 Deutsch
 English
 Español
 Français
 Italiano
 Nederlands
 Polski
 Português
 Русский
 Türkçe
 Svenska
 Chinese
 Magyar
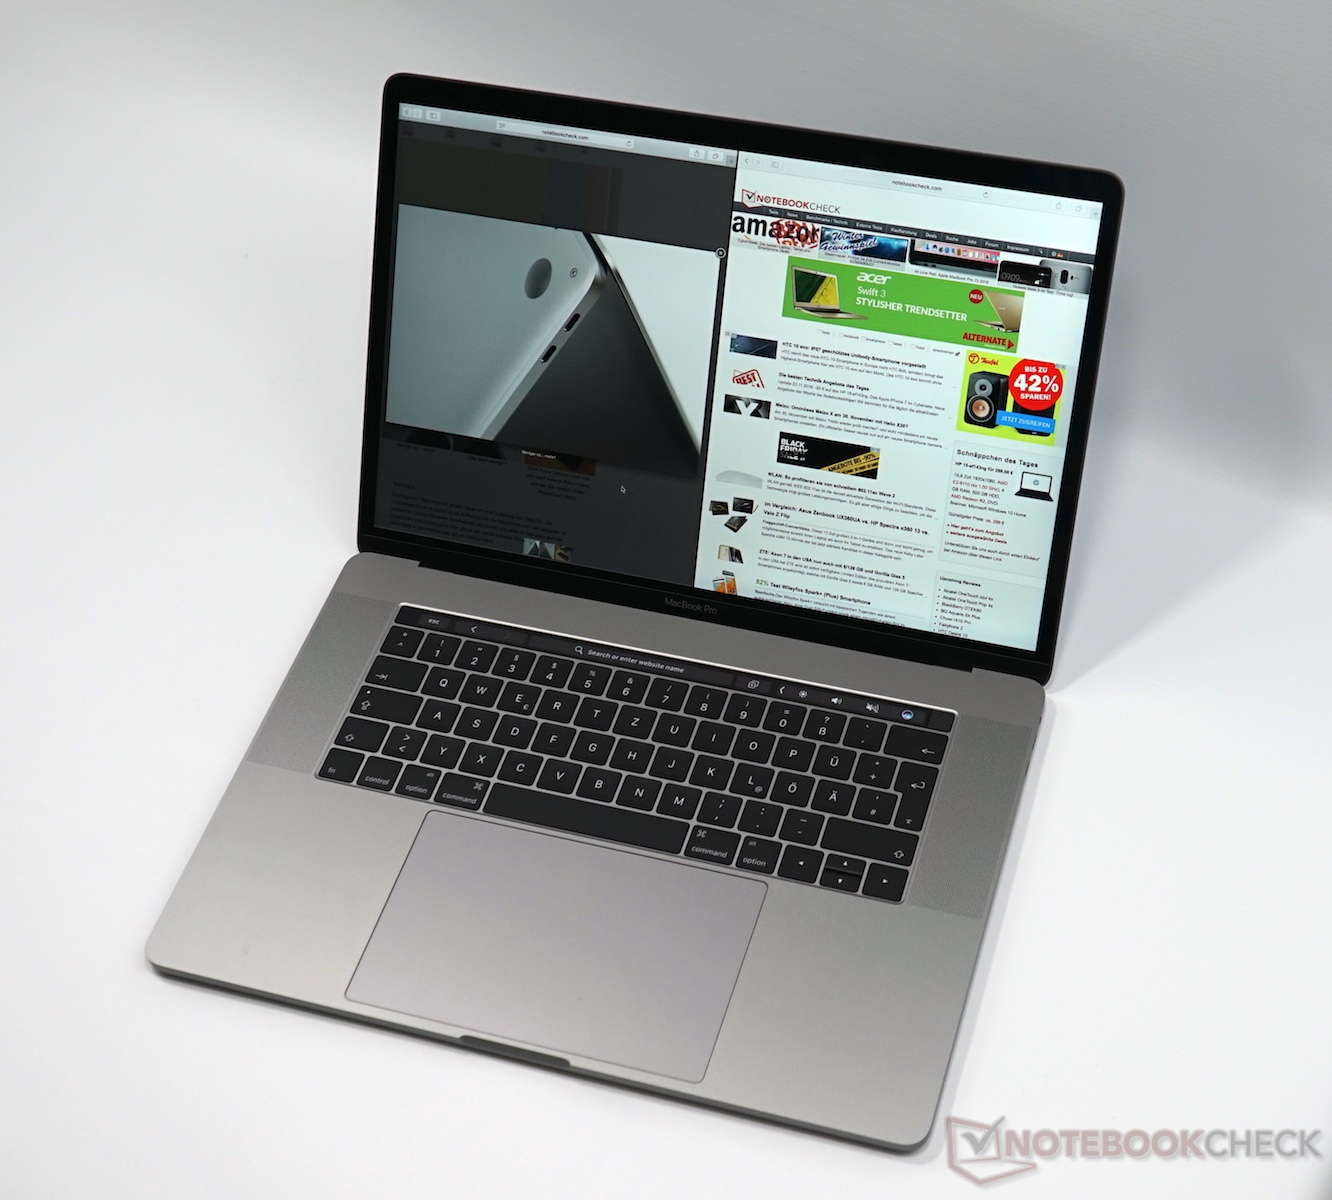
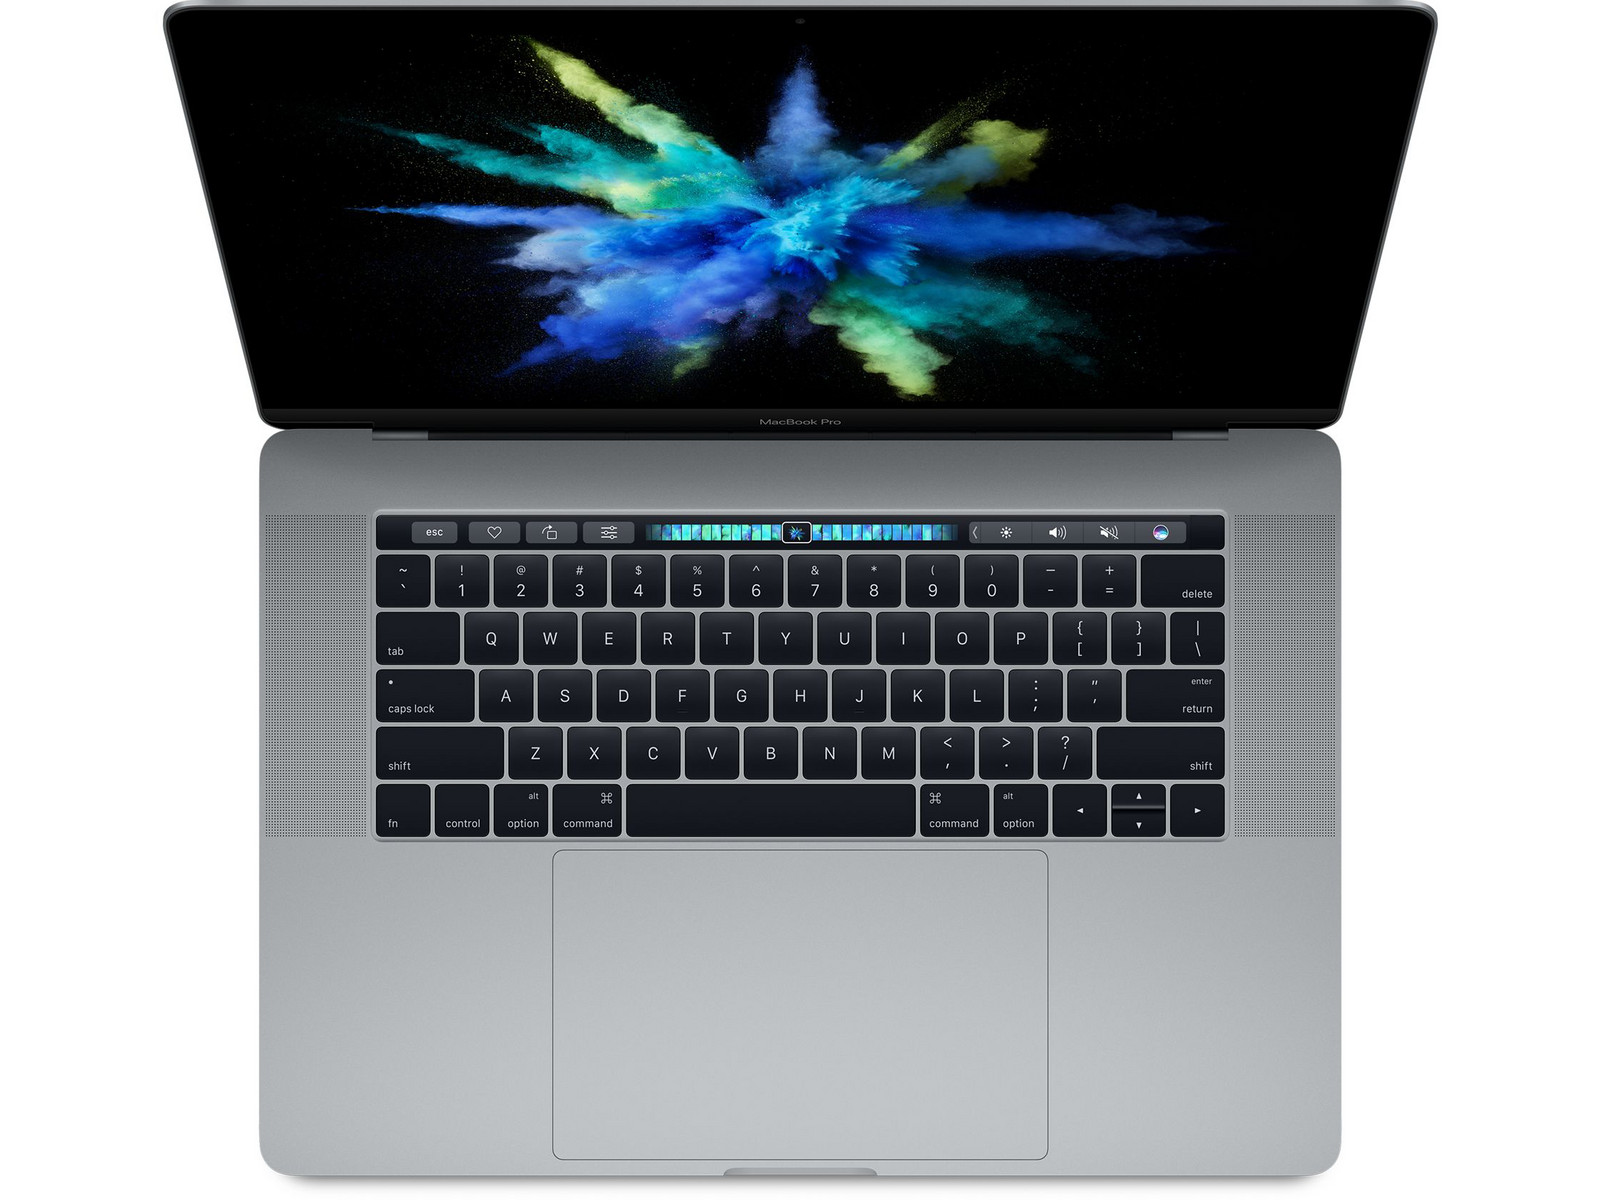
Kısa inceleme: Apple MacBook Pro 15 (Late 2016, 2.7 GHz, 455) Notebook

| |||||||||||||||||||||||||
Aydınlatma: 83 %
Batarya modunda parlaklık: 568 cd/m²
Kontrast: 1912:1 (Siyah: 0.297 cd/m²)
ΔE Color 1.4 | 0.5-29.43 Ø5
ΔE Greyscale 2.3 | 0.57-98 Ø5.3
99.9% sRGB (Argyll 1.6.3 3D)
77.4% AdobeRGB 1998 (Argyll 1.6.3 3D)
86.4% AdobeRGB 1998 (Argyll 2.2.0 3D)
99.9% sRGB (Argyll 2.2.0 3D)
98.5% Display P3 (Argyll 2.2.0 3D)
Gamma: 2.29
| Apple MacBook Pro 15 2016 (2.7 GHz, 455) APPA031, , 2880x1800, 15.40 | Apple MacBook Pro 15 2016 (2.9 GHz, 460) Apple APPA030, , 2880x1800, 15.40 | Apple MacBook Pro 15 2016 (2.6 GHz, 450) 2880x1800, 15.40 | Apple MacBook Pro Retina 15 inch 2015-05 APPA02E, , 2880x1800, 15.40 | Dell XPS 15-9550 i7 SHARP LQ156D1JX01 Dell PN: 7PHPT, , 3840x2160, 15.60 | Dell XPS 15 2017 9560 (7300HQ, Full-HD) Sharp SHP1453 LQ156M1, , 1920x1080, 15.60 | |
|---|---|---|---|---|---|---|
| Display | 1% | -25% | 1% | -16% | ||
| Display P3 Coverage | 98.5 | 99 1% | 61.4 -38% | 87.8 -11% | 68.9 -30% | |
| sRGB Coverage | 99.9 | 100 0% | 90.8 -9% | 100 0% | 98.9 -1% | |
| AdobeRGB 1998 Coverage | 86.4 | 87.3 1% | 62.9 -27% | 99.4 15% | 70.9 -18% | |
| Response Times | -21% | 9% | -7% | -25% | ||
| Response Time Grey 50% / Grey 80% * | 46.4 ? | 46 ? 1% | 47.3 ? -2% | 58 ? -25% | 54 ? -16% | |
| Response Time Black / White * | 39.2 ? | 56 ? -43% | 31.2 ? 20% | 35 ? 11% | 52.4 ? -34% | |
| PWM Frequency | 119000 ? | 117000 ? | ||||
| Screen | -32% | -3% | -23% | -57% | -85% | |
| Brightness middle | 568 | 420 -26% | 483 -15% | 341 -40% | 361 -36% | 400 -30% |
| Brightness | 532 | 401 -25% | 465 -13% | 315 -41% | 344 -35% | 392 -26% |
| Brightness Distribution | 83 | 90 8% | 92 11% | 82 -1% | 90 8% | 89 7% |
| Black Level * | 0.297 | 0.3 -1% | 0.33 -11% | 0.34 -14% | 0.38 -28% | 0.26 12% |
| Contrast | 1912 | 1400 -27% | 1464 -23% | 1003 -48% | 950 -50% | 1538 -20% |
| Colorchecker dE 2000 * | 1.4 | 3.33 -138% | 1.4 -0% | 2.07 -48% | 5.34 -281% | 4.9 -250% |
| Colorchecker dE 2000 max. * | 2.7 | 5.11 -89% | 3 -11% | 3.27 -21% | 11 -307% | |
| Greyscale dE 2000 * | 2.3 | 2.73 -19% | 1.5 35% | 1.9 17% | 4.84 -110% | 7.2 -213% |
| Gamma | 2.29 96% | 2.48 89% | 2.34 94% | 2.62 84% | 2.21 100% | 2.11 104% |
| CCT | 7165 91% | 6457 101% | 6650 98% | 6514 100% | 7395 88% | 6911 94% |
| Color Space (Percent of AdobeRGB 1998) | 77.4 | 78.09 1% | 58 -25% | 89 15% | 64.2 -17% | |
| Color Space (Percent of sRGB) | 99.9 | 99.97 0% | 91 -9% | 100 0% | 98.9 -1% | |
| Total Average (Program / Settings) | -17% /
-24% | 3% /
-1% | -24% /
-23% | -21% /
-38% | -42% /
-63% |
* ... smaller is better
Display Response Times
| ↔ Response Time Black to White | ||
|---|---|---|
| 39.2 ms ... rise ↗ and fall ↘ combined | ↗ 7.6 ms rise | 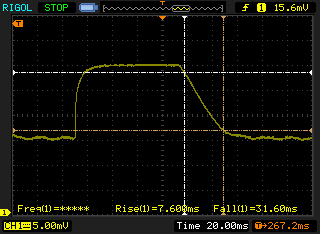 |
| ↘ 31.6 ms fall | ||
| The screen shows slow response rates in our tests and will be unsatisfactory for gamers. In comparison, all tested devices range from 0.1 (minimum) to 240 (maximum) ms. » 96 % of all devices are better. This means that the measured response time is worse than the average of all tested devices (21.5 ms). | ||
| ↔ Response Time 50% Grey to 80% Grey | ||
| 46.4 ms ... rise ↗ and fall ↘ combined | ↗ 18.8 ms rise | 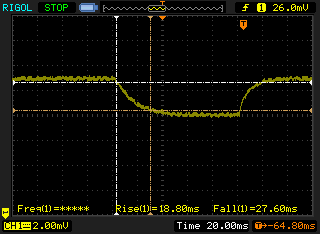 |
| ↘ 27.6 ms fall | ||
| The screen shows slow response rates in our tests and will be unsatisfactory for gamers. In comparison, all tested devices range from 0.2 (minimum) to 636 (maximum) ms. » 77 % of all devices are better. This means that the measured response time is worse than the average of all tested devices (33.7 ms). | ||
Screen Flickering / PWM (Pulse-Width Modulation)
| Screen flickering / PWM not detected | ||
In comparison: 53 % of all tested devices do not use PWM to dim the display. If PWM was detected, an average of 17924 (minimum: 5 - maximum: 3846000) Hz was measured. | ||
| PCMark 8 Home Score Accelerated v2 | 3728 puan | |
| PCMark 8 Creative Score Accelerated v2 | 4569 puan | |
| PCMark 8 Work Score Accelerated v2 | 4522 puan | |
Yardım | ||

| 3DMark 11 - 1280x720 Performance GPU | |
| SCHENKER XMG P507 PRO | |
| Acer Aspire VX5-591G-D0DD | |
| Dell XPS 15 2017 9560 (7300HQ, Full-HD) | |
| Apple MacBook Pro 15 2016 (2.9 GHz, 460) | |
| Apple MacBook Pro 15 2016 (2.7 GHz, 455) | |
| Dell XPS 15-9550 i7 | |
| Lenovo ThinkPad P50 20ENV509PB | |
| Apple MacBook Pro 15 2016 (2.6 GHz, 450) | |
| HP ZBook Studio G3 | |
| Apple MacBook Pro Retina 15 inch 2015-05 | |
| Apple MacBook Pro 13 2016 (2.9 GHz) | |
| Lenovo ThinkPad P40 Yoga 20GQ-0004GE | |
| 3DMark - 1920x1080 Fire Strike Graphics | |
| SCHENKER XMG P507 PRO | |
| Acer Aspire VX5-591G-D0DD | |
| Dell XPS 15 2017 9560 (7300HQ, Full-HD) | |
| Apple MacBook Pro 15 2016 (2.9 GHz, 460) | |
| Dell XPS 15-9550 i7 | |
| Lenovo ThinkPad P50 20ENV509PB | |
| Apple MacBook Pro 15 2016 (2.7 GHz, 455) | |
| HP ZBook Studio G3 | |
| Apple MacBook Pro 15 2016 (2.6 GHz, 450) | |
| Apple MacBook Pro Retina 15 inch 2015-05 | |
| Apple MacBook Pro 13 2016 (2.9 GHz) | |
| Lenovo ThinkPad P40 Yoga 20GQ-0004GE | |
| 3DMark 06 Standard Score | 25873 puan | |
| 3DMark Vantage P Result | 16522 puan | |
| 3DMark 11 Performance | 5774 puan | |
| 3DMark Cloud Gate Standard Score | 15766 puan | |
| 3DMark Fire Strike Score | 3463 puan | |
| 3DMark Time Spy Score | 1254 puan | |
Yardım | ||
| Rise of the Tomb Raider - 1920x1080 High Preset AA:FX AF:4x | |
| Acer Aspire VX5-591G-D0DD | |
| HP Omen 15-ax007ng | |
| Asus Strix GL753VD-GC045T | |
| HP Pavilion 17 FHD V3A33AV | |
| Apple MacBook Pro 15 2016 (2.9 GHz, 460) | |
| Apple MacBook Pro 15 2016 (2.7 GHz, 455) | |
| Apple MacBook Pro 15 2016 (2.6 GHz, 450) | |
| Apple MacBook Pro 15 2016 (2.6 GHz, 450) | |
| The Witcher 3 - 1920x1080 High Graphics & Postprocessing (Nvidia HairWorks Off) | |
| Acer Aspire VX5-591G-D0DD | |
| Dell XPS 15 2017 9560 (7300HQ, Full-HD) | |
| Asus Strix GL753VD-GC045T | |
| Apple MacBook Pro 15 2016 (2.9 GHz, 460) | |
| Apple MacBook Pro 15 2016 (2.7 GHz, 455) | |
| Apple MacBook Pro 15 2016 (2.6 GHz, 450) | |
| Apple MacBook Pro Retina 15 inch 2015-05 | |
| Anno 2205 - 1920x1080 High Preset AA:4x | |
| Asus Strix GL753VD-GC045T | |
| Apple MacBook Pro 15 2016 (2.9 GHz, 460) | |
| Apple MacBook Pro 15 2016 (2.6 GHz, 450) | |
| Apple MacBook Pro 15 2016 (2.7 GHz, 455) | |
| Call of Duty Infinite Warfare - 1920x1080 High / On AA:FX | |
| SCHENKER XMG P507 PRO | |
| Asus Strix GL753VD-GC045T | |
| Apple MacBook Pro 15 2016 (2.9 GHz, 460) | |
| Apple MacBook Pro 15 2016 (2.7 GHz, 455) | |
| Apple MacBook Pro 15 2016 (2.6 GHz, 450) | |
| düşük | orta | yüksek | ultra | 4K | |
| Counter-Strike: GO (2012) | 145 | ||||
| BioShock Infinite (2013) | 230 | 37.8 | |||
| Sims 4 (2014) | 50.6 | ||||
| GTA V (2015) | 37.1 | 11.1 | |||
| The Witcher 3 (2015) | 69.5 | 24.6 | 14.2 | ||
| Dota 2 Reborn (2015) | 67.2 | 61.5 | 22.8 | ||
| World of Warships (2015) | 188 | 70.7 | 53 | ||
| Anno 2205 (2015) | 86 | 17.5 | 7.7 | ||
| Fallout 4 (2015) | 27.8 | ||||
| Rainbow Six Siege (2015) | 162 | 52.7 | 33.7 | ||
| Rise of the Tomb Raider (2016) | 84 | 24.9 | 18.3 | ||
| XCOM 2 (2016) | 70 | 27.2 | 17.9 | 5.9 | |
| Far Cry Primal (2016) | 70 | 32 | 30 | 20 | |
| The Division (2016) | 88 | 25.2 | 18.5 | ||
| Hitman 2016 (2016) | 75 | 20.4 | |||
| Ashes of the Singularity (2016) | 33.8 | 21.3 | 19.3 | ||
| Doom (2016) | 53.1 | 19.8 | |||
| Overwatch (2016) | 178 | 65.8 | 30.1 | 18.7 | |
| Deus Ex Mankind Divided (2016) | 59.5 | 21.5 | 8.9 | ||
| FIFA 17 (2016) | 107 | ||||
| Mafia 3 (2016) | 32.8 | 15.1 | |||
| Battlefield 1 (2016) | 109 | 28.9 | 25.3 | ||
| Civilization VI (2016) | 69 | 28.8 | 21.6 | ||
| Farming Simulator 17 (2016) | 71.7 | 25.8 | 22.8 | ||
| Titanfall 2 (2016) | 33.1 | 28.8 | |||
| Call of Duty Infinite Warfare (2016) | 40.2 | 34.4 | |||
| Dishonored 2 (2016) | 44.1 | 20.6 | |||
| Watch Dogs 2 (2016) | 54.4 | 20.7 | |||
| Resident Evil 7 (2017) | 146 | 59.4 | 34.6 | 19.7 |
Ses yüksekliği
| Boşta |
| 30.8 / 30.8 / 30.8 dB |
| HDD |
| 30.8 dB |
| Çalışırken |
| 38.7 / 48.8 dB |
 | ||
30 dB sessiz 40 dB(A) duyulabilirlik 50 dB(A) gürültülü |
||
min: | ||
| 6820HQ, Radeon Pro 455 Radeon Pro 455, 6820HQ, Apple SSD SM0512L | 6920HQ, Radeon Pro 460 Radeon Pro 460, 6920HQ, Apple SSD SM1024L | 6700HQ, Radeon Pro 450 Radeon Pro 450, 6700HQ, Apple SSD SM0256L | 4870HQ, Radeon R9 M370X Radeon R9 M370X, 4870HQ, Apple SSD SM0512G | 6700HQ, GeForce GTX 960M GeForce GTX 960M, 6700HQ, Samsung PM951 NVMe 512 GB | i5-7300HQ, GeForce GTX 1050 Mobile GeForce GTX 1050 Mobile, i5-7300HQ, WDC WD10SPCX-75KHST0 + SanDisk Z400s M.2 2242 32 GB Cache | |
|---|---|---|---|---|---|---|
| Noise | 4% | 3% | 1% | -6% | -6% | |
| off / environment * | 30.4 | 29 5% | 30.4 -0% | 30.3 -0% | ||
| Idle Minimum * | 30.8 | 30.3 2% | 30.6 1% | 28.9 6% | 31.4 -2% | 31.6 -3% |
| Idle Average * | 30.8 | 30.3 2% | 30.6 1% | 28.9 6% | 32.5 -6% | 31.6 -3% |
| Idle Maximum * | 30.8 | 30.3 2% | 30.6 1% | 28.9 6% | 33.6 -9% | 33.4 -8% |
| Load Average * | 38.7 | 35.1 9% | 34.7 10% | 46 -19% | 45.2 -17% | 47.8 -24% |
| Load Maximum * | 48.8 | 46 6% | 46.3 5% | 46 6% | 46 6% | 47.8 2% |
* ... smaller is better
(-) The maximum temperature on the upper side is 46 °C / 115 F, compared to the average of 36.9 °C / 98 F, ranging from 21.1 to 71 °C for the class Multimedia.
(+) The bottom heats up to a maximum of 39 °C / 102 F, compared to the average of 39.1 °C / 102 F
(+) The palmrests and touchpad are cooler than skin temperature with a maximum of 29 °C / 84.2 F and are therefore cool to the touch.
(±) The average temperature of the palmrest area of similar devices was 28.8 °C / 83.8 F (-0.2 °C / -0.4 F).
| Apple MacBook Pro 15 2016 (2.7 GHz, 455) 6820HQ, Radeon Pro 455 | Apple MacBook Pro 15 2016 (2.9 GHz, 460) 6920HQ, Radeon Pro 460 | Apple MacBook Pro 15 2016 (2.6 GHz, 450) 6700HQ, Radeon Pro 450 | Apple MacBook Pro Retina 15 inch 2015-05 4870HQ, Radeon R9 M370X | Dell XPS 15-9550 i7 6700HQ, GeForce GTX 960M | Dell XPS 15 2017 9560 (7300HQ, Full-HD) i5-7300HQ, GeForce GTX 1050 Mobile | |
|---|---|---|---|---|---|---|
| Heat | -2% | 2% | 3% | -25% | -6% | |
| Maximum Upper Side * | 46 | 44.2 4% | 43 7% | 43.2 6% | 55.9 -22% | 47.6 -3% |
| Maximum Bottom * | 39 | 41.6 -7% | 40 -3% | 39 -0% | 50 -28% | 42.1 -8% |
| Idle Upper Side * | 33.6 | 26 | 30 | 28.1 | 29.9 | |
| Idle Bottom * | 31.1 | 25 | 29.3 | 27.9 | 29.8 |
* ... smaller is better
| Boşta | |
| Çalışırken |
|
| Apple MacBook Pro 15 2016 (2.7 GHz, 455) 6820HQ, Radeon Pro 455 | Apple MacBook Pro 15 2016 (2.9 GHz, 460) 6920HQ, Radeon Pro 460 | Apple MacBook Pro 15 2016 (2.6 GHz, 450) 6700HQ, Radeon Pro 450 | Apple MacBook Pro Retina 15 inch 2015-05 4870HQ, Radeon R9 M370X | Dell XPS 15-9550 i7 6700HQ, GeForce GTX 960M | Dell XPS 15 2017 9560 (7300HQ, Full-HD) i5-7300HQ, GeForce GTX 1050 Mobile | |
|---|---|---|---|---|---|---|
| Power Consumption | 1% | 8% | -25% | -97% | -23% | |
| Idle Minimum * | 4 | 3 25% | 2.9 27% | 6 -50% | 12.5 -213% | 6.6 -65% |
| Idle Average * | 10.9 | 9.9 9% | 9.7 11% | 12.8 -17% | 19.6 -80% | 9 17% |
| Idle Maximum * | 10.9 | 12.5 -15% | 10.1 7% | 13.3 -22% | 22.8 -109% | 10.7 2% |
| Load Average * | 64.6 | 70.6 -9% | 65 -1% | 82.4 -28% | 102 -58% | 77.5 -20% |
| Load Maximum * | 86.7 | 90.8 -5% | 89.5 -3% | 91.8 -6% | 107 -23% | 130 -50% |
* ... smaller is better
| Apple MacBook Pro 15 2016 (2.7 GHz, 455) 6820HQ, Radeon Pro 455, 76 Wh | Apple MacBook Pro 15 2016 (2.9 GHz, 460) 6920HQ, Radeon Pro 460, 76 Wh | Apple MacBook Pro 15 2016 (2.6 GHz, 450) 6700HQ, Radeon Pro 450, 76 Wh | Apple MacBook Pro Retina 15 inch 2015-05 4870HQ, Radeon R9 M370X, 100 Wh | Dell XPS 15-9550 i7 6700HQ, GeForce GTX 960M, 84 Wh | Dell XPS 15 2017 9560 (7300HQ, Full-HD) i5-7300HQ, GeForce GTX 1050 Mobile, 56 Wh | |
|---|---|---|---|---|---|---|
| Battery Runtime | -4% | -2% | 31% | 40% | 4% | |
| WiFi v1.3 | 637 | 619 -3% | 602 -5% | 432 -32% | 309 -51% | 334 -48% |
| Load | 54 | 52 -4% | 55 2% | 105 94% | 125 131% | 84 56% |
| H.264 | 547 | 516 | 413 | 318 | ||
| Reader / Idle | 1039 | 528 | 565 |
Artılar
Eksiler
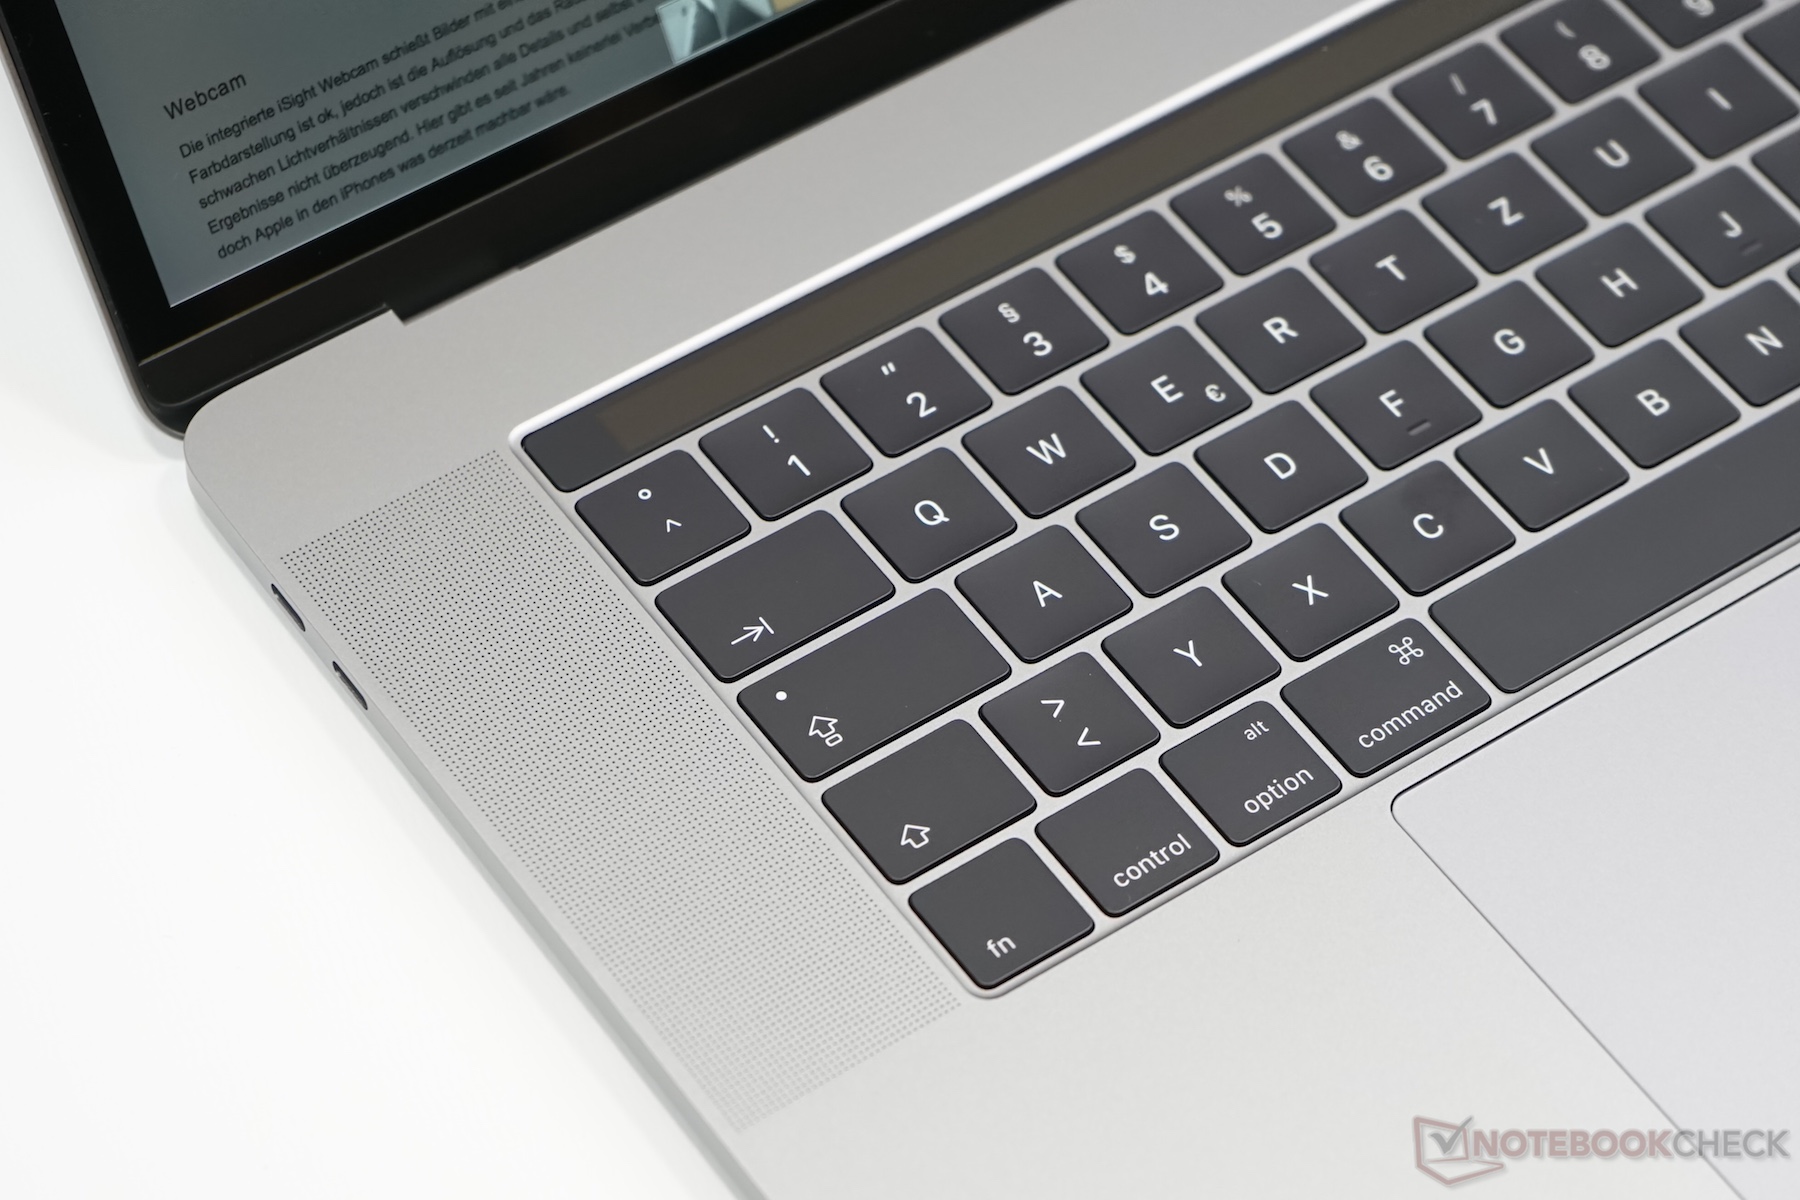
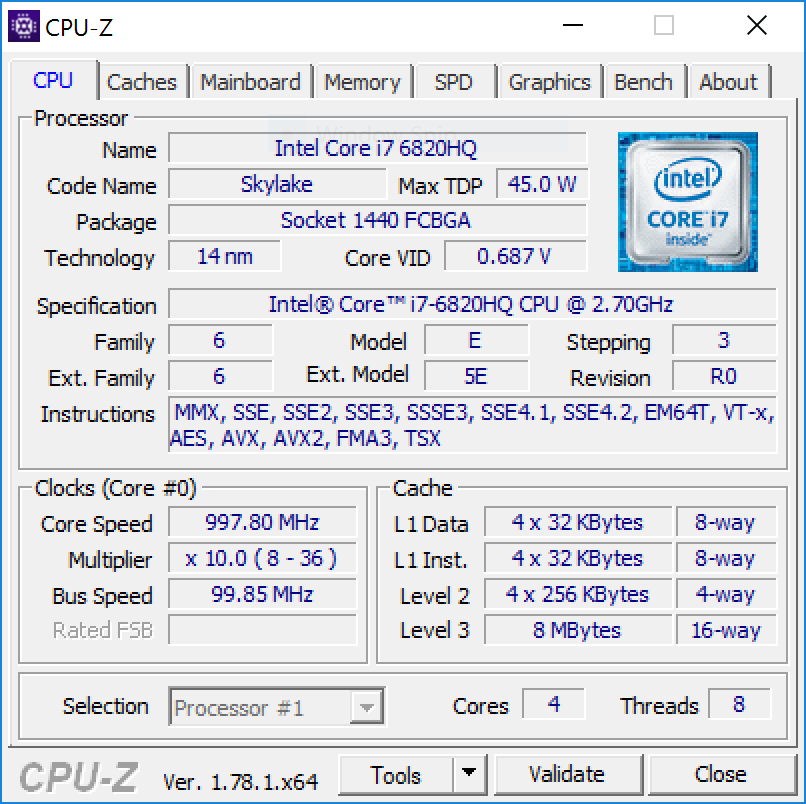
3. Apple MacBook Pro 15 konfigrasyonu aslında biraz şaşırtıcı sonuçlar veriyor. Ancak iki hızlı bileşenden bahsetmeyeceğiz. Bu modelimizde işlemci temel modelden 100 MHz daha hızlı ve testlerde tek haneli performans artışı sağlıyor, bu farkı pratikte pek farkedemezsiniz.
AMD Radeon Pro 455 diğer 450 ve 460 modellerinin arasında kalıyor. Eğer kartın performansından memnun değilseniz daha güçlü 4 GB GDDR5-VRAM belleğe sahip 460 modelini kullanmalısınız.
En büyük süpriz ise ekran. Kontrast daha iyi. Sahip olacağınız ekran biraz şans işiymiş gibi gözüküyor. Keza giriş seviyesi ve en üst model de biraz daha karanlık bir ekrana sahip.
We started this review with the question of whether the upgrades are worth it. The answer in this case is: it depends. The processor is hardly any faster and power users will get the optional Core i7-6920HQ anyway, which is also the case for the graphics card. However, the upgrade also includes the larger 512 GB SSD and preconfigured models are often less expensive in online shops, so the model might actually be interesting even when you only want the additional storage capacity. The general advantages and drawbacks of the Apple MacBook Pro 15 still apply here, so we once again want to refer to our in-depth review of the entry-level model.
İncelememize başlarlen aklımızda ek bileşenlerin fiyatlarının karşılığı olup olmadığıydı. Bu durumda çok emin değiliz. İşlemci çok ufak bir hız artışı sağlıyor, ancak bu modelde 512 GBlik SSD kullanılıyor. Kısaca Apple MacBook Pro 15 modeline ait genel çekincelerimiz bu model için de geçerli.
Yazının orjinali için tıklayın.
Apple MacBook Pro 15 2016 (2.7 GHz, 455)
-
02/13/2017 v6(old)
Klaus A. Hinum, Andreas Osthoff
Pricecompare
