 Deutsch
 English
 Español
 Français
 Italiano
 Nederlands
 Polski
 Português
 Русский
 Türkçe
 Svenska
 Chinese
 Magyar
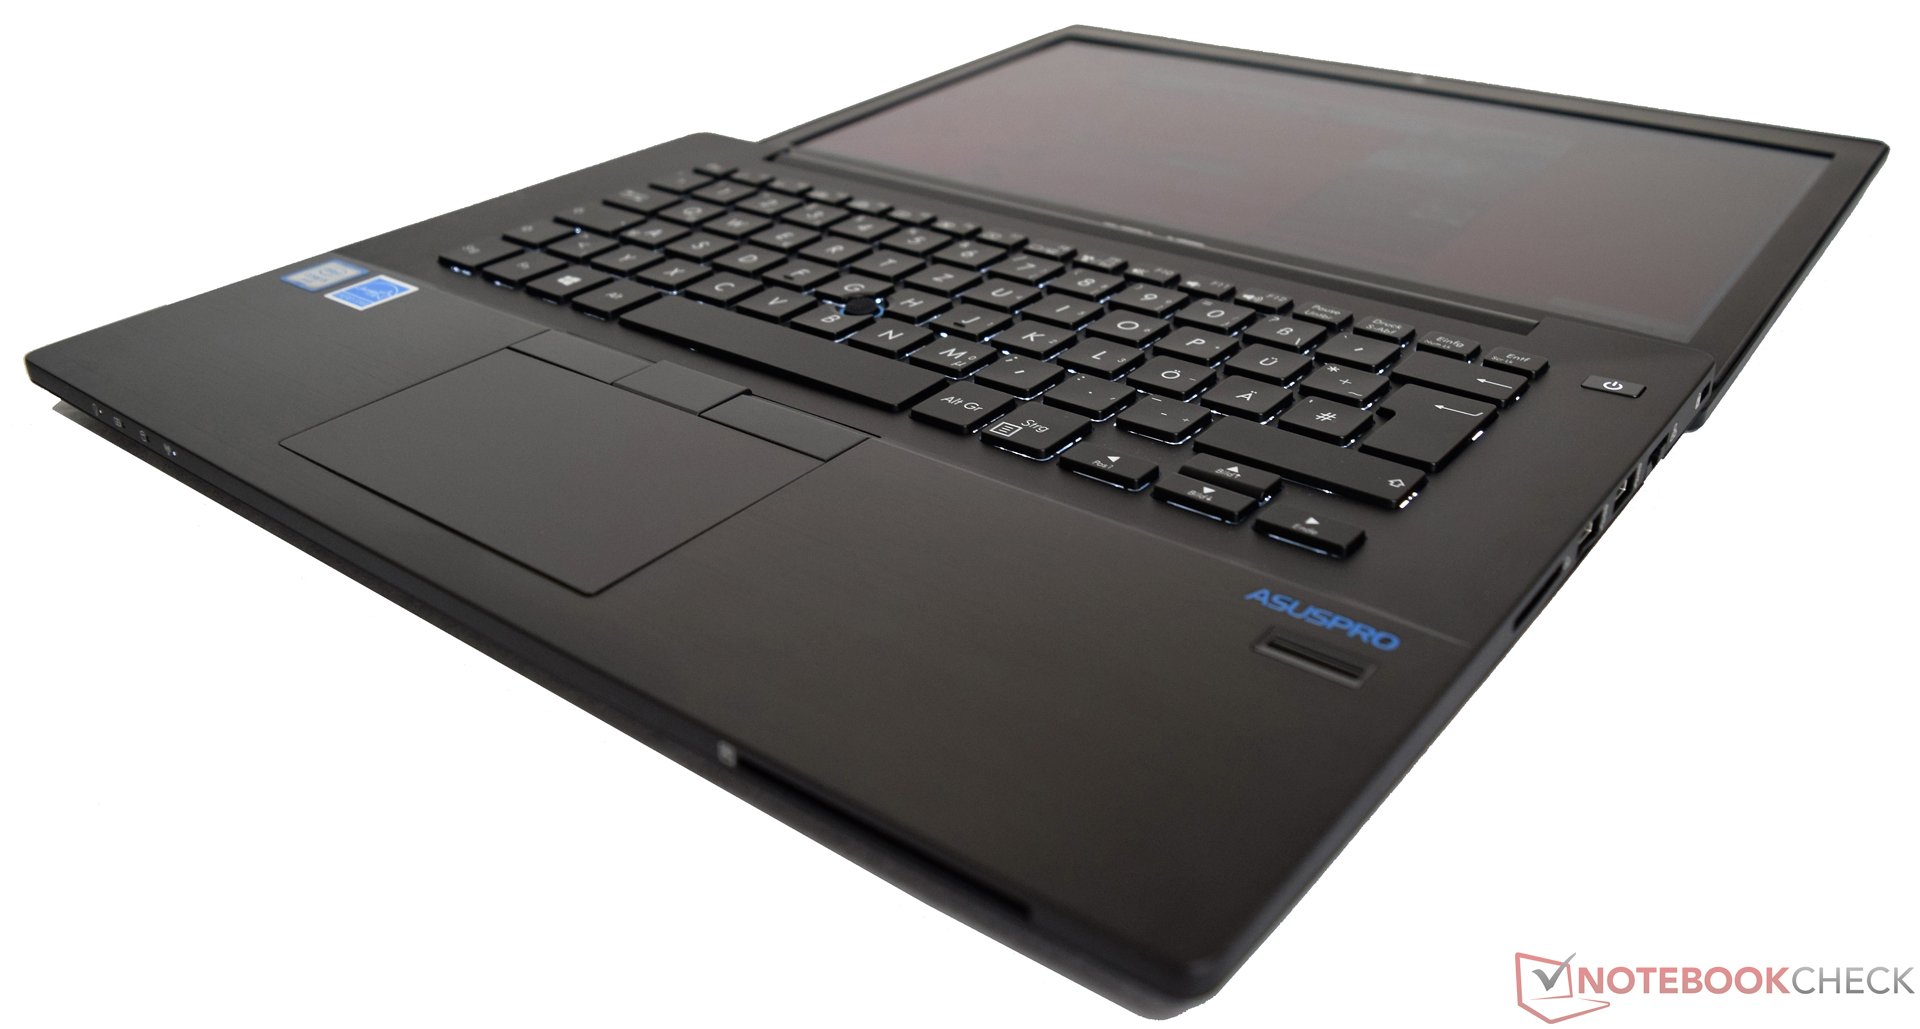
Kısa inceleme: Asus ASUSPRO Advanced B8430UA-FA0084E Notebook


| |||||||||||||||||||||||||
Aydınlatma: 87 %
Batarya modunda parlaklık: 213 cd/m²
Kontrast: 525:1 (Siyah: 0.4 cd/m²)
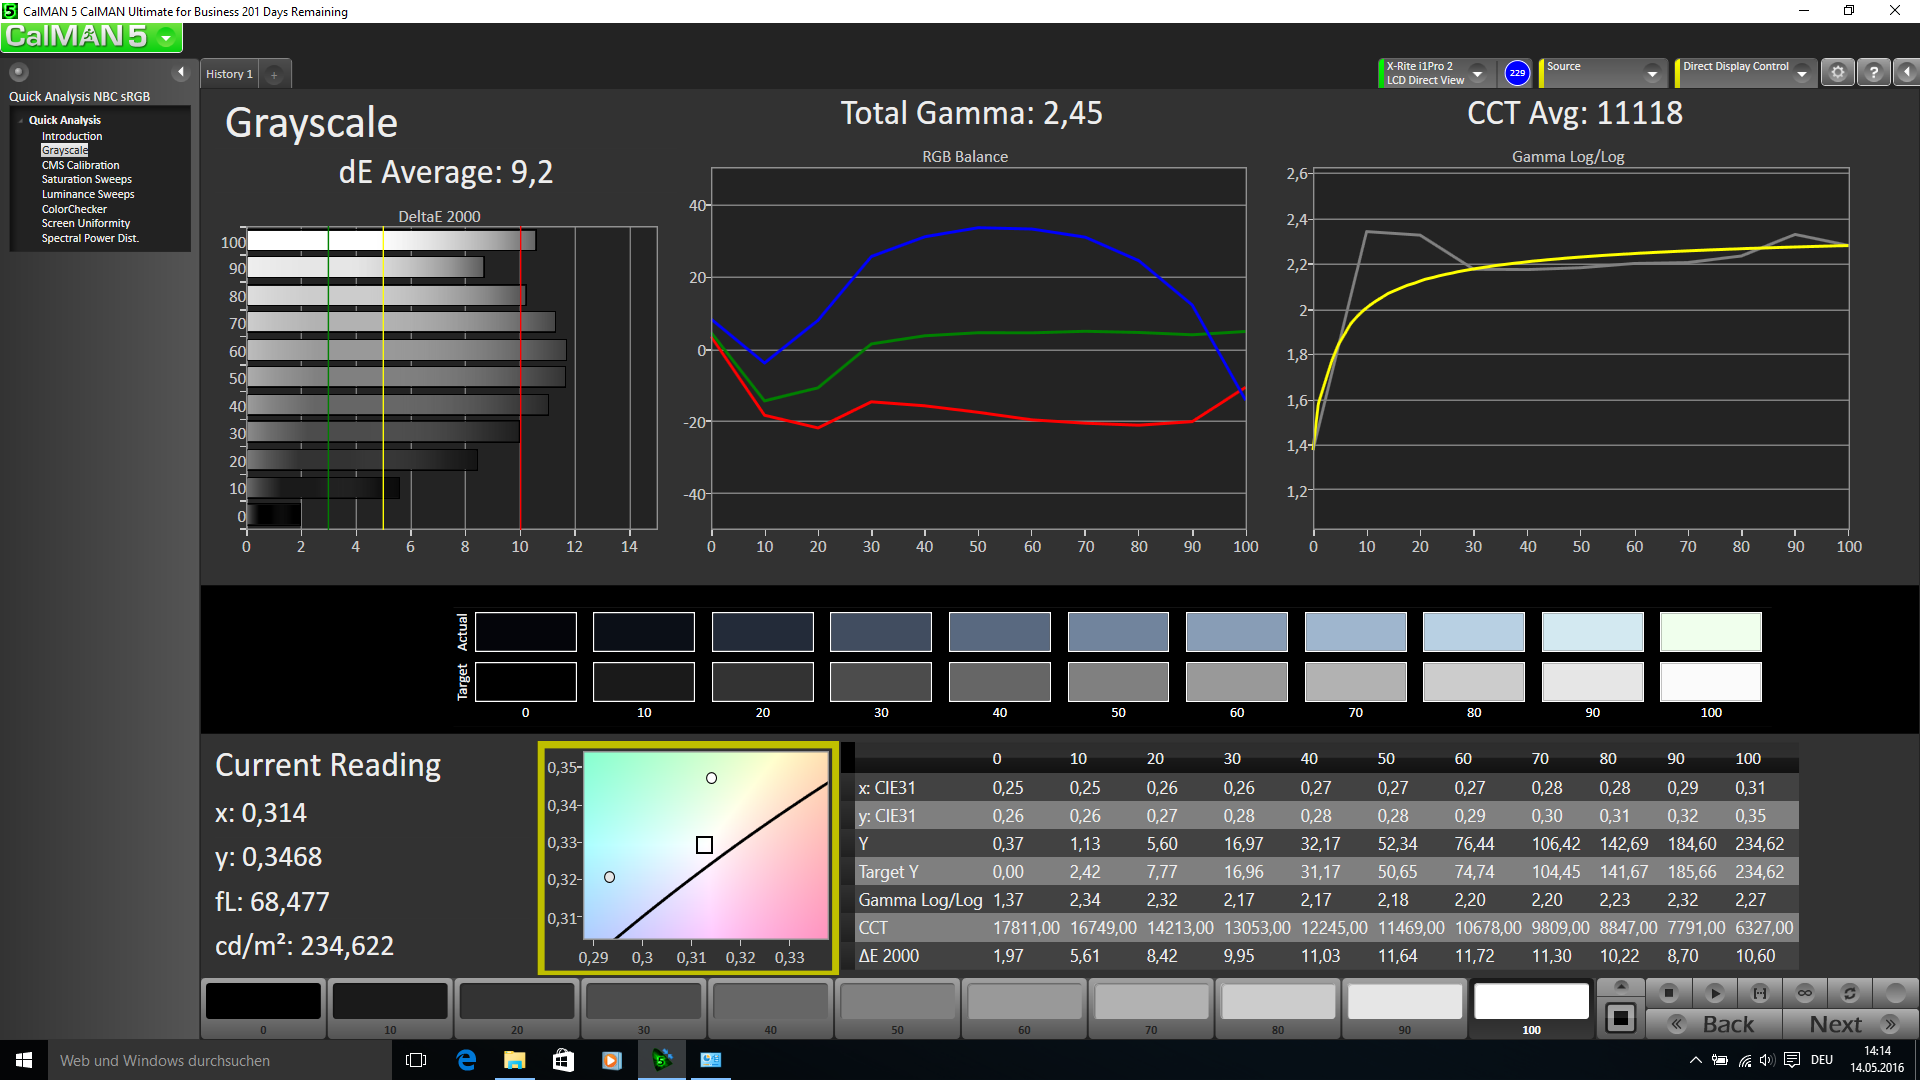
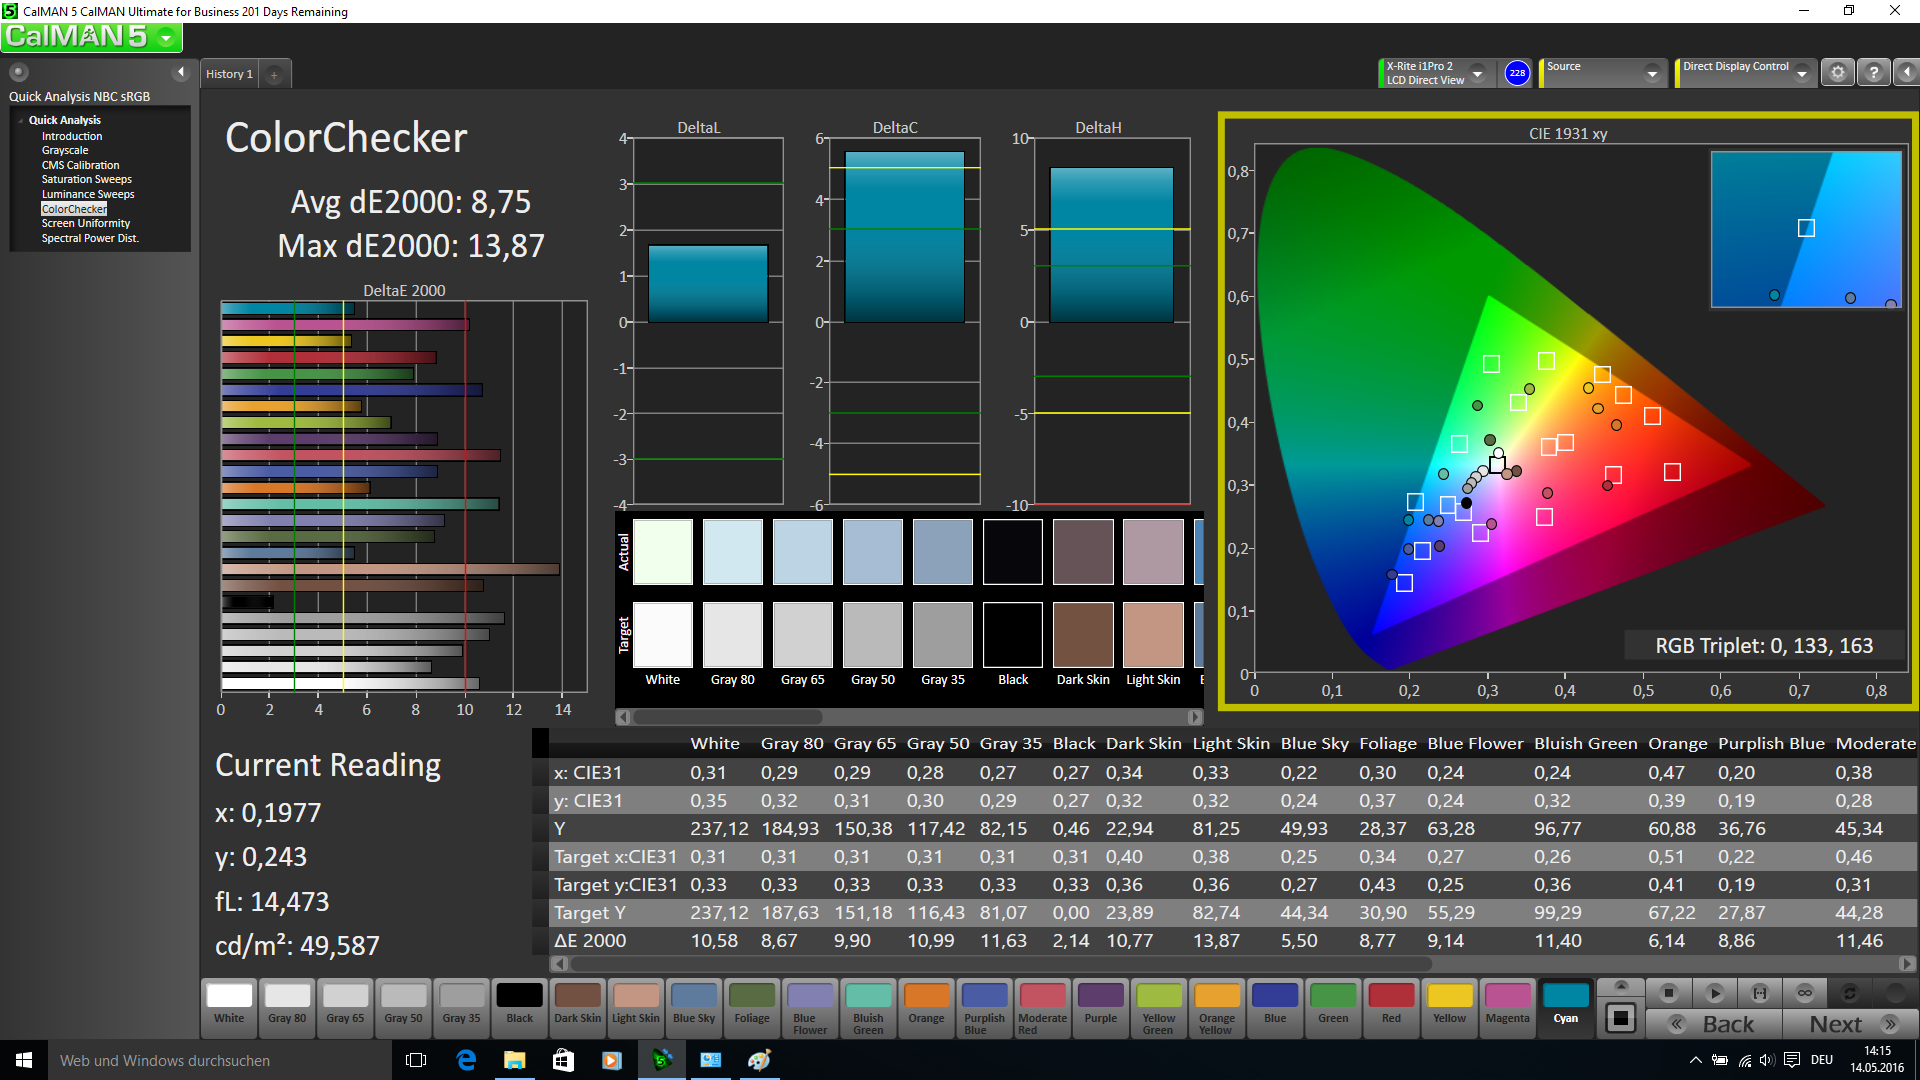
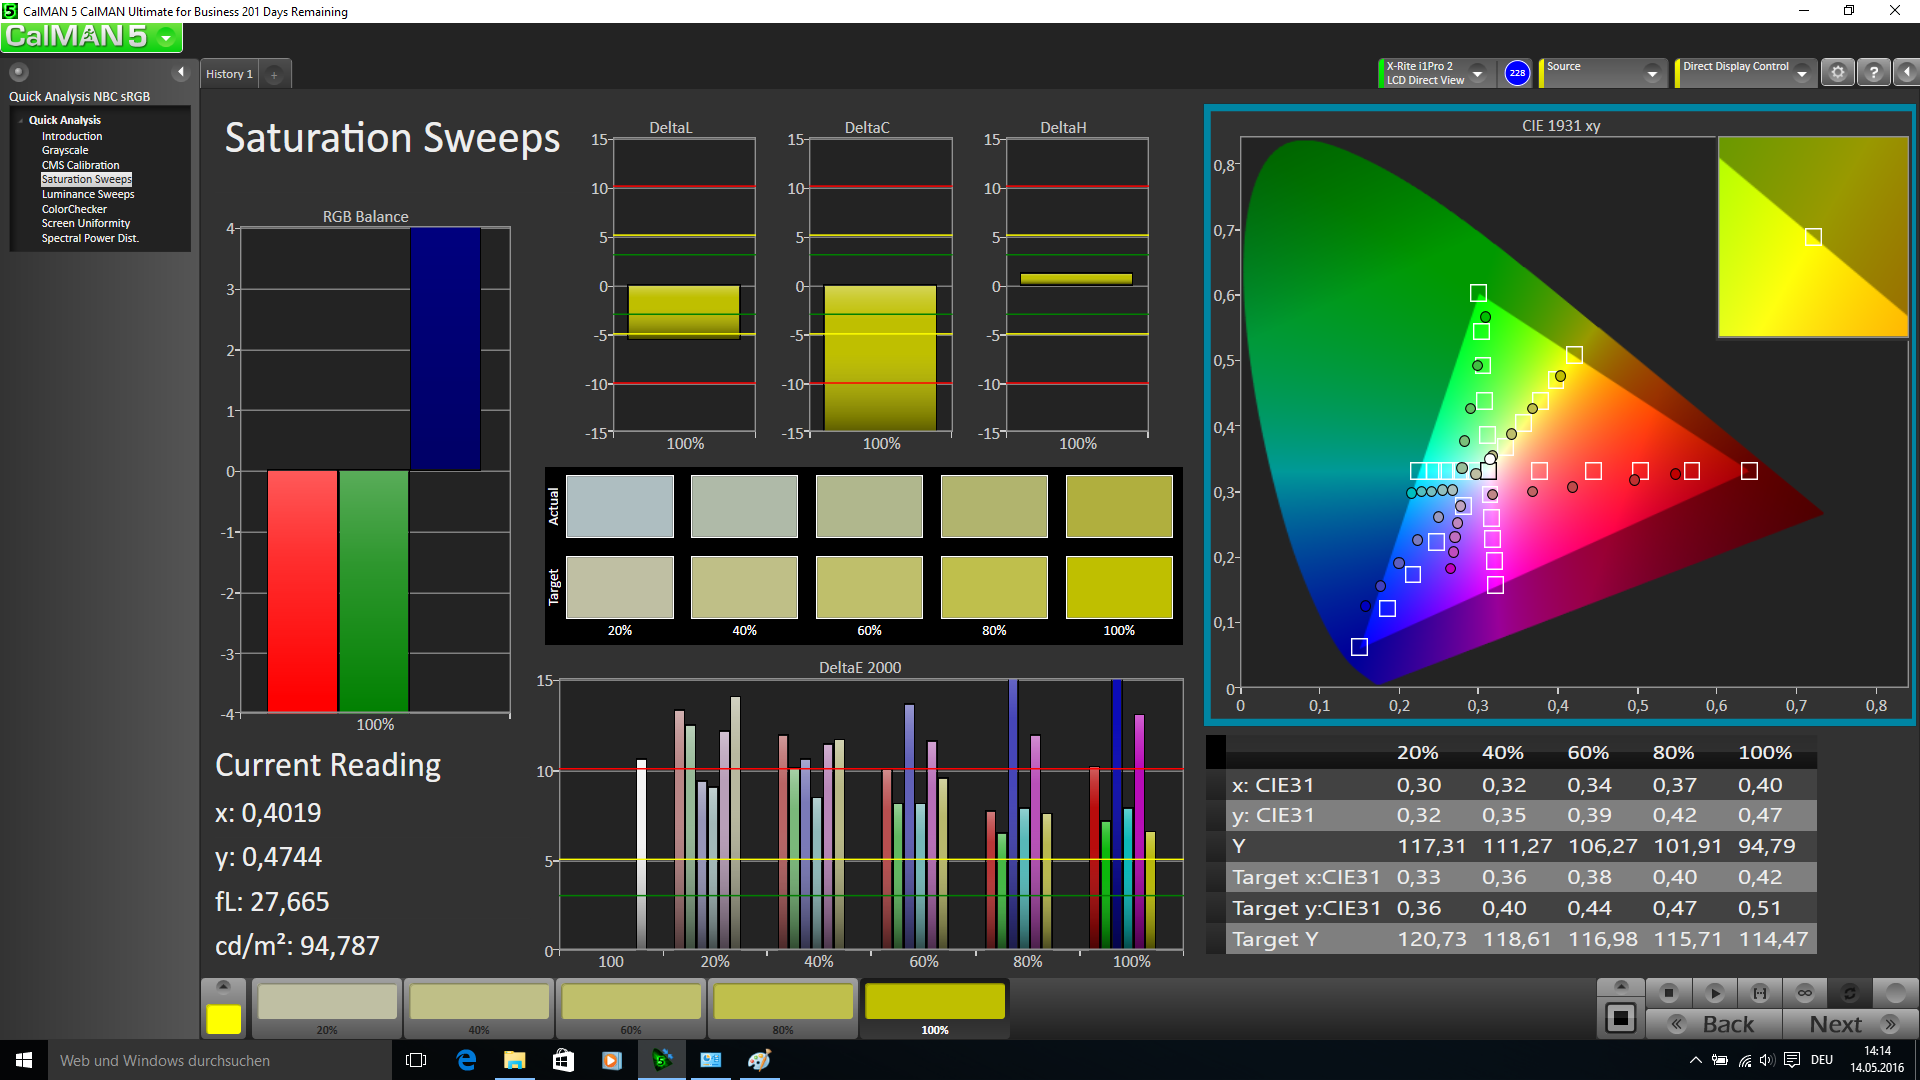
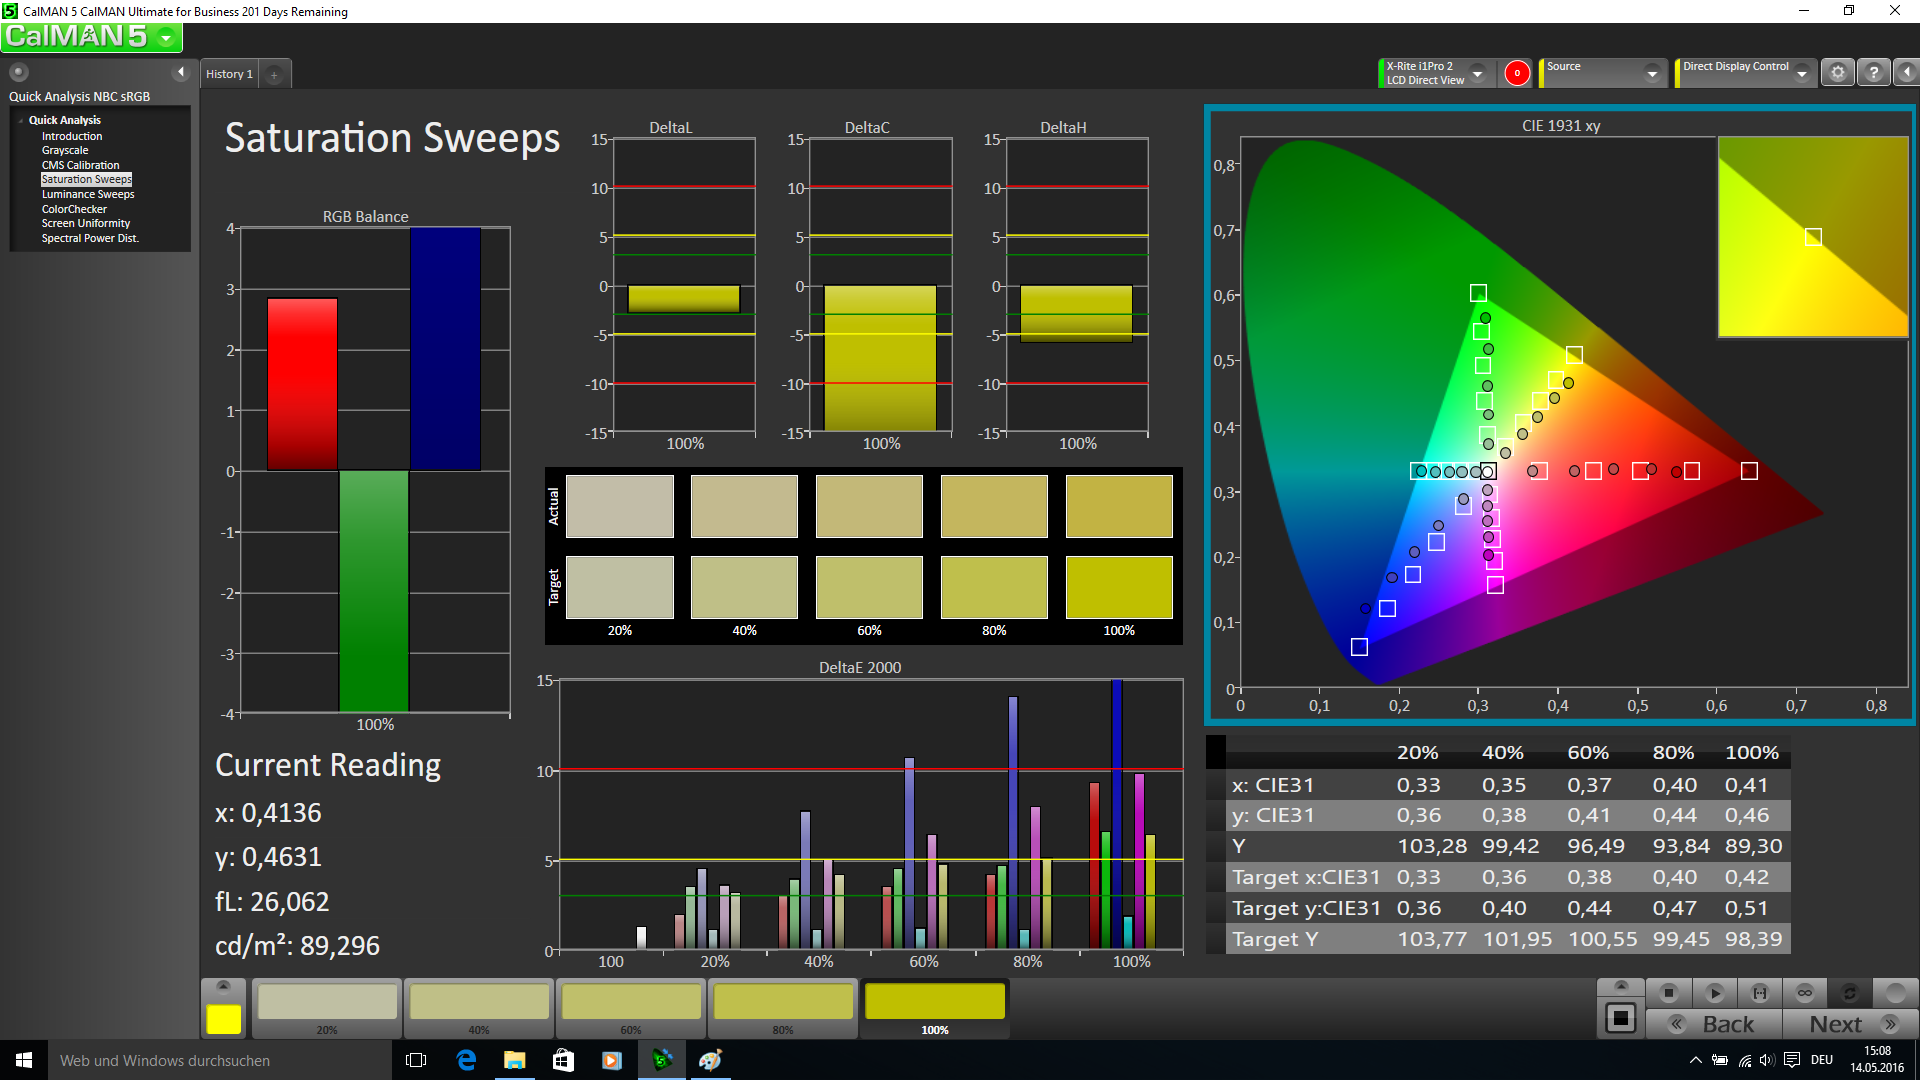
ΔE Color 8.75 | 0.5-29.43 Ø5
ΔE Greyscale 9.2 | 0.57-98 Ø5.3
57.96% sRGB (Argyll 1.6.3 3D)
37.46% AdobeRGB 1998 (Argyll 1.6.3 3D)
40.63% AdobeRGB 1998 (Argyll 2.2.0 3D)
58.1% sRGB (Argyll 2.2.0 3D)
39.25% Display P3 (Argyll 2.2.0 3D)
Gamma: 2.45
| Asus ASUSPRO Advanced B8430UA-FA0084E TN WLED, 1920x1080 | Asus ASUSPRO Advanced BU401LA-CZ020G TN-Panel, 1600x900 | Lenovo ThinkPad L460-20FVS01400 IPS, 1920x1080 | Dell Latitude 14 E5470 TN, 1366x768 | HP EliteBook 840 G3 T9X59ET#ABD TN LED, 1920x1080 | Lenovo ThinkPad T460s-20F9003SGE IPS, 1920x1080 | Lenovo ThinkPad T460-20FN003LGE IPS, 1920x1080 | |
|---|---|---|---|---|---|---|---|
| Display | 20% | 8% | 3% | 25% | 6% | 7% | |
| Display P3 Coverage | 39.25 | 46.98 20% | 42.2 8% | 40.06 2% | 48.93 25% | 41.65 6% | 42.09 7% |
| sRGB Coverage | 58.1 | 69.8 20% | 62.3 7% | 60.3 4% | 73.7 27% | 61.6 6% | 62 7% |
| AdobeRGB 1998 Coverage | 40.63 | 48.67 20% | 43.72 8% | 41.42 2% | 50.5 24% | 43.14 6% | 43.6 7% |
| Response Times | -23% | -36% | -10% | -19% | -9% | ||
| Response Time Grey 50% / Grey 80% * | 42 ? | 44.4 ? -6% | 56.8 ? -35% | 43 ? -2% | 42 ? -0% | 42.4 ? -1% | |
| Response Time Black / White * | 21.2 ? | 29.6 ? -40% | 28.8 ? -36% | 25 ? -18% | 29.2 ? -38% | 24.8 ? -17% | |
| PWM Frequency | 204 ? | ||||||
| Screen | -2% | 19% | -16% | 10% | 20% | 14% | |
| Brightness middle | 210 | 216 3% | 245 17% | 229 9% | 366 74% | 226 8% | 230 10% |
| Brightness | 207 | 209 1% | 225 9% | 207 0% | 336 62% | 211 2% | 216 4% |
| Brightness Distribution | 87 | 89 2% | 83 -5% | 80 -8% | 87 0% | 89 2% | 85 -2% |
| Black Level * | 0.4 | 0.436 -9% | 0.24 40% | 0.69 -73% | 0.65 -63% | 0.22 45% | 0.26 35% |
| Contrast | 525 | 495 -6% | 1021 94% | 332 -37% | 563 7% | 1027 96% | 885 69% |
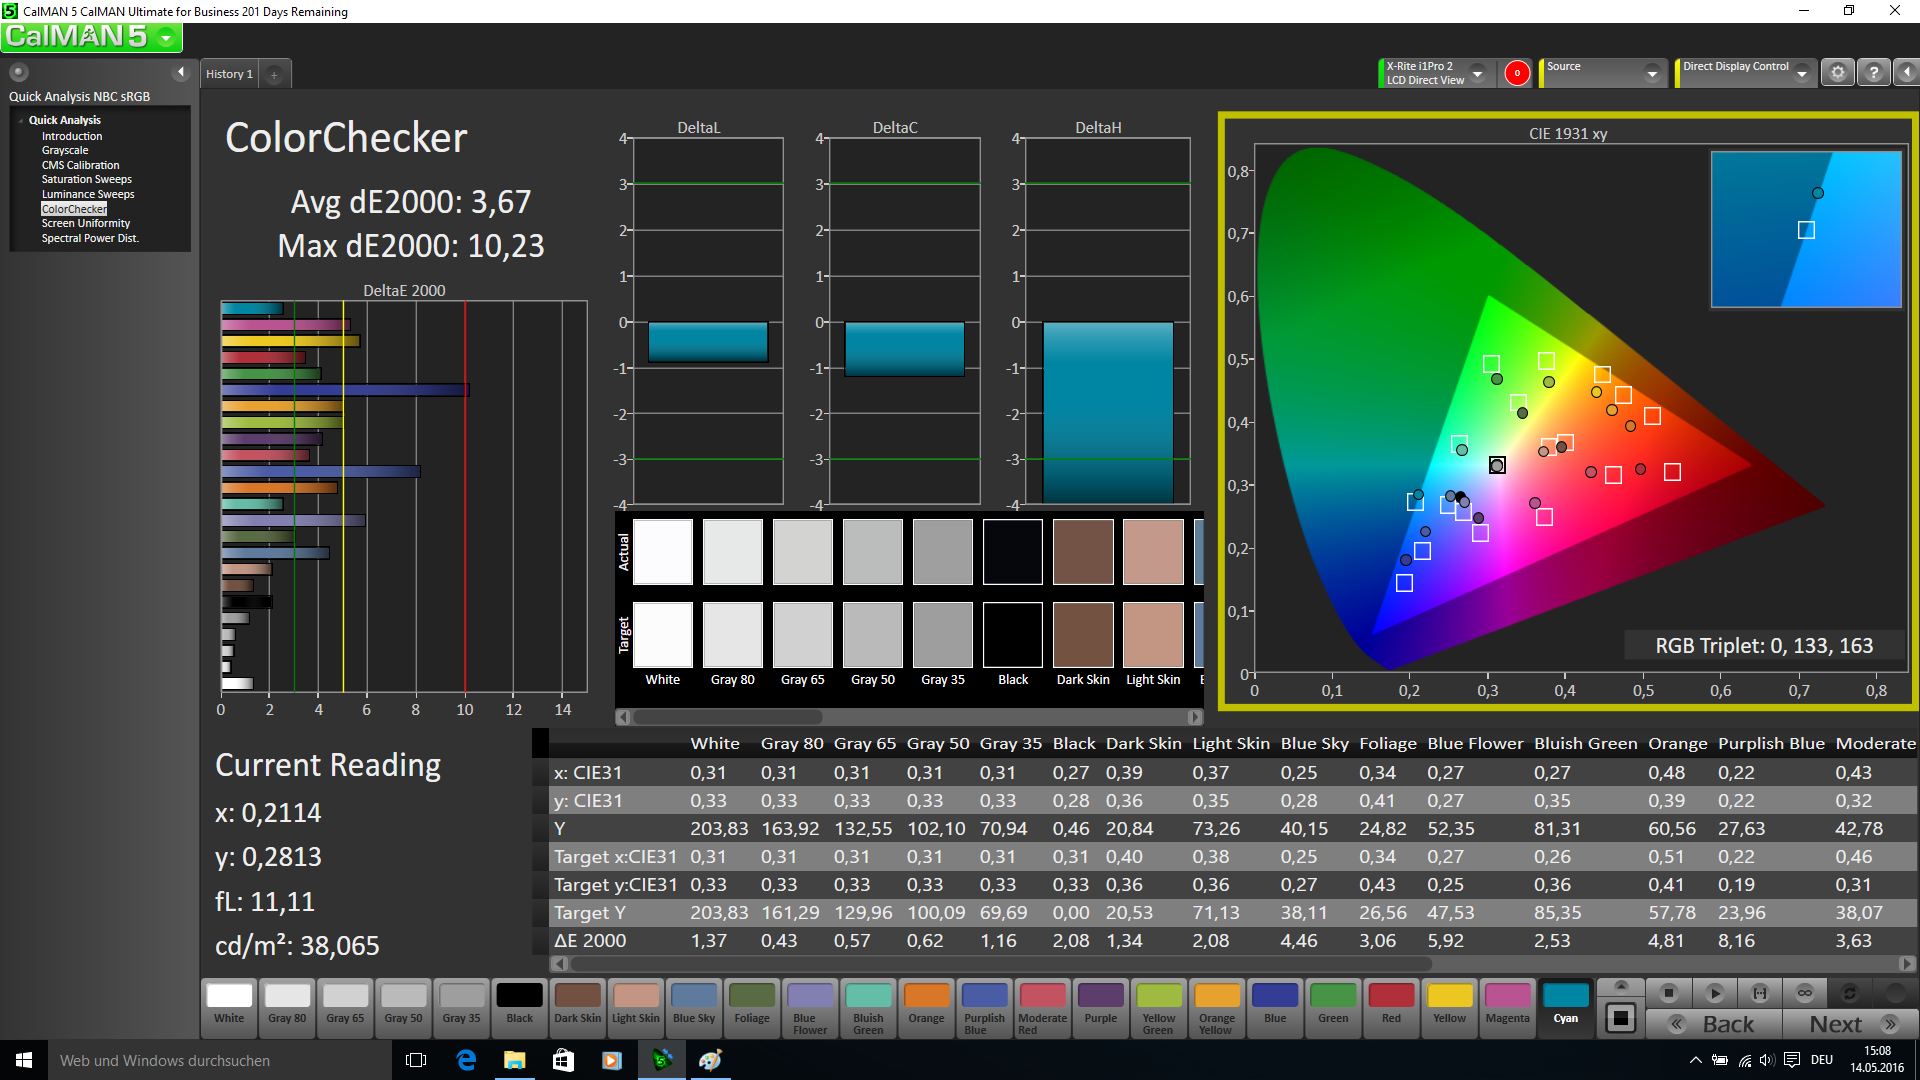
| Colorchecker dE 2000 * | 8.75 | 9.63 -10% | 6.89 21% | 10.16 -16% | 10.26 -17% | 6.44 26% | 7.32 16% |
| Colorchecker dE 2000 max. * | 13.87 | 17.62 -27% | 17.18 -24% | 17.18 -24% | 18.14 -31% | ||
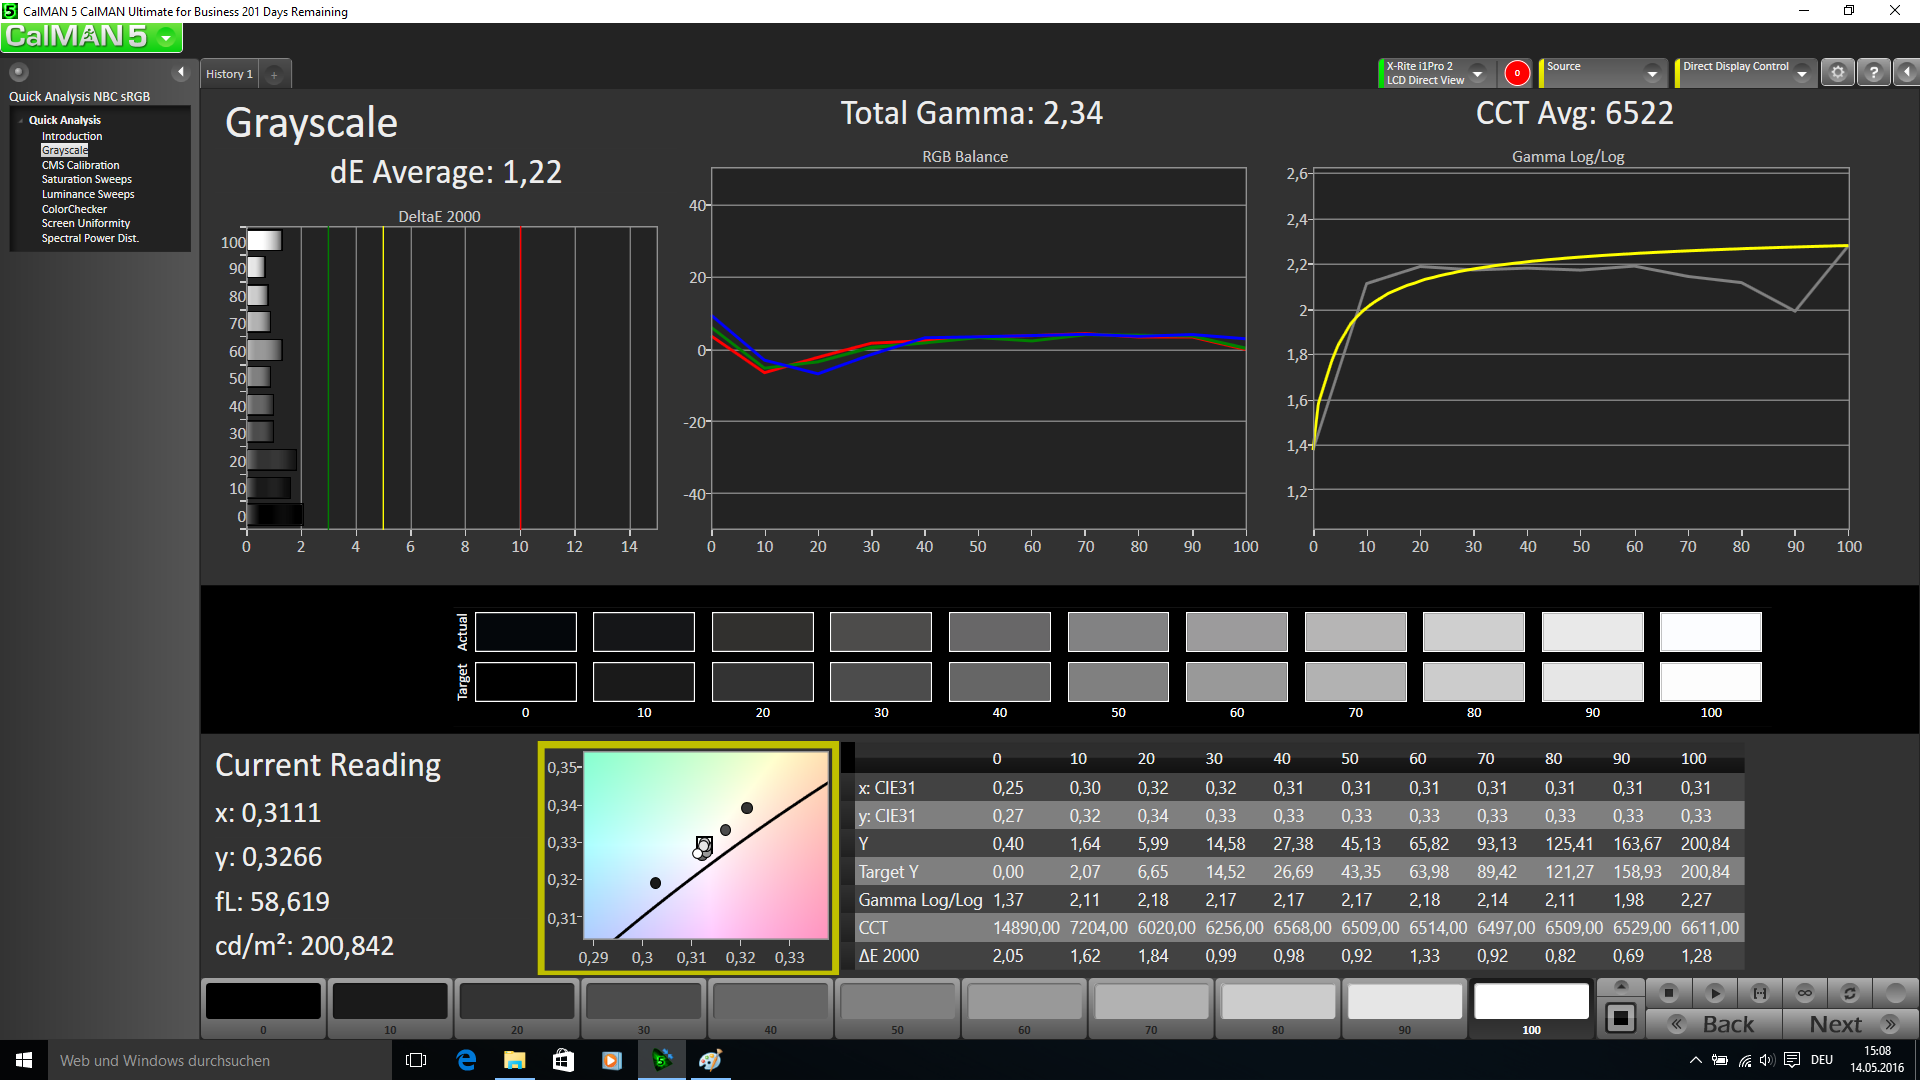
| Greyscale dE 2000 * | 9.2 | 10.72 -17% | 6.45 30% | 10.87 -18% | 11.51 -25% | 5.87 36% | 6.98 24% |
| Gamma | 2.45 90% | 2.49 88% | 2.46 89% | 2.41 91% | 2.4 92% | 2.37 93% | 2.5 88% |
| CCT | 11118 58% | 12873 50% | 6857 95% | 12881 50% | 12725 51% | 6856 95% | 6683 97% |
| Color Space (Percent of AdobeRGB 1998) | 37.46 | 44.8 20% | 40.1 7% | 38.4 3% | 47 25% | 39.58 6% | 39.97 7% |
| Color Space (Percent of sRGB) | 57.96 | 61.8 7% | 60.4 4% | 74 28% | 61.15 6% | 61.55 6% | |
| Total Average (Program / Settings) | 9% /
4% | 1% /
11% | -16% /
-15% | 8% /
11% | 2% /
12% | 4% /
9% |
* ... smaller is better
Display Response Times
| ↔ Response Time Black to White | ||
|---|---|---|
| 21.2 ms ... rise ↗ and fall ↘ combined | ↗ 16.8 ms rise | 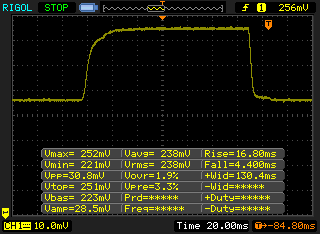 |
| ↘ 4.4 ms fall | ||
| The screen shows good response rates in our tests, but may be too slow for competitive gamers. In comparison, all tested devices range from 0.1 (minimum) to 240 (maximum) ms. » 41 % of all devices are better. This means that the measured response time is similar to the average of all tested devices (21.5 ms). | ||
| ↔ Response Time 50% Grey to 80% Grey | ||
| 42 ms ... rise ↗ and fall ↘ combined | ↗ 22.4 ms rise | 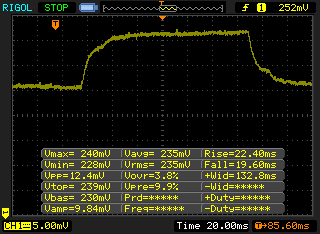 |
| ↘ 19.6 ms fall | ||
| The screen shows slow response rates in our tests and will be unsatisfactory for gamers. In comparison, all tested devices range from 0.2 (minimum) to 636 (maximum) ms. » 63 % of all devices are better. This means that the measured response time is worse than the average of all tested devices (33.7 ms). | ||
Screen Flickering / PWM (Pulse-Width Modulation)
| Screen flickering / PWM not detected | ||
In comparison: 53 % of all tested devices do not use PWM to dim the display. If PWM was detected, an average of 17924 (minimum: 5 - maximum: 3846000) Hz was measured. | ||
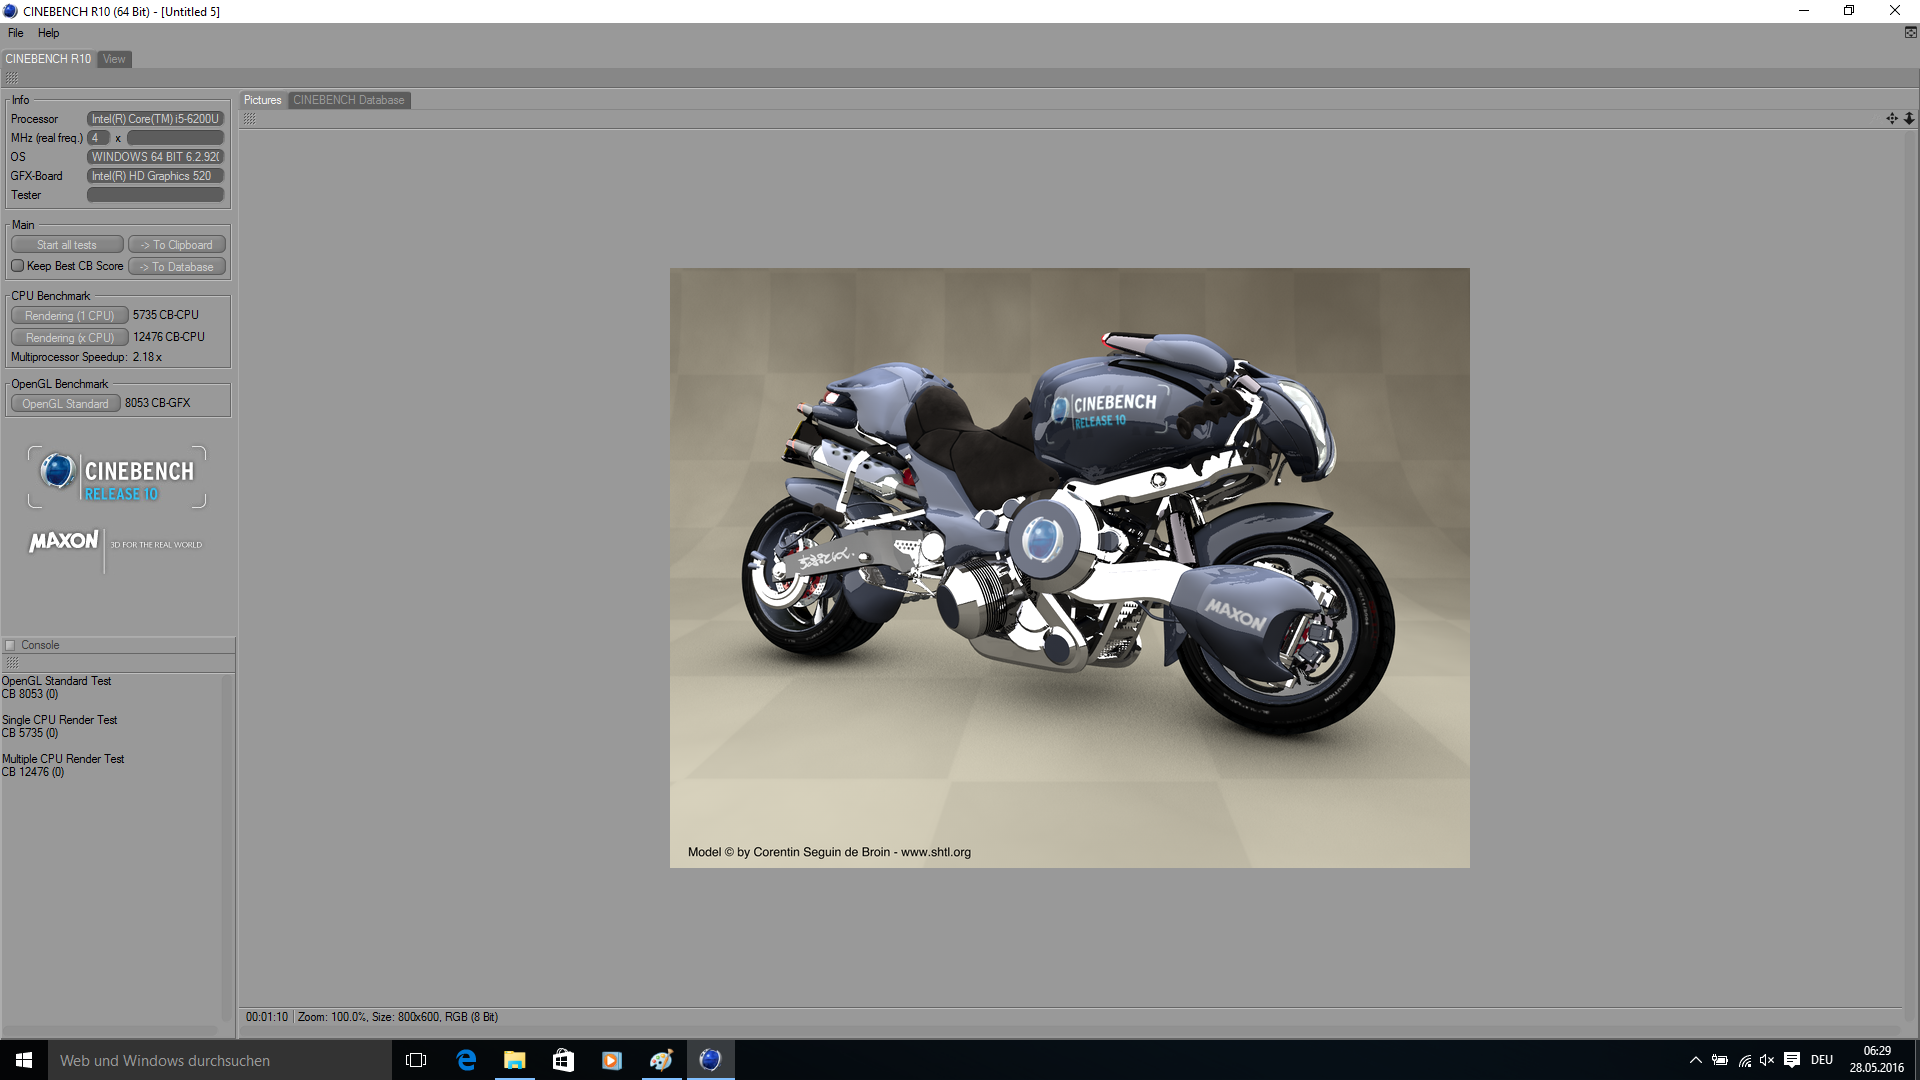
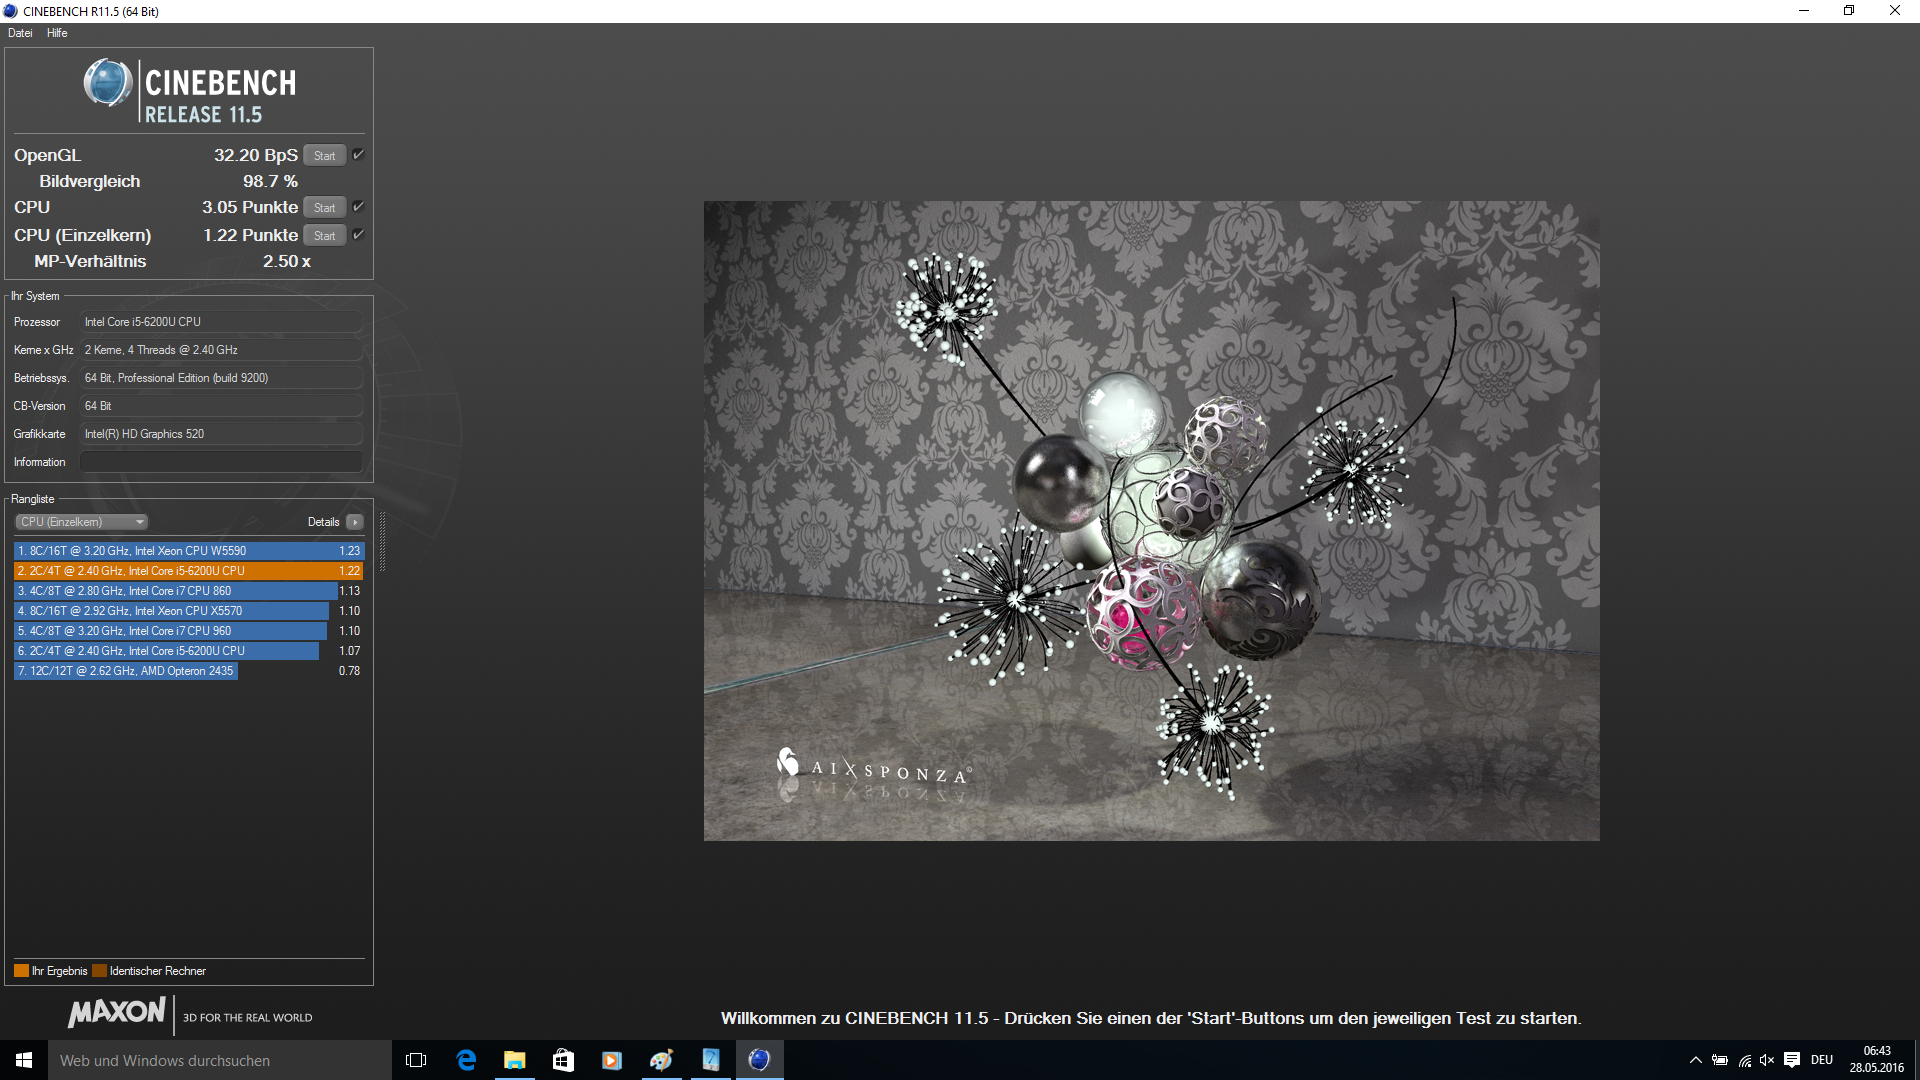
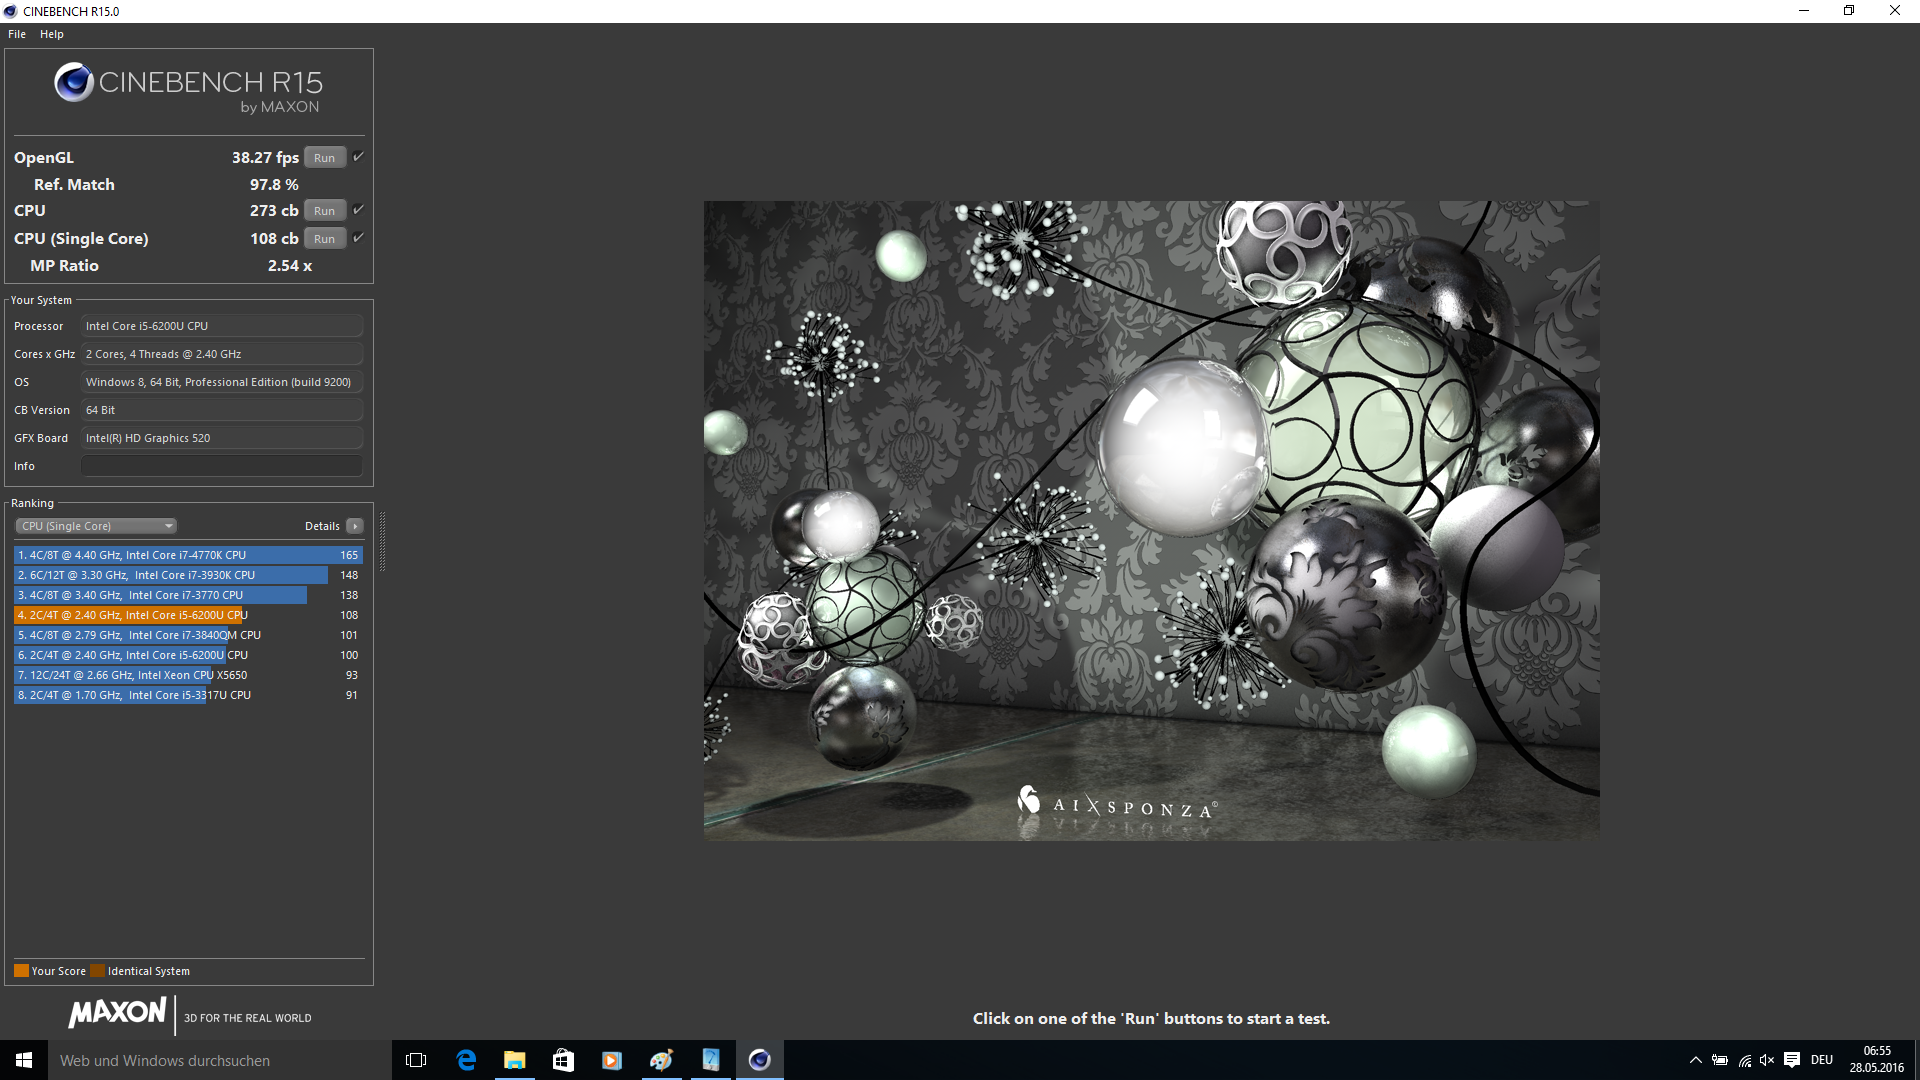
| Cinebench R10 | |
| Rendering Single CPUs 64Bit (sort by value) | |
| Asus ASUSPRO Advanced B8430UA-FA0084E | |
| Asus ASUSPRO Advanced BU401LA-CZ020G | |
| Dell Latitude 14 E5470 | |
| Rendering Multiple CPUs 64Bit (sort by value) | |
| Asus ASUSPRO Advanced B8430UA-FA0084E | |
| Asus ASUSPRO Advanced BU401LA-CZ020G | |
| Dell Latitude 14 E5470 | |
* ... smaller is better
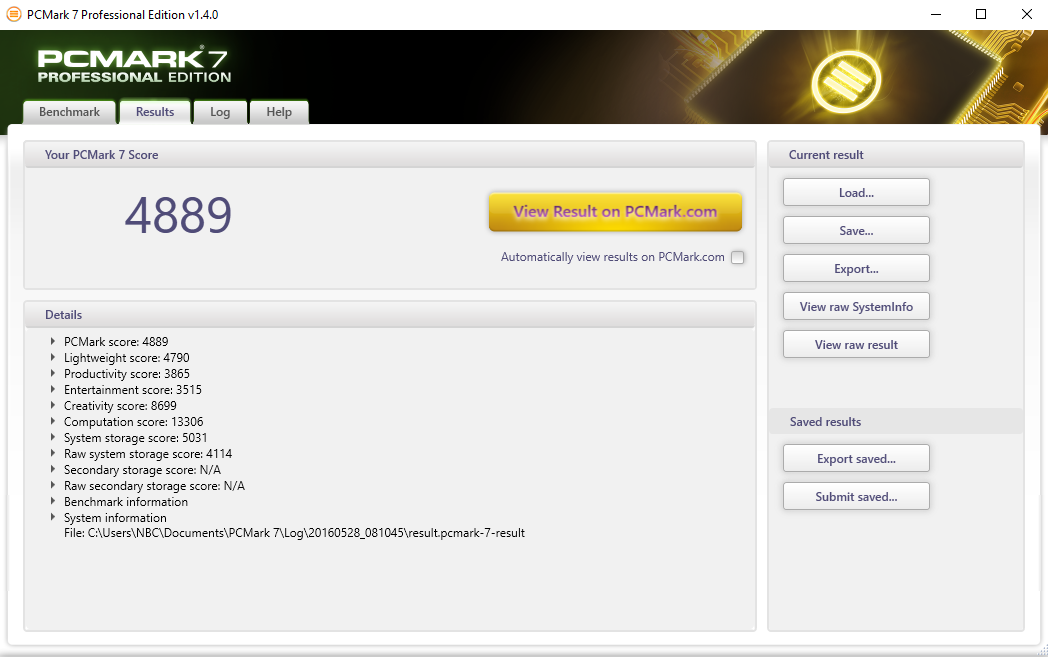
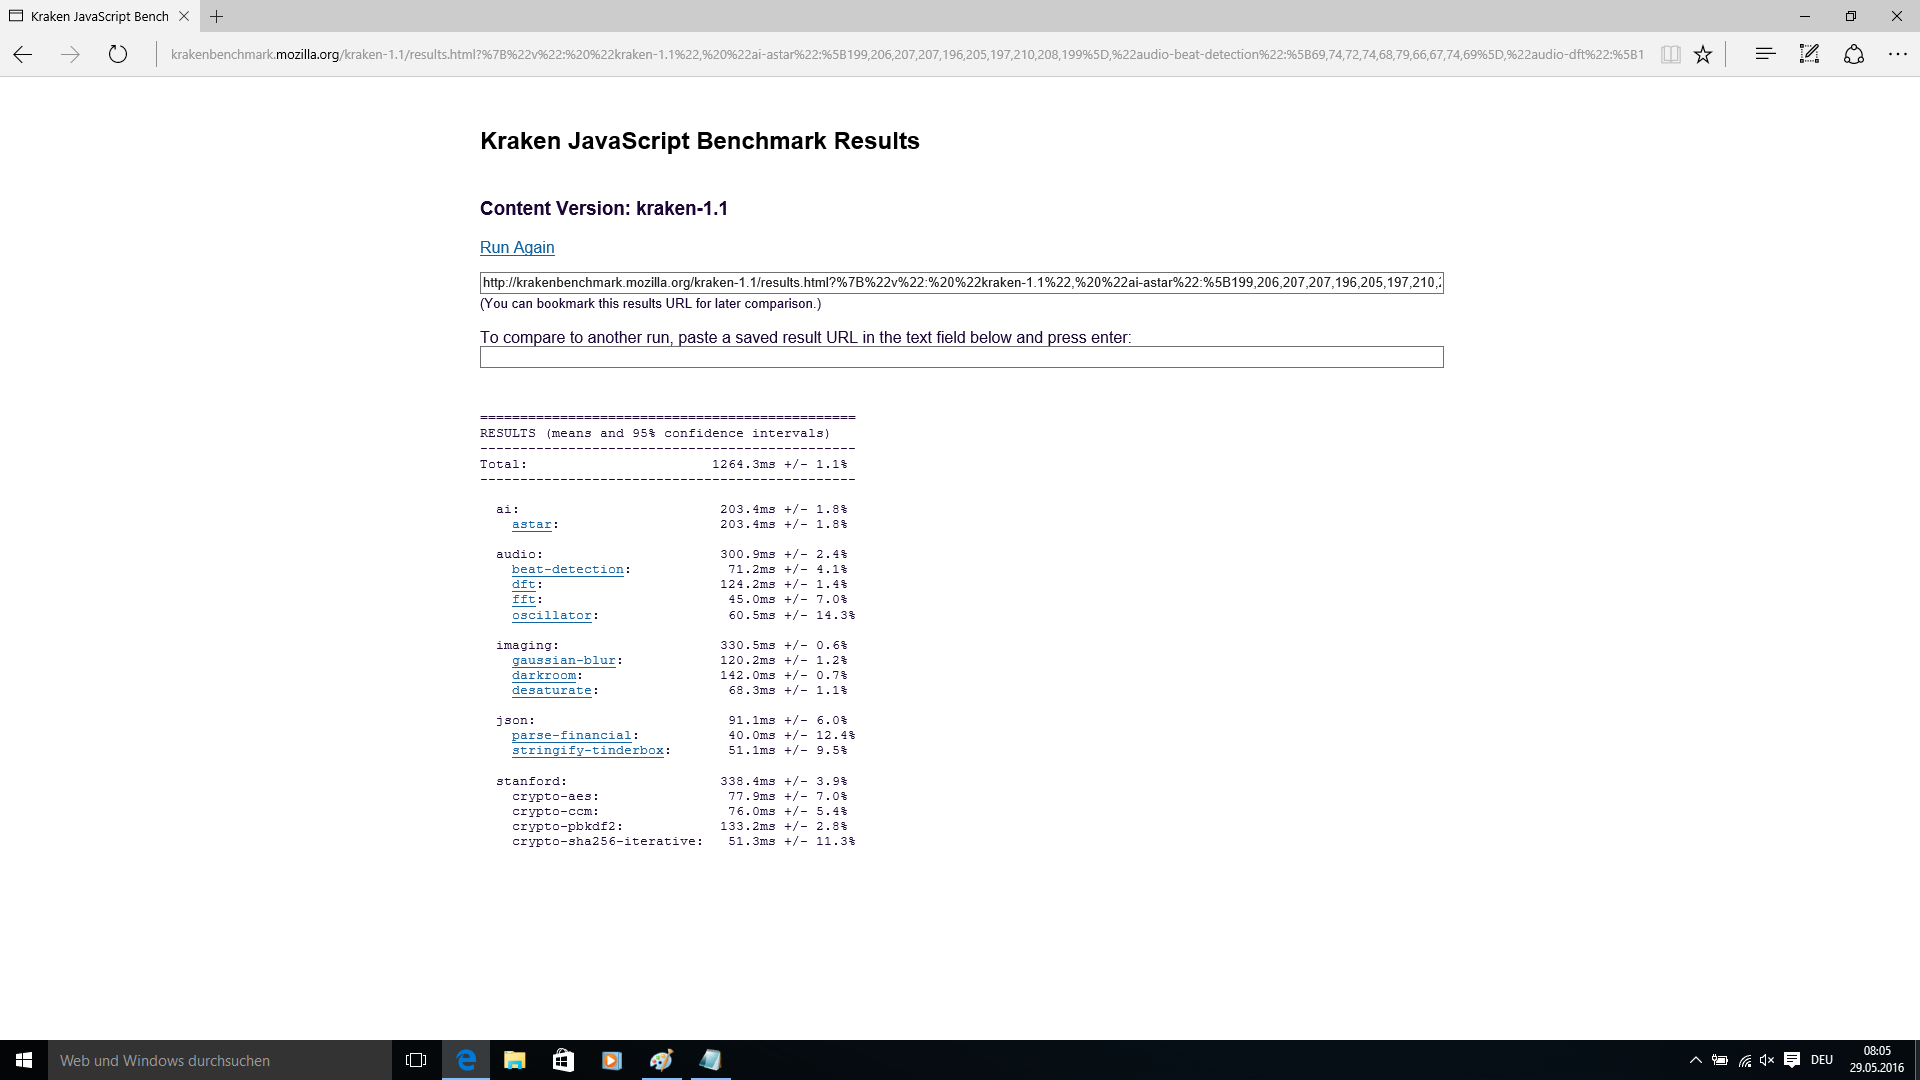
| PCMark 7 Score | 4889 puan | |
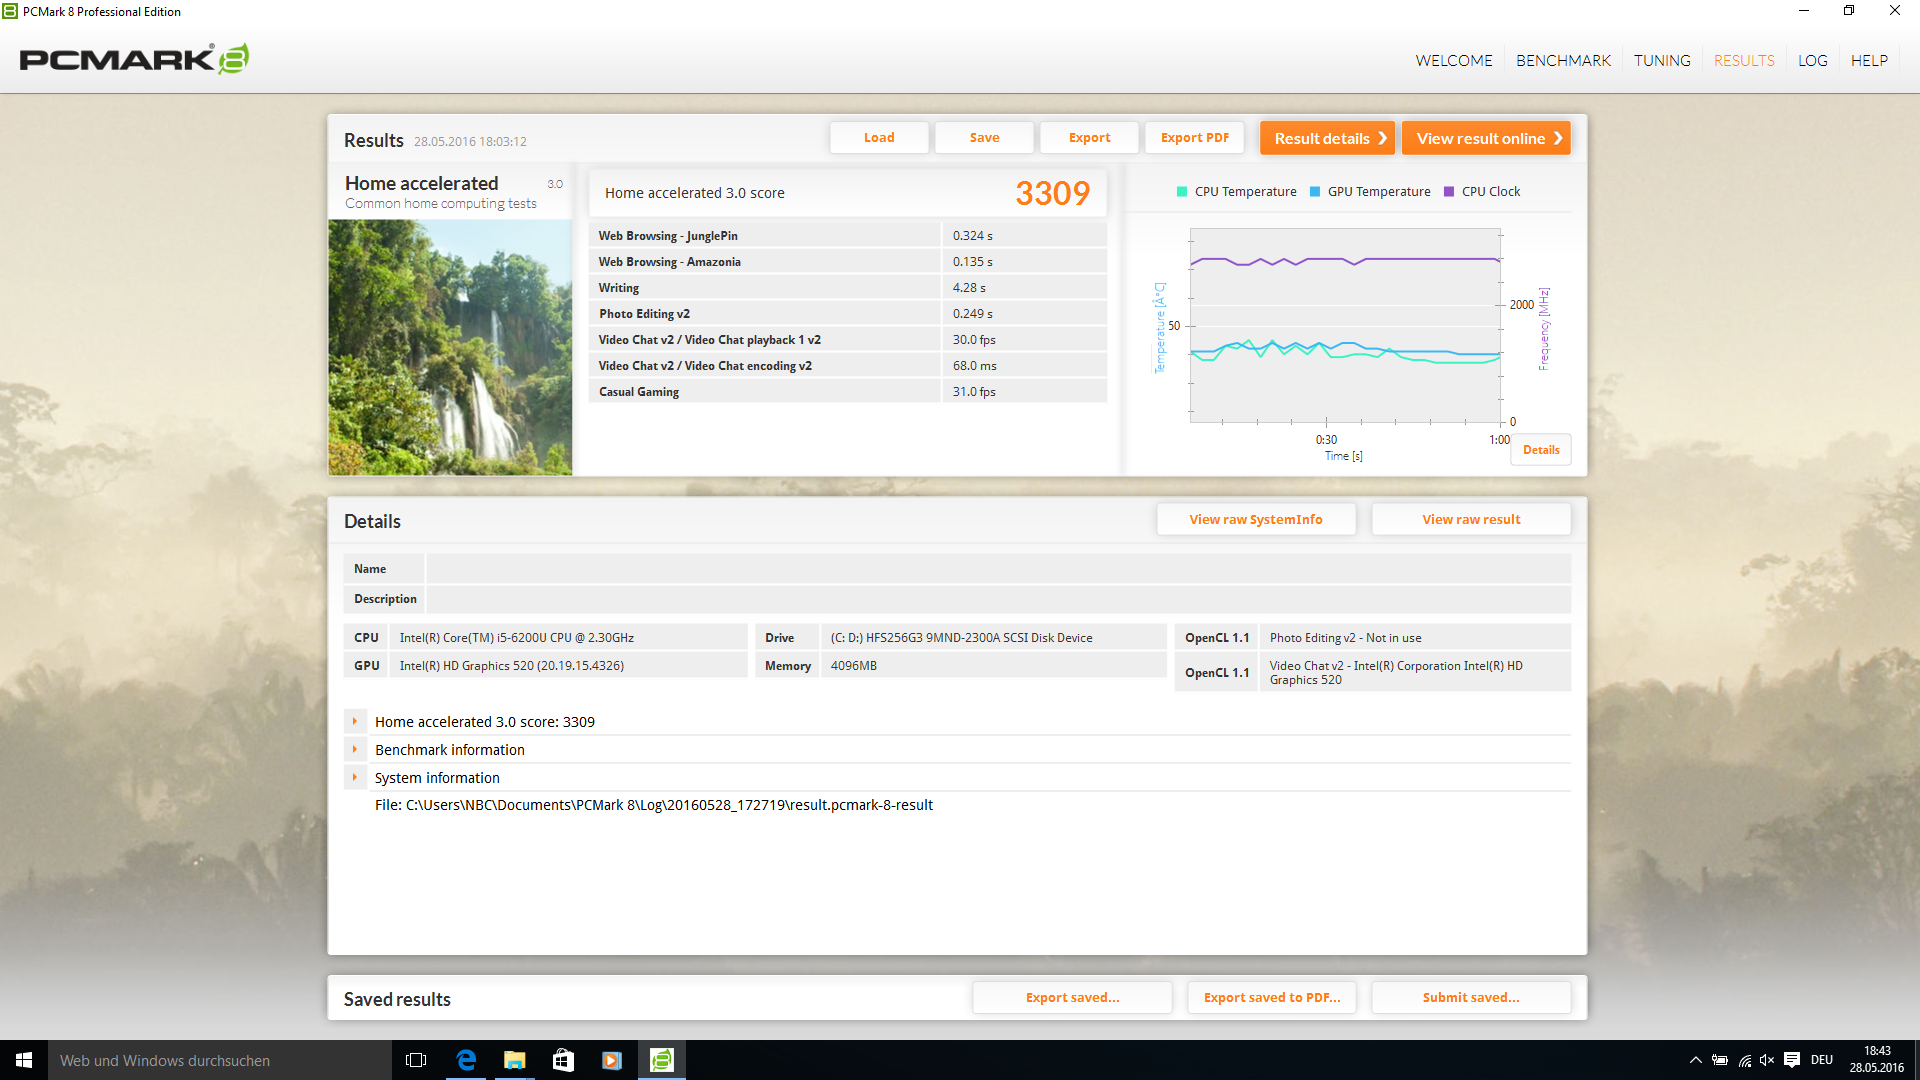
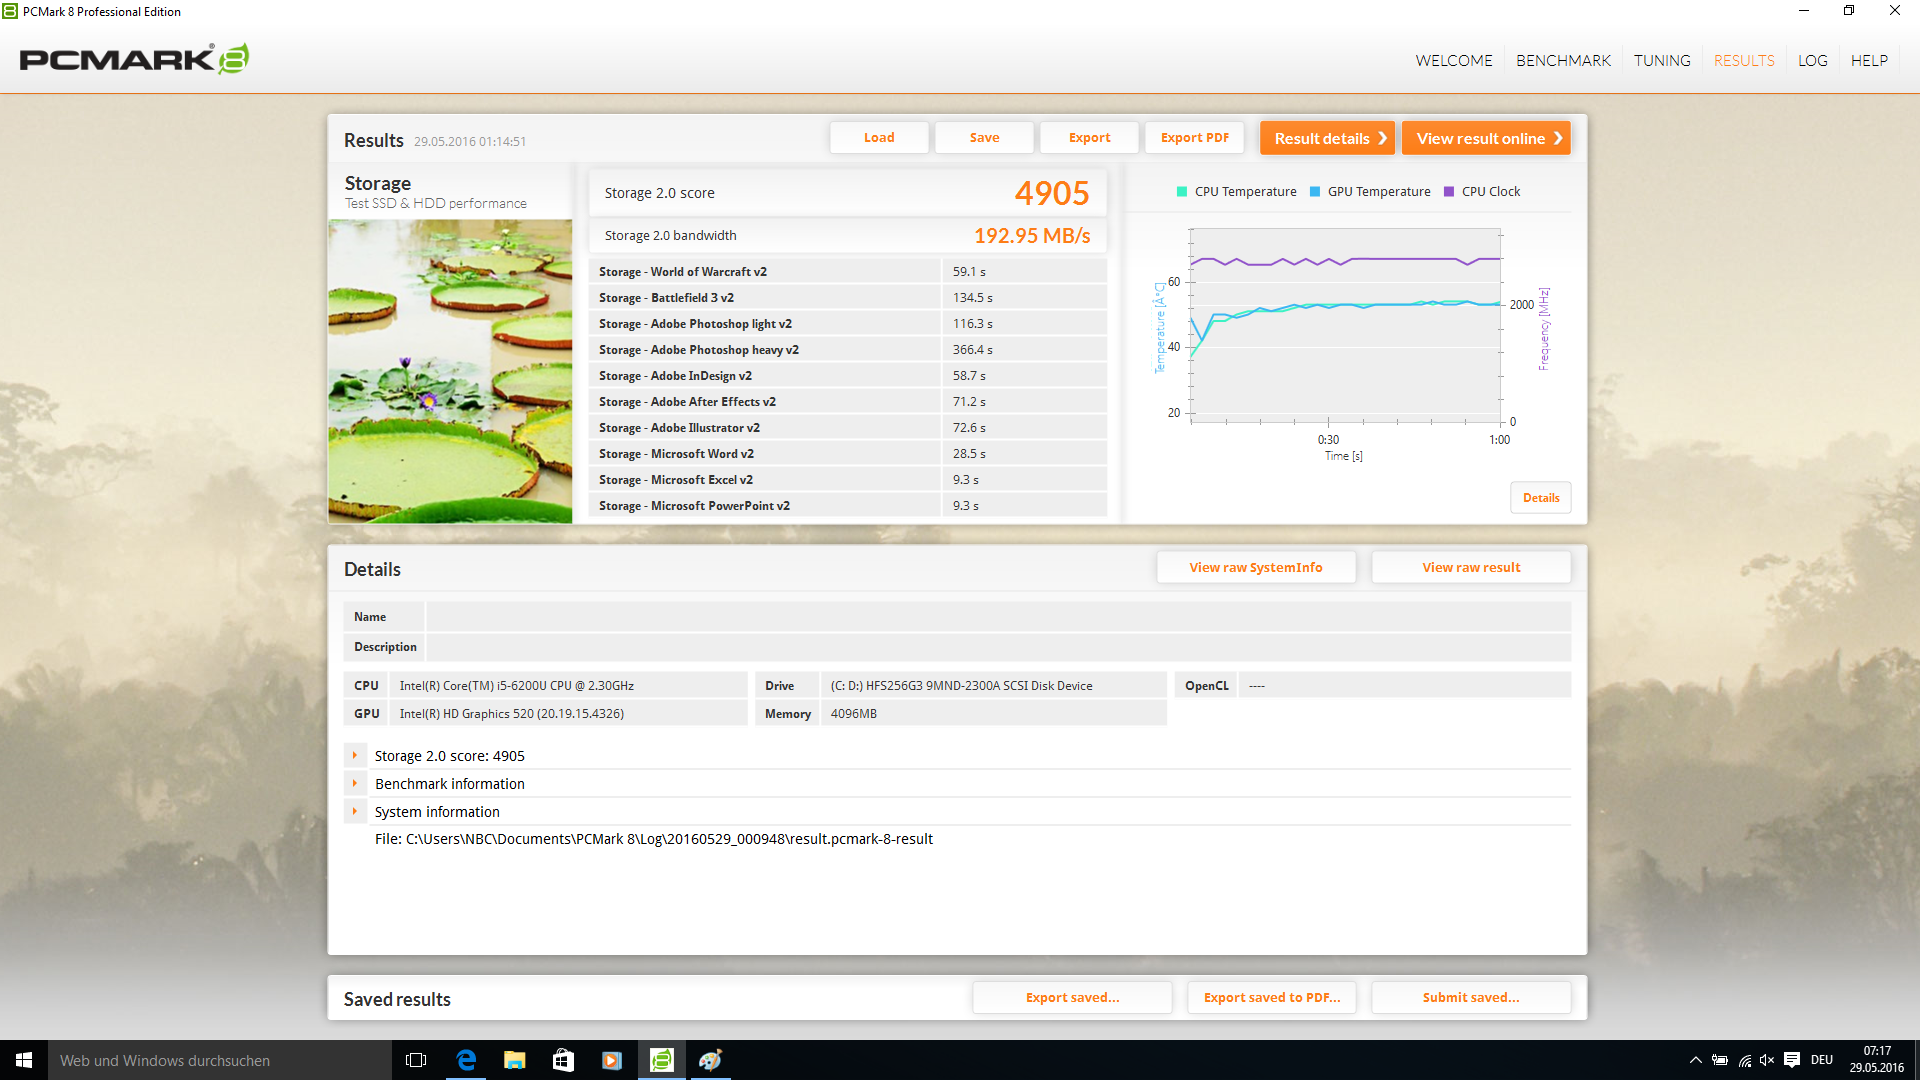
| PCMark 8 Home Score Accelerated v2 | 3309 puan | |
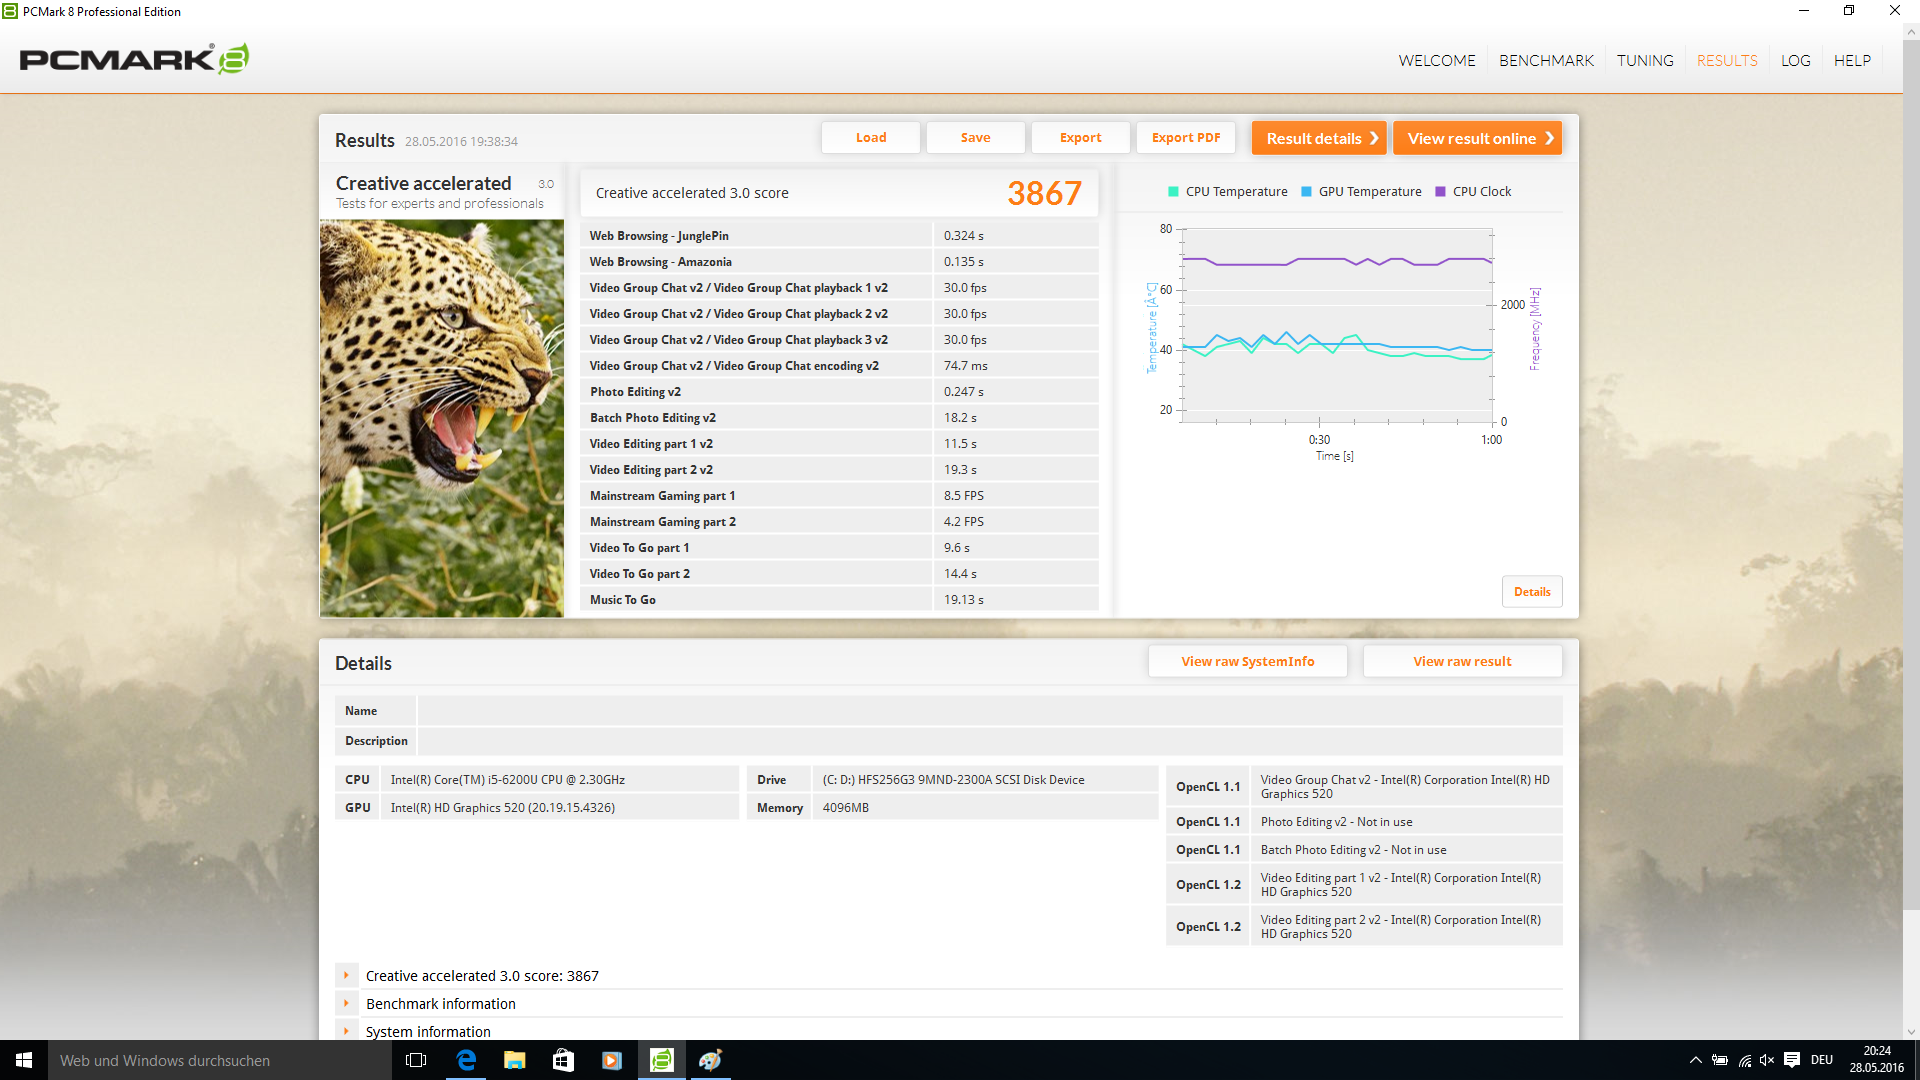
| PCMark 8 Creative Score Accelerated v2 | 3867 puan | |
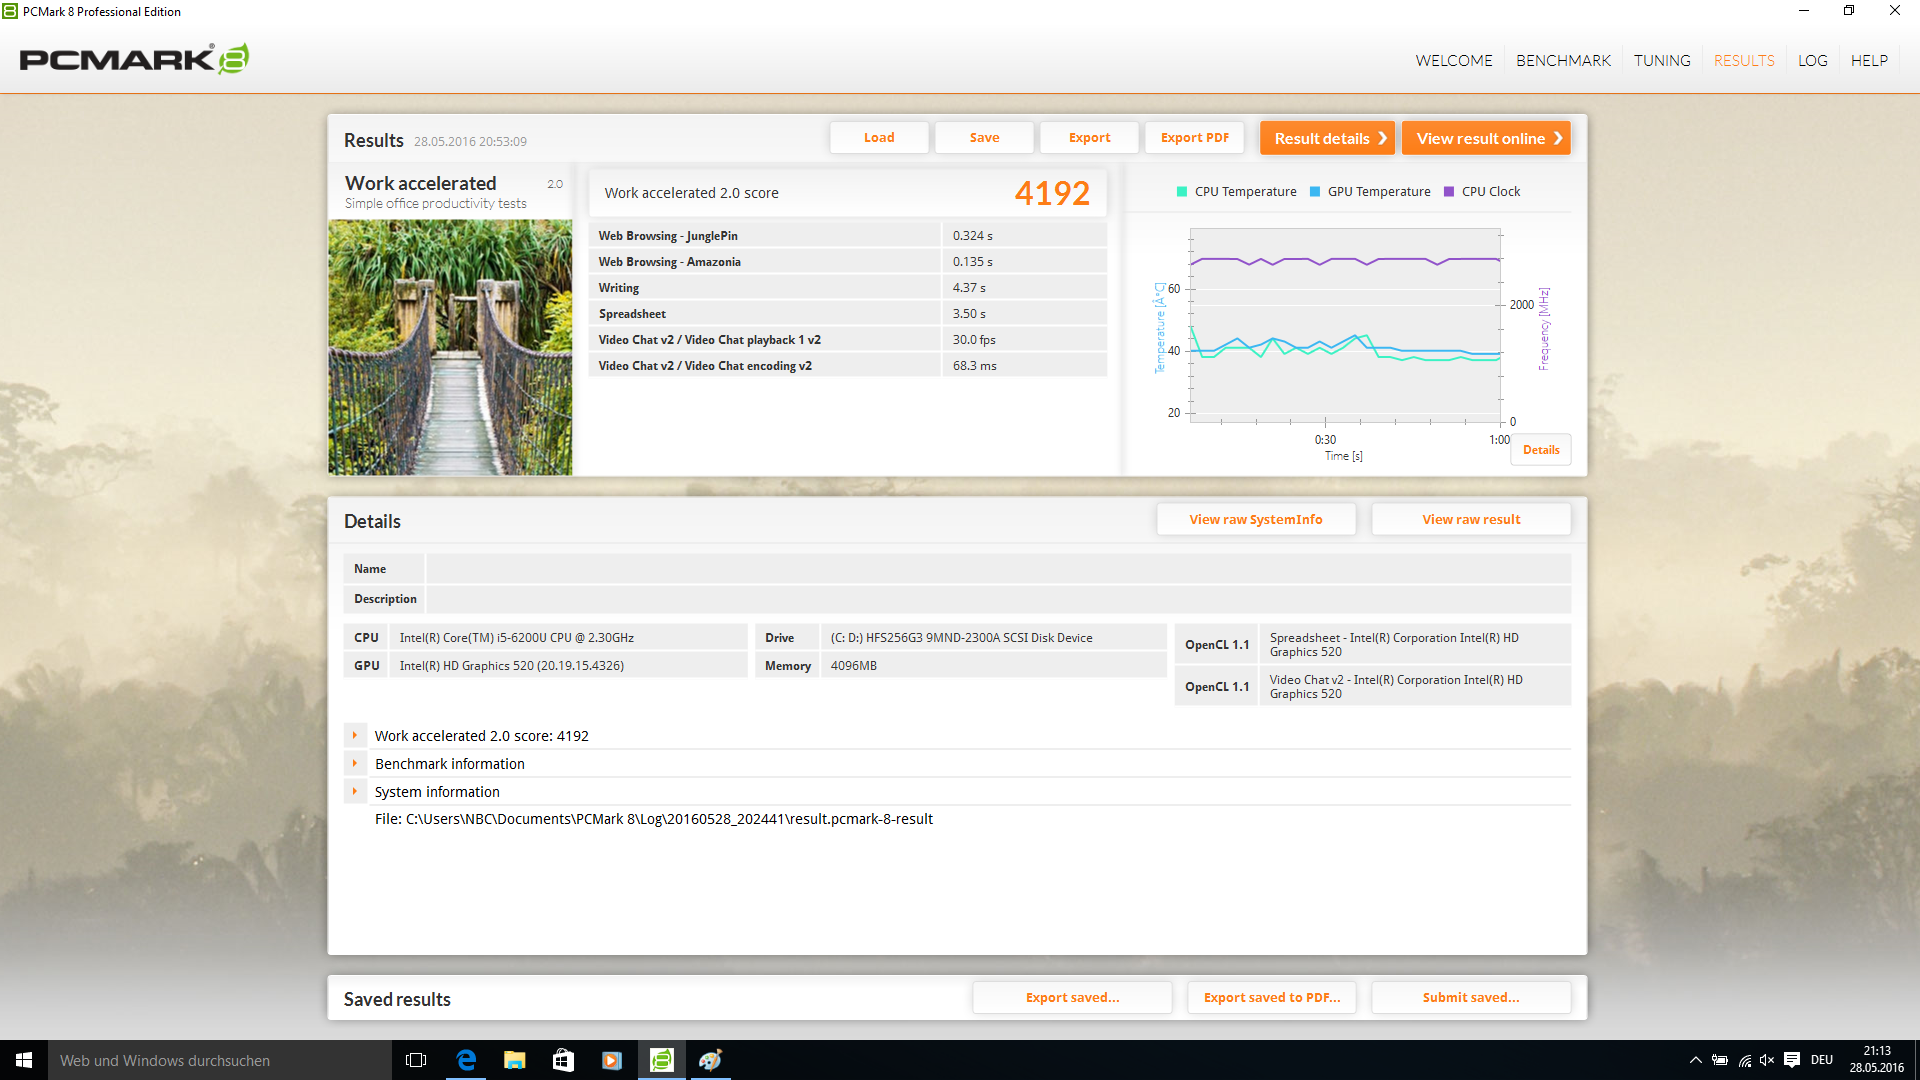
| PCMark 8 Work Score Accelerated v2 | 4192 puan | |
Yardım | ||

| 3DMark 06 - 1280x1024 Standard Score AA:0x AF:0x (sort by value) | |
| Asus ASUSPRO Advanced B8430UA-FA0084E | |
| Lenovo ThinkPad L460-20FVS01400 | |
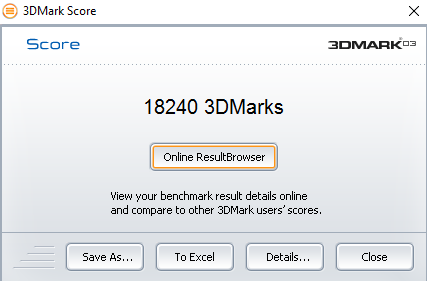
| 3DMark 03 Standard | 18240 puan | |
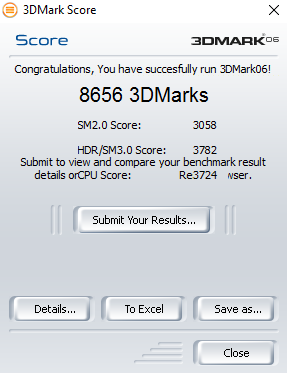
| 3DMark 06 Standard Score | 8656 puan | |
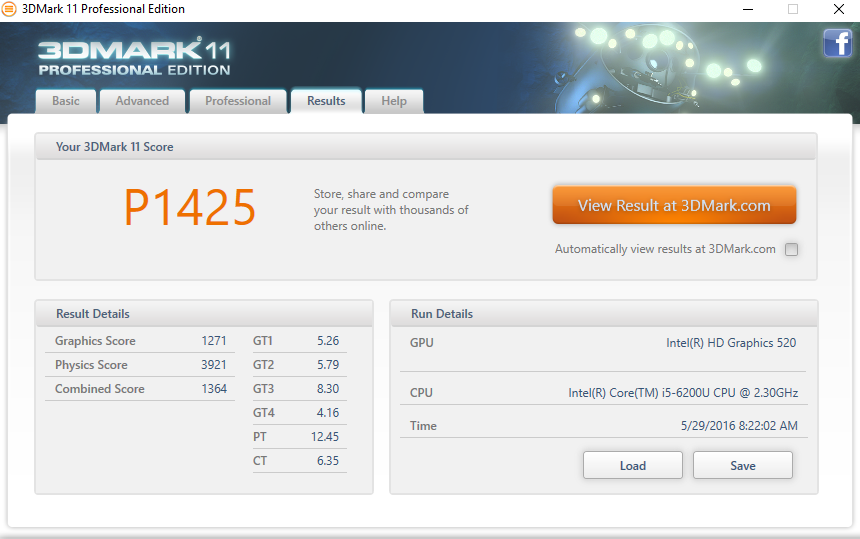
| 3DMark 11 Performance | 1425 puan | |
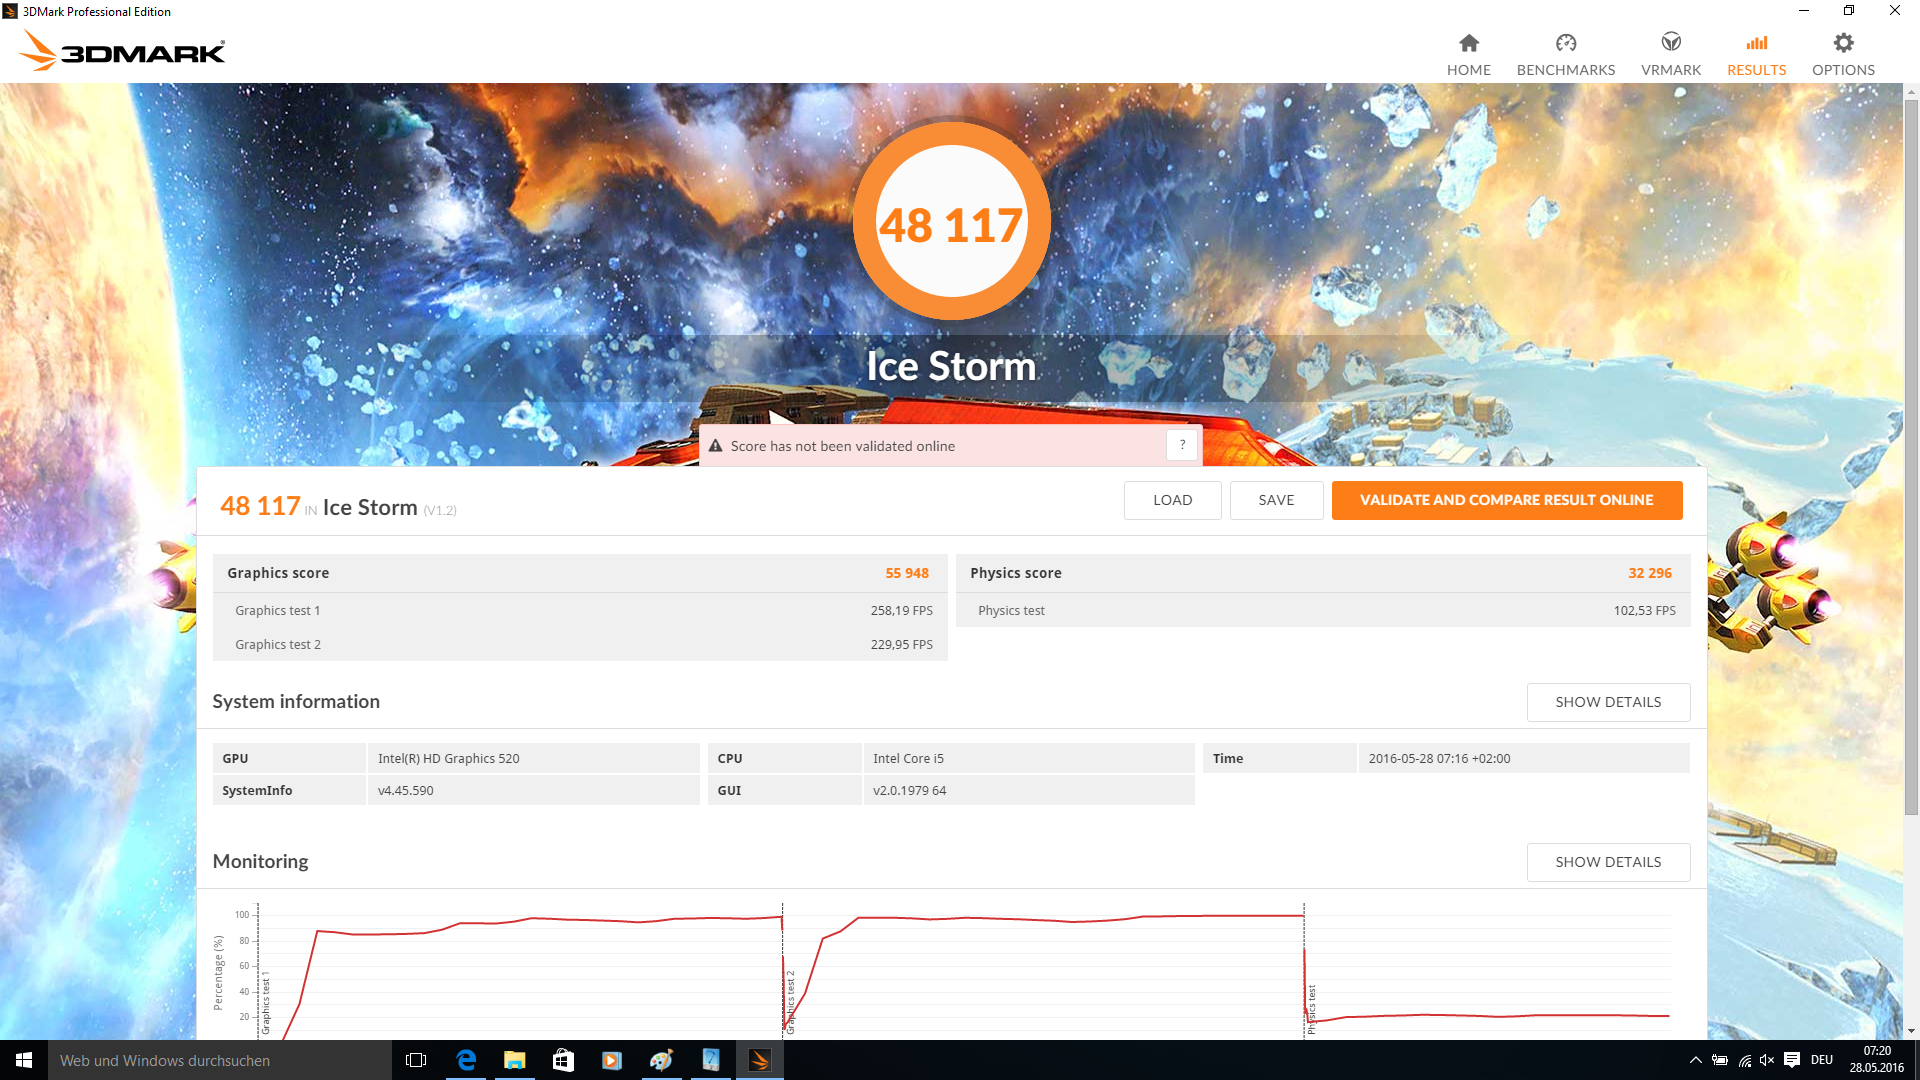
| 3DMark Ice Storm Standard Score | 48117 puan | |
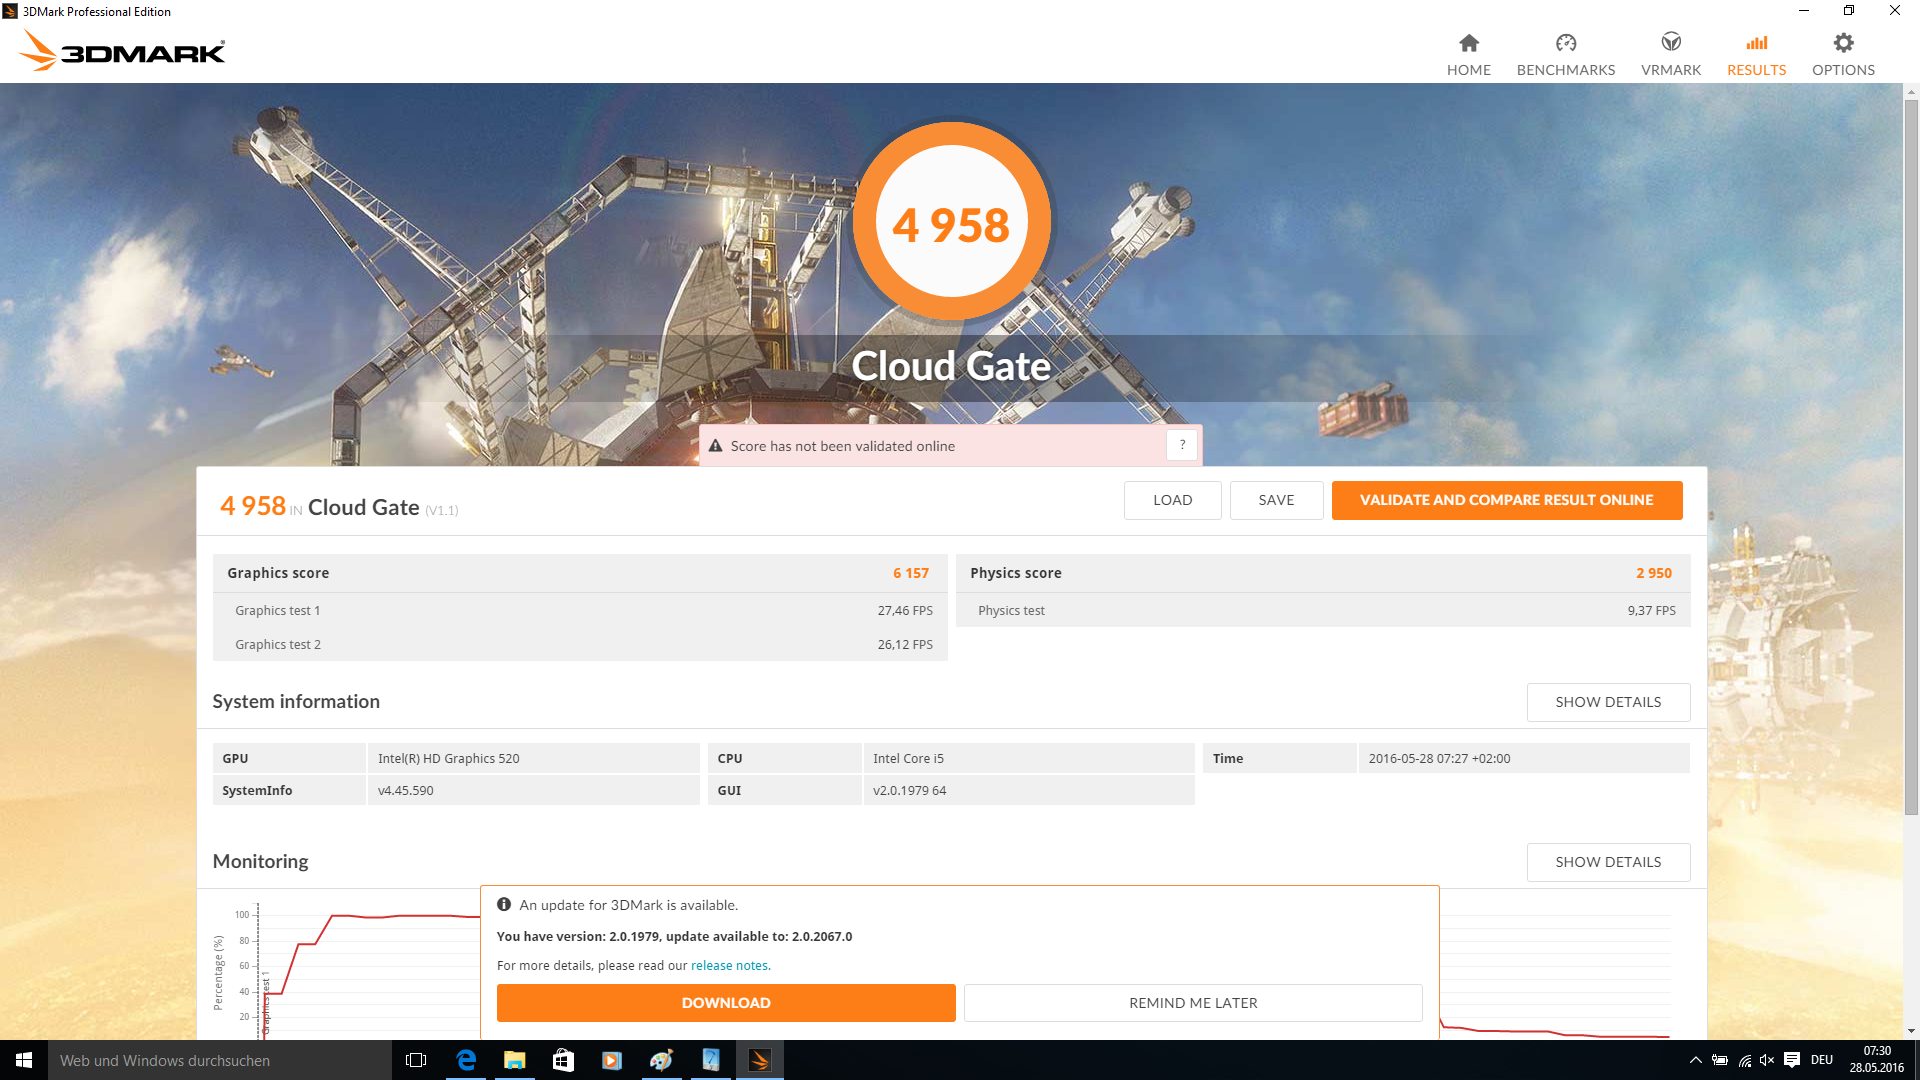
| 3DMark Cloud Gate Standard Score | 4958 puan | |
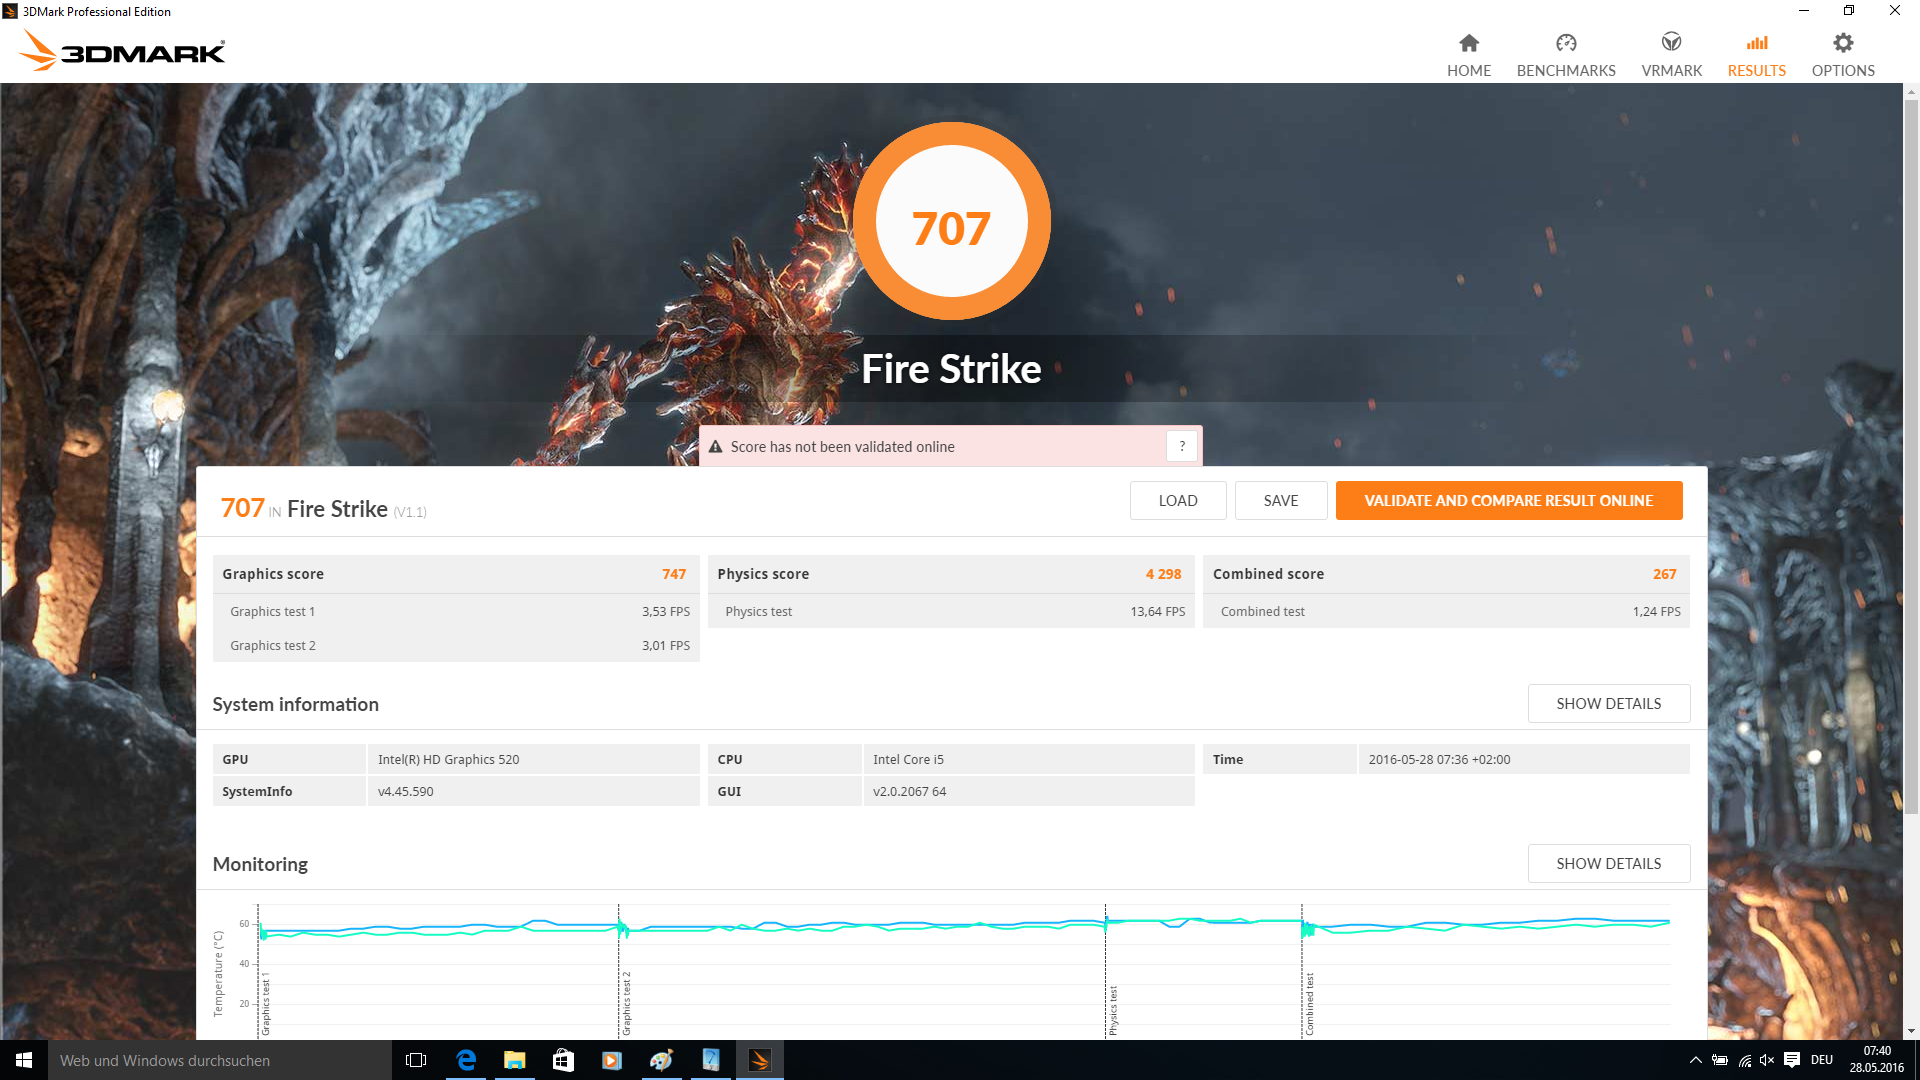
| 3DMark Fire Strike Score | 707 puan | |
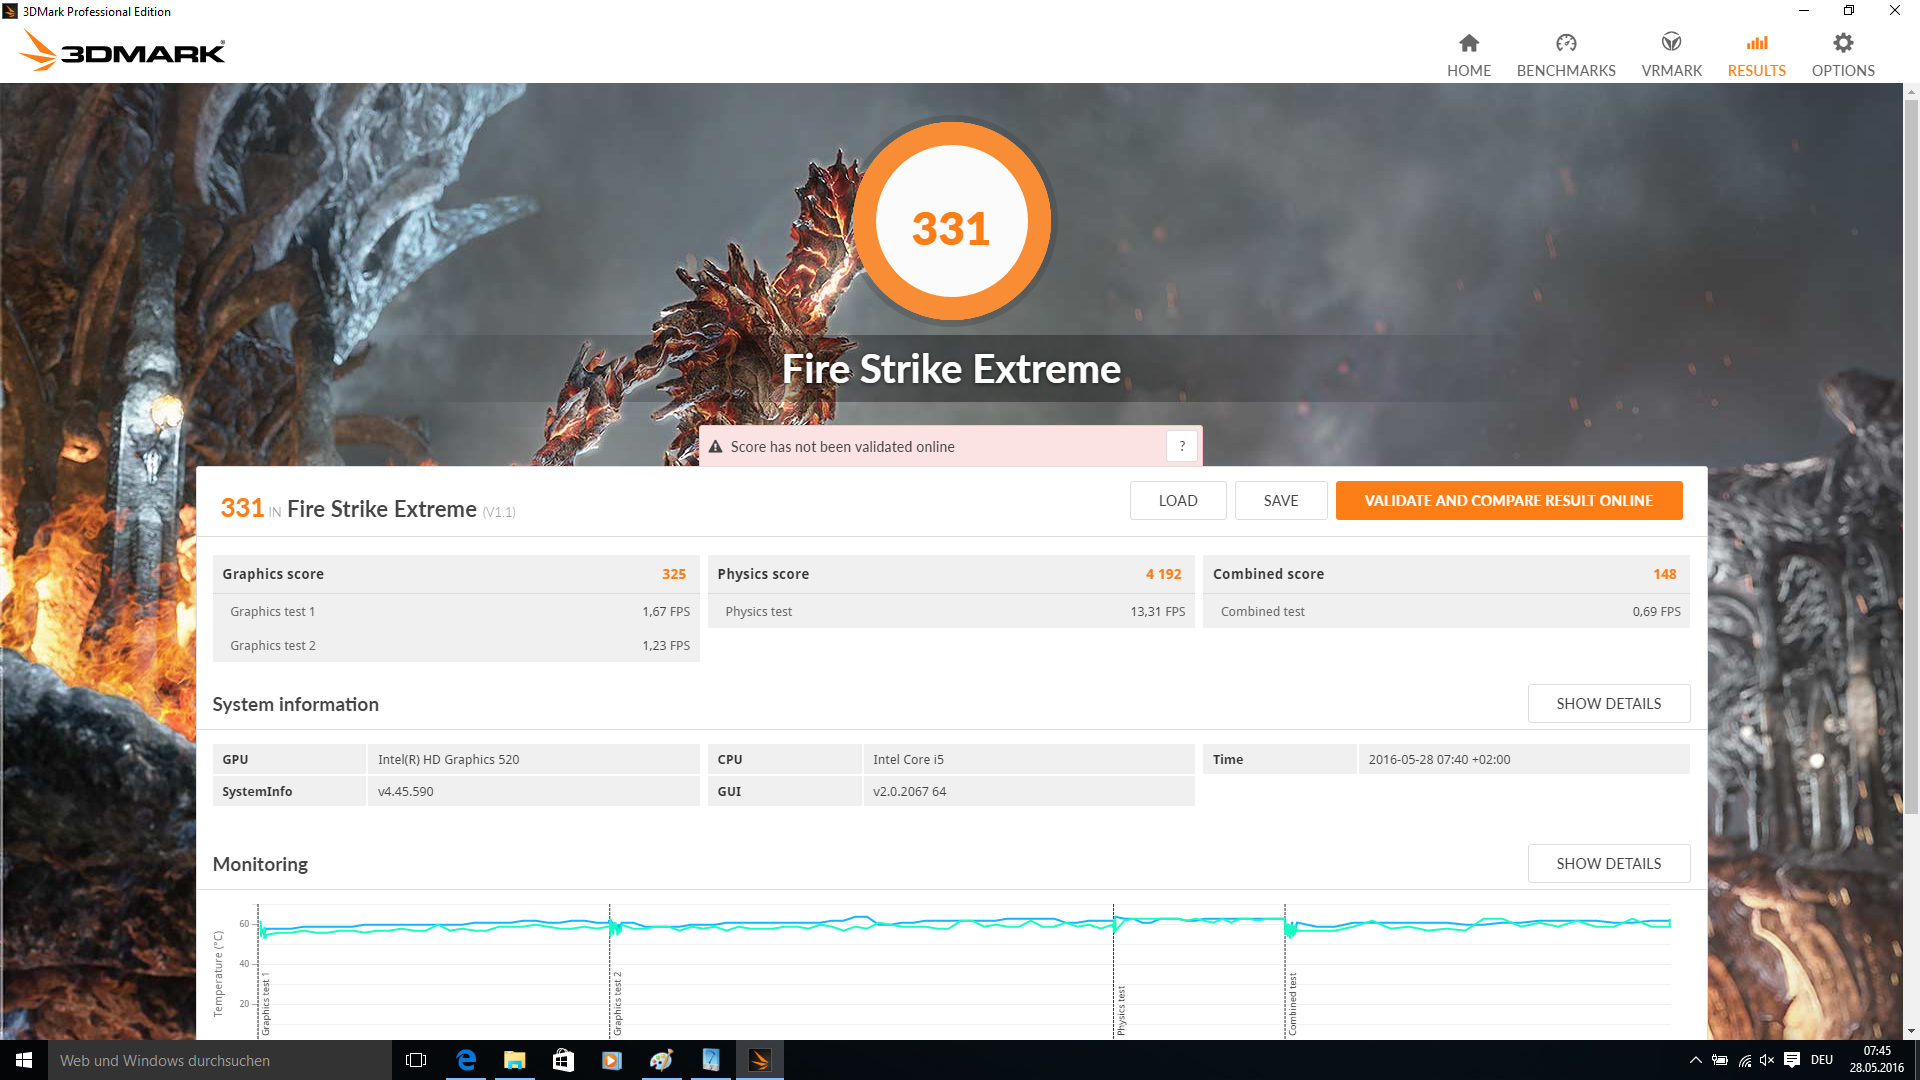
| 3DMark Fire Strike Extreme Score | 331 puan | |
Yardım | ||
| düşük | orta | yüksek | ultra | |
| BioShock Infinite (2013) | 44.04 | 23.58 | 19.79 | 5.82 |
| Battlefield 4 (2013) | 40.9 | 24.1 | 18.7 | |
| Rise of the Tomb Raider (2016) | 17.8 | 11.9 | 7.2 |
Ses yüksekliği
| Boşta |
| 28.8 / 28.8 / 28.8 dB |
| Çalışırken |
| 34.7 / 36.1 dB |
 | ||
30 dB sessiz 40 dB(A) duyulabilirlik 50 dB(A) gürültülü |
||
min: | ||
| Asus ASUSPRO Advanced B8430UA-FA0084E Intel Core i5-6200U, HD Graphics 520 | Asus ASUSPRO Advanced BU401LA-CZ020G Intel Core i7-4650U, HD Graphics 5000 | Lenovo ThinkPad L460-20FVS01400 Intel Core i7-6500U, Radeon R5 M330 | Dell Latitude 14 E5470 Intel Core i5-6300U, HD Graphics 520 | HP EliteBook 840 G3 T9X59ET#ABD Intel Core i7-6500U, HD Graphics 520 | Lenovo ThinkPad T460s-20F9003SGE Intel Core i5-6200U, HD Graphics 520 | Lenovo ThinkPad T460-20FN003LGE Intel Core i5-6200U, HD Graphics 520 | |
|---|---|---|---|---|---|---|---|
| Noise | -2% | -0% | 0% | -9% | 0% | -1% | |
| off / environment * | 28.8 | 29.2 -1% | 29.2 -1% | 31.2 -8% | 29.1 -1% | 29 -1% | |
| Idle Minimum * | 28.8 | 29.3 -2% | 29.2 -1% | 29.2 -1% | 31.2 -8% | 29.1 -1% | 29 -1% |
| Idle Average * | 28.8 | 29.3 -2% | 29.2 -1% | 29.2 -1% | 32.1 -11% | 29.1 -1% | 29 -1% |
| Idle Maximum * | 28.8 | 30.9 -7% | 29.2 -1% | 29.2 -1% | 33.1 -15% | 29.1 -1% | 29 -1% |
| Load Average * | 34.7 | 33.1 5% | 32.5 6% | 32.1 7% | 36.2 -4% | 32.3 7% | 34.2 1% |
| Load Maximum * | 36.1 | 37.3 -3% | 37.2 -3% | 36.8 -2% | 37.8 -5% | 36.6 -1% | 37.8 -5% |
* ... smaller is better
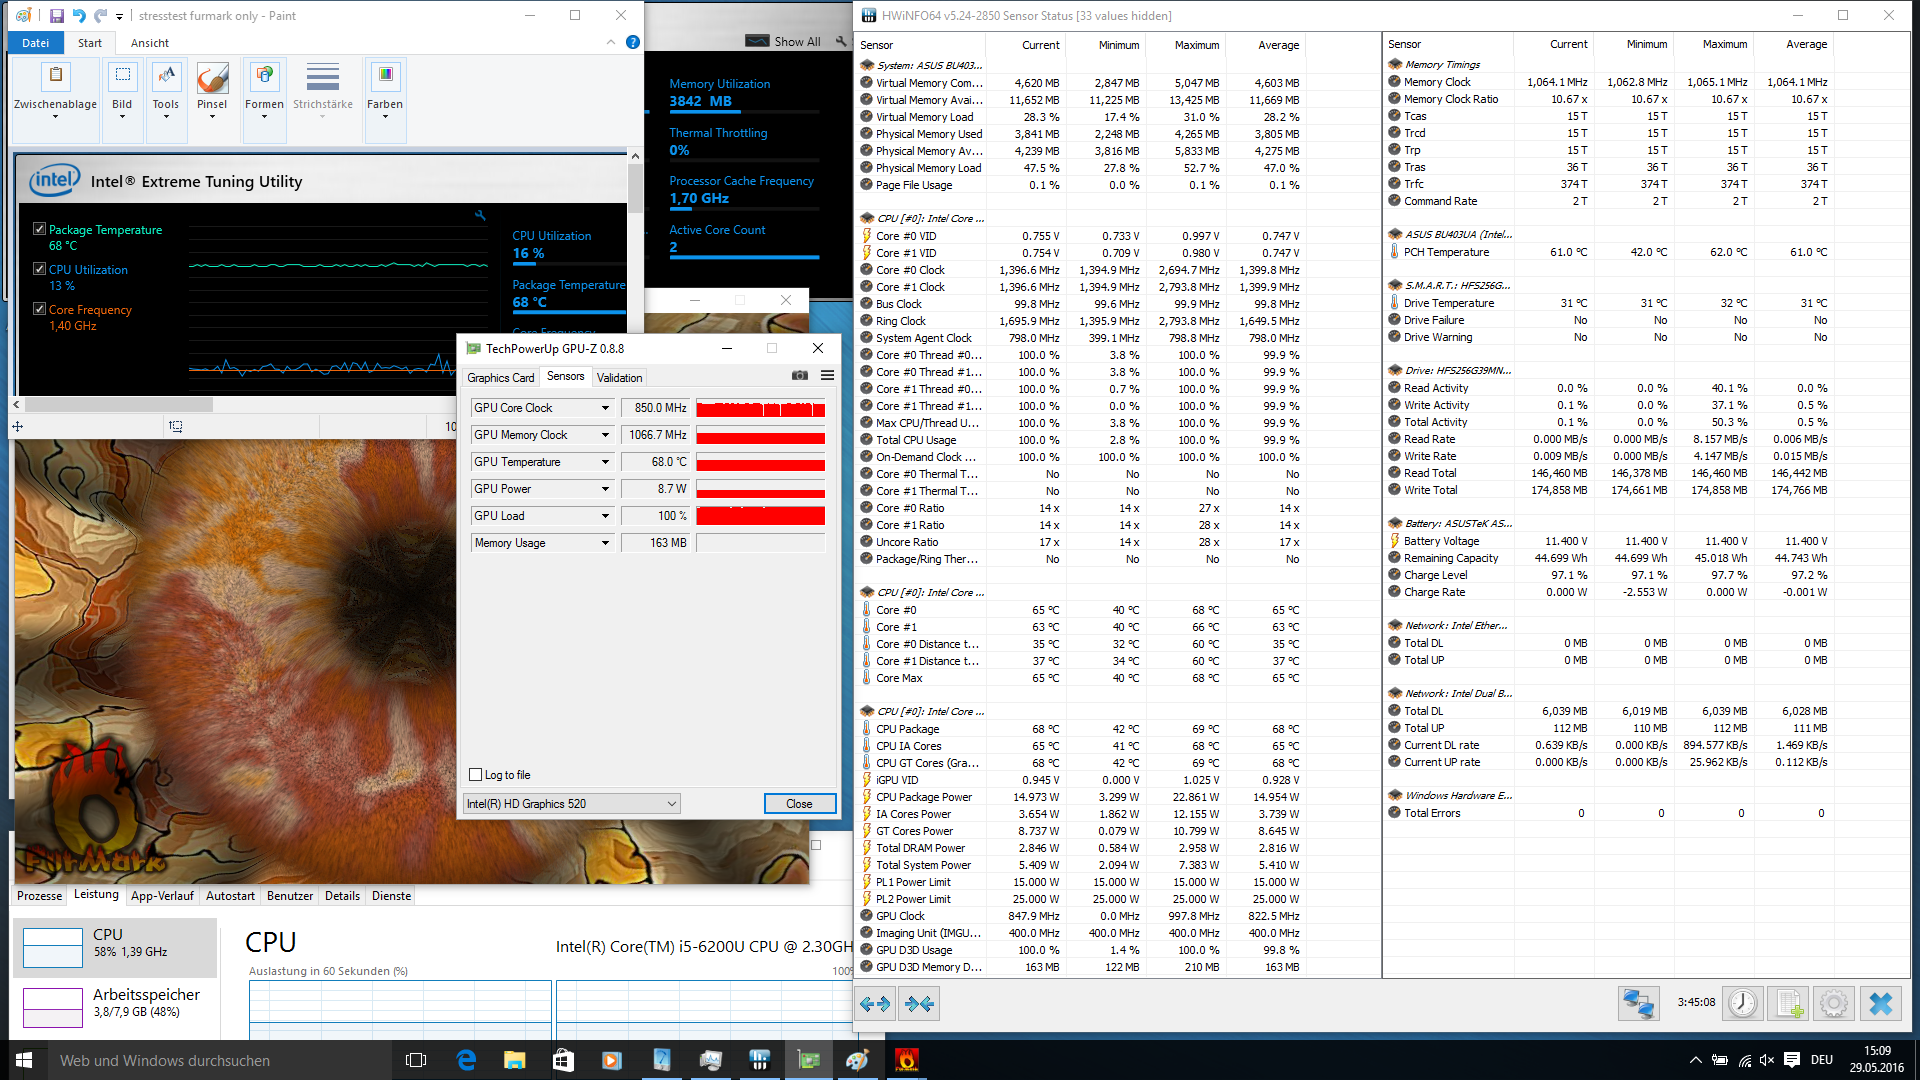
(±) The maximum temperature on the upper side is 40.1 °C / 104 F, compared to the average of 34.2 °C / 94 F, ranging from 21.2 to 62.5 °C for the class Office.
(±) The bottom heats up to a maximum of 41.8 °C / 107 F, compared to the average of 36.7 °C / 98 F
(+) In idle usage, the average temperature for the upper side is 28.8 °C / 84 F, compared to the device average of 29.5 °C / 85 F.
(+) The palmrests and touchpad are cooler than skin temperature with a maximum of 30.7 °C / 87.3 F and are therefore cool to the touch.
(-) The average temperature of the palmrest area of similar devices was 27.7 °C / 81.9 F (-3 °C / -5.4 F).
| Asus ASUSPRO Advanced B8430UA-FA0084E HD Graphics 520, 6200U, Hynix HFS256G39MND | Asus ASUSPRO Advanced BU401LA-CZ020G HD Graphics 5000, 4650U, Liteonit LCS-256M6S | Lenovo ThinkPad L460-20FVS01400 Radeon R5 M330, 6500U, Toshiba HG6 THNSFJ256GCSU | Dell Latitude 14 E5470 HD Graphics 520, 6300U, Liteon L8H-256V2G | HP EliteBook 840 G3 T9X59ET#ABD HD Graphics 520, 6500U, Samsung SSD PM851 256 GB MZNTE256HMHP | Lenovo ThinkPad T460s-20F9003SGE HD Graphics 520, 6200U, Samsung CM871 MZ7LF192HCGS | Lenovo ThinkPad T460-20FN003LGE HD Graphics 520, 6200U, Toshiba HG6 THNSFJ256GCSU | |
|---|---|---|---|---|---|---|---|
| Power Consumption | 4% | -4% | 15% | 6% | 6% | 6% | |
| Idle Minimum * | 4.2 | 4.1 2% | 3.1 26% | 3.5 17% | 3.8 10% | 3.7 12% | 3.5 17% |
| Idle Average * | 6.5 | 7.1 -9% | 6.3 3% | 5.3 18% | 6.3 3% | 6.8 -5% | 6.7 -3% |
| Idle Maximum * | 7.2 | 7.3 -1% | 7.9 -10% | 6 17% | 6.8 6% | 7.3 -1% | 7.3 -1% |
| Load Average * | 29.2 | 28.9 1% | 29.5 -1% | 26.3 10% | 34.4 -18% | 26.3 10% | 28.2 3% |
| Load Maximum * | 41 | 29.3 29% | 57.3 -40% | 36.6 11% | 28.3 31% | 34.6 16% | 34.6 16% |
* ... smaller is better
| Kapalı / Bekleme modu | |
| Boşta | |
| Çalışırken |
|
| Asus ASUSPRO Advanced B8430UA-FA0084E 48 Wh | Asus ASUSPRO Advanced BU401LA-CZ020G 53 Wh | Lenovo ThinkPad L460-20FVS01400 48 Wh | Dell Latitude 14 E5470 62 Wh | HP EliteBook 840 G3 T9X59ET#ABD 46 Wh | Lenovo ThinkPad T460s-20F9003SGE 49 Wh | Lenovo ThinkPad T460-20FN003LGE 46 Wh | |
|---|---|---|---|---|---|---|---|
| Battery Runtime | -7% | 22% | 75% | 29% | 23% | 15% | |
| Reader / Idle | 716 | 699 -2% | 1153 61% | 1304 82% | 1020 42% | 915 28% | 953 33% |
| H.264 | 336 | 296 -12% | 431 28% | 645 92% | 534 59% | 512 52% | |
| WiFi v1.3 | 344 | 425 24% | 667 94% | 453 32% | 395 15% | 338 -2% | |
| Load | 129 | 120 -7% | 97 -25% | 172 33% | 146 13% | 116 -10% | 98 -24% |
| WiFi | 310 |
Artılar
Eksiler
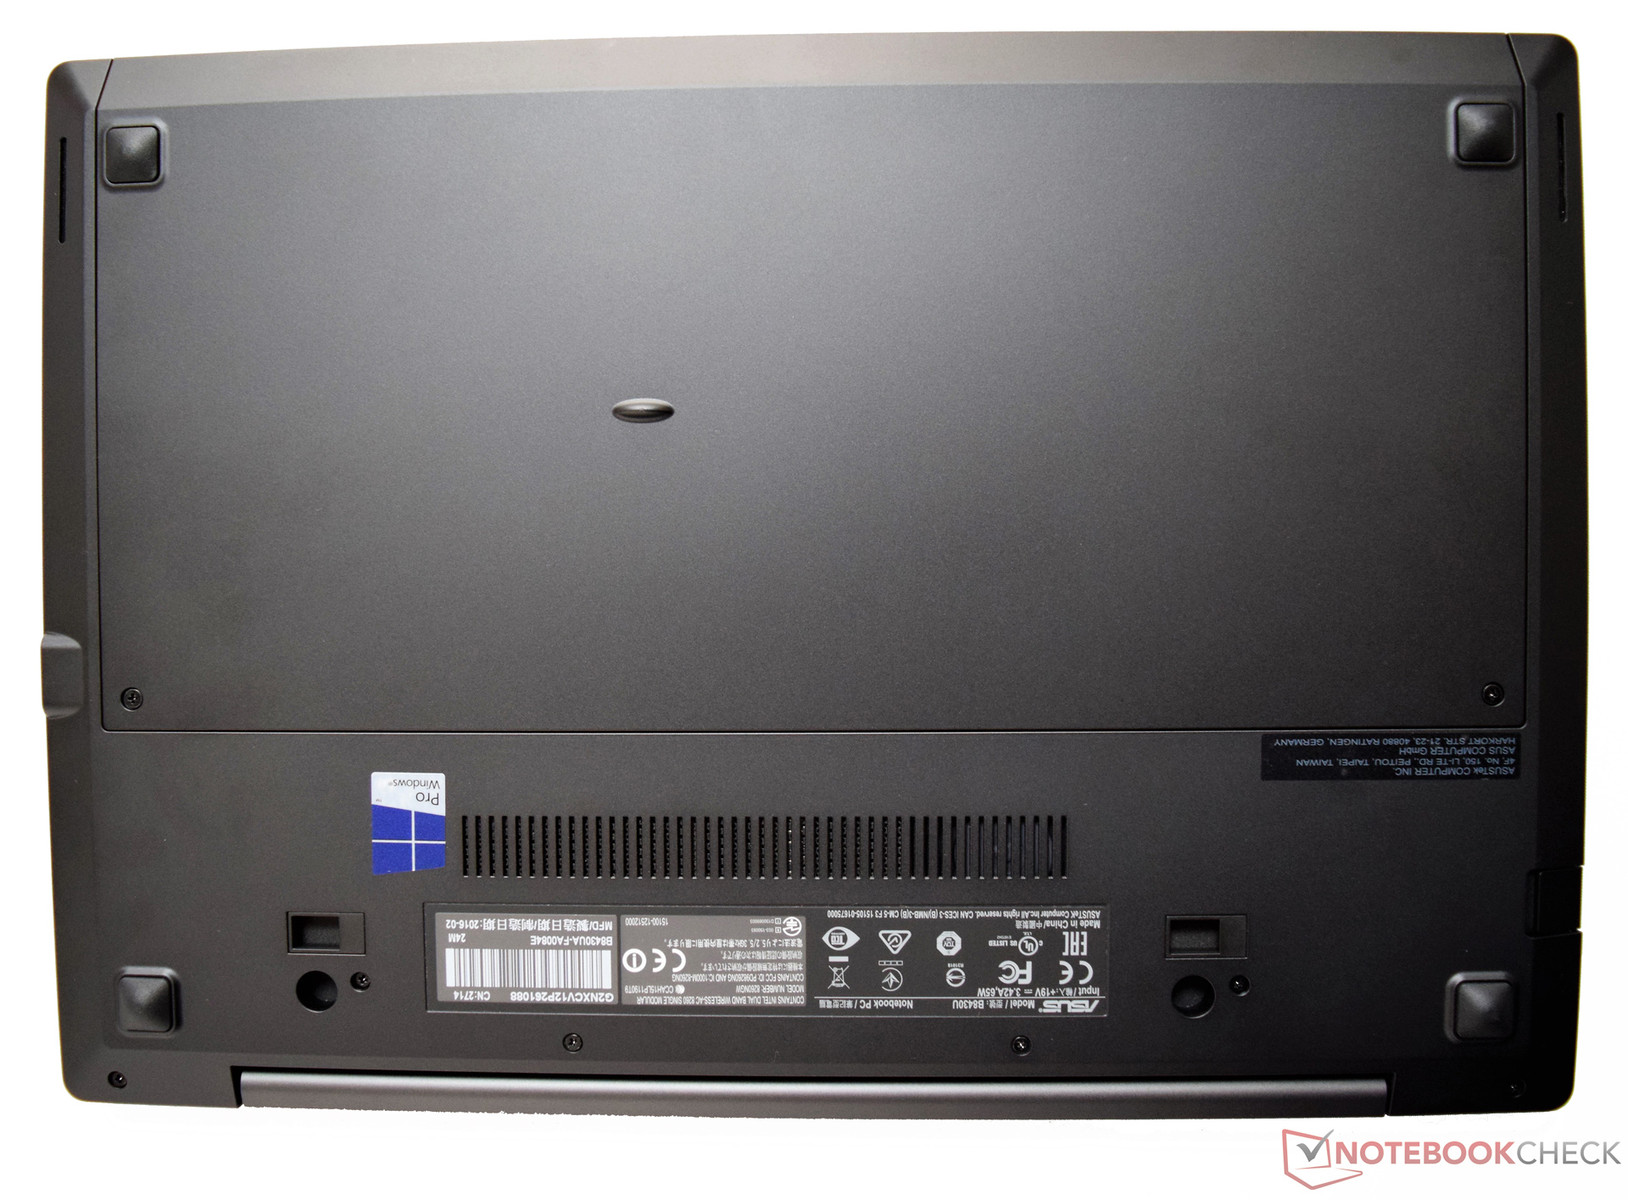
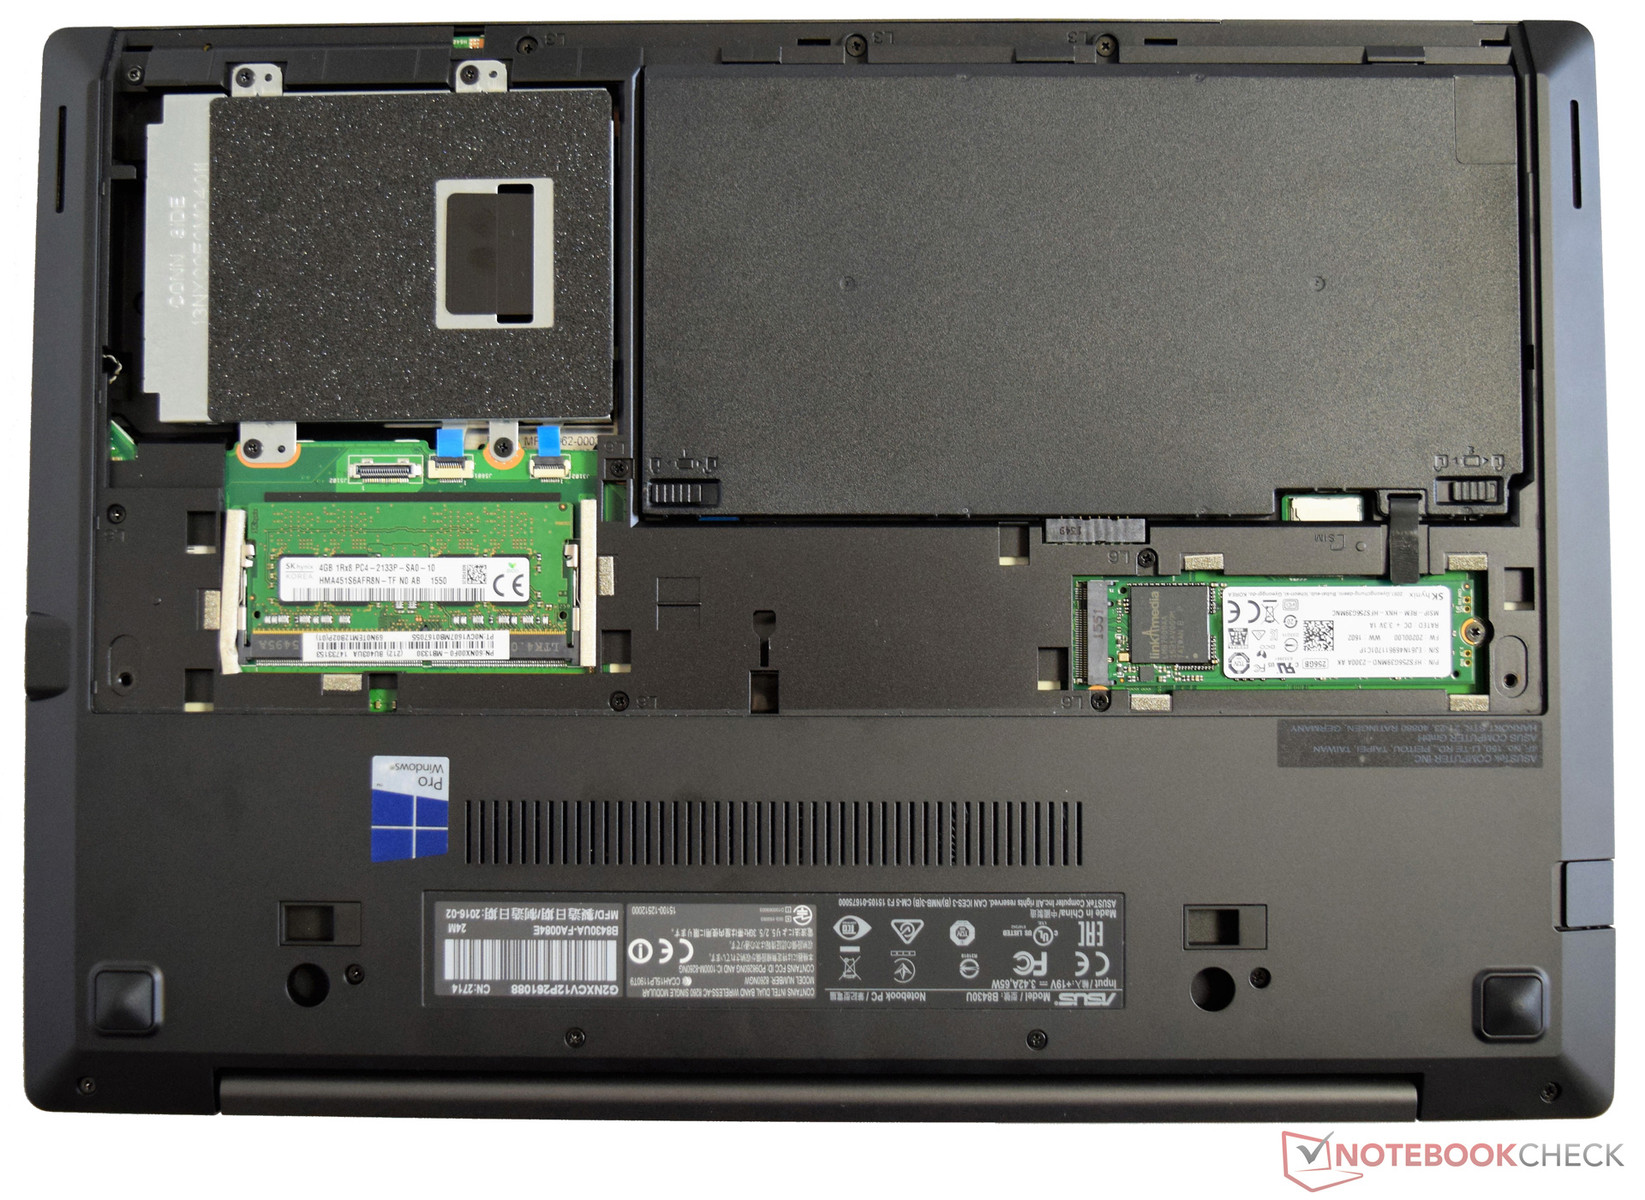
AsusPro Advanced B8430UA iyi ve dayanıklı bir 14 inçlik iş cihazı. Modern bileşenleri sayesinde performans önceli modellere göre farkedilir şekilde iyileşmiş. Düşük ağırlık ile mobilite mümkün kılınıyor. İyi sistem performansı cihazı her gün kullanınca fark yaratıyor. SSD bu yüzden oldukça mantıklı bir tercih.
Sağlam kasa ve dengeli bileşenleri ile makul fiyata sunulan bir cihaz.
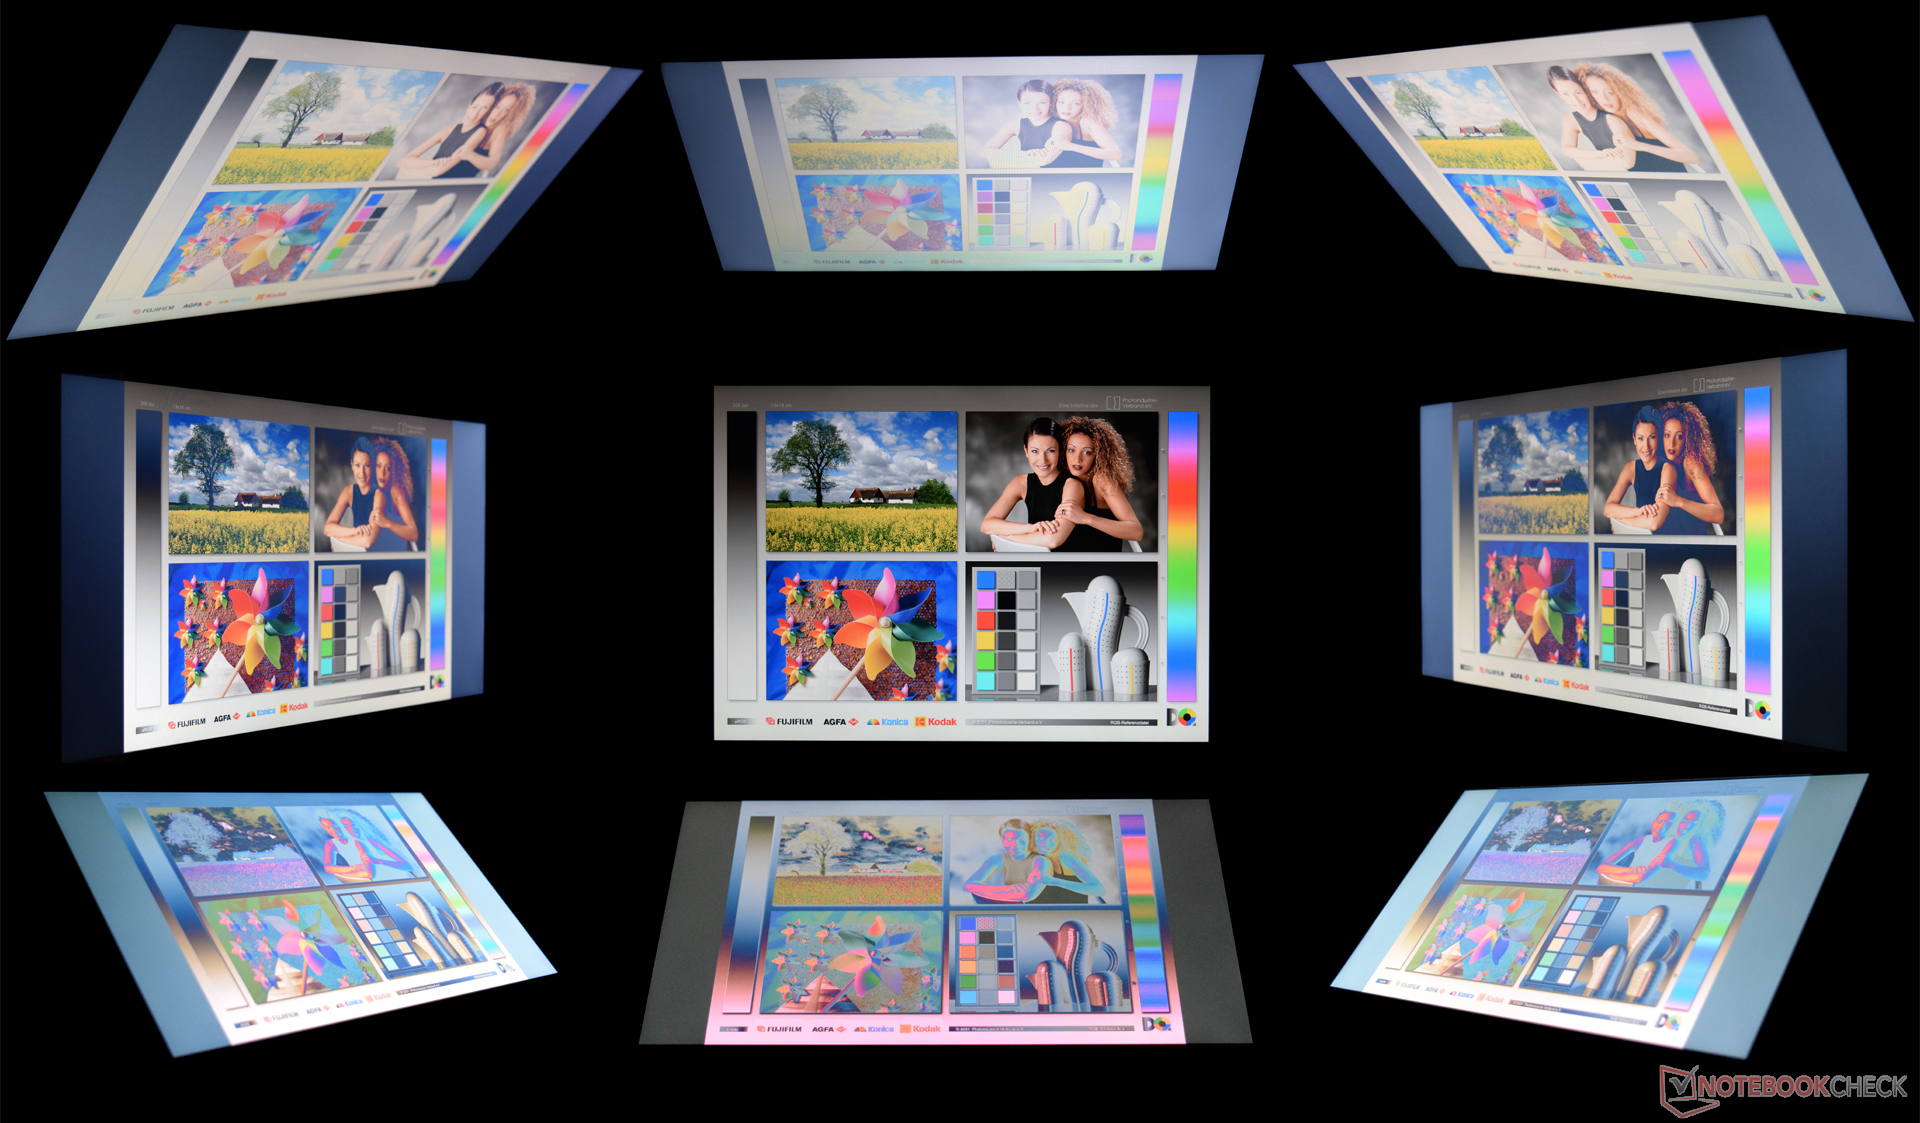
Ekran ise biraz hayal kırıklığı yaratıyor. TN panel iyi bakış açılarına sahip olsa da aydınlantma yönünden beklentileri karşılayamıyor. Küçük stereo hoparlörler tatmin edici değil. Cihazın performansı mevcut 3D oyunlar için yeterli olmasa da hedef kitlesi için bu çok gerekli değil.
Yazının orjinali için tıklayın.
Asus ASUSPRO Advanced B8430UA-FA0084E
-
07/03/2016 v5.1(old)
Sebastian Bade
Pricecompare
