 Deutsch
 English
 Español
 Français
 Italiano
 Nederlands
 Polski
 Português
 Русский
 Türkçe
 Svenska
 Chinese
 Magyar
Kısa inceleme: Asus ZenBook 3 UX390UA-GS041T Notebook


| Networking | |
| iperf Server (receive) TCP 1 m | |
| Asus Zenbook 3 UX390UA-GS041T (jseb) | |
| Apple MacBook 12 (Early 2016) 1.1 GHz | |
| Razer Blade Stealth QHD i7-7500U (sim) | |
| Acer Aspire S 13 S5-371-71QZ | |
| iperf Client (transmit) TCP 1 m | |
| Asus Zenbook 3 UX390UA-GS041T (jseb) | |
| Razer Blade Stealth QHD i7-7500U (sim) | |
| Apple MacBook 12 (Early 2016) 1.1 GHz | |
| Acer Aspire S 13 S5-371-71QZ | |
| |||||||||||||||||||||||||
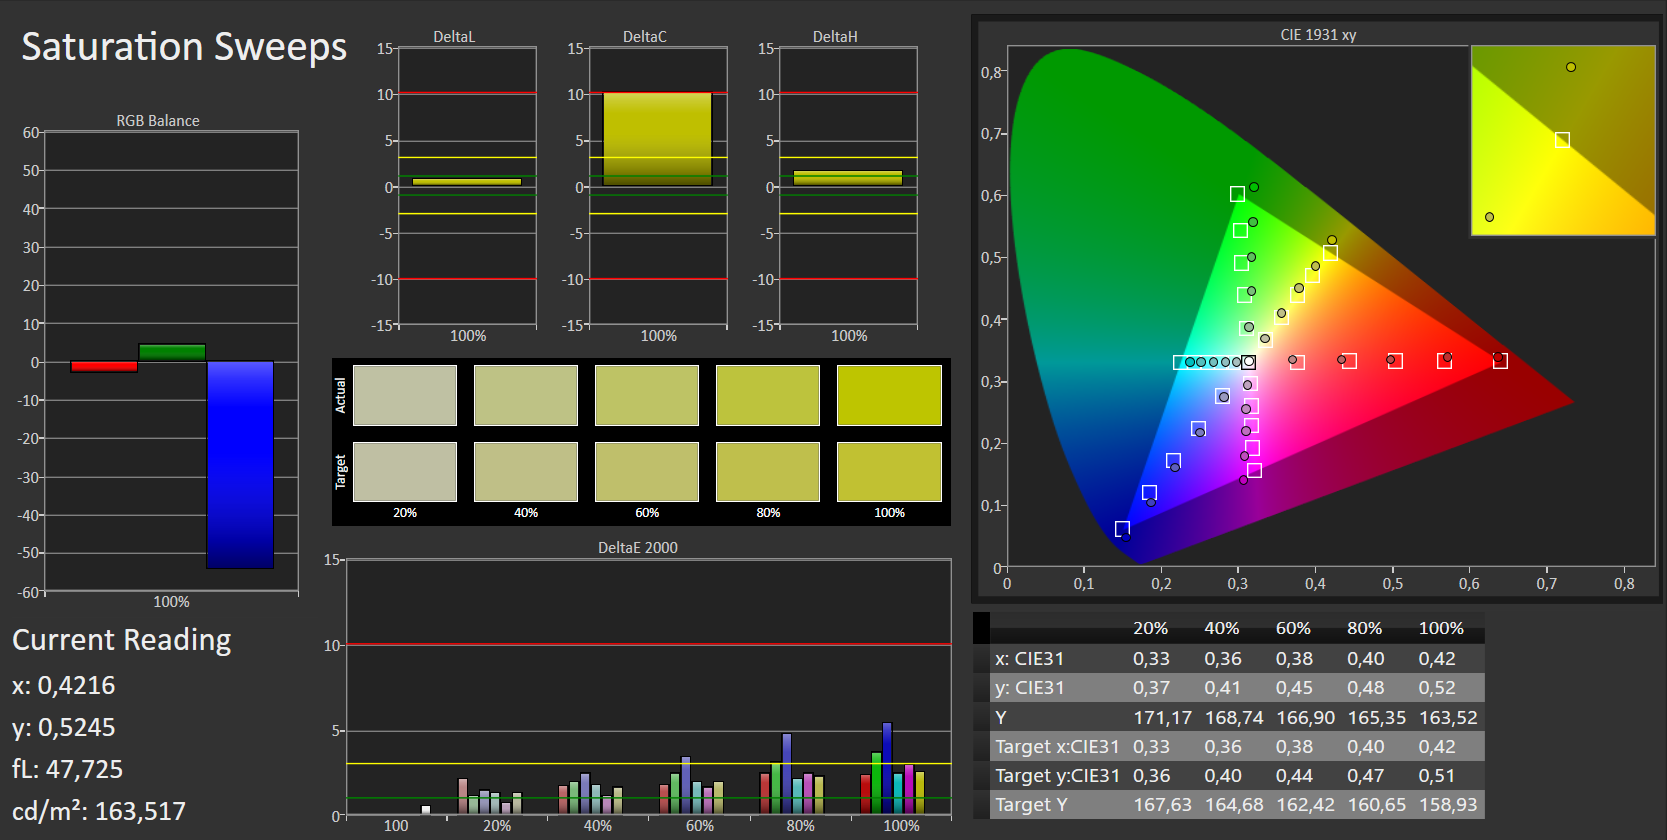
Aydınlatma: 87 %
Batarya modunda parlaklık: 355 cd/m²
Kontrast: 1183:1 (Siyah: 0.3 cd/m²)
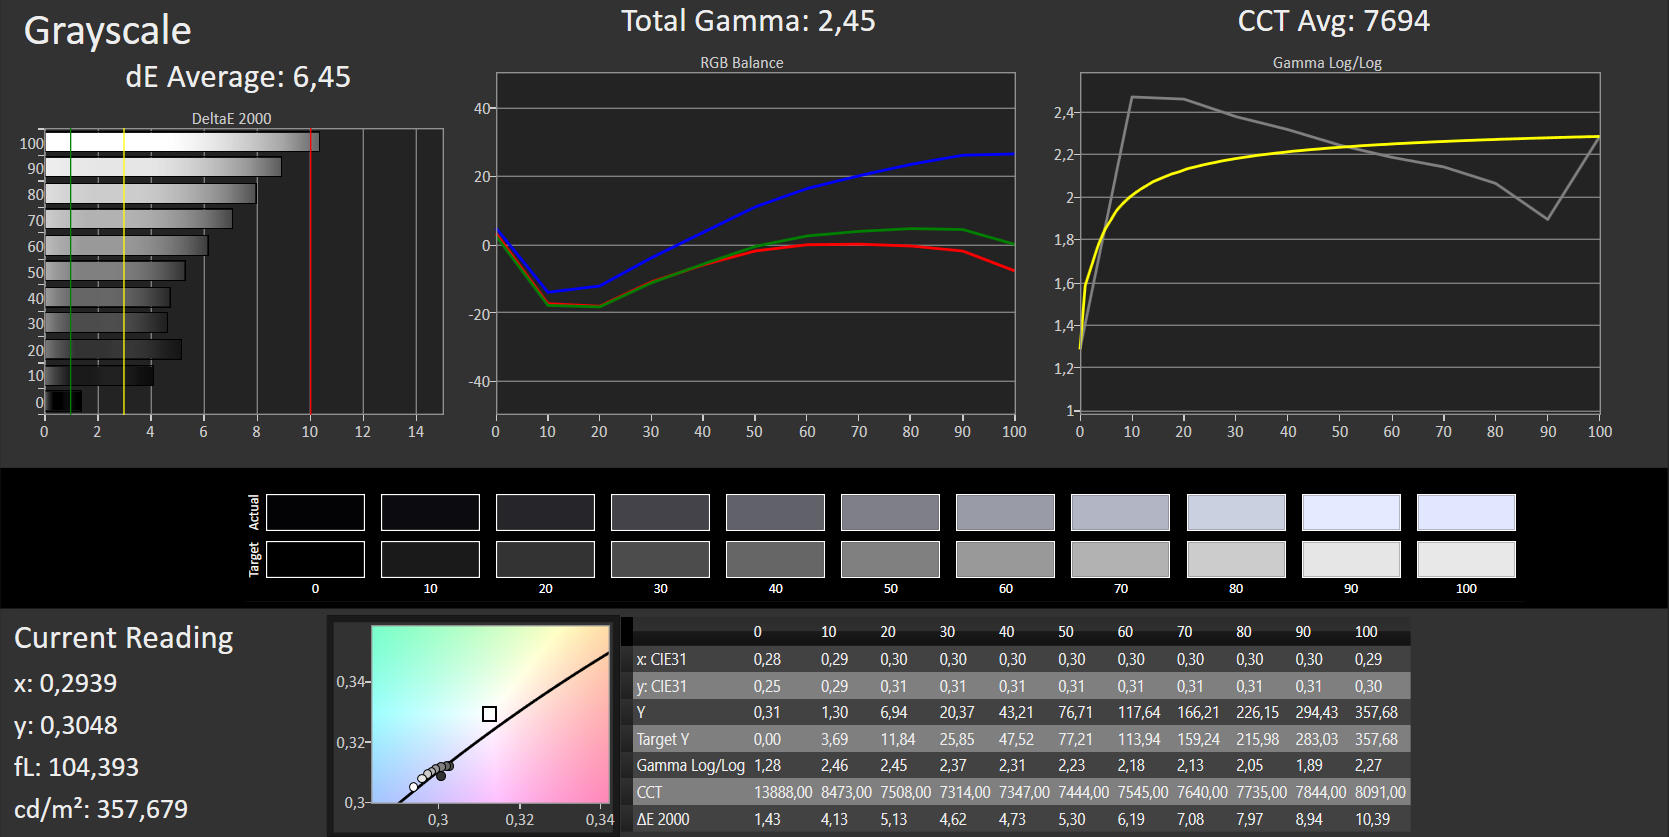
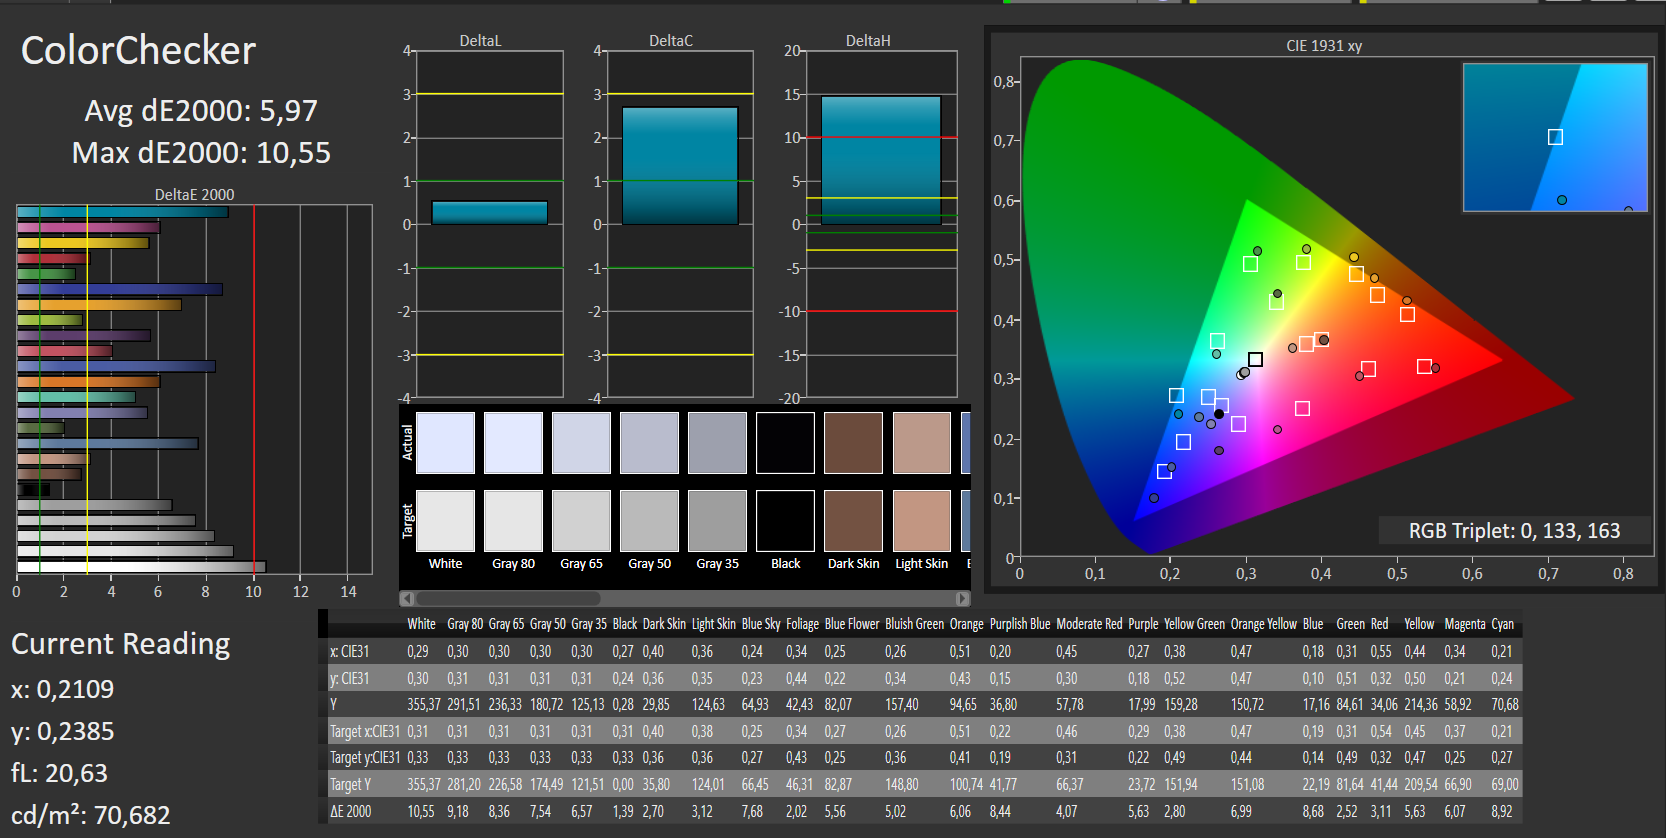
ΔE Color 5.97 | 0.5-29.43 Ø5
ΔE Greyscale 6.45 | 0.57-98 Ø5.3
89% sRGB (Argyll 1.6.3 3D)
58% AdobeRGB 1998 (Argyll 1.6.3 3D)
65.4% AdobeRGB 1998 (Argyll 2.2.0 3D)
89.6% sRGB (Argyll 2.2.0 3D)
64.7% Display P3 (Argyll 2.2.0 3D)
Gamma: 2.45
| Asus Zenbook 3 UX390UA-GS041T AUO B125HAN03.0 AUO306D, , 1920x1080, 12.50 | Apple MacBook 12 (Early 2016) 1.1 GHz APPA027, , 2304x1440, 12.00 | Dell XPS 13 9360 QHD+ i7 Sharp SHP144A, , 3200x1800, 13.30 | HP EliteBook Folio G1 V1C37EA AUO226D, , 1920x1080, 12.50 | Razer Blade Stealth QHD i7-7500U Sharp SHP142F (LQ125T1JW02), , 2560x1440, 12.50 | Acer Aspire S 13 S5-371-71QZ AUO B133HAN04.1, , 1920x1080, 13.30 | HP Spectre 13 1920x1080, 13.30 | |
|---|---|---|---|---|---|---|---|
| Display | 4% | -1% | -29% | 7% | 3% | ||
| Display P3 Coverage | 64.7 | 66.8 3% | 62.8 -3% | 44.45 -31% | 68.7 6% | 65.6 1% | |
| sRGB Coverage | 89.6 | 95.4 6% | 89.4 0% | 65.2 -27% | 95.8 7% | 94.7 6% | |
| AdobeRGB 1998 Coverage | 65.4 | 68 4% | 64.6 -1% | 45.96 -30% | 69.9 7% | 67.5 3% | |
| Response Times | -27% | -29% | 1% | 83% | -41% | -49% | |
| Response Time Grey 50% / Grey 80% * | 30 ? | 41.2 ? -37% | 43.6 ? -45% | 32 ? -7% | 37 ? -23% | 50 ? -67% | 50.8 ? -69% |
| Response Time Black / White * | 26 ? | 30.4 ? -17% | 29.2 ? -12% | 24 ? 8% | 33.4 ? -28% | 29.6 ? -14% | 33.2 ? -28% |
| PWM Frequency | 50 ? | 200 ? 300% | |||||
| Screen | 15% | 15% | -3% | 7% | 4% | 21% | |
| Brightness middle | 355 | 387 9% | 396.2 12% | 289 -19% | 402 13% | 375 6% | 300.5 -15% |
| Brightness | 341 | 358 5% | 357 5% | 298 -13% | 382 12% | 358 5% | 305 -11% |
| Brightness Distribution | 87 | 88 1% | 84 -3% | 87 0% | 88 1% | 87 0% | 76 -13% |
| Black Level * | 0.3 | 0.47 -57% | 0.266 11% | 0.27 10% | 0.45 -50% | 0.39 -30% | 0.184 39% |
| Contrast | 1183 | 823 -30% | 1489 26% | 1070 -10% | 893 -25% | 962 -19% | 1633 38% |
| Colorchecker dE 2000 * | 5.97 | 1.6 73% | 3.9 35% | 4.82 19% | 3.6 40% | 4.6 23% | 2.64 56% |
| Colorchecker dE 2000 max. * | 10.55 | 4 62% | 7.58 28% | 10.73 -2% | 7.5 29% | 8.8 17% | 5.06 52% |
| Greyscale dE 2000 * | 6.45 | 1 84% | 4.16 36% | 3.84 40% | 4.3 33% | 4 38% | 2.8 57% |
| Gamma | 2.45 90% | 2.26 97% | 2.31 95% | 2.41 91% | 2.1 105% | 2.34 94% | 2.16 102% |
| CCT | 7694 84% | 6680 97% | 6514 100% | 6492 100% | 6572 99% | 7304 89% | 6999 93% |
| Color Space (Percent of AdobeRGB 1998) | 58 | 61.6 6% | 57.5 -1% | 42.03 -28% | 62.3 7% | 57.9 0% | 60.9 5% |
| Color Space (Percent of sRGB) | 89 | 82.2 -8% | 88.7 0% | 64.8 -27% | 95.7 8% | 88.7 0% | 94.3 6% |
| Total Average (Program / Settings) | -3% /
7% | -5% /
6% | -10% /
-8% | 32% /
21% | -19% /
-3% | -8% /
8% |
* ... smaller is better

Display Response Times
| ↔ Response Time Black to White | ||
|---|---|---|
| 26 ms ... rise ↗ and fall ↘ combined | ↗ 6 ms rise |  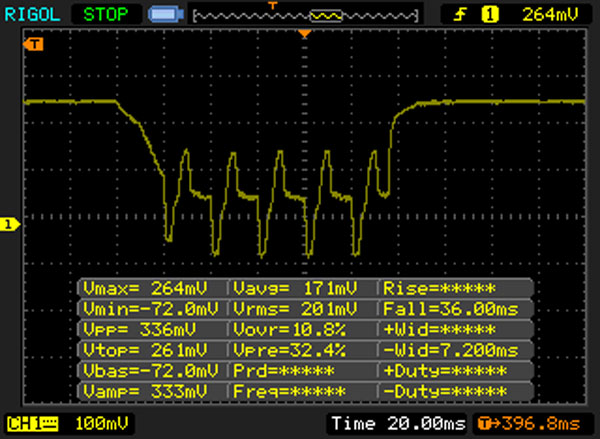 |
| ↘ 20 ms fall | ||
| The screen shows relatively slow response rates in our tests and may be too slow for gamers. In comparison, all tested devices range from 0.1 (minimum) to 240 (maximum) ms. » 57 % of all devices are better. This means that the measured response time is worse than the average of all tested devices (21.5 ms). | ||
| ↔ Response Time 50% Grey to 80% Grey | ||
| 30 ms ... rise ↗ and fall ↘ combined | ↗ 13 ms rise |  |
| ↘ 17 ms fall | ||
| The screen shows slow response rates in our tests and will be unsatisfactory for gamers. In comparison, all tested devices range from 0.2 (minimum) to 636 (maximum) ms. » 34 % of all devices are better. This means that the measured response time is better than the average of all tested devices (33.7 ms). | ||
Screen Flickering / PWM (Pulse-Width Modulation)
| Screen flickering / PWM detected | 50 Hz | ≤ 10 % brightness setting | 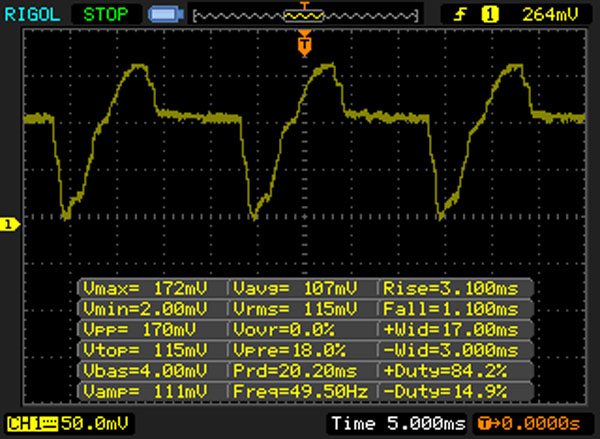 |
The display backlight flickers at 50 Hz (worst case, e.g., utilizing PWM) Flickering detected at a brightness setting of 10 % and below. There should be no flickering or PWM above this brightness setting. The frequency of 50 Hz is very low, so the flickering may cause eyestrain and headaches after extended use. In comparison: 53 % of all tested devices do not use PWM to dim the display. If PWM was detected, an average of 17900 (minimum: 5 - maximum: 3846000) Hz was measured. | |||


| PCMark 8 Home Score Accelerated v2 | 2880 puan | |
| PCMark 8 Work Score Accelerated v2 | 4326 puan | |
Yardım | ||
| Asus Zenbook 3 UX390UA-GS041T SK Hynix Canvas SC300 512GB M.2 (HFS512G39MND) | Apple MacBook 12 (Early 2016) 1.1 GHz Apple SSD AP0256 | Dell XPS 13 9360 QHD+ i7 Toshiba NVMe THNSN5256GPUK | HP EliteBook Folio G1 V1C37EA Samsung SM951 MZVPV256 m.2 | Razer Blade Stealth QHD i7-7500U Samsung PM951 NVMe MZVLV256 | Acer Aspire S 13 S5-371-71QZ LiteOn CV1-8B512 | HP Spectre 13 Samsung PM951 NVMe MZVLV256 | |
|---|---|---|---|---|---|---|---|
| CrystalDiskMark 3.0 | 27% | 74% | 127% | 60% | 2% | 49% | |
| Read Seq | 508 | 754 48% | 1214 139% | 1482 192% | 1178 132% | 502 -1% | 1322 160% |
| Write Seq | 454.4 | 638 40% | 655 44% | 1232 171% | 305.4 -33% | 418.9 -8% | 305.5 -33% |
| Read 512 | 335.5 | 616 84% | 1019 204% | 1191 255% | 638 90% | 341.3 2% | 621 85% |
| Write 512 | 413.9 | 678 64% | 445.7 8% | 1220 195% | 305.7 -26% | 389.7 -6% | 306 -26% |
| Read 4k | 28.13 | 14.6 -48% | 35.55 26% | 46.96 67% | 38.54 37% | 29.69 6% | 40.09 43% |
| Write 4k | 69.8 | 20.5 -71% | 130 86% | 100.7 44% | 153.4 120% | 86.8 24% | 119 70% |
| Read 4k QD32 | 245.7 | 464 89% | 537 119% | 464 89% | 614 150% | 301.3 23% | 513 109% |
| Write 4k QD32 | 277.6 | 315 13% | 173.8 -37% | 292.1 5% | 302.7 9% | 211.2 -24% | 231.5 -17% |

| 3DMark 11 Performance | 1704 puan | |
| 3DMark Cloud Gate Standard Score | 5989 puan | |
Yardım | ||
| BioShock Infinite - 1280x720 Very Low Preset | |
| Acer Aspire S 13 S5-371-71QZ | |
| Dell XPS 13 9360 QHD+ i7 | |
| HP Spectre 13 | |
| Asus Zenbook 3 UX390UA-GS041T | |
| HP EliteBook Folio G1 V1C37EA | |
| Thief - 1024x768 Very Low Preset | |
| Asus Zenbook 3 UX390UA-GS041T | |
| Dirt Rally - 1024x768 Ultra Low Preset | |
| Asus Zenbook 3 UX390UA-GS041T | |
| Rise of the Tomb Raider - 1024x768 Lowest Preset | |
| Dell XPS 13 9360 QHD+ i7 | |
| Razer Blade Stealth QHD i7-7500U | |
| Asus Zenbook 3 UX390UA-GS041T | |
| Doom - 1280x720 Low Preset | |
| Asus Zenbook 3 UX390UA-GS041T | |
| düşük | orta | yüksek | ultra | |
| BioShock Infinite (2013) | 51 | 27.2 | 20.7 | |
| Thief (2014) | 14 | 8.4 | ||
| Dirt Rally (2015) | 119 | 34.5 | 15 | |
| Rise of the Tomb Raider (2016) | 18.8 | 9.4 | ||
| Doom (2016) | 22.6 |
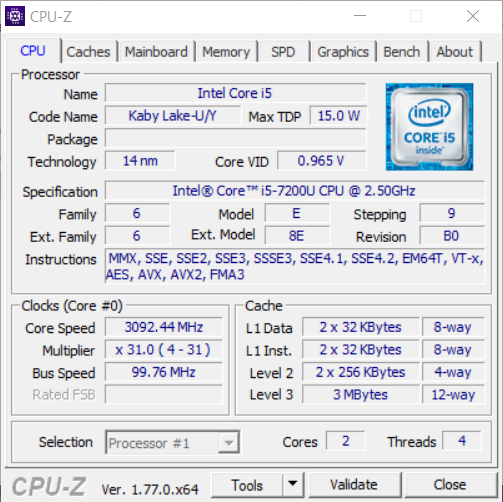
| Asus Zenbook 3 UX390UA-GS041T HD Graphics 620, i5-7200U, SK Hynix Canvas SC300 512GB M.2 (HFS512G39MND) | Apple MacBook 12 (Early 2016) 1.1 GHz HD Graphics 515, 6Y30, Apple SSD AP0256 | Dell XPS 13 9360 QHD+ i7 HD Graphics 620, i7-7500U, Toshiba NVMe THNSN5256GPUK | HP EliteBook Folio G1 V1C37EA HD Graphics 515, 6Y54, Samsung SM951 MZVPV256 m.2 | Razer Blade Stealth QHD i7-7500U HD Graphics 620, i7-7500U, Samsung PM951 NVMe MZVLV256 | Acer Aspire S 13 S5-371-71QZ HD Graphics 520, 6500U, LiteOn CV1-8B512 | HP Spectre 13 HD Graphics 520, 6500U, Samsung PM951 NVMe MZVLV256 | |
|---|---|---|---|---|---|---|---|
| Noise | 7% | 1% | 1% | 1% | |||
| off / environment * | 30.7 | 28.8 6% | 31 -1% | 31.2 -2% | 28.5 7% | ||
| Idle Minimum * | 30.7 | 28.8 6% | 31 -1% | 31.2 -2% | 28.5 7% | ||
| Idle Average * | 30.7 | 28.8 6% | 31 -1% | 31.2 -2% | 30.9 -1% | ||
| Idle Maximum * | 30.9 | 30.8 -0% | 31 -0% | 31.5 -2% | 31.6 -2% | ||
| Load Average * | 38.7 | 34.8 10% | 35 10% | 35.7 8% | 38.8 -0% | ||
| Load Maximum * | 38.9 | 34.8 11% | 40.5 -4% | 35.8 8% | 41.4 -6% |
* ... smaller is better
Ses yüksekliği
| Boşta |
| 30.7 / 30.7 / 30.9 dB |
| Çalışırken |
| 38.7 / 38.9 dB |
 | ||
30 dB sessiz 40 dB(A) duyulabilirlik 50 dB(A) gürültülü |
||
min: | ||
(±) The maximum temperature on the upper side is 41.6 °C / 107 F, compared to the average of 35.9 °C / 97 F, ranging from 21.4 to 59 °C for the class Subnotebook.
(+) The bottom heats up to a maximum of 39.3 °C / 103 F, compared to the average of 39.4 °C / 103 F
(+) In idle usage, the average temperature for the upper side is 24.5 °C / 76 F, compared to the device average of 30.7 °C / 87 F.
(+) The palmrests and touchpad are reaching skin temperature as a maximum (32.2 °C / 90 F) and are therefore not hot.
(-) The average temperature of the palmrest area of similar devices was 28.3 °C / 82.9 F (-3.9 °C / -7.1 F).
Asus Zenbook 3 UX390UA-GS041T audio analysis
(-) | not very loud speakers (71 dB)
Bass 100 - 315 Hz
(-) | nearly no bass - on average 20.9% lower than median
(±) | linearity of bass is average (12.6% delta to prev. frequency)
Mids 400 - 2000 Hz
(+) | balanced mids - only 4.1% away from median
(±) | linearity of mids is average (8.9% delta to prev. frequency)
Highs 2 - 16 kHz
(+) | balanced highs - only 2.3% away from median
(+) | highs are linear (4% delta to prev. frequency)
Overall 100 - 16.000 Hz
(±) | linearity of overall sound is average (17.3% difference to median)
Compared to same class
» 38% of all tested devices in this class were better, 10% similar, 51% worse
» The best had a delta of 5%, average was 19%, worst was 53%
Compared to all devices tested
» 27% of all tested devices were better, 8% similar, 65% worse
» The best had a delta of 4%, average was 25%, worst was 134%
Apple MacBook 12 (Early 2016) 1.1 GHz audio analysis
(+) | speakers can play relatively loud (83.6 dB)
Bass 100 - 315 Hz
(±) | reduced bass - on average 11.3% lower than median
(±) | linearity of bass is average (14.2% delta to prev. frequency)
Mids 400 - 2000 Hz
(+) | balanced mids - only 2.4% away from median
(+) | mids are linear (5.5% delta to prev. frequency)
Highs 2 - 16 kHz
(+) | balanced highs - only 2% away from median
(+) | highs are linear (4.5% delta to prev. frequency)
Overall 100 - 16.000 Hz
(+) | overall sound is linear (10.2% difference to median)
Compared to same class
» 5% of all tested devices in this class were better, 2% similar, 93% worse
» The best had a delta of 5%, average was 19%, worst was 53%
Compared to all devices tested
» 3% of all tested devices were better, 1% similar, 96% worse
» The best had a delta of 4%, average was 25%, worst was 134%
| Kapalı / Bekleme modu | |
| Boşta | |
| Çalışırken |
|
| Asus Zenbook 3 UX390UA-GS041T i5-7200U, HD Graphics 620, SK Hynix Canvas SC300 512GB M.2 (HFS512G39MND), IPS, 1920x1080, 12.50 | Apple MacBook 12 (Early 2016) 1.1 GHz 6Y30, HD Graphics 515, Apple SSD AP0256, IPS, 2304x1440, 12.00 | Dell XPS 13 9360 QHD+ i7 i7-7500U, HD Graphics 620, Toshiba NVMe THNSN5256GPUK, IPS, 3200x1800, 13.30 | HP EliteBook Folio G1 V1C37EA 6Y54, HD Graphics 515, Samsung SM951 MZVPV256 m.2, IPS, 1920x1080, 12.50 | Razer Blade Stealth QHD i7-7500U i7-7500U, HD Graphics 620, Samsung PM951 NVMe MZVLV256, , 2560x1440, 12.50 | Acer Aspire S 13 S5-371-71QZ 6500U, HD Graphics 520, LiteOn CV1-8B512, IPS, 1920x1080, 13.30 | HP Spectre 13 6500U, HD Graphics 520, Samsung PM951 NVMe MZVLV256, IPS UWVA, 1920x1080, 13.30 | |
|---|---|---|---|---|---|---|---|
| Power Consumption | 29% | -18% | 2% | -28% | -9% | -62% | |
| Idle Minimum * | 3.3 | 2.7 18% | 6.4 -94% | 4.3 -30% | 4.4 -33% | 4.1 -24% | 8.6 -161% |
| Idle Average * | 6.2 | 2.7 56% | 6.6 -6% | 6 3% | 5.8 6% | 6.7 -8% | 11 -77% |
| Idle Maximum * | 10.4 | 7.2 31% | 6.8 35% | 6.4 38% | 8.6 17% | 7.4 29% | 11.3 -9% |
| Load Average * | 28 | 22 21% | 27.5 2% | 22.7 19% | 35.2 -26% | 32.4 -16% | 33.8 -21% |
| Load Maximum * | 25.7 | 20.5 20% | 32.4 -26% | 31.2 -21% | 52 -102% | 32.4 -26% | 36.2 -41% |
* ... smaller is better
| Asus Zenbook 3 UX390UA-GS041T i5-7200U, HD Graphics 620, 40 Wh | Apple MacBook 12 (Early 2016) 1.1 GHz 6Y30, HD Graphics 515, 41.4 Wh | Dell XPS 13 9360 QHD+ i7 i7-7500U, HD Graphics 620, 60 Wh | HP EliteBook Folio G1 V1C37EA 6Y54, HD Graphics 515, 38 Wh | Razer Blade Stealth QHD i7-7500U i7-7500U, HD Graphics 620, 53.6 Wh | Acer Aspire S 13 S5-371-71QZ 6500U, HD Graphics 520, 45 Wh | HP Spectre 13 6500U, HD Graphics 520, 38 Wh | |
|---|---|---|---|---|---|---|---|
| Battery Runtime | 60% | 26% | 1% | 7% | 12% | -19% | |
| Reader / Idle | 844 | 1053 25% | 526 -38% | 817 -3% | 1028 22% | 715 -15% | |
| H.264 | 383 | 512 34% | 413 8% | ||||
| WiFi v1.3 | 397 | 501 26% | 516 30% | 355 -11% | 498 25% | 472 19% | 338 -15% |
| Load | 105 | 231 120% | 129 23% | 152 45% | 105 0% | 99 -6% | 78 -26% |
Artılar
Eksiler
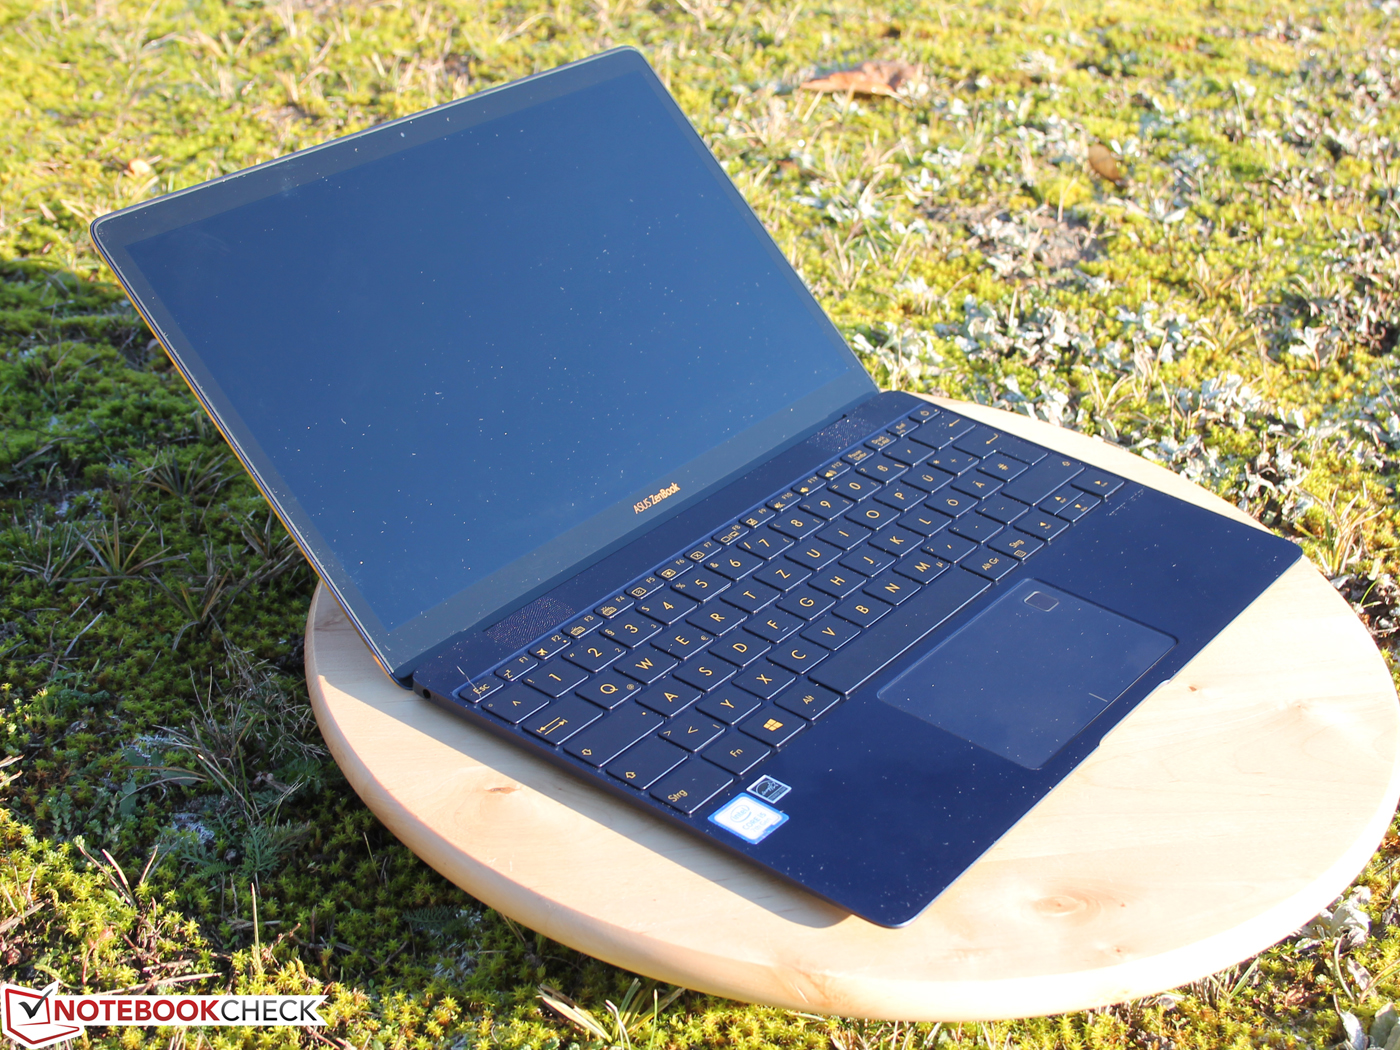
ZenBook 3 UX390UA-GS041T subnotebooklar arasında kolaylıkla en üst sıralarda yer edinebilir, ancak düşük değerlemelerle. Apple'ın MacBook 12, Dell'in XPS 13 9360 ve HP'nin EliteBook Folio G1 V1C37EA genel olarak daha iyi değerlemelere sahip ancak her kullanıcı için doğru tercih değiller.
Şık görünümü ve iyi stabilitesinin dışında ZenBook 3 UX390UA iyi bir performans da sunuyor. MacBook 12 ve EliteBook Folio G1 modelleri Core m işlemci ile geride kalıyor. Eğer işlemci performansı arıyorsanız ZenBook 3 UX390UA ve XPS 13 9360 üst sıralarda. Asus'un yoğun kullanım altında biraz ses yapan ama çok rahatsız etmeyen bir fan kullanmak zorunda kaldığını da belirtelim.
Tüm cihazlar ekran kalitesi yönünden neredeyse benzer. Test cihazımız kullanım süresi yönünden taç takamıyor. XPS 13, 60 Wh gibi büyük bir bataryaya sahipken ZenBook 914 gramlık ağırlığında 40 Whlik bir batarya ile 6 saat 30 dakikalık bir kullanım sunuyor, XPS ise 8 saat 40 dakika ancak bu model 1.3 kg gibi bir ağırlığa sahip. MacBook 12 de böyle bir kullanım süresi sunuyor.
En ince kasa olma yarışını 10.4 milimetre ile HP Spectre 13 kazanırken, Core i çipi kötü Turbo kullanımından müzdarip.
Genel olarak baktığımızda ZenBook 3 UX390UA bizce en küçük cihazda en olası performansı isteyen kullanıcılar için ideal. Böylesi bir performans/boyut kombinasyonu subnotebook kategorisi için de bir ilk.
Eğer performansı kullanım süresi, ergonomi (fansız) ve uygulama performansı olarak görüyorsanız HP EliteBook Folio G1 veya Apple MacBook 12 (2016 başı) modellerinden de memnun kalabilirsiniz.
Yazının orjinali için tıklayın.
Asus Zenbook 3 UX390UA-GS041T
-
12/02/2016 v5.1(old)
Sebastian Jentsch
Pricecompare
