 Deutsch
 English
 Español
 Français
 Italiano
 Nederlands
 Polski
 Português
 Русский
 Türkçe
 Svenska
 Chinese
 Magyar
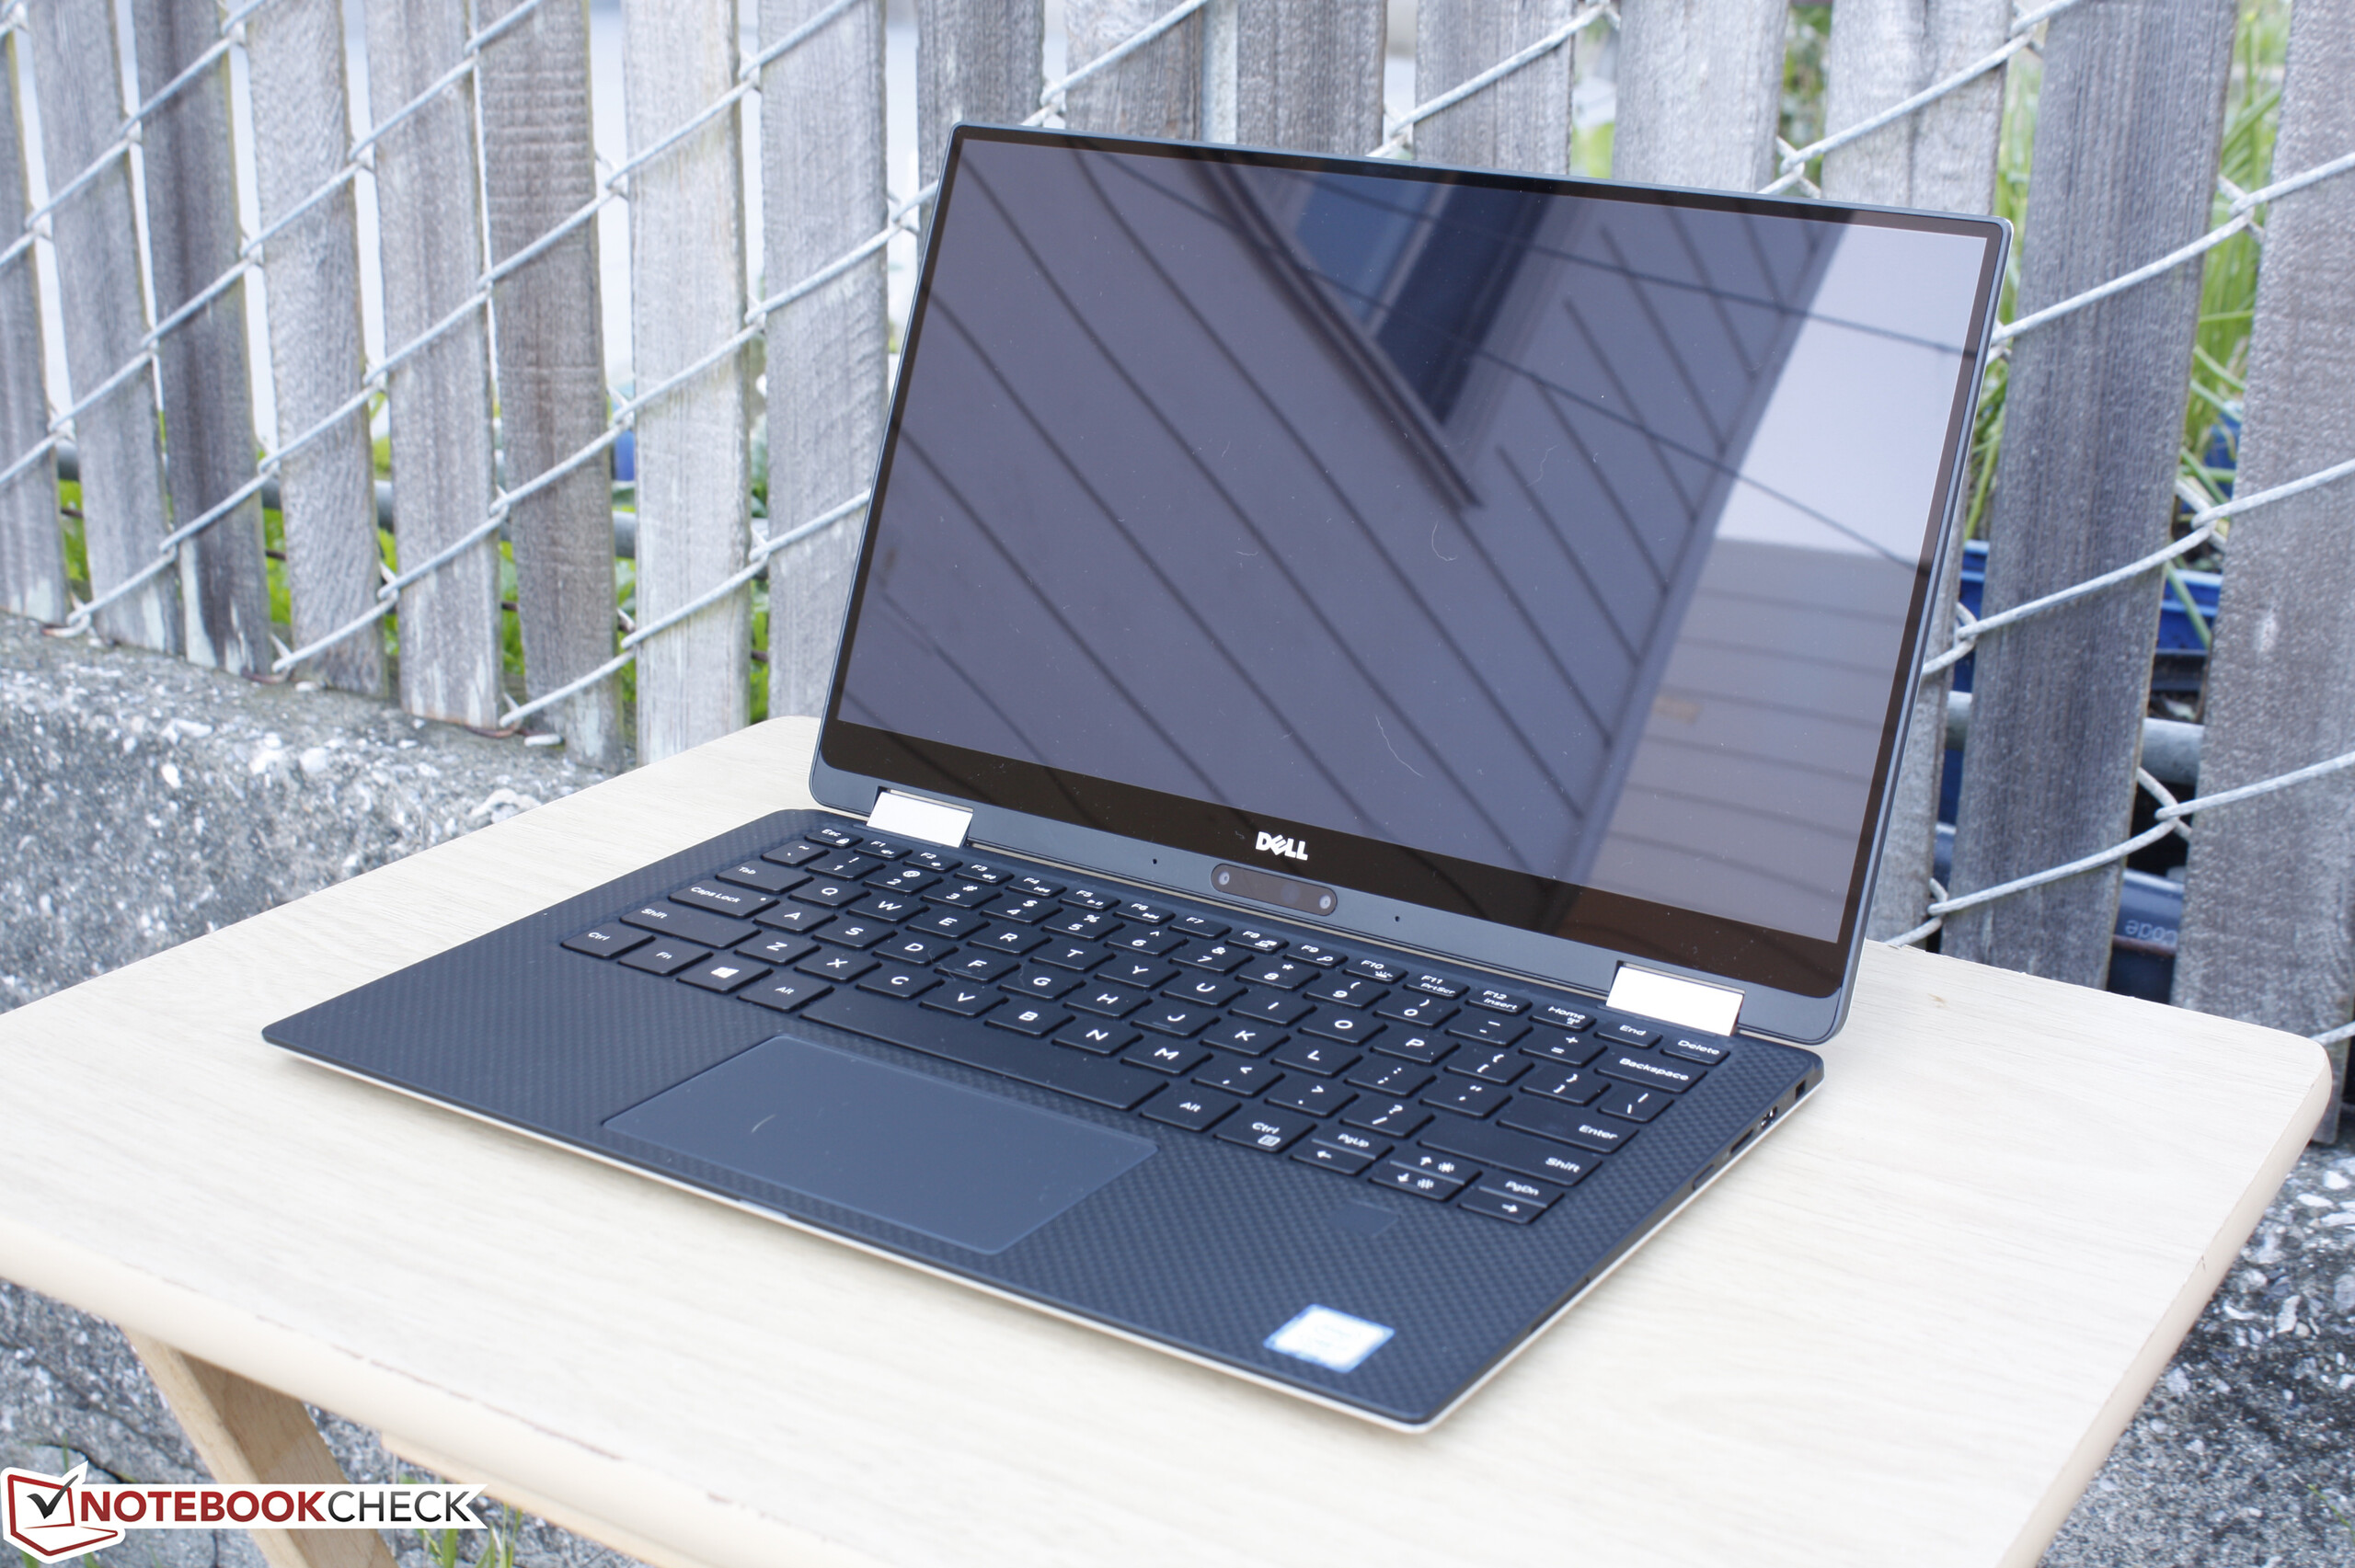
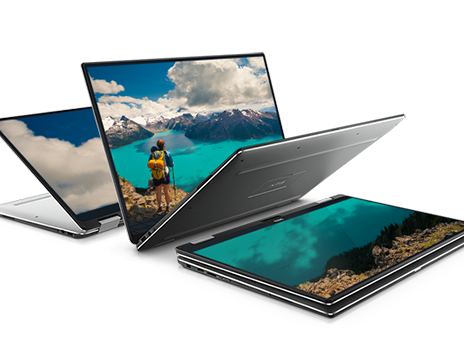
Kısa inceleme: Dell XPS 13 9365 2-in-1 dönüştürülebilir model


| SD Card Reader | |
| average JPG Copy Test (av. of 3 runs) | |
| Dell XPS 13 9360 FHD i5 | |
| Lenovo ThinkPad E570-20H6S00000 | |
| Dell XPS 13-9365 2-in-1 | |
| maximum AS SSD Seq Read Test (1GB) | |
| Dell XPS 13 9360 FHD i5 | |
| Dell XPS 13-9365 2-in-1 | |
| Lenovo ThinkPad E570-20H6S00000 | |
| Networking | |
| iperf3 transmit AX12 | |
| MSI GT72VR 7RE-433 | |
| Dell XPS 13 9360 FHD i5 | |
| Dell XPS 13-9365 2-in-1 | |
| iperf3 receive AX12 | |
| MSI GT72VR 7RE-433 | |
| Dell XPS 13 9360 FHD i5 | |
| Dell XPS 13-9365 2-in-1 | |
| |||||||||||||||||||||||||
Aydınlatma: 91 %
Batarya modunda parlaklık: 322.6 cd/m²
Kontrast: 1698:1 (Siyah: 0.19 cd/m²)
ΔE Color 7.7 | 0.5-29.43 Ø5
ΔE Greyscale 7.9 | 0.57-98 Ø5.3
69.9% sRGB (Argyll 1.6.3 3D)
44.1% AdobeRGB 1998 (Argyll 1.6.3 3D)
48.83% AdobeRGB 1998 (Argyll 2.2.0 3D)
71.1% sRGB (Argyll 2.2.0 3D)
47.32% Display P3 (Argyll 2.2.0 3D)
Gamma: 2.88
| Dell XPS 13-9365 2-in-1 IPS, 13.30, 1920x1080 | Lenovo Yoga 910-13IKB-80VF004CGE AU Optronics AUO323D / B139HAN03.2, IPS, 13.90, 3840x2160 | HP Spectre x360 13-w023dx Chi Mei CMN1367, IPS, 13.30, 1920x1080 | Asus Zenbook UX310UQ-GL011T AU Optronics AUO142D, TN LED, 13.30, 1920x1080 | Dell XPS 13 9360 FHD i5 Sharp SHP1449 LQ133M1, IPS, 13.30, 1920x1080 | |
|---|---|---|---|---|---|
| Display | 29% | 33% | 28% | 3% | |
| Display P3 Coverage | 47.32 | 62.2 31% | 65.4 38% | 61.9 31% | 48.94 3% |
| sRGB Coverage | 71.1 | 90.1 27% | 90.4 27% | 88.3 24% | 73.3 3% |
| AdobeRGB 1998 Coverage | 48.83 | 63.5 30% | 65.8 35% | 63 29% | 50.5 3% |
| Response Times | 16% | 23% | -16% | 16% | |
| Response Time Grey 50% / Grey 80% * | 48 ? | 46 ? 4% | 33.2 ? 31% | 39 ? 19% | 32.8 ? 32% |
| Response Time Black / White * | 32.8 ? | 24 ? 27% | 28 ? 15% | 24 ? 27% | 33.2 ? -1% |
| PWM Frequency | 1042 ? | 50 ? -95% | |||
| Screen | -2% | -4% | -9% | 7% | |
| Brightness middle | 322.6 | 348 8% | 334.6 4% | 247 -23% | 351.2 9% |
| Brightness | 306 | 310 1% | 319 4% | 240 -22% | 325 6% |
| Brightness Distribution | 91 | 80 -12% | 90 -1% | 90 -1% | 89 -2% |
| Black Level * | 0.19 | 0.25 -32% | 0.336 -77% | 0.43 -126% | 0.195 -3% |
| Contrast | 1698 | 1392 -18% | 996 -41% | 574 -66% | 1801 6% |
| Colorchecker dE 2000 * | 7.7 | 7.86 -2% | 6.21 19% | 4.74 38% | 7.4 4% |
| Colorchecker dE 2000 max. * | 11.1 | 13.43 -21% | 12 -8% | 9.14 18% | 9.08 18% |
| Greyscale dE 2000 * | 7.9 | 8.25 -4% | 7.71 2% | 4.87 38% | 6.71 15% |
| Gamma | 2.88 76% | 2.05 107% | 2.36 93% | 2.57 86% | 2.74 80% |
| CCT | 7044 92% | 6834 95% | 6458 101% | 7450 87% | 7222 90% |
| Color Space (Percent of AdobeRGB 1998) | 44.1 | 58 32% | 58.6 33% | 57 29% | 50.48 14% |
| Color Space (Percent of sRGB) | 69.9 | 90 29% | 90 29% | 88 26% | 73.31 5% |
| Total Average (Program / Settings) | 14% /
7% | 17% /
7% | 1% /
-3% | 9% /
7% |
* ... smaller is better
Display Response Times
| ↔ Response Time Black to White | ||
|---|---|---|
| 32.8 ms ... rise ↗ and fall ↘ combined | ↗ 7.6 ms rise | 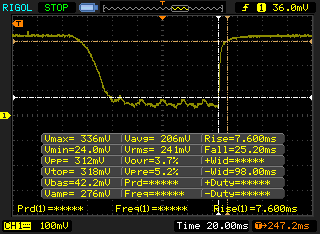 |
| ↘ 25.2 ms fall | ||
| The screen shows slow response rates in our tests and will be unsatisfactory for gamers. In comparison, all tested devices range from 0.1 (minimum) to 240 (maximum) ms. » 87 % of all devices are better. This means that the measured response time is worse than the average of all tested devices (21.5 ms). | ||
| ↔ Response Time 50% Grey to 80% Grey | ||
| 48 ms ... rise ↗ and fall ↘ combined | ↗ 16.4 ms rise |  |
| ↘ 31.6 ms fall | ||
| The screen shows slow response rates in our tests and will be unsatisfactory for gamers. In comparison, all tested devices range from 0.2 (minimum) to 636 (maximum) ms. » 80 % of all devices are better. This means that the measured response time is worse than the average of all tested devices (33.7 ms). | ||
Screen Flickering / PWM (Pulse-Width Modulation)
| Screen flickering / PWM detected | 1042 Hz | ≤ 29 % brightness setting |  |
The display backlight flickers at 1042 Hz (worst case, e.g., utilizing PWM) Flickering detected at a brightness setting of 29 % and below. There should be no flickering or PWM above this brightness setting. The frequency of 1042 Hz is quite high, so most users sensitive to PWM should not notice any flickering. In comparison: 53 % of all tested devices do not use PWM to dim the display. If PWM was detected, an average of 17924 (minimum: 5 - maximum: 3846000) Hz was measured. | |||
| Cinebench R15 | |
| CPU Single 64Bit | |
| HP Pavilion 15t-au100 CTO (W0P31AV) | |
| Apple MacBook Pro 13 2016 (2.9 GHz) | |
| Dell XPS 13-9365 2-in-1 | |
| Dell XPS 13 9360 FHD i5 | |
| HP EliteBook 1030 G1-X2F03EA | |
| Acer Spin 7 SP714-51-M09D | |
| Lenovo Ideapad 510S-13ISK | |
| Asus TransformerBook T302CA-FL010T | |
| HP Pavilion 15-aw004ng W8Y60EA | |
| Lenovo Yoga Book 2016 Windows 64GB LTE | |
| CPU Multi 64Bit | |
| HP Pavilion 15t-au100 CTO (W0P31AV) | |
| Apple MacBook Pro 13 2016 (2.9 GHz) | |
| Dell XPS 13 9360 FHD i5 | |
| Lenovo Ideapad 510S-13ISK | |
| HP EliteBook 1030 G1-X2F03EA | |
| Dell XPS 13-9365 2-in-1 | |
| HP Pavilion 15-aw004ng W8Y60EA | |
| Asus TransformerBook T302CA-FL010T | |
| Acer Spin 7 SP714-51-M09D | |
| Lenovo Yoga Book 2016 Windows 64GB LTE | |
| Cinebench R11.5 | |
| CPU Single 64Bit | |
| HP Pavilion 15t-au100 CTO (W0P31AV) | |
| Dell XPS 13-9365 2-in-1 | |
| Dell XPS 13 9360 FHD i5 | |
| HP EliteBook 1030 G1-X2F03EA | |
| Acer Spin 7 SP714-51-M09D | |
| Lenovo Ideapad 510S-13ISK | |
| HP Pavilion 15-aw004ng W8Y60EA | |
| CPU Multi 64Bit | |
| HP Pavilion 15t-au100 CTO (W0P31AV) | |
| Dell XPS 13 9360 FHD i5 | |
| HP EliteBook 1030 G1-X2F03EA | |
| Dell XPS 13-9365 2-in-1 | |
| Lenovo Ideapad 510S-13ISK | |
| HP Pavilion 15-aw004ng W8Y60EA | |
| Acer Spin 7 SP714-51-M09D | |
| Cinebench R10 | |
| Rendering Multiple CPUs 32Bit | |
| HP Pavilion 15t-au100 CTO (W0P31AV) | |
| Dell XPS 13 9360 FHD i5 | |
| Lenovo Ideapad 510S-13ISK | |
| Dell XPS 13-9365 2-in-1 | |
| Acer Spin 7 SP714-51-M09D | |
| HP Pavilion 15-aw004ng W8Y60EA | |
| Rendering Single 32Bit | |
| HP Pavilion 15t-au100 CTO (W0P31AV) | |
| Dell XPS 13-9365 2-in-1 | |
| Dell XPS 13 9360 FHD i5 | |
| Lenovo Ideapad 510S-13ISK | |
| Acer Spin 7 SP714-51-M09D | |
| HP Pavilion 15-aw004ng W8Y60EA | |
| wPrime 2.10 - 1024m | |
| Dell XPS 13-9365 2-in-1 | |
| HP Pavilion 15t-au100 CTO (W0P31AV) | |
| Super Pi Mod 1.5 XS 32M - 32M | |
| Acer Spin 7 SP714-51-M09D | |
| Dell XPS 13 9360 FHD i5 | |
| HP Pavilion 15t-au100 CTO (W0P31AV) | |
| Dell XPS 13-9365 2-in-1 | |
* ... smaller is better
| PCMark 8 | |
| Home Score Accelerated v2 | |
| HP Spectre x360 13-w023dx | |
| Asus Zenbook UX310UQ-GL011T | |
| Lenovo Yoga 910-13IKB-80VF004CGE | |
| Dell XPS 13 9360 FHD i5 | |
| Dell XPS 13-9365 2-in-1 | |
| Work Score Accelerated v2 | |
| HP Spectre x360 13-w023dx | |
| Dell XPS 13-9365 2-in-1 | |
| Asus Zenbook UX310UQ-GL011T | |
| Dell XPS 13 9360 FHD i5 | |
| Creative Score Accelerated v2 | |
| HP Spectre x360 13-w023dx | |
| Asus Zenbook UX310UQ-GL011T | |
| Dell XPS 13-9365 2-in-1 | |
| Dell XPS 13 9360 FHD i5 | |
| PCMark 8 Home Score Accelerated v2 | 3134 puan | |
| PCMark 8 Creative Score Accelerated v2 | 4277 puan | |
| PCMark 8 Work Score Accelerated v2 | 4674 puan | |
Yardım | ||
| Dell XPS 13-9365 2-in-1 Toshiba NVMe THNSN5256GPUK | Lenovo Yoga 910-13IKB-80VF004CGE Samsung PM951 NVMe MZVLV512 | HP Spectre x360 13-w023dx Samsung PM951 NVMe MZVLV512 | Asus Zenbook UX310UQ-GL011T SanDisk SD8SNAT256G1002 | Dell XPS 13 9360 FHD i5 Toshiba NVMe THNSN5256GPUK | |
|---|---|---|---|---|---|
| CrystalDiskMark 3.0 | 28% | 17% | -46% | 3% | |
| Read Seq | 1206 | 1412 17% | 1376 14% | 468.1 -61% | 1233 2% |
| Write Seq | 629 | 578 -8% | 571 -9% | 319.2 -49% | 733 17% |
| Read 512 | 966 | 701 -27% | 679 -30% | 318.6 -67% | 1036 7% |
| Write 512 | 410.7 | 580 41% | 571 39% | 272.8 -34% | 439.9 7% |
| Read 4k | 32.93 | 43.5 32% | 42.66 30% | 22.03 -33% | 29.31 -11% |
| Write 4k | 121.2 | 159.7 32% | 137.9 14% | 72.1 -41% | 116.9 -4% |
| Read 4k QD32 | 411 | 570 39% | 535 30% | 147.4 -64% | 479.2 17% |
| Write 4k QD32 | 250.2 | 488.7 95% | 361.2 44% | 200.2 -20% | 218.3 -13% |

| 3DMark 11 | |
| 1280x720 Performance GPU | |
| HP Pavilion 15-aw004ng W8Y60EA | |
| HP Pavilion 15t-au100 CTO (W0P31AV) | |
| Asus Zenbook UX3410UA | |
| Dell XPS 13 9360 FHD i5 | |
| Dell XPS 13-9365 2-in-1 | |
| HP 250 G5 SP X0N33EA | |
| Acer Spin 7 SP714-51-M09D | |
| Asus TransformerBook T302CA-FL010T | |
| Lenovo Yoga Book 2016 Windows 64GB LTE | |
| 1280x720 Performance Combined | |
| HP Pavilion 15t-au100 CTO (W0P31AV) | |
| Asus Zenbook UX3410UA | |
| Dell XPS 13 9360 FHD i5 | |
| Dell XPS 13-9365 2-in-1 | |
| HP Pavilion 15-aw004ng W8Y60EA | |
| HP 250 G5 SP X0N33EA | |
| Acer Spin 7 SP714-51-M09D | |
| Asus TransformerBook T302CA-FL010T | |
| Lenovo Yoga Book 2016 Windows 64GB LTE | |
| 3DMark | |
| 1280x720 Cloud Gate Standard Graphics | |
| HP Pavilion 15-aw004ng W8Y60EA | |
| Asus Zenbook UX3410UA | |
| HP Pavilion 15t-au100 CTO (W0P31AV) | |
| Dell XPS 13 9360 FHD i5 | |
| Dell XPS 13-9365 2-in-1 | |
| HP 250 G5 SP X0N33EA | |
| Acer Spin 7 SP714-51-M09D | |
| Asus TransformerBook T302CA-FL010T | |
| Lenovo Yoga Book 2016 Windows 64GB LTE | |
| 1920x1080 Ice Storm Extreme Graphics | |
| Dell XPS 13 9360 FHD i5 | |
| HP Pavilion 15-aw004ng W8Y60EA | |
| Dell XPS 13-9365 2-in-1 | |
| 1280x720 offscreen Ice Storm Unlimited Graphics Score | |
| Dell XPS 13 9360 FHD i5 | |
| Dell XPS 13-9365 2-in-1 | |
| HP Pavilion 15-aw004ng W8Y60EA | |
| 1280x720 Ice Storm Standard Graphics | |
| Dell XPS 13 9360 FHD i5 | |
| Dell XPS 13-9365 2-in-1 | |
| HP Pavilion 15-aw004ng W8Y60EA | |
| HP 250 G5 SP X0N33EA | |
| Acer Spin 7 SP714-51-M09D | |
| 3DMark 11 Performance | 1505 puan | |
| 3DMark Ice Storm Standard Score | 56912 puan | |
| 3DMark Cloud Gate Standard Score | 5828 puan | |
| 3DMark Fire Strike Score | 829 puan | |
| 3DMark Fire Strike Extreme Score | 392 puan | |
Yardım | ||
| BioShock Infinite - 1280x720 Very Low Preset | |
| Apple MacBook Pro 13 2016 (2.9 GHz) | |
| HP 17-y044ng | |
| Asus Zenbook UX3410UA | |
| Fujitsu LifeBook E736 E7360M27BBPL | |
| Asus TransformerBook T302CA-FL010T | |
| Dell XPS 13-9365 2-in-1 | |
| Acer Spin 7 SP714-51-M09D | |
| Medion Akoya E2215T | |
| düşük | orta | yüksek | ultra | |
| BioShock Infinite (2013) | 38.4 | 18.8 | ||
| Metro: Last Light (2013) | 20.2 | |||
| Rise of the Tomb Raider (2016) | 12.9 |
| Dell XPS 13-9365 2-in-1 HD Graphics 615, i7-7Y75, Toshiba NVMe THNSN5256GPUK | Lenovo Yoga 910-13IKB-80VF004CGE HD Graphics 620, i7-7500U, Samsung PM951 NVMe MZVLV512 | HP Spectre x360 13-w023dx HD Graphics 620, i7-7500U, Samsung PM951 NVMe MZVLV512 | Asus Zenbook UX310UQ-GL011T GeForce 940MX, 6500U, SanDisk SD8SNAT256G1002 | Dell XPS 13 9360 FHD i5 HD Graphics 620, i5-7200U, Toshiba NVMe THNSN5256GPUK | |
|---|---|---|---|---|---|
| Noise | |||||
| off / environment * | 31.7 | 29.1 | 30.5 | ||
| Idle Minimum * | 31.7 | 29.1 | 30.5 | 28.9 | |
| Idle Average * | 31.7 | 29.1 | 30.5 | 28.9 | |
| Idle Maximum * | 31.7 | 31.2 | 31.5 | 28.9 | |
| Load Average * | 38.4 | 37.3 | 36.2 | 30.9 | |
| Load Maximum * | 34.7 | 39.6 | 40 | 33.5 |
* ... smaller is better
(-) The maximum temperature on the upper side is 51 °C / 124 F, compared to the average of 35.3 °C / 96 F, ranging from 19.6 to 55.7 °C for the class Convertible.
(-) The bottom heats up to a maximum of 48 °C / 118 F, compared to the average of 36.8 °C / 98 F
(+) In idle usage, the average temperature for the upper side is 23 °C / 73 F, compared to the device average of 30.2 °C / 86 F.
(+) The palmrests and touchpad are reaching skin temperature as a maximum (32.4 °C / 90.3 F) and are therefore not hot.
(-) The average temperature of the palmrest area of similar devices was 28.1 °C / 82.6 F (-4.3 °C / -7.7 F).
Dell XPS 13-9365 2-in-1 audio analysis
(-) | not very loud speakers (68.9 dB)
Bass 100 - 315 Hz
(-) | nearly no bass - on average 15.5% lower than median
(±) | linearity of bass is average (7.5% delta to prev. frequency)
Mids 400 - 2000 Hz
(±) | higher mids - on average 5.5% higher than median
(-) | mids are not linear (15.3% delta to prev. frequency)
Highs 2 - 16 kHz
(+) | balanced highs - only 3.3% away from median
(±) | linearity of highs is average (12.7% delta to prev. frequency)
Overall 100 - 16.000 Hz
(-) | overall sound is not linear (31.7% difference to median)
Compared to same class
» 90% of all tested devices in this class were better, 2% similar, 8% worse
» The best had a delta of 6%, average was 21%, worst was 57%
Compared to all devices tested
» 89% of all tested devices were better, 2% similar, 9% worse
» The best had a delta of 4%, average was 25%, worst was 134%
Apple MacBook 12 (Early 2016) 1.1 GHz audio analysis
(+) | speakers can play relatively loud (83.6 dB)
Bass 100 - 315 Hz
(±) | reduced bass - on average 11.3% lower than median
(±) | linearity of bass is average (14.2% delta to prev. frequency)
Mids 400 - 2000 Hz
(+) | balanced mids - only 2.4% away from median
(+) | mids are linear (5.5% delta to prev. frequency)
Highs 2 - 16 kHz
(+) | balanced highs - only 2% away from median
(+) | highs are linear (4.5% delta to prev. frequency)
Overall 100 - 16.000 Hz
(+) | overall sound is linear (10.2% difference to median)
Compared to same class
» 5% of all tested devices in this class were better, 2% similar, 93% worse
» The best had a delta of 5%, average was 19%, worst was 53%
Compared to all devices tested
» 3% of all tested devices were better, 1% similar, 96% worse
» The best had a delta of 4%, average was 25%, worst was 134%
| Kapalı / Bekleme modu | |
| Boşta | |
| Çalışırken |
|
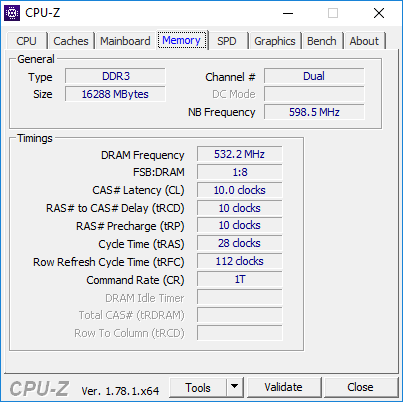
| Dell XPS 13-9365 2-in-1 i7-7Y75, HD Graphics 615, Toshiba NVMe THNSN5256GPUK, IPS, 1920x1080, 13.30 | Lenovo Yoga 910-13IKB-80VF004CGE i7-7500U, HD Graphics 620, Samsung PM951 NVMe MZVLV512, IPS, 3840x2160, 13.90 | HP Spectre x360 13-w023dx i7-7500U, HD Graphics 620, Samsung PM951 NVMe MZVLV512, IPS, 1920x1080, 13.30 | Asus Zenbook UX310UQ-GL011T 6500U, GeForce 940MX, SanDisk SD8SNAT256G1002, TN LED, 1920x1080, 13.30 | Dell XPS 13 9360 FHD i5 i5-7200U, HD Graphics 620, Toshiba NVMe THNSN5256GPUK, IPS, 1920x1080, 13.30 | |
|---|---|---|---|---|---|
| Power Consumption | -46% | -54% | -68% | -11% | |
| Idle Minimum * | 3.1 | 4.3 -39% | 5.5 -77% | 3 3% | 4.1 -32% |
| Idle Average * | 4.3 | 6.3 -47% | 6.7 -56% | 5.6 -30% | 4.2 2% |
| Idle Maximum * | 4.9 | 9 -84% | 7.1 -45% | 6.8 -39% | 5.1 -4% |
| Load Average * | 24.3 | 32.7 -35% | 33.1 -36% | 48.7 -100% | 22.1 9% |
| Load Maximum * | 22.8 | 28.8 -26% | 35.2 -54% | 63 -176% | 29.4 -29% |
* ... smaller is better
| Dell XPS 13-9365 2-in-1 i7-7Y75, HD Graphics 615, 46 Wh | Lenovo Yoga 910-13IKB-80VF004CGE i7-7500U, HD Graphics 620, 78 Wh | HP Spectre x360 13-w023dx i7-7500U, HD Graphics 620, 57.8 Wh | Asus Zenbook UX310UQ-GL011T 6500U, GeForce 940MX, 48 Wh | Dell XPS 13 9360 FHD i5 i5-7200U, HD Graphics 620, 60 Wh | |
|---|---|---|---|---|---|
| Battery Runtime | 1% | -8% | -27% | 7% | |
| Reader / Idle | 971 | 1069 10% | 1233 27% | 878 -10% | 1295 33% |
| WiFi v1.3 | 686 | 644 -6% | 558 -19% | 486 -29% | 677 -1% |
| Load | 175 | 174 -1% | 121 -31% | 103 -41% | 157 -10% |
Artılar
Eksiler
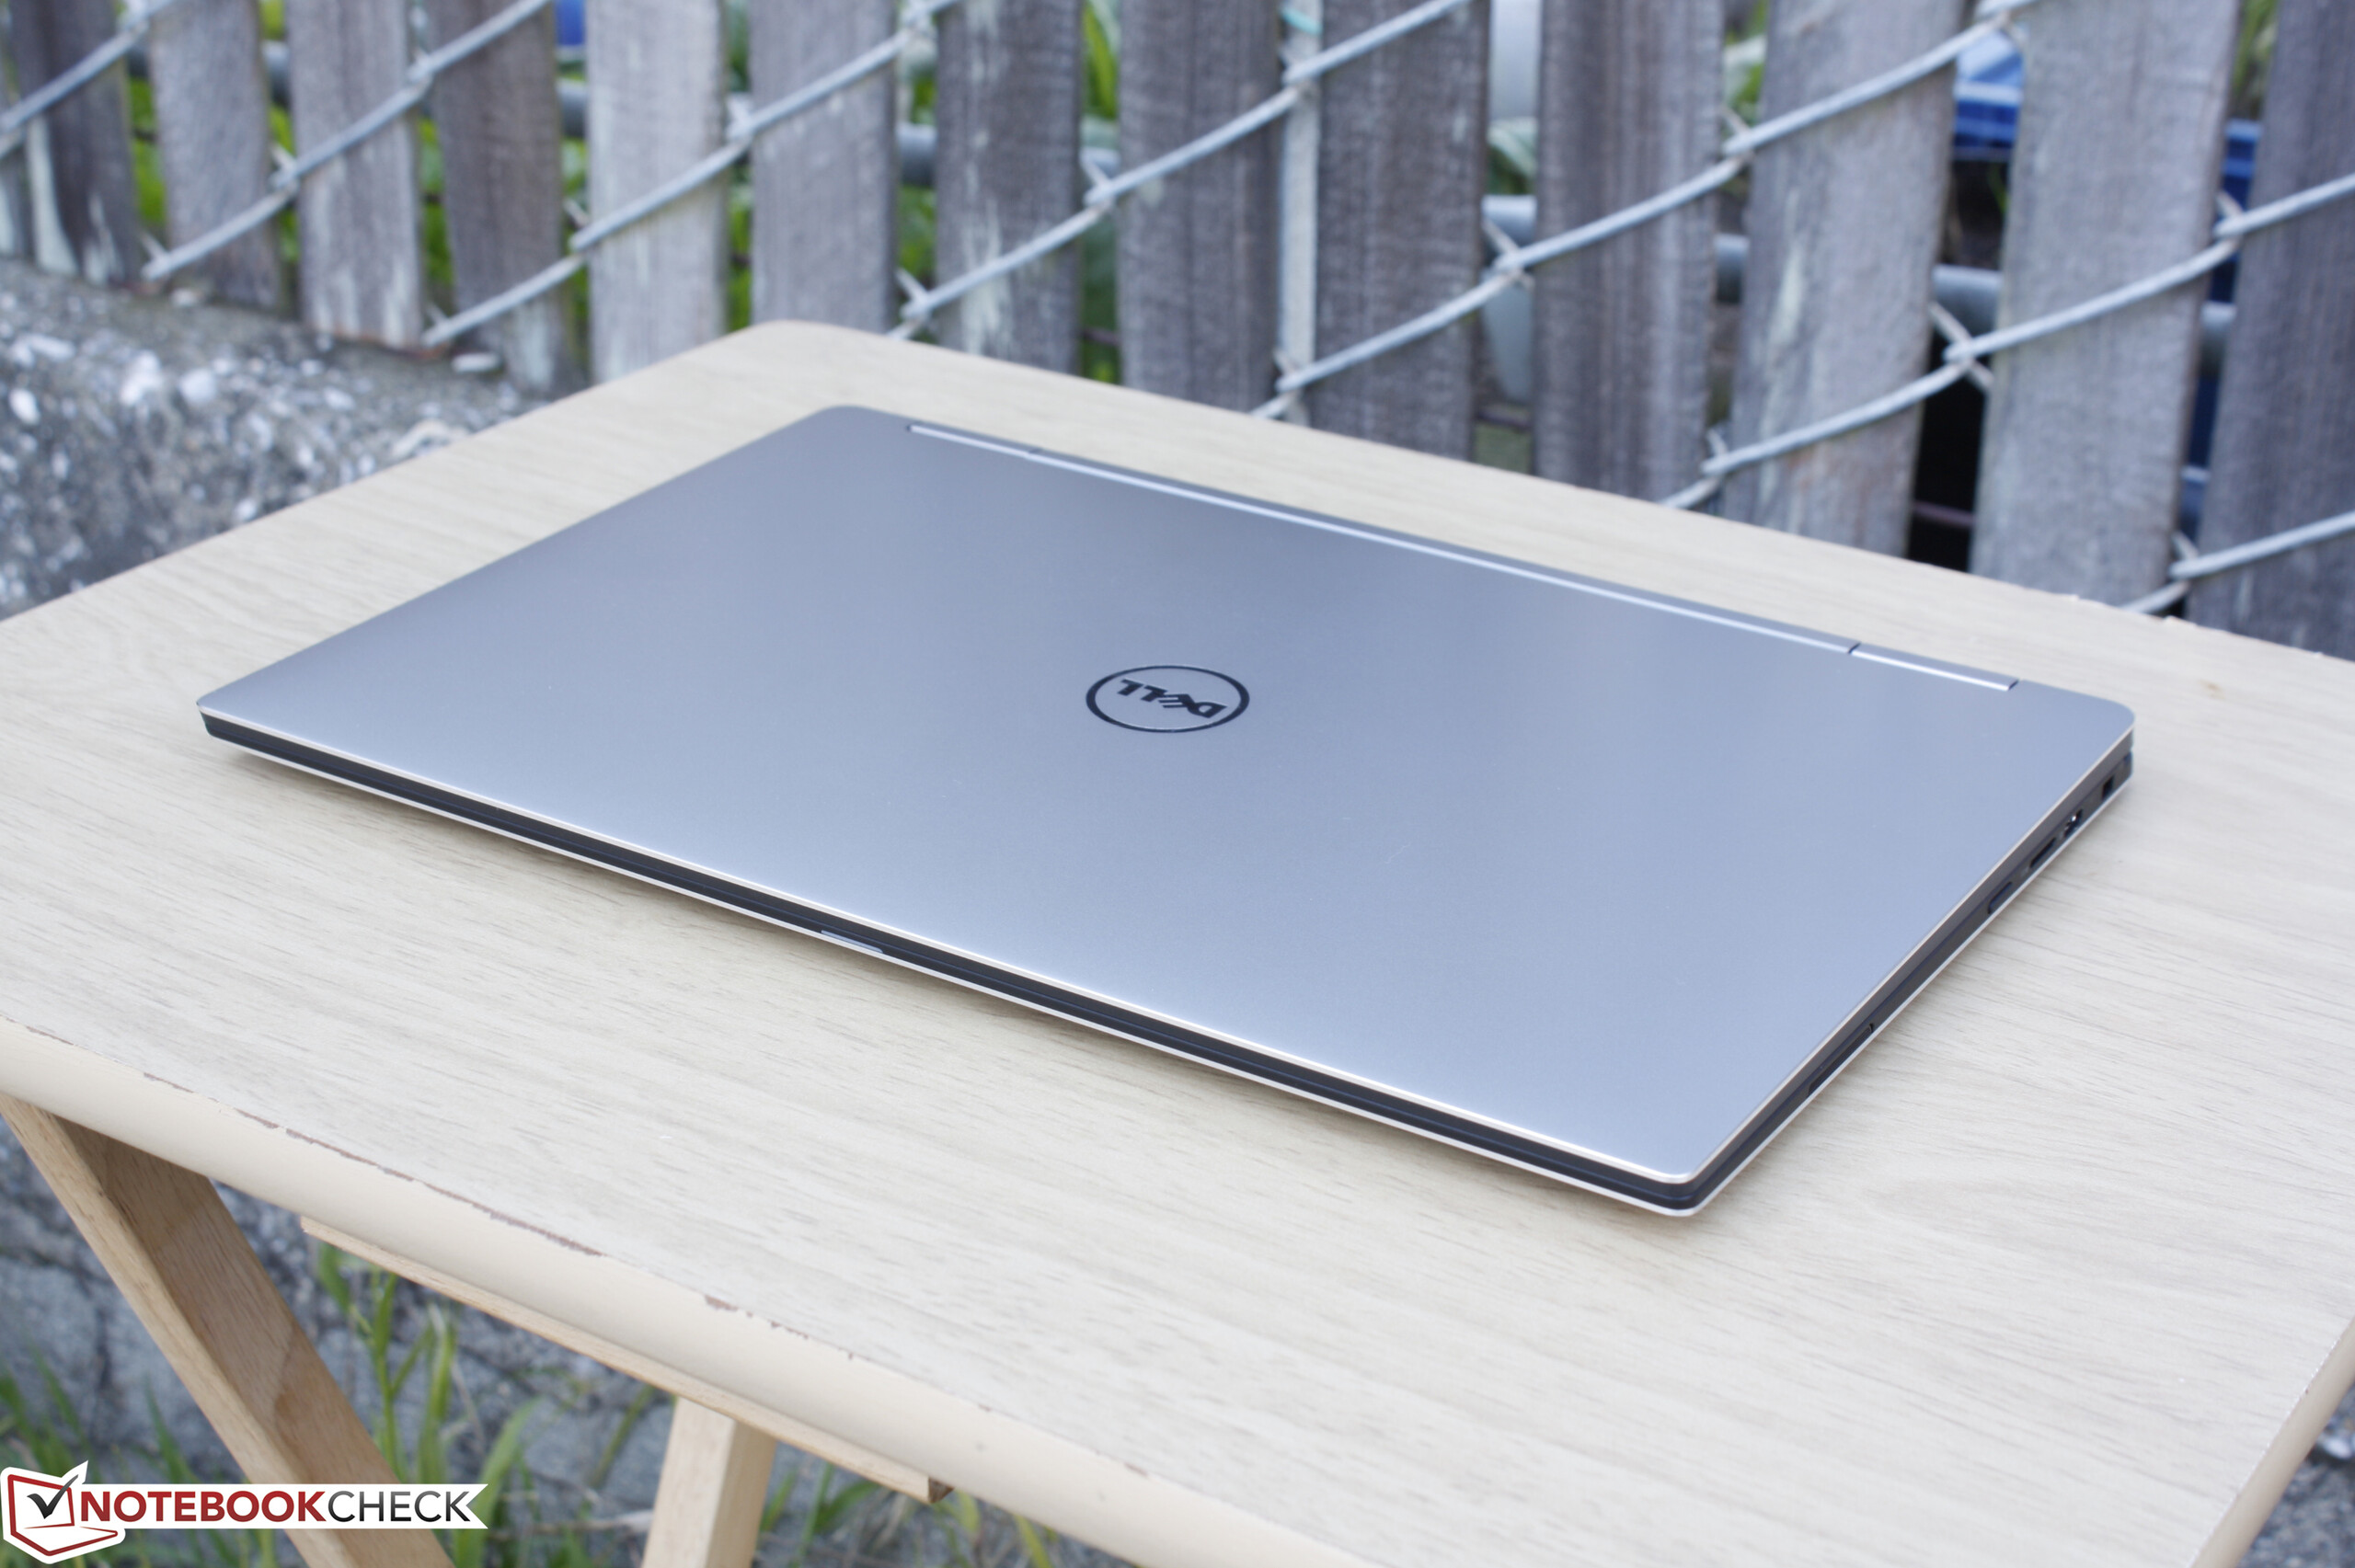
XPS 13 modelleri arasında 2si1 arada bulunurken neden orjinalini alasınız?
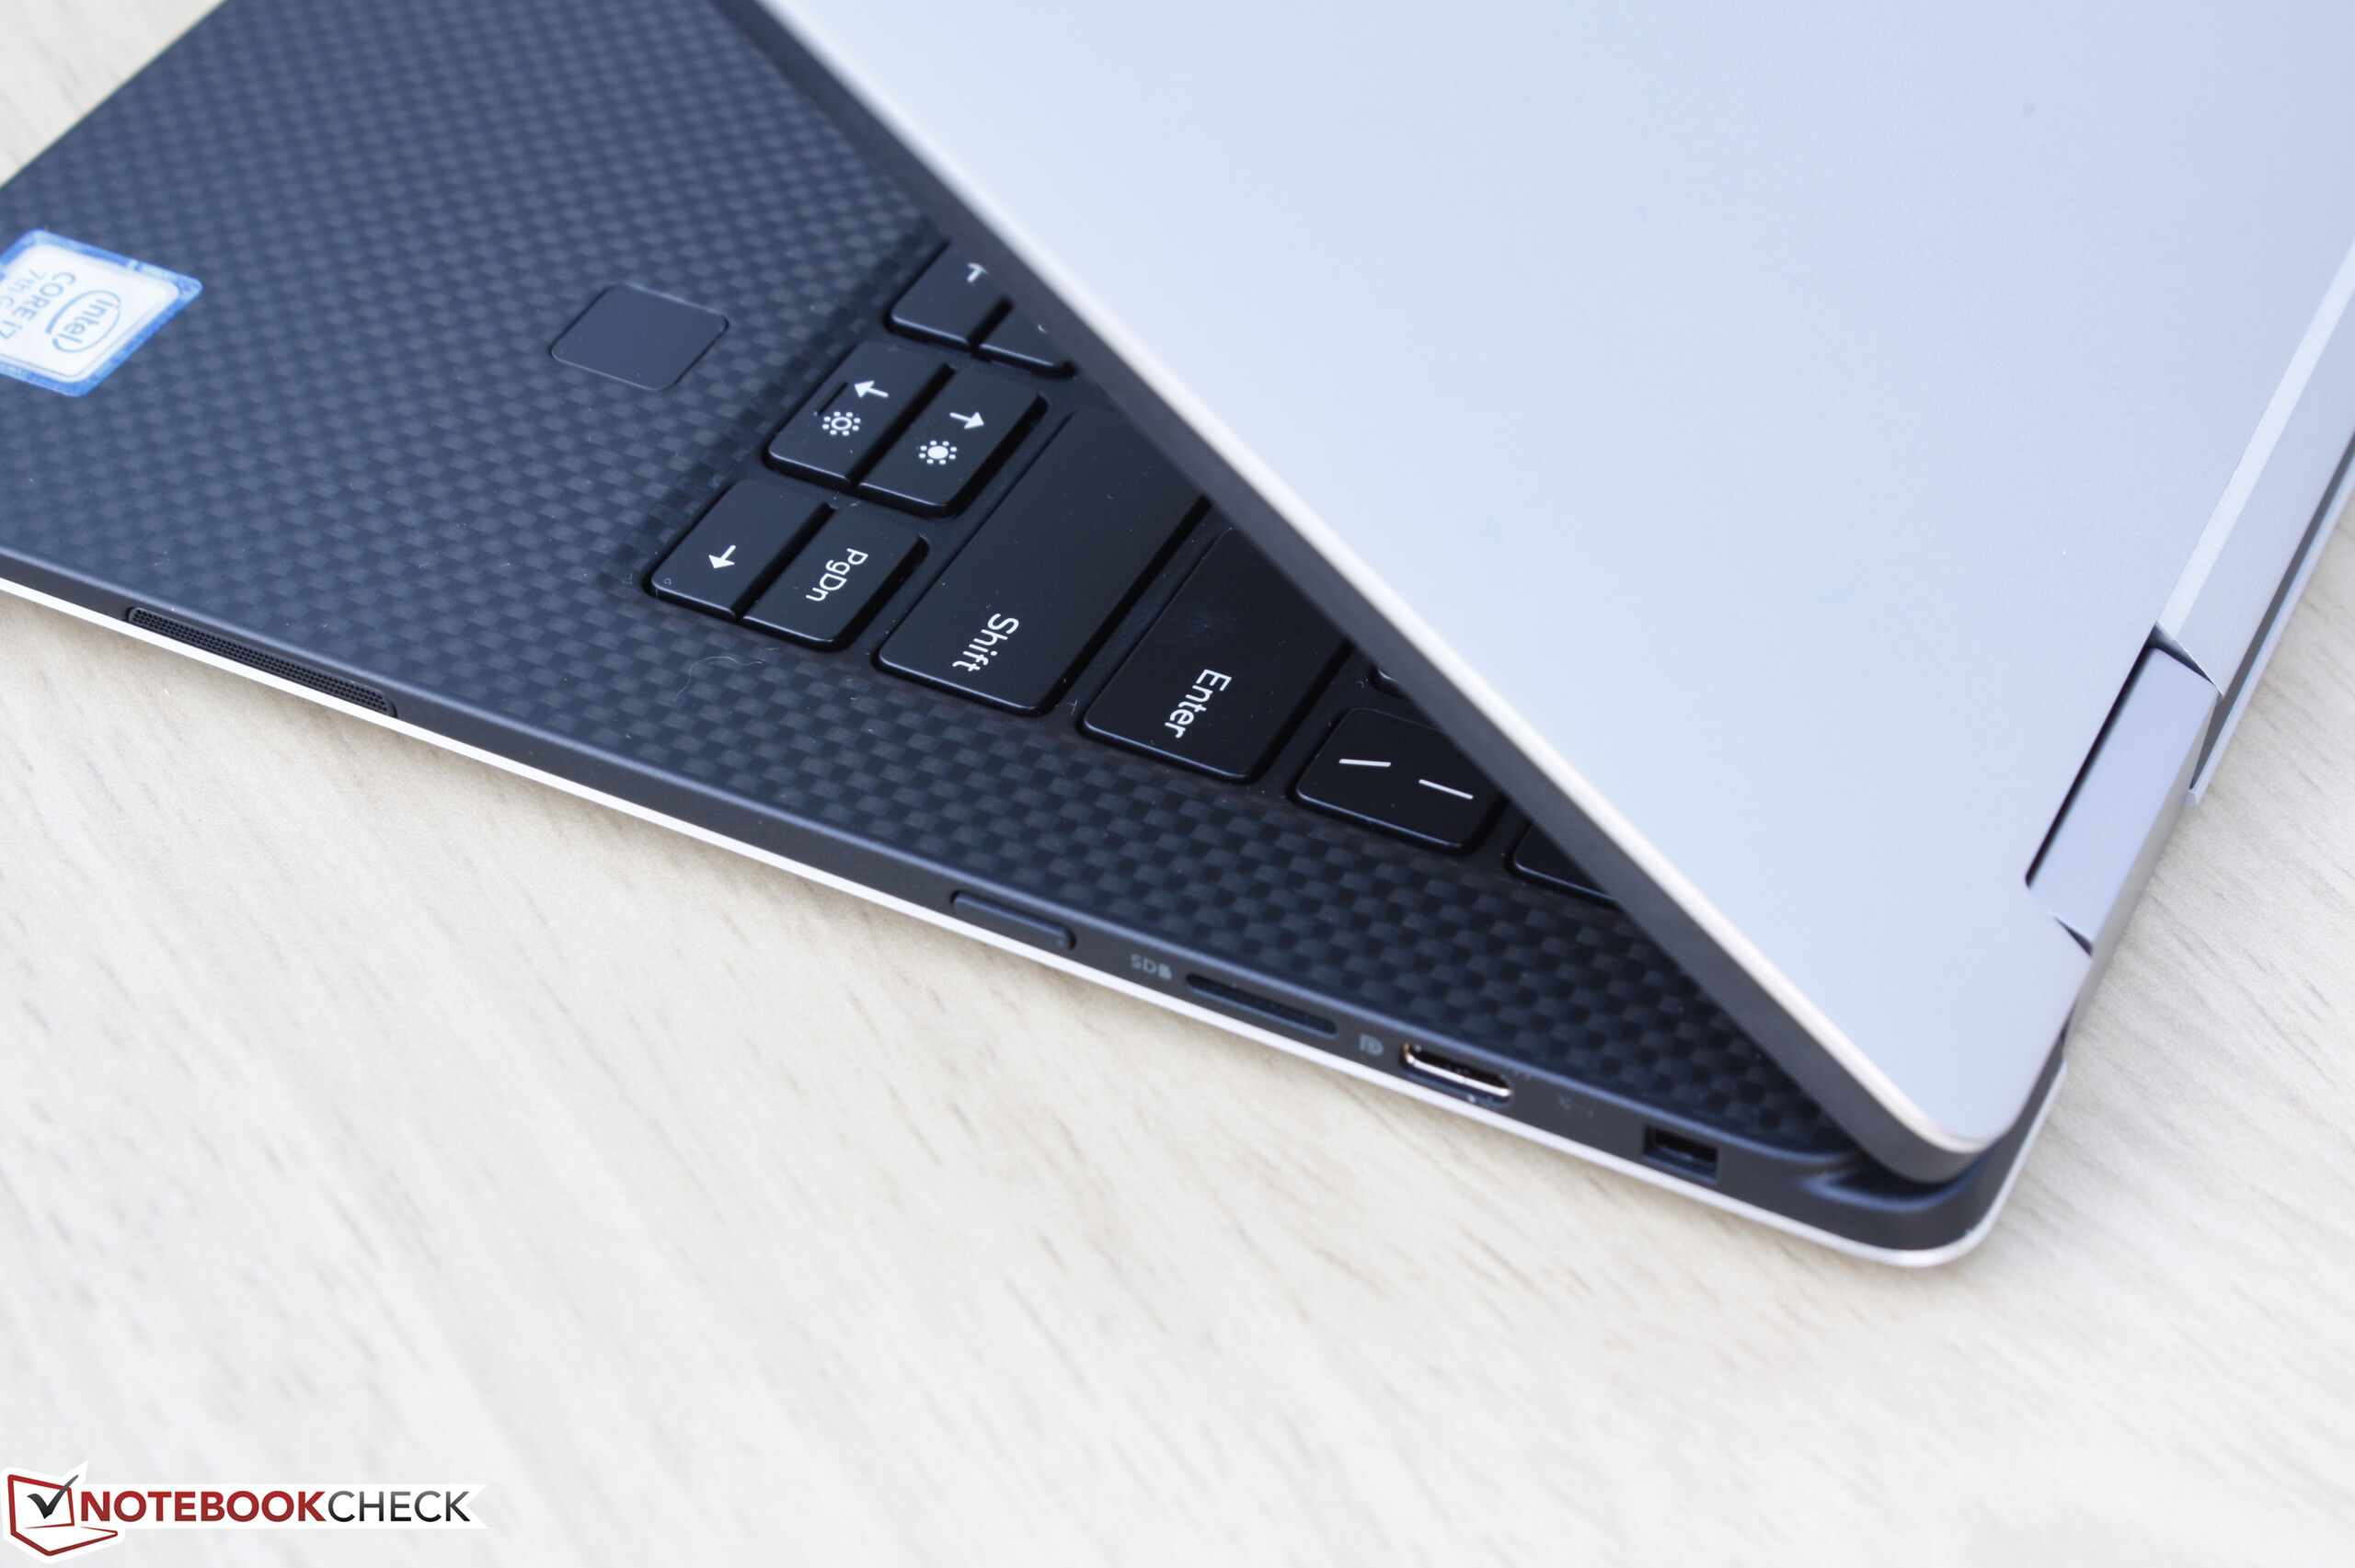
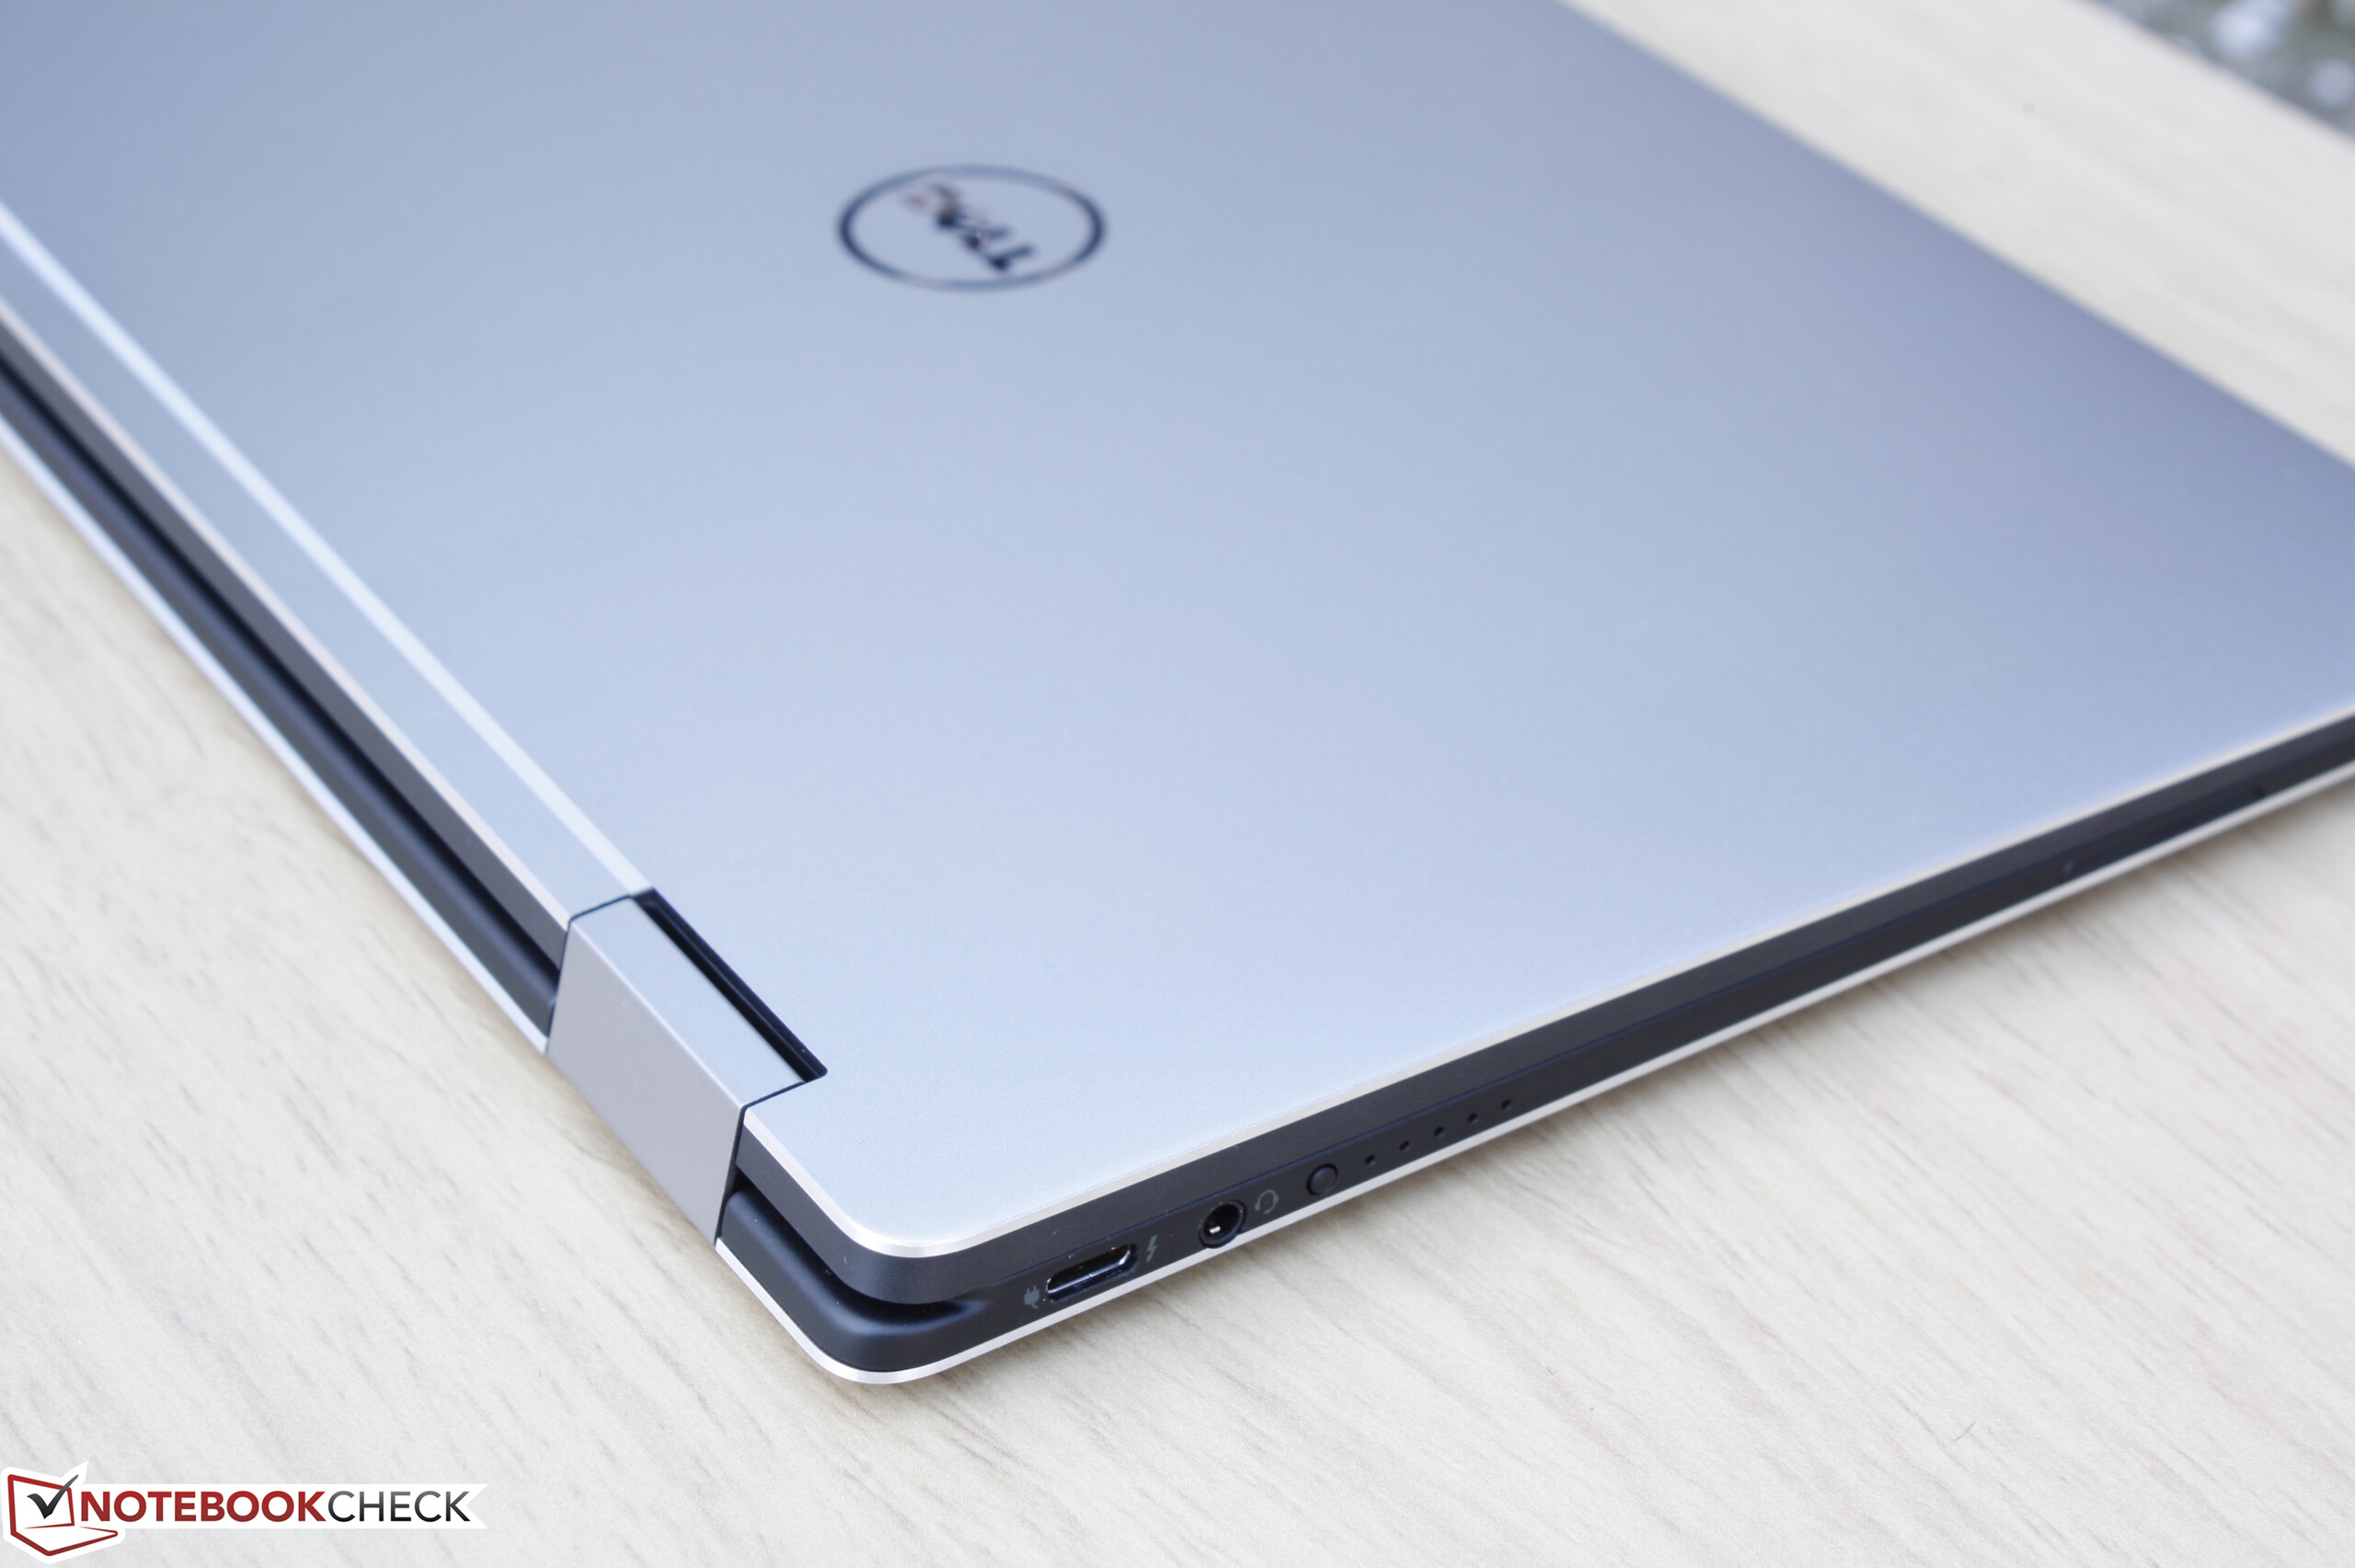
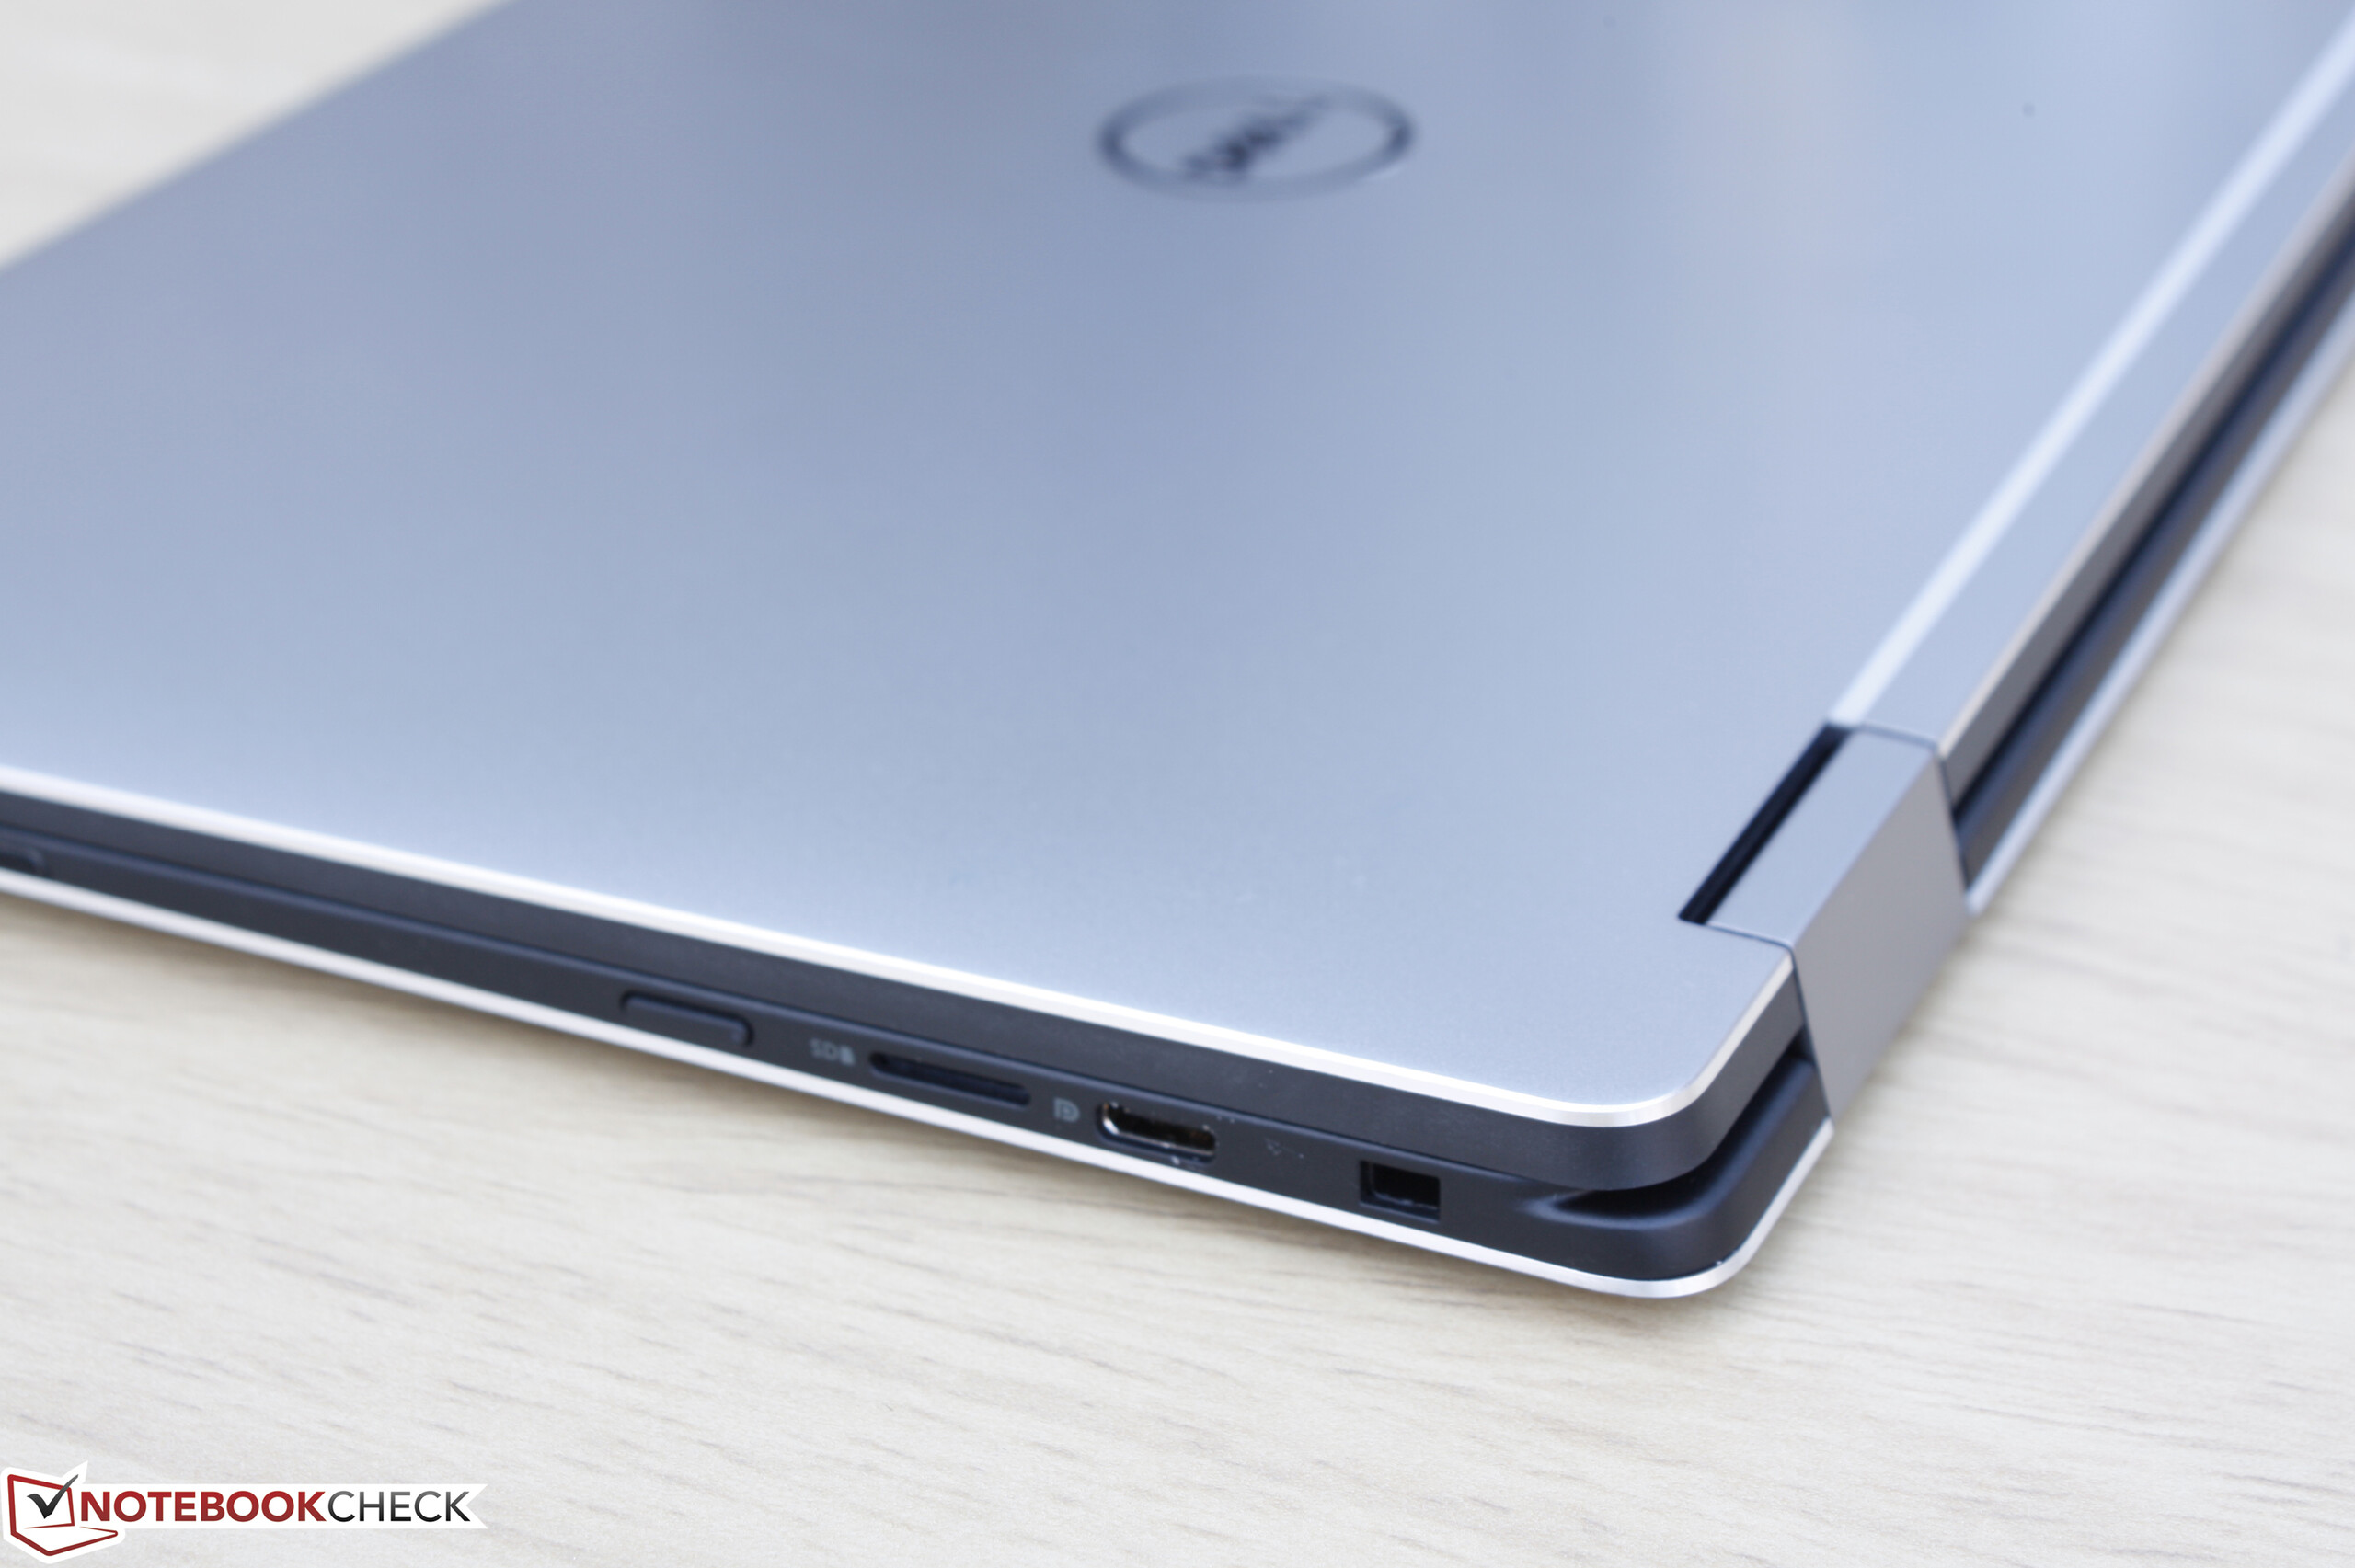
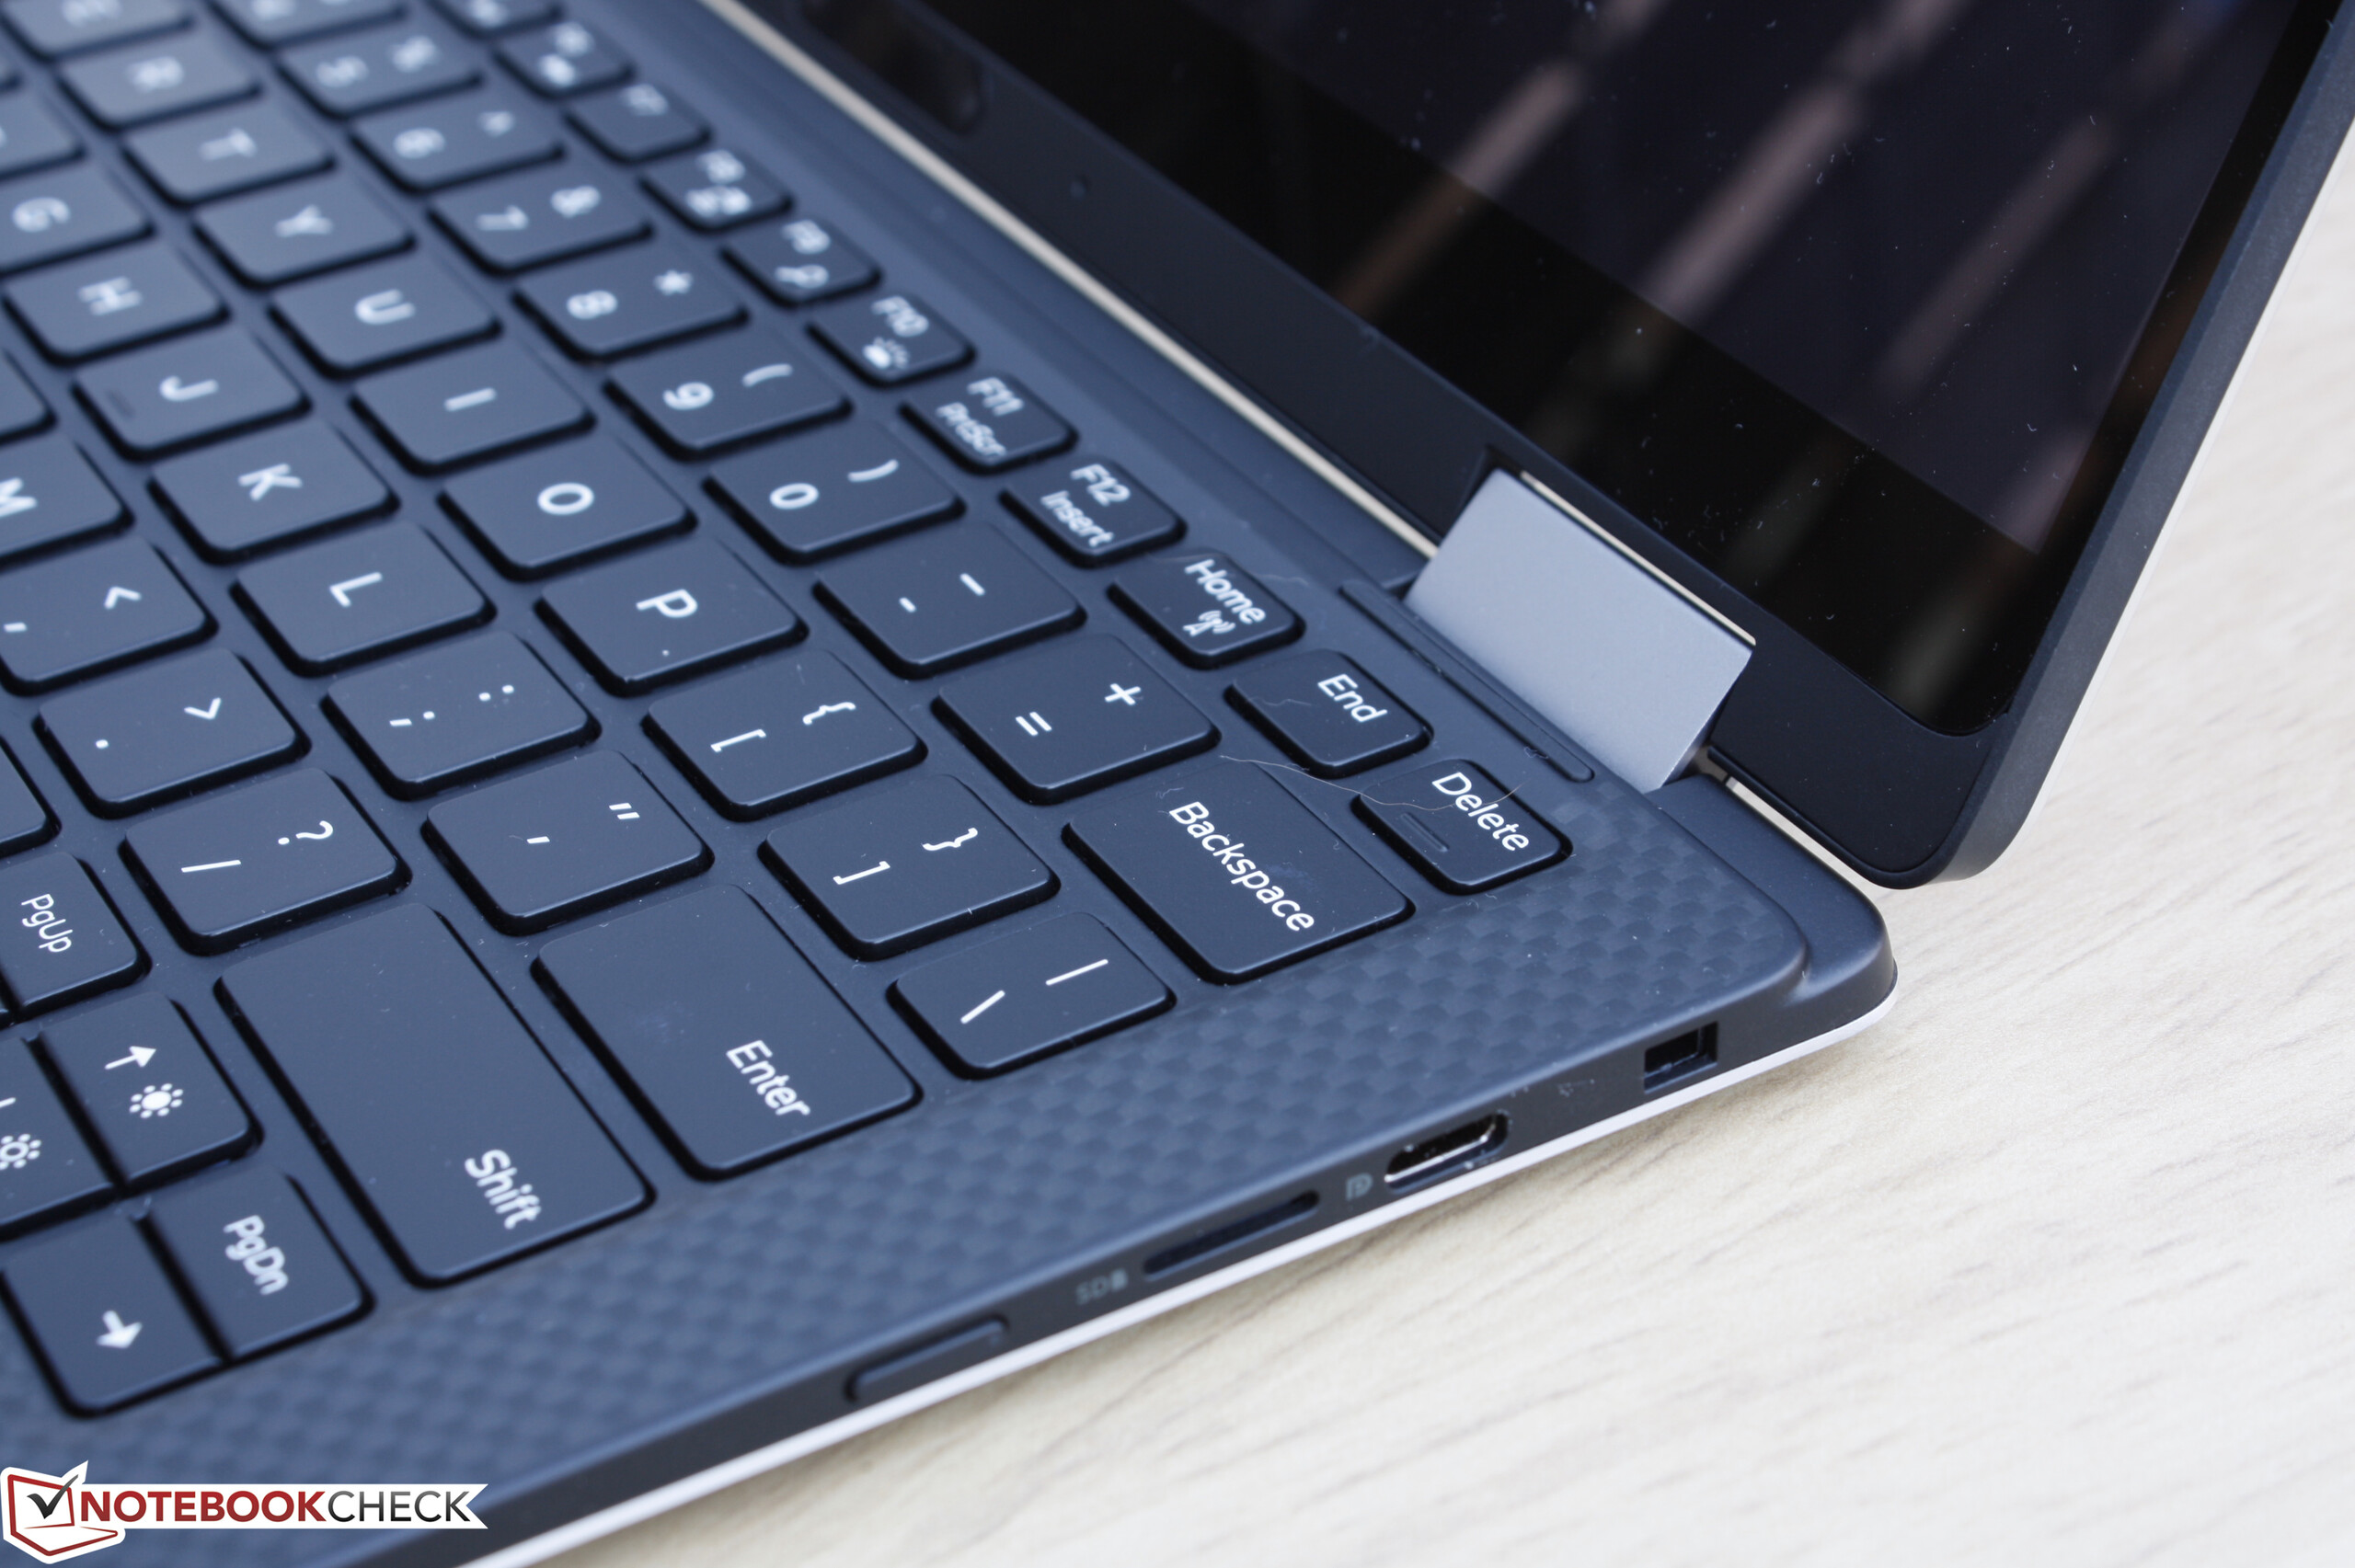
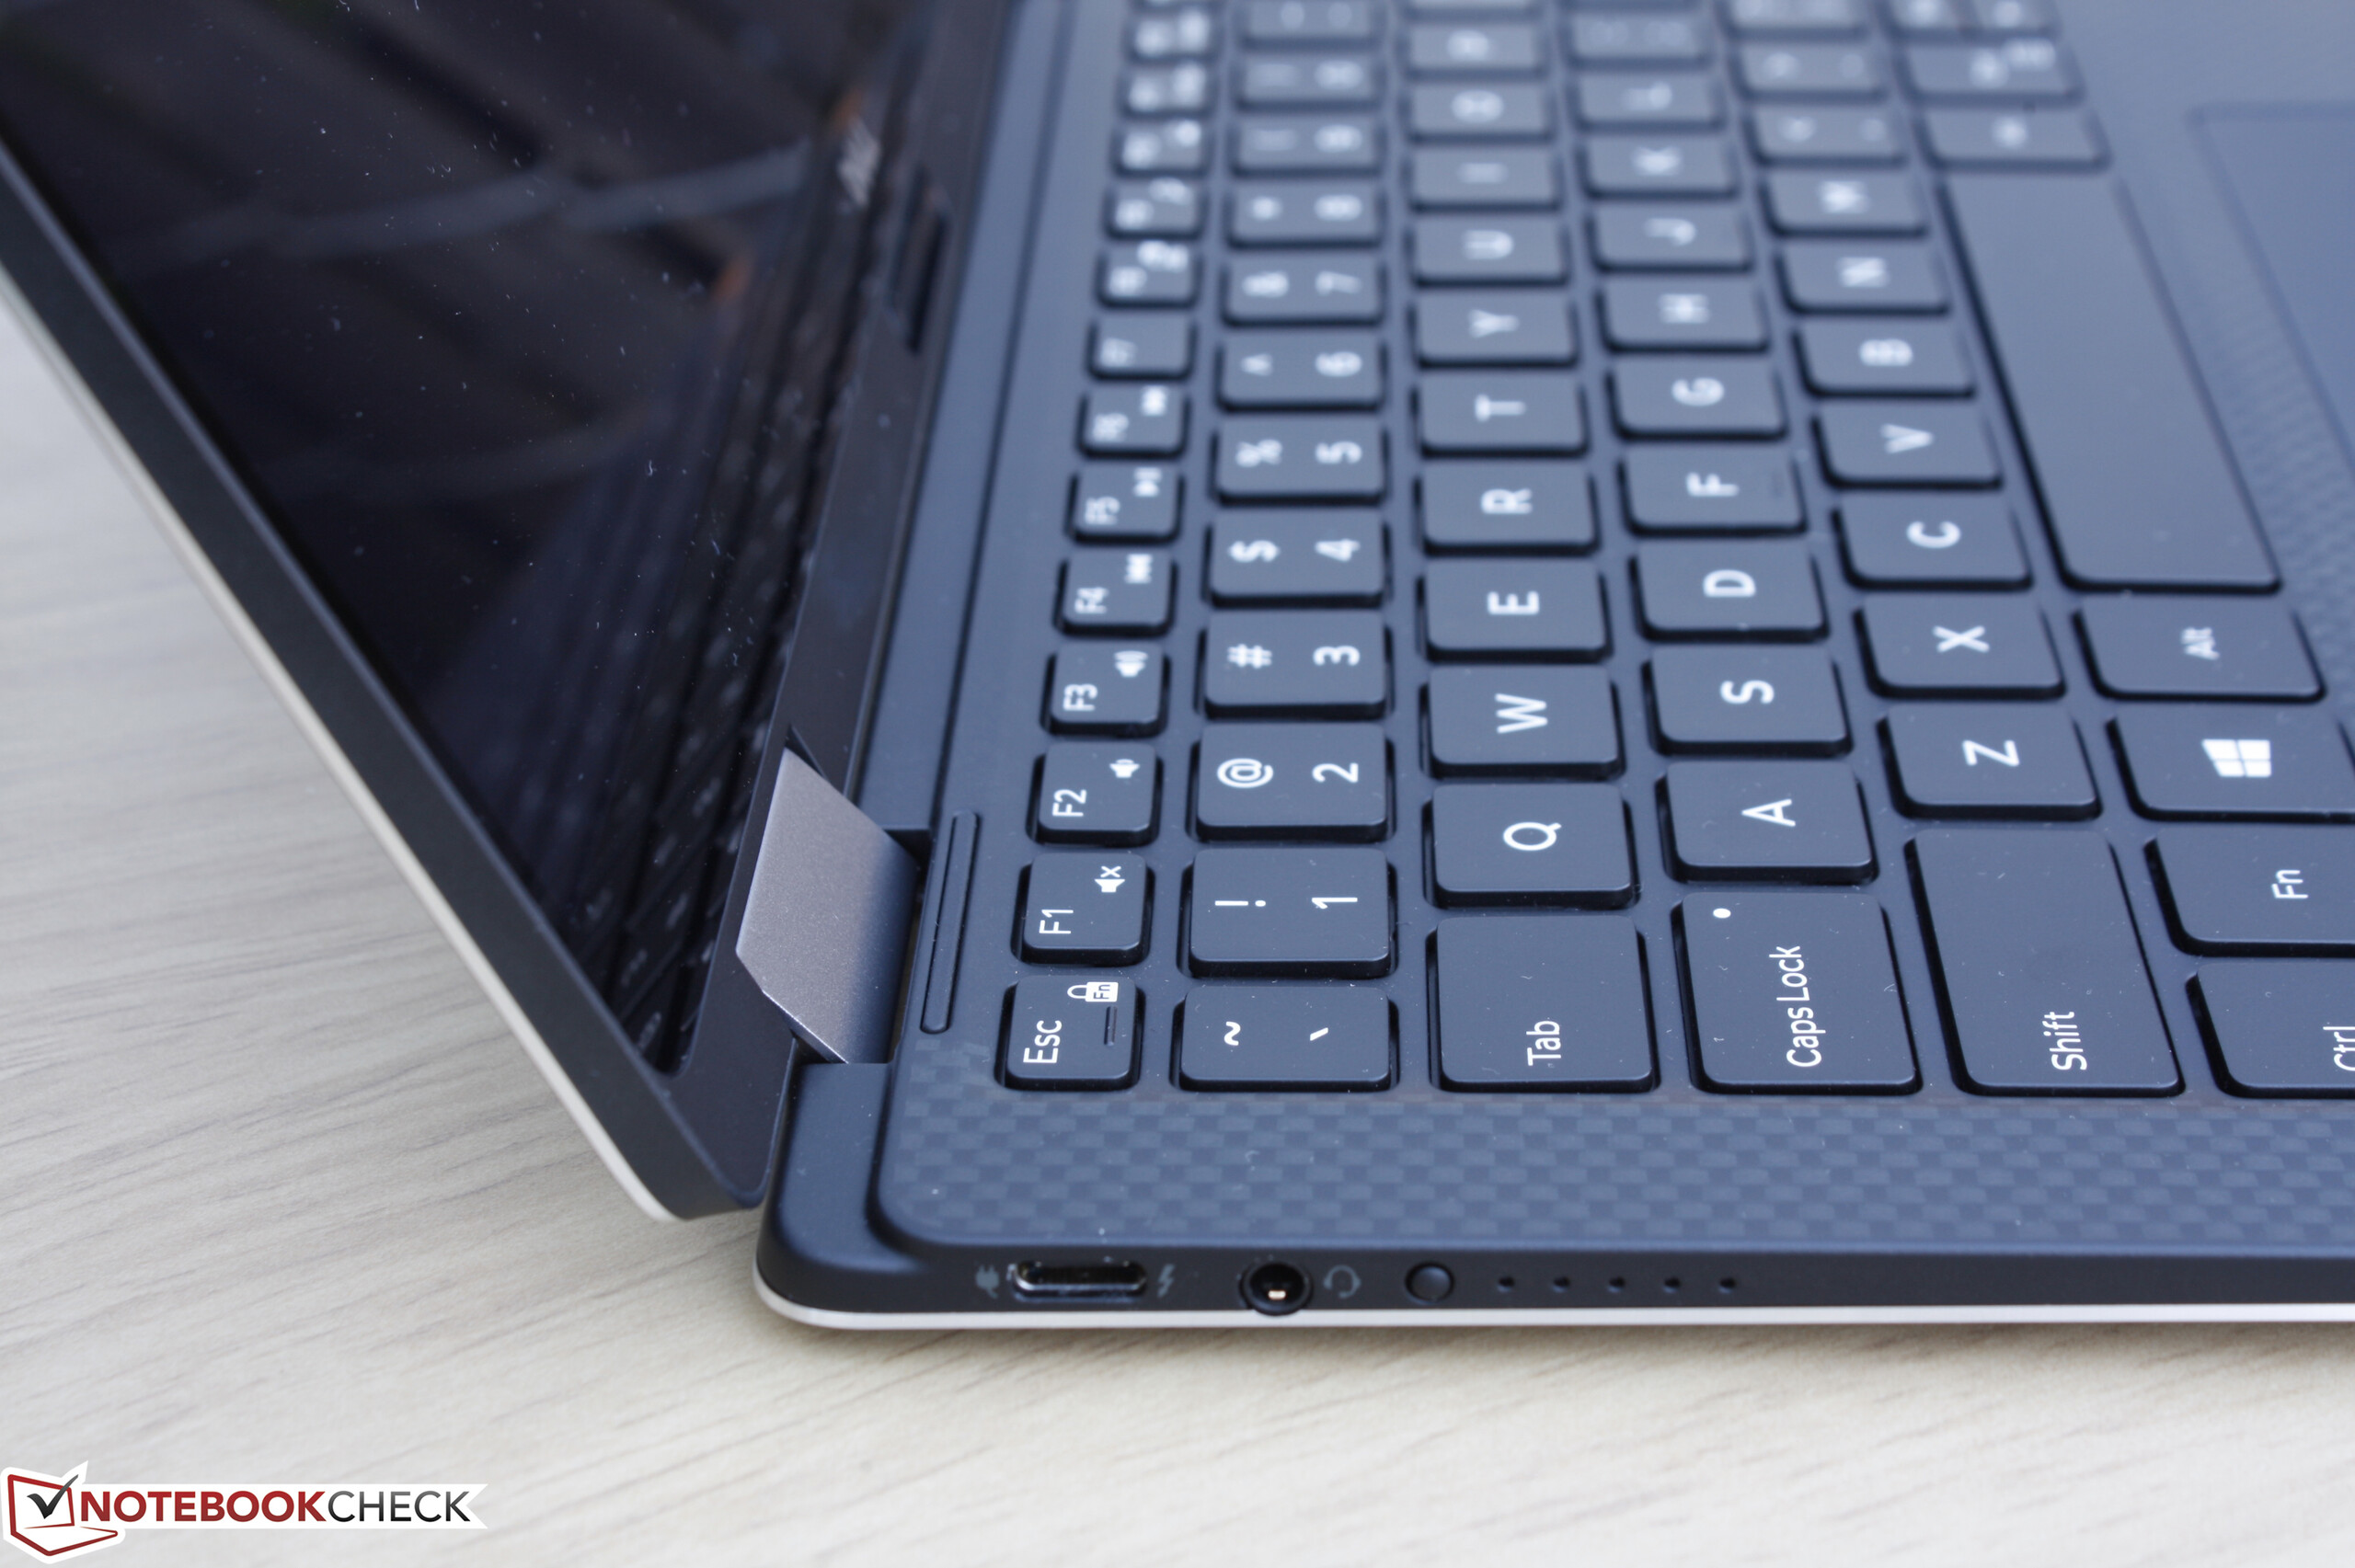
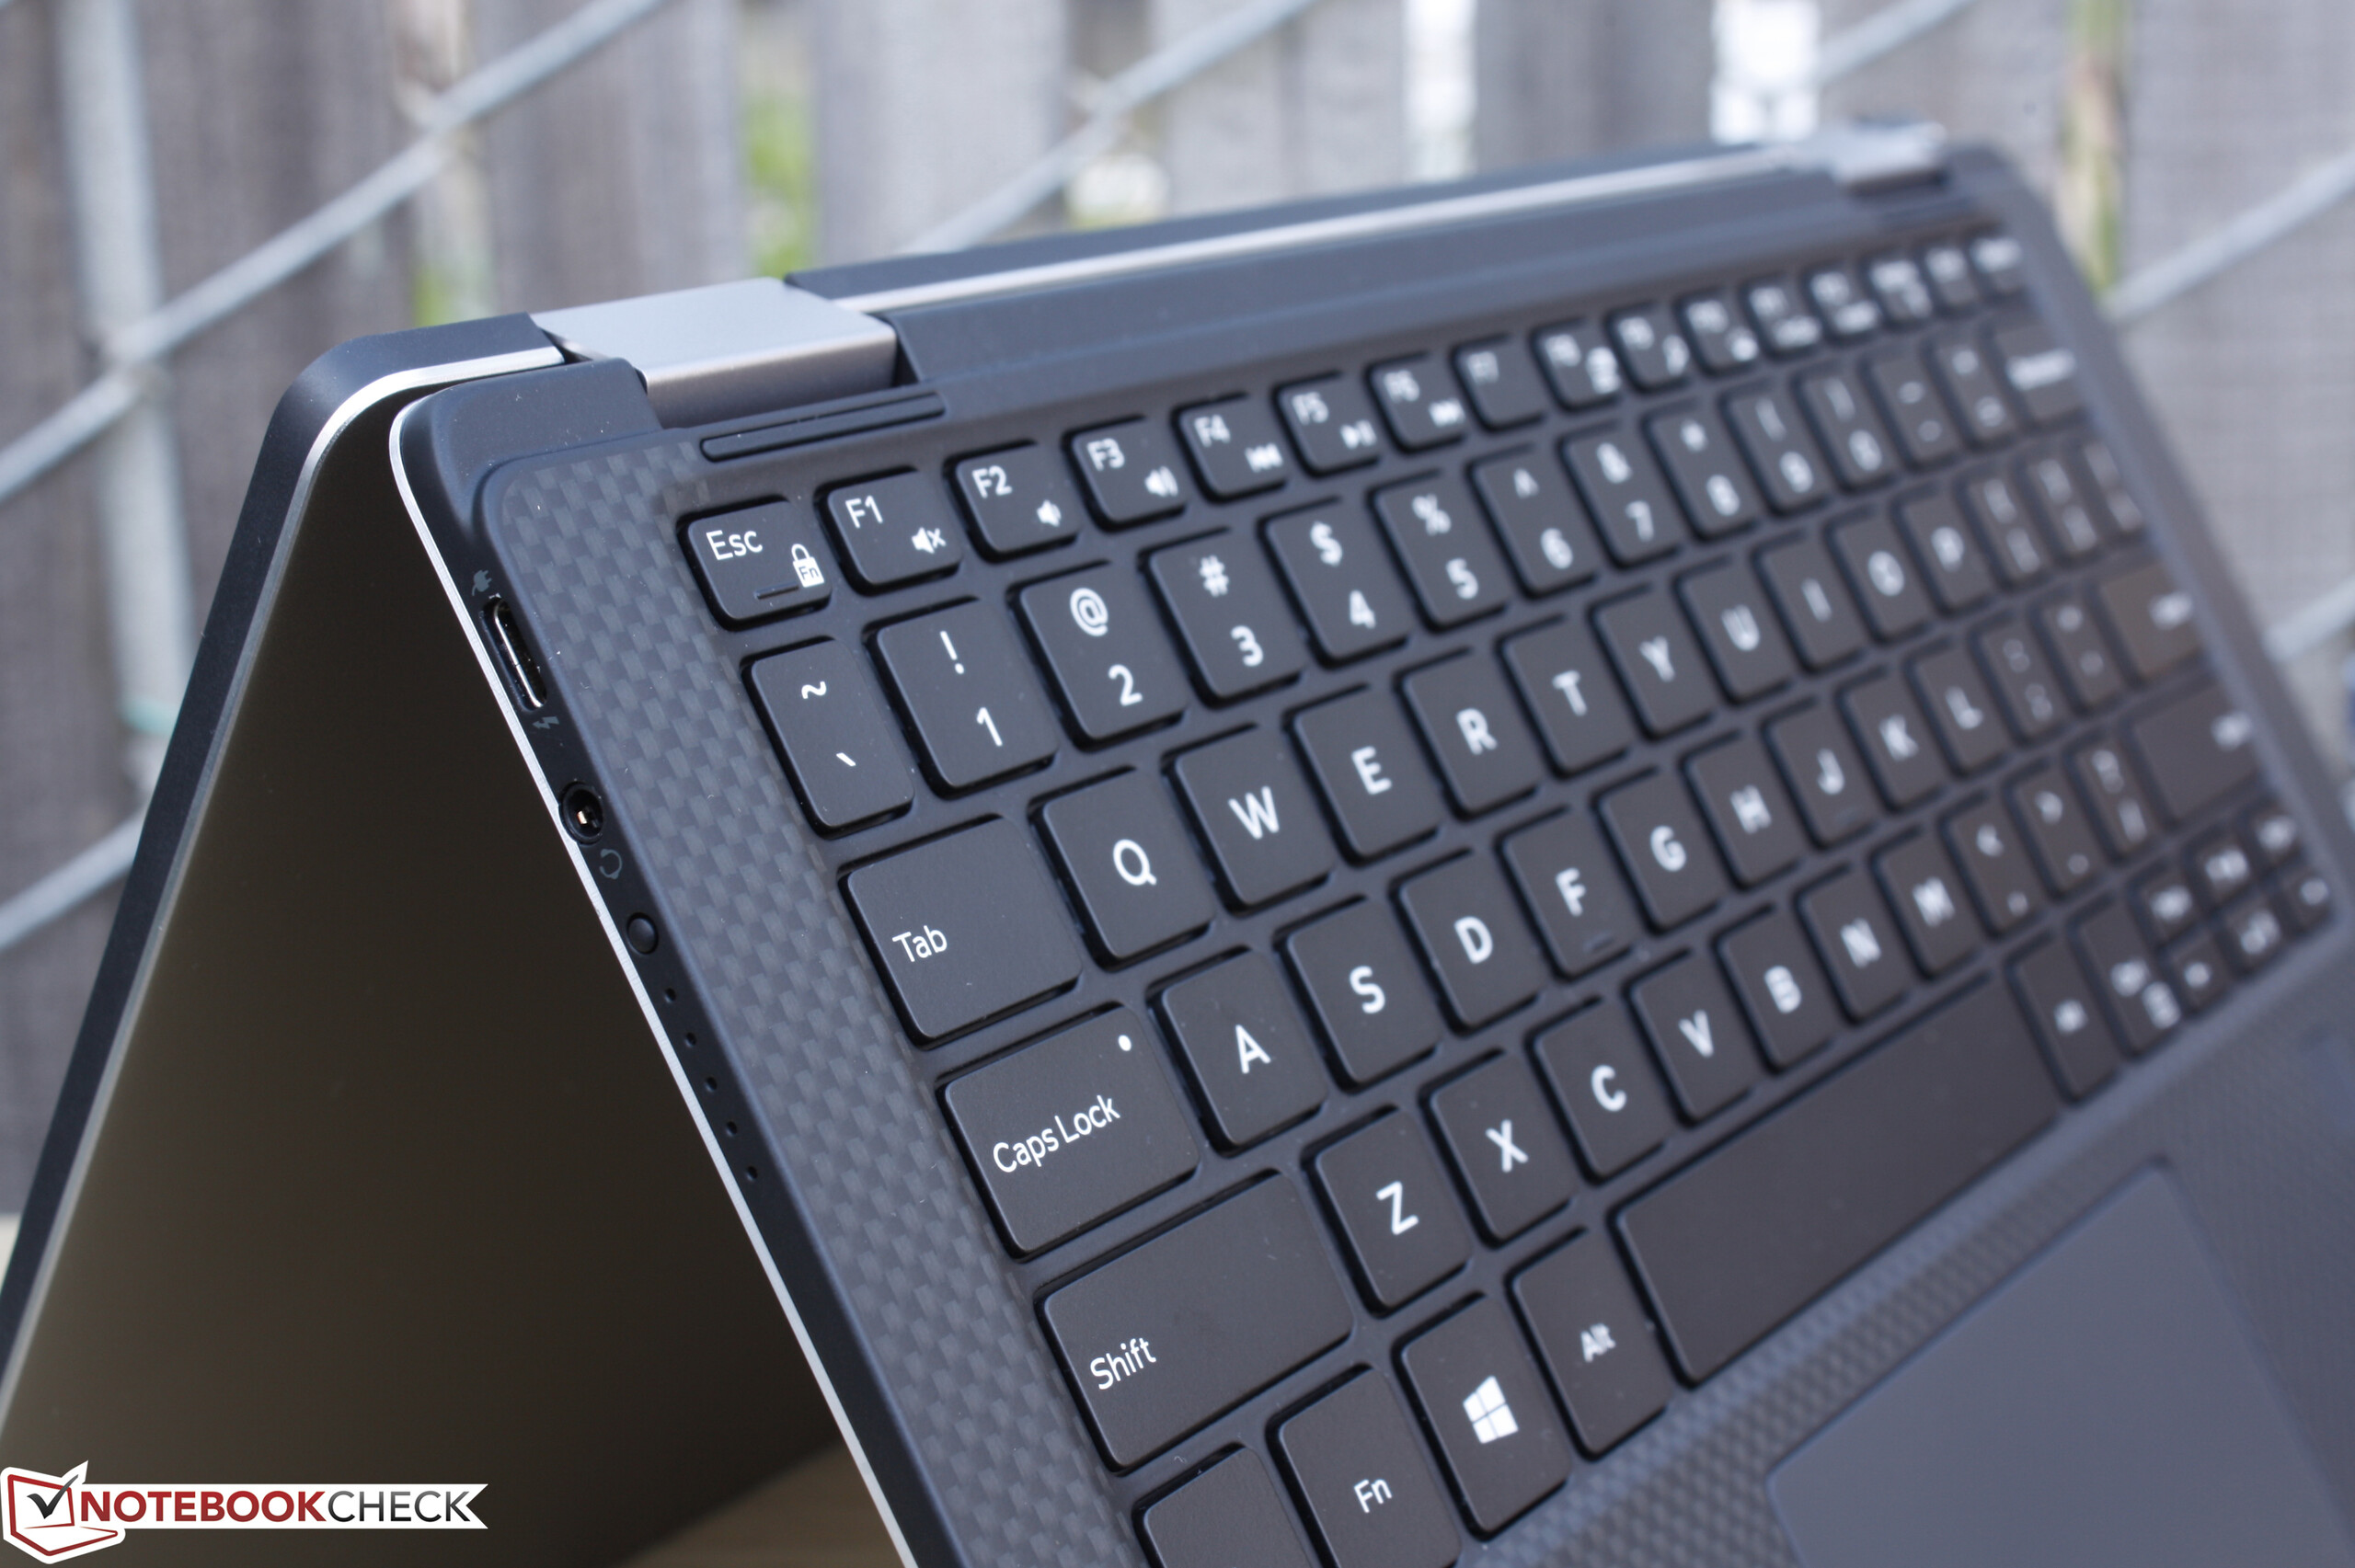
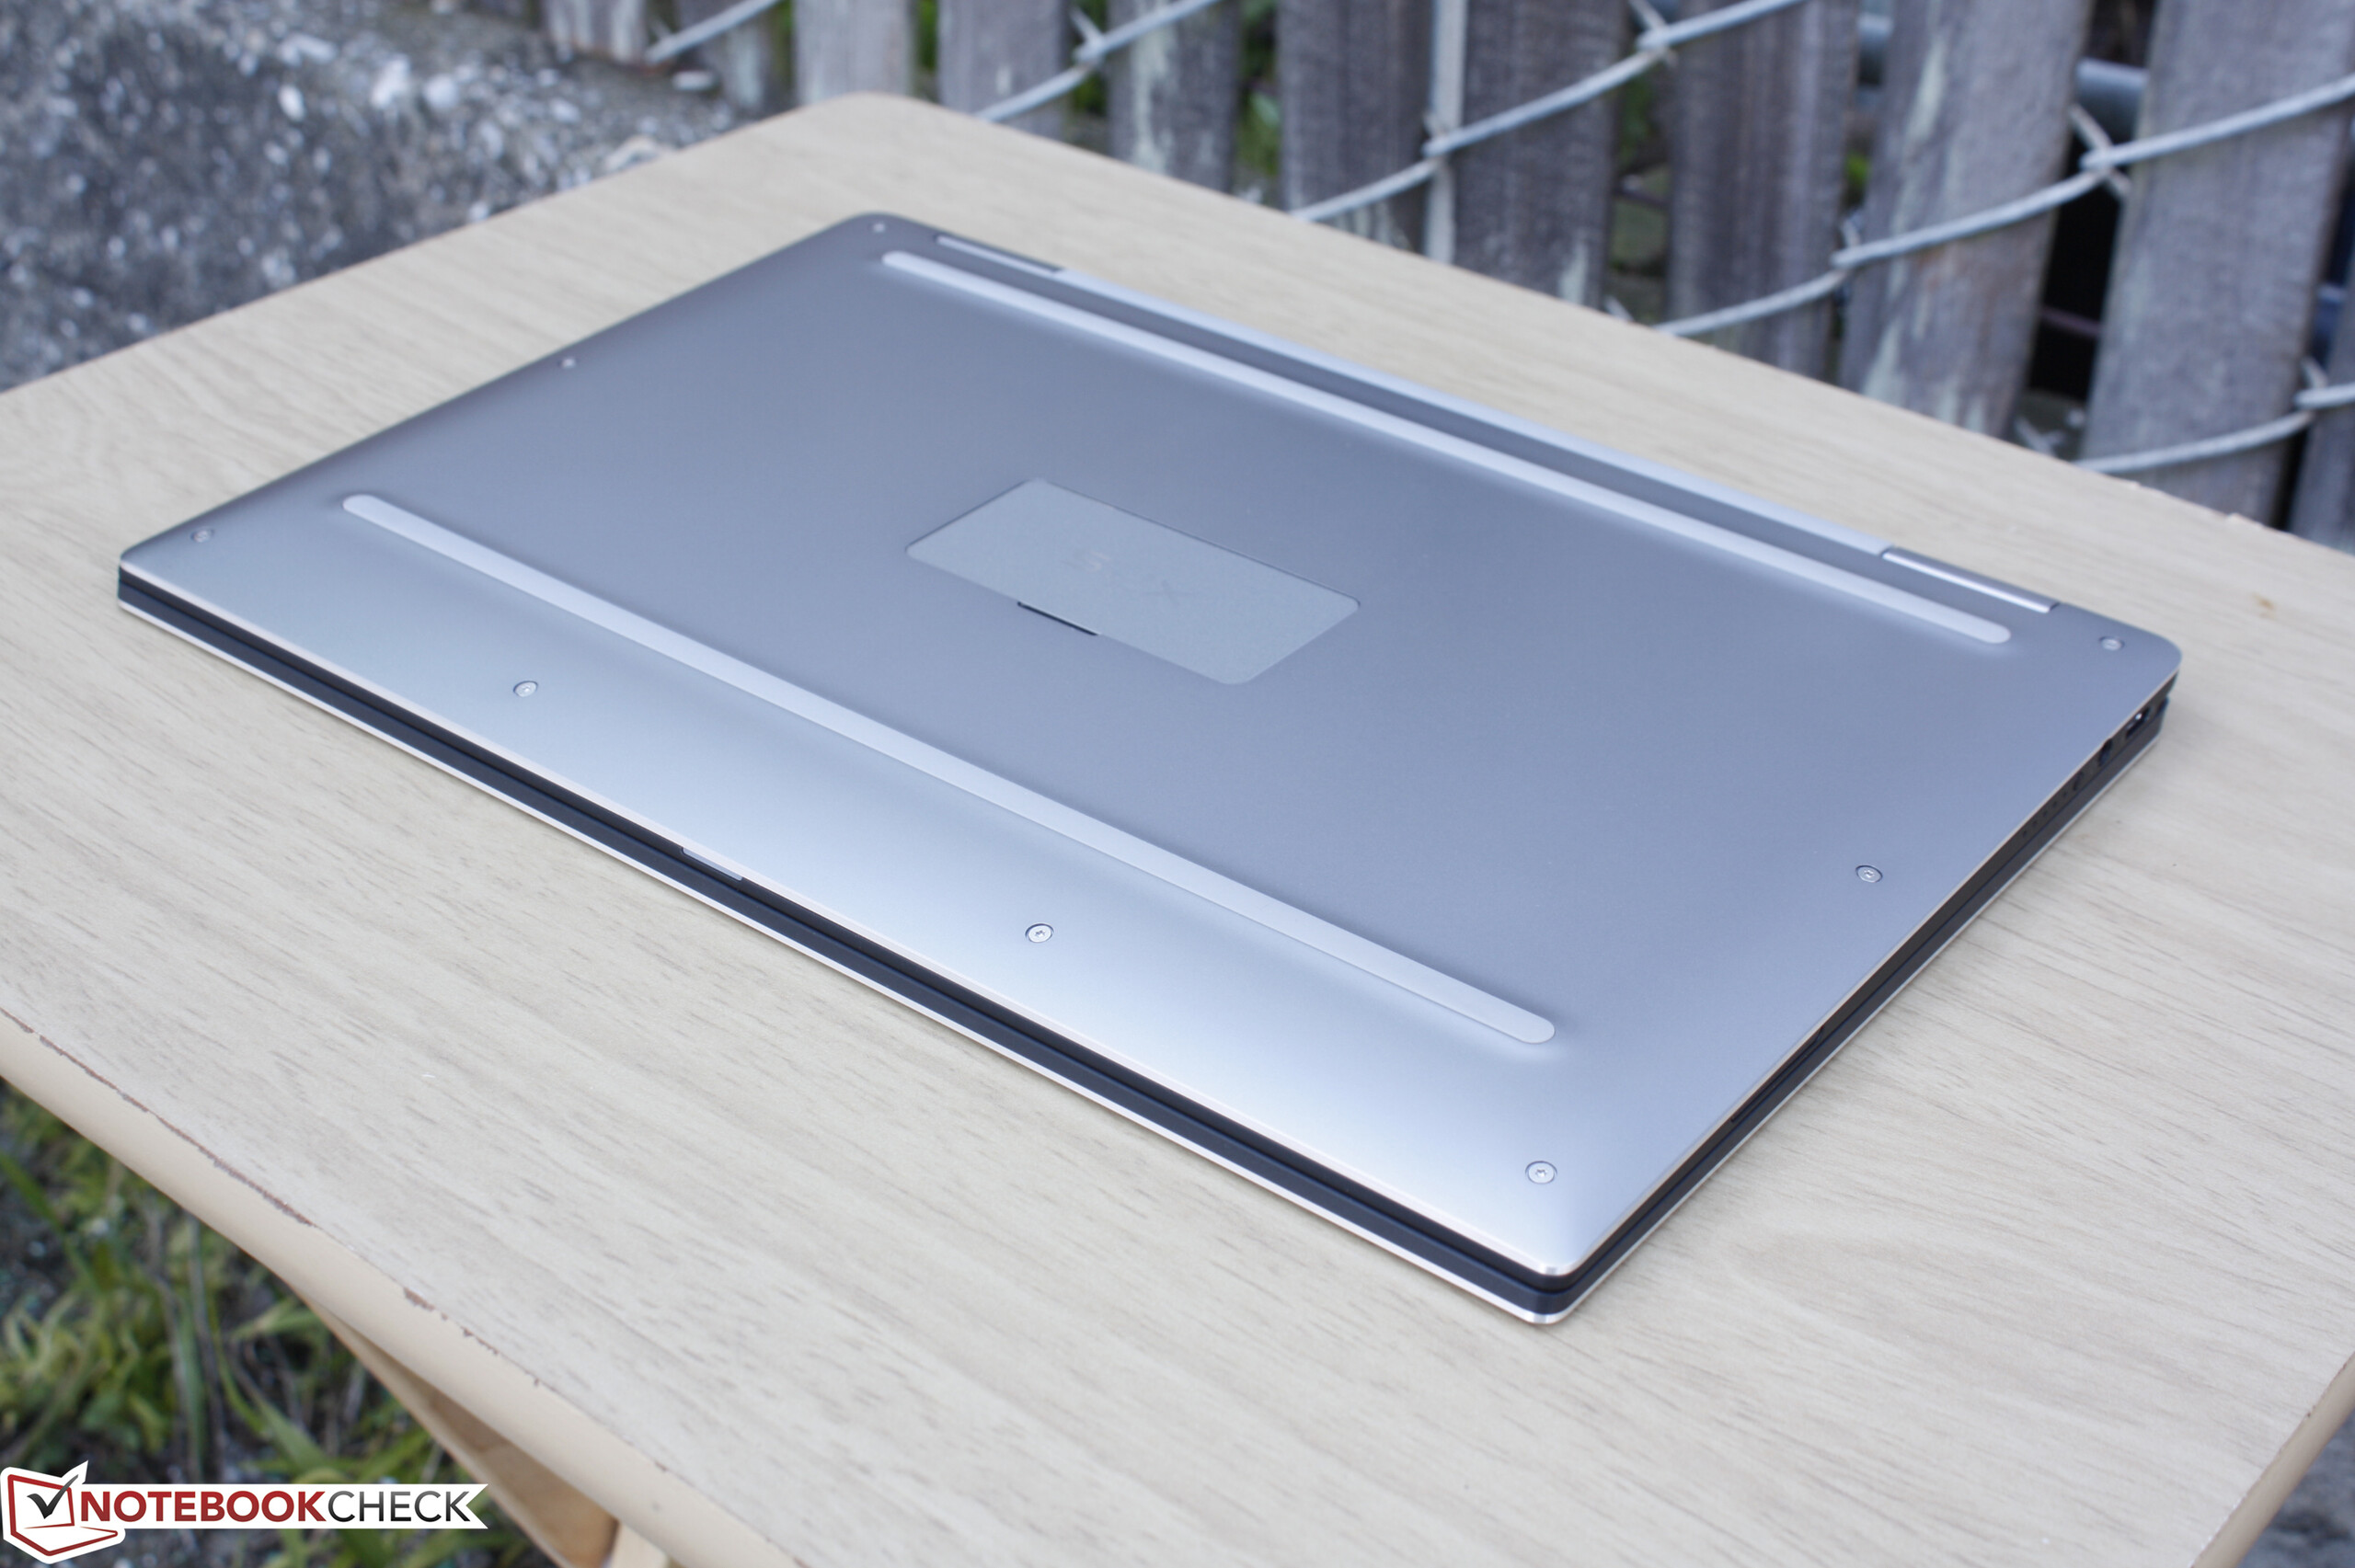
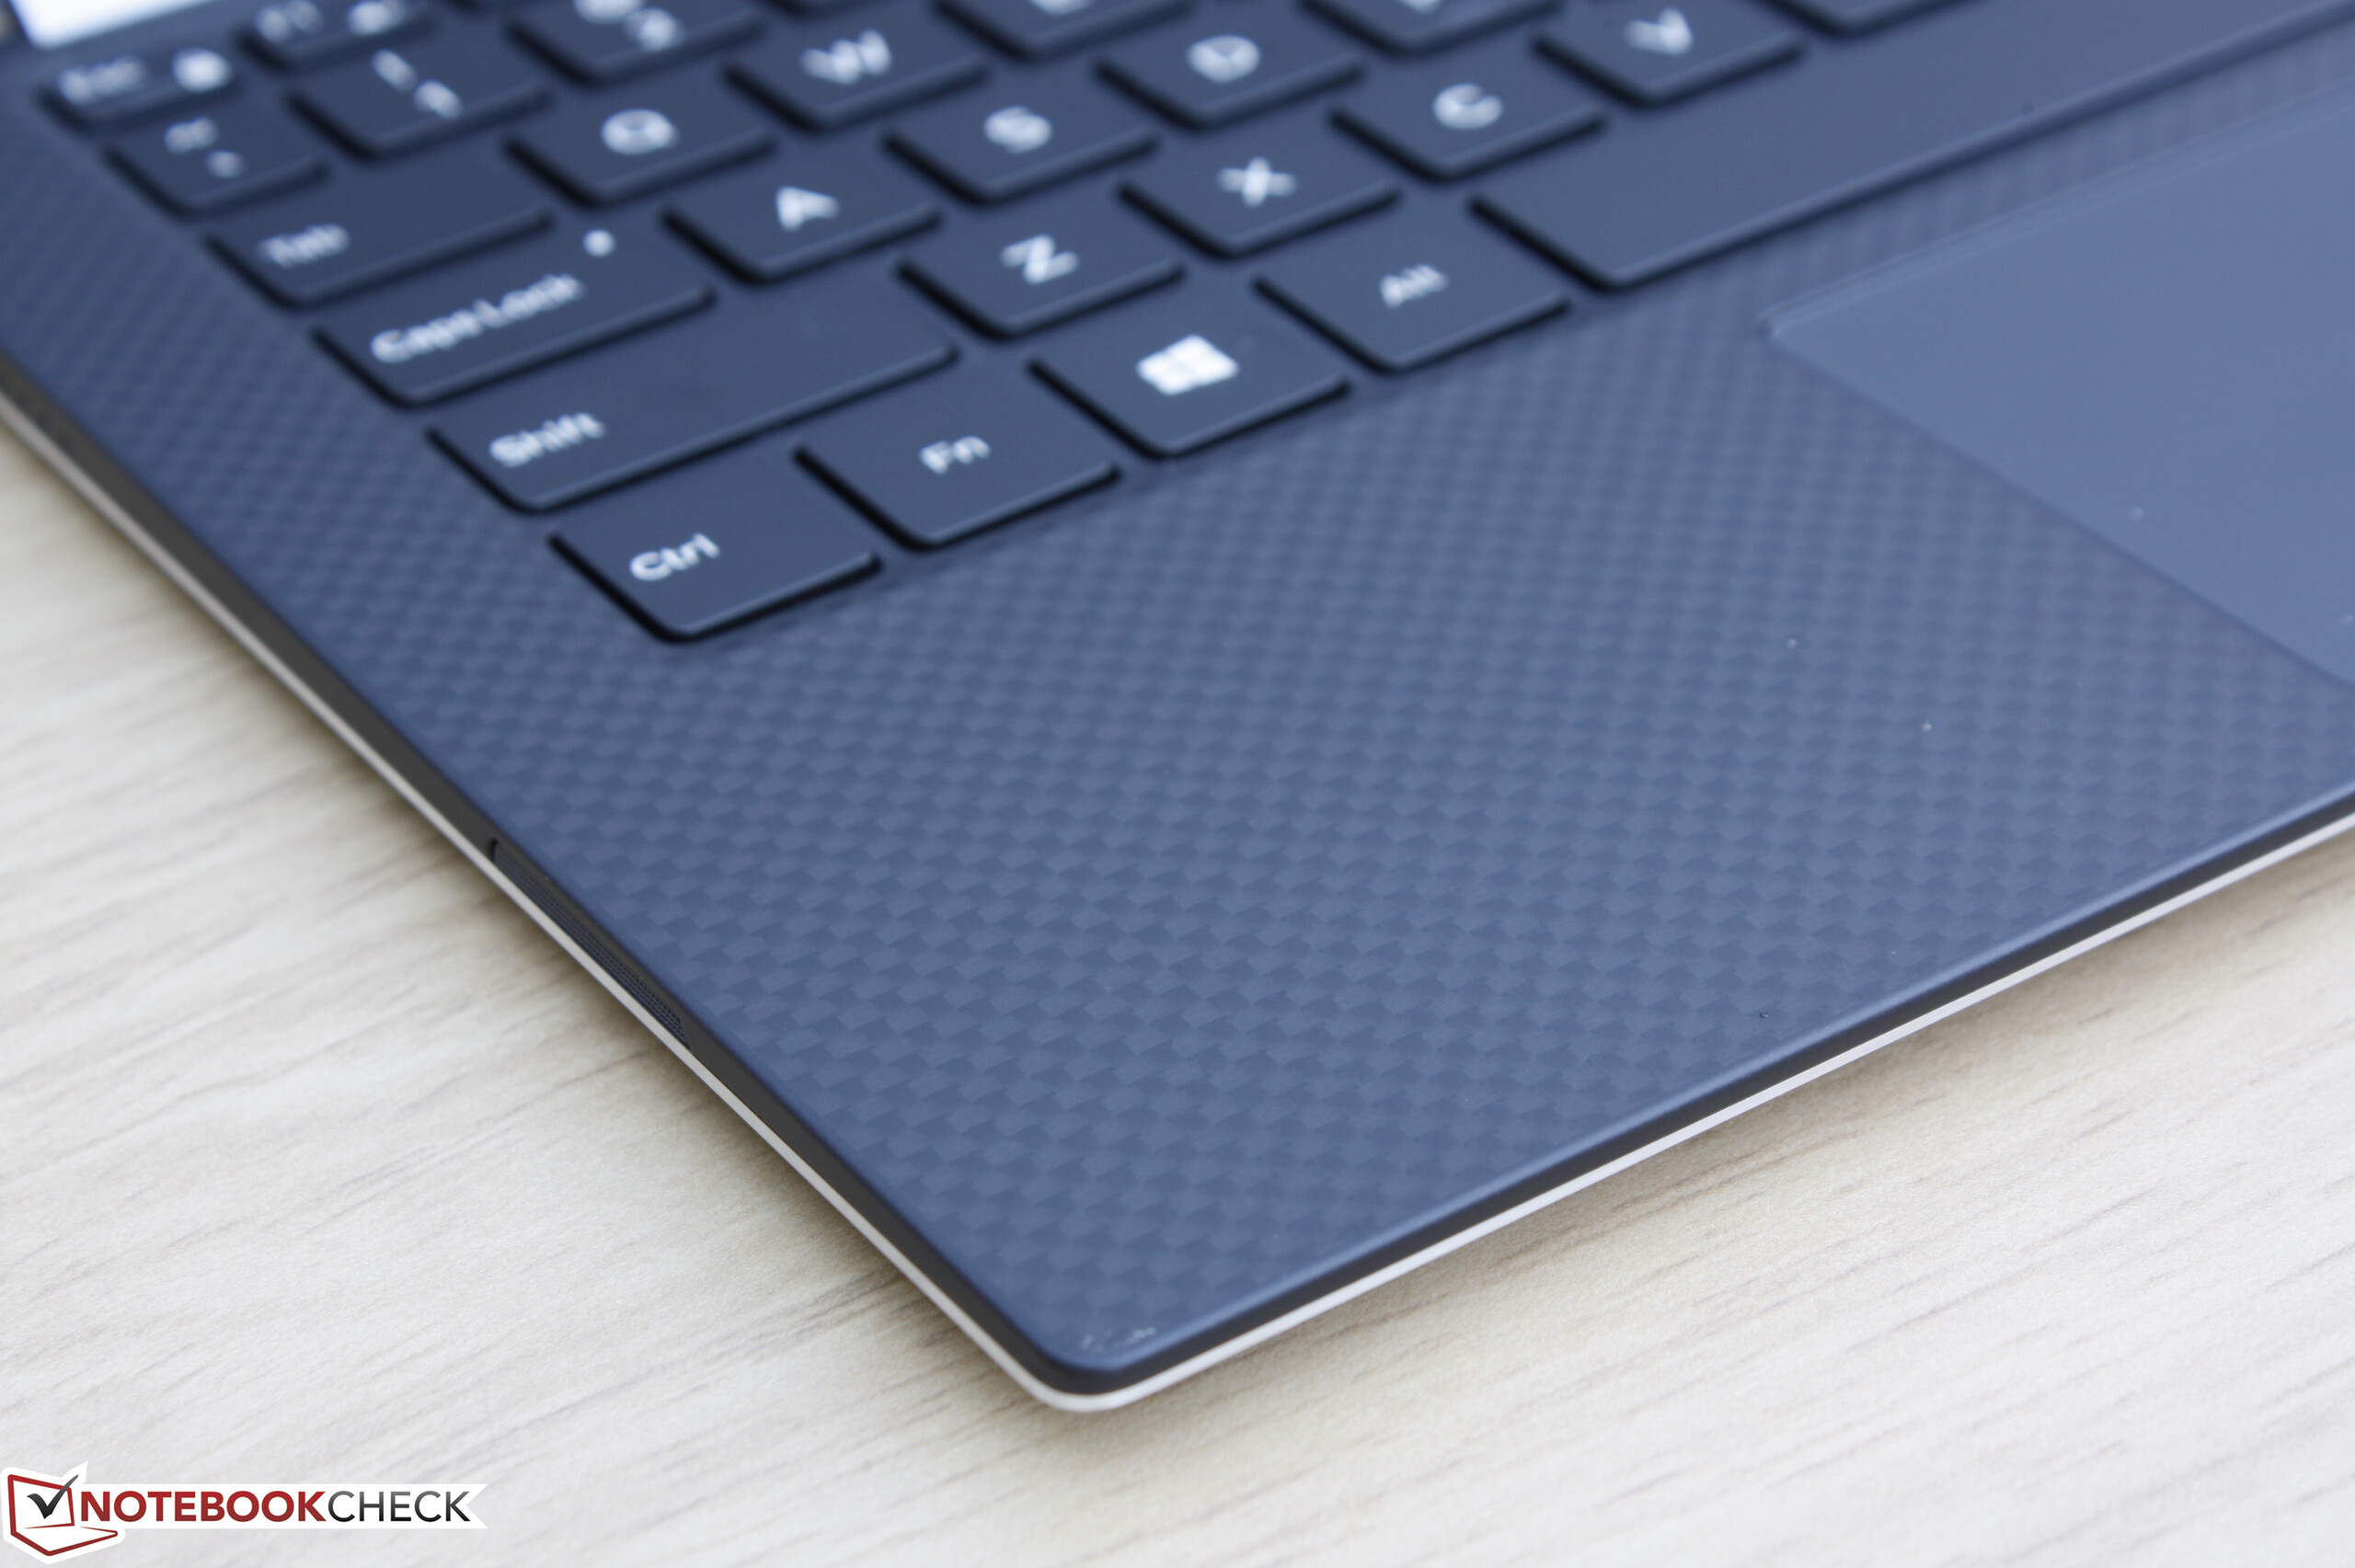
Oldukça benzer görünümünün dışında, standart XPS 13 modelini almak için bazı sebepler halen mevcut. Öncelikle orjinal XPS 13 birazcık daha kalın olmasına karşın daha ağır değil ve daha hoş bir deneyim sunuyor. USB Type-A bağlantısı var ve daha hızlı SD kart oyucusu mevcut. Son olarak klavye deneyimi daha iyi ve Lenovo cihazlardaki ile benzer.
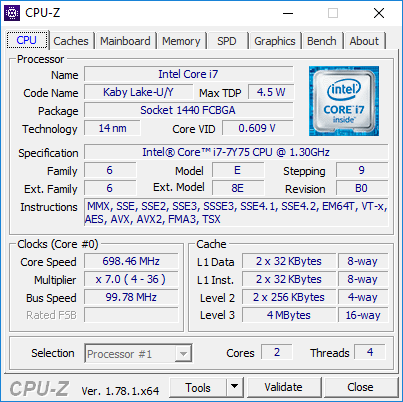
İşlemci performansını da göz ardı etmemek gerekir. Giriş seviyesi XPS 13 modellerindeki işlemciler bile en üst XPS 13 2si1 arada modelindeki işlemcilerden %25 daha hızlı. Sadece internette gezinirken veya ofis işlemleriyle ilgilenirken çok belirgin olmasa da, ek programlar kullanılmaya başlandığında bu fark kendini belli ediyor.
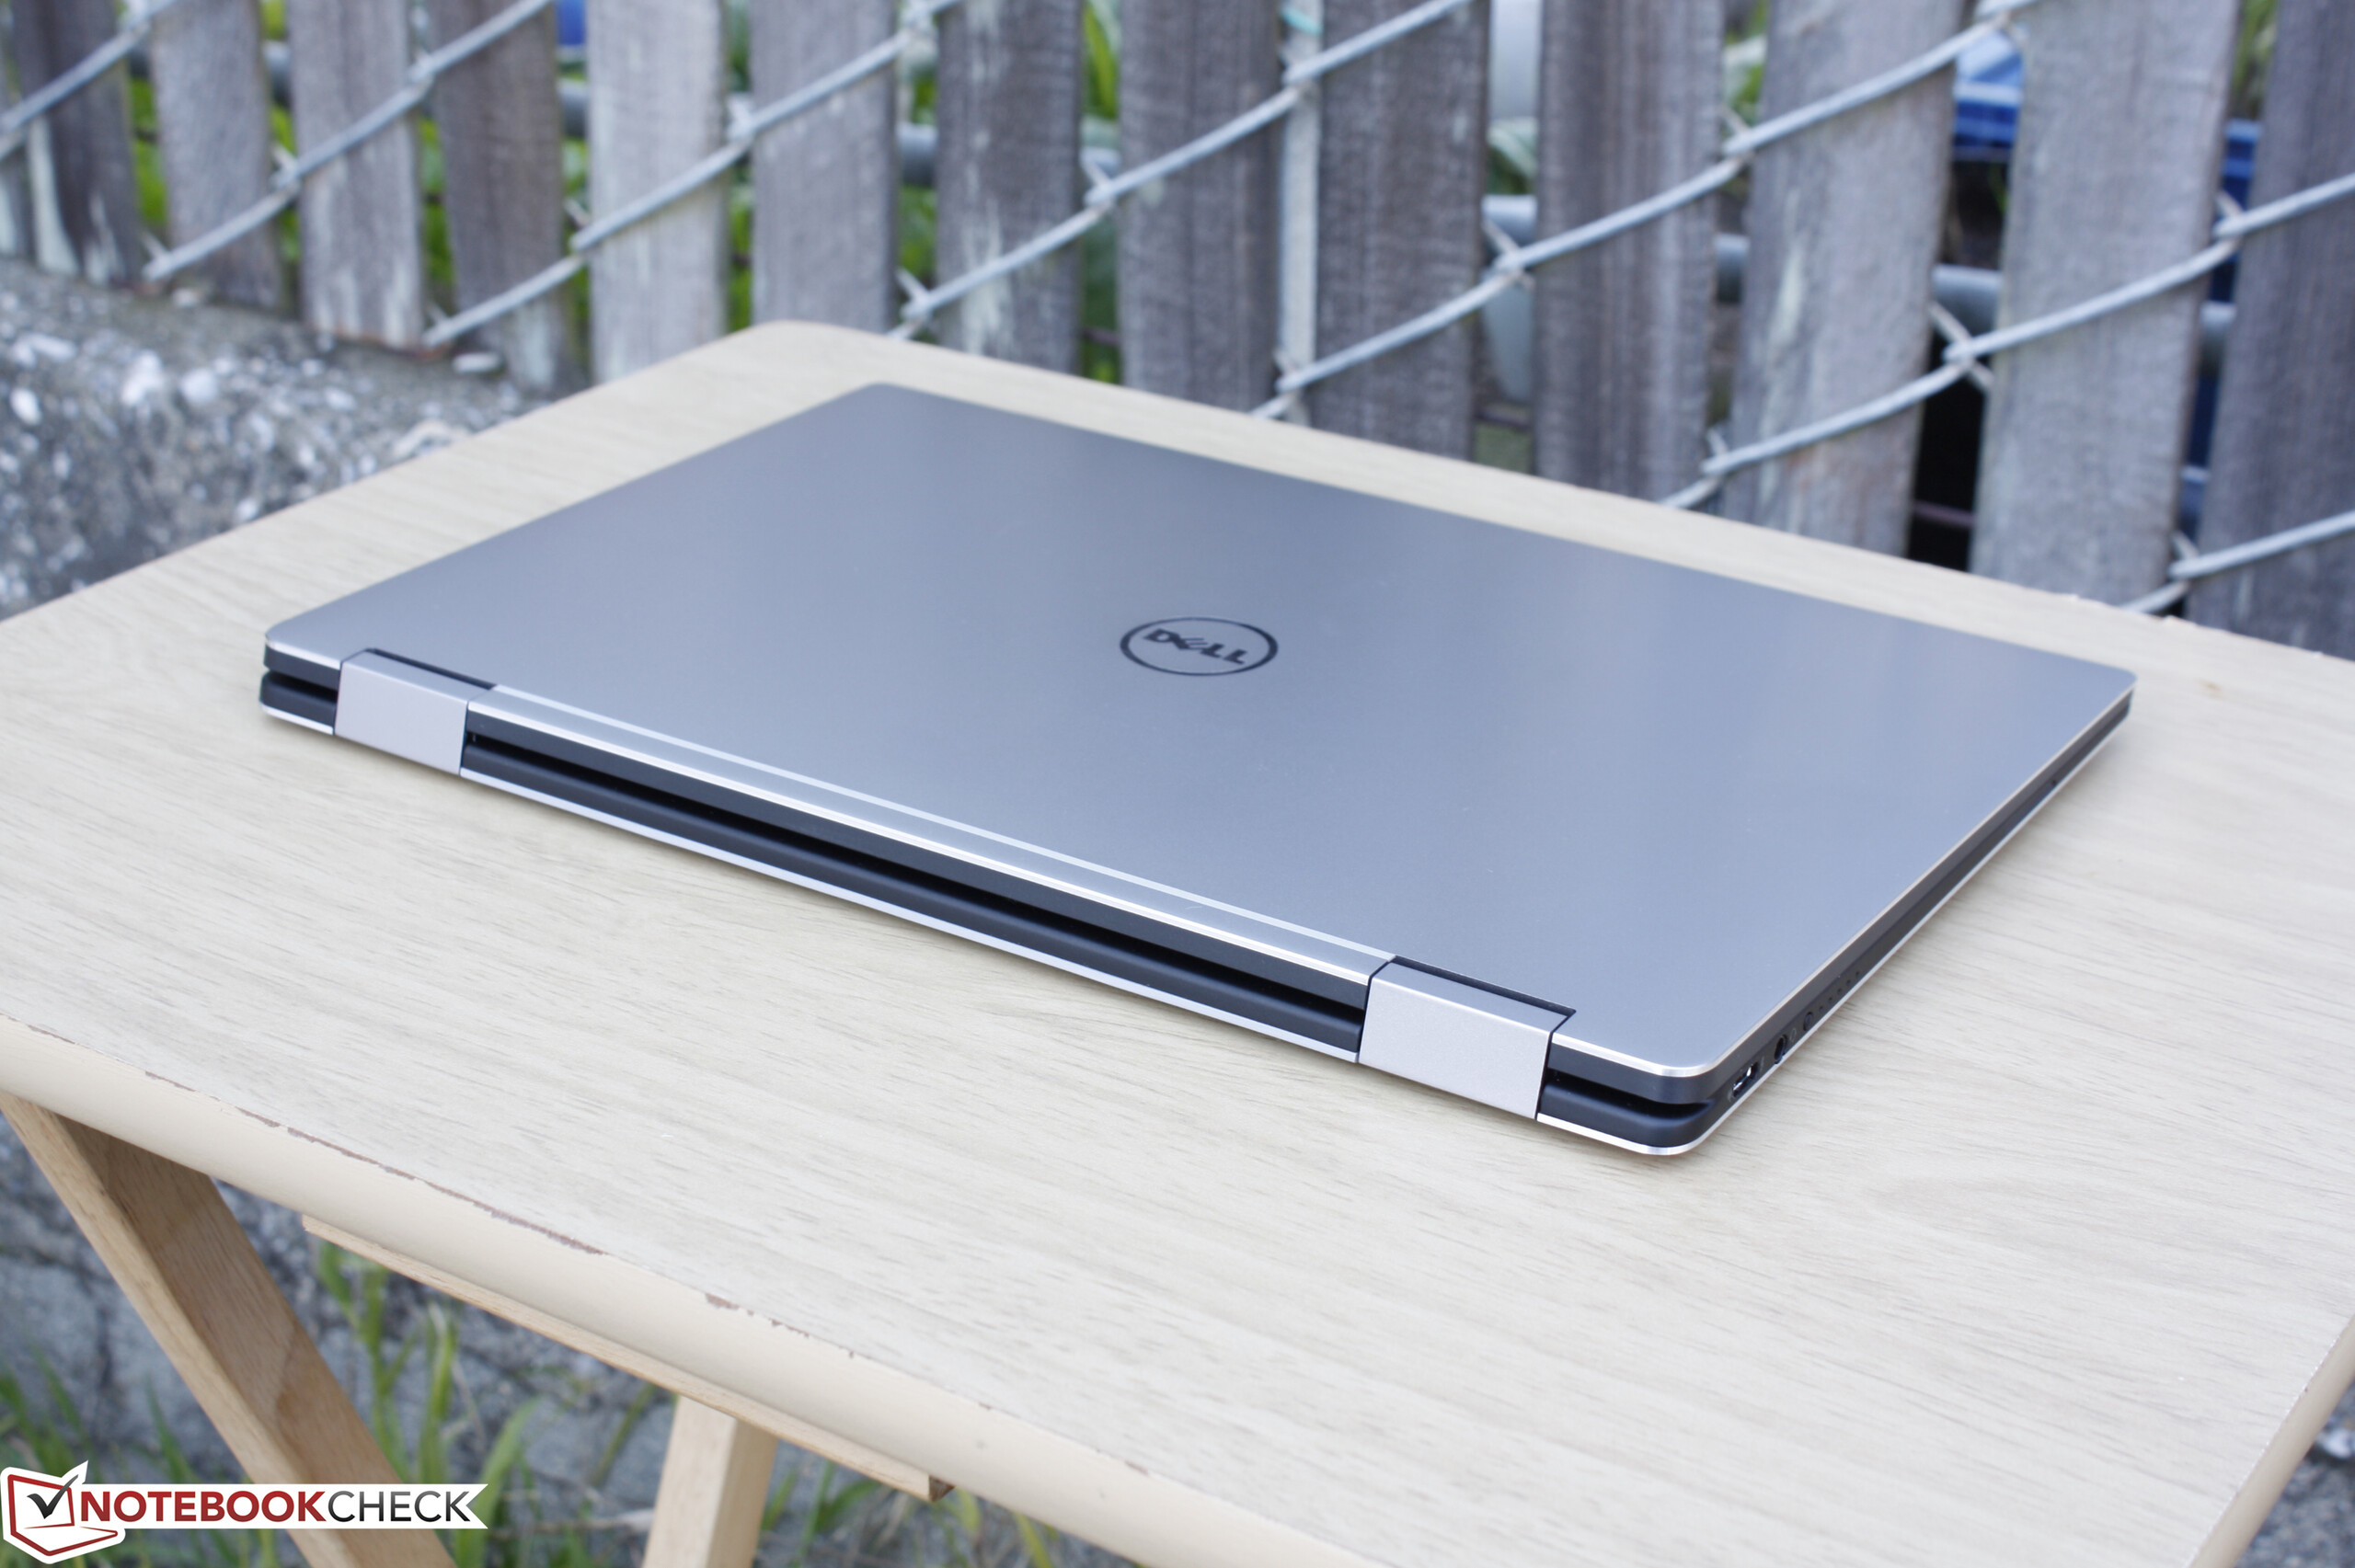
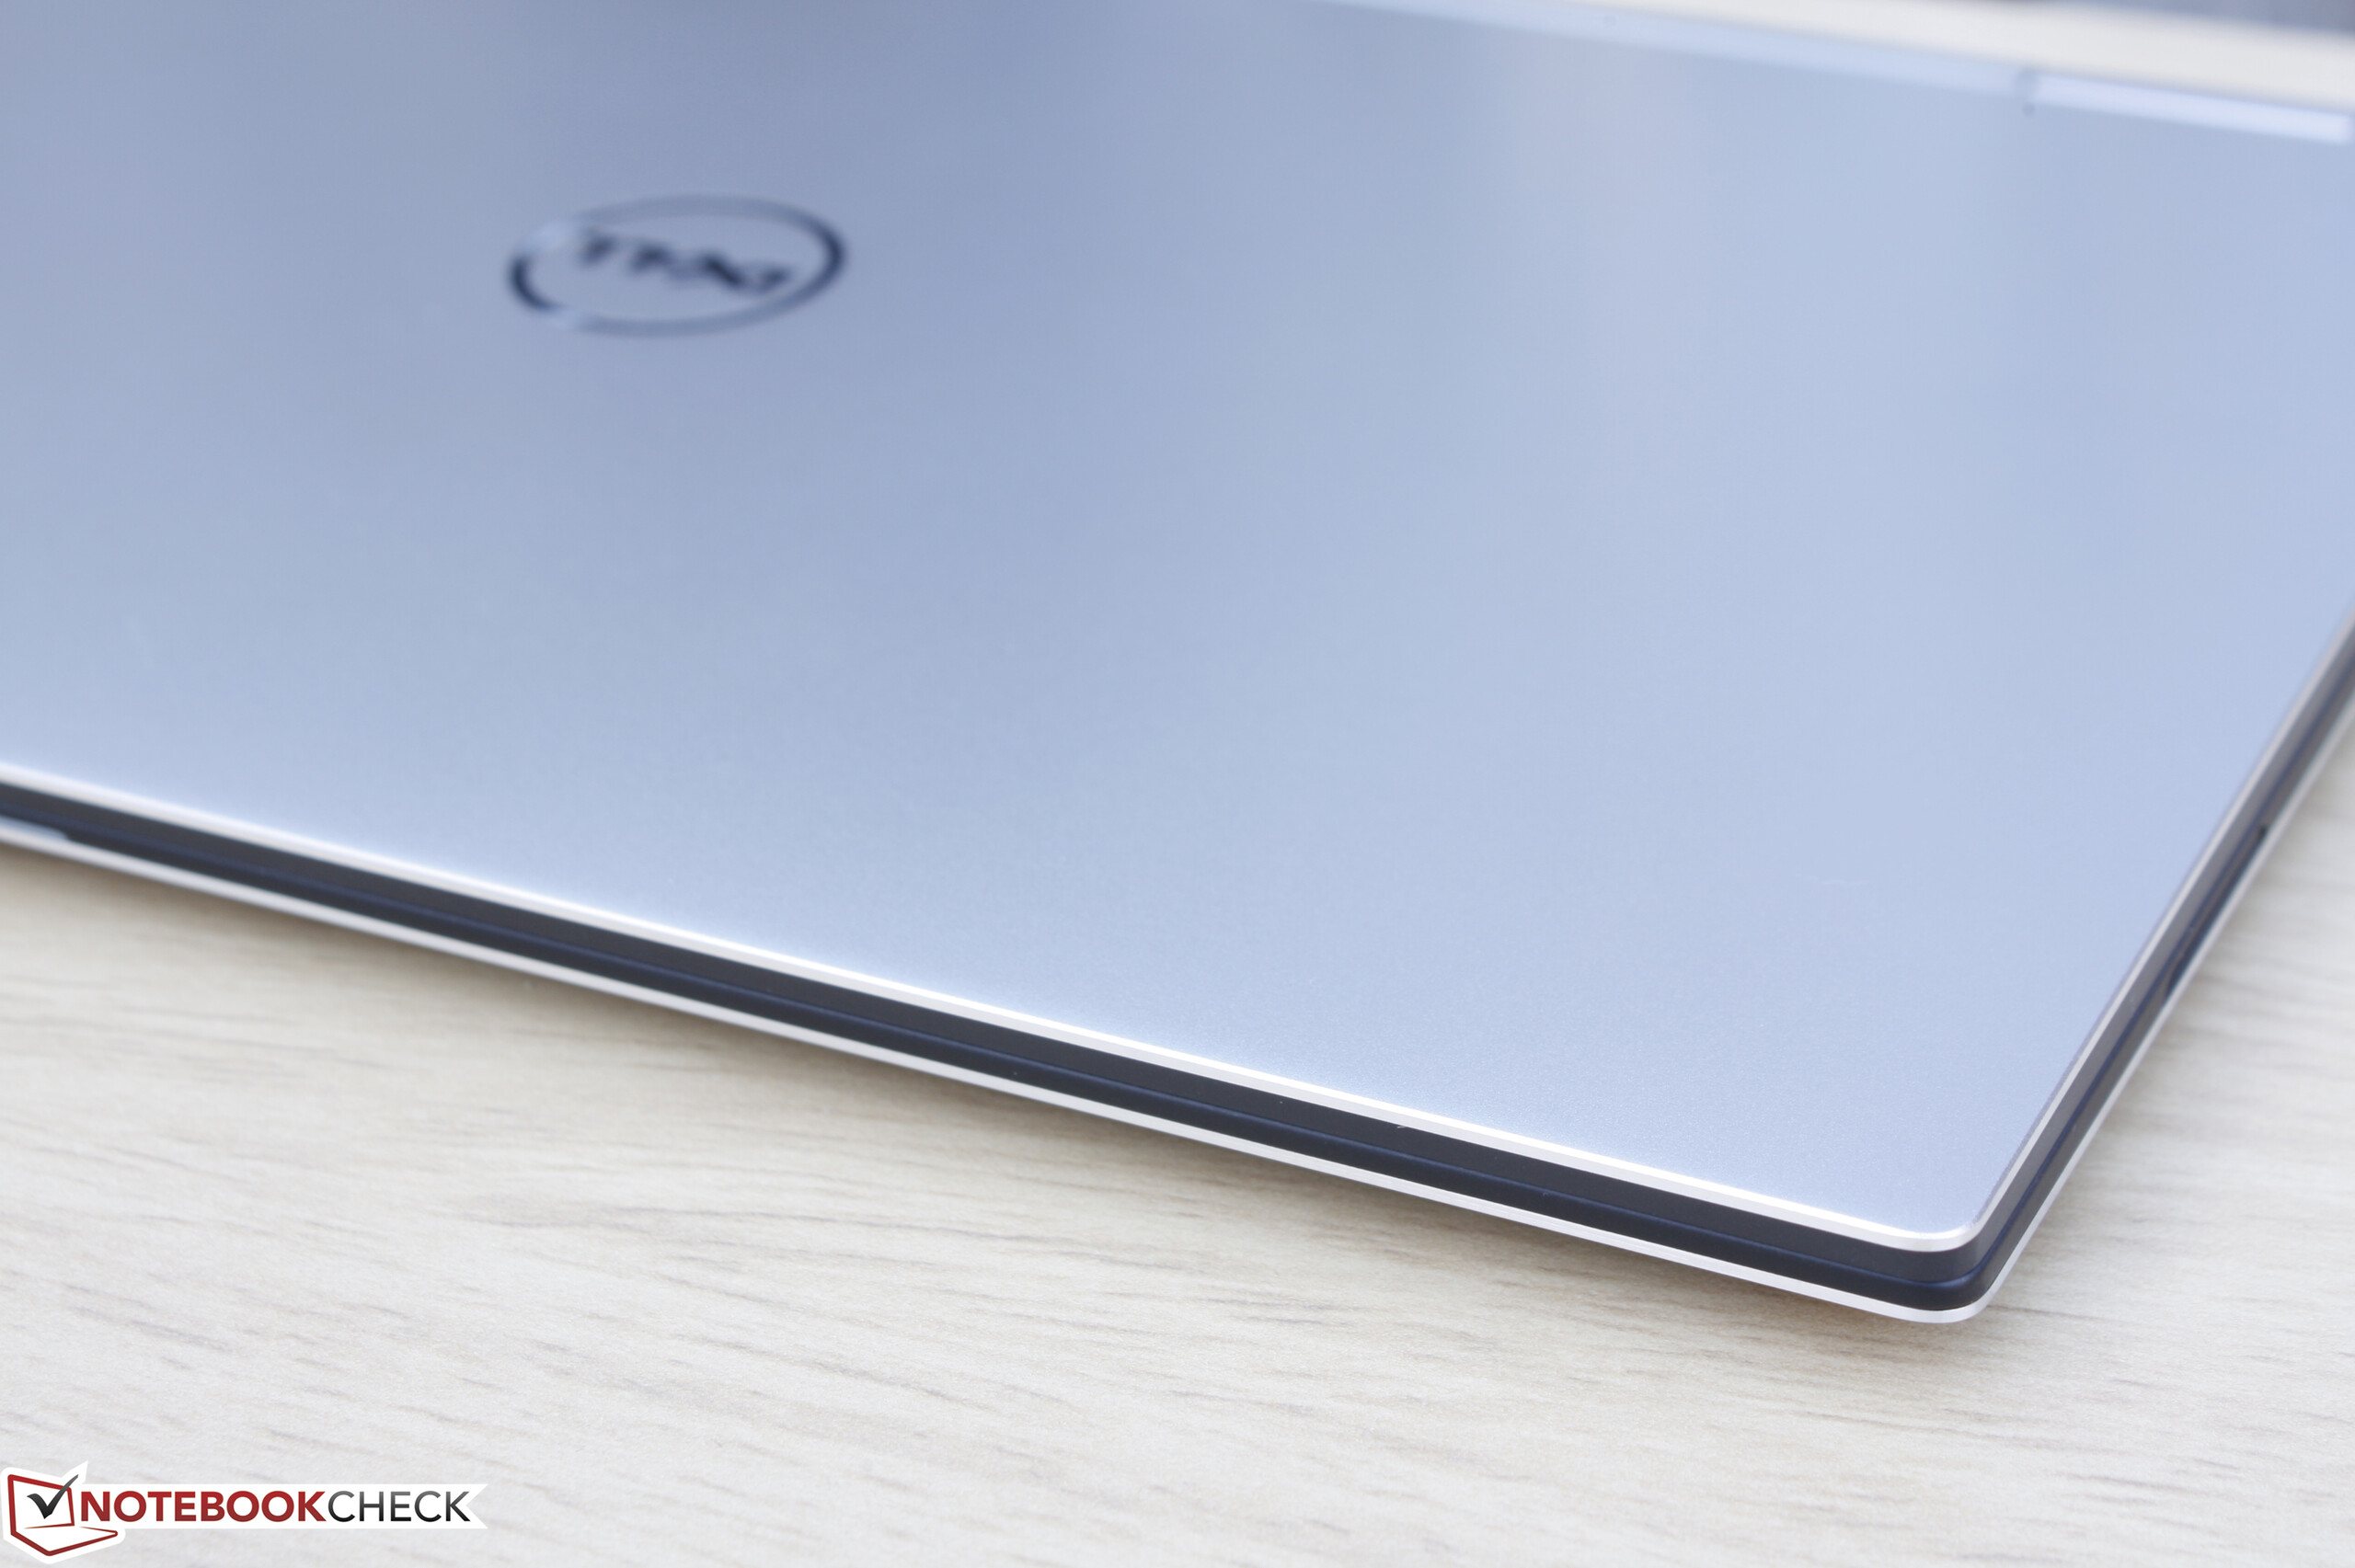
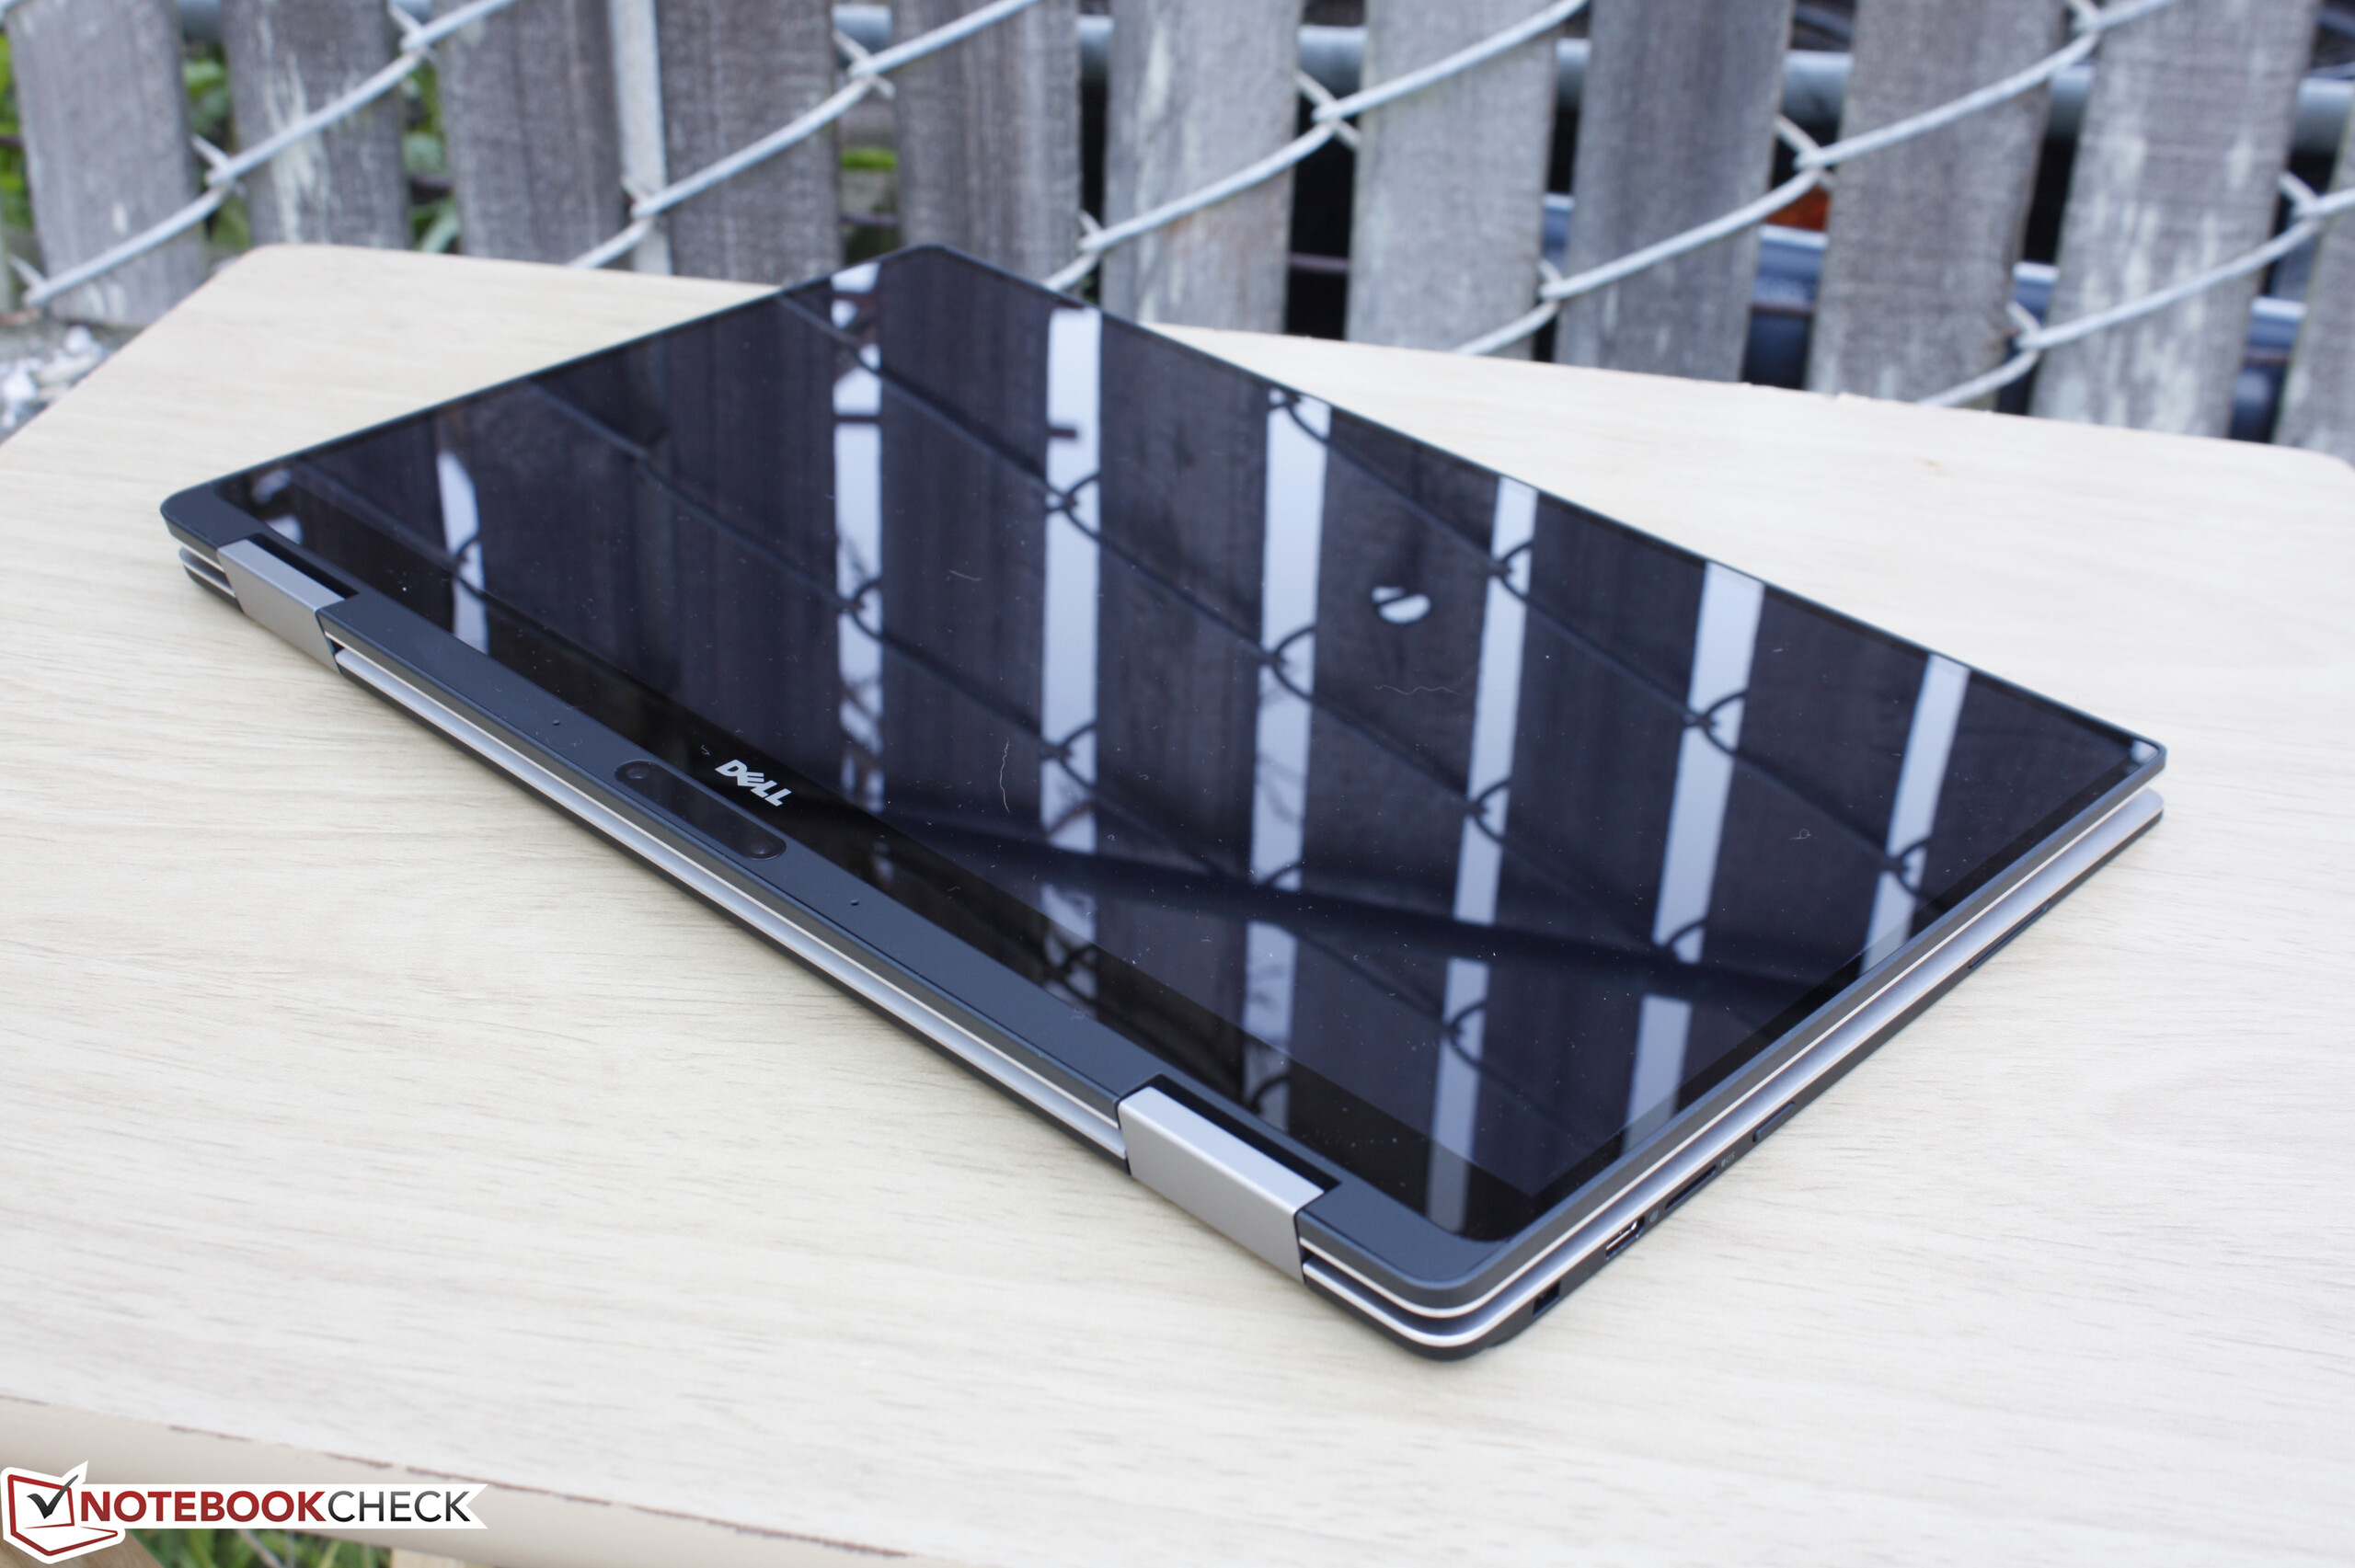
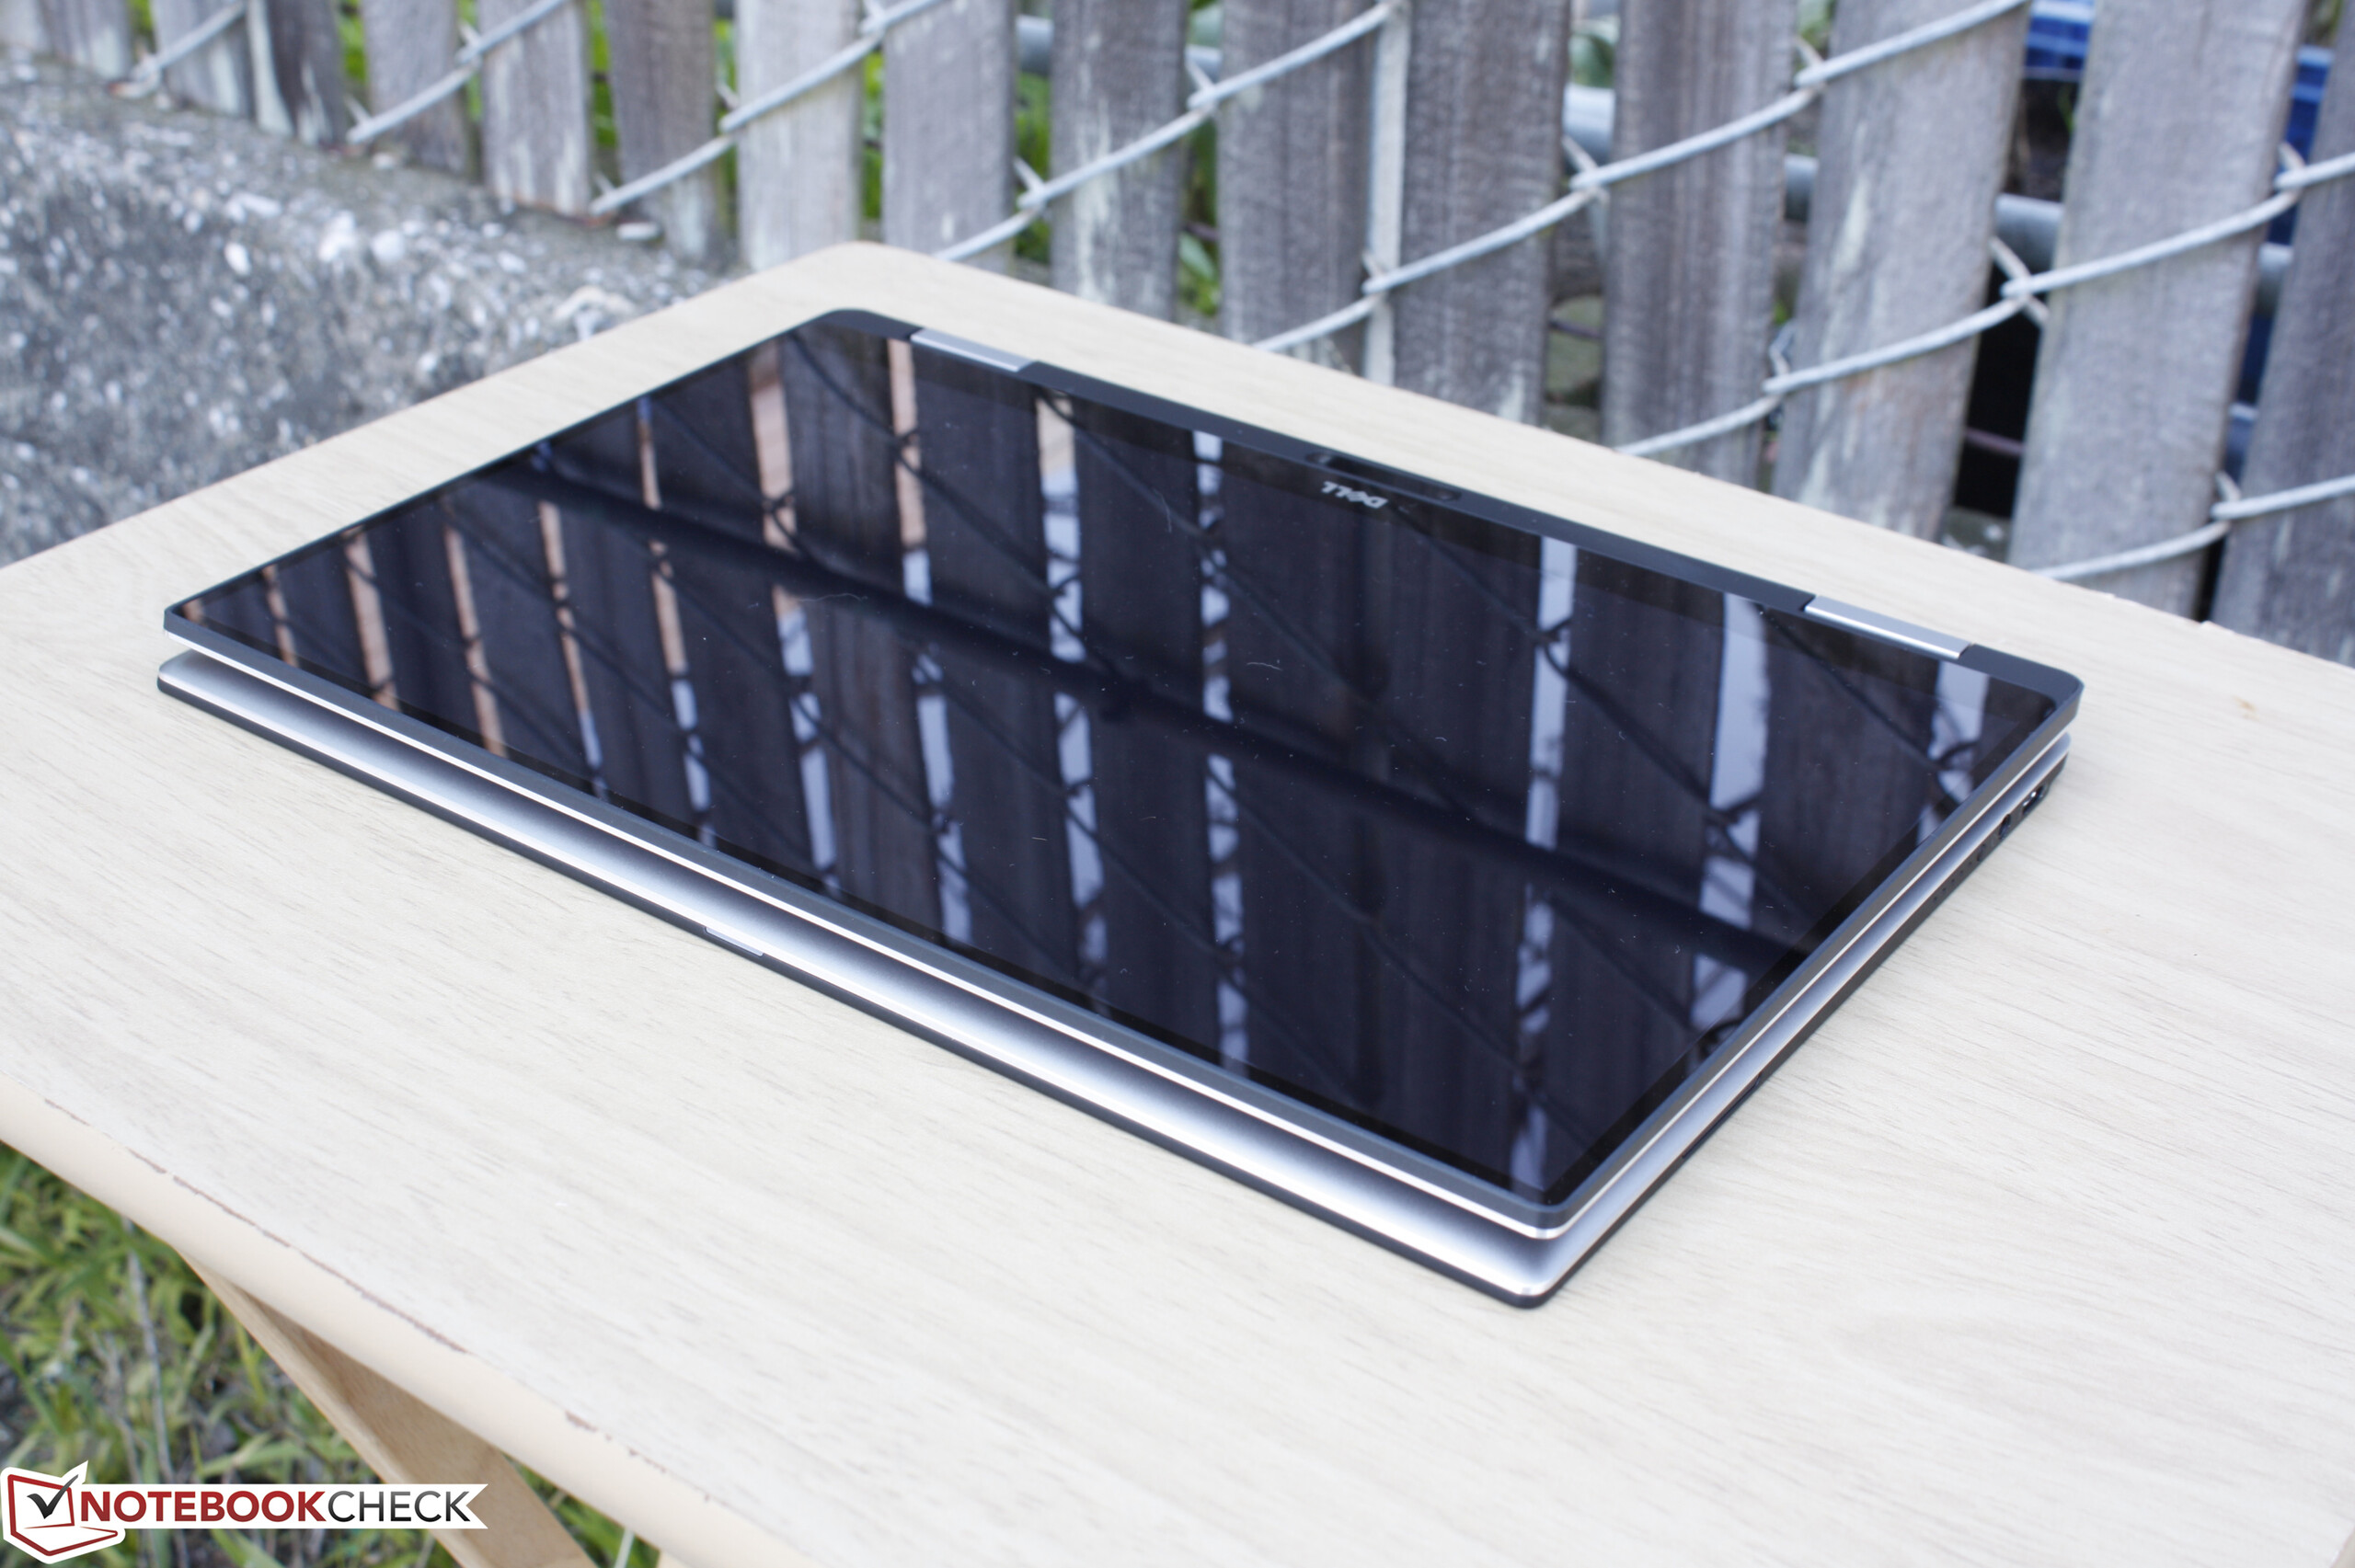
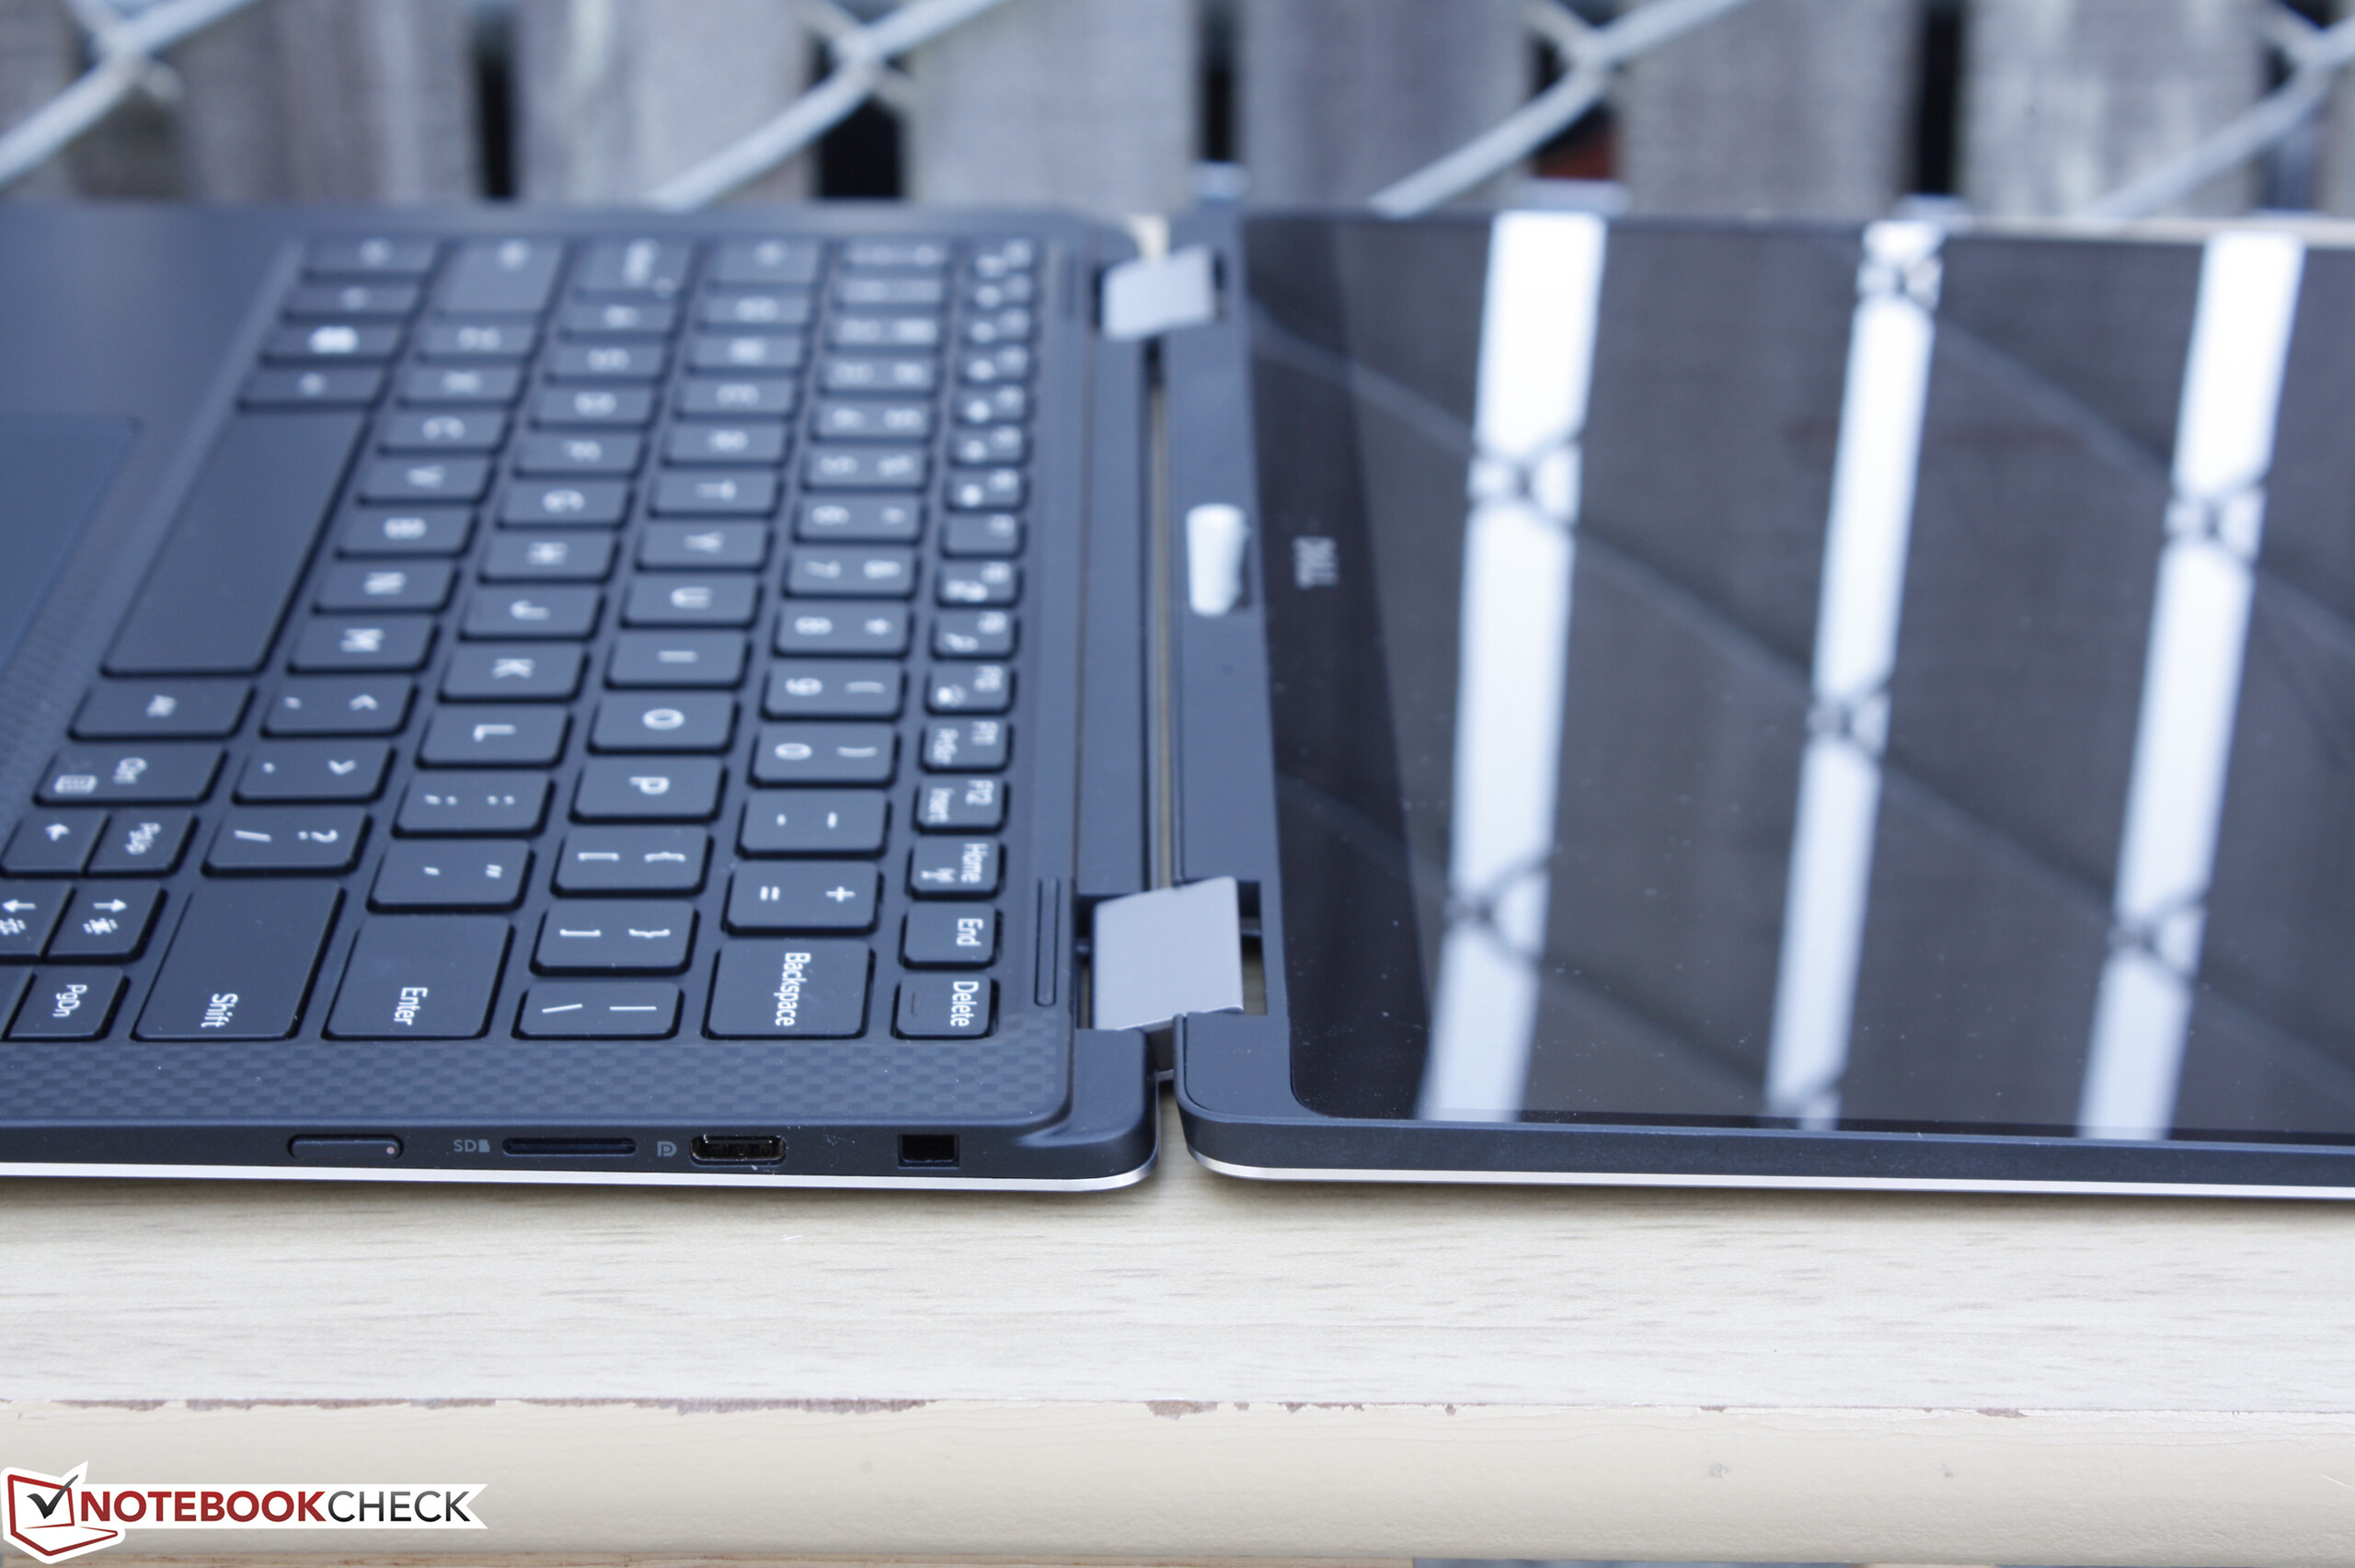
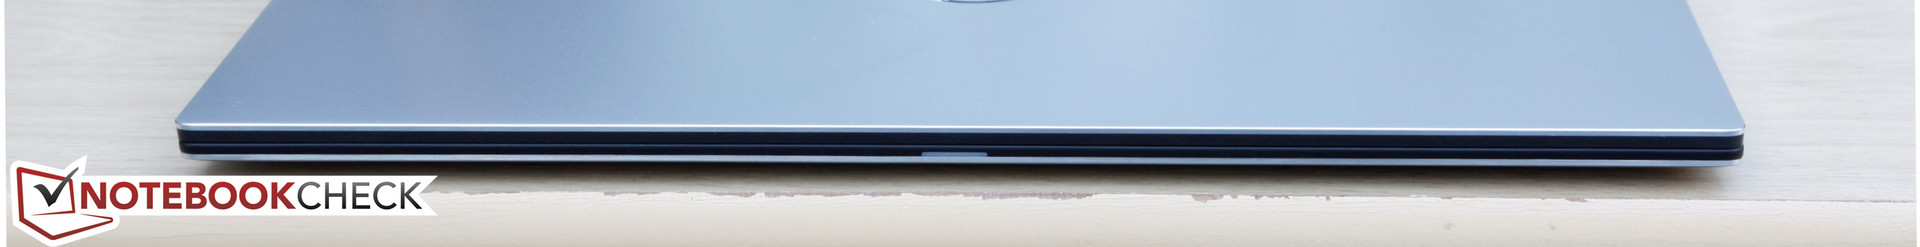
Bu eksiklikleri göz ardı edebilecek kullanıcılar en iyi 2si1 arada cihazlardan birine sahip olacak. InfinityEdge tasarımı oldukça hoş. Cihazın Lenovo veya HP modellerine göre daha hafif ve kompakt olduğunu da belirtmekte fayda var.
Sadece internette gezinmekten fazlasını yapmak isteyen kullanıcılar ise U serisi bir işlemciye sahip Ultrabooklara yönelmeli. Bunun dışında cihaz favorimiz olan 2si1 arada cihazlardan.
Yazının orjinali için tıklayın.
Dell XPS 13-9365 2-in-1
-
02/02/2017 v6(old)
Allen Ngo
Pricecompare
