 Deutsch
 English
 Español
 Français
 Italiano
 Nederlands
 Polski
 Português
 Русский
 Türkçe
 Svenska
 Chinese
 Magyar
Kısa inceleme: Dell XPS 15 9575 (i5-8305G, Vega M GL, FHD)
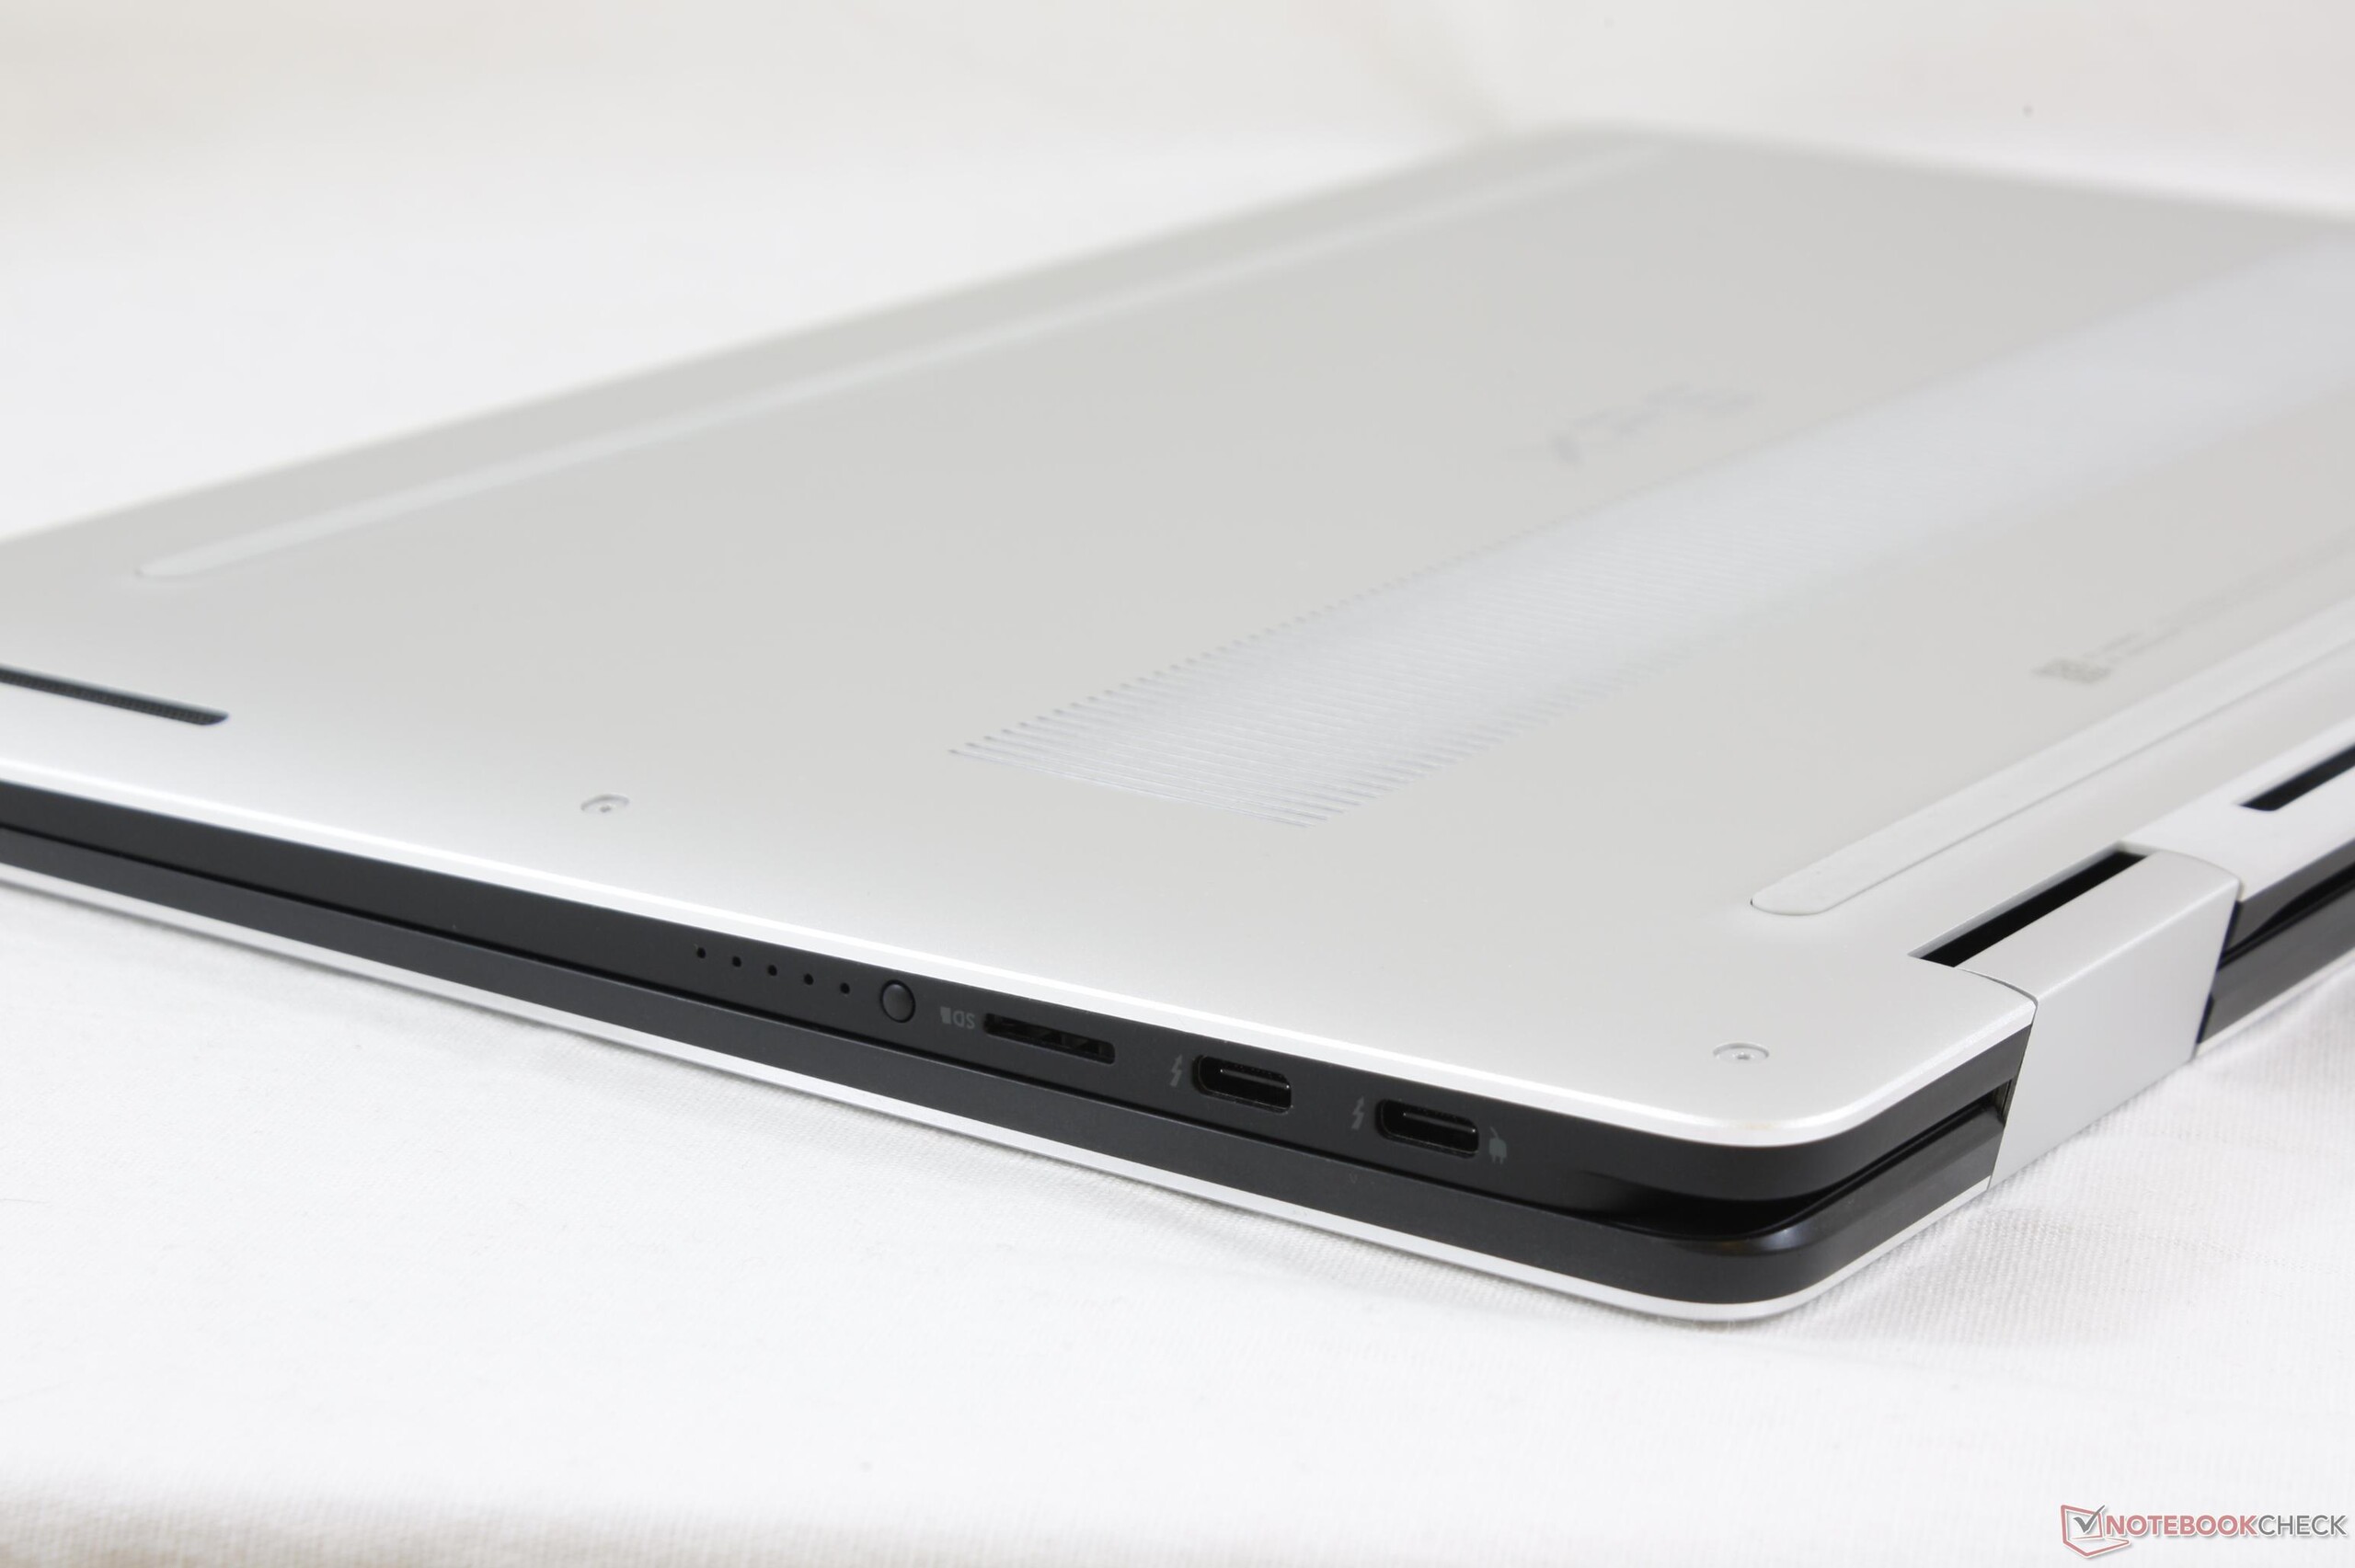
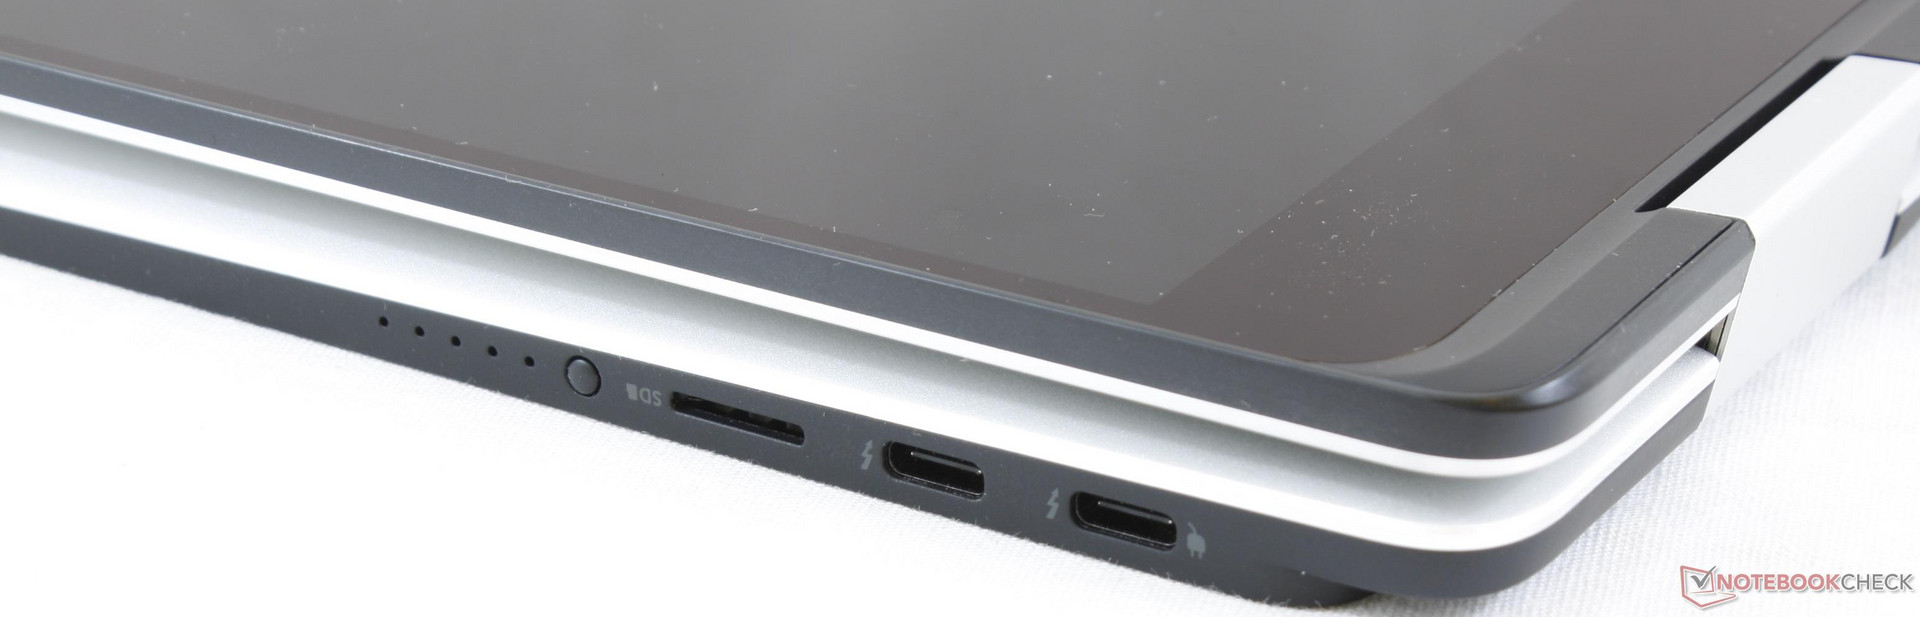
| SD Card Reader | |
| average JPG Copy Test (av. of 3 runs) | |
| HP Spectre x360 15t-bl100 (Toshiba Exceria Pro SDXC 64 GB UHS-II) | |
| Dell XPS 15 9575 i5-8305G (Toshiba Exceria Pro M501 UHS-II) | |
| Dell XPS 15 9560 (i7-7700HQ, UHD) (Toshiba Exceria Pro SDXC 64 GB UHS-II) | |
| maximum AS SSD Seq Read Test (1GB) | |
| Dell XPS 15 9560 (i7-7700HQ, UHD) (Toshiba Exceria Pro SDXC 64 GB UHS-II) | |
| HP Spectre x360 15t-bl100 (Toshiba Exceria Pro SDXC 64 GB UHS-II) | |
| Dell XPS 15 9575 i5-8305G (Toshiba Exceria Pro M501 UHS-II) | |
| Networking | |
| iperf3 transmit AX12 | |
| Dell XPS 15 9575 i5-8305G | |
| Dell XPS 15 9560 (i7-7700HQ, UHD) | |
| LG Gram 15Z975 | |
| iperf3 receive AX12 | |
| Dell XPS 15 9560 (i7-7700HQ, UHD) | |
| LG Gram 15Z975 | |
| Dell XPS 15 9575 i5-8305G | |
| |||||||||||||||||||||||||
Aydınlatma: 87 %
Batarya modunda parlaklık: 418.5 cd/m²
Kontrast: 1196:1 (Siyah: 0.35 cd/m²)
ΔE Color 3.5 | 0.5-29.43 Ø5, calibrated: 2.51
ΔE Greyscale 5.3 | 0.57-98 Ø5.3
92.1% sRGB (Argyll 1.6.3 3D)
57.9% AdobeRGB 1998 (Argyll 1.6.3 3D)
63.9% AdobeRGB 1998 (Argyll 2.2.0 3D)
92.5% sRGB (Argyll 2.2.0 3D)
63.3% Display P3 (Argyll 2.2.0 3D)
Gamma: 2.2
| Dell XPS 15 9575 i5-8305G Sharp SHP148E, IPS, 15.60, 1920x1080 | Dell XPS 15 9560 (i7-7700HQ, UHD) IGZO IPS, 15.60, 3840x2160 | HP Spectre x360 15t-bl100 BOE06C3, IPS, 15.60, 3840x2160 | LG Gram 15Z975 ID: LGD052A, Name: LG Philips LP156WFA-SPC1, IPS, 15.60, 1920x1080 | Microsoft Surface Book 2 15 LG Philips LGD0554, IPS, 15.00, 3240x2160 | Apple MacBook Pro 15 2017 (2.9 GHz, 560) 15.40, 2880x1800 | |
|---|---|---|---|---|---|---|
| Display | 35% | -1% | -14% | |||
| Display P3 Coverage | 63.3 | 89.7 42% | 66.6 5% | 54.9 -13% | ||
| sRGB Coverage | 92.5 | 100 8% | 86.9 -6% | 77.1 -17% | ||
| AdobeRGB 1998 Coverage | 63.9 | 100 56% | 63.5 -1% | 56.3 -12% | ||
| Response Times | -6% | 14% | 32% | 720% | 22% | |
| Response Time Grey 50% / Grey 80% * | 53.6 ? | 57.2 ? -7% | 41.2 ? 23% | 35.2 ? 34% | 37.6 ? 30% | 42.4 ? 21% |
| Response Time Black / White * | 36.4 ? | 39.2 ? -8% | 29.6 ? 19% | 25.6 ? 30% | 22.4 ? 38% | 28 ? 23% |
| PWM Frequency | 1000 ? | 962 -4% | 1000 0% | 21930 ? 2093% | ||
| Screen | -5% | -7% | -19% | 29% | 31% | |
| Brightness middle | 418.5 | 370.1 -12% | 338.7 -19% | 273 -35% | 446 7% | 534 28% |
| Brightness | 391 | 356 -9% | 325 -17% | 276 -29% | 444 14% | 502 28% |
| Brightness Distribution | 87 | 87 0% | 91 5% | 89 2% | 89 2% | 86 -1% |
| Black Level * | 0.35 | 0.37 -6% | 0.28 20% | 0.22 37% | 0.25 29% | 0.31 11% |
| Contrast | 1196 | 1000 -16% | 1210 1% | 1241 4% | 1784 49% | 1723 44% |
| Colorchecker dE 2000 * | 3.5 | 5.3 -51% | 4.9 -40% | 4.77 -36% | 1.7 51% | 1.8 49% |
| Colorchecker dE 2000 max. * | 7.57 | 9.9 -31% | 8.7 -15% | 10.76 -42% | 2.7 64% | 3.8 50% |
| Colorchecker dE 2000 calibrated * | 2.51 | |||||
| Greyscale dE 2000 * | 5.3 | 4.6 13% | 5.5 -4% | 8.6 -62% | 1.7 68% | 2.4 55% |
| Gamma | 2.2 100% | 2.31 95% | 2.08 106% | 1.7 129% | 2.11 104% | 2.27 97% |
| CCT | 7500 87% | 6284 103% | 7498 87% | 6678 97% | 6384 102% | 6563 99% |
| Color Space (Percent of AdobeRGB 1998) | 57.9 | 88.3 53% | 63.5 10% | 50.2 -13% | 58.6 1% | 77.92 35% |
| Color Space (Percent of sRGB) | 92.1 | 100 9% | 86.92 -6% | 76.9 -17% | 92.9 1% | 99.94 9% |
| Total Average (Program / Settings) | 8% /
2% | 2% /
-2% | -0% /
-11% | 375% /
188% | 27% /
29% |
* ... smaller is better
Display Response Times
| ↔ Response Time Black to White | ||
|---|---|---|
| 36.4 ms ... rise ↗ and fall ↘ combined | ↗ 19.2 ms rise | 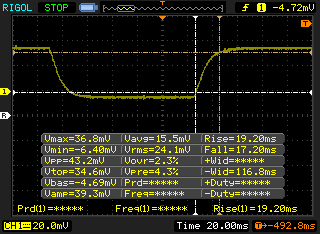 |
| ↘ 17.2 ms fall | ||
| The screen shows slow response rates in our tests and will be unsatisfactory for gamers. In comparison, all tested devices range from 0.1 (minimum) to 240 (maximum) ms. » 94 % of all devices are better. This means that the measured response time is worse than the average of all tested devices (21.5 ms). | ||
| ↔ Response Time 50% Grey to 80% Grey | ||
| 53.6 ms ... rise ↗ and fall ↘ combined | ↗ 26 ms rise | 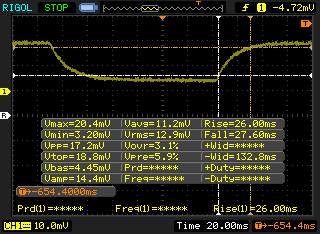 |
| ↘ 27.6 ms fall | ||
| The screen shows slow response rates in our tests and will be unsatisfactory for gamers. In comparison, all tested devices range from 0.2 (minimum) to 636 (maximum) ms. » 89 % of all devices are better. This means that the measured response time is worse than the average of all tested devices (33.7 ms). | ||
Screen Flickering / PWM (Pulse-Width Modulation)
| Screen flickering / PWM detected | 1000 Hz | ≤ 25 % brightness setting | 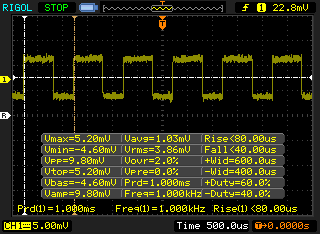 |
The display backlight flickers at 1000 Hz (worst case, e.g., utilizing PWM) Flickering detected at a brightness setting of 25 % and below. There should be no flickering or PWM above this brightness setting. The frequency of 1000 Hz is quite high, so most users sensitive to PWM should not notice any flickering. In comparison: 53 % of all tested devices do not use PWM to dim the display. If PWM was detected, an average of 17900 (minimum: 5 - maximum: 3846000) Hz was measured. | |||
| Cinebench R15 | |
| CPU Single 64Bit | |
| Eurocom Sky X4C | |
| Intel Hades Canyon NUC8i7HVK | |
| Lenovo ThinkPad T480s-20L8S02E00 | |
| Asus Zephyrus M GM501 | |
| Dell XPS 15 9560 (i7-7700HQ, UHD) | |
| Dell XPS 15 9575 i5-8305G | |
| Razer Blade (2016) FHD | |
| MSI GP62-2QEi781FD | |
| LG Gram 13Z980-A | |
| HP Envy x360 15-bq102ng | |
| Asus ROG Strix GL702ZC-GC204T | |
| Dell Inspiron 15 7000 7577 | |
| CPU Multi 64Bit | |
| Eurocom Sky X4C | |
| Asus Zephyrus M GM501 | |
| Asus ROG Strix GL702ZC-GC204T | |
| Intel Hades Canyon NUC8i7HVK | |
| Dell XPS 15 9560 (i7-7700HQ, UHD) | |
| Lenovo ThinkPad T480s-20L8S02E00 | |
| Dell XPS 15 9575 i5-8305G | |
| MSI GP62-2QEi781FD | |
| Razer Blade (2016) FHD | |
| HP Envy x360 15-bq102ng | |
| LG Gram 13Z980-A | |
| Dell Inspiron 15 7000 7577 | |
| Cinebench R11.5 | |
| CPU Single 64Bit | |
| Eurocom Sky X4C | |
| Intel Hades Canyon NUC8i7HVK | |
| Lenovo ThinkPad T480s-20L8S02E00 | |
| Asus Zephyrus M GM501 | |
| Dell XPS 15 9575 i5-8305G | |
| Dell XPS 15 9560 (i7-7700HQ, UHD) | |
| Razer Blade (2016) FHD | |
| MSI GP62-2QEi781FD | |
| LG Gram 13Z980-A | |
| HP Envy x360 15-bq102ng | |
| Asus ROG Strix GL702ZC-GC204T | |
| Dell Inspiron 15 7000 7577 | |
| CPU Multi 64Bit | |
| Eurocom Sky X4C | |
| Asus Zephyrus M GM501 | |
| Asus ROG Strix GL702ZC-GC204T | |
| Intel Hades Canyon NUC8i7HVK | |
| Dell XPS 15 9560 (i7-7700HQ, UHD) | |
| Lenovo ThinkPad T480s-20L8S02E00 | |
| MSI GP62-2QEi781FD | |
| Razer Blade (2016) FHD | |
| Dell XPS 15 9575 i5-8305G | |
| HP Envy x360 15-bq102ng | |
| Dell Inspiron 15 7000 7577 | |
| LG Gram 13Z980-A | |
| Cinebench R10 | |
| Rendering Multiple CPUs 32Bit | |
| Eurocom Sky X4C | |
| Asus Zephyrus M GM501 | |
| Intel Hades Canyon NUC8i7HVK | |
| Asus ROG Strix GL702ZC-GC204T | |
| Lenovo ThinkPad T480s-20L8S02E00 | |
| Dell XPS 15 9575 i5-8305G | |
| Dell XPS 15 9560 (i7-7700HQ, UHD) | |
| Razer Blade (2016) FHD | |
| MSI GP62-2QEi781FD | |
| Dell Inspiron 15 7000 7577 | |
| LG Gram 13Z980-A | |
| HP Envy x360 15-bq102ng | |
| Rendering Single 32Bit | |
| Eurocom Sky X4C | |
| Intel Hades Canyon NUC8i7HVK | |
| Lenovo ThinkPad T480s-20L8S02E00 | |
| Asus Zephyrus M GM501 | |
| Dell XPS 15 9575 i5-8305G | |
| Dell XPS 15 9560 (i7-7700HQ, UHD) | |
| Razer Blade (2016) FHD | |
| LG Gram 13Z980-A | |
| MSI GP62-2QEi781FD | |
| Dell Inspiron 15 7000 7577 | |
| HP Envy x360 15-bq102ng | |
| Asus ROG Strix GL702ZC-GC204T | |
| wPrime 2.10 - 1024m | |
| HP Envy x360 15-bq102ng | |
| Asus ROG Strix GL702ZC-GC204T | |
| Dell Inspiron 15 7000 7577 | |
| LG Gram 13Z980-A | |
| Dell XPS 15 9575 i5-8305G | |
| Dell XPS 15 9560 (i7-7700HQ, UHD) | |
| MSI GP62-2QEi781FD | |
| Intel Hades Canyon NUC8i7HVK | |
| Eurocom Sky X4C | |
* ... smaller is better
| PCMark 10 - Score | |
| Intel Hades Canyon NUC8i7HVK | |
| Dell XPS 15 9575 i5-8305G | |
| Microsoft Surface Book 2 15 | |
| Apple MacBook Pro 15 2017 (2.9 GHz, 560) | |
| HP Spectre x360 15t-bl100 | |
| LG Gram 15Z975 | |
| HP Envy x360 15-bq102ng | |
| PCMark 8 | |
| Home Score Accelerated v2 | |
| Intel Hades Canyon NUC8i7HVK | |
| Dell XPS 15 9575 i5-8305G | |
| Apple MacBook Pro 15 2017 (2.9 GHz, 560) | |
| Microsoft Surface Book 2 15 | |
| Dell XPS 15 9560 (i7-7700HQ, UHD) | |
| LG Gram 15Z975 | |
| HP Envy x360 15-bq102ng | |
| HP Spectre x360 15t-bl100 | |
| Work Score Accelerated v2 | |
| Intel Hades Canyon NUC8i7HVK | |
| Dell XPS 15 9575 i5-8305G | |
| LG Gram 15Z975 | |
| Microsoft Surface Book 2 15 | |
| Dell XPS 15 9560 (i7-7700HQ, UHD) | |
| Apple MacBook Pro 15 2017 (2.9 GHz, 560) | |
| HP Spectre x360 15t-bl100 | |
| HP Envy x360 15-bq102ng | |
| Creative Score Accelerated v2 | |
| Intel Hades Canyon NUC8i7HVK | |
| Dell XPS 15 9575 i5-8305G | |
| Dell XPS 15 9560 (i7-7700HQ, UHD) | |
| HP Spectre x360 15t-bl100 | |
| Microsoft Surface Book 2 15 | |
| Apple MacBook Pro 15 2017 (2.9 GHz, 560) | |
| LG Gram 15Z975 | |
| HP Envy x360 15-bq102ng | |
| PCMark 8 Home Score Accelerated v2 | 4693 puan | |
| PCMark 8 Creative Score Accelerated v2 | 6303 puan | |
| PCMark 8 Work Score Accelerated v2 | 5134 puan | |
| PCMark 10 Score | 4702 puan | |
Yardım | ||
| Dell XPS 15 9575 i5-8305G Toshiba XG5 KXG50ZNV256G | Dell XPS 15 9560 (i7-7700HQ, UHD) Lite-On CX2-8B512-Q11 | HP Spectre x360 15t-bl100 Samsung PM961 NVMe MZVLW512HMJP | LG Gram 15Z975 SK Hynix HFS256G39TND-N210A | Asus Zephyrus M GM501 Samsung SM961 MZVKW512HMJP m.2 PCI-e | |
|---|---|---|---|---|---|
| AS SSD | 138% | 232% | -34% | 191% | |
| Copy Game MB/s | 250.5 | 540 116% | 1134 353% | 179.8 -28% | |
| Copy Program MB/s | 174.9 | 411.5 135% | 534 205% | 141.2 -19% | |
| Copy ISO MB/s | 392.7 | 1272 224% | 1936 393% | 197.5 -50% | |
| Score Total | 1113 | 2810 152% | 3781 240% | 1003 -10% | 3649 228% |
| Score Write | 307 | 1022 233% | 1556 407% | 339 10% | 1446 371% |
| Score Read | 595 | 1206 103% | 1493 151% | 442 -26% | 1471 147% |
| Access Time Write * | 0.056 | 0.034 39% | 0.026 54% | 0.232 -314% | 0.041 27% |
| Access Time Read * | 0.146 | 0.034 77% | 0.04 73% | 0.08 45% | 0.046 68% |
| 4K-64 Write | 181.2 | 789 335% | 1262 596% | 246.7 36% | 1198 561% |
| 4K-64 Read | 337.1 | 962 185% | 1206 258% | 366.5 9% | 1218 261% |
| 4K Write | 92.7 | 112.2 21% | 141.1 52% | 67.6 -27% | 90.2 -3% |
| 4K Read | 24.78 | 41.34 67% | 51.9 109% | 26.24 6% | 43.42 75% |
| Seq Write | 334.3 | 1207 261% | 1530 358% | 248.5 -26% | 1580 373% |
| Seq Read | 2335 | 2026 -13% | 2342 0% | 488.1 -79% | 2091 -10% |
* ... smaller is better

| 3DMark | |
| 1920x1080 Fire Strike Graphics | |
| Asus FX503VM-EH73 | |
| HP Omen 15-ce002ng | |
| Intel Hades Canyon NUC8i7HVK | |
| Asus Zenbook Pro UX550VE-DB71T | |
| Dell XPS 15 9575 i5-8305G | |
| Dell XPS 15 9560 (i7-7700HQ, UHD) | |
| HP Pavilion 17 FHD V3A33AV | |
| HP Spectre x360 15t-bl100 | |
| HP Envy x360 15-bq102ng | |
| Intel Skull Canyon NUC6i7KYK | |
| Fire Strike Extreme Graphics | |
| Asus FX503VM-EH73 | |
| Intel Hades Canyon NUC8i7HVK | |
| Asus Zenbook Pro UX550VE-DB71T | |
| Dell XPS 15 9575 i5-8305G | |
| Dell XPS 15 9560 (i7-7700HQ, UHD) | |
| HP Pavilion 17 FHD V3A33AV | |
| HP Envy x360 15-bq102ng | |
| Intel Skull Canyon NUC6i7KYK | |
| 1920x1080 Fire Strike Score | |
| Asus FX503VM-EH73 | |
| HP Omen 15-ce002ng | |
| Intel Hades Canyon NUC8i7HVK | |
| Asus Zenbook Pro UX550VE-DB71T | |
| Dell XPS 15 9575 i5-8305G | |
| Dell XPS 15 9560 (i7-7700HQ, UHD) | |
| HP Pavilion 17 FHD V3A33AV | |
| HP Spectre x360 15t-bl100 | |
| HP Envy x360 15-bq102ng | |
| Intel Skull Canyon NUC6i7KYK | |
| 3DMark 11 | |
| 1280x720 Performance GPU | |
| Asus FX503VM-EH73 | |
| Intel Hades Canyon NUC8i7HVK | |
| HP Omen 15-ce002ng | |
| Dell XPS 15 9575 i5-8305G | |
| Asus Zenbook Pro UX550VE-DB71T | |
| HP Pavilion 17 FHD V3A33AV | |
| HP Spectre x360 15t-bl100 | |
| HP Envy x360 15-bq102ng | |
| Intel Skull Canyon NUC6i7KYK | |
| 1280x720 Performance Combined | |
| Intel Hades Canyon NUC8i7HVK | |
| HP Omen 15-ce002ng | |
| Asus Zenbook Pro UX550VE-DB71T | |
| Dell XPS 15 9575 i5-8305G | |
| Asus FX503VM-EH73 | |
| HP Pavilion 17 FHD V3A33AV | |
| HP Spectre x360 15t-bl100 | |
| Intel Skull Canyon NUC6i7KYK | |
| HP Envy x360 15-bq102ng | |
| 3DMark 06 Standard Score | 16707 puan | |
| 3DMark 11 Performance | 9326 puan | |
| 3DMark Ice Storm Standard Score | 111847 puan | |
| 3DMark Cloud Gate Standard Score | 21322 puan | |
| 3DMark Fire Strike Score | 6235 puan | |
| 3DMark Fire Strike Extreme Score | 3052 puan | |
Yardım | ||
| Rise of the Tomb Raider - 1920x1080 Very High Preset AA:FX AF:16x | |
| Asus FX503VM-EH73 | |
| Dell Inspiron 15 7000 7577 4K | |
| Intel Hades Canyon NUC8i7HVK | |
| Asus Zenbook Pro UX550VE-DB71T | |
| Dell XPS 15 9575 i5-8305G | |
| Acer Nitro 5 Spin NP515-51-86CX | |
| Asus G501VW-FY081T | |
| Lenovo ThinkPad T480-20L6S01V00 | |
| Intel Skull Canyon NUC6i7KYK | |
| düşük | orta | yüksek | ultra | |
| BioShock Infinite (2013) | 202.7 | 172 | 152 | 51.7 |
| Metro: Last Light (2013) | 105.8 | 80.9 | 40.8 | |
| Thief (2014) | 78.8 | 72.6 | 41.1 | |
| The Witcher 3 (2015) | 77.8 | 43.8 | 23.7 | |
| Batman: Arkham Knight (2015) | 111 | 97 | 53 | |
| Metal Gear Solid V (2015) | 60 | 60 | 60 | 54 |
| Fallout 4 (2015) | 86.1 | 45.2 | 36 | |
| Rise of the Tomb Raider (2016) | 131.1 | 79.7 | 40.6 | 31.7 |
| Ashes of the Singularity (2016) | 54.1 | 36.4 | 32.3 | |
| Overwatch (2016) | 184.3 | 108.2 | 50 | |
| Mafia 3 (2016) | 45 | 34 | 24 | |
| Prey (2017) | 135 | 86.6 | 69.1 | 61 |
| Dirt 4 (2017) | 40.9 | 16.3 | 9.7 | |
| F1 2017 (2017) | 80 | 65 | 39 | |
| Final Fantasy XV Benchmark (2018) | 9 |
Ses yüksekliği
| Boşta |
| 27.8 / 27.8 / 27.8 dB |
| HDD |
| 27.8 dB |
| Çalışırken |
| 35 / 44.2 dB |
 | ||
30 dB sessiz 40 dB(A) duyulabilirlik 50 dB(A) gürültülü |
||
min: | ||
| Dell XPS 15 9575 i5-8305G Vega M GL / 870, i5-8305G, Toshiba XG5 KXG50ZNV256G | Dell XPS 15 9560 (i7-7700HQ, UHD) GeForce GTX 1050 Mobile, i7-7700HQ, Lite-On CX2-8B512-Q11 | HP Spectre x360 15t-bl100 GeForce MX150, i5-8550U, Samsung PM961 NVMe MZVLW512HMJP | Microsoft Surface Book 2 15 GeForce GTX 1060 Mobile, i7-8650U, Samsung PM961 MZVLW256HEHP | Dell Inspiron 15 7000 7577 GeForce GTX 1060 Max-Q, i5-7300HQ, Samsung PM961 MZVLW256HEHP | Apple MacBook Pro 15 2017 (2.9 GHz, 560) Radeon Pro 560, i7-7820HQ | |
|---|---|---|---|---|---|---|
| Noise | -12% | -0% | -4% | 2% | -5% | |
| off / environment * | 27.8 | 28.4 -2% | 28.4 -2% | 29.1 -5% | 28 -1% | 30.8 -11% |
| Idle Minimum * | 27.8 | 29 -4% | 28.4 -2% | 29.1 -5% | 28 -1% | 31 -12% |
| Idle Average * | 27.8 | 29 -4% | 28.4 -2% | 29.1 -5% | 28 -1% | 31 -12% |
| Idle Maximum * | 27.8 | 32.2 -16% | 28.4 -2% | 29.1 -5% | 28 -1% | 31 -12% |
| Load Average * | 35 | 47.1 -35% | 41.6 -19% | 35.7 -2% | 30.3 13% | 31.3 11% |
| Witcher 3 ultra * | 44.2 | 52 -18% | 36.1 18% | 39.5 11% | ||
| Load Maximum * | 44.2 | 47.1 -7% | 41.6 6% | 45.3 -2% | 46.5 -5% | 41.8 5% |
* ... smaller is better
(±) The maximum temperature on the upper side is 44.8 °C / 113 F, compared to the average of 36.9 °C / 98 F, ranging from 21.1 to 71 °C for the class Multimedia.
(±) The bottom heats up to a maximum of 40 °C / 104 F, compared to the average of 39.1 °C / 102 F
(+) In idle usage, the average temperature for the upper side is 26.2 °C / 79 F, compared to the device average of 31.2 °C / 88 F.
(±) Playing The Witcher 3, the average temperature for the upper side is 36.7 °C / 98 F, compared to the device average of 31.2 °C / 88 F.
(+) The palmrests and touchpad are cooler than skin temperature with a maximum of 31.2 °C / 88.2 F and are therefore cool to the touch.
(-) The average temperature of the palmrest area of similar devices was 28.8 °C / 83.8 F (-2.4 °C / -4.4 F).
Dell XPS 15 9575 i5-8305G audio analysis
(-) | not very loud speakers (68.1 dB)
Bass 100 - 315 Hz
(-) | nearly no bass - on average 16.7% lower than median
(±) | linearity of bass is average (11.2% delta to prev. frequency)
Mids 400 - 2000 Hz
(+) | balanced mids - only 4.5% away from median
(+) | mids are linear (6.9% delta to prev. frequency)
Highs 2 - 16 kHz
(+) | balanced highs - only 2.8% away from median
(±) | linearity of highs is average (8.4% delta to prev. frequency)
Overall 100 - 16.000 Hz
(±) | linearity of overall sound is average (23% difference to median)
Compared to same class
» 78% of all tested devices in this class were better, 6% similar, 16% worse
» The best had a delta of 5%, average was 18%, worst was 45%
Compared to all devices tested
» 64% of all tested devices were better, 6% similar, 30% worse
» The best had a delta of 4%, average was 25%, worst was 134%
Apple MacBook 12 (Early 2016) 1.1 GHz audio analysis
(+) | speakers can play relatively loud (83.6 dB)
Bass 100 - 315 Hz
(±) | reduced bass - on average 11.3% lower than median
(±) | linearity of bass is average (14.2% delta to prev. frequency)
Mids 400 - 2000 Hz
(+) | balanced mids - only 2.4% away from median
(+) | mids are linear (5.5% delta to prev. frequency)
Highs 2 - 16 kHz
(+) | balanced highs - only 2% away from median
(+) | highs are linear (4.5% delta to prev. frequency)
Overall 100 - 16.000 Hz
(+) | overall sound is linear (10.2% difference to median)
Compared to same class
» 5% of all tested devices in this class were better, 2% similar, 93% worse
» The best had a delta of 5%, average was 19%, worst was 53%
Compared to all devices tested
» 3% of all tested devices were better, 1% similar, 96% worse
» The best had a delta of 4%, average was 25%, worst was 134%
| Dell XPS 15 9575 i5-8305G i5-8305G, Vega M GL / 870, 75 Wh | Dell XPS 15 9560 (i7-7700HQ, UHD) i7-7700HQ, GeForce GTX 1050 Mobile, 97 Wh | HP Spectre x360 15t-bl100 i5-8550U, GeForce MX150, 79.2 Wh | Apple MacBook Pro 15 2017 (2.9 GHz, 560) i7-7820HQ, Radeon Pro 560, Wh | LG Gram 15Z975 i5-8250U, UHD Graphics 620, 60 Wh | Dell Inspiron 15 7000 7577 i5-7300HQ, GeForce GTX 1060 Max-Q, 56 Wh | |
|---|---|---|---|---|---|---|
| Battery Runtime | 11% | 35% | 3% | 36% | -1% | |
| Reader / Idle | 663 | 831 25% | 934 41% | 1078 63% | 659 -1% | |
| WiFi v1.3 | 564 | 434 -23% | 511 -9% | 677 20% | 435 -23% | 416 -26% |
| Load | 78 | 103 32% | 136 74% | 67 -14% | 131 68% | 96 23% |
| Witcher 3 ultra | 76 |
Artılar
Eksiler
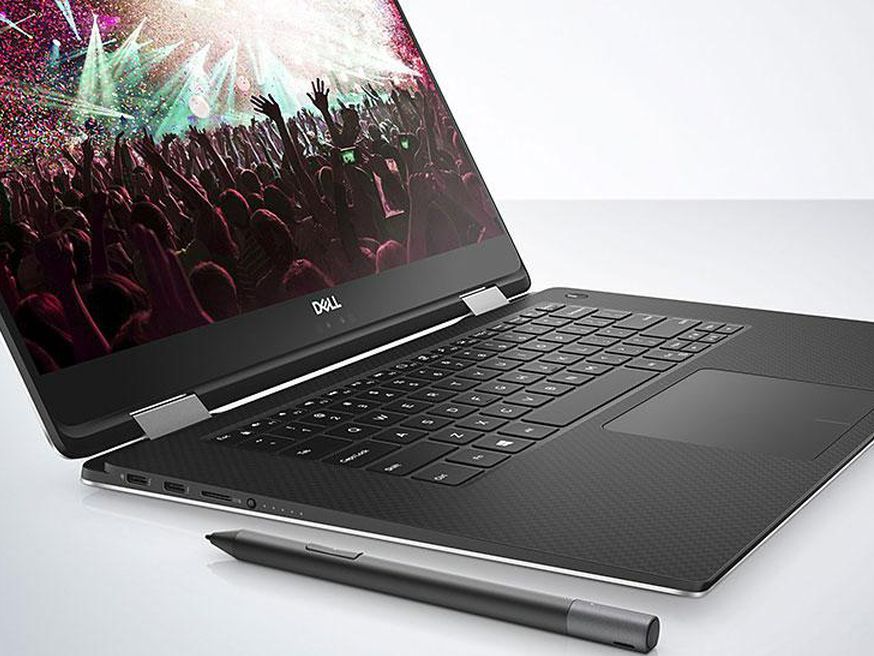
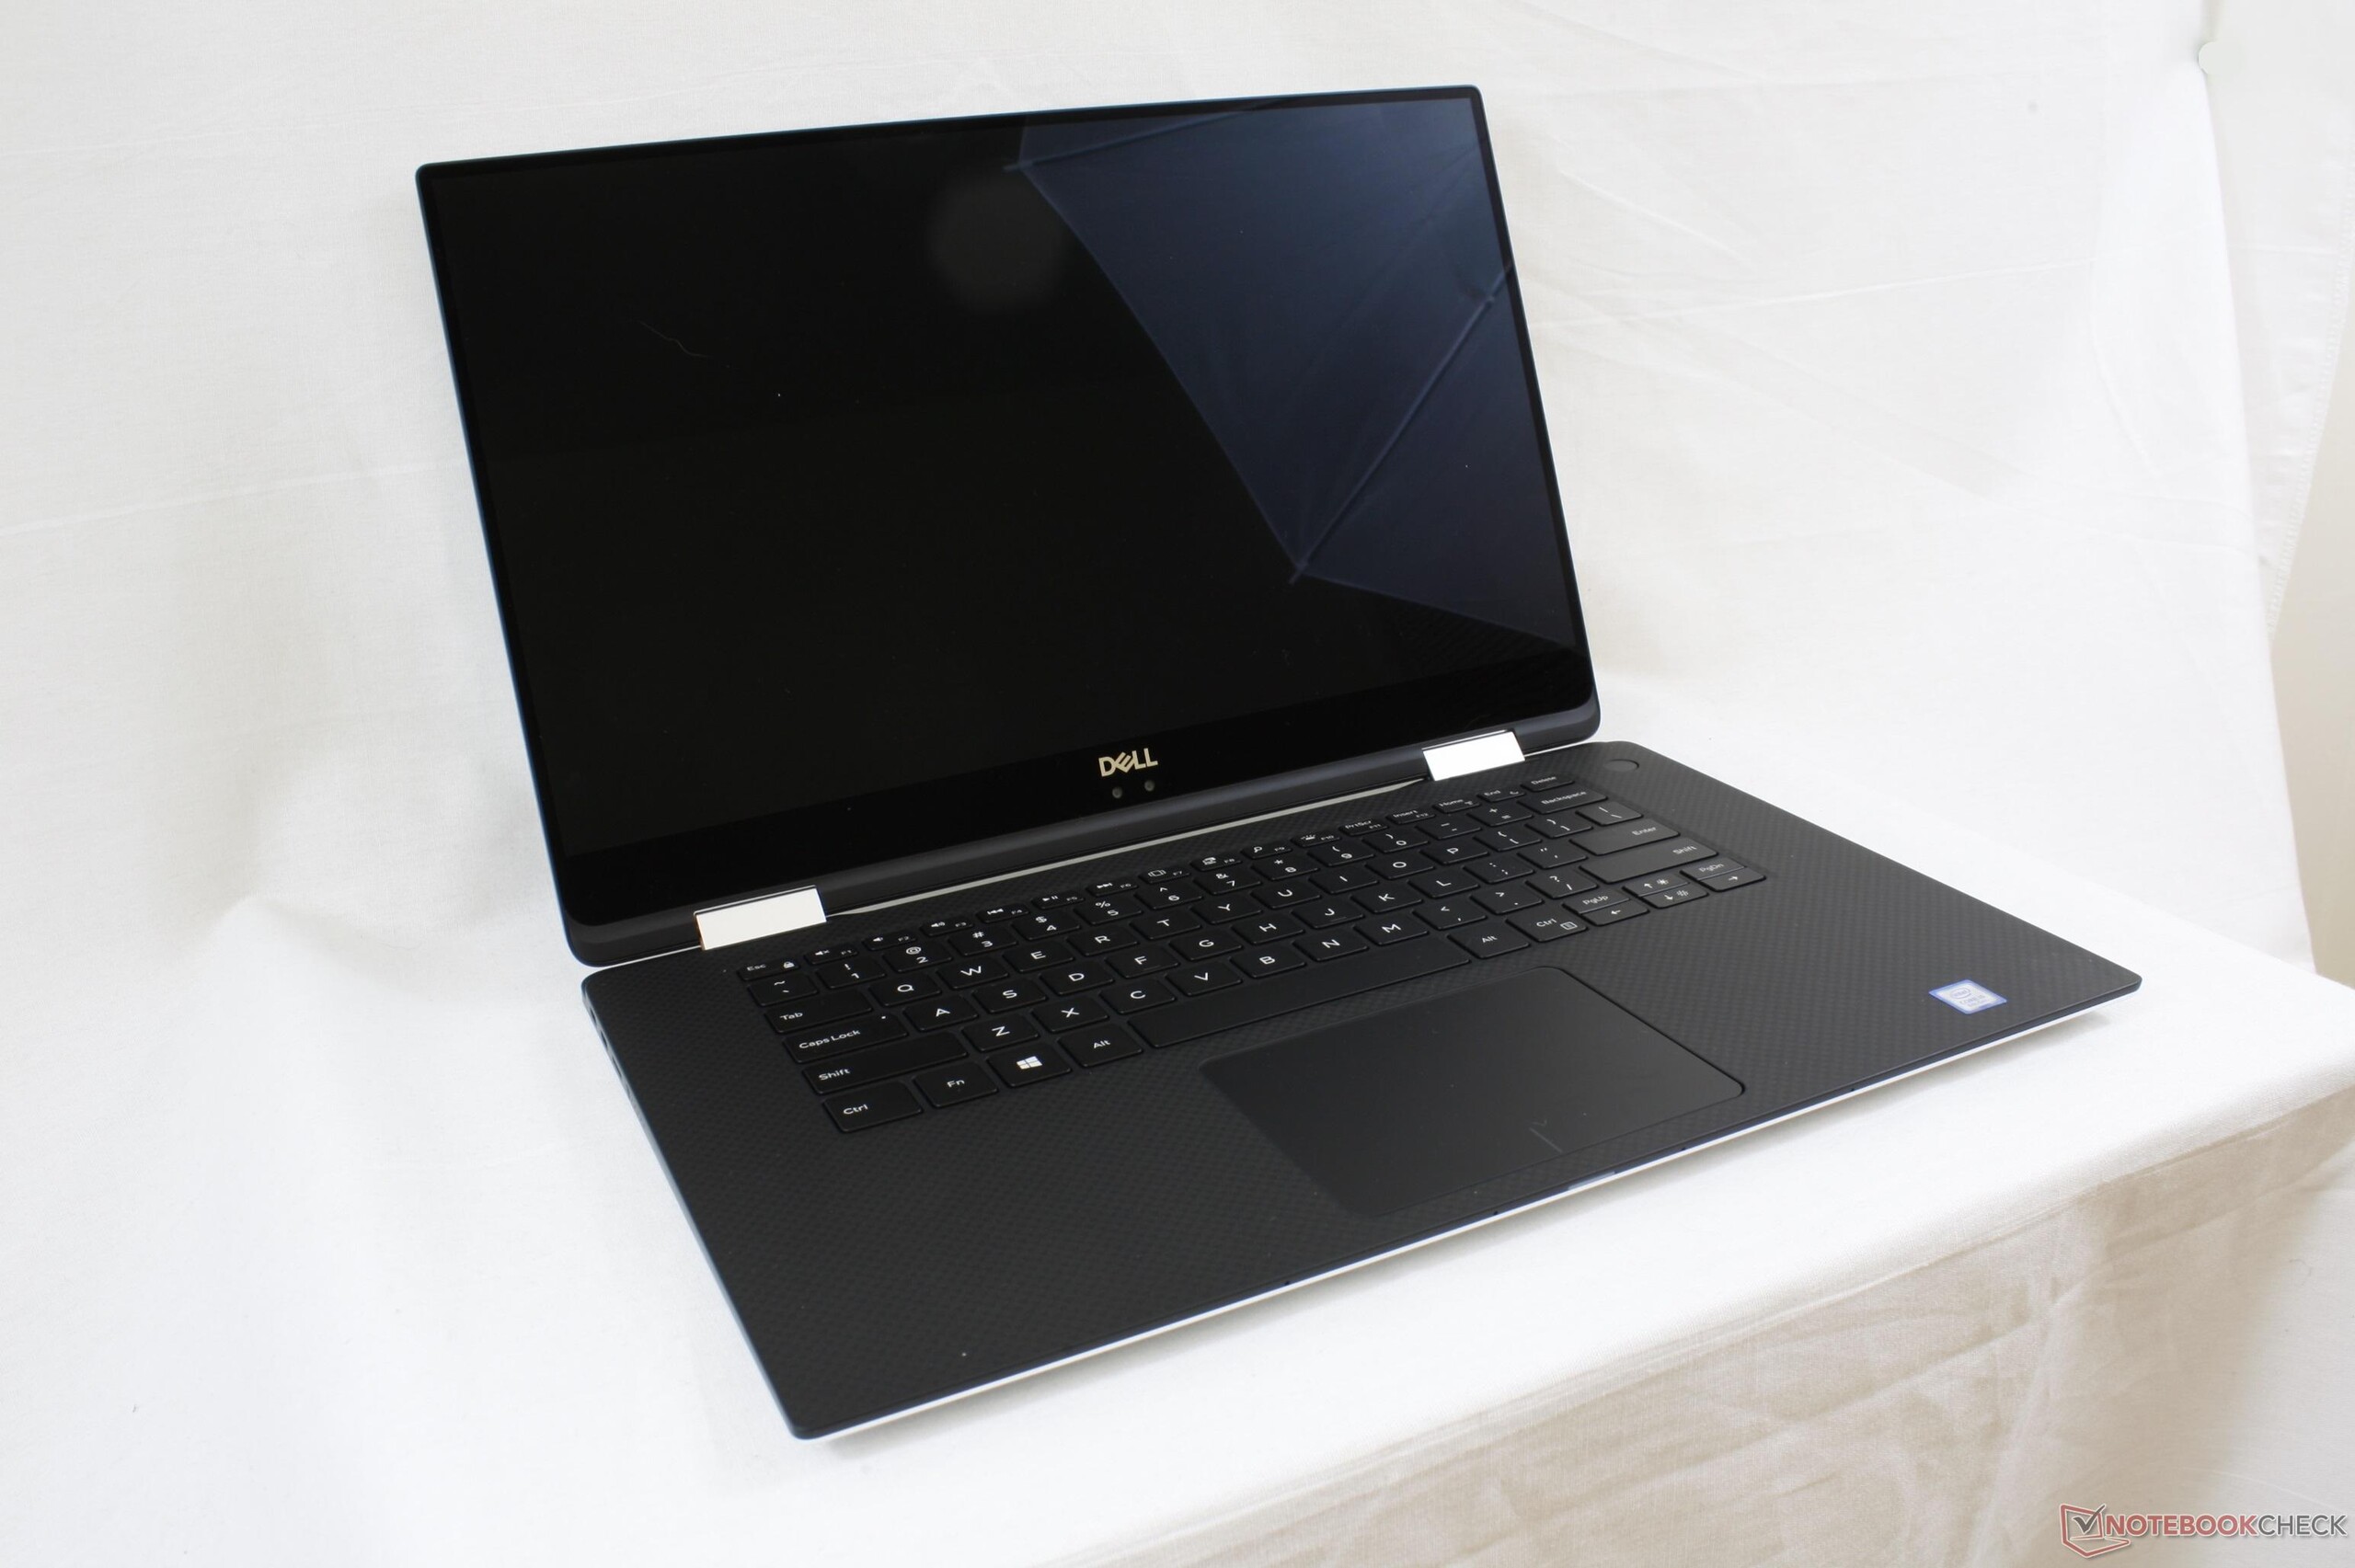
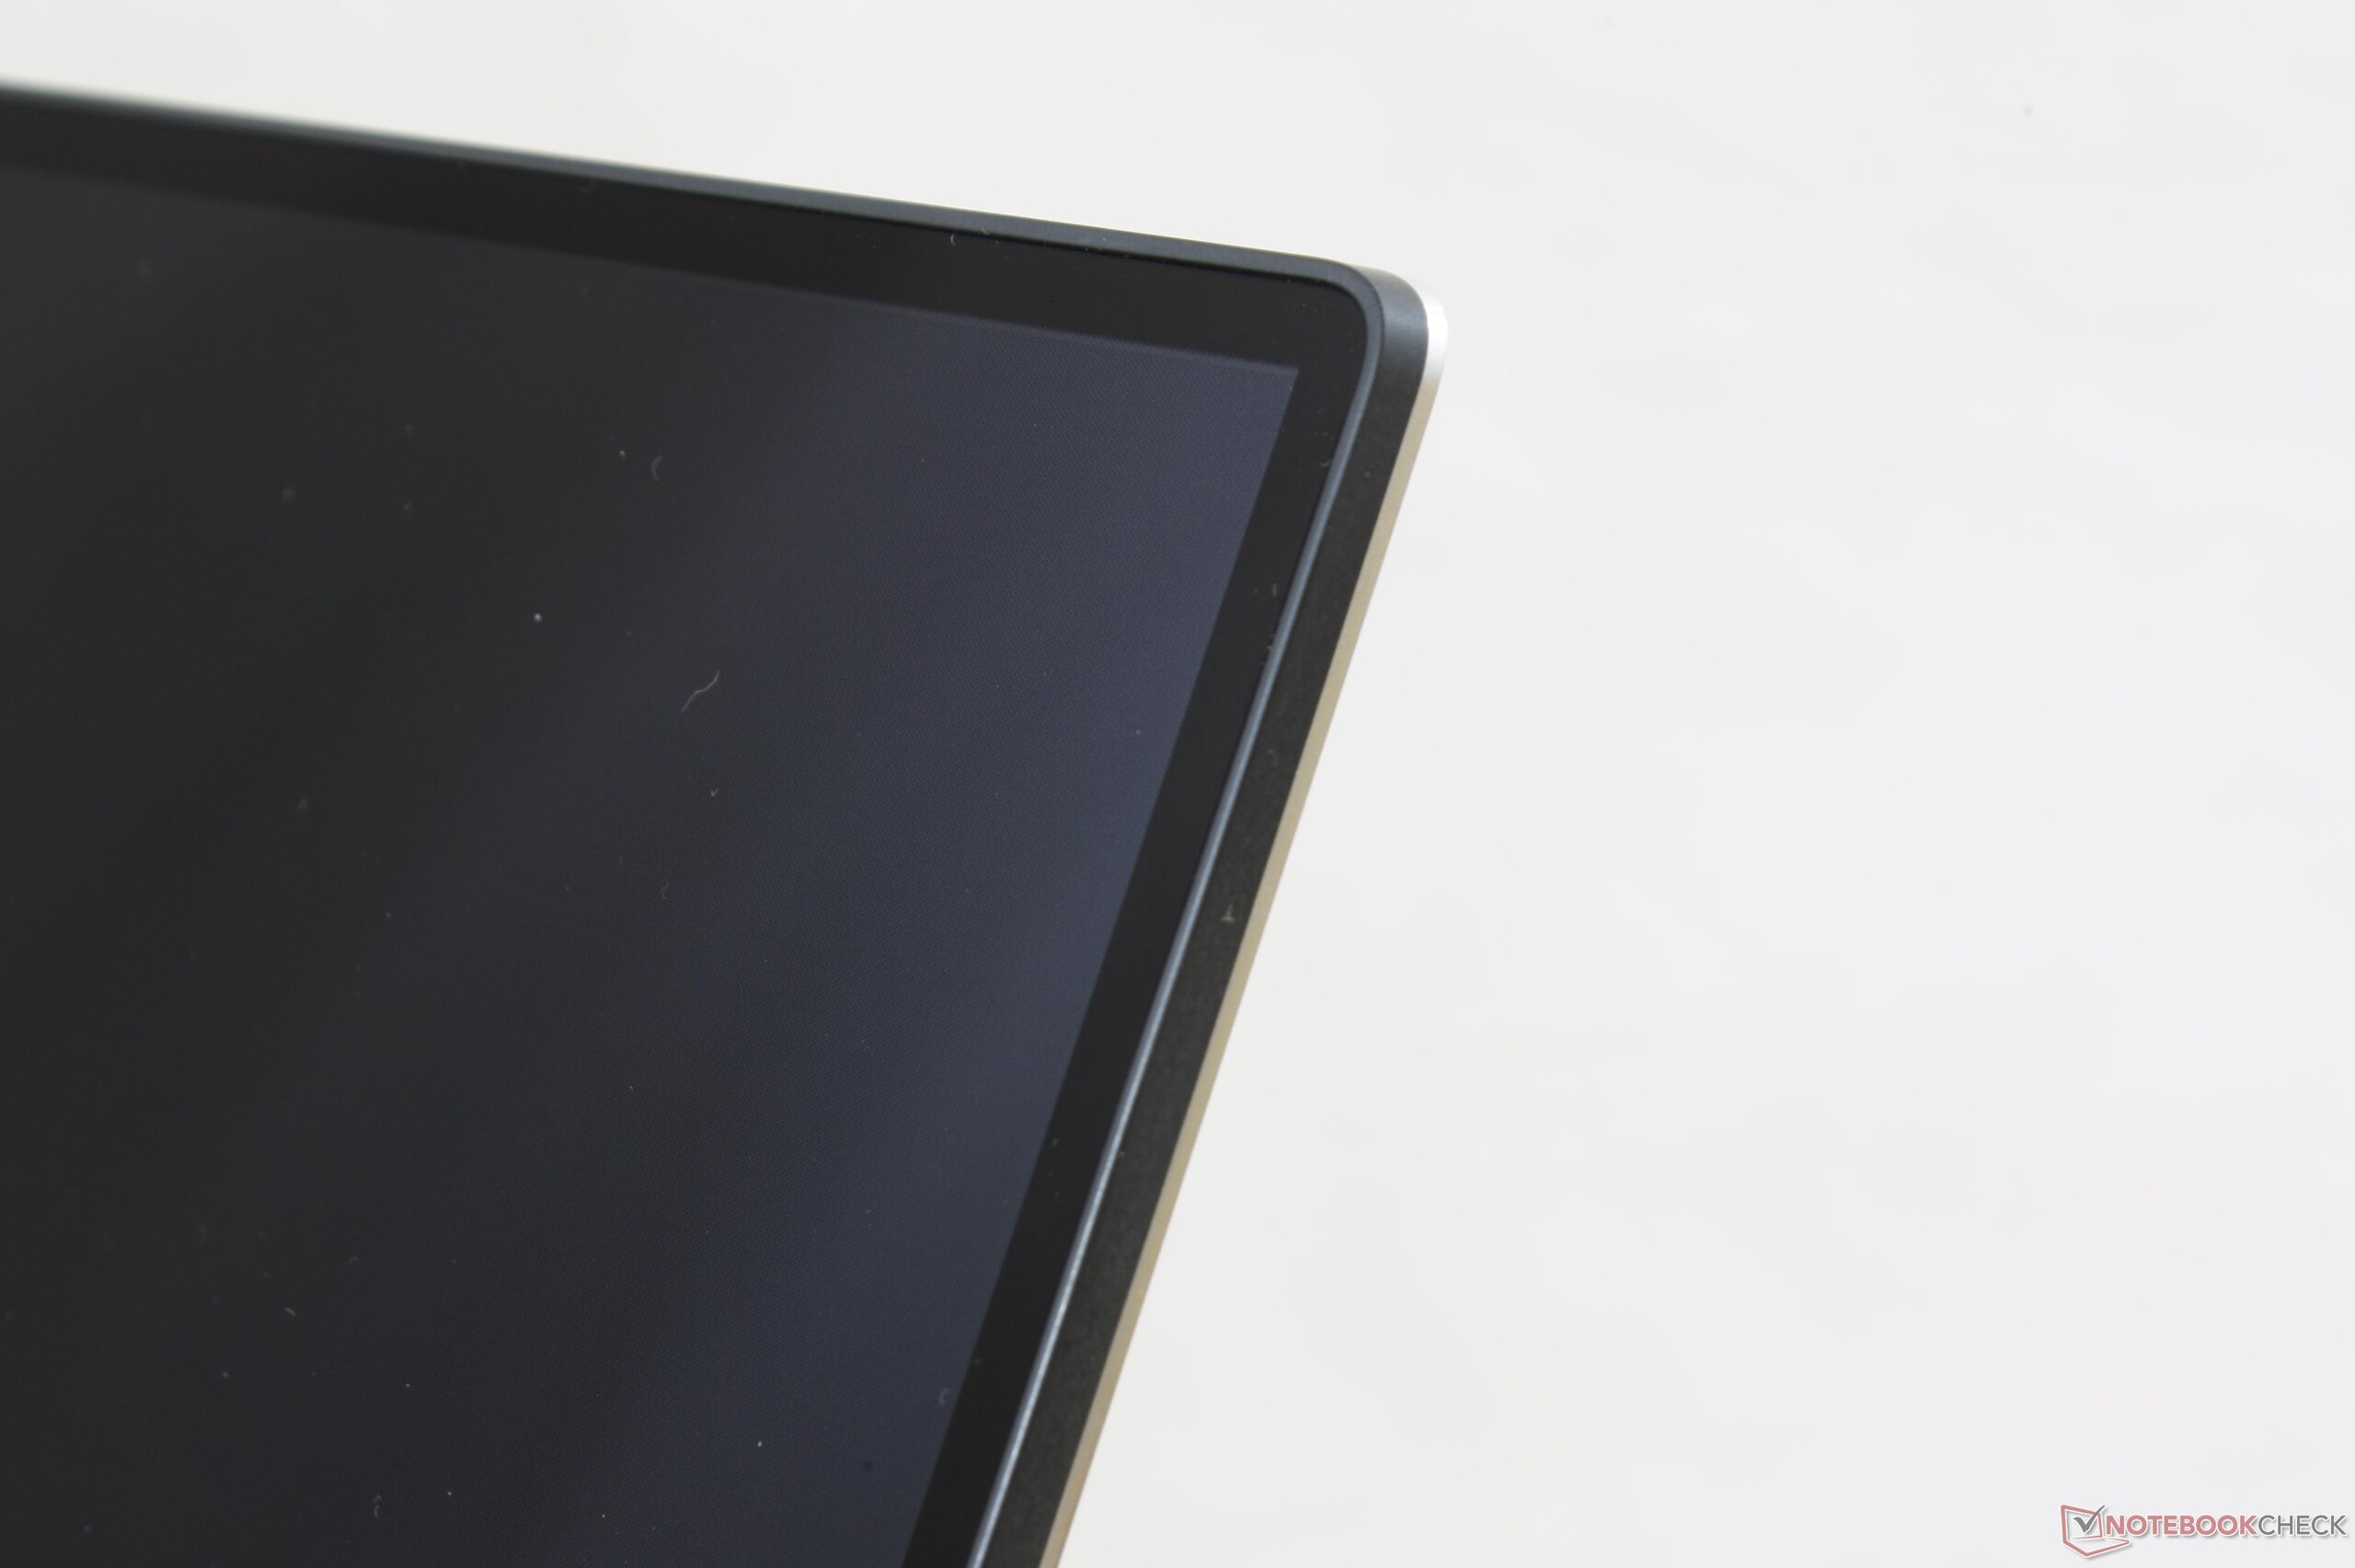
XPS 15 9575, XPS 15 9560 modelinin dönüştürülebilir hali olarak karşımıza çıkmalıydı, ki aynen öyle de oldu. Klasik bir XPS 15 gibi durup, çoklu kullanım modlarına sahip olan cihaz, ince tasarımı ile güçlü performansı birleştiriyor.
Performans yönünden Core i5-8305G işlemci ve Radeon RX Vega M GL grafik kartı Core i7-7700HQ ve GTX 1050 ile kıyaslanabilir.
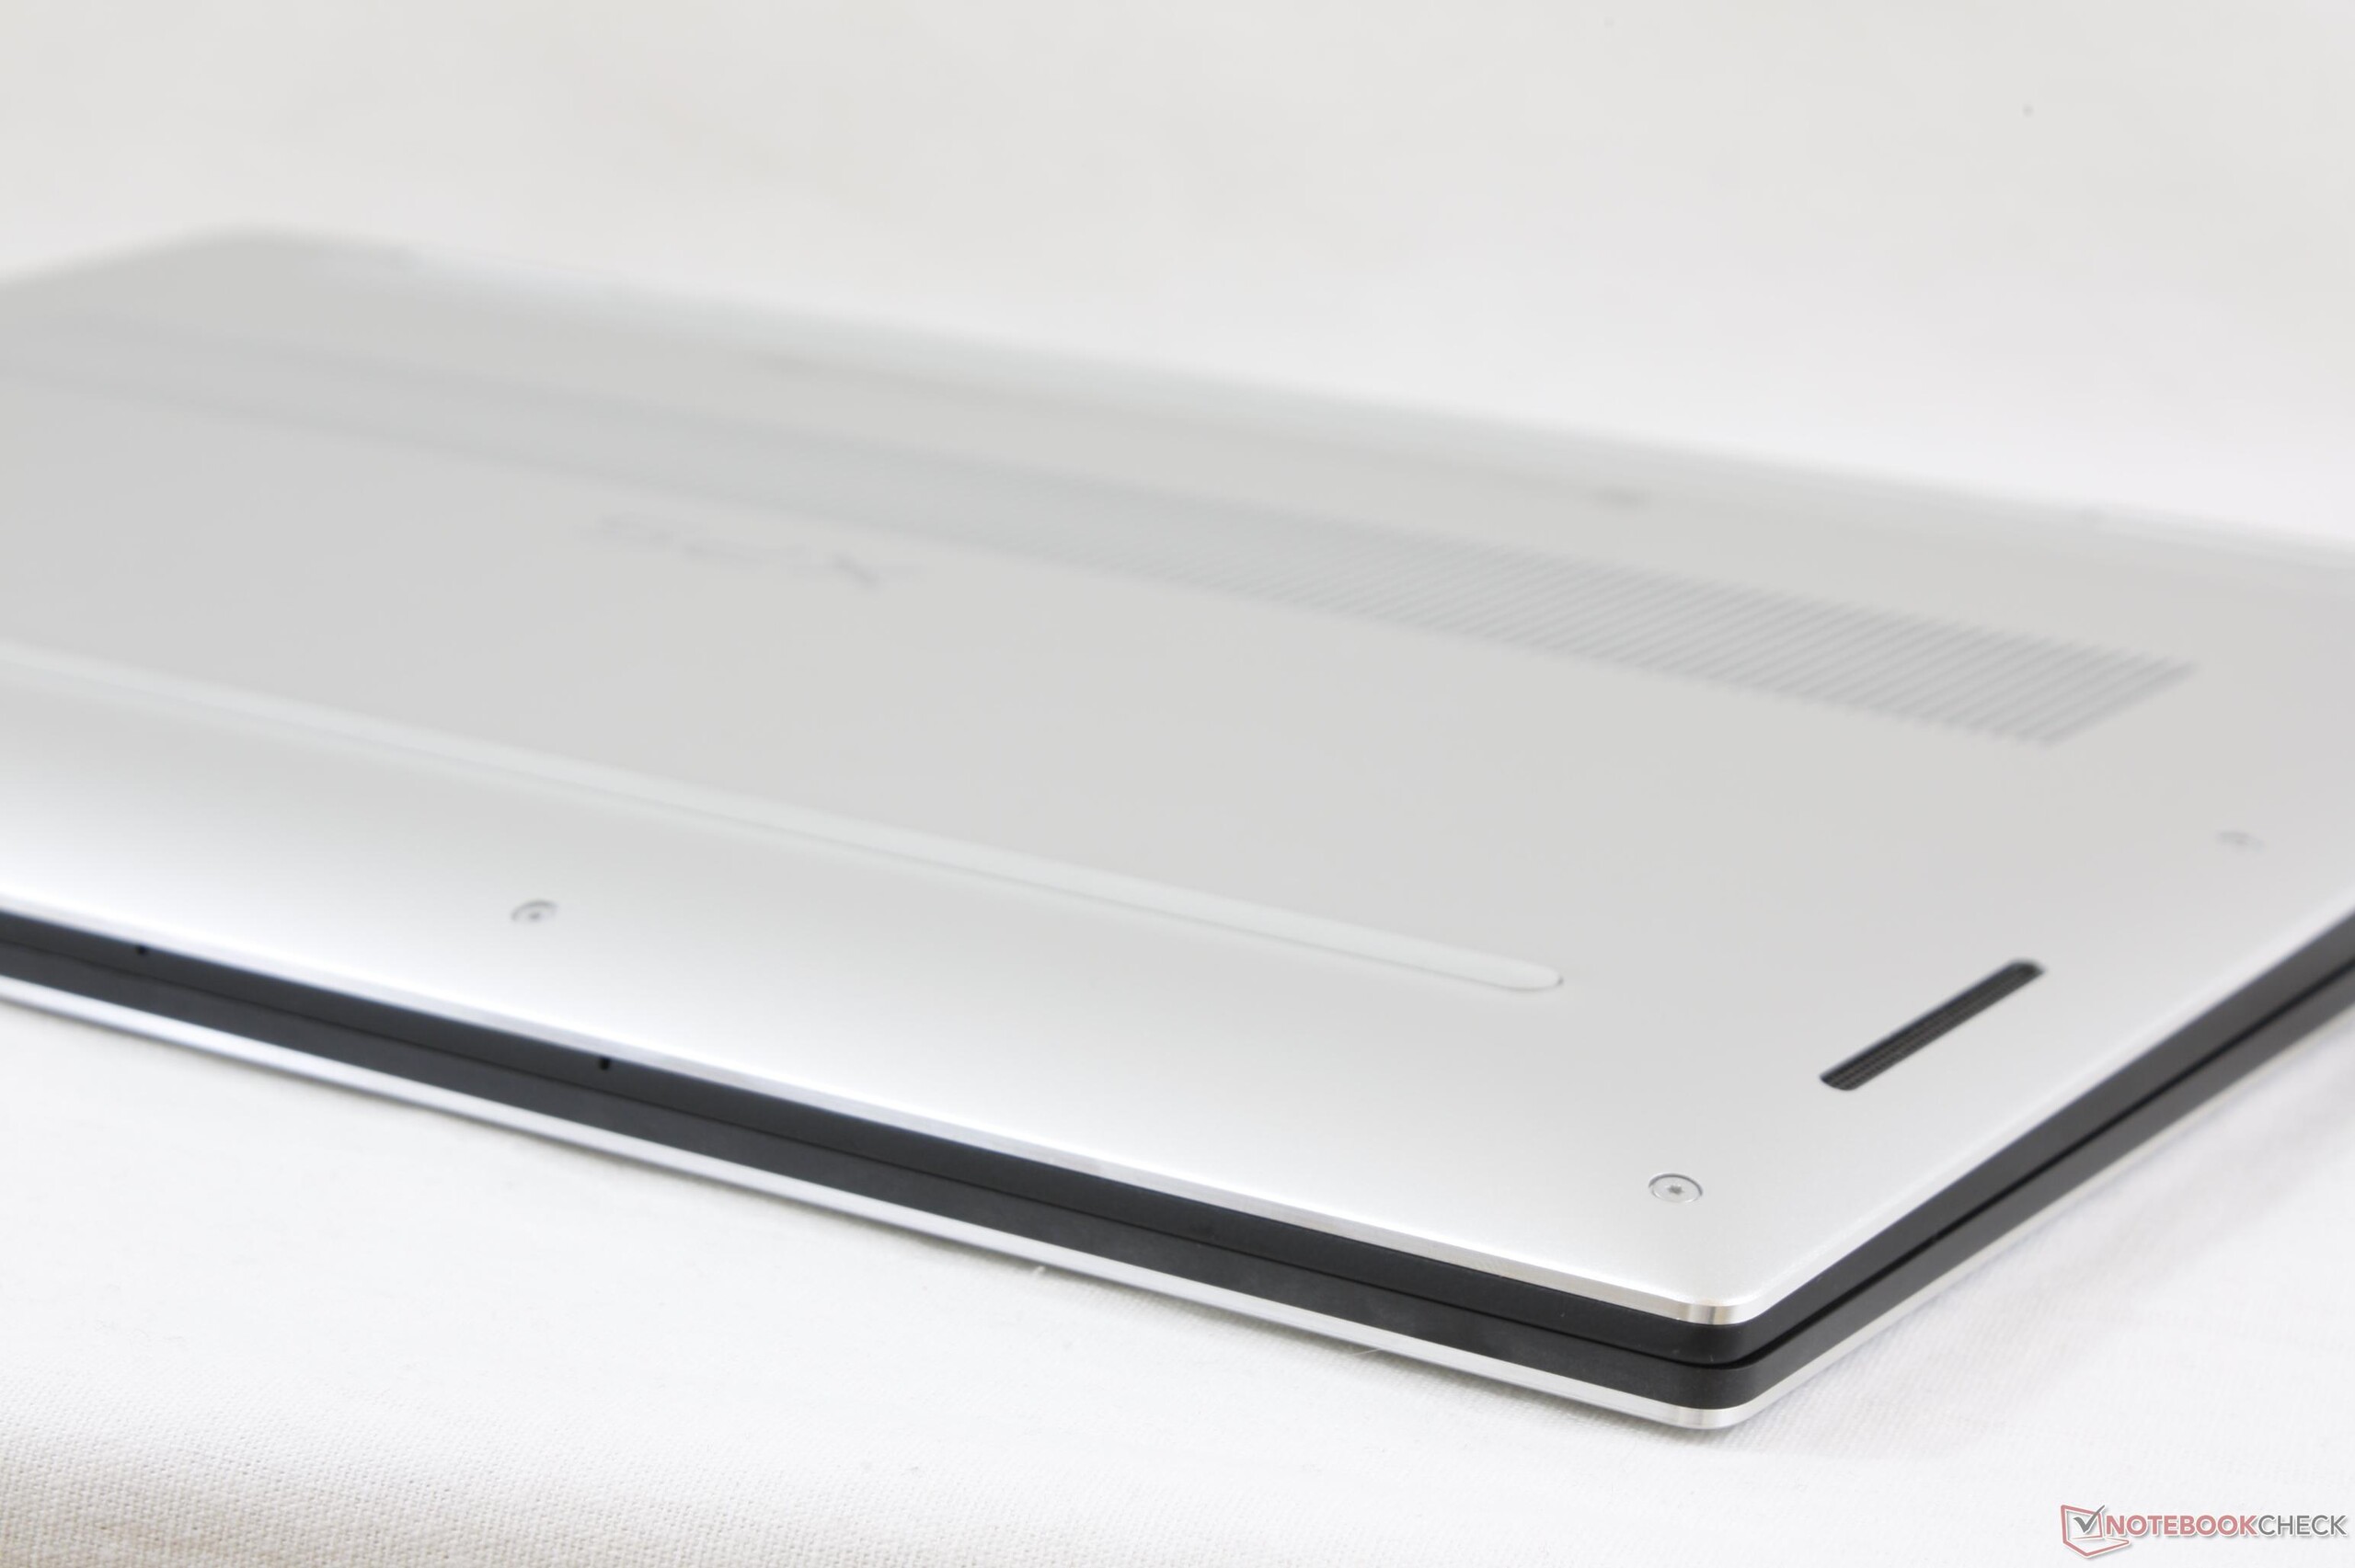
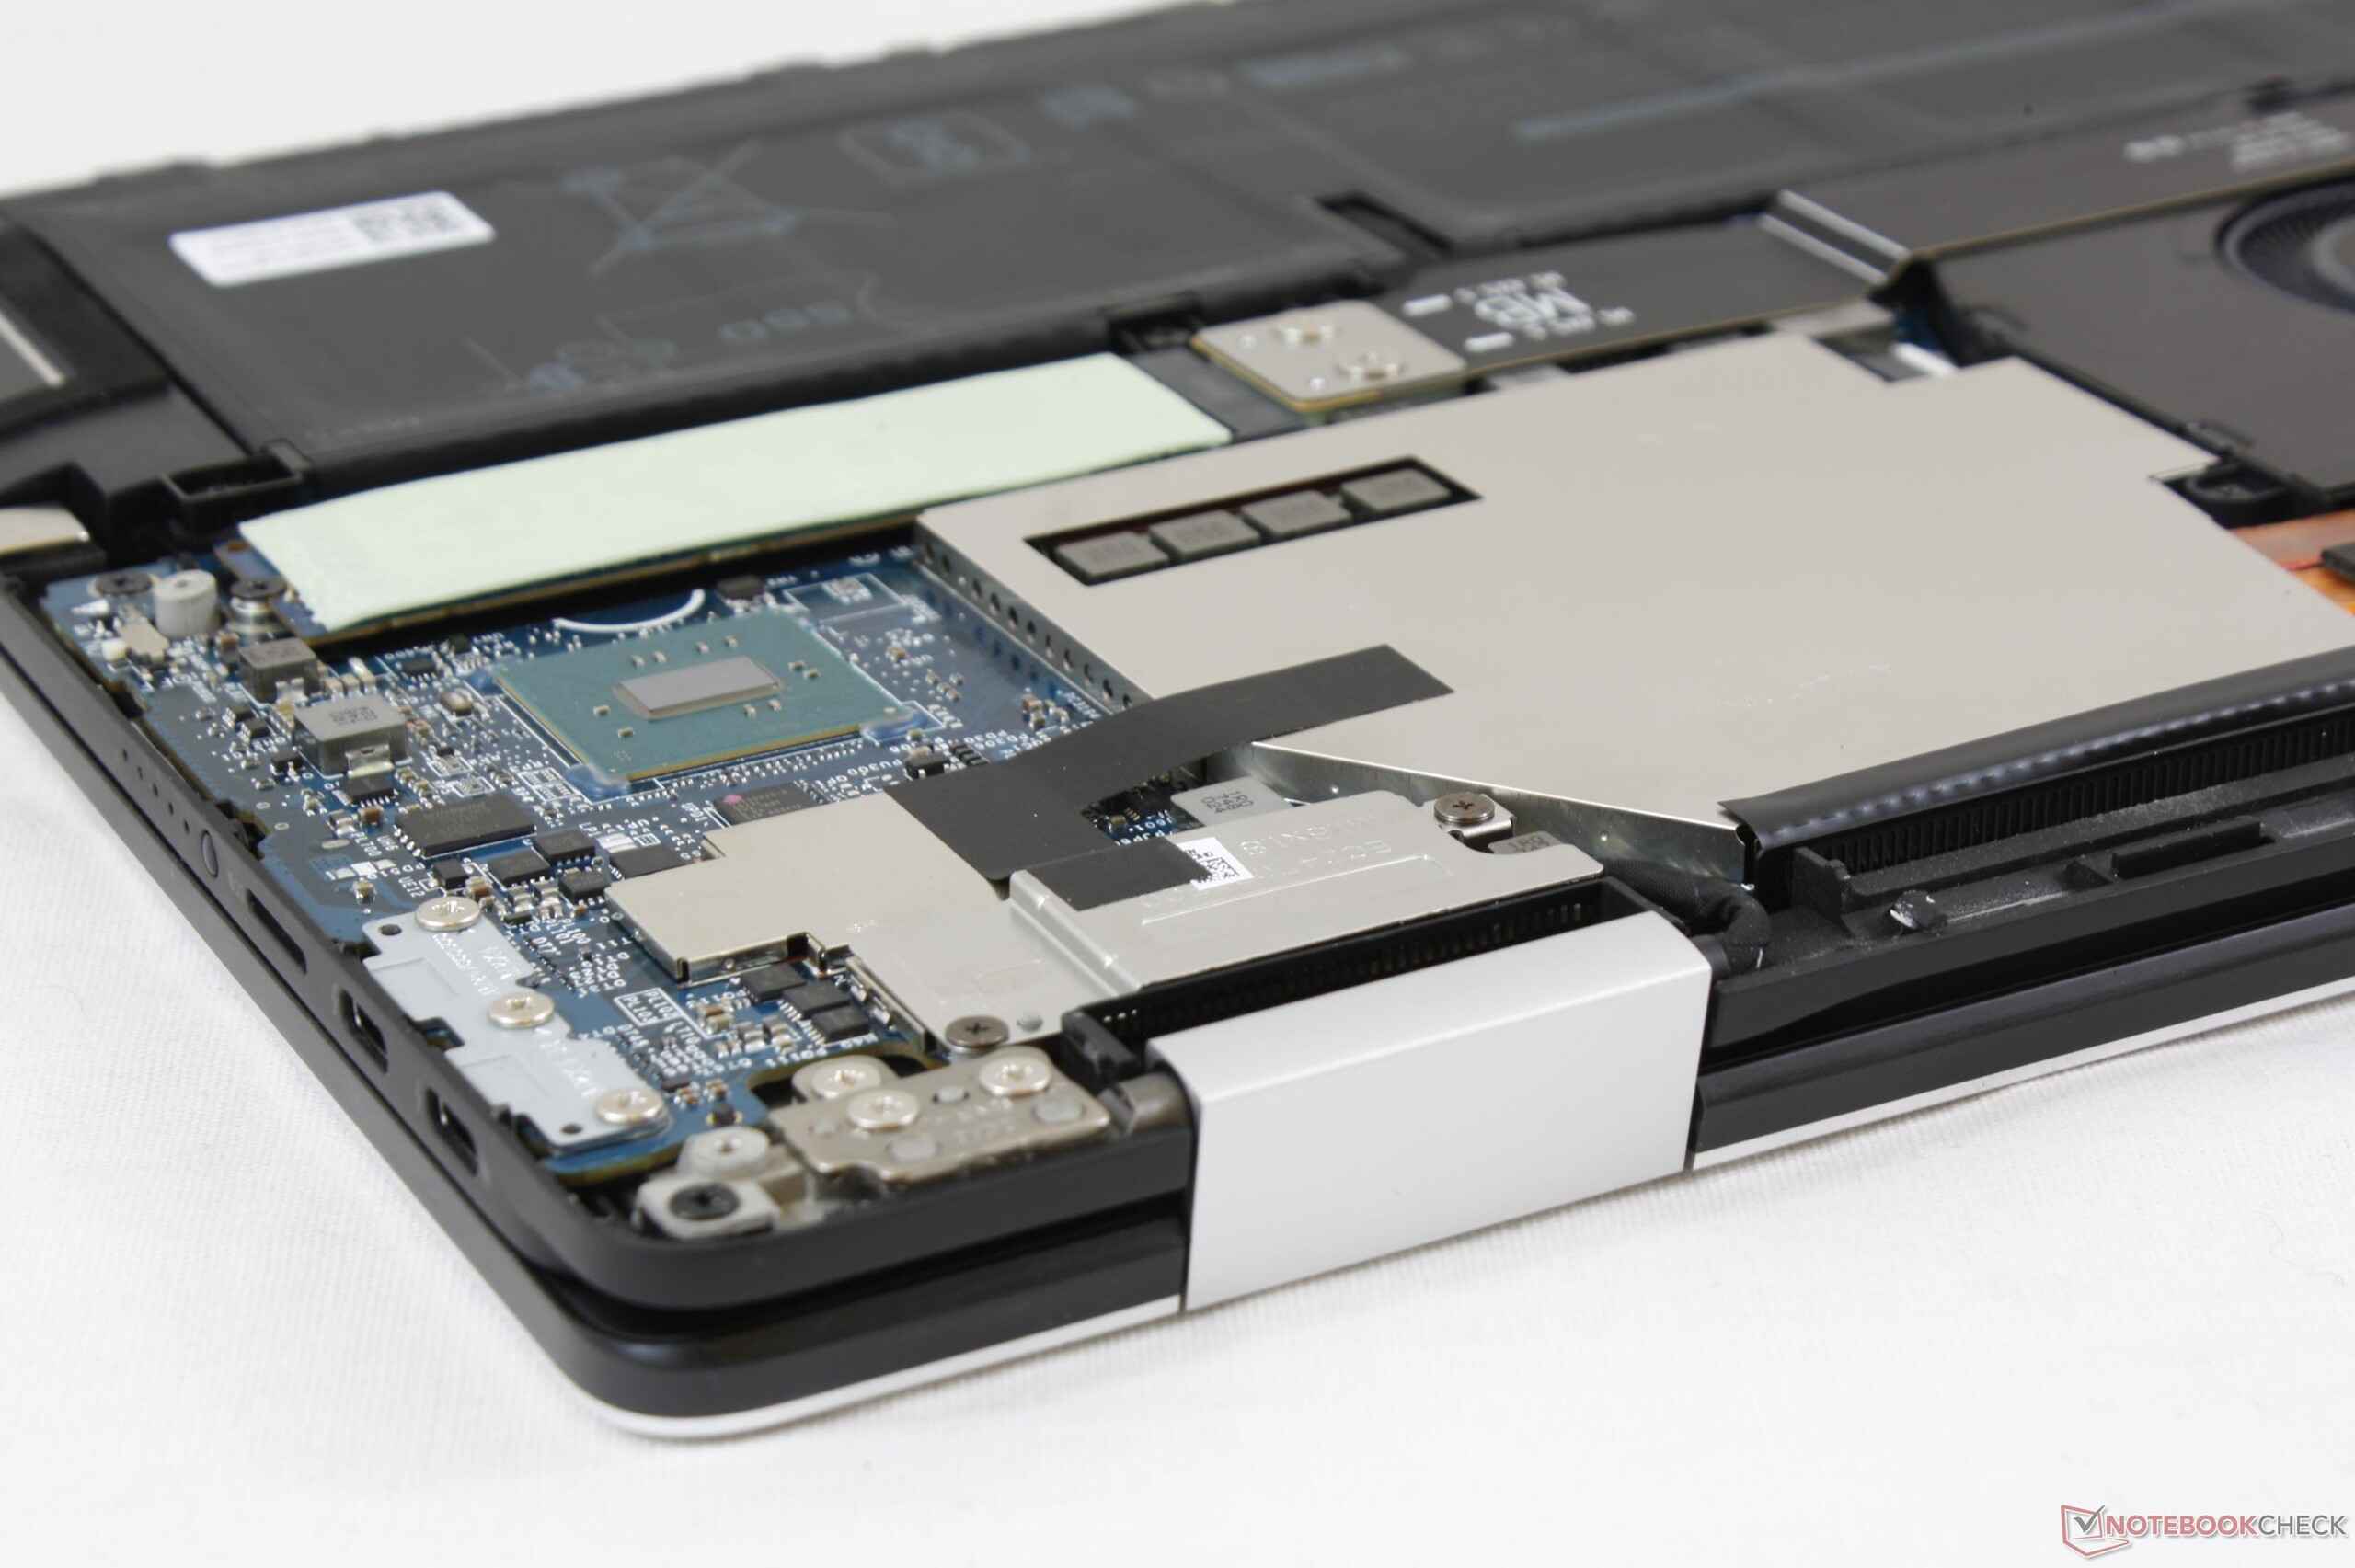
Fiyat ve bileşenler yönünden fark ortada iken, sistem değerlerine bakmak asıl önemli nokta. Bizi şaşırtan ise yeni modelin daha sessiz, daha serin ve daha uzun kullanım ömrüne sahip olması. Açıkcası bu bir başarı, çünkü bu modelde daha küçük bir batarya bulunuyor ve cihaz daha ince bir forma sahip.
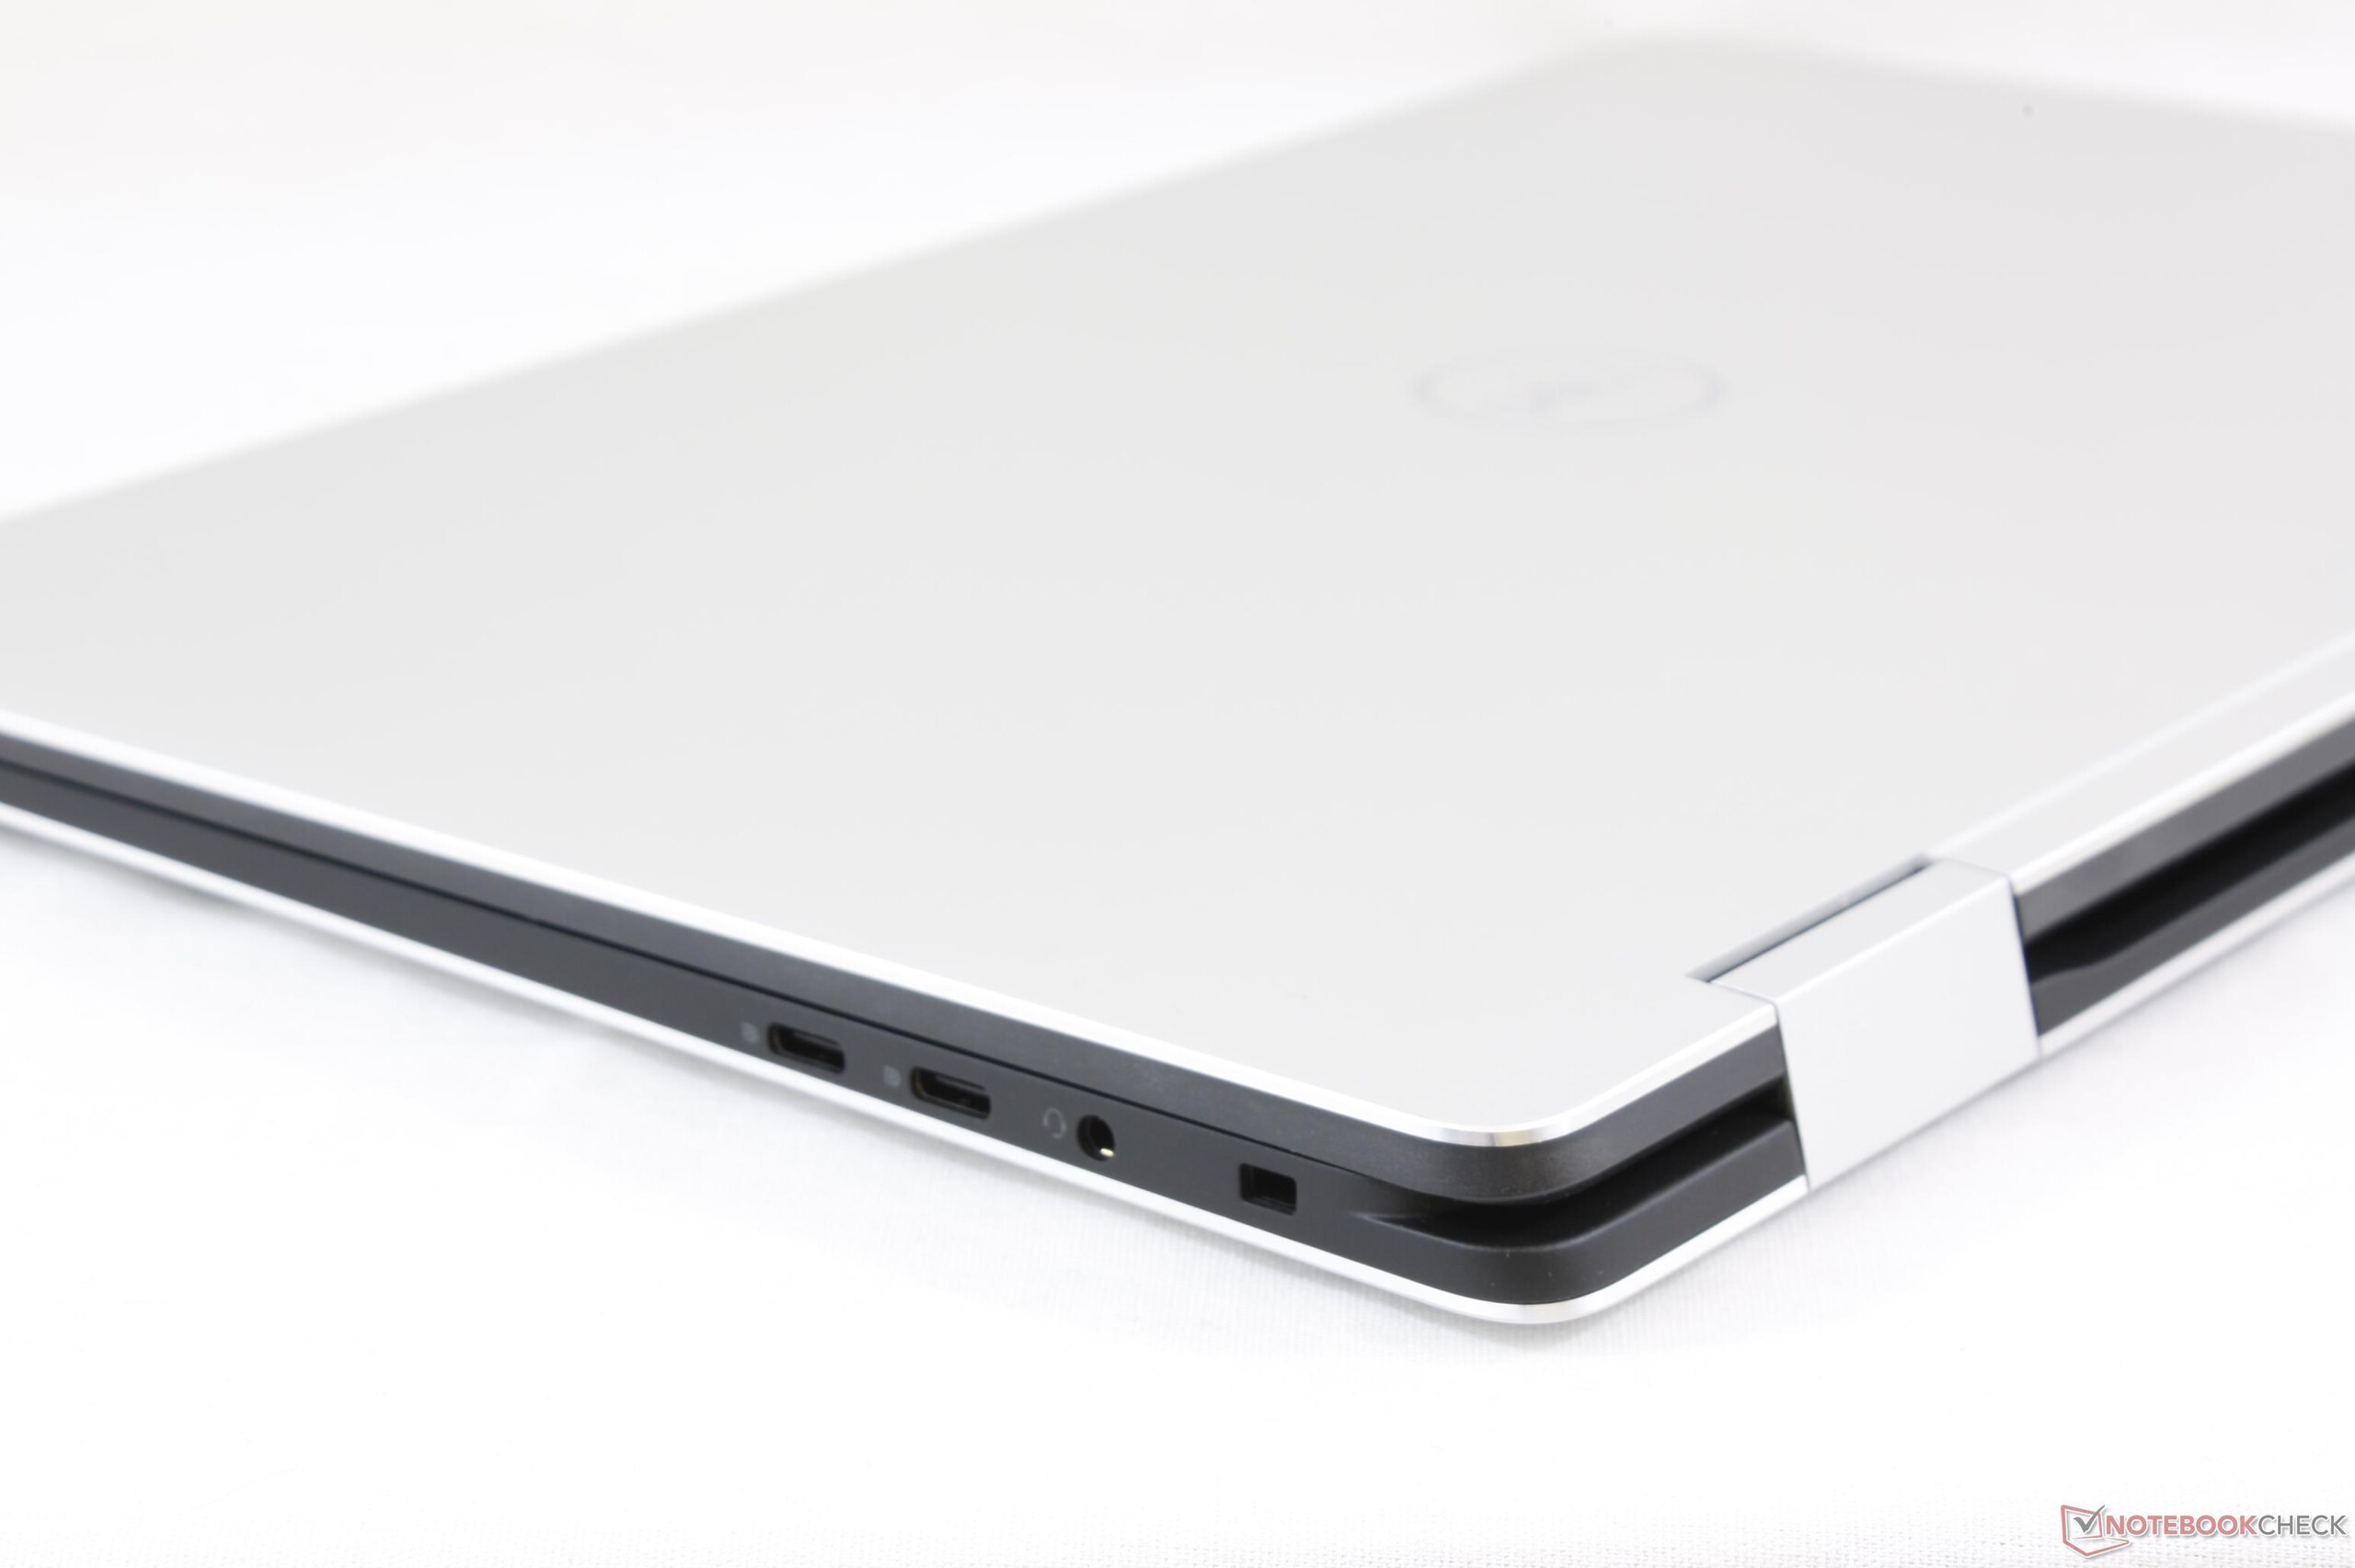
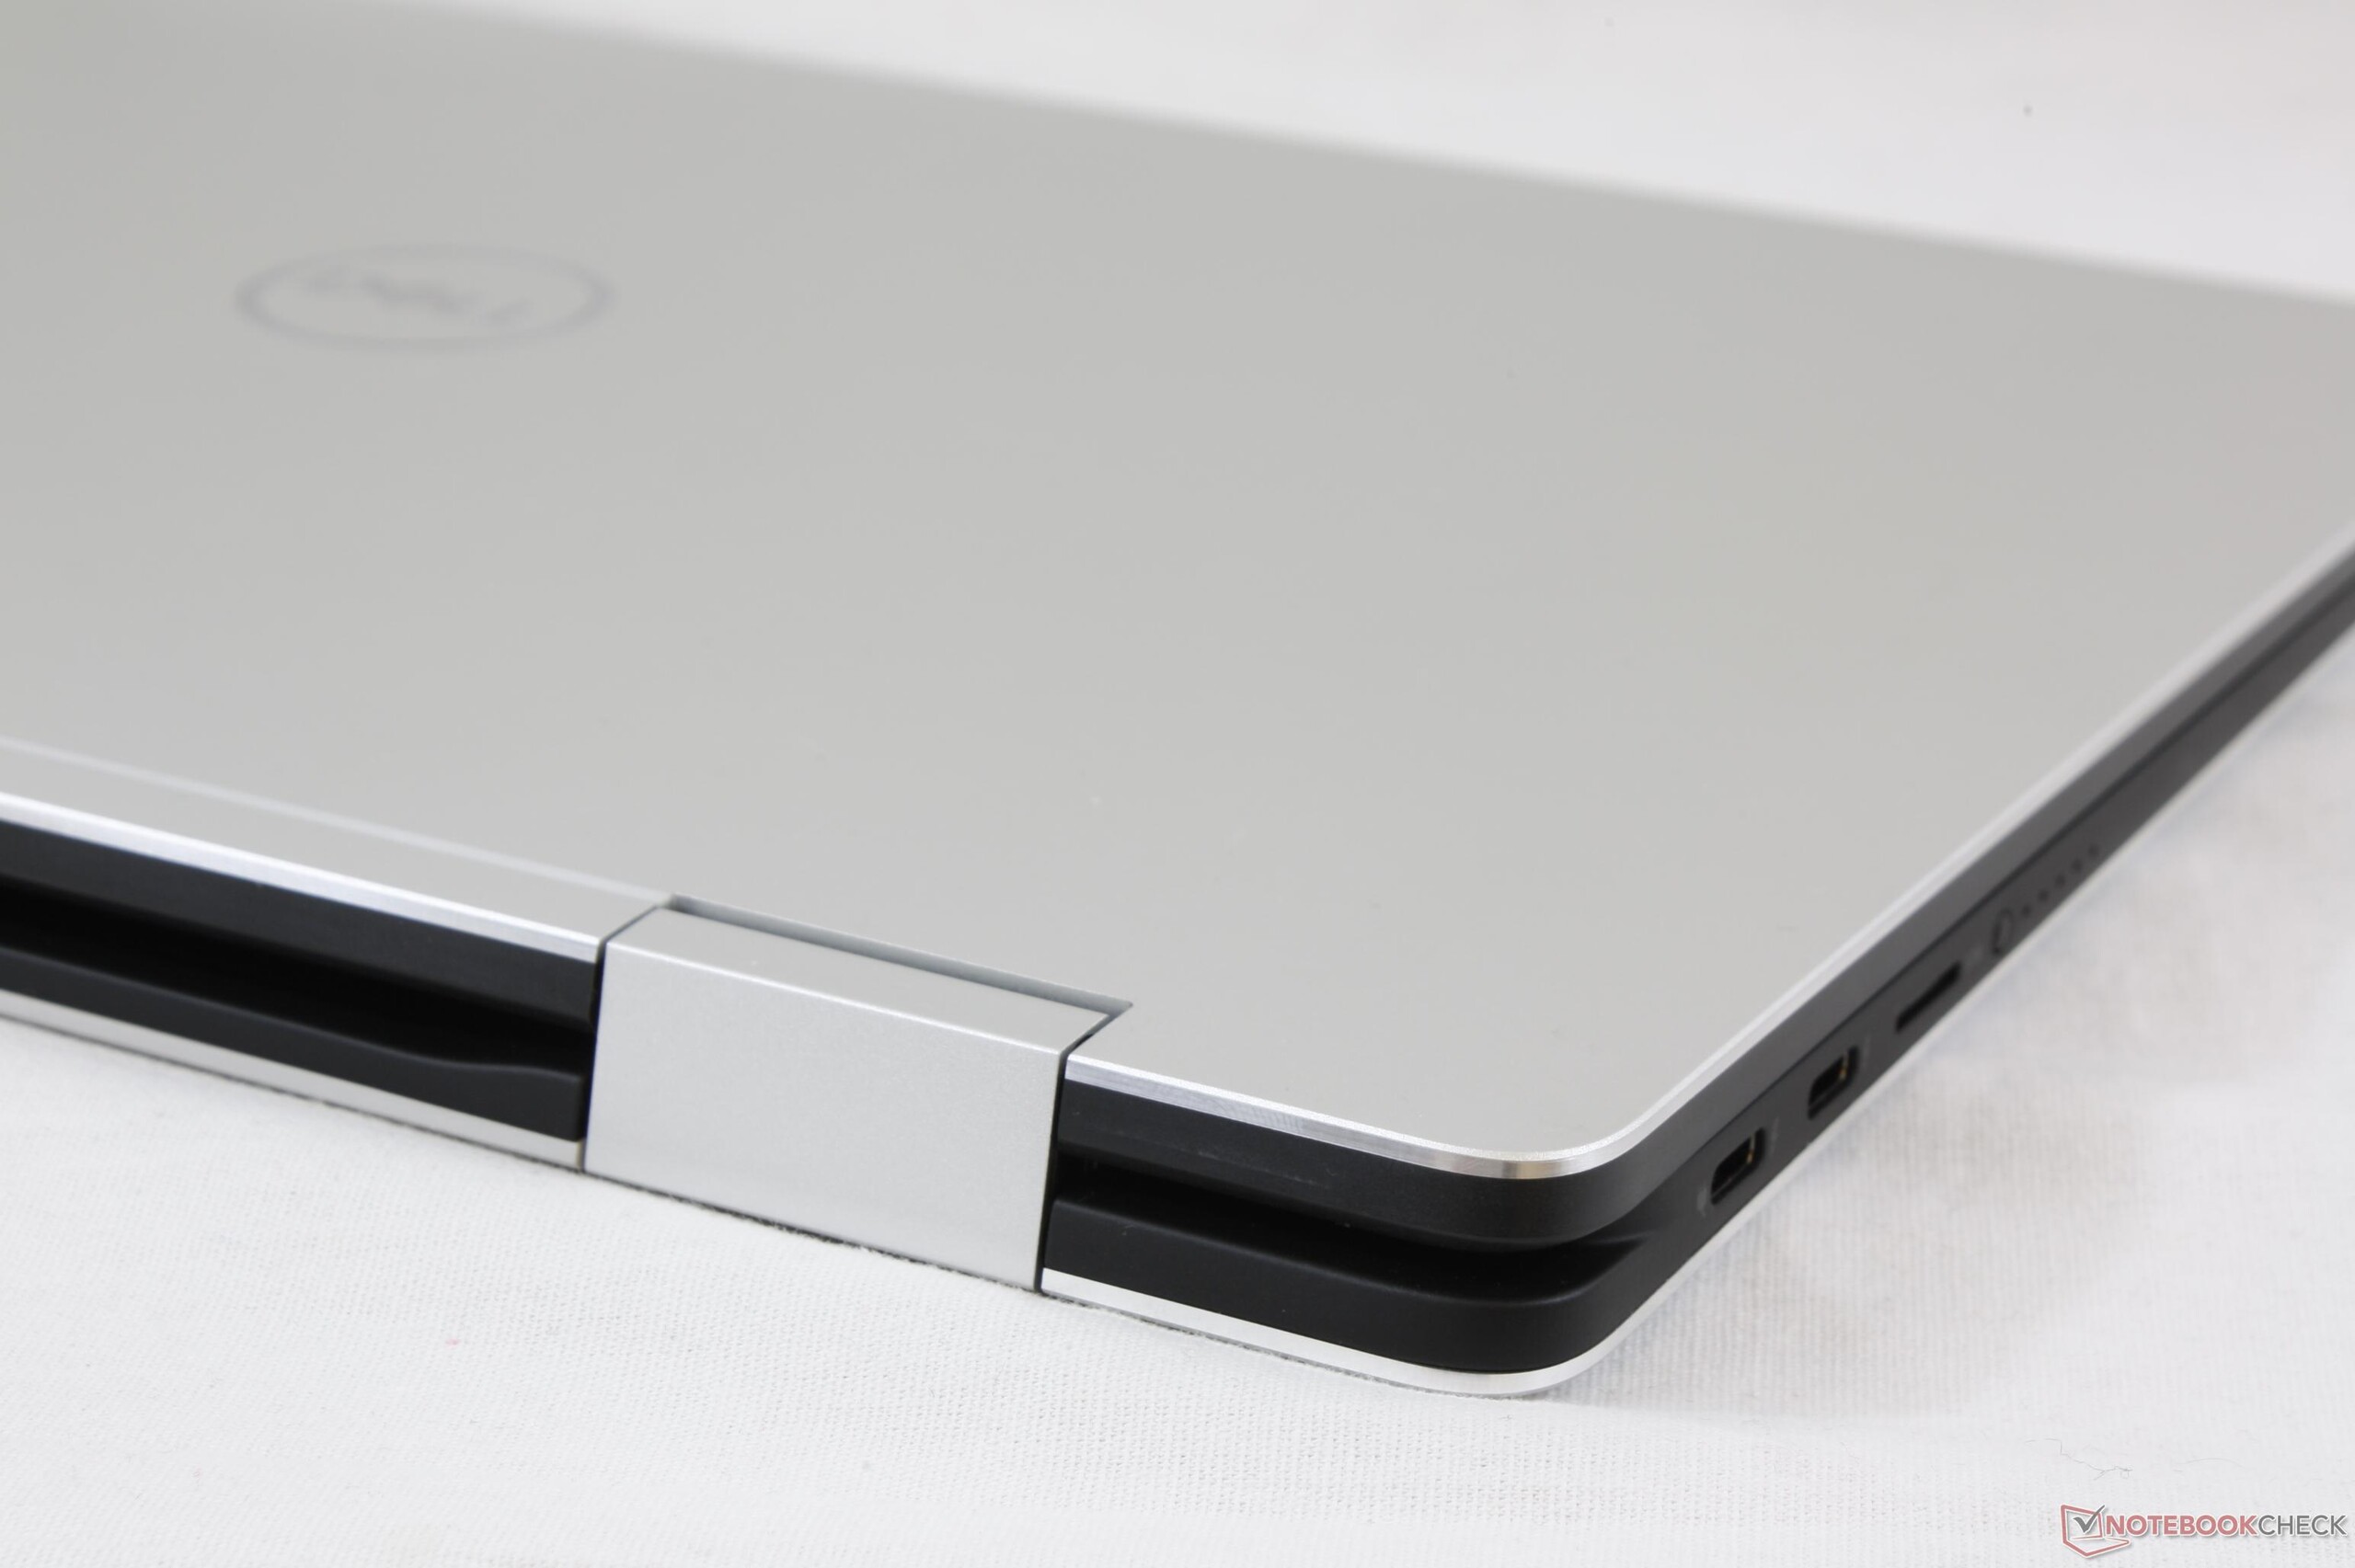
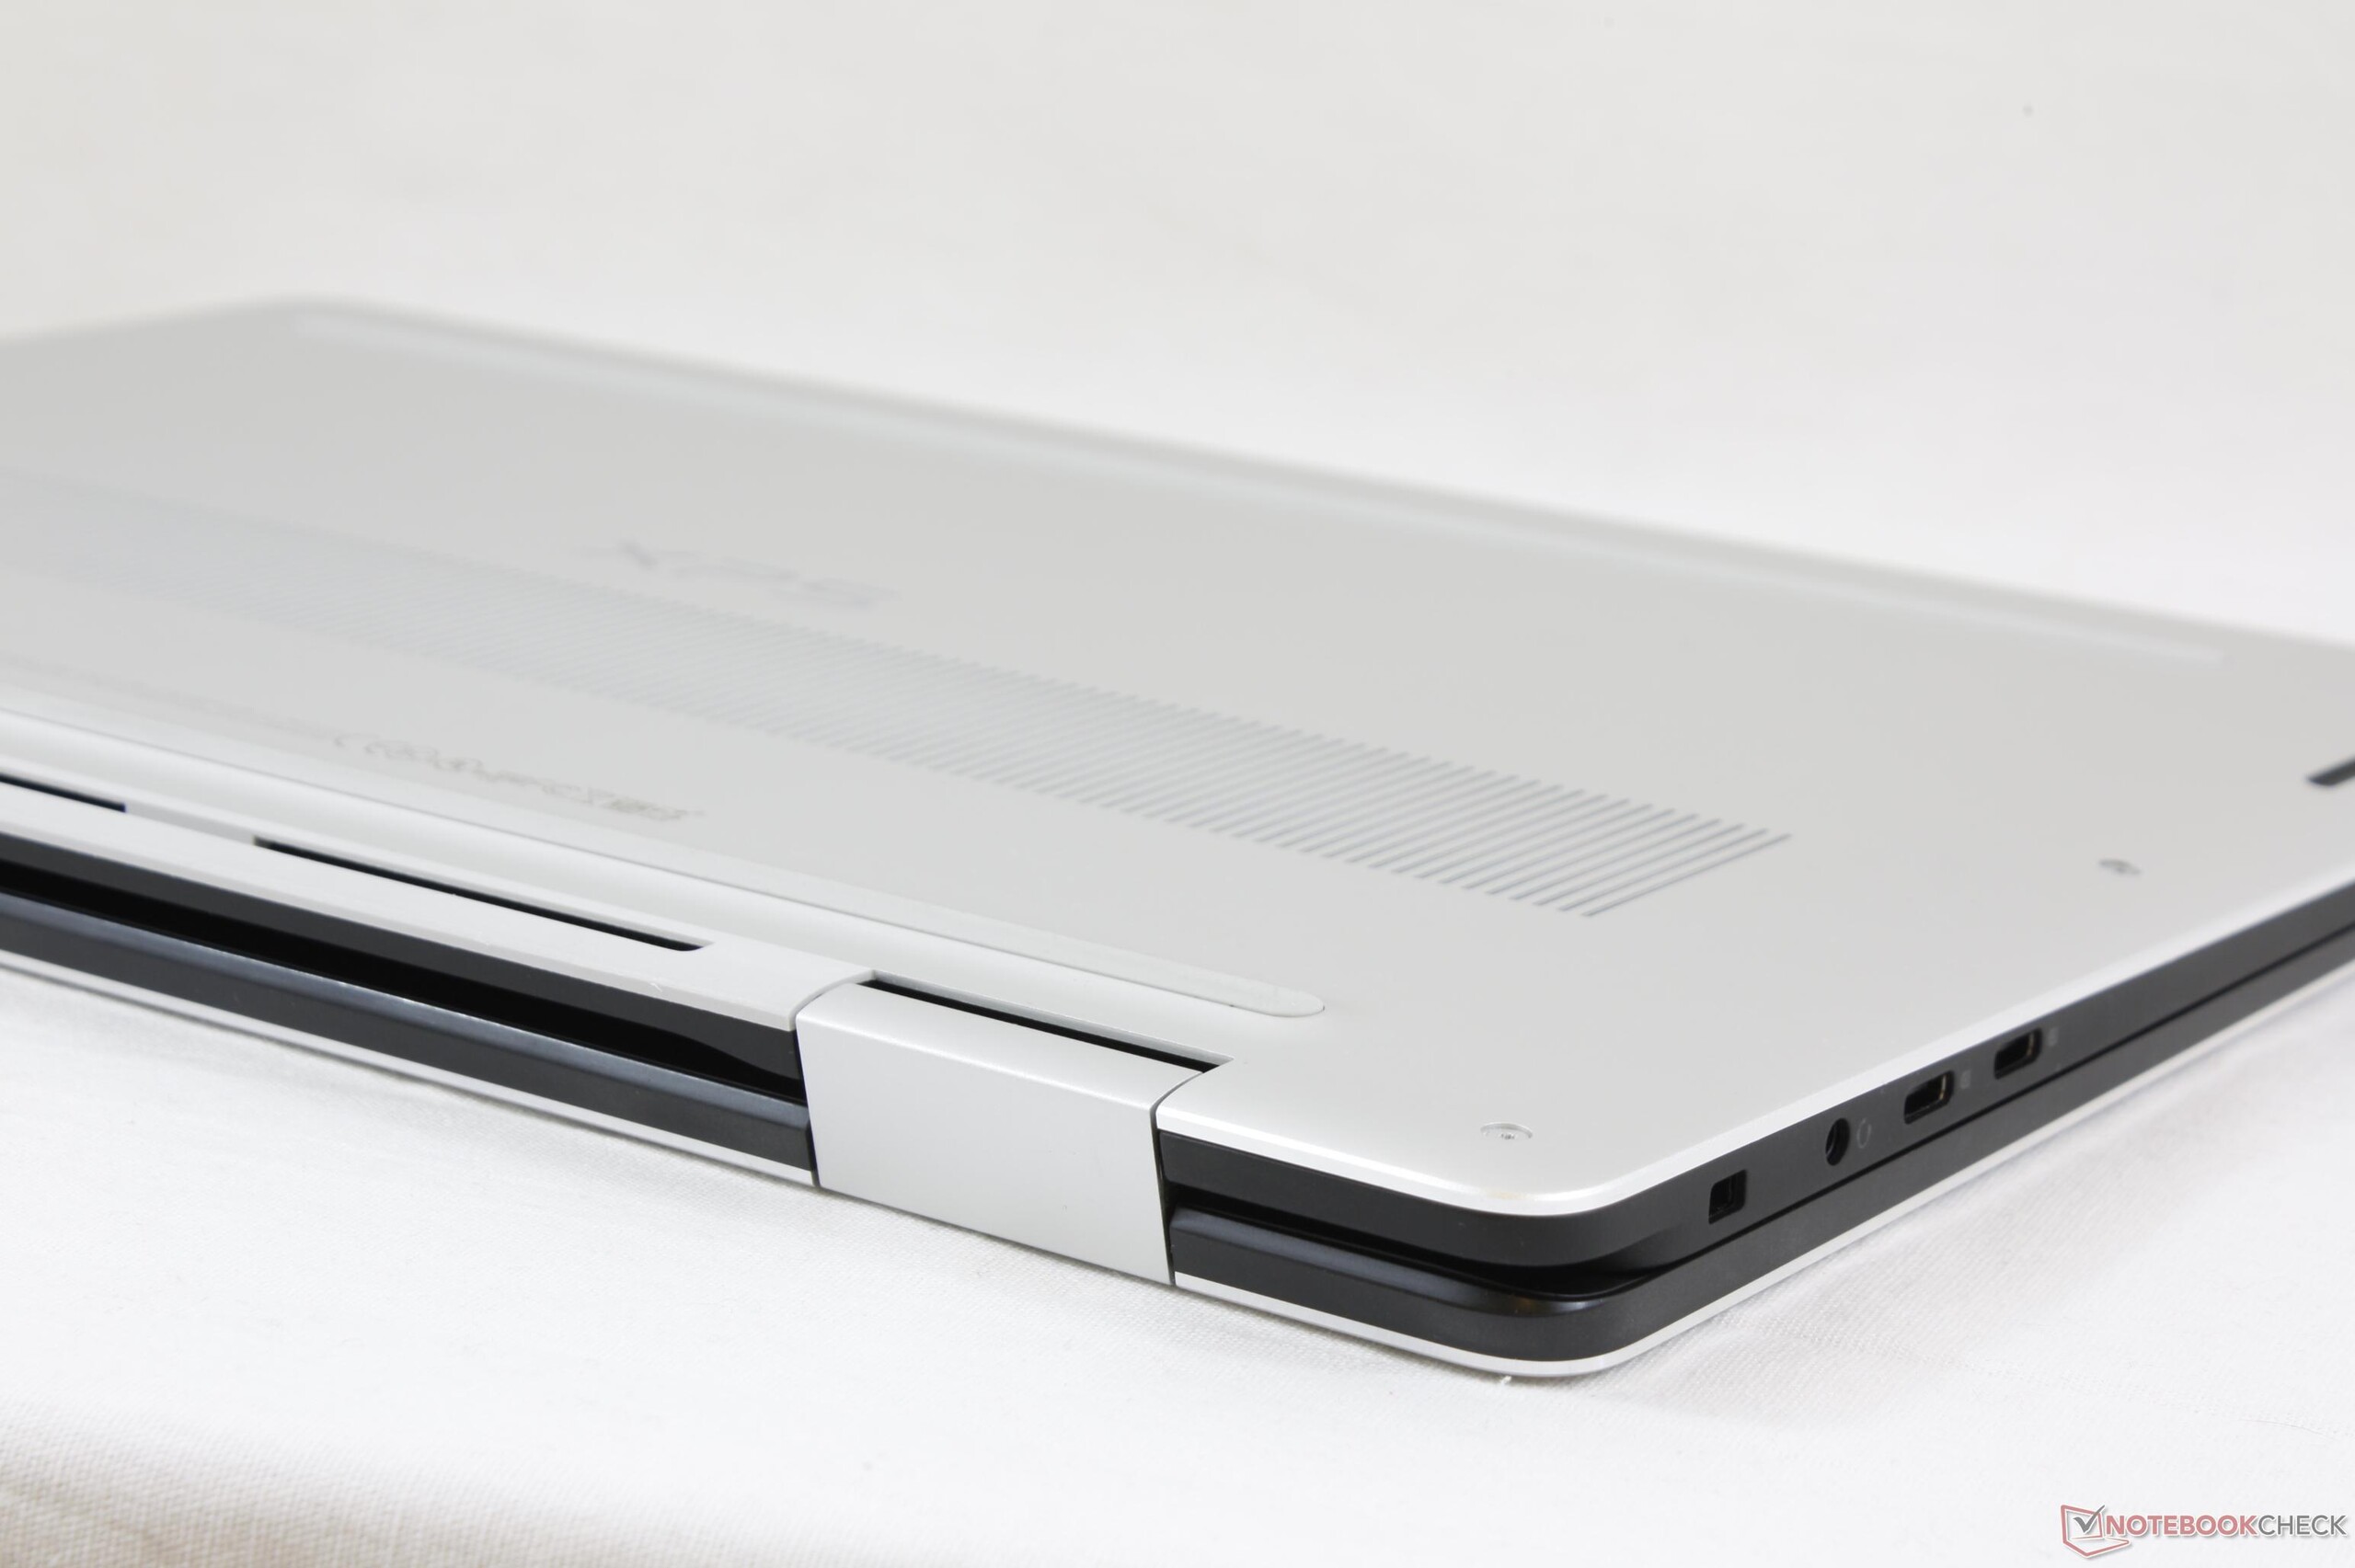
Maglev klavyeyi ise beğenip, beğenmemek kişisel zevk meselesi. Cihazın bunun dışındaki dezavantaj sayılabilecek noktaları arasında lehimli bellek, ağırlık, tamamen USB C kullanımı, kısıtlı depolama alanı seçenekleri gibi noktalar var. Oyun performansı GTX 1050 modelinin gerisinde kalıyor ama idare eder. Kaby Lake-G modelleri gün geçtikçe daha fazla karşımıza çıkacak. Ancak bu modelin belki de en büyük dezavantajı sürekli yanınızda USB C adaptörleri taşıma zorunluluğu olacak gibi.
Dell XPS 15 9575 i5-8305G
-
04/22/2018 v6(old)
Allen Ngo
Pricecompare
