 Deutsch
 English
 Español
 Français
 Italiano
 Nederlands
 Polski
 Português
 Русский
 Türkçe
 Svenska
 Chinese
 Magyar
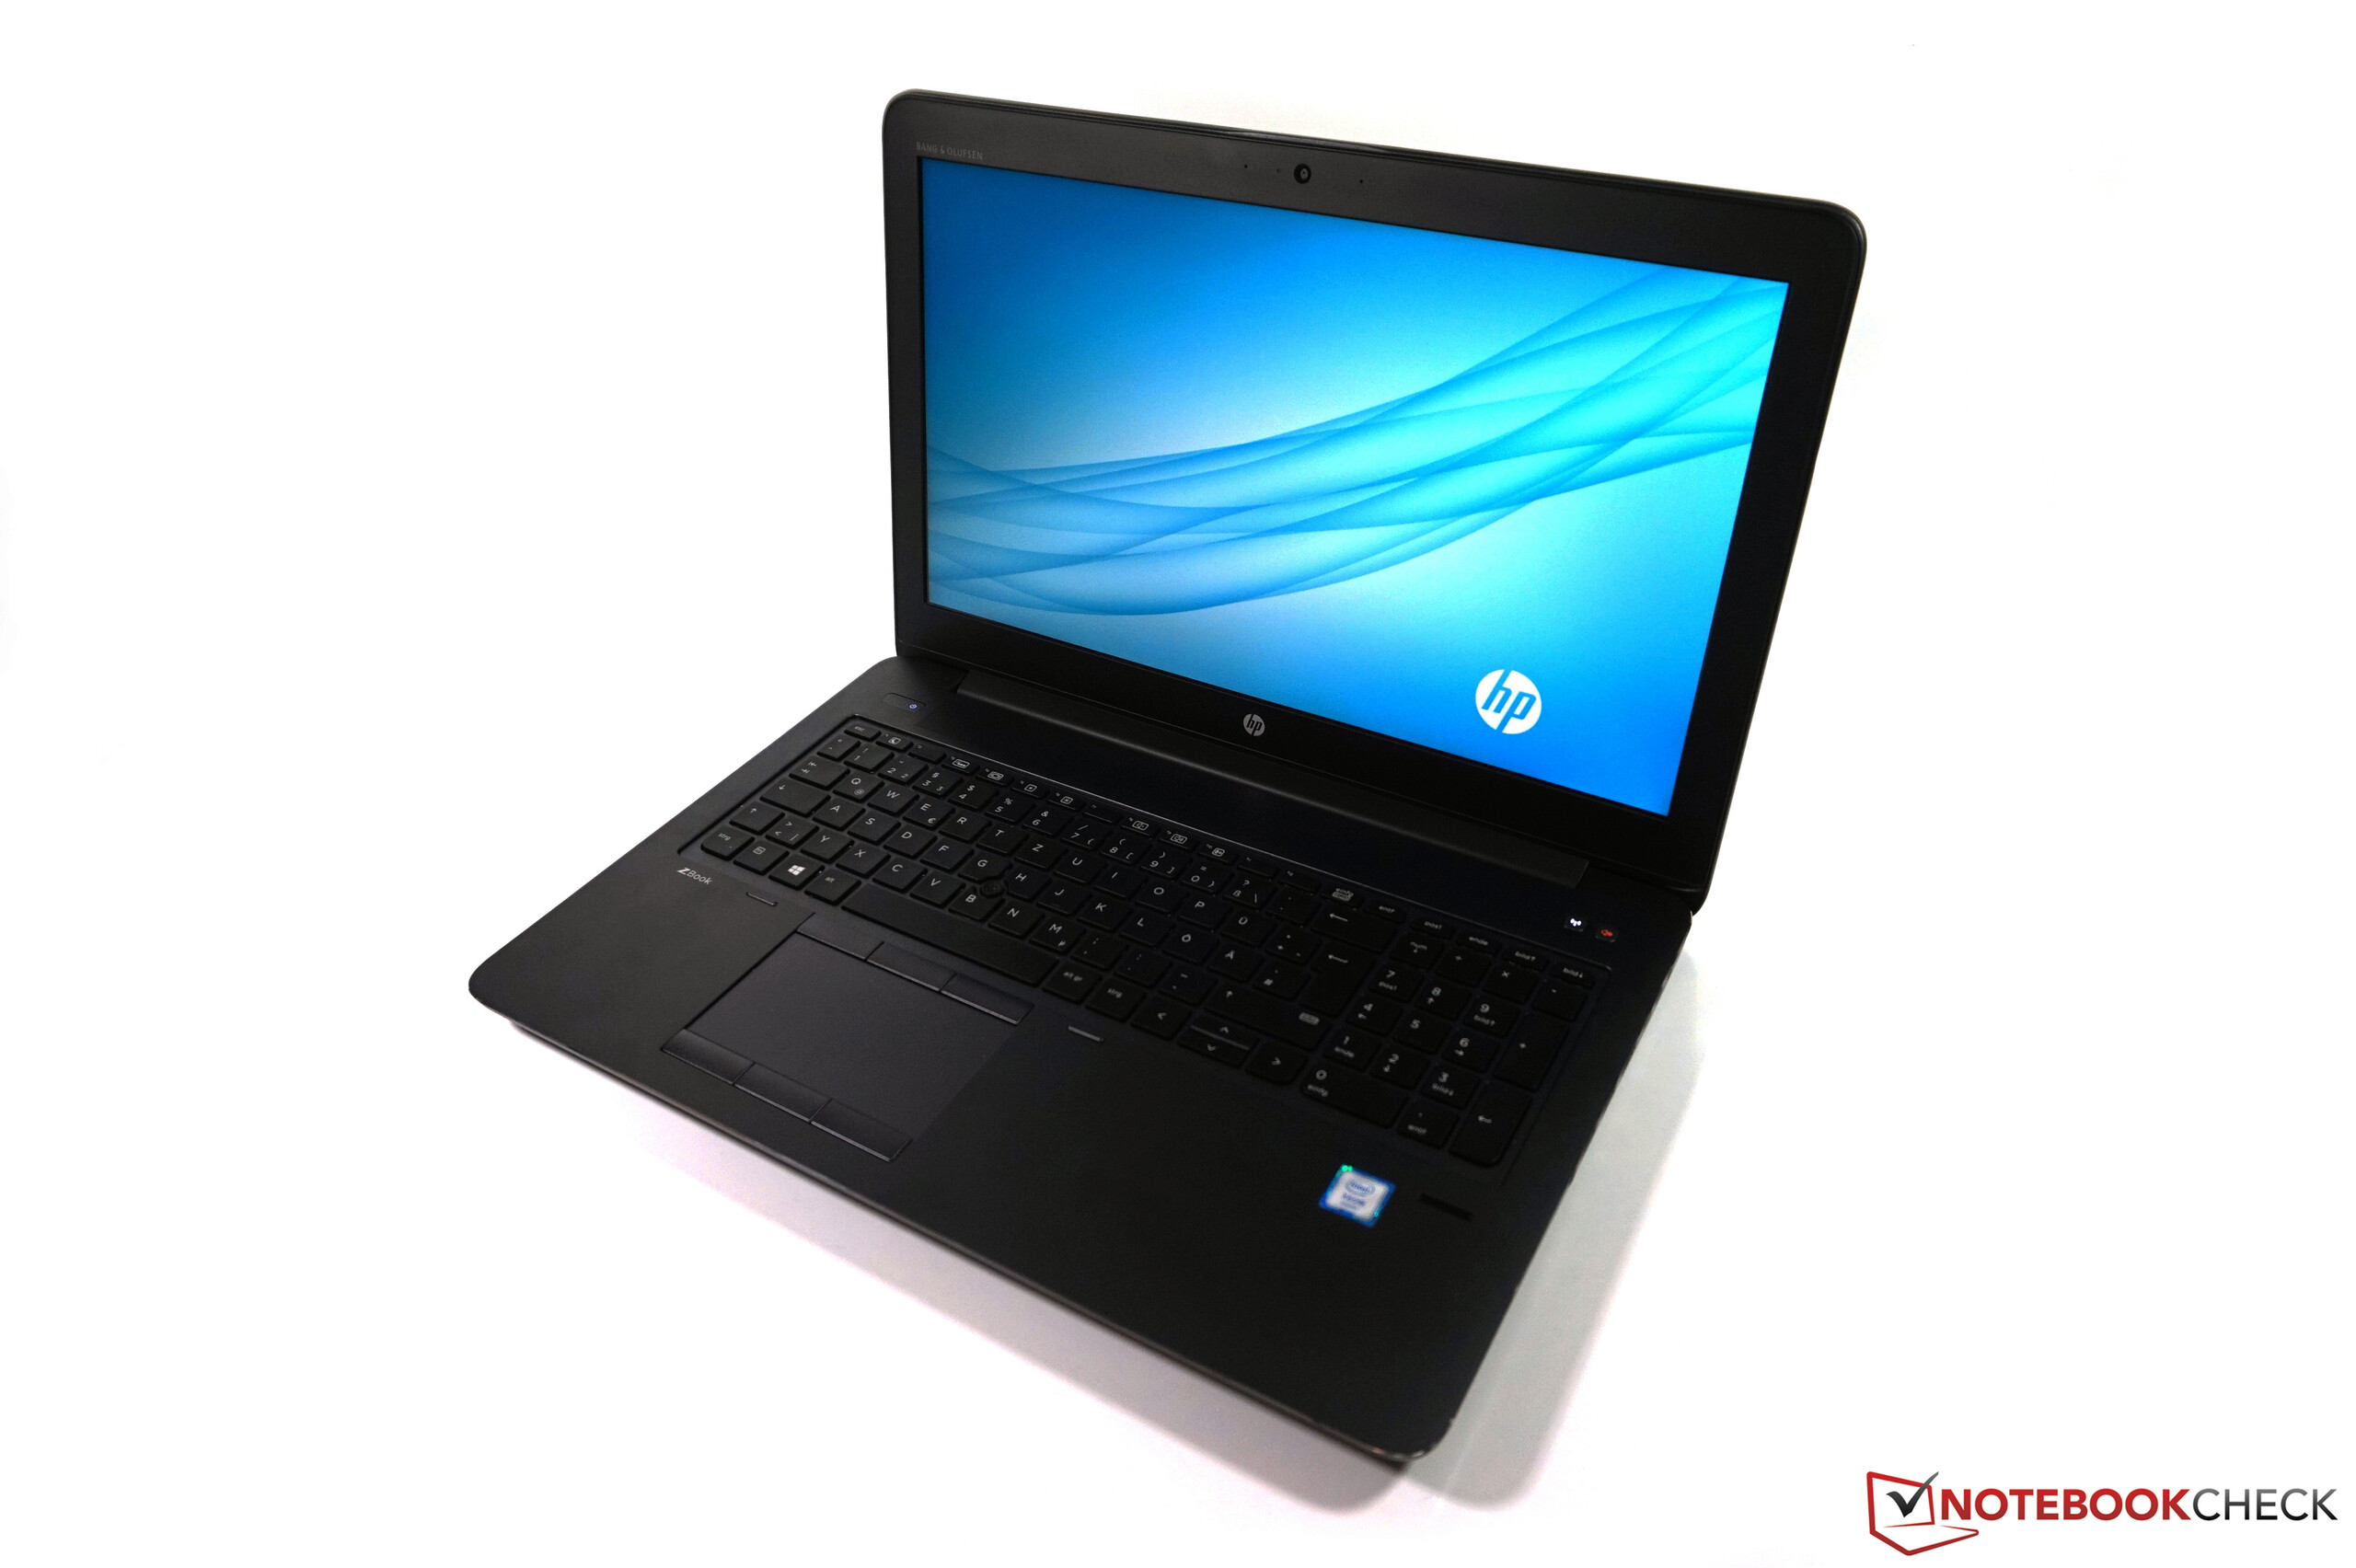
Kısa inceleme: HP ZBook 15 G3 çalışma istasyonu

| |||||||||||||||||||||||||
Aydınlatma: 85 %
Batarya modunda parlaklık: 306 cd/m²
Kontrast: 900:1 (Siyah: 0.34 cd/m²)
ΔE Color 5.1 | 0.5-29.43 Ø5
ΔE Greyscale 7.4 | 0.57-98 Ø5.3
95% sRGB (Argyll 1.6.3 3D)
63% AdobeRGB 1998 (Argyll 1.6.3 3D)
69% AdobeRGB 1998 (Argyll 2.2.0 3D)
95.5% sRGB (Argyll 2.2.0 3D)
66.8% Display P3 (Argyll 2.2.0 3D)
Gamma: 2.37
| HP ZBook 15 G3 Samsung SDC5344, UWVA-IPS, 1920x1080 | Lenovo ThinkPad P50 LP156WF6-SPK1, IPS, 1920x1080 | Dell Precision 5510 SHP143E, 7PHPT_LQ156D1, IGZO LED, 3840x2160 | Dell XPS 15 2016 9550 Sharp SHP1453 LQ156M1 Dell PN: 1203M, IPS, 1920x1080 | HP ZBook 15 G2 Samsung SDC5344, IPS LED, 1920x1080 | |
|---|---|---|---|---|---|
| Display | -40% | 27% | 3% | 2% | |
| Display P3 Coverage | 66.8 | 39.13 -41% | 88.4 32% | 68.8 3% | 68.5 3% |
| sRGB Coverage | 95.5 | 58.5 -39% | 100 5% | 97.9 3% | 97.3 2% |
| AdobeRGB 1998 Coverage | 69 | 40.45 -41% | 99.5 44% | 70.7 2% | 70.7 2% |
| Response Times | 21% | 0% | 19% | ||
| Response Time Grey 50% / Grey 80% * | 54 ? | 46 ? 15% | 56.4 ? -4% | 62 ? -15% | |
| Response Time Black / White * | 35.6 ? | 26 ? 27% | 34 ? 4% | 40 ? -12% | |
| PWM Frequency | 198 ? | 362 ? 83% | |||
| Screen | -3% | 17% | 18% | -2% | |
| Brightness middle | 306 | 263 -14% | 391 28% | 399 30% | 309 1% |
| Brightness | 289 | 236 -18% | 361 25% | 394 36% | 289 0% |
| Brightness Distribution | 85 | 78 -8% | 87 2% | 89 5% | 84 -1% |
| Black Level * | 0.34 | 0.34 -0% | 0.4 -18% | 0.24 29% | 0.47 -38% |
| Contrast | 900 | 774 -14% | 978 9% | 1663 85% | 657 -27% |
| Colorchecker dE 2000 * | 5.1 | 2.35 54% | 4.85 5% | 5.95 -17% | 3.82 25% |
| Colorchecker dE 2000 max. * | 9.9 | ||||
| Greyscale dE 2000 * | 7.4 | 3.33 55% | 4.01 46% | 8.41 -14% | 5.94 20% |
| Gamma | 2.37 93% | 2.38 92% | 2.18 101% | 2.35 94% | 2.16 102% |
| CCT | 7263 89% | 6917 94% | 7340 89% | 7010 93% | 6996 93% |
| Color Space (Percent of AdobeRGB 1998) | 63 | 37 -41% | 96 52% | 64 2% | 63.8 1% |
| Color Space (Percent of sRGB) | 95 | 58 -39% | 100 5% | 98 3% | |
| Total Average (Program / Settings) | -7% /
-7% | 15% /
17% | 13% /
15% | 0% /
-1% |
* ... smaller is better
Display Response Times
| ↔ Response Time Black to White | ||
|---|---|---|
| 35.6 ms ... rise ↗ and fall ↘ combined | ↗ 11.6 ms rise | 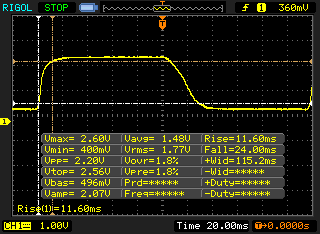 |
| ↘ 24 ms fall | ||
| The screen shows slow response rates in our tests and will be unsatisfactory for gamers. In comparison, all tested devices range from 0.1 (minimum) to 240 (maximum) ms. » 93 % of all devices are better. This means that the measured response time is worse than the average of all tested devices (21.5 ms). | ||
| ↔ Response Time 50% Grey to 80% Grey | ||
| 54 ms ... rise ↗ and fall ↘ combined | ↗ 24.4 ms rise | 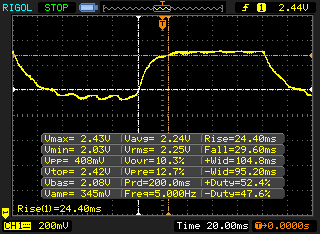 |
| ↘ 29.6 ms fall | ||
| The screen shows slow response rates in our tests and will be unsatisfactory for gamers. In comparison, all tested devices range from 0.2 (minimum) to 636 (maximum) ms. » 89 % of all devices are better. This means that the measured response time is worse than the average of all tested devices (33.8 ms). | ||
Screen Flickering / PWM (Pulse-Width Modulation)
| Screen flickering / PWM detected | 198 Hz | ≤ 95 % brightness setting | 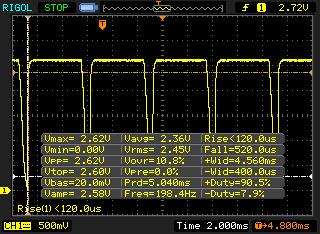 |
The display backlight flickers at 198 Hz (worst case, e.g., utilizing PWM) Flickering detected at a brightness setting of 95 % and below. There should be no flickering or PWM above this brightness setting. The frequency of 198 Hz is relatively low, so sensitive users will likely notice flickering and experience eyestrain at the stated brightness setting and below. In comparison: 53 % of all tested devices do not use PWM to dim the display. If PWM was detected, an average of 17942 (minimum: 5 - maximum: 3846000) Hz was measured. | |||
| Cinebench R15 | |
| CPU Multi 64Bit | |
| Dell Precision 5510 | |
| HP ZBook 15 G3 | |
| MSI WS60-6QJE316H11 | |
| HP ZBook 15 G2 | |
| Lenovo ThinkPad P50 | |
| Dell XPS 15 2016 9550 | |
| CPU Single 64Bit | |
| MSI WS60-6QJE316H11 | |
| HP ZBook 15 G3 | |
| HP ZBook 15 G2 | |
| Dell Precision 5510 | |
| Dell XPS 15 2016 9550 | |
| Lenovo ThinkPad P50 | |
| Cinebench R11.5 | |
| CPU Multi 64Bit | |
| Dell Precision 5510 | |
| HP ZBook 15 G3 | |
| MSI WS60-6QJE316H11 | |
| HP ZBook 15 G2 | |
| Lenovo ThinkPad P50 | |
| Dell XPS 15 2016 9550 | |
| CPU Single 64Bit | |
| MSI WS60-6QJE316H11 | |
| HP ZBook 15 G3 | |
| HP ZBook 15 G2 | |
| Dell Precision 5510 | |
| Dell XPS 15 2016 9550 | |
| Lenovo ThinkPad P50 | |
| Cinebench R10 | |
| Rendering Multiple CPUs 32Bit | |
| HP ZBook 15 G3 | |
| Dell Precision 5510 | |
| MSI WS60-6QJE316H11 | |
| HP ZBook 15 G2 | |
| Lenovo ThinkPad P50 | |
| Dell XPS 15 2016 9550 | |
| Rendering Single 32Bit | |
| MSI WS60-6QJE316H11 | |
| HP ZBook 15 G3 | |
| HP ZBook 15 G2 | |
| Dell Precision 5510 | |
| Dell XPS 15 2016 9550 | |
| Lenovo ThinkPad P50 | |
| Rendering Multiple CPUs 64Bit | |
| HP ZBook 15 G3 | |
| Dell Precision 5510 | |
| HP ZBook 15 G2 | |
| MSI WS60-6QJE316H11 | |
| Lenovo ThinkPad P50 | |
| Dell XPS 15 2016 9550 | |
| Rendering Single CPUs 64Bit | |
| MSI WS60-6QJE316H11 | |
| HP ZBook 15 G2 | |
| HP ZBook 15 G3 | |
| Dell Precision 5510 | |
| Dell XPS 15 2016 9550 | |
| Lenovo ThinkPad P50 | |
| PCMark 7 - Score | |
| HP ZBook 15 G2 | |
| HP ZBook 15 G3 | |
| MSI WS60-6QJE316H11 | |
| Dell Precision 5510 | |
| Dell XPS 15 2016 9550 | |
| Lenovo ThinkPad P50 | |
| PCMark 8 | |
| Home Score Accelerated v2 | |
| HP ZBook 15 G2 | |
| Lenovo ThinkPad P50 | |
| HP ZBook 15 G3 | |
| Dell Precision 5510 | |
| Dell XPS 15 2016 9550 | |
| MSI WS60-6QJE316H11 | |
| Creative Score Accelerated v2 | |
| HP ZBook 15 G2 | |
| Dell Precision 5510 | |
| HP ZBook 15 G3 | |
| Dell XPS 15 2016 9550 | |
| Work Score Accelerated v2 | |
| HP ZBook 15 G3 | |
| HP ZBook 15 G2 | |
| Dell Precision 5510 | |
| Lenovo ThinkPad P50 | |
| MSI WS60-6QJE316H11 | |
| PCMark Vantage Result | 23161 puan | |
| PCMark 7 Score | 5521 puan | |
| PCMark 8 Home Score Accelerated v2 | 3959 puan | |
| PCMark 8 Creative Score Accelerated v2 | 4392 puan | |
| PCMark 8 Work Score Accelerated v2 | 5221 puan | |
Yardım | ||

| LuxMark v2.0 64Bit | |
| Room GPUs-only | |
| HP ZBook 15 G3 | |
| MSI WS60-6QJE316H11 | |
| Dell XPS 15 2016 9550 | |
| Lenovo ThinkPad P50 | |
| Dell Precision 5510 | |
| HP ZBook 15 G2 | |
| Lenovo ThinkPad W541 20EF000SGE | |
| Sala GPUs-only | |
| HP ZBook 15 G3 | |
| MSI WS60-6QJE316H11 | |
| Lenovo ThinkPad P50 | |
| Dell XPS 15 2016 9550 | |
| Dell Precision 5510 | |
| HP ZBook 15 G2 | |
| Lenovo ThinkPad W541 20EF000SGE | |
| SiSoft Sandra 2016 | |
| Image Processing | |
| HP ZBook 15 G3 | |
| MSI WS60-6QJE316H11 | |
| Lenovo ThinkPad P50 | |
| Dell Precision 5510 | |
| GP Cryptography (Higher Security AES256+SHA2-512) | |
| Lenovo ThinkPad P50 | |
| HP ZBook 15 G3 | |
| MSI WS60-6QJE316H11 | |
| Dell Precision 5510 | |
| GP Financial Analysis (FP High/Double Precision) | |
| HP ZBook 15 G3 | |
| Lenovo ThinkPad P50 | |
| MSI WS60-6QJE316H11 | |
| Dell Precision 5510 | |
| 3DMark 11 | |
| 1280x720 Performance | |
| MSI WS60-6QJE316H11 | |
| HP ZBook 15 G3 | |
| Dell XPS 15 2016 9550 | |
| Lenovo ThinkPad P50 | |
| Dell Precision 5510 | |
| 1280x720 Performance GPU | |
| Dell XPS 15 2016 9550 | |
| MSI WS60-6QJE316H11 | |
| Lenovo ThinkPad P50 | |
| HP ZBook 15 G3 | |
| Dell Precision 5510 | |
| 3DMark | |
| 1920x1080 Fire Strike Score | |
| MSI WS60-6QJE316H11 | |
| Dell XPS 15 2016 9550 | |
| HP ZBook 15 G3 | |
| Lenovo ThinkPad P50 | |
| Dell Precision 5510 | |
| HP ZBook 15 G2 | |
| 1920x1080 Fire Strike Graphics | |
| Dell XPS 15 2016 9550 | |
| MSI WS60-6QJE316H11 | |
| Lenovo ThinkPad P50 | |
| HP ZBook 15 G3 | |
| Dell Precision 5510 | |
| HP ZBook 15 G2 | |
| Unigine Valley 1.0 | |
| 1920x1080 Extreme HD DirectX AA:x8 | |
| Lenovo ThinkPad P50 | |
| HP ZBook 15 G3 | |
| MSI WS60-6QJE316H11 | |
| Dell Precision 5510 | |
| 1920x1080 Extreme HD Preset OpenGL AA:x8 | |
| HP ZBook 15 G3 | |
| Dell Precision 5510 | |
| MSI WS60-6QJE316H11 | |
| Lenovo ThinkPad P50 | |
| Unigine Heaven 3.0 | |
| 1920x1080 DX 11, Normal Tessellation, High Shaders AA:Off AF:Off | |
| MSI WS60-6QJE316H11 | |
| Lenovo ThinkPad P50 | |
| HP ZBook 15 G3 | |
| Dell Precision 5510 | |
| HP ZBook 15 G2 | |
| 1920x1080 OpenGL, Normal Tessellation, High Shaders AA:Off AF:Off | |
| HP ZBook 15 G3 | |
| Dell Precision 5510 | |
| MSI WS60-6QJE316H11 | |
| Lenovo ThinkPad P50 | |
| HP ZBook 15 G2 | |
| 3DMark 06 Standard Score | 25462 puan | |
| 3DMark Vantage P Result | 21026 puan | |
| 3DMark 11 Performance | 5414 puan | |
| 3DMark Ice Storm Standard Score | 89211 puan | |
| 3DMark Cloud Gate Standard Score | 18230 puan | |
| 3DMark Fire Strike Score | 3820 puan | |
Yardım | ||
| düşük | orta | yüksek | ultra | |
| BioShock Infinite (2013) | 211 | 133 | 115.8 | 72.2 |
| The Witcher 3 (2015) | 75.7 | 46.8 | 25.9 | 13.6 |
| Rise of the Tomb Raider (2016) | 72.6 | 44.6 | 25.5 | 21.8 |
Ses yüksekliği
| Boşta |
| 30 / 30 / 30 dB |
| Çalışırken |
| 45.3 / 49.7 dB |
 | ||
30 dB sessiz 40 dB(A) duyulabilirlik 50 dB(A) gürültülü |
||
min: | ||
| HP ZBook 15 G3 Intel Xeon E3-1505M v5, NVIDIA Quadro M2000M | Lenovo ThinkPad P50 Intel Core i7-6820HQ, NVIDIA Quadro M2000M | Dell Precision 5510 Intel Xeon E3-1505M v5, NVIDIA Quadro M1000M | HP ZBook 15 G2 Intel Core i7-4910MQ, AMD FirePro M5100 | MSI WS60-6QJE316H11 Intel Xeon E3-1505M v5, NVIDIA Quadro M2000M | |
|---|---|---|---|---|---|
| Noise | 8% | 3% | 6% | -13% | |
| off / environment * | 30 | ||||
| Idle Minimum * | 30 | 30 -0% | 30 -0% | 30.6 -2% | 37.2 -24% |
| Idle Average * | 30 | 30 -0% | 30 -0% | 30.6 -2% | 37.2 -24% |
| Idle Maximum * | 30 | 30 -0% | 30 -0% | 30.6 -2% | 37.2 -24% |
| Load Average * | 45.3 | 34.5 24% | 42.08 7% | 35.7 21% | 42.1 7% |
| Load Maximum * | 49.7 | 42.1 15% | 46.78 6% | 43.2 13% | 50.7 -2% |
* ... smaller is better
(-) The maximum temperature on the upper side is 54.6 °C / 130 F, compared to the average of 38.1 °C / 101 F, ranging from 22.2 to 69.8 °C for the class Workstation.
(-) The bottom heats up to a maximum of 60.8 °C / 141 F, compared to the average of 41.3 °C / 106 F
(+) In idle usage, the average temperature for the upper side is 27.7 °C / 82 F, compared to the device average of 32 °C / 90 F.
(+) The palmrests and touchpad are cooler than skin temperature with a maximum of 28.6 °C / 83.5 F and are therefore cool to the touch.
(±) The average temperature of the palmrest area of similar devices was 27.8 °C / 82 F (-0.8 °C / -1.5 F).
| HP ZBook 15 G3 Intel Xeon E3-1505M v5, NVIDIA Quadro M2000M | Lenovo ThinkPad P50 Intel Core i7-6820HQ, NVIDIA Quadro M2000M | Dell Precision 5510 Intel Xeon E3-1505M v5, NVIDIA Quadro M1000M | HP ZBook 15 G2 Intel Core i7-4910MQ, AMD FirePro M5100 | MSI WS60-6QJE316H11 Intel Xeon E3-1505M v5, NVIDIA Quadro M2000M | |
|---|---|---|---|---|---|
| Heat | 11% | 8% | 10% | 2% | |
| Maximum Upper Side * | 54.6 | 36.7 33% | 45.8 16% | 44.1 19% | 42.3 23% |
| Maximum Bottom * | 60.8 | 41.3 32% | 46.7 23% | 45.7 25% | 60.1 1% |
| Idle Upper Side * | 30.3 | 31.1 -3% | 31.2 -3% | 29.6 2% | 32.7 -8% |
| Idle Bottom * | 30.7 | 36.2 -18% | 31.9 -4% | 32.2 -5% | 33.1 -8% |
* ... smaller is better
| Kapalı / Bekleme modu | |
| Boşta | |
| Çalışırken |
|
| HP ZBook 15 G3 Quadro M2000M, E3-1505M v5, Samsung SM951 MZVPV512HDGL m.2 PCI-e | Lenovo ThinkPad P50 Quadro M2000M, 6820HQ, Samsung SSD PM871 MZNLN256HCHP | Dell Precision 5510 Quadro M1000M, E3-1505M v5, SK hynix SC920 512 GB | HP ZBook 15 G2 FirePro M5100, 4910MQ, SanDisk A110 SD6PP4M-256G-1006 | MSI WS60-6QJE316H11 Quadro M2000M, E3-1505M v5, Toshiba NVMe THNSN5128GP | |
|---|---|---|---|---|---|
| Power Consumption | 15% | -22% | -71% | -106% | |
| Idle Minimum * | 5.7 | 5.6 2% | 8.6 -51% | 17.1 -200% | 18.8 -230% |
| Idle Average * | 12.2 | 8.6 30% | 16.2 -33% | 21.9 -80% | 29.6 -143% |
| Idle Maximum * | 12.6 | 9.3 26% | 16.7 -33% | 23.2 -84% | 30.3 -140% |
| Load Average * | 83.1 | 89.5 -8% | 82.6 1% | 86.6 -4% | 90.4 -9% |
| Load Maximum * | 138.2 | 105 24% | 131.8 5% | 120.7 13% | 150.2 -9% |
* ... smaller is better
| HP ZBook 15 G3 90 Wh | Lenovo ThinkPad P50 90 Wh | Dell Precision 5510 56 Wh | HP ZBook 15 G2 83 Wh | MSI WS60-6QJE316H11 47 Wh | |
|---|---|---|---|---|---|
| Battery Runtime | 14% | -33% | -44% | -69% | |
| Reader / Idle | 822 | 860 5% | 428 -48% | 370 -55% | 160 -81% |
| H.264 | 449 | 533 19% | 197 -56% | 260 -42% | 141 -69% |
| WiFi v1.3 | 386 | 498 29% | 286 -26% | 278 -28% | 106 -73% |
| Load | 110 | 113 3% | 109 -1% | 53 -52% | 51 -54% |
| WiFi | 298 | 237 |
Artılar
Eksiler
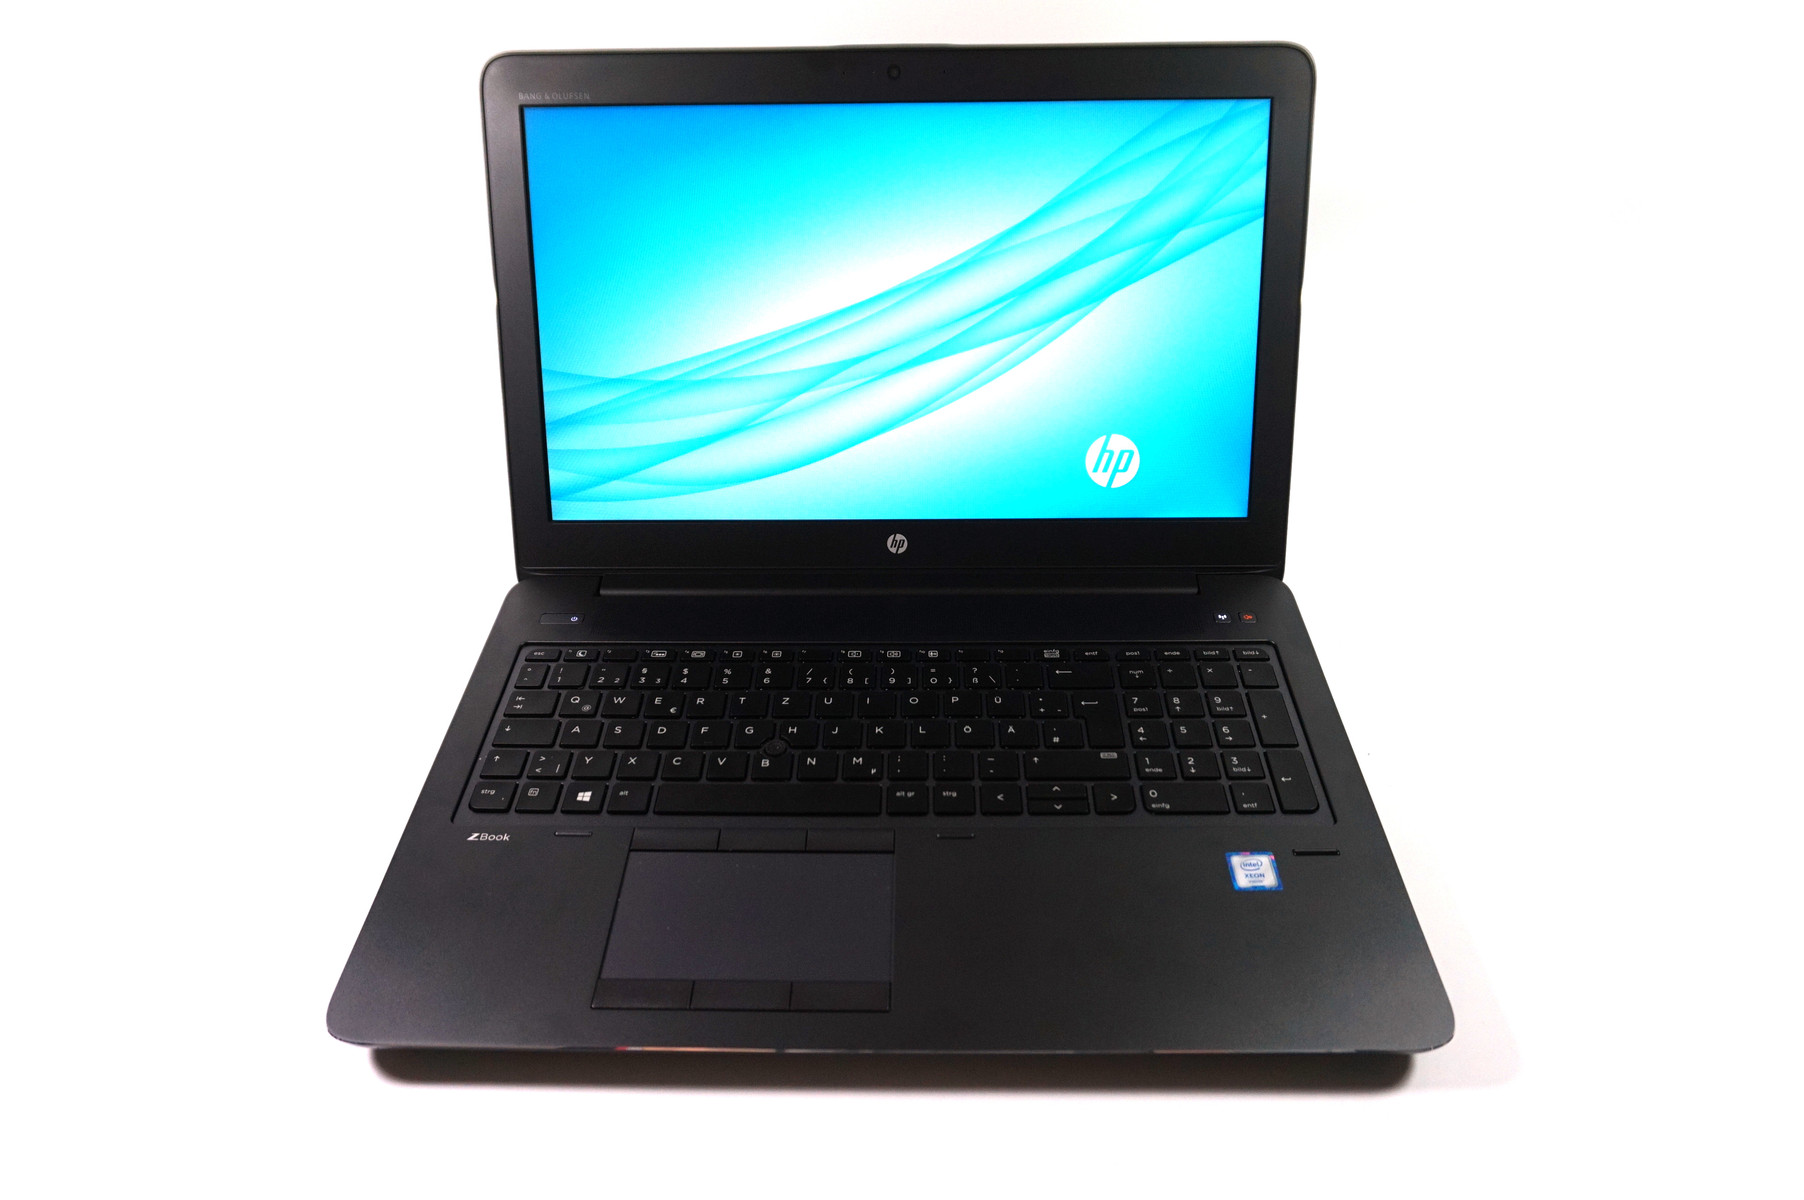
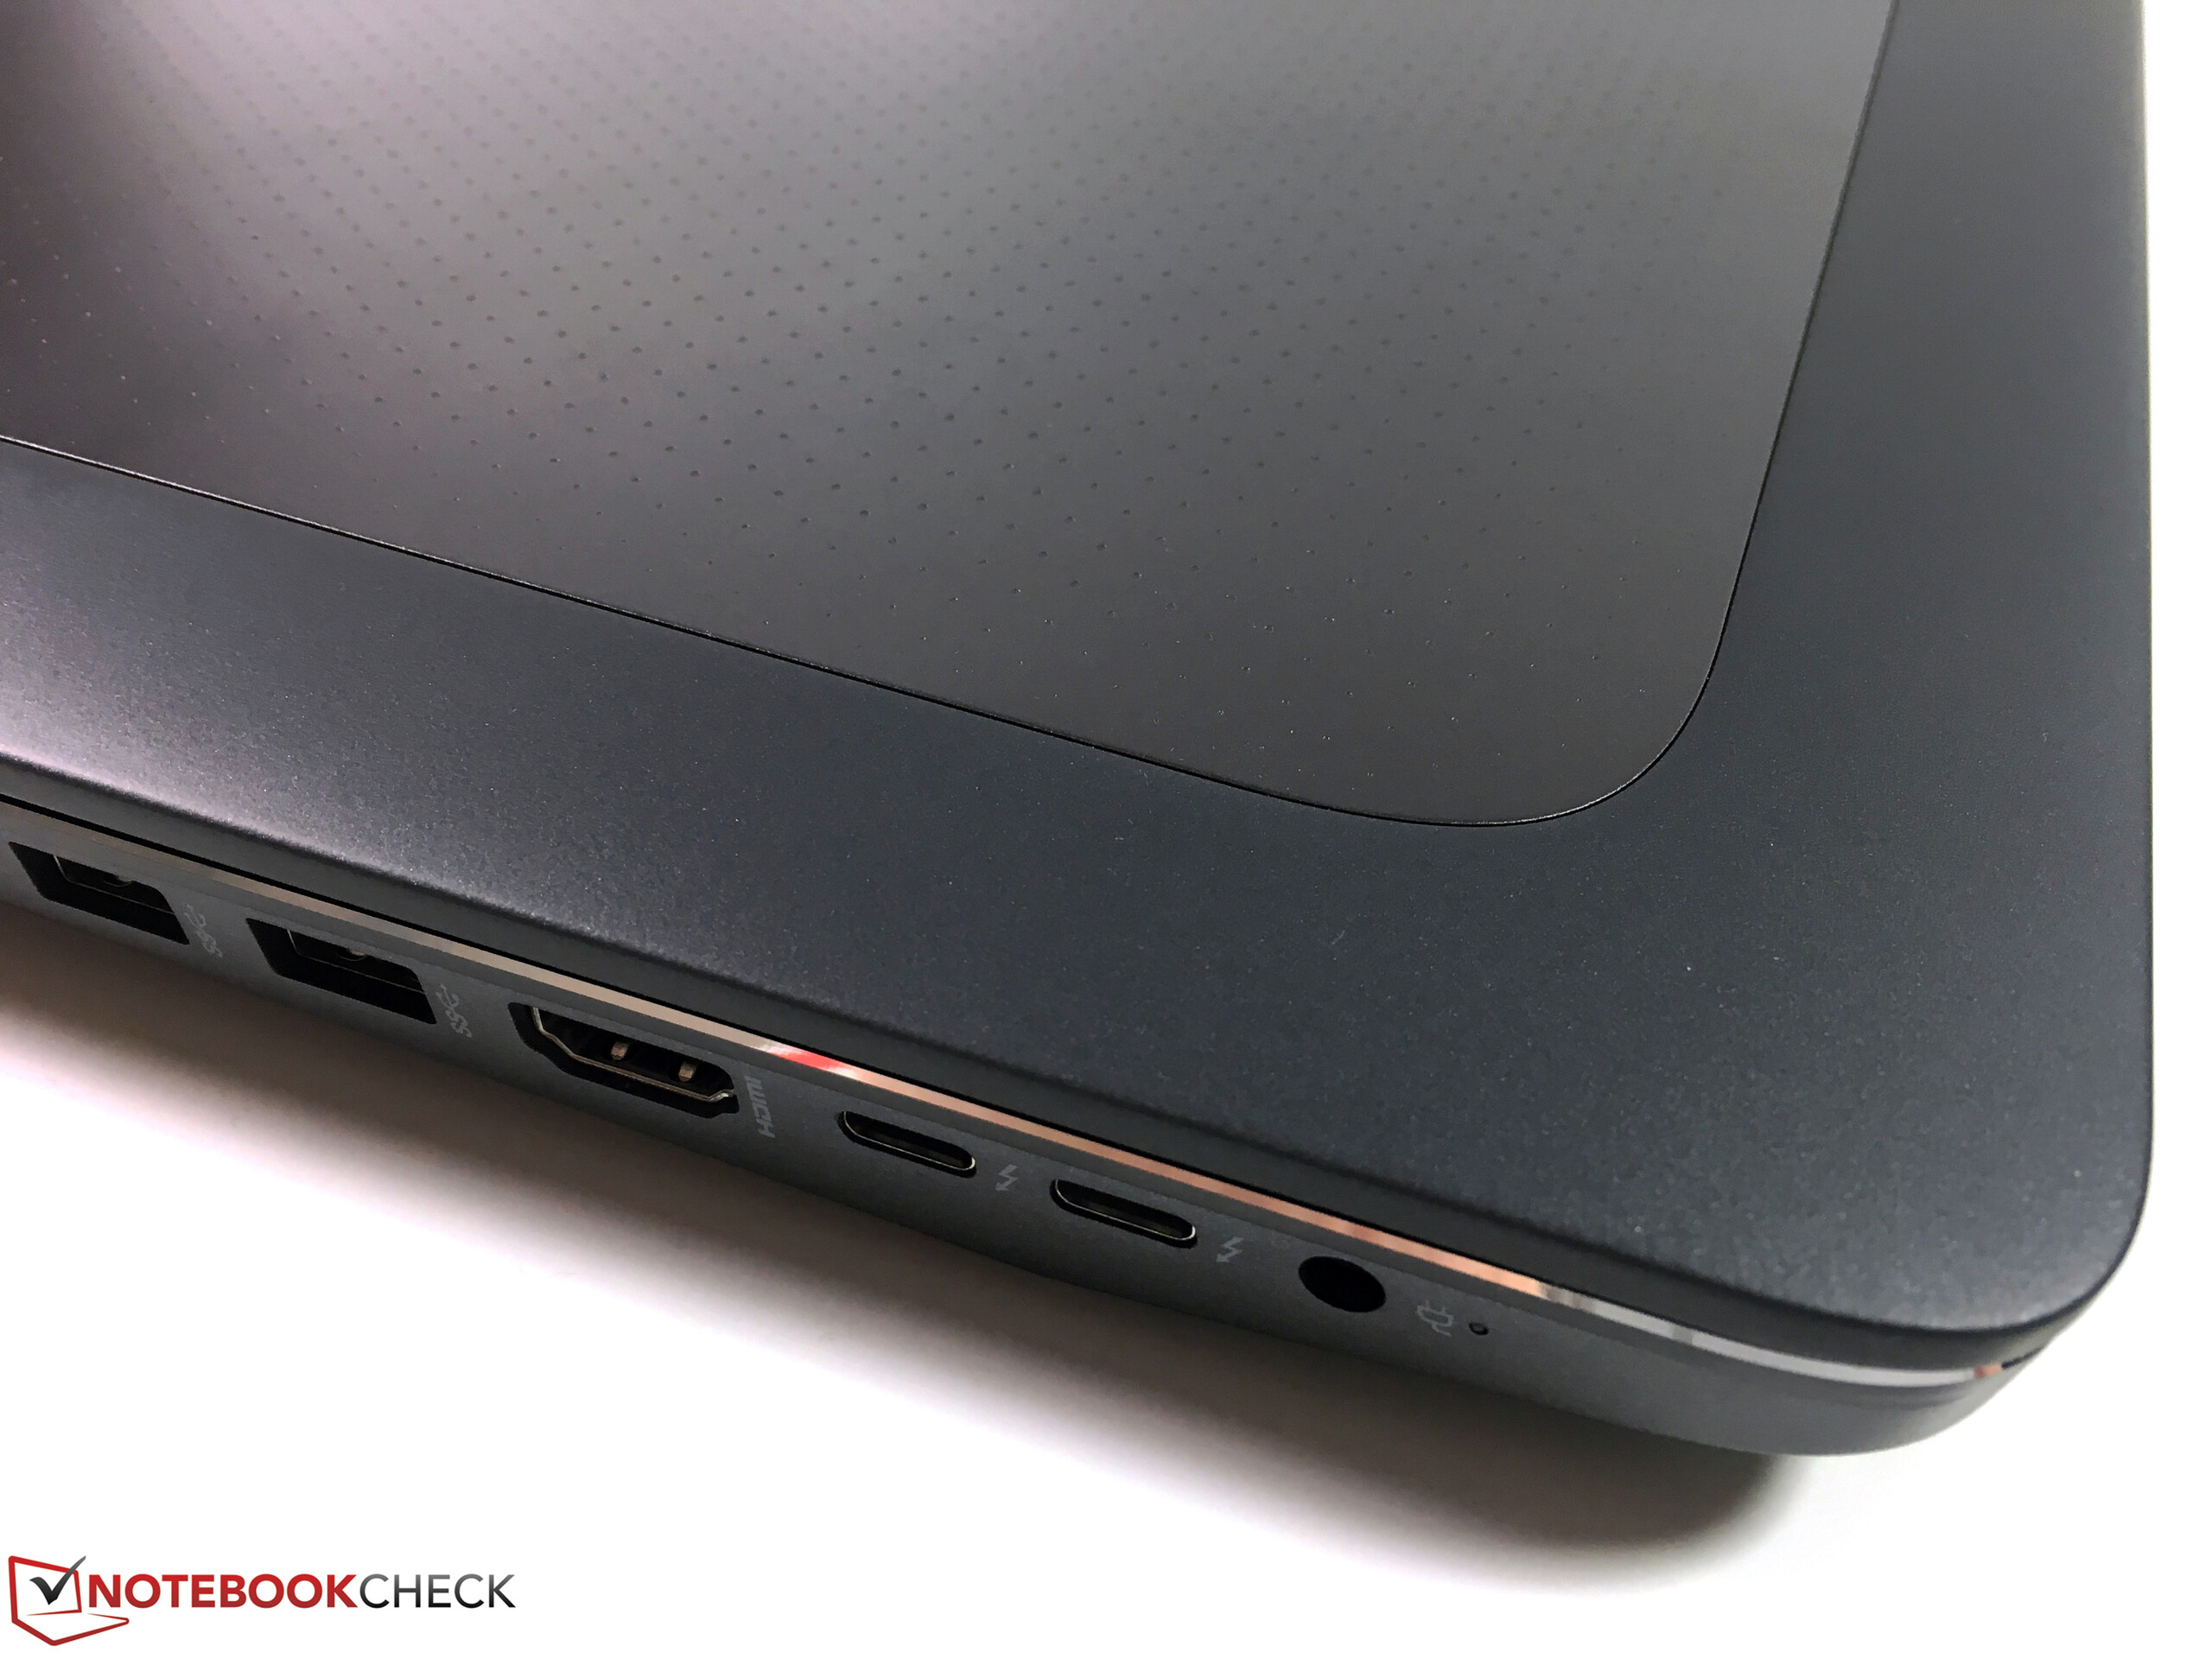
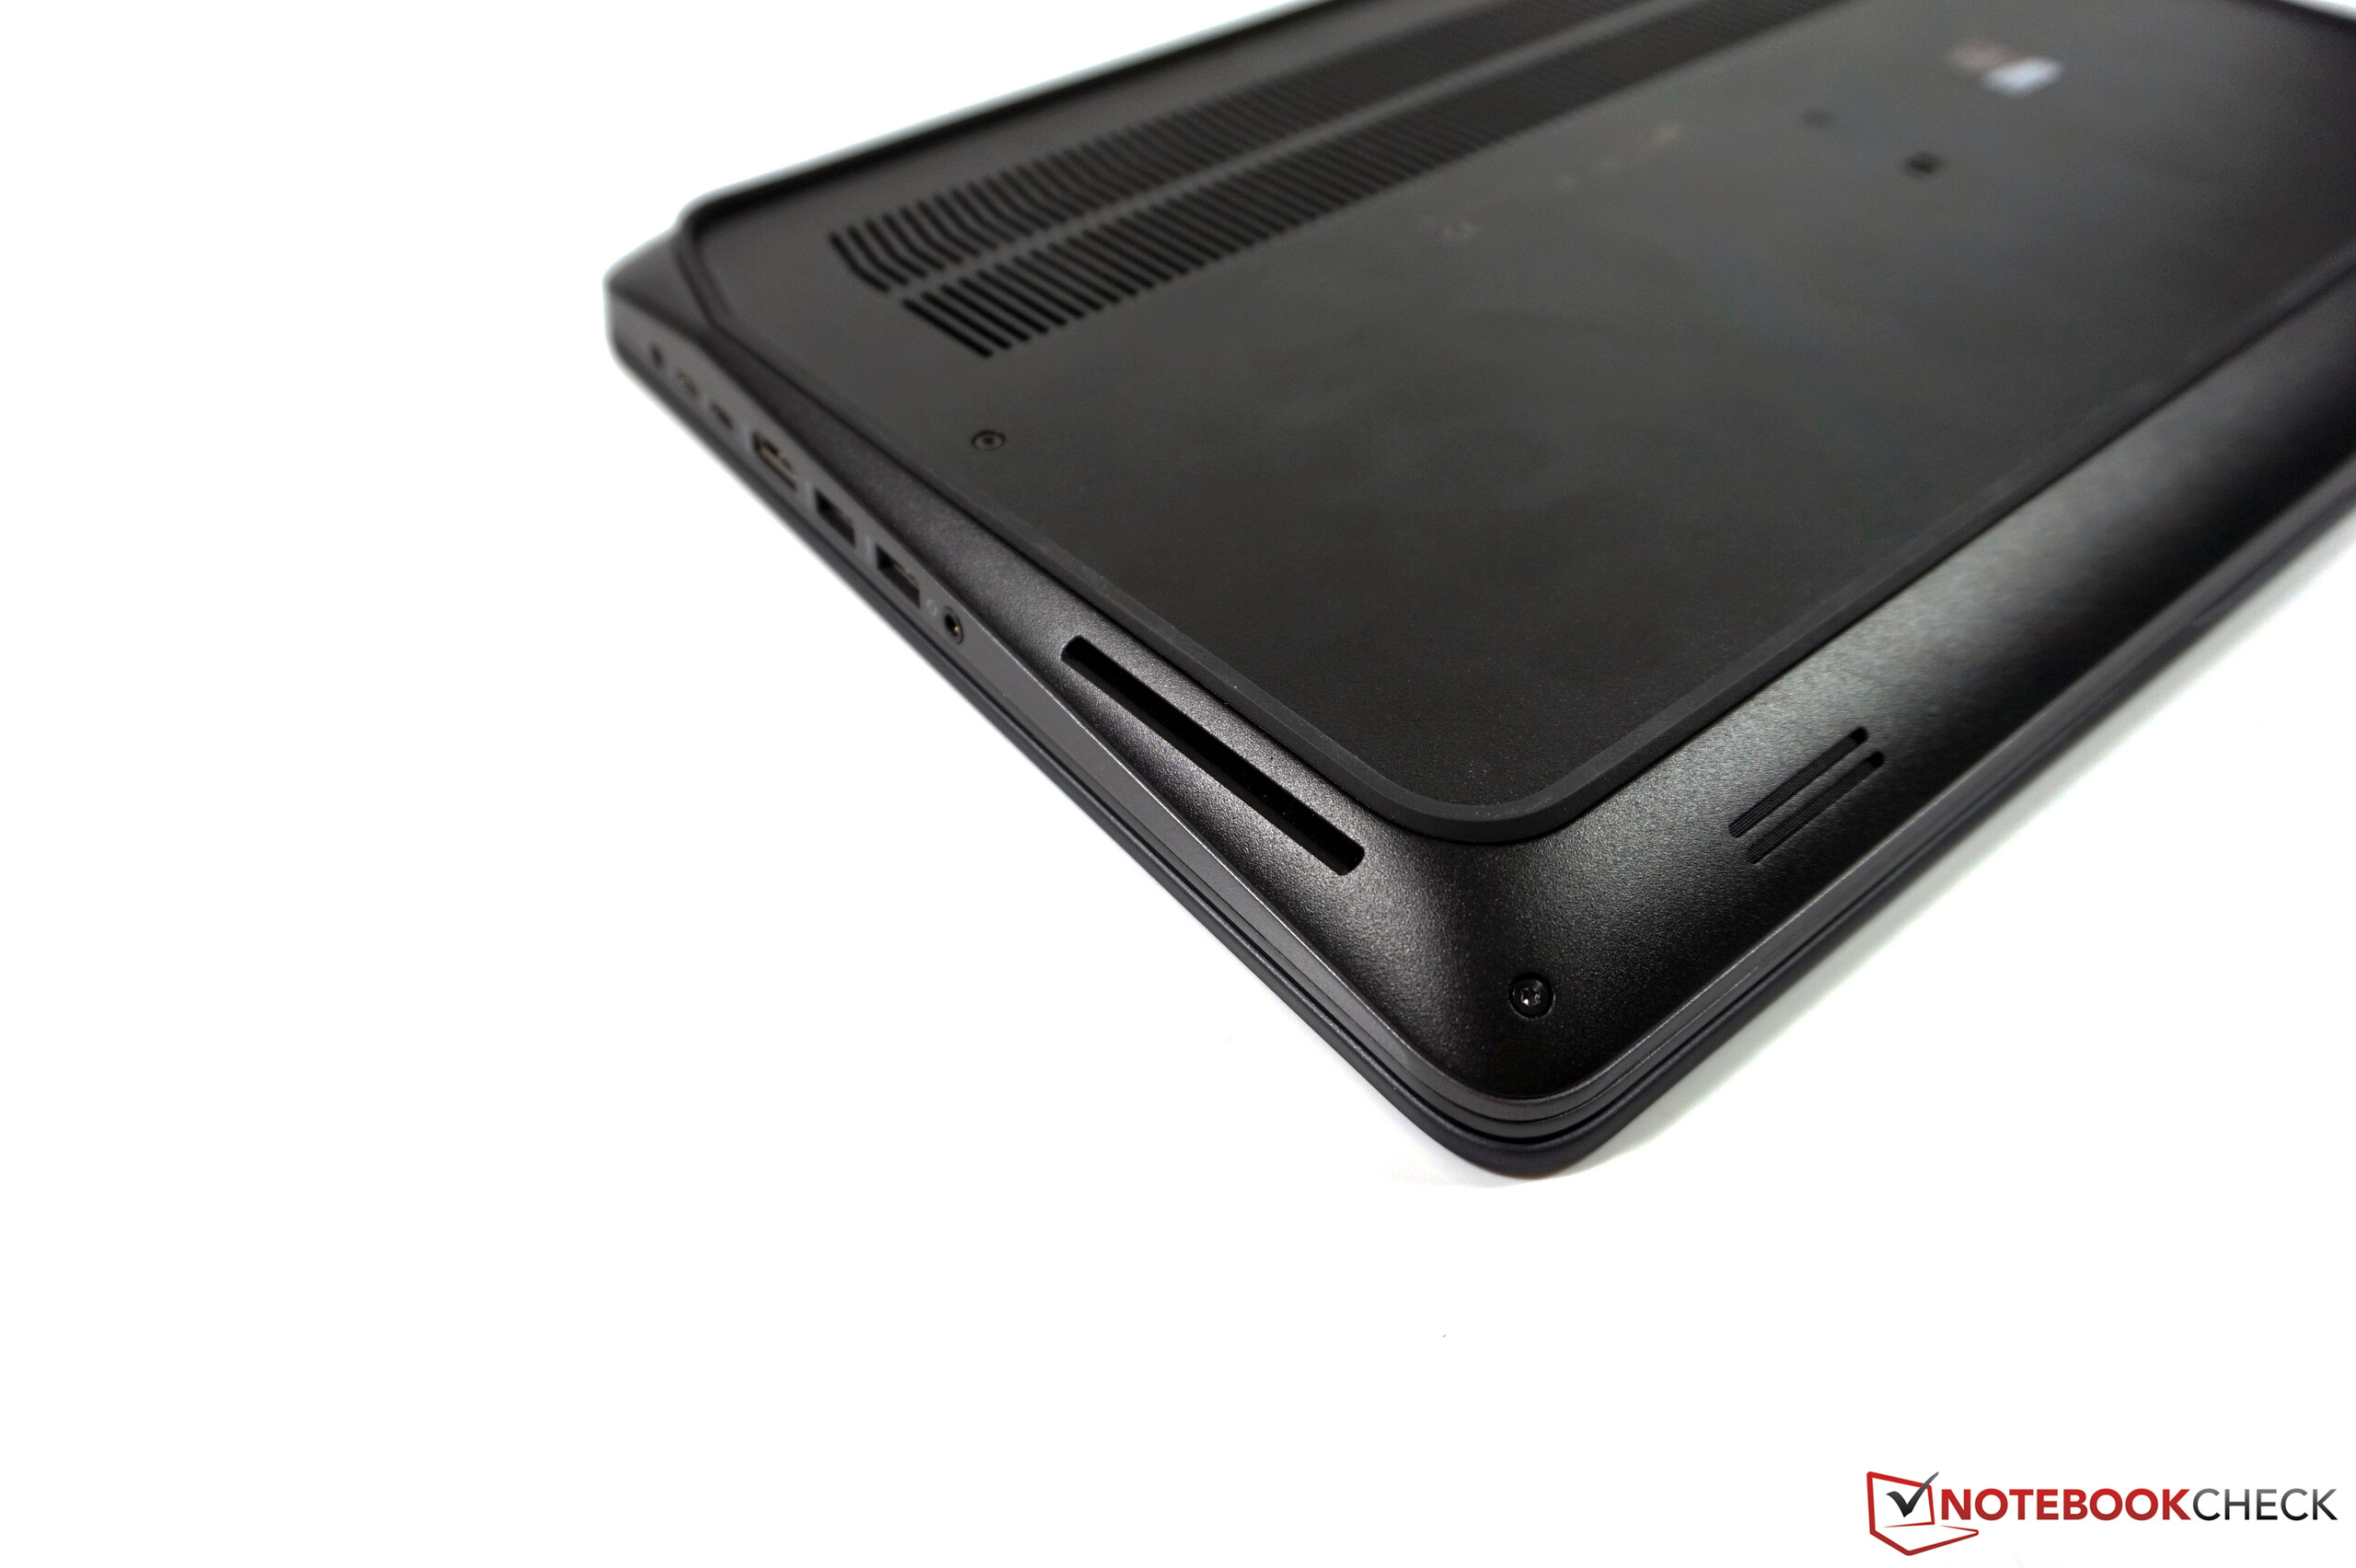
HP başarılı bir şekilde zaten iyi olan ZBook 15 G3 modelini geliştirmiş. Tamamen elden geçen kasa oldukça soylu bir izlenim bırakıyor ve kalite yönünden şüpheye yer vermiyor. Bunun dışında Skylake işlemcinin yanısıra tüm modern arayüzler eklenmiş. Performans hali hazırda 15 inçlik bir mobil çalışma istasyonunun limitlerini belirliyor. Birçok FHD panelden yana hayal kırıklığı yaşadıktan sonra nihayet bir IPS ekran görüyoruz.
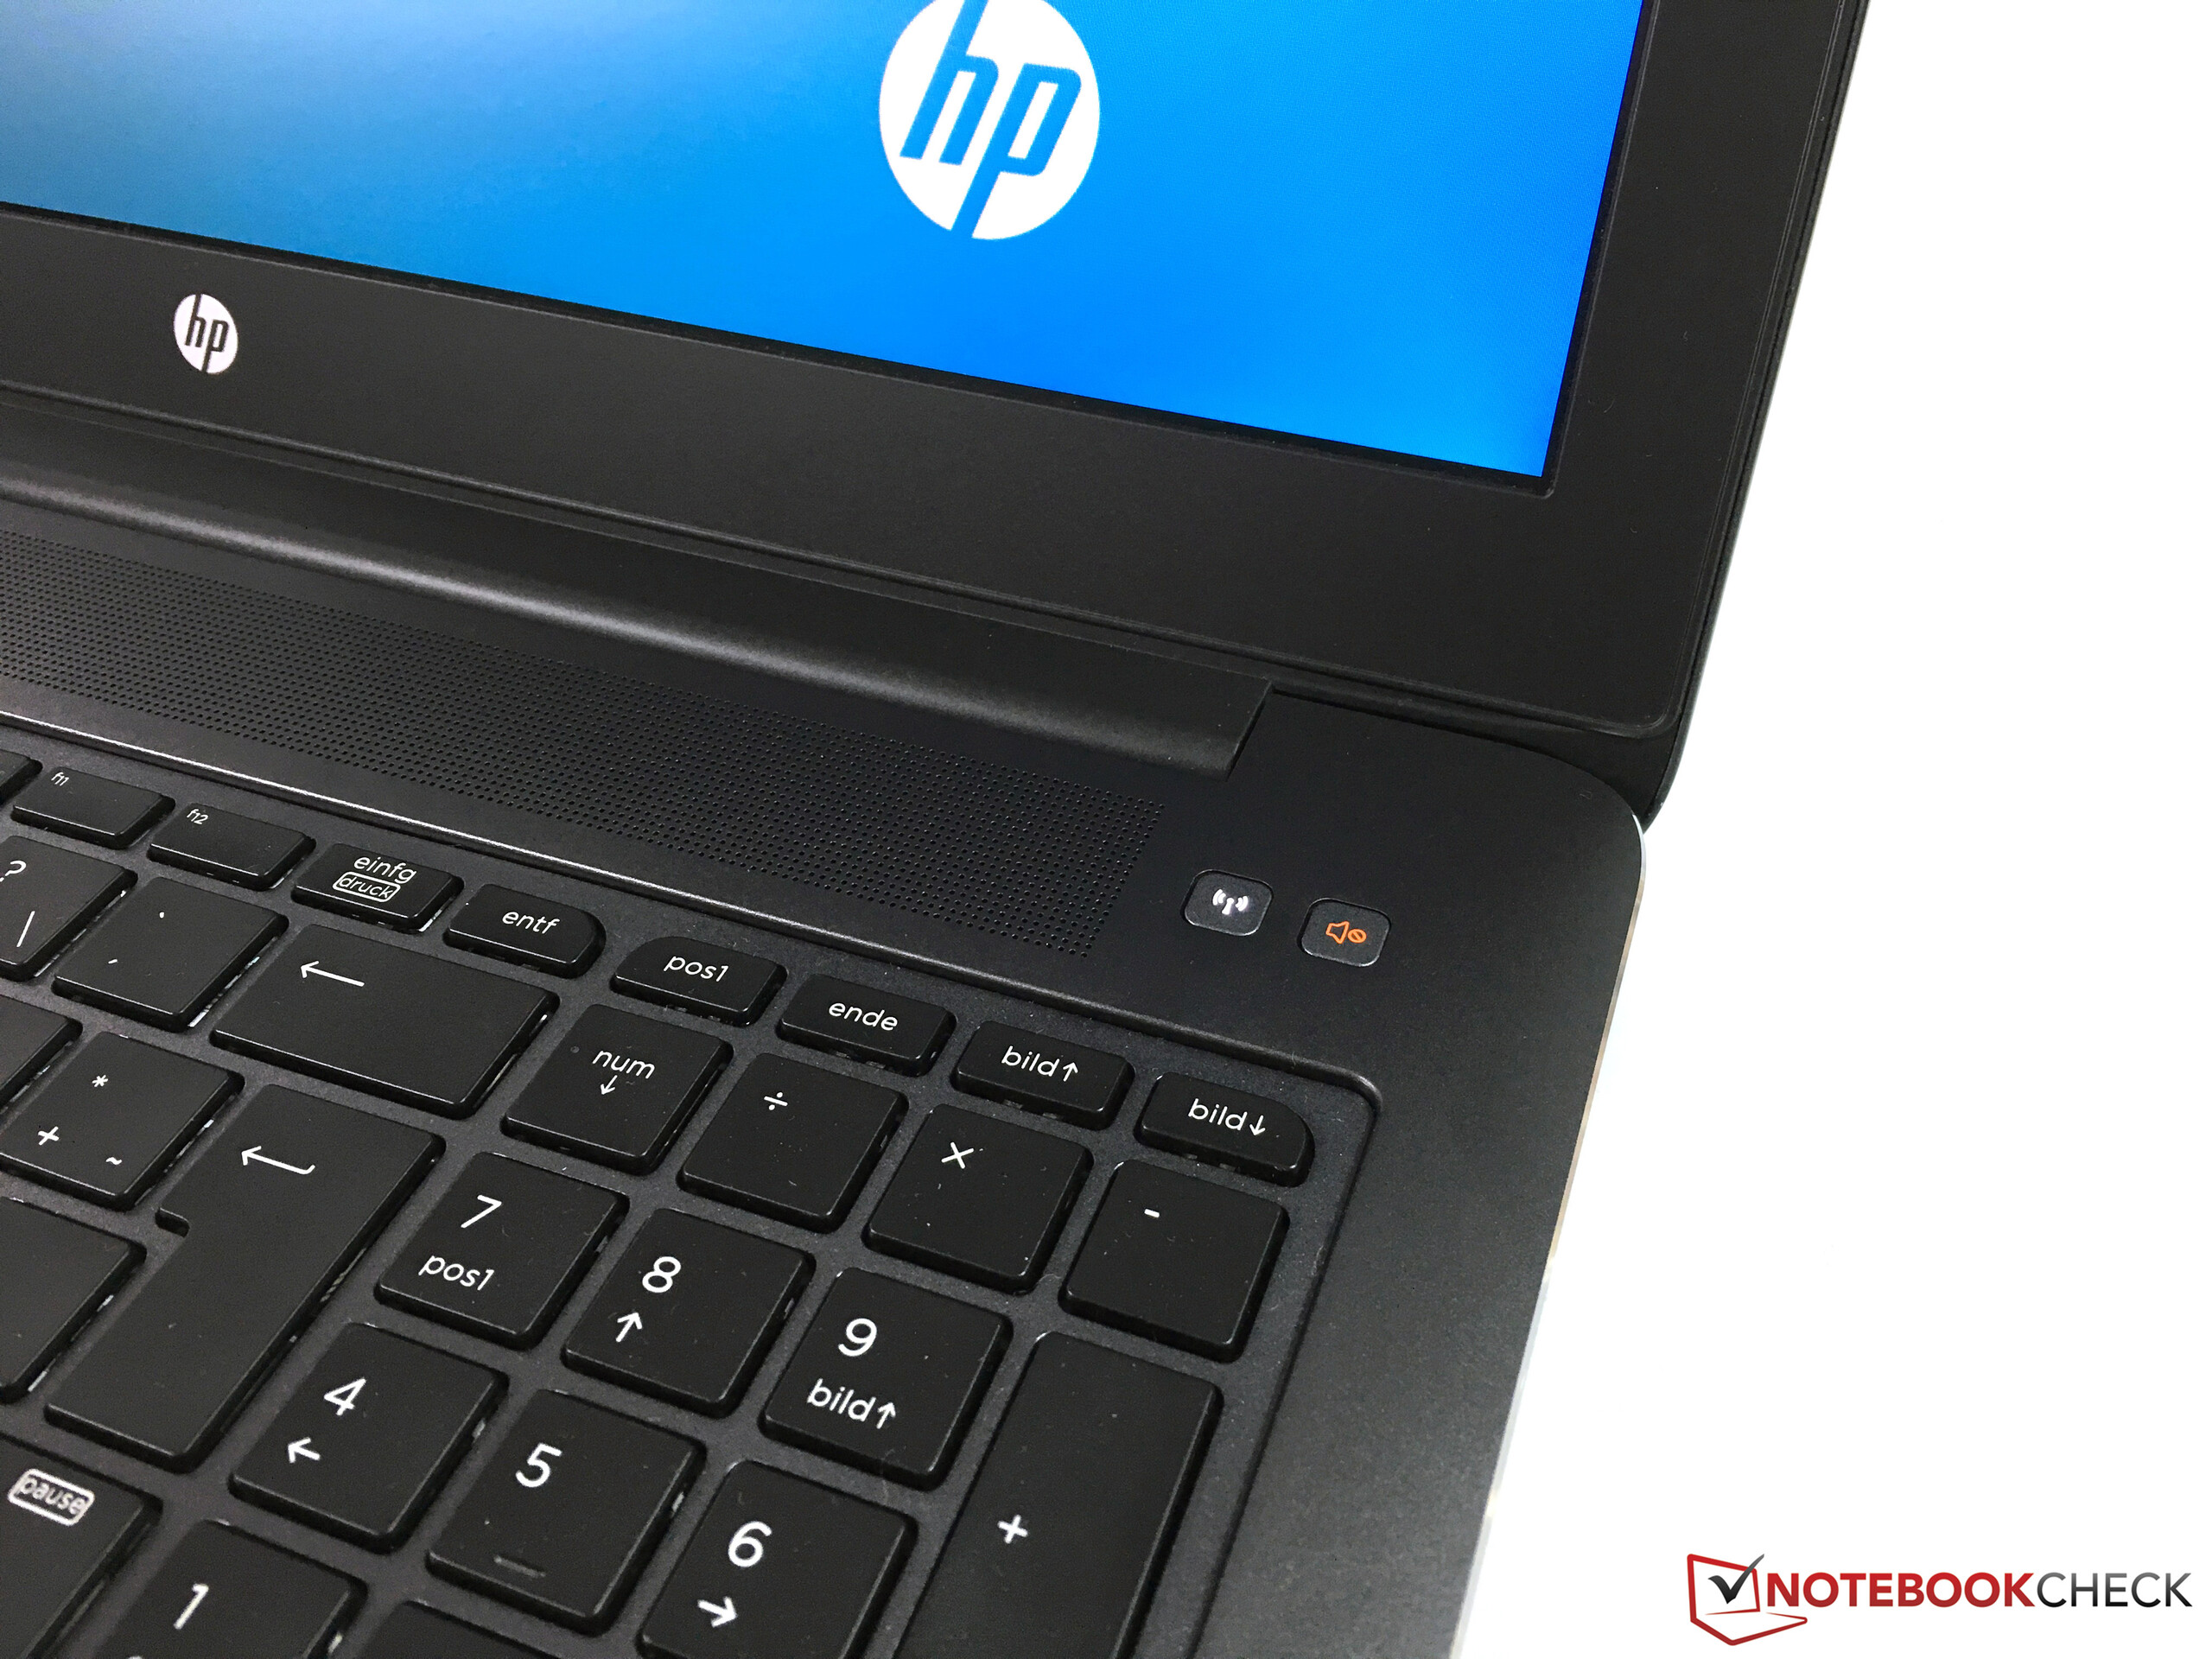
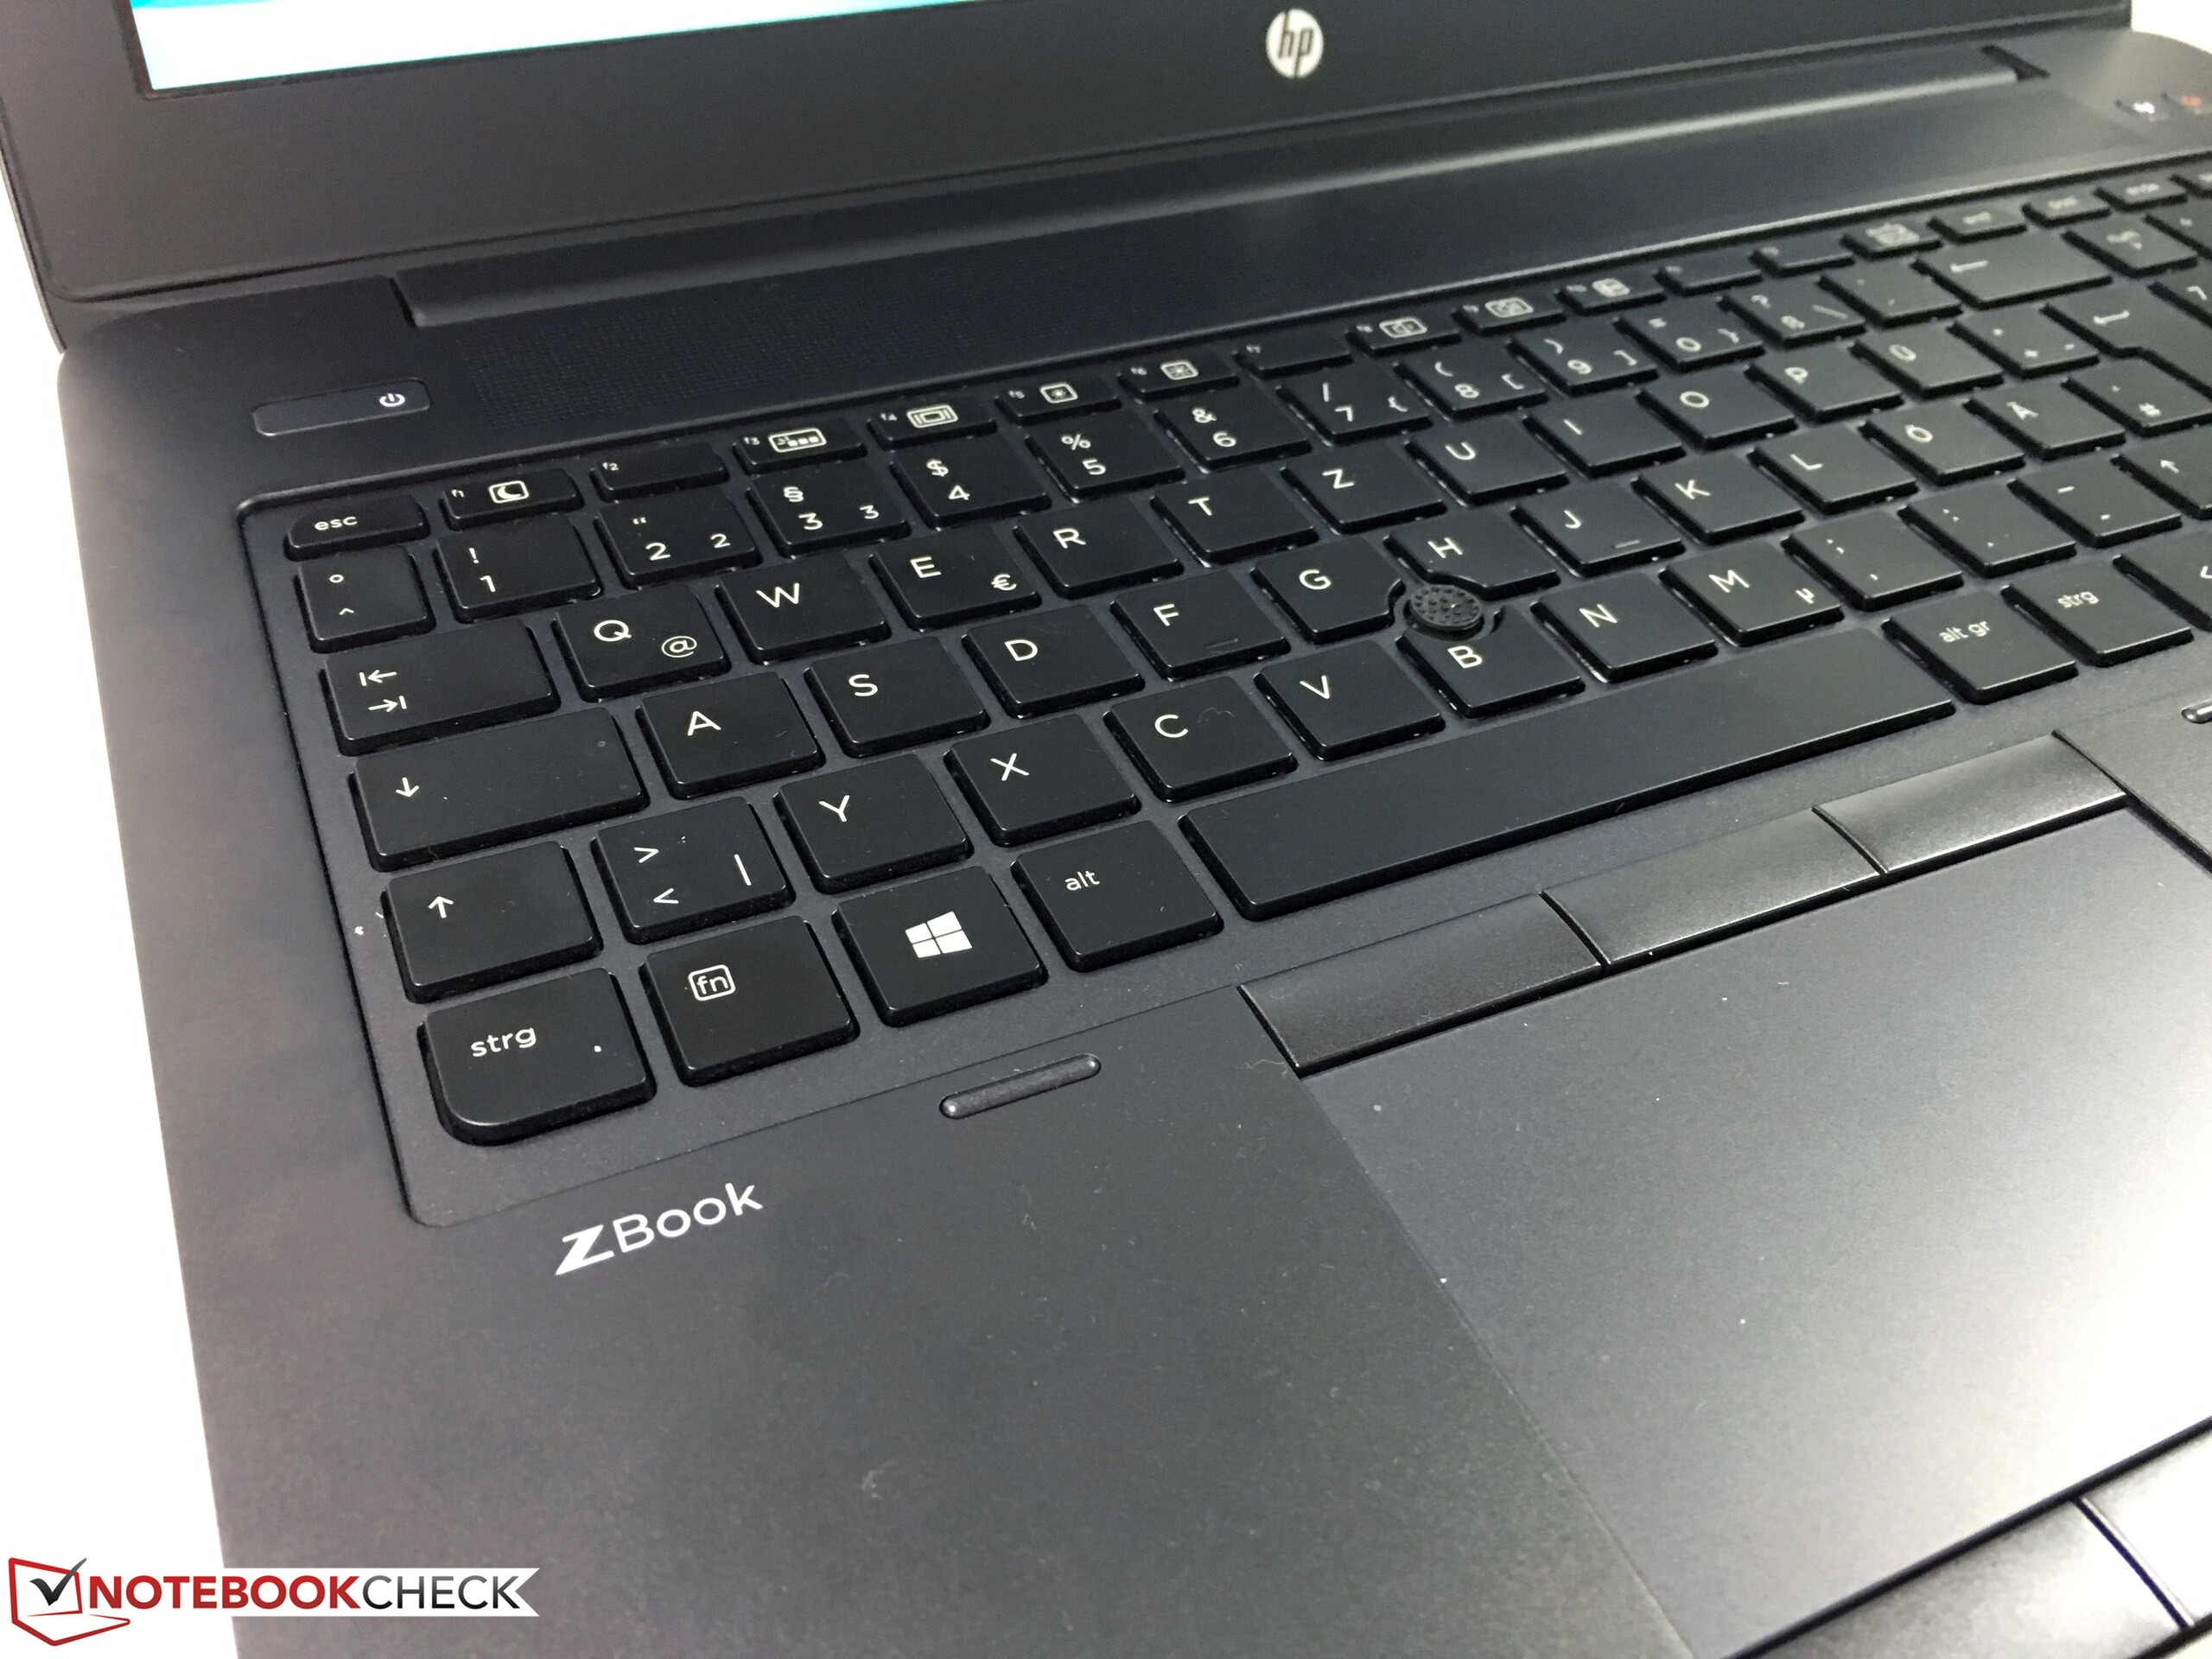
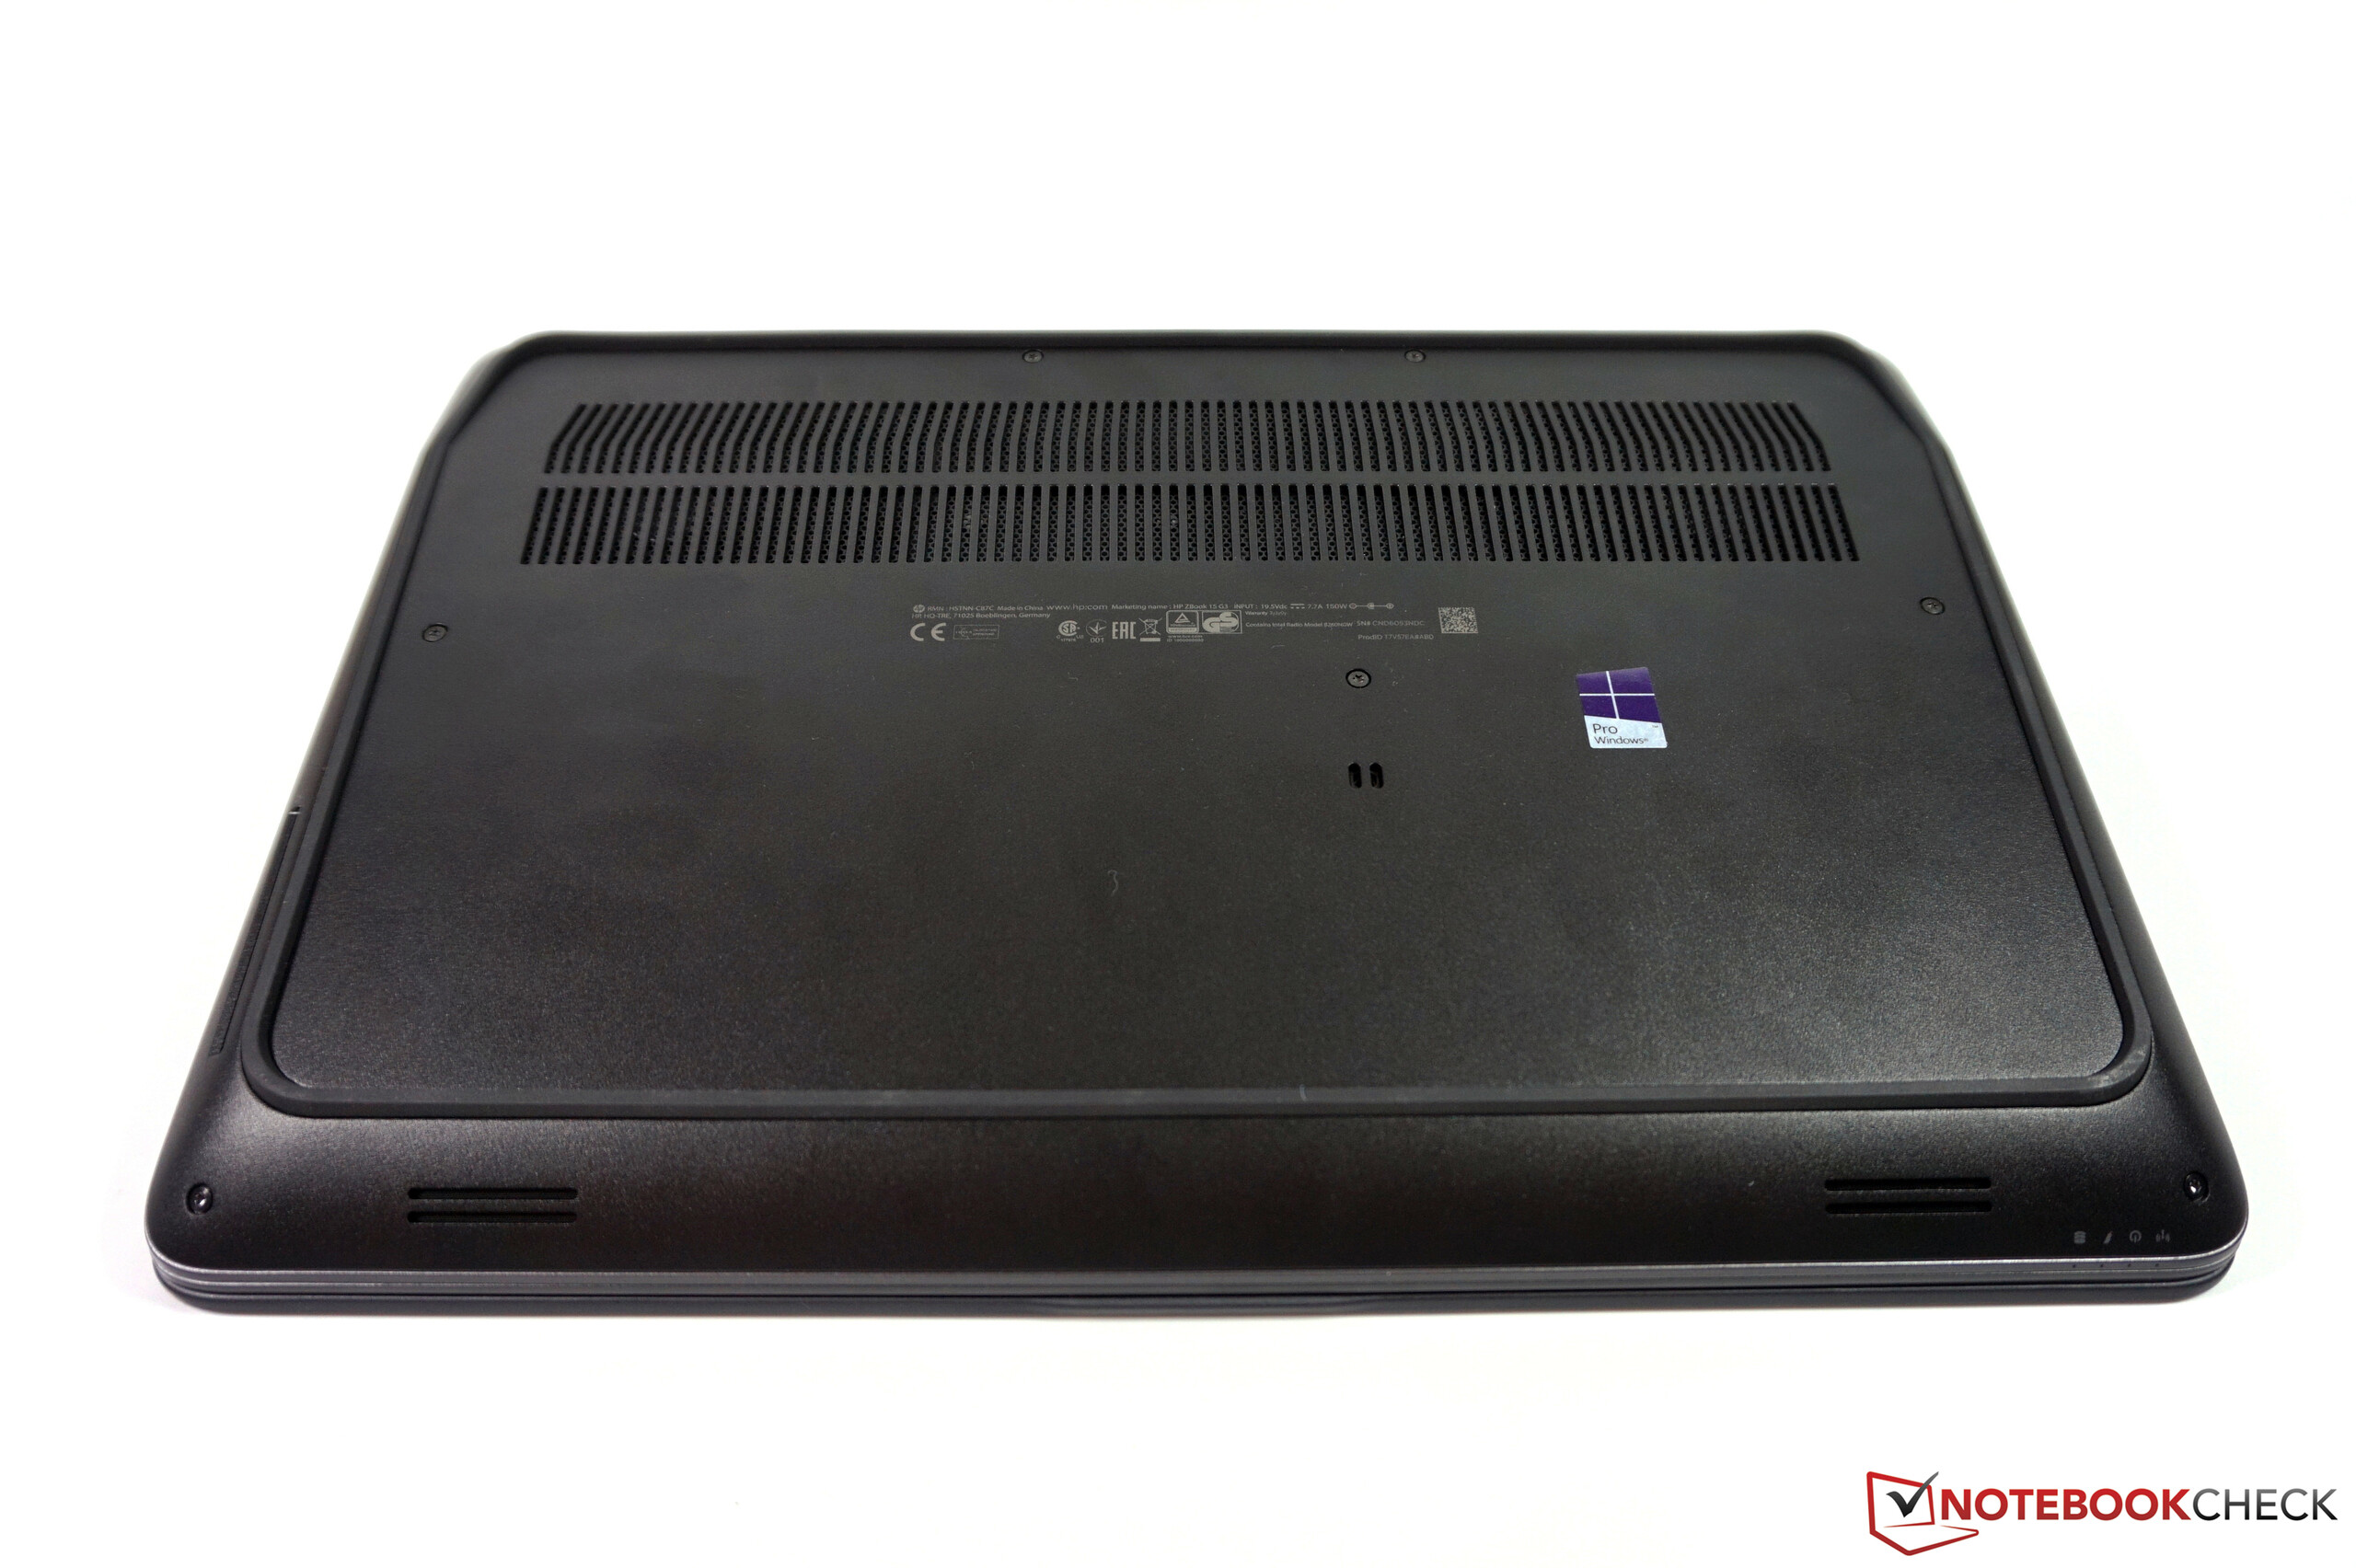
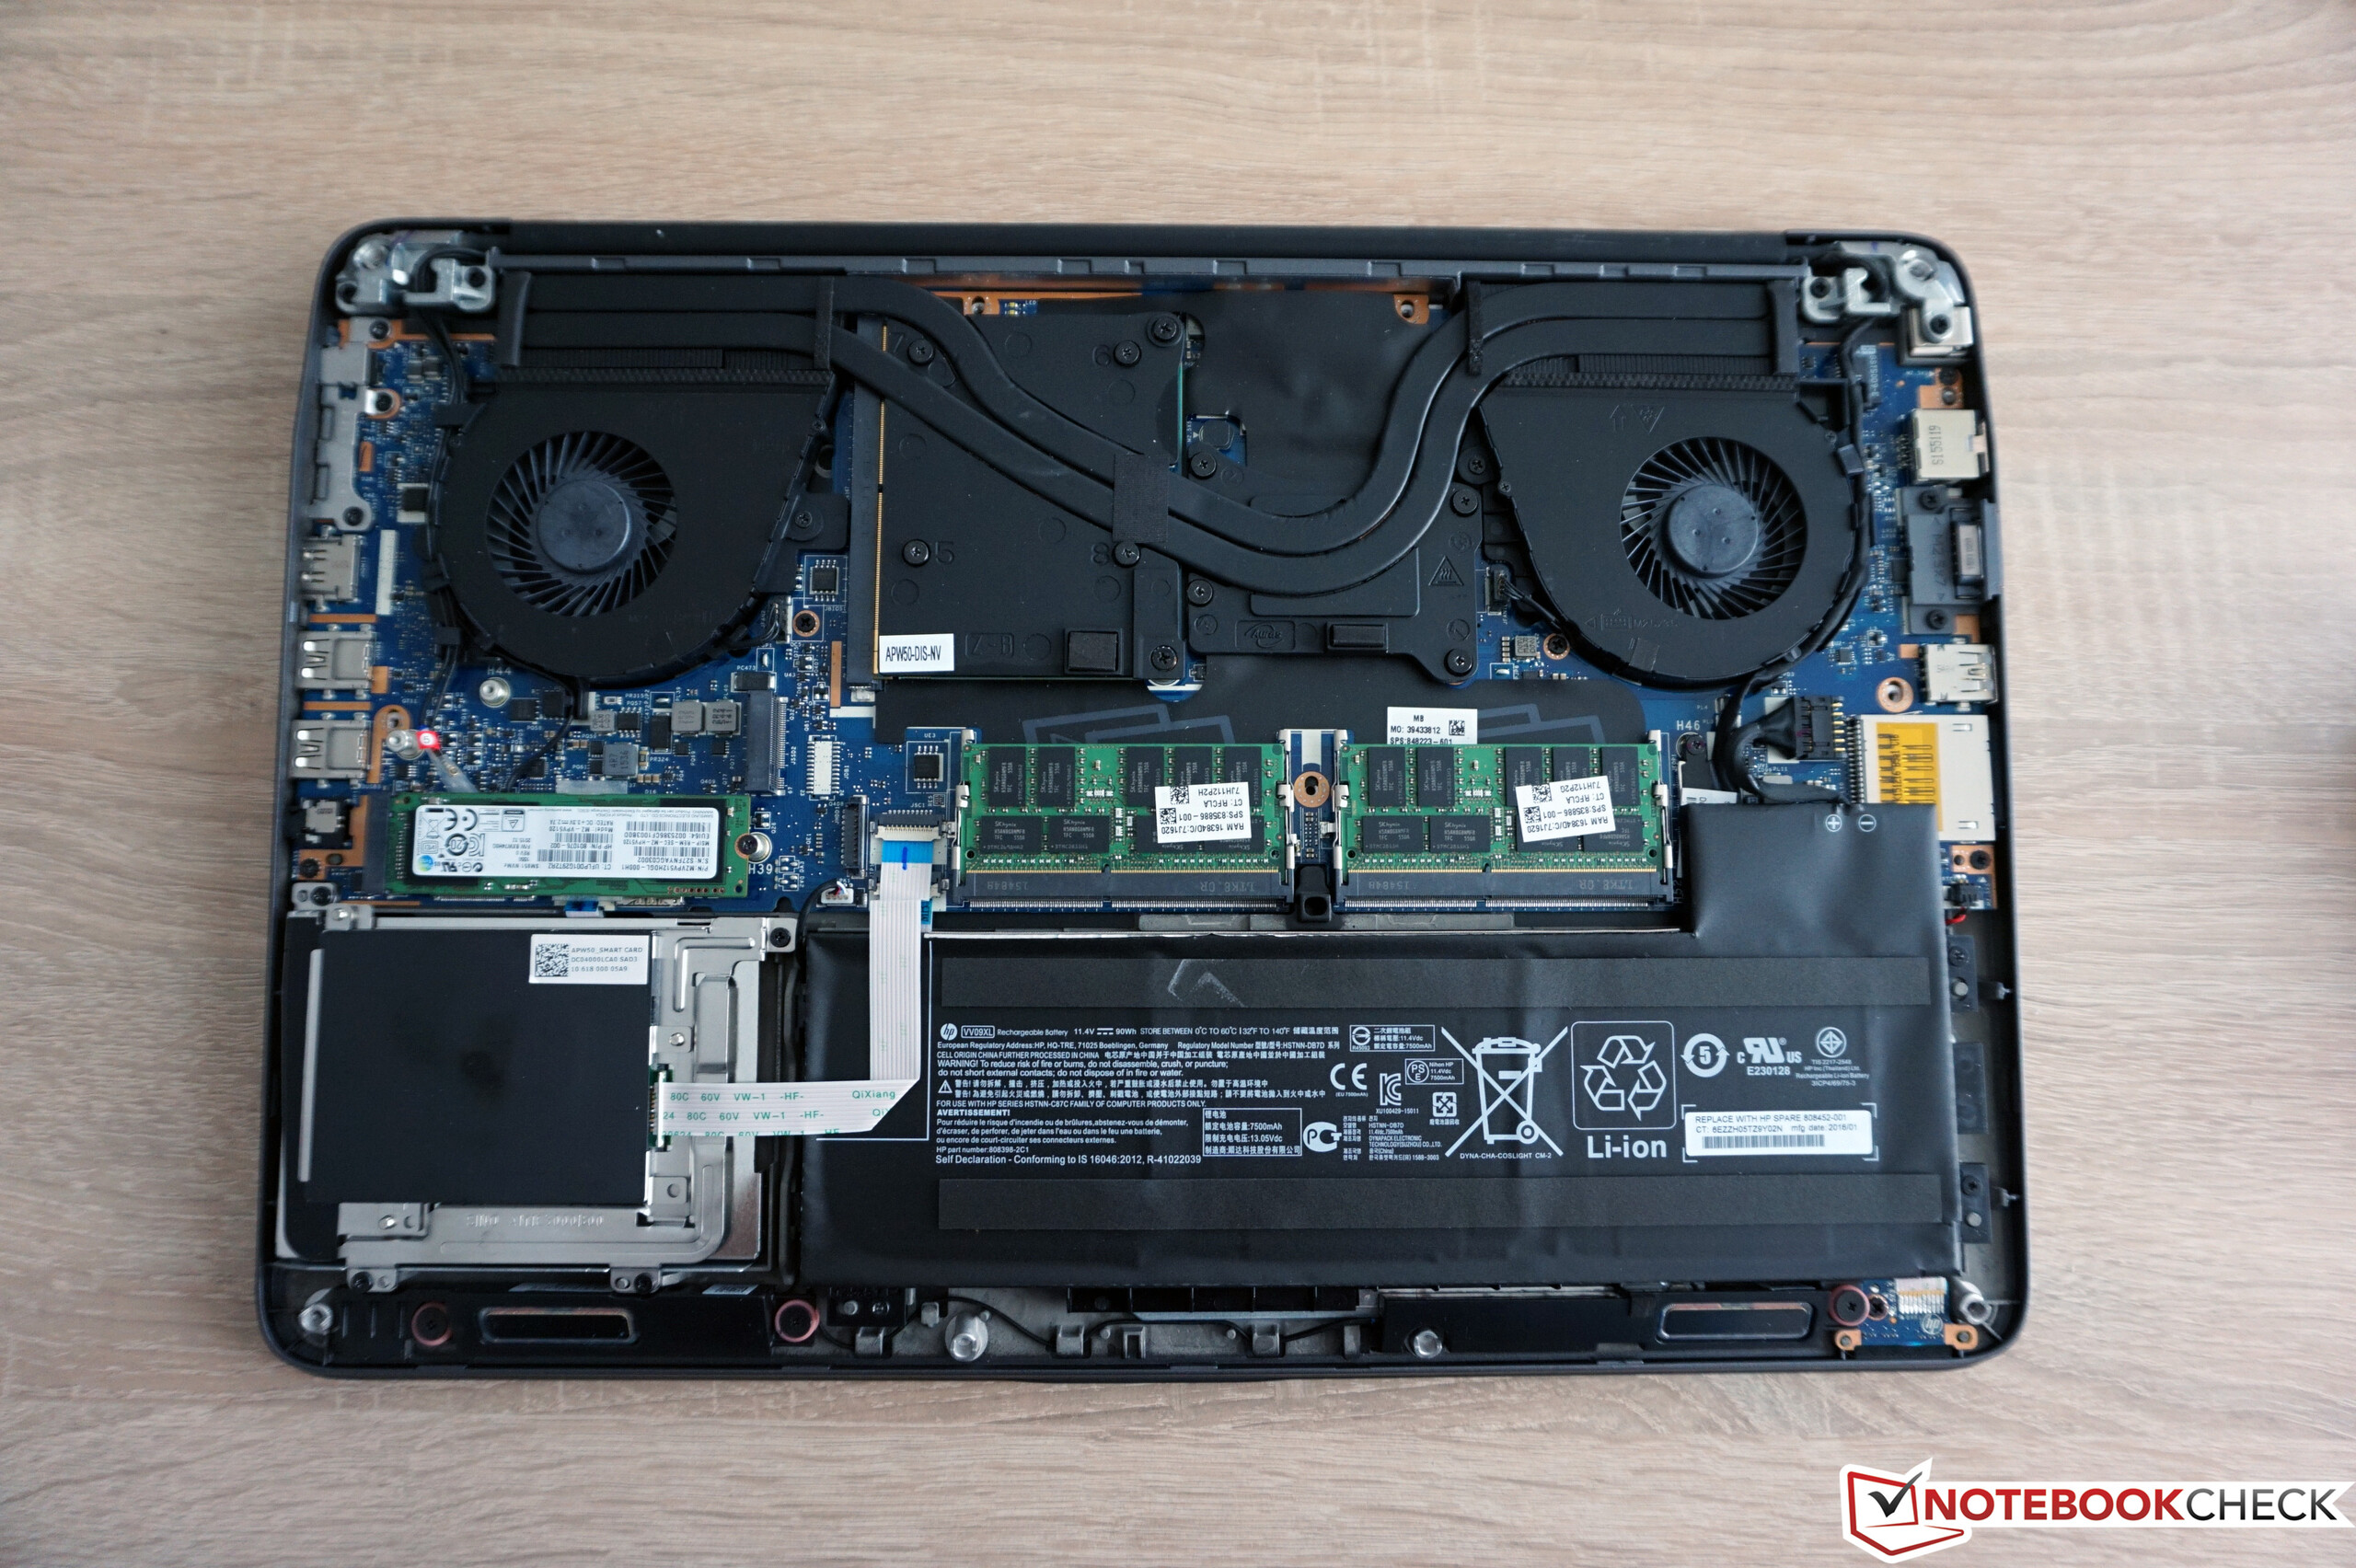
Elbette beğenmediğimiz küçük şeyler de var. Ses çıkaran fanın dışında dışarıdan artık erişilemeyen batarya bunlardan biri. Bazı iç bileşenlerin erişimi de zor. SIM slotunun neden M.2SSD ve WiFi modülün altında yer aldığının açıklanması lazım. HP, klavyeyi de bitaz iyileştirebilir. Çok iyi bir cihaz karşımızda bu kesin, ama Lenovo ThinkPad P50 hala bu alanda daha iyi. Bir diğer nokta da elbette oldukça yüksek fiyat.
HP'nin ZBook 15 G3 modeli çalışma istasyonunun iyi bir güncellemesi olmuş, ancak ucuz bir cihaz değil.
Mobil çalışma istasyonu kullanıcıları için oldukça iyi zamanlar olduğu söylenebilir. Birçok yeni ve iyi cihaz karşımıza çıkıyor ve oldukça tatmin ediciler. Diğer oyuncuların modellerini de bekliyoruz.
Yazının orjinali için tıklayın.
HP ZBook 15 G3
-
04/18/2016 v5.1(old)
Andreas Osthoff
Pricecompare
