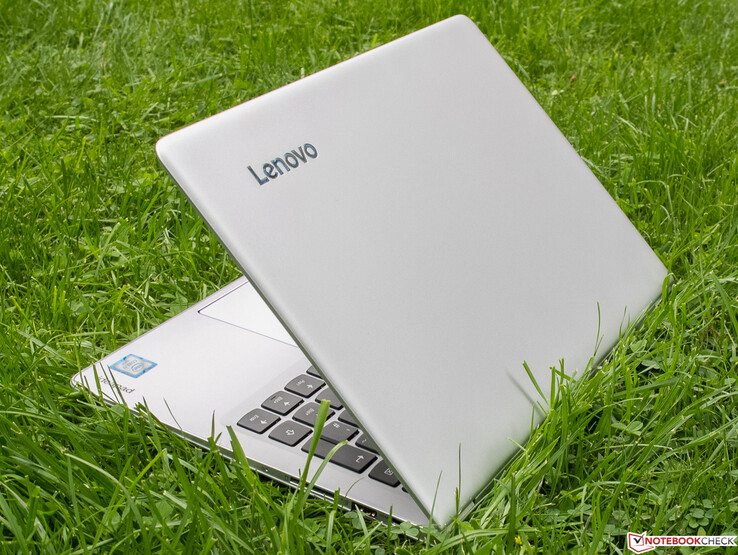
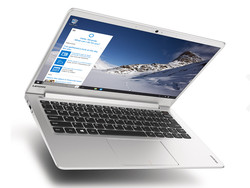
Kısa inceleme: Lenovo IdeaPad 710S-13ISK (Core i7) Subnotebook
Top 10
» Top 10 Multimedia Notebook listesi
» Top 10 oyun notebooku
» Top 10 bütçeye uygun Ofis/İş Notebook Listesi
» Top 10 Premium Ofis/İş notebookları
» Top 10 Çalışma istasyonu laptopları
» Top 10 Subnotebook listesi
» Top 10 Ultrabooklar
» En iyi 10 dönüştürülebilir modeli
» Seçimi en iyi 10 tablet
» Notebookcheck Top 10 Windows Tabletleri
» Top 10 Subnotebook listesi
» NotebookCheck tarafından incelenen en iyi Notebook ekranları
» Notebookcheck'in 500 Euro altındaki en iyi 10 Notebook listesi
» NotebookCheck tarafından seçilen 300 Euro altındaki en iyi 10 Notebook
» Notebookcheck'in 500 Euro altındaki en iyi 10 Notebook listesi
» Notebookcheck'in Top 10 akıllı telefon listesi
» Notebookcheck'in Top 10 hafif oyun notebookları
| |||||||||||||||||||||||||
Aydınlatma: 87 %
Batarya modunda parlaklık: 343 cd/m²
Kontrast: 956:1 (Siyah: 0.36 cd/m²)
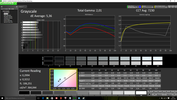
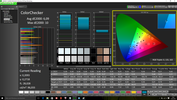
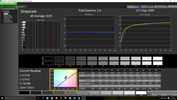
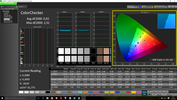
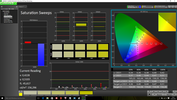
ΔE Color 6.09 | 0.5-29.43 Ø5
ΔE Greyscale 5.36 | 0.57-98 Ø5.3
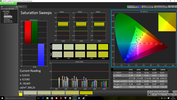
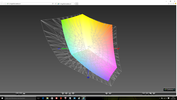
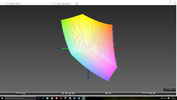
97.54% sRGB (Argyll 1.6.3 3D)
62.25% AdobeRGB 1998 (Argyll 1.6.3 3D)
68.4% AdobeRGB 1998 (Argyll 2.2.0 3D)
97.5% sRGB (Argyll 2.2.0 3D)
66.4% Display P3 (Argyll 2.2.0 3D)
Gamma: 2.01
| Lenovo IdeaPad 710S-13ISK | Acer Aspire S 13 S5-371-71QZ | Dell XPS 13 9350 WQXGA | Asus Zenbook UX305UA-FC040T | |
|---|---|---|---|---|
| Display | -4% | -3% | ||
| Display P3 Coverage | 66.4 | 63.6 -4% | 65.1 -2% | |
| sRGB Coverage | 97.5 | 92.3 -5% | 92.8 -5% | |
| AdobeRGB 1998 Coverage | 68.4 | 65.4 -4% | 66.3 -3% | |
| Response Times | -10% | -11% | -15% | |
| Response Time Grey 50% / Grey 80% * | 52.4 ? | 50 ? 5% | 50.8 ? 3% | 25 ? 52% |
| Response Time Black / White * | 23.6 ? | 29.6 ? -25% | 29.6 ? -25% | 28 ? -19% |
| PWM Frequency | 220 ? | 50 ? -77% | ||
| Screen | 6% | 13% | -9% | |
| Brightness middle | 344 | 375 9% | 307.5 -11% | 358 4% |
| Brightness | 326 | 358 10% | 297 -9% | 351 8% |
| Brightness Distribution | 87 | 87 0% | 92 6% | 86 -1% |
| Black Level * | 0.36 | 0.39 -8% | 0.207 42% | 0.4 -11% |
| Contrast | 956 | 962 1% | 1486 55% | 895 -6% |
| Colorchecker dE 2000 * | 6.09 | 4.6 24% | 4.18 31% | 5.96 2% |
| Colorchecker dE 2000 max. * | 10 | 8.8 12% | 7.84 22% | 10.99 -10% |
| Greyscale dE 2000 * | 5.36 | 4 25% | 4.94 8% | 8.93 -67% |
| Gamma | 2.01 109% | 2.34 94% | 2.31 95% | 2.28 96% |
| CCT | 7230 90% | 7304 89% | 7645 85% | 6548 99% |
| Color Space (Percent of AdobeRGB 1998) | 62.25 | 57.9 -7% | 59 -5% | 60 -4% |
| Color Space (Percent of sRGB) | 97.54 | 88.7 -9% | 92 -6% | 93 -5% |
| Total Average (Program / Settings) | -2% /
3% | -1% /
7% | -9% /
-9% |
* ... smaller is better
Display Response Times
| ↔ Response Time Black to White | ||
|---|---|---|
| 23.6 ms ... rise ↗ and fall ↘ combined | ↗ 12 ms rise | |
| ↘ 11.6 ms fall | ||
| The screen shows good response rates in our tests, but may be too slow for competitive gamers. In comparison, all tested devices range from 0.1 (minimum) to 240 (maximum) ms. » 48 % of all devices are better. This means that the measured response time is similar to the average of all tested devices (21.5 ms). | ||
| ↔ Response Time 50% Grey to 80% Grey | ||
| 52.4 ms ... rise ↗ and fall ↘ combined | ↗ 18.4 ms rise | |
| ↘ 34 ms fall | ||
| The screen shows slow response rates in our tests and will be unsatisfactory for gamers. In comparison, all tested devices range from 0.2 (minimum) to 636 (maximum) ms. » 87 % of all devices are better. This means that the measured response time is worse than the average of all tested devices (33.7 ms). | ||
Screen Flickering / PWM (Pulse-Width Modulation)
| Screen flickering / PWM detected | 220 Hz | ≤ 50 % brightness setting |
The display backlight flickers at 220 Hz (worst case, e.g., utilizing PWM) Flickering detected at a brightness setting of 50 % and below. There should be no flickering or PWM above this brightness setting. The frequency of 220 Hz is relatively low, so sensitive users will likely notice flickering and experience eyestrain at the stated brightness setting and below. In comparison: 53 % of all tested devices do not use PWM to dim the display. If PWM was detected, an average of 17924 (minimum: 5 - maximum: 3846000) Hz was measured. | ||
| Cinebench R15 | |
| CPU Multi 64Bit | |
| Lenovo IdeaPad 710S-13ISK | |
| Asus Zenbook UX305UA-FC040T | |
| Dell XPS 13 9350 WQXGA | |
| Acer Aspire S 13 S5-371-71QZ | |
| CPU Single 64Bit | |
| Dell XPS 13 9350 WQXGA | |
| Lenovo IdeaPad 710S-13ISK | |
| Acer Aspire S 13 S5-371-71QZ | |
| Asus Zenbook UX305UA-FC040T | |
| PCMark 8 | |
| Home Score Accelerated v2 | |
| Lenovo IdeaPad 710S-13ISK | |
| Acer Aspire S 13 S5-371-71QZ | |
| Asus Zenbook UX305UA-FC040T | |
| Dell XPS 13 9350 WQXGA | |
| Work Score Accelerated v2 | |
| Lenovo IdeaPad 710S-13ISK | |
| Acer Aspire S 13 S5-371-71QZ | |
| Asus Zenbook UX305UA-FC040T | |
| Dell XPS 13 9350 WQXGA | |
| PCMark 8 Home Score Accelerated v2 | 3883 puan | |
| PCMark 8 Work Score Accelerated v2 | 4680 puan | |
Yardım | ||
| Lenovo IdeaPad 710S-13ISK Samsung PM951 NVMe MZVLV256 | Acer Aspire S 13 S5-371-71QZ LiteOn CV1-8B512 | Dell XPS 13 9350 WQXGA Samsung PM951 NVMe 512 GB | Asus Zenbook UX305UA-FC040T SK Hynix Canvas SC300 512GB M.2 (HFS512G39MND) | |
|---|---|---|---|---|
| AS SSD | -46% | 26% | -41% | |
| Seq Read | 1273 | 486 -62% | 1442 13% | 496.8 -61% |
| 4K Read | 39.13 | 27 -31% | 38.29 -2% | 26.87 -31% |
| 4K-64 Read | 1091 | 290 -73% | 1497 37% | 375.5 -66% |
| Score Write | 429 | 347 -19% | 664 55% | 405 -6% |
| CrystalDiskMark 3.0 | -44% | 3% | -49% | |
| Read Seq | 1193 | 502 -58% | 1236 4% | 469.1 -61% |
| Read 4k | 42.43 | 29.69 -30% | 42.36 0% | 28.08 -34% |
| Read 4k QD32 | 549 | 301.3 -45% | 572 4% | 262 -52% |
| Total Average (Program / Settings) | -45% /
-45% | 15% /
16% | -45% /
-44% |
| 3DMark 11 - 1280x720 Performance GPU | |
| Lenovo IdeaPad 710S-13ISK | |
| Dell XPS 13 9350 WQXGA | |
| Dell Latitude E7470 N001LE747014EMEA | |
| Acer Aspire S 13 S5-371-71QZ | |
| Asus Zenbook UX305UA-FC040T | |
| 3DMark | |
| 1280x720 Ice Storm Standard Graphics | |
| Dell Latitude E7470 N001LE747014EMEA | |
| Lenovo IdeaPad 710S-13ISK | |
| Dell XPS 13 9350 WQXGA | |
| Asus Zenbook UX305UA-FC040T | |
| 1280x720 Cloud Gate Standard Graphics | |
| Lenovo IdeaPad 710S-13ISK | |
| Dell XPS 13 9350 WQXGA | |
| Dell Latitude E7470 N001LE747014EMEA | |
| Asus Zenbook UX305UA-FC040T | |
| 3DMark 11 Performance | 2244 puan | |
| 3DMark Ice Storm Standard Score | 60021 puan | |
| 3DMark Cloud Gate Standard Score | 7646 puan | |
Yardım | ||
| düşük | orta | yüksek | ultra | |
| Crysis 3 (2013) | 37.6 | 27.6 | 19.6 | 6.6 |
| BioShock Infinite (2013) | 69.1 | 42.2 | 35.7 | 10 |
| Metro: Last Light (2013) | 21.9 | 9.5 | ||
| Battlefield 4 (2013) | 29 small graphical problems | 18 small graphical problems | 11.4 | |
| Dirt Rally (2015) | 119.2 | 30.4 | 14.3 | 12.5 |
| The Witcher 3 (2015) | 17.8 | 12 | 0 | |
| Mad Max (2015) | 28.9 | 13.2 | ||
| Anno 2205 (2015) | 29 small graphical problems | 15 small graphical problems | 6 small graphical problems | |
| Star Wars Battlefront (2015) | 40.2 | 22.9 | 0 | |
| Assassin's Creed Syndicate (2015) | 4.9 | |||
| Rainbow Six Siege (2015) | 39.1 | 24.2 | 13.5 | 11 |
| Rise of the Tomb Raider (2016) | 21.5 | 0 | 0 | |
| XCOM 2 (2016) | 18 | 6.7 | ||
| Far Cry Primal (2016) | 22 | 10 | 8 | |
| The Division (2016) | 21.7 | 12.9 | ||
| Hitman 2016 (2016) | 13.5 | 13.8 | 7.6 |
Ses yüksekliği
| Boşta |
| 30.1 / 30.1 / 30.1 dB |
| Çalışırken |
| 39.2 / 39.3 dB |
 | ||
30 dB sessiz 40 dB(A) duyulabilirlik 50 dB(A) gürültülü |
||
min: | ||
(±) The maximum temperature on the upper side is 42 °C / 108 F, compared to the average of 35.9 °C / 97 F, ranging from 21.4 to 59 °C for the class Subnotebook.
(+) The bottom heats up to a maximum of 37.5 °C / 100 F, compared to the average of 39.4 °C / 103 F
(+) In idle usage, the average temperature for the upper side is 31.3 °C / 88 F, compared to the device average of 30.7 °C / 87 F.
(+) The palmrests and touchpad are cooler than skin temperature with a maximum of 29.9 °C / 85.8 F and are therefore cool to the touch.
(±) The average temperature of the palmrest area of similar devices was 28.3 °C / 82.9 F (-1.6 °C / -2.9 F).
| Kapalı / Bekleme modu | |
| Boşta | |
| Çalışırken |
|
| Lenovo IdeaPad 710S-13ISK Iris Graphics 540, 6560U, Samsung PM951 NVMe MZVLV256 | Acer Aspire S 13 S5-371-71QZ HD Graphics 520, 6500U, LiteOn CV1-8B512 | Dell XPS 13 9350 WQXGA Iris Graphics 540, 6560U, Samsung PM951 NVMe 512 GB | Asus Zenbook UX305UA-FC040T HD Graphics 520, 6500U, SK Hynix Canvas SC300 512GB M.2 (HFS512G39MND) | |
|---|---|---|---|---|
| Battery Runtime | 17% | -2% | 39% | |
| Reader / Idle | 810 | 1028 27% | 604 -25% | 1427 76% |
| H.264 | 486 | 545 12% | ||
| WiFi v1.3 | 418 | 472 13% | 311 -26% | 561 34% |
| Load | 89 | 99 11% | 128 44% | 118 33% |
Artılar
Eksiler
Kompakt ve tüy hafifliğinde Lenovo IdeaPad 710S-13ISK incelememiz esnasında çok iyi bir izlenim bırakıyor ve herhangi ciddi bir aksaklık sunmuyor. İyi izlenimimizin temelinde aluminyum-magnezyum alaşımlı kasa yer almakta.
Bir diğer öne çıkan özelliği ise iyi ekranı. Klavye atrıca tatmin edici. Bağlantı noktalarının kısıtlı olması biraz sorun olabilir. Bakım kapağı yok ancak alt kısım kolay çıkarılabilir gibi duruyor.
Yazının tamamını okumak için tıklayın.
Lenovo IdeaPad 710S-13ISK
-
06/02/2016 v5.1(old)
Sven Kloevekorn


 Deutsch
 English
 Español
 Français
 Italiano
 Nederlands
 Polski
 Português
 Русский
 Türkçe
 Svenska
 Chinese
 Magyar