 Deutsch
 English
 Español
 Français
 Italiano
 Nederlands
 Polski
 Português
 Русский
 Türkçe
 Svenska
 Chinese
 Magyar
Kısa inceleme: Lenovo ThinkPad T470 (Core i5, Full-HD) Notebook
| SD Card Reader | |
| average JPG Copy Test (av. of 3 runs) | |
| Lenovo ThinkPad T470-20HD002HGE | |
| Lenovo ThinkPad T460s-20F9003SGE | |
| maximum AS SSD Seq Read Test (1GB) | |
| Lenovo ThinkPad T470-20HD002HGE | |
| Lenovo ThinkPad T460s-20F9003SGE | |
| Networking | |
| iperf3 transmit AX12 | |
| Apple MacBook Pro 15 2016 (2.6 GHz, 450) (Klaus I211) | |
| Lenovo ThinkPad T470-20HD002HGE | |
| Lenovo ThinkPad E470-20H2S00400 | |
| iperf3 receive AX12 | |
| Apple MacBook Pro 15 2016 (2.6 GHz, 450) (Klaus I211) | |
| Lenovo ThinkPad T470-20HD002HGE | |
| Lenovo ThinkPad E470-20H2S00400 | |
| |||||||||||||||||||||||||
Aydınlatma: 88 %
Batarya modunda parlaklık: 304 cd/m²
Kontrast: 1020:1 (Siyah: 0.3 cd/m²)
ΔE Color 6.2 | 0.5-29.43 Ø5
ΔE Greyscale 5.8 | 0.57-98 Ø5.3
61.44% sRGB (Argyll 1.6.3 3D)
39.62% AdobeRGB 1998 (Argyll 1.6.3 3D)
43.06% AdobeRGB 1998 (Argyll 2.2.0 3D)
61.9% sRGB (Argyll 2.2.0 3D)
41.6% Display P3 (Argyll 2.2.0 3D)
Gamma: 2.04
| Lenovo ThinkPad T470-20HD002HGE N140HCA-EAB, , 1920x1080, 14.00 | Lenovo ThinkPad T460-20FN003LGE Lenovo LEN40A9 / N140HCE-EAA, , 1920x1080, 14.00 | Lenovo ThinkPad T460s-20F9003SGE N140HCE-EAA, LEN40A9, , 1920x1080, 14.00 | Dell Latitude 14 7000 Series E7470 AUO B140QAN Dell PN F0WXVV, , 2560x1440, 14.00 | Lenovo ThinkPad E470-20H2S00400 N140HCA-EAB, , 1920x1080, 14.00 | |
|---|---|---|---|---|---|
| Display | 1% | 0% | 59% | -1% | |
| Display P3 Coverage | 41.6 | 42.09 1% | 41.65 0% | 67.2 62% | 41.23 -1% |
| sRGB Coverage | 61.9 | 62 0% | 61.6 0% | 95.9 55% | 61.4 -1% |
| AdobeRGB 1998 Coverage | 43.06 | 43.6 1% | 43.14 0% | 69.3 61% | 42.67 -1% |
| Response Times | 13% | 7% | 3% | 7% | |
| Response Time Grey 50% / Grey 80% * | 41.6 ? | 42.4 ? -2% | 42 ? -1% | 48 ? -15% | 40.8 ? 2% |
| Response Time Black / White * | 34 ? | 24.8 ? 27% | 29.2 ? 14% | 27 ? 21% | 30.4 ? 11% |
| PWM Frequency | |||||
| Screen | -12% | -5% | 33% | -10% | |
| Brightness middle | 306 | 230 -25% | 226 -26% | 380 24% | 244 -20% |
| Brightness | 287 | 216 -25% | 211 -26% | 354 23% | 231 -20% |
| Brightness Distribution | 88 | 85 -3% | 89 1% | 81 -8% | 89 1% |
| Black Level * | 0.3 | 0.26 13% | 0.22 27% | 0.26 13% | 0.37 -23% |
| Contrast | 1020 | 885 -13% | 1027 1% | 1462 43% | 659 -35% |
| Colorchecker dE 2000 * | 6.2 | 7.32 -18% | 6.44 -4% | 3.11 50% | 6.41 -3% |
| Colorchecker dE 2000 max. * | 13.6 | 18.14 -33% | 17.18 -26% | 6.73 51% | 13.4 1% |
| Greyscale dE 2000 * | 5.8 | 6.98 -20% | 5.87 -1% | 4.35 25% | 5.94 -2% |
| Gamma | 2.04 108% | 2.5 88% | 2.37 93% | 2.37 93% | 2.28 96% |
| CCT | 6277 104% | 6683 97% | 6856 95% | 6771 96% | 6101 107% |
| Color Space (Percent of AdobeRGB 1998) | 39.62 | 39.97 1% | 39.58 0% | 62 56% | 39.3 -1% |
| Color Space (Percent of sRGB) | 61.44 | 61.55 0% | 61.15 0% | 96 56% | 61.1 -1% |
| Total Average (Program / Settings) | 1% /
-6% | 1% /
-3% | 32% /
34% | -1% /
-6% |
* ... smaller is better
Display Response Times
| ↔ Response Time Black to White | ||
|---|---|---|
| 34 ms ... rise ↗ and fall ↘ combined | ↗ 9.6 ms rise | 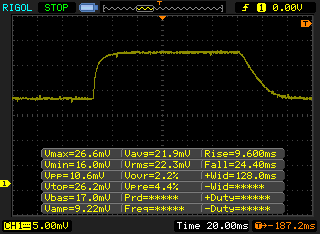 |
| ↘ 24.4 ms fall | ||
| The screen shows slow response rates in our tests and will be unsatisfactory for gamers. In comparison, all tested devices range from 0.1 (minimum) to 240 (maximum) ms. » 89 % of all devices are better. This means that the measured response time is worse than the average of all tested devices (21.5 ms). | ||
| ↔ Response Time 50% Grey to 80% Grey | ||
| 41.6 ms ... rise ↗ and fall ↘ combined | ↗ 20.4 ms rise | 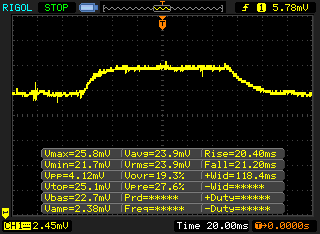 |
| ↘ 21.2 ms fall | ||
| The screen shows slow response rates in our tests and will be unsatisfactory for gamers. In comparison, all tested devices range from 0.2 (minimum) to 636 (maximum) ms. » 62 % of all devices are better. This means that the measured response time is worse than the average of all tested devices (33.7 ms). | ||
Screen Flickering / PWM (Pulse-Width Modulation)
| Screen flickering / PWM not detected | ||
In comparison: 53 % of all tested devices do not use PWM to dim the display. If PWM was detected, an average of 17924 (minimum: 5 - maximum: 3846000) Hz was measured. | ||
| PCMark 8 Home Score Accelerated v2 | 3507 puan | |
| PCMark 8 Creative Score Accelerated v2 | 4347 puan | |
| PCMark 8 Work Score Accelerated v2 | 4667 puan | |
Yardım | ||

| 3DMark 11 - 1280x720 Performance GPU | |
| Lenovo ThinkPad E470-20H2S00400 | |
| Asus Zenbook UX3410UA | |
| Lenovo ThinkPad T470-20HD002HGE | |
| Lenovo ThinkPad T460-20FN003LGE | |
| Lenovo ThinkPad T460s-20F9003SGE | |
| 3DMark | |
| 1280x720 Cloud Gate Standard Graphics | |
| Lenovo ThinkPad E470-20H2S00400 | |
| Asus Zenbook UX3410UA | |
| Lenovo ThinkPad T470-20HD002HGE | |
| Lenovo ThinkPad T460s-20F9003SGE | |
| Lenovo ThinkPad T460-20FN003LGE | |
| 1920x1080 Fire Strike Graphics | |
| Lenovo ThinkPad E470-20H2S00400 | |
| Asus Zenbook UX3410UA | |
| Lenovo ThinkPad T470-20HD002HGE | |
| Lenovo ThinkPad T460s-20F9003SGE | |
| 3DMark 11 Performance | 1554 puan | |
| 3DMark Cloud Gate Standard Score | 5317 puan | |
| 3DMark Fire Strike Score | 762 puan | |
Yardım | ||
| BioShock Infinite | |
| 1280x720 Very Low Preset | |
| HP Spectre x360 15-bl002xx | |
| Lenovo ThinkPad T470-20HD002HGE | |
| 1366x768 Medium Preset | |
| HP Spectre x360 15-bl002xx | |
| Lenovo ThinkPad T470-20HD002HGE | |
| 1366x768 High Preset | |
| HP Spectre x360 15-bl002xx | |
| Lenovo ThinkPad T470-20HD002HGE | |
| Tomb Raider | |
| 1024x768 Low Preset | |
| HP Spectre x360 15-bl002xx | |
| Lenovo ThinkPad T470-20HD002HGE | |
| 1366x768 Normal Preset AA:FX AF:4x | |
| HP Spectre x360 15-bl002xx | |
| Lenovo ThinkPad T470-20HD002HGE | |
| 1366x768 High Preset AA:FX AF:8x | |
| HP Spectre x360 15-bl002xx | |
| Lenovo ThinkPad T470-20HD002HGE | |
| Rise of the Tomb Raider | |
| 1024x768 Lowest Preset | |
| HP Spectre x360 15-bl002xx | |
| Lenovo ThinkPad T470-20HD002HGE | |
| 1366x768 Medium Preset AF:2x | |
| HP Spectre x360 15-bl002xx | |
| Lenovo ThinkPad T470-20HD002HGE | |
| düşük | orta | yüksek | ultra | |
| Tomb Raider (2013) | 66.1 | 33.3 | 19.5 | |
| BioShock Infinite (2013) | 40.5 | 23.9 | 19.9 | 6.4 |
| Battlefield 4 (2013) | 31.5 | 25 | 16.2 | |
| The Witcher 3 (2015) | 13.3 | |||
| Rise of the Tomb Raider (2016) | 17.8 | 12.6 |
Ses yüksekliği
| Boşta |
| 28 / 28 / 29.4 dB |
| Çalışırken |
| 31.4 / 34.6 dB |
 | ||
30 dB sessiz 40 dB(A) duyulabilirlik 50 dB(A) gürültülü |
||
min: | ||
| Lenovo ThinkPad T470-20HD002HGE i5-7200U, HD Graphics 620 | Lenovo ThinkPad T460-20FN003LGE 6200U, HD Graphics 520 | Lenovo ThinkPad T460s-20F9003SGE 6200U, HD Graphics 520 | Dell Latitude 14 7000 Series E7470 6600U, HD Graphics 520 | Lenovo ThinkPad E470-20H2S00400 i5-7200U, GeForce 940MX | HP EliteBook 840 G4-Z2V49ET ABD i5-7200U, HD Graphics 620 | |
|---|---|---|---|---|---|---|
| Noise | -5% | -3% | -6% | -6% | -7% | |
| off / environment * | 28 | 29 -4% | 29.1 -4% | 31.2 -11% | 29 -4% | 31 -11% |
| Idle Minimum * | 28 | 29 -4% | 29.1 -4% | 31.2 -11% | 29 -4% | 31 -11% |
| Idle Average * | 28 | 29 -4% | 29.1 -4% | 31.2 -11% | 29 -4% | 31 -11% |
| Idle Maximum * | 29.4 | 29 1% | 29.1 1% | 31.2 -6% | 29 1% | 31 -5% |
| Load Average * | 31.4 | 34.2 -9% | 32.3 -3% | 31.9 -2% | 35.6 -13% | 33.5 -7% |
| Load Maximum * | 34.6 | 37.8 -9% | 36.6 -6% | 31.9 8% | 38.5 -11% | 33.7 3% |
* ... smaller is better
(+) The maximum temperature on the upper side is 37.2 °C / 99 F, compared to the average of 34.2 °C / 94 F, ranging from 21.2 to 62.5 °C for the class Office.
(-) The bottom heats up to a maximum of 45.1 °C / 113 F, compared to the average of 36.7 °C / 98 F
(+) In idle usage, the average temperature for the upper side is 23.3 °C / 74 F, compared to the device average of 29.5 °C / 85 F.
(+) The palmrests and touchpad are cooler than skin temperature with a maximum of 29.8 °C / 85.6 F and are therefore cool to the touch.
(-) The average temperature of the palmrest area of similar devices was 27.7 °C / 81.9 F (-2.1 °C / -3.7 F).
Lenovo ThinkPad T470-20HD002HGE audio analysis
(±) | speaker loudness is average but good (80.4 dB)
Bass 100 - 315 Hz
(-) | nearly no bass - on average 16.6% lower than median
(±) | linearity of bass is average (8.8% delta to prev. frequency)
Mids 400 - 2000 Hz
(+) | balanced mids - only 4.3% away from median
(+) | mids are linear (6.7% delta to prev. frequency)
Highs 2 - 16 kHz
(±) | higher highs - on average 5.4% higher than median
(±) | linearity of highs is average (13.3% delta to prev. frequency)
Overall 100 - 16.000 Hz
(±) | linearity of overall sound is average (18.7% difference to median)
Compared to same class
» 29% of all tested devices in this class were better, 6% similar, 65% worse
» The best had a delta of 7%, average was 22%, worst was 53%
Compared to all devices tested
» 37% of all tested devices were better, 8% similar, 55% worse
» The best had a delta of 4%, average was 25%, worst was 134%
Lenovo ThinkPad E470-20H2S00400 audio analysis
(+) | speakers can play relatively loud (84.8 dB)
Bass 100 - 315 Hz
(-) | nearly no bass - on average 15.7% lower than median
(±) | linearity of bass is average (11.2% delta to prev. frequency)
Mids 400 - 2000 Hz
(±) | higher mids - on average 9% higher than median
(±) | linearity of mids is average (11.1% delta to prev. frequency)
Highs 2 - 16 kHz
(±) | higher highs - on average 5.1% higher than median
(±) | linearity of highs is average (10.5% delta to prev. frequency)
Overall 100 - 16.000 Hz
(±) | linearity of overall sound is average (23.8% difference to median)
Compared to same class
» 65% of all tested devices in this class were better, 10% similar, 26% worse
» The best had a delta of 7%, average was 22%, worst was 53%
Compared to all devices tested
» 67% of all tested devices were better, 7% similar, 26% worse
» The best had a delta of 4%, average was 25%, worst was 134%
| Kapalı / Bekleme modu | |
| Boşta | |
| Çalışırken |
|
| Lenovo ThinkPad T470-20HD002HGE i5-7200U, HD Graphics 620, 1920x1080 | Lenovo ThinkPad T460-20FN003LGE 6200U, HD Graphics 520, 1920x1080 | Lenovo ThinkPad T460s-20F9003SGE 6200U, HD Graphics 520, 1920x1080 | Dell Latitude 14 7000 Series E7470 6600U, HD Graphics 520, 2560x1440 | Lenovo ThinkPad E470-20H2S00400 i5-7200U, GeForce 940MX, 1920x1080 | HP EliteBook 840 G4-Z2V49ET ABD i5-7200U, HD Graphics 620, 1920x1080 | |
|---|---|---|---|---|---|---|
| Power Consumption | -5% | -5% | -32% | -22% | 0% | |
| Idle Minimum * | 3.21 | 3.5 -9% | 3.7 -15% | 5.1 -59% | 2.7 16% | 2.9 10% |
| Idle Average * | 6.15 | 6.7 -9% | 6.8 -11% | 8.5 -38% | 5.5 11% | 5.6 9% |
| Idle Maximum * | 6.82 | 7.3 -7% | 7.3 -7% | 10.1 -48% | 6.5 5% | 8.15 -20% |
| Load Average * | 28.5 | 28.2 1% | 26.3 8% | 35.2 -24% | 44.2 -55% | 30.6 -7% |
| Load Maximum * | 34.5 | 34.6 -0% | 34.6 -0% | 31 10% | 65.2 -89% | 31 10% |
* ... smaller is better
| Lenovo ThinkPad T470-20HD002HGE i5-7200U, HD Graphics 620, 48 Wh | Lenovo ThinkPad T460-20FN003LGE 6200U, HD Graphics 520, 46 Wh | Lenovo ThinkPad T460s-20F9003SGE 6200U, HD Graphics 520, 49 Wh | Dell Latitude 14 7000 Series E7470 6600U, HD Graphics 520, 55 Wh | Lenovo ThinkPad E470-20H2S00400 i5-7200U, GeForce 940MX, 45 Wh | |
|---|---|---|---|---|---|
| Battery Runtime | -17% | -6% | -10% | -11% | |
| H.264 | 623 | 512 -18% | 534 -14% | 503 -19% | |
| WiFi v1.3 | 438 | 338 -23% | 395 -10% | 346 -21% | 326 -26% |
| Load | 110 | 98 -11% | 116 5% | 112 2% | 124 13% |
Artılar
Eksiler
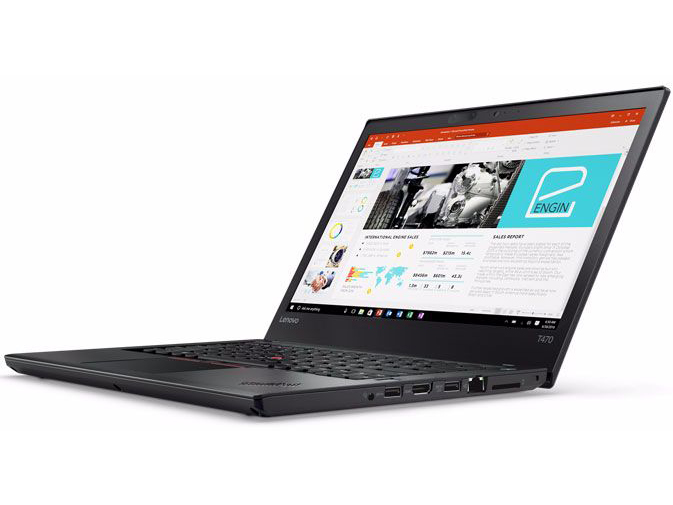
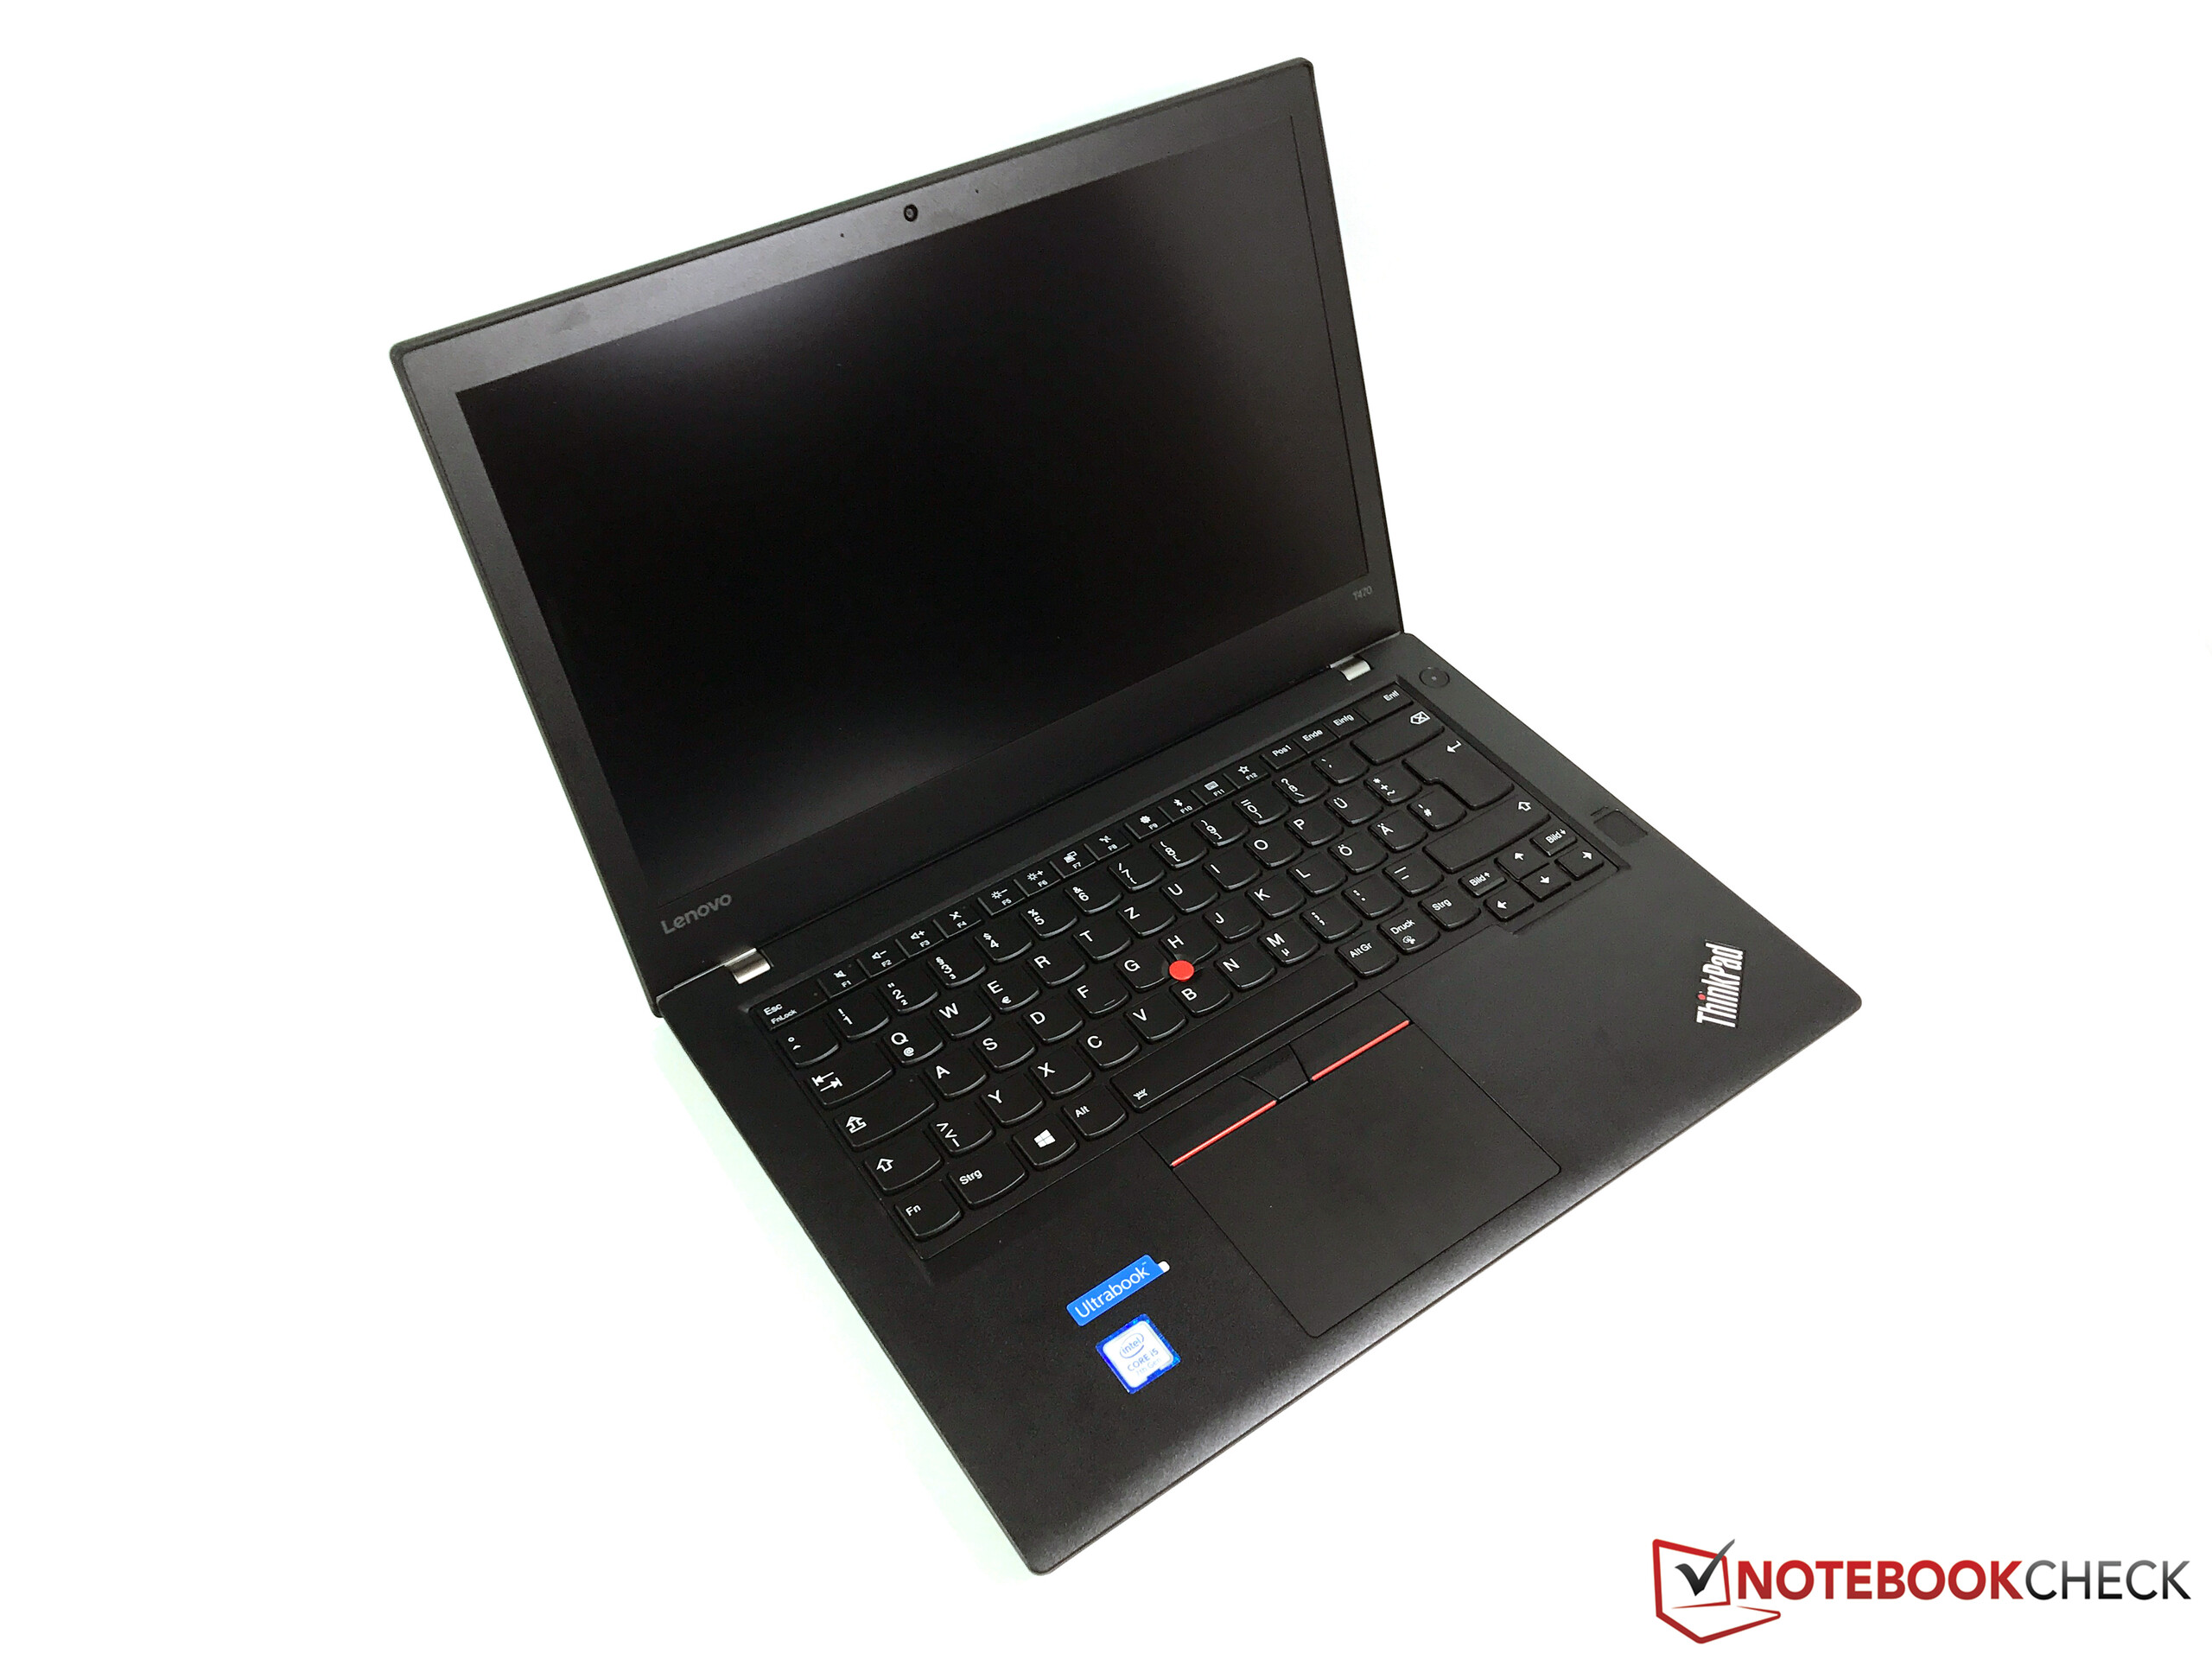
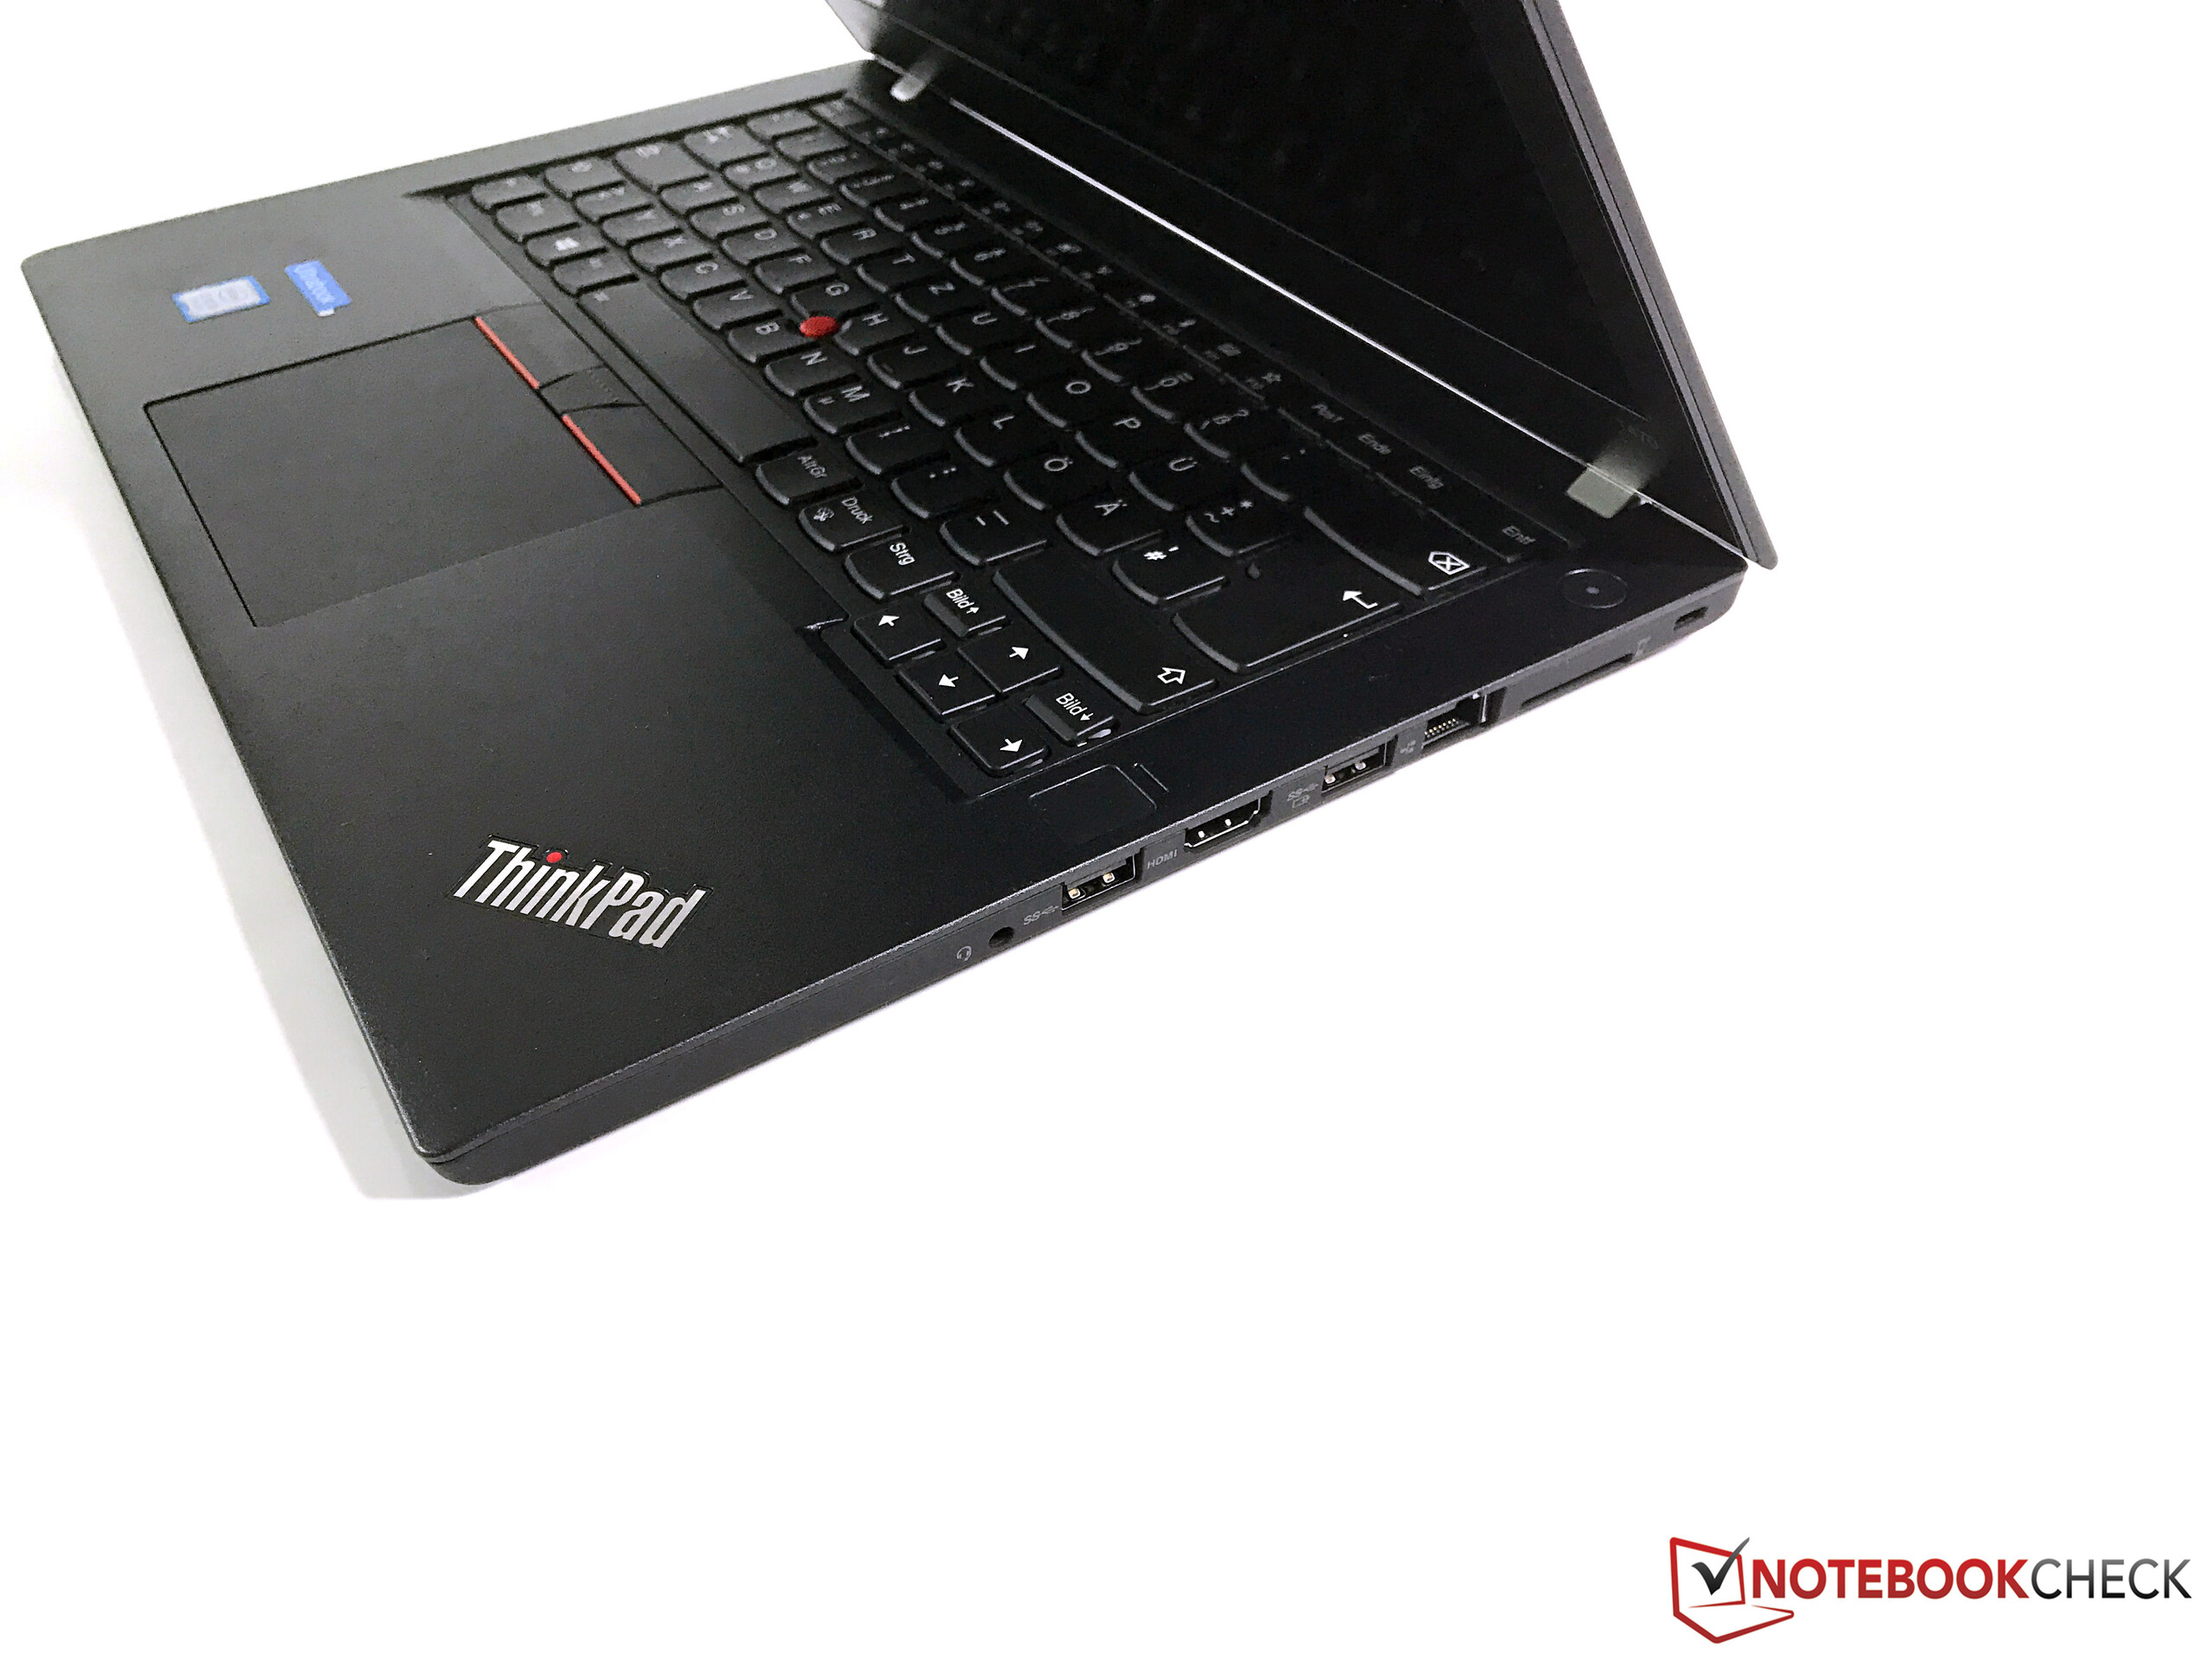
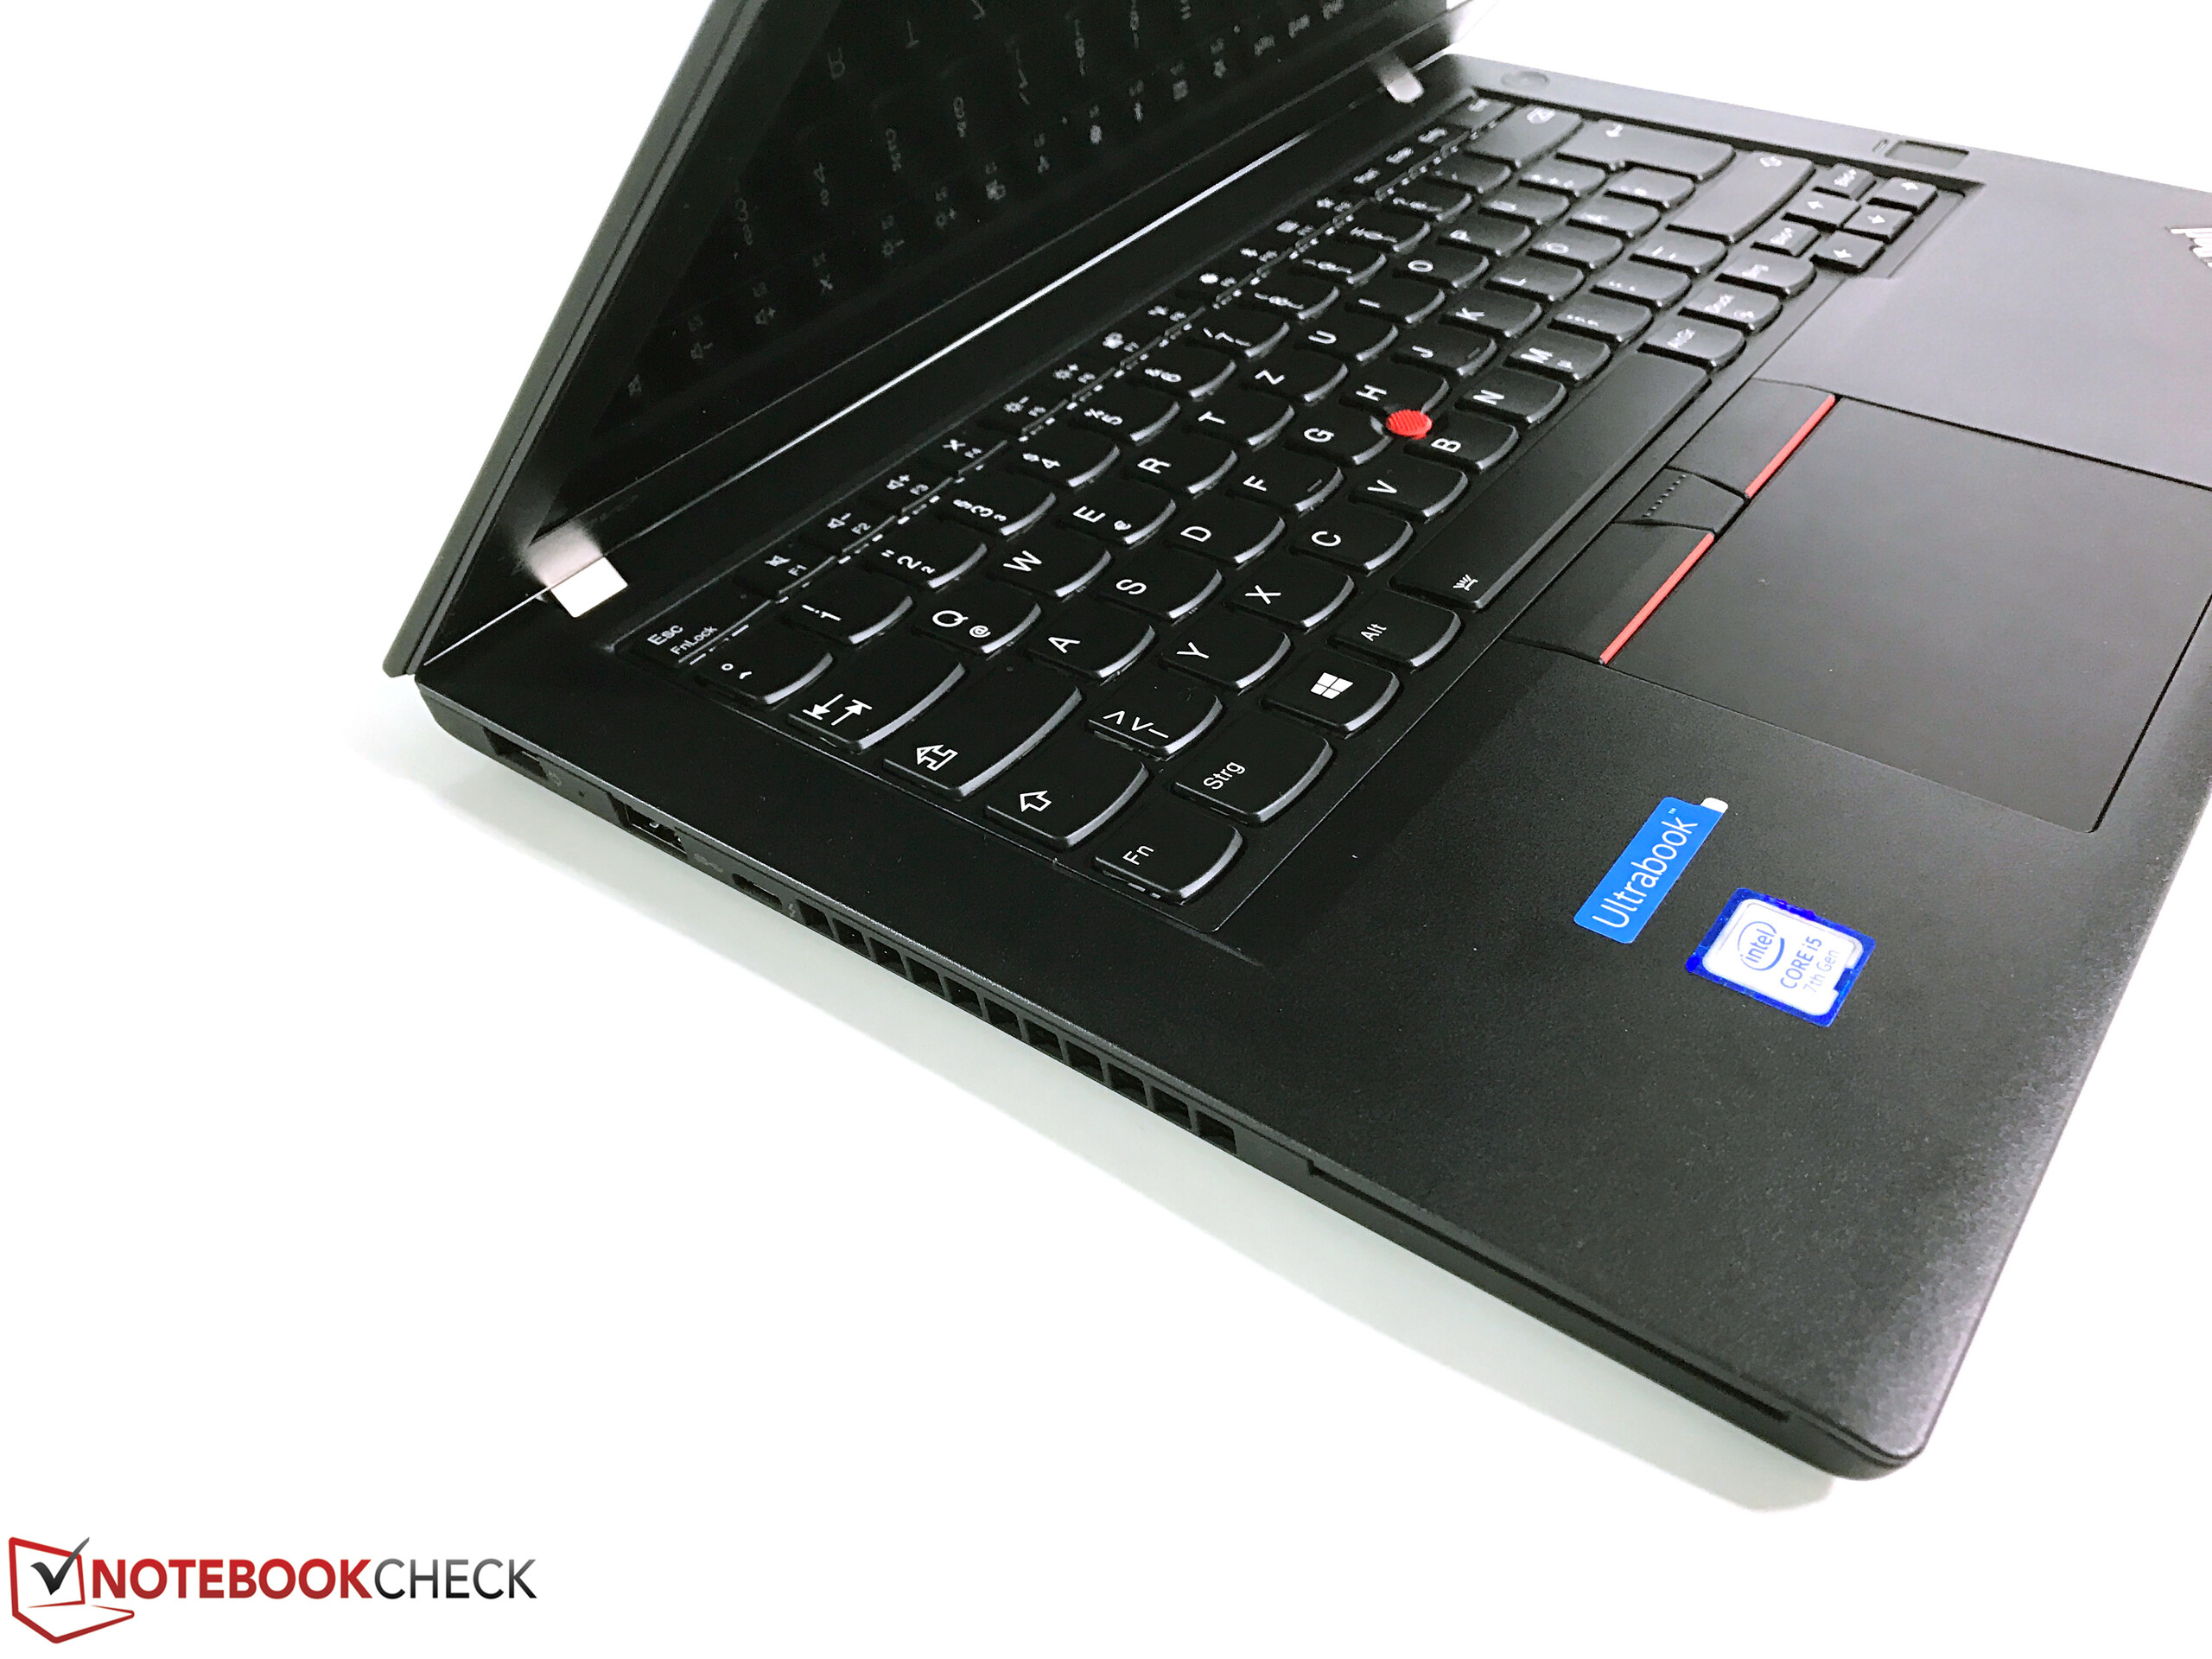
Yeni ThinkPad T470 birçok alanda bazı eksikliklerine rağmen tatmin edici performans sunuyor. Yeni kasa eskisinden biraz daha küçük ve hafif olmasına karşın yapım ve stabilite yönünden oldukça iyi. Klavye mobil segmentinde halen en iyi kullanımlardan birine sahip.
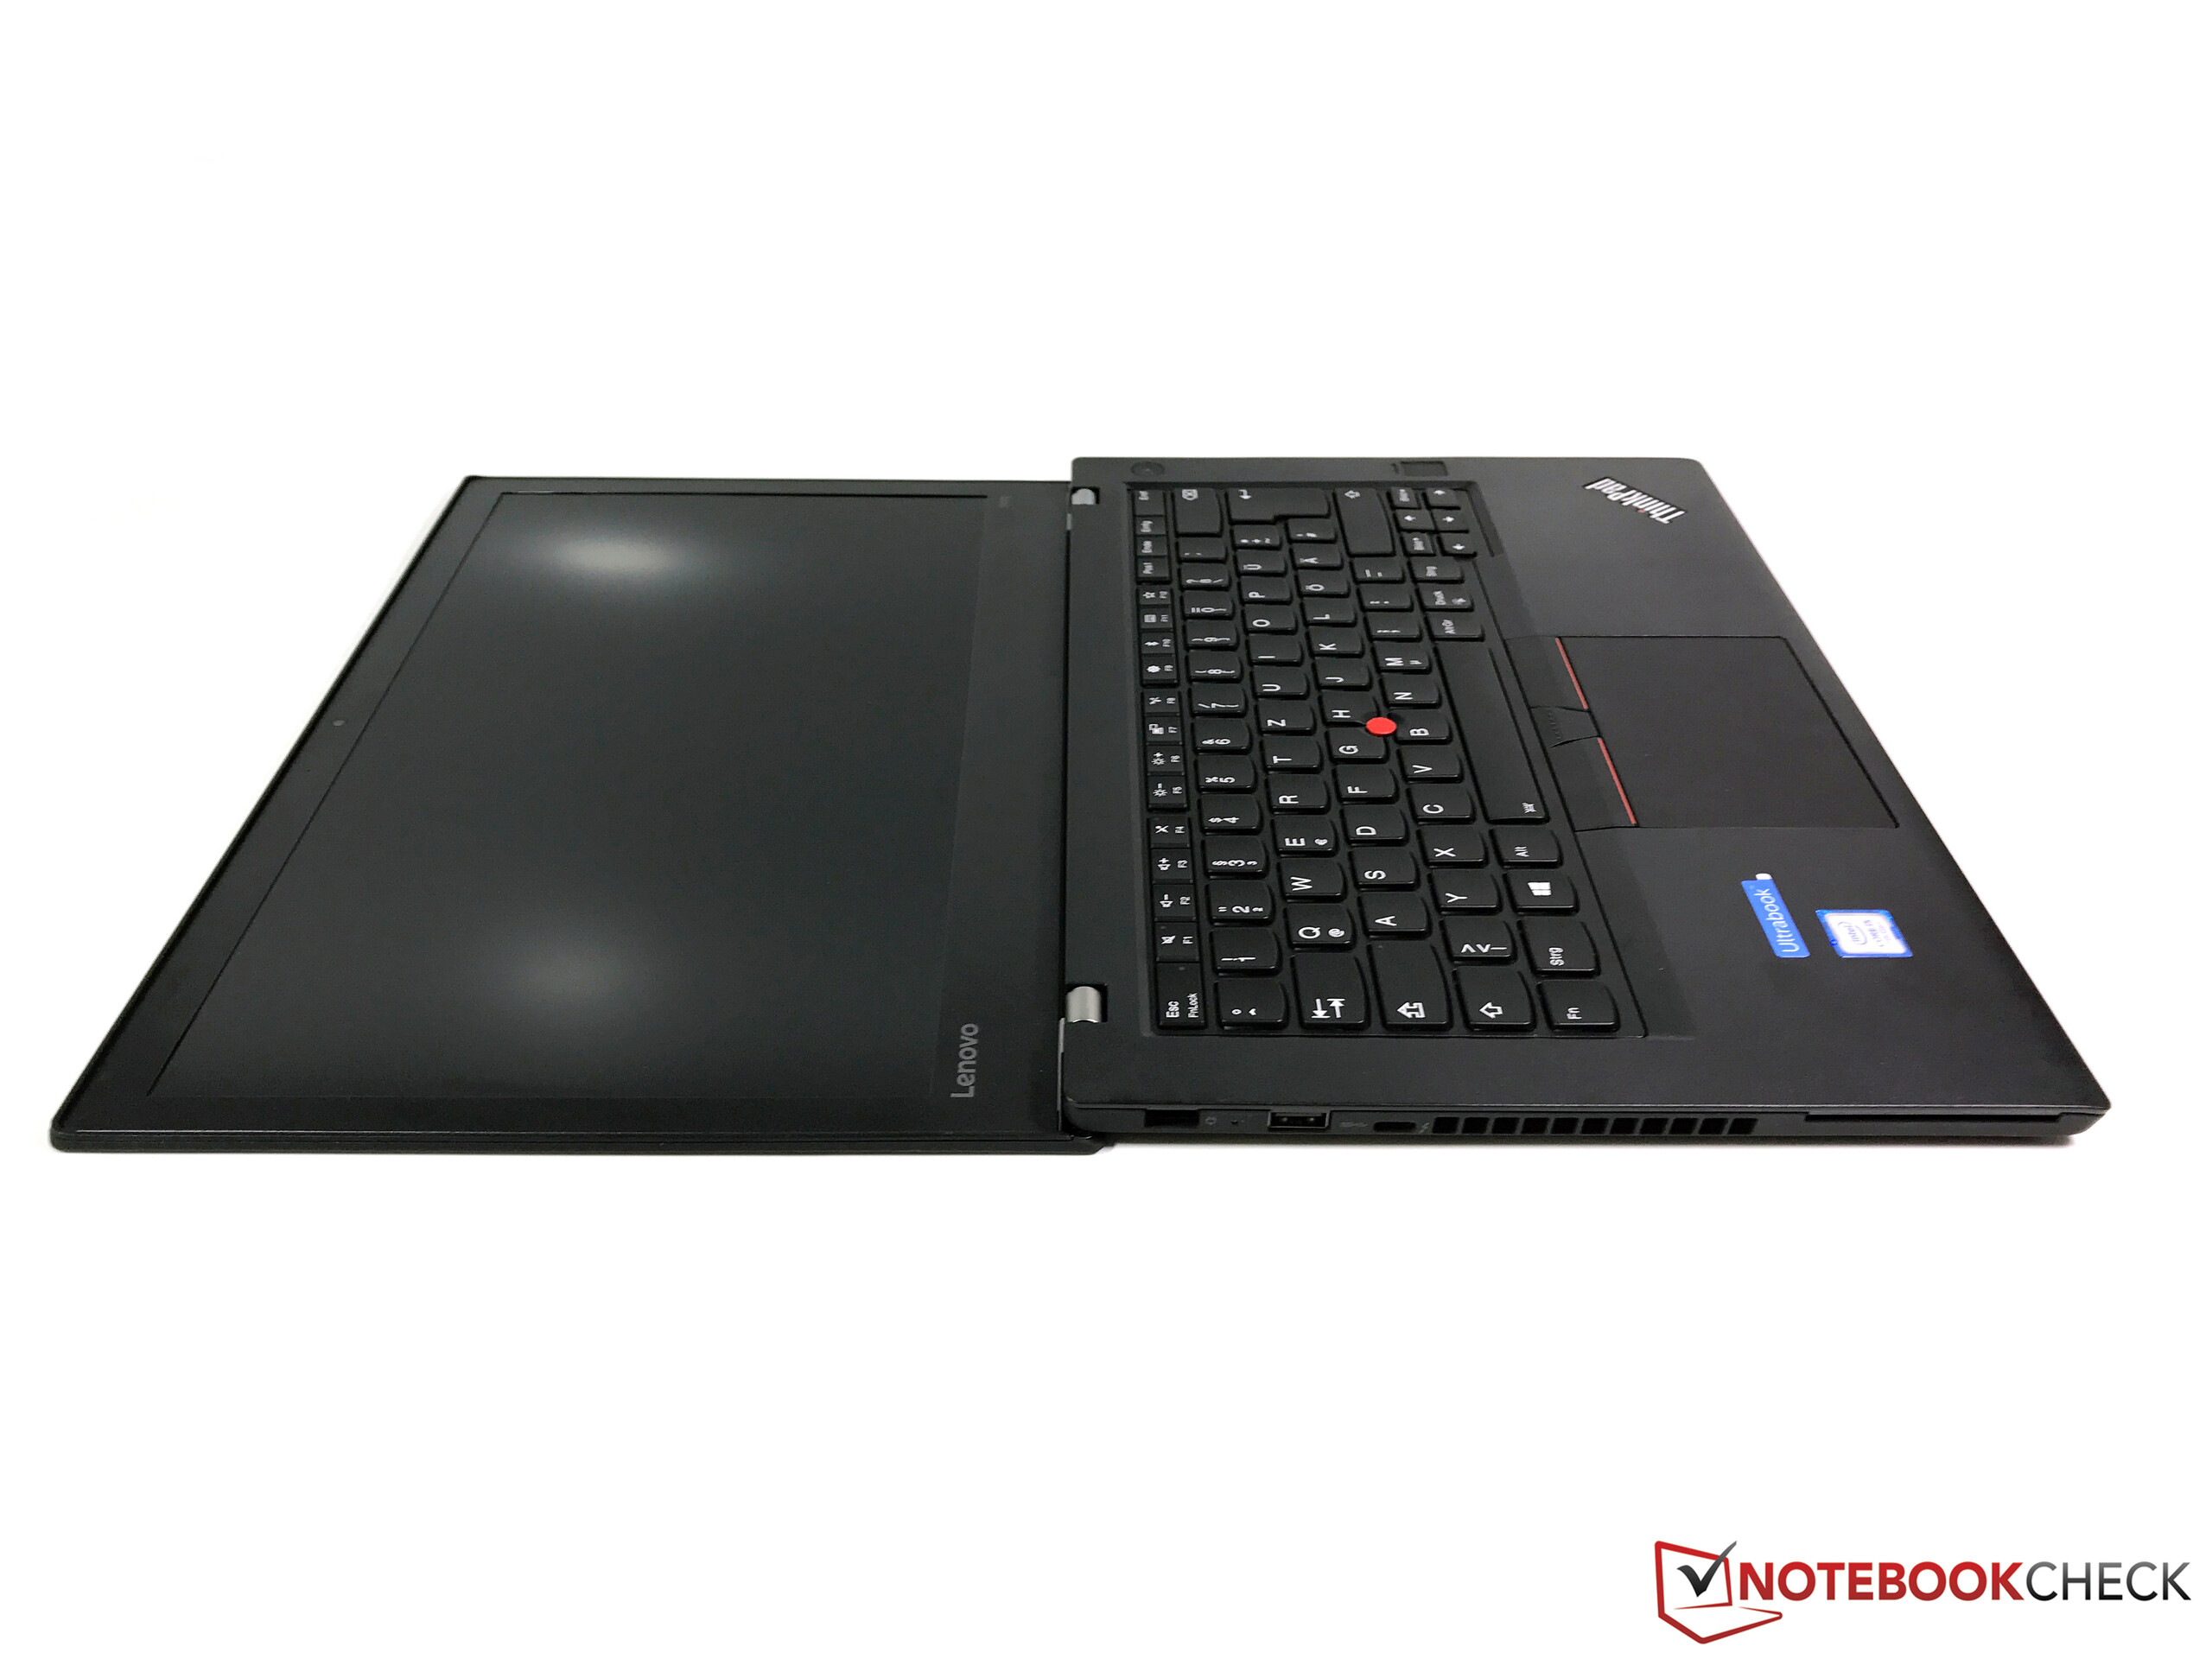
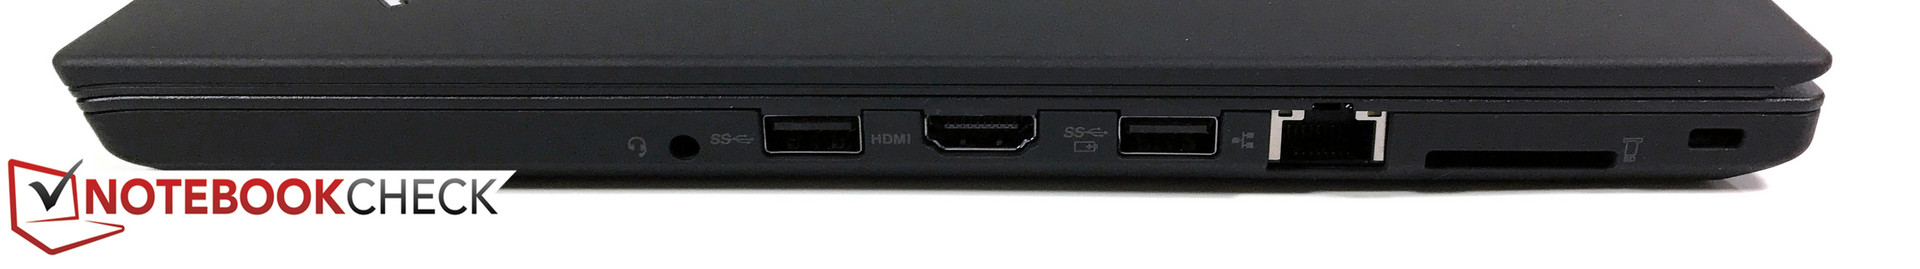
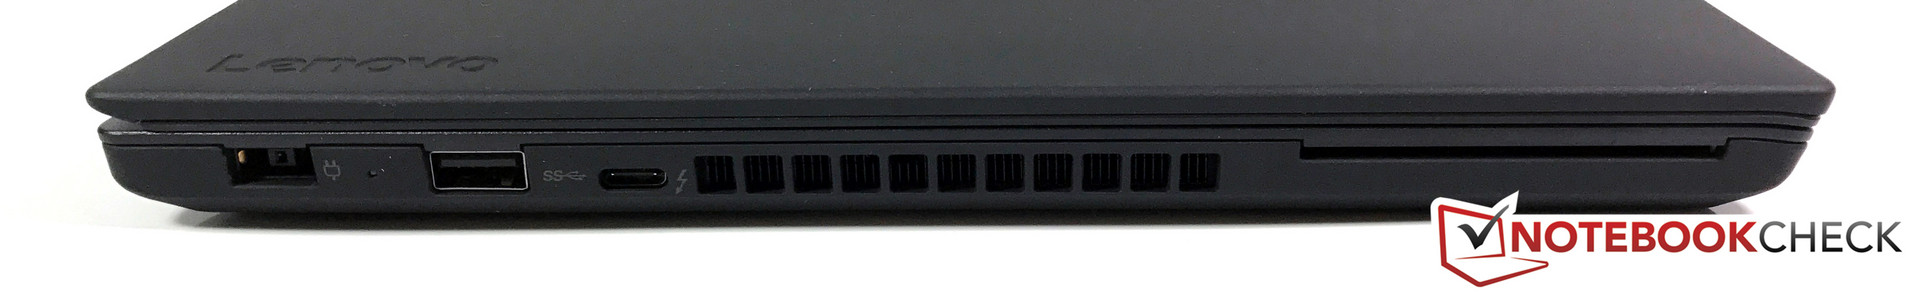
Lenovo bağlantı noktası seçimini de bu güncelleme için iyileştirip tüm standartları Thunderbolt 3 de dahil olmak üzere kullanmış. Bağlantı olanaklarına ek olarak hızlı WiFi modülü ve detaylı güvenlik özellikleri eklenmiş.
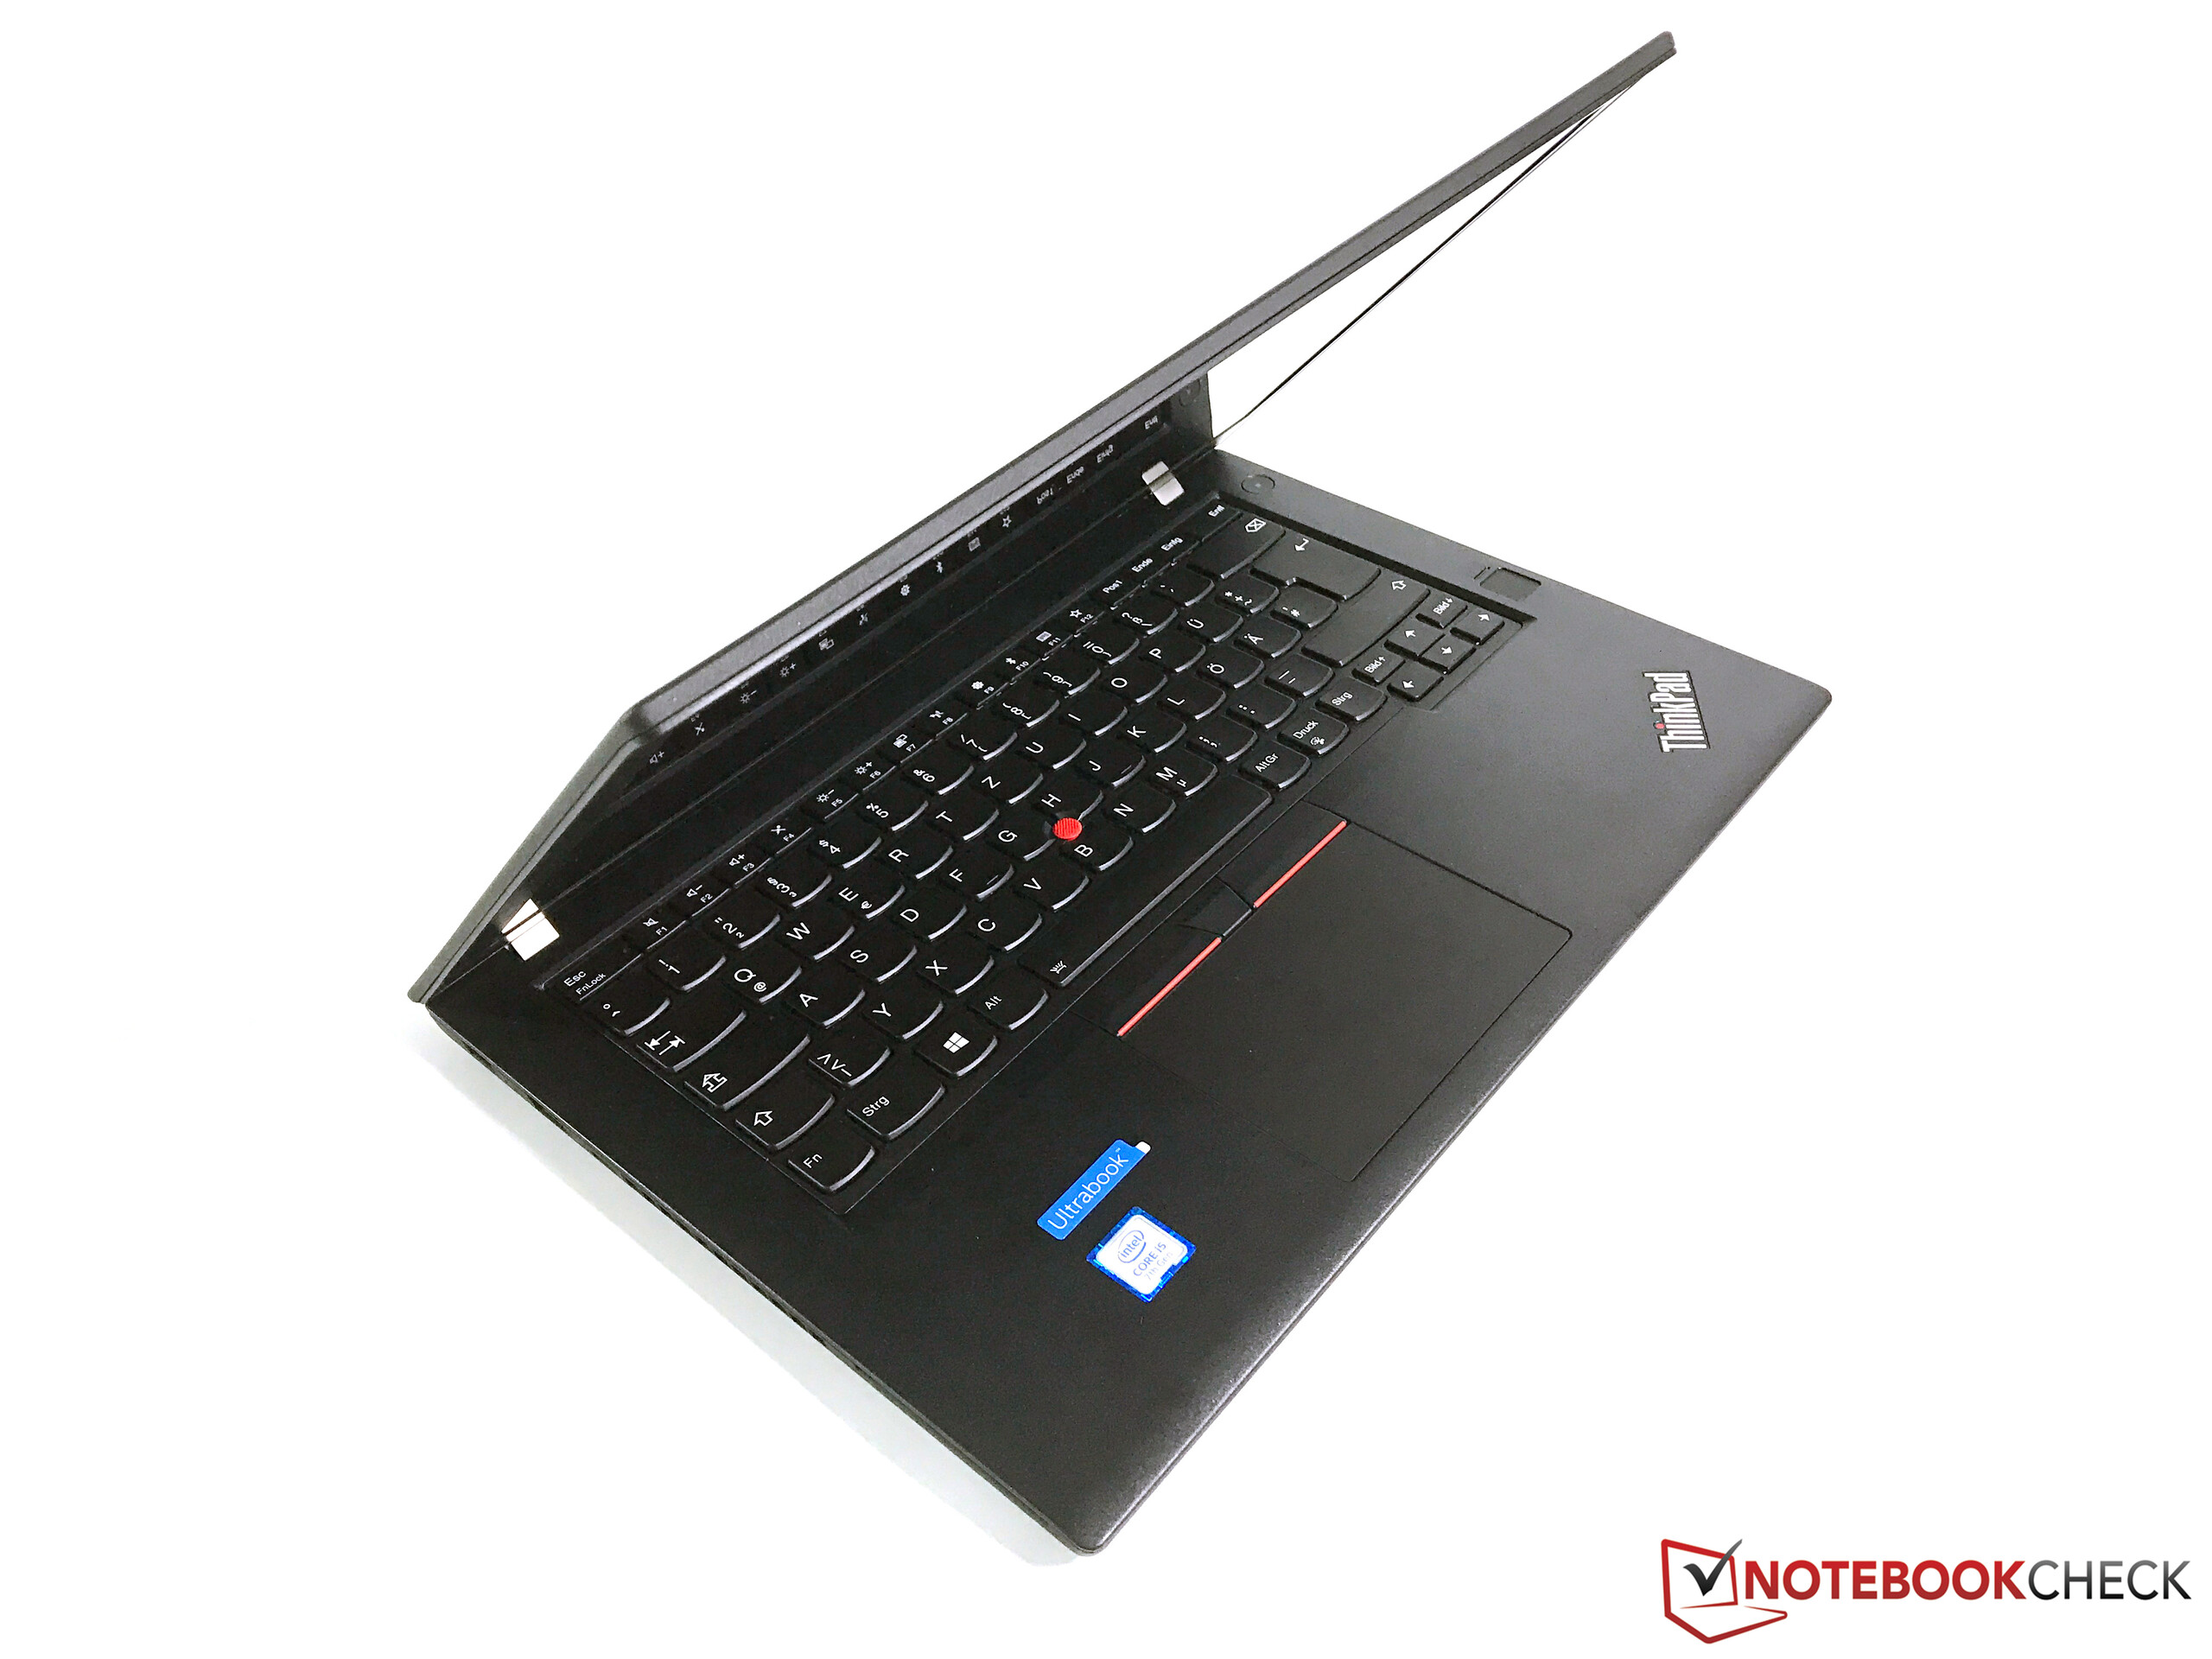
Cihazın performansı oldukça iyi ve yoğun kullanımda bile herhangi bir kısıtlaması yok. İşlemcinin güç tüketimi arttırılması ile performansı da iyileştiğinden iyi bir seçim olmuş. Soğutma sistemi ise bu konuda hiçbir sorun yaşamıyor.
Lenovo'nun ThinkPad T470 modeli çok iyi bir iş cihazı. Sadece düşük renk gamutundan ve oldukça değişken ekran renklerinden ötürü resim düzenleme pek mümkün değil.
Cihazın en büyük eksikliklerinden birini halen ekran oluşturuyor. Resim düzenleme işleri için ideal değil ve bu iş için daha pahalı T470s modelini seçmeniz gerek. Daha iyi bir ekran olmasını elbette isterdik, ancak çoğu şirketin bu cihazı resim düzenleme için kullanmayacağı düşünüldüğünde pek bir sorun olmayacaktır.
En son nokta ise fiyatı. 1600 Euroluk yurtdışı satış fiyatına 3 yıl yerinde servis dahil. 512 GBlik SSD de fiyatı arttırıyor.
Overall, the ThinkPad T470 is currently one of the best office laptops thanks to the low emissions, the great input devices, the good performance, and long battery runtimes. We reward this performance with our Editor's Choice award.
Genel olarak ThinkPad T470 düşük sistem değerleri, harika bağlantı noktaları, iyi performansı ve uzun batarya süreleri ile en iyi ofis cihazlarında biri. Bu performansı "Editörün tercihi" ödülü ile taçlandırıyoruz.
Yazının orjinali için tıklayın.
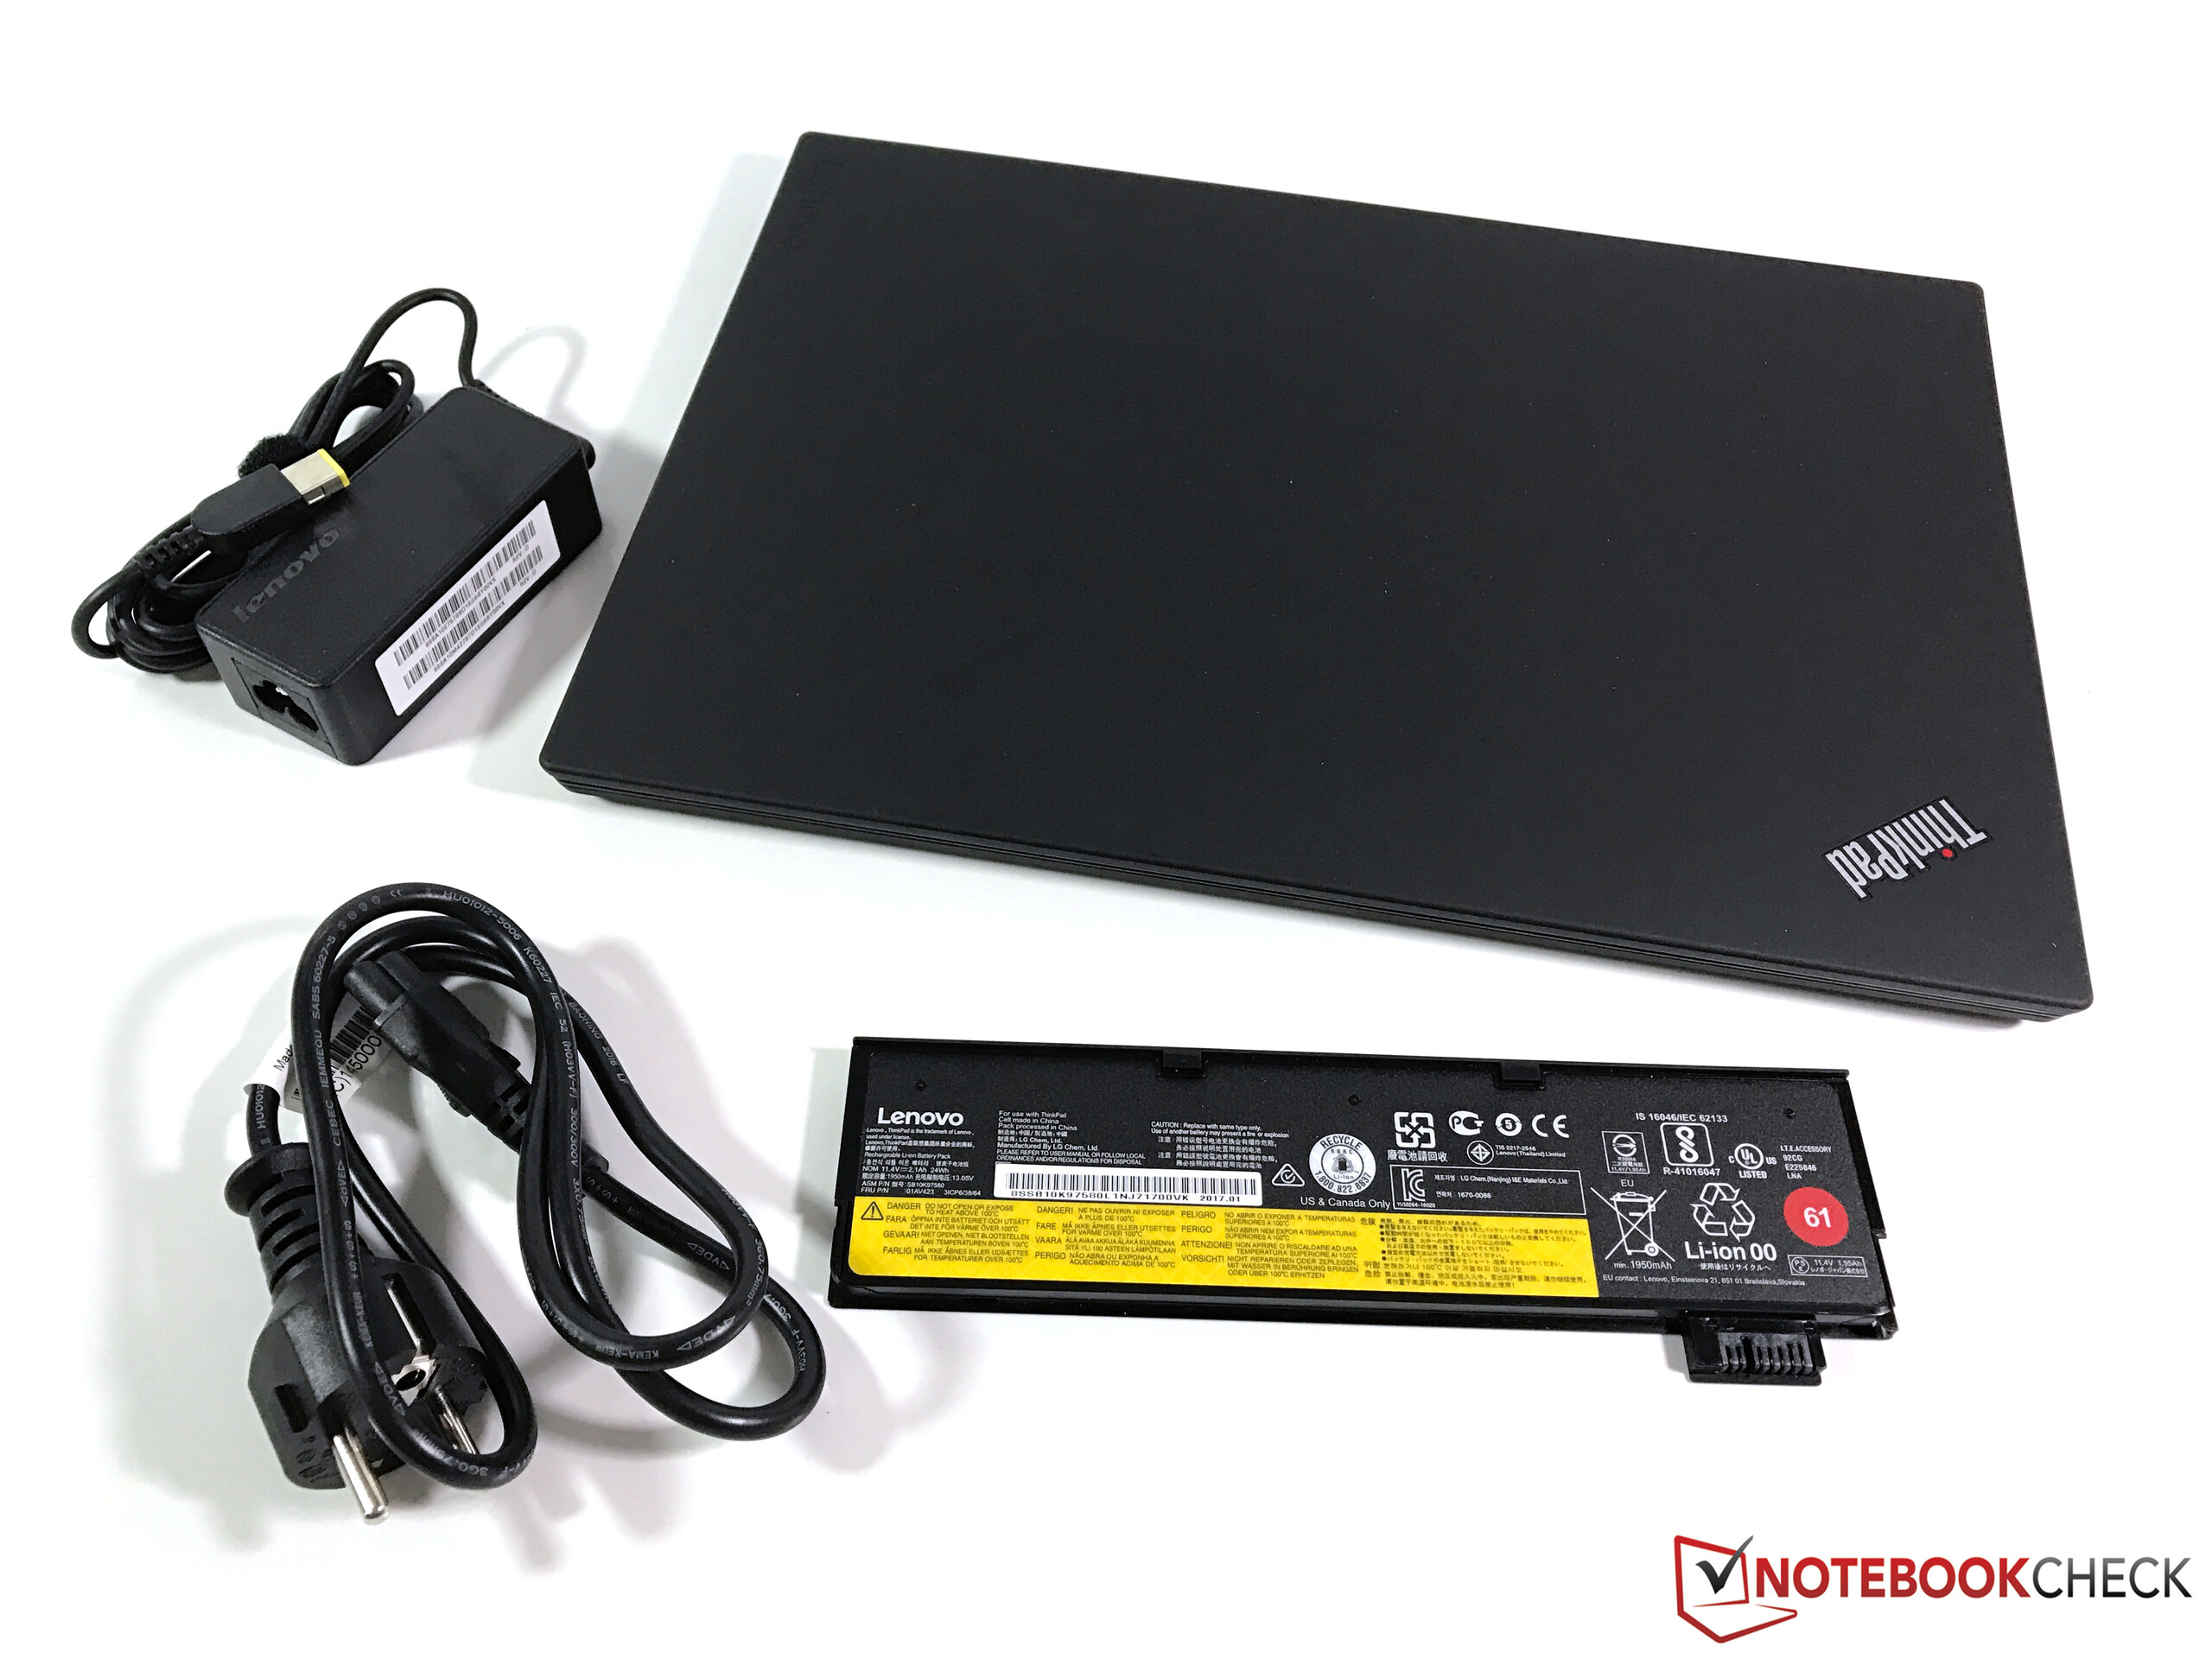
Lenovo ThinkPad T470-20HD002HGE
-
02/26/2017 v6(old)
Andreas Osthoff
Pricecompare
