 Deutsch
 English
 Español
 Français
 Italiano
 Nederlands
 Polski
 Português
 Русский
 Türkçe
 Svenska
 Chinese
 Magyar
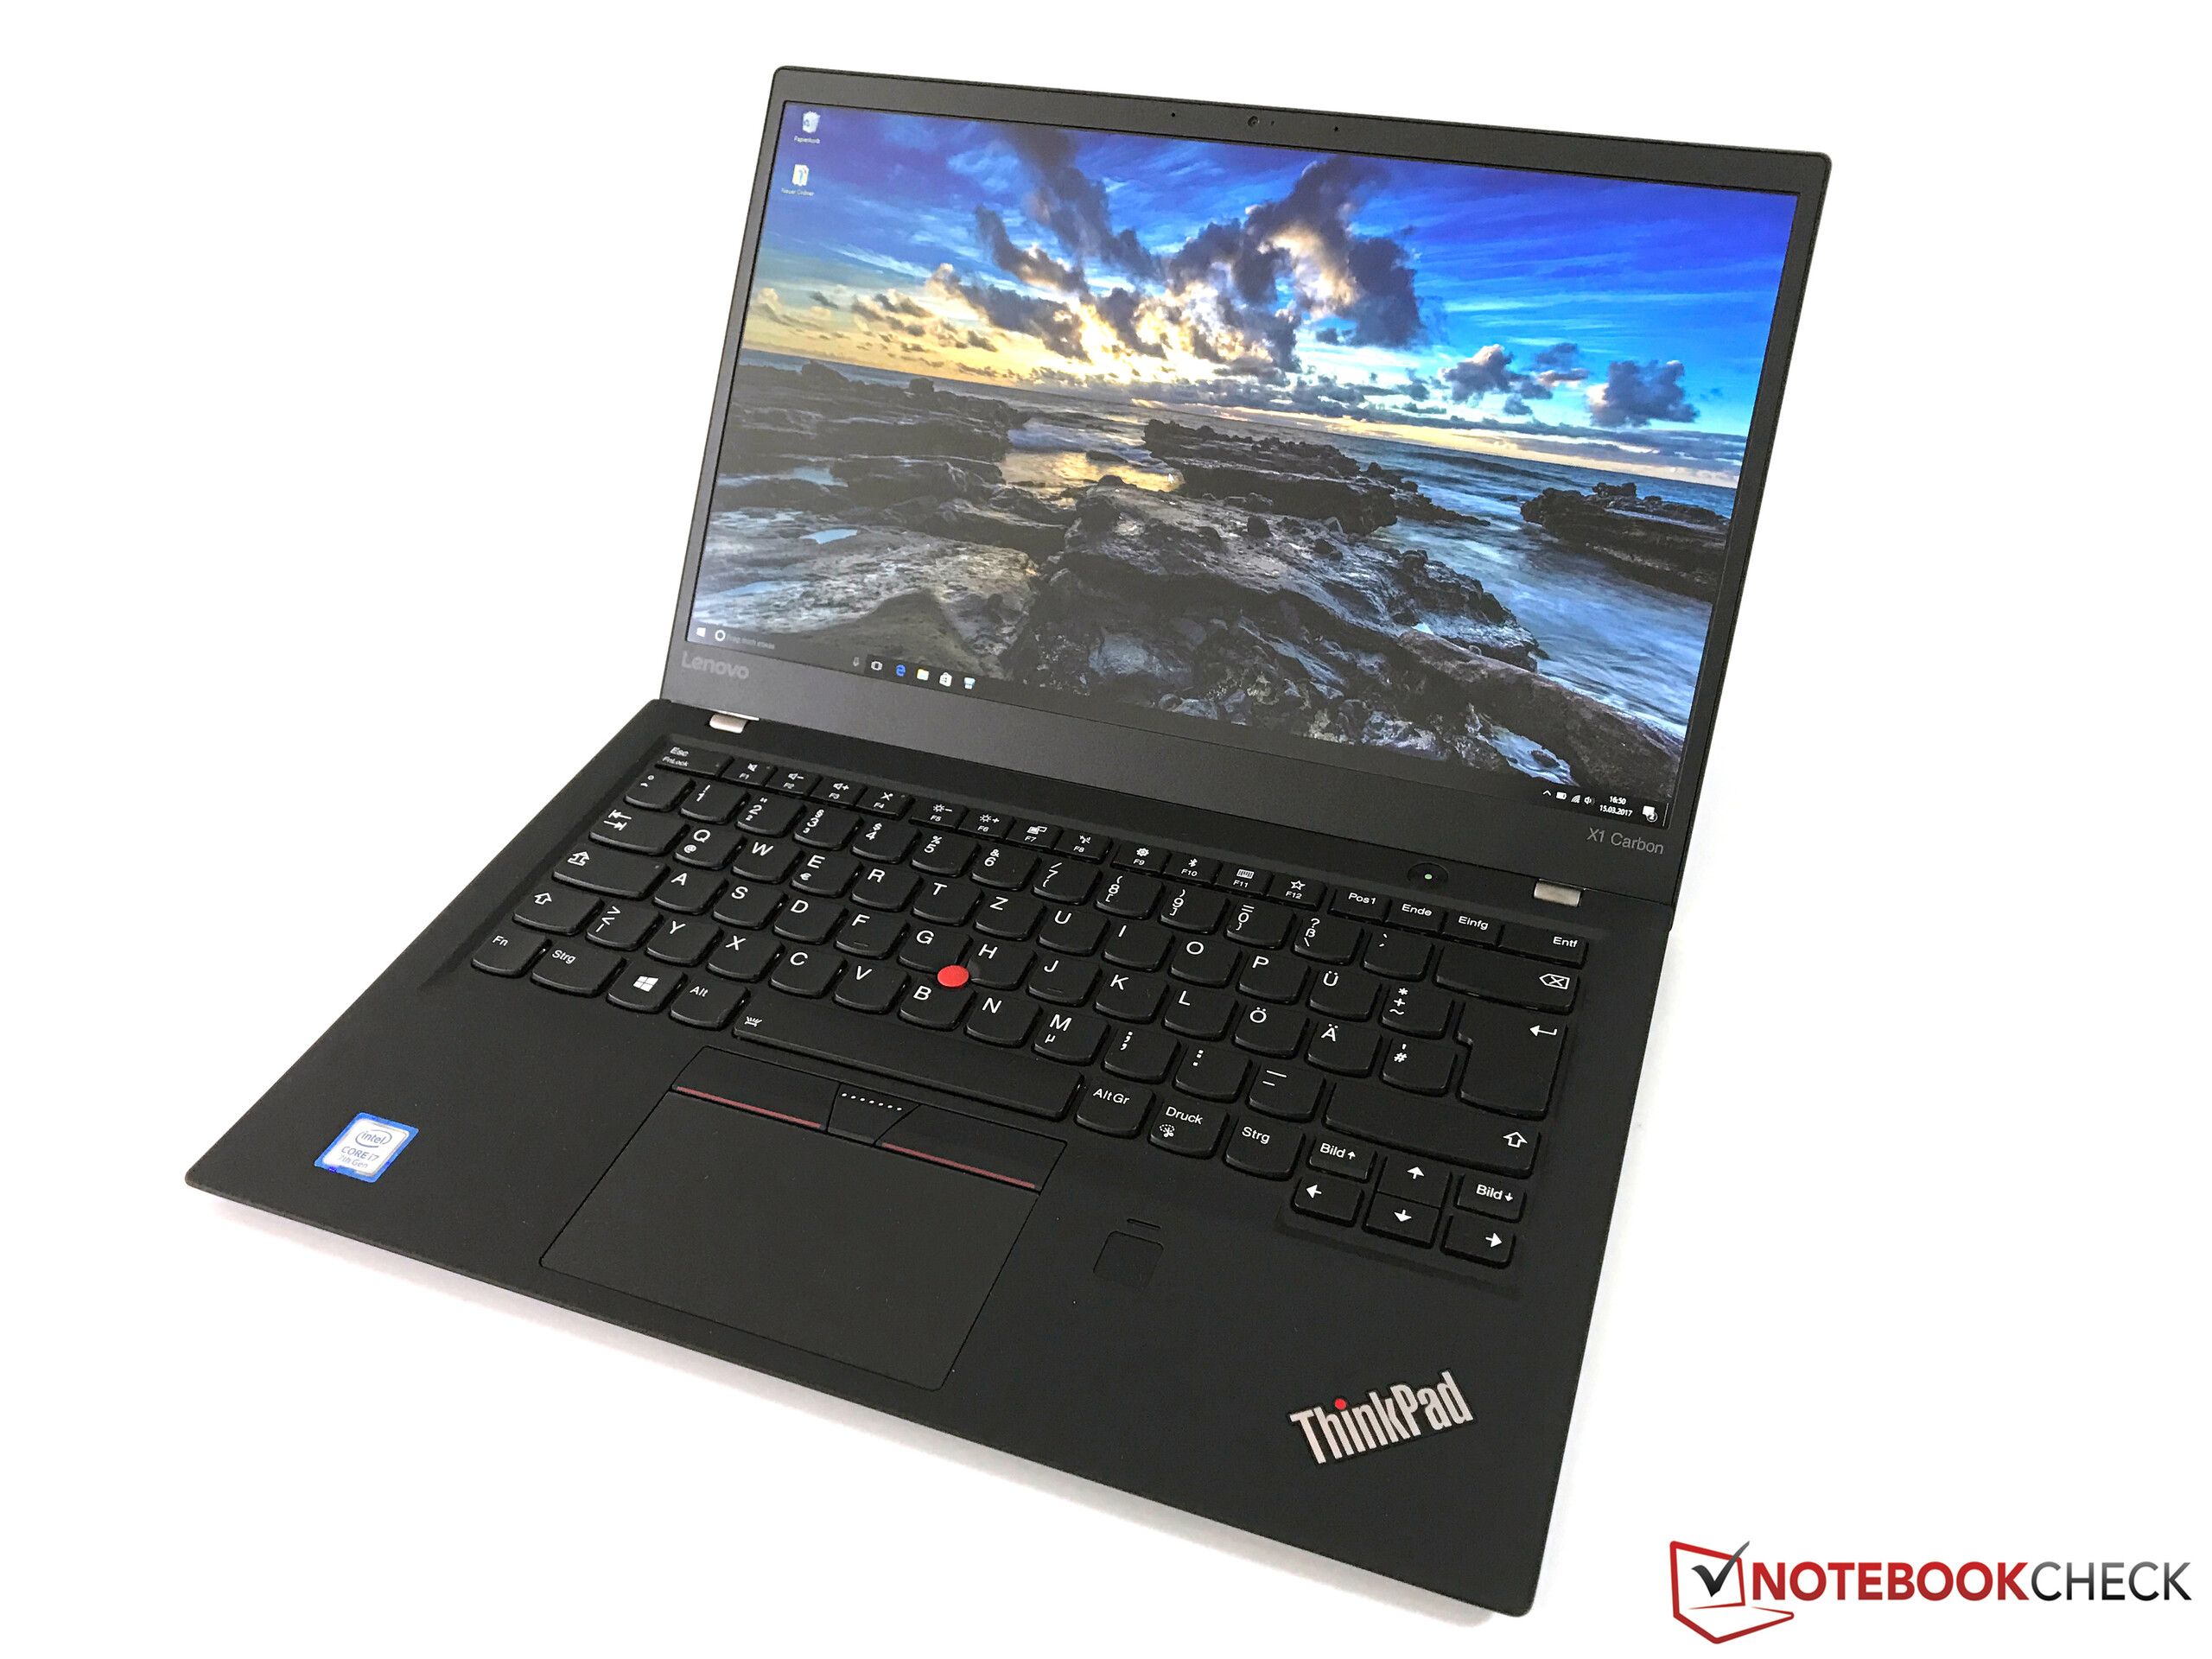
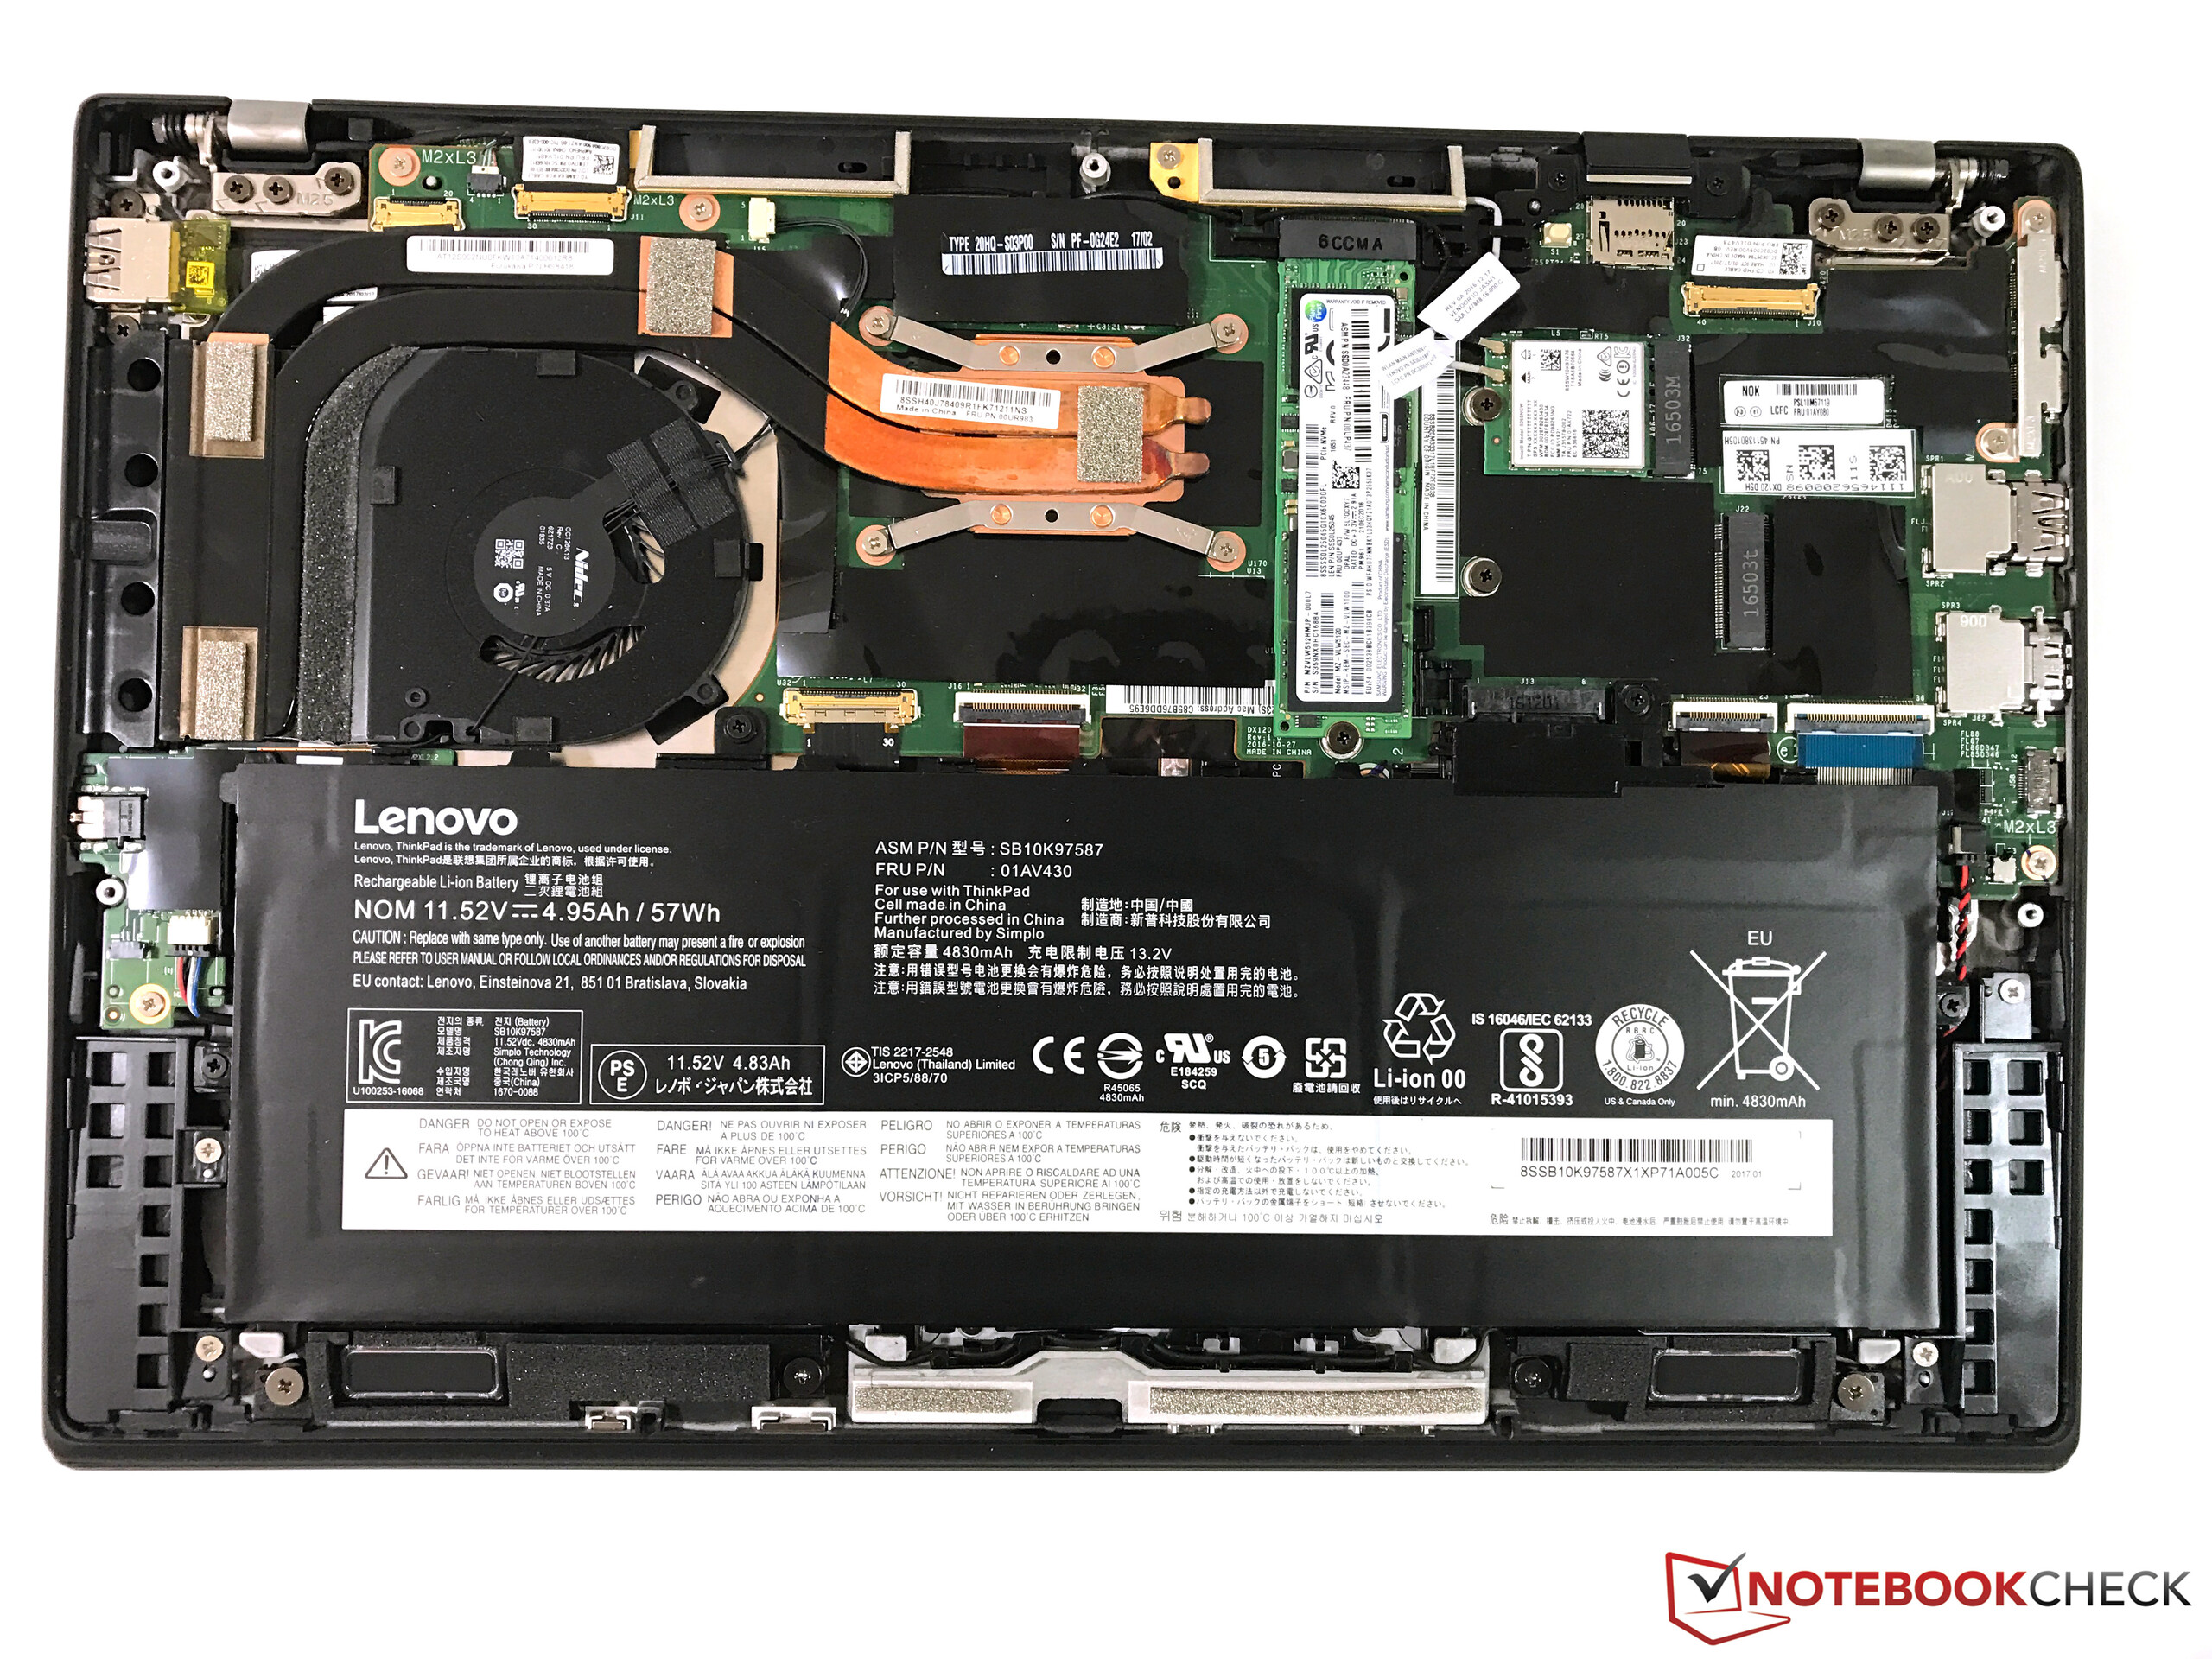
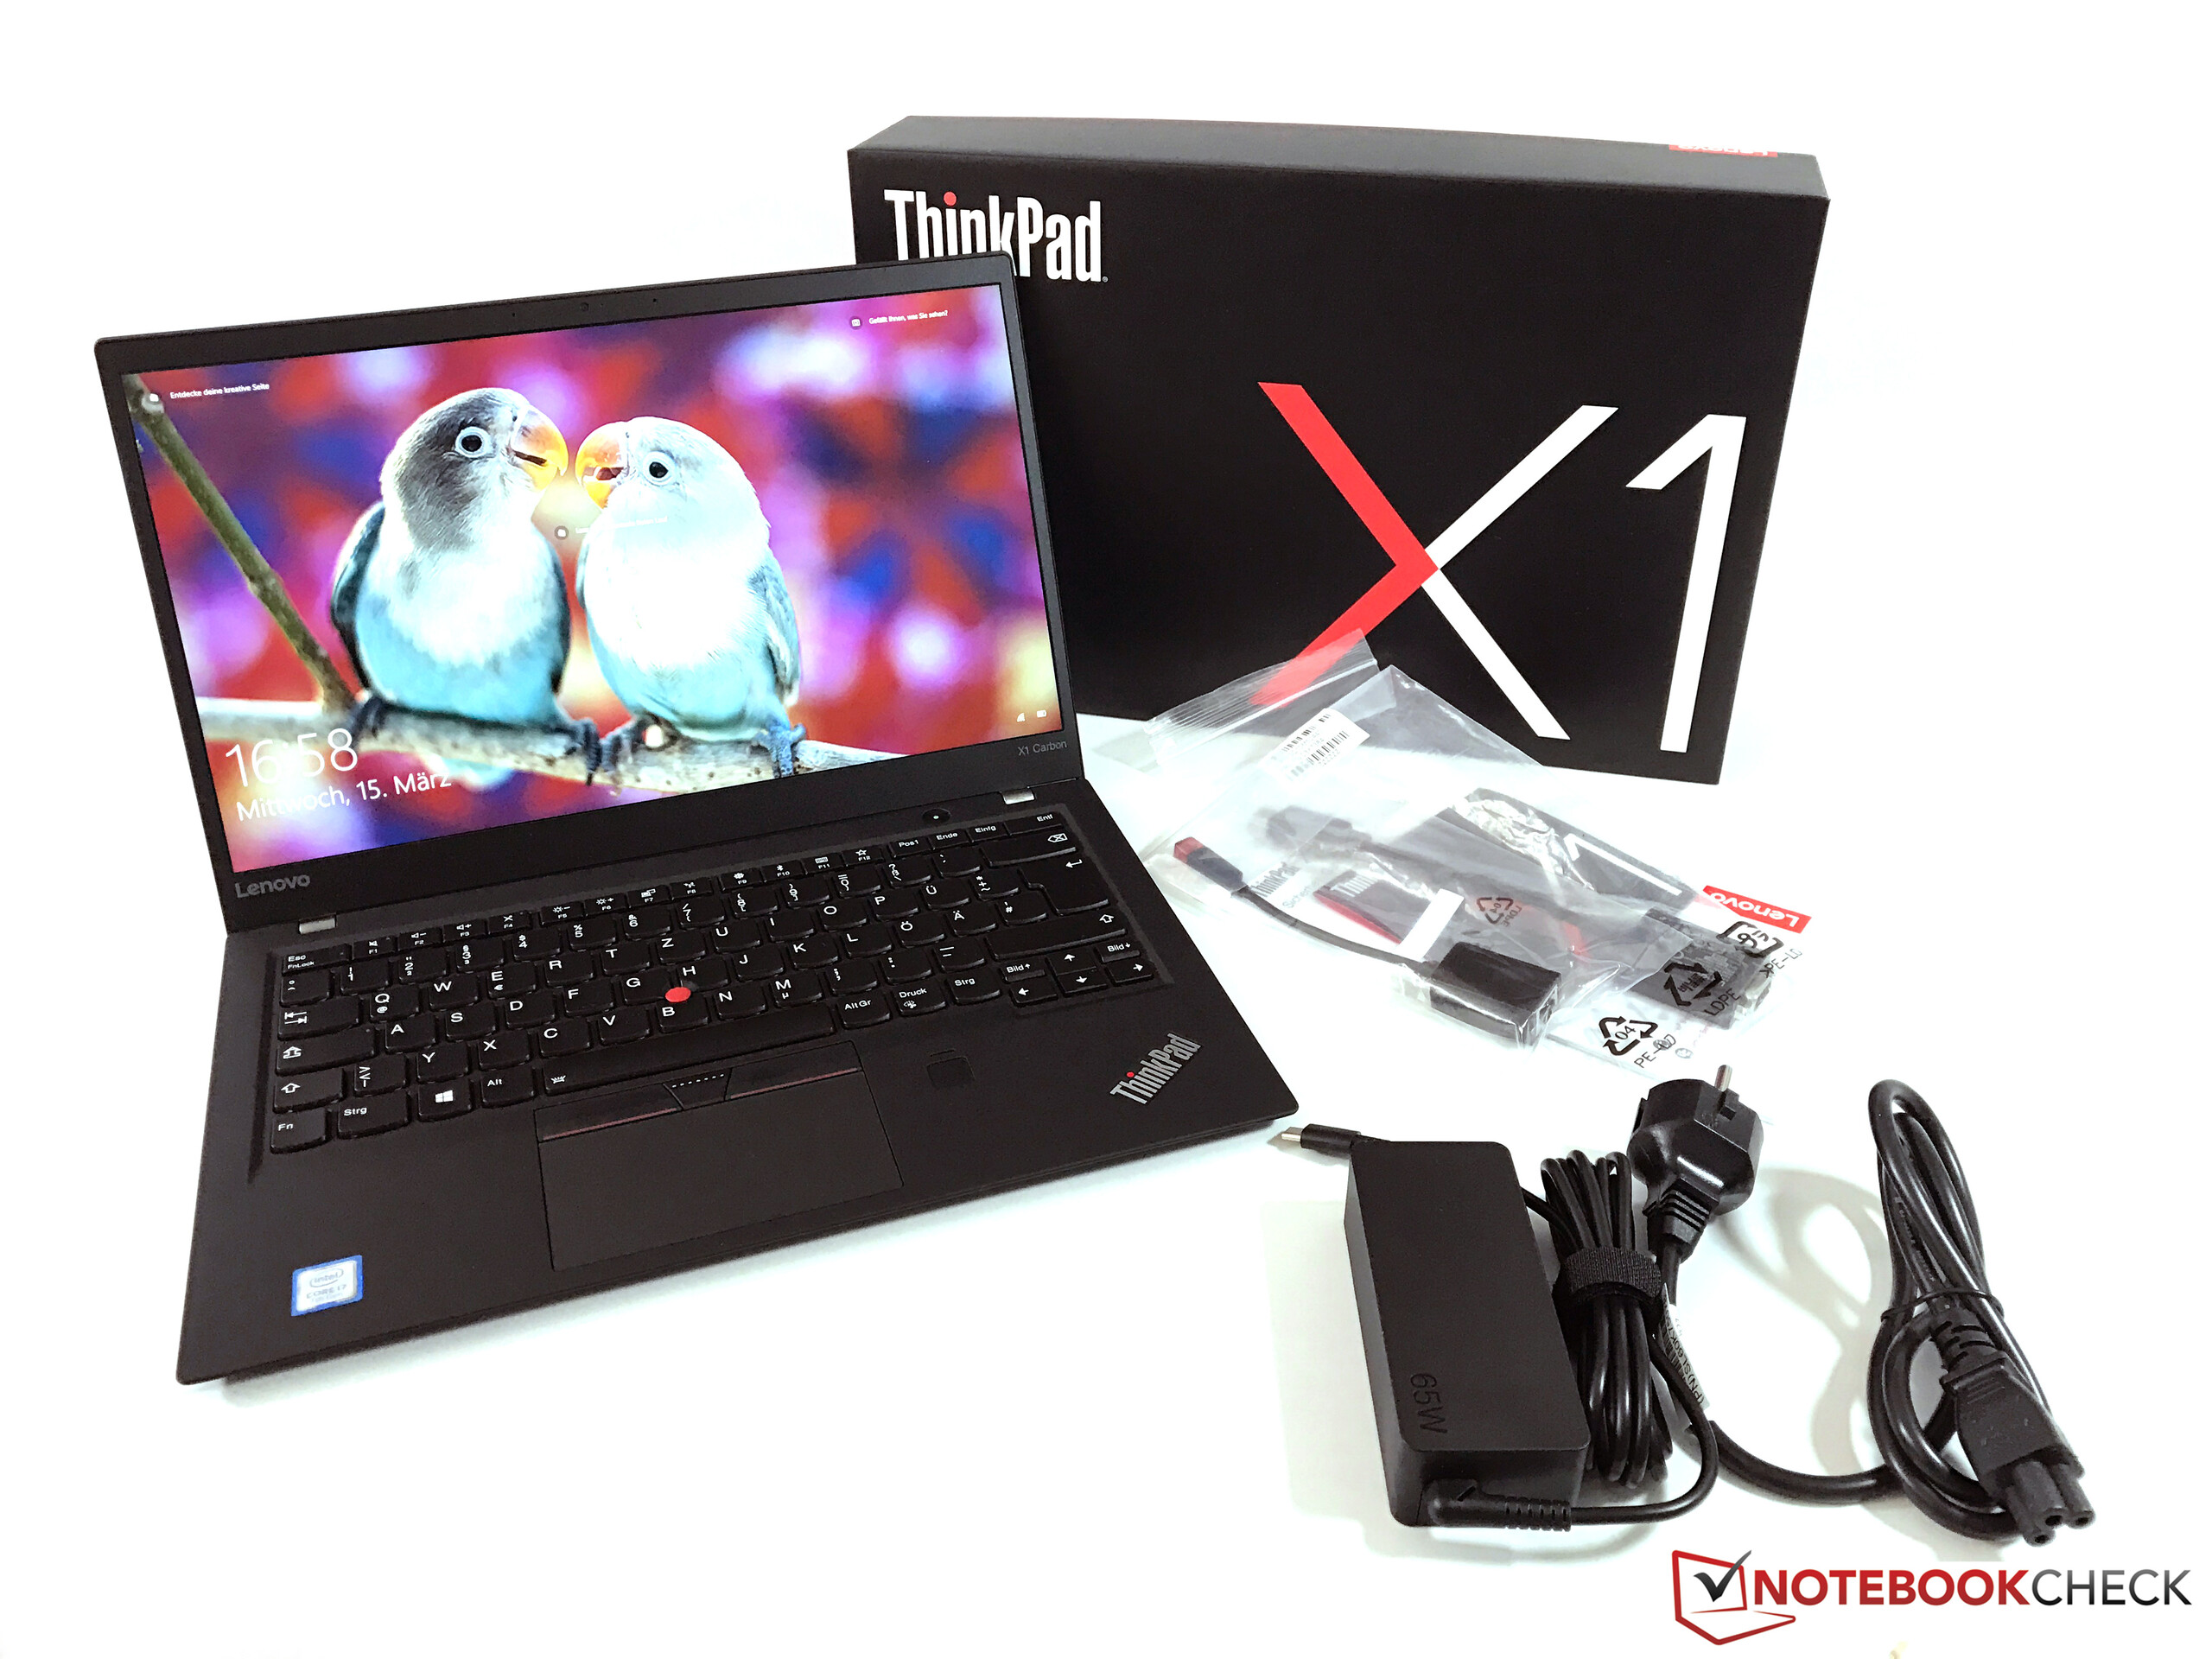
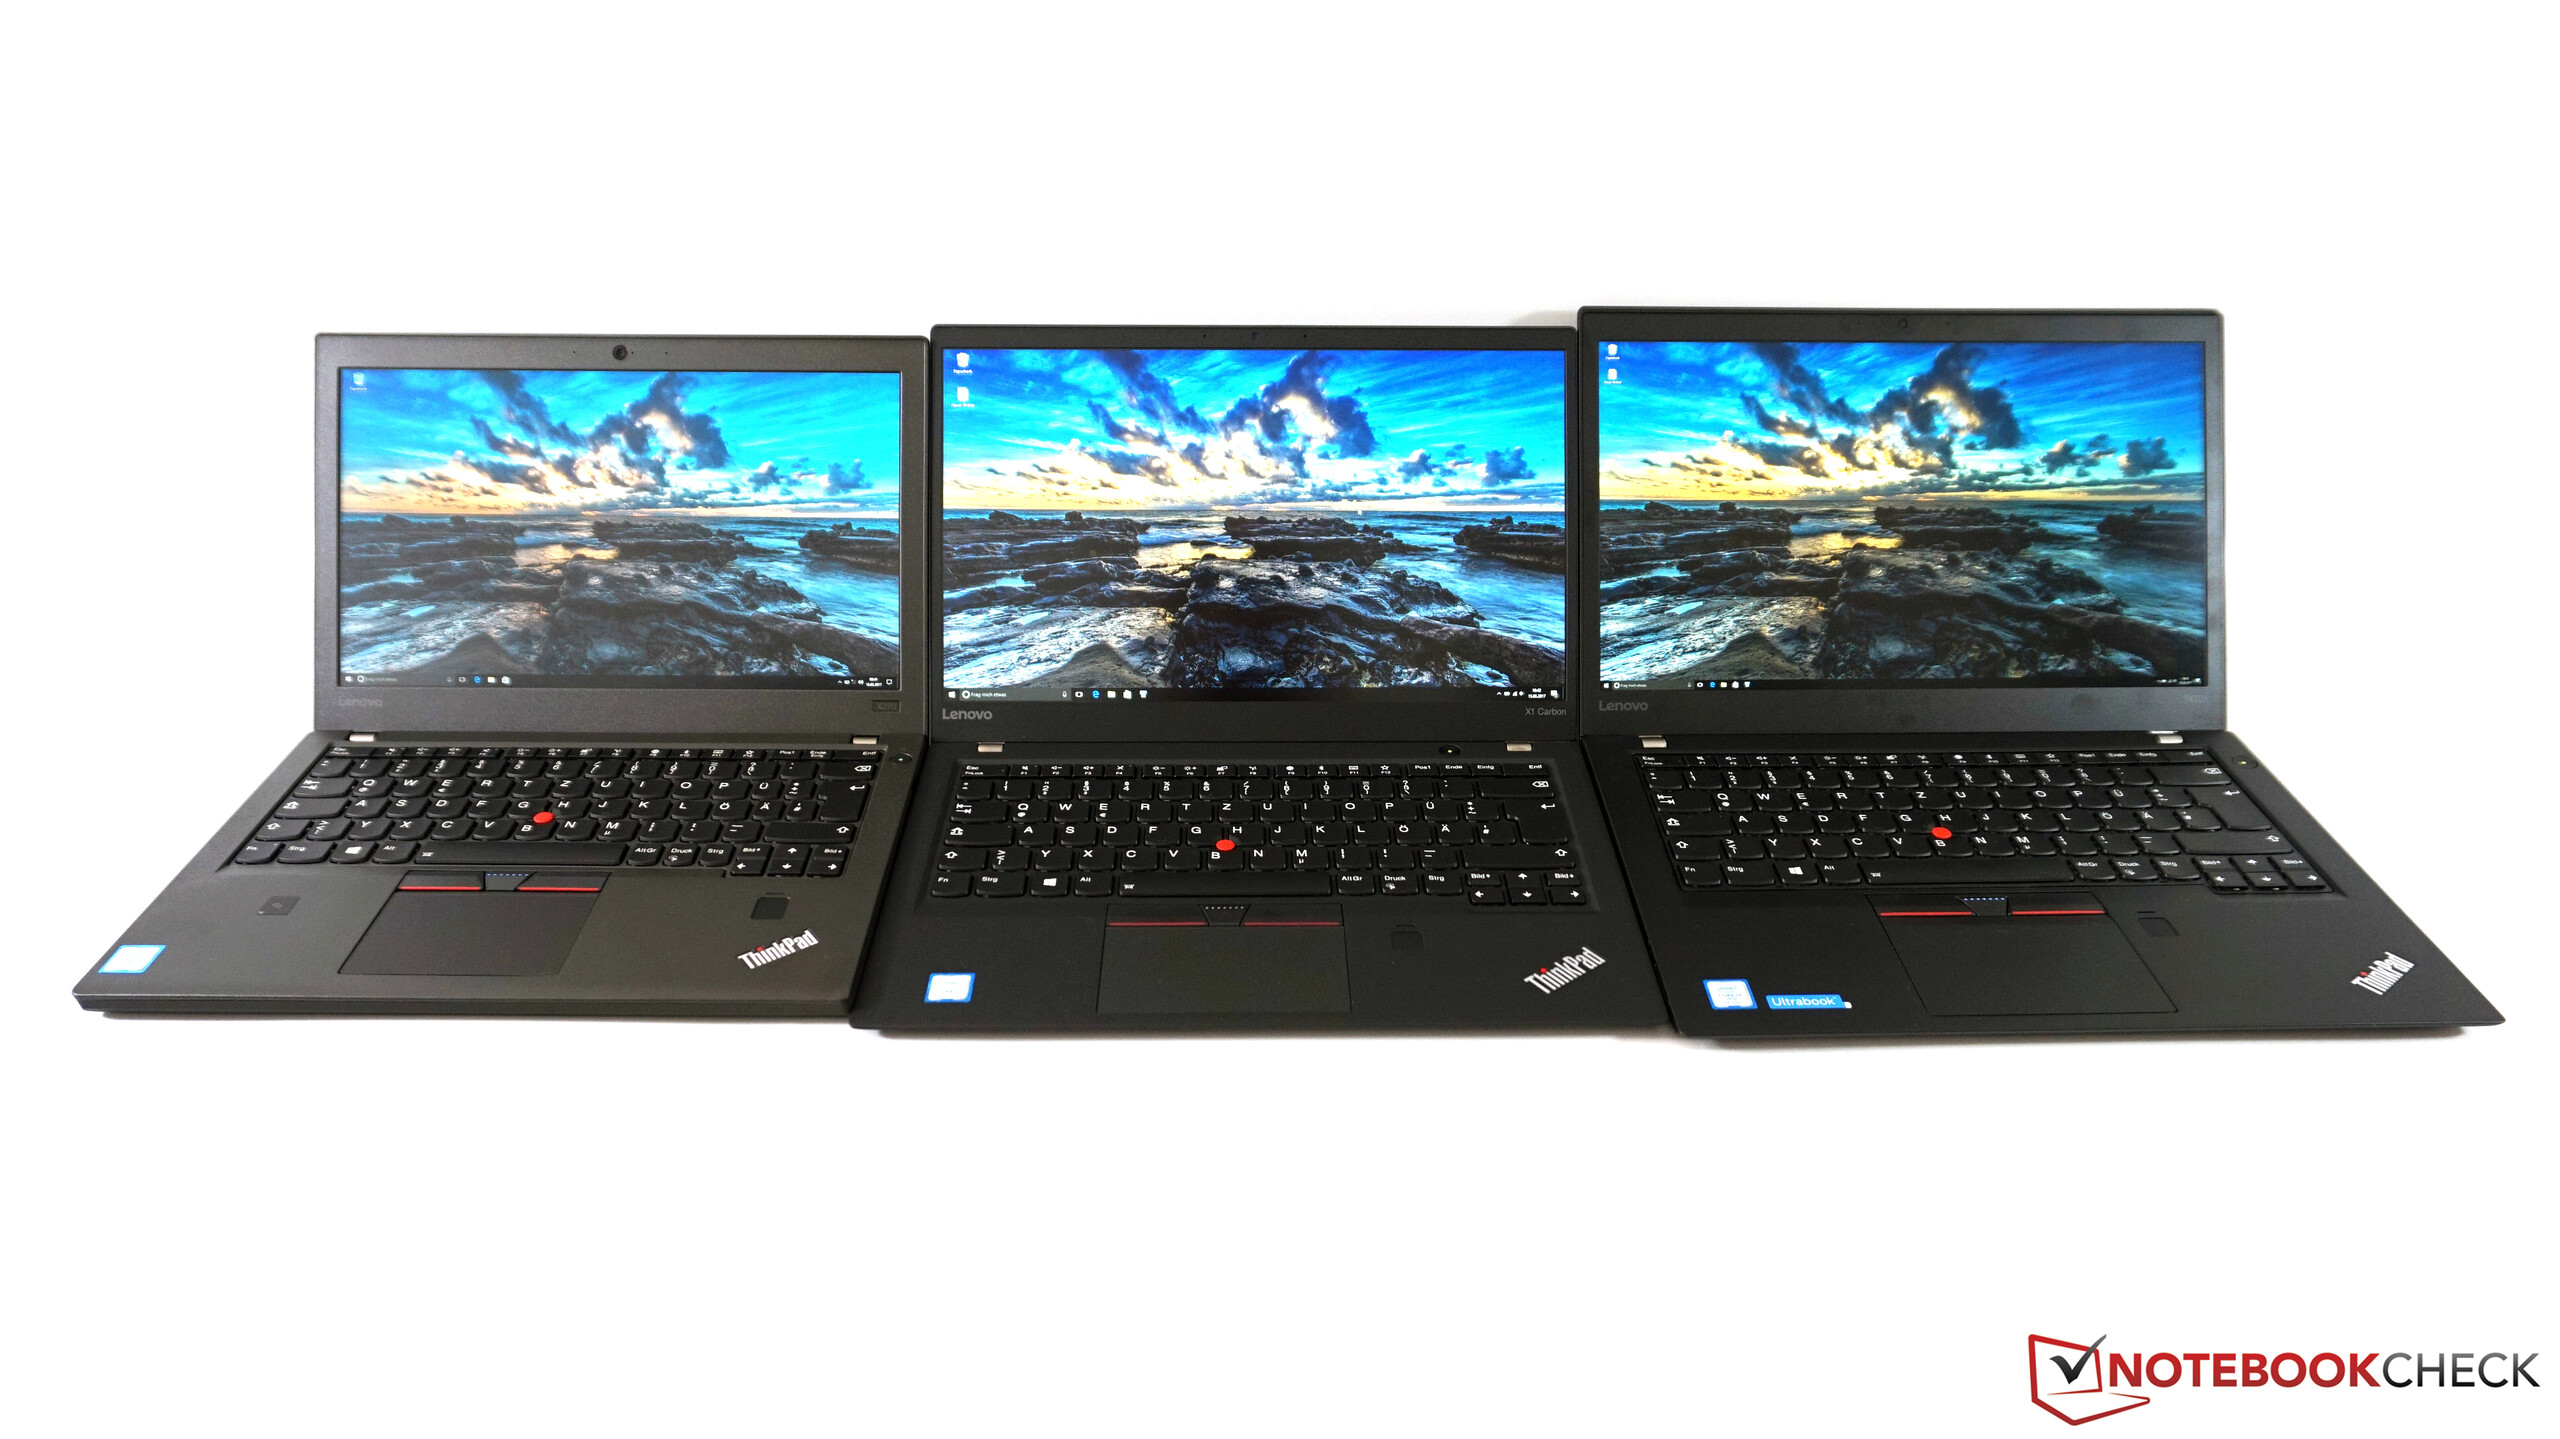
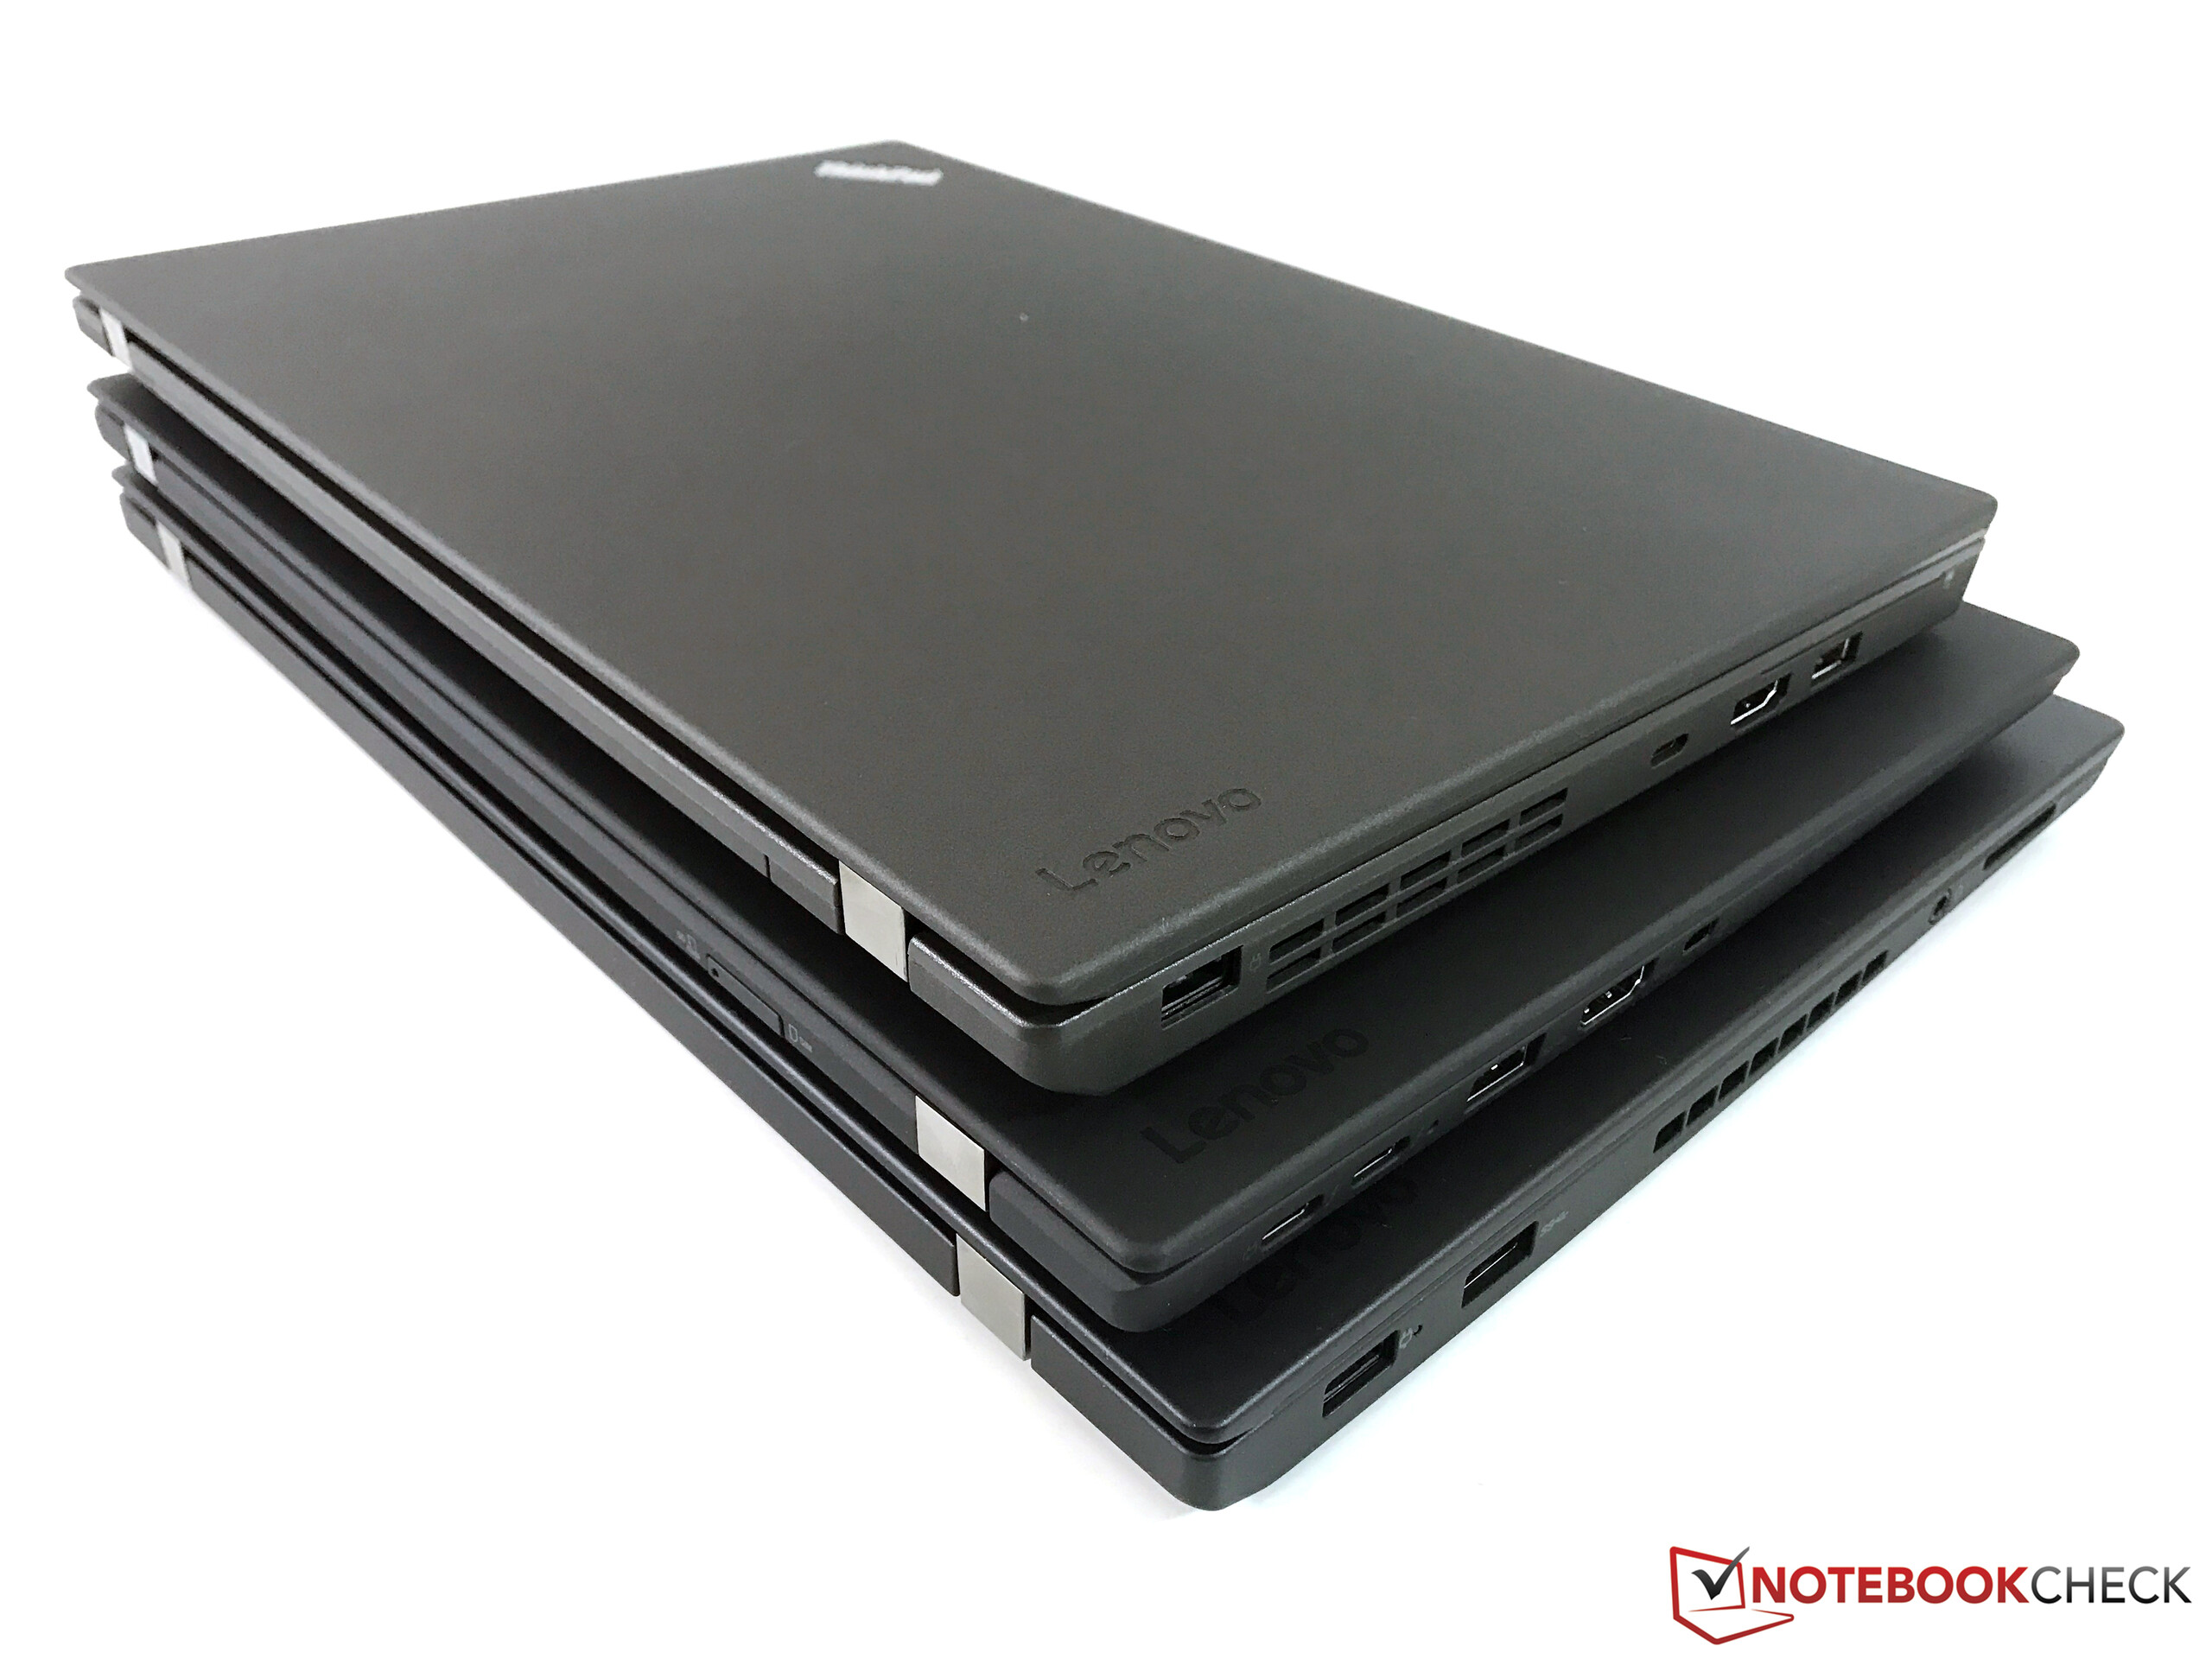
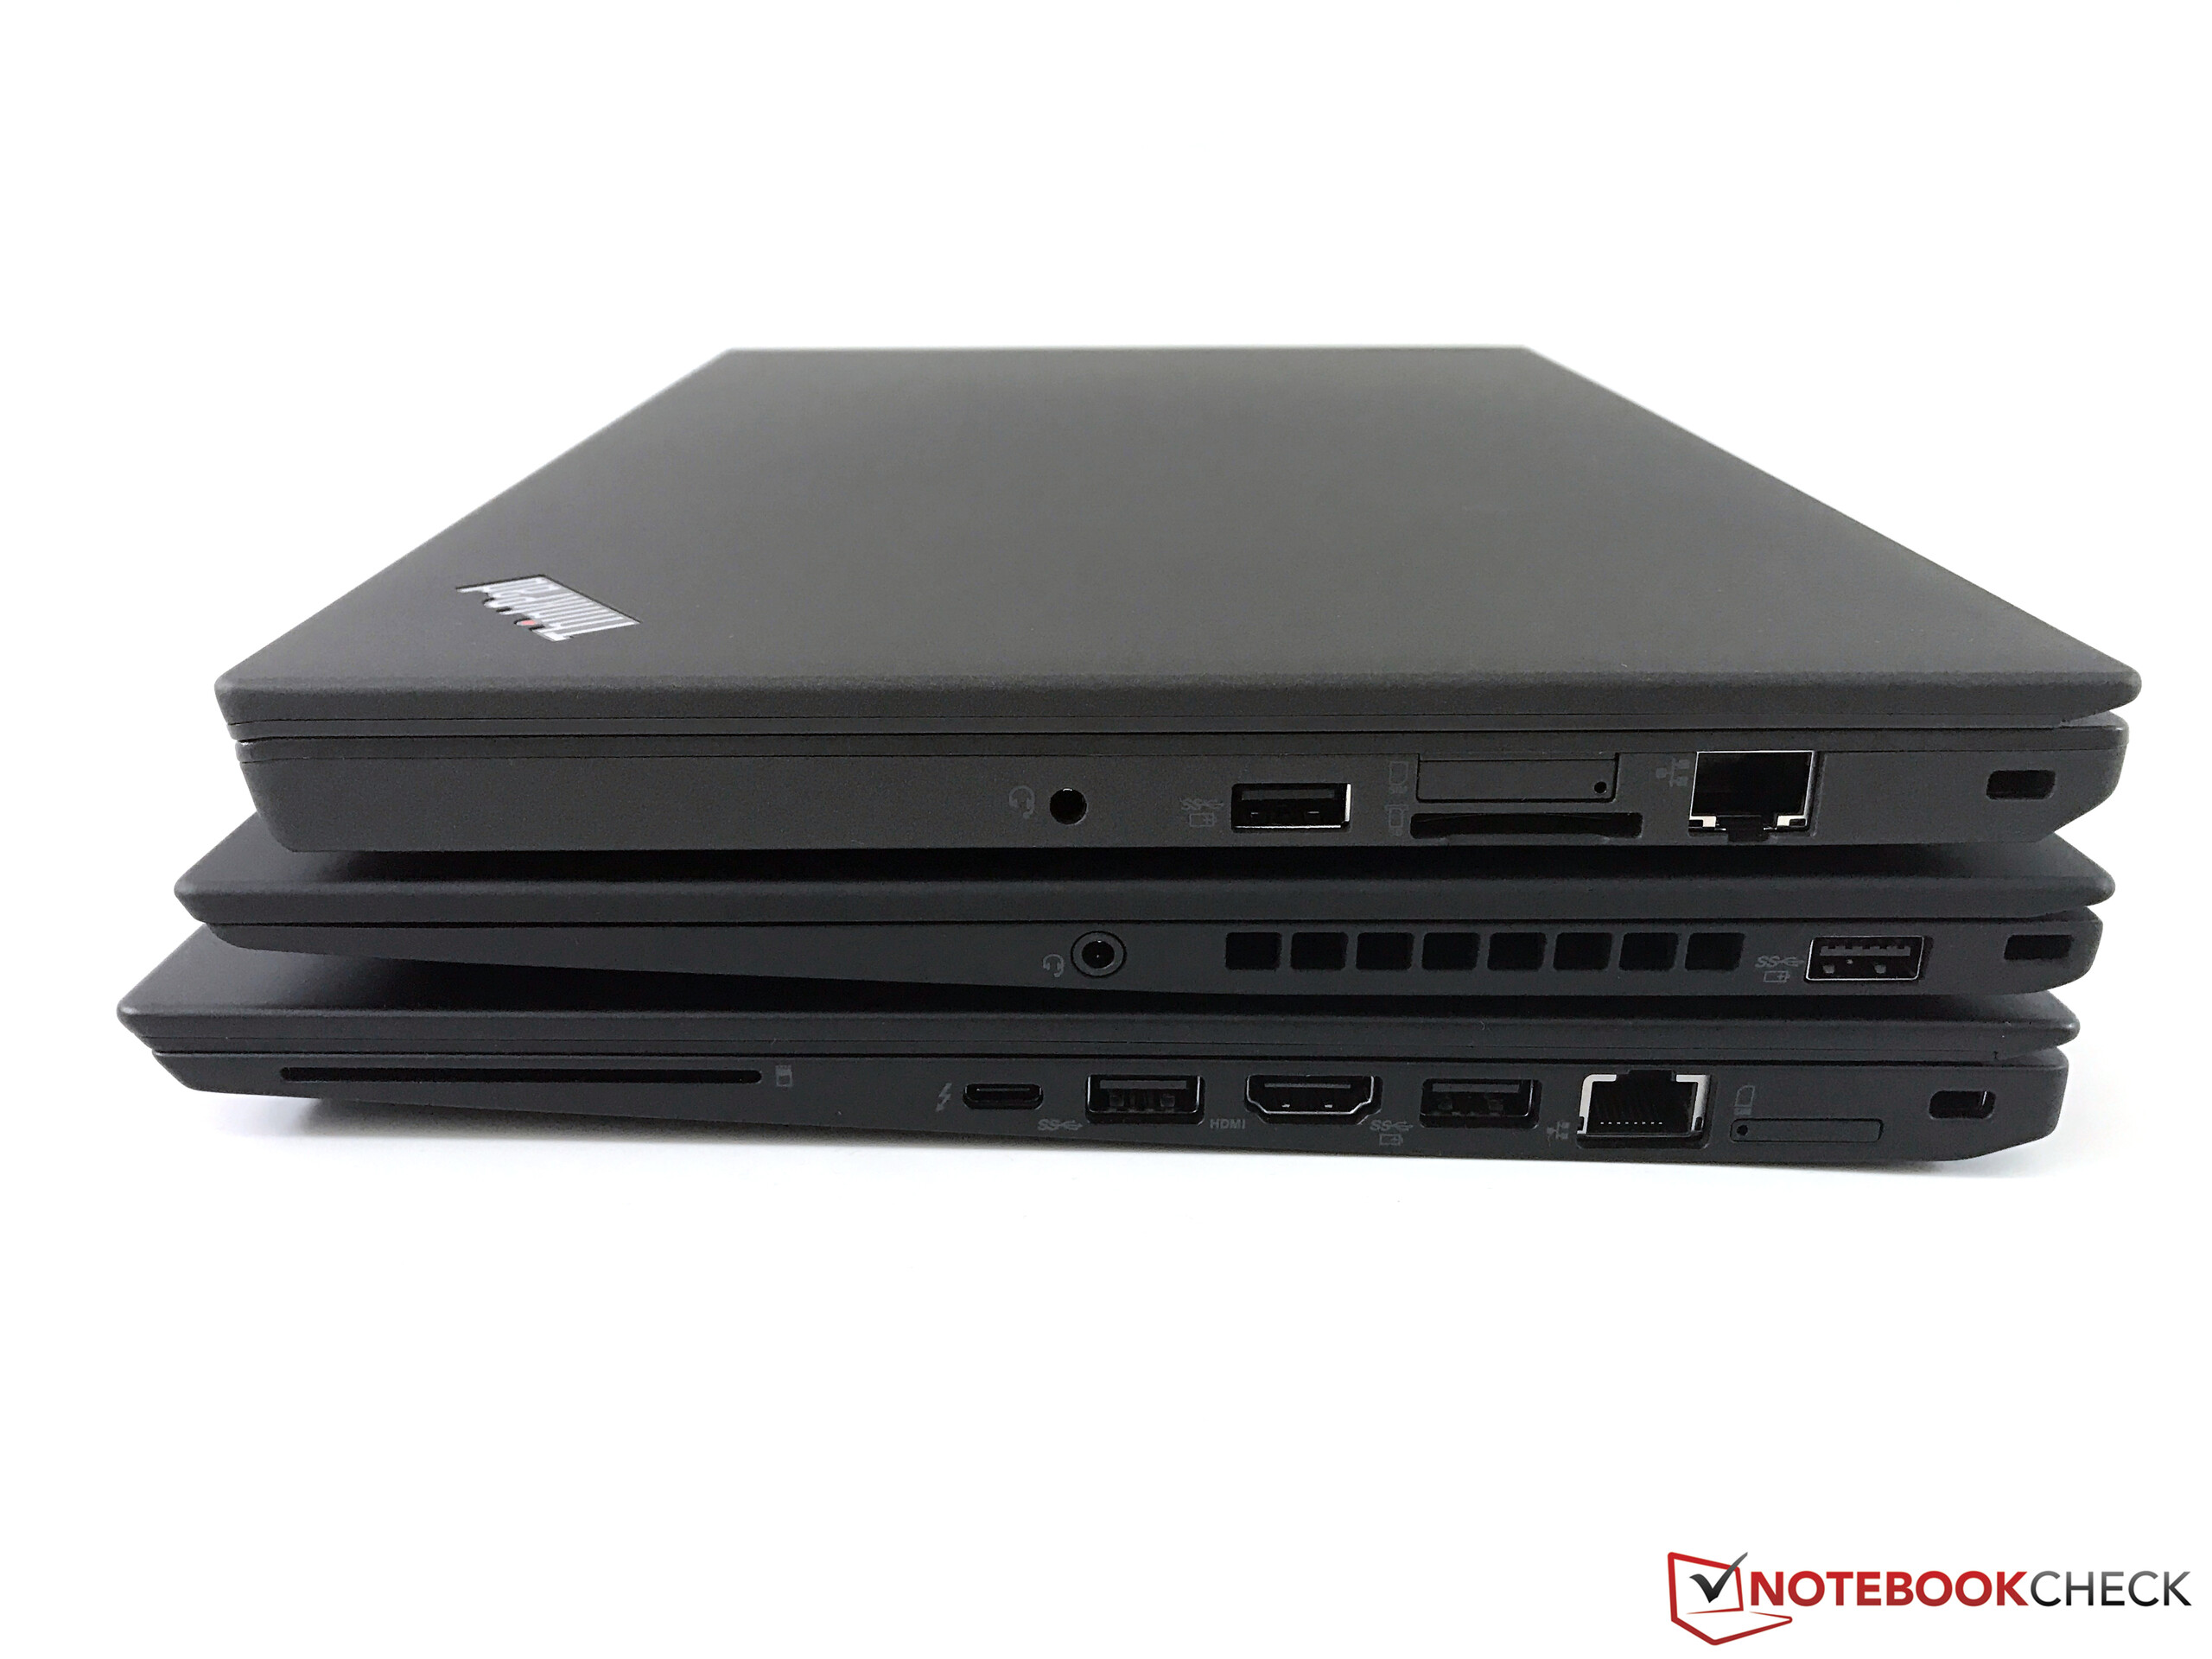
Kısa inceleme: Lenovo ThinkPad X1 Carbon 2017 (Core i7, Full-HD) Laptop
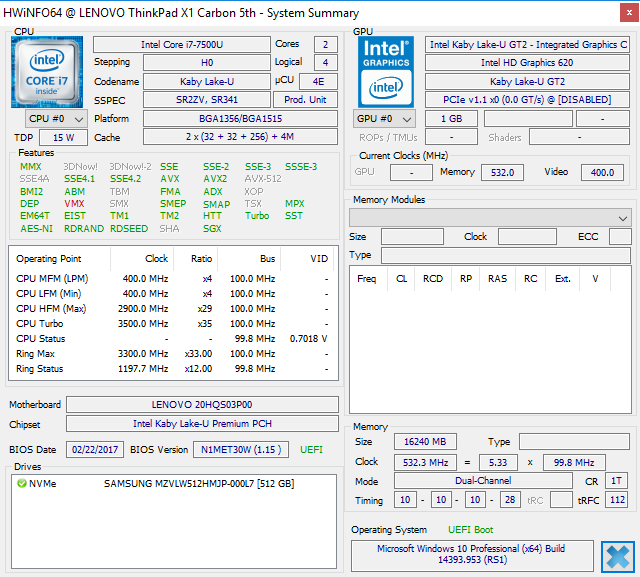
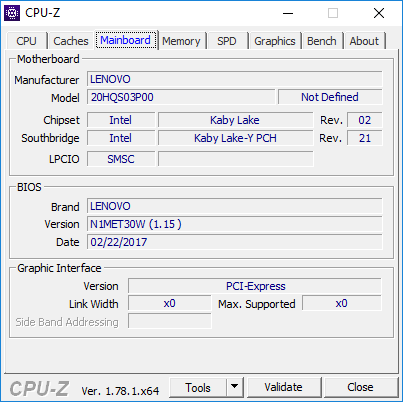
20HR002MGE (ThinkPad X1 Carbon 2017 Seri)
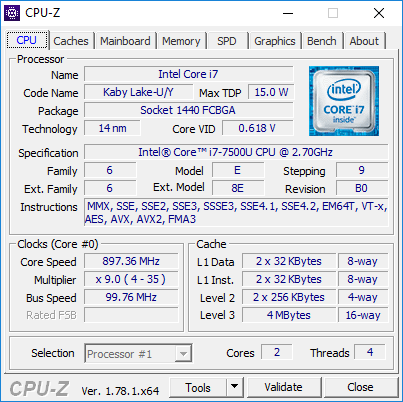
İşlemci
Intel Core i7-7500U 2 x 2.7 - 3.5 GHz, Kaby Lake
Grafik kartı
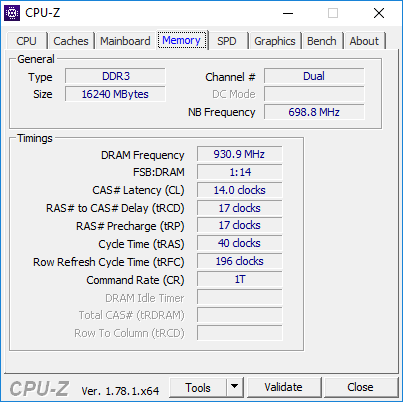
Bellek
16 GB
, LPDDR3-1866, Dual-Channel, soldered
Görüntü
14.00 inç 16:9, 1920 x 1080 pixel 157 PPI, B140HAN03_1, IPS, parlak: hayır
Anakart
Intel Kaby Lake-U Premium PCH
Harddisk
Samsung PM961 NVMe MZVLW512HMJP, 512 GB
, 454 GB Boş
Ağırlık
1.144 kg, Güç kaynağı: 356 g
Fiyat
1599 Euro
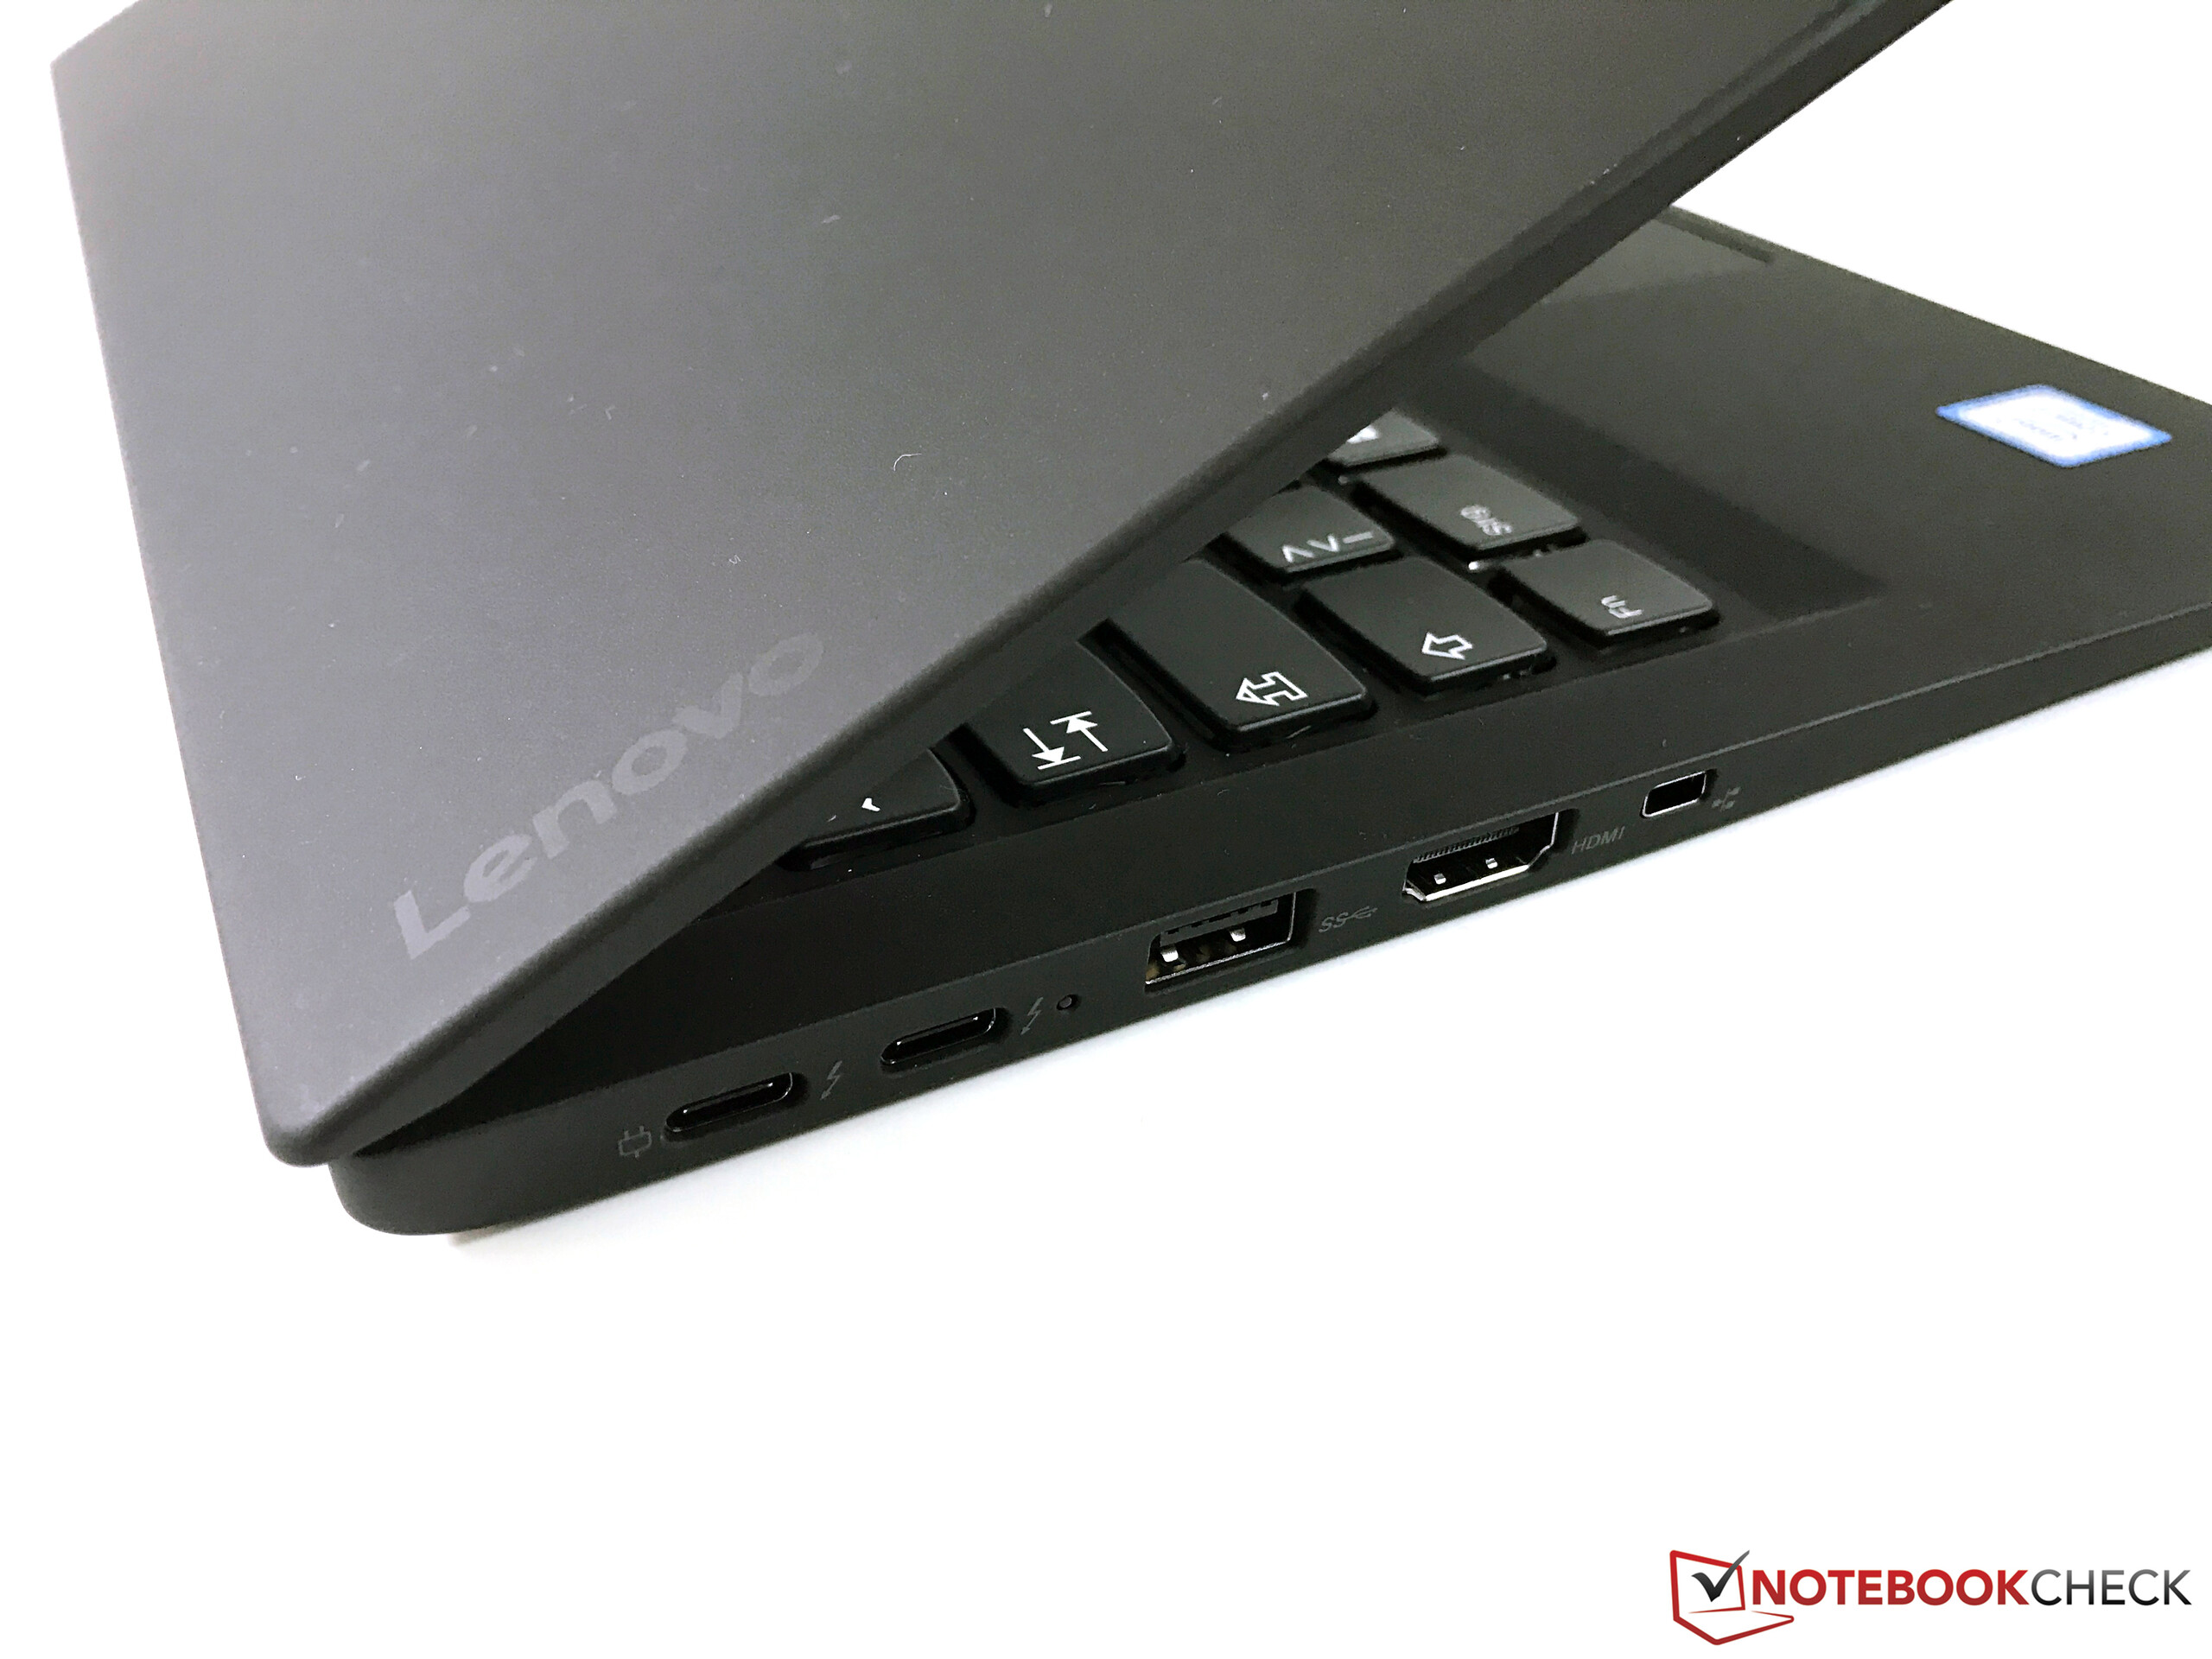
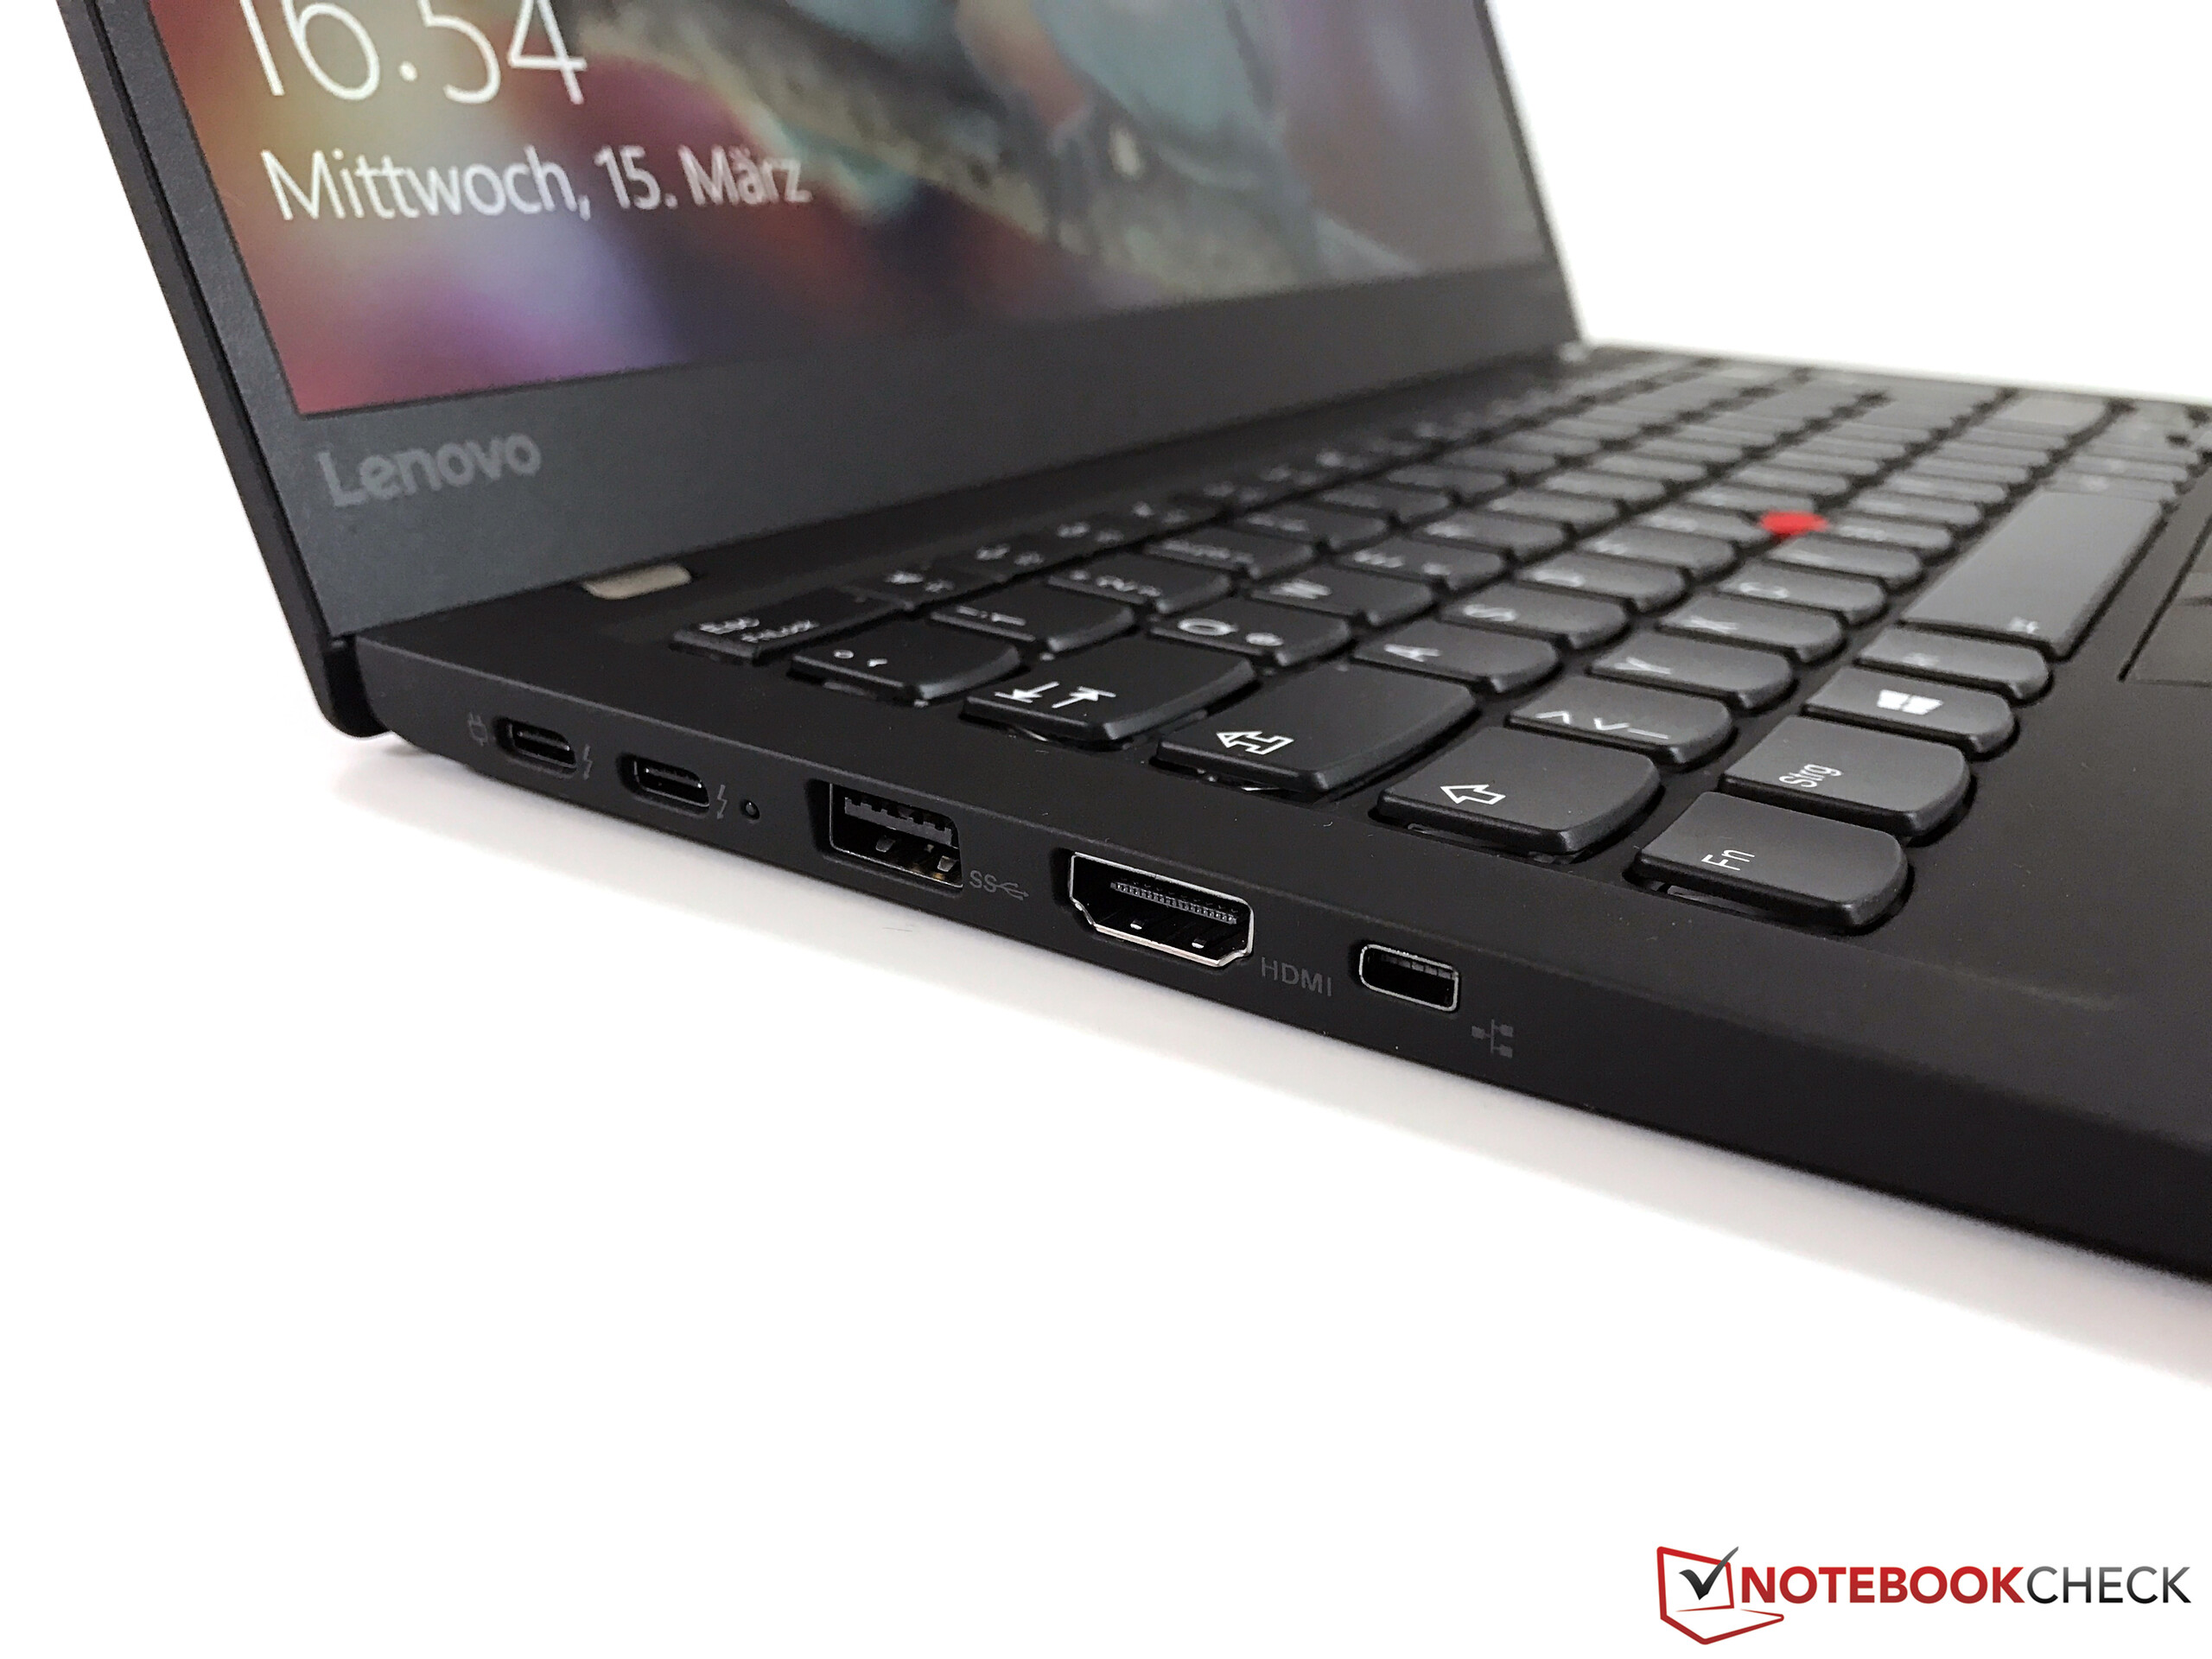
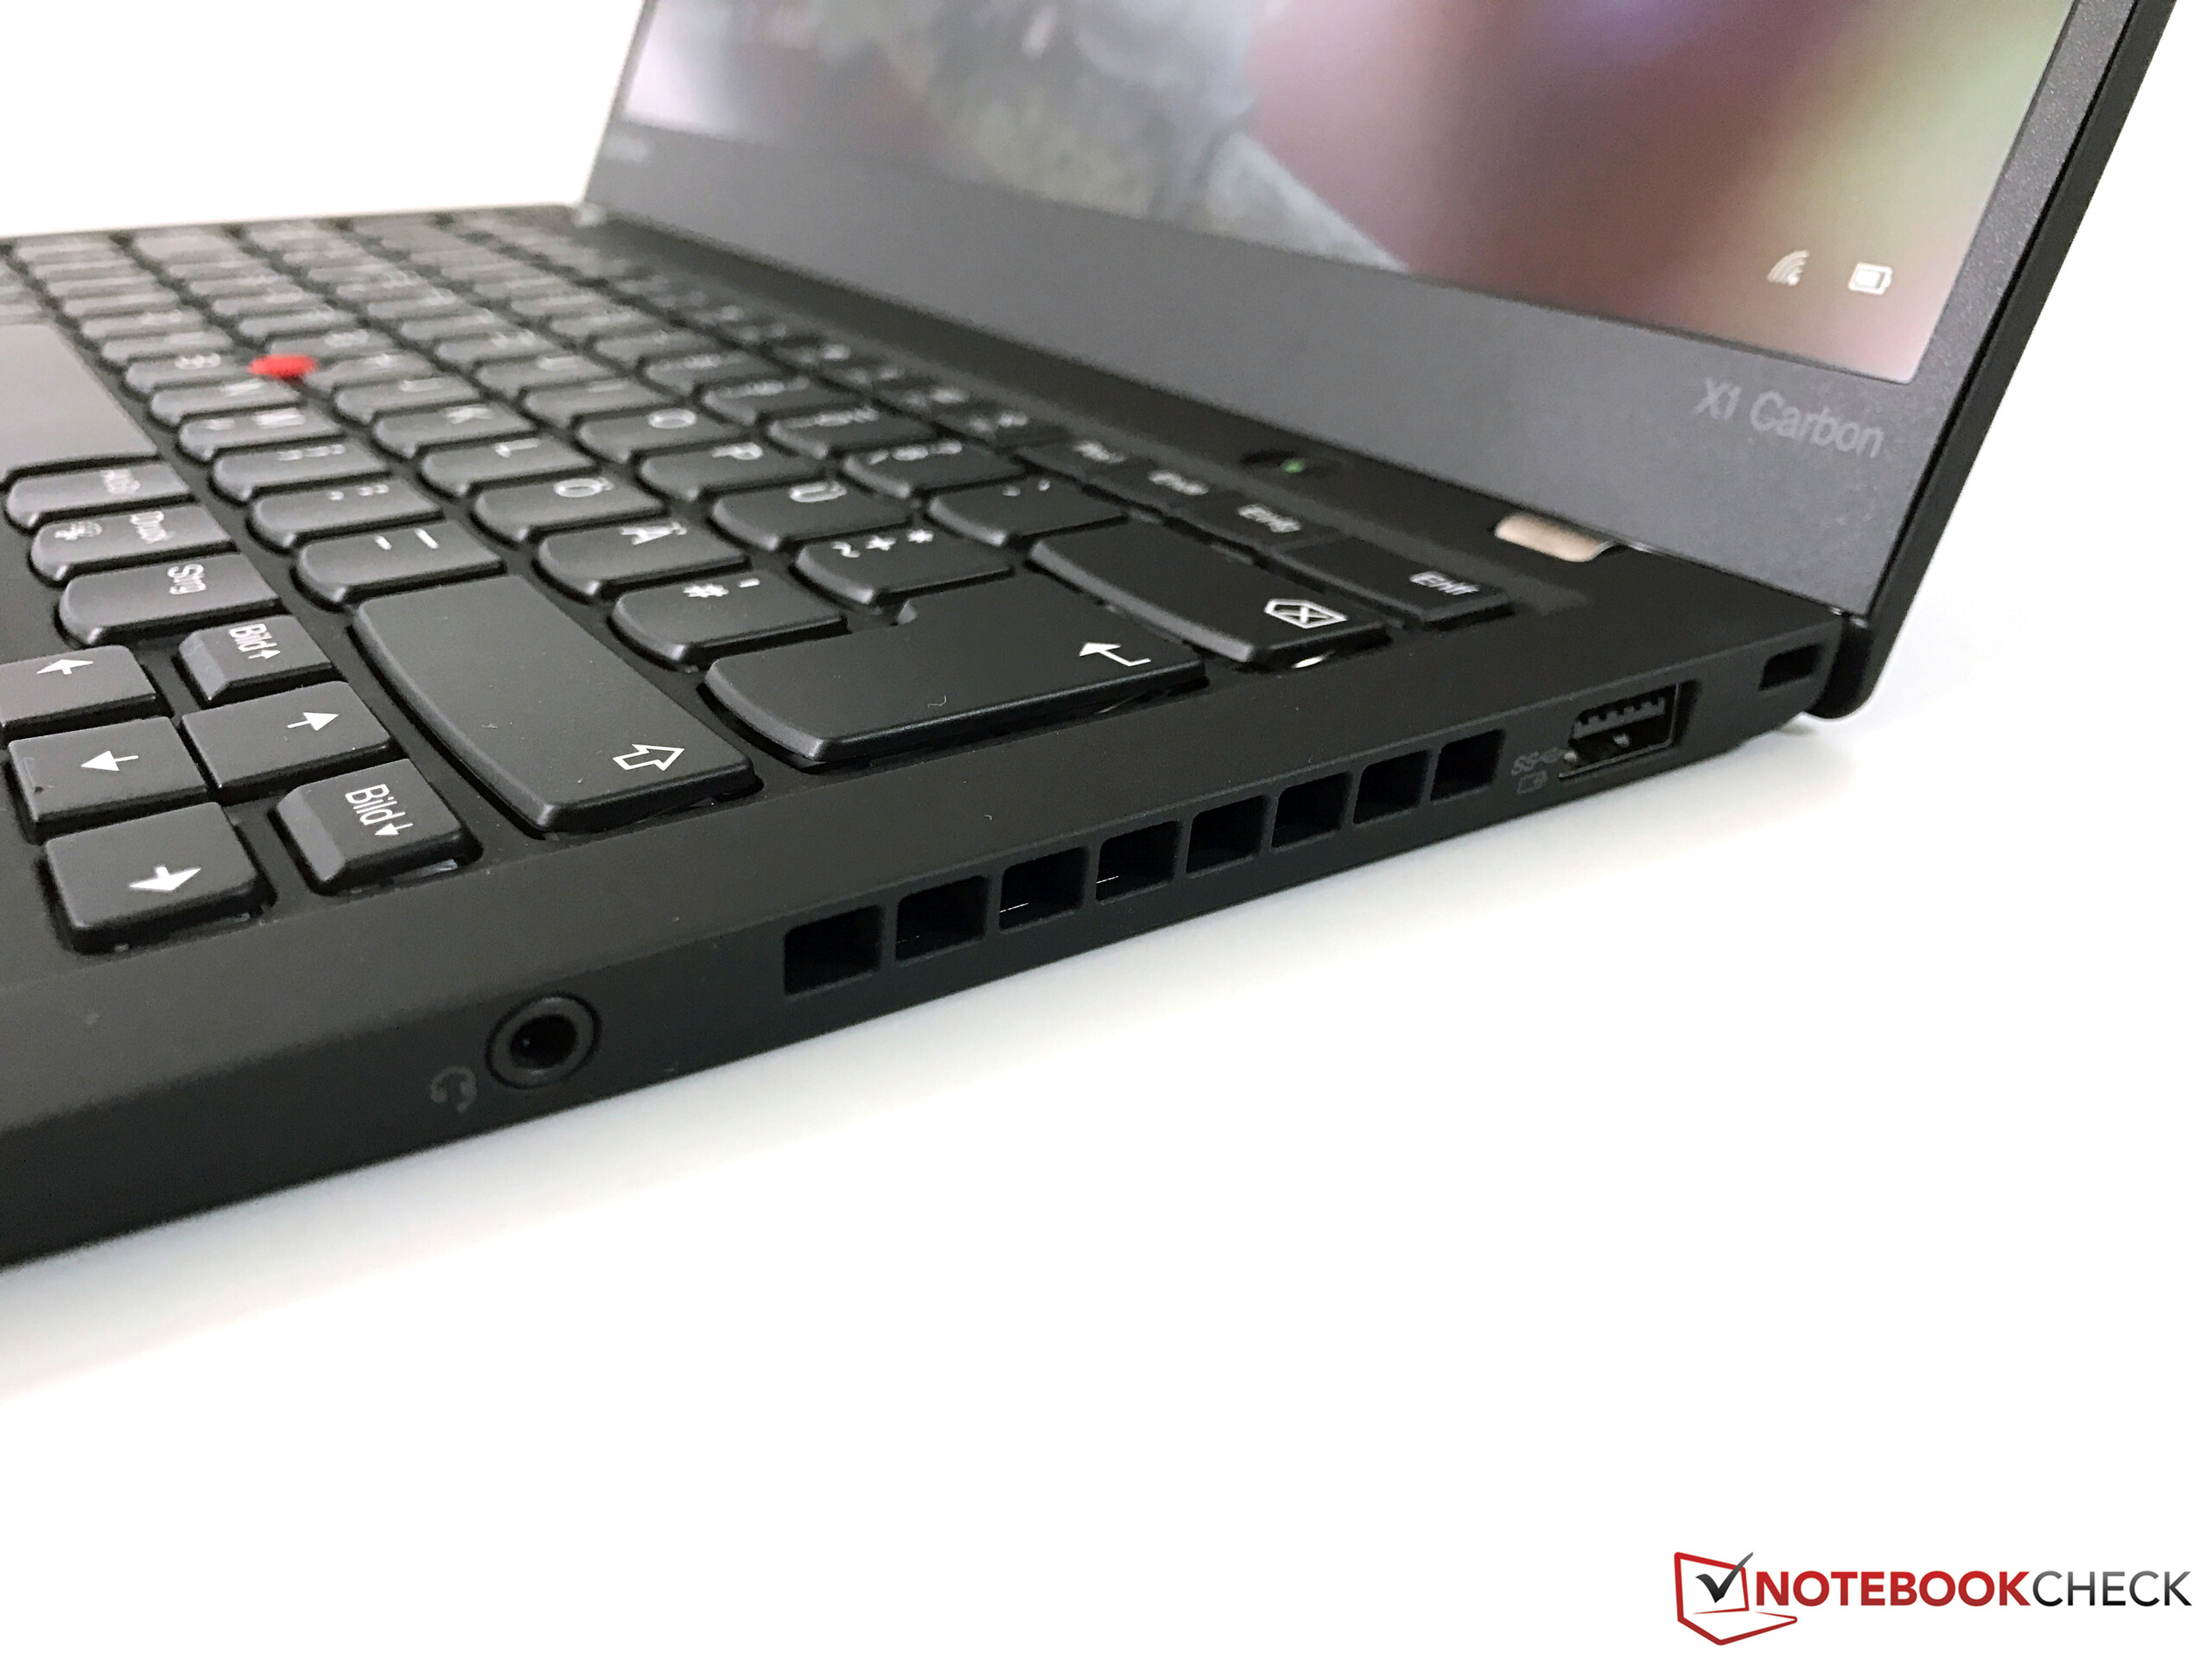
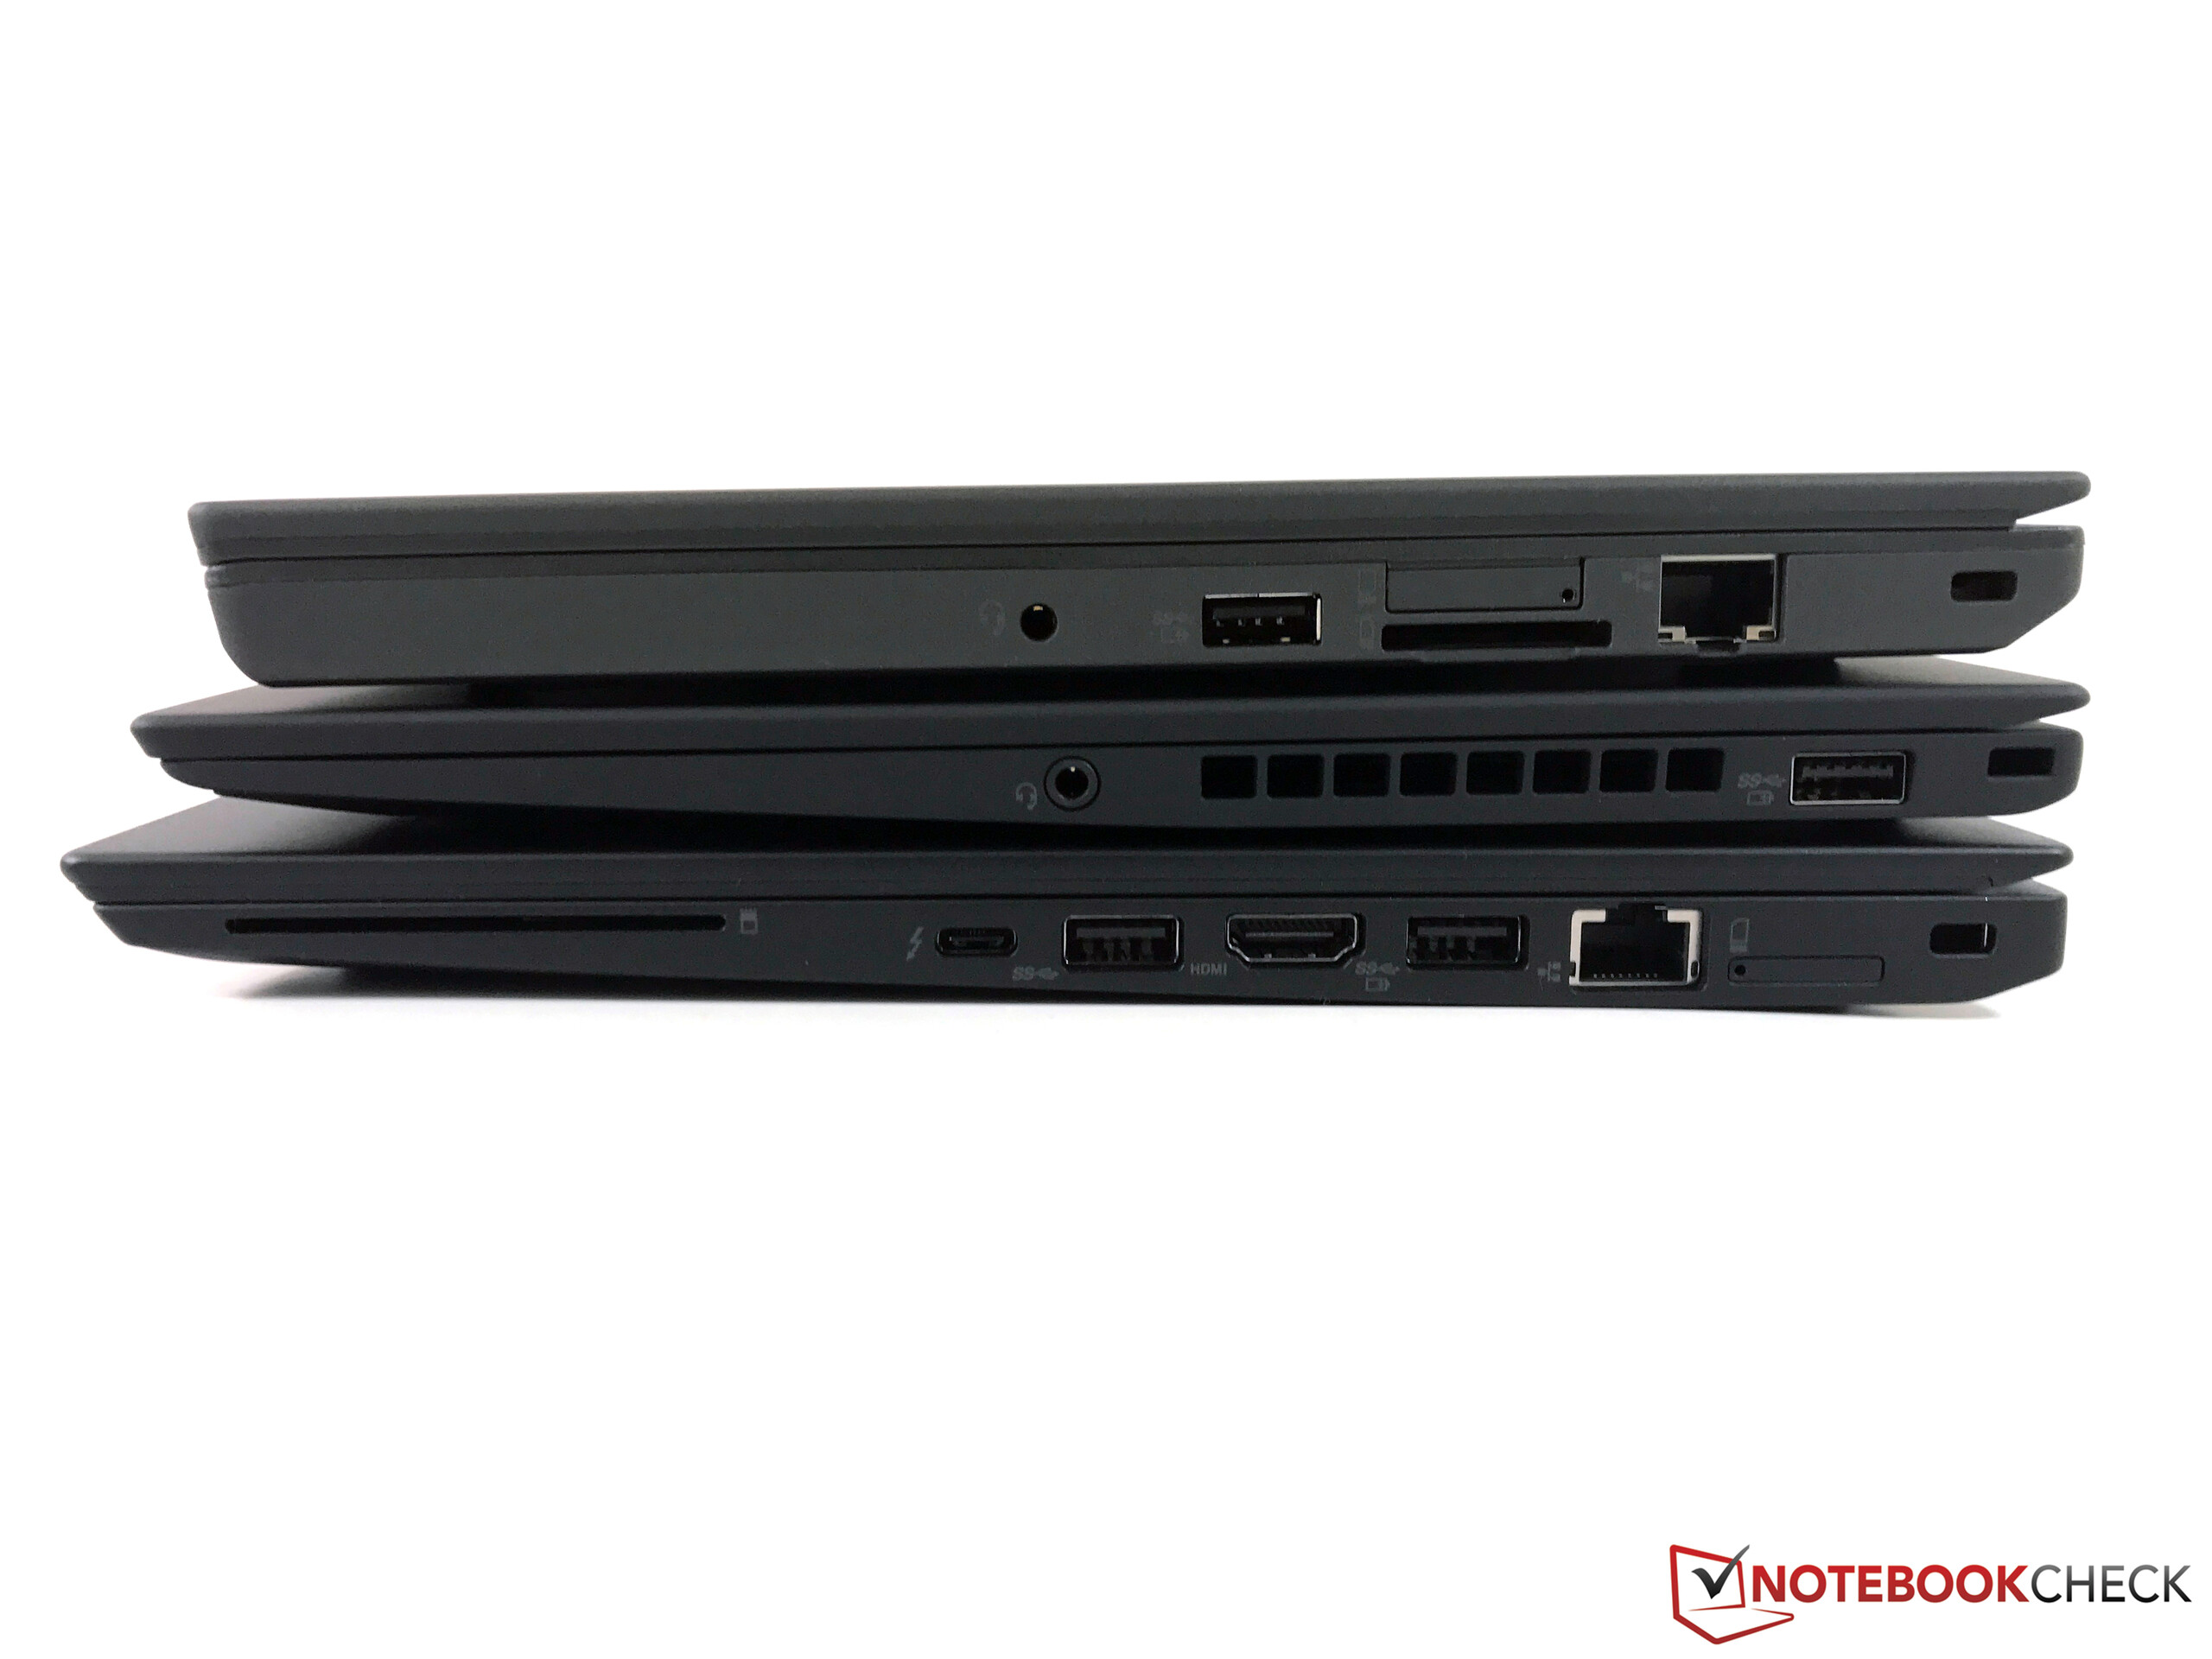
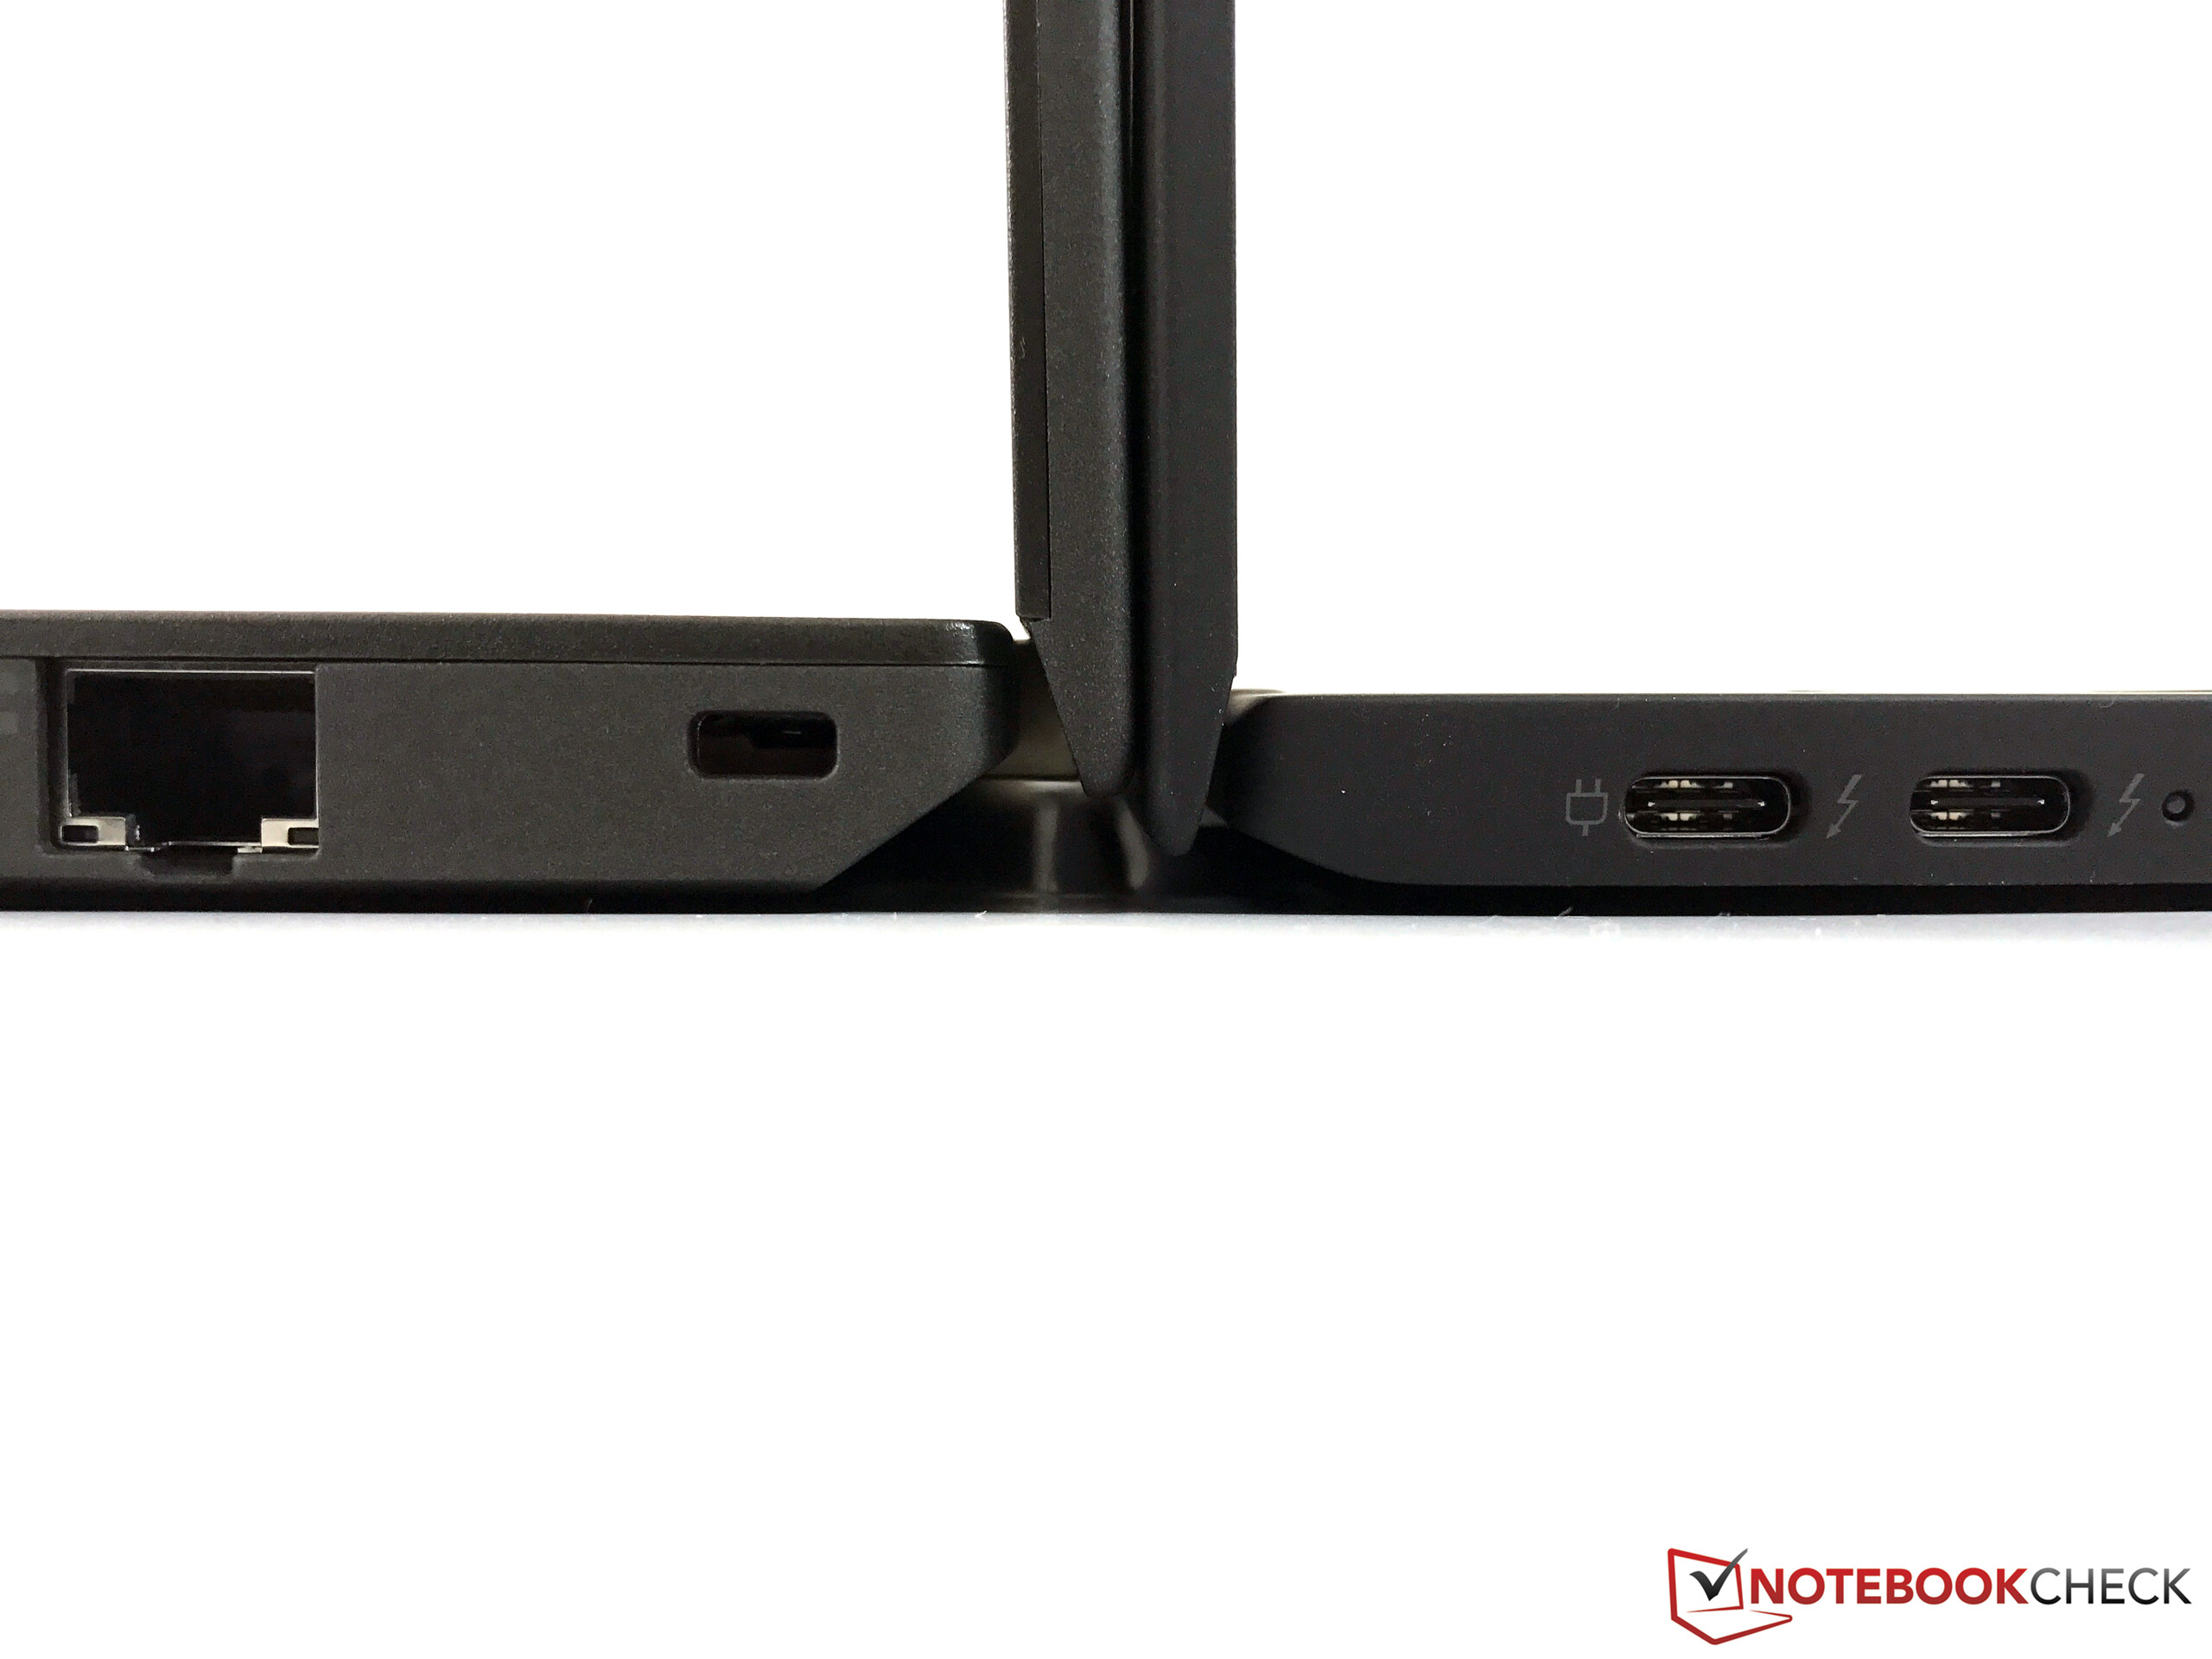
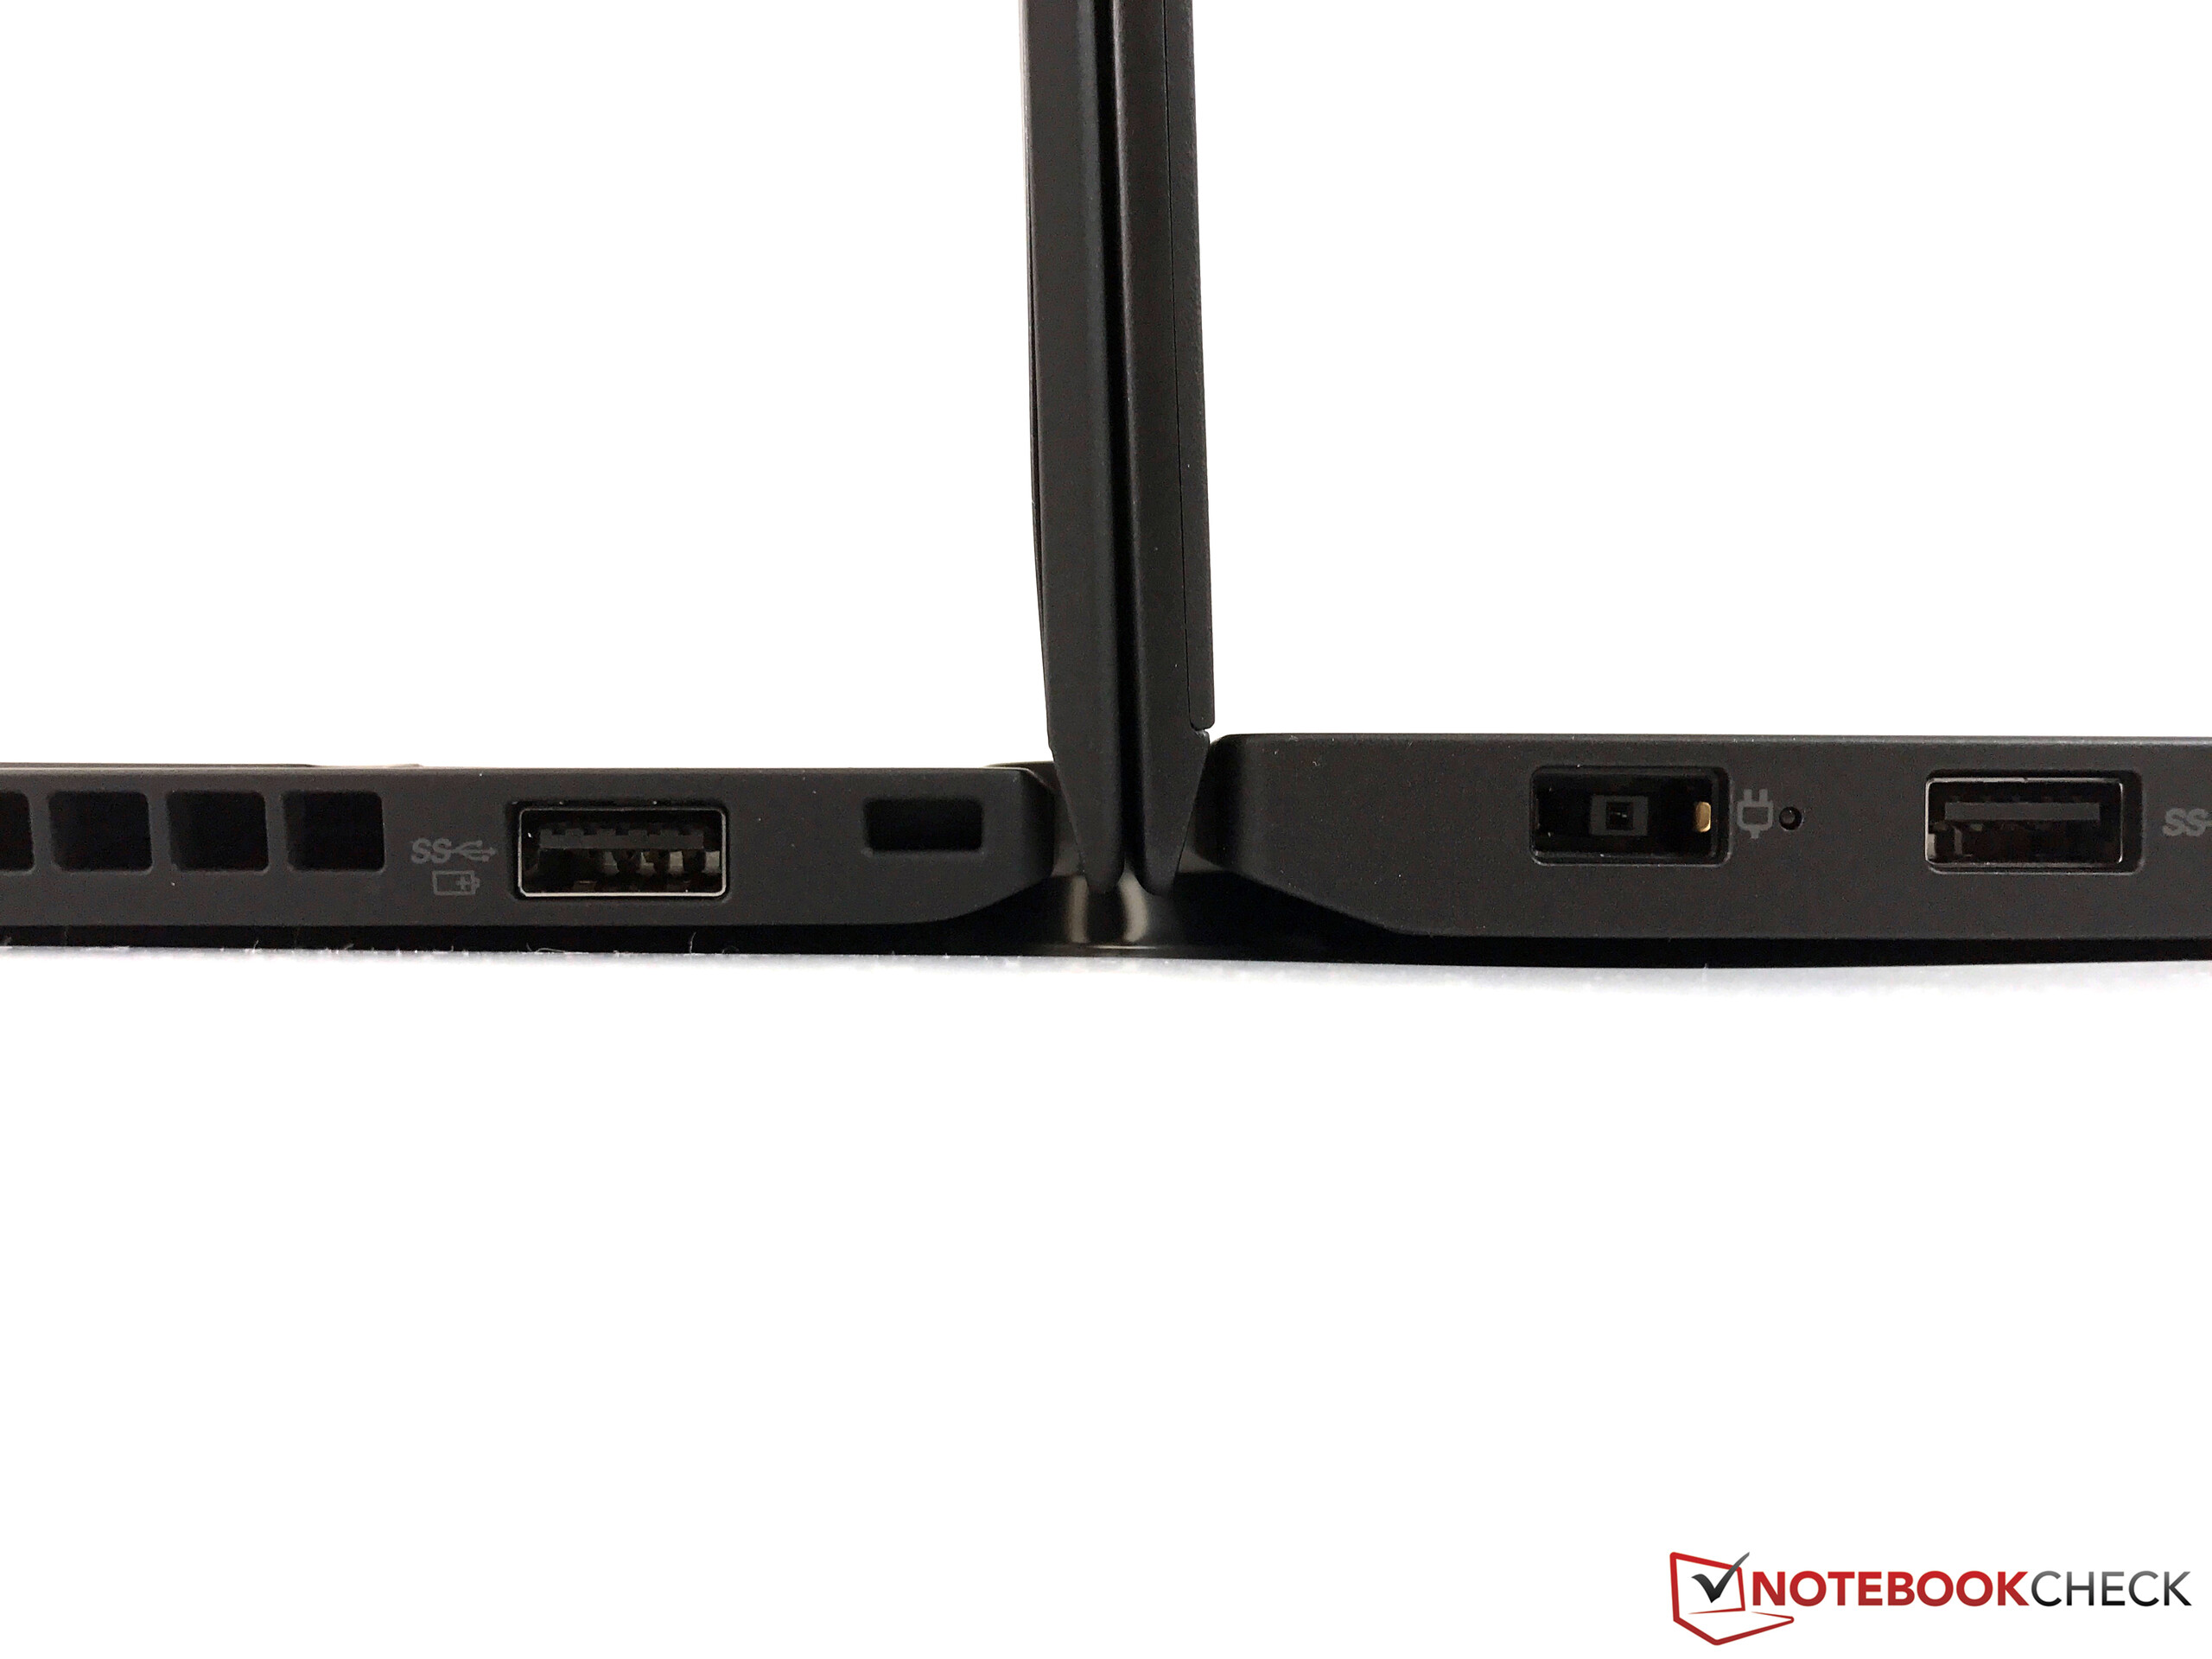
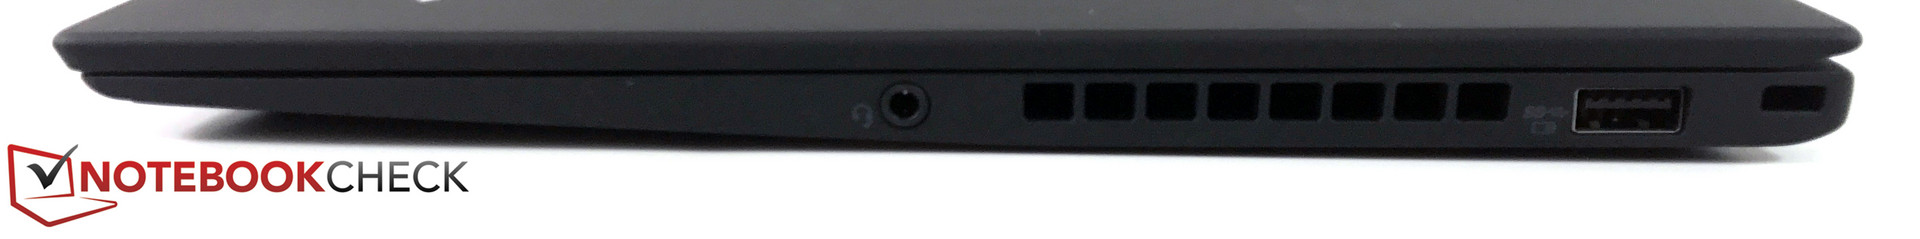
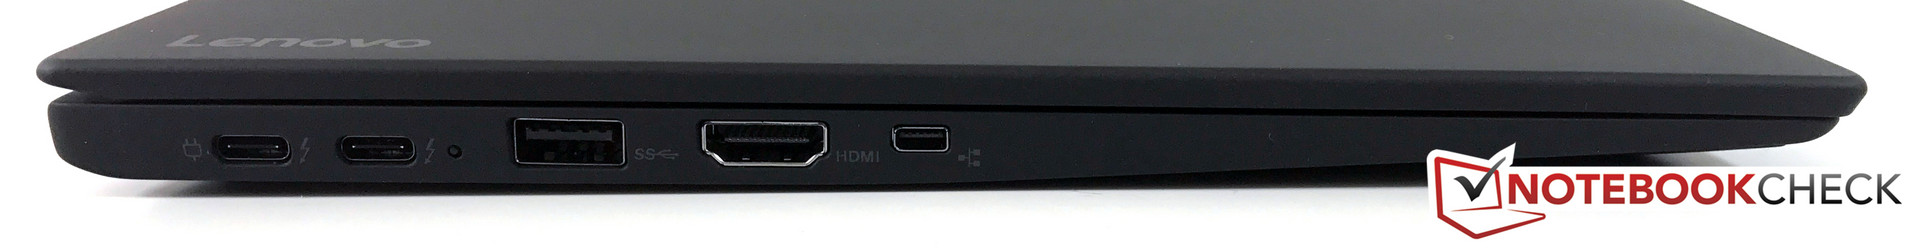
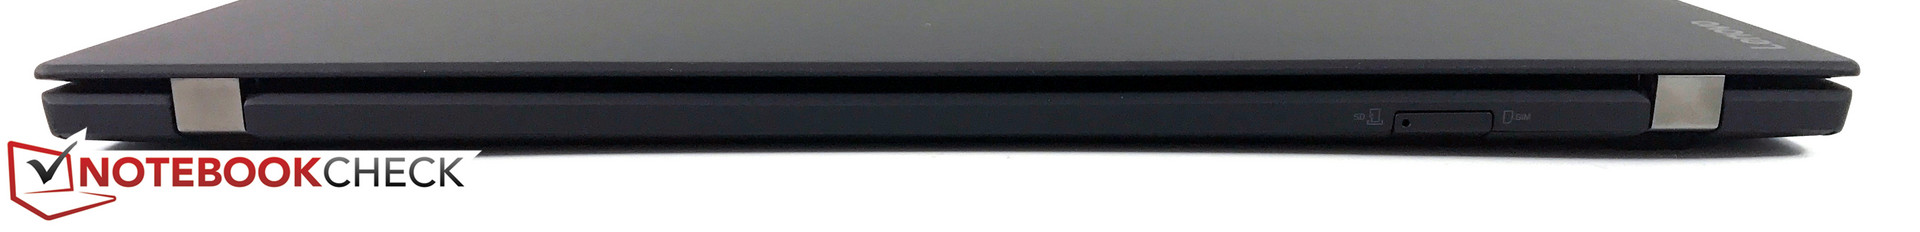
Bağlantılar
Note: The manufacturer may use components from different suppliers including display panels, drives or memory sticks with similar specifications.
| SD Card Reader | |
| average JPG Copy Test (av. of 3 runs) | |
| Dell XPS 15 9560 (i7-7700HQ, UHD) | |
| Lenovo ThinkPad T470s-20HGS00V00 | |
| Lenovo ThinkPad T470-20HD002HGE | |
| Fujitsu LifeBook U747 | |
| Lenovo ThinkPad X1 Carbon 2017-20HQS03P00 | |
| maximum AS SSD Seq Read Test (1GB) | |
| Dell XPS 15 9560 (i7-7700HQ, UHD) | |
| Lenovo ThinkPad T470s-20HGS00V00 | |
| Lenovo ThinkPad T470-20HD002HGE | |
| Fujitsu LifeBook U747 | |
| Lenovo ThinkPad X1 Carbon 2017-20HQS03P00 | |
Screen Flickering / PWM (Pulse-Width Modulation)
ℹ
To dim the screen, some notebooks will simply cycle the backlight on and off in rapid succession - a method called Pulse Width Modulation (PWM) . This cycling frequency should ideally be undetectable to the human eye. If said frequency is too low, users with sensitive eyes may experience strain or headaches or even notice the flickering altogether.| Screen flickering / PWM not detected | 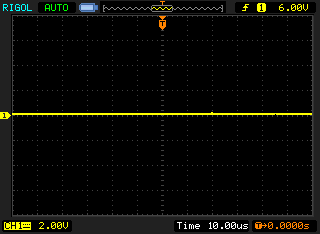 | ||
In comparison: 53 % of all tested devices do not use PWM to dim the display. If PWM was detected, an average of 17900 (minimum: 5 - maximum: 3846000) Hz was measured. | |||
| |||||||||||||||||||||||||
B140HAN03_1 tested with X-Rite i1Pro 2
Maksimum: 311 cd/m² (Nits) Ortalama: 287.7 cd/m² Minimum: 4.4 cd/m²Aydınlatma: 85 %
Batarya modunda parlaklık: 308 cd/m²
Kontrast: 1296:1 (Siyah: 0.24 cd/m²)
ΔE Color 5.5 | 0.5-29.43 Ø5
ΔE Greyscale 6.2 | 0.57-98 Ø5.3
85.77% sRGB (Argyll 1.6.3 3D)
55.96% AdobeRGB 1998 (Argyll 1.6.3 3D)
62.4% AdobeRGB 1998 (Argyll 2.2.0 3D)
85.9% sRGB (Argyll 2.2.0 3D)
61.4% Display P3 (Argyll 2.2.0 3D)
Gamma: 2.02
| Lenovo ThinkPad X1 Carbon 2017-20HQS03P00 B140HAN03_1, , 1920x1080 | Lenovo ThinkPad X1 Carbon 20FB-005XUS 1920x1080 | Lenovo ThinkPad X1 Carbon 20FB003RGE VVX14T058J00, , 2560x1440 | Lenovo ThinkPad T470s-20HGS00V00 B140QAN01.5, , 2560x1440 | Lenovo ThinkPad T470-20HD002HGE N140HCA-EAB, , 1920x1080 | HP EliteBook Folio 1040 G3 AUO1136, , 2560x1440 | Fujitsu LifeBook U747 LG LP140WF3, , 1920x1080 | |
|---|---|---|---|---|---|---|---|
| Display | -3% | 10% | 12% | -30% | 12% | 2% | |
| Display P3 Coverage | 61.4 | 58.9 -4% | 66.7 9% | 69 12% | 41.6 -32% | 67.9 11% | 66.1 8% |
| sRGB Coverage | 85.9 | 83.1 -3% | 94.7 10% | 95.1 11% | 61.9 -28% | 96.8 13% | 84.8 -1% |
| AdobeRGB 1998 Coverage | 62.4 | 60.3 -3% | 68.4 10% | 69.6 12% | 43.06 -31% | 70 12% | 62 -1% |
| Response Times | 0% | 9% | -2% | -4% | 2% | 20% | |
| Response Time Grey 50% / Grey 80% * | 41.6 ? | 47.2 ? -13% | 44 ? -6% | 46.4 ? -12% | 41.6 ? -0% | 46.4 ? -12% | 36 ? 13% |
| Response Time Black / White * | 31.6 ? | 27.6 ? 13% | 24 ? 24% | 28.8 ? 9% | 34 ? -8% | 26.4 ? 16% | 23.2 ? 27% |
| PWM Frequency | 220 ? | ||||||
| Screen | 7% | 8% | -5% | -16% | 3% | 0% | |
| Brightness middle | 311 | 321.7 3% | 272 -13% | 327 5% | 306 -2% | 327 5% | 291 -6% |
| Brightness | 288 | 301 5% | 268 -7% | 311 8% | 287 0% | 316 10% | 296 3% |
| Brightness Distribution | 85 | 89 5% | 95 12% | 88 4% | 88 4% | 87 2% | 84 -1% |
| Black Level * | 0.24 | 0.294 -23% | 0.32 -33% | 0.25 -4% | 0.3 -25% | 0.35 -46% | 0.32 -33% |
| Contrast | 1296 | 1094 -16% | 850 -34% | 1308 1% | 1020 -21% | 934 -28% | 909 -30% |
| Colorchecker dE 2000 * | 5.5 | 3.96 28% | 2.61 53% | 6.1 -11% | 6.2 -13% | 4.39 20% | 4.3 22% |
| Colorchecker dE 2000 max. * | 9 | 6.69 26% | 6.43 29% | 12.2 -36% | 13.6 -51% | 7.27 19% | 7.5 17% |
| Greyscale dE 2000 * | 6.2 | 3.15 49% | 3.31 47% | 8.8 -42% | 5.8 6% | 4.69 24% | 4.3 31% |
| Gamma | 2.02 109% | 2.34 94% | 2.35 94% | 2.18 101% | 2.04 108% | 2.15 102% | 2.31 95% |
| CCT | 5950 109% | 7082 92% | 6360 102% | 6172 105% | 6277 104% | 7101 92% | 6529 100% |
| Color Space (Percent of AdobeRGB 1998) | 55.96 | 53.8 -4% | 63 13% | 61.56 10% | 39.62 -29% | 62.52 12% | 55.46 -1% |
| Color Space (Percent of sRGB) | 85.77 | 82.7 -4% | 95 11% | 94.88 11% | 61.44 -28% | 96.71 13% | 84.77 -1% |
| Total Average (Program / Settings) | 1% /
4% | 9% /
8% | 2% /
-1% | -17% /
-17% | 6% /
5% | 7% /
3% |
* ... smaller is better
Display Response Times
ℹ
Display response times show how fast the screen is able to change from one color to the next. Slow response times can lead to afterimages and can cause moving objects to appear blurry (ghosting). Gamers of fast-paced 3D titles should pay special attention to fast response times.| ↔ Response Time Black to White | ||
|---|---|---|
| 31.6 ms ... rise ↗ and fall ↘ combined | ↗ 18.8 ms rise | 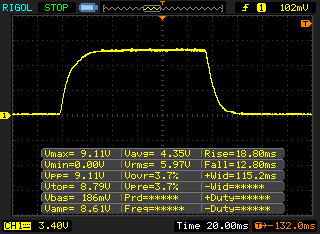 |
| ↘ 12.8 ms fall | ||
| The screen shows slow response rates in our tests and will be unsatisfactory for gamers. In comparison, all tested devices range from 0.1 (minimum) to 240 (maximum) ms. » 83 % of all devices are better. This means that the measured response time is worse than the average of all tested devices (21.5 ms). | ||
| ↔ Response Time 50% Grey to 80% Grey | ||
| 41.6 ms ... rise ↗ and fall ↘ combined | ↗ 20.4 ms rise | 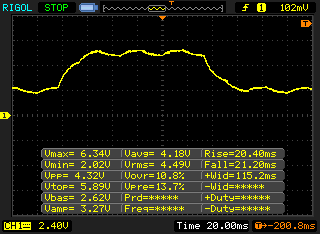 |
| ↘ 21.2 ms fall | ||
| The screen shows slow response rates in our tests and will be unsatisfactory for gamers. In comparison, all tested devices range from 0.2 (minimum) to 636 (maximum) ms. » 62 % of all devices are better. This means that the measured response time is worse than the average of all tested devices (33.7 ms). | ||
Cinebench R15 CPU Multi 64 Bit
| Lenovo ThinkPad X1 Carbon 2017-20HQS03P00 Samsung PM961 NVMe MZVLW512HMJP | Lenovo ThinkPad T470s-20HGS00V00 Samsung SSD PM961 1TB M.2 PCIe 3.0 x4 NVMe (MZVLW1T0) | Lenovo ThinkPad X1 Carbon 20FB003RGE Samsung SSD PM871 MZNLN256HCHP | HP EliteBook Folio 1040 G3 Samsung SM951 MZVPV256HDGL m.2 PCI-e | Fujitsu LifeBook U747 Samsung MZYTY256HDHP | Lenovo ThinkPad T470-20HD002HGE Samsung PM961 NVMe MZVLW512HMJP | |
|---|---|---|---|---|---|---|
| CrystalDiskMark 3.0 | 2% | -59% | -0% | -54% | -18% | |
| Read Seq | 1827 | 1760 -4% | 439.3 -76% | 1649 -10% | 504 -72% | 1155 -37% |
| Write Seq | 1383 | 1666 20% | 308.1 -78% | 1265 -9% | 497.8 -64% | 1076 -22% |
| Read 512 | 814 | 832 2% | 299.5 -63% | 1252 54% | 396.7 -51% | 811 0% |
| Write 512 | 1098 | 1064 -3% | 304.2 -72% | 1244 13% | 283.4 -74% | 862 -21% |
| Read 4k | 61 | 53.2 -13% | 34.05 -44% | 53.3 -13% | 35.73 -41% | 55.5 -9% |
| Write 4k | 172.2 | 167.4 -3% | 86.5 -50% | 159.9 -7% | 87.8 -49% | 134.6 -22% |
| Read 4k QD32 | 601 | 630 5% | 339.6 -43% | 559 -7% | 399.1 -34% | 496.2 -17% |
| Write 4k QD32 | 495.6 | 533 8% | 279.2 -44% | 376.7 -24% | 249.7 -50% | 425.4 -14% |

Samsung PM961 NVMe MZVLW512HMJP
Sequential Read:
1827 MB/s
Sequential Write:
1383 MB/s
512K Read:
814 MB/s
512K Write:
1098 MB/s
4K Read:
61 MB/s
4K Write:
172.2 MB/s
4K QD32 Read:
601 MB/s
4K QD32 Write:
495.6 MB/s
| 3DMark 11 Performance | 1815 puan | |
| 3DMark Ice Storm Standard Score | 69541 puan | |
| 3DMark Cloud Gate Standard Score | 6738 puan | |
| 3DMark Fire Strike Score | 1001 puan | |
Yardım | ||
(±) The average temperature for the upper side under maximal load is 37.3 °C / 99 F, compared to the average of 29.5 °C / 85 F for the devices in the class Office.
(-) The maximum temperature on the upper side is 48 °C / 118 F, compared to the average of 34.2 °C / 94 F, ranging from 21.2 to 62.5 °C for the class Office.
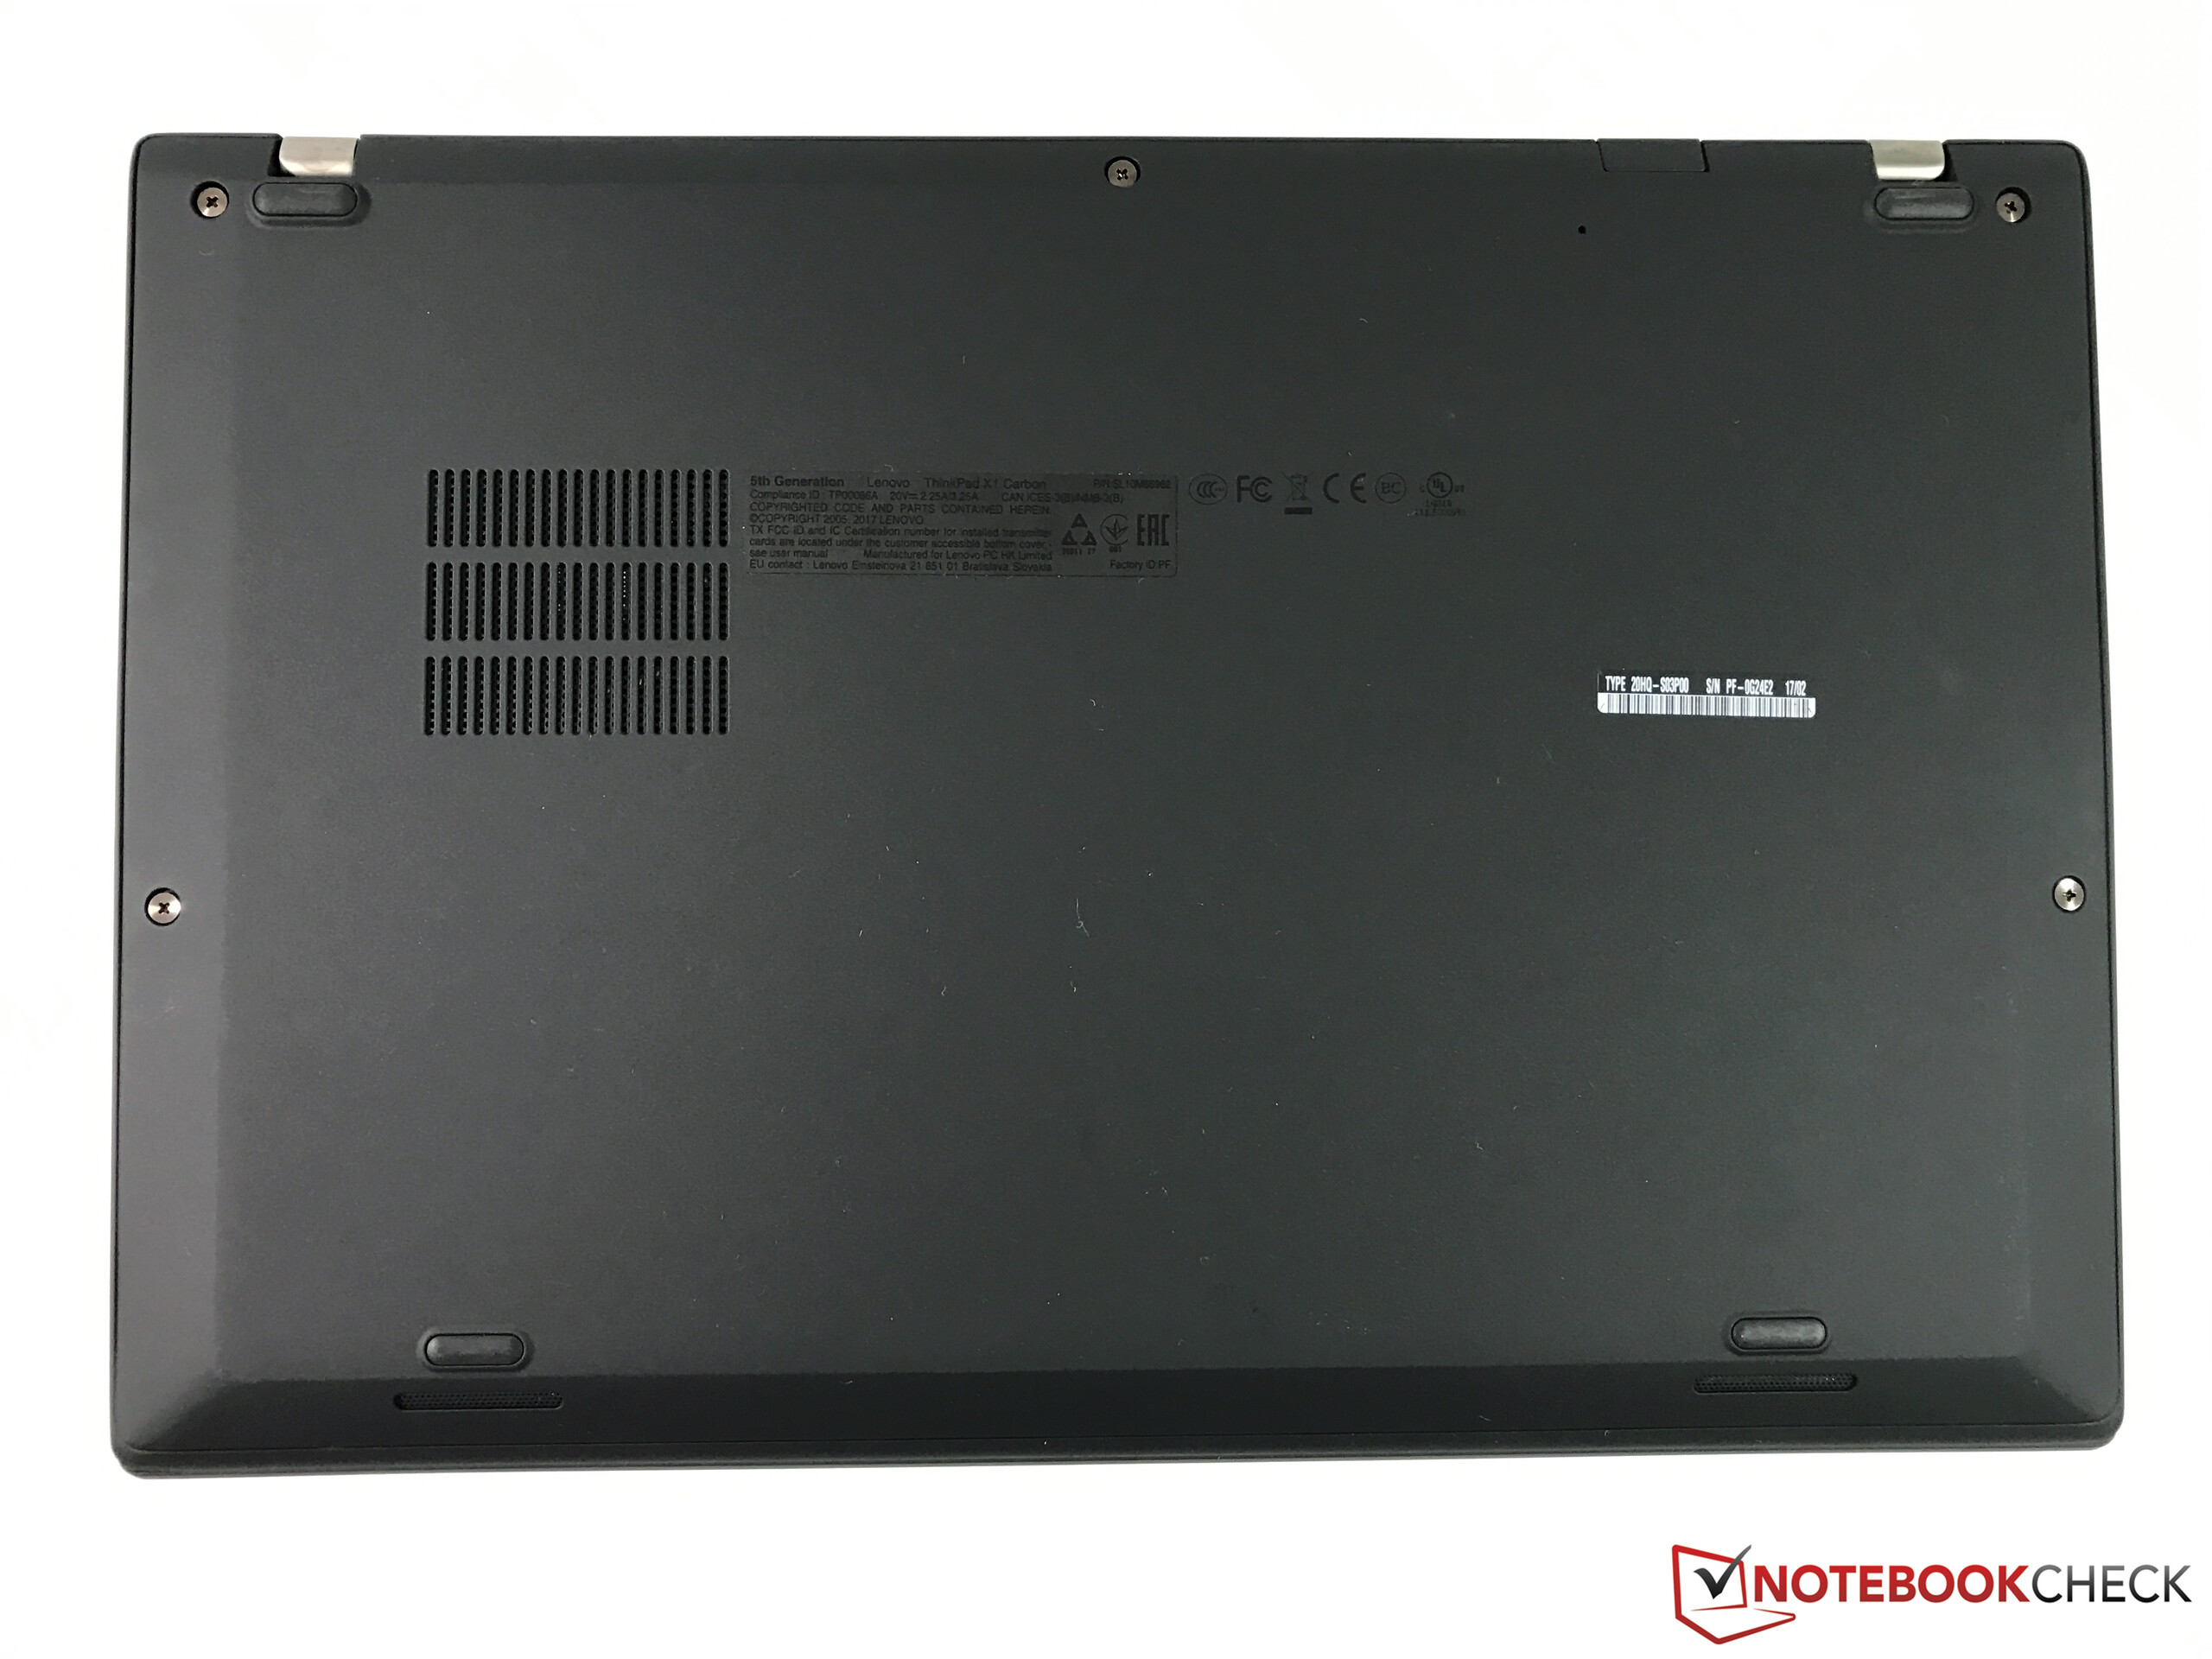
(-) The bottom heats up to a maximum of 47.2 °C / 117 F, compared to the average of 36.7 °C / 98 F
(+) In idle usage, the average temperature for the upper side is 22.2 °C / 72 F, compared to the device average of 29.5 °C / 85 F.
(+) The palmrests and touchpad are cooler than skin temperature with a maximum of 31.6 °C / 88.9 F and are therefore cool to the touch.
(-) The average temperature of the palmrest area of similar devices was 27.7 °C / 81.9 F (-3.9 °C / -7 F).
(-) The maximum temperature on the upper side is 48 °C / 118 F, compared to the average of 34.2 °C / 94 F, ranging from 21.2 to 62.5 °C for the class Office.
(-) The bottom heats up to a maximum of 47.2 °C / 117 F, compared to the average of 36.7 °C / 98 F
(+) In idle usage, the average temperature for the upper side is 22.2 °C / 72 F, compared to the device average of 29.5 °C / 85 F.
(+) The palmrests and touchpad are cooler than skin temperature with a maximum of 31.6 °C / 88.9 F and are therefore cool to the touch.
(-) The average temperature of the palmrest area of similar devices was 27.7 °C / 81.9 F (-3.9 °C / -7 F).
| Lenovo ThinkPad X1 Carbon 2017-20HQS03P00 i7-7500U, HD Graphics 620, 57 Wh, 1920x1080 | Lenovo ThinkPad X1 Carbon 20FB003RGE 6500U, HD Graphics 520, 52 Wh, 2560x1440 | Lenovo ThinkPad T470s-20HGS00V00 i7-7600U, HD Graphics 620, 51 Wh, 2560x1440 | Lenovo ThinkPad T470-20HD002HGE i5-7200U, HD Graphics 620, 48 Wh, 1920x1080 | Fujitsu LifeBook U747 i5-7200U, HD Graphics 620, 50 Wh, 1920x1080 | HP EliteBook Folio 1040 G3 6300U, HD Graphics 520, 45.6 Wh, 2560x1440 | Lenovo ThinkPad X1 Carbon 20FB-005XUS 6300U, HD Graphics 520, 52 Wh, 1920x1080 | |
|---|---|---|---|---|---|---|---|
| Battery Runtime | -12% | -22% | -8% | -13% | -24% | -3% | |
| H.264 | 711 | 510 -28% | 454 -36% | 623 -12% | 490 -31% | 339 -52% | |
| WiFi v1.3 | 496 | 429 -14% | 417 -16% | 438 -12% | 430 -13% | 309 -38% | 411 -17% |
| Load | 110 | 115 5% | 93 -15% | 110 0% | 117 6% | 131 19% | 123 12% |
Pricecompare
