 Deutsch
 English
 Español
 Français
 Italiano
 Nederlands
 Polski
 Português
 Русский
 Türkçe
 Svenska
 Chinese
 Magyar
Kısa inceleme: Microsoft Surface Book (Core i7, 940M) dönüştürülebilir
| |||||||||||||||||||||||||
Aydınlatma: 88 %
Batarya modunda parlaklık: 438 cd/m²
Kontrast: 1752:1 (Siyah: 0.25 cd/m²)
ΔE Color 2.06 | 0.5-29.43 Ø5
ΔE Greyscale 2.87 | 0.57-98 Ø5.3
96% sRGB (Argyll 1.6.3 3D)
64% AdobeRGB 1998 (Argyll 1.6.3 3D)
68% AdobeRGB 1998 (Argyll 2.2.0 3D)
96% sRGB (Argyll 2.2.0 3D)
66.3% Display P3 (Argyll 2.2.0 3D)
Gamma: 2.44
| Microsoft Surface Book Core i7 13.50, 3000x2000 | Apple MacBook Pro Retina 13 inch 2015-03 13.30, 2560x1600 | Toshiba KIRA-10D 13.30, 1920x1080 | Microsoft Surface Pro 4, Core i5, 128GB 12.30, 2736x1824 | Dell XPS 13 9343 Core i7 13.30, 3200x1800 | HP Spectre x360 13-4104ng 13.30, 2560x1440 | HP Spectre x2 12-a003ng K3D42EA 12.00, 1920x1080 | |
|---|---|---|---|---|---|---|---|
| Display | -0% | 3% | -1% | -6% | -1% | -23% | |
| Display P3 Coverage | 66.3 | 65.9 -1% | 69.1 4% | 65 -2% | 62.6 -6% | 66.8 1% | 52.9 -20% |
| sRGB Coverage | 96 | 97 1% | 98.2 2% | 96.5 1% | 89.8 -6% | 92.8 -3% | 71.8 -25% |
| AdobeRGB 1998 Coverage | 68 | 67.4 -1% | 71 4% | 67 -1% | 64.2 -6% | 67.3 -1% | 52.6 -23% |
| Response Times | -5% | 41% | 2% | ||||
| Response Time Grey 50% / Grey 80% * | 39 ? | 46 ? -18% | 24 ? 38% | 47 ? -21% | |||
| Response Time Black / White * | 34 ? | 31.2 ? 8% | 19 ? 44% | 26 ? 24% | |||
| PWM Frequency | 50 ? | ||||||
| Screen | -9% | -11% | -20% | -28% | -34% | -59% | |
| Brightness middle | 438 | 361 -18% | 334 -24% | 413 -6% | 232 -47% | 324 -26% | 353 -19% |
| Brightness | 414 | 342 -17% | 316 -24% | 396 -4% | 231 -44% | 324 -22% | 347 -16% |
| Brightness Distribution | 88 | 81 -8% | 92 5% | 87 -1% | 82 -7% | 90 2% | 91 3% |
| Black Level * | 0.25 | 0.361 -44% | 0.29 -16% | 0.36 -44% | 0.25 -0% | 0.34 -36% | 0.44 -76% |
| Contrast | 1752 | 1000 -43% | 1152 -34% | 1147 -35% | 928 -47% | 953 -46% | 802 -54% |
| Colorchecker dE 2000 * | 2.06 | 1.82 12% | 2.27 -10% | 3.09 -50% | 3.63 -76% | 4.36 -112% | 6.09 -196% |
| Greyscale dE 2000 * | 2.87 | 1.8 37% | 2.47 14% | 3.92 -37% | 2.57 10% | 4.62 -61% | 6.24 -117% |
| Gamma | 2.44 90% | 2.49 88% | 2.36 93% | 2.3 96% | 2.17 101% | 2.18 101% | 2.41 91% |
| CCT | 6820 95% | 6417 101% | 6872 95% | 7333 89% | 6422 101% | 6857 95% | 7238 90% |
| Color Space (Percent of AdobeRGB 1998) | 64 | 61.9 -3% | 64 0% | 61 -5% | 58 -9% | 60 -6% | 46 -28% |
| Color Space (Percent of sRGB) | 96 | 96.9 1% | 97 1% | 93 -3% | 71 -26% | ||
| Colorchecker dE 2000 max. * | 3.26 | ||||||
| Total Average (Program / Settings) | -5% /
-7% | -4% /
-7% | -9% /
-14% | -17% /
-22% | 2% /
-17% | -27% /
-42% |
* ... smaller is better
Display Response Times
| ↔ Response Time Black to White | ||
|---|---|---|
| 34 ms ... rise ↗ and fall ↘ combined | ↗ 10 ms rise | 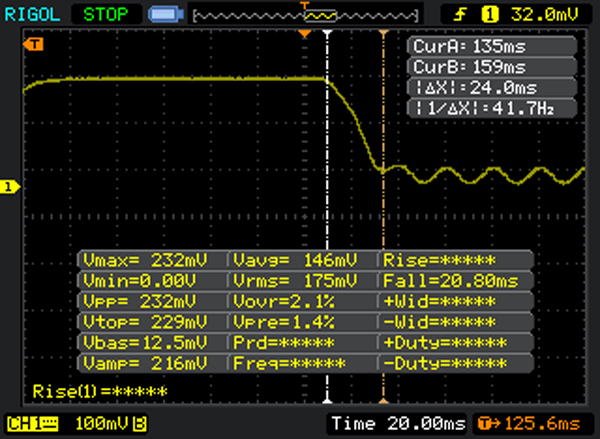 |
| ↘ 24 ms fall | ||
| The screen shows slow response rates in our tests and will be unsatisfactory for gamers. In comparison, all tested devices range from 0.1 (minimum) to 240 (maximum) ms. » 89 % of all devices are better. This means that the measured response time is worse than the average of all tested devices (21.5 ms). | ||
| ↔ Response Time 50% Grey to 80% Grey | ||
| 39 ms ... rise ↗ and fall ↘ combined | ↗ 24 ms rise | 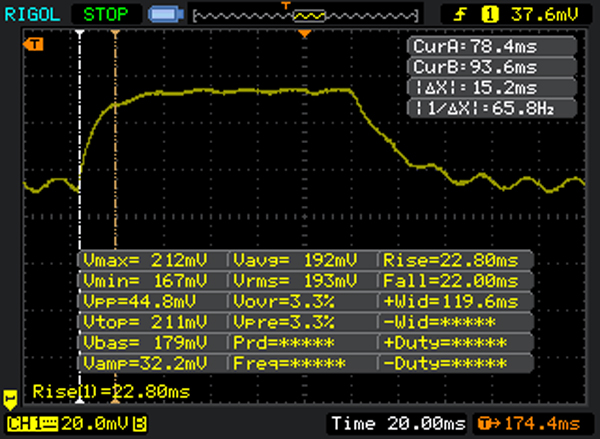 |
| ↘ 15 ms fall | ||
| The screen shows slow response rates in our tests and will be unsatisfactory for gamers. In comparison, all tested devices range from 0.2 (minimum) to 636 (maximum) ms. » 53 % of all devices are better. This means that the measured response time is worse than the average of all tested devices (33.7 ms). | ||
Screen Flickering / PWM (Pulse-Width Modulation)
| Screen flickering / PWM not detected | ||
In comparison: 53 % of all tested devices do not use PWM to dim the display. If PWM was detected, an average of 17900 (minimum: 5 - maximum: 3846000) Hz was measured. | ||
| PCMark 7 | |
| Score (sort by value) | |
| Microsoft Surface Book Core i7 | |
| Microsoft Surface Book Core i5 | |
| Microsoft Surface Pro 4, Core m3 | |
| Microsoft Surface Pro 4, Core i5, 128GB | |
| Microsoft Surface Pro 4 Core i7 | |
| HP EliteBook Folio 1040 G2 | |
| Apple MacBook Pro Retina 13 inch 2015-03 | |
| Toshiba KIRA-10D | |
| HP Spectre x360 13-4104ng | |
| HP Spectre x360 13-4104ng | |
| Productivity (sort by value) | |
| Microsoft Surface Book Core i7 | |
| Microsoft Surface Book Core i5 | |
| Microsoft Surface Pro 4, Core i5, 128GB | |
| Microsoft Surface Pro 4 Core i7 | |
| HP EliteBook Folio 1040 G2 | |
| Apple MacBook Pro Retina 13 inch 2015-03 | |
| HP Spectre x360 13-4104ng | |
| HP Spectre x360 13-4104ng | |
| PCMark 7 Score | 5178 puan | |
| PCMark 8 Home Score Accelerated v2 | 2947 puan | |
| PCMark 8 Creative Score Accelerated v2 | 3755 puan | |
| PCMark 8 Work Score Accelerated v2 | 3782 puan | |
Yardım | ||
| Microsoft Surface Book Core i7 13.50, 3000x2000 | Microsoft Surface Book Core i5 13.50, 3000x2000 | Microsoft Surface Pro 4 Core i7 12.30, 2736x1824 | HP EliteBook Folio 1040 G2 14.00, 1920x1080 | Apple MacBook Pro Retina 13 inch 2015-03 13.30, 2560x1600 | Toshiba KIRA-10D 13.30, 1920x1080 | Dell XPS 13 9343 Core i7 13.30, 3200x1800 | HP Spectre x2 12-a003ng K3D42EA 12.00, 1920x1080 | |
|---|---|---|---|---|---|---|---|---|
| AS SSD | -14% | -15% | -50% | -29% | -47% | -48% | -60% | |
| Seq Read | 1342 | 1223 -9% | 1312 -2% | 480.7 -64% | 1233 -8% | 515 -62% | 515 -62% | 439.1 -67% |
| Seq Write | 545 | 275.2 -50% | 274.8 -50% | 250.1 -54% | 616 13% | 467.6 -14% | 233.4 -57% | 216.9 -60% |
| 4K Read | 37.25 | 34.31 -8% | 33.47 -10% | 25.98 -30% | 20.6 -45% | 21.74 -42% | 26.28 -29% | 23.12 -38% |
| 4K Write | 109 | 85 -22% | 89.2 -18% | 84.4 -23% | 30.2 -72% | 78.8 -28% | 91.7 -16% | 49.2 -55% |
| 4K-64 Read | 919 | 1409 53% | 1280 39% | 356.1 -61% | 891 -3% | 352.6 -62% | 359 -61% | 265.6 -71% |
| 4K-64 Write | 520 | 281.4 -46% | 268.7 -48% | 182.7 -65% | 221.2 -57% | 149.7 -71% | 181 -65% | 151.8 -71% |
| CrystalDiskMark 3.0 | -27% | -39% | -1% | -31% | -40% | -52% | ||
| Read Seq | 953 | 834 -12% | 499.9 -48% | 1403 47% | 530 -44% | 527 -45% | 410.1 -57% | |
| Write Seq | 592 | 304 -49% | 264.3 -55% | 657 11% | 474.3 -20% | 237.2 -60% | 316 -47% | |
| Read 512 | 520 | 396.7 -24% | 418.9 -19% | 810 56% | 426.1 -18% | 420.5 -19% | 260.8 -50% | |
| Write 512 | 591 | 304.3 -49% | 264.6 -55% | 648 10% | 445.8 -25% | 241.6 -59% | 241.6 -59% | |
| Read 4k | 42.66 | 40.75 -4% | 28.4 -33% | 20.95 -51% | 23.27 -45% | 28.29 -34% | 27.4 -36% | |
| Write 4k | 136.3 | 106.3 -22% | 101.2 -26% | 32.43 -76% | 90.1 -34% | 103.7 -24% | 53.5 -61% | |
| Total Average (Program / Settings) | -14% /
-14% | -21% /
-21% | -45% /
-44% | -15% /
-15% | -39% /
-39% | -44% /
-44% | -56% /
-56% |

| Microsoft Surface Book Core i7 13.50, 3000x2000 | Microsoft Surface Book i7 Heat Keyboard iGPU 13.50, 3000x2000 | Microsoft Surface Book Core i5 13.50, 3000x2000 | Microsoft Surface Pro 4, Core m3 12.30, 2736x1824 | Microsoft Surface Pro 4, Core i5, 128GB 12.30, 2736x1824 | Microsoft Surface Pro 4 Core i7 12.30, 2736x1824 | HP EliteBook Folio 1040 G2 14.00, 1920x1080 | Apple MacBook Pro Retina 13 inch 2015-03 13.30, 2560x1600 | Dell XPS 13 9343 Core i7 13.30, 3200x1800 | HP Spectre x2 12-a003ng K3D42EA 12.00, 1920x1080 | |
|---|---|---|---|---|---|---|---|---|---|---|
| 3DMark 11 | -32% | -5% | -47% | -35% | -3% | -47% | -28% | -44% | -56% | |
| 1280x720 Performance Physics | 4760 | 4765 0% | 4199 -12% | 3067 -36% | 3984 -16% | 4919 3% | 3692 -22% | 4084 -14% | 3845 -19% | 2604 -45% |
| 1280x720 Performance GPU | 2606 | 1319 -49% | 2548 -2% | 1206 -54% | 1402 -46% | 2450 -6% | 1011 -61% | 1706 -35% | 1115 -57% | 996 -62% |
| 1280x720 Performance | 2761 | 1480 -46% | 2711 -2% | 1344 -51% | 1565 -43% | 2624 -5% | 1133 -59% | 1828 -34% | 1252 -55% | 1098 -60% |
| 3DMark | -34% | -2% | -36% | -19% | 12% | -11% | -14% | -21% | -36% | |
| 1280x720 Cloud Gate Standard Physics | 3745 | 3701 -1% | 3362 -10% | 2238 -40% | 3342 -11% | 3639 -3% | 3185 -15% | 3527 -6% | 3362 -10% | 2304 -38% |
| 1280x720 Ice Storm Standard Physics | 36360 | 31340 -14% | 38206 5% | 25720 -29% | 38764 7% | 44259 22% | 37081 2% | 38688 6% | 38854 7% | 27821 -23% |
| 1280x720 Ice Storm Standard Graphics | 54706 | 22709 -58% | 54088 -1% | 51362 -6% | 56071 2% | 91565 67% | 60003 10% | 60636 11% | 54695 0% | 50126 -8% |
| 1280x720 Cloud Gate Standard Graphics | 11420 | 6274 -45% | 11340 -1% | 6597 -42% | 7455 -35% | 11650 2% | 6585 -42% | 7894 -31% | 6475 -43% | 6298 -45% |
| 1920x1080 Fire Strike Graphics | 2120 | 1010 -52% | 2031 -4% | 810 -62% | 905 -57% | 1477 -30% | 1020 -52% | 834 -61% | 725 -66% | |
| Total Average (Program / Settings) | -33% /
-33% | -4% /
-3% | -42% /
-40% | -27% /
-25% | 5% /
6% | -29% /
-27% | -21% /
-19% | -33% /
-30% | -46% /
-43% |
| 3DMark 11 Performance | 2761 puan | |
| 3DMark Ice Storm Standard Score | 50418 puan | |
| 3DMark Cloud Gate Standard Score | 7505 puan | |
| 3DMark Fire Strike Score | 1952 puan | |
Yardım | ||
| Microsoft Surface Book Core i7 13.50, 3000x2000 | Microsoft Surface Book Core i5 13.50, 3000x2000 | Microsoft Surface Pro 4 Core i7 12.30, 2736x1824 | HP EliteBook Folio 1040 G2 14.00, 1920x1080 | Apple MacBook Pro Retina 13 inch 2015-03 13.30, 2560x1600 | Toshiba KIRA-10D 13.30, 1920x1080 | Dell XPS 13 9343 Core i7 13.30, 3200x1800 | HP Spectre x360 13-4104ng 13.30, 2560x1440 | |
|---|---|---|---|---|---|---|---|---|
| Noise | 3% | 3% | 4% | -1% | -2% | -3% | 3% | |
| off / environment * | 31.3 | |||||||
| Idle Minimum * | 31.3 | 29.5 6% | 28.4 9% | 29.6 5% | 29 7% | 29.6 5% | 29.6 5% | 29.6 5% |
| Idle Average * | 31.3 | 29.6 5% | 28.6 9% | 29.6 5% | 29 7% | 29.6 5% | 29.6 5% | 29.6 5% |
| Idle Maximum * | 31.3 | 29.7 5% | 28.7 8% | 32.2 -3% | 29 7% | 30.7 2% | 33.2 -6% | 34.6 -11% |
| Load Average * | 38 | 37.5 1% | 40.8 -7% | 36.4 4% | 42.5 -12% | 43.9 -16% | 43.2 -14% | 34.7 9% |
| Load Maximum * | 40.5 | 40.9 -1% | 41.4 -2% | 36.4 10% | 45.6 -13% | 43.9 -8% | 43.2 -7% | 37.9 6% |
* ... smaller is better
Ses yüksekliği
| Boşta |
| 31.3 / 31.3 / 31.3 dB |
| Çalışırken |
| 38 / 40.5 dB |
 | ||
30 dB sessiz 40 dB(A) duyulabilirlik 50 dB(A) gürültülü |
||
min: | ||
| Microsoft Surface Book Core i7 13.50, 3000x2000 | Microsoft Surface Book Core i5 13.50, 3000x2000 | Microsoft Surface Pro 4, Core i5, 128GB 12.30, 2736x1824 | Microsoft Surface Pro 4 Core i7 12.30, 2736x1824 | HP EliteBook Folio 1040 G2 14.00, 1920x1080 | Apple MacBook Pro Retina 13 inch 2015-03 13.30, 2560x1600 | Toshiba KIRA-10D 13.30, 1920x1080 | Dell XPS 13 9343 Core i7 13.30, 3200x1800 | HP Spectre x2 12-a003ng K3D42EA 12.00, 1920x1080 | |
|---|---|---|---|---|---|---|---|---|---|
| Heat | 13% | -21% | 12% | 10% | 7% | 13% | 14% | 2% | |
| Maximum Upper Side * | 47.4 | 44.2 7% | 52.3 -10% | 45.4 4% | 35.9 24% | 45.1 5% | 42.2 11% | 43.4 8% | 43.5 8% |
| Maximum Bottom * | 50.2 | 41.2 18% | 51.4 -2% | 43.2 14% | 42.4 16% | 39.6 21% | 34.4 31% | 37 26% | 42 16% |
| Idle Upper Side * | 30.4 | 26 14% | 43.2 -42% | 25.2 17% | 28.5 6% | 28.5 6% | 26.2 14% | 25.9 15% | 33 -9% |
| Idle Bottom * | 27.4 | 23.8 13% | 36 -31% | 24 12% | 29 -6% | 28.3 -3% | 28.5 -4% | 25.1 8% | 29.3 -7% |
* ... smaller is better
Heat Tablet
(-) The maximum temperature on the upper side is 47.4 °C / 117 F, compared to the average of 35.3 °C / 96 F, ranging from 19.6 to 55.7 °C for the class Convertible.
(-) The bottom heats up to a maximum of 50.2 °C / 122 F, compared to the average of 36.8 °C / 98 F
(+) In idle usage, the average temperature for the upper side is 26.6 °C / 80 F, compared to the device average of 30.2 °C / 86 F.
(-) The palmrests and touchpad can get very hot to the touch with a maximum of 47.35 °C / 117.2 F.
(-) The average temperature of the palmrest area of similar devices was 28.1 °C / 82.6 F (-19.3 °C / -34.6 F).
Heat Keyboard with Maxwell Geforce
(+) The maximum temperature on the upper side is 39.6 °C / 103 F, compared to the average of 35.3 °C / 96 F, ranging from 19.6 to 55.7 °C for the class Convertible.
(±) The bottom heats up to a maximum of 40.7 °C / 105 F, compared to the average of 36.8 °C / 98 F
(+) The palmrests and touchpad are cooler than skin temperature with a maximum of 28.6 °C / 83.5 F and are therefore cool to the touch.
(±) The average temperature of the palmrest area of similar devices was 28.1 °C / 82.6 F (-0.5 °C / -0.9 F).
| Microsoft Surface Book Core i7 13.50, 3000x2000 | Microsoft Surface Pro 4, Core i5, 128GB 12.30, 2736x1824 | HP EliteBook Folio 1040 G2 14.00, 1920x1080 | Apple MacBook Pro Retina 13 inch 2015-03 13.30, 2560x1600 | Toshiba KIRA-10D 13.30, 1920x1080 | Dell XPS 13 9343 Core i7 13.30, 3200x1800 | HP Spectre x360 13-4104ng 13.30, 2560x1440 | HP Spectre x2 12-a003ng K3D42EA 12.00, 1920x1080 | |
|---|---|---|---|---|---|---|---|---|
| Power Consumption | 29% | 40% | 13% | 41% | 8% | 30% | 35% | |
| Idle Minimum * | 4.5 | 4.4 2% | 3.2 29% | 2.8 38% | 2.6 42% | 6.6 -47% | 3.9 13% | 4.5 -0% |
| Idle Average * | 9.8 | 9 8% | 6.5 34% | 7.8 20% | 6.3 36% | 9.3 5% | 7.4 24% | 7.7 21% |
| Idle Maximum * | 12.2 | 10.7 12% | 7.4 39% | 8.1 34% | 6.5 47% | 11 10% | 9.2 25% | 8.3 32% |
| Load Average * | 46 | 19.6 57% | 25.6 44% | 52.4 -14% | 30.9 33% | 32.2 30% | 28.1 39% | 19.8 57% |
| Load Maximum * | 56 | 19.9 64% | 26.1 53% | 62.8 -12% | 30.9 45% | 33.2 41% | 27.6 51% | 20.6 63% |
* ... smaller is better
| Kapalı / Bekleme modu | |
| Boşta | |
| Çalışırken |
|
Artılar
Eksiler
Çok deniyor ve Core i5 kardeşinden bir puan daha fazlasını almayı başarıyor. Karar verici faktörümüz ise daha uzun kullanım süresi. Çünkü i7/512 GB versiyonun işlemci ve uygulama performansı yönünden gerçek bir avantajını göremiyoruz. Geniş SSD daha yüksek yazma hızlarına olanak sağlıyor. Sıcaklık üretimi i5 modelien göre daha yüksek.
Surface Book, ister i5 ister i7 modeli olsun işlemci odaklı uygulamalarda kolay bir şekilde kullanılabilir. Eğer video işleri ile uğralıyorsanız MacBook Pro 13 veya Dell XPS 13 modelleri ile rekabet edebilecek bir cihaz elinizde.
Yazının orjinali için tıklayın.
Microsoft Surface Book Core i7
-
04/27/2016 v5.1(old)
Sebastian Jentsch
Pricecompare
