 Deutsch
 English
 Español
 Français
 Italiano
 Nederlands
 Polski
 Português
 Русский
 Türkçe
 Svenska
 Chinese
 Magyar
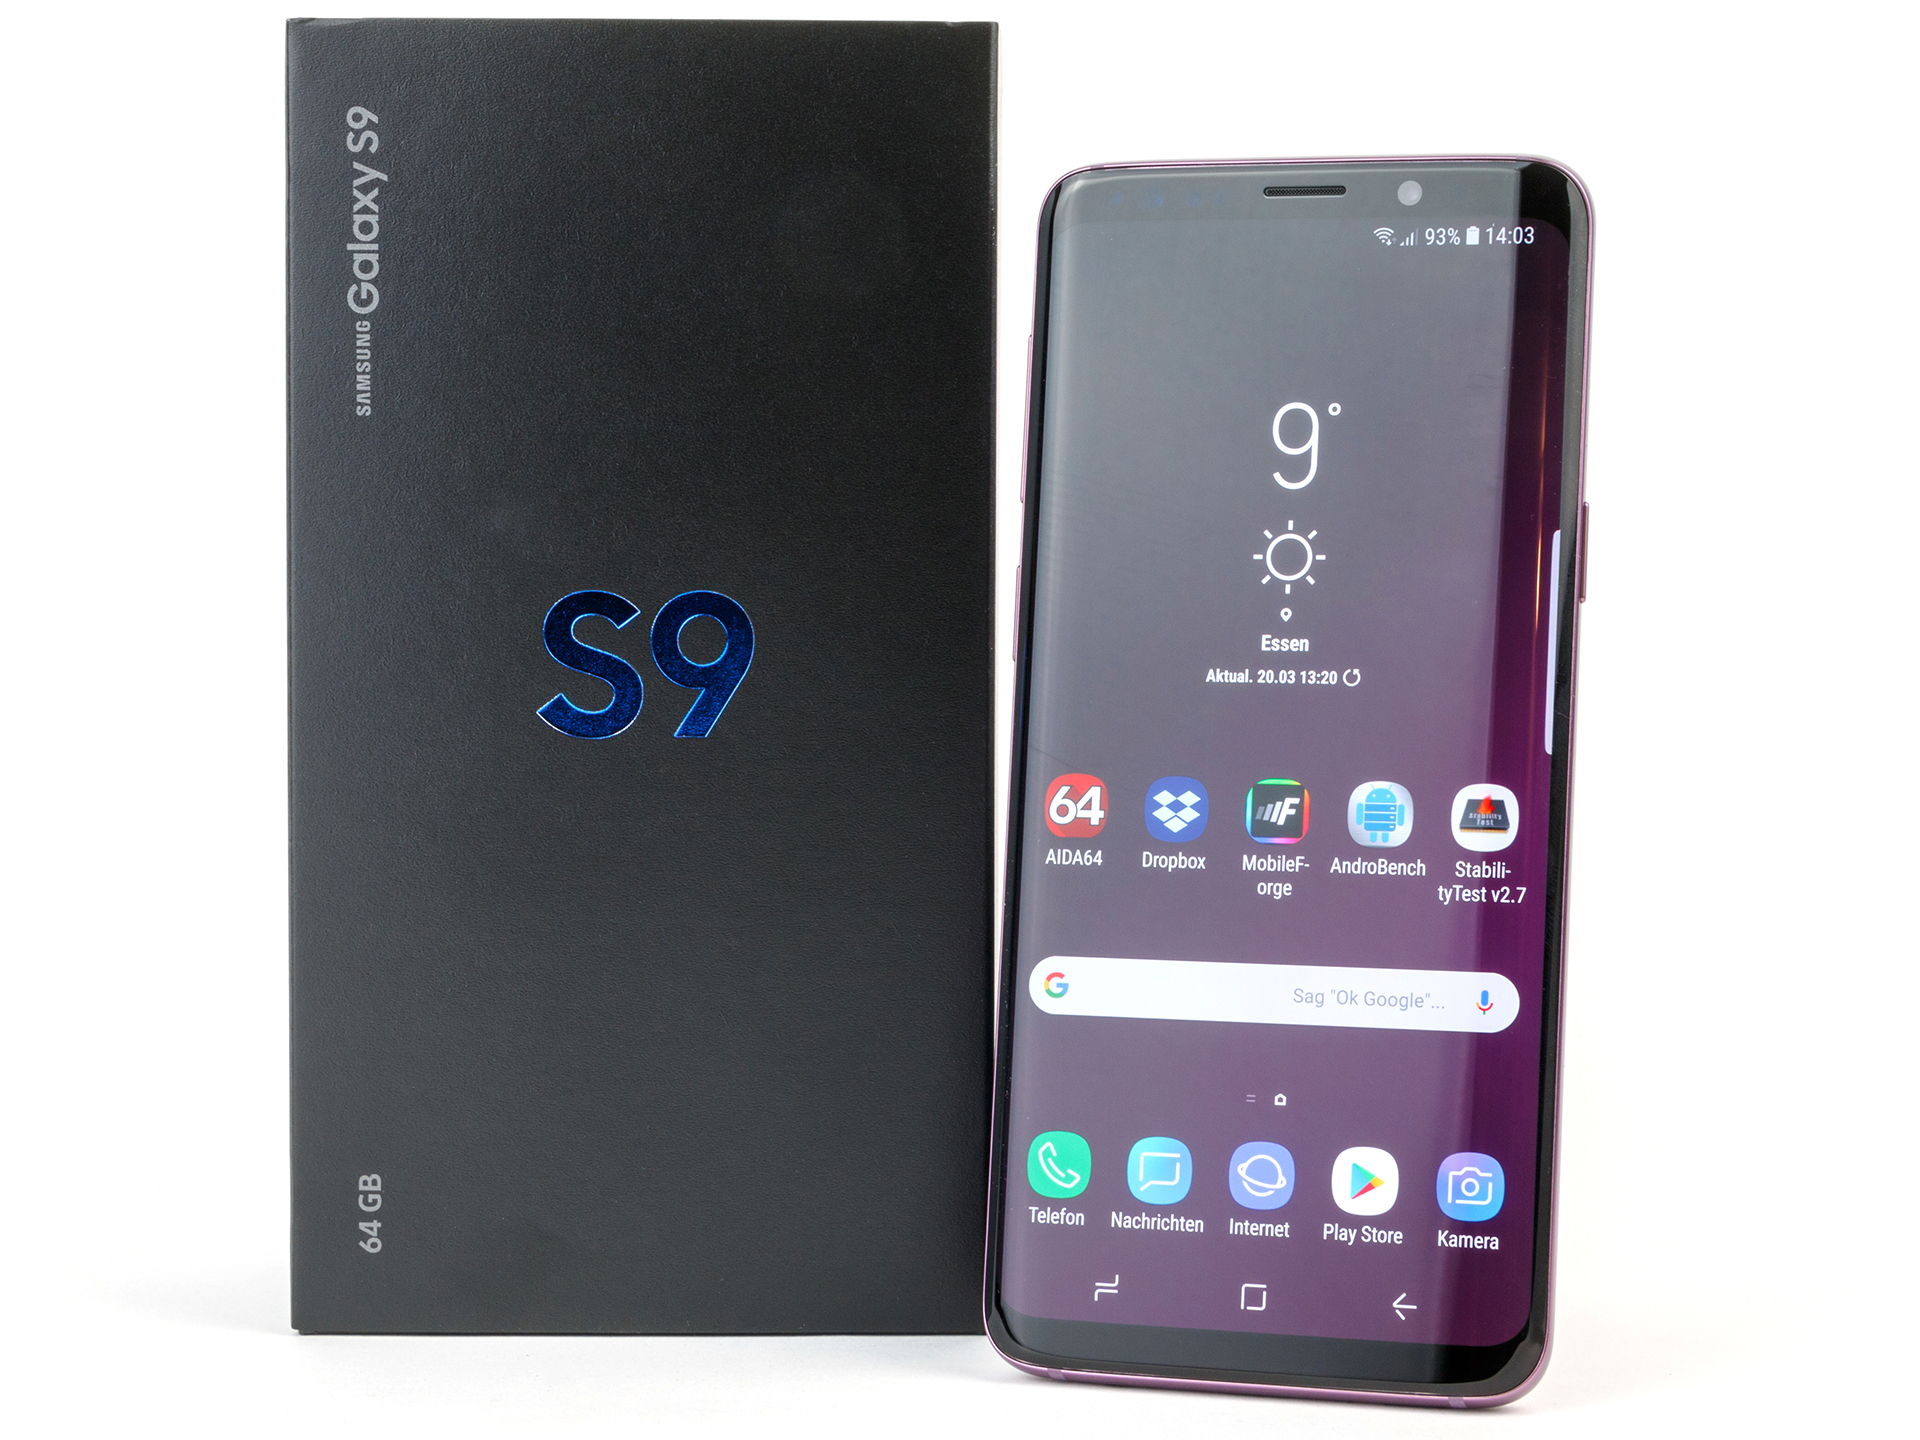
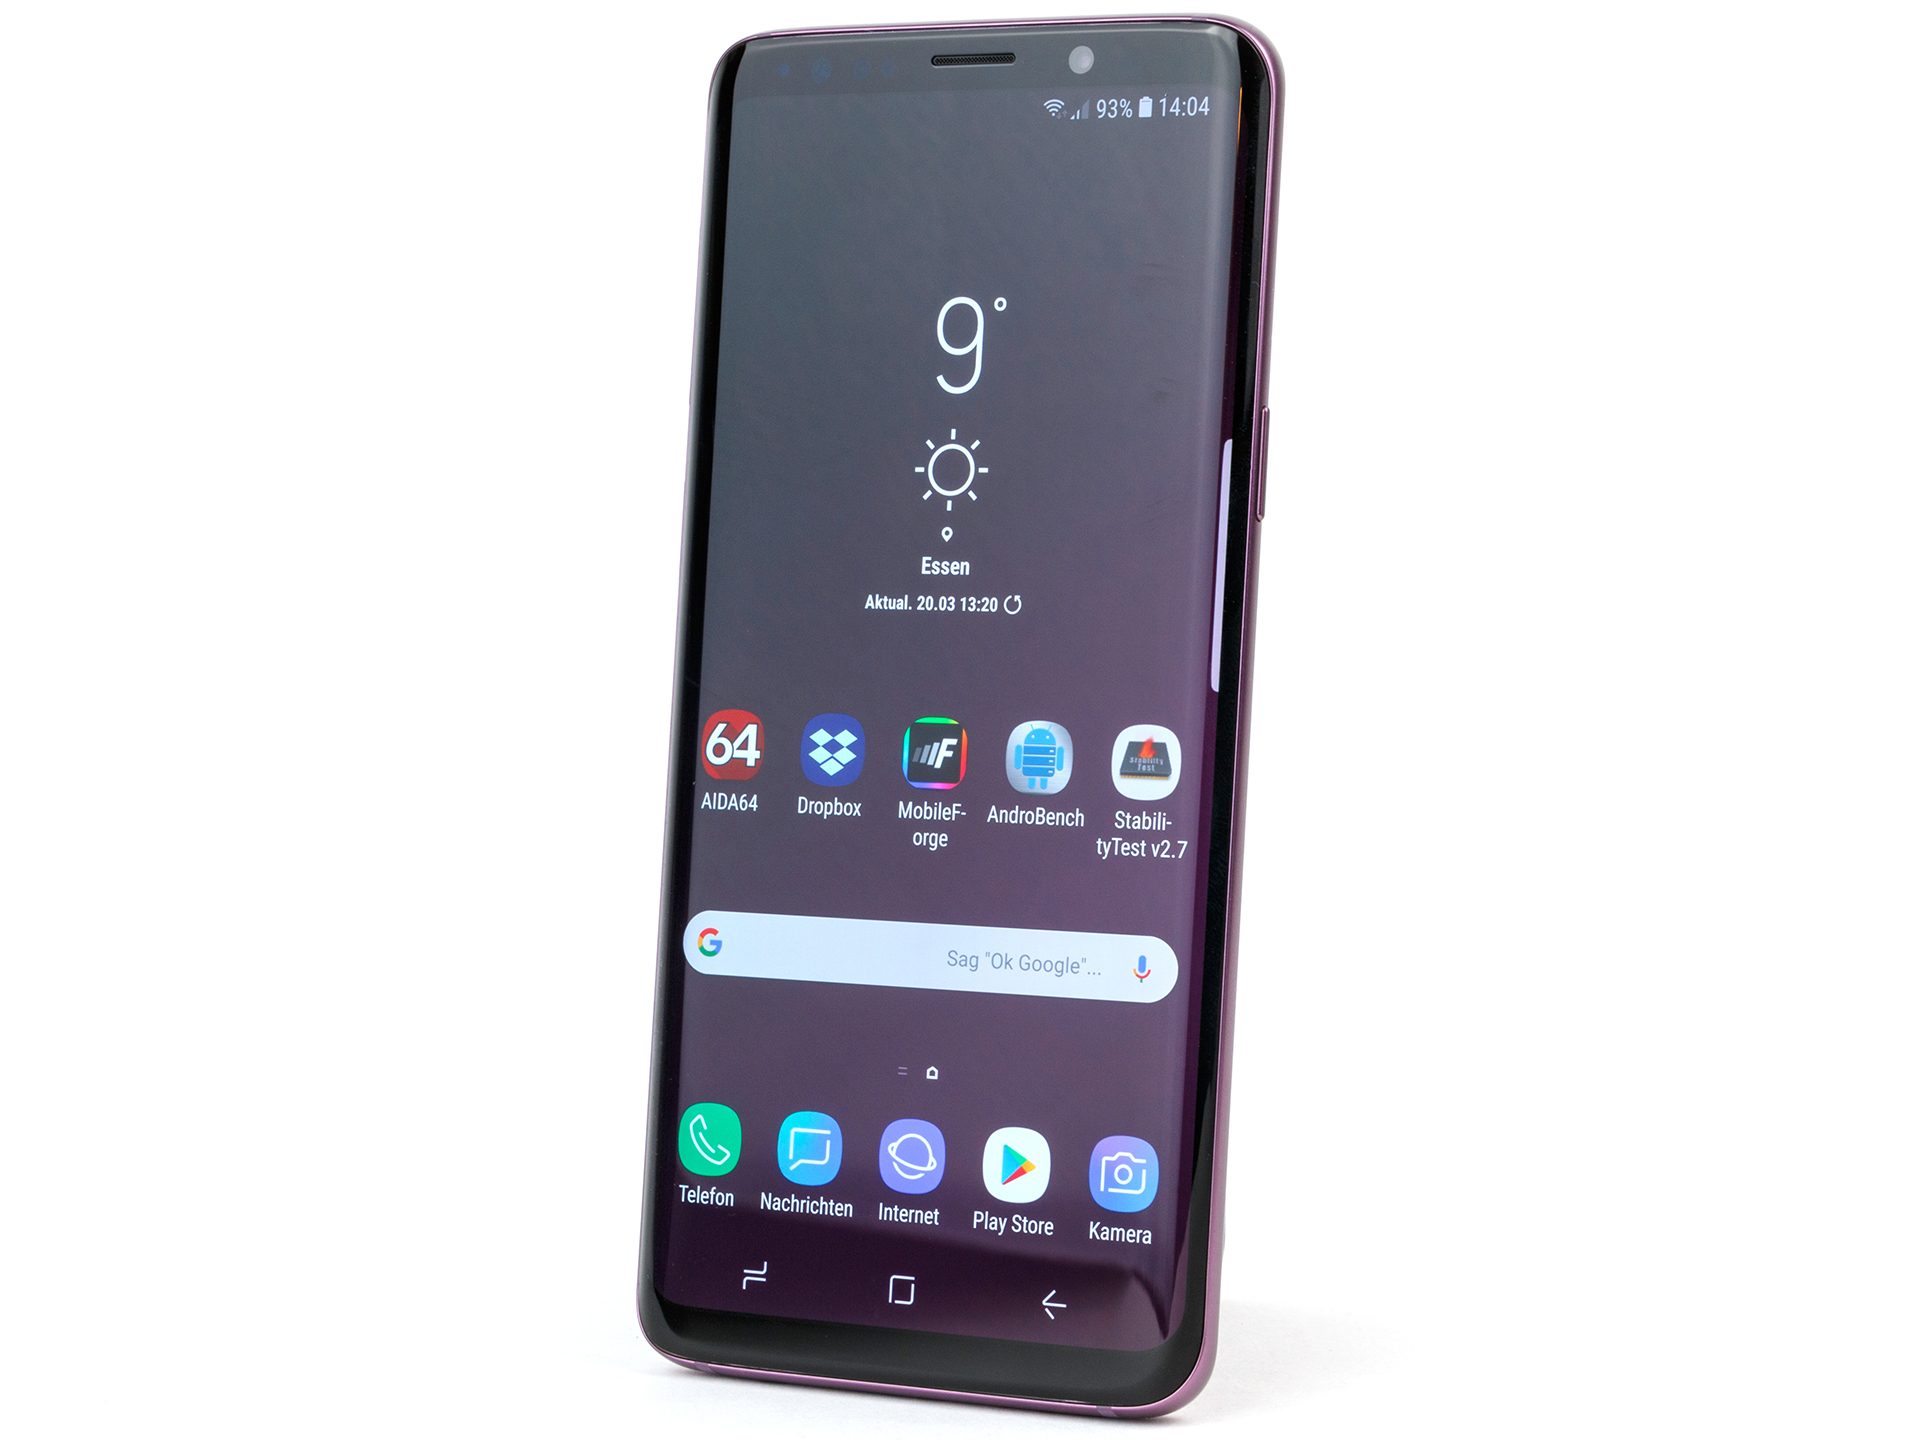
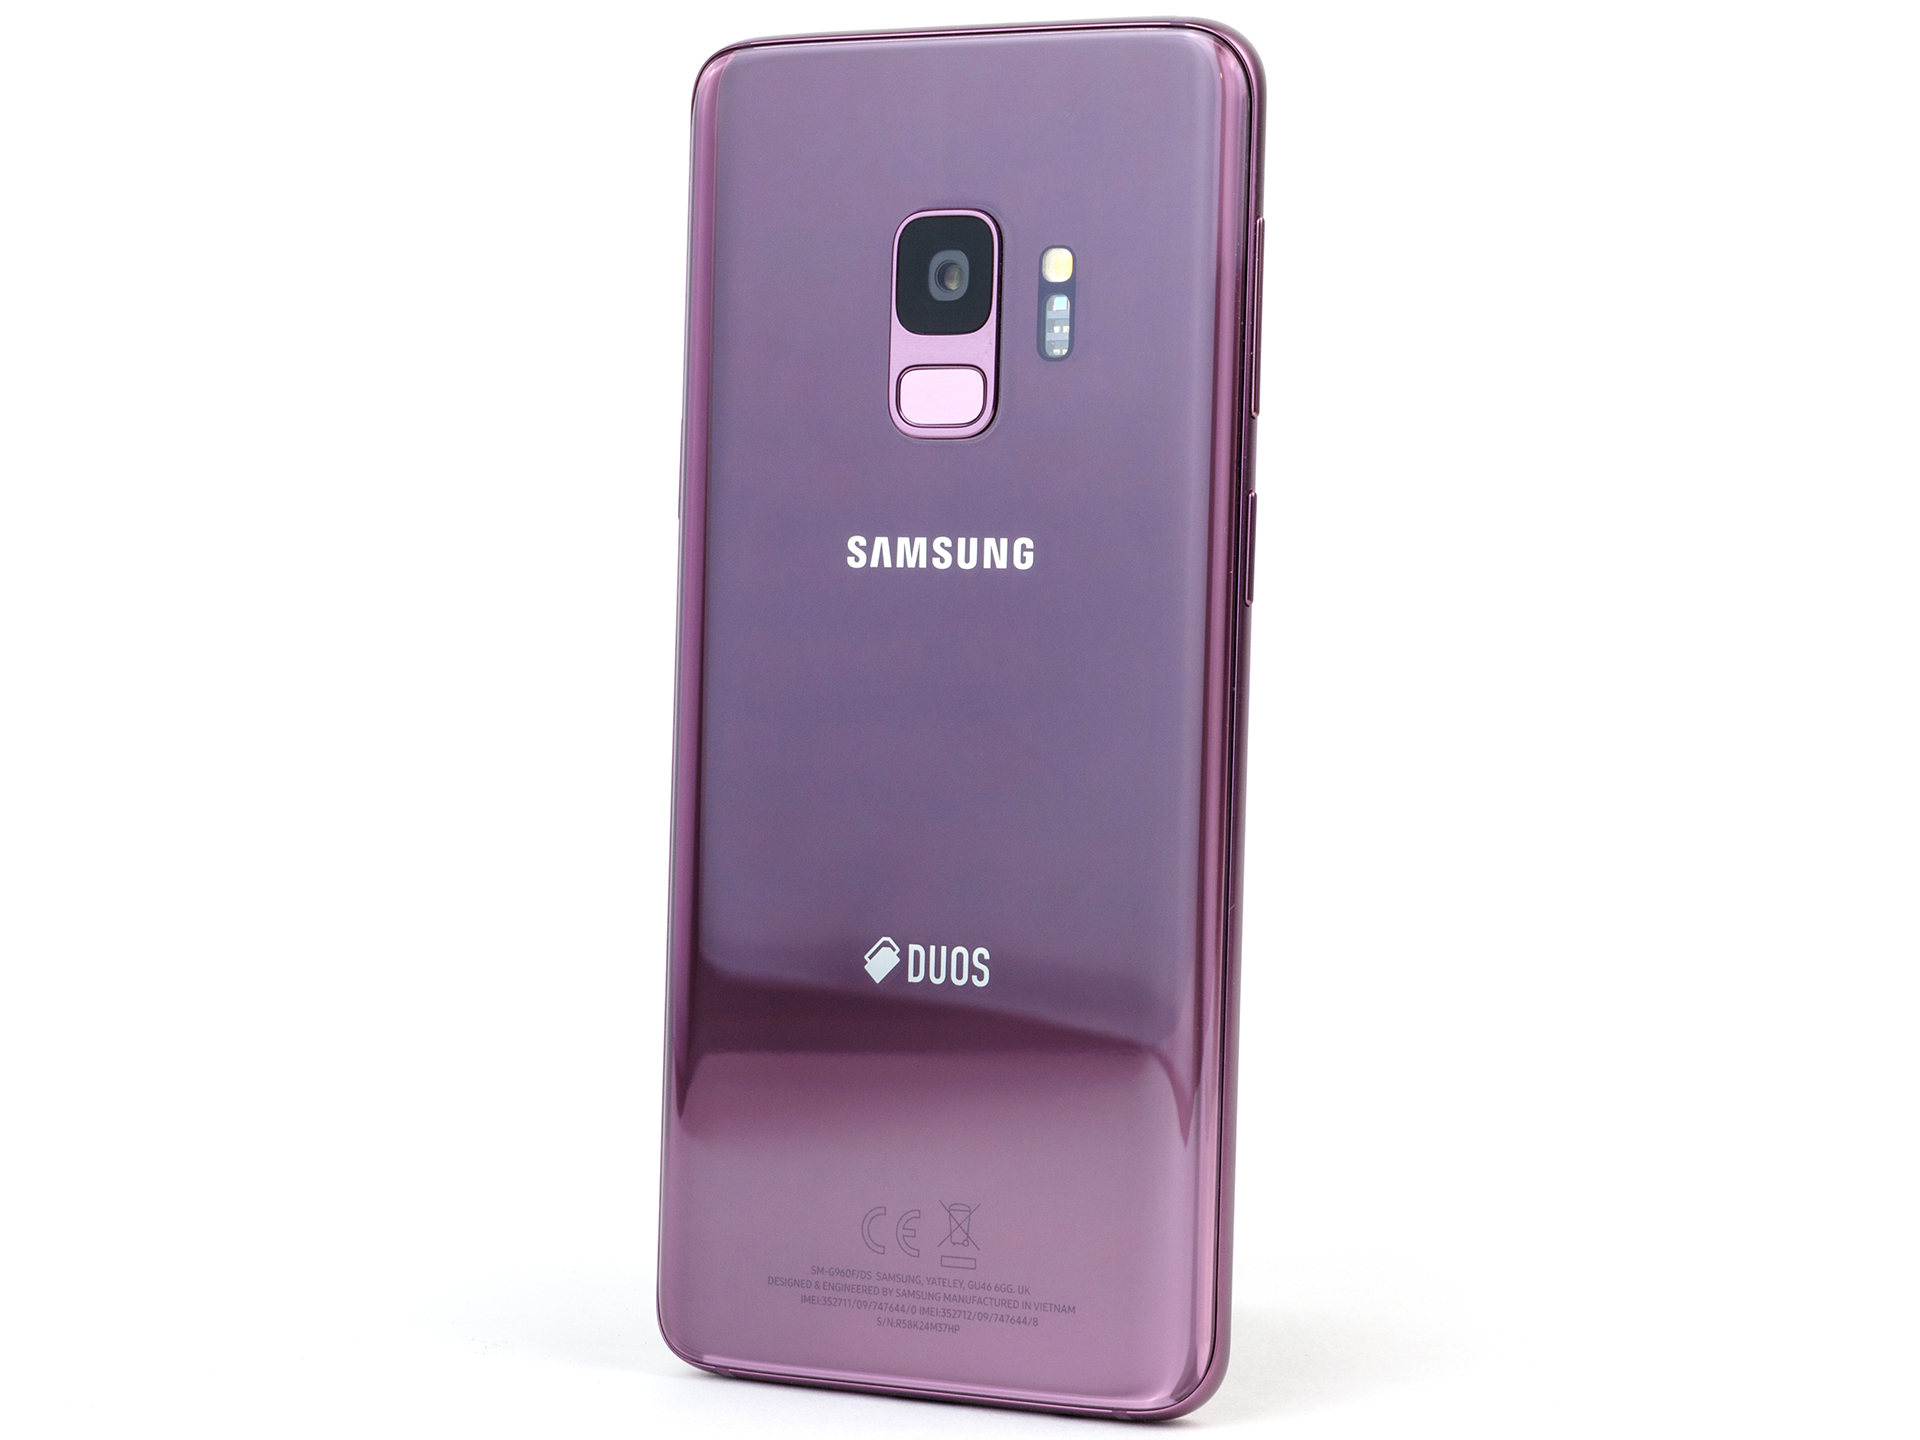
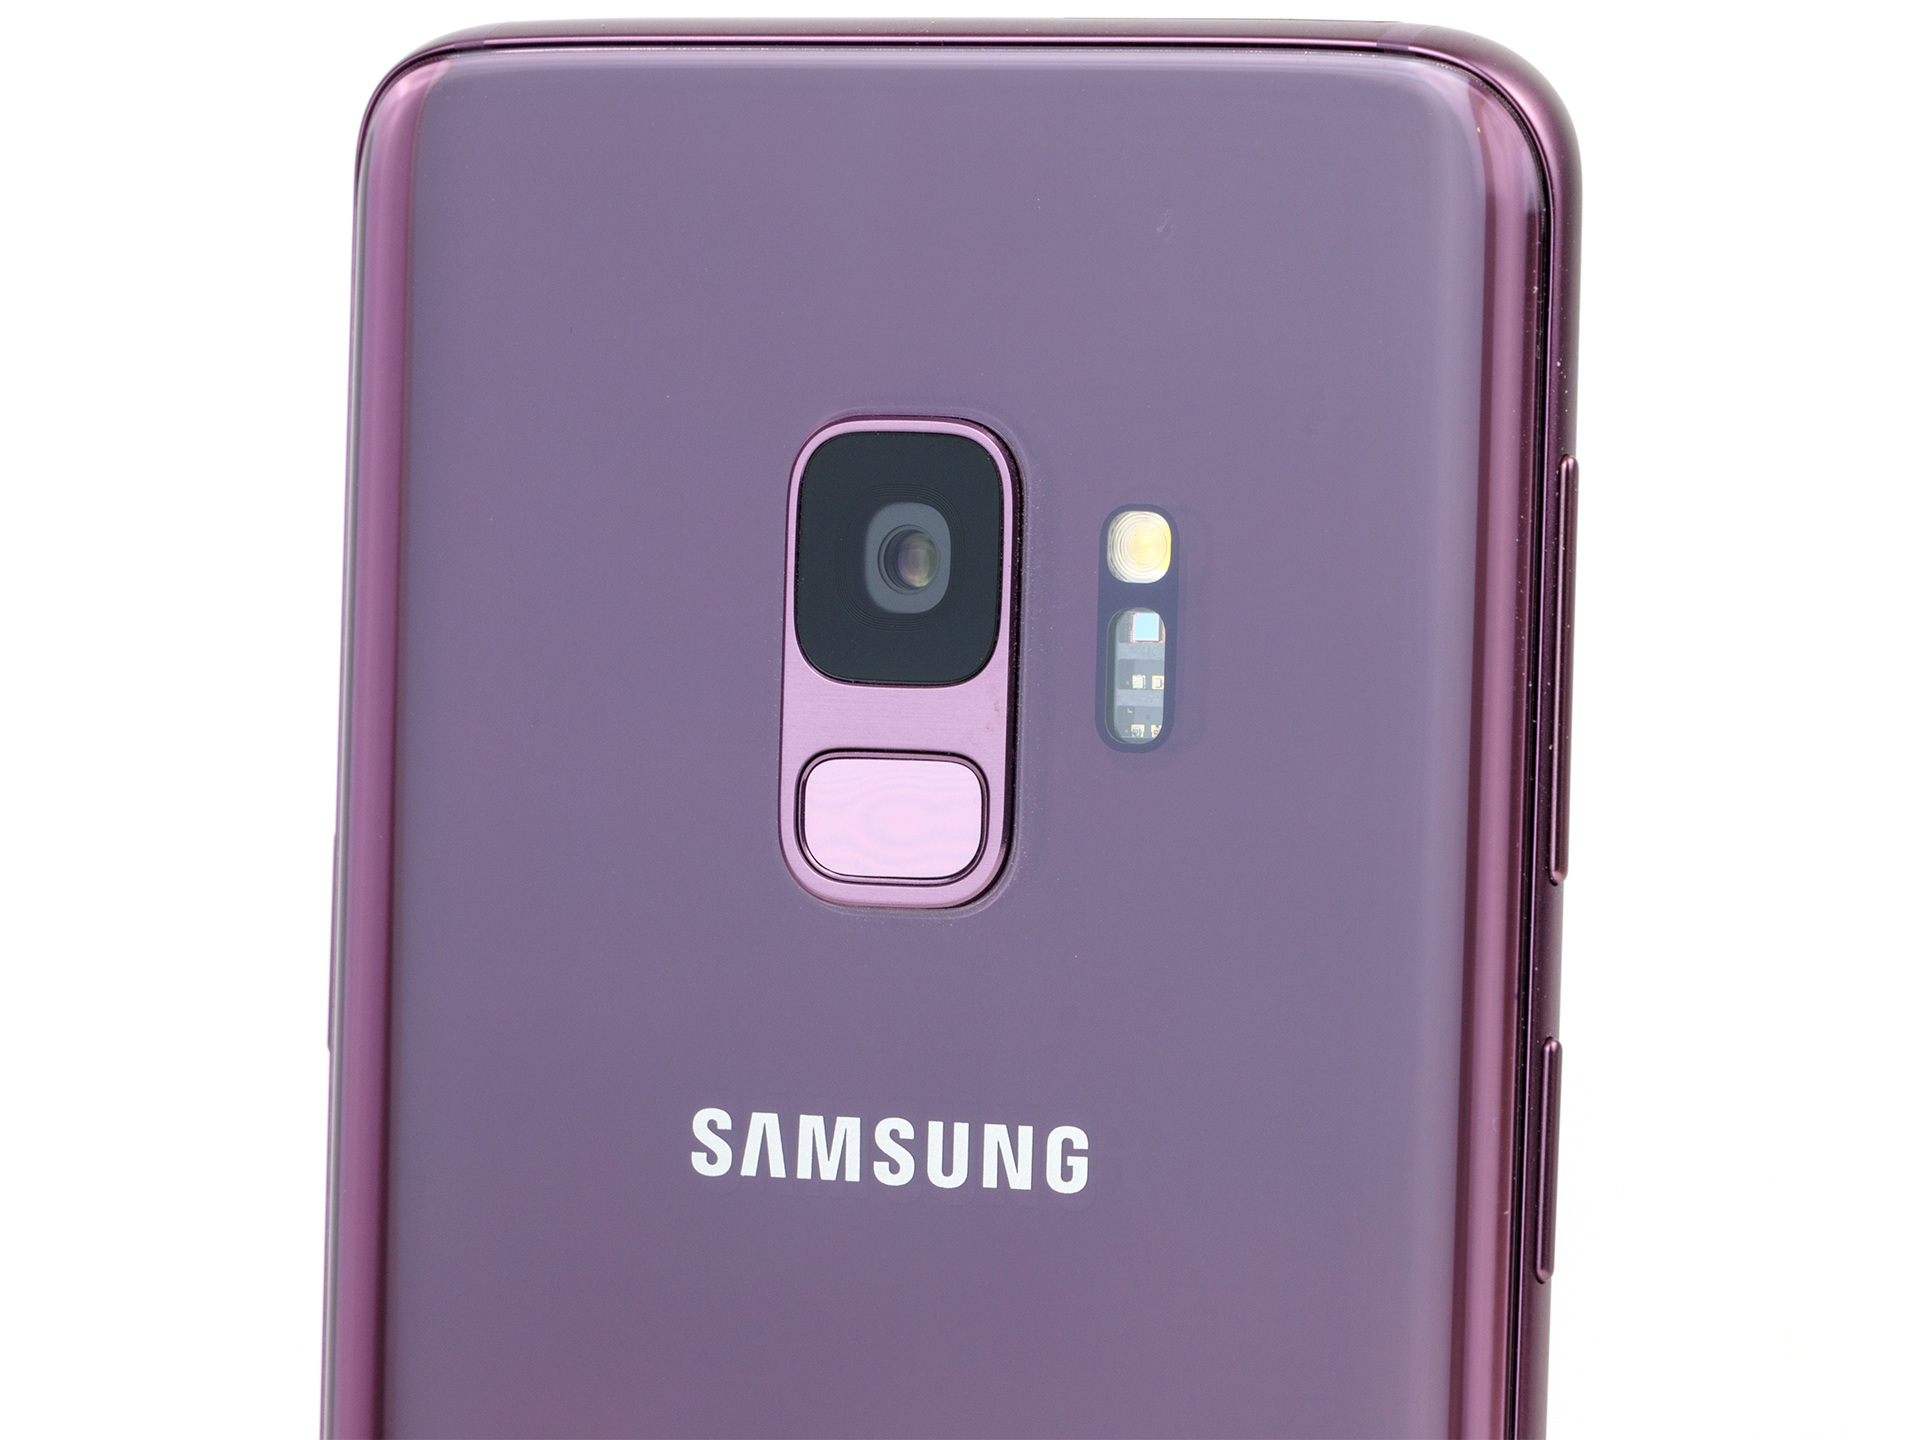
Kısa inceleme: Samsung Galaxy S9


| |||||||||||||||||||||||||
Aydınlatma: 96 %
Batarya modunda parlaklık: 529 cd/m²
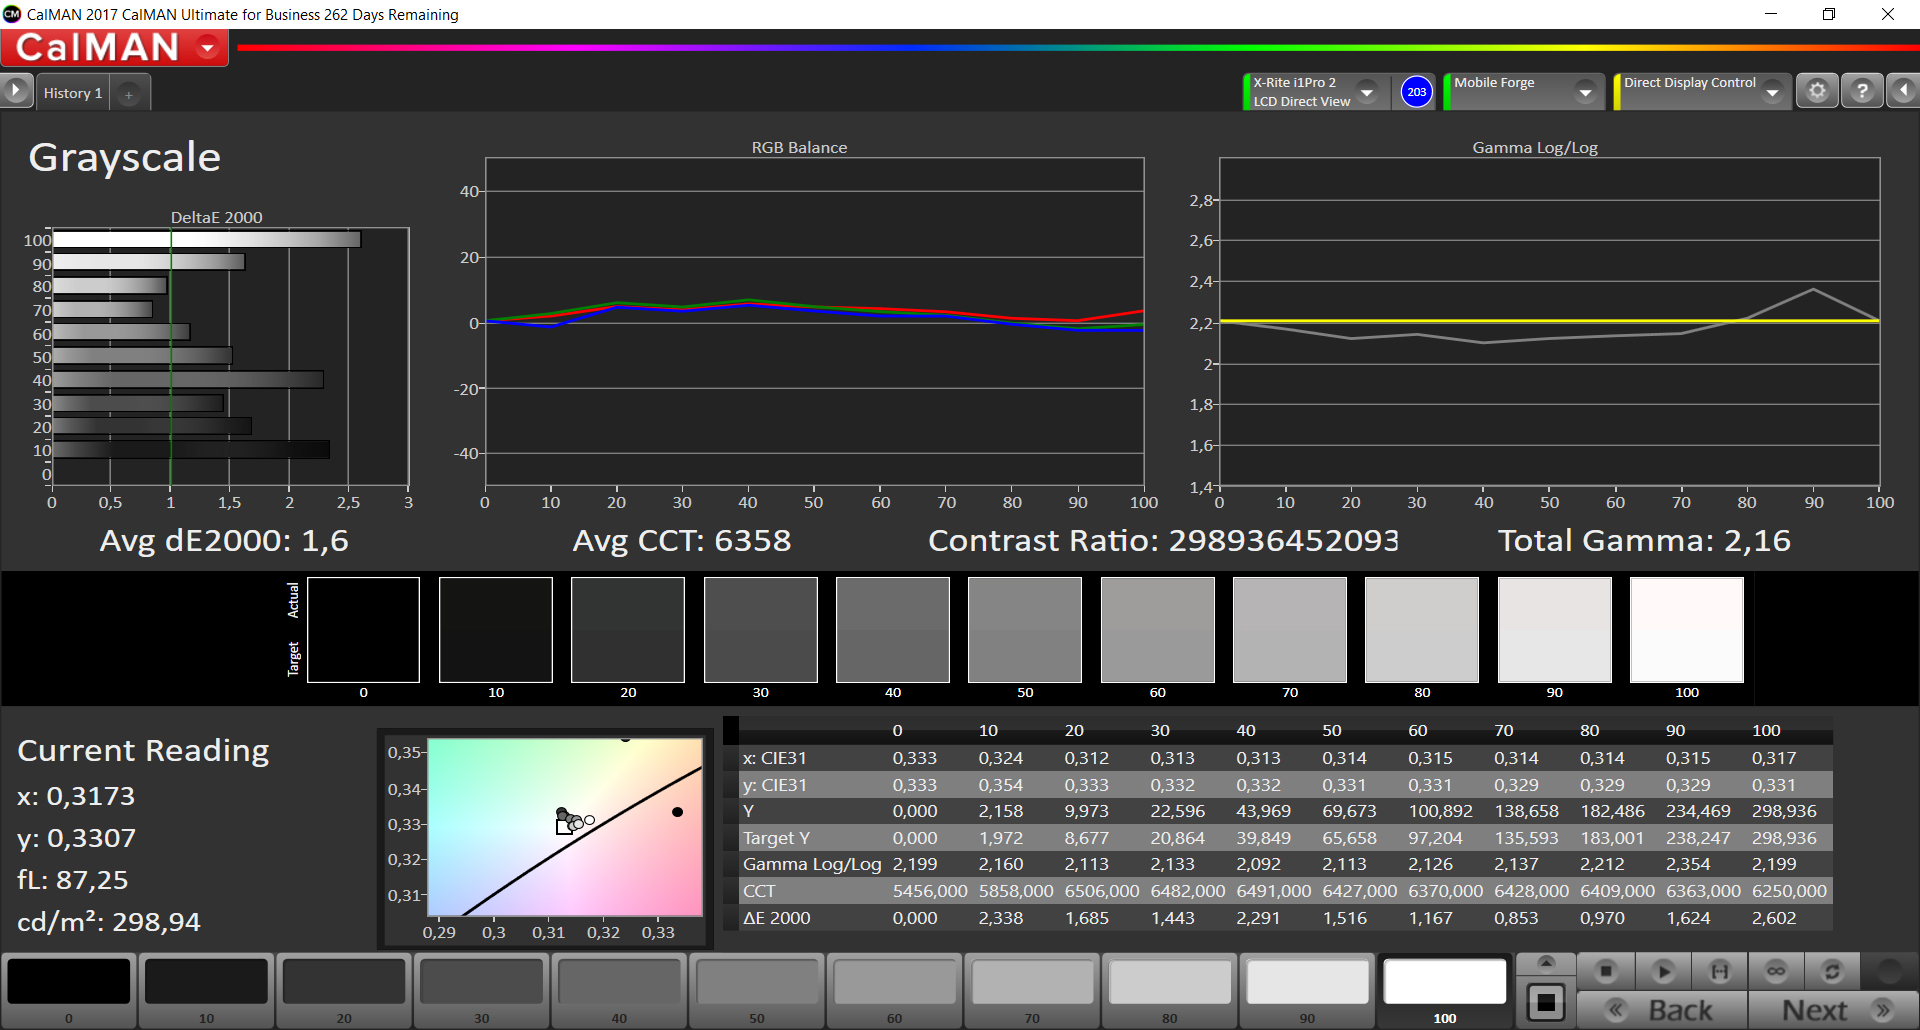
Kontrast: ∞:1 (Siyah: 0 cd/m²)
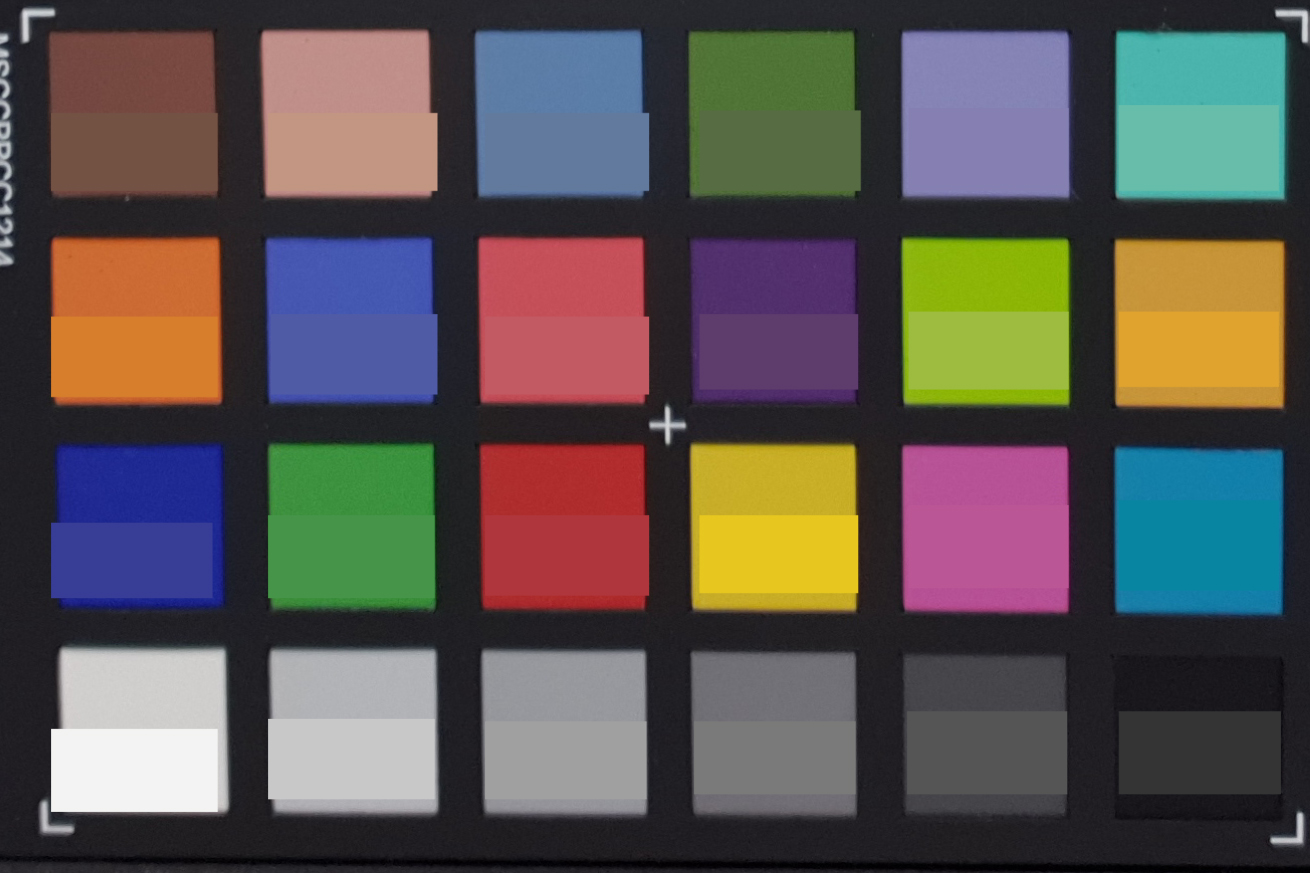
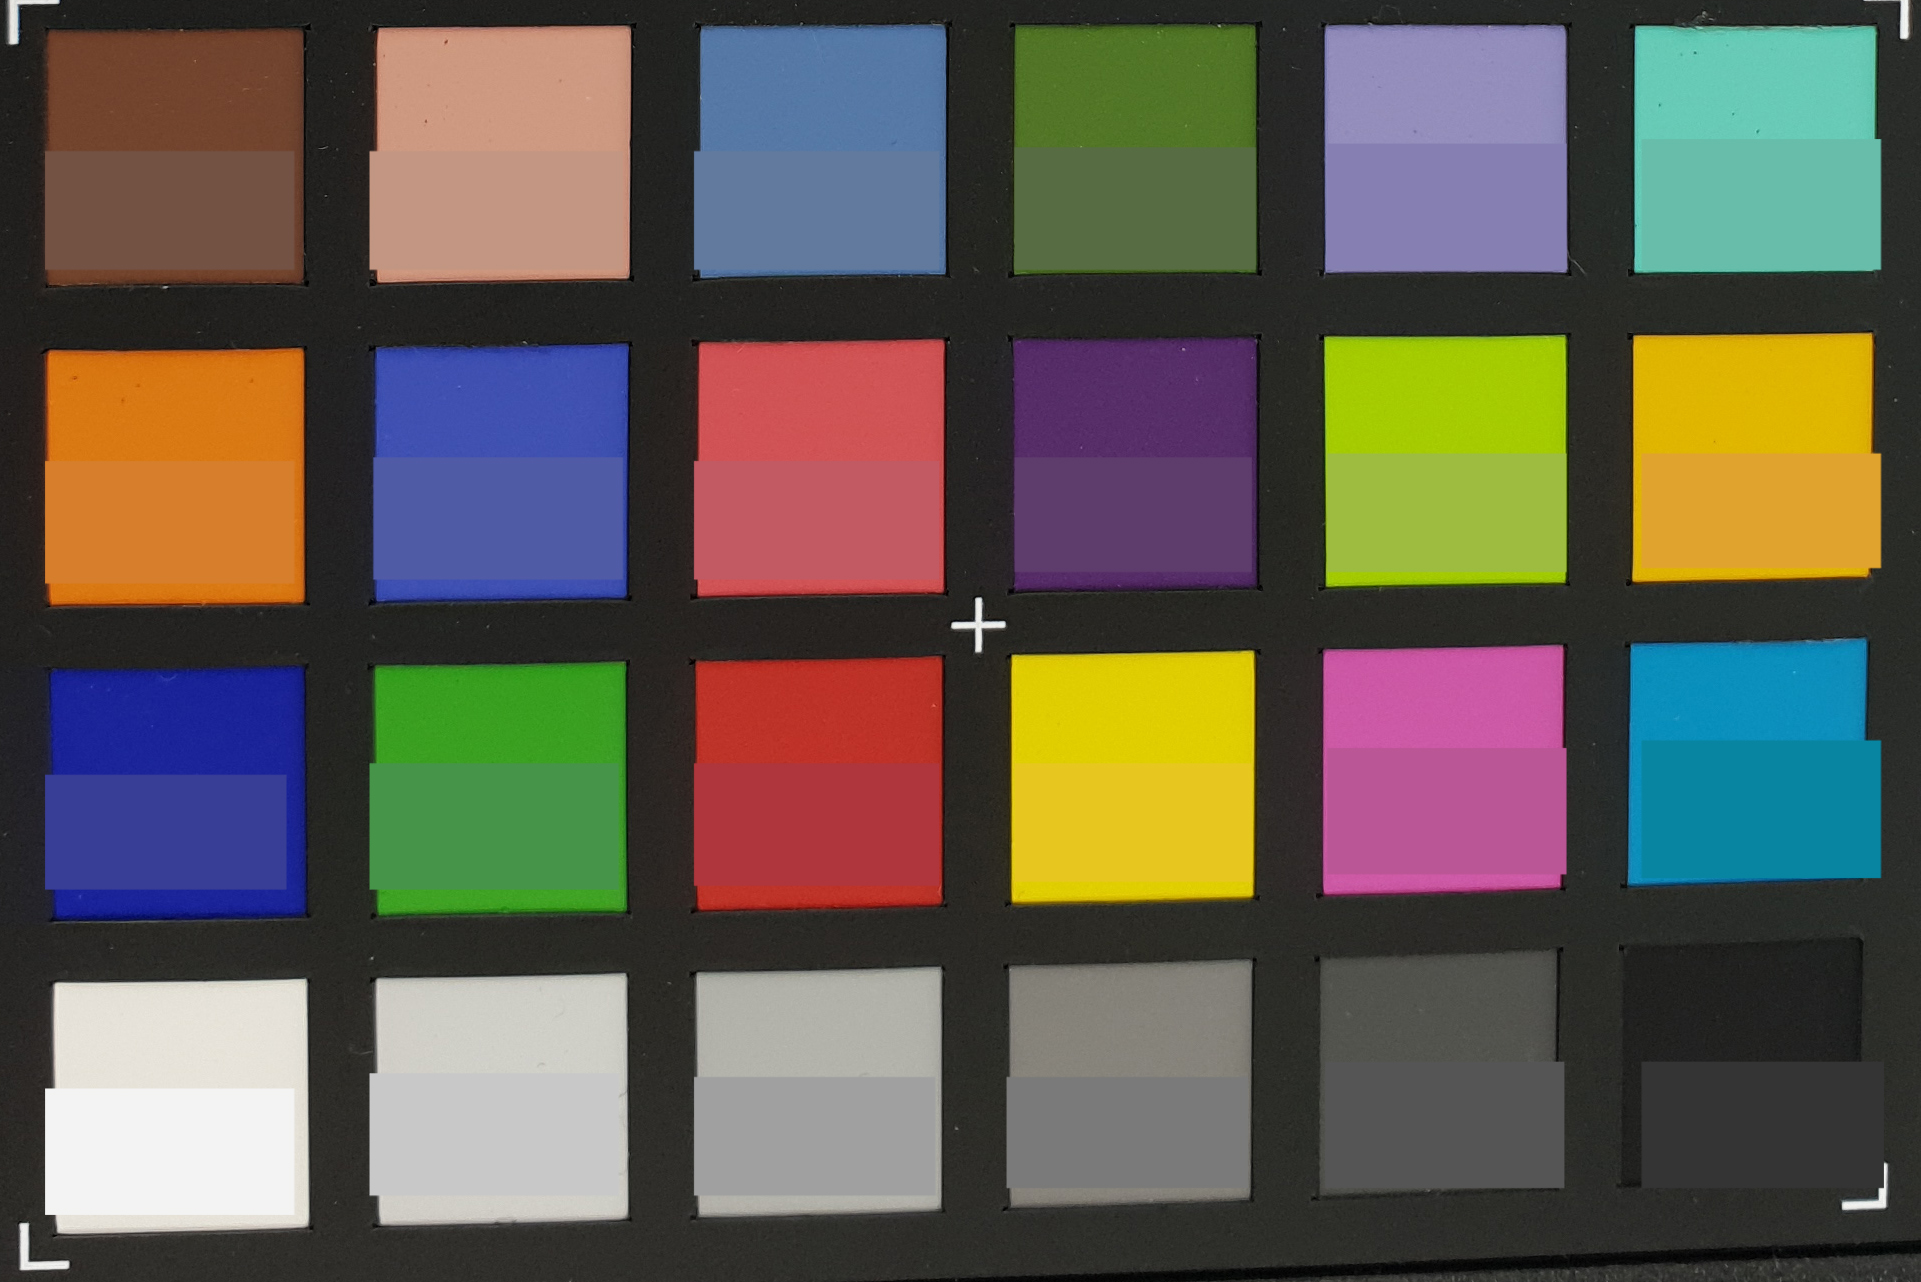
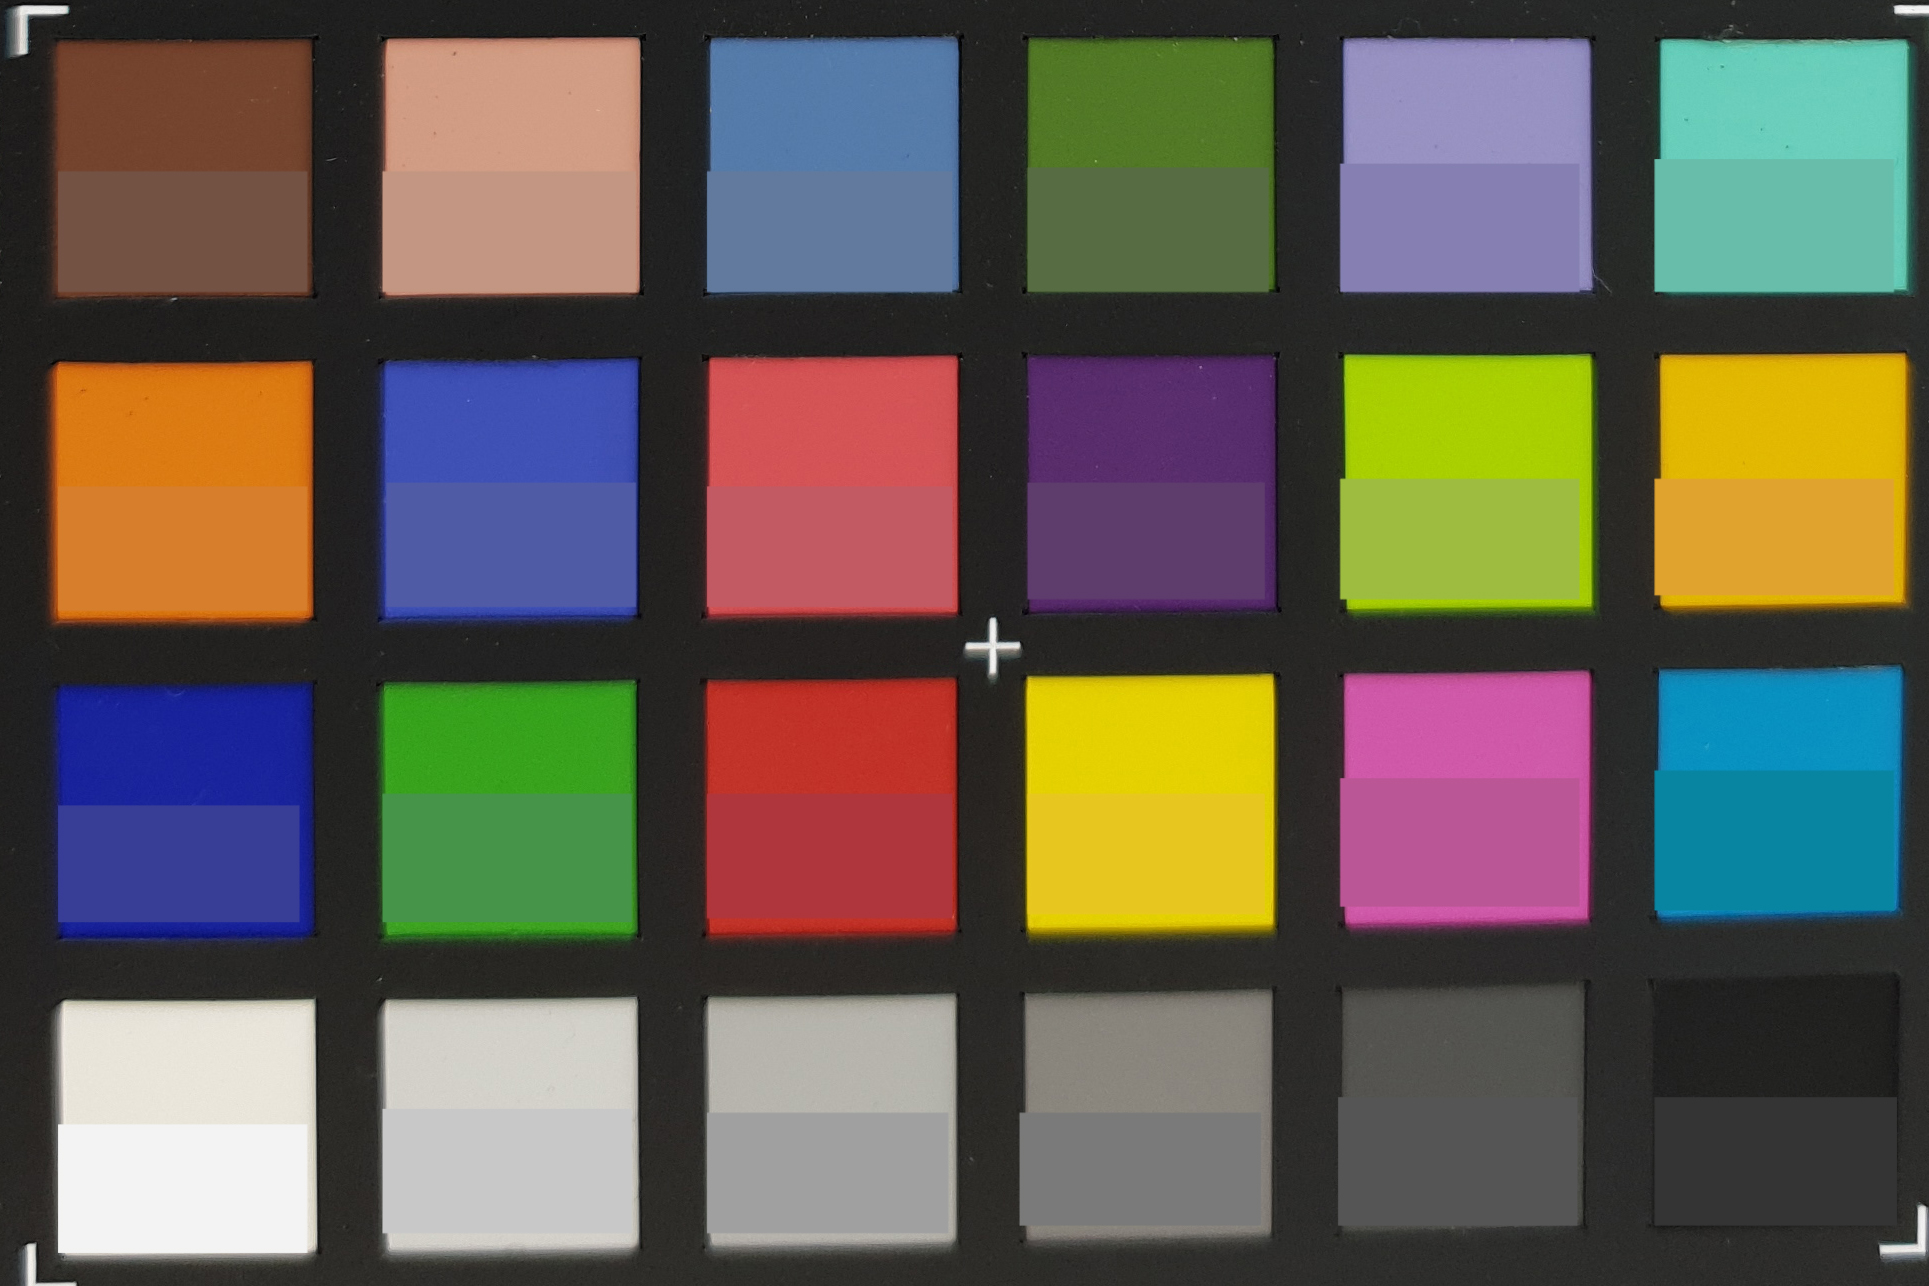
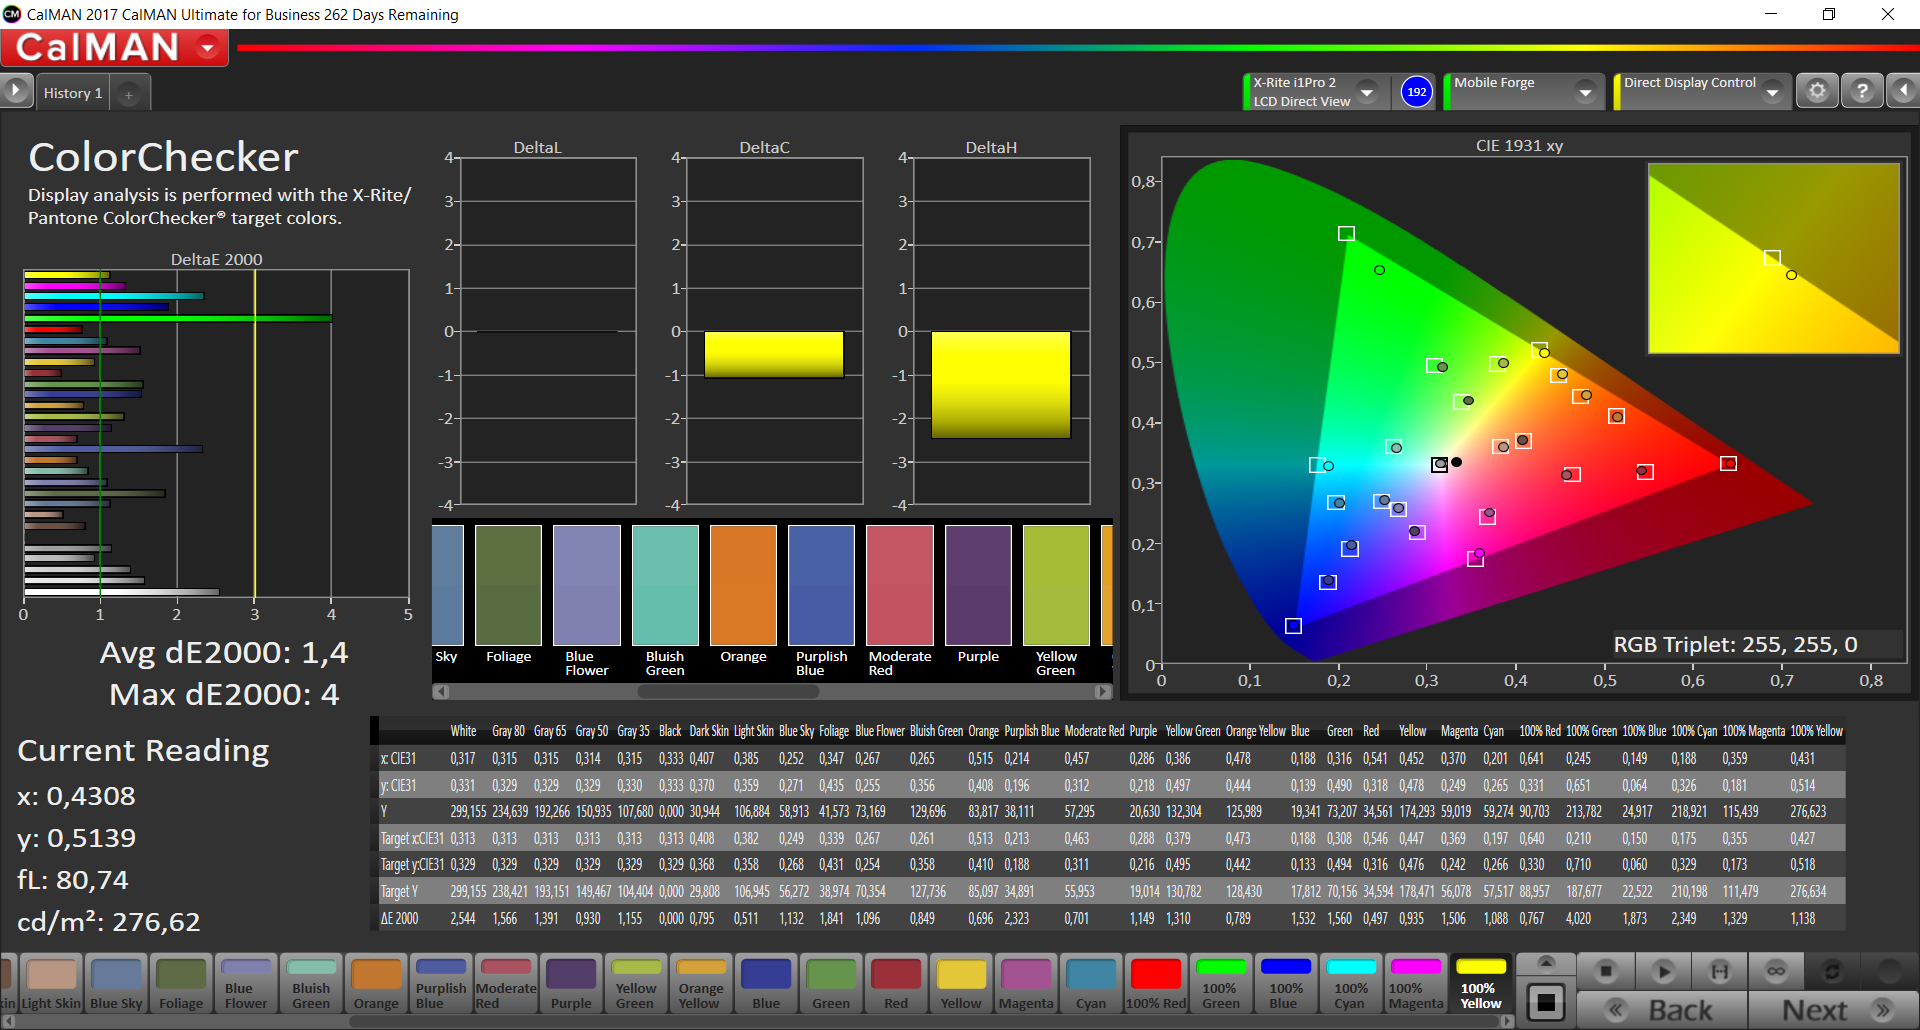
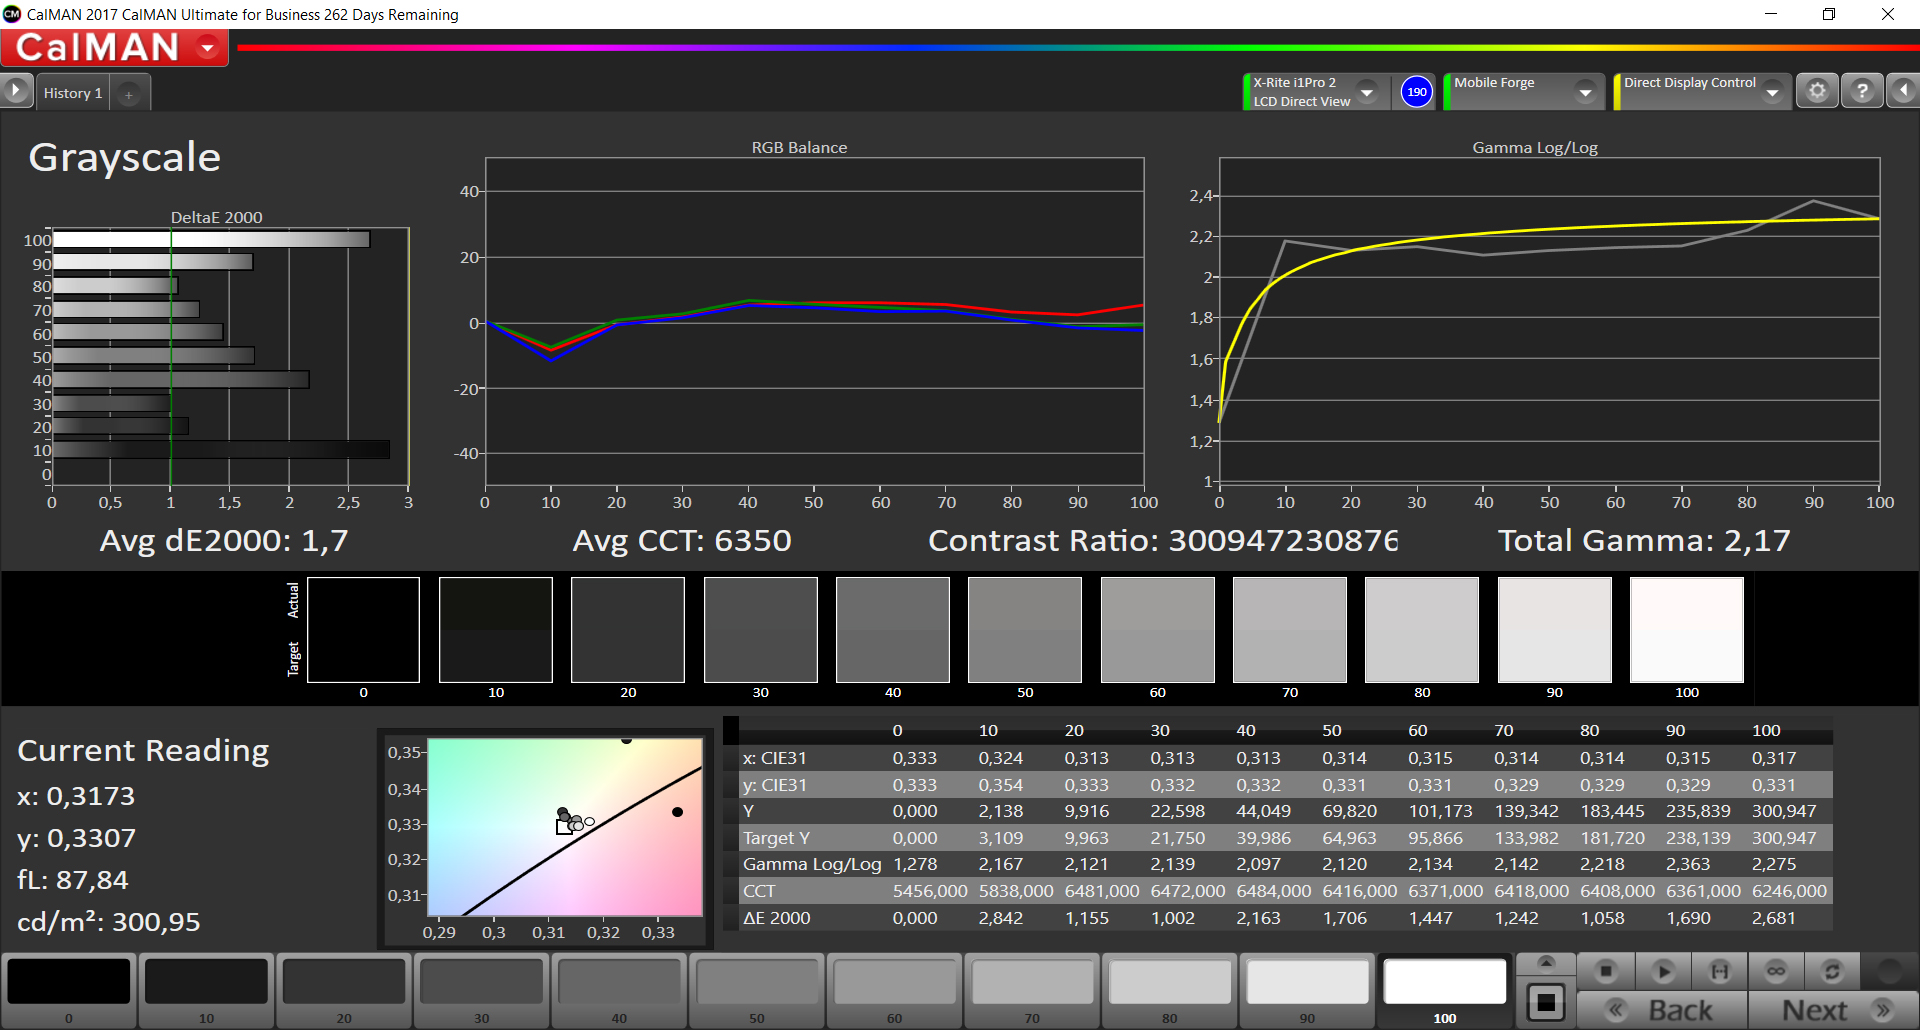
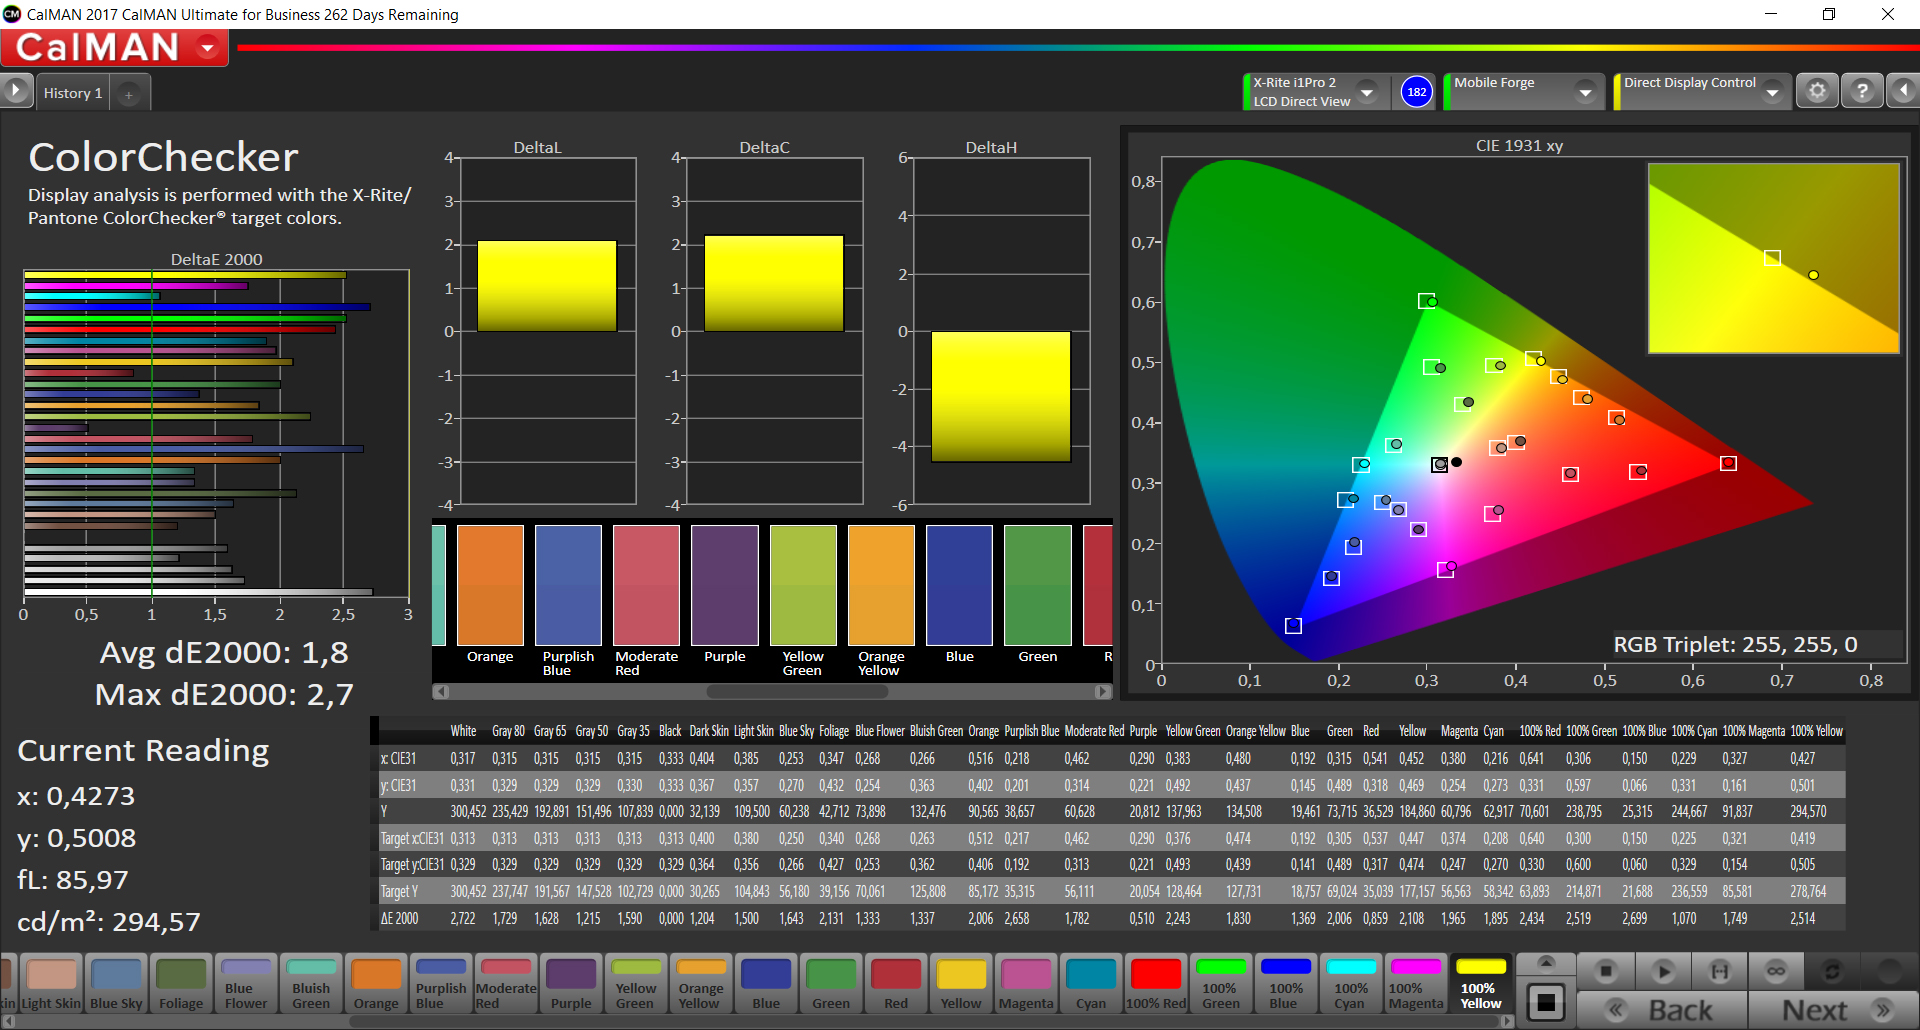
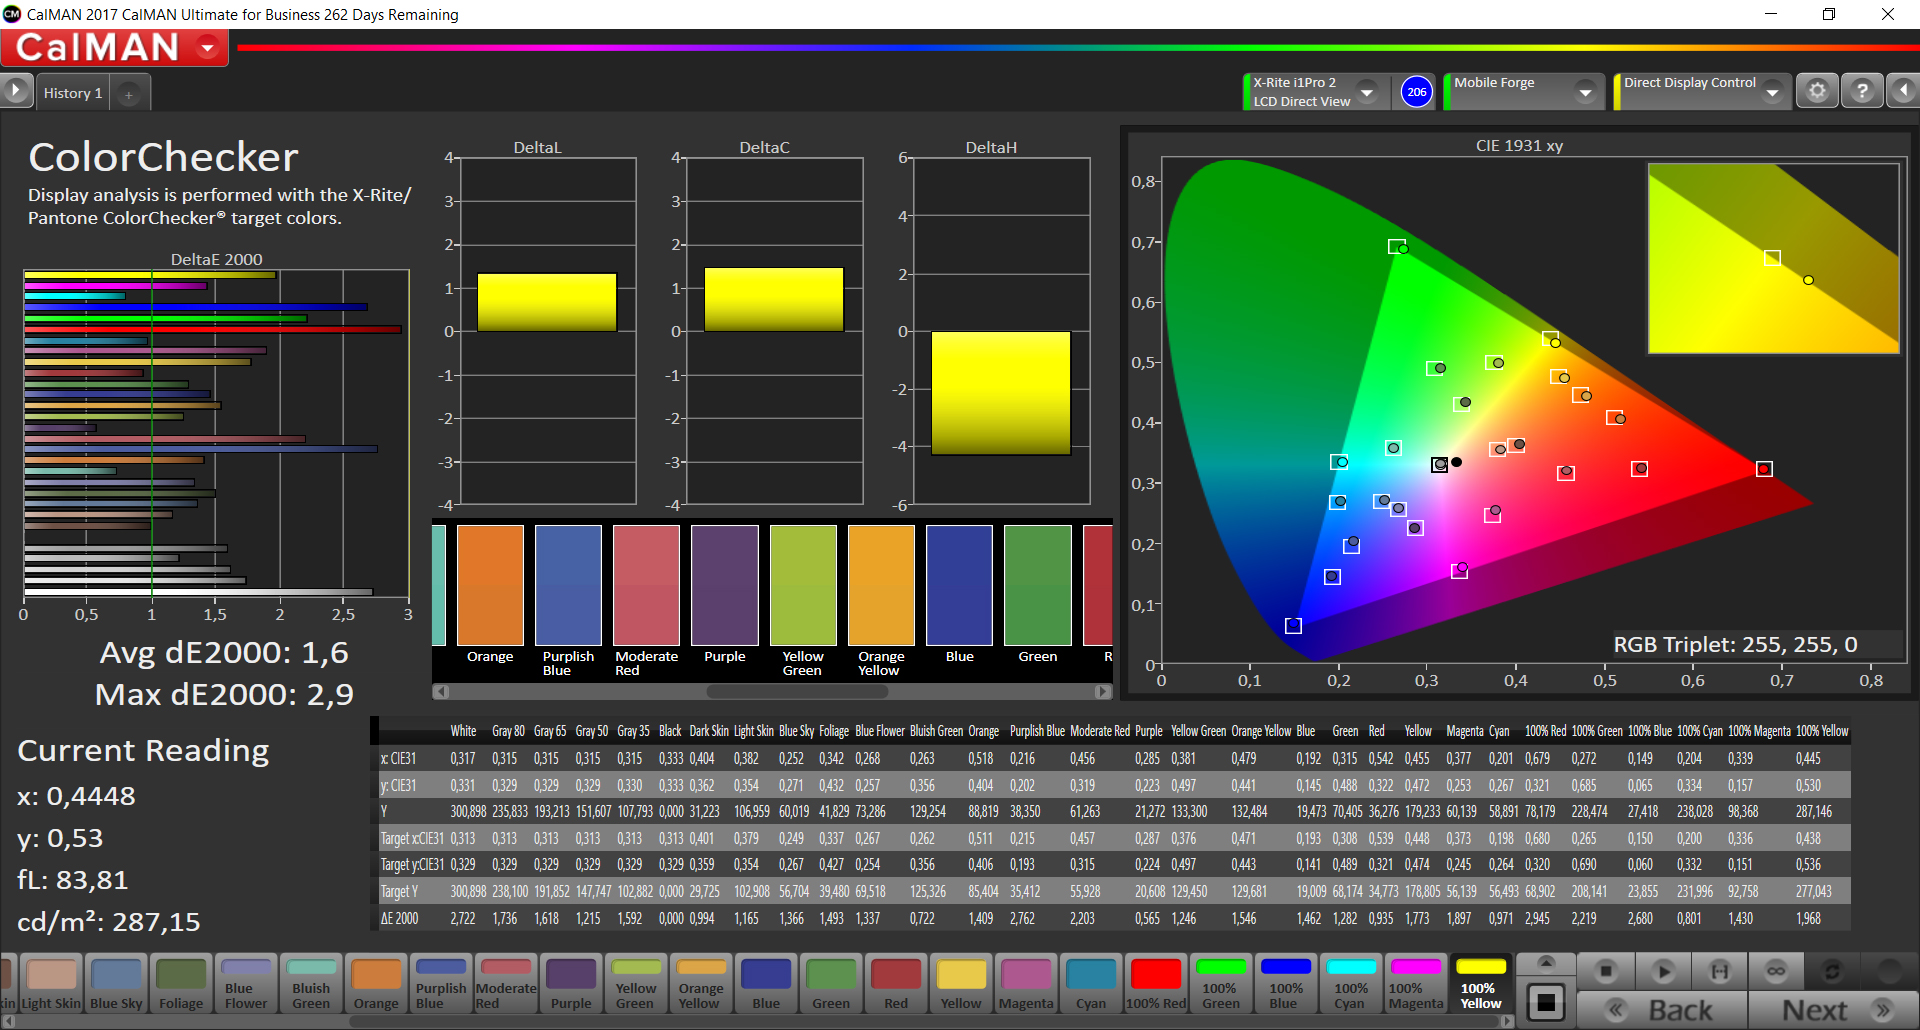
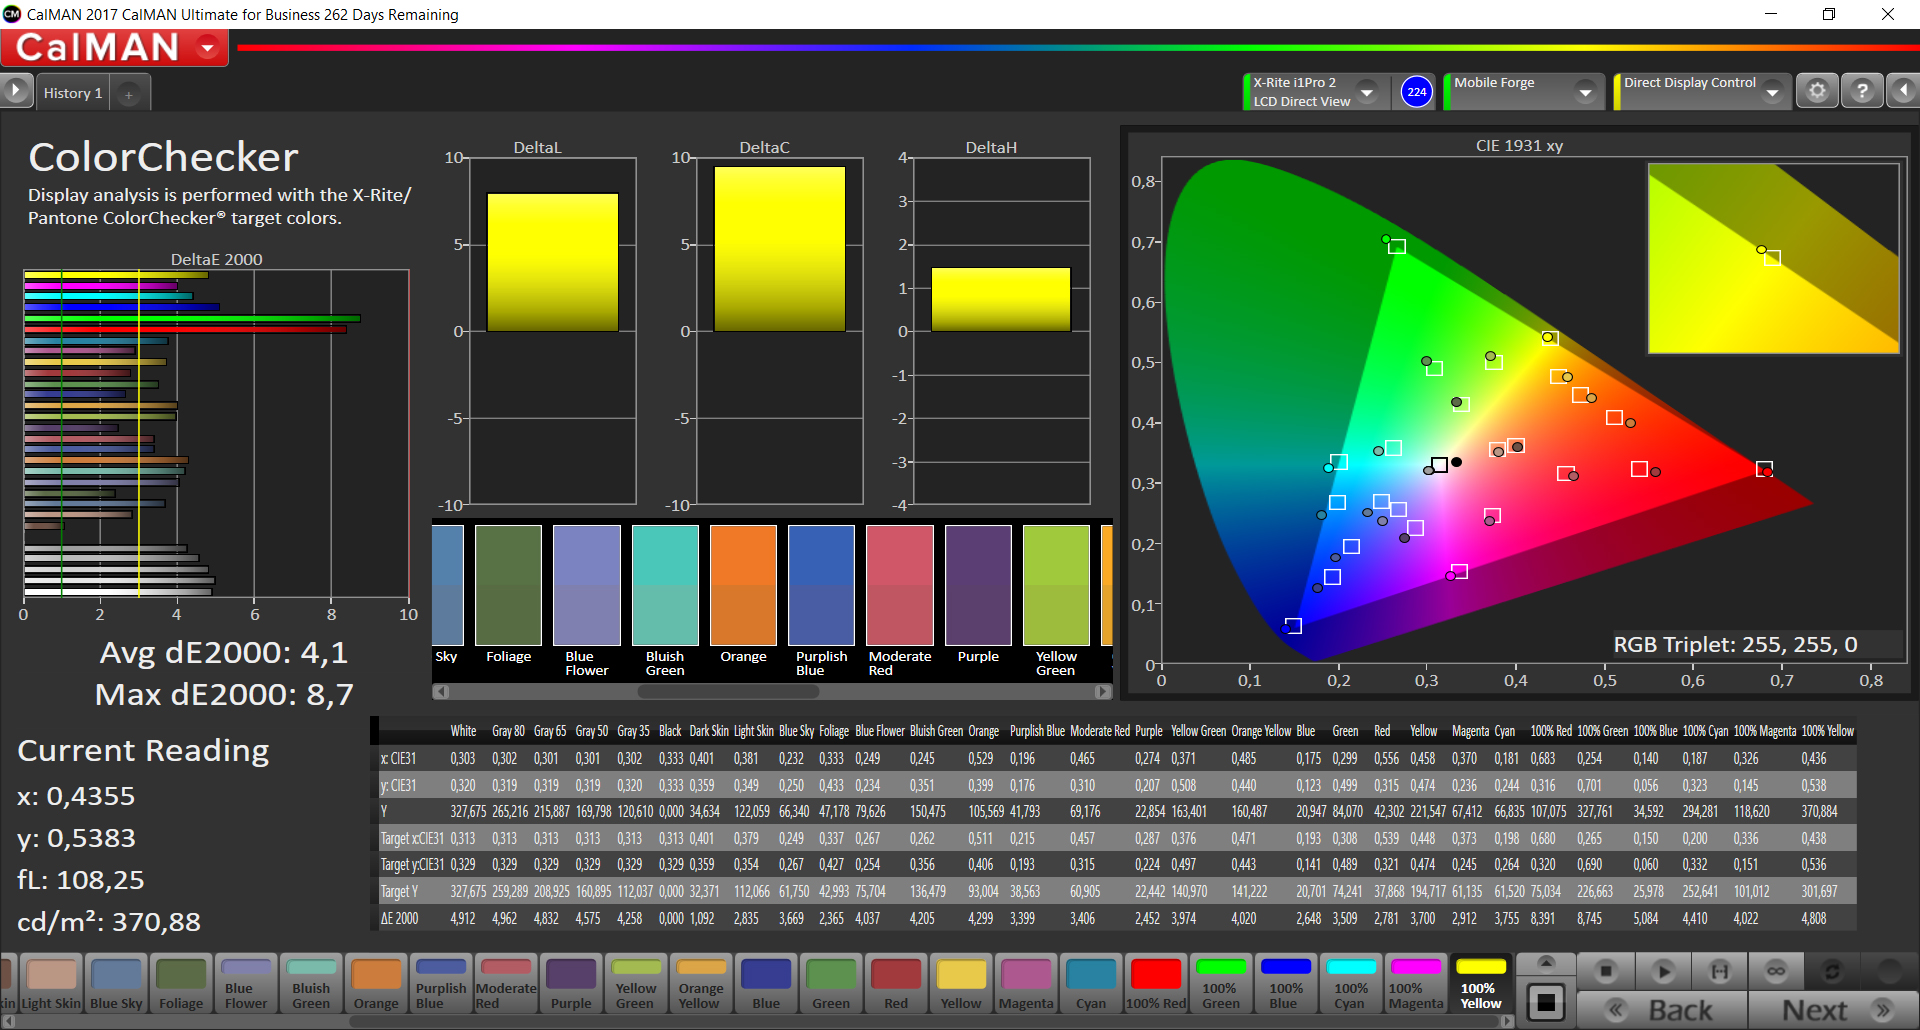
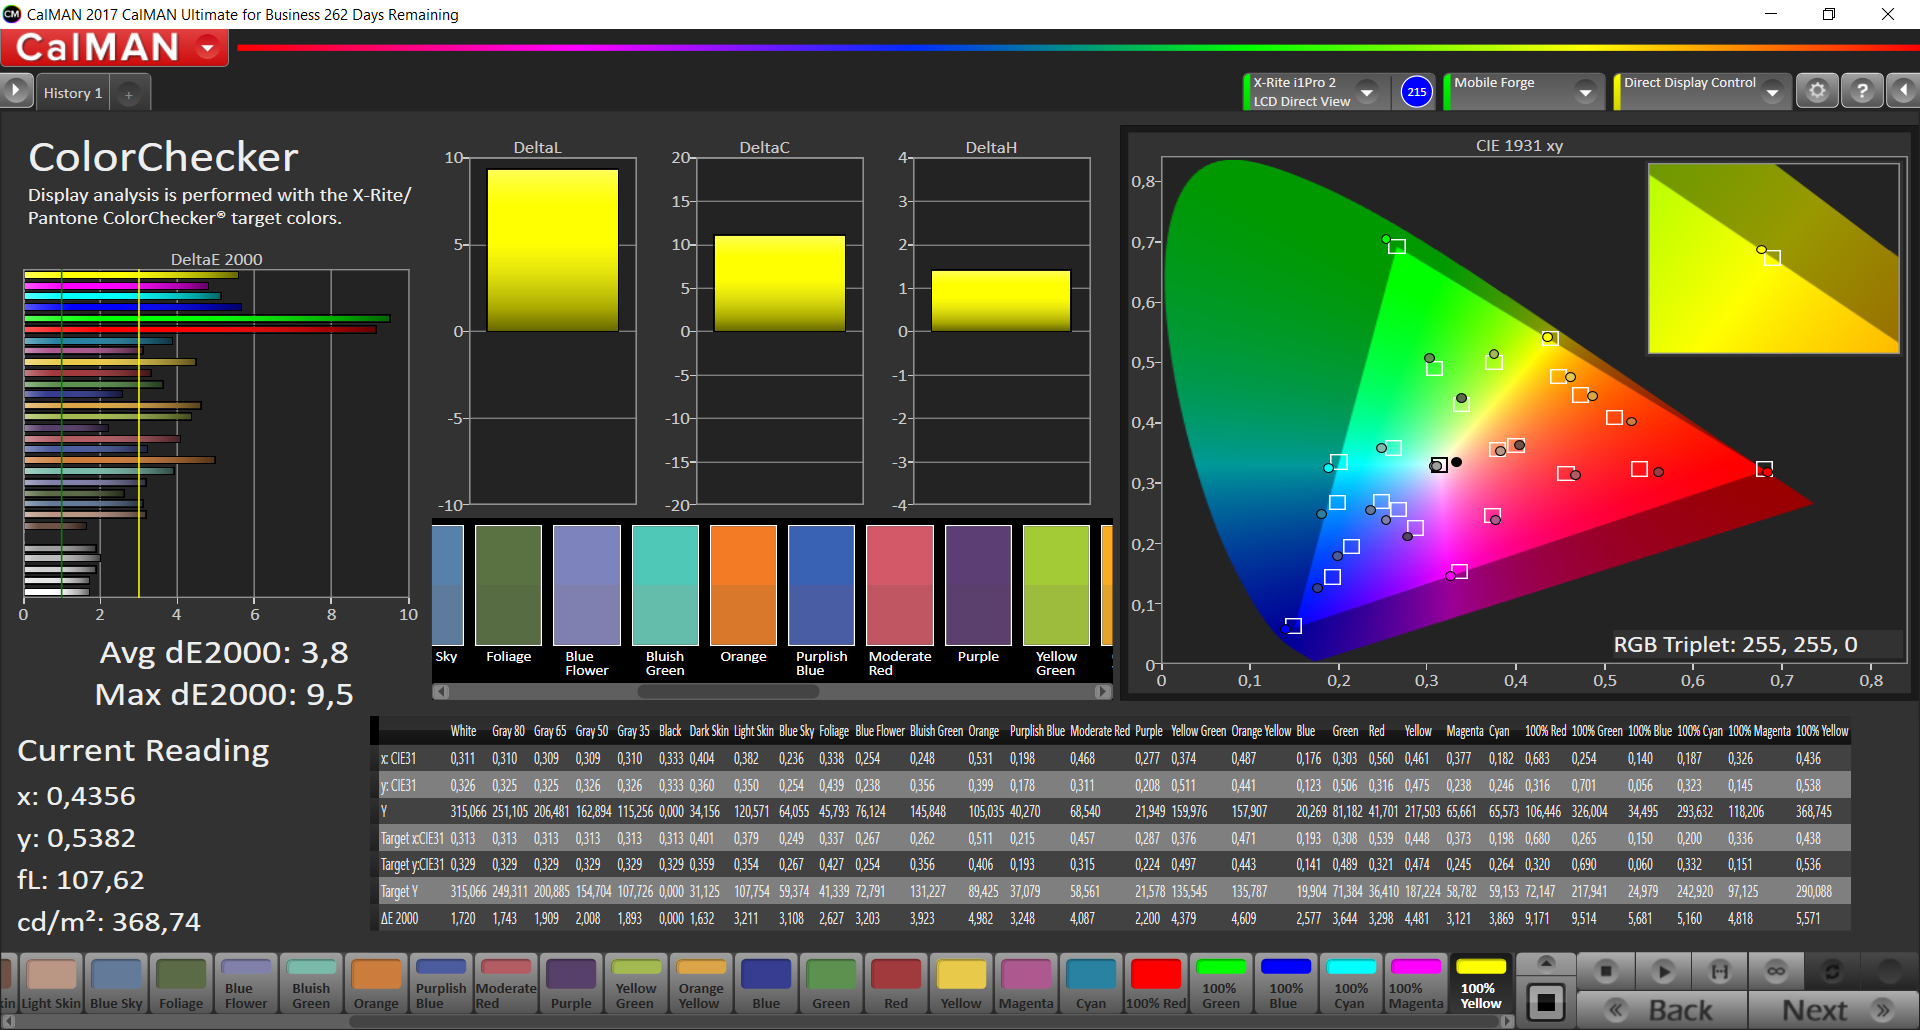
ΔE Color 1.4 | 0.5-29.43 Ø5
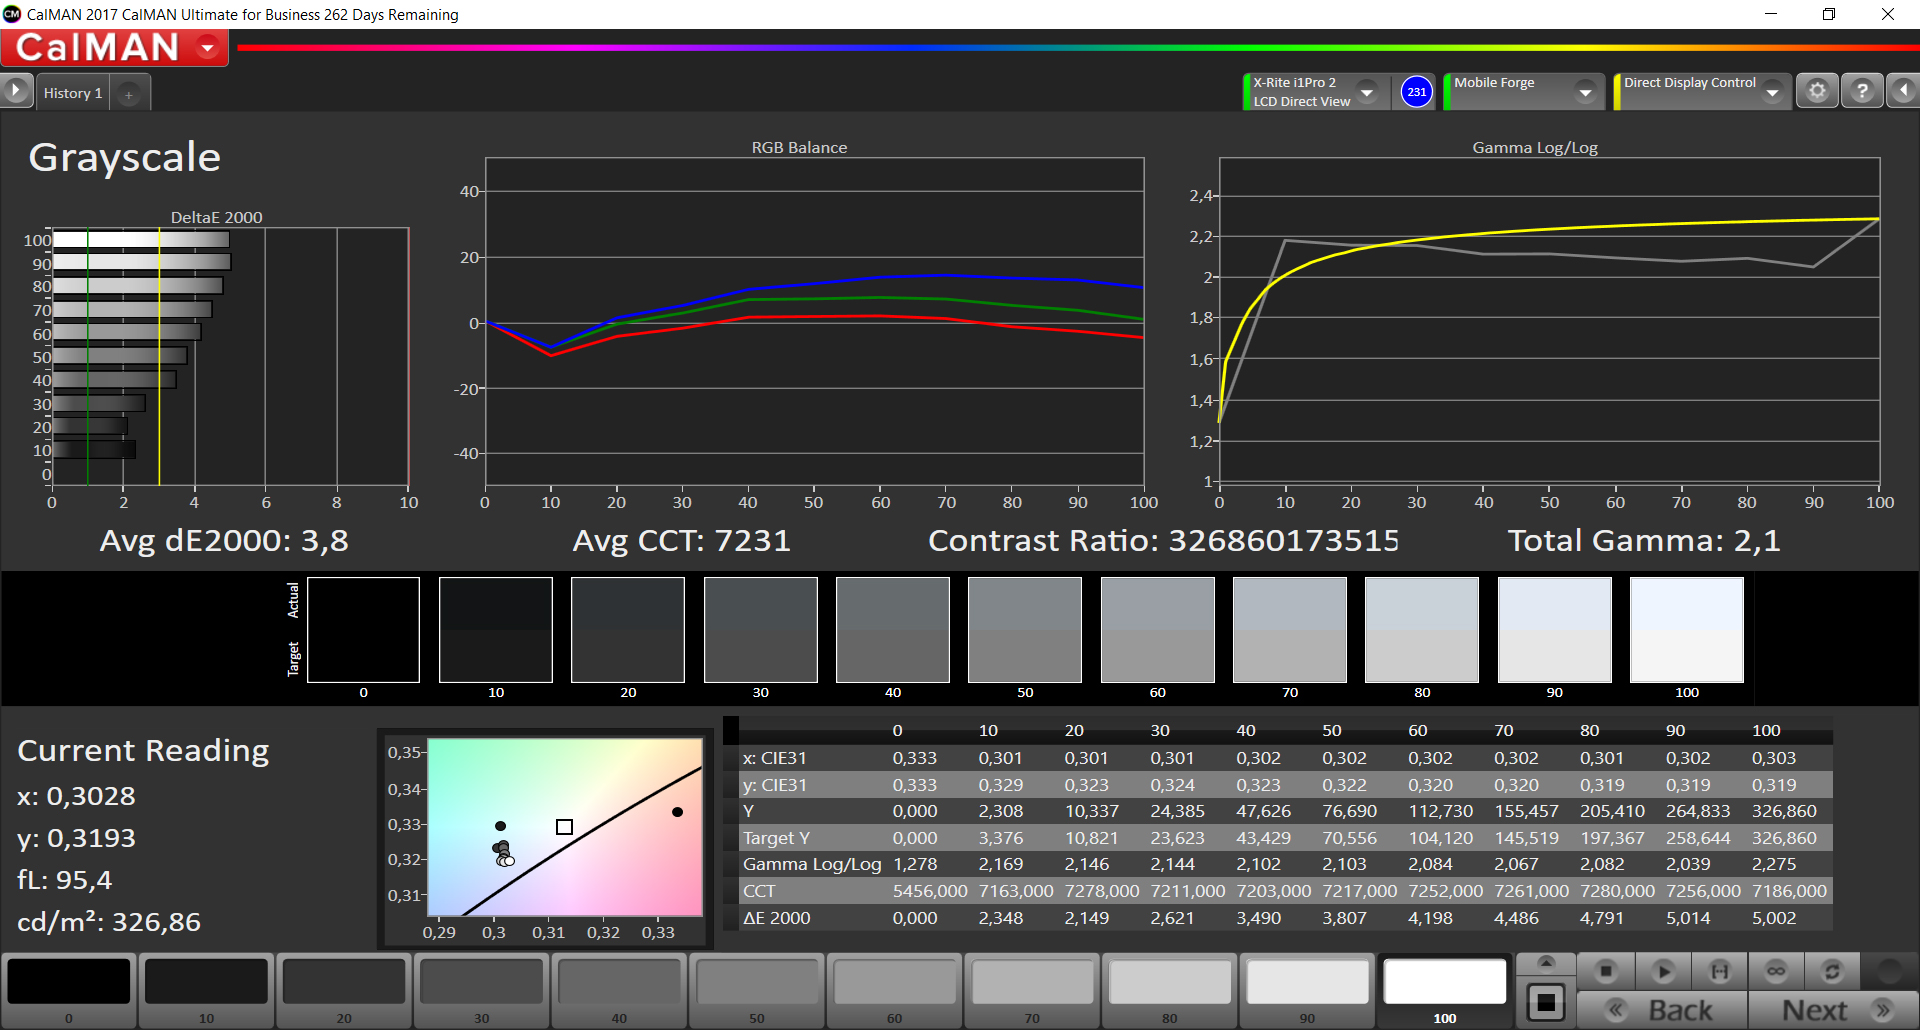
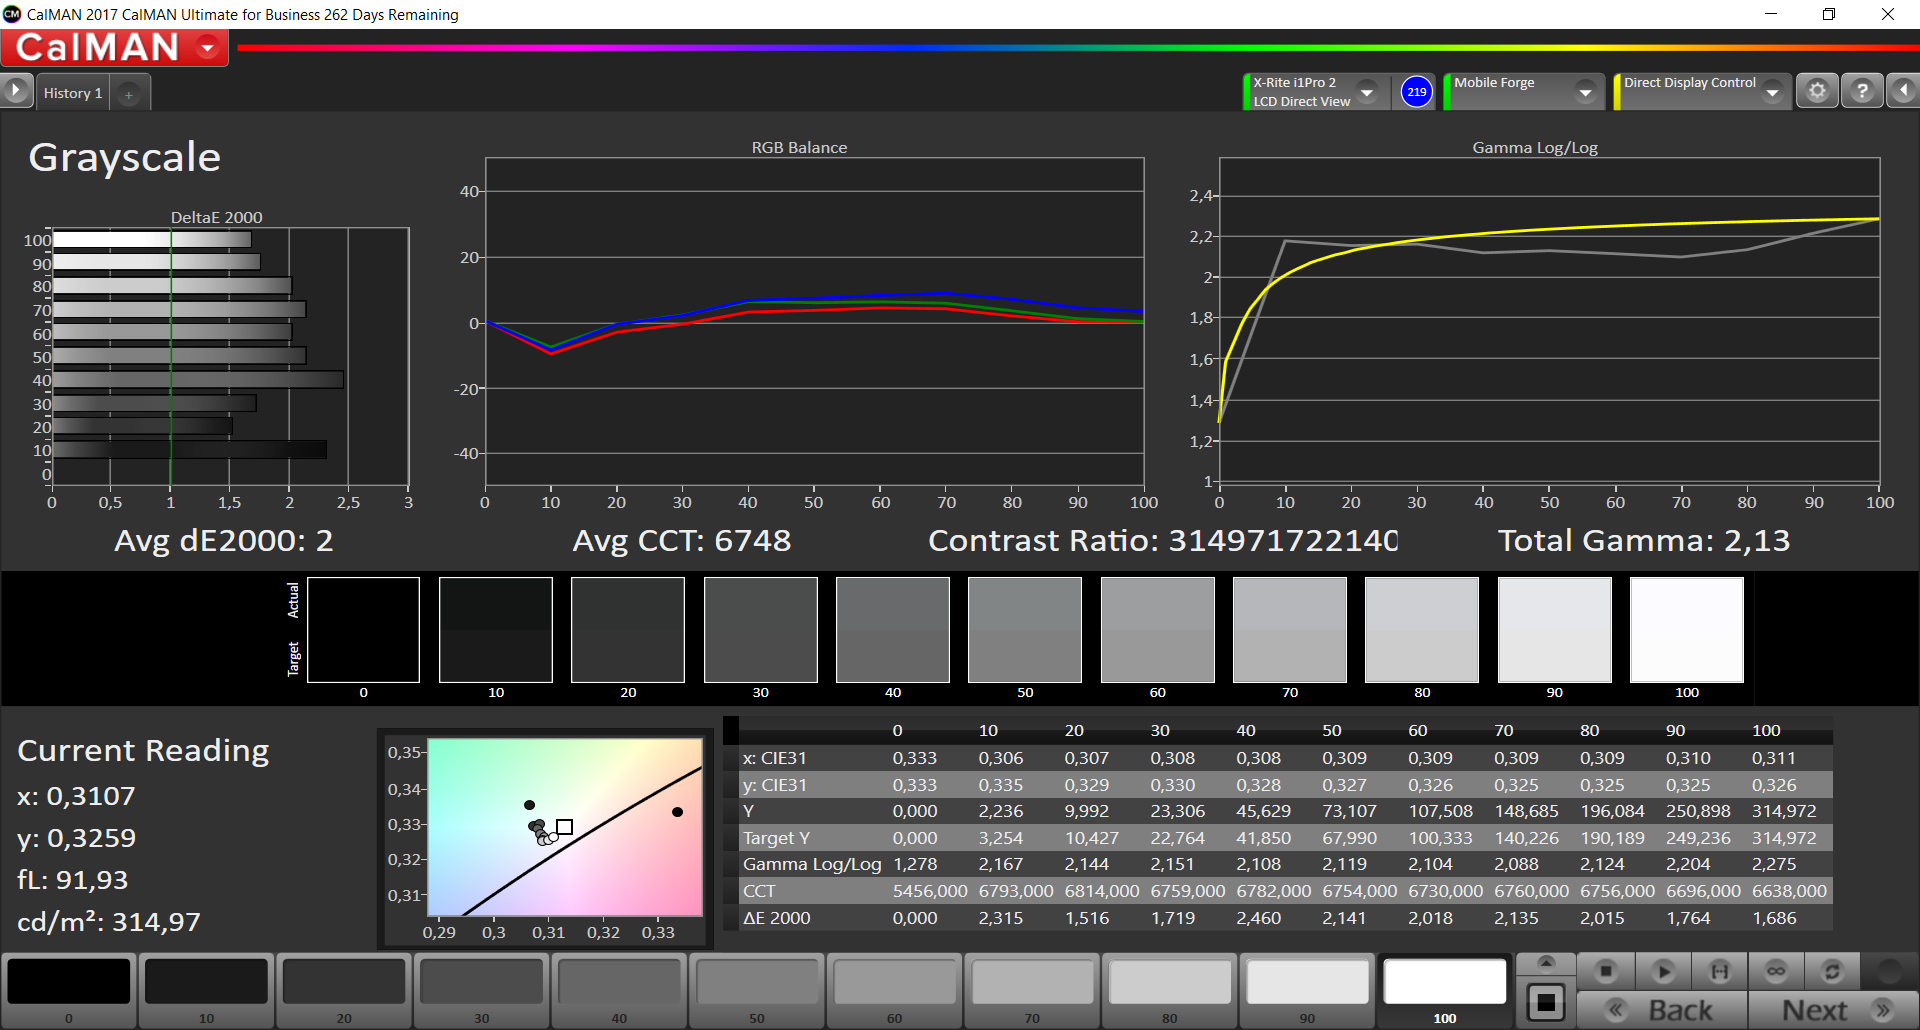
ΔE Greyscale 1.6 | 0.57-98 Ø5.3
Gamma: 2.16
| Samsung Galaxy S9 Super AMOLED, 2960x1440, 5.80 | Samsung Galaxy S8 Super AMOLED, 2960x1440, 5.80 | Google Pixel 2 AMOLED, 1920x1080, 5.00 | Apple iPhone X Super AMOLED, 2436x1125, 5.80 | Huawei Mate 10 Pro OLED, 2160x1080, 6.00 | LG V30 OLED, 2880x1440, 6.00 | Xiaomi Mi Mix 2 IPS, 2160x1080, 6.00 | |
|---|---|---|---|---|---|---|---|
| Screen | -35% | -9% | 11% | -4% | -98% | -64% | |
| Brightness middle | 529 | 566 7% | 396 -25% | 600 13% | 629 19% | 432 -18% | 472 -11% |
| Brightness | 527 | 564 7% | 404 -23% | 606 15% | 636 21% | 428 -19% | 430 -18% |
| Brightness Distribution | 96 | 94 -2% | 91 -5% | 94 -2% | 94 -2% | 87 -9% | 87 -9% |
| Black Level * | 0.27 | ||||||
| Colorchecker dE 2000 * | 1.4 | 2.7 -93% | 1.7 -21% | 1.2 14% | 1.7 -21% | 4.18 -199% | 3.5 -150% |
| Colorchecker dE 2000 max. * | 4 | 5.4 -35% | 4 -0% | 3 25% | 3.6 10% | 8.53 -113% | 5.9 -48% |
| Greyscale dE 2000 * | 1.6 | 3.1 -94% | 1.3 19% | 1.6 -0% | 2.4 -50% | 5.3 -231% | 4 -150% |
| Gamma | 2.16 102% | 2.15 102% | 2.3 96% | 2.23 99% | 2.15 102% | 2.33 94% | 2.29 96% |
| CCT | 6358 102% | 6335 103% | 6483 100% | 6707 97% | 6337 103% | 7487 87% | 7048 92% |
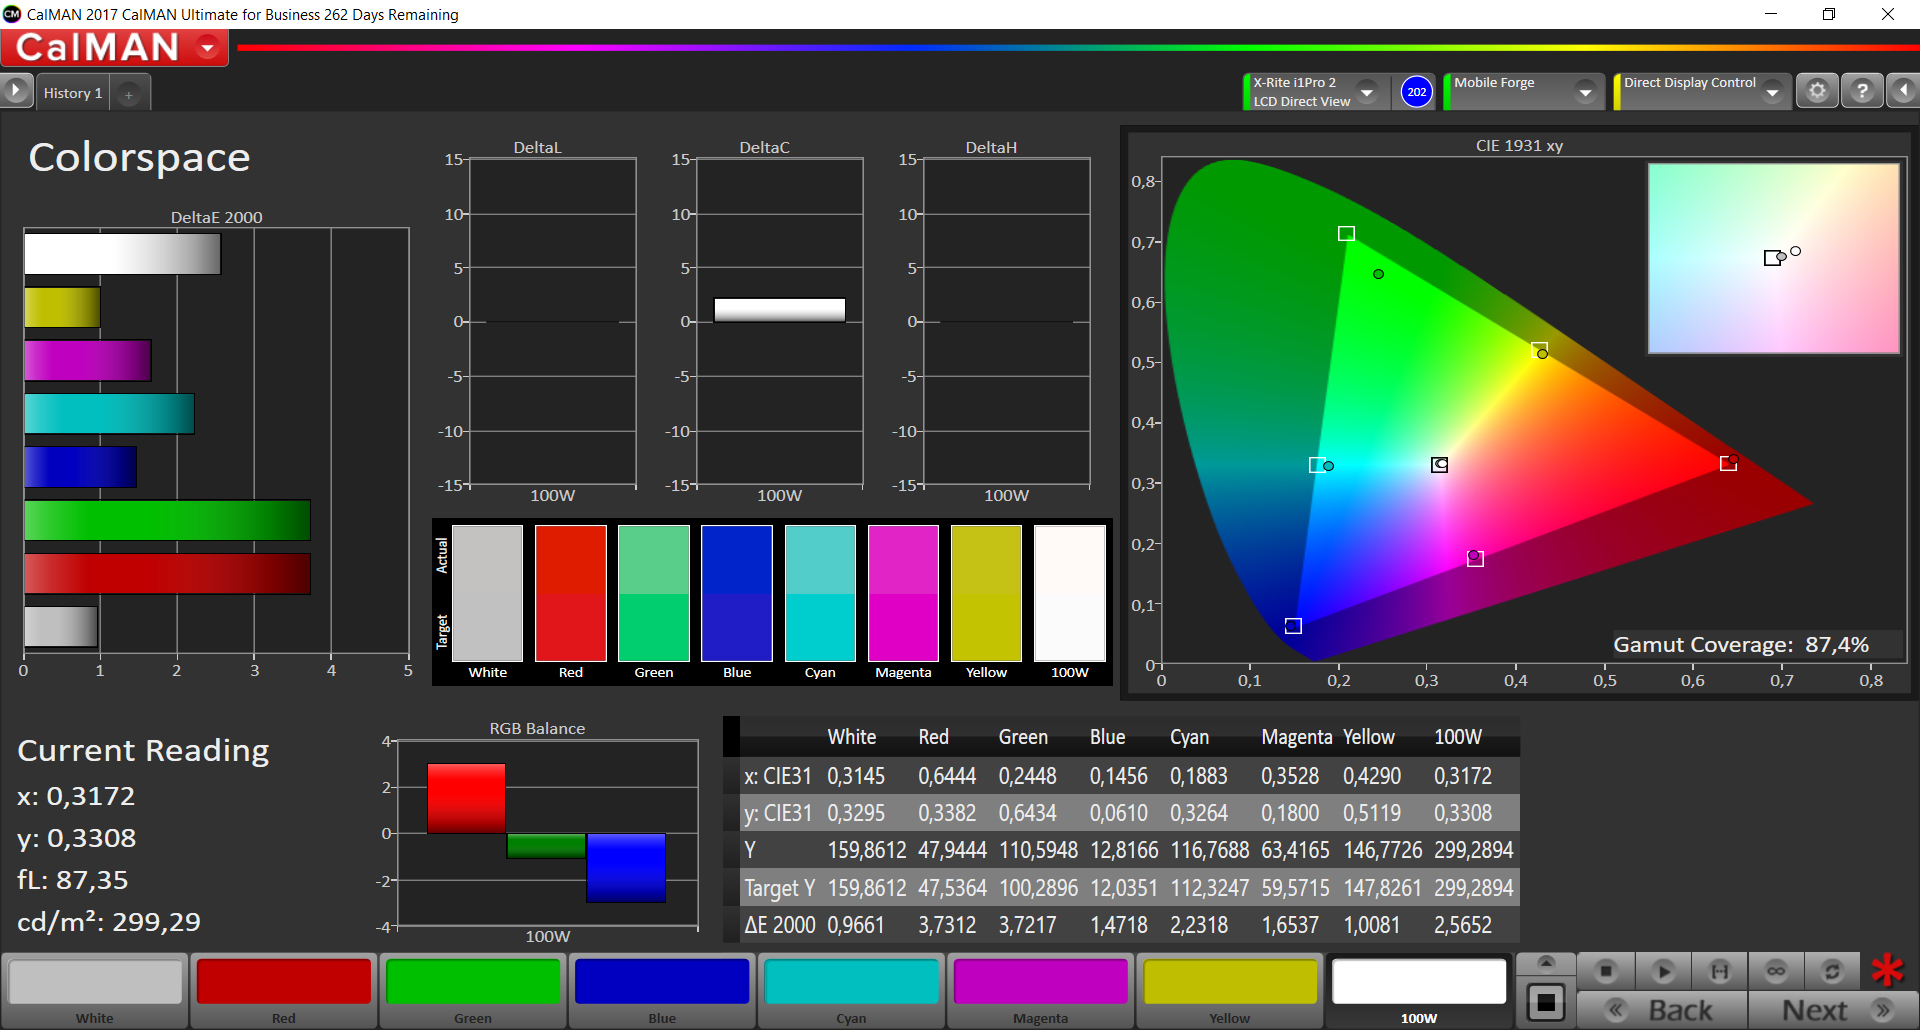
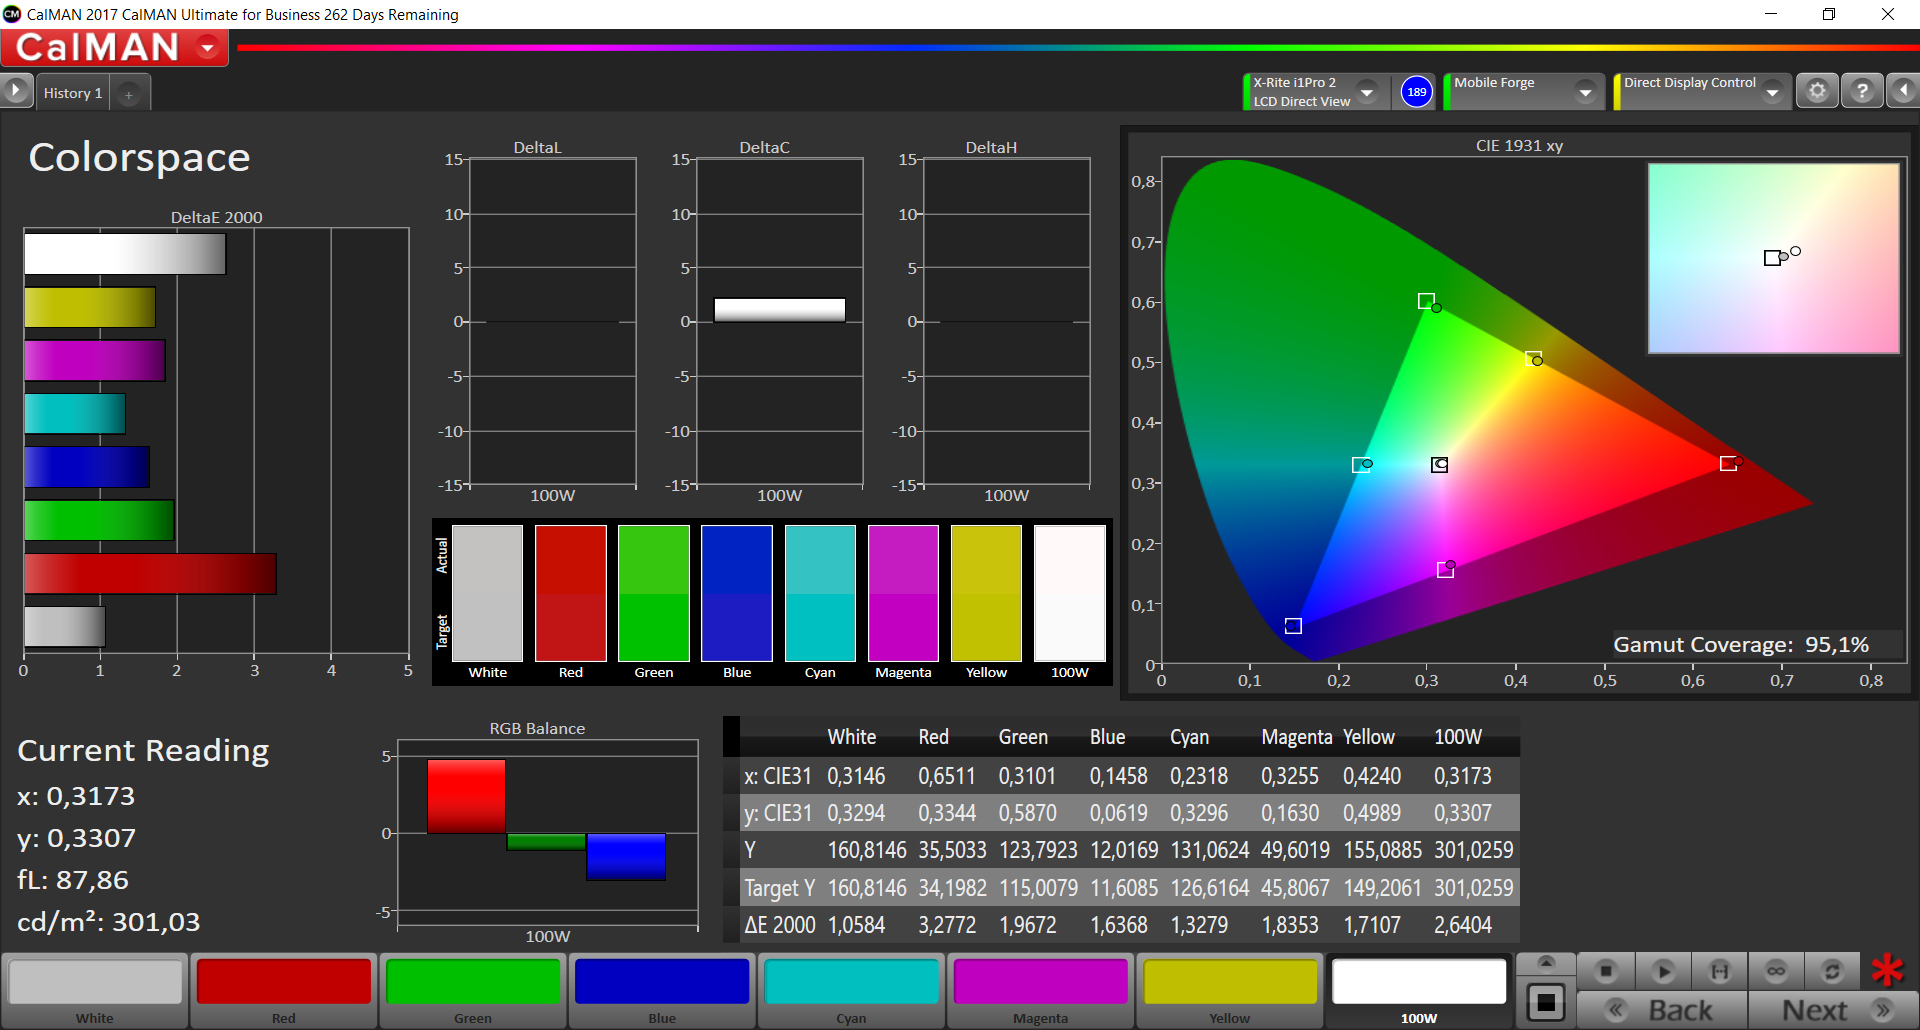
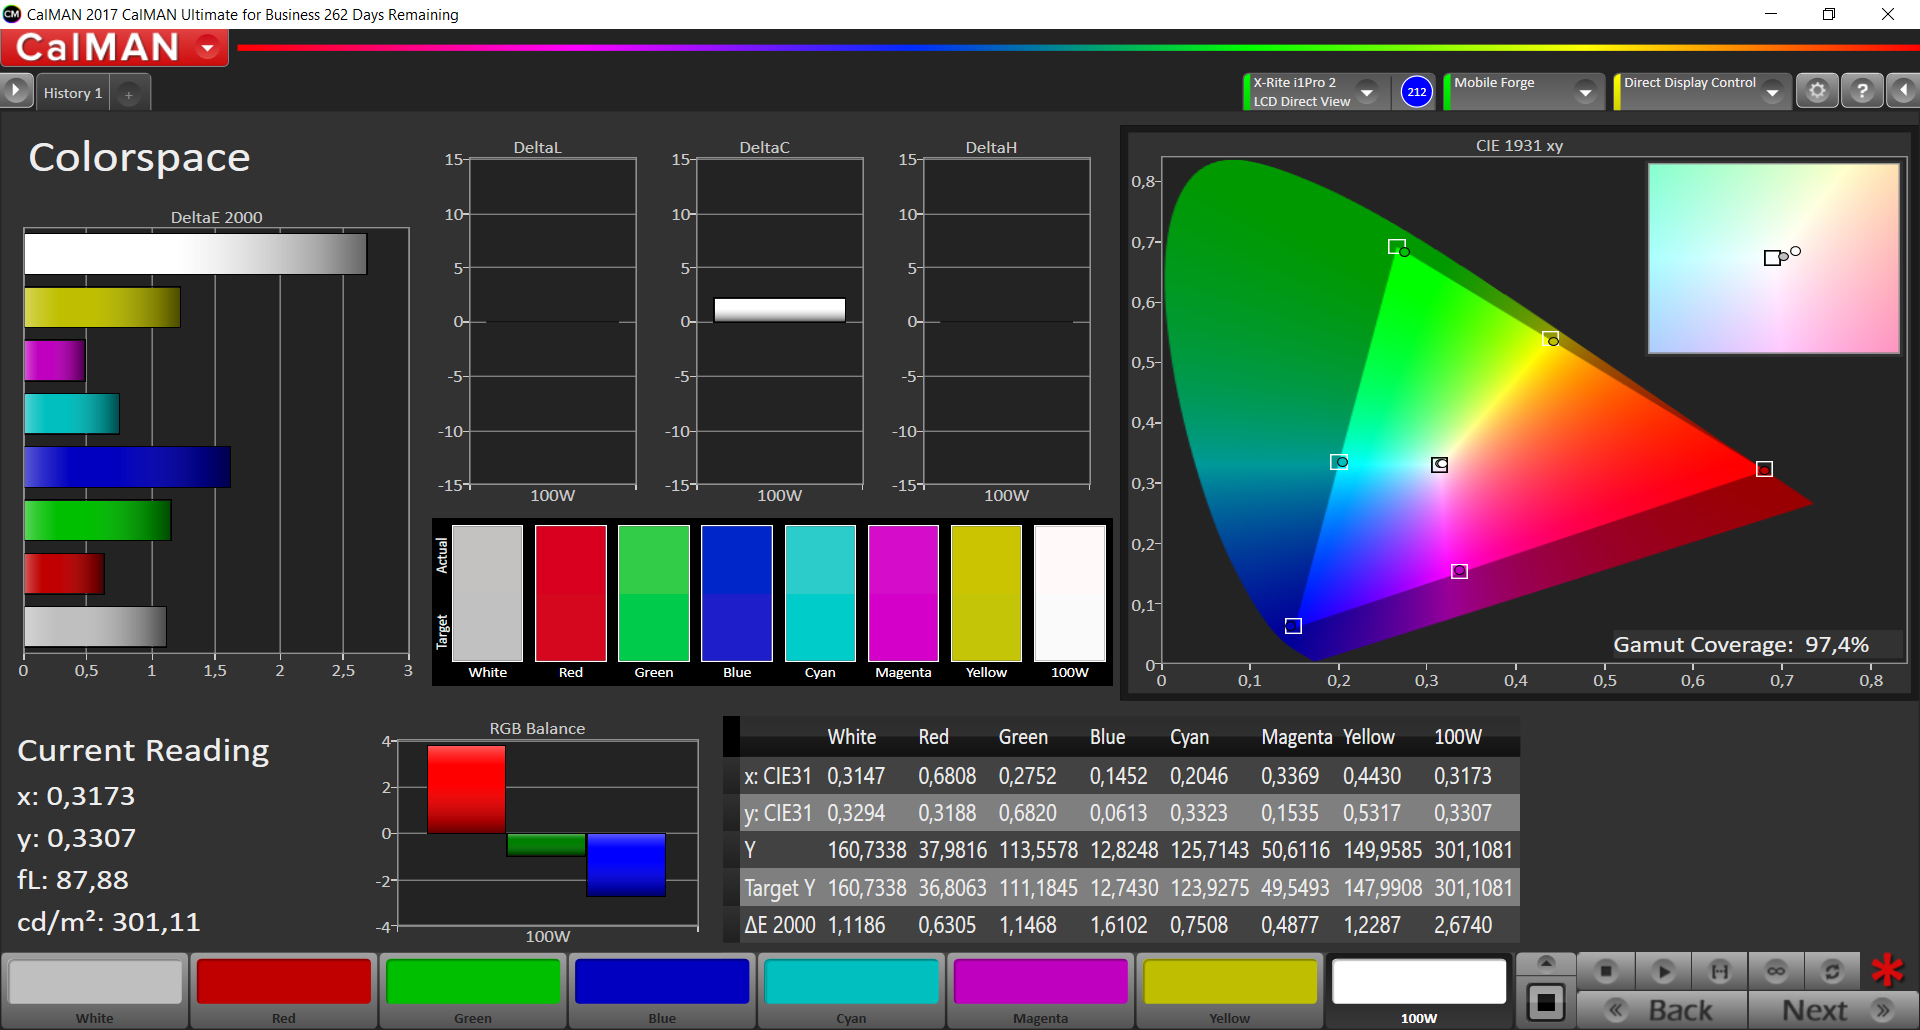
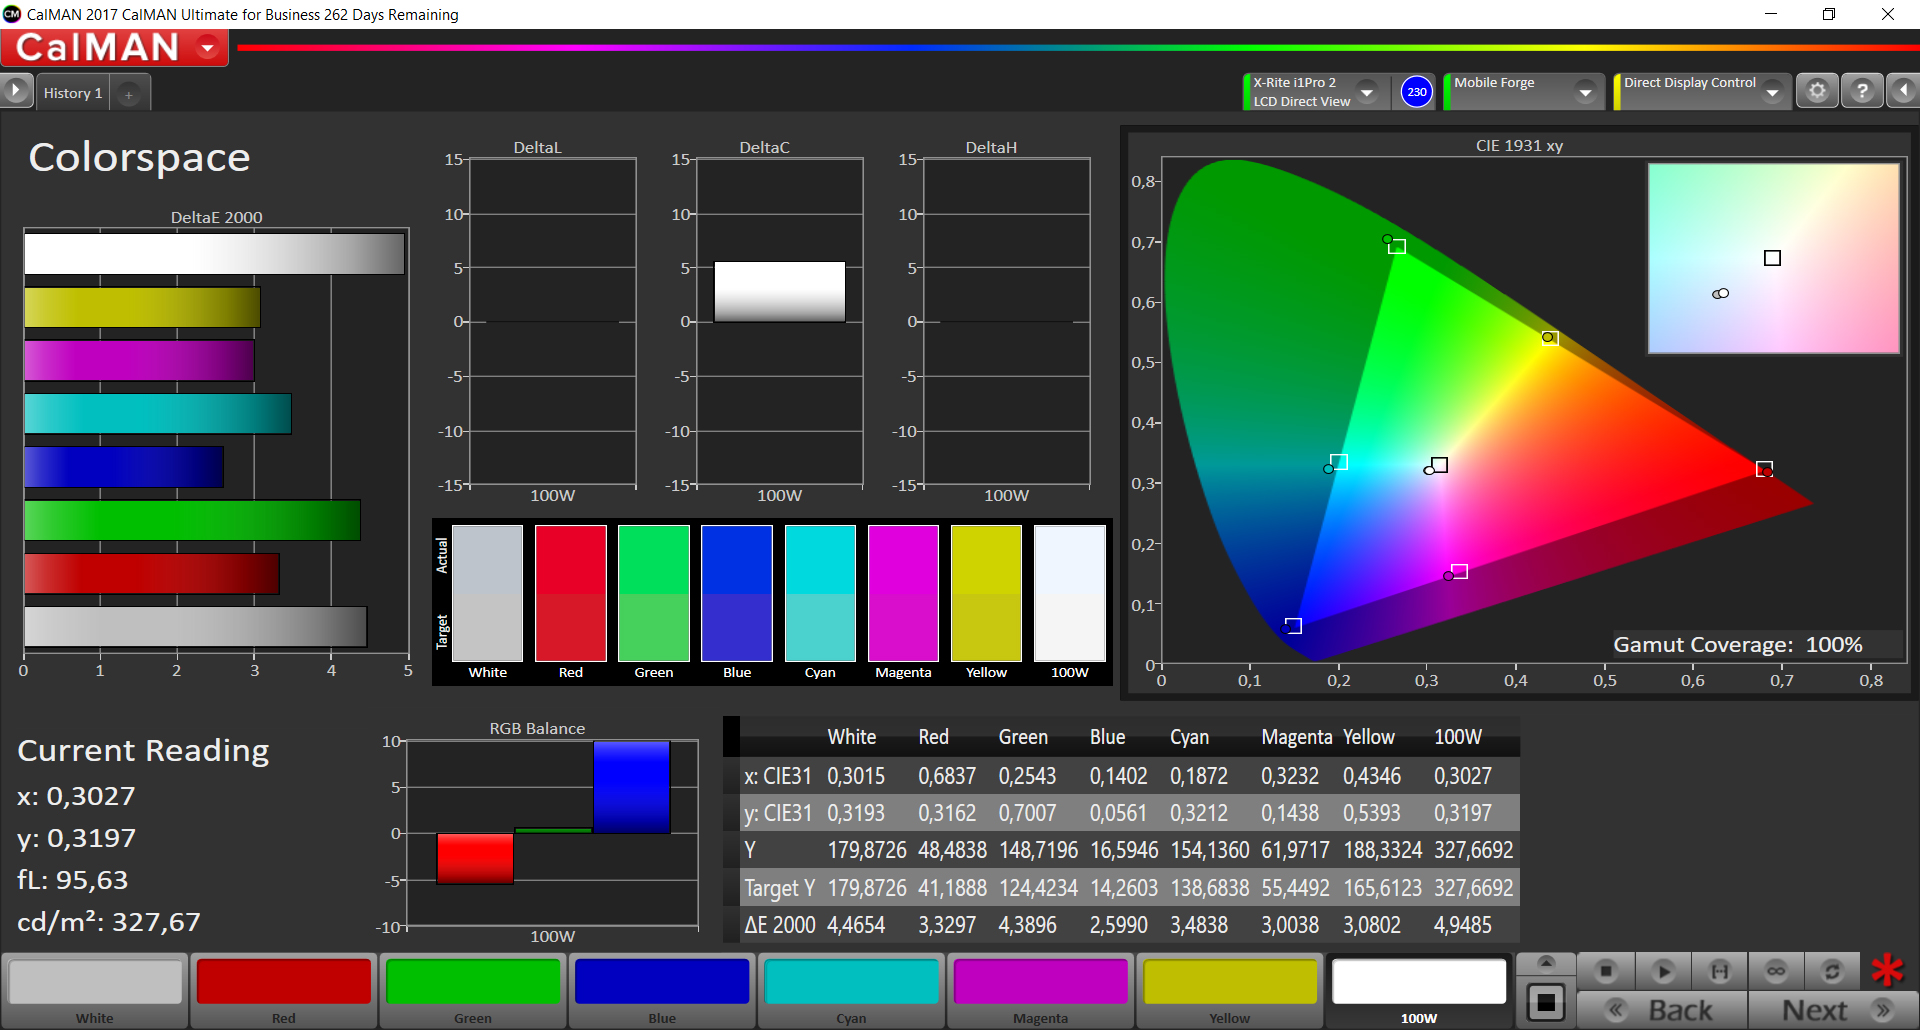
| Color Space (Percent of AdobeRGB 1998) | 81.57 | ||||||
| Color Space (Percent of sRGB) | 99.87 | ||||||
| Contrast | 1748 |
* ... smaller is better
Screen Flickering / PWM (Pulse-Width Modulation)
| Screen flickering / PWM detected | 240.4 Hz | 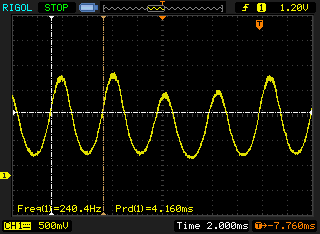 | |
The display backlight flickers at 240.4 Hz (worst case, e.g., utilizing PWM) . The frequency of 240.4 Hz is relatively low, so sensitive users will likely notice flickering and experience eyestrain at the stated brightness setting and below. In comparison: 53 % of all tested devices do not use PWM to dim the display. If PWM was detected, an average of 17933 (minimum: 5 - maximum: 3846000) Hz was measured. | |||

Display Response Times
| ↔ Response Time Black to White | ||
|---|---|---|
| 6 ms ... rise ↗ and fall ↘ combined | ↗ 3 ms rise | 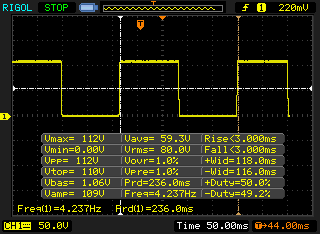 |
| ↘ 3 ms fall | ||
| The screen shows very fast response rates in our tests and should be very well suited for fast-paced gaming. In comparison, all tested devices range from 0.1 (minimum) to 240 (maximum) ms. » 13 % of all devices are better. This means that the measured response time is better than the average of all tested devices (21.5 ms). | ||
| ↔ Response Time 50% Grey to 80% Grey | ||
| 8 ms ... rise ↗ and fall ↘ combined | ↗ 3 ms rise | 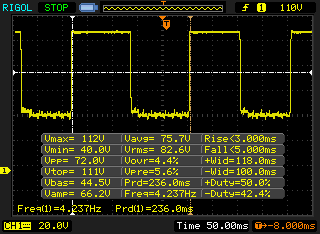 |
| ↘ 5 ms fall | ||
| The screen shows fast response rates in our tests and should be suited for gaming. In comparison, all tested devices range from 0.2 (minimum) to 636 (maximum) ms. » 15 % of all devices are better. This means that the measured response time is better than the average of all tested devices (33.8 ms). | ||
| AnTuTu v6 - Total Score (sort by value) | |
| Samsung Galaxy S9 | |
| Samsung Galaxy S8 | |
| LG V30 | |
| OnePlus 5T | |
| HTC U11 | |
| Google Pixel 2 | |
| Apple iPhone X | |
| Huawei Mate 10 Pro | |
| Average Samsung Exynos 9810 (214090 - 222290, n=3) | |
| AnTuTu v7 - Total Score (sort by value) | |
| Samsung Galaxy S9 | |
| OnePlus 5T | |
| Xiaomi Mi Mix 2 | |
| Google Pixel 2 | |
| Apple iPhone X | |
| Huawei Mate 10 Pro | |
| Average Samsung Exynos 9810 (236552 - 250577, n=3) | |
| Lightmark - 1920x1080 1080p (sort by value) | |
| Samsung Galaxy S9 | |
| Samsung Galaxy S8 | |
| HTC U11 | |
| Google Pixel 2 | |
| Huawei Mate 10 Pro | |
| Average Samsung Exynos 9810 (34 - 35.8, n=2) | |
| Basemark X 1.1 | |
| Medium Quality (sort by value) | |
| Samsung Galaxy S8 | |
| HTC U11 | |
| Huawei Mate 10 Pro | |
| High Quality (sort by value) | |
| Samsung Galaxy S8 | |
| HTC U11 | |
| Huawei Mate 10 Pro | |
| Basemark ES 3.1 / Metal - offscreen Overall Score (sort by value) | |
| Samsung Galaxy S9 | |
| Samsung Galaxy S8 | |
| HTC U11 | |
| Google Pixel 2 | |
| Apple iPhone X | |
| Huawei Mate 10 Pro | |
| Average Samsung Exynos 9810 (1436 - 1481, n=3) | |
| Average of class Smartphone (177 - 6114, n=58, last 2 years) | |
| Epic Citadel - Ultra High Quality (sort by value) | |
| Samsung Galaxy S8 | |
| HTC U11 | |
| Huawei Mate 10 Pro | |
| JetStream 1.1 - Total Score | |
| Apple iPhone X (IOS 11.1.1) | |
| Average of class Smartphone (last 2 years) | |
| HTC U11 (Chrome 58) | |
| Samsung Galaxy S9 (Samsung Browser 7.0) | |
| OnePlus 5T (Chrome 63) | |
| Samsung Galaxy S8 (Samsung Browser 5.2) | |
| Average Samsung Exynos 9810 (62.9 - 69.6, n=4) | |
| Google Pixel 2 (Chrome 62) | |
| Huawei Mate 10 Pro (Chrome 61) | |
| LG V30 (Chrome 62) | |
| Octane V2 - Total Score | |
| Apple iPhone X (IOS 11.1.2) | |
| Average of class Smartphone (4633 - 89112, n=210, last 2 years) | |
| Samsung Galaxy S9 (Samsung Browser 7.0) | |
| Average Samsung Exynos 9810 (12933 - 15233, n=4) | |
| Samsung Galaxy S8 (Samsung Browser 5.2) | |
| OnePlus 5T (Chrome 63) | |
| HTC U11 (Chrome 58) | |
| Google Pixel 2 (Chrome 62) | |
| LG V30 (Chrome 62) | |
| Huawei Mate 10 Pro (Chrome 61) | |
| Xiaomi Mi Mix 2 (Chrome 53) | |
| Mozilla Kraken 1.1 - Total | |
| LG V30 (Chrome 62) | |
| Huawei Mate 10 Pro (Chrome 61) | |
| Google Pixel 2 (Chrome 62) | |
| OnePlus 5T (Chrome 63) | |
| HTC U11 (Chrome 58) | |
| Xiaomi Mi Mix 2 (Chrome 53) | |
| Average Samsung Exynos 9810 (2060 - 3189, n=4) | |
| Samsung Galaxy S9 (Samsung Browser 7.0) | |
| Samsung Galaxy S8 (Samsung Browser 5.2) | |
| Average of class Smartphone (388 - 9999, n=172, last 2 years) | |
| Apple iPhone X (IOS 11.1.2) | |
| WebXPRT 2015 - Overall | |
| Apple iPhone X (Safari Mobile 11.0) | |
| Samsung Galaxy S8 (Samsung Browser 5.2) | |
| Google Pixel 2 (Chrome 62) | |
| OnePlus 5T (Chrome 63) | |
| Average Samsung Exynos 9810 (163 - 202, n=3) | |
| Samsung Galaxy S9 (Samsung Browser 7.0) | |
| HTC U11 (Chrome 58) | |
| Huawei Mate 10 Pro (Chrome 61) | |
| LG V30 (Chrome 62) | |
| Xiaomi Mi Mix 2 (Chrome 53) | |
* ... smaller is better
| Samsung Galaxy S9 | Samsung Galaxy S8 | LG V30 | HTC U11 | Xiaomi Mi Mix 2 | Huawei Mate 10 Pro | Average 64 GB UFS 2.1 Flash | Average of class Smartphone | |
|---|---|---|---|---|---|---|---|---|
| AndroBench 3-5 | -14% | -29% | 27% | -8% | 151% | 38% | 422% | |
| Sequential Read 256KB | 815 | 793 -3% | 669 -18% | 717 -12% | 704 -14% | 732 -10% | 696 ? -15% | 1505 ? 85% |
| Sequential Write 256KB | 206.9 | 193.2 -7% | 193.2 -7% | 206.4 0% | 208.6 1% | 208.7 1% | 224 ? 8% | 1112 ? 437% |
| Random Read 4KB | 131 | 127.2 -3% | 78.2 -40% | 91.4 -30% | 148.5 13% | 132.3 1% | 137.2 ? 5% | 247 ? 89% |
| Random Write 4KB | 23.07 | 15.25 -34% | 10.21 -56% | 80 247% | 15.75 -32% | 164.4 613% | 84.7 ? 267% | 271 ? 1075% |
| Sequential Read 256KB SDCard | 79.2 ? | 63.9 ? -19% | 62.8 -21% | 68.8 ? -13% | 68.6 ? -13% | |||
| Sequential Write 256KB SDCard | 67.2 ? | 53.5 ? -20% | 47.2 -30% | 46.25 ? -31% | 52.2 ? -22% |
| Asphalt 8: Airborne | |||
| Ayarlar | Değer | ||
| high | 30 fps | ||
| Dead Trigger 2 | |||
| Ayarlar | Değer | ||
| high | 30 fps | ||
| Battle Bay | |||
| Ayarlar | Değer | ||
| full resolution | 60 fps | ||
| World of Tanks Blitz | |||
| Ayarlar | Değer | ||
| high, 0xAA, 0xAF | 60 fps | ||
| Arena of Valor | |||
| Ayarlar | Değer | ||
| high HD | 59 fps | ||
| Shadow Fight 3 | |||
| Ayarlar | Değer | ||
| high | 59 fps | ||
(+) The maximum temperature on the upper side is 35.4 °C / 96 F, compared to the average of 35 °C / 95 F, ranging from 21.9 to 56 °C for the class Smartphone.
(+) The bottom heats up to a maximum of 36.2 °C / 97 F, compared to the average of 33.8 °C / 93 F
(+) In idle usage, the average temperature for the upper side is 22.9 °C / 73 F, compared to the device average of 32.7 °C / 91 F.
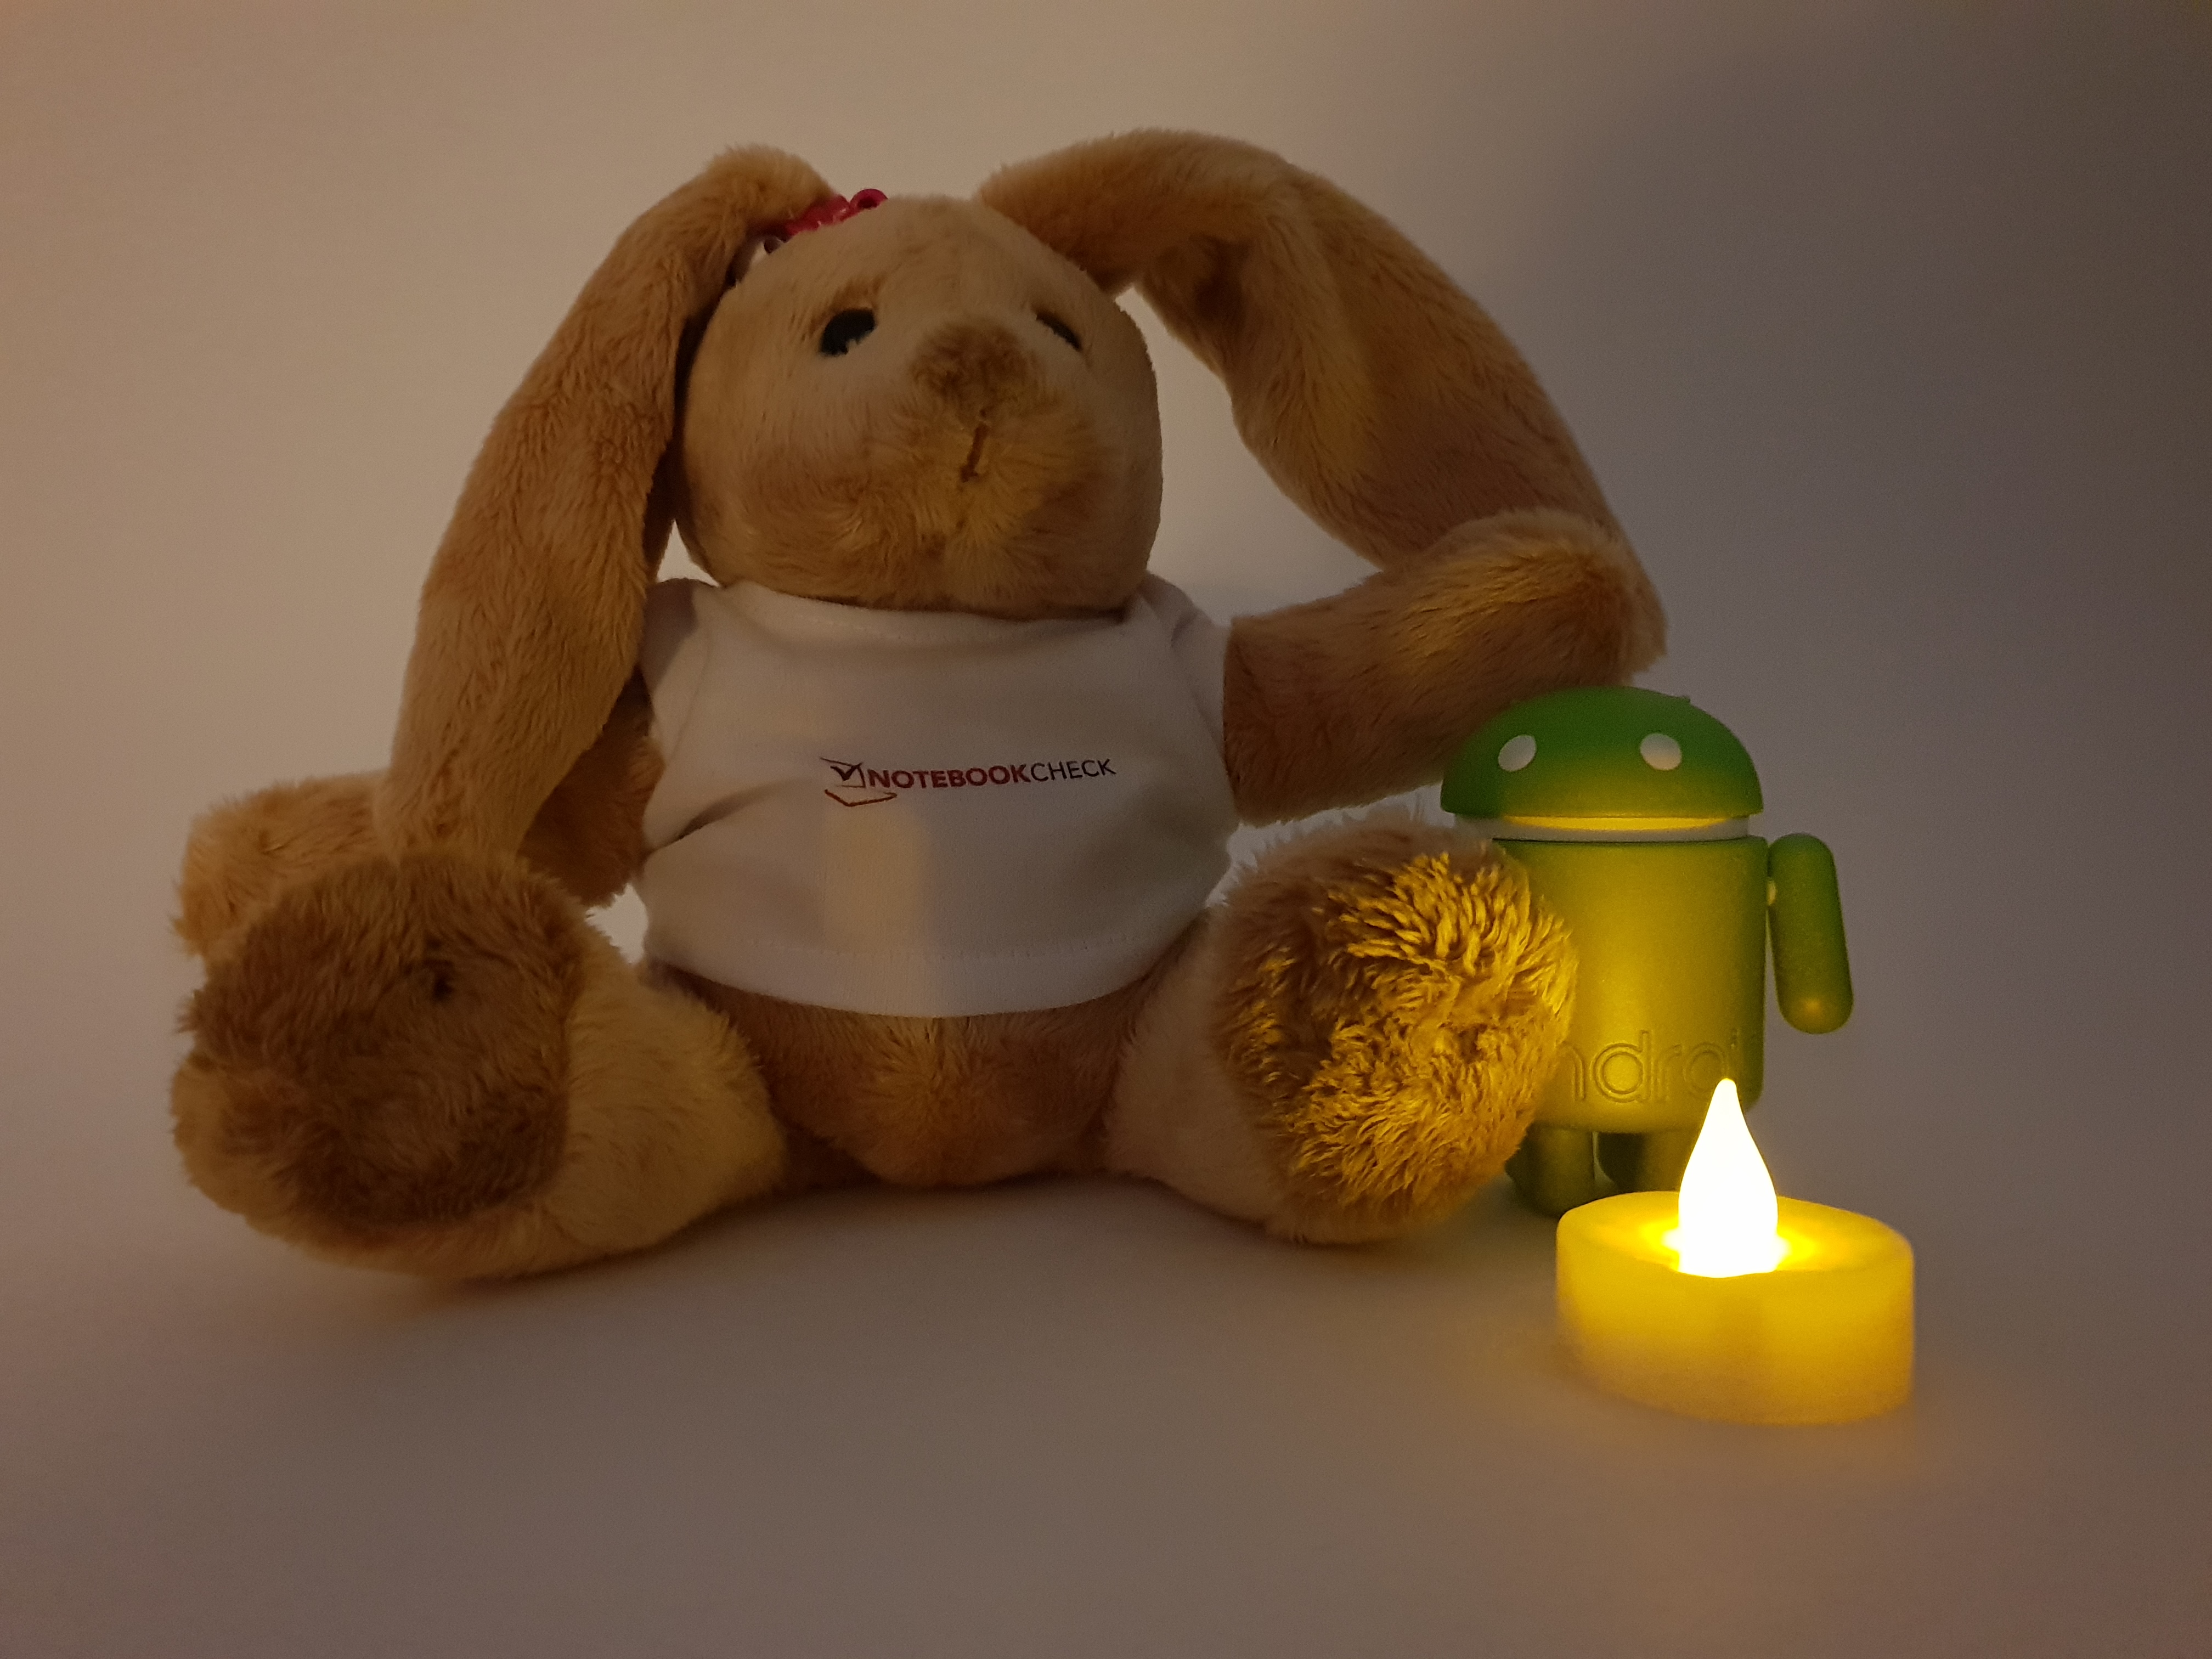
Samsung Galaxy S9 audio analysis
(+) | speakers can play relatively loud (86 dB)
Bass 100 - 315 Hz
(-) | nearly no bass - on average 23.1% lower than median
(±) | linearity of bass is average (11.5% delta to prev. frequency)
Mids 400 - 2000 Hz
(+) | balanced mids - only 3.1% away from median
(+) | mids are linear (3.8% delta to prev. frequency)
Highs 2 - 16 kHz
(+) | balanced highs - only 4.8% away from median
(+) | highs are linear (4.3% delta to prev. frequency)
Overall 100 - 16.000 Hz
(±) | linearity of overall sound is average (17.2% difference to median)
Compared to same class
» 7% of all tested devices in this class were better, 6% similar, 87% worse
» The best had a delta of 12%, average was 38%, worst was 134%
Compared to all devices tested
» 26% of all tested devices were better, 8% similar, 66% worse
» The best had a delta of 4%, average was 25%, worst was 134%
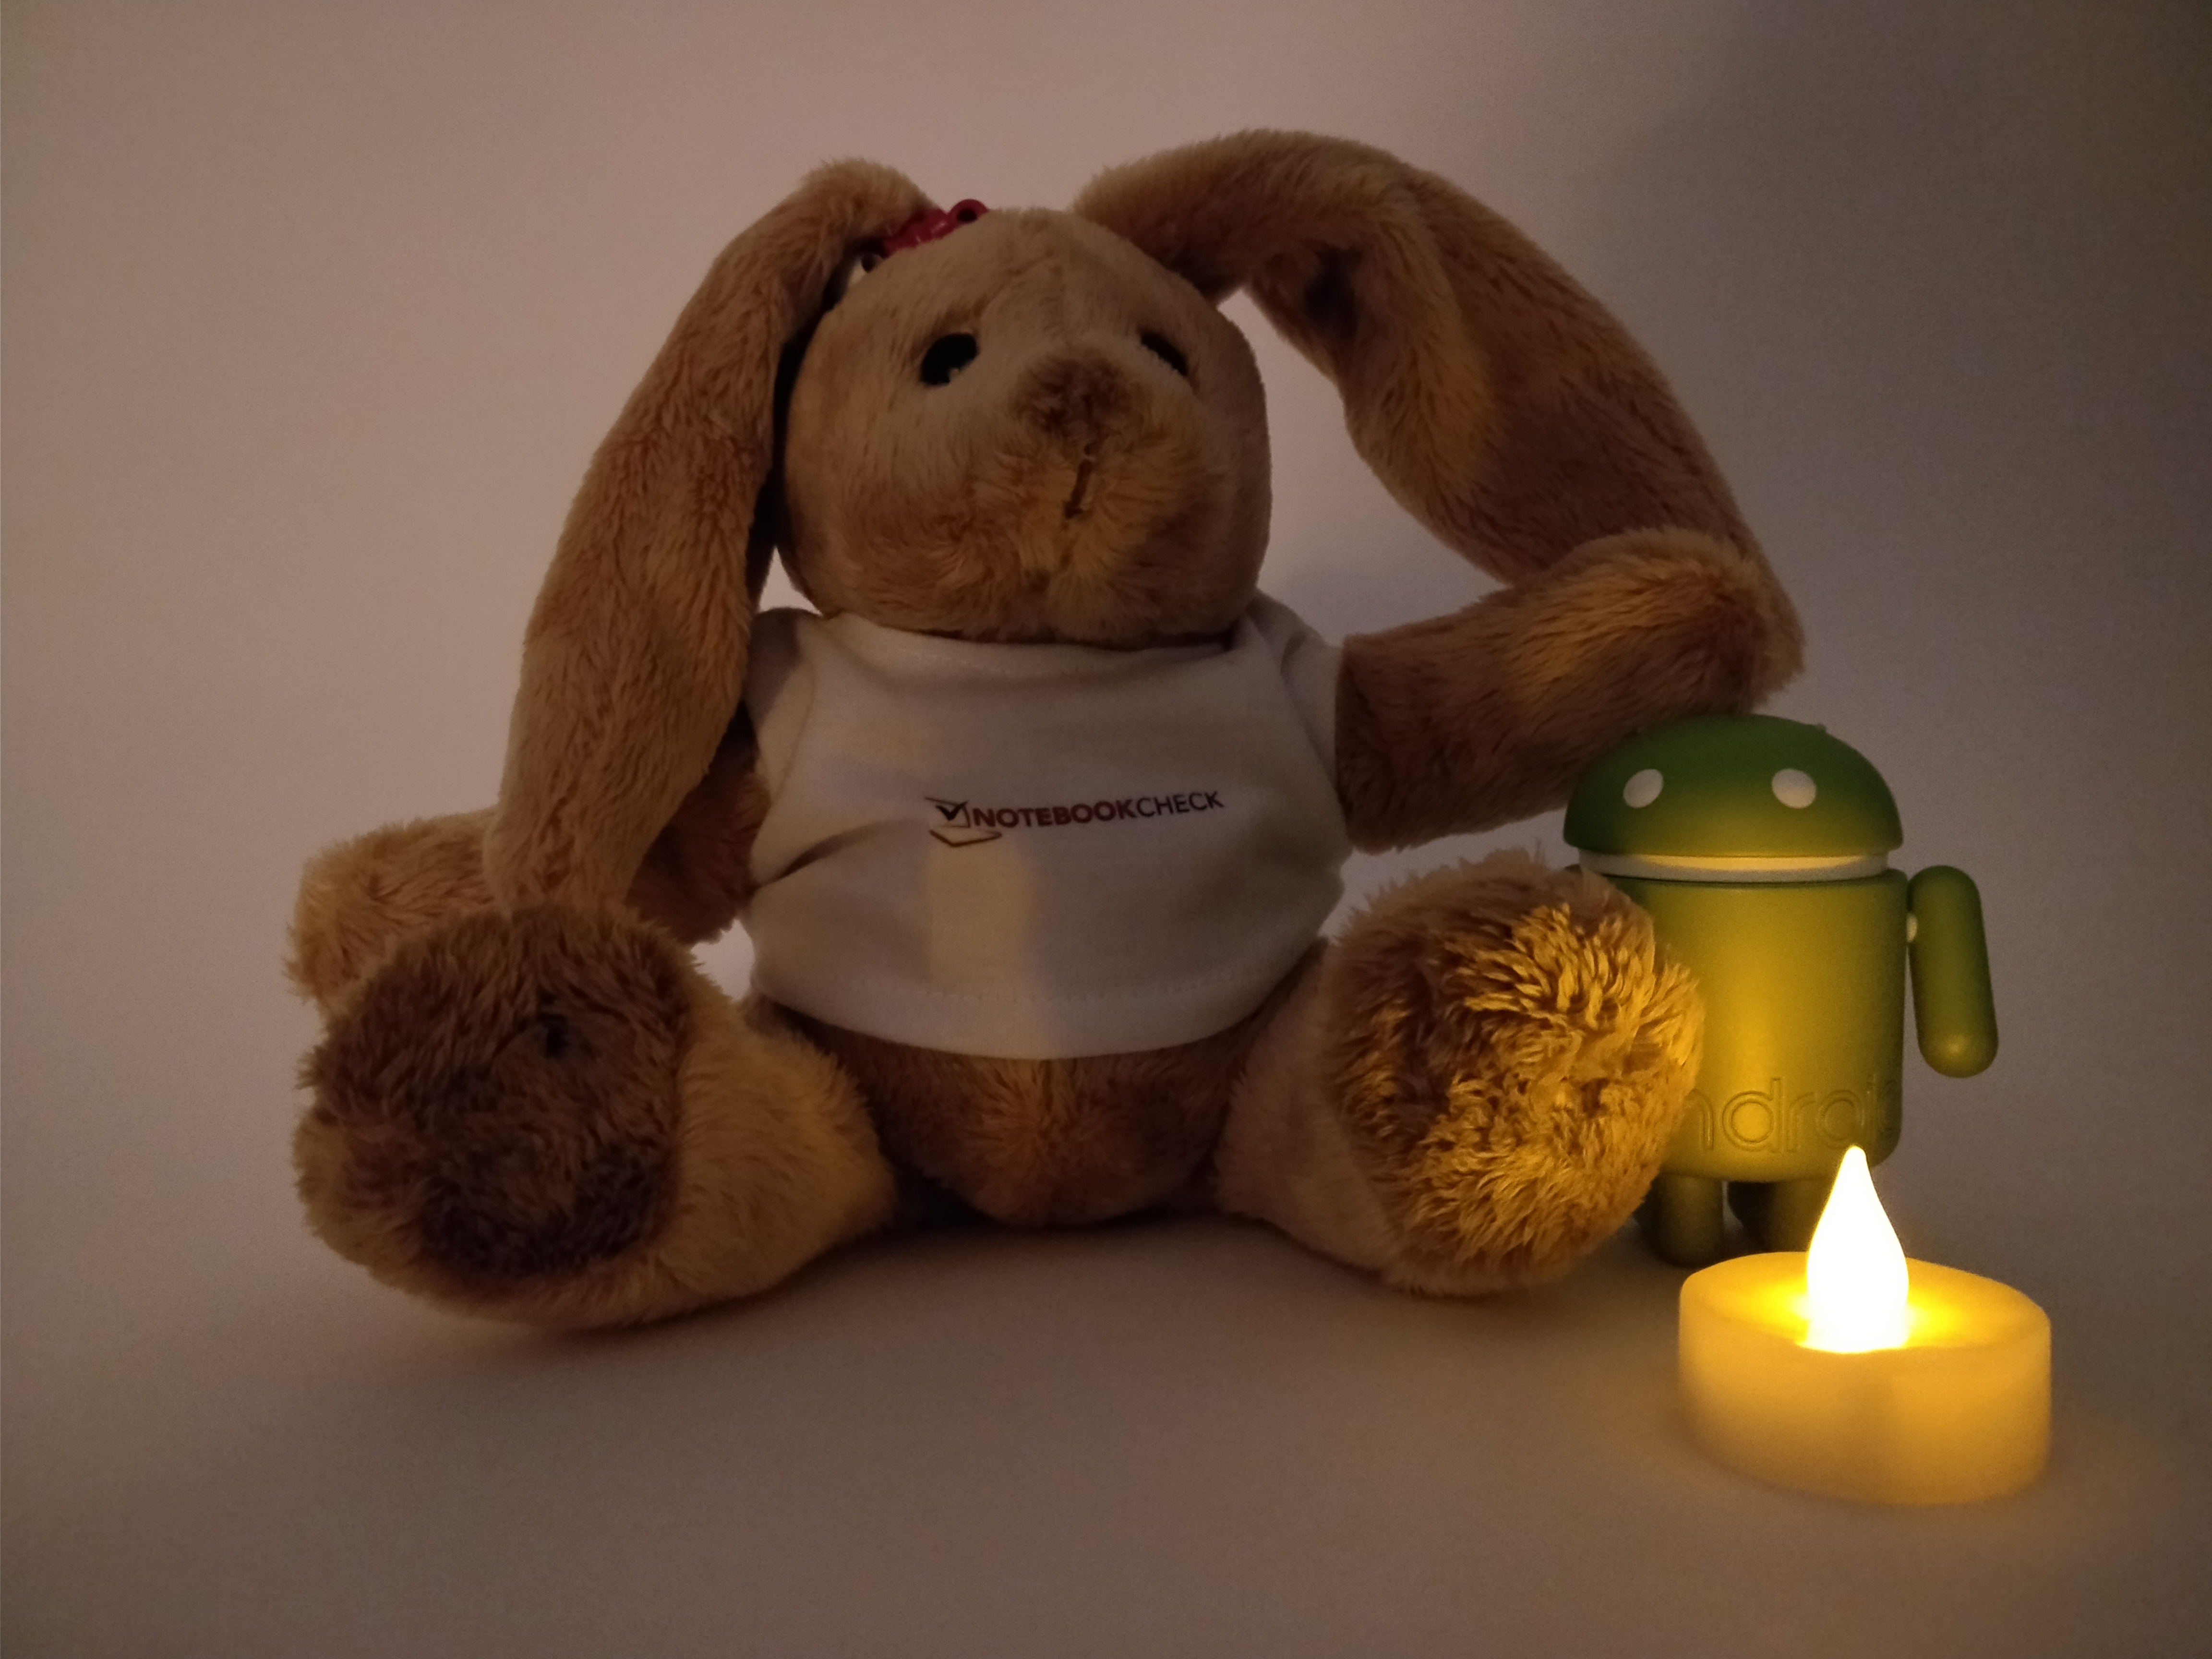
Google Pixel 2 audio analysis
(+) | speakers can play relatively loud (89.4 dB)
Bass 100 - 315 Hz
(-) | nearly no bass - on average 27% lower than median
(±) | linearity of bass is average (8% delta to prev. frequency)
Mids 400 - 2000 Hz
(±) | reduced mids - on average 5.6% lower than median
(+) | mids are linear (5.3% delta to prev. frequency)
Highs 2 - 16 kHz
(±) | higher highs - on average 5.3% higher than median
(+) | highs are linear (4.7% delta to prev. frequency)
Overall 100 - 16.000 Hz
(±) | linearity of overall sound is average (20% difference to median)
Compared to same class
» 25% of all tested devices in this class were better, 9% similar, 66% worse
» The best had a delta of 12%, average was 38%, worst was 134%
Compared to all devices tested
» 46% of all tested devices were better, 8% similar, 46% worse
» The best had a delta of 4%, average was 25%, worst was 134%
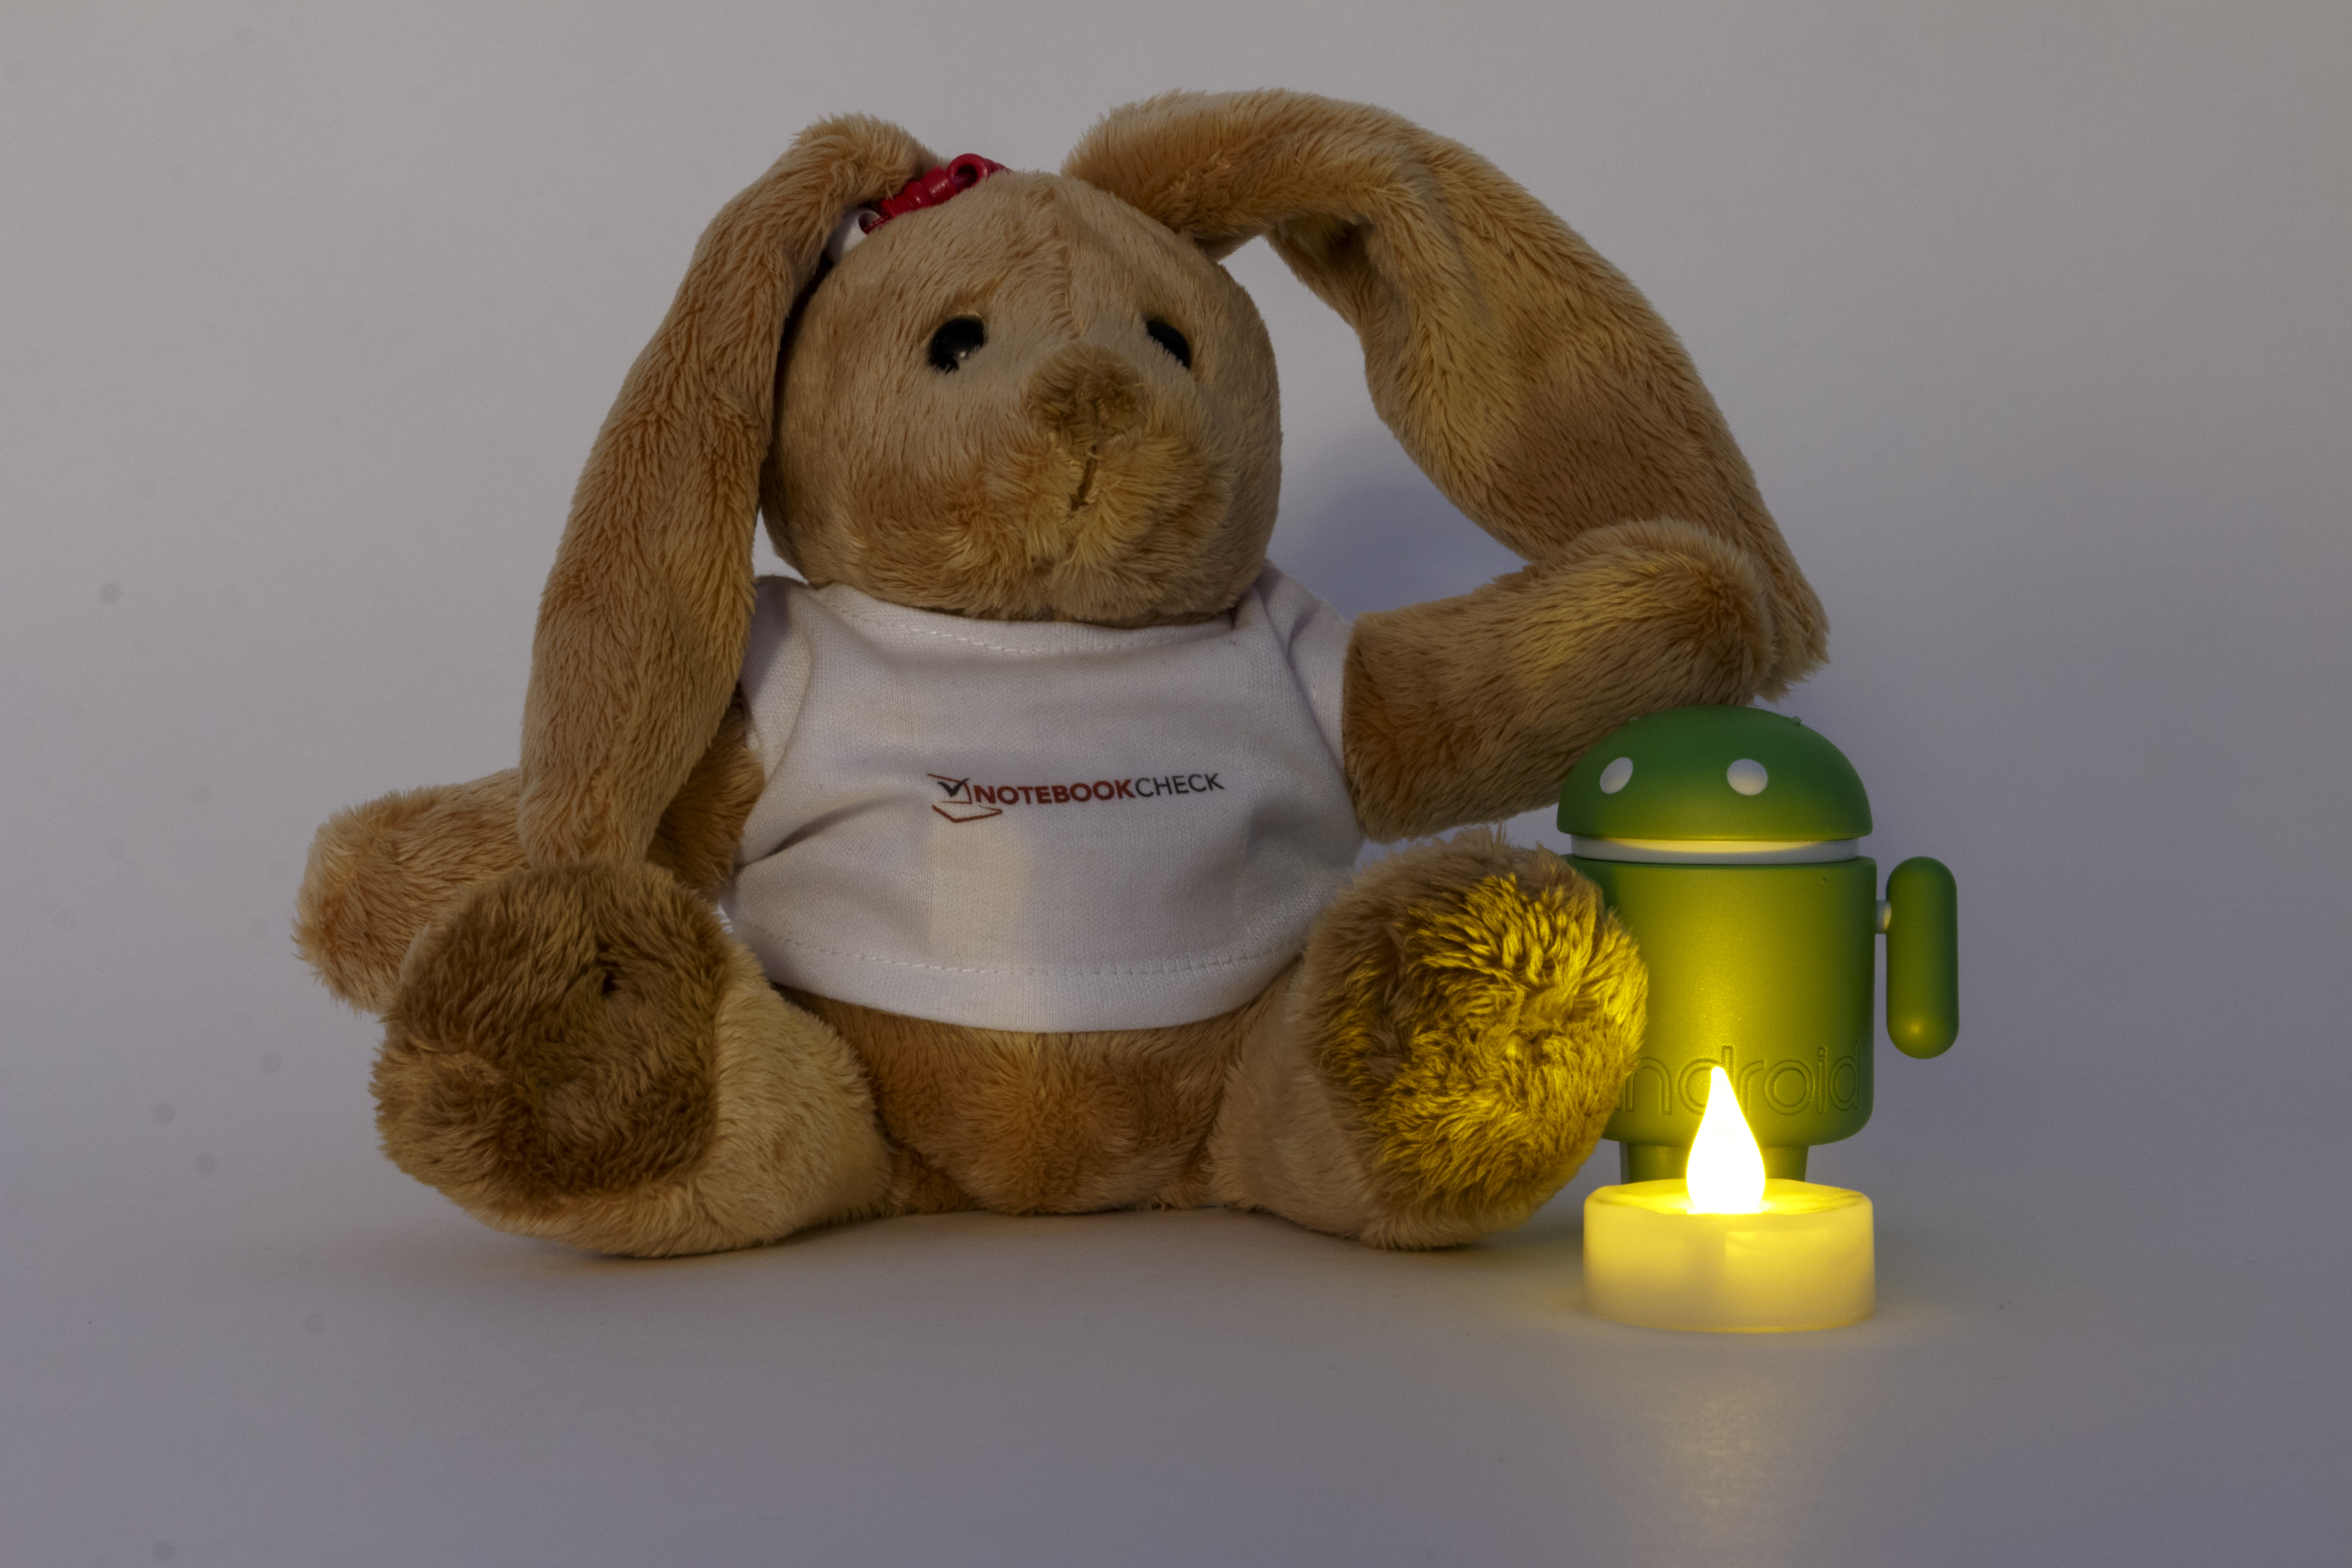
HTC U11 audio analysis
(±) | speaker loudness is average but good (81.4 dB)
Bass 100 - 315 Hz
(-) | nearly no bass - on average 24.5% lower than median
(±) | linearity of bass is average (13.3% delta to prev. frequency)
Mids 400 - 2000 Hz
(+) | balanced mids - only 4.1% away from median
(±) | linearity of mids is average (7.4% delta to prev. frequency)
Highs 2 - 16 kHz
(±) | higher highs - on average 5.1% higher than median
(+) | highs are linear (6.2% delta to prev. frequency)
Overall 100 - 16.000 Hz
(±) | linearity of overall sound is average (22.1% difference to median)
Compared to same class
» 40% of all tested devices in this class were better, 7% similar, 53% worse
» The best had a delta of 12%, average was 38%, worst was 134%
Compared to all devices tested
» 59% of all tested devices were better, 7% similar, 34% worse
» The best had a delta of 4%, average was 25%, worst was 134%
| Kapalı / Bekleme modu | |
| Boşta | |
| Çalışırken |
|
| Samsung Galaxy S9 3000 mAh | Samsung Galaxy S8 3000 mAh | HTC U11 3000 mAh | Google Pixel 2 2700 mAh | Apple iPhone X 2716 mAh | Xiaomi Mi Mix 2 3771 mAh | Average Samsung Exynos 9810 | Average of class Smartphone | |
|---|---|---|---|---|---|---|---|---|
| Power Consumption | -14% | -62% | -40% | -85% | -64% | -49% | -54% | |
| Idle Minimum * | 0.65 | 0.78 -20% | 0.73 -12% | 0.99 -52% | 1.03 -58% | 0.69 -6% | 0.783 ? -20% | 0.897 ? -38% |
| Idle Average * | 0.81 | 1.1 -36% | 1.96 -142% | 1.35 -67% | 2.4 -196% | 2.03 -151% | 1.315 ? -62% | 1.452 ? -79% |
| Idle Maximum * | 0.92 | 1.16 -26% | 1.98 -115% | 1.37 -49% | 2.6 -183% | 2.1 -128% | 1.903 ? -107% | 1.629 ? -77% |
| Load Average * | 4.76 | 4.15 13% | 4.82 -1% | 3.25 32% | 2.96 38% | 3.18 33% | 5.76 ? -21% | 5.55 ? -17% |
| Load Maximum * | 5.16 | 5.12 1% | 7.15 -39% | 8.56 -66% | 6.6 -28% | 8.73 -69% | 7.06 ? -37% | 8.31 ? -61% |
* ... smaller is better
| Samsung Galaxy S9 3000 mAh | Samsung Galaxy S8 3000 mAh | LG V30 3300 mAh | HTC U11 3000 mAh | Google Pixel 2 2700 mAh | Apple iPhone X 2716 mAh | Xiaomi Mi Mix 2 3771 mAh | Huawei Mate 10 Pro 4000 mAh | |
|---|---|---|---|---|---|---|---|---|
| Battery Runtime | 45% | 56% | 9% | 9% | 11% | 27% | 79% | |
| Reader / Idle | 1182 | 1667 41% | 1914 62% | 1250 6% | 1457 23% | 1292 9% | 1744 48% | |
| H.264 | 609 | 771 27% | 822 35% | 498 -18% | 564 -7% | 634 4% | 929 53% | |
| WiFi v1.3 | 474 | 719 52% | 774 63% | 560 18% | 575 21% | 564 19% | 600 27% | 818 73% |
| Load | 164 | 264 61% | 267 63% | 212 29% | 161 -2% | 180 10% | 398 143% |
Artılar
Eksiler

Samsung Galaxy S9 büyük kardeşi S9 Plus modeline kıyasla tercihimiz oluyor. Kaba değil ve çift kamera seçeneği de ekstra ücrete çok değmiyor. Koreli üretici bir kez daha harika bir akıllı telefon sunmayı başarıyor, ancak geçtiğimiz yılıns S8 modeline kıyasla çok fazla şeyin değiştiğini veya düzeldiğini söylemek pek mümkün değil. Kullanım süresi özellikle eski S8 modeline göre daha kısa ve bu bazı kullanıcıları halihazırda kızdırmış durumda. Umarız üretici bu durumu bir güncelleme ile düzeltecektir.
Hızlı işlemci, harika ekran, parmak izi okuyucu için daha iyi bir yer, genişletilebilir depolama alanı, su ve toza karşı dayanıklılık ve opsiyonel çift sim modeli avantajlar olarak sıralanabilir. Öte yandan AR Emoji ve süper yavaş modu gerçekten ek değer katan ve çalışan ek özellikler.
Öte yandan Galaxy S8 kullanıcısı iseniz, henüz bu cihazı almanız için gerçek bir sebep olduğu söylenemez.
Samsung Galaxy S9
-
08/31/2022 v7
Daniel Schmidt
Pricecompare
