Deutsch
 English
 Español
 Français
 Italiano
 Nederlands
 Polski
 Português
 Русский
 Türkçe
 Svenska
 Chinese
 Magyar
Kısa inceleme: Alienware 15 R3 Notebook
| Networking | |
| iperf3 transmit AX12 | |
| Alienware 15 R3 | |
| SCHENKER XMG P507 PRO | |
| iperf3 receive AX12 | |
| Alienware 15 R3 | |
| SCHENKER XMG P507 PRO | |
| |||||||||||||||||||||||||
Aydınlatma: 93 %
Batarya modunda parlaklık: 386 cd/m²
Kontrast: 990:1 (Siyah: 0.39 cd/m²)
ΔE Color 10.2 | 0.5-29.43 Ø5
ΔE Greyscale 11.28 | 0.57-98 Ø5.3
90% sRGB (Argyll 1.6.3 3D)
59% AdobeRGB 1998 (Argyll 1.6.3 3D)
66.2% AdobeRGB 1998 (Argyll 2.2.0 3D)
90.5% sRGB (Argyll 2.2.0 3D)
66% Display P3 (Argyll 2.2.0 3D)
Gamma: 2.23
| Alienware 15 R3 HPJGK_B156HTN (AUO51ED), 1920x1080 | Alienware 15 R2 (Skylake) Samsung 4NDDJ_156HL (SDC4C48), 1920x1080 | Asus Strix GL502VS-FY032T LG Philips LP156WF6-SPB6 (LGD046F), 1920x1080 | MSI GT62VR-6RE16H21 LG Philips LP156WF6 (LGD046F), 1920x1080 | SCHENKER XMG P507 PRO AUO B156HTN05.2 (AUO52ED), 1920x1080 | |
|---|---|---|---|---|---|
| Display | -36% | -6% | -5% | -1% | |
| Display P3 Coverage | 66 | 40.3 -39% | 64.5 -2% | 64.6 -2% | 66.4 1% |
| sRGB Coverage | 90.5 | 60.2 -33% | 83.1 -8% | 84.6 -7% | 88.9 -2% |
| AdobeRGB 1998 Coverage | 66.2 | 41.67 -37% | 60.8 -8% | 61.8 -7% | 65.1 -2% |
| Response Times | -114% | -72% | -60% | 2% | |
| Response Time Grey 50% / Grey 80% * | 25 ? | 48.8 ? -95% | 38 ? -52% | 34 ? -36% | 24 ? 4% |
| Response Time Black / White * | 12 ? | 28 ? -133% | 23 ? -92% | 22 ? -83% | 12 ? -0% |
| PWM Frequency | 200 ? | ||||
| Screen | -7% | 11% | 15% | -6% | |
| Brightness middle | 386 | 180 -53% | 315 -18% | 273 -29% | 357 -8% |
| Brightness | 382 | 179 -53% | 290 -24% | 278 -27% | 365 -4% |
| Brightness Distribution | 93 | 83 -11% | 85 -9% | 88 -5% | 85 -9% |
| Black Level * | 0.39 | 0.19 51% | 0.32 18% | 0.27 31% | 0.5 -28% |
| Contrast | 990 | 947 -4% | 984 -1% | 1011 2% | 714 -28% |
| Colorchecker dE 2000 * | 10.2 | 6.74 34% | 4.88 52% | 3.67 64% | 9.93 3% |
| Colorchecker dE 2000 max. * | 15.81 | 8.88 44% | 8.33 47% | 14.87 6% | |
| Greyscale dE 2000 * | 11.28 | 6.44 43% | 4.17 63% | 2.73 76% | 10.32 9% |
| Gamma | 2.23 99% | 2.29 96% | 2.53 87% | 2.49 88% | 2.11 104% |
| CCT | 11383 57% | 6465 101% | 6683 97% | 7029 92% | 10096 64% |
| Color Space (Percent of AdobeRGB 1998) | 59 | 38 -36% | 55 -7% | 55 -7% | 58 -2% |
| Color Space (Percent of sRGB) | 90 | 60 -33% | 83 -8% | 84 -7% | 89 -1% |
| Total Average (Program / Settings) | -52% /
-29% | -22% /
-3% | -17% /
1% | -2% /
-4% |
* ... smaller is better
Display Response Times
| ↔ Response Time Black to White | ||
|---|---|---|
| 12 ms ... rise ↗ and fall ↘ combined | ↗ 4 ms rise | 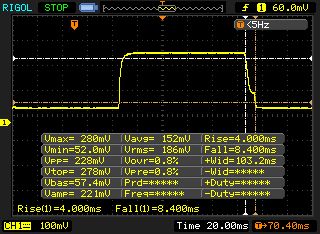 |
| ↘ 8 ms fall | ||
| The screen shows good response rates in our tests, but may be too slow for competitive gamers. In comparison, all tested devices range from 0.1 (minimum) to 240 (maximum) ms. » 26 % of all devices are better. This means that the measured response time is better than the average of all tested devices (21.5 ms). | ||
| ↔ Response Time 50% Grey to 80% Grey | ||
| 25 ms ... rise ↗ and fall ↘ combined | ↗ 12 ms rise | 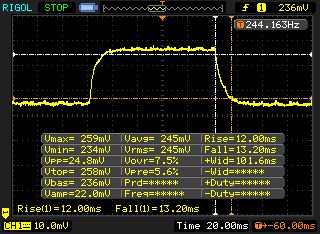 |
| ↘ 13 ms fall | ||
| The screen shows relatively slow response rates in our tests and may be too slow for gamers. In comparison, all tested devices range from 0.2 (minimum) to 636 (maximum) ms. » 30 % of all devices are better. This means that the measured response time is better than the average of all tested devices (33.7 ms). | ||
Screen Flickering / PWM (Pulse-Width Modulation)
| Screen flickering / PWM not detected | 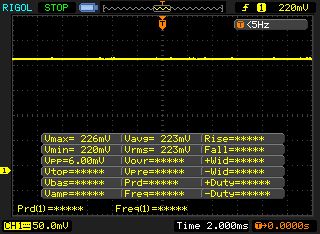 | ||
In comparison: 53 % of all tested devices do not use PWM to dim the display. If PWM was detected, an average of 17903 (minimum: 5 - maximum: 3846000) Hz was measured. | |||
| Cinebench R15 | |
| CPU Single 64Bit | |
| SCHENKER XMG P507 PRO | |
| Alienware 15 R3 | |
| Asus Strix GL502VS-FY032T | |
| Alienware 15 R2 (Skylake) | |
| MSI GT62VR-6RE16H21 | |
| CPU Multi 64Bit | |
| SCHENKER XMG P507 PRO | |
| Alienware 15 R3 | |
| Alienware 15 R2 (Skylake) | |
| Asus Strix GL502VS-FY032T | |
| MSI GT62VR-6RE16H21 | |
| Cinebench R11.5 | |
| CPU Single 64Bit | |
| SCHENKER XMG P507 PRO | |
| Alienware 15 R3 | |
| Alienware 15 R2 (Skylake) | |
| MSI GT62VR-6RE16H21 | |
| Asus Strix GL502VS-FY032T | |
| CPU Multi 64Bit | |
| SCHENKER XMG P507 PRO | |
| Alienware 15 R3 | |
| Alienware 15 R2 (Skylake) | |
| MSI GT62VR-6RE16H21 | |
| Asus Strix GL502VS-FY032T | |
| PCMark 8 | |
| Home Score Accelerated v2 | |
| Alienware 15 R3 | |
| Asus Strix GL502VS-FY032T | |
| MSI GT62VR-6RE16H21 | |
| SCHENKER XMG P507 PRO | |
| Alienware 15 R2 (Skylake) | |
| Work Score Accelerated v2 | |
| Alienware 15 R3 | |
| SCHENKER XMG P507 PRO | |
| Alienware 15 R2 (Skylake) | |
| Asus Strix GL502VS-FY032T | |
| MSI GT62VR-6RE16H21 | |
| PCMark 7 - Score | |
| Alienware 15 R3 | |
| SCHENKER XMG P507 PRO | |
| MSI GT62VR-6RE16H21 | |
| Alienware 15 R2 (Skylake) | |
| PCMark 7 Score | 6886 puan | |
| PCMark 8 Home Score Accelerated v2 | 4966 puan | |
| PCMark 8 Creative Score Accelerated v2 | 7678 puan | |
| PCMark 8 Work Score Accelerated v2 | 5299 puan | |
Yardım | ||
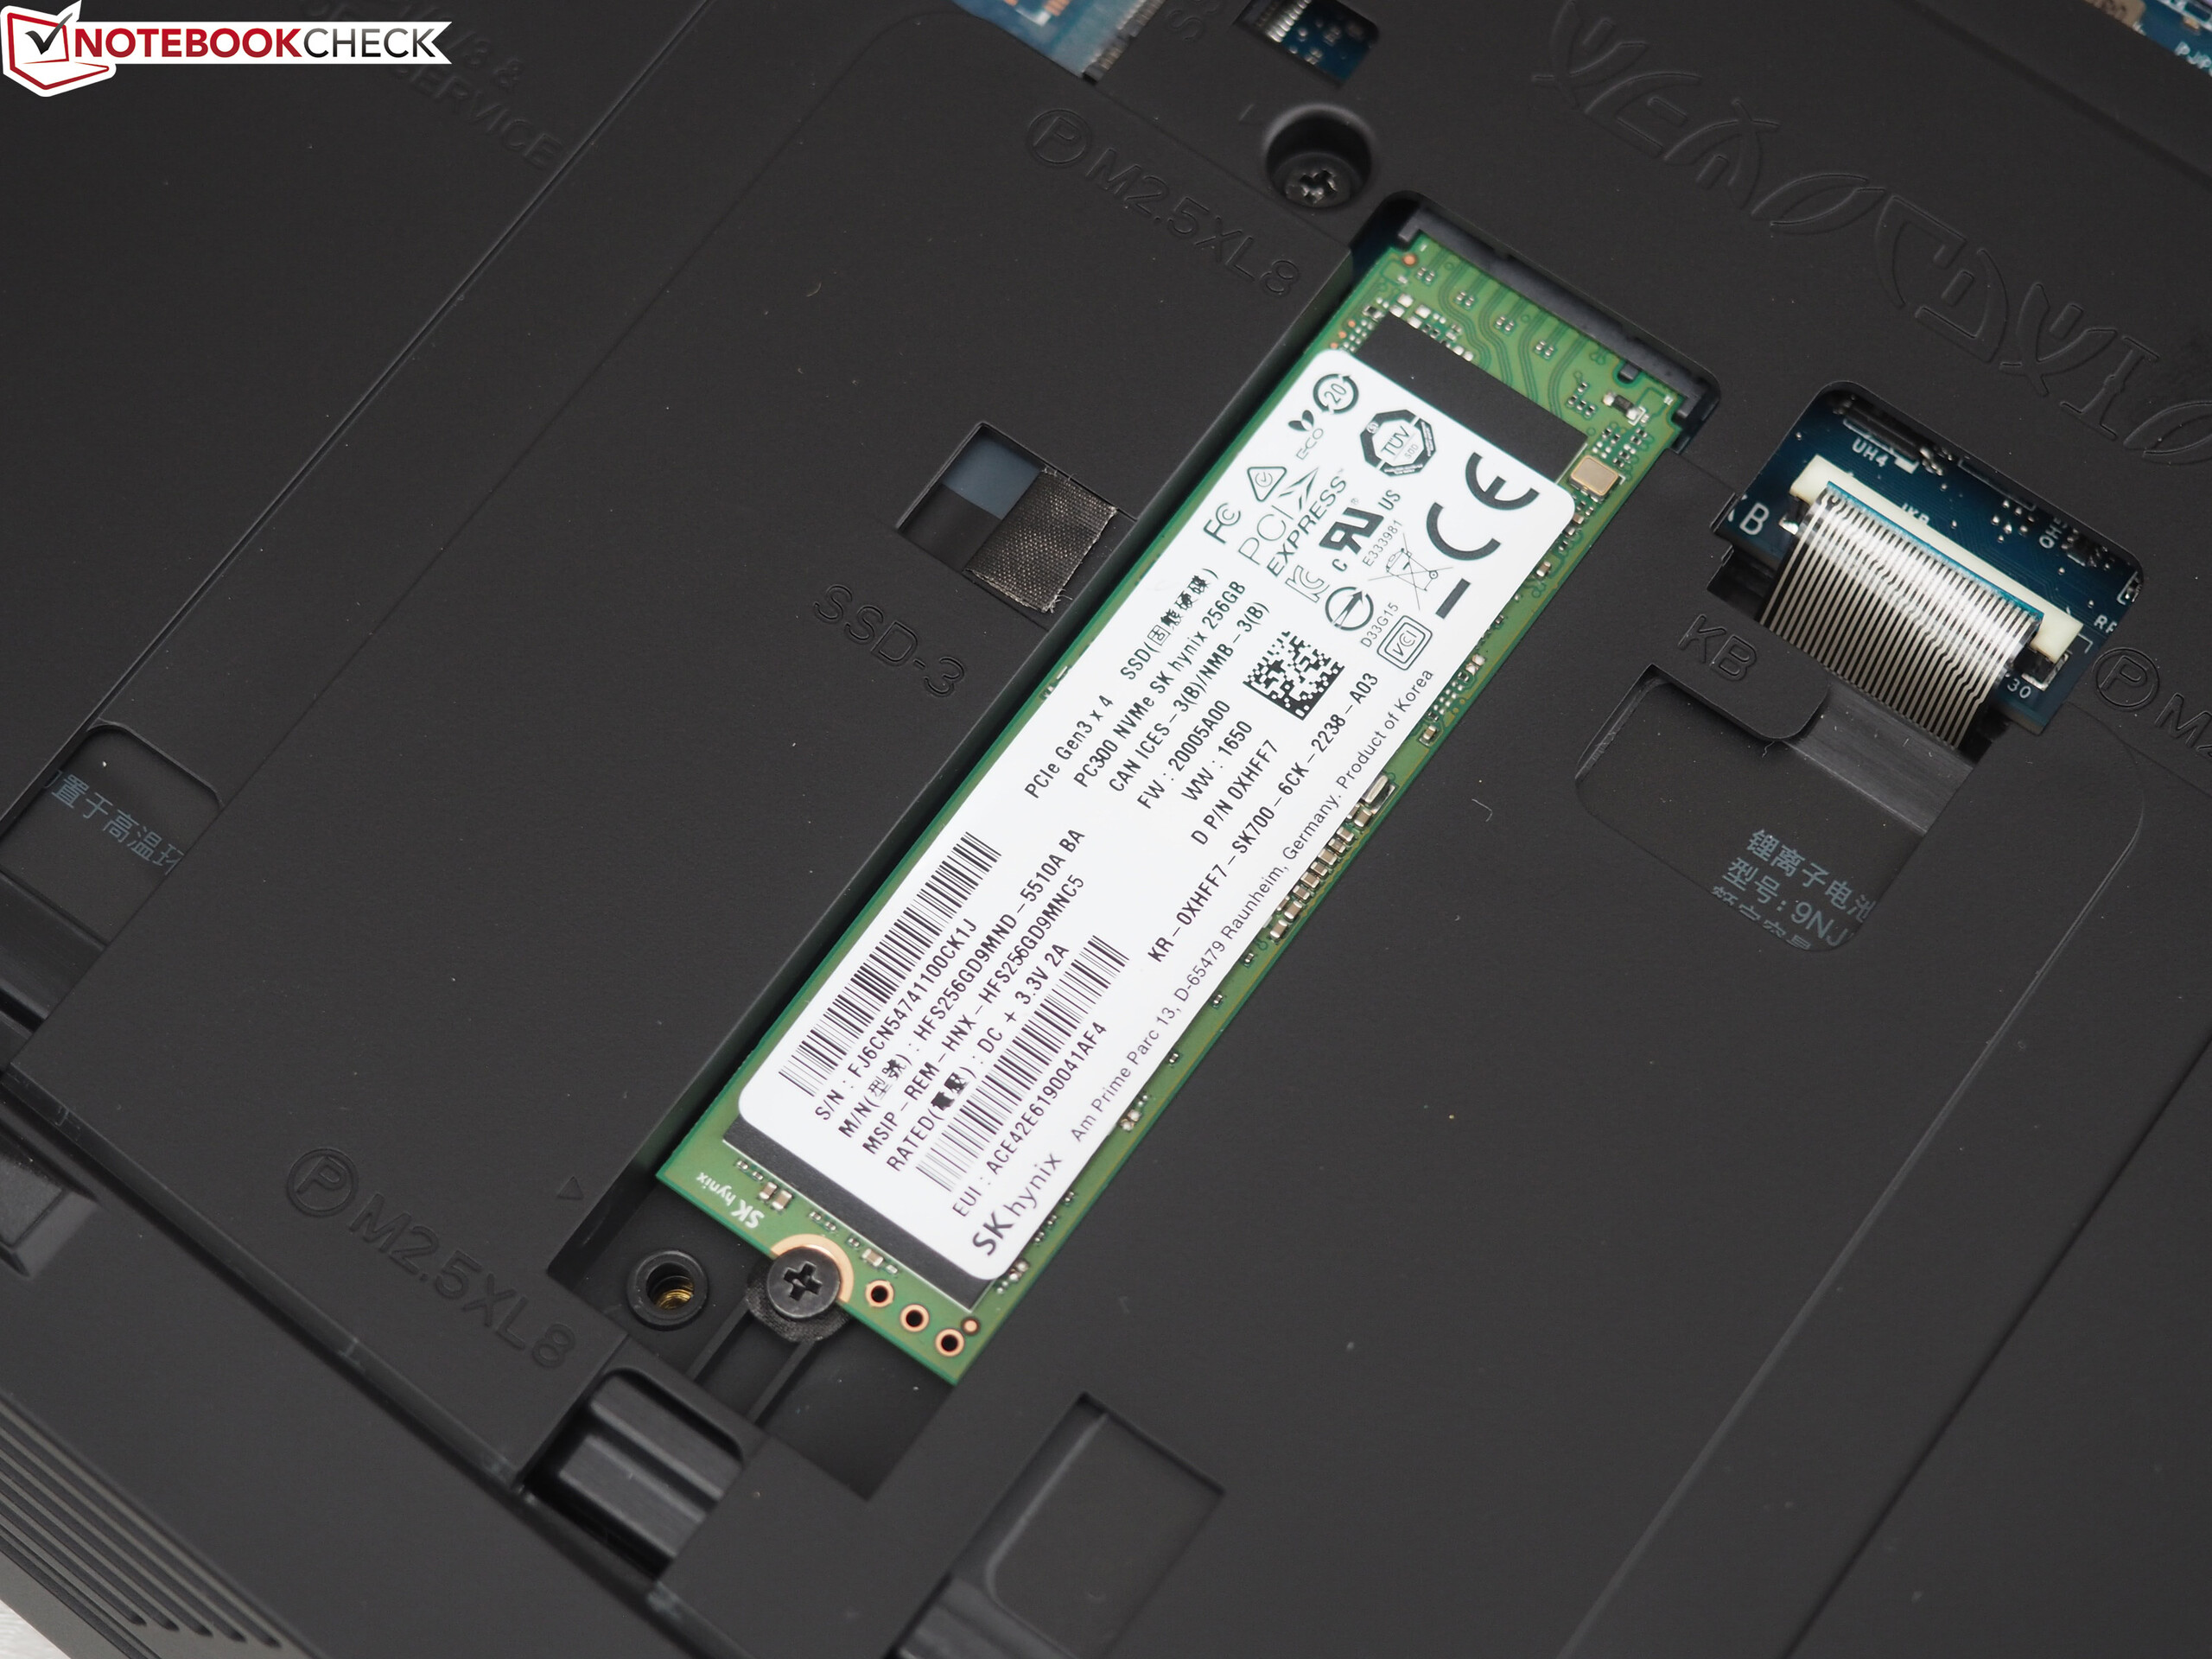
| Alienware 15 R3 | Alienware 15 R2 (Skylake) Samsung PM951 NVMe MZ-VLV256D | Asus Strix GL502VS-FY032T SanDisk SD8SNAT256G1002 | MSI GT62VR-6RE16H21 Toshiba HG6 THNSNJ256G8NY | SCHENKER XMG P507 PRO Samsung SSD 960 Evo 500GB m.2 NVMe | |
|---|---|---|---|---|---|
| CrystalDiskMark 3.0 | -7% | -44% | -23% | 104% | |
| Read Seq | 1123 | 1213 8% | 485.4 -57% | 523 -53% | 1718 53% |
| Write Seq | 429.2 | 306 -29% | 312.4 -27% | 485.5 13% | 1635 281% |
| Read 512 | 833 | 652 -22% | 294.8 -65% | 444.7 -47% | 873 5% |
| Write 512 | 428.1 | 304.8 -29% | 287.8 -33% | 471.2 10% | 1216 184% |
| Read 4k | 37.8 | 42.62 13% | 21.44 -43% | 21.86 -42% | 59.1 56% |
| Write 4k | 122.9 | 143.7 17% | 75.7 -38% | 98.8 -20% | 177.5 44% |

| 3DMark - 1920x1080 Fire Strike Graphics | |
| Alienware 15 R3 | |
| MSI GT62VR-6RE16H21 | |
| SCHENKER XMG P507 PRO | |
| Asus Strix GL502VS-FY032T | |
| Alienware 15 R2 (Skylake) | |
| 3DMark 11 - 1280x720 Performance GPU | |
| Alienware 15 R3 | |
| MSI GT62VR-6RE16H21 | |
| Asus Strix GL502VS-FY032T | |
| SCHENKER XMG P507 PRO | |
| Alienware 15 R2 (Skylake) | |
| Unigine Heaven 4.0 - Extreme Preset DX11 | |
| Alienware 15 R3 | |
| SCHENKER XMG P507 PRO | |
| MSI GT62VR-6RE16H21 | |
| Alienware 15 R2 (Skylake) | |
| 3DMark 11 Performance | 16435 puan | |
| 3DMark Ice Storm Standard Score | 135715 puan | |
| 3DMark Cloud Gate Standard Score | 26672 puan | |
| 3DMark Fire Strike Score | 13728 puan | |
Yardım | ||
| Titanfall 2 | |
| 1920x1080 Very High (Insane Texture Quality) / Enabled AA:TS AF:16x | |
| Alienware 15 R3 | |
| SCHENKER XMG P507 PRO | |
| 1920x1080 High / Enabled AA:TS AF:8x | |
| Alienware 15 R3 | |
| SCHENKER XMG P507 PRO | |
| Call of Duty Infinite Warfare | |
| 1920x1080 Ultra / On AA:T2X SM | |
| Alienware 15 R3 | |
| SCHENKER XMG P507 PRO | |
| 1920x1080 High / On AA:FX | |
| Alienware 15 R3 | |
| SCHENKER XMG P507 PRO | |
| Dishonored 2 | |
| 1920x1080 Ultra Preset AA:TX | |
| Alienware 15 R3 | |
| SCHENKER XMG P507 PRO | |
| 1920x1080 High Preset AA:TX | |
| SCHENKER XMG P507 PRO | |
| Alienware 15 R3 | |
| Watch Dogs 2 | |
| 1920x1080 Ultra Preset | |
| Alienware 15 R3 | |
| SCHENKER XMG P507 PRO | |
| 1920x1080 High Preset | |
| Alienware 15 R3 | |
| SCHENKER XMG P507 PRO | |
| Resident Evil 7 | |
| 1920x1080 Very High / On AA:FXAA+T | |
| Alienware 15 R3 | |
| 1920x1080 High / On AA:FXAA+T | |
| Alienware 15 R3 | |
| Battlefield 1 | |
| 1920x1080 Ultra Preset AA:T | |
| Alienware 15 R3 | |
| 1920x1080 High Preset AA:T | |
| Alienware 15 R3 | |
| düşük | orta | yüksek | ultra | |
| Battlefield 1 (2016) | 121 | 109 | ||
| Titanfall 2 (2016) | 132 | 121 | ||
| Call of Duty Infinite Warfare (2016) | 121 | 114 | ||
| Dishonored 2 (2016) | 85 | 73.3 | ||
| Watch Dogs 2 (2016) | 83.2 | 62.9 | ||
| Resident Evil 7 (2017) | 156 | 130 |
Ses yüksekliği
| Boşta |
| 31 / 32 / 42 dB |
| HDD |
| 32 dB |
| Çalışırken |
| 49 / 50 dB |
 | ||
30 dB sessiz 40 dB(A) duyulabilirlik 50 dB(A) gürültülü |
||
min: | ||
| Alienware 15 R3 GeForce GTX 1070 Mobile, i7-7700HQ | Alienware 15 R2 (Skylake) GeForce GTX 980M, 6700HQ | Asus Strix GL502VS-FY032T GeForce GTX 1070 Mobile, 6700HQ | MSI GT62VR-6RE16H21 GeForce GTX 1070 Mobile, 6700HQ | SCHENKER XMG P507 PRO GeForce GTX 1070 Mobile, i7-7700HQ | |
|---|---|---|---|---|---|
| Noise | 4% | 5% | 7% | -3% | |
| off / environment * | 30 | 30 -0% | 30 -0% | 31 -3% | |
| Idle Minimum * | 31 | 33.6 -8% | 32 -3% | 32 -3% | 33 -6% |
| Idle Average * | 32 | 33.8 -6% | 33 -3% | 33 -3% | 34 -6% |
| Idle Maximum * | 42 | 34 19% | 34 19% | 34 19% | 44 -5% |
| Load Average * | 49 | 39.3 20% | 39 20% | 40 18% | 46 6% |
| Load Maximum * | 50 | 51.4 -3% | 51 -2% | 46 8% | 52 -4% |
* ... smaller is better
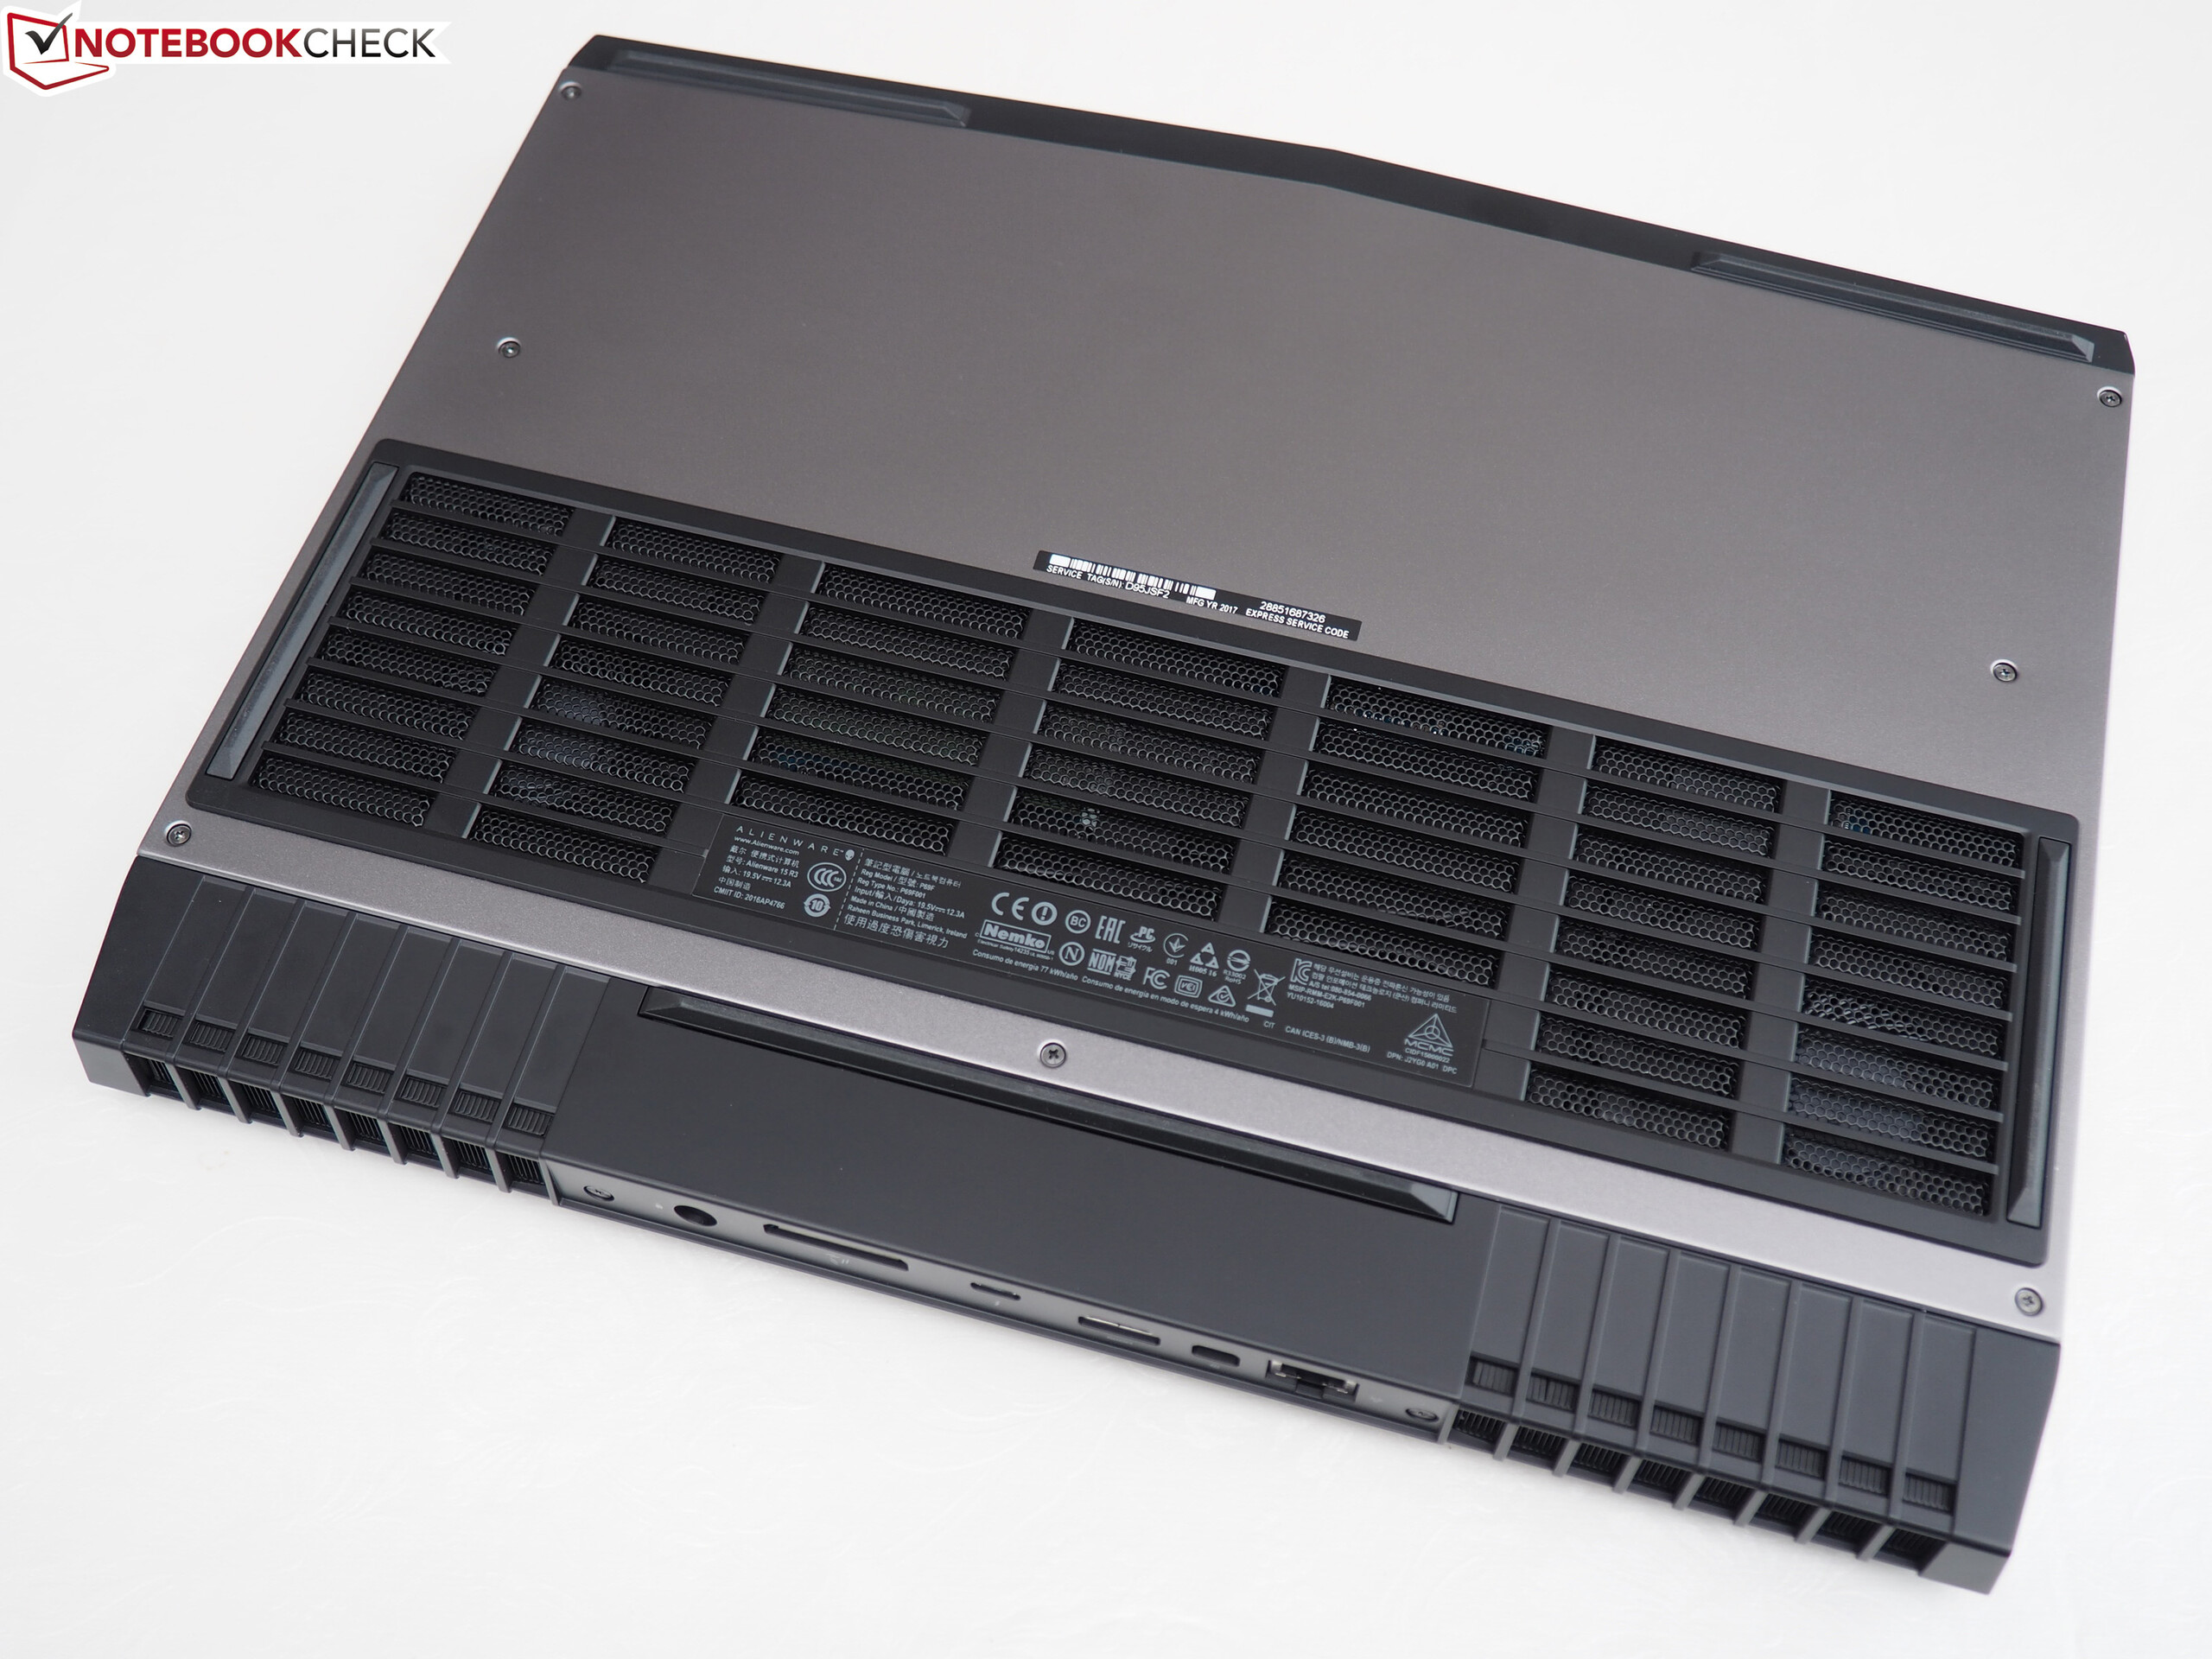
(-) The maximum temperature on the upper side is 46 °C / 115 F, compared to the average of 40.4 °C / 105 F, ranging from 21.2 to 68.8 °C for the class Gaming.
(-) The bottom heats up to a maximum of 51.8 °C / 125 F, compared to the average of 43.2 °C / 110 F
(+) In idle usage, the average temperature for the upper side is 31.7 °C / 89 F, compared to the device average of 33.8 °C / 93 F.
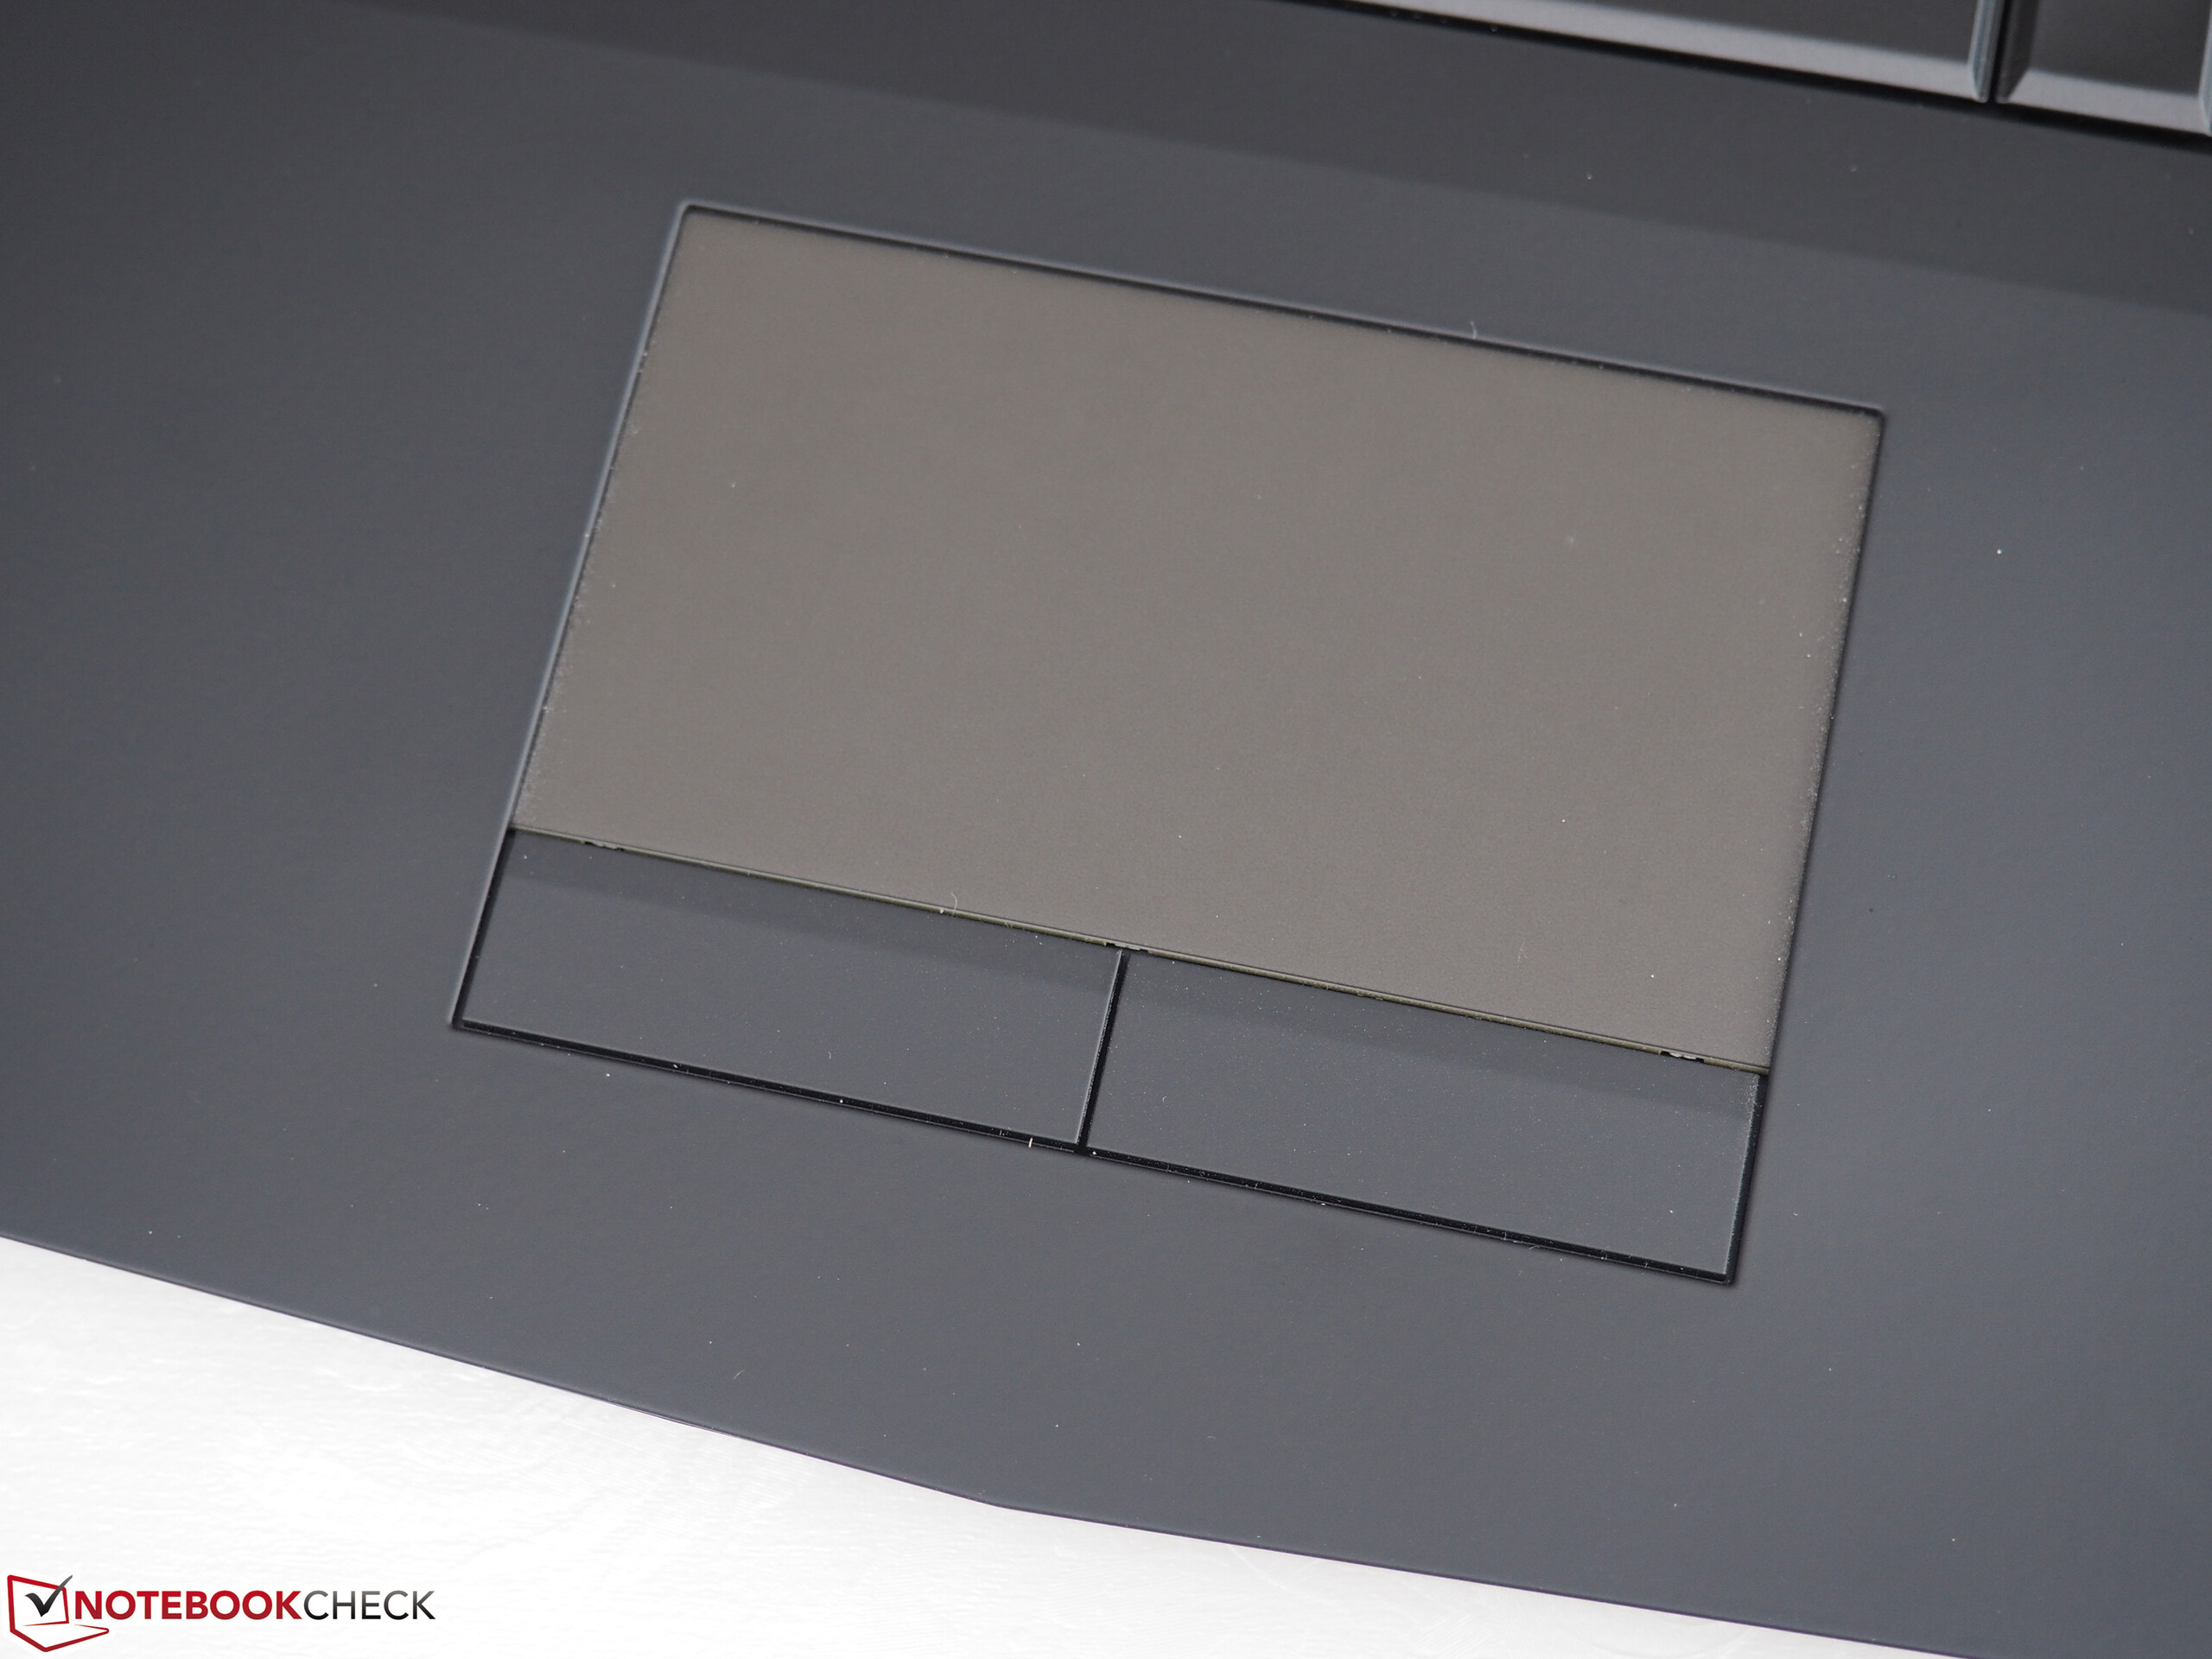
(+) The palmrests and touchpad are cooler than skin temperature with a maximum of 26.6 °C / 79.9 F and are therefore cool to the touch.
(+) The average temperature of the palmrest area of similar devices was 28.9 °C / 84 F (+2.3 °C / 4.1 F).
| Alienware 15 R3 GeForce GTX 1070 Mobile, i7-7700HQ | Alienware 15 R2 (Skylake) GeForce GTX 980M, 6700HQ | Asus Strix GL502VS-FY032T GeForce GTX 1070 Mobile, 6700HQ | MSI GT62VR-6RE16H21 GeForce GTX 1070 Mobile, 6700HQ | SCHENKER XMG P507 PRO GeForce GTX 1070 Mobile, i7-7700HQ | |
|---|---|---|---|---|---|
| Heat | 3% | 9% | 12% | -1% | |
| Maximum Upper Side * | 46 | 48 -4% | 48 -4% | 44 4% | 49.2 -7% |
| Maximum Bottom * | 51.8 | 57.3 -11% | 46.8 10% | 53.1 -3% | 62 -20% |
| Idle Upper Side * | 36.5 | 31.9 13% | 33.7 8% | 28.8 21% | 32.4 11% |
| Idle Bottom * | 38.2 | 33.4 13% | 30.5 20% | 28.2 26% | 33 14% |
* ... smaller is better
Alienware 15 R3 audio analysis
(+) | speakers can play relatively loud (82 dB)
Bass 100 - 315 Hz
(-) | nearly no bass - on average 19.1% lower than median
(±) | linearity of bass is average (10.4% delta to prev. frequency)
Mids 400 - 2000 Hz
(±) | higher mids - on average 6.7% higher than median
(±) | linearity of mids is average (7.5% delta to prev. frequency)
Highs 2 - 16 kHz
(+) | balanced highs - only 3.6% away from median
(+) | highs are linear (5.2% delta to prev. frequency)
Overall 100 - 16.000 Hz
(±) | linearity of overall sound is average (21.6% difference to median)
Compared to same class
» 75% of all tested devices in this class were better, 5% similar, 20% worse
» The best had a delta of 6%, average was 18%, worst was 132%
Compared to all devices tested
» 56% of all tested devices were better, 7% similar, 37% worse
» The best had a delta of 4%, average was 25%, worst was 134%
Asus Strix GL502VS-FY032T audio analysis
(±) | speaker loudness is average but good (77 dB)
Bass 100 - 315 Hz
(-) | nearly no bass - on average 16.2% lower than median
(±) | linearity of bass is average (11.9% delta to prev. frequency)
Mids 400 - 2000 Hz
(+) | balanced mids - only 0.7% away from median
(+) | mids are linear (3.1% delta to prev. frequency)
Highs 2 - 16 kHz
(+) | balanced highs - only 3.5% away from median
(±) | linearity of highs is average (7.4% delta to prev. frequency)
Overall 100 - 16.000 Hz
(±) | linearity of overall sound is average (16.8% difference to median)
Compared to same class
» 41% of all tested devices in this class were better, 11% similar, 48% worse
» The best had a delta of 6%, average was 18%, worst was 132%
Compared to all devices tested
» 25% of all tested devices were better, 7% similar, 68% worse
» The best had a delta of 4%, average was 25%, worst was 134%
| Kapalı / Bekleme modu | |
| Boşta | |
| Çalışırken |
|
| Alienware 15 R3 GeForce GTX 1070 Mobile, i7-7700HQ | Alienware 15 R2 (Skylake) GeForce GTX 980M, 6700HQ | Asus Strix GL502VS-FY032T GeForce GTX 1070 Mobile, 6700HQ | MSI GT62VR-6RE16H21 GeForce GTX 1070 Mobile, 6700HQ | SCHENKER XMG P507 PRO GeForce GTX 1070 Mobile, i7-7700HQ | |
|---|---|---|---|---|---|
| Power Consumption | 16% | -1% | -10% | 12% | |
| Idle Minimum * | 19 | 11.4 40% | 20 -5% | 20 -5% | 14 26% |
| Idle Average * | 23 | 16.5 28% | 24 -4% | 26 -13% | 18 22% |
| Idle Maximum * | 29 | 22 24% | 29 -0% | 32 -10% | 24 17% |
| Load Average * | 85 | 94.2 -11% | 86 -1% | 100 -18% | 87 -2% |
| Load Maximum * | 192 | 192.2 -0% | 183 5% | 202 -5% | 201 -5% |
* ... smaller is better
| Alienware 15 R3 GeForce GTX 1070 Mobile, i7-7700HQ, 99 Wh | Alienware 15 R2 (Skylake) GeForce GTX 980M, 6700HQ, 96 Wh | Asus Strix GL502VS-FY032T GeForce GTX 1070 Mobile, 6700HQ, 62 Wh | MSI GT62VR-6RE16H21 GeForce GTX 1070 Mobile, 6700HQ, 75.24 Wh | SCHENKER XMG P507 PRO GeForce GTX 1070 Mobile, i7-7700HQ, 60 Wh | |
|---|---|---|---|---|---|
| Battery Runtime | 63% | -35% | -11% | -23% | |
| Reader / Idle | 382 | 769 101% | 243 -36% | 300 -21% | |
| H.264 | 266 | 456 71% | 213 -20% | ||
| WiFi v1.3 | 264 | 446 69% | 196 -26% | 246 -7% | 195 -26% |
| Load | 102 | 114 12% | 58 -43% | 97 -5% |
Artılar
Eksiler
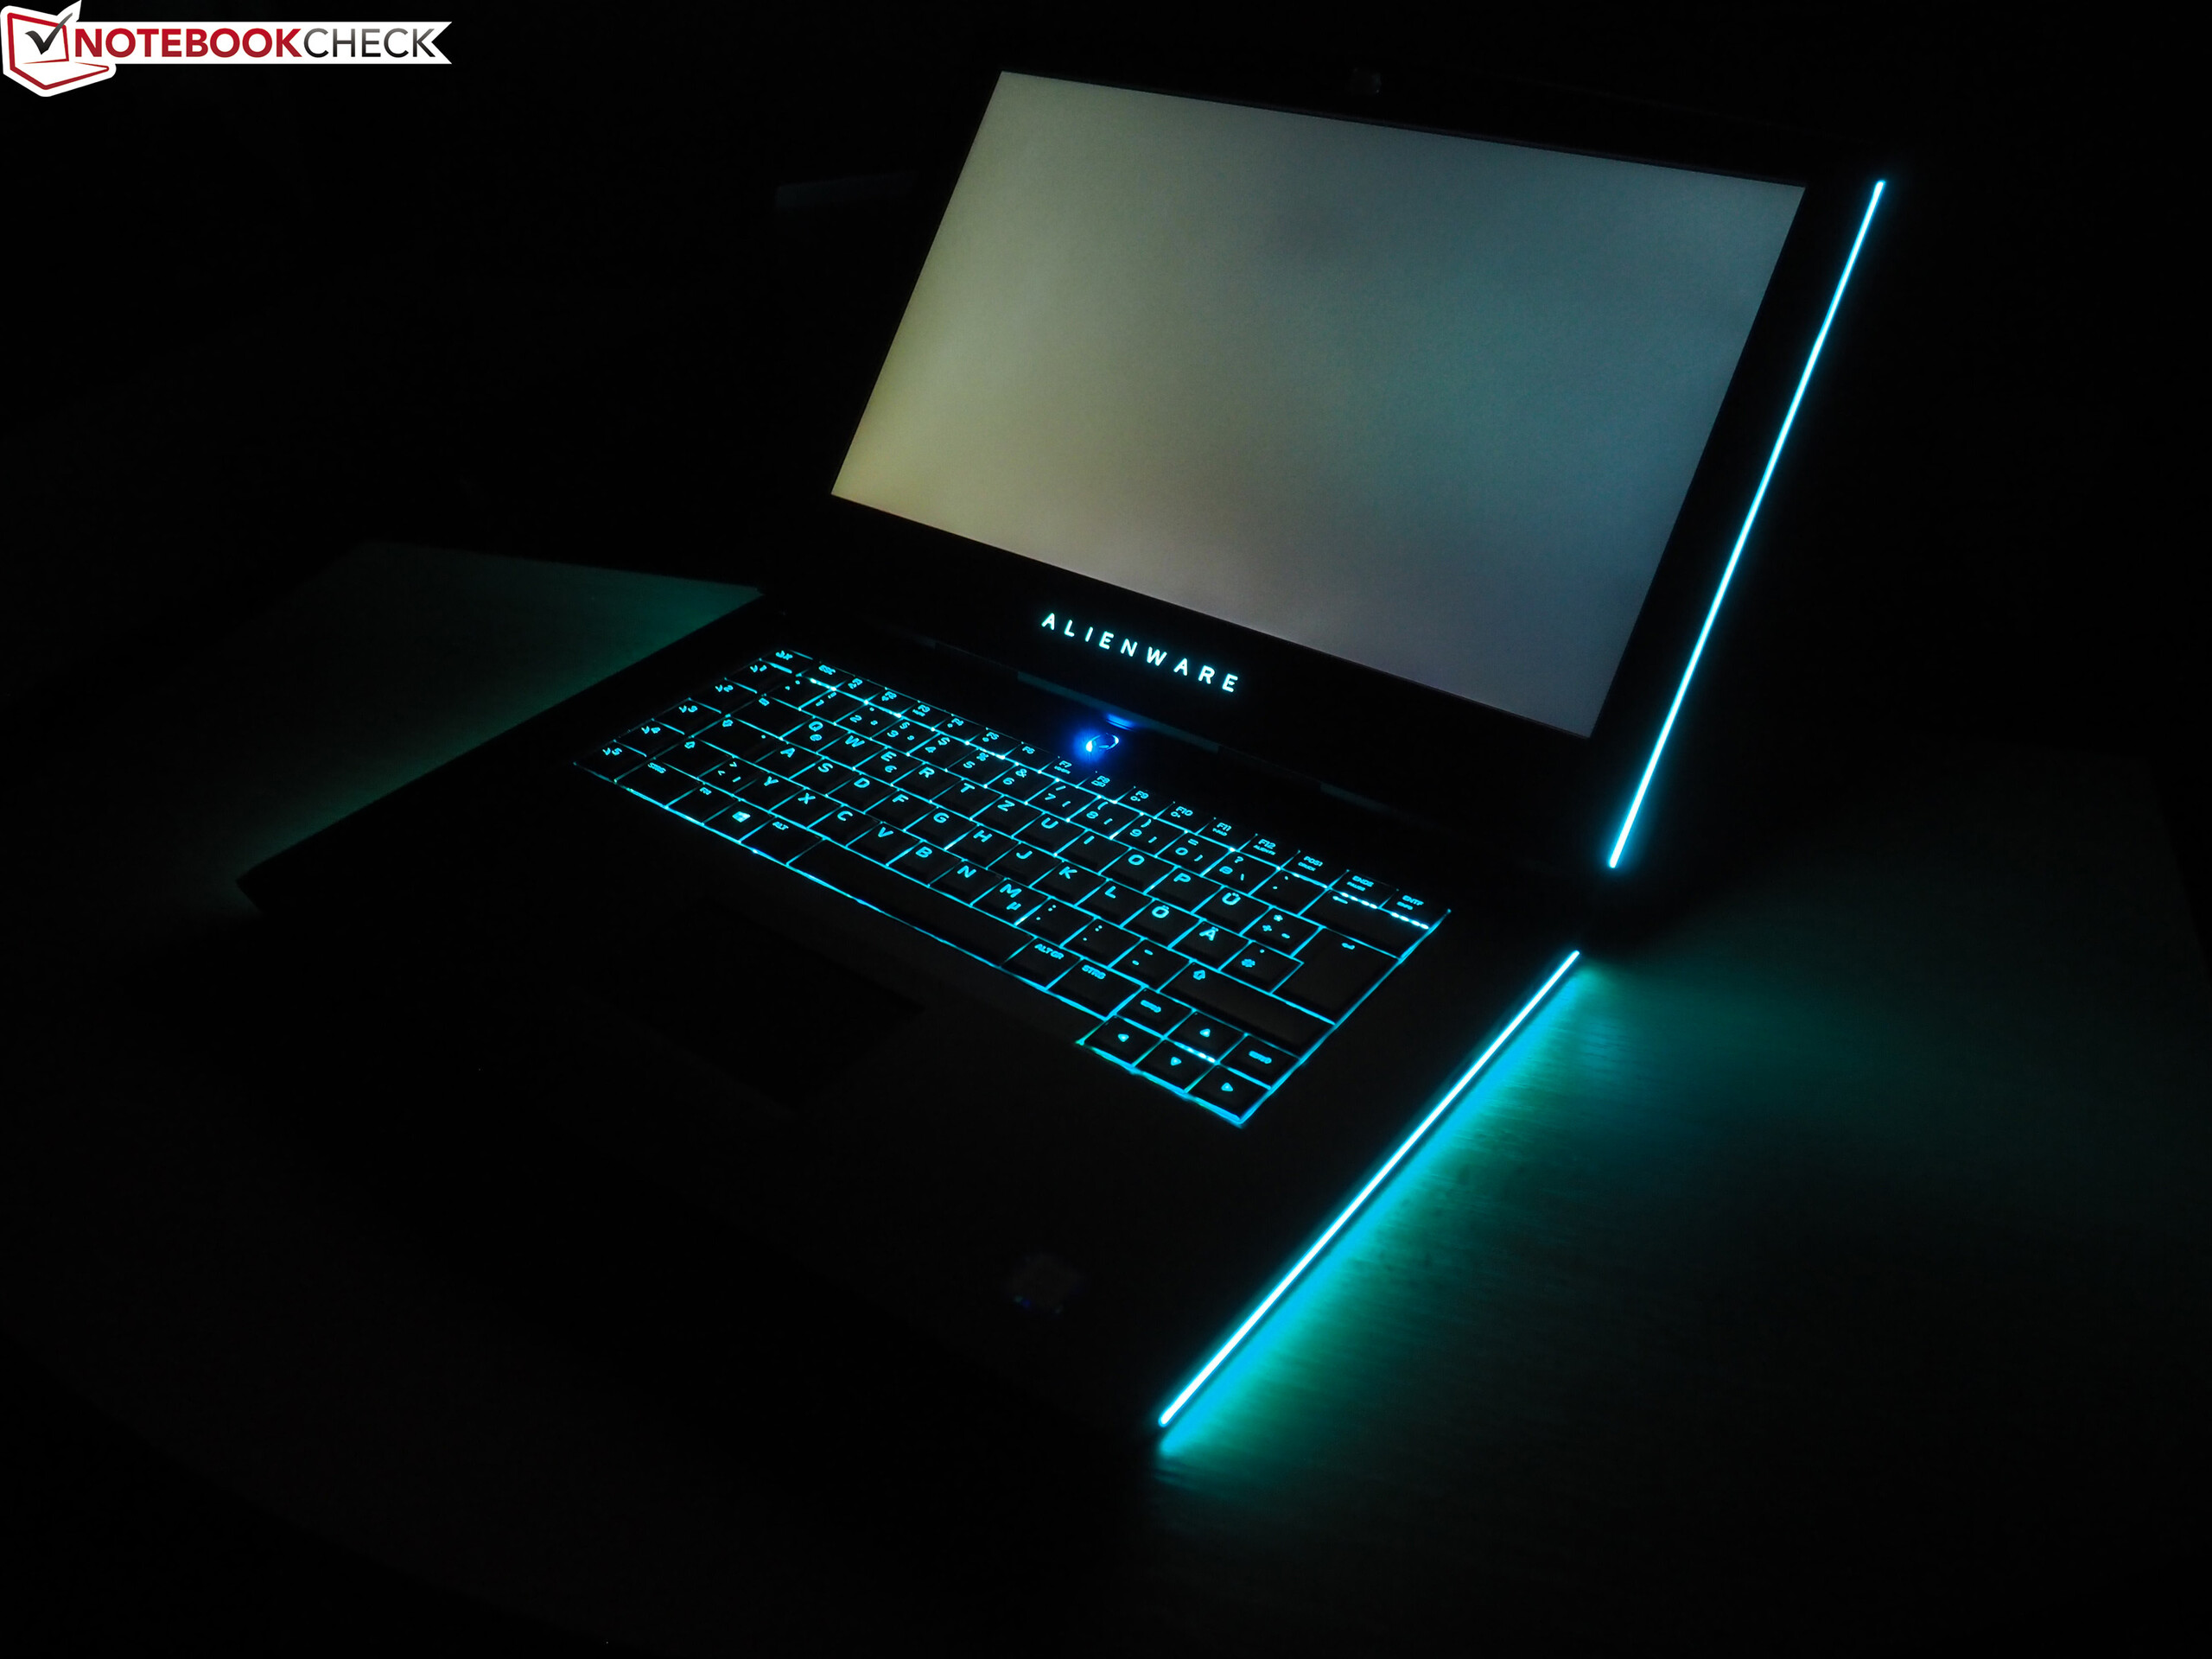
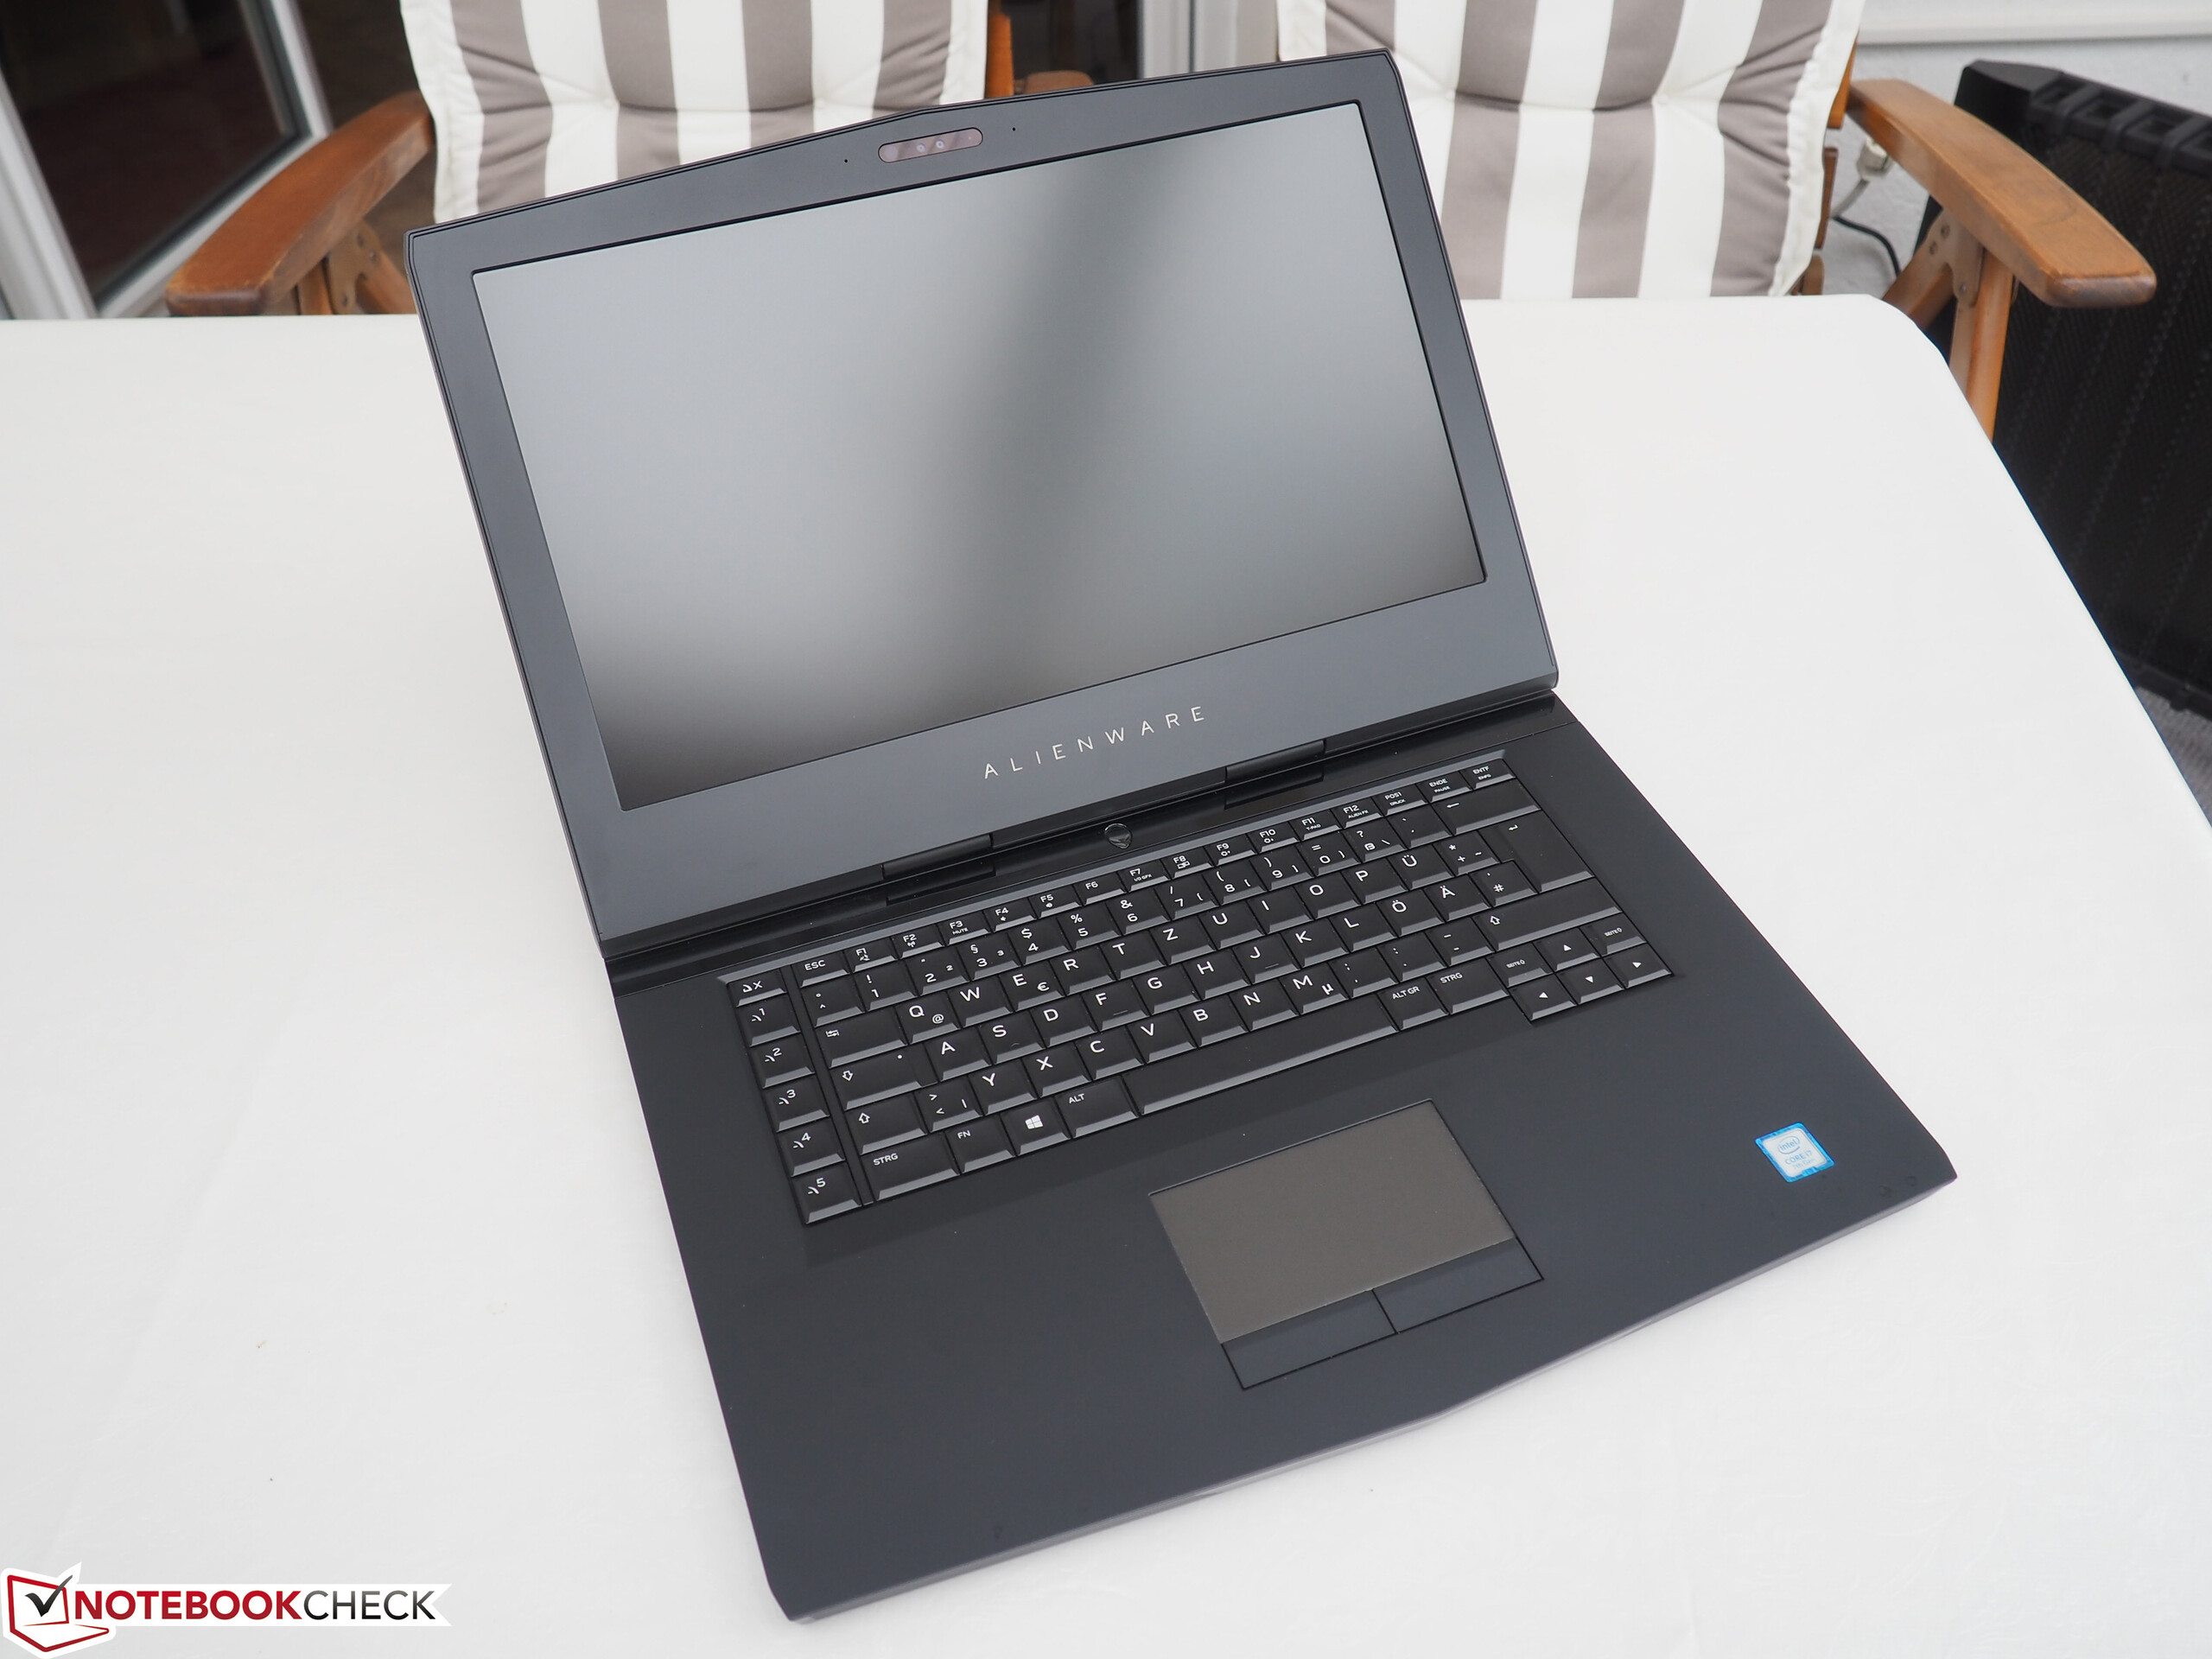
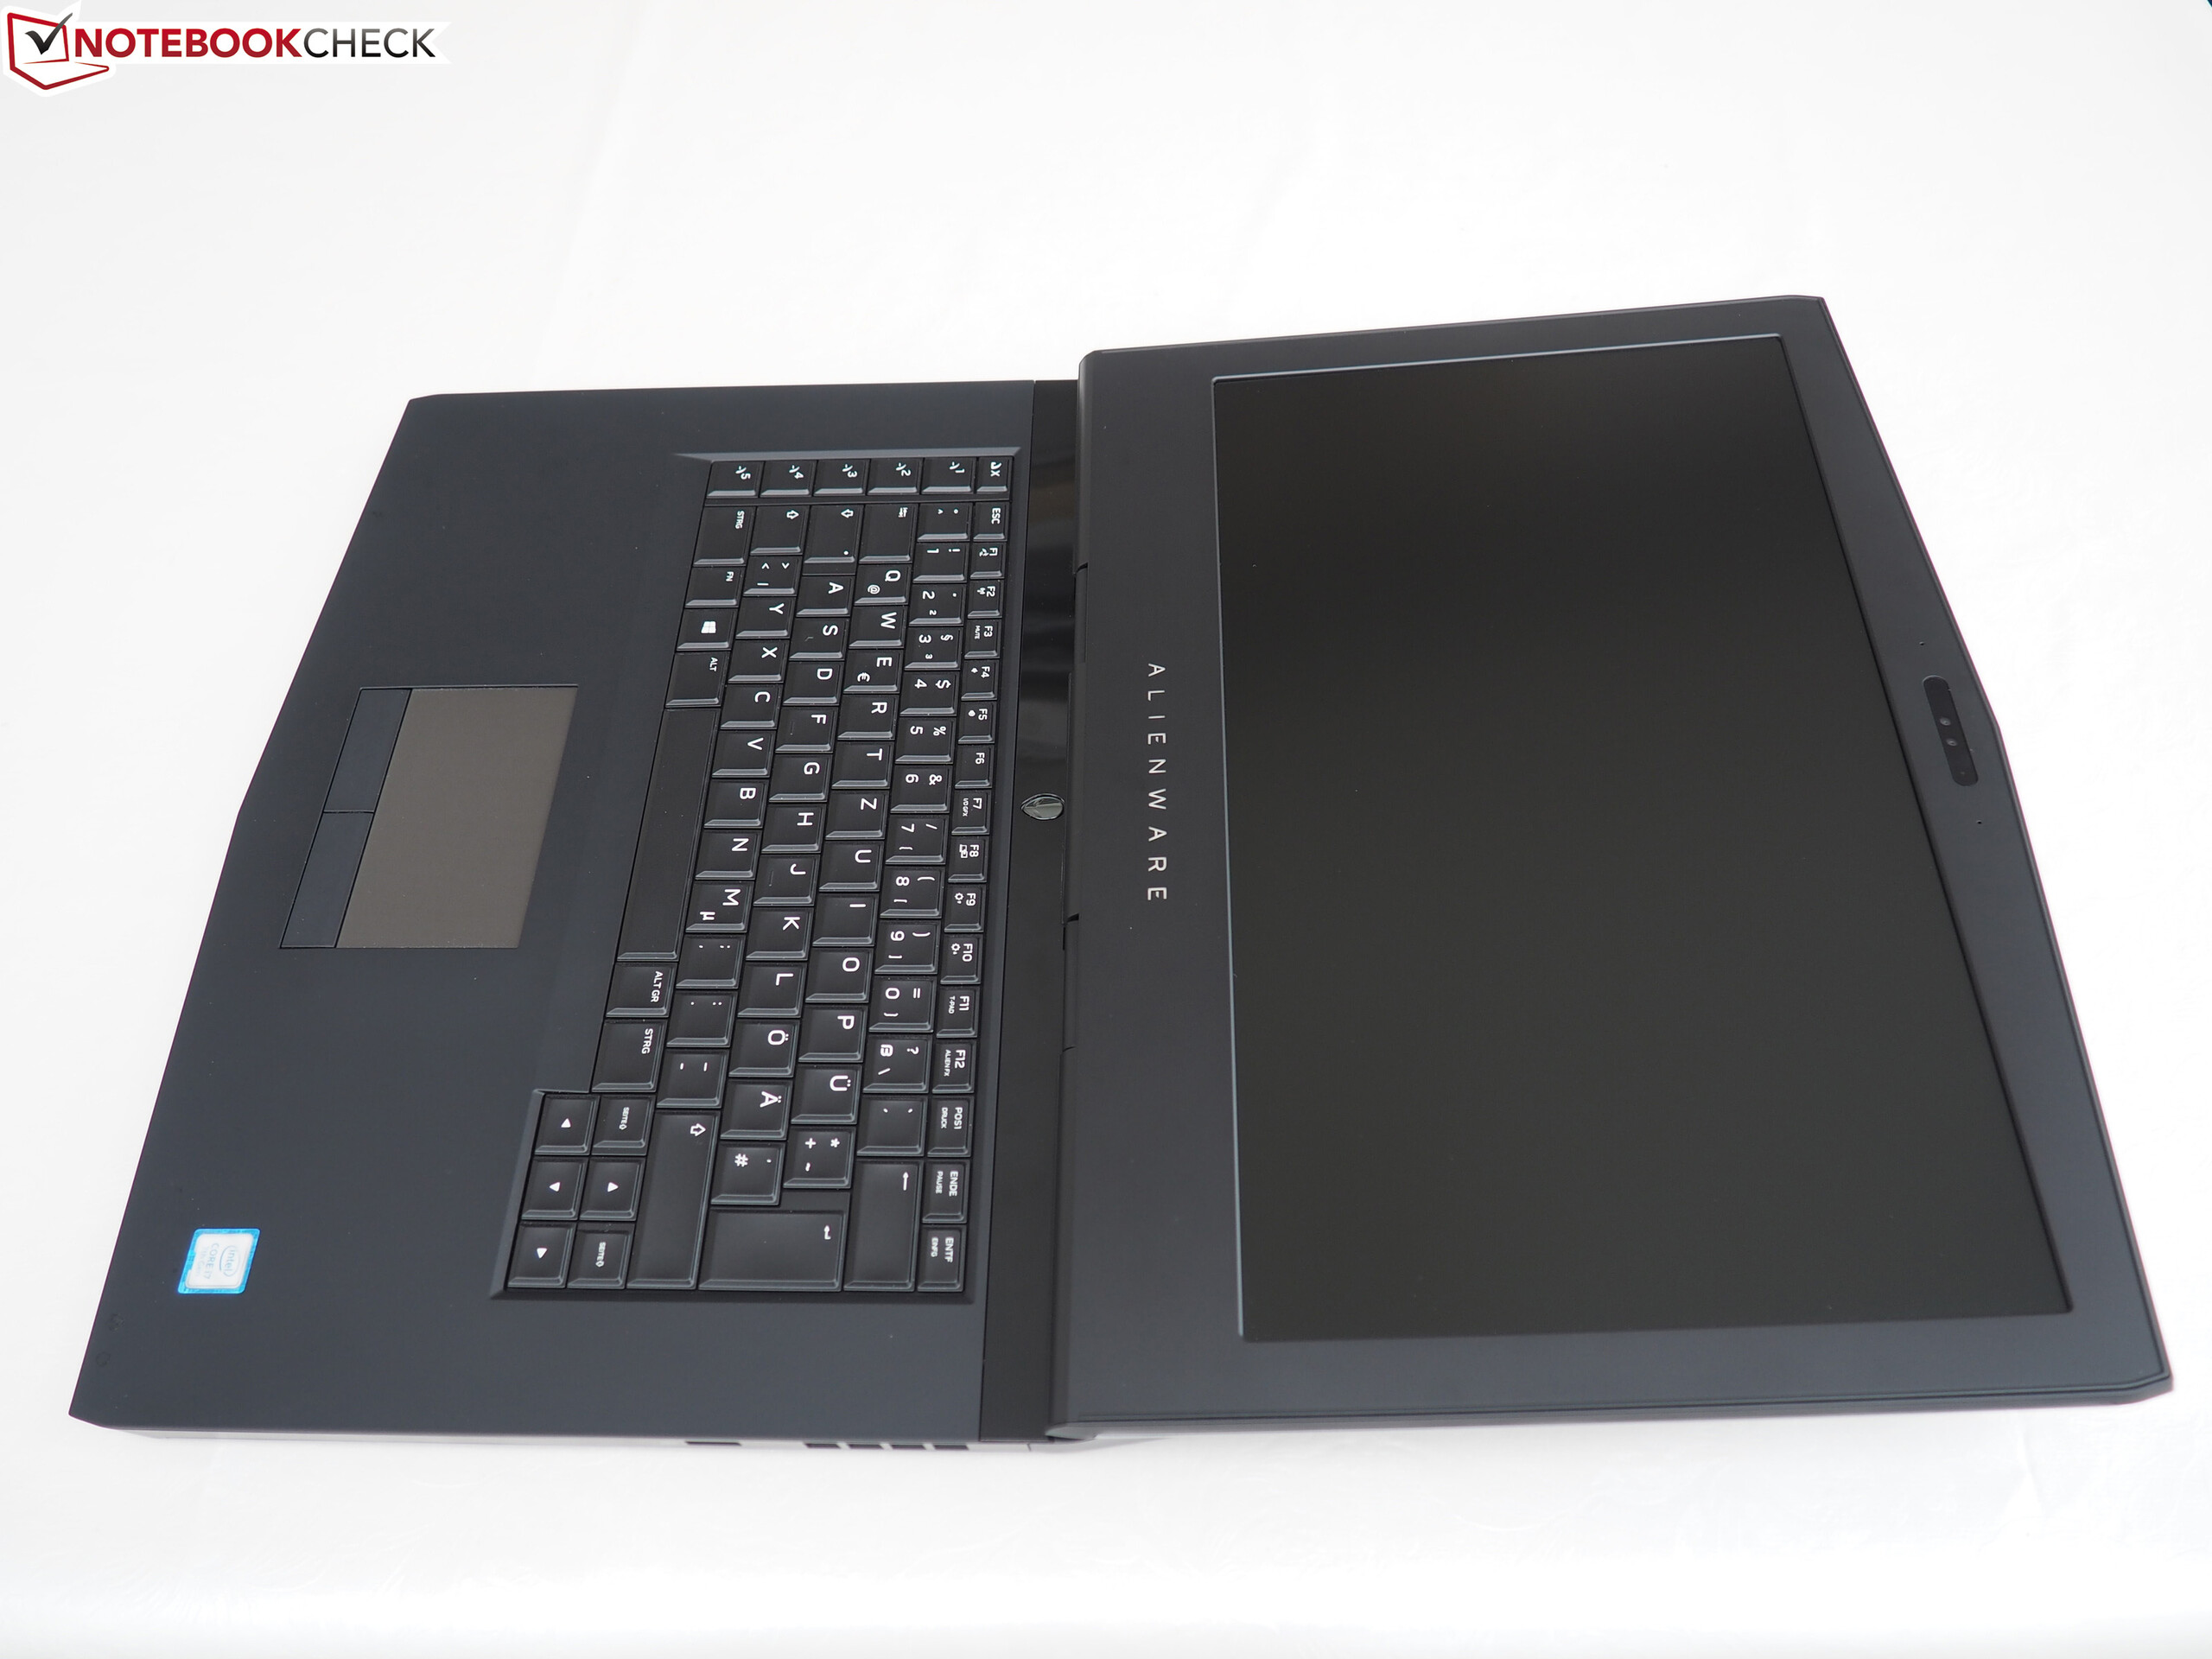
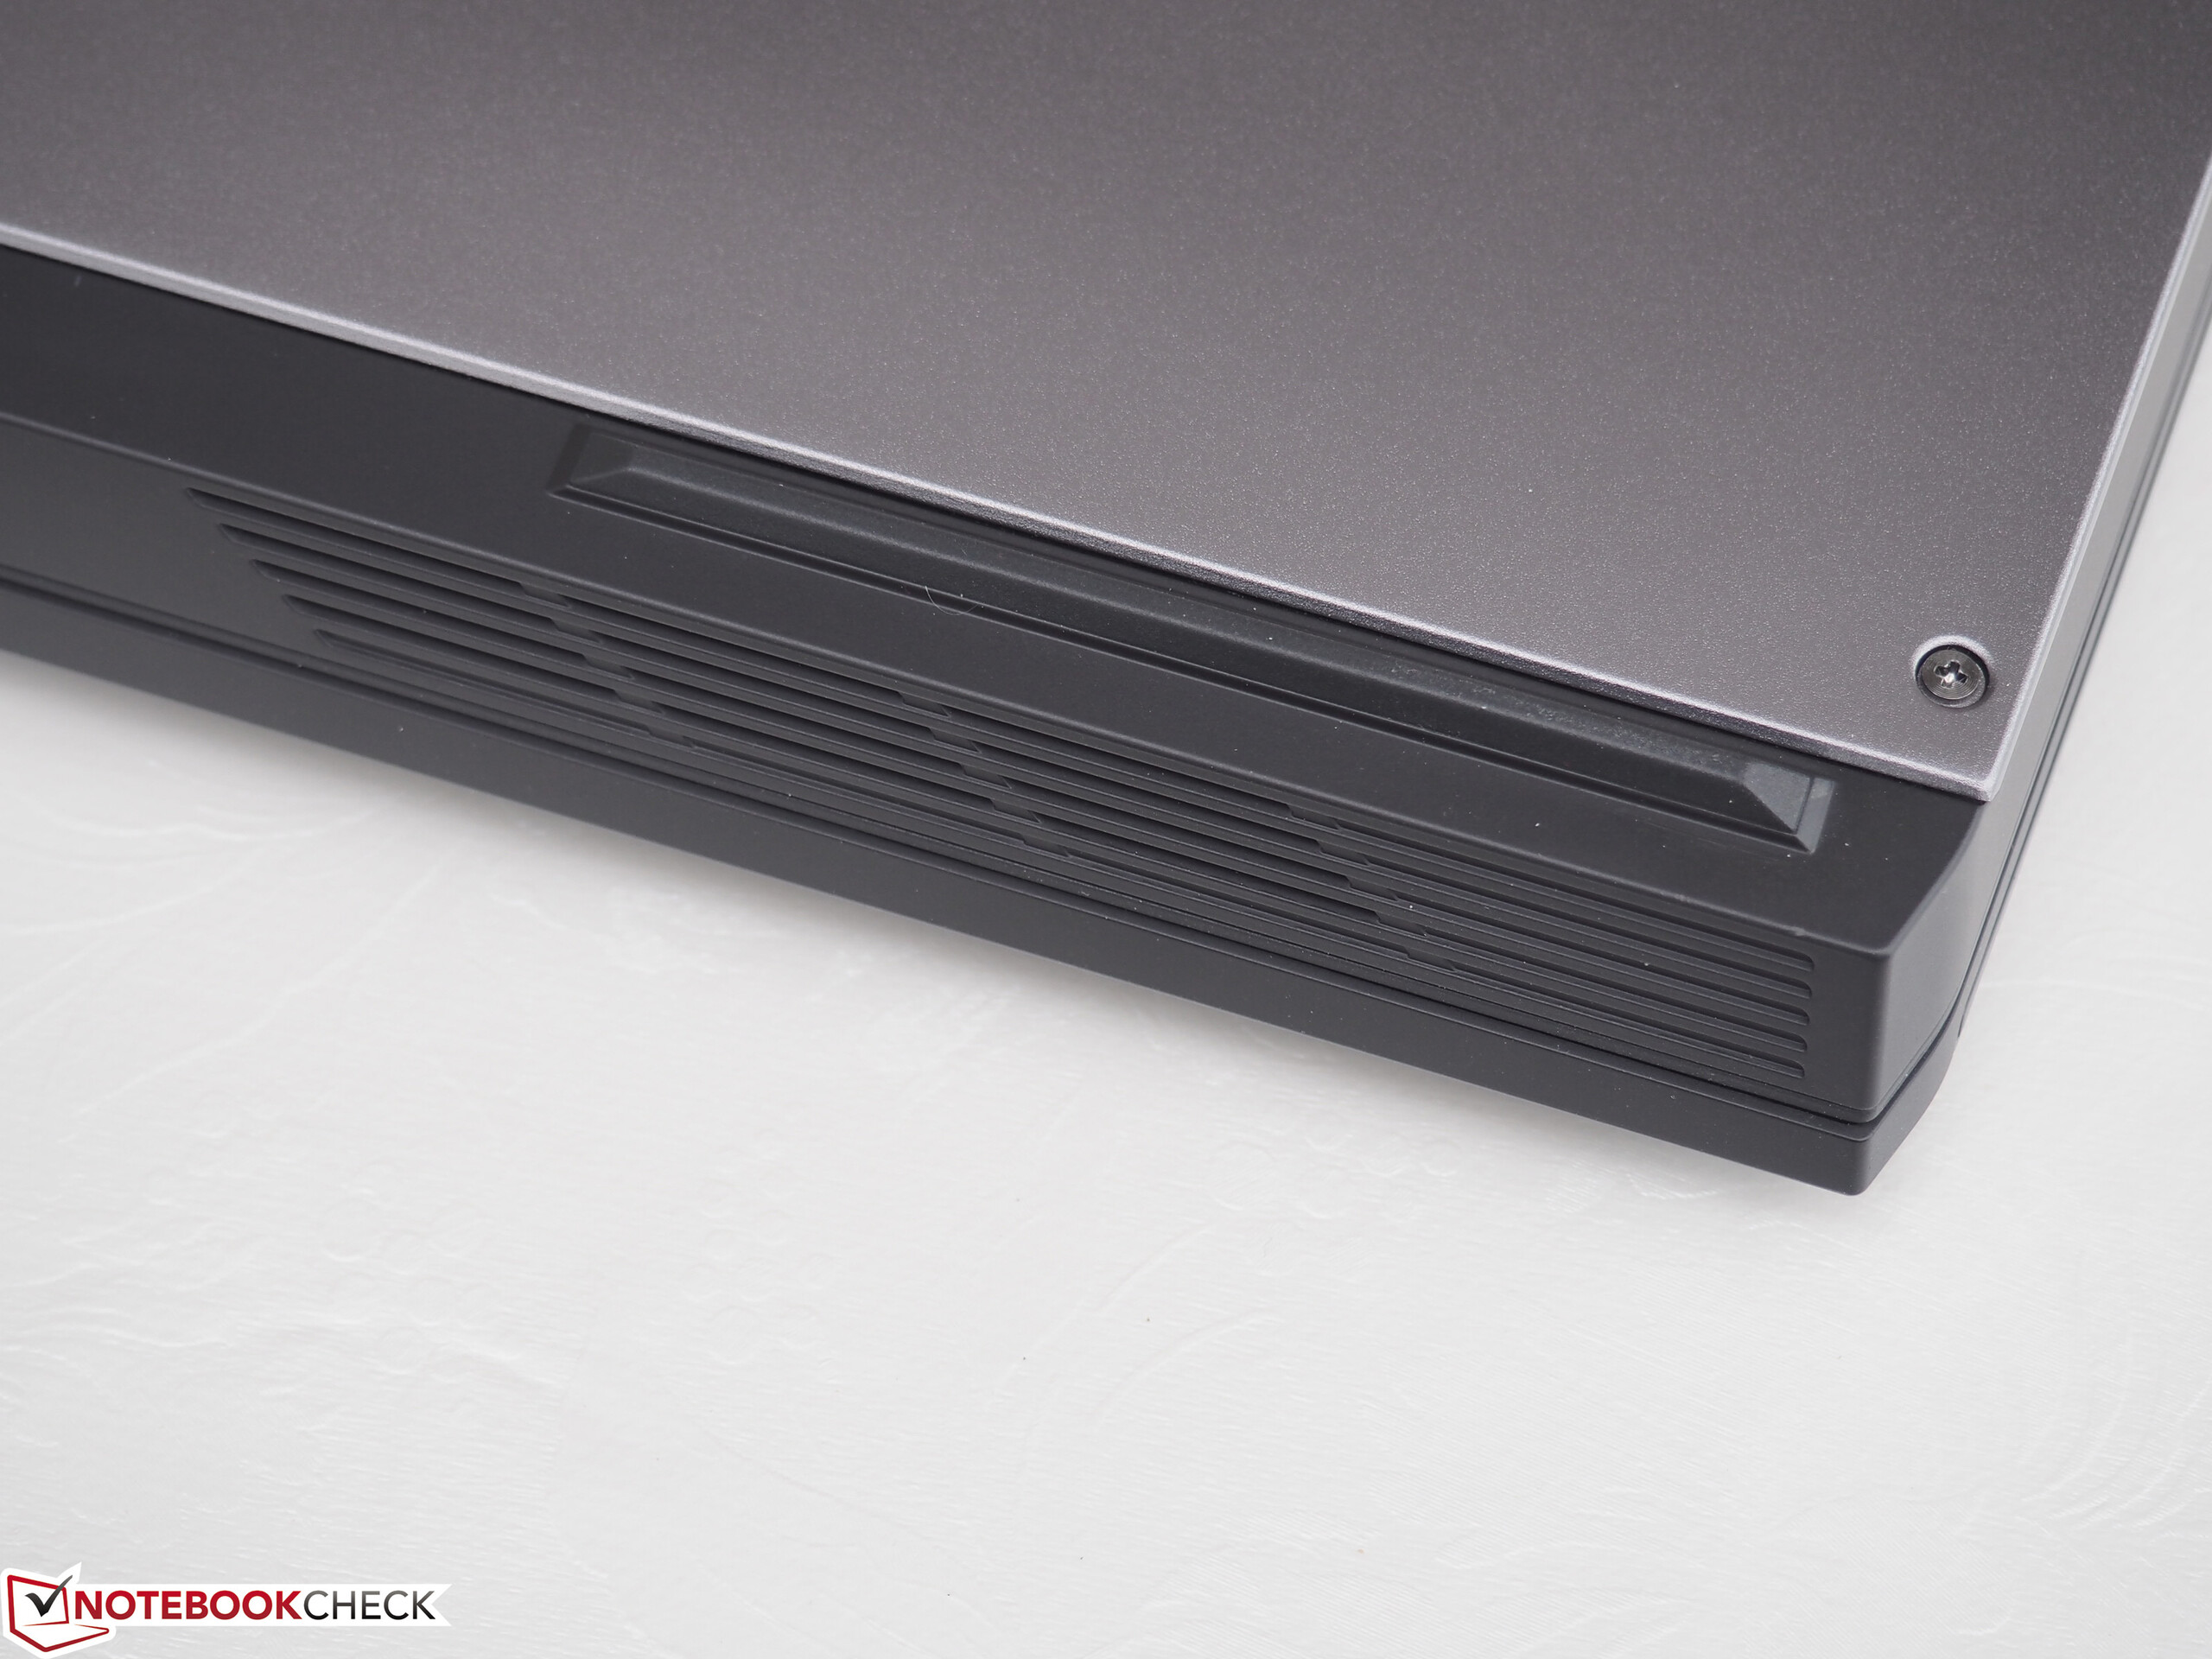
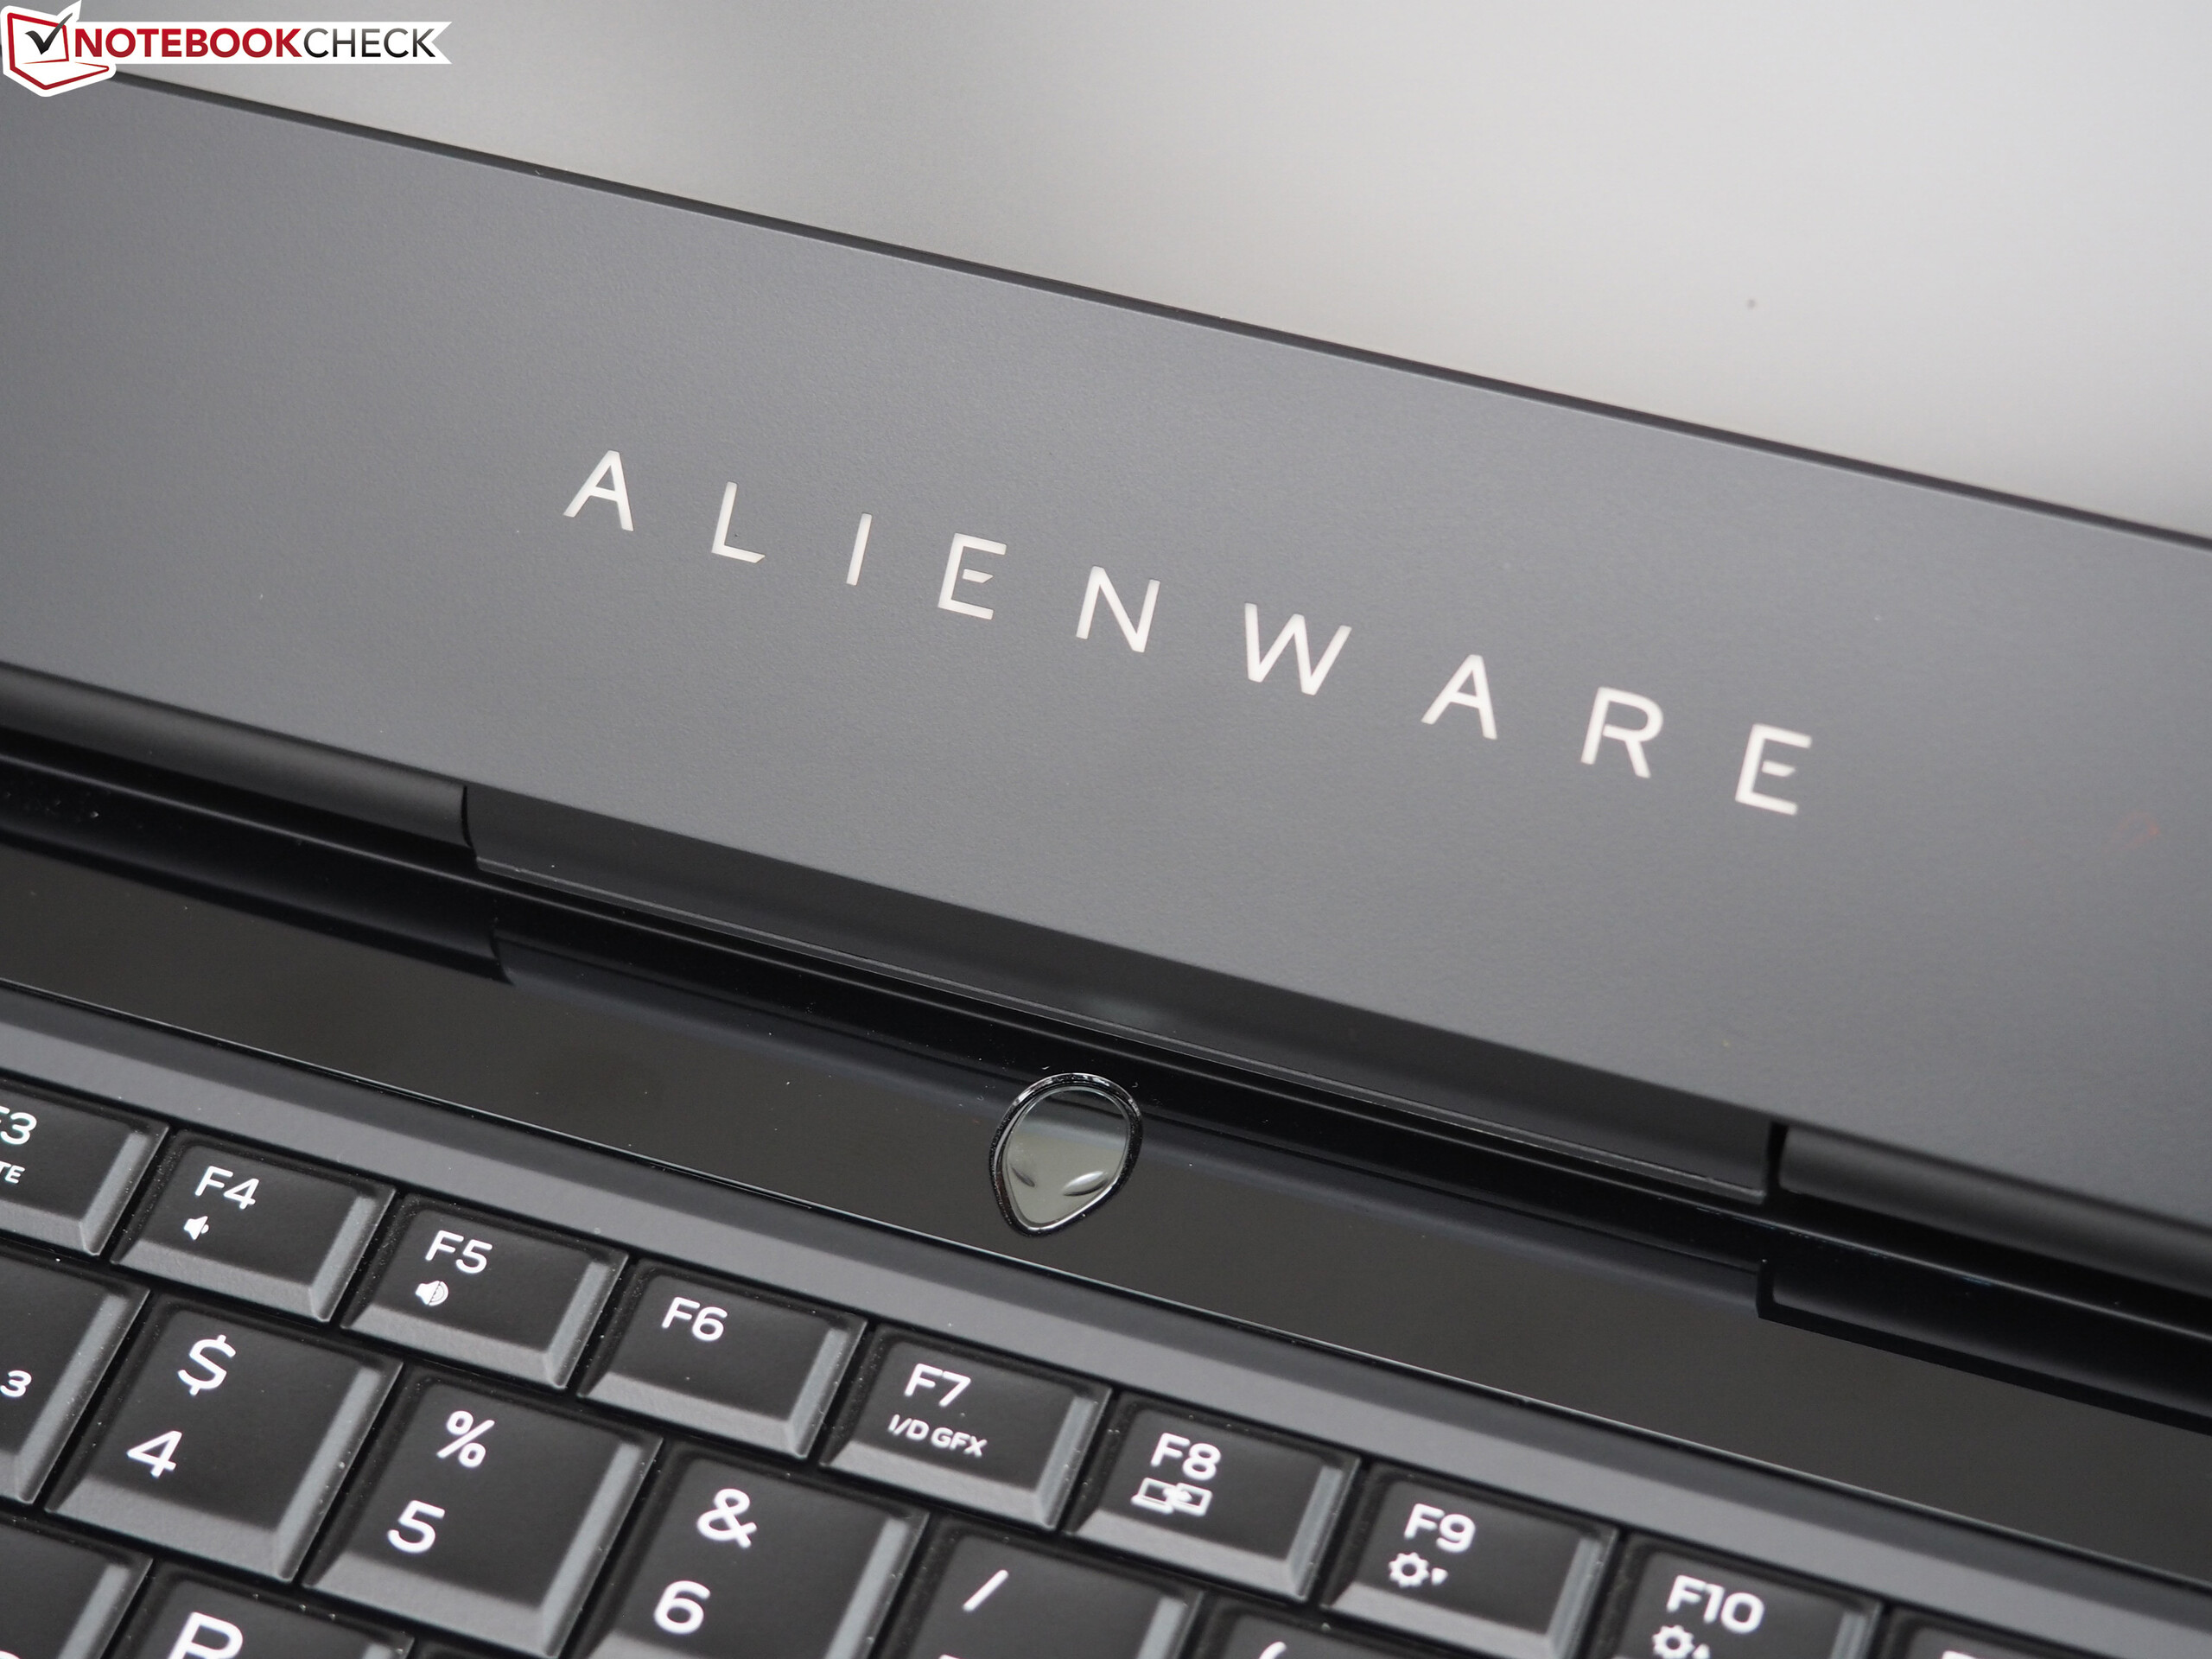
Alienware 15 R3 modelinin 3. güncellemesi karşımızda. Bu kadar iyi bir kasaya sahip başka bir oyun cihazı şu an için yok. Bunun dışında eşsiz tasarımı, harika arayüzleri ve birçok aydınlatma noktası cihazı farklı kılıyor.
Cihaz gelecek birkaç yıl boyunca performans sunmaya devaqm edecektir. Grafik kartının yeterli kalmaması durumunda Thunderbolt 3 bağlantısı veya Graphics Amplifier çıkışı ile harici bir çözüm kullanabilirsiniz. 120 Hzlik ekran karışık bir izlenim bırakıyor. Cevap süreleri, aydınlatma ve kontrast harika ancak bakış açıları, siyahlık değeri ve renk tutarlılığı ortalamanın altında. Bunun sebebi ise kullanılan TN teknolojisi. 60 Hz lik modelde ise IPS kullanılmakta.
Ancak bizce cihazın asıl sorunu yoğun kullanım altındaki sıcaklık ve ses üretimi. Bir başka modeli daha inceleyip sorunun test modelimizden kaynaklı olmadığına tekrar bakacağız. Ancak genel olarak fan ve sıcaklık sorunlarından ötürü genel değerlendirmeden 1 puan kırdık.
Bu sorunu ve ortalama ses çıkışını göz ardı ederseniz, Alienware 15 R3 neredeyse her noktada tatmin edici.
Yazının orjinali için tıklayın.
Alienware 15 R3
-
02/08/2017 v6(old)
Florian Glaser
Pricecompare