 Deutsch
 English
 Español
 Français
 Italiano
 Nederlands
 Polski
 Português
 Русский
 Türkçe
 Svenska
 Chinese
 Magyar
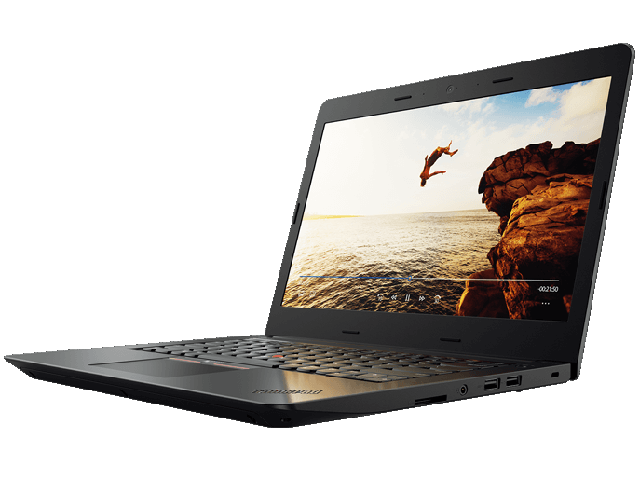
Kısa inceleme: Lenovo ThinkPad E470 (Core i5, GeForce 940MX) Notebook


| SD Card Reader | |
| average JPG Copy Test (av. of 3 runs) | |
| HP ProBook 440 G4-Y8B51EA | |
| Lenovo ThinkPad E460-20EUS00000 | |
| Lenovo ThinkPad E470-20H2S00400 | |
| Acer TravelMate P249-M-5452 | |
| maximum AS SSD Seq Read Test (1GB) | |
| HP ProBook 440 G4-Y8B51EA | |
| Lenovo ThinkPad E460-20EUS00000 | |
| Lenovo ThinkPad E470-20H2S00400 | |
| Networking | |
| iperf Server (receive) TCP 1 m | |
| Lenovo ThinkPad E470-20H2S00400 | |
| HP ProBook 440 G4-Y8B51EA | |
| Acer TravelMate P249-M-5452 | |
| iperf Client (transmit) TCP 1 m | |
| HP ProBook 440 G4-Y8B51EA | |
| Lenovo ThinkPad E470-20H2S00400 | |
| Acer TravelMate P249-M-5452 | |
| |||||||||||||||||||||||||
Aydınlatma: 89 %
Batarya modunda parlaklık: 242 cd/m²
Kontrast: 659:1 (Siyah: 0.37 cd/m²)
ΔE Color 6.41 | 0.5-29.43 Ø5
ΔE Greyscale 5.94 | 0.57-98 Ø5.3
61.1% sRGB (Argyll 1.6.3 3D)
39.3% AdobeRGB 1998 (Argyll 1.6.3 3D)
42.67% AdobeRGB 1998 (Argyll 2.2.0 3D)
61.4% sRGB (Argyll 2.2.0 3D)
41.23% Display P3 (Argyll 2.2.0 3D)
Gamma: 2.28
| Lenovo ThinkPad E470-20H2S00400 N140HCA-EAB, , 1920x1080, 14.00 | Lenovo ThinkPad E460-20EUS00000 LG LP140WF6-SPB2, , 1920x1080, 14.00 | HP ProBook 440 G4-Y8B51EA AUO1E3D, , 1920x1080, 14.00 | Acer TravelMate P249-M-5452 Chi Mei N140HGE-EAA, , 1920x1080, 14.00 | Lenovo ThinkPad T460s-20FA003GGE VVX14T058J02, , 2560x1440, 14.00 | |
|---|---|---|---|---|---|
| Display | -5% | -9% | -7% | 64% | |
| Display P3 Coverage | 41.23 | 39.1 -5% | 37.6 -9% | 38.15 -7% | 68.7 67% |
| sRGB Coverage | 61.4 | 58.8 -4% | 56.6 -8% | 56.7 -8% | 98.1 60% |
| AdobeRGB 1998 Coverage | 42.67 | 40.41 -5% | 38.85 -9% | 39.48 -7% | 70.4 65% |
| Response Times | 13% | 7% | 20% | 9% | |
| Response Time Grey 50% / Grey 80% * | 40.8 ? | 40 ? 2% | 43.2 ? -6% | 44 ? -8% | 35.6 ? 13% |
| Response Time Black / White * | 30.4 ? | 23.2 ? 24% | 24.4 ? 20% | 16 ? 47% | 29.2 ? 4% |
| PWM Frequency | 50 ? | 220 ? | |||
| Screen | 9% | -21% | -15% | 27% | |
| Brightness middle | 244 | 233 -5% | 216 -11% | 249 2% | 257 5% |
| Brightness | 231 | 221 -4% | 203 -12% | 238 3% | 248 7% |
| Brightness Distribution | 89 | 88 -1% | 83 -7% | 87 -2% | 94 6% |
| Black Level * | 0.37 | 0.3 19% | 0.47 -27% | 0.41 -11% | 0.26 30% |
| Contrast | 659 | 777 18% | 460 -30% | 607 -8% | 988 50% |
| Colorchecker dE 2000 * | 6.41 | 4.43 31% | 8.98 -40% | 9.09 -42% | 4.59 28% |
| Colorchecker dE 2000 max. * | 13.4 | 14.07 -5% | 14.64 -9% | 9.72 27% | |
| Greyscale dE 2000 * | 5.94 | 3.78 36% | 9.61 -62% | 9.92 -67% | 6.38 -7% |
| Gamma | 2.28 96% | 2.31 95% | 2.63 84% | 2.42 91% | 2.51 88% |
| CCT | 6101 107% | 7171 91% | 11265 58% | 11177 58% | 6238 104% |
| Color Space (Percent of AdobeRGB 1998) | 39.3 | 37.3 -5% | 35.9 -9% | 36.5 -7% | 65 65% |
| Color Space (Percent of sRGB) | 61.1 | 58.7 -4% | 56.7 -7% | 56.7 -7% | 98 60% |
| Total Average (Program / Settings) | 6% /
7% | -8% /
-15% | -1% /
-9% | 33% /
32% |
* ... smaller is better
Display Response Times
| ↔ Response Time Black to White | ||
|---|---|---|
| 30.4 ms ... rise ↗ and fall ↘ combined | ↗ 8.4 ms rise | 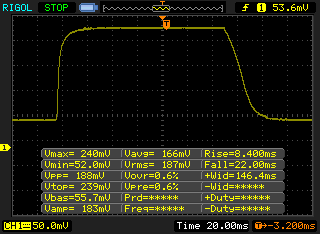 |
| ↘ 22 ms fall | ||
| The screen shows slow response rates in our tests and will be unsatisfactory for gamers. In comparison, all tested devices range from 0.1 (minimum) to 240 (maximum) ms. » 80 % of all devices are better. This means that the measured response time is worse than the average of all tested devices (21.5 ms). | ||
| ↔ Response Time 50% Grey to 80% Grey | ||
| 40.8 ms ... rise ↗ and fall ↘ combined | ↗ 22 ms rise | 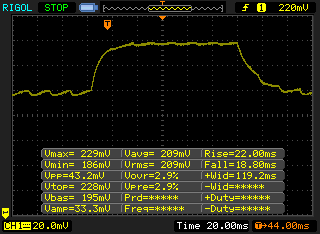 |
| ↘ 18.8 ms fall | ||
| The screen shows slow response rates in our tests and will be unsatisfactory for gamers. In comparison, all tested devices range from 0.2 (minimum) to 636 (maximum) ms. » 59 % of all devices are better. This means that the measured response time is worse than the average of all tested devices (33.7 ms). | ||
Screen Flickering / PWM (Pulse-Width Modulation)
| Screen flickering / PWM not detected | ||
In comparison: 53 % of all tested devices do not use PWM to dim the display. If PWM was detected, an average of 17903 (minimum: 5 - maximum: 3846000) Hz was measured. | ||


| Cinebench R15 | |
| CPU Single 64Bit | |
| HP ProBook 450 G4 Y8B60EA | |
| HP ProBook 440 G4-Y8B51EA | |
| Lenovo ThinkPad T460s-20FA003GGE | |
| Lenovo ThinkPad E560 20EV000XPB | |
| Lenovo ThinkPad E470-20H2S00400 | |
| Acer TravelMate P249-M-5452 | |
| Lenovo ThinkPad E460-20EUS00000 | |
| CPU Multi 64Bit | |
| HP ProBook 450 G4 Y8B60EA | |
| Lenovo ThinkPad T460s-20FA003GGE | |
| HP ProBook 440 G4-Y8B51EA | |
| Lenovo ThinkPad E470-20H2S00400 | |
| Lenovo ThinkPad E560 20EV000XPB | |
| Acer TravelMate P249-M-5452 | |
| Lenovo ThinkPad E460-20EUS00000 | |
| Lenovo ThinkPad E470-20H2S00400 SanDisk X400 SED 256GB, SATA (SD8TB8U-256G) | Lenovo ThinkPad E460-20EUS00000 Samsung CM871 MZ7LF192HCGS | HP ProBook 440 G4-Y8B51EA SanDisk SD8SNAT256G1002 | Acer TravelMate P249-M-5452 SK Hynix HFS256G39TND-N210A | Lenovo ThinkPad T460s-20FA003GGE Samsung SSD SM951a 512GB M.2 PCIe 3.0 x4 NVMe (MZVKV512) | |
|---|---|---|---|---|---|
| CrystalDiskMark 3.0 | -45% | -12% | 8% | 187% | |
| Read Seq | 476.5 | 497.6 4% | 491.2 3% | 510 7% | 1778 273% |
| Write Seq | 458.7 | 180 -61% | 322.2 -30% | 267.2 -42% | 1530 234% |
| Read 512 | 346.4 | 297.1 -14% | 310.1 -10% | 347.6 0% | 1339 287% |
| Write 512 | 291.1 | 169.1 -42% | 276 -5% | 267.5 -8% | 1506 417% |
| Read 4k | 35.15 | 18.91 -46% | 19.57 -44% | 33.12 -6% | 51.3 46% |
| Write 4k | 78.8 | 37.13 -53% | 77.8 -1% | 95.9 22% | 139.3 77% |
| Read 4k QD32 | 276 | 95.7 -65% | 146.3 -47% | 392.8 42% | 561 103% |
| Write 4k QD32 | 178.3 | 37.26 -79% | 241.4 35% | 266.4 49% | 277 55% |

| PCMark 8 | |
| Home Score Accelerated v2 | |
| HP ProBook 440 G4-Y8B51EA | |
| Lenovo ThinkPad E470-20H2S00400 | |
| Lenovo ThinkPad T460s-20FA003GGE | |
| Acer TravelMate P249-M-5452 | |
| Lenovo ThinkPad E460-20EUS00000 | |
| Work Score Accelerated v2 | |
| HP ProBook 440 G4-Y8B51EA | |
| Lenovo ThinkPad E470-20H2S00400 | |
| Acer TravelMate P249-M-5452 | |
| Lenovo ThinkPad T460s-20FA003GGE | |
| Lenovo ThinkPad E460-20EUS00000 | |
| PCMark 8 Home Score Accelerated v2 | 3546 puan | |
| PCMark 8 Creative Score Accelerated v2 | 4389 puan | |
| PCMark 8 Work Score Accelerated v2 | 4642 puan | |
Yardım | ||
| 3DMark 11 - 1280x720 Performance GPU | |
| Lenovo ThinkPad E470-20H2S00400 | |
| HP ProBook 440 G4-Y8B51EA | |
| Lenovo ThinkPad E460-20EUS00000 | |
| Intel Kaby Lake i7-7500U / HD Graphics 620 | |
| Acer TravelMate P249-M-5452 | |
| 3DMark - 1920x1080 Fire Strike Graphics | |
| Lenovo ThinkPad E470-20H2S00400 | |
| HP ProBook 440 G4-Y8B51EA | |
| Intel Kaby Lake i7-7500U / HD Graphics 620 | |
| Lenovo ThinkPad E460-20EUS00000 | |
| Acer TravelMate P249-M-5452 | |
| 3DMark 11 Performance | 2642 puan | |
| 3DMark Ice Storm Standard Score | 42449 puan | |
| 3DMark Cloud Gate Standard Score | 6759 puan | |
| 3DMark Fire Strike Score | 1528 puan | |
Yardım | ||
| düşük | orta | yüksek | ultra | |
| BioShock Infinite (2013) | 92.4 | 53.1 | 43.1 | 15.1 |
| Battlefield 4 (2013) | 65.8 | 46.7 | 31.2 | 12.1 |
| Sims 4 (2014) | 150.6 | 68.9 | 41.4 | 29.9 |
| Deus Ex Mankind Divided (2016) | 24 | 16.5 | 8.5 |
Ses yüksekliği
| Boşta |
| 29 / 29 / 29 dB |
| Çalışırken |
| 35.6 / 38.5 dB |
 | ||
30 dB sessiz 40 dB(A) duyulabilirlik 50 dB(A) gürültülü |
||
min: | ||
(±) The maximum temperature on the upper side is 43.8 °C / 111 F, compared to the average of 34.2 °C / 94 F, ranging from 21.2 to 62.5 °C for the class Office.
(-) The bottom heats up to a maximum of 53 °C / 127 F, compared to the average of 36.7 °C / 98 F
(+) In idle usage, the average temperature for the upper side is 24.4 °C / 76 F, compared to the device average of 29.5 °C / 85 F.
(+) The palmrests and touchpad are cooler than skin temperature with a maximum of 25.5 °C / 77.9 F and are therefore cool to the touch.
(+) The average temperature of the palmrest area of similar devices was 27.7 °C / 81.9 F (+2.2 °C / 4 F).
Lenovo ThinkPad E470-20H2S00400 audio analysis
(+) | speakers can play relatively loud (84.8 dB)
Bass 100 - 315 Hz
(-) | nearly no bass - on average 15.7% lower than median
(±) | linearity of bass is average (11.2% delta to prev. frequency)
Mids 400 - 2000 Hz
(±) | higher mids - on average 9% higher than median
(±) | linearity of mids is average (11.1% delta to prev. frequency)
Highs 2 - 16 kHz
(±) | higher highs - on average 5.1% higher than median
(±) | linearity of highs is average (10.5% delta to prev. frequency)
Overall 100 - 16.000 Hz
(±) | linearity of overall sound is average (23.8% difference to median)
Compared to same class
» 65% of all tested devices in this class were better, 10% similar, 26% worse
» The best had a delta of 7%, average was 22%, worst was 53%
Compared to all devices tested
» 67% of all tested devices were better, 7% similar, 26% worse
» The best had a delta of 4%, average was 25%, worst was 134%
Apple MacBook 12 (Early 2016) 1.1 GHz audio analysis
(+) | speakers can play relatively loud (83.6 dB)
Bass 100 - 315 Hz
(±) | reduced bass - on average 11.3% lower than median
(±) | linearity of bass is average (14.2% delta to prev. frequency)
Mids 400 - 2000 Hz
(+) | balanced mids - only 2.4% away from median
(+) | mids are linear (5.5% delta to prev. frequency)
Highs 2 - 16 kHz
(+) | balanced highs - only 2% away from median
(+) | highs are linear (4.5% delta to prev. frequency)
Overall 100 - 16.000 Hz
(+) | overall sound is linear (10.2% difference to median)
Compared to same class
» 5% of all tested devices in this class were better, 2% similar, 93% worse
» The best had a delta of 5%, average was 19%, worst was 53%
Compared to all devices tested
» 3% of all tested devices were better, 1% similar, 96% worse
» The best had a delta of 4%, average was 25%, worst was 134%
| Kapalı / Bekleme modu | |
| Boşta | |
| Çalışırken |
|
| Lenovo ThinkPad E470-20H2S00400 i5-7200U, GeForce 940MX, SanDisk X400 SED 256GB, SATA (SD8TB8U-256G), IPS, 1920x1080, 14.00 | Lenovo ThinkPad E460-20EUS00000 6200U, Radeon R7 M360, Samsung CM871 MZ7LF192HCGS, IPS-Panel, 1920x1080, 14.00 | HP ProBook 440 G4-Y8B51EA i7-7500U, GeForce 930MX, SanDisk SD8SNAT256G1002, TN, 1920x1080, 14.00 | Acer TravelMate P249-M-5452 6200U, HD Graphics 520, SK Hynix HFS256G39TND-N210A, TN LED, 1920x1080, 14.00 | Dell Latitude 3470 N2P7L347014EMEA 6200U, HD Graphics 520, Samsung SSD 850 EVO 250GB, , 1366x768, 14.00 | |
|---|---|---|---|---|---|
| Power Consumption | -21% | 3% | -4% | -13% | |
| Idle Minimum * | 2.7 | 4.1 -52% | 3 -11% | 3.8 -41% | 4.3 -59% |
| Idle Average * | 5.5 | 8 -45% | 5.4 2% | 7.6 -38% | 8 -45% |
| Idle Maximum * | 6.5 | 8.9 -37% | 6.3 3% | 8 -23% | 10.3 -58% |
| Load Average * | 44.2 | 39.3 11% | 37.5 15% | 30.5 31% | 26.4 40% |
| Load Maximum * | 65.2 | 52.2 20% | 61.1 6% | 32.5 50% | 28.3 57% |
* ... smaller is better
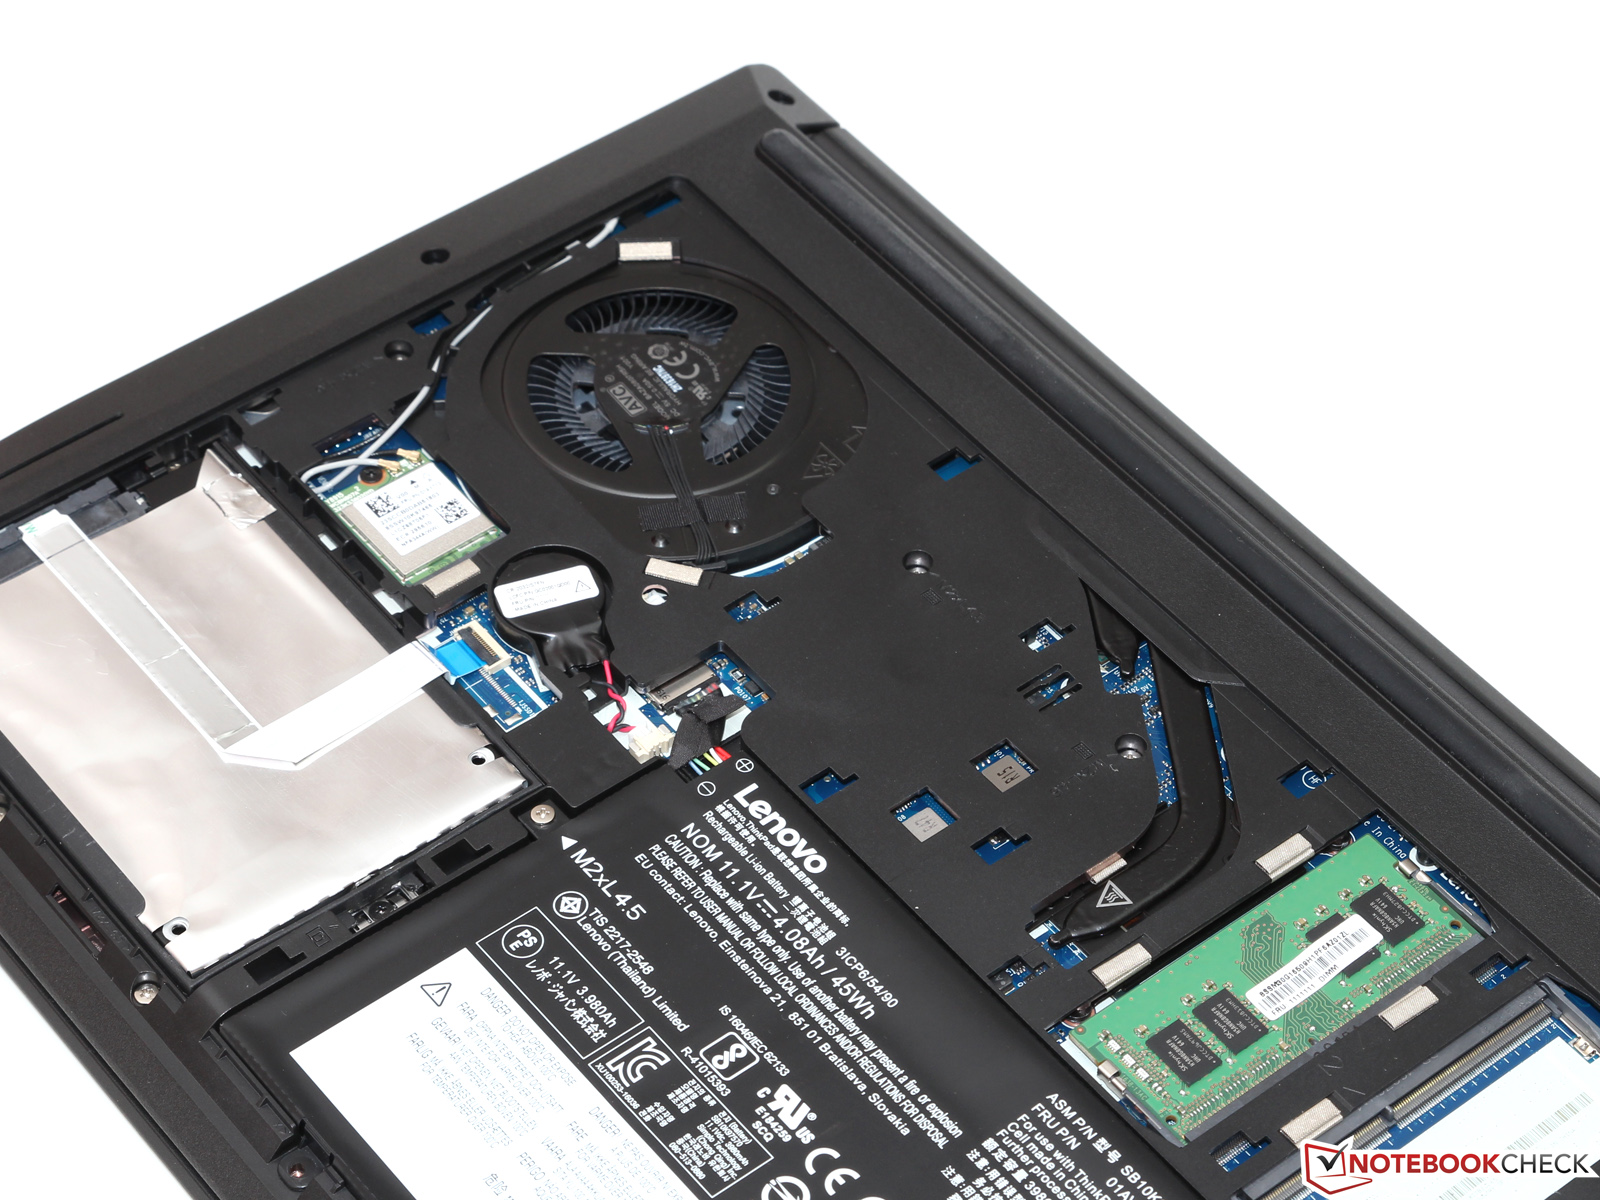
| Lenovo ThinkPad E470-20H2S00400 i5-7200U, GeForce 940MX, 45 Wh | Lenovo ThinkPad E460-20EUS00000 6200U, Radeon R7 M360, 47 Wh | HP ProBook 440 G4-Y8B51EA i7-7500U, GeForce 930MX, 48 Wh | Acer TravelMate P249-M-5452 6200U, HD Graphics 520, 41 Wh | Lenovo ThinkPad T460s-20FA003GGE 6600U, HD Graphics 520, 49 Wh | |
|---|---|---|---|---|---|
| Battery Runtime | -16% | 17% | -15% | -22% | |
| Reader / Idle | 1043 | 736 -29% | 1083 4% | 791 -24% | 833 -20% |
| H.264 | 503 | 425 -16% | 571 14% | 361 -28% | 397 -21% |
| WiFi v1.3 | 326 | 292 -10% | 414 27% | 400 23% | 340 4% |
| Load | 124 | 112 -10% | 151 22% | 87 -30% | 62 -50% |
Artılar
Eksiler
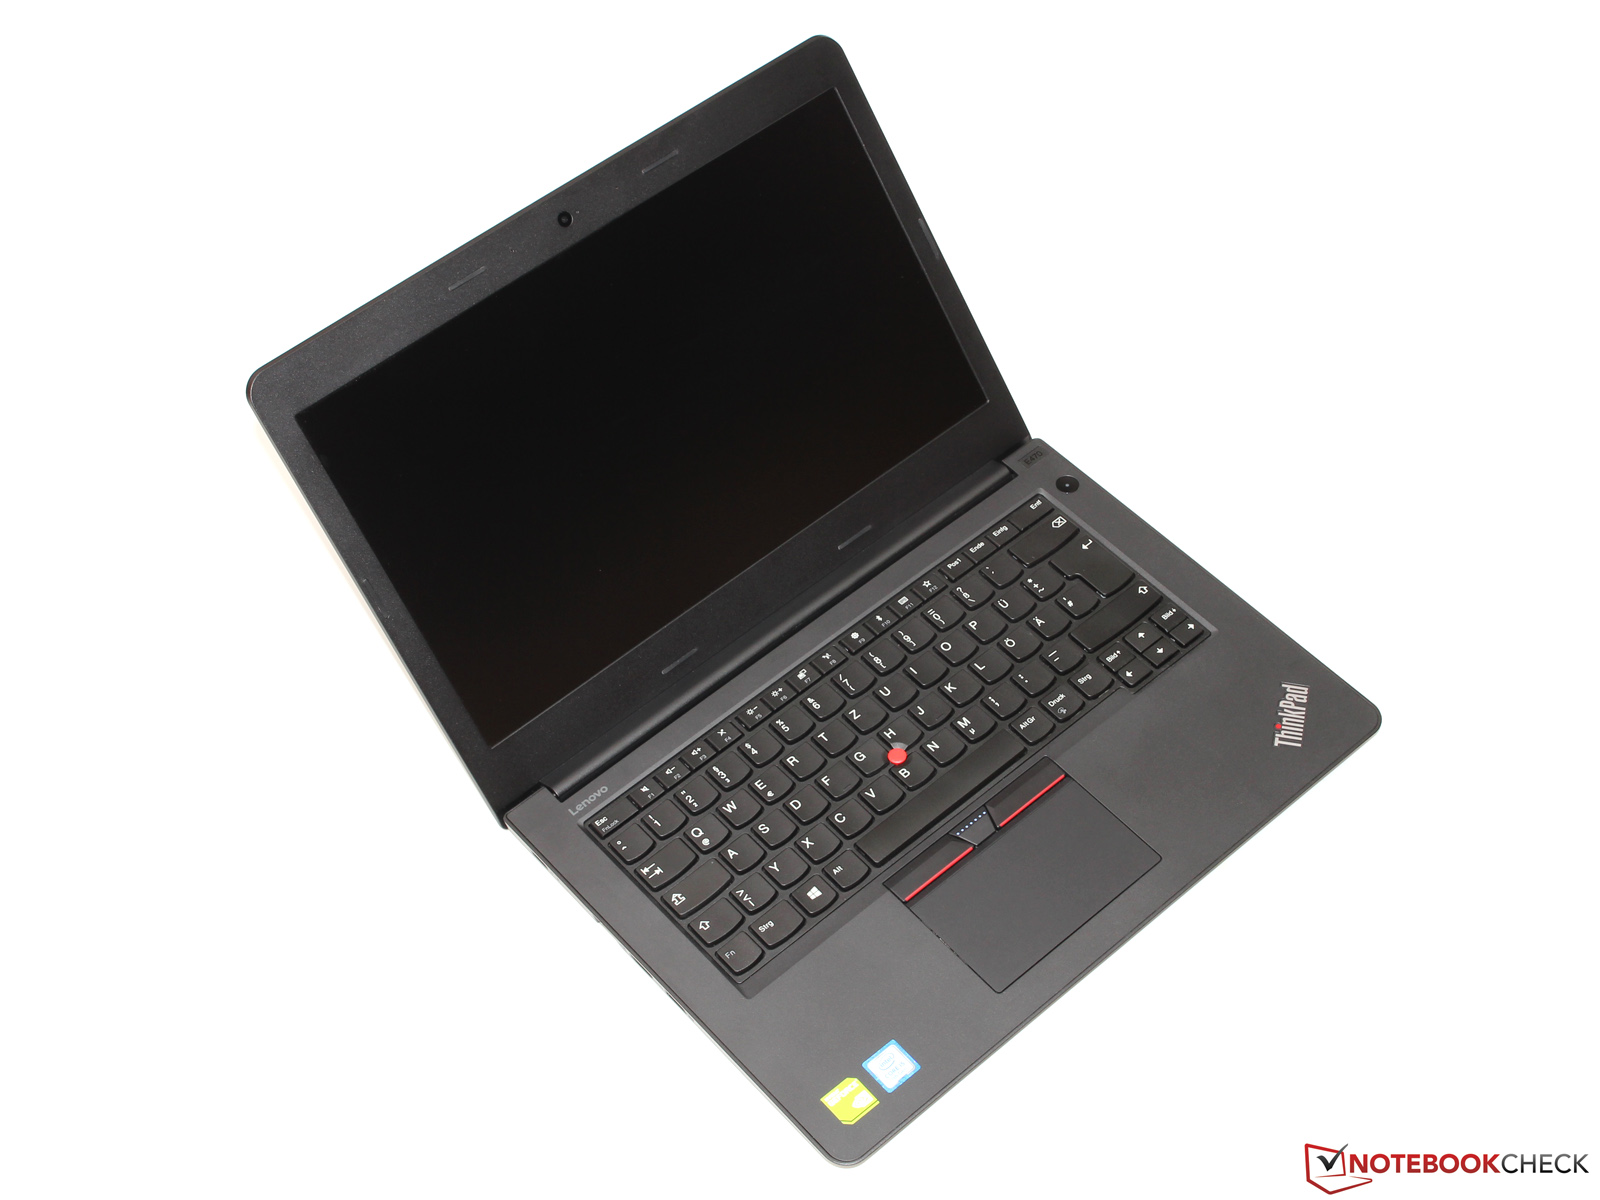
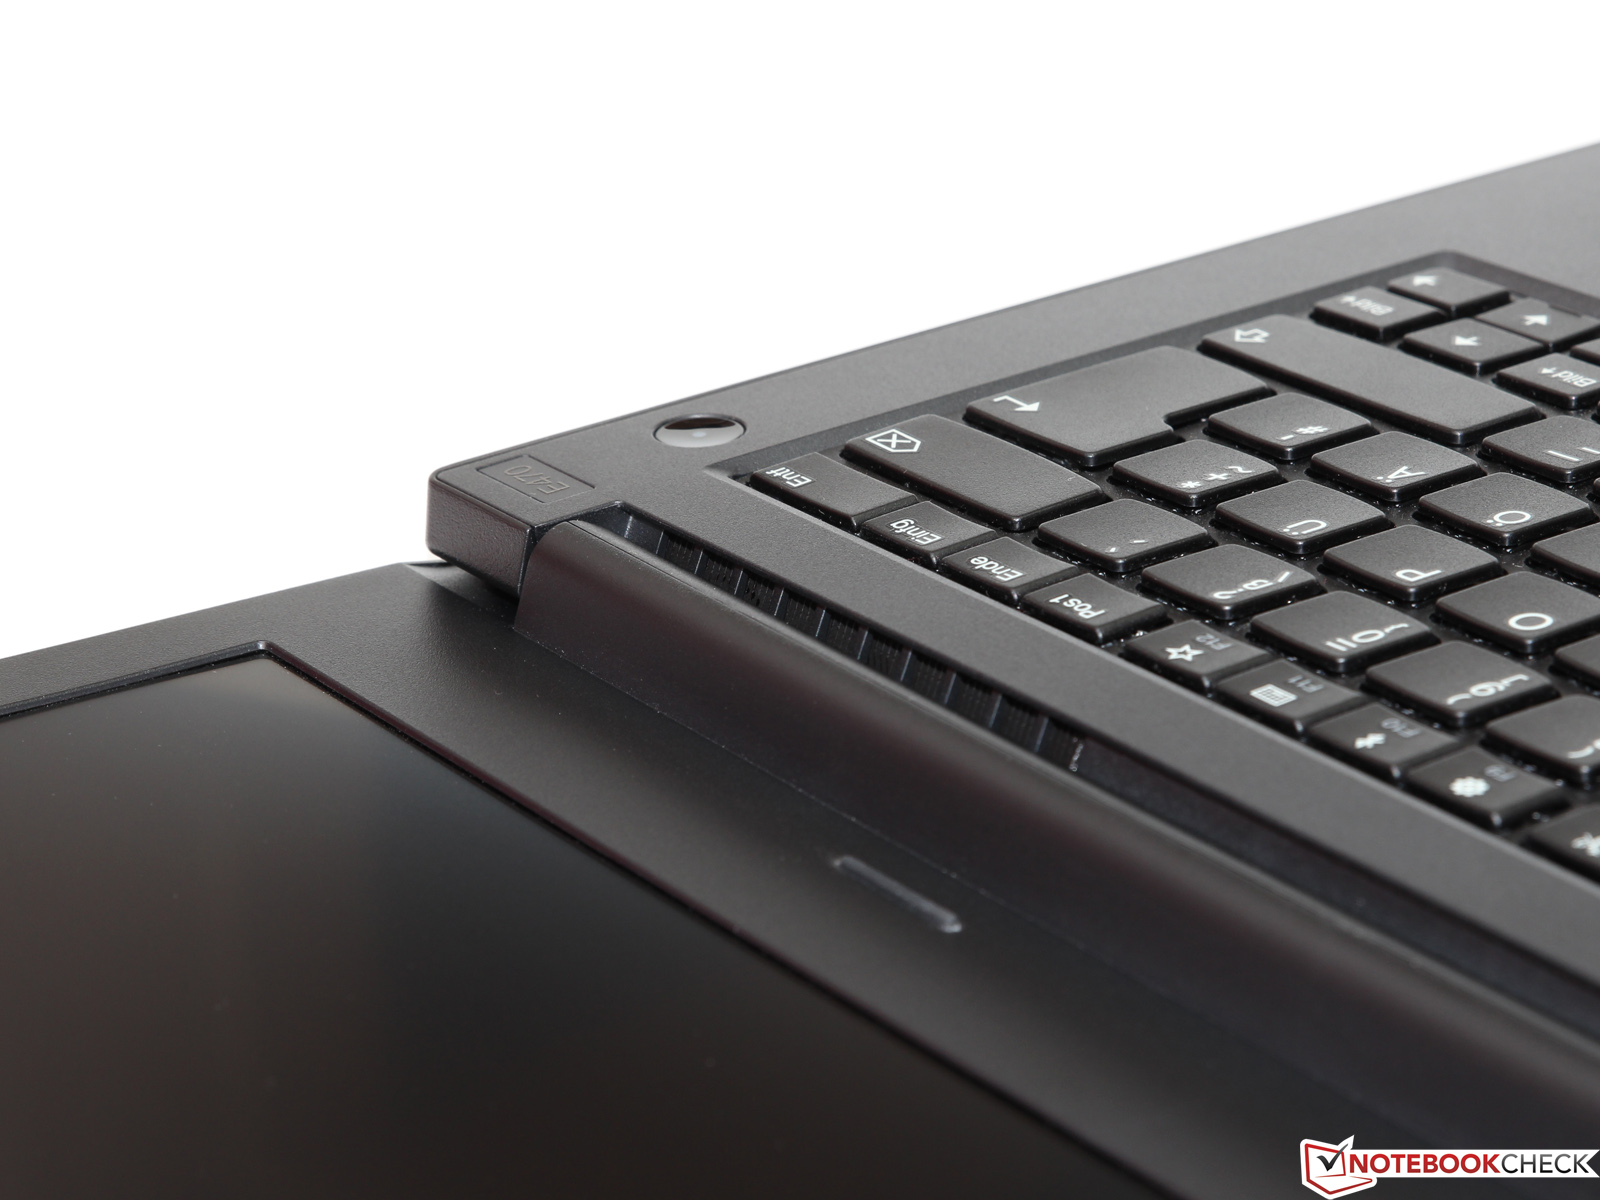
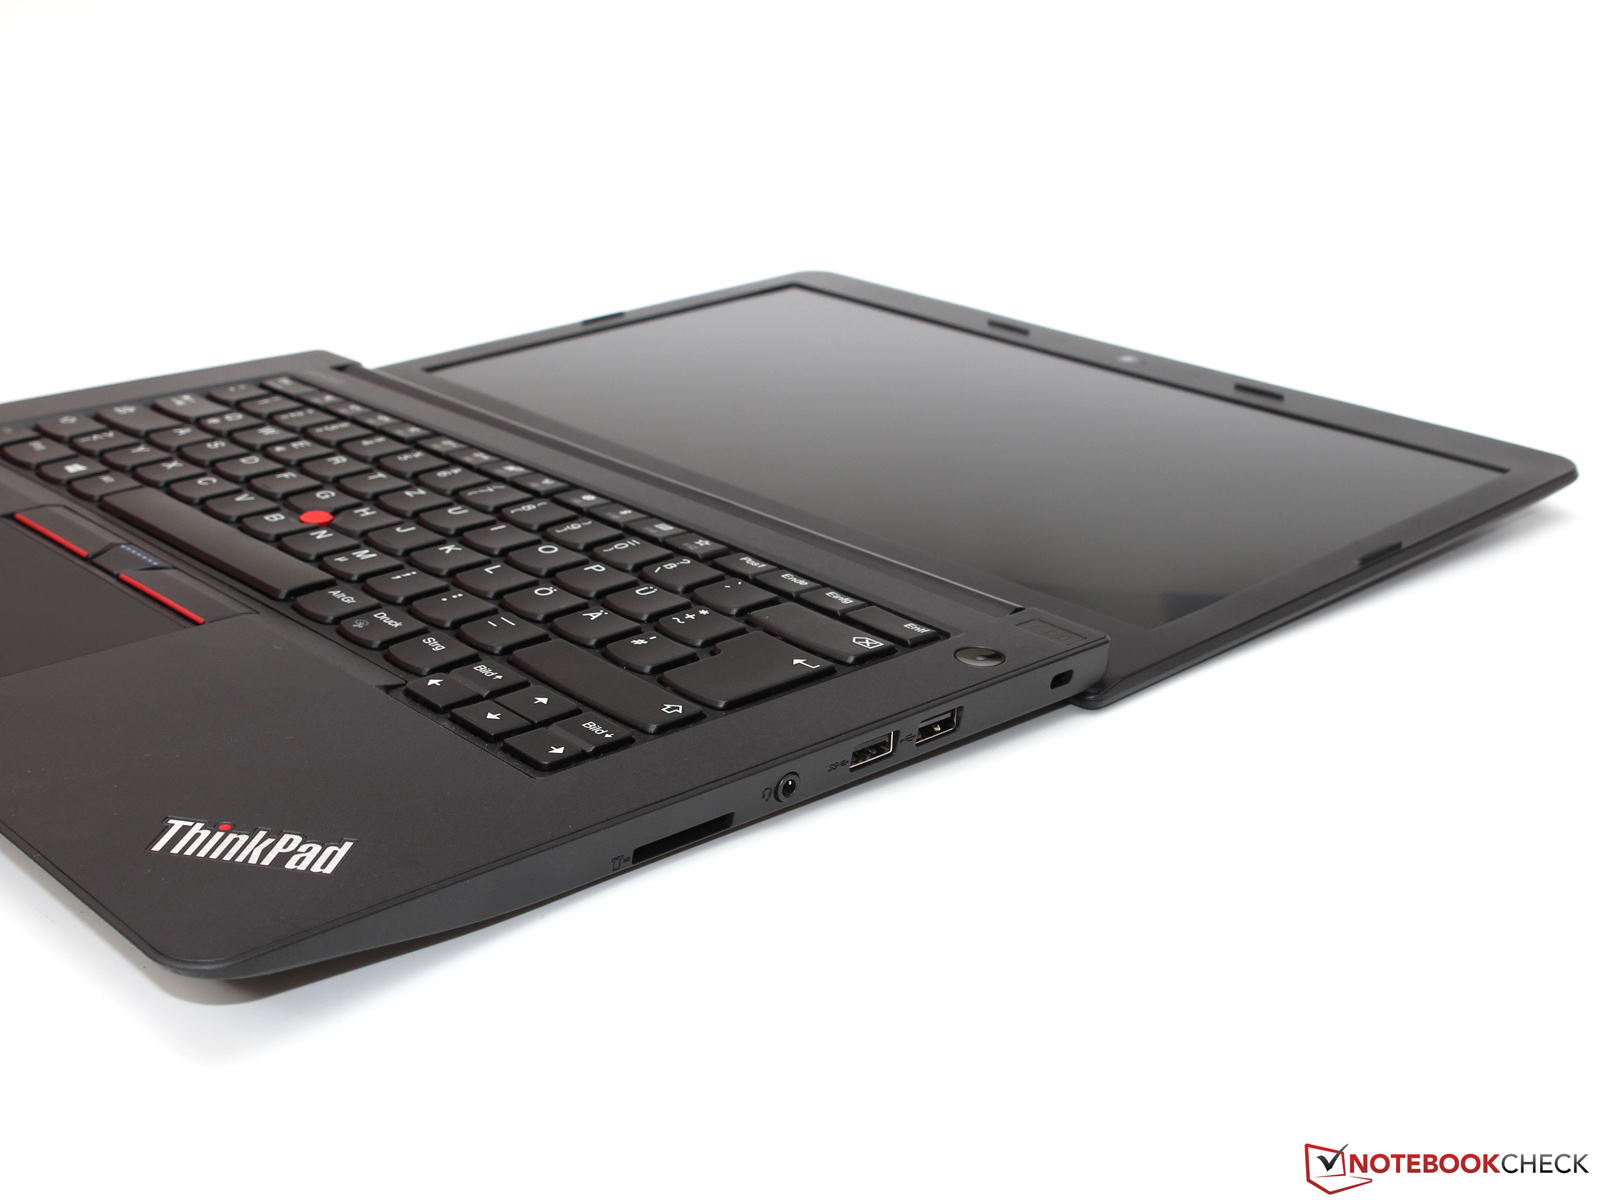
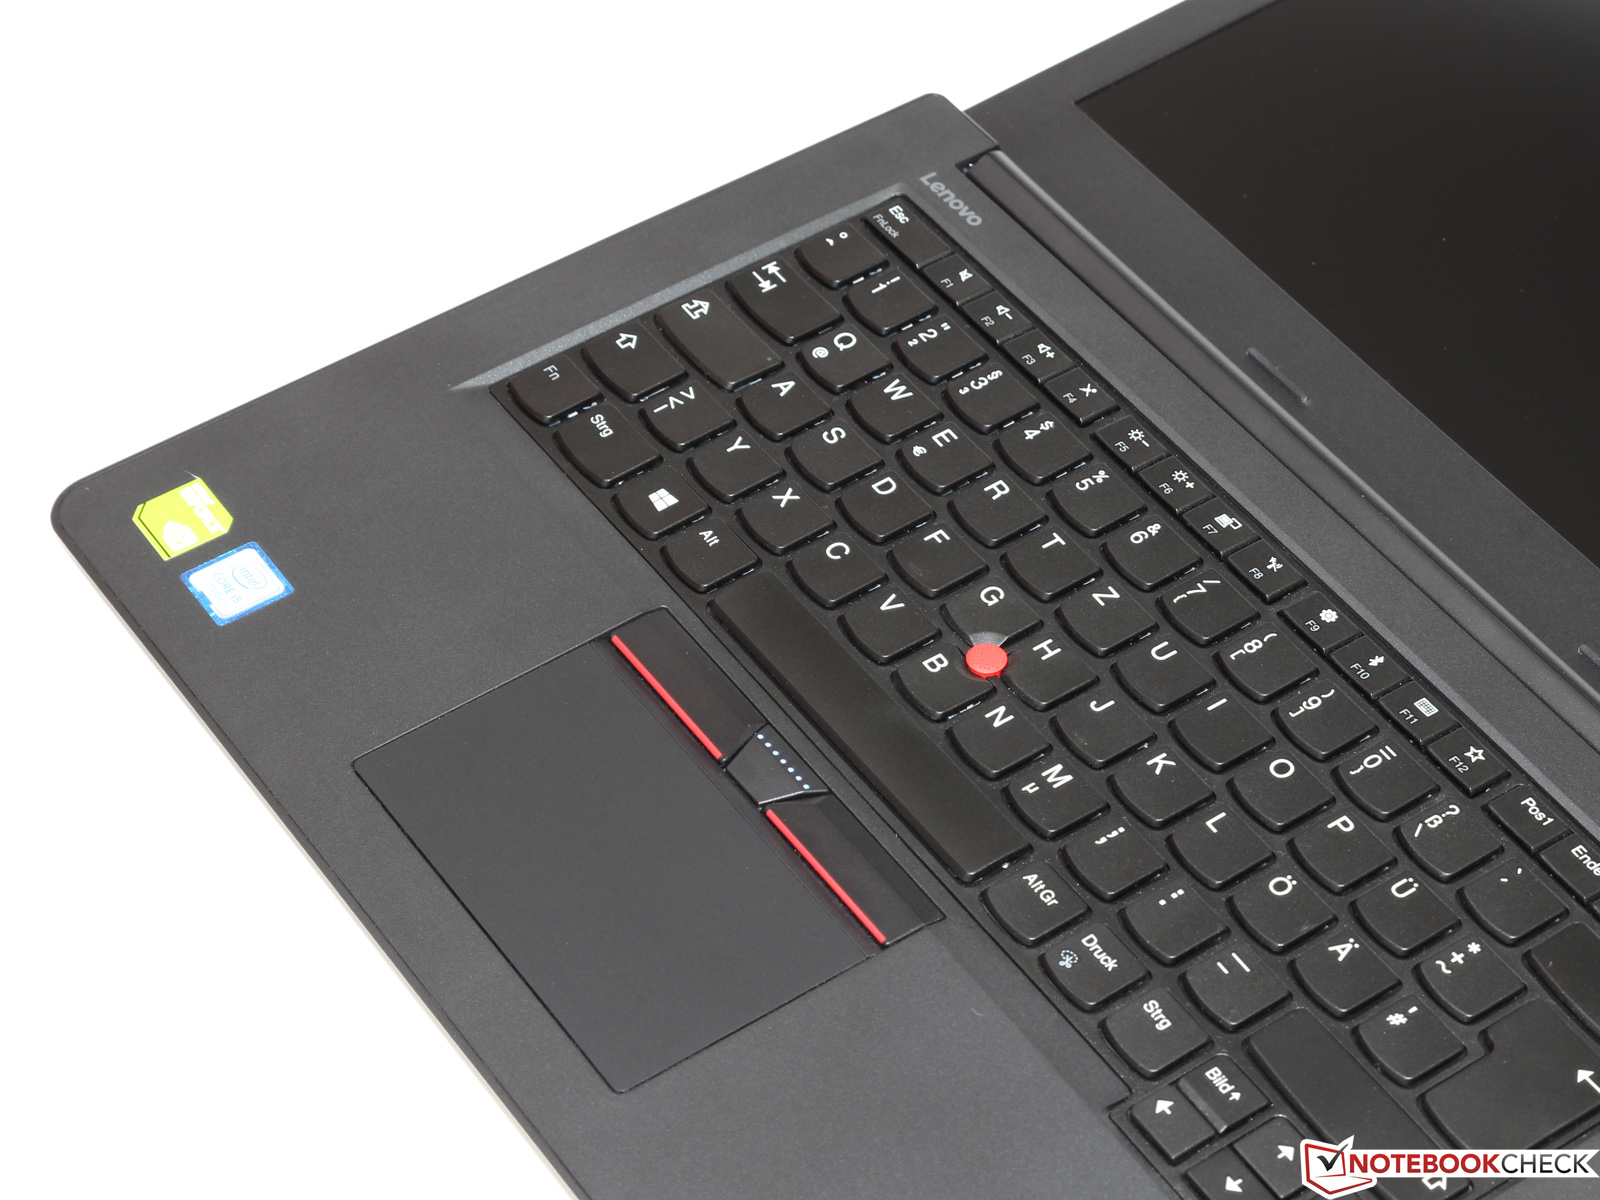
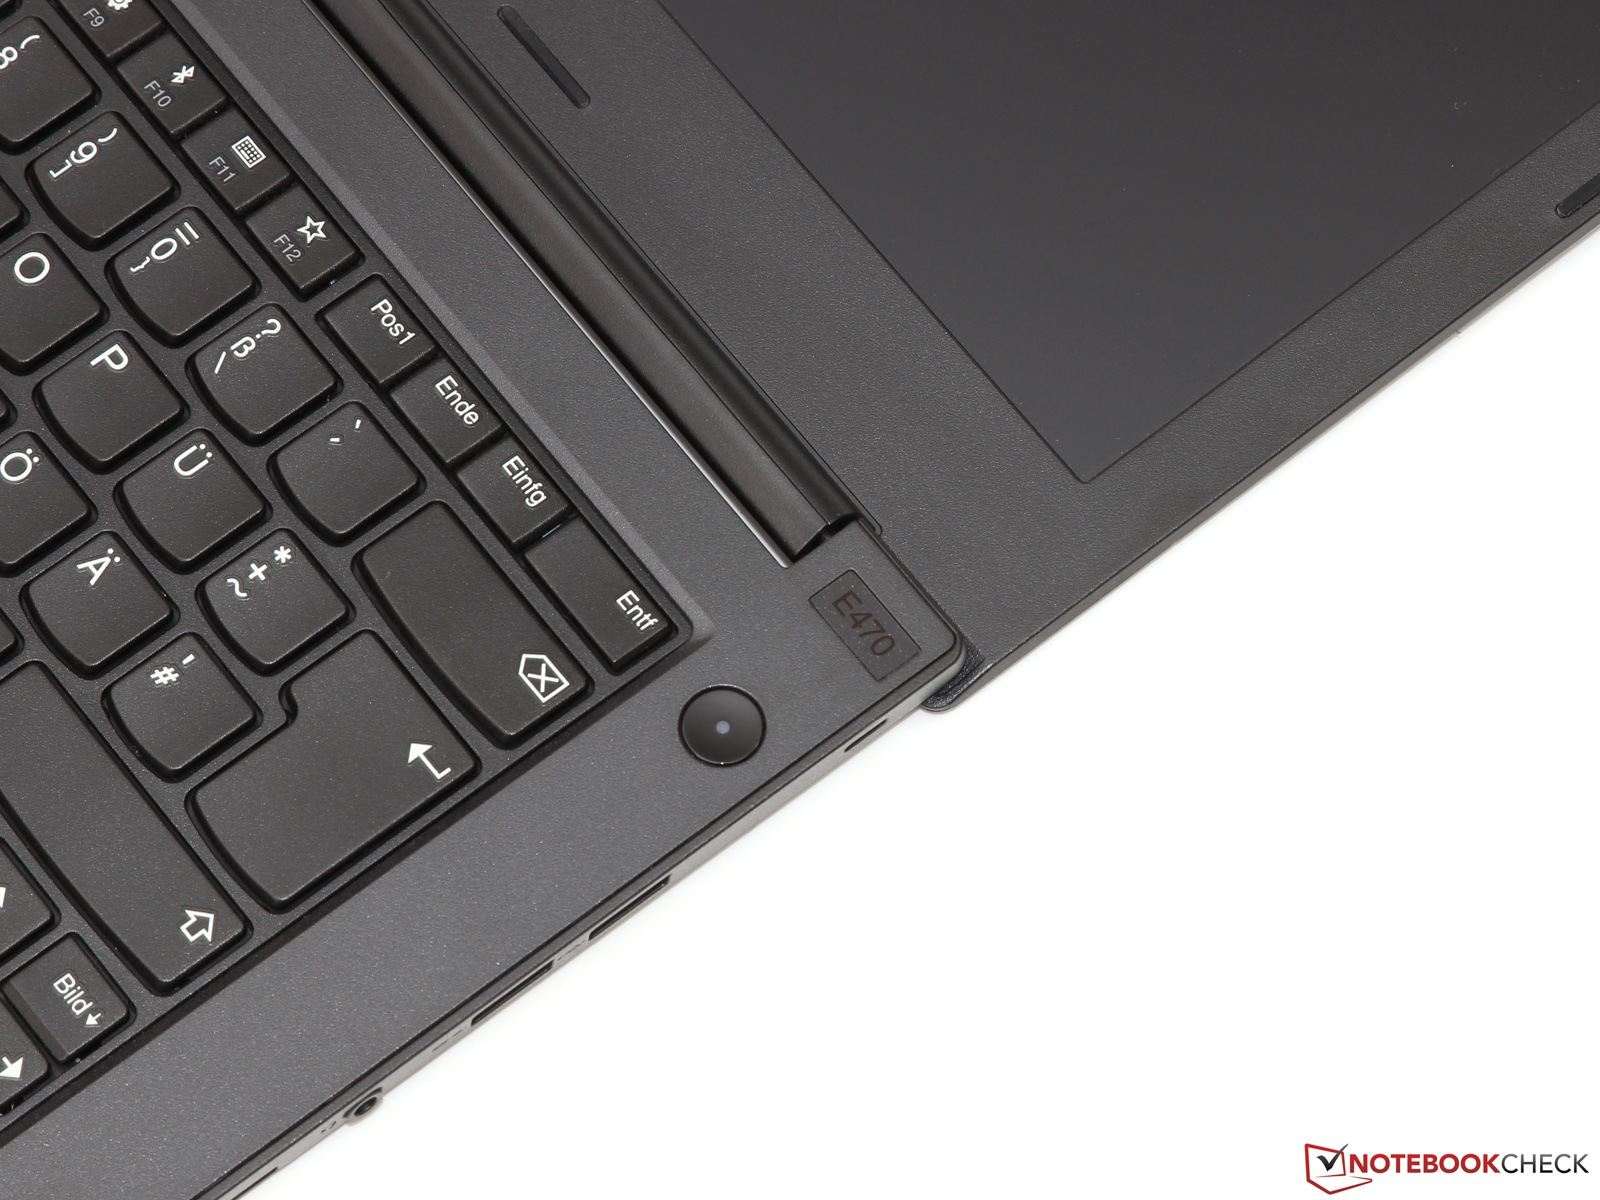
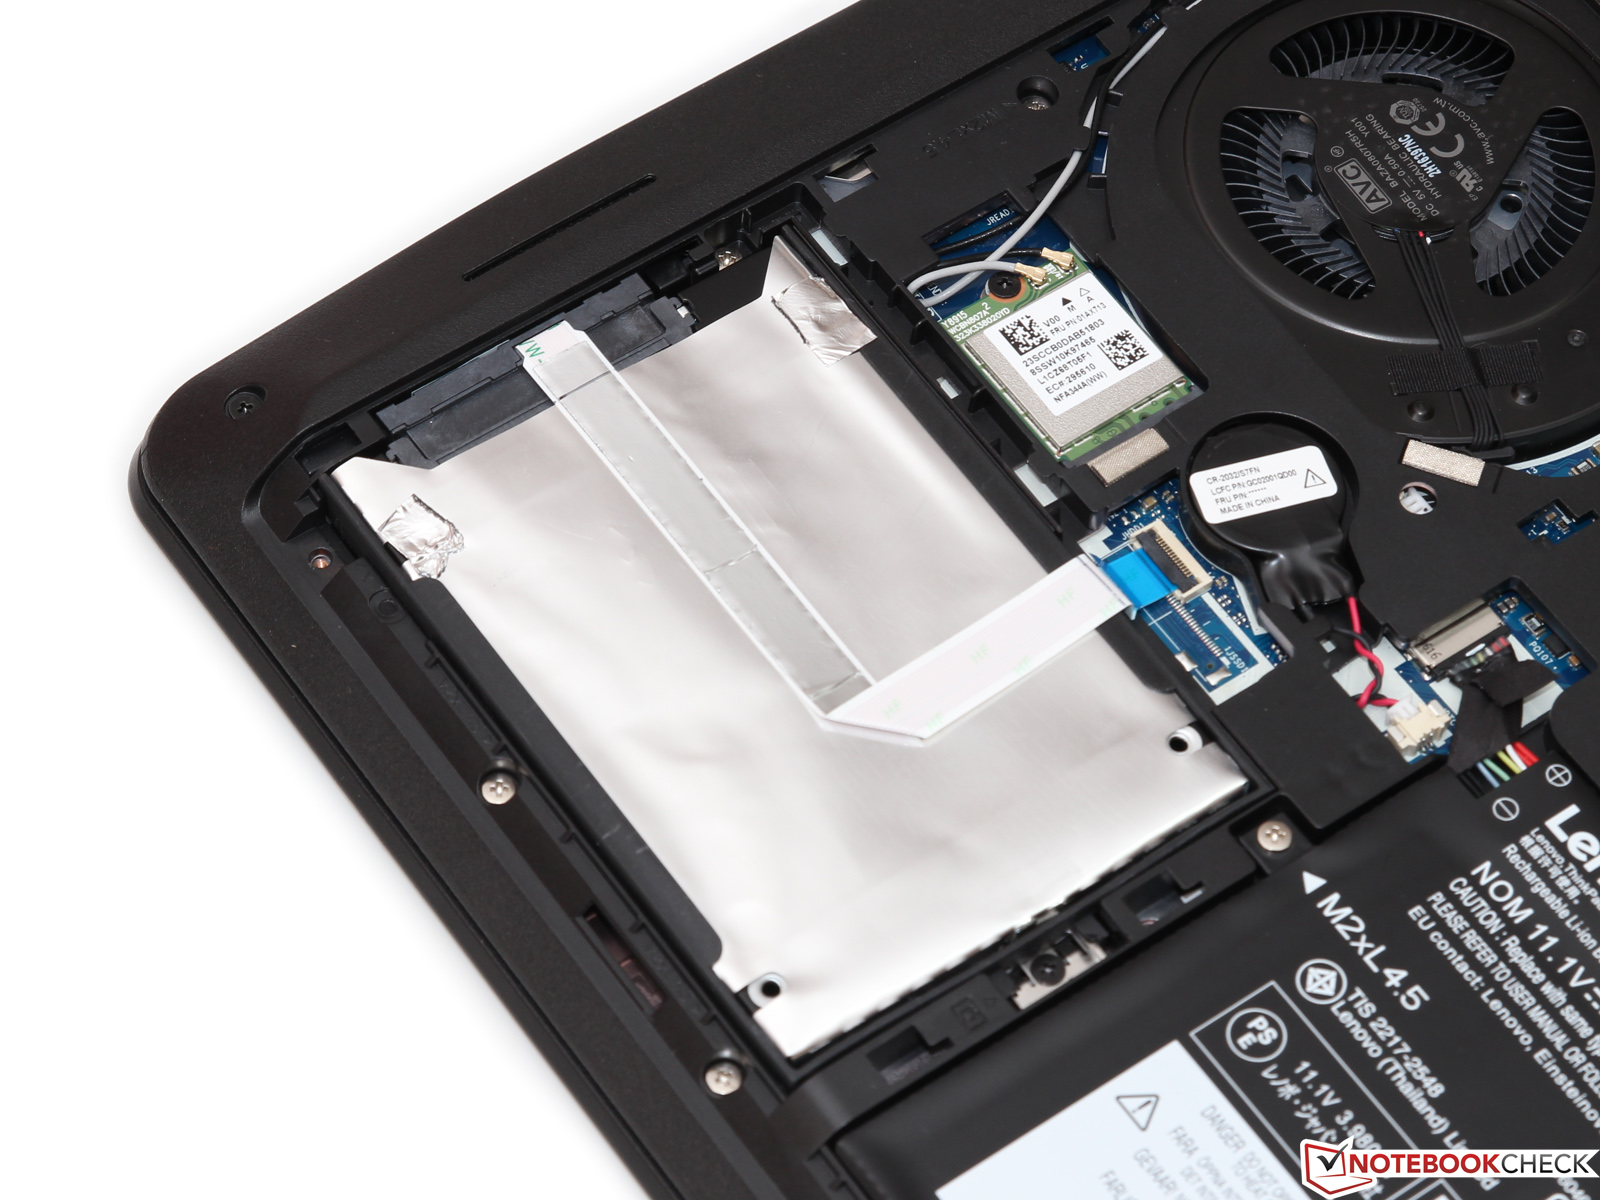
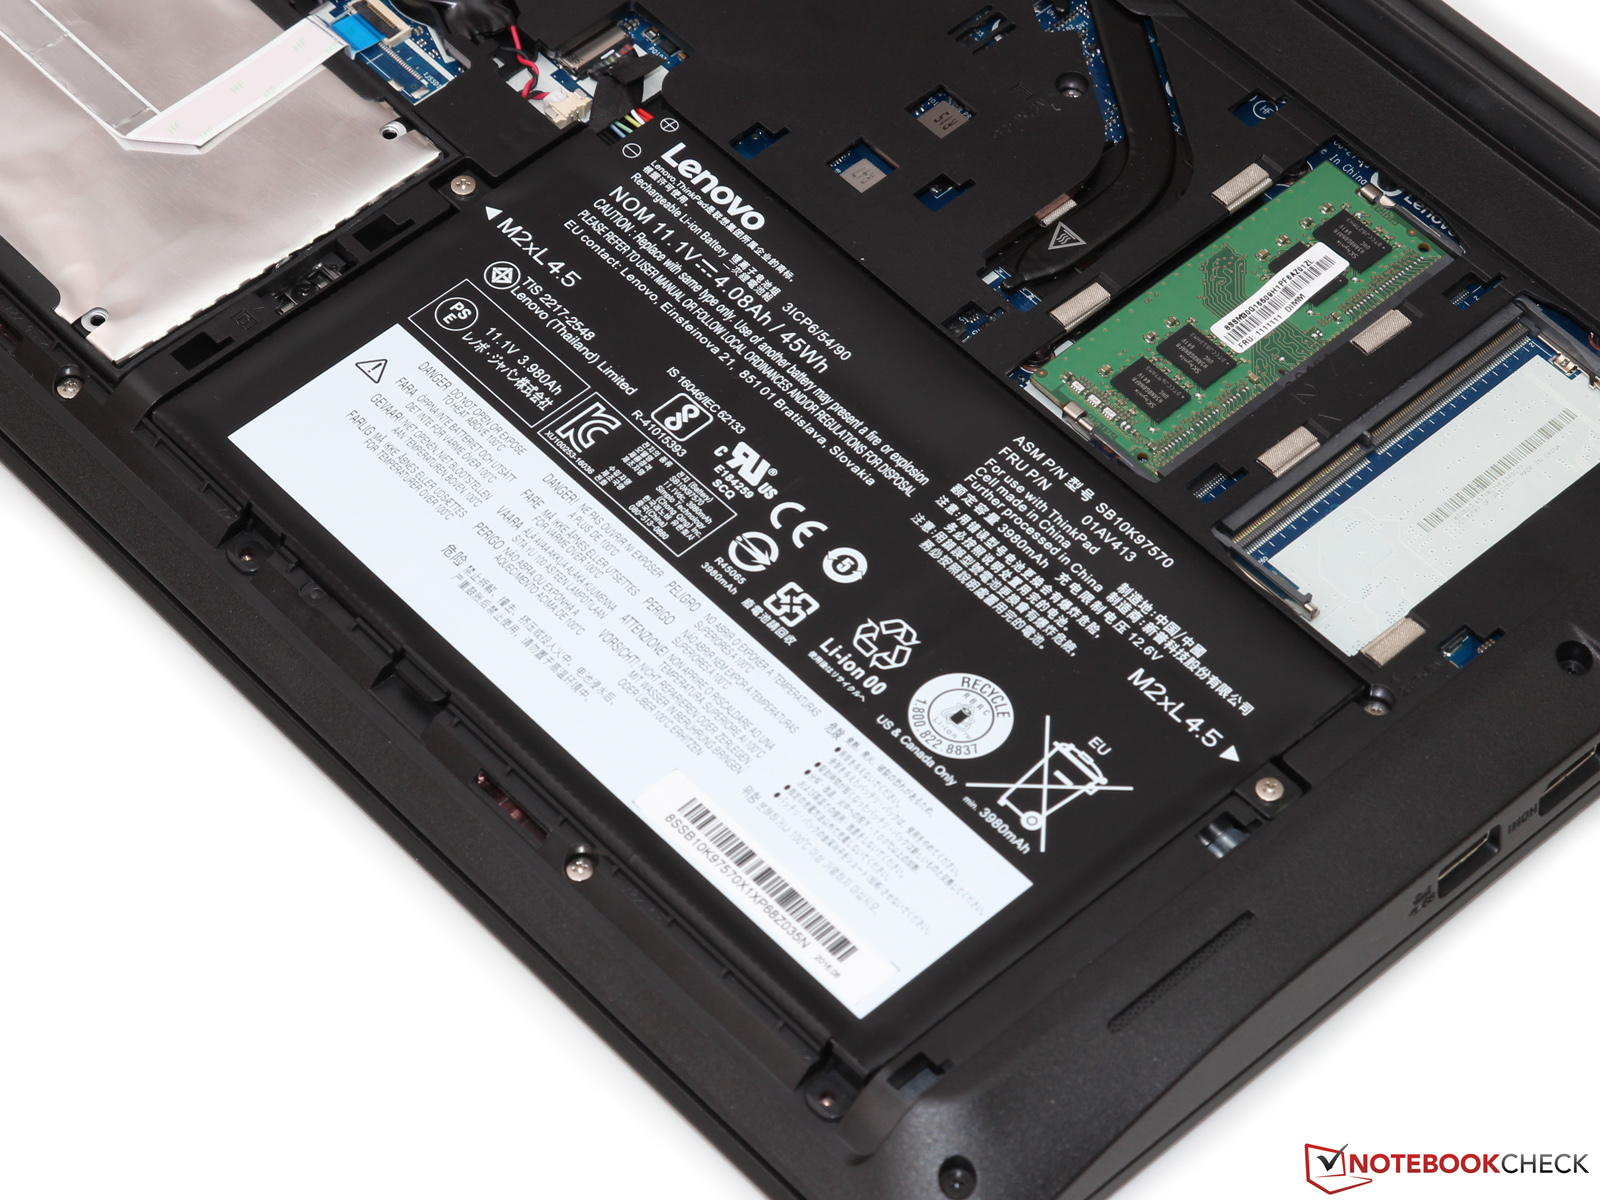
Bu yıl Lenovo eski E400 serisi tasarımına bağlı kalıp, bazı bileşenleri güncelliyor. Bu cihazda da harika işcilik, arayüzler ve iyi yönetilmiş ses ve sıcaklık değerleri mevcut. Ek olarak testcihazımında Core i5 işlemci, SSD ve IPS ekran ile harici GeForce grafik kartı mevcut, üstelik bunların hepsi ilgi çekici bir fiyata. Ancak malesef bu cihaz bu fiyata sadece öğrenciler için sunulmakta.
Yüksek kalite, iyi donanım ve iyi işcilik: Lenovo ThinkPad E470 tüm bileşenleri ile fiyat/performans yönünden harika.
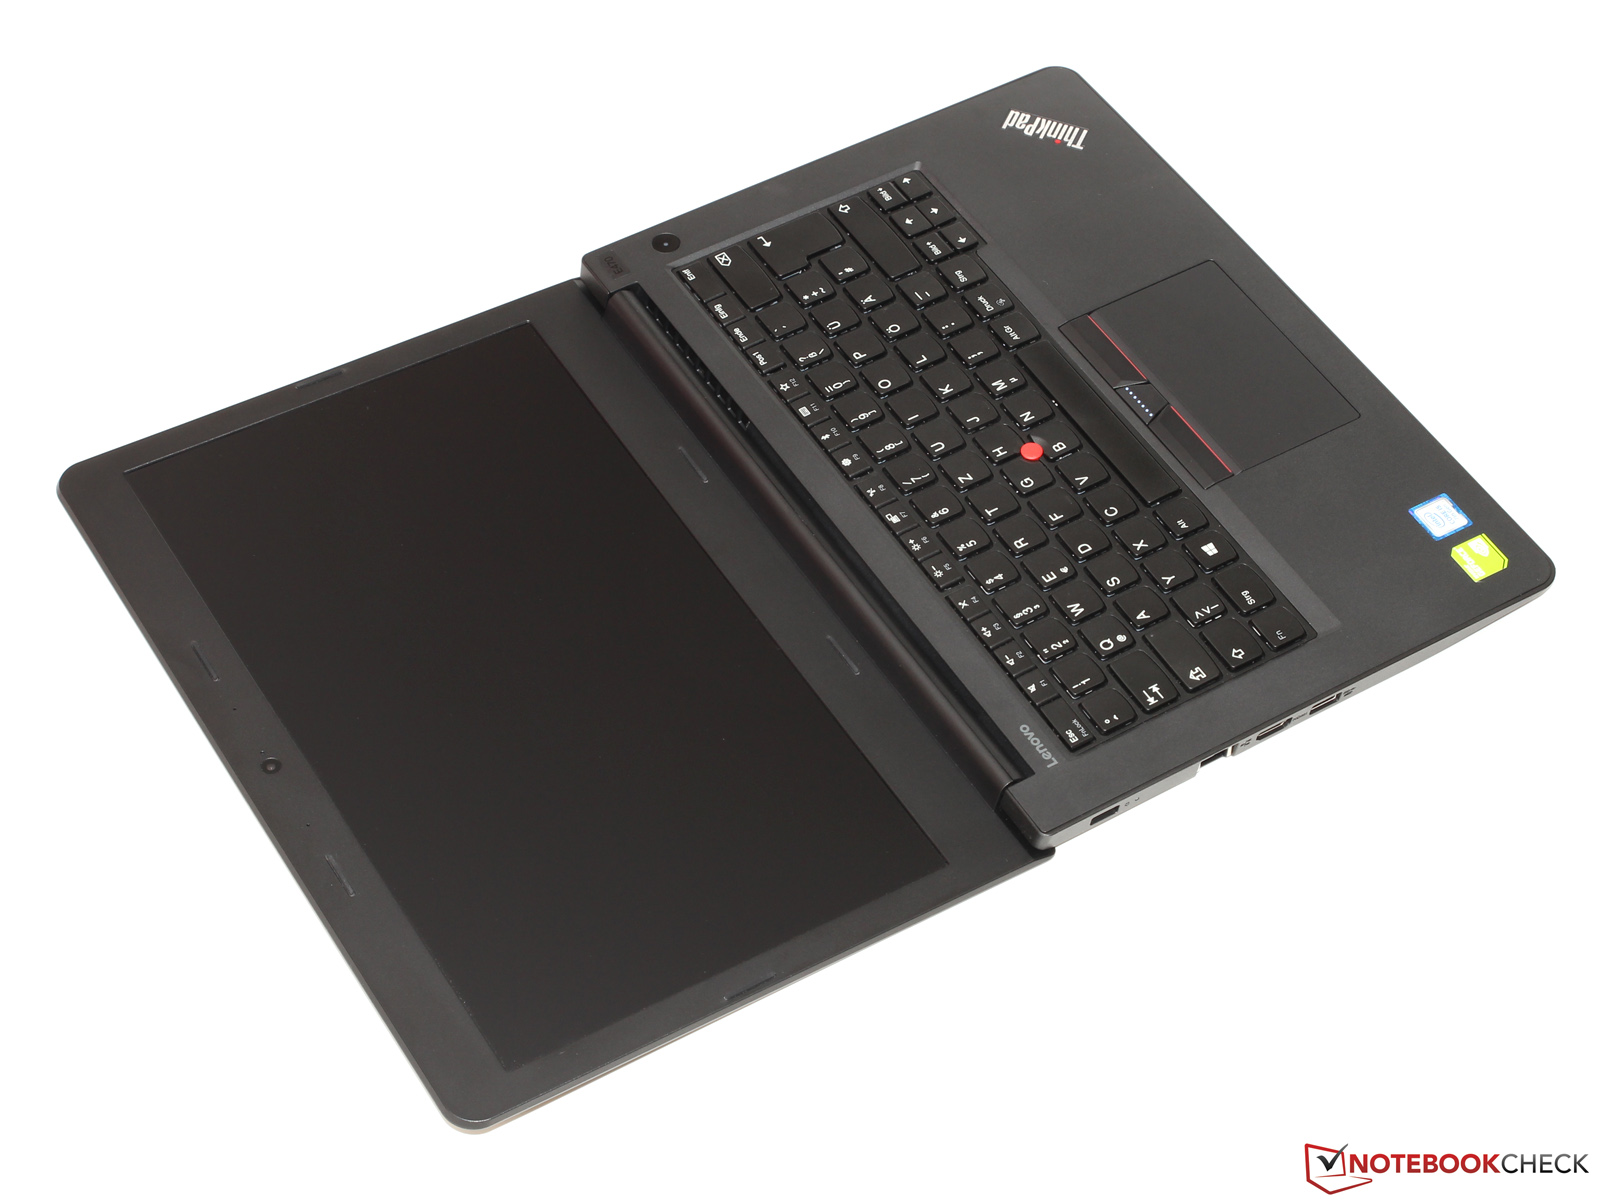
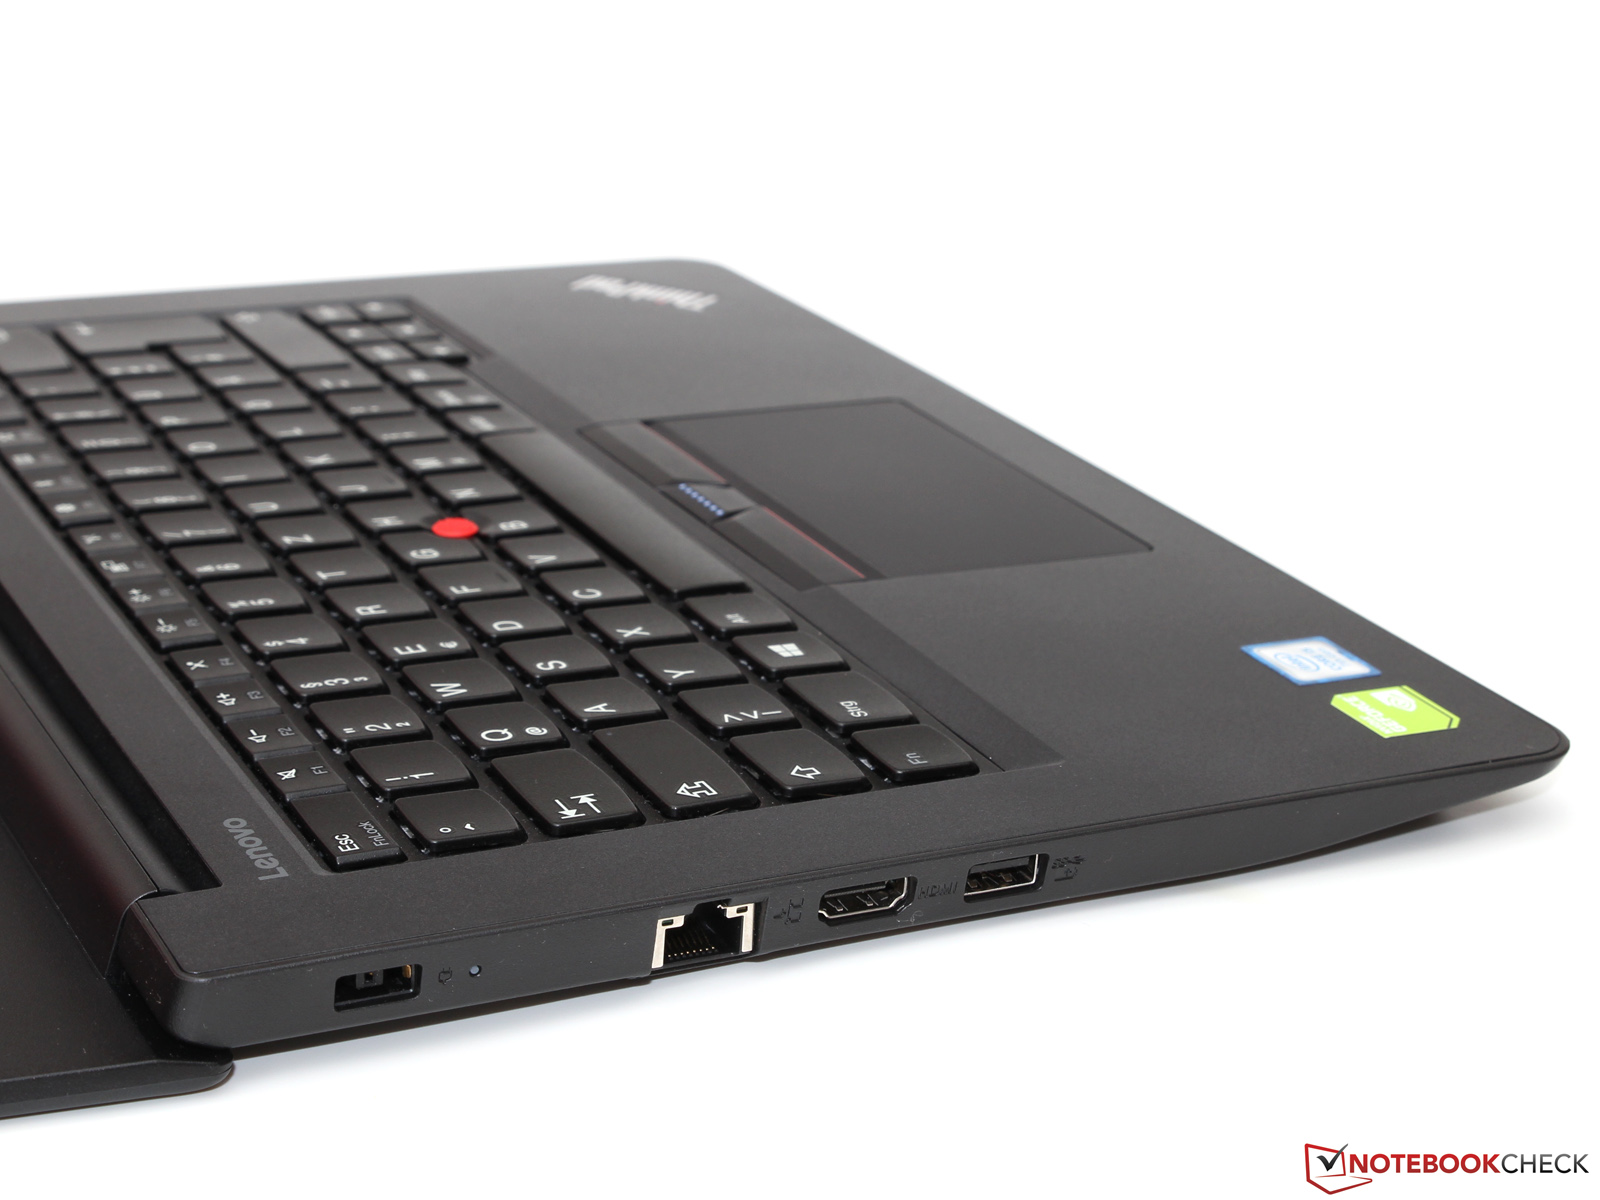
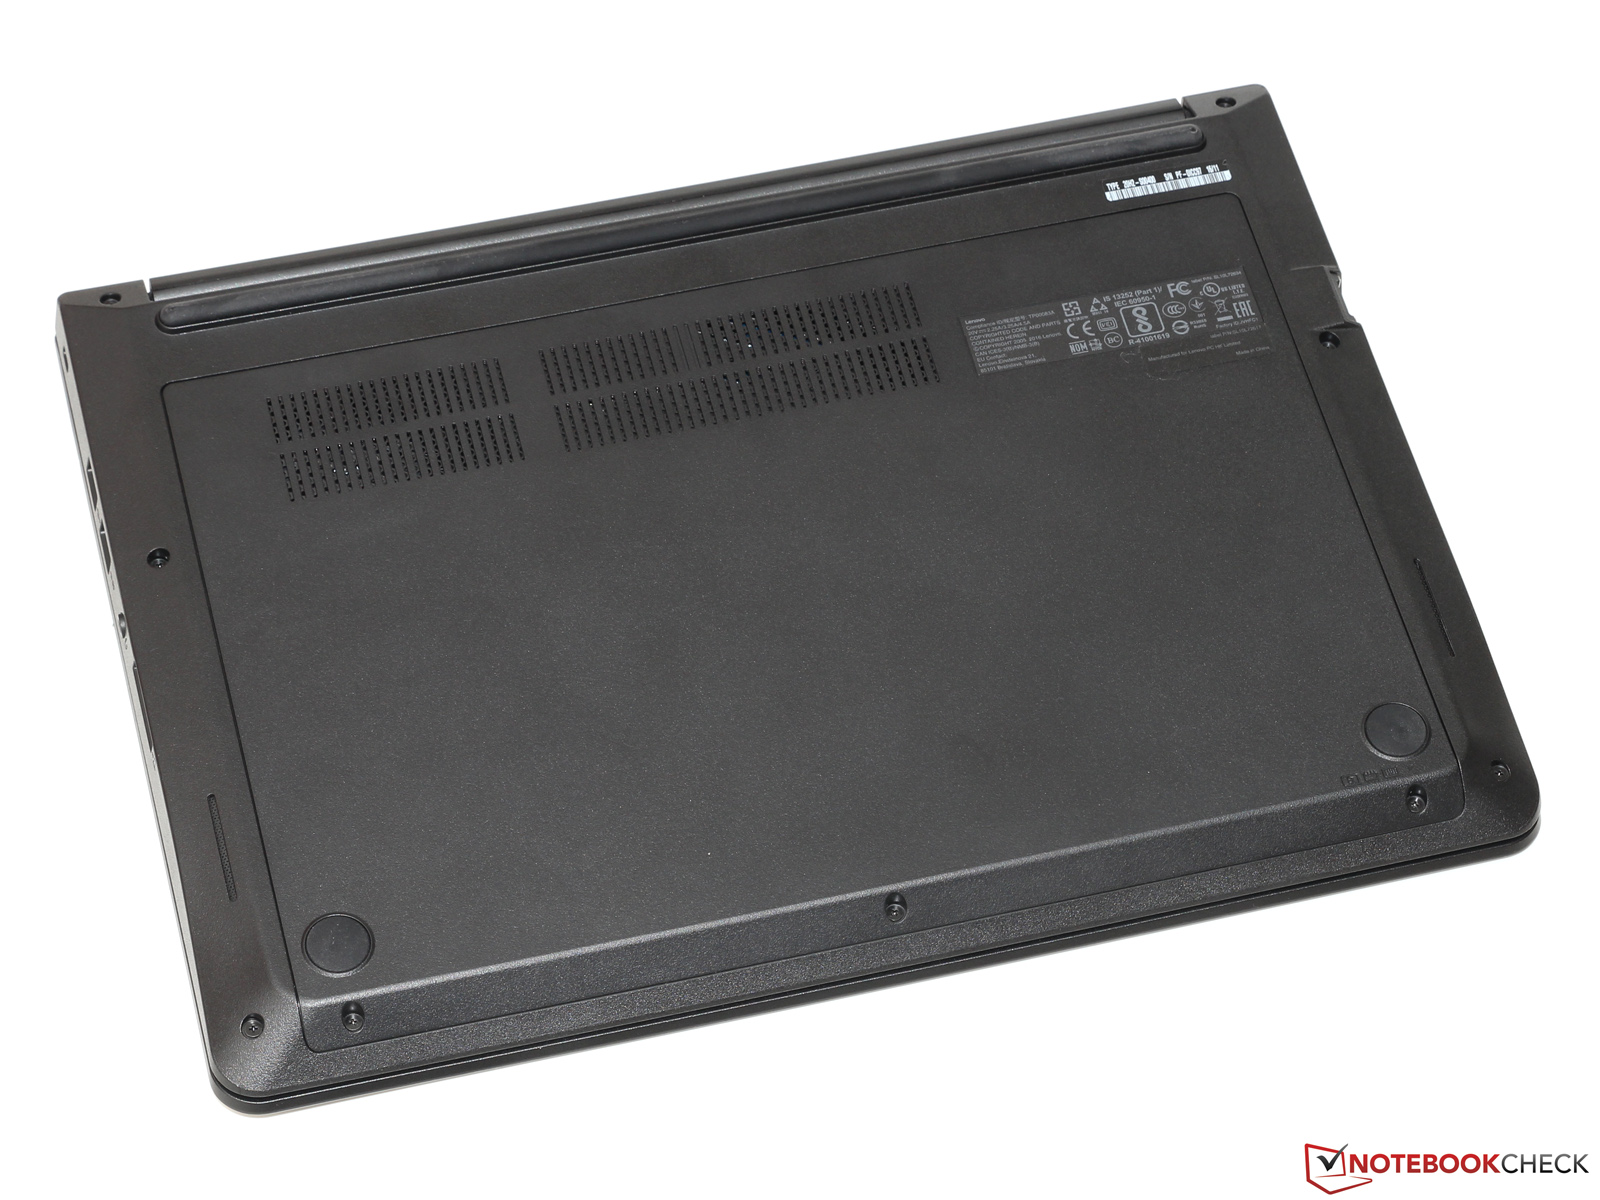
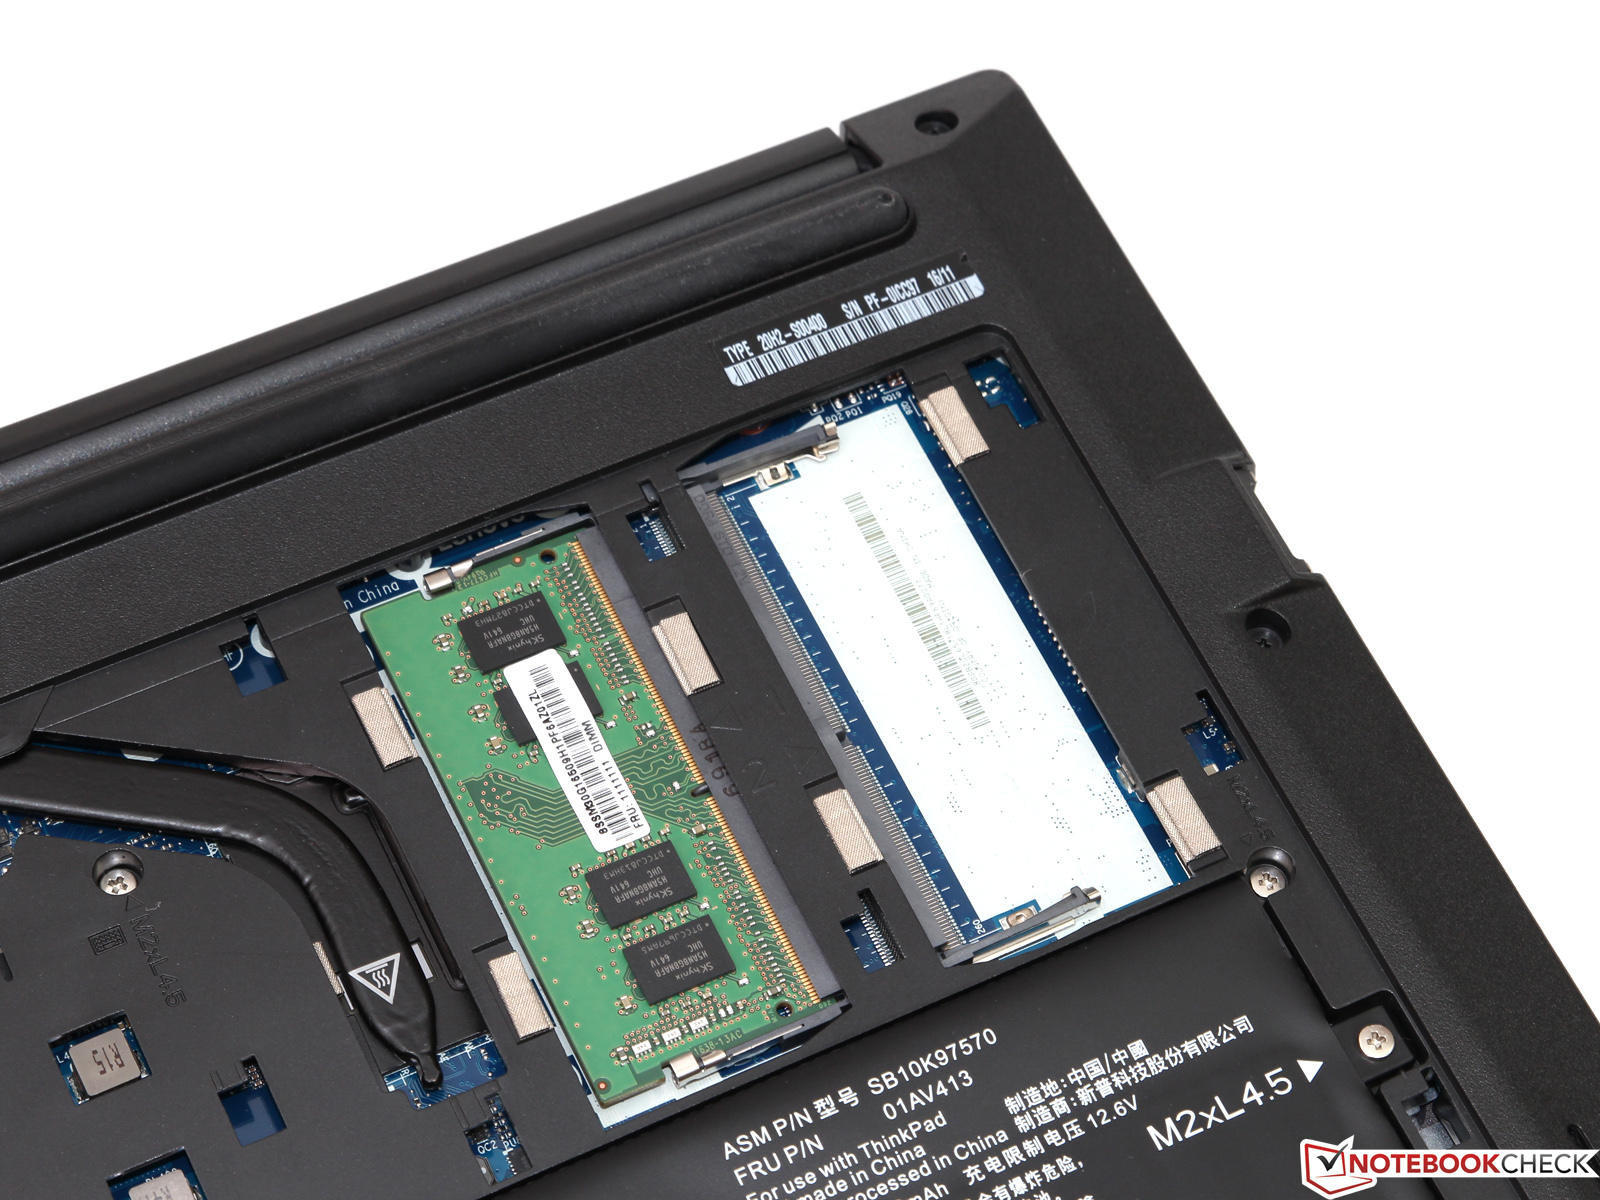
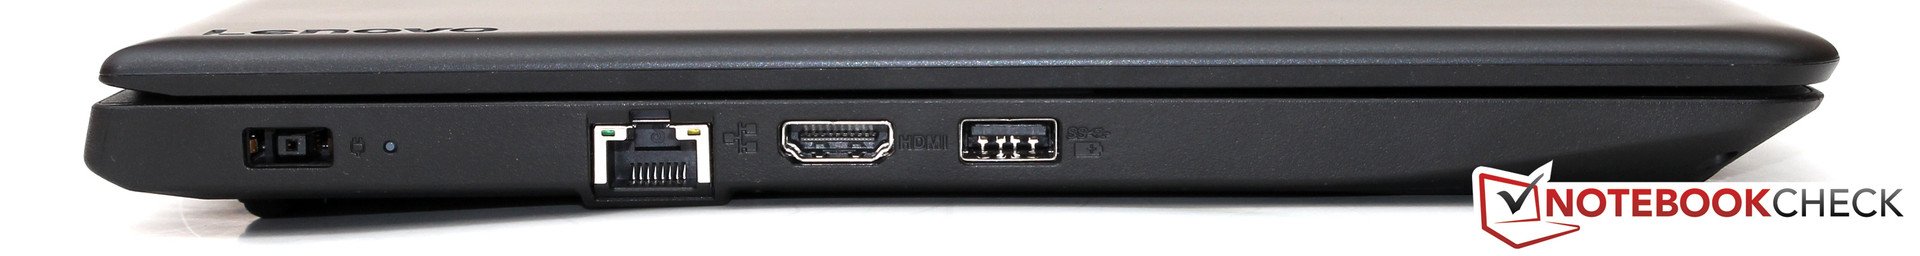
Cihazın eksikliklerine de değinmek gerekir: Kasa biraz ağır ve bileşenlerin güncelliği biraz kısıtlı. En azından bir adet M.2 bağlantısı veya USB C olabilirdi. HP ProBook 440 G4 gibi rakipler bu özellikleri de sunuyor. Stratejik olarak bu seçim doğru gözüküyor, eğer bunlar da olmul olsaydı daha pahalı ThinkPad cihazlarına ilgi azalabilirdi. Olası alıcılar seçim konusunda arada kalabilirler. ThinkPad E470 birçok farklı model seçeneği ile ofis ve multimedia işler için ideal.
Yazının orjinali için tıklayın.
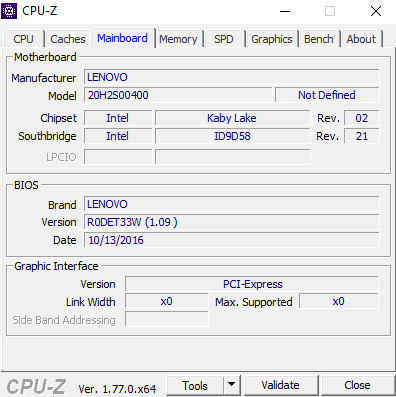
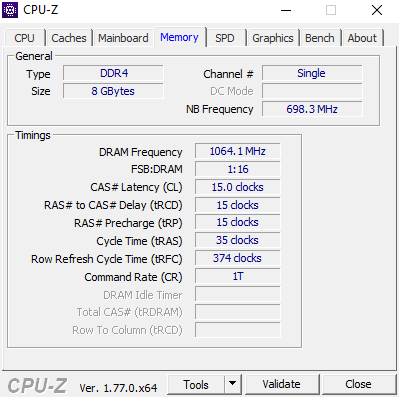
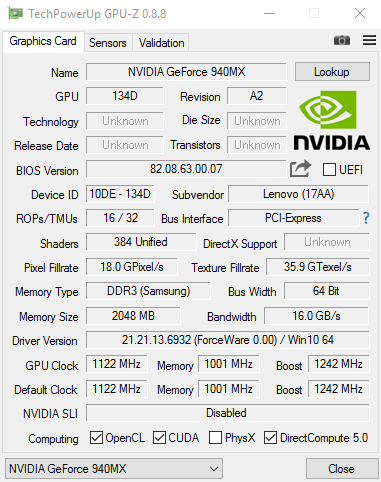
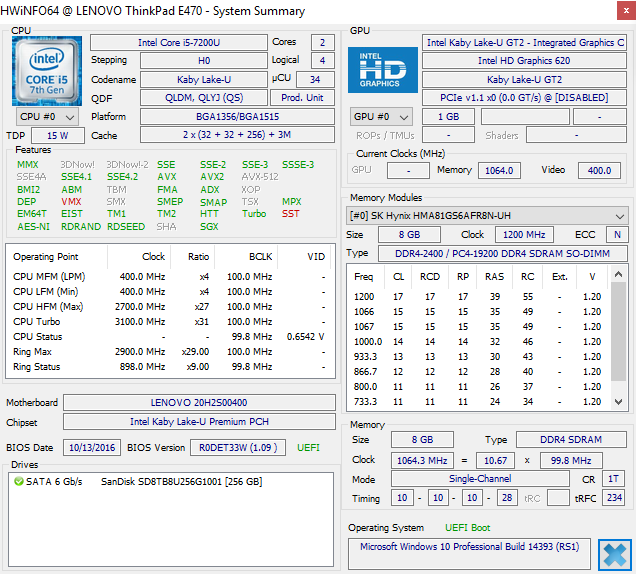
Lenovo ThinkPad E470-20H2S00400
-
12/27/2016 v6(old)
Till Schönborn