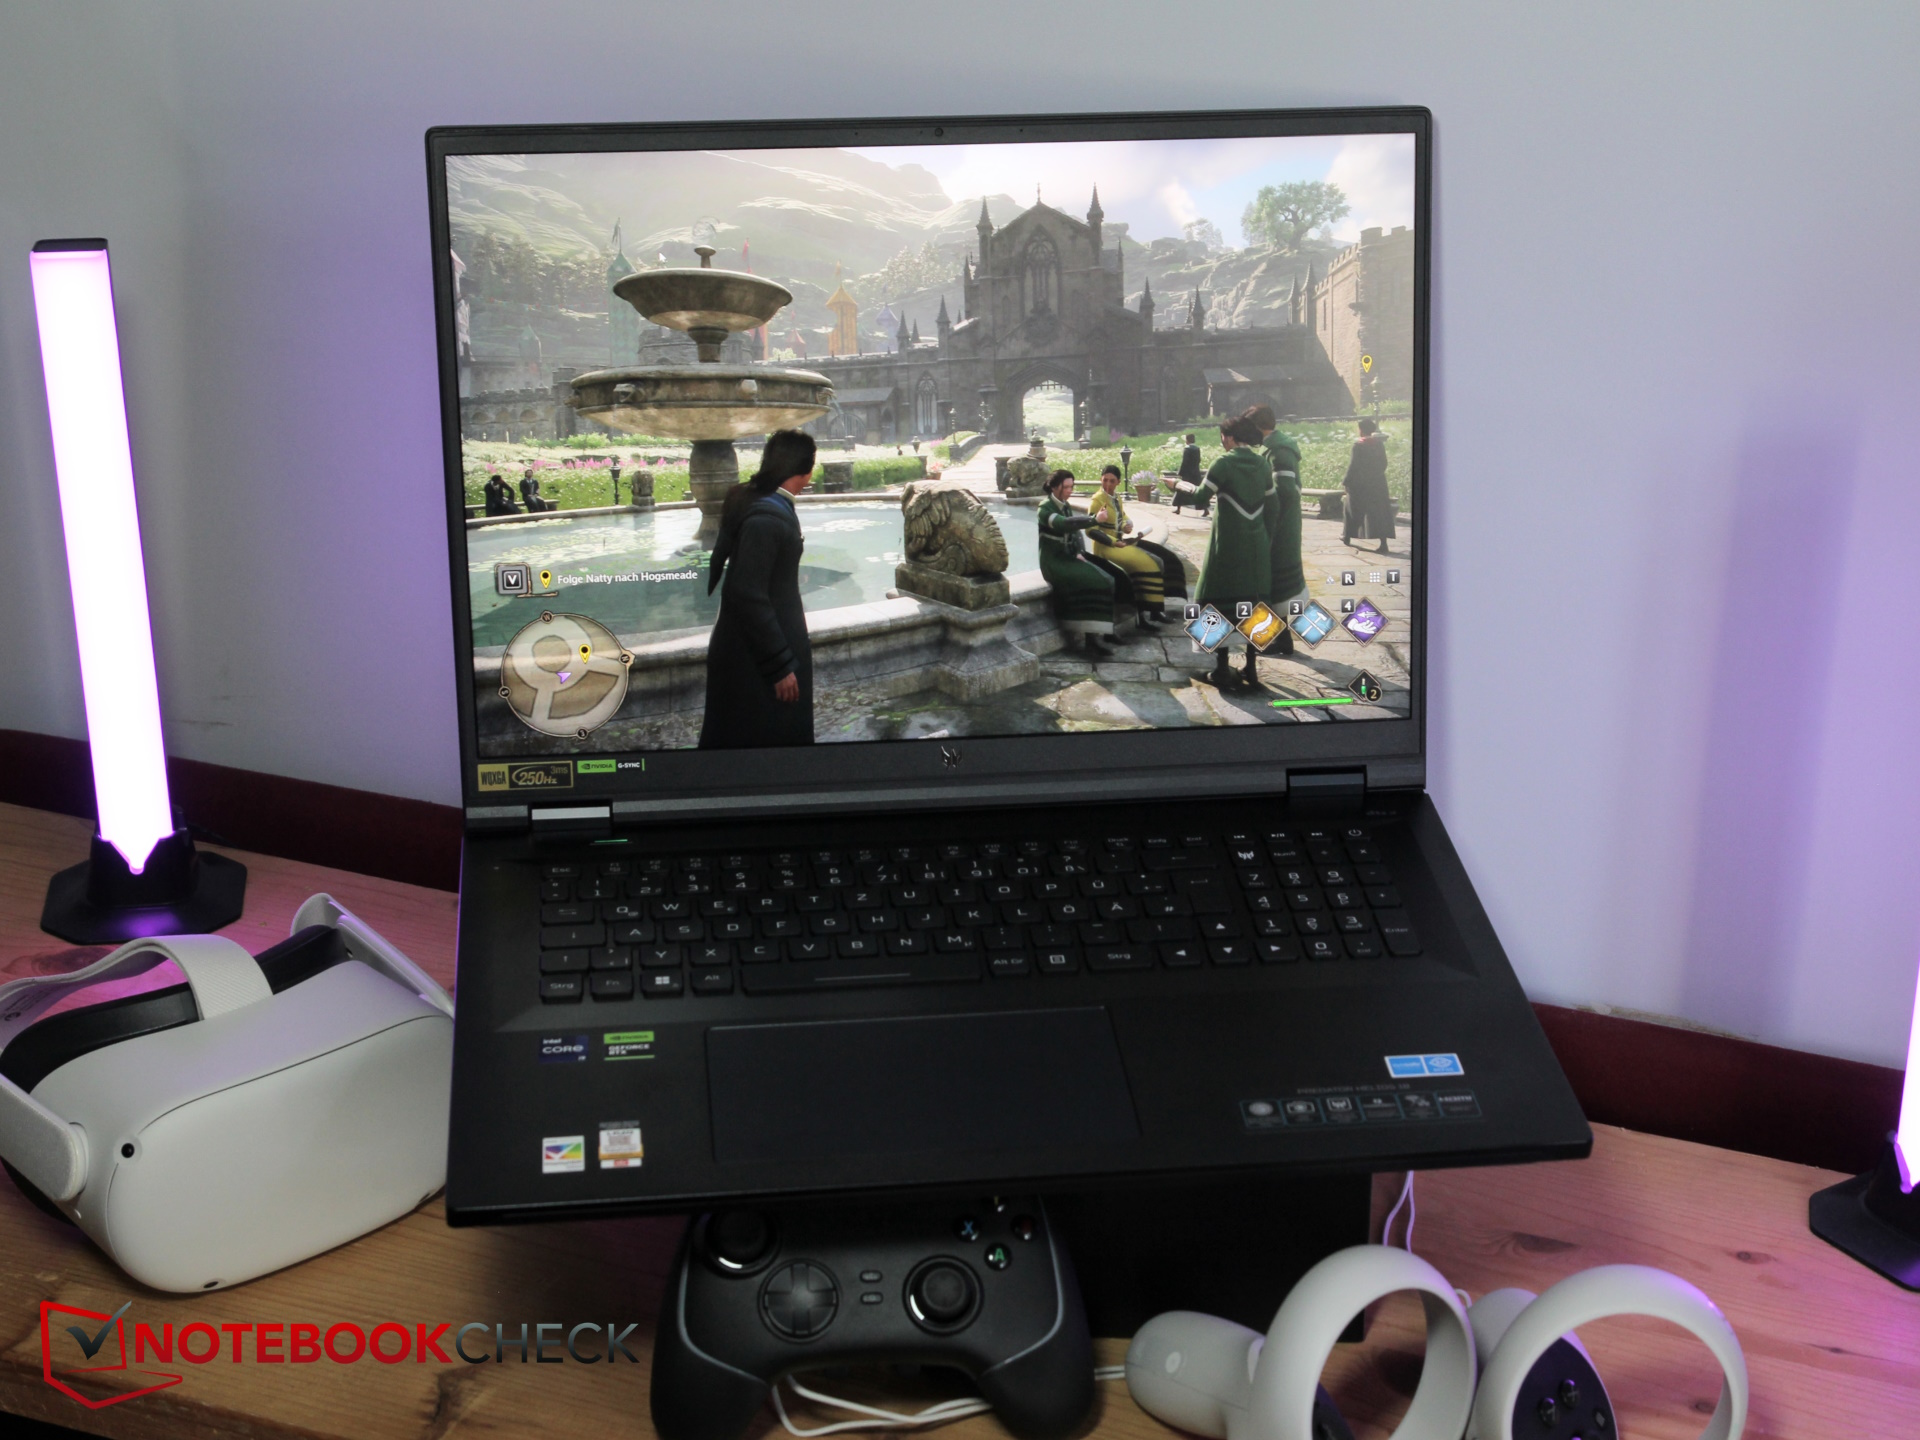
Acer Predator Helios 18 dizüstü bilgisayar incelemesi: 1.000 nitin üzerinde MiniLED ekranlı RTX 4080 oyuncu bilgisayarı
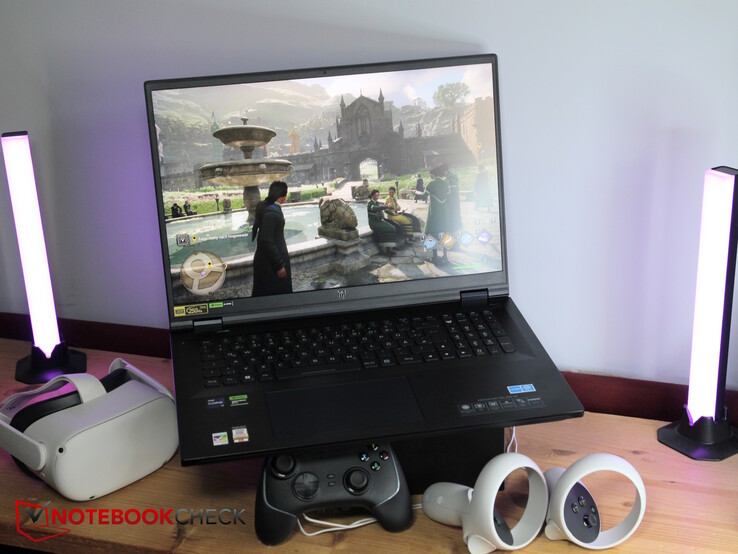
Bu RTX 4060 donanımlı Acer Predator Helios 16 temmuz ayındaki incelememizde tam yüzde 90 puan aldı. Şimdi, Intel HX işlemcili, 18 inçlik üst düzey modele bir göz atıyoruz RTX 4080 ve bir MiniLED ekran.
Predator Helios 18, 18 inçlik dizüstü bilgisayar incelemelerimiz arasında RTX 4080'e sahip ilk dizüstü bilgisayar olduğundan, karşılaştırma için diğer 18 inçlik oyuncuların yanı sıra benzer özelliklere sahip 17 inçlik oyuncuları da kullanıyoruz. Rakipler arasındaMSI Raider GE78 HX 13VH, the HP Omen 17, the Alienware m18 R1, the Asus ROG Strix G18 G814JI ve Razer Blade 18.
Karşılaştırmalı olarak olası rakipler
Derecelendirme | Tarih | Modeli | Ağırlık | Yükseklik | Boyut | Çözünürlük | Fiyat |
|---|---|---|---|---|---|---|---|
| 88.3 % v7 (old) | 10/2023 | Acer Predator Helios 18 N23Q2 i9-13900HX, GeForce RTX 4080 Laptop GPU | 3.2 kg | 29.15 mm | 18.00" | 2560x1600 | |
| 88.3 % v7 (old) | 04/2023 | MSI GE78HX 13VH-070US i9-13950HX, GeForce RTX 4080 Laptop GPU | 3 kg | 23 mm | 17.00" | 2560x1600 | |
| 85.4 % v7 (old) | 05/2023 | HP Omen 17-ck2097ng i9-13900HX, GeForce RTX 4080 Laptop GPU | 2.8 kg | 27 mm | 17.30" | 2560x1440 | |
| 90.7 % v7 (old) | 04/2023 | Alienware m18 R1 i9-13980HX, GeForce RTX 4090 Laptop GPU | 3.9 kg | 26.7 mm | 18.00" | 1920x1200 | |
| 87.4 % v7 (old) | 04/2023 | Asus ROG Strix G18 G814JI i7-13650HX, GeForce RTX 4070 Laptop GPU | 3 kg | 31 mm | 18.00" | 2560x1600 | |
| 91.4 % v7 (old) | 02/2023 | Razer Blade 18 RTX 4070 i9-13950HX, GeForce RTX 4070 Laptop GPU | 3 kg | 21.9 mm | 18.00" | 2560x1600 |
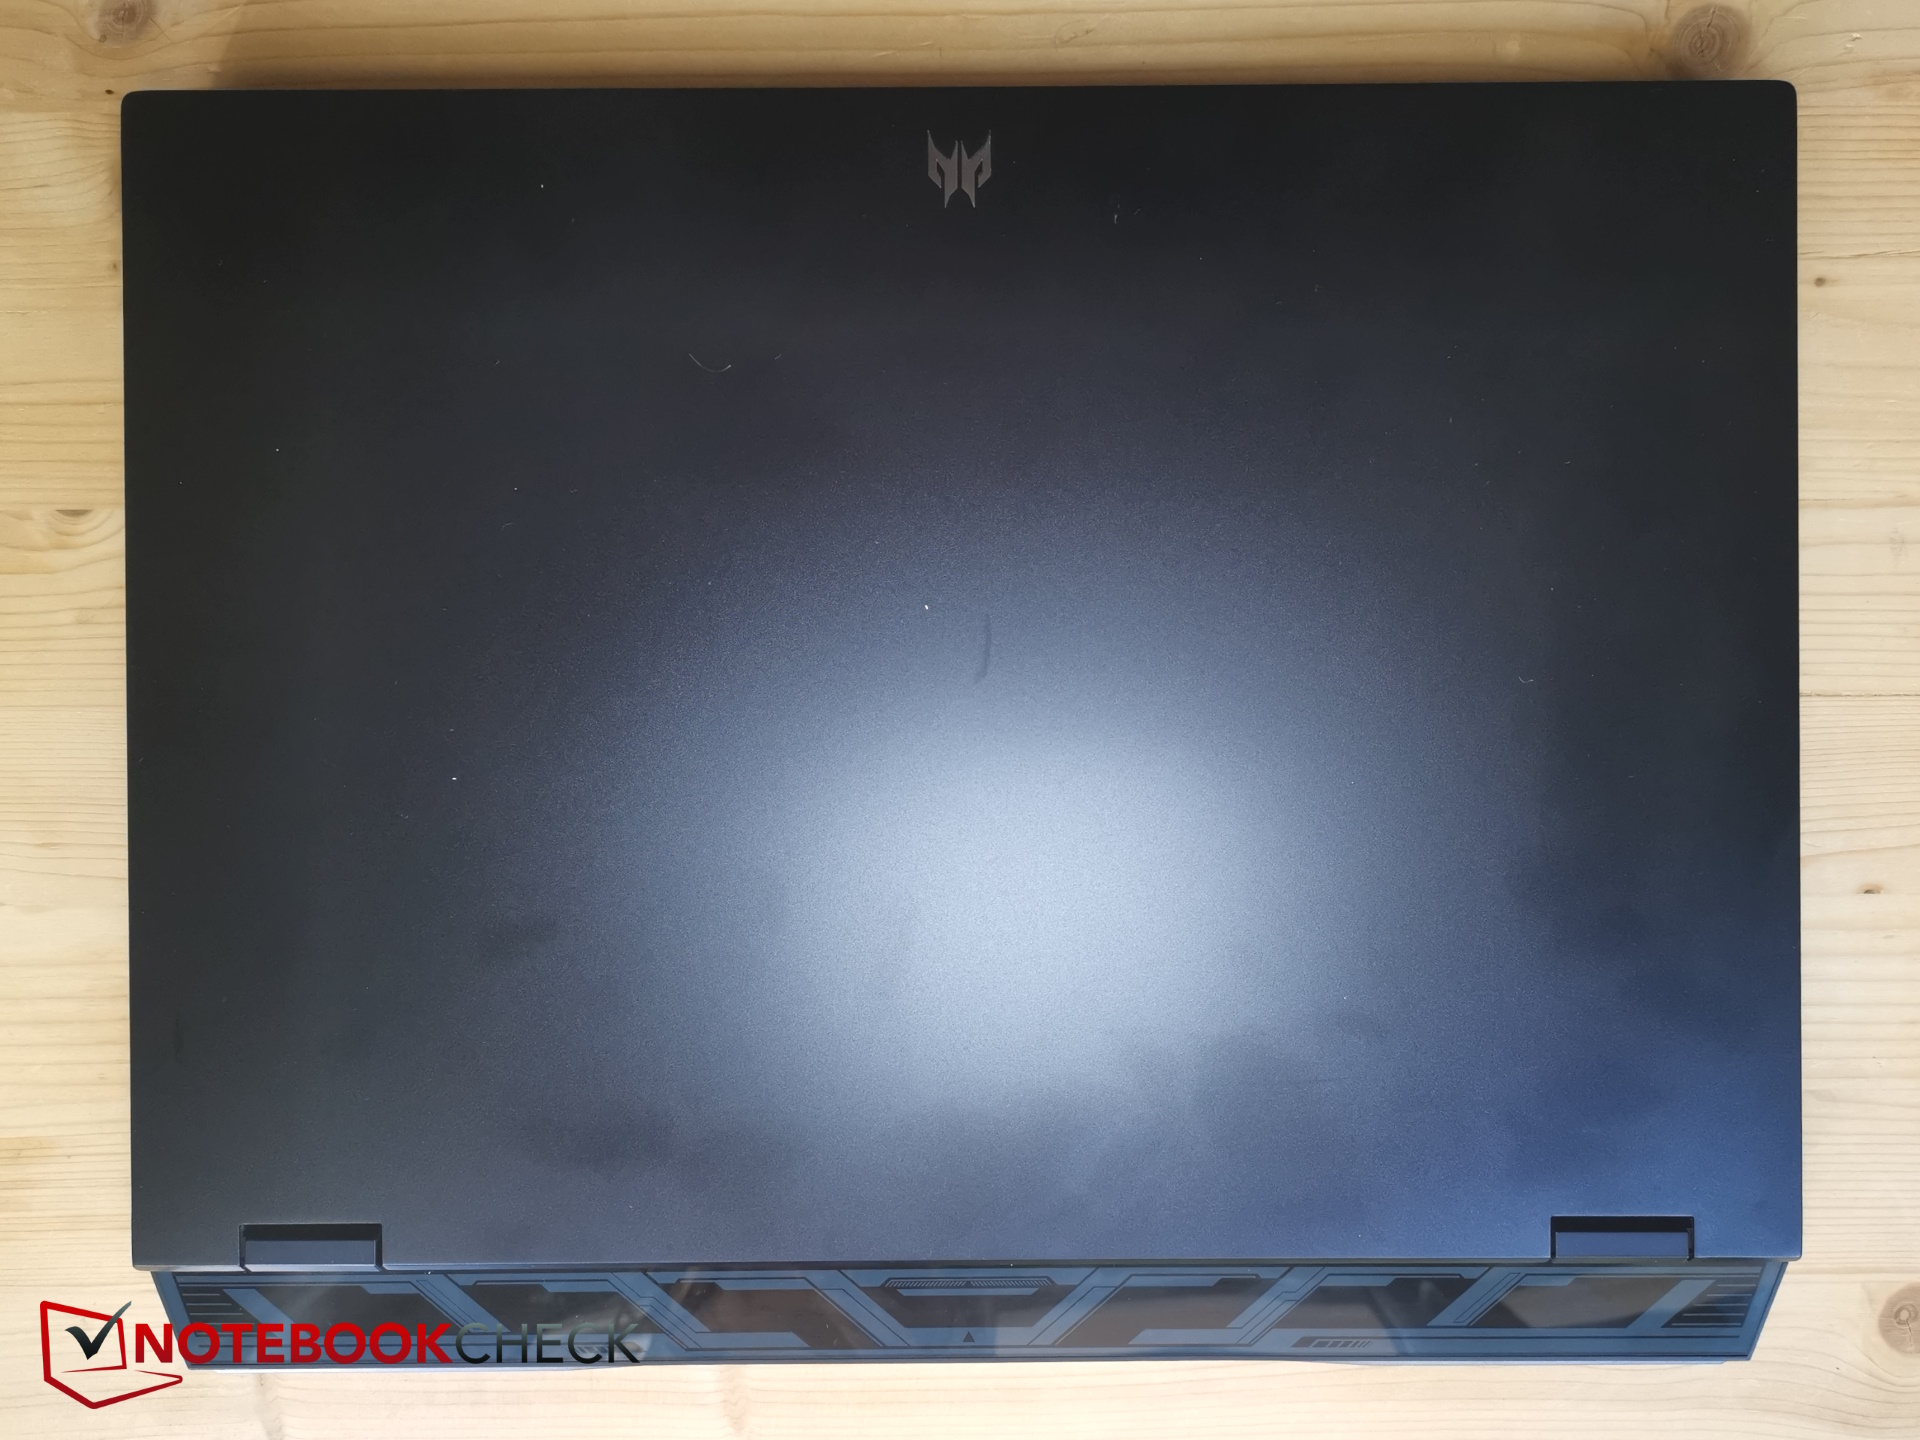
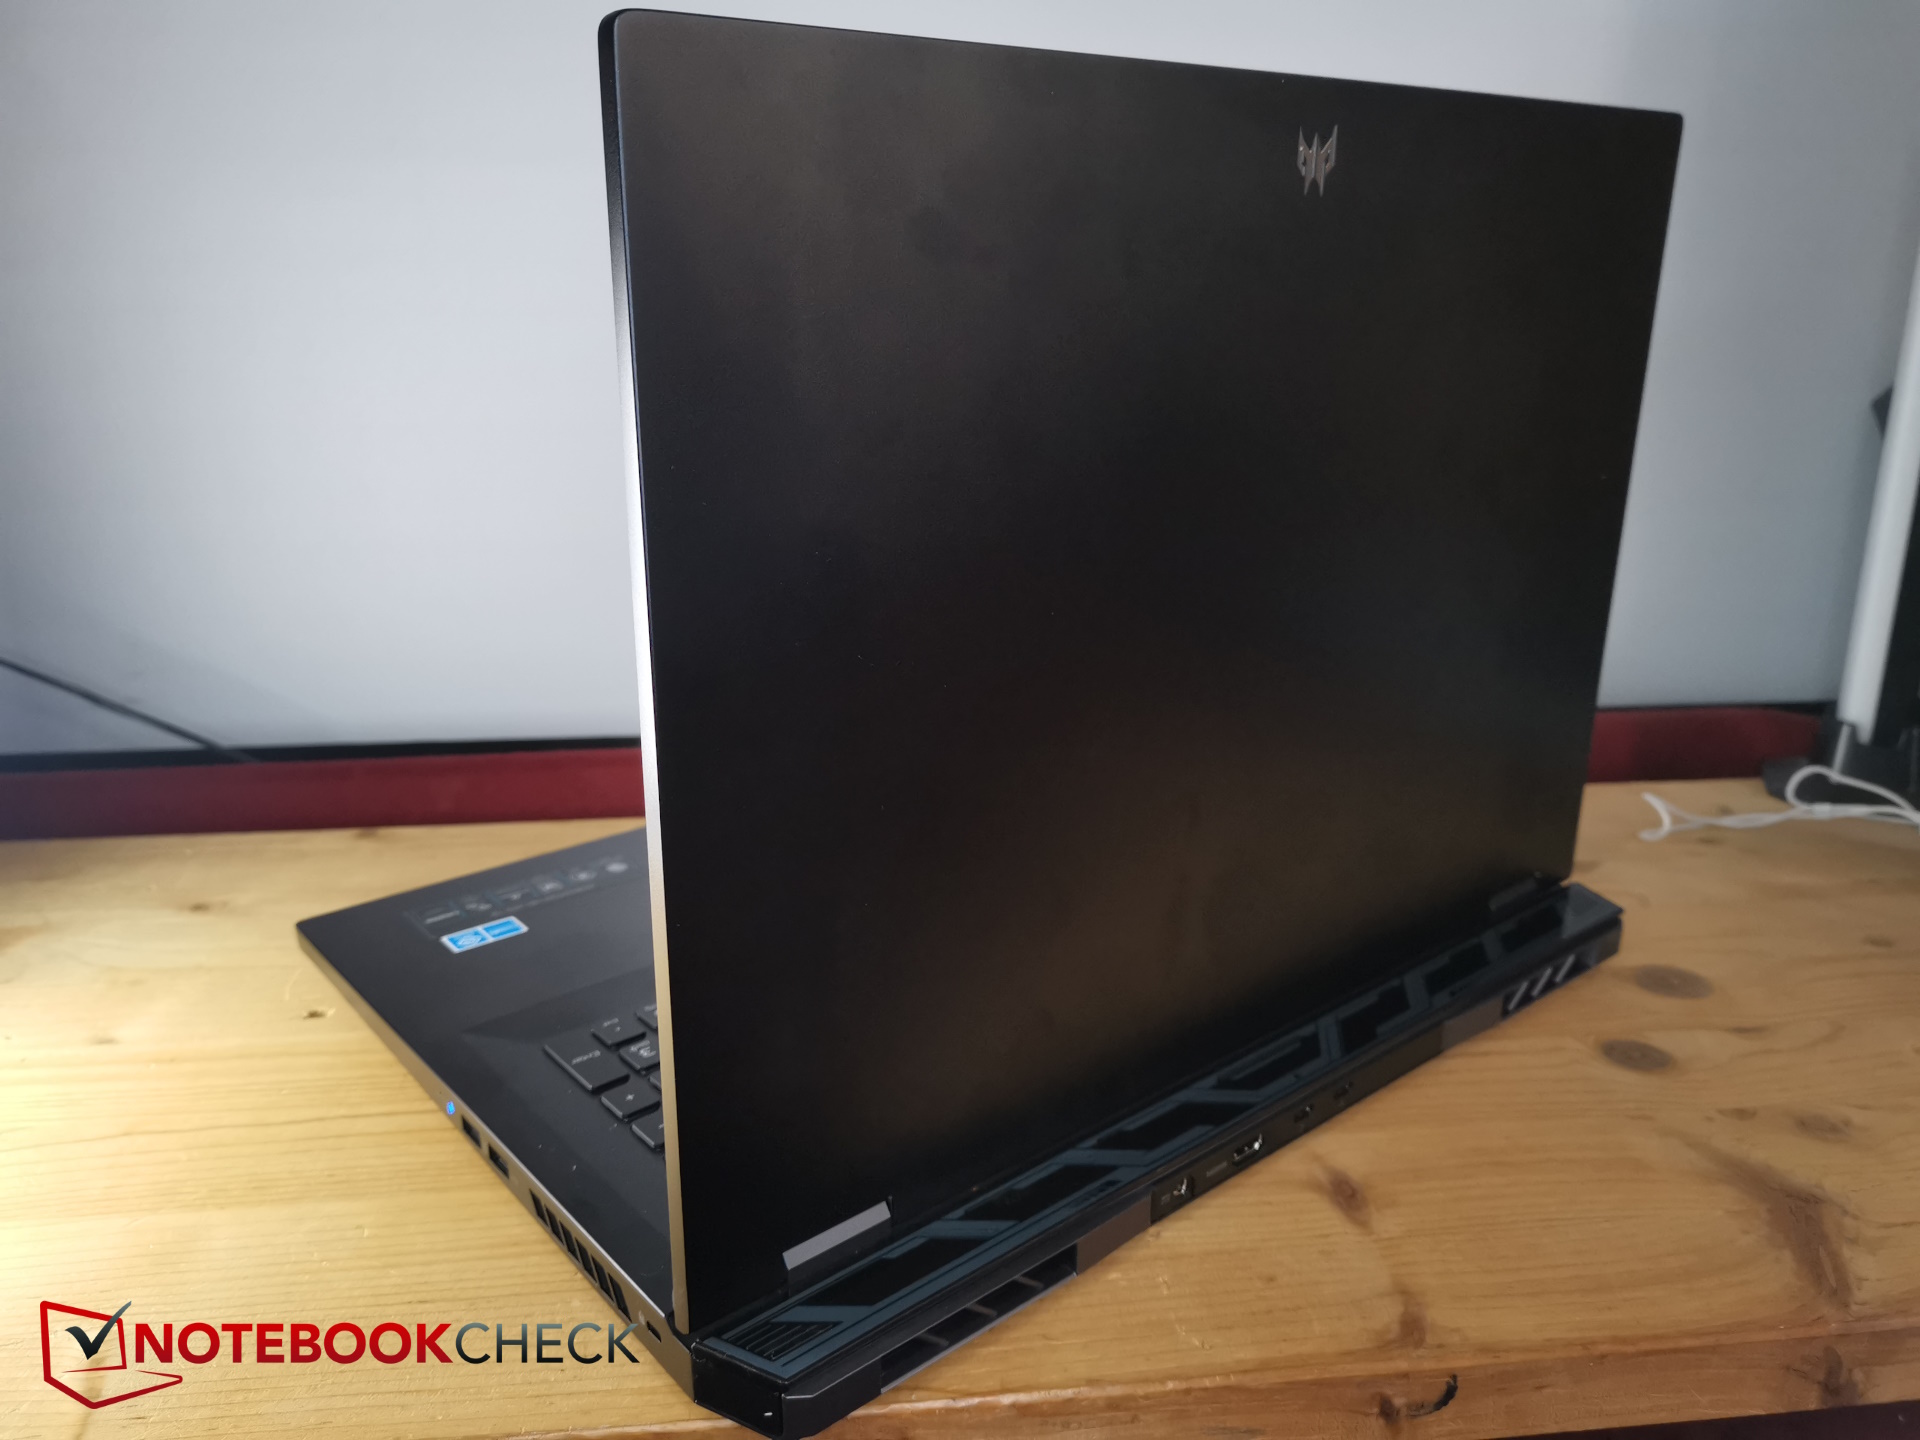
Kasa - Acer Predator için siyah alüminyum
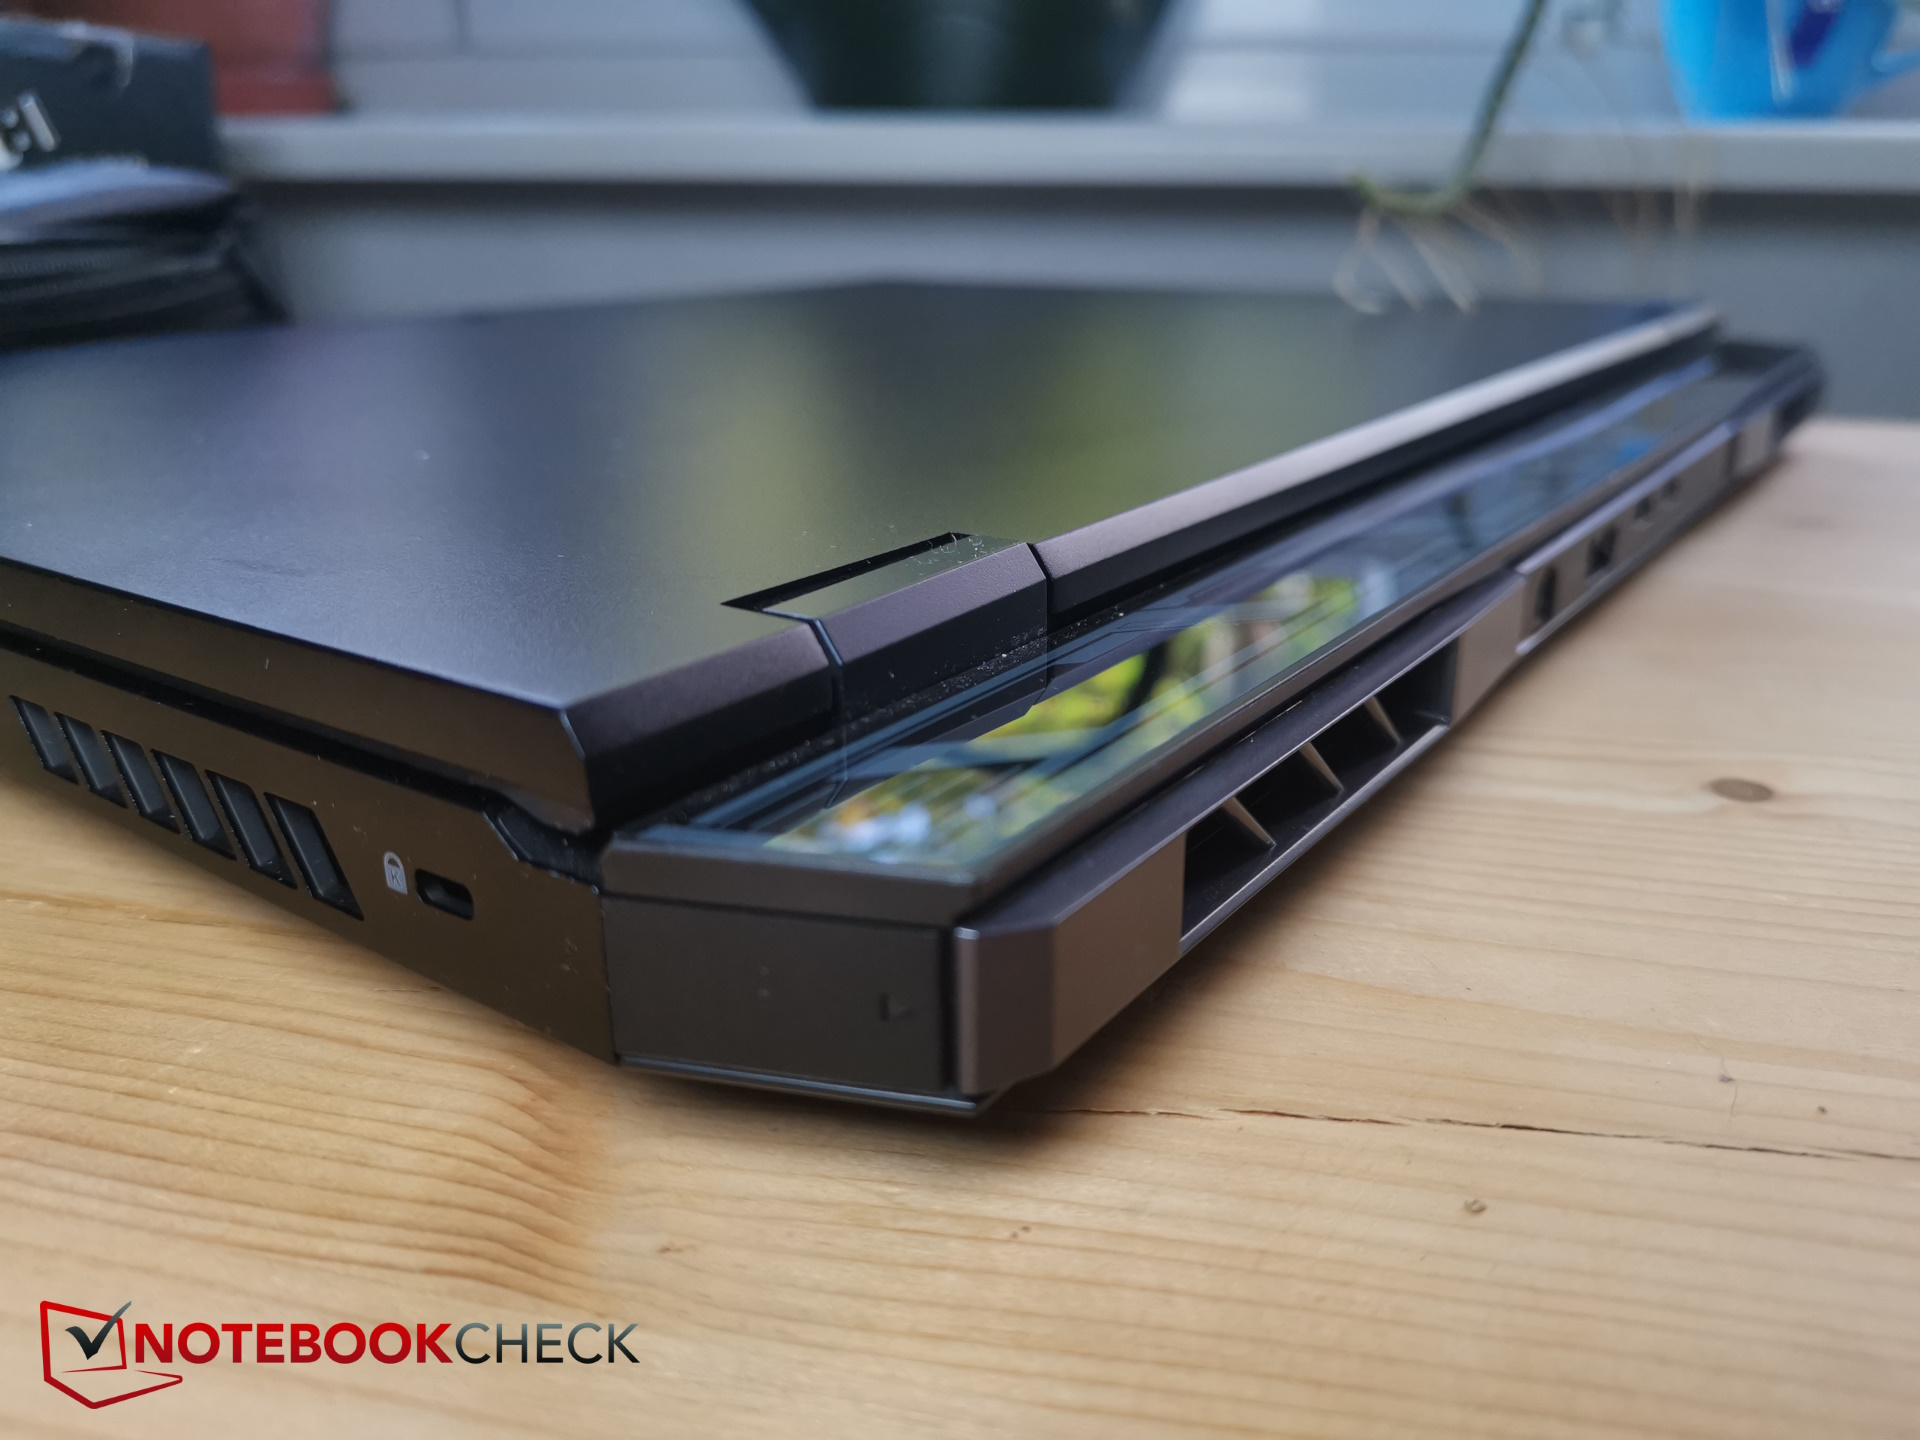
Acer, Helios 18'i koyu, neredeyse göze çarpmayan siyah renkte tasarladı. Ancak cihaz, ekran kapağındaki küçük Predator logosu ve arkadaki çıkıntılı soğutma sistemi ile karakterize edilen oyun doğasını gizlemek için hiçbir girişimde bulunmuyor.
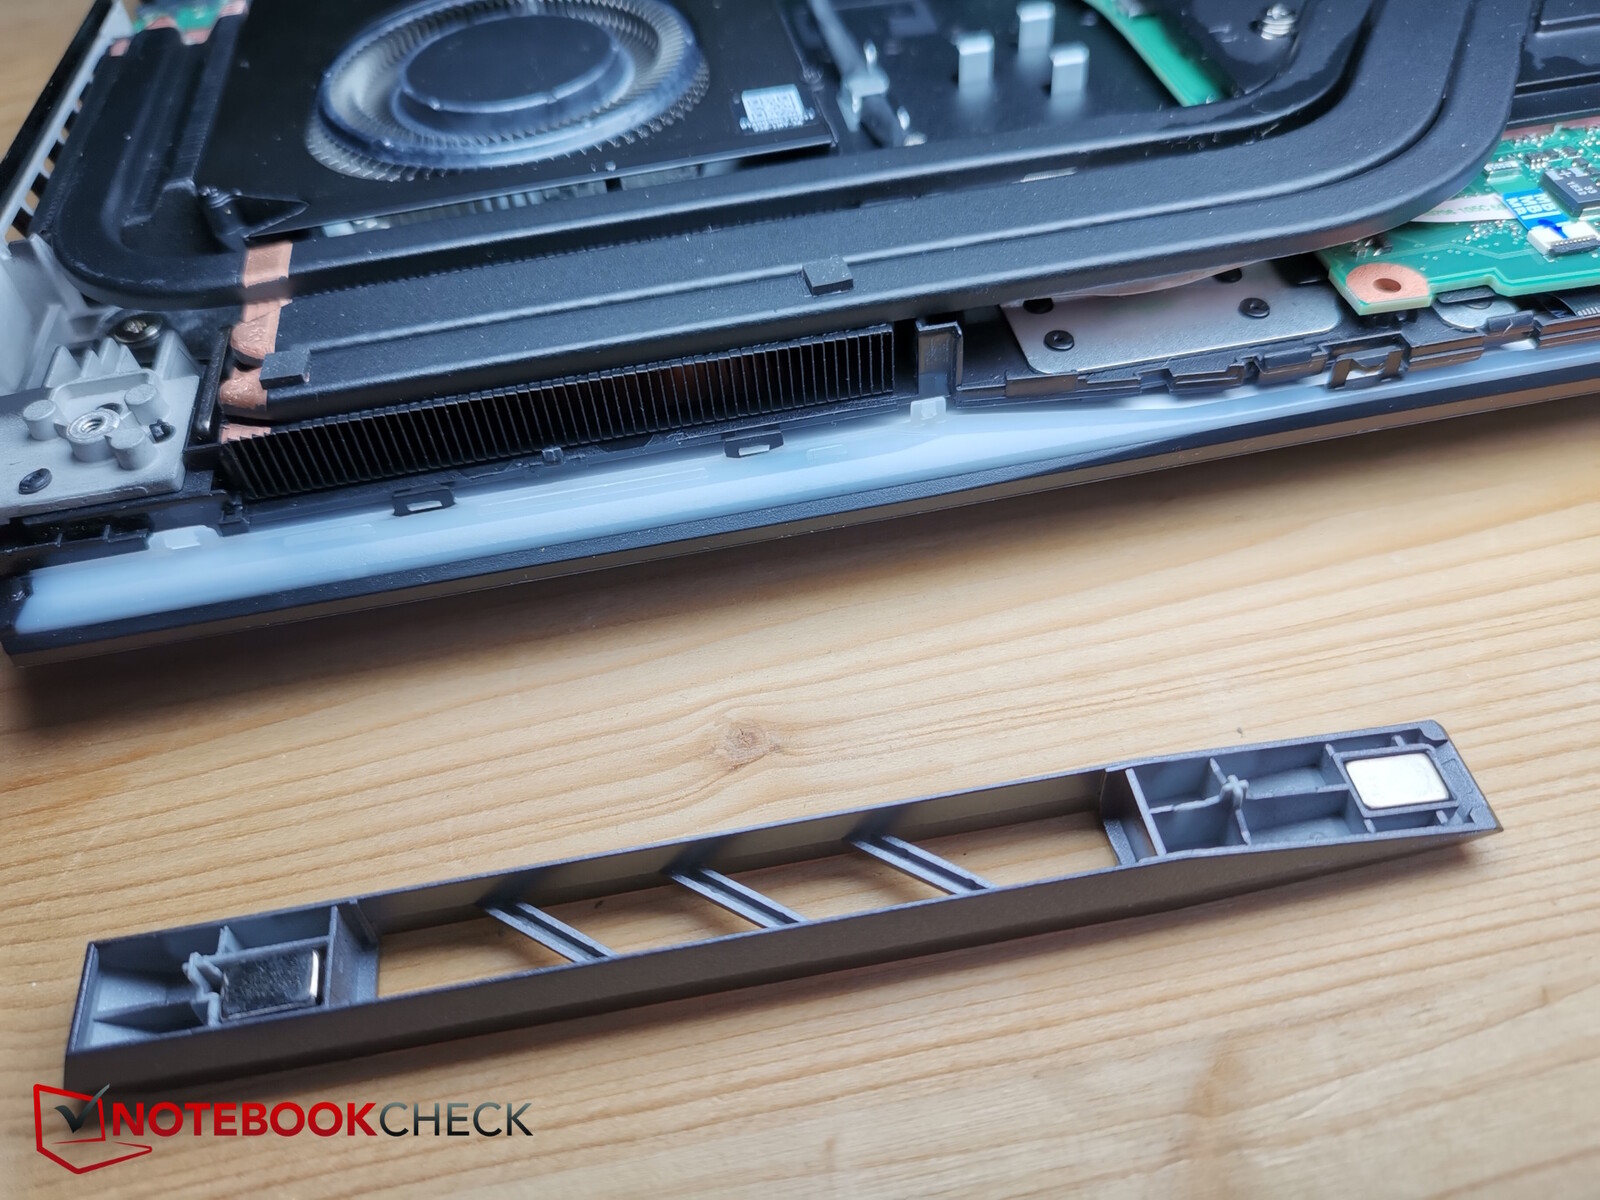
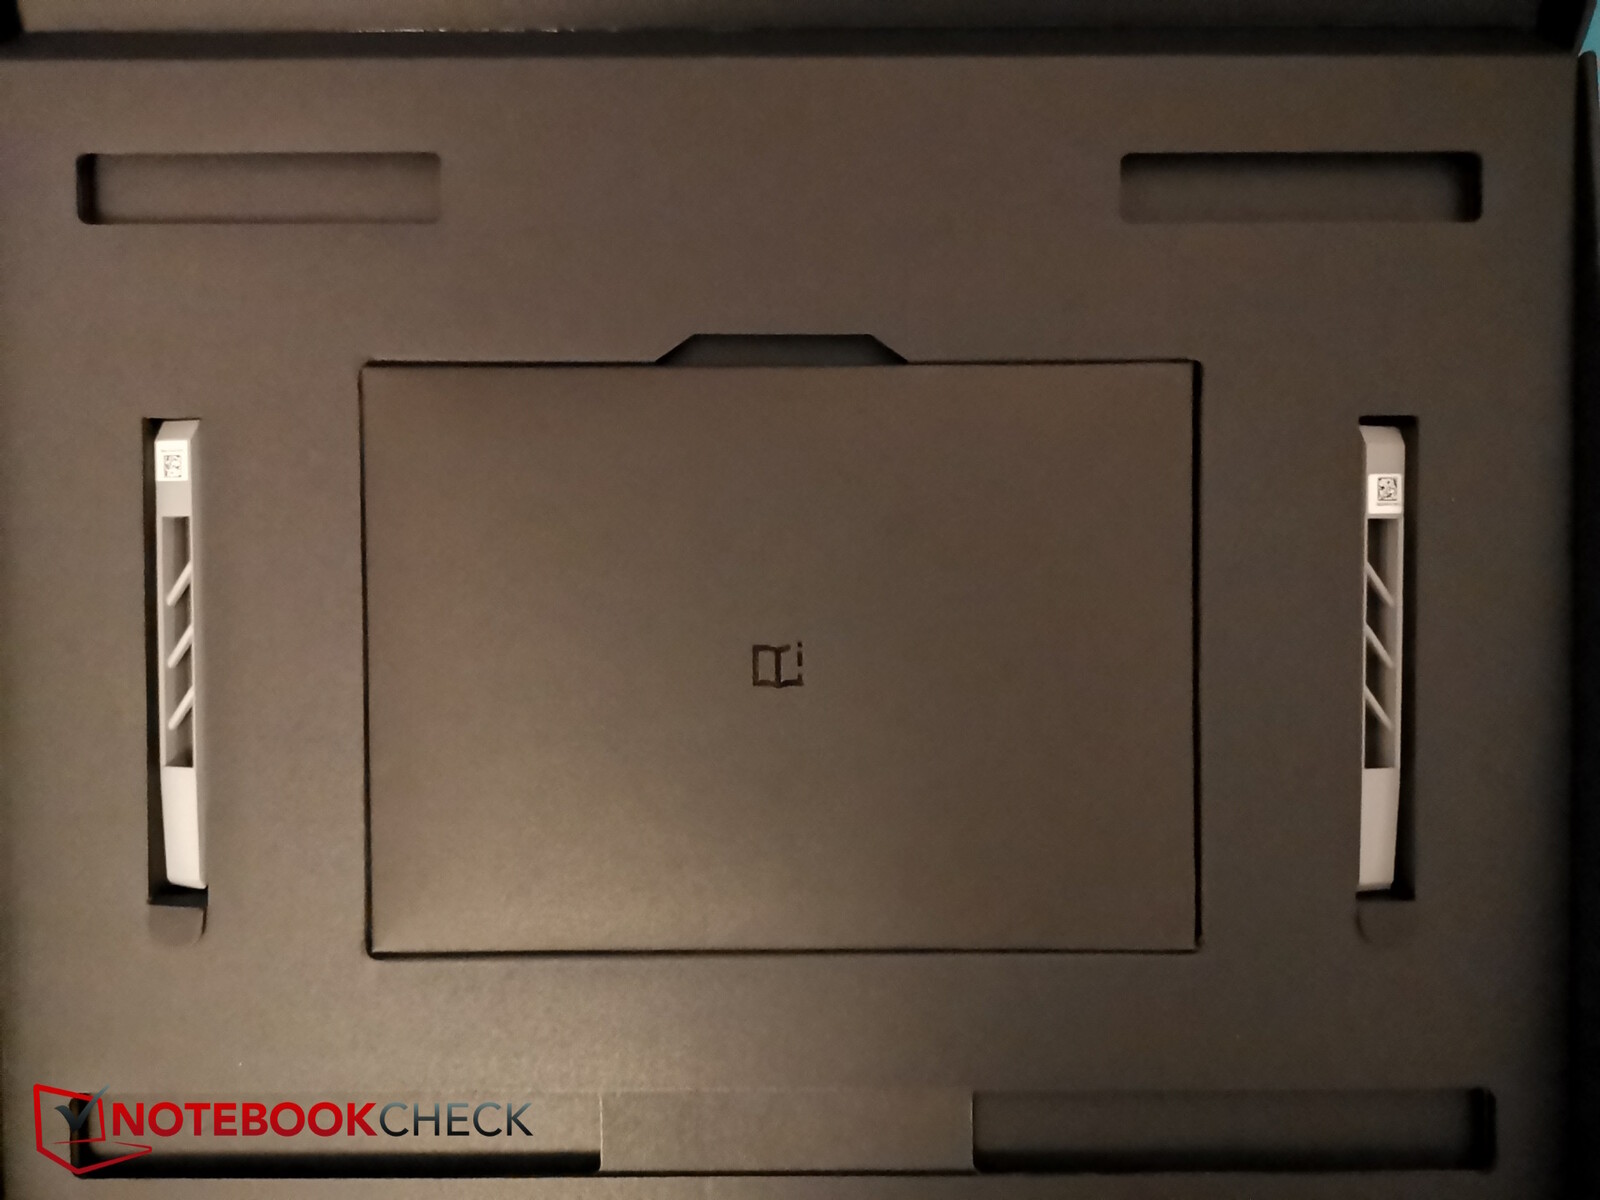
İşçilik eleştiriye yer bırakmıyor: boşluklar fark edilmiyor. Arka hava çıkışları bile özelleştirilebilir - Acer, 3D yazıcı ile daha da özelleştirilebilen bir çift havalandırma ızgarası daha içerir.
Ekran kapağı ve tabanı alüminyumdan yapılırken, ekran kenarları, arka soğutma ünitesi ve dizüstü bilgisayarın alt kısmı plastikten yapılmıştır. Metal, Helios 18'e iyi bir sağlamlık sağlıyor ve burulma stresine maruz kaldığında hiçbir şey çatlamıyor veya kırılmıyor. Bununla birlikte, parmak izleri burada kolayca birikir ve yazarken bile tabanın üst tarafı metale rağmen biraz bastırılabilir. Ancak bu sınırlar içinde kalıyor ve geniş yüzeyden kaynaklanıyor.
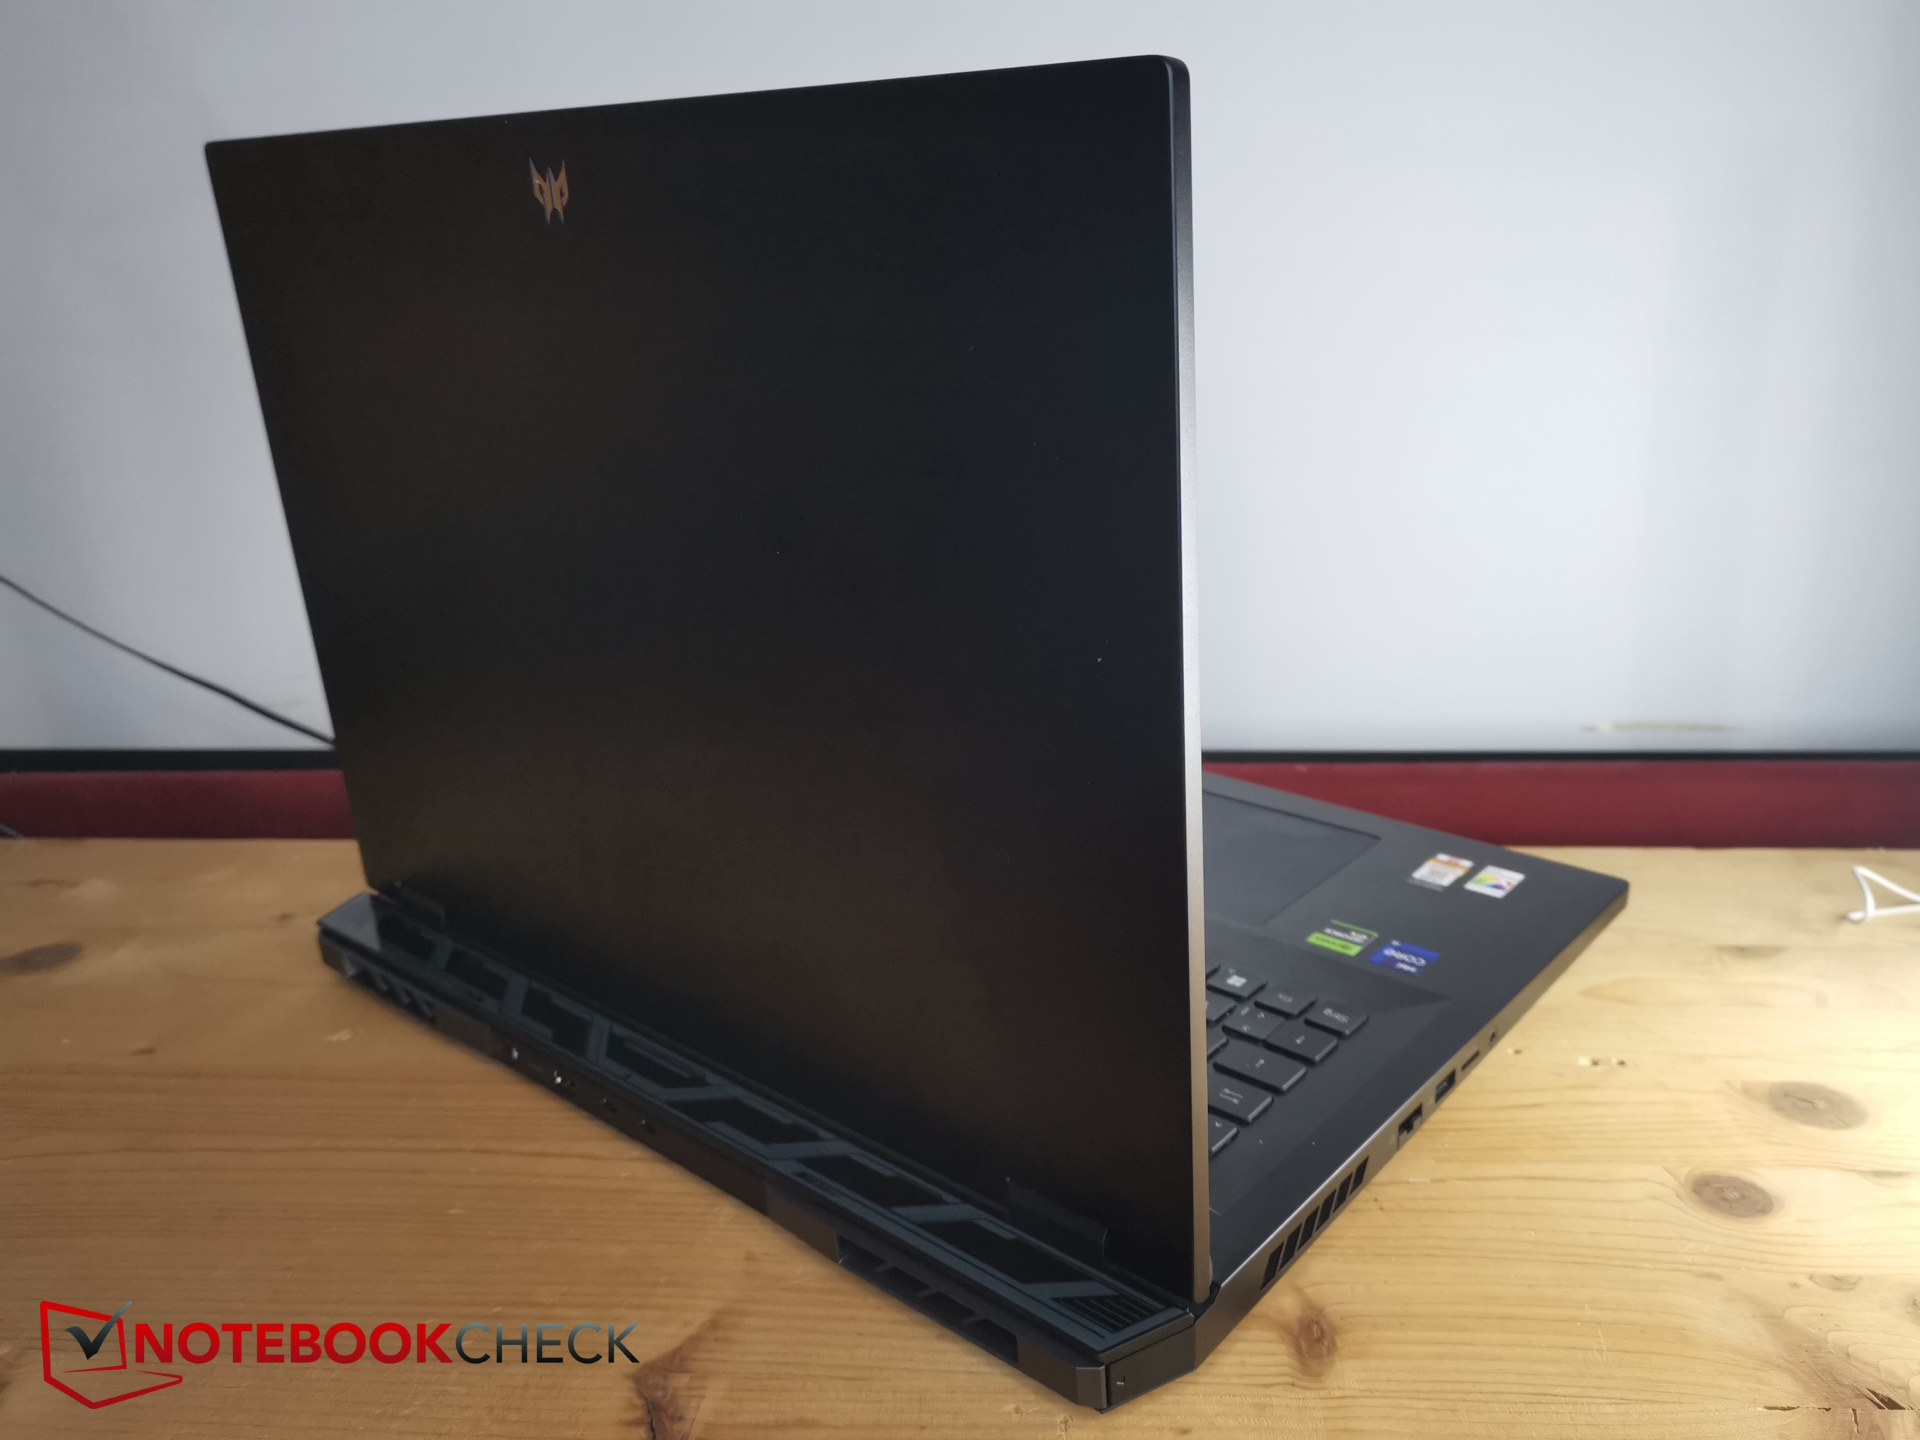
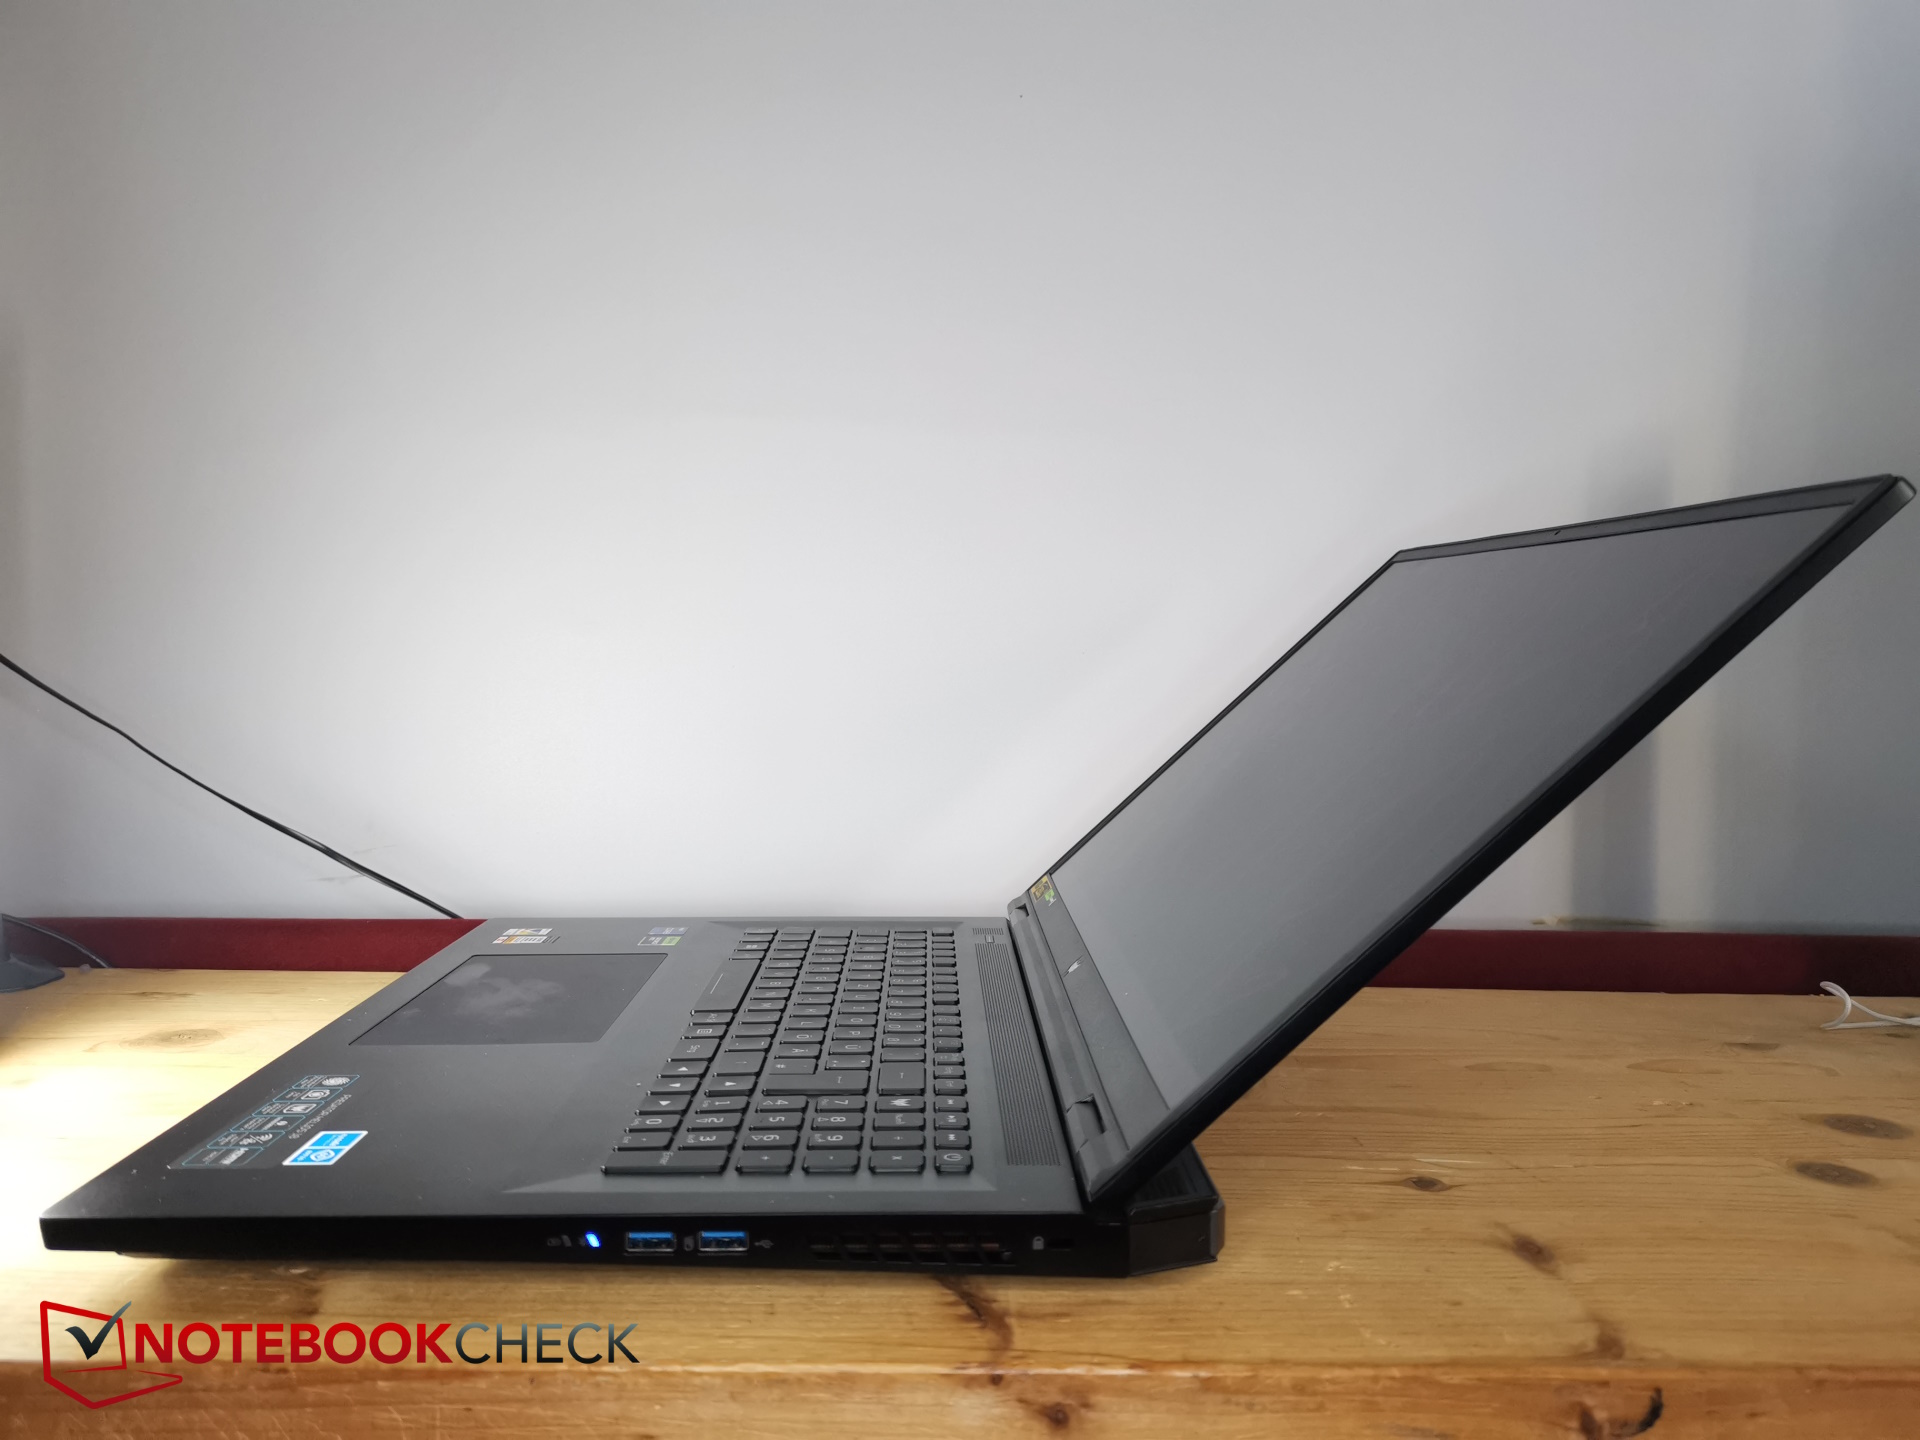
18 inçlik rakipleriyle karşılaştırıldığında, Helios 18 boyut açısından ortada kalıyor. Alienware m18 biraz daha büyük, Asus ROG Strix G18 ise daha küçük. İkincisi biraz daha kalınken, Alienware m18 daha ince. Ağırlık açısından, Alien açıkça daha ağır, G18 biraz daha hafif.
17 inçlik oyuncular kısmen çok daha küçük ve aynı zamanda daha ince.
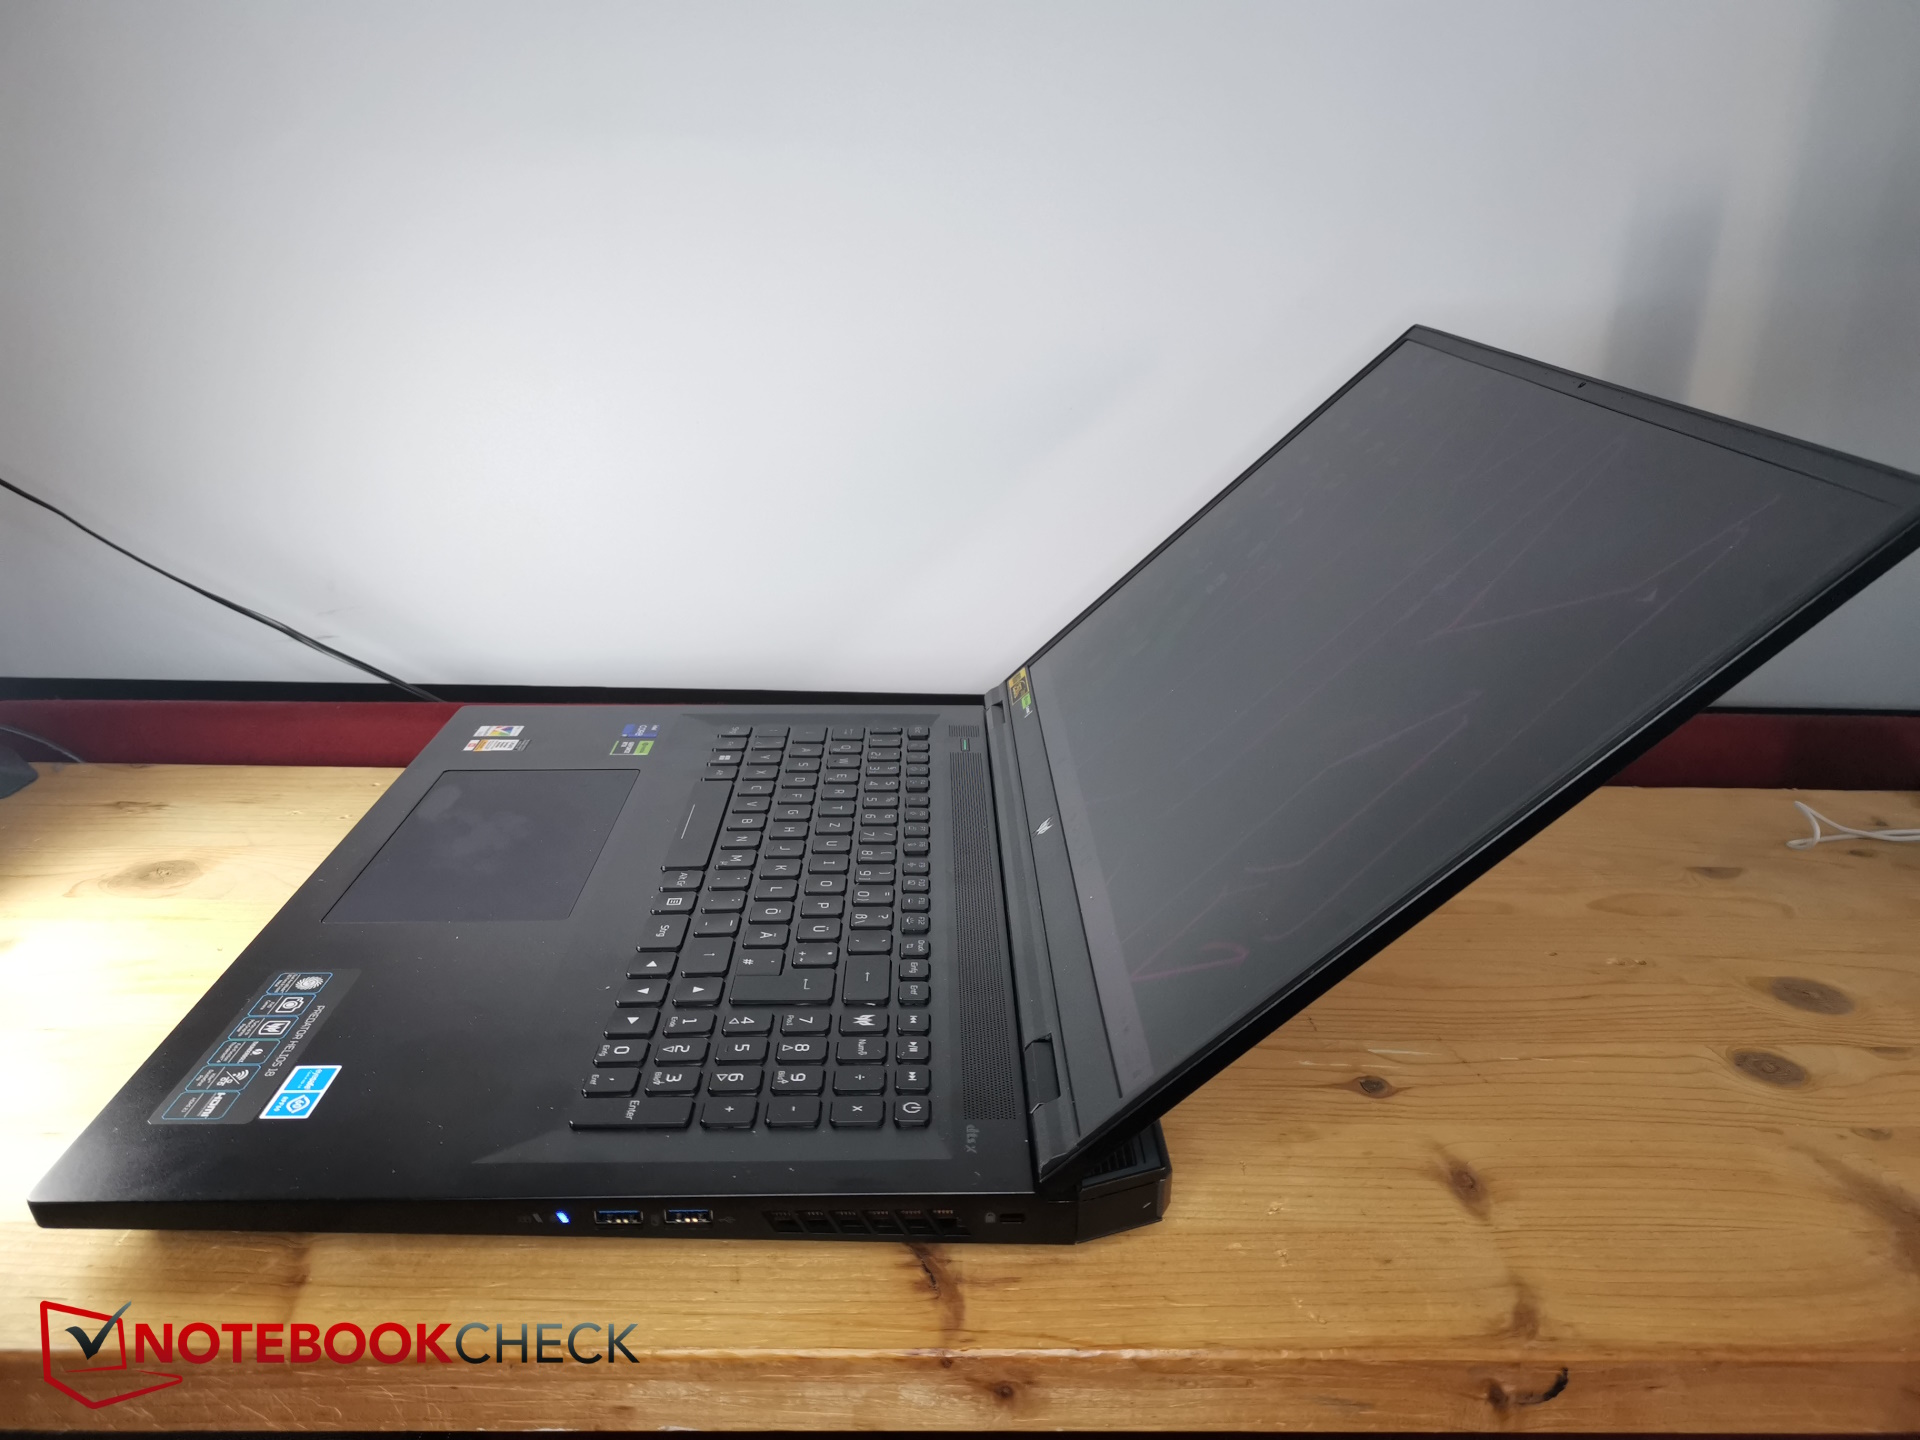
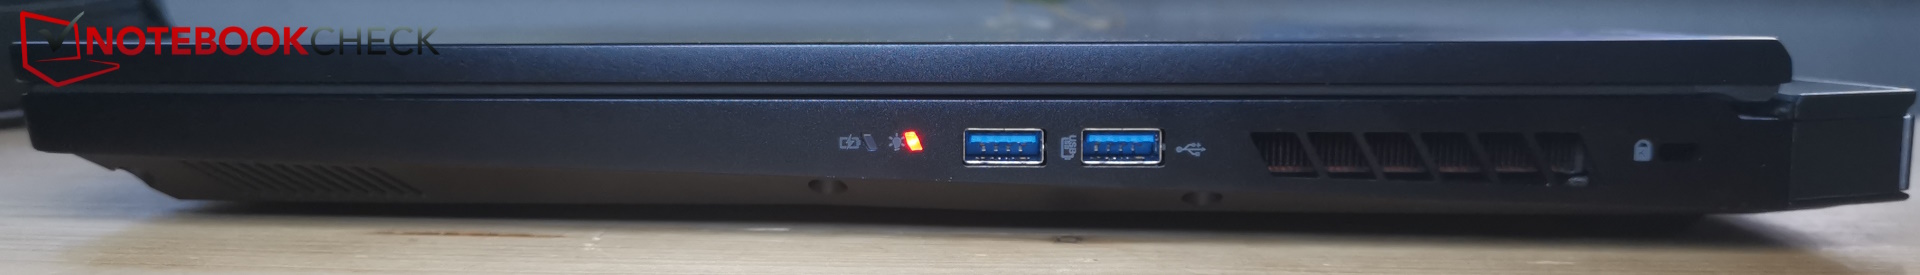
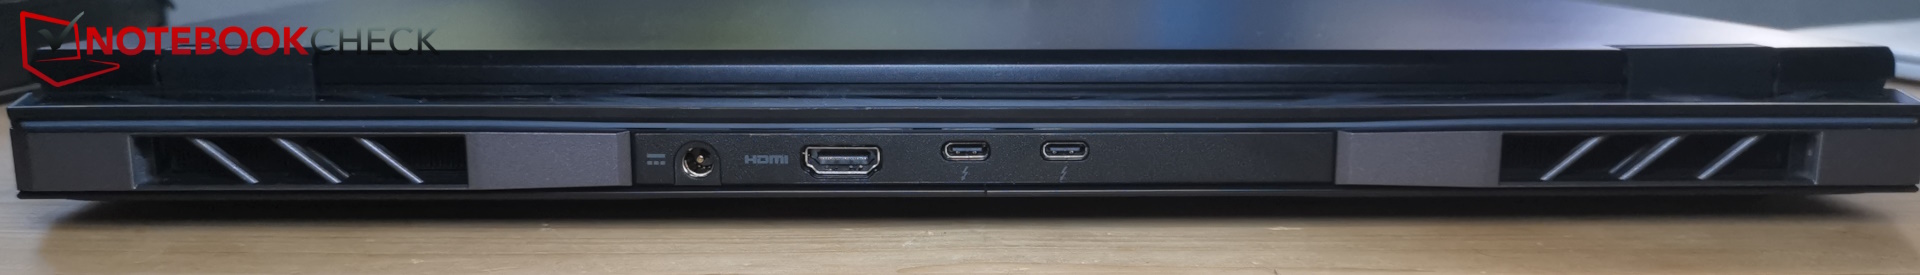
Ekipman - Predator Helios'ta 2x Thunderbolt 4
Helios 18 gerekli tüm bağlantı noktalarına sahiptir. USB-C şeklinde iki Thunderbolt 4 bağlantı noktası yer alıyor. Yalnızca PowerDelivery mevcut değildir. SD kart okuyucu "sadece" MicroSD kartları kabul ediyor.
Bağlantı noktaları üç tarafa yayılmış, ancak arka tarafta hala yer var ve soldaki birçok bağlantı noktasından birini kolayca barındırabilirdi. LAN bağlantı noktasının arkada ve giderek önem kazanan USB-C bağlantı noktalarından birinin de yan tarafta olmasını tercih ederdik.
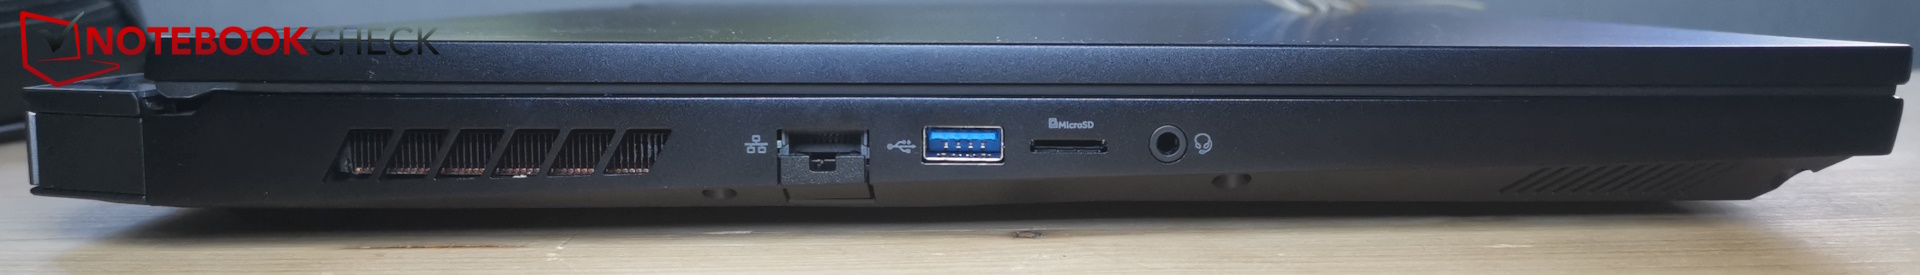
SD kart okuyucu
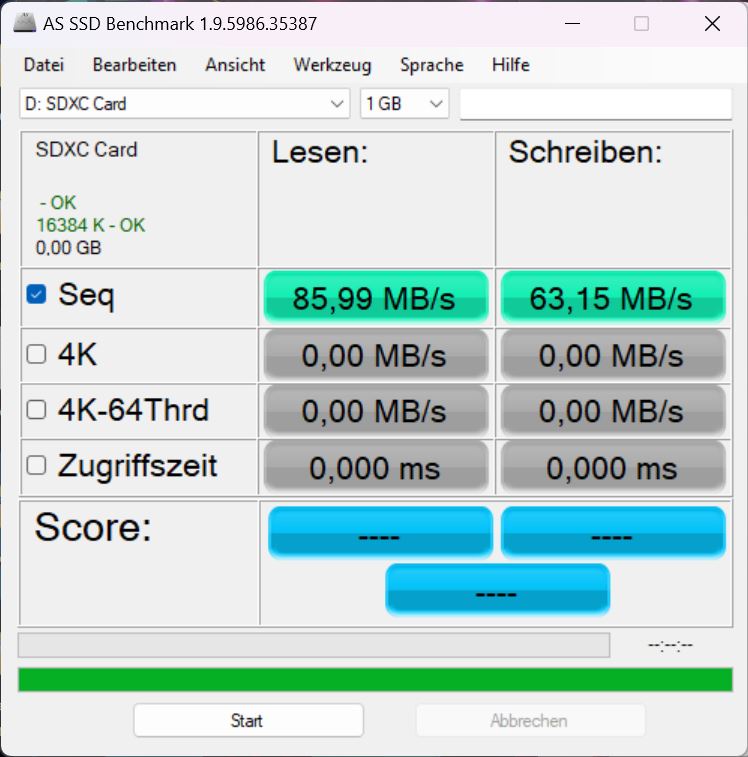
Takılan microSD kartlar yerine kayıyor ve çıkıntı yapmıyor. AV PRO microSD 128 GB V60'ımızı takarken biraz zorlandık çünkü kilitlemek ve çıkarmak için aynı hizadan biraz daha içeri doğru itmek gerekiyordu.
Hız dikkat çekici değil, orta seviyede; kart okuyucular Bıçak 18 ya da Alienware m18önemli ölçüde daha hızlıdır.
| SD Card Reader | |
| average JPG Copy Test (av. of 3 runs) | |
| Razer Blade 18 RTX 4070 (Angelibird AV Pro V60) | |
| Alienware m18 R1 (Angelibird AV Pro V60) | |
| Sınıf ortalaması Gaming (20.9 - 210, n=54, son 2 yıl) | |
| HP Omen 17-ck2097ng (AV PRO microSD 128 GB V60) | |
| Acer Predator Helios 18 N23Q2 | |
| MSI GE78HX 13VH-070US (Angelibird AV Pro V60) | |
| maximum AS SSD Seq Read Test (1GB) | |
| Alienware m18 R1 (Angelibird AV Pro V60) | |
| Razer Blade 18 RTX 4070 (Angelibird AV Pro V60) | |
| Sınıf ortalaması Gaming (25.5 - 261, n=51, son 2 yıl) | |
| MSI GE78HX 13VH-070US (Angelibird AV Pro V60) | |
| Acer Predator Helios 18 N23Q2 | |
| HP Omen 17-ck2097ng (AV PRO microSD 128 GB V60) | |
İletişim
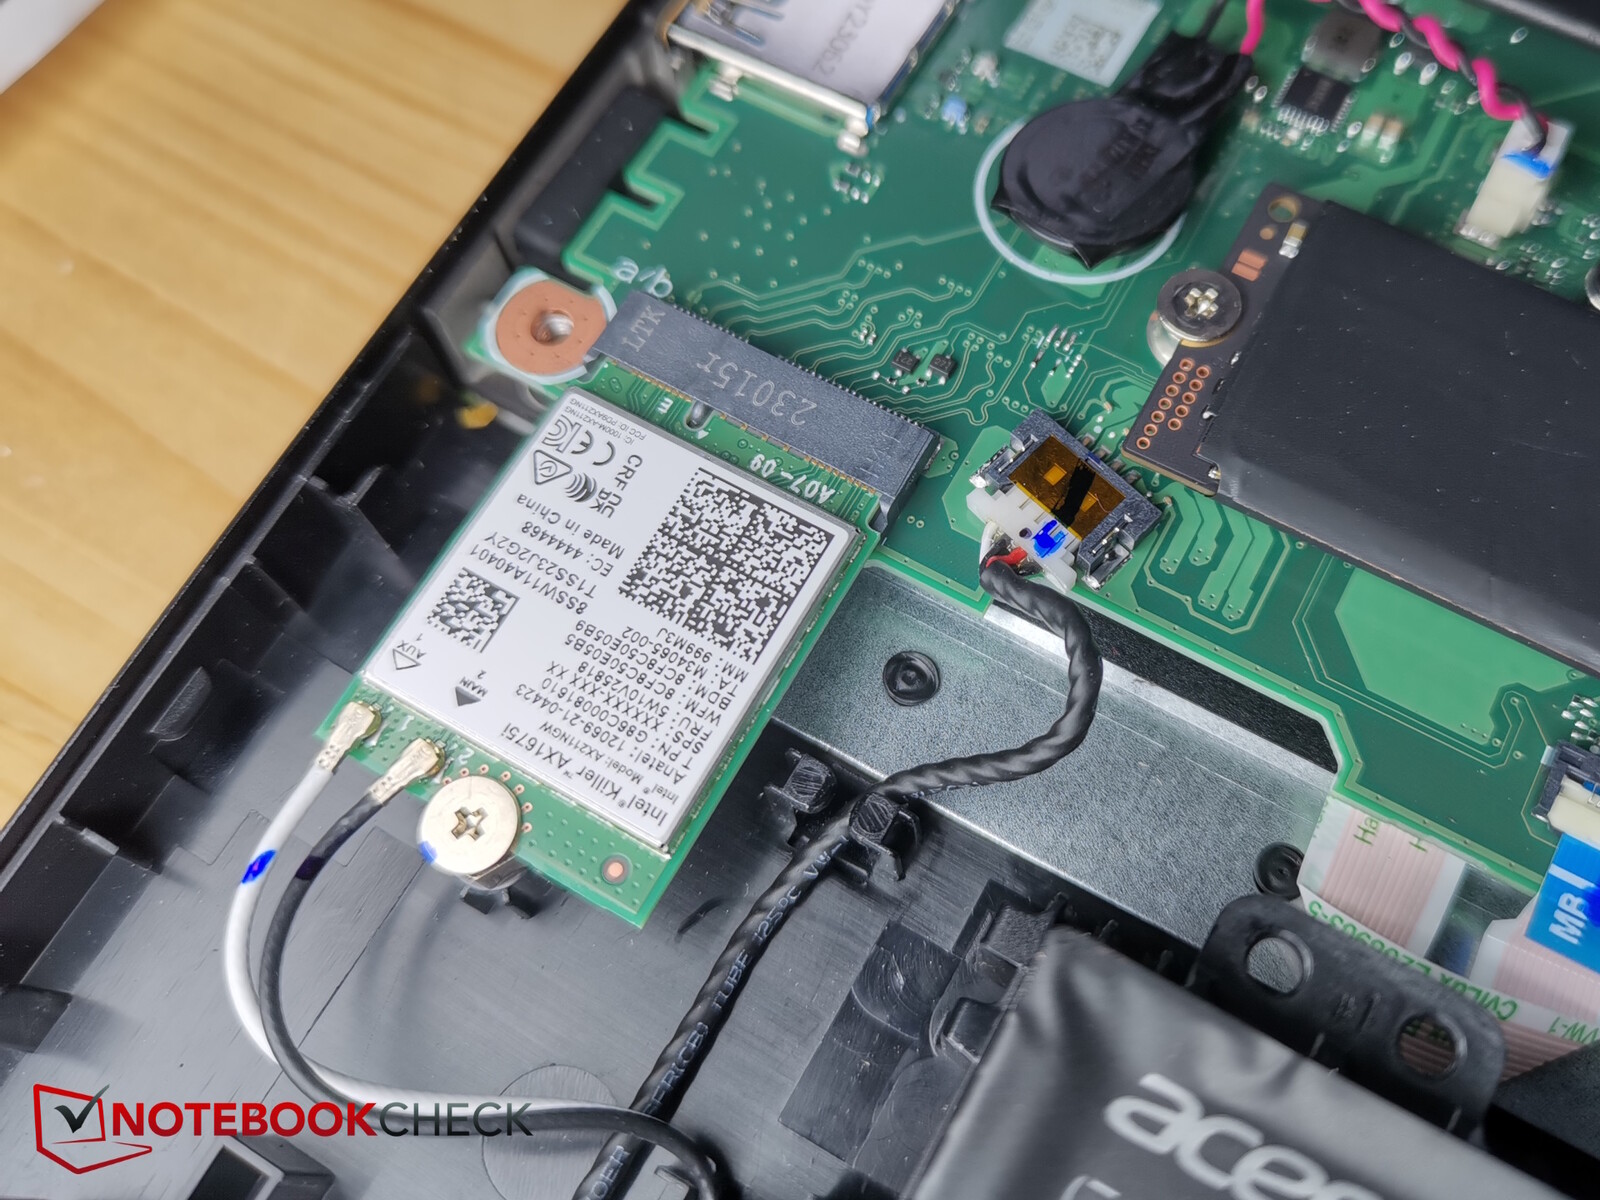
Acer, 6 GHz modunda 6E'yi destekleyen ve yaklaşık 1,5 Mbps'lik iyi aktarım hızları sağlayan Killer WiFi 6E AX1675i WiFi modülünü kullanıyor. 5 GHz ağda ise oldukça yavaş, yaklaşık 900 Mbit/s'ye ulaşıyor.
Aktarım hızlarının çok istikrarlı olduğu kanıtlanmıştır.
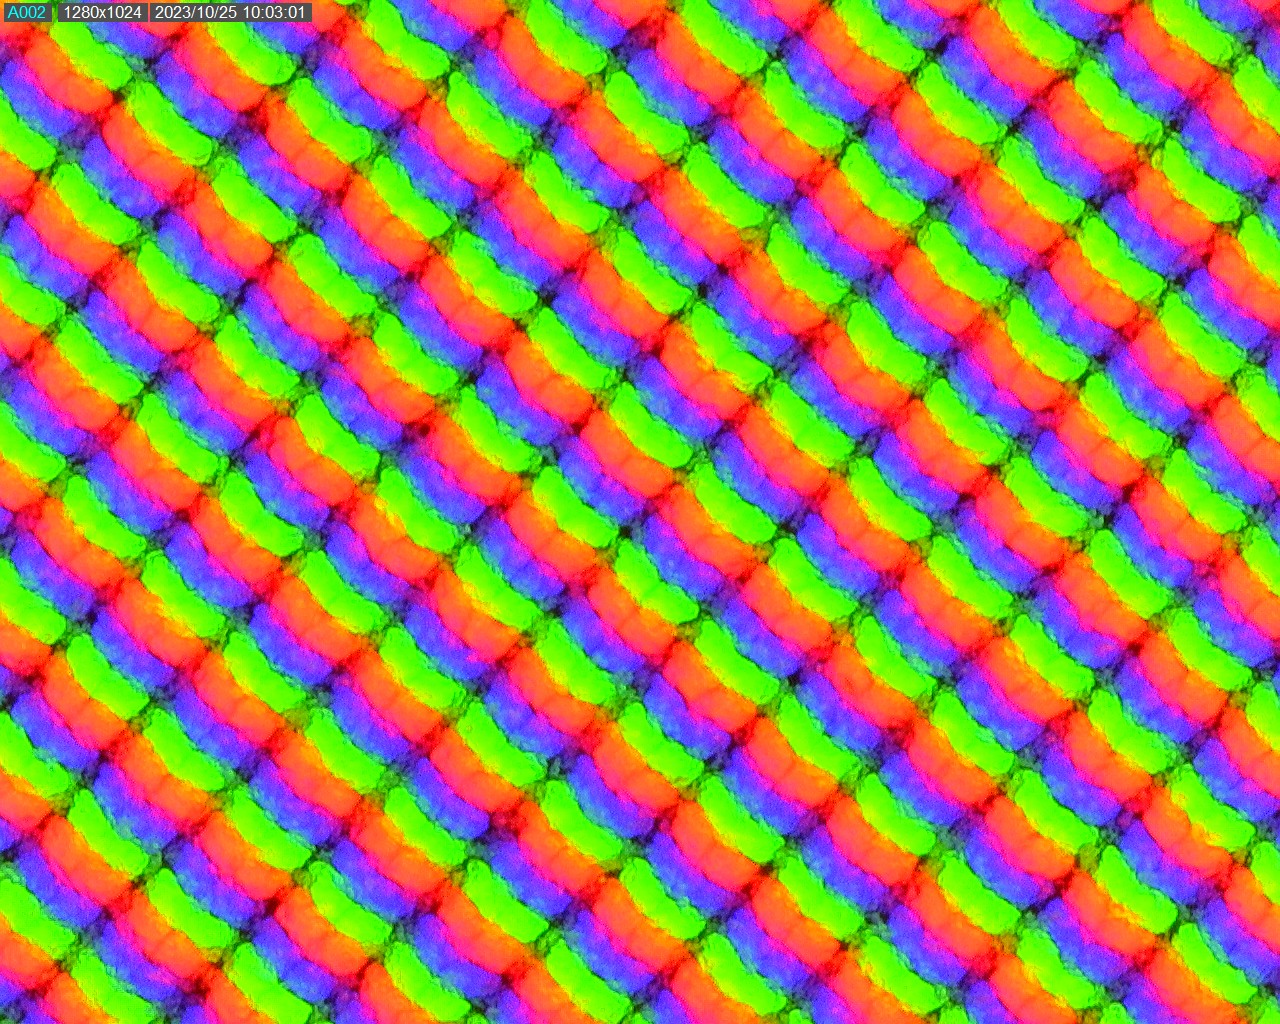
Web kamerası
Kamera FullHD kalitesinde fotoğraf ve video çeker. Kalite kabul edilebilir: renk sapmaları sınırlar içinde kalır. Mavi tonlar en yüksek sapmaları gösterir.


Güvenlik
Çelik kilit için bir bağlantı olduğu gibi TPM de yerleşiktir. Ancak parmak izi sensörü bulunmamaktadır.
Aksesuarlar ve garanti
Dizüstü bilgisayar, güç kaynağı ve olağan evrakların yanı sıra, Helios 18'in arkası için bir çift alternatif fan kapağı da teslimat kapsamına dahildir.
Acer, Almanya'da 24 aylık standart garanti sağlamaktadır. Bu süre diğer ülkelerde farklılık gösterebilir, bu nedenle potansiyel alıcılar satın almadan önce iki kez kontrol etmelidir.
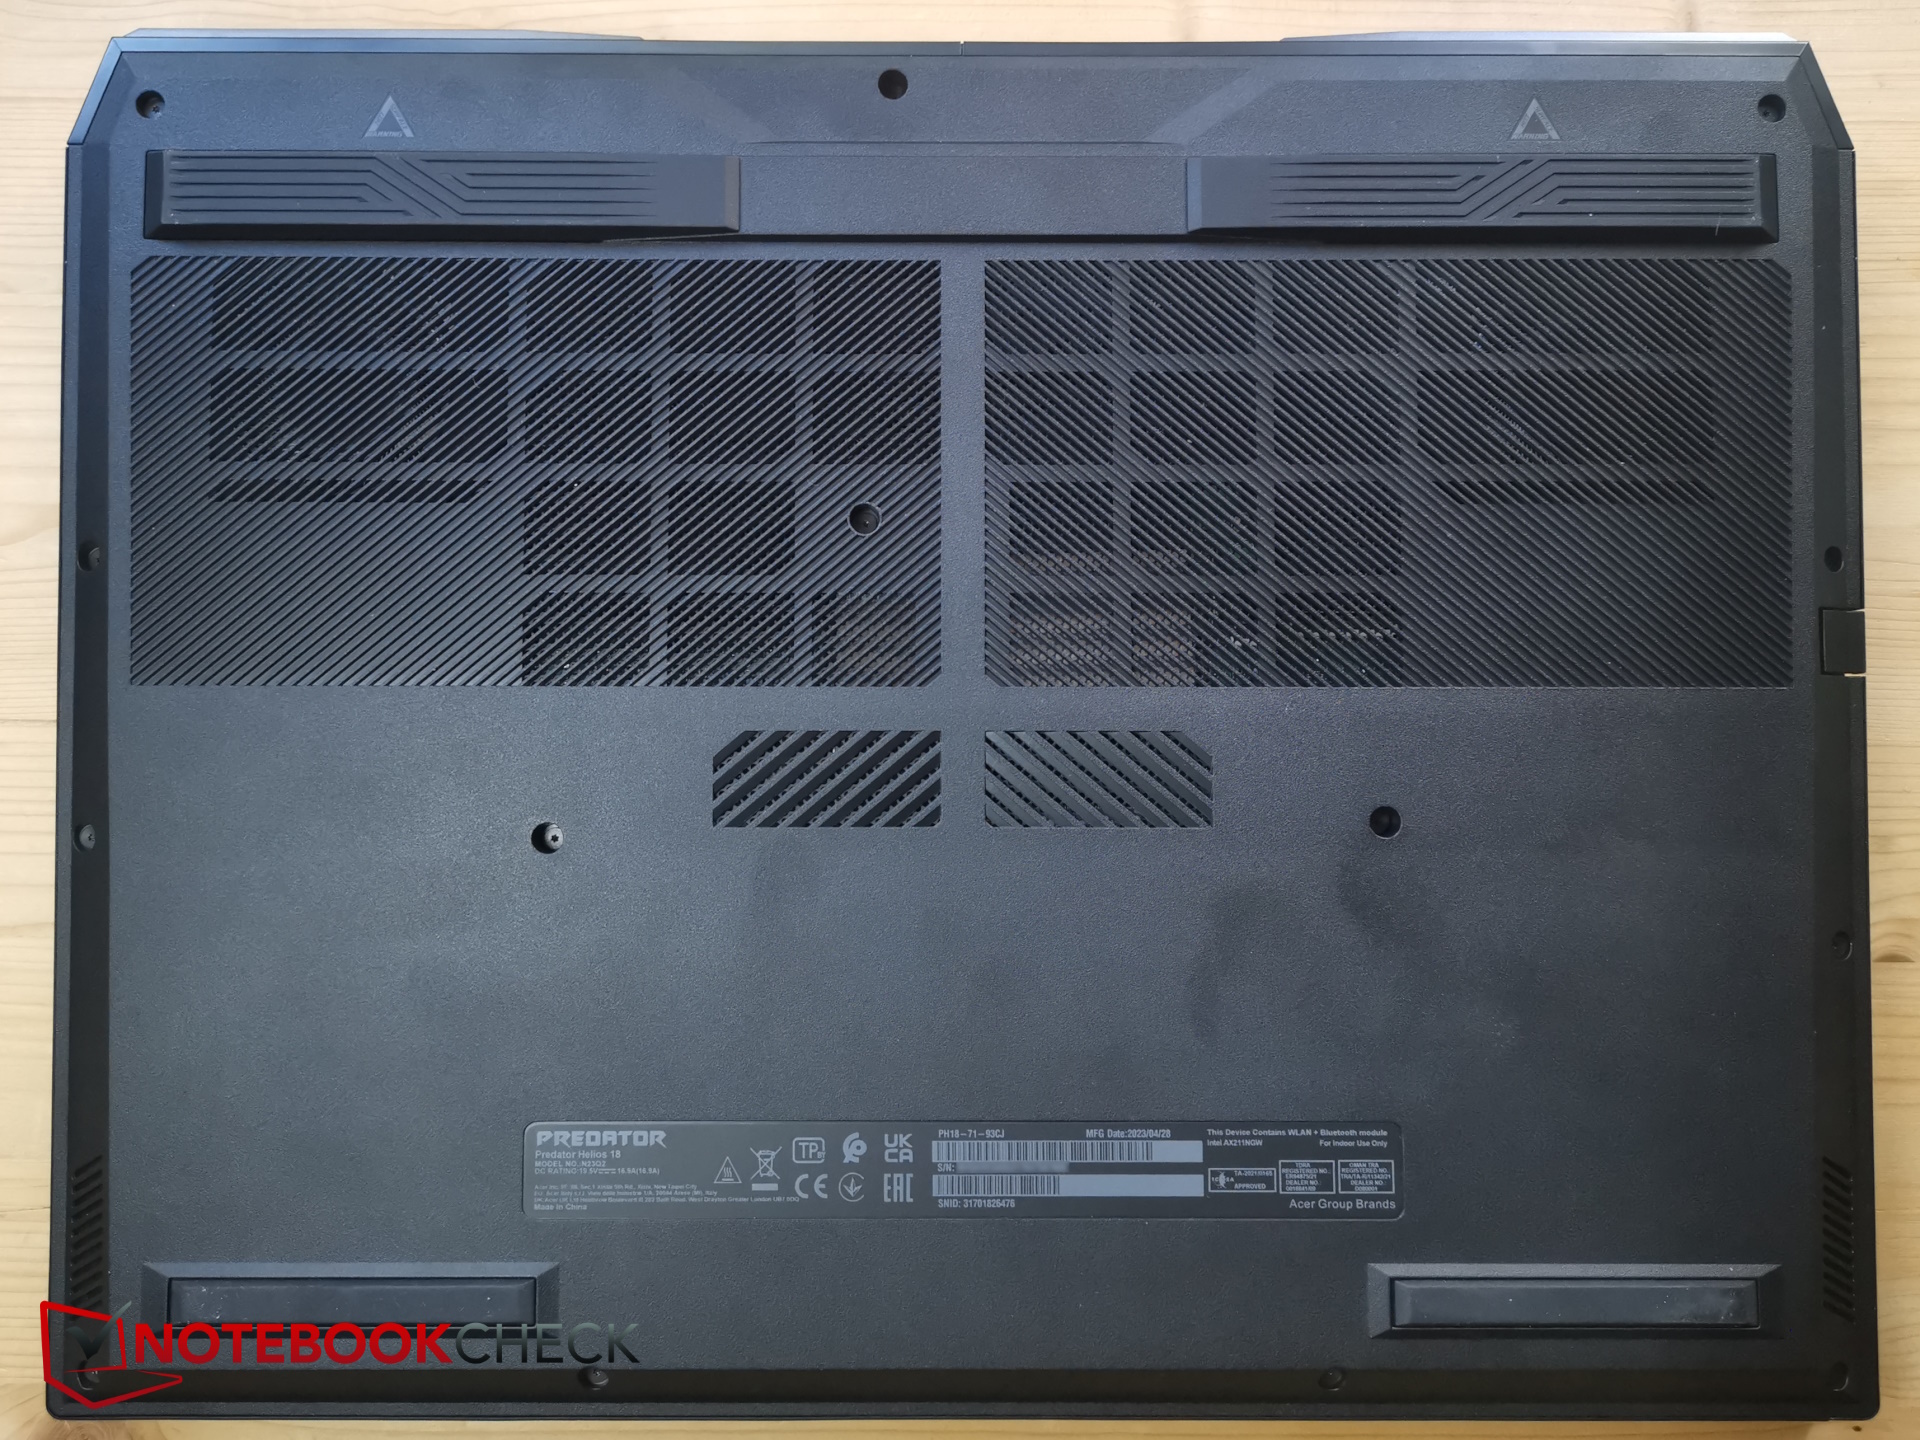
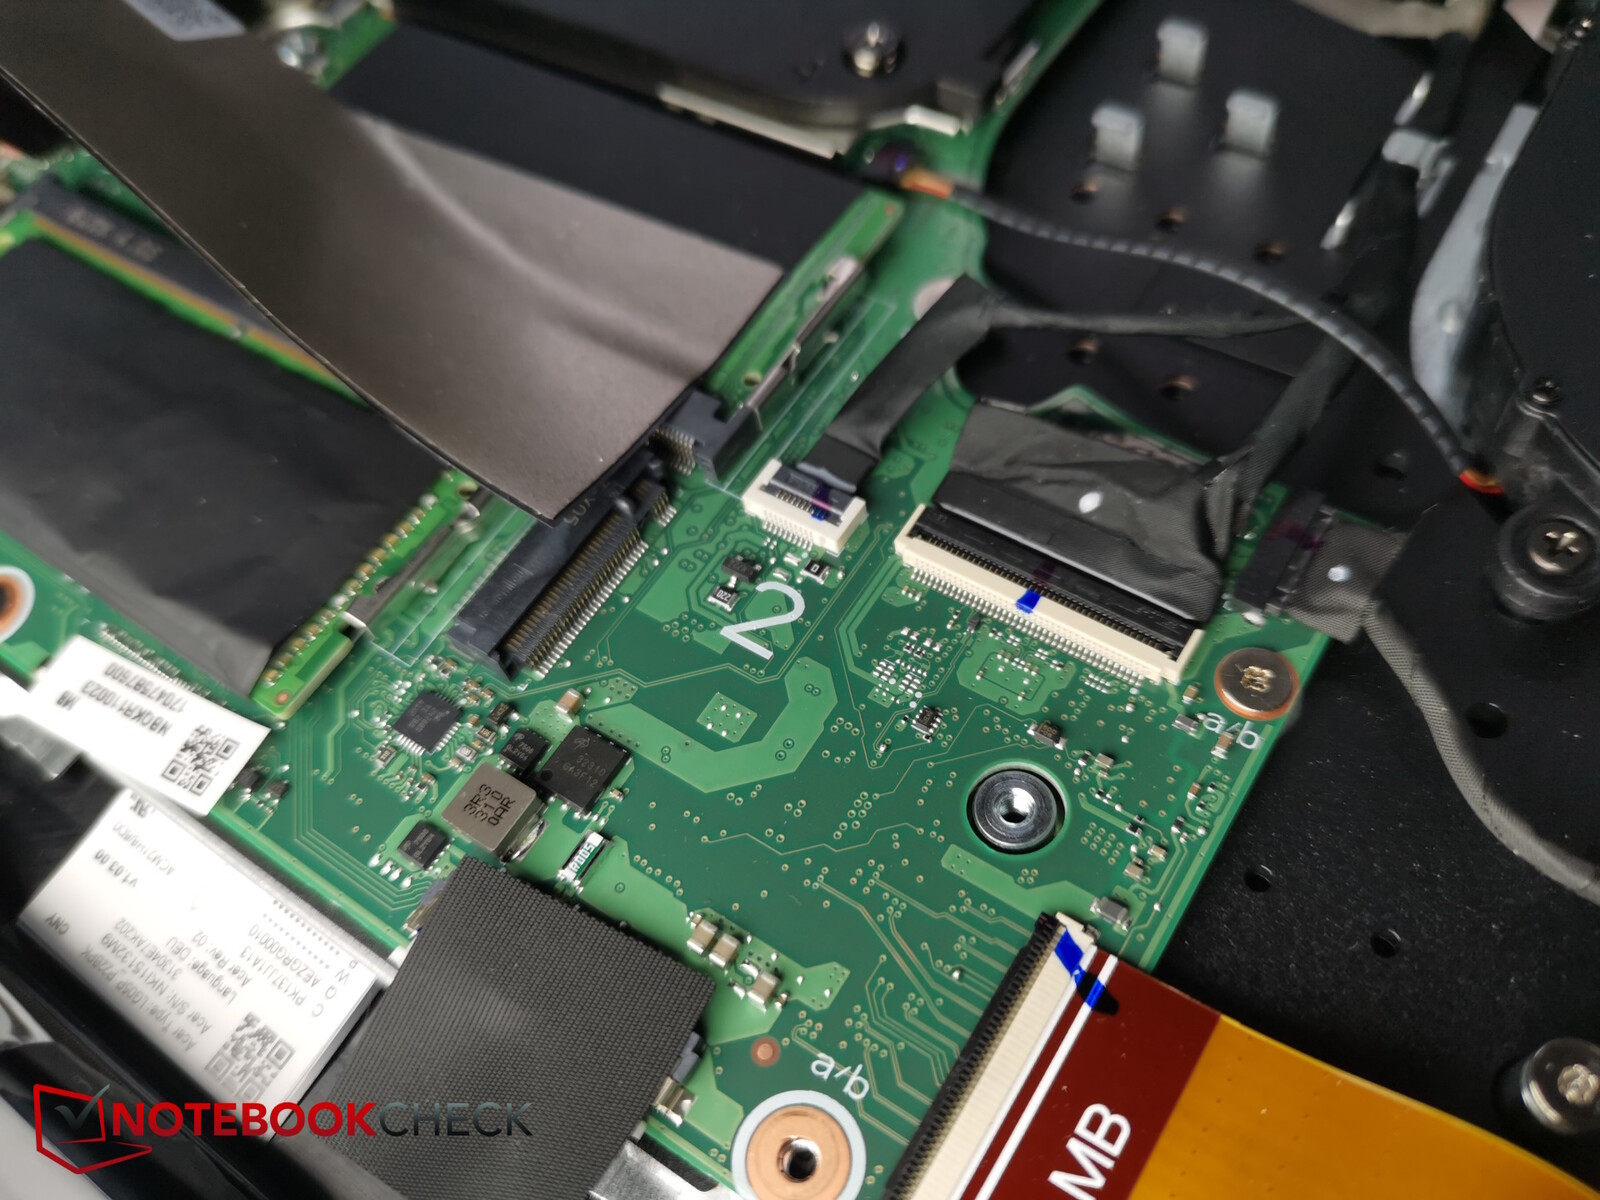
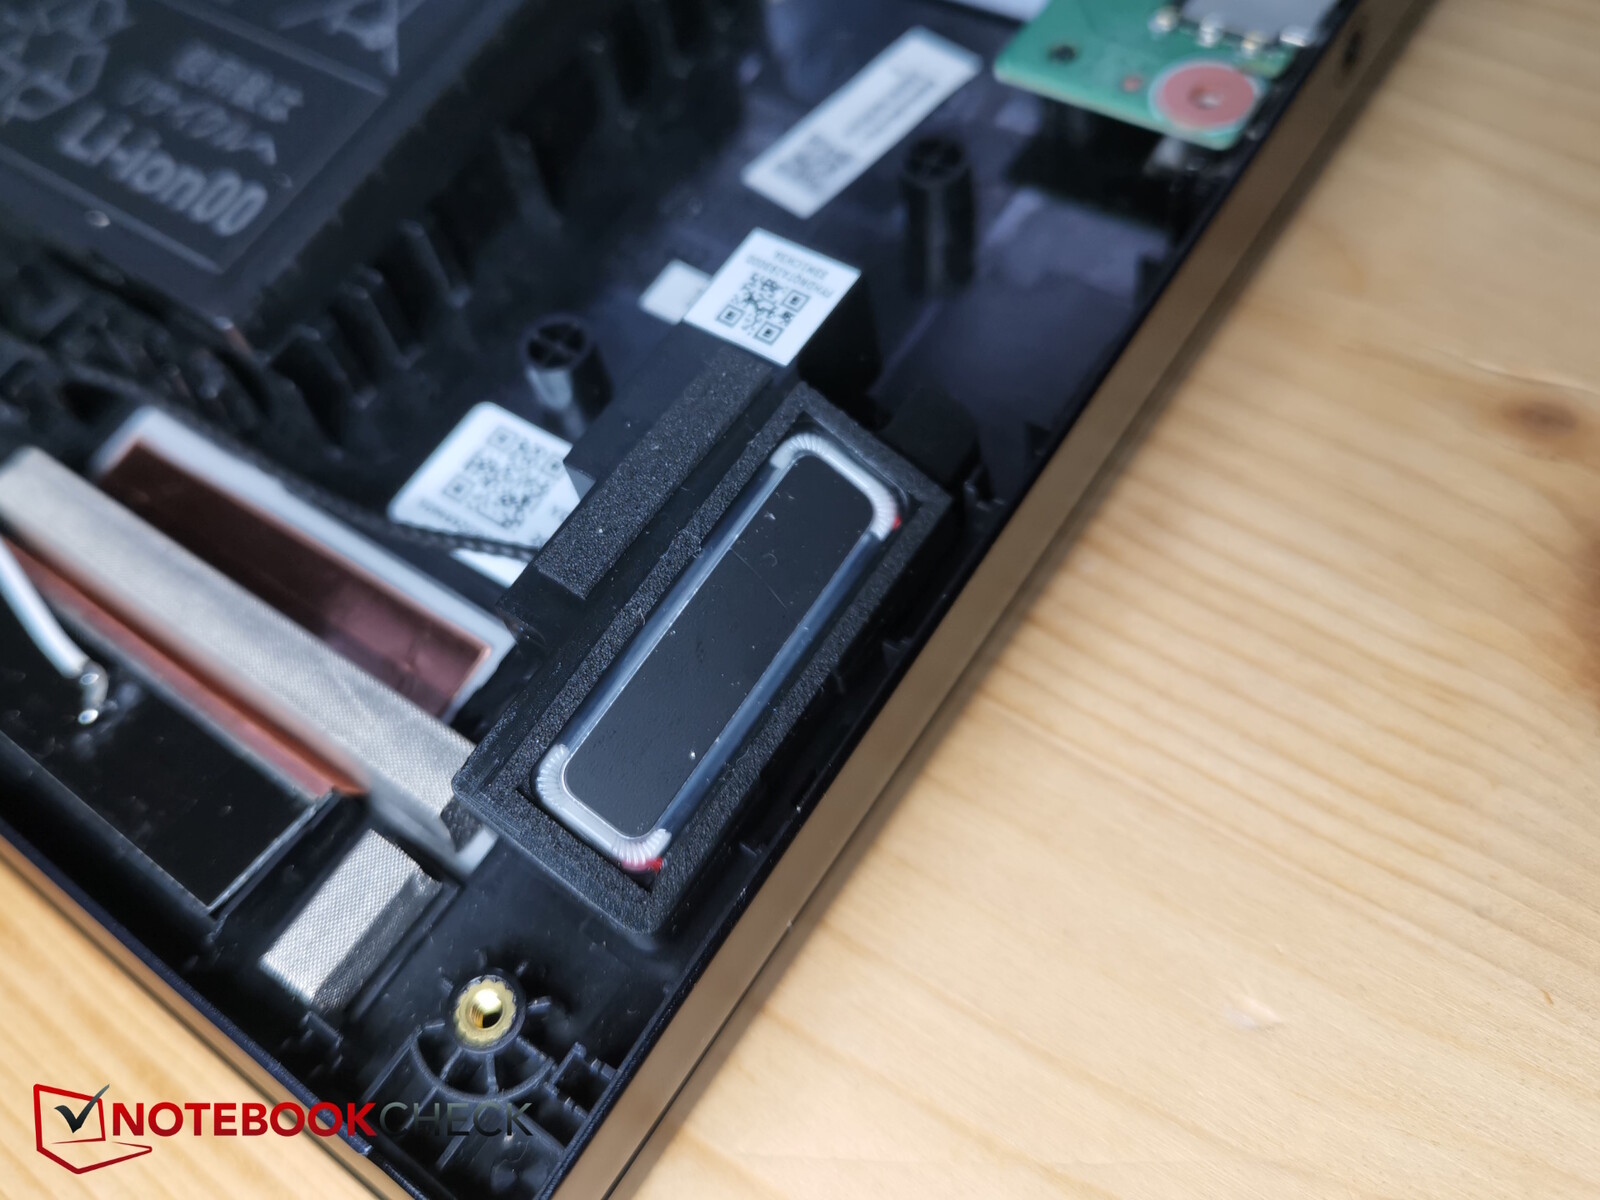
Bakım
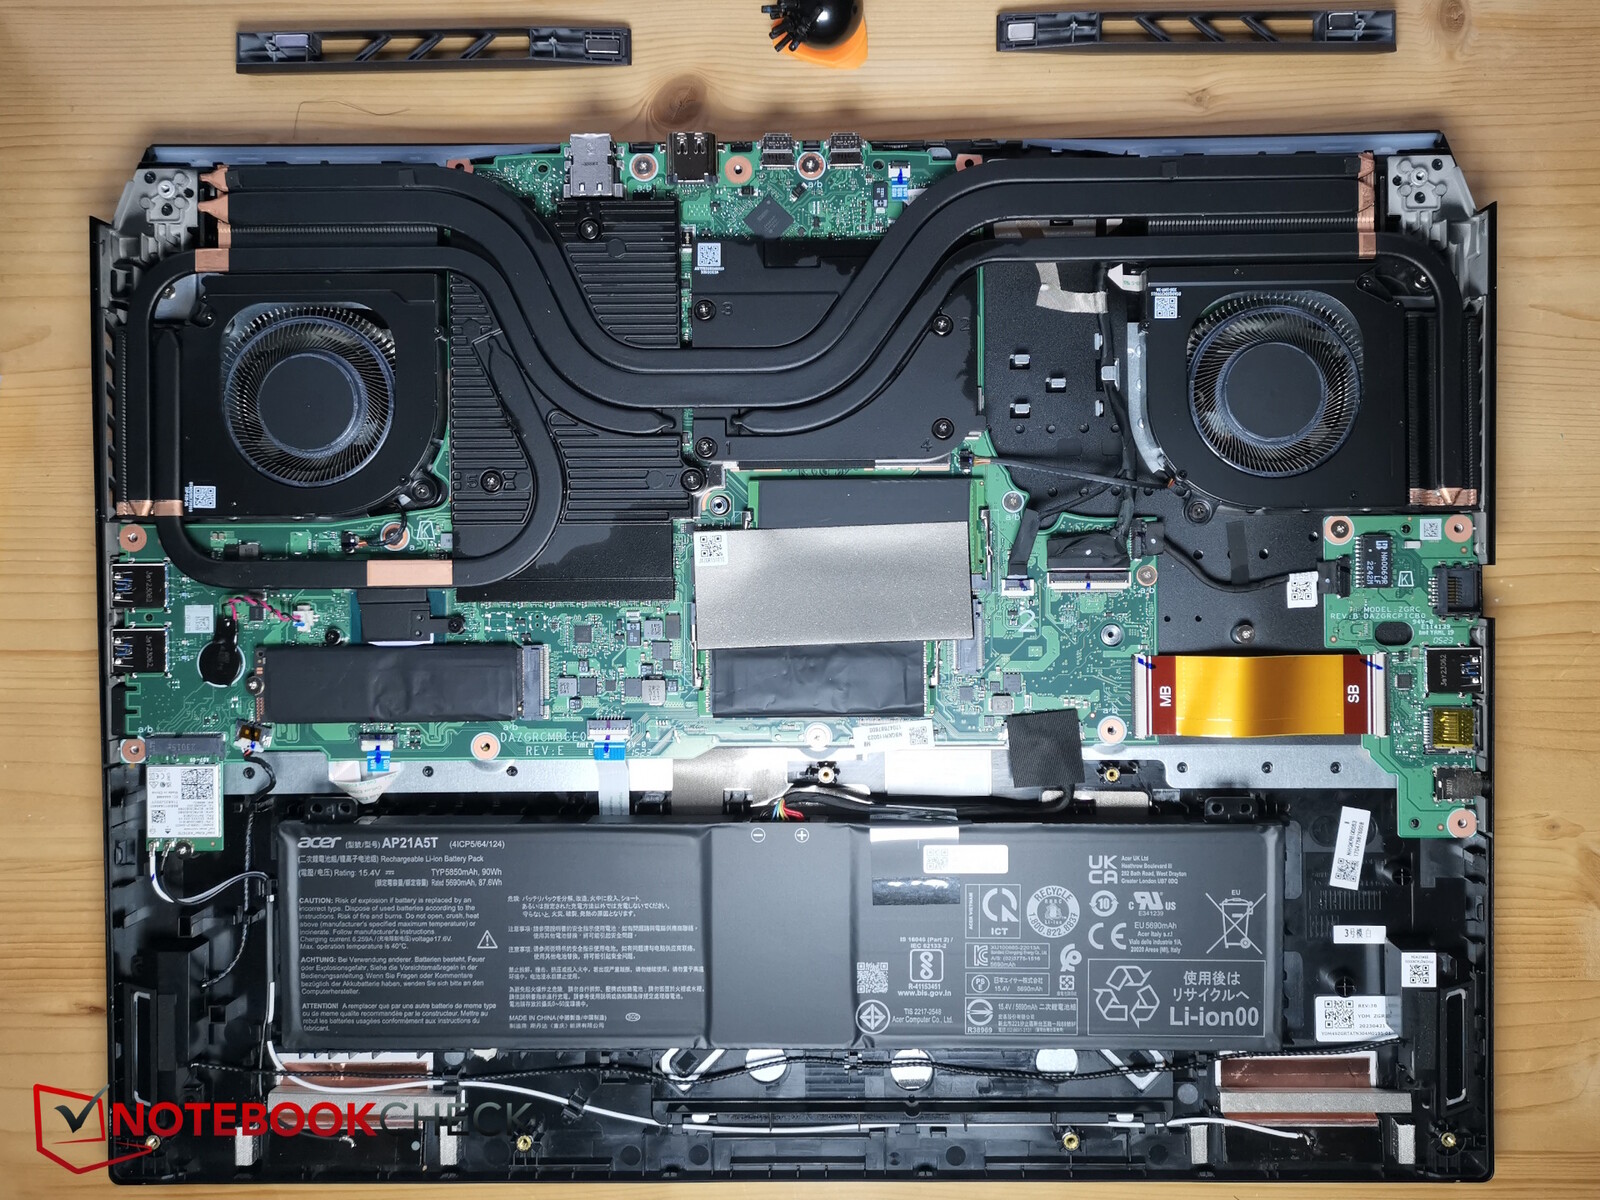
Sıkı kelepçeler ve sert alüminyum taban nedeniyle Helios 18'i açmak o kadar kolay değildir, ancak yine de idare edilebilir. İlk olarak, aynı boyuttaki 14 Torx vidanın gevşetilmesi gerekiyor. Daha sonra, tercihen dar kenarlı plastik bir aletle arka tarafı ön köşelerden kaldırarak açmak en iyisidir
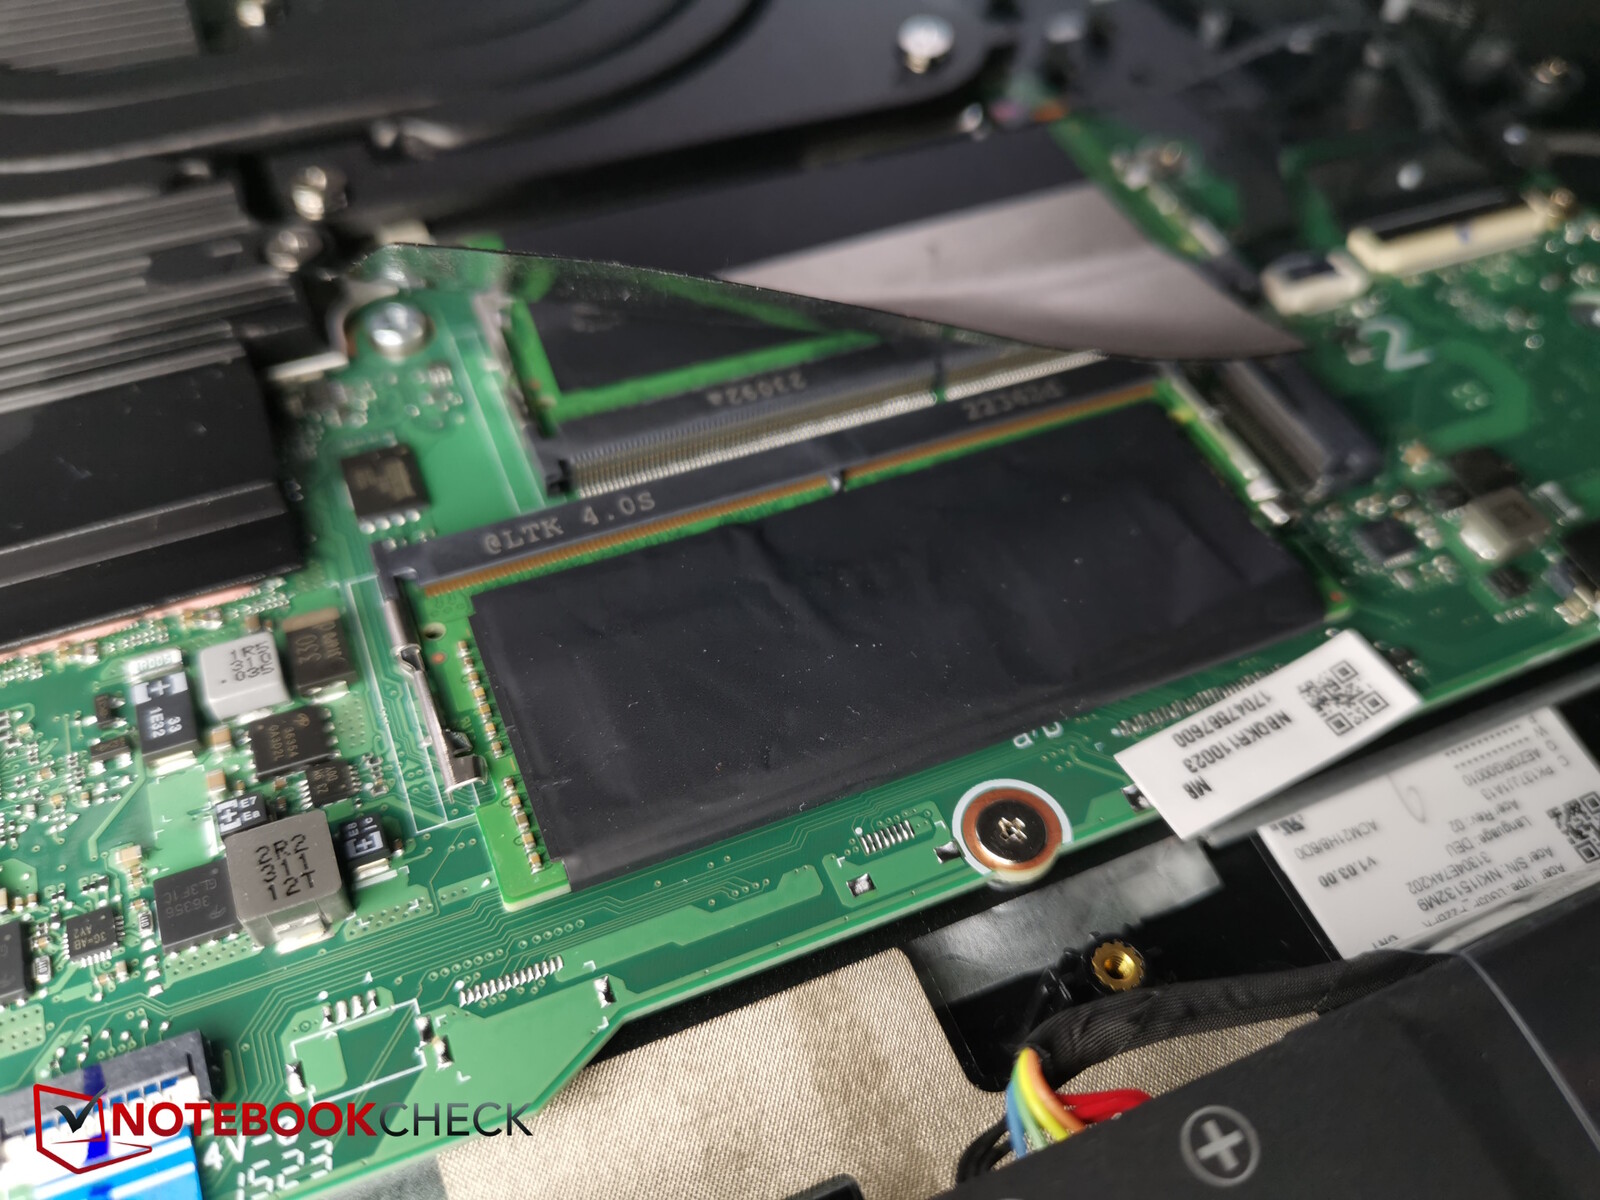
Acer Predator'ün içine girdikten sonra kullanıcılar fanlara, bataryaya, SSD'ye (artı ikinci yuva), RAM yuvalarına ve WiFi modülüne erişebilir.
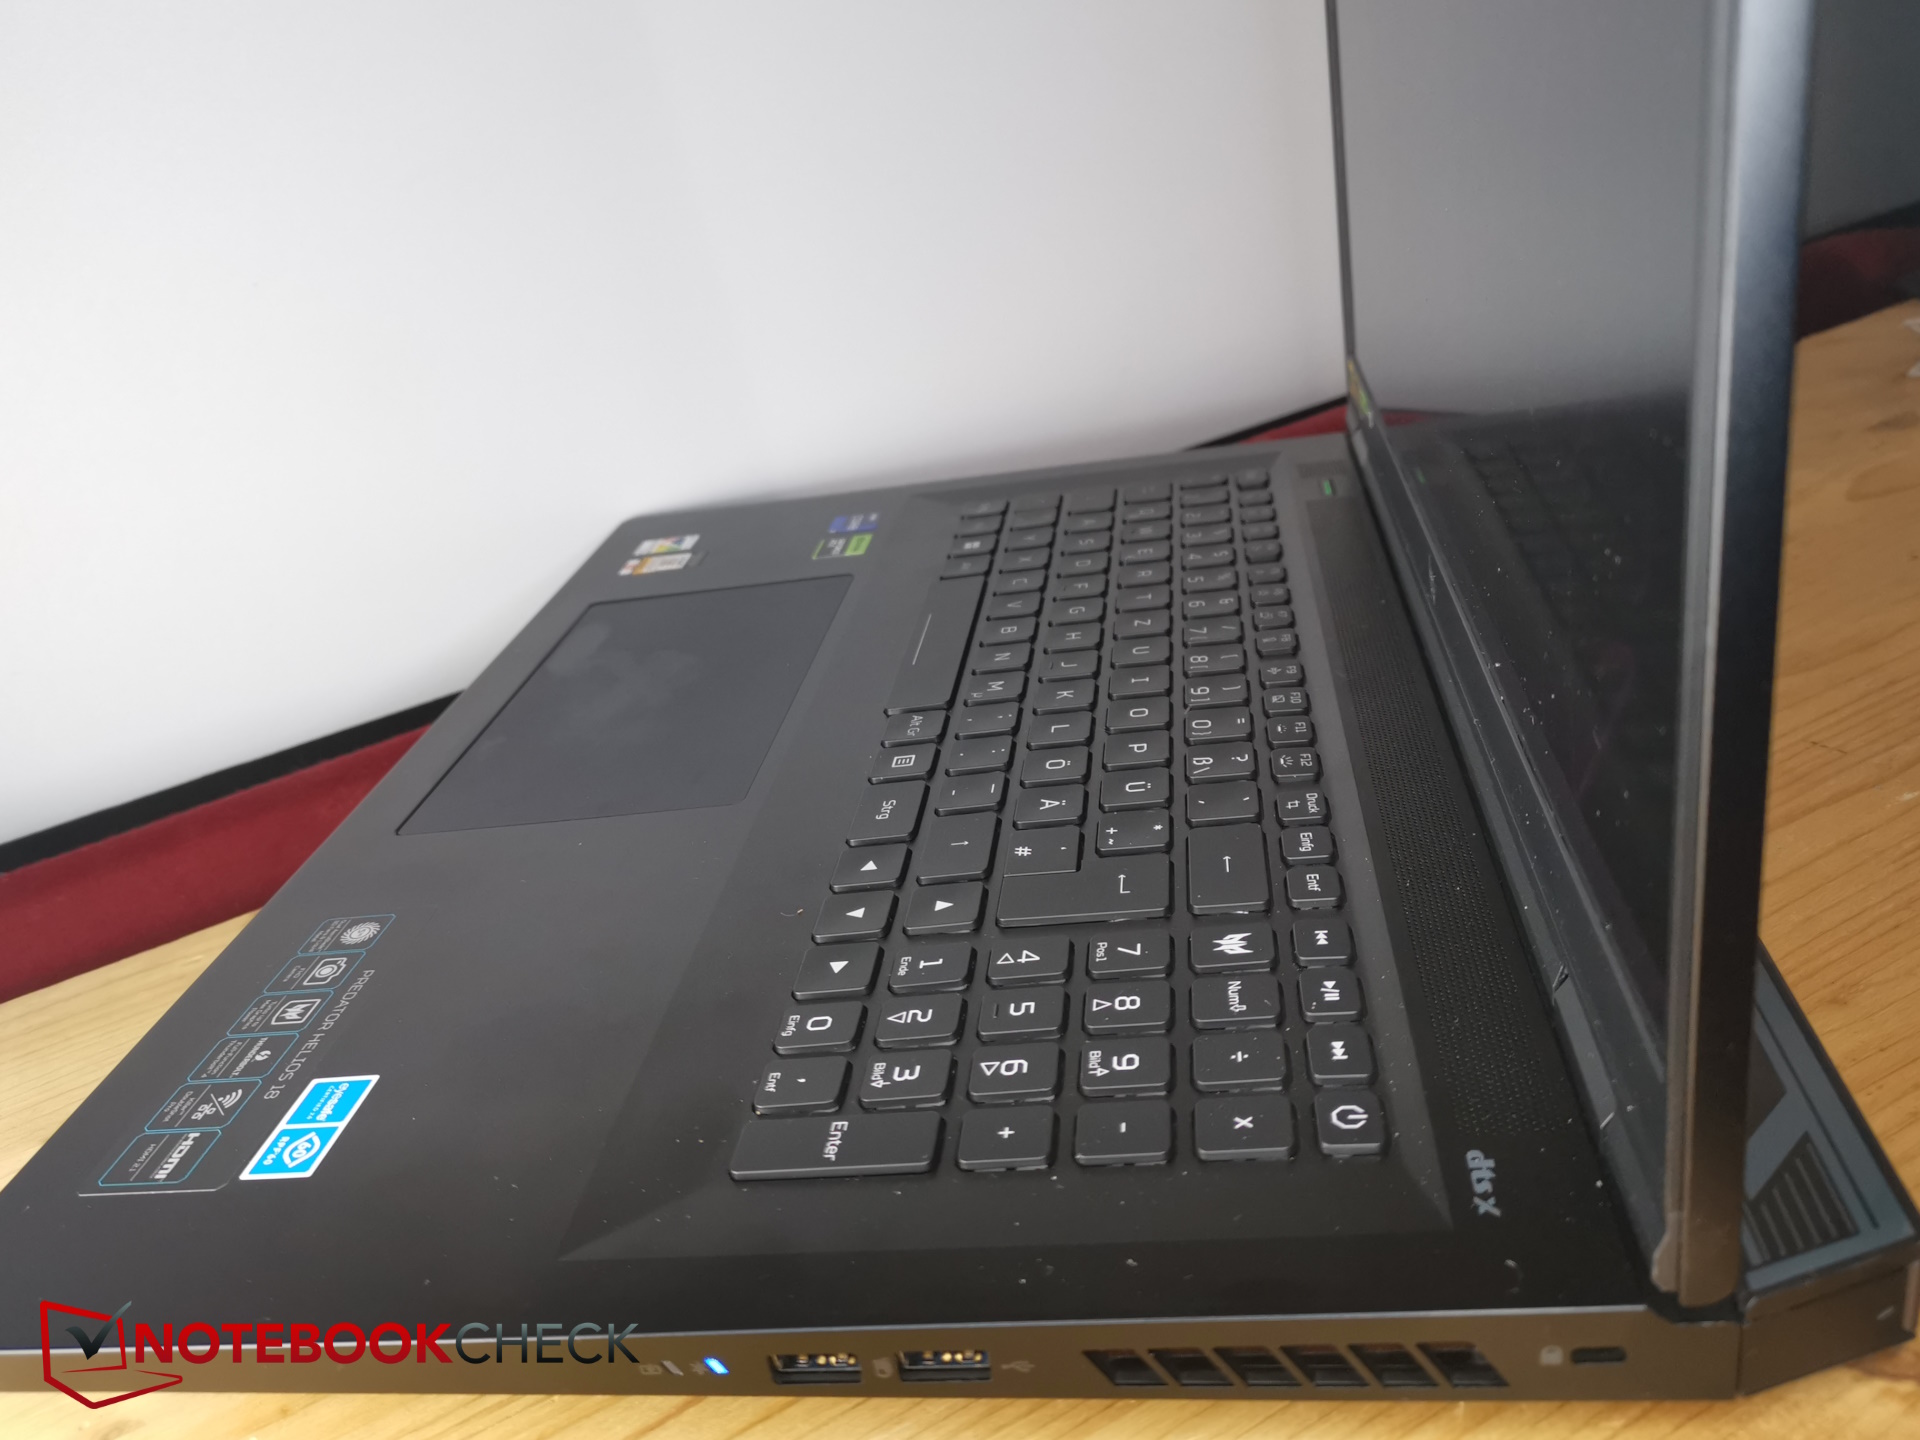
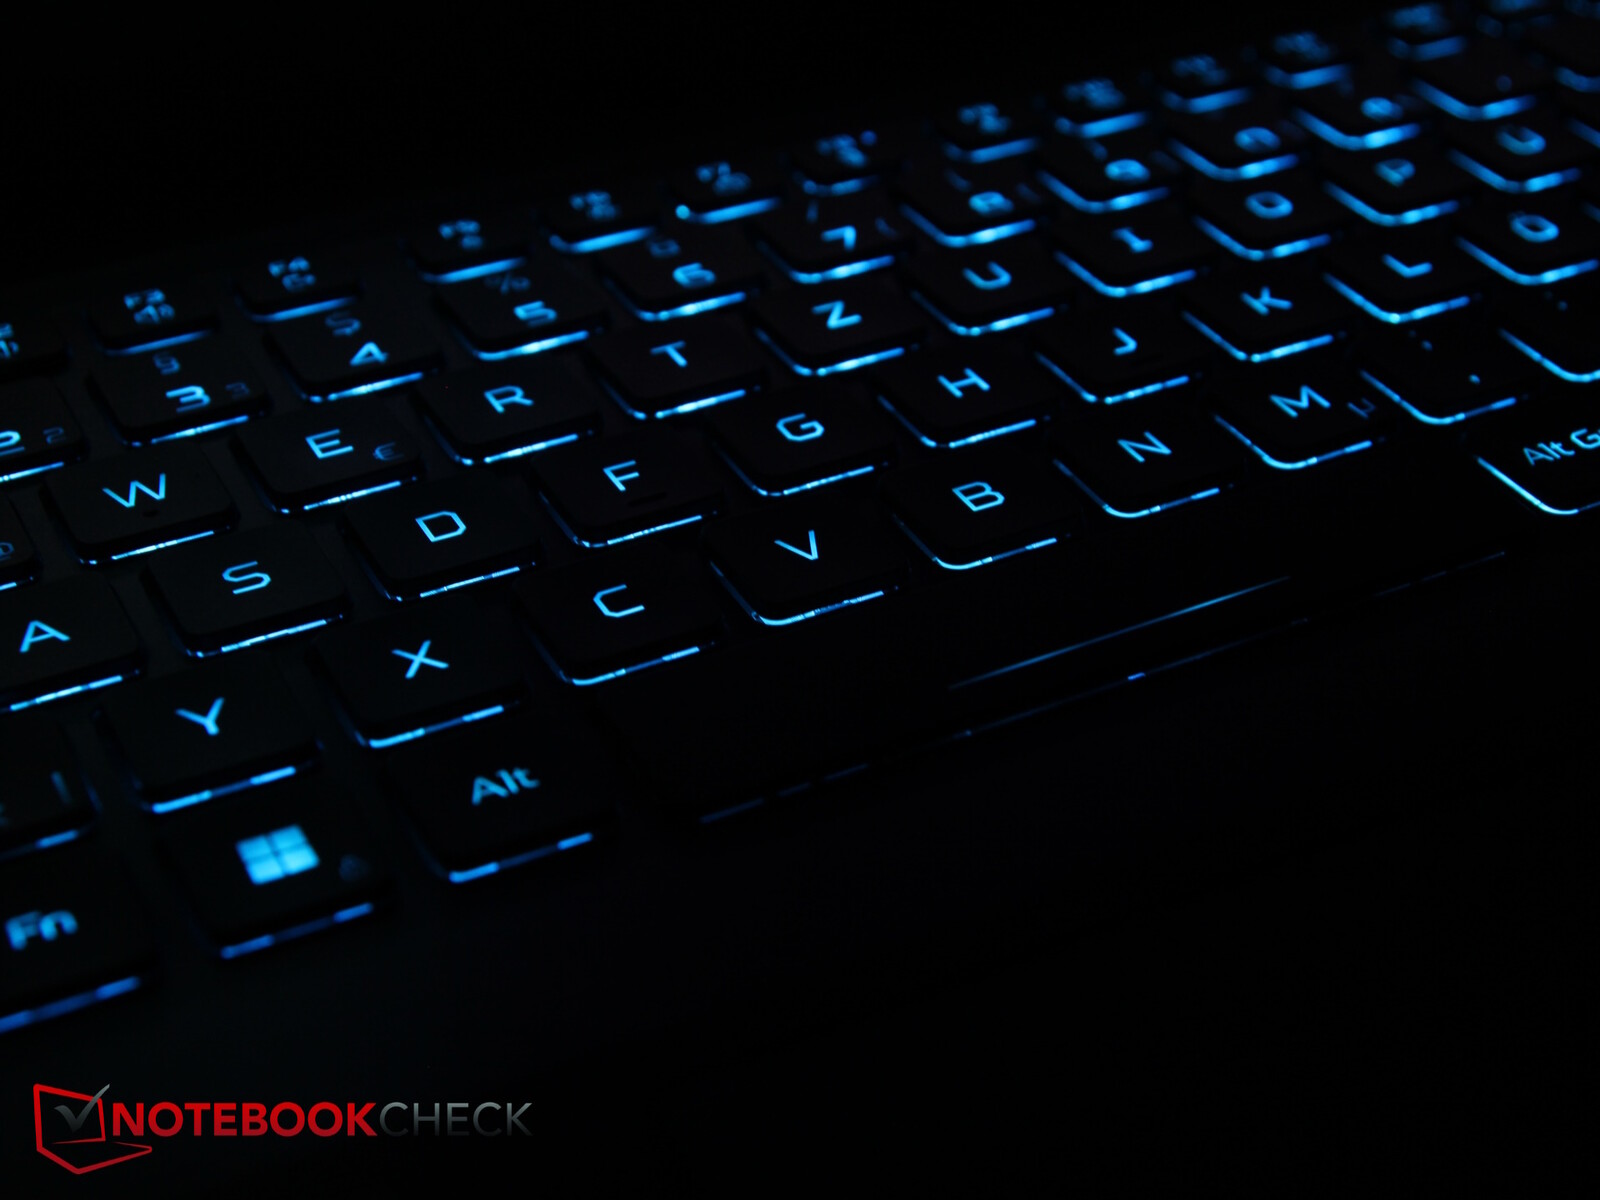
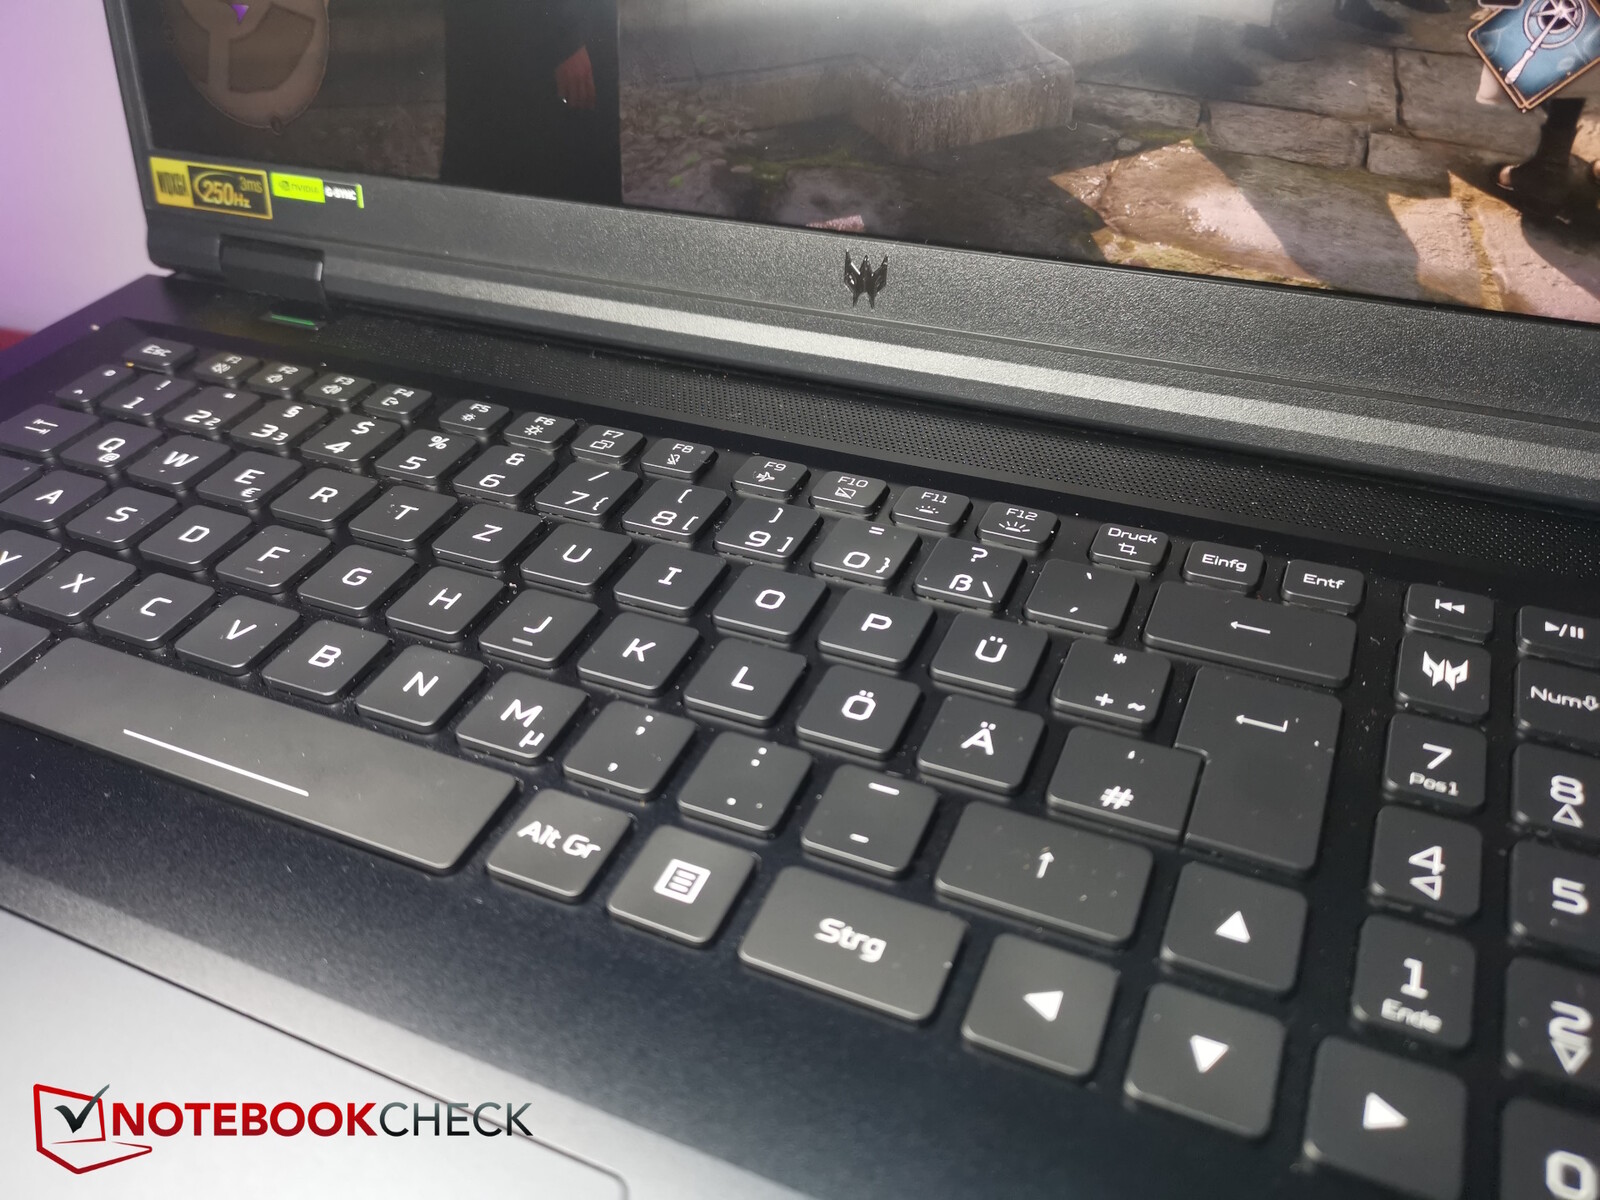
Giriş cihazları - Tuşlar için de MiniLED
Klavye
Predator, tam boyutlu ok tuşları, sağda bir sayı tuş takımı ve Predator Sense yazılımını çağırmak ve performans modlarını değiştirmek için ekstra tuşlar içeren çok düzenli bir düzene sahiptir
Tuşlar 1,5 x 1,5 mm boyutlarında, orta hareket mesafesine sahip ve biraz daha sert olabilen gözle görülür bir geri bildirime sahip. Yazma gürültüsü orta düzeyde ve yazma hızı hızlı.
Acer'a göre, tuş başına RGB arka ışık, tıpkı ekran gibi MiniLED'ler aracılığıyla çalışıyor ve dört seviyede ayarlanabiliyor.
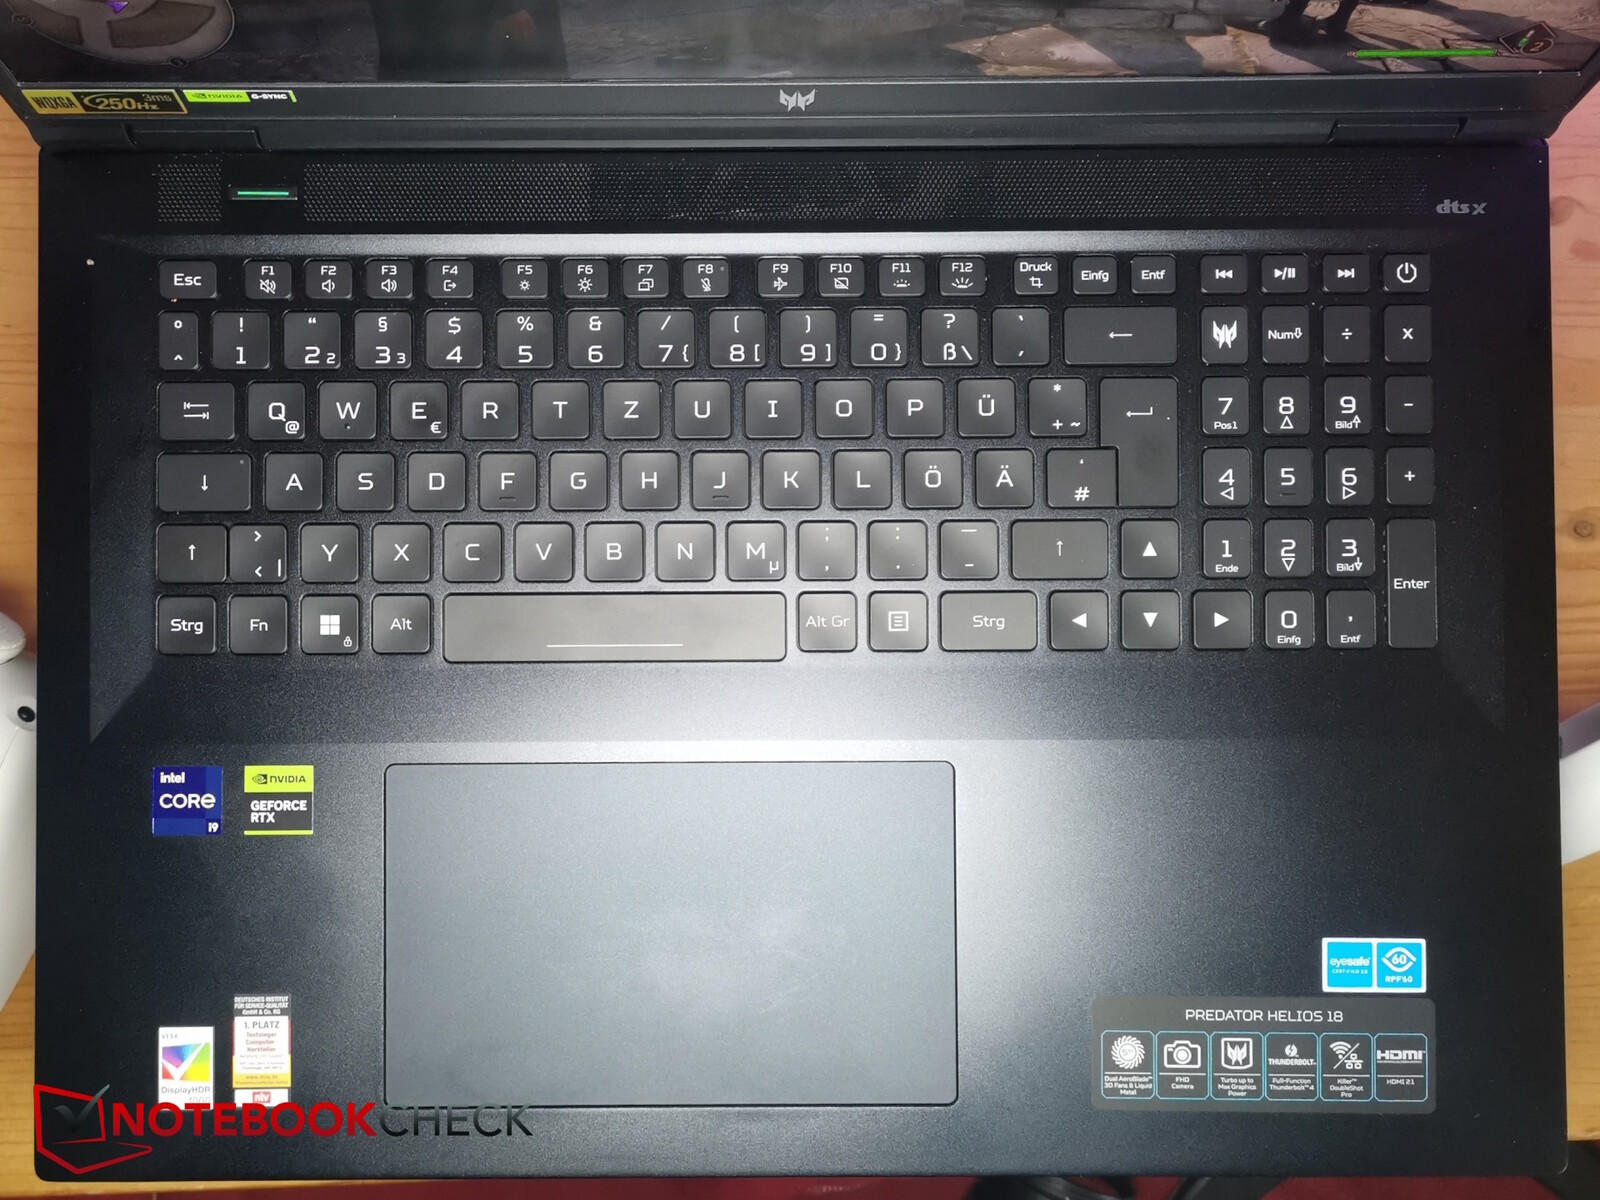
Dokunmatik yüzey
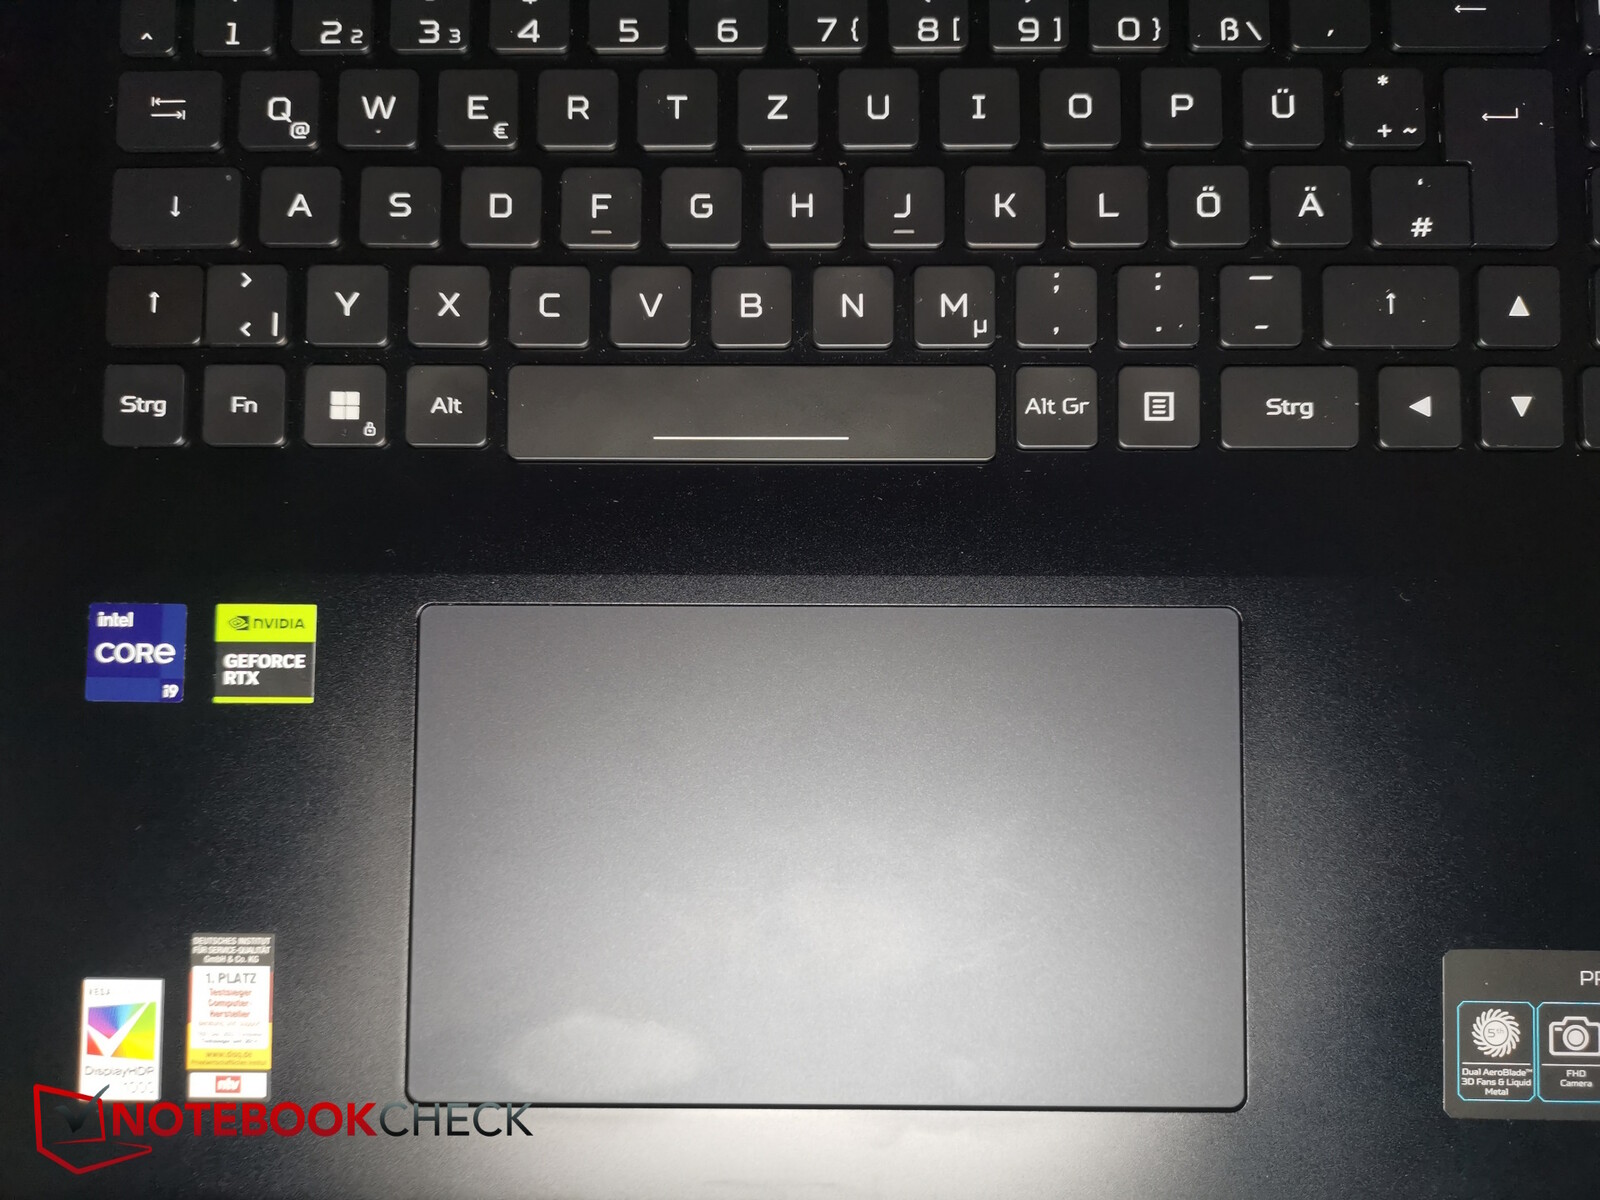
18 inçlik dokunmatik yüzey oldukça büyük (yaklaşık 15,2 x 9,1 cm) ve neredeyse hiç takılmaya neden olmayan çok iyi kayma özellikleri sunuyor.
Entegre tıklama düğmeleri çok sessizdir ve son derece kısa bir hareket mesafesine sahiptir, ancak güvenilir bir şekilde tetiklenir ve iyi geri bildirim sağlar.
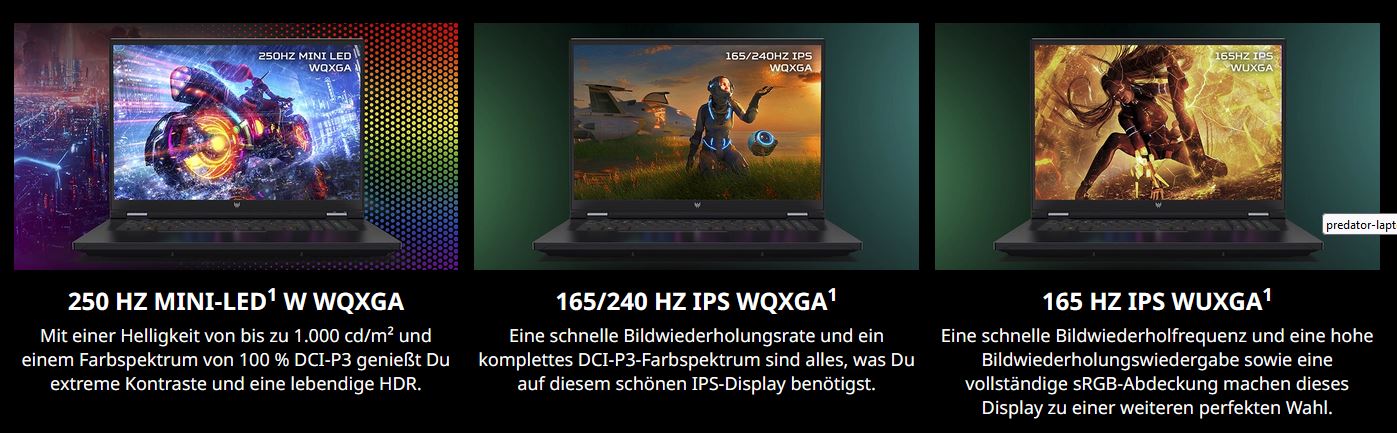
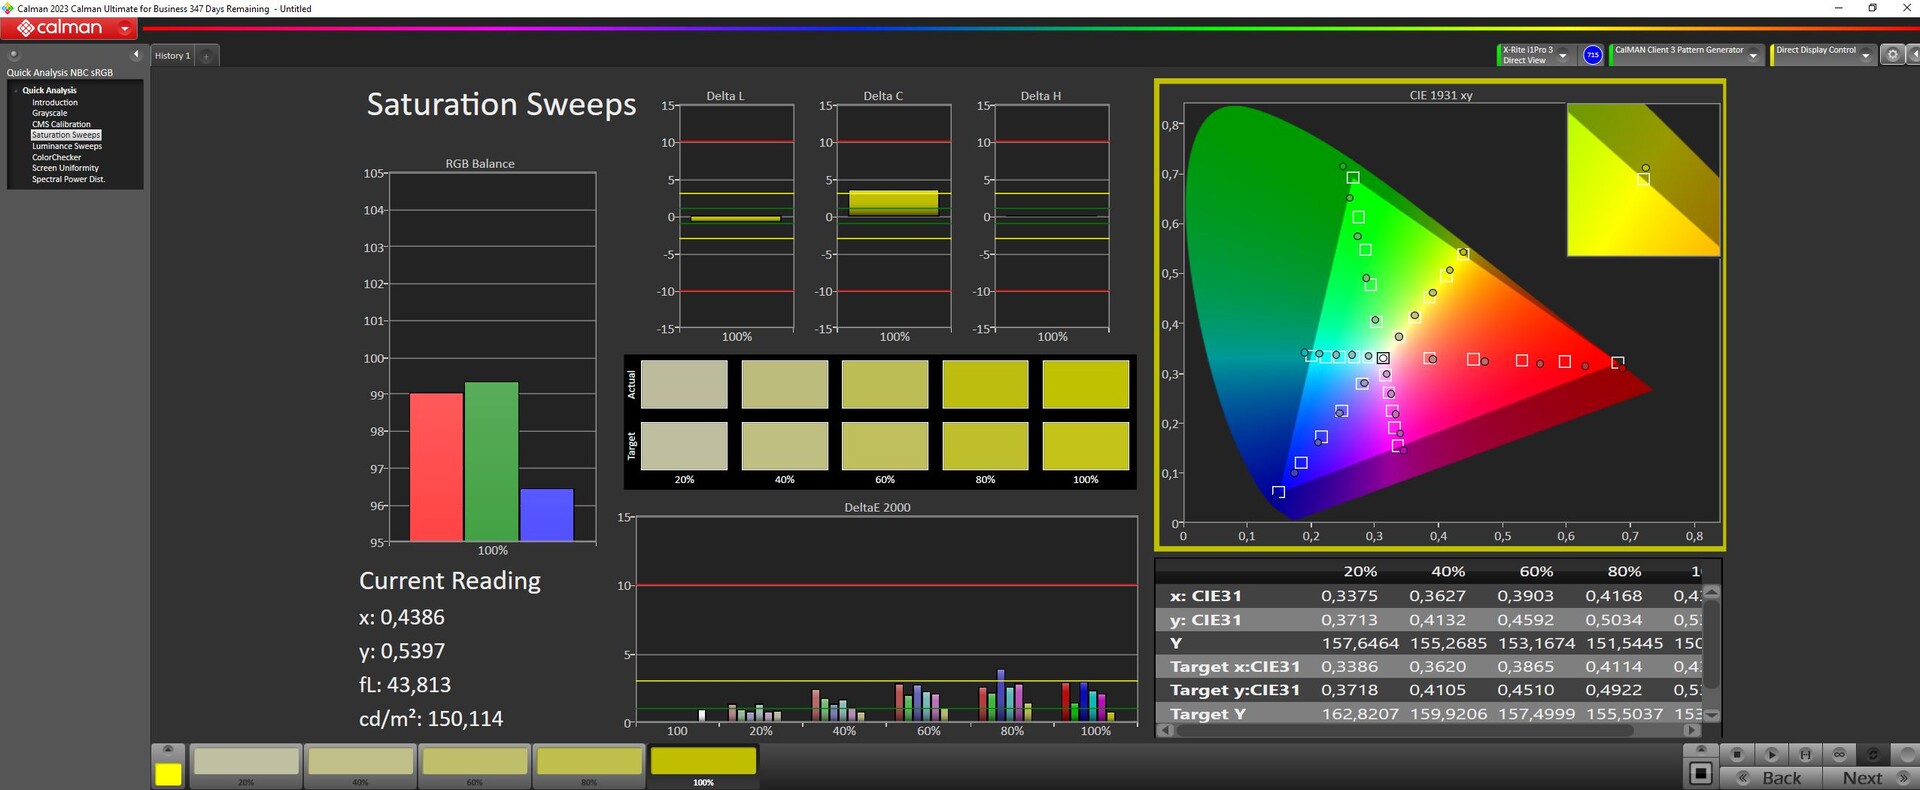
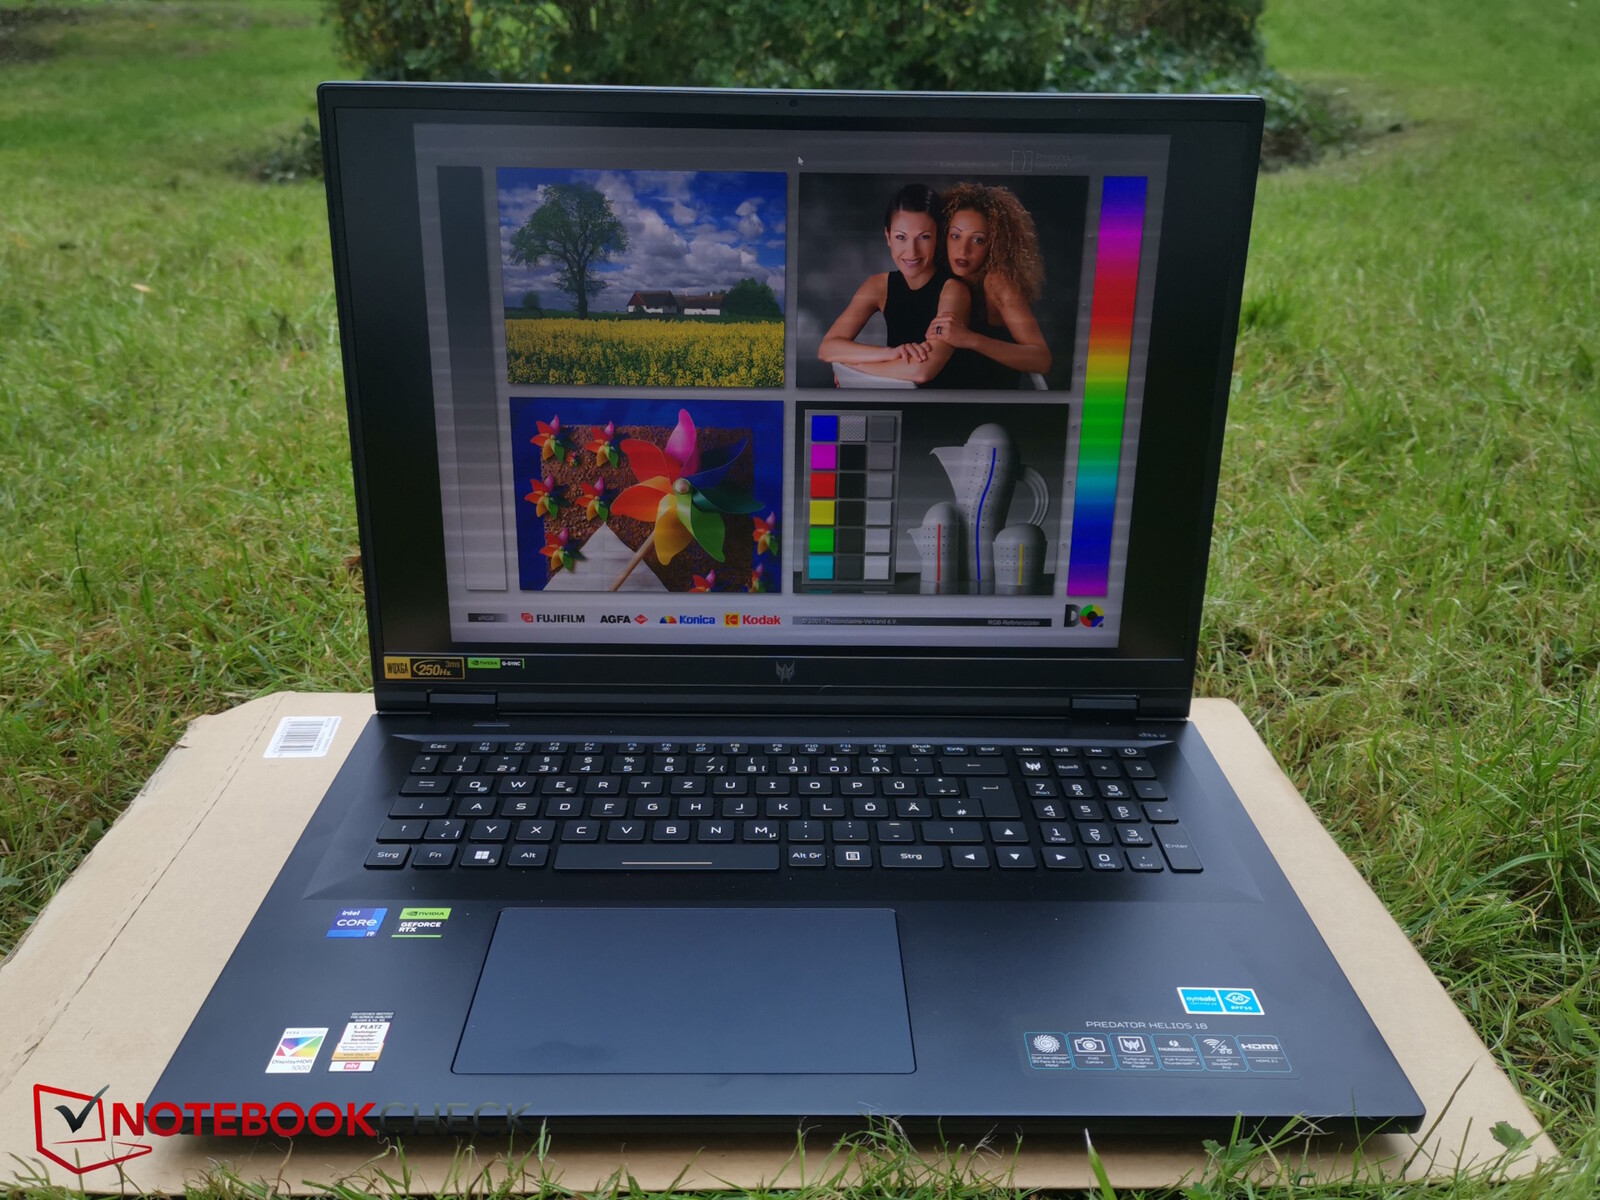
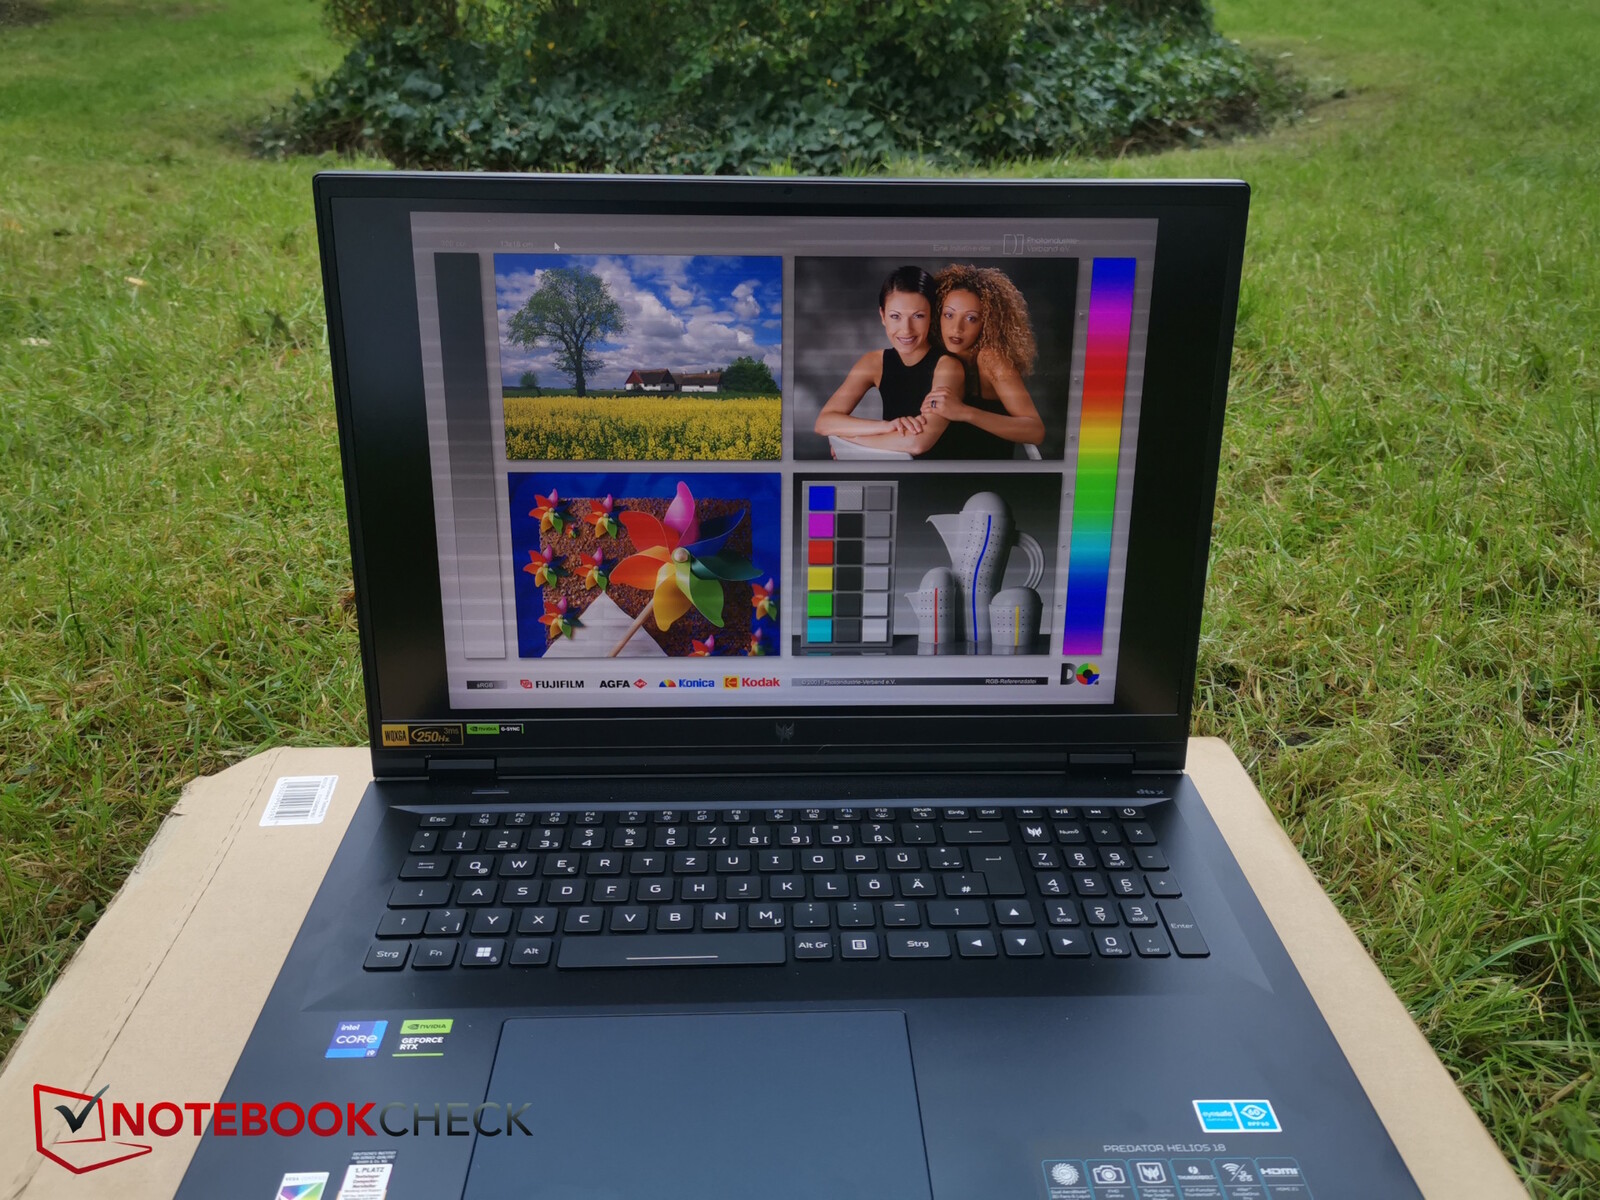
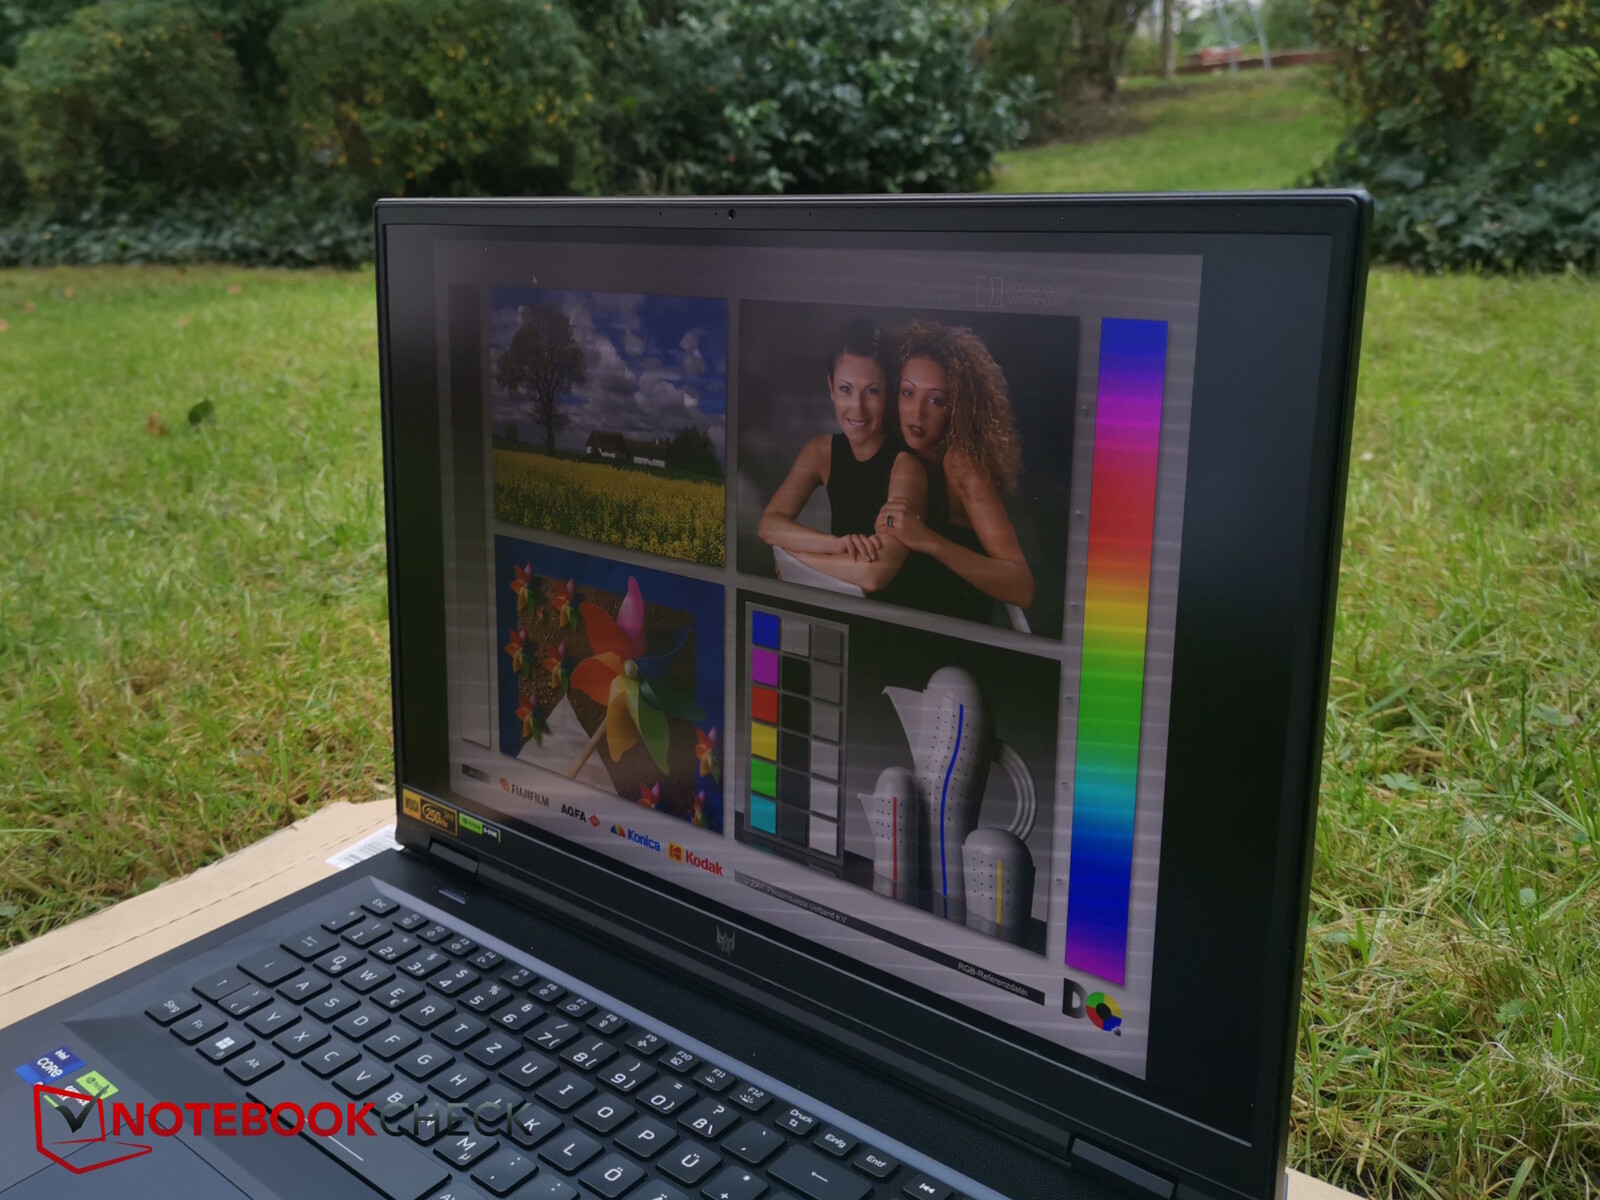
Ekran - 1.000 nitin üzerinde MiniLED'ler
Helios 18, isteğe bağlı olarak test cihazımızda da bulunan 250 Hz'de fantastik MiniLED ekranla birlikte sunuluyor. Burada haleler görünmüyor, siyahlar rahatsız edici ışık artefaktları olmadan zengin ve kontrast da buna uygun olarak iyi.
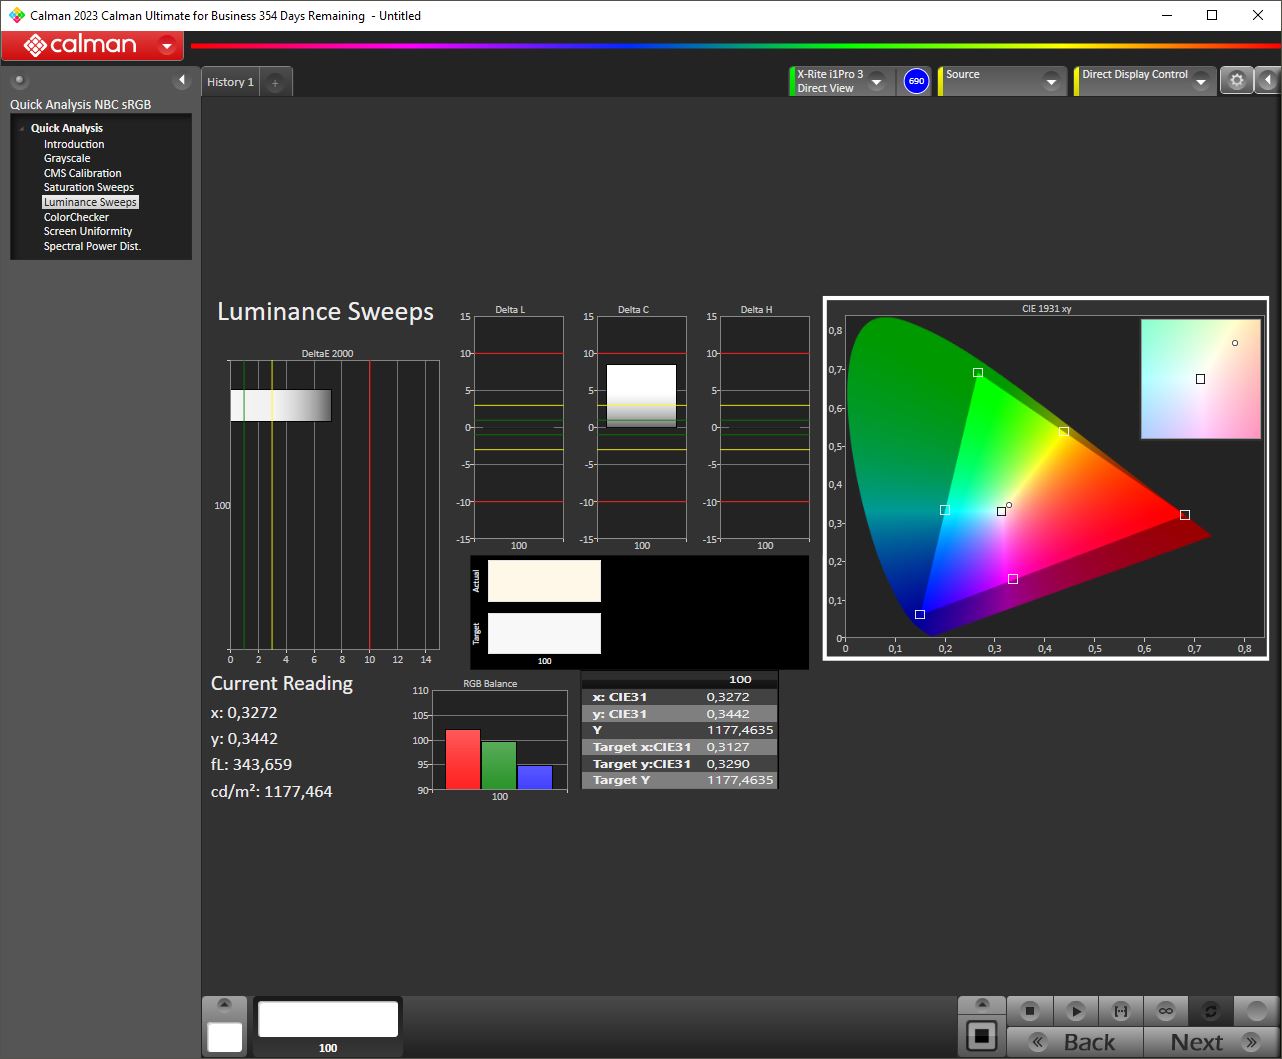
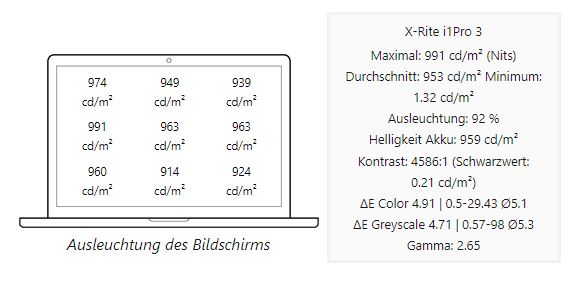
Normal SDR modunda, AU Optronics paneli yaklaşık 350 nit'e ulaşır. Ancak ekran HDR modunda daha da fazla parlaklık üretiyor. Burada, 1.100 nitin üzerinde bir tepe parlaklığı ölçtük! Aydınlatma her iki durumda da %92 gibi çok iyi bir seviyede.
HDR modunda aydınlatma
Illumination in SDR mode
| |||||||||||||||||||||||||
Aydınlatma: 92 %
Batarya modunda parlaklık: 359 cd/m²
Kontrast: 1714:1 (Siyah: 0.21 cd/m²)
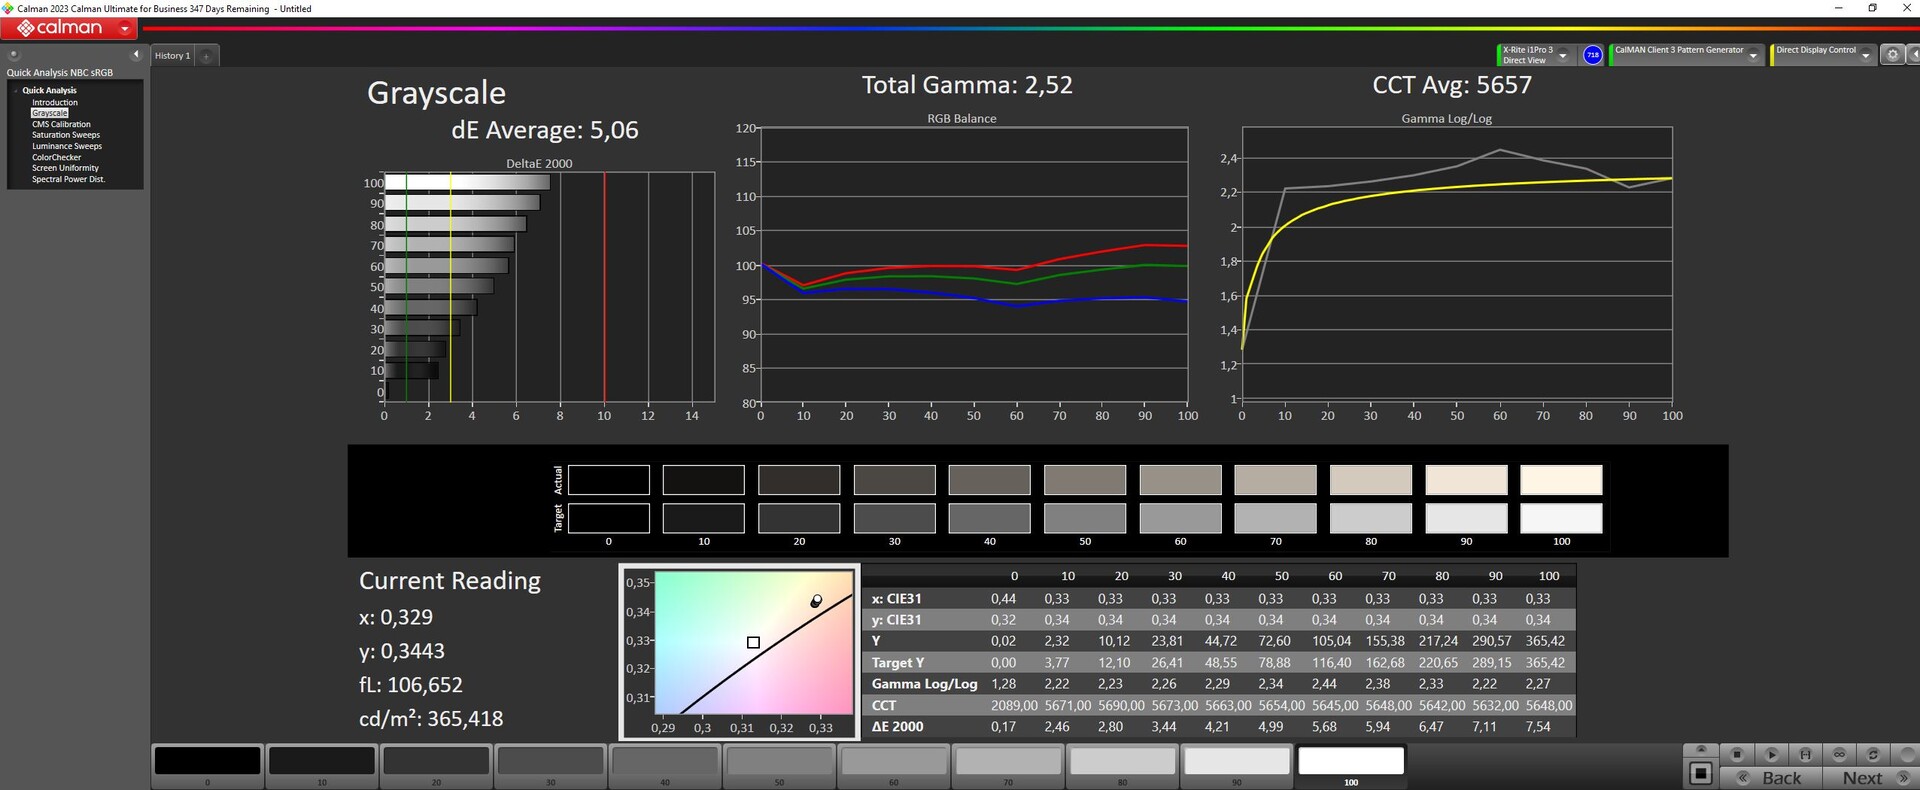
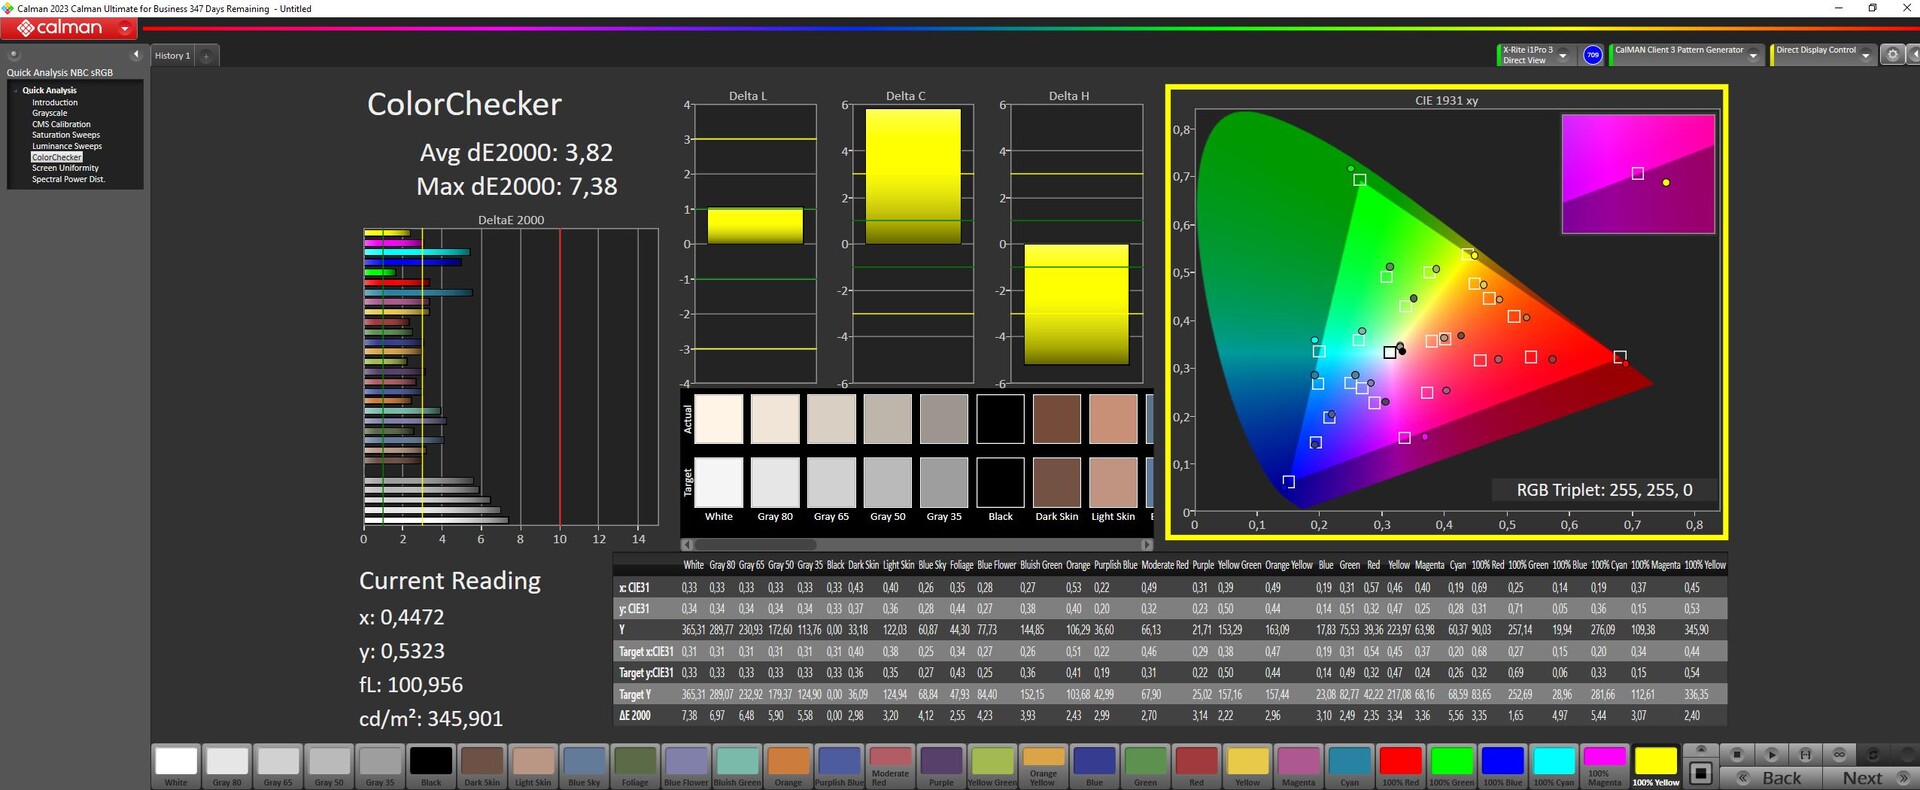
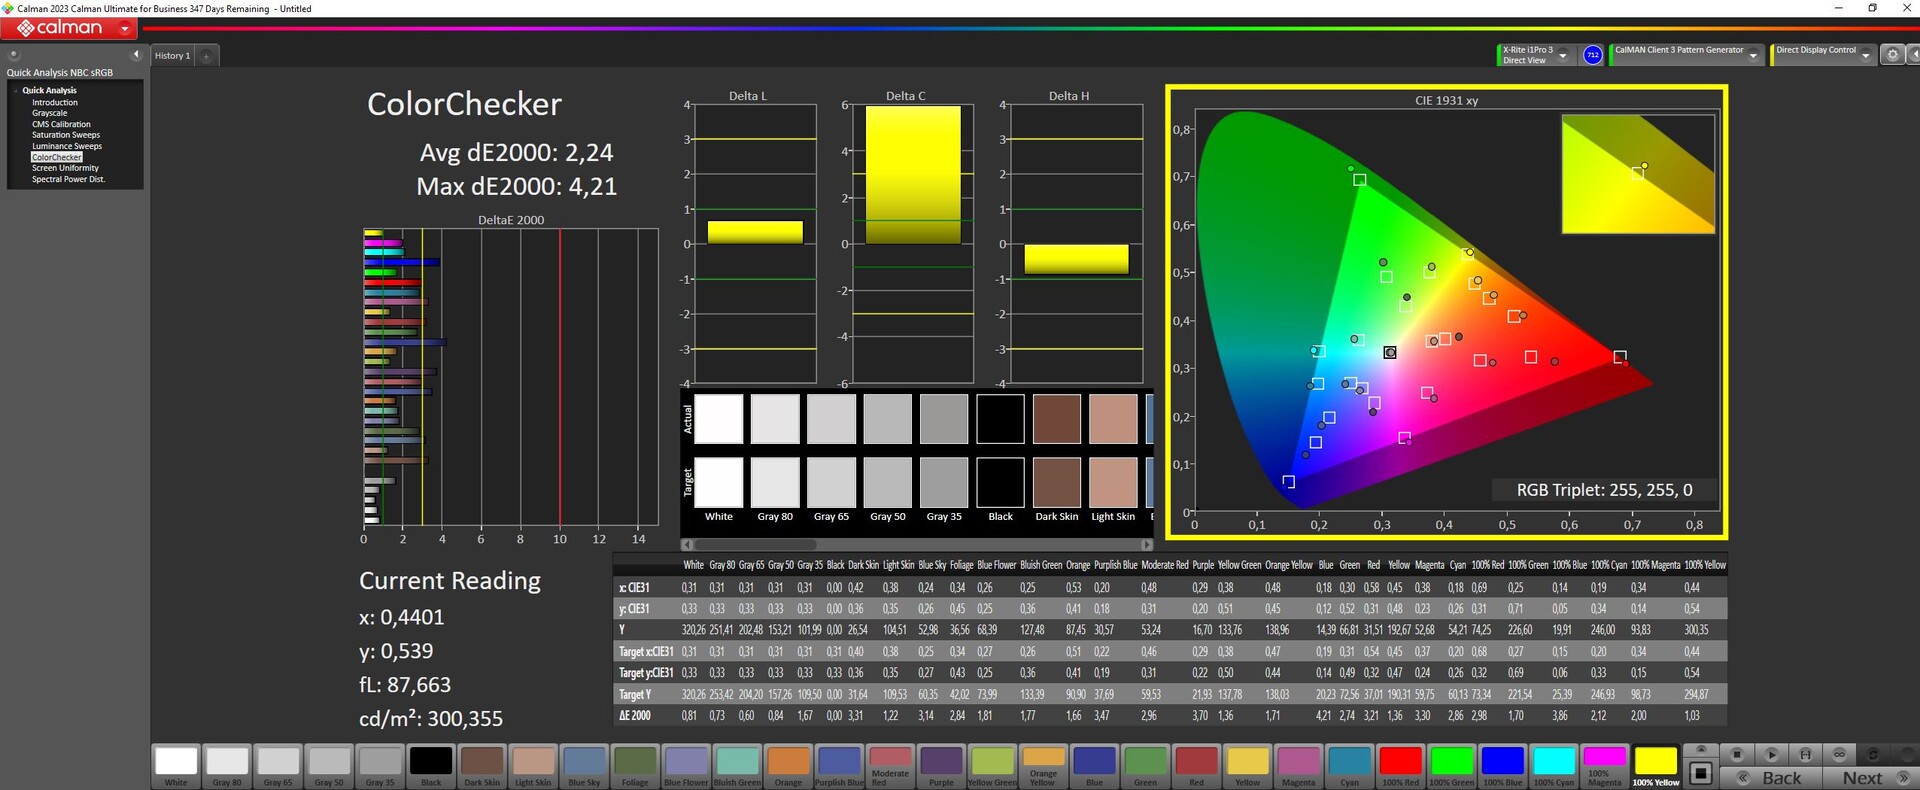
ΔE ColorChecker Calman: 3.82 | ∀{0.5-29.43 Ø4.72}
calibrated: 2.24
ΔE Greyscale Calman: 5.06 | ∀{0.09-98 Ø4.97}
91.8% AdobeRGB 1998 (Argyll 3D)
100% sRGB (Argyll 3D)
99.8% Display P3 (Argyll 3D)
Gamma: 2.52
CCT: 5657 K
| Acer Predator Helios 18 N23Q2 AUO45A8 (B180QAN01.2), IPS, 2560x1600, 18" | MSI GE78HX 13VH-070US AU Optronics B170QAN01.2, IPS, 2560x1600, 17" | HP Omen 17-ck2097ng BOE BOE09BF, IPS, 2560x1440, 17.3" | Alienware m18 R1 Chi Mei 180JME, IPS, 1920x1200, 18" | Asus ROG Strix G18 G814JI NE180QDM-NZ2 (BOE0B35), IPS, 2560x1600, 18" | Razer Blade 18 RTX 4070 AU Optronics B180QAN01.0, IPS, 2560x1600, 18" | |
|---|---|---|---|---|---|---|
| Display | -3% | -19% | -1% | -3% | -3% | |
| Display P3 Coverage (%) | 99.8 | 97.6 -2% | 67.4 -32% | 97.7 -2% | 98.1 -2% | 96.9 -3% |
| sRGB Coverage (%) | 100 | 99.9 0% | 97.6 -2% | 100 0% | 99.9 0% | 99.8 0% |
| AdobeRGB 1998 Coverage (%) | 91.8 | 86.5 -6% | 69.6 -24% | 89.8 -2% | 85.6 -7% | 85.3 -7% |
| Response Times | 55% | -28% | 53% | 38% | 50% | |
| Response Time Grey 50% / Grey 80% * (ms) | 7.6 ? | 4.2 ? 45% | 15.6 ? -105% | 3 ? 61% | 5.6 ? 26% | 4.2 ? 45% |
| Response Time Black / White * (ms) | 17.8 ? | 6.4 ? 64% | 8.9 ? 50% | 9.9 ? 44% | 9 ? 49% | 8 ? 55% |
| PWM Frequency (Hz) | 2509 | |||||
| Screen | -17% | 13% | 20% | 8% | -3% | |
| Brightness middle (cd/m²) | 360 | 398.6 11% | 371 3% | 372.8 4% | 471 31% | 549.6 53% |
| Brightness (cd/m²) | 355 | 384 8% | 350 -1% | 367 3% | 422 19% | 524 48% |
| Brightness Distribution (%) | 92 | 89 -3% | 90 -2% | 97 5% | 83 -10% | 89 -3% |
| Black Level * (cd/m²) | 0.21 | 0.46 -119% | 0.32 -52% | 0.32 -52% | 0.47 -124% | 0.53 -152% |
| Contrast (:1) | 1714 | 867 -49% | 1159 -32% | 1165 -32% | 1002 -42% | 1037 -39% |
| Colorchecker dE 2000 * | 3.82 | 4.05 -6% | 1.74 54% | 1.92 50% | 2.05 46% | 3.32 13% |
| Colorchecker dE 2000 max. * | 7.38 | 8.68 -18% | 3.59 51% | 3.65 51% | 4.15 44% | 6.63 10% |
| Colorchecker dE 2000 calibrated * | 2.24 | 1.02 54% | 1.01 55% | 0.51 77% | 0.8 64% | 2.7 -21% |
| Greyscale dE 2000 * | 5.06 | 6.5 -28% | 2.8 45% | 1.5 70% | 2.8 45% | 2 60% |
| Gamma | 2.52 87% | 2.11 104% | 2.19 100% | 2.34 94% | 2.204 100% | 2.29 96% |
| CCT | 5657 115% | 7518 86% | 6474 100% | 6607 98% | 7122 91% | 6319 103% |
| Toplam Ortalama (Program / Ayarlar) | 12% /
-4% | -11% /
1% | 24% /
20% | 14% /
10% | 15% /
4% |
* ... daha küçük daha iyidir
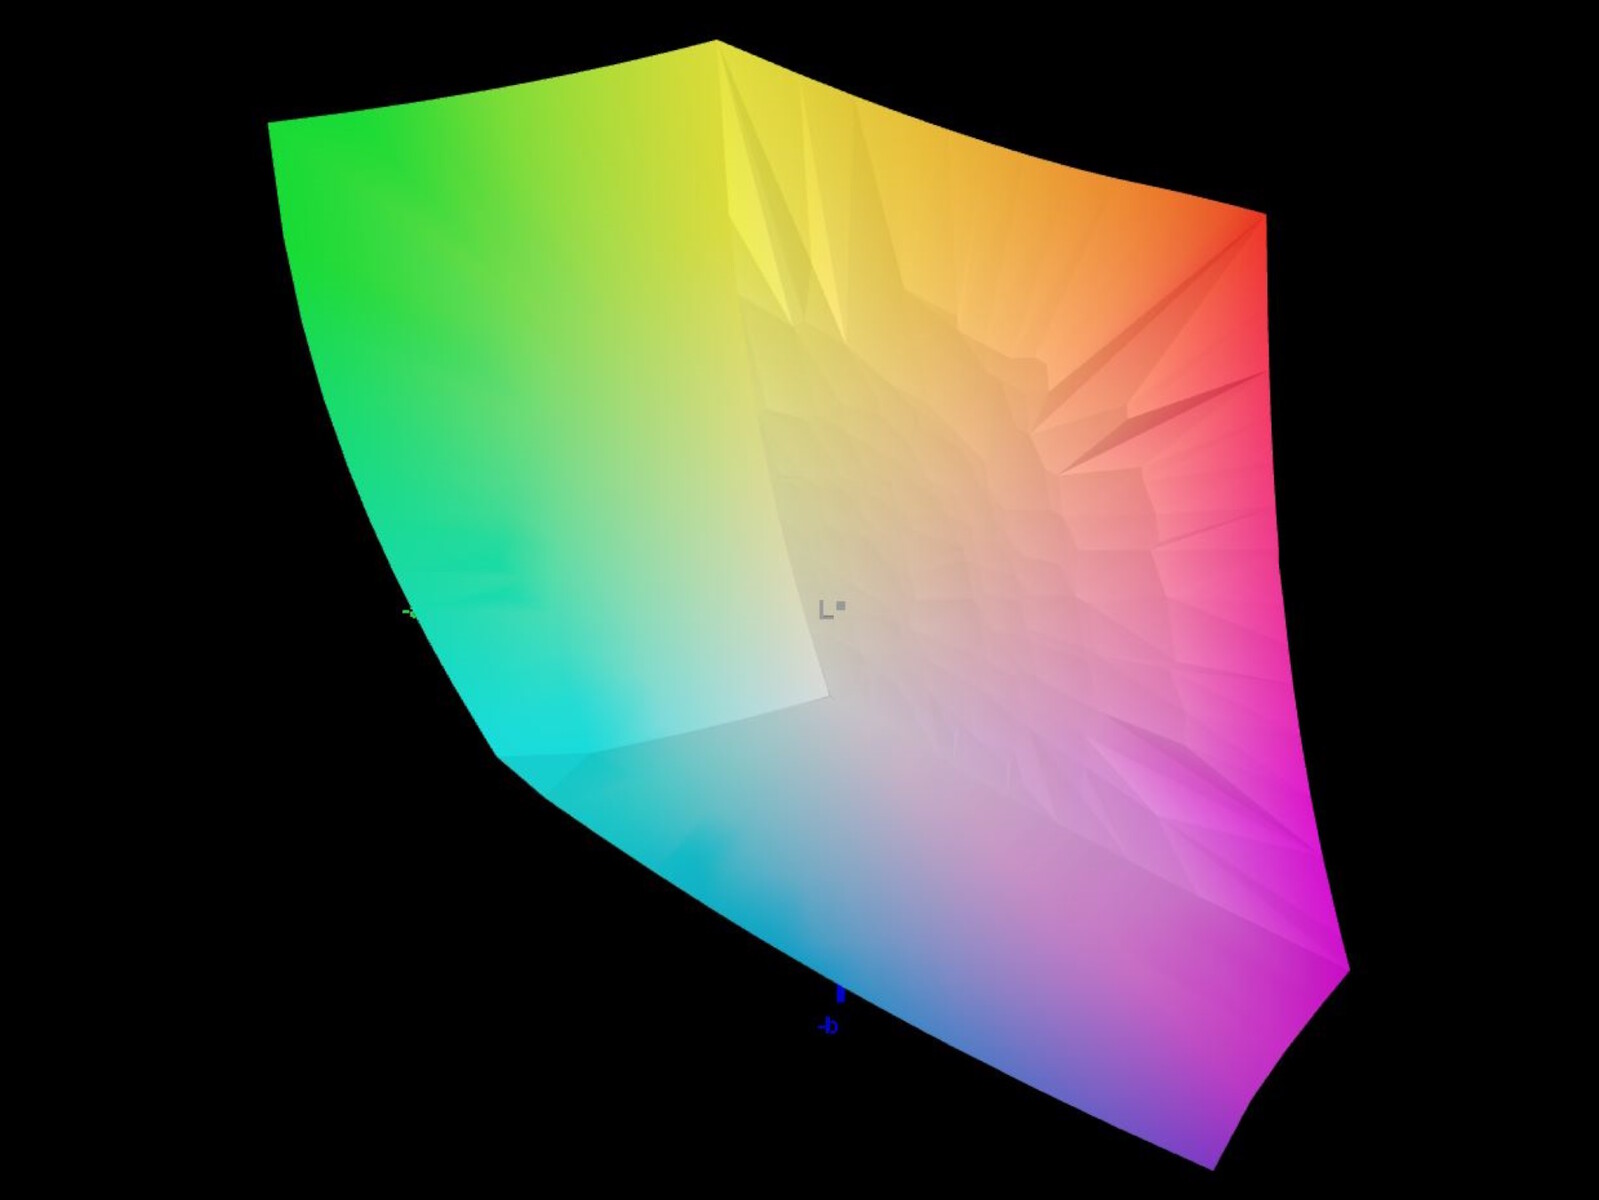
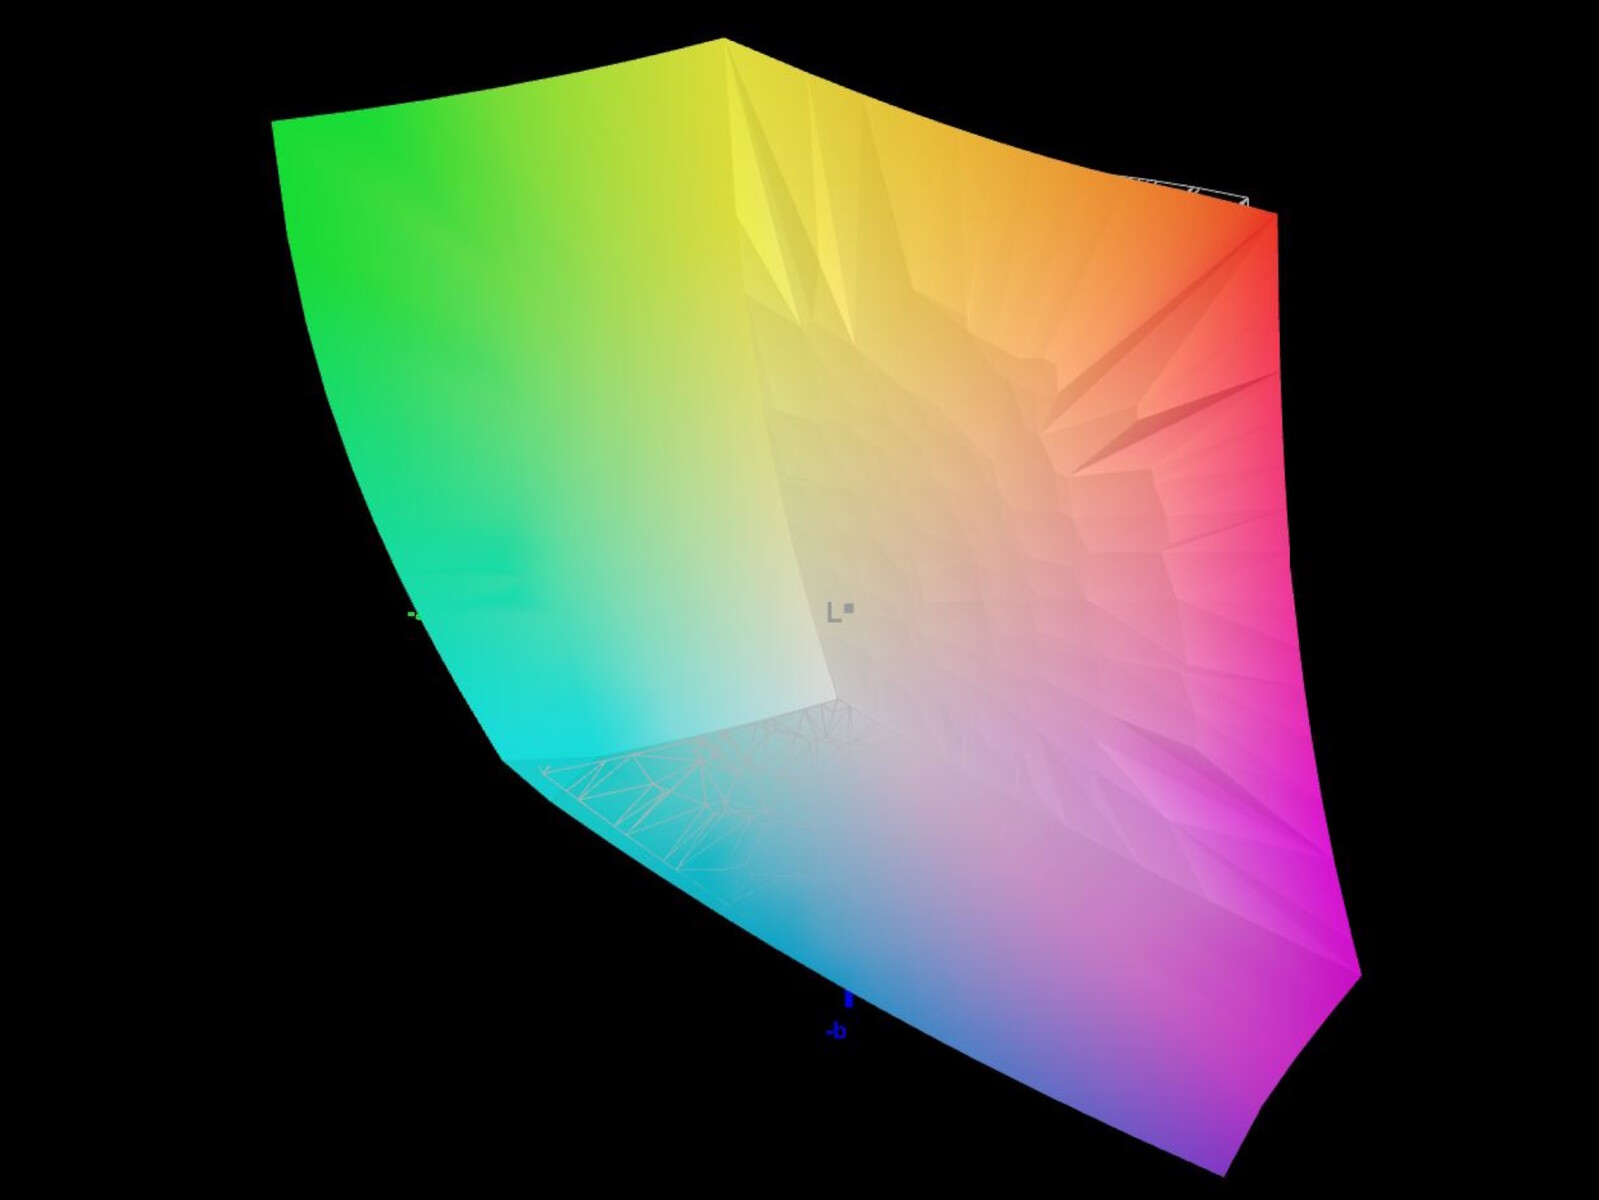
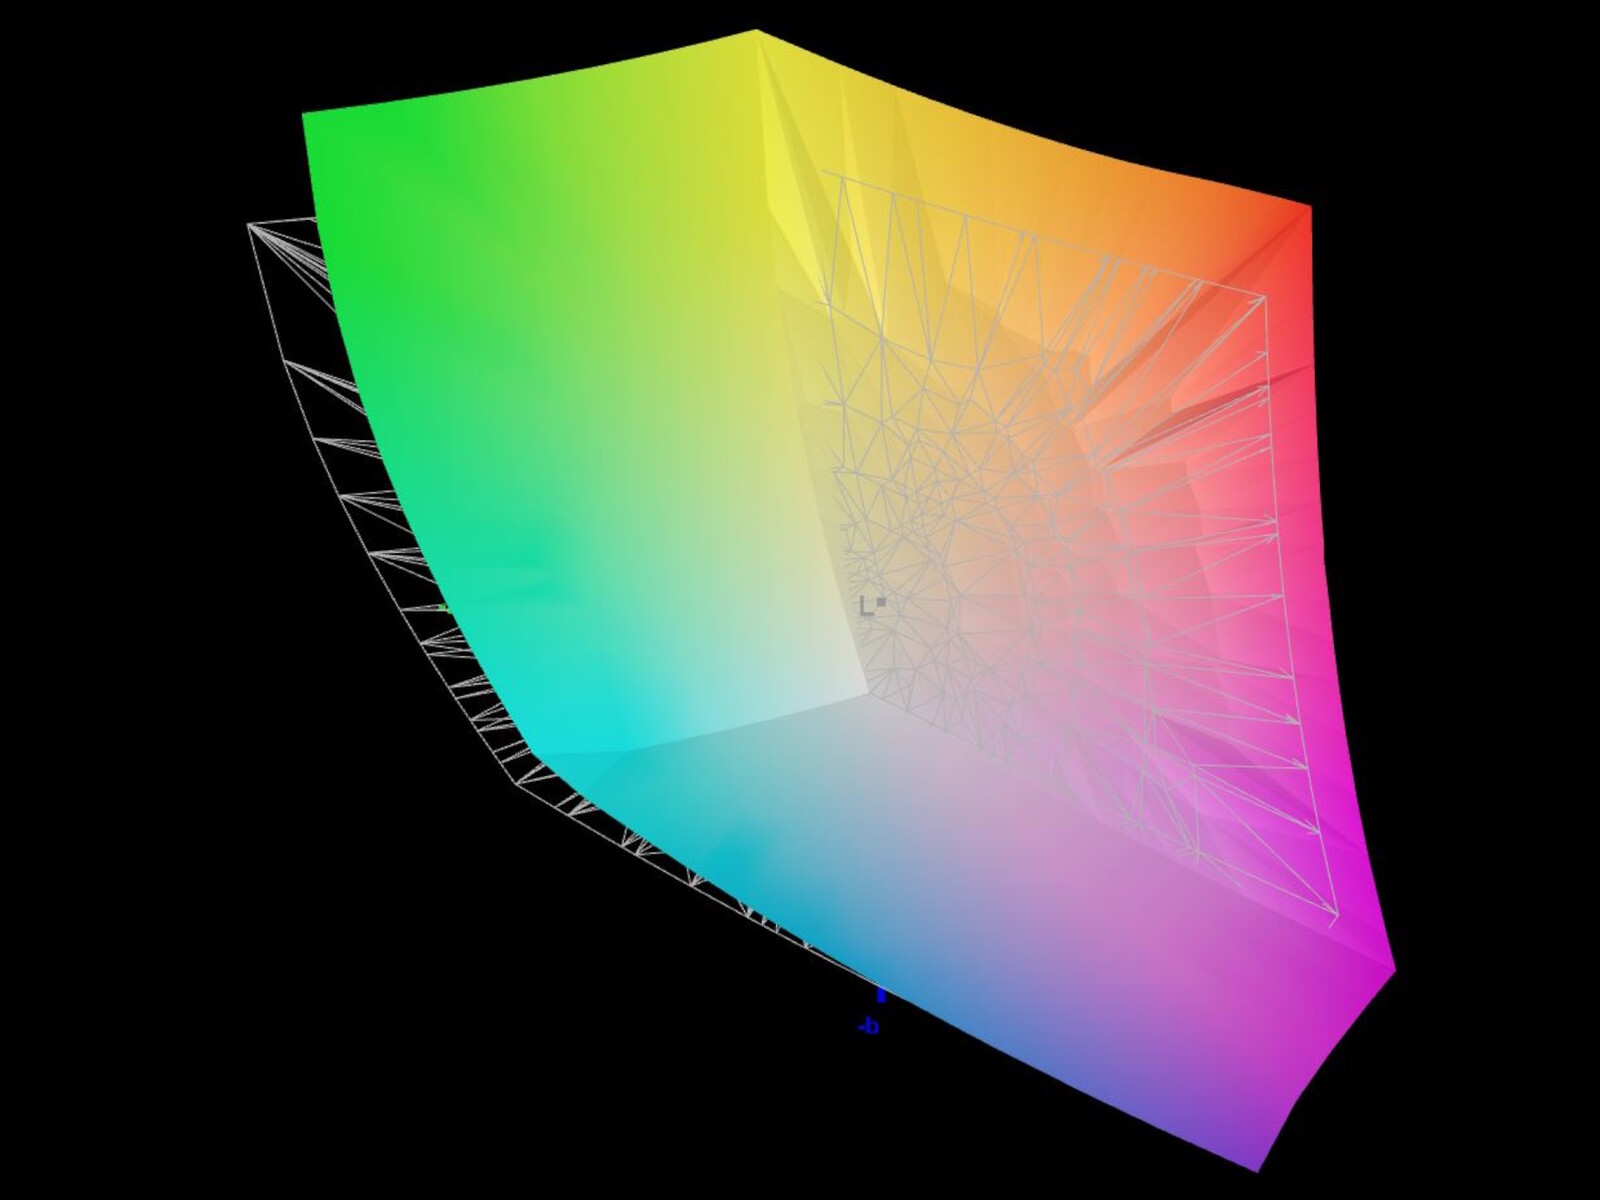
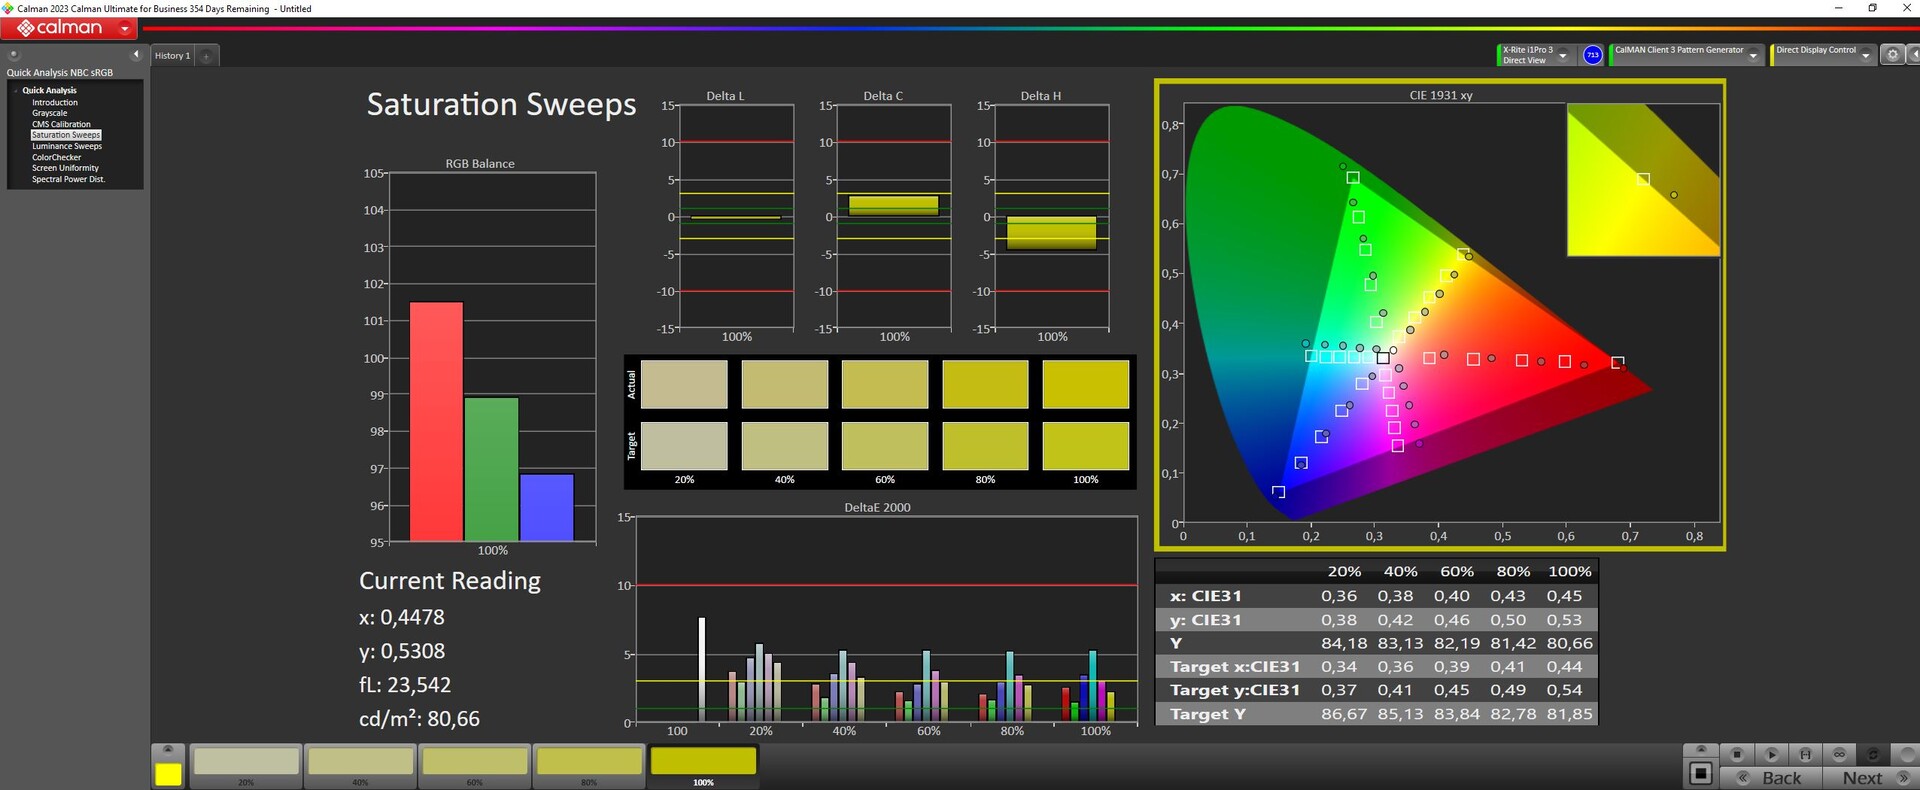
P3 renk uzayına göre ölçüm yaptık. Ekran sRGB ve DisplayP3'ü neredeyse tamamen kapsıyor. AdobeRGB ise yüzde 92 oranında kapsama alanına sahip. Özellikle P3 sayesinde, parlak ve yüksek kontrastlı ekran görüntü ve video düzenleme için de uygundur.
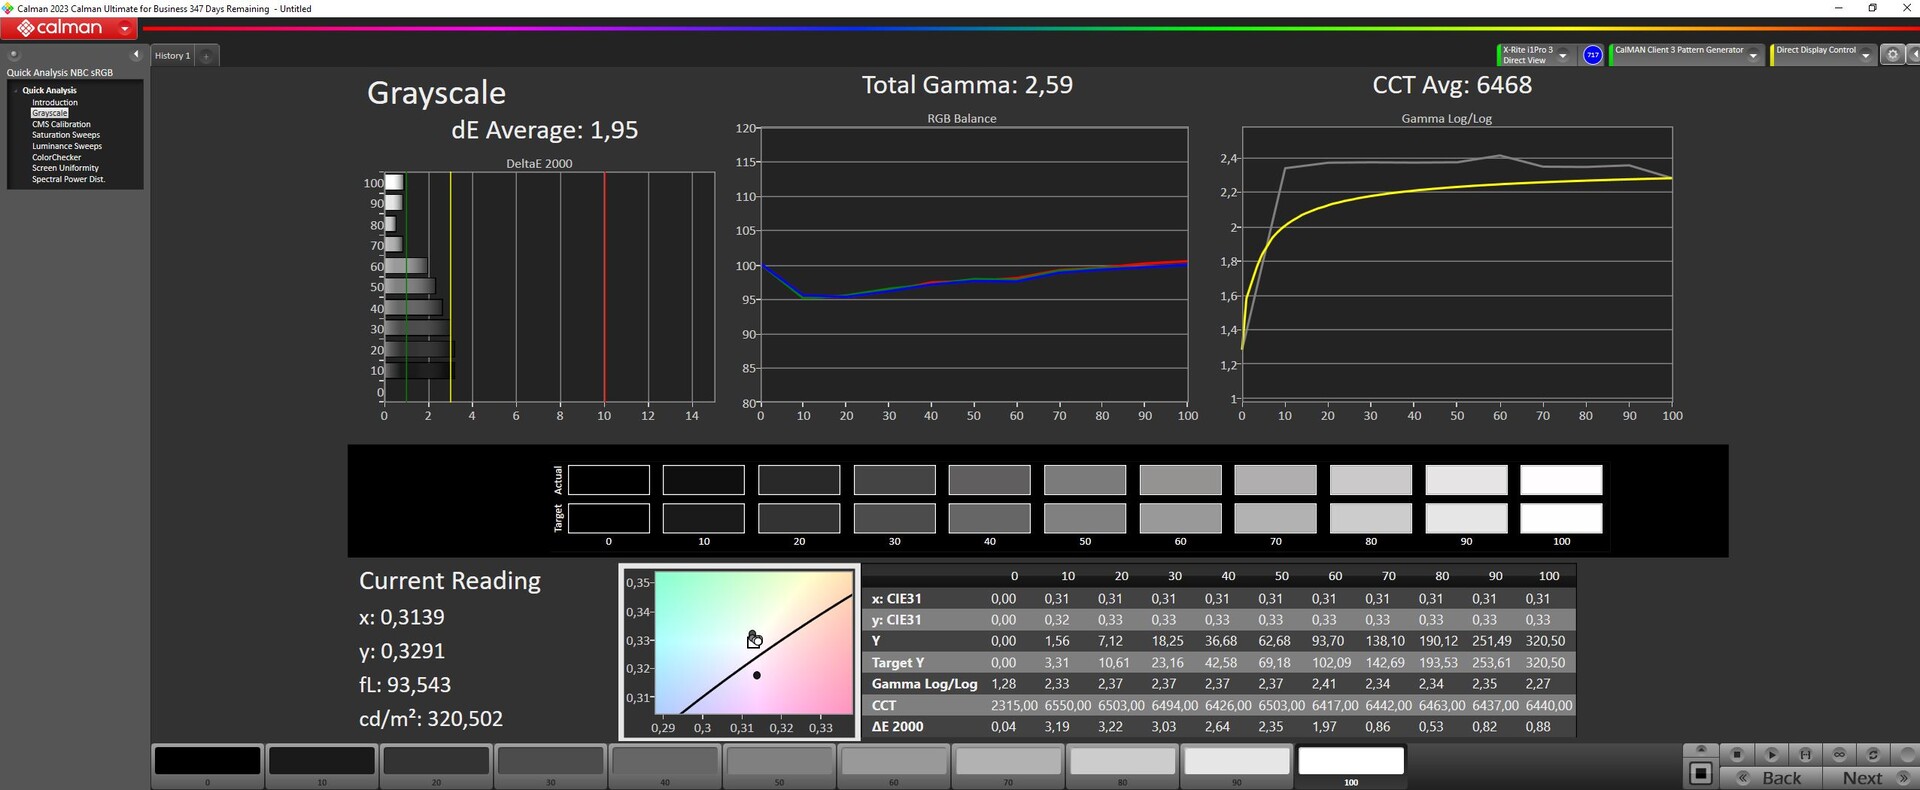
Ancak ekran, kutudan çıktığı anda renkler ve gri tonlama için önemli DeltaE değeri olan 3'ün üzerine çıkıyor. Manuel kalibrasyonumuz renk sapmalarını iyileştiriyor ve DeltaE değerlerini eşiğin altına çekiyor. Parlaklığı 160 nit'e düşürmek de daha fazla iyileşme sağlayabilir. Kalibre edilmiş icc dosyamız yukarıda ücretsiz olarak indirilebilir.
Yanıt Sürelerini Görüntüle
| ↔ Tepki Süresi Siyahtan Beyaza | ||
|---|---|---|
| 17.8 ms ... yükseliş ↗ ve sonbahar↘ birleşimi | ↗ 15.6 ms yükseliş | 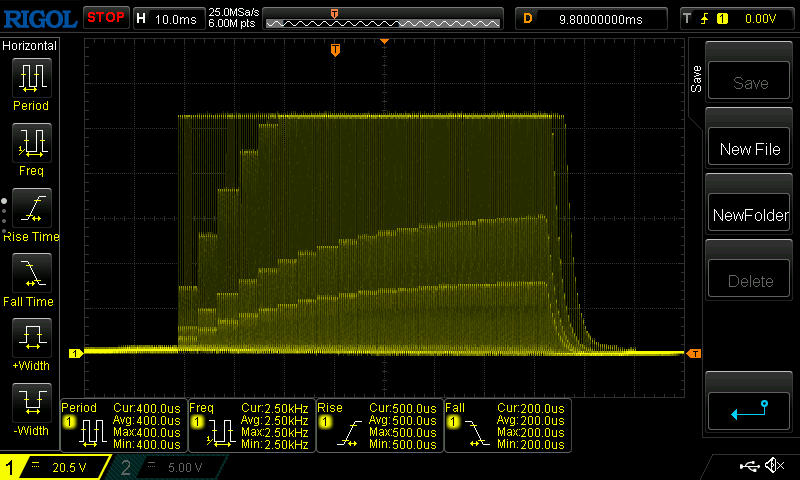 |
| ↘ 2.2 ms sonbahar | ||
| Ekran, testlerimizde iyi yanıt oranları gösteriyor ancak rekabetçi oyuncular için çok yavaş olabilir. Karşılaştırıldığında, test edilen tüm cihazlar 0.1 (minimum) ile 240 (maksimum) ms arasında değişir. » Tüm cihazların 40 %'si daha iyi. Bu, ölçülen yanıt süresinin test edilen tüm cihazların ortalamasından (19.8 ms) daha iyi olduğu anlamına gelir. | ||
| ↔ Tepki Süresi %50 Griden %80 Griye | ||
| 7.6 ms ... yükseliş ↗ ve sonbahar↘ birleşimi | ↗ 4.4 ms yükseliş | 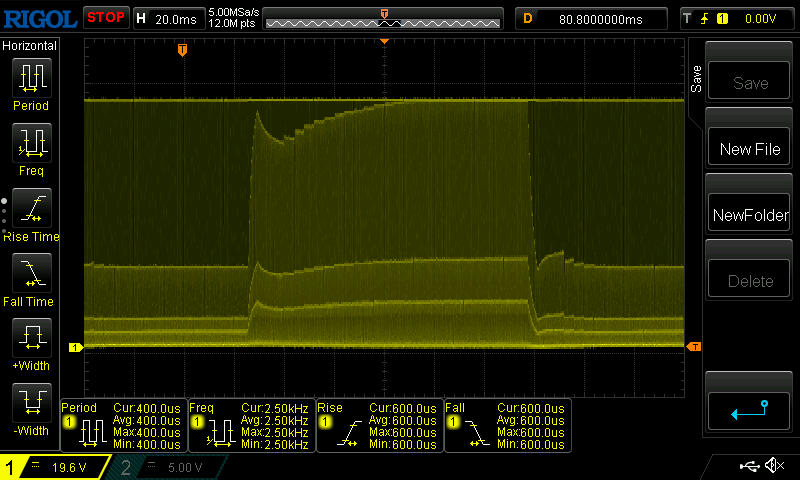 |
| ↘ 3.2 ms sonbahar | ||
| Ekran, testlerimizde çok hızlı yanıt oranları gösteriyor ve hızlı oyun oynamaya çok uygun olmalı. Karşılaştırıldığında, test edilen tüm cihazlar 0.165 (minimum) ile 636 (maksimum) ms arasında değişir. » Tüm cihazların 20 %'si daha iyi. Bu, ölçülen yanıt süresinin test edilen tüm cihazların ortalamasından (31 ms) daha iyi olduğu anlamına gelir. | ||
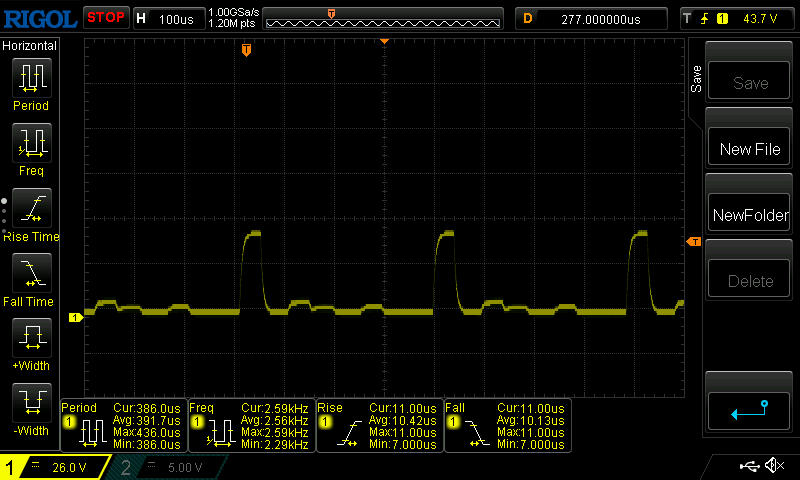
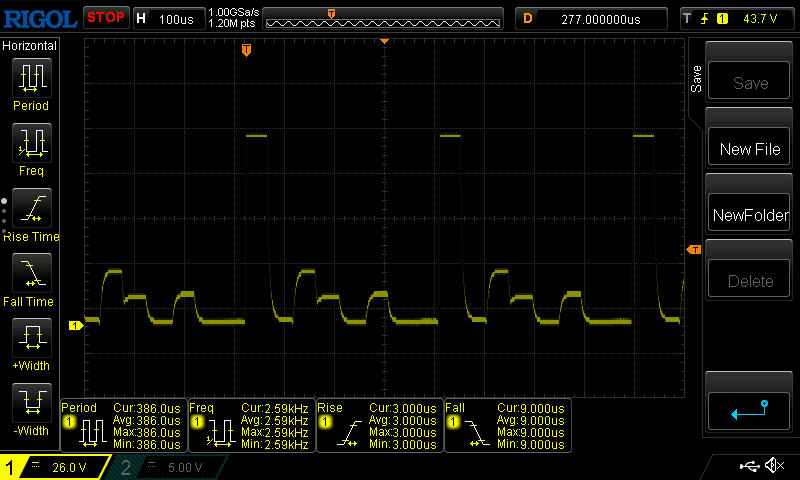
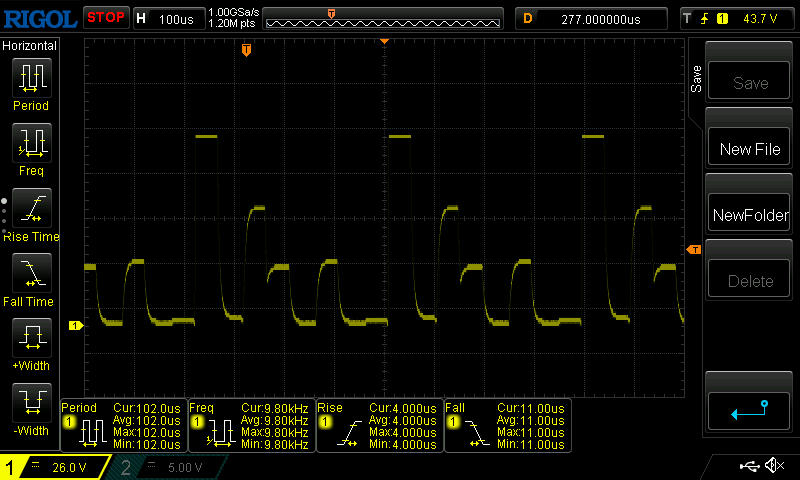
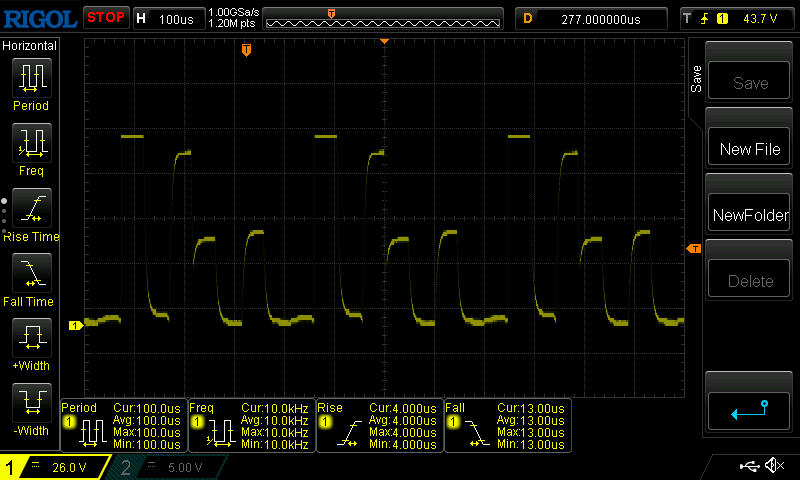
Ekran Titremesi / PWM (Darbe Genişliği Modülasyonu)
| Ekran titriyor / PWM algılandı | 2509 Hz | 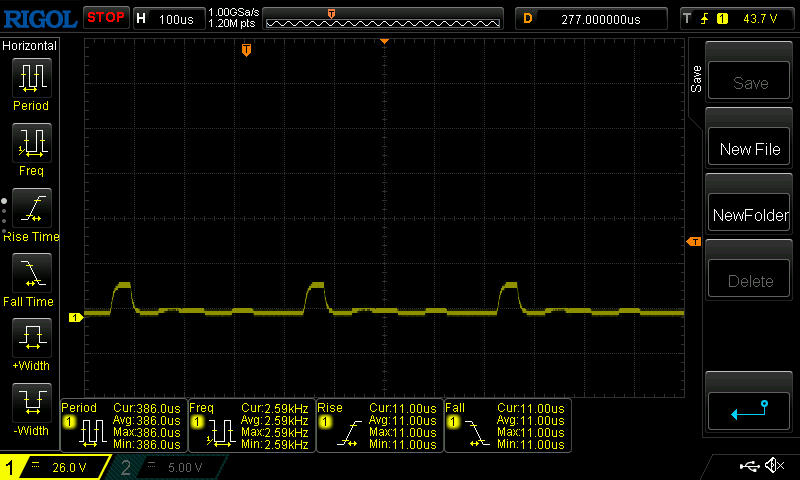 | |
Ekran arka ışığı 2509 Hz'de titriyor (en kötü durum, örneğin PWM kullanılması) . 2509 Hz frekansı oldukça yüksektir, bu nedenle PWM'ye duyarlı çoğu kullanıcı herhangi bir titremeyi fark etmemelidir. Karşılaştırıldığında: Test edilen tüm cihazların %52 %'si ekranı karartmak için PWM kullanmıyor. PWM tespit edilirse, ortalama 7763 (minimum: 5 - maksimum: 343500) Hz ölçüldü. | |||
PWM ekranda parlaklık kontrolü için kullanılır. Minimum parlaklıkta, frekans 2,5 kHz civarında en düşük seviyededir, ancak yine de hassas kişiler için sorun yaratmayacak kadar yüksektir.
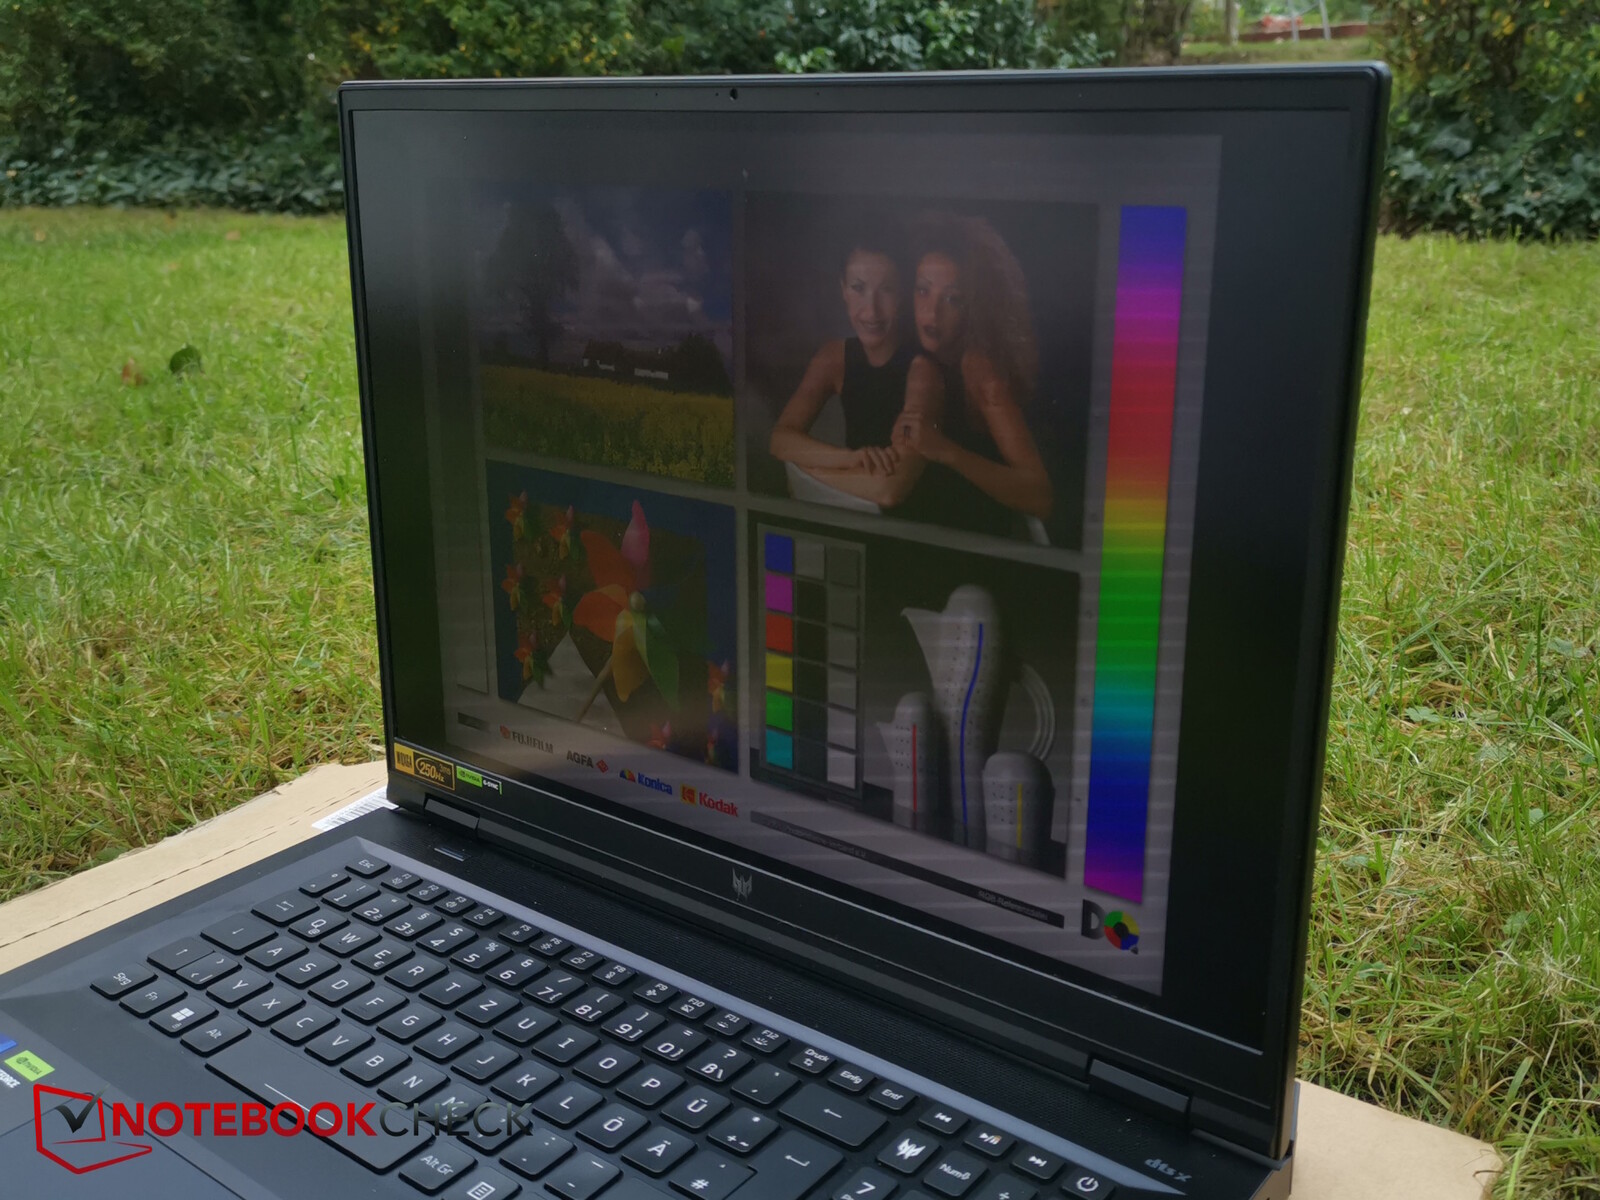
Dışarıda, ekranı daha da parlak hale getirmek için HDR'ye ayarlamak faydalı olabilir. Gölgede, içerik yine de çok iyi görülebilir.

Performans - HX CPU ve RTX 4080
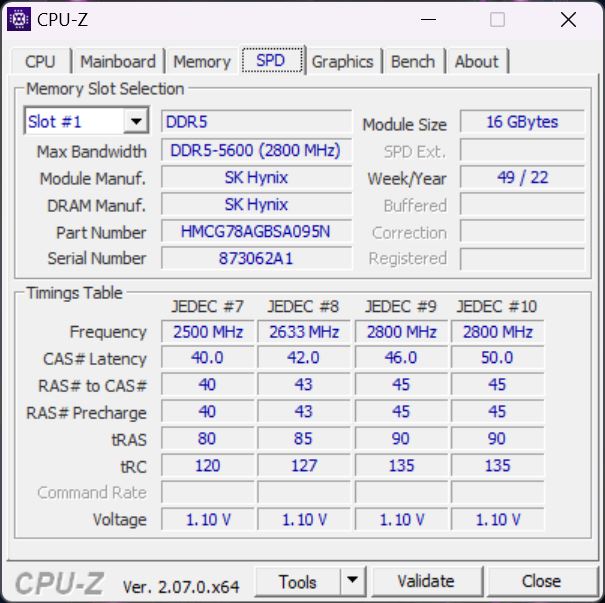
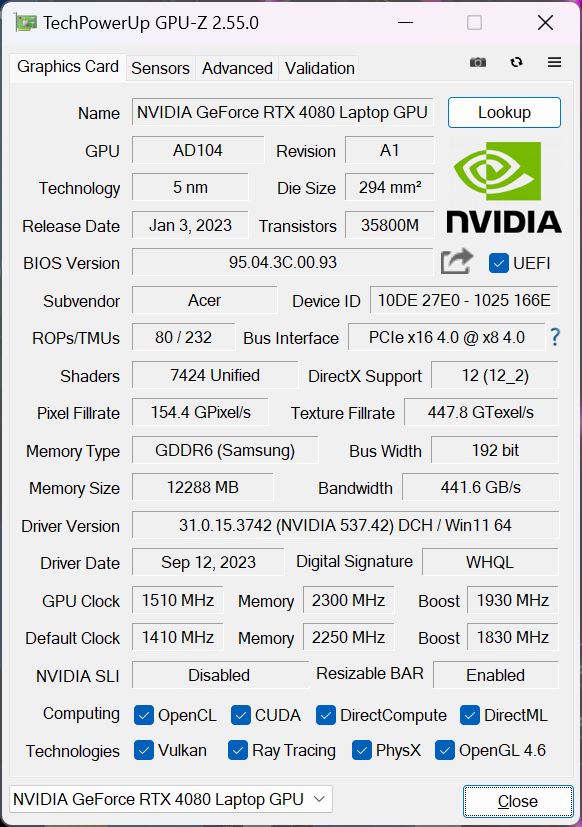
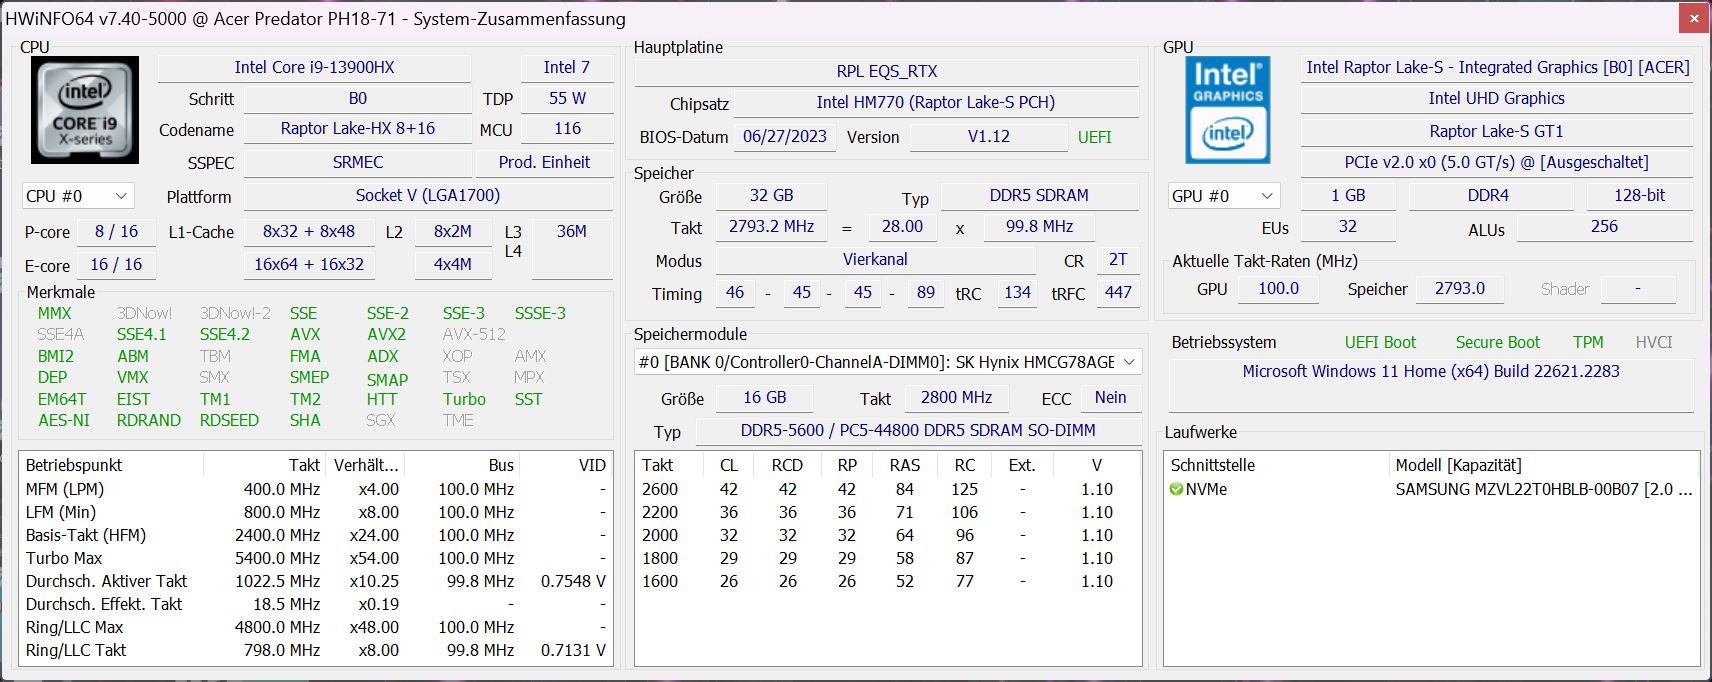
Intel Core i9-13900HX ile donatılmıştır ve bir GeForce RTX 4080 Dizüstü Bilgisayar GPU'subuna 32 GB RAM ve 18 inç MiniLED ekran da eklendiğinde, elimizde son derece güçlü bir masaüstü ikamesi ve tüm güncel oyunları doğal WQXGA çözünürlükte bile sorunsuzca oynatabilecek üst düzey bir oyuncu bilgisayarı var.
İyi ekranı sayesinde dizüstü bilgisayar, yaratıcı insanlar için bir iş istasyonu olarak da kullanılabilir.
Test Koşulları
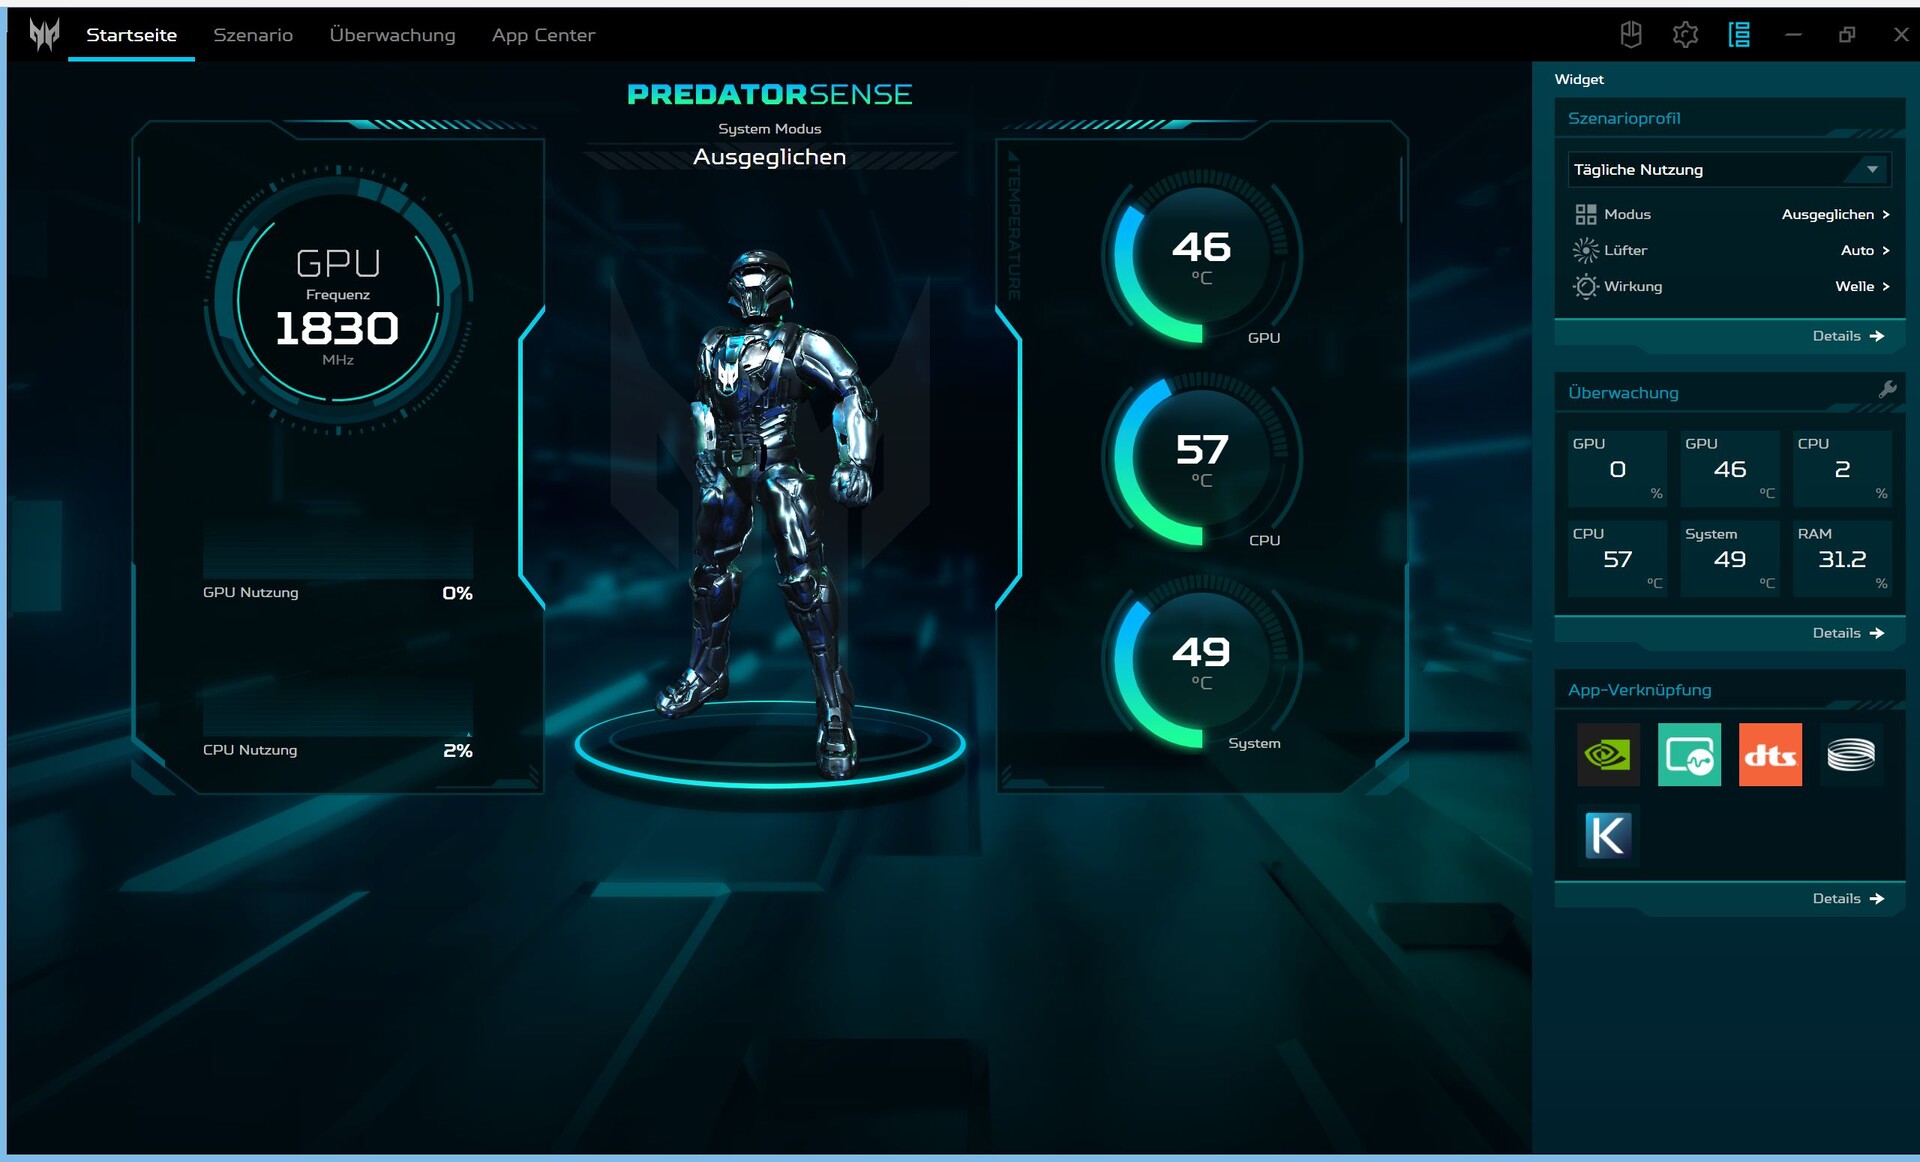
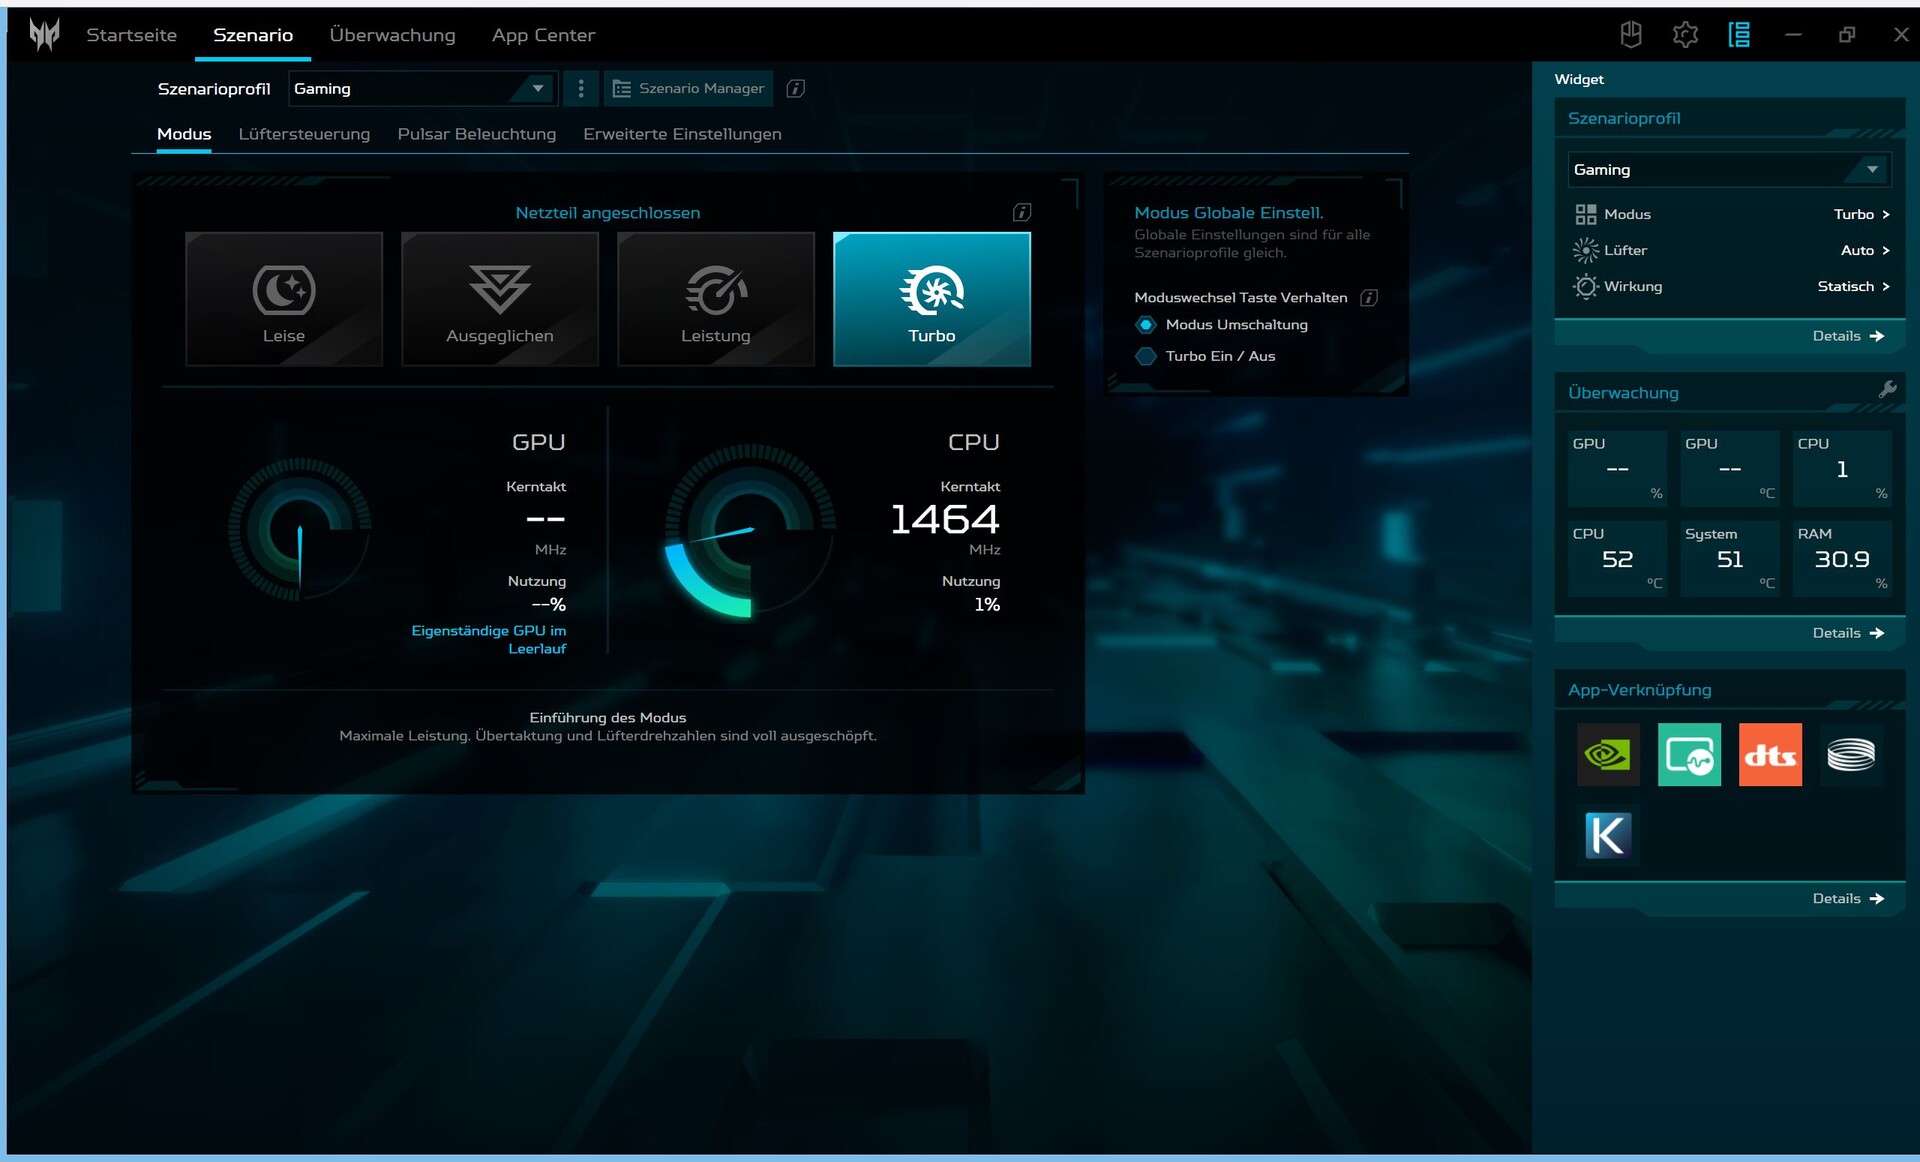
Acer, diğer şeylerin yanı sıra Predator Sense yazılımını oyun dizüstü bilgisayarına yükler. Burada dört performans modu(Eco, Balanced, Performance, Turbo) ve diğer seçenekler (örneğin klavye aydınlatması) özelleştirilebiliyor. Yazılım oldukça anlaşılır, ancak rakip cihazlar kadar çok (manuel) ayar sunmuyor. Örneğin, GPU değiştirme seçeneğinin yanı sıra performans parametrelerini manuel olarak ayarlama ayarlarından yoksunuz.
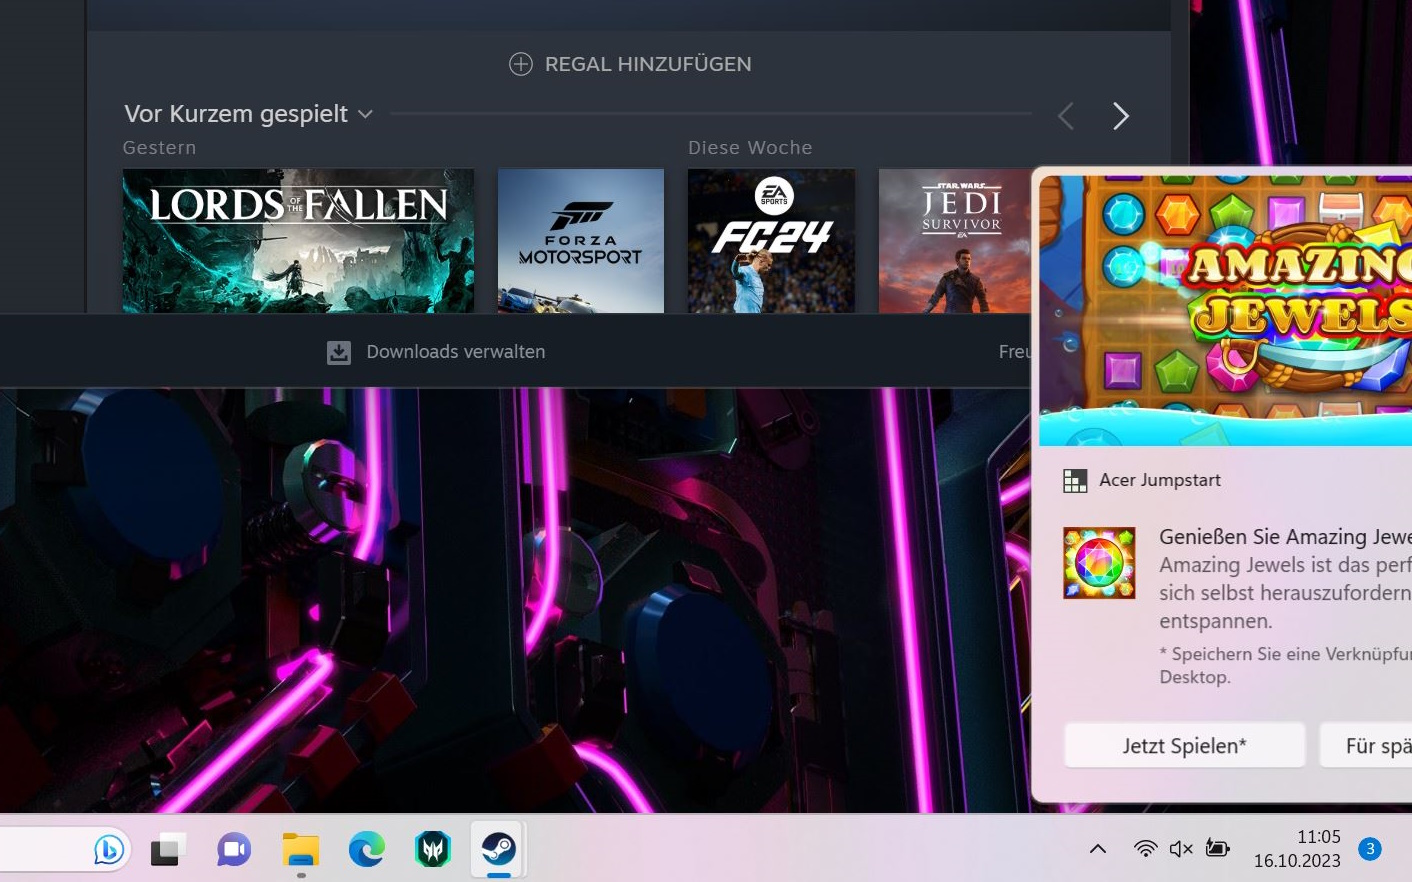
Ne yazık ki Acer, McAfee veya Acer Care gibi daha çok destekle ilgili başka yazılımlar da yüklüyor. Ayrıca, Acer'dan istenmeyen reklamlar aldık. Hatta bir keresinde Opera tarayıcısını yüklemek için istenmeyen bir istek aldık. Zorunlu üretici yazılımları aracılığıyla bu tür zorunlu reklamlar gerçek bir sıkıntıdır ve ne yazık ki giderek daha sık hale gelmektedir, örneğin Lenovo LOQ 16'dasense'teki "Planet9" oyun merkezine tıklamak, can sıkıcı, çeşitli "meşru ilgi" düğmelerini içeren bir çerez isteğini tetikler; kullanıcılar vazgeçmek isterse bunların hepsinin ayrı ayrı seçilmesi gerekir.
En iyi kıyaslama sonuçları için çoğunlukla Turbo modunu kullandık, ancak diğer modlar hakkında da bilgi veriyoruz.

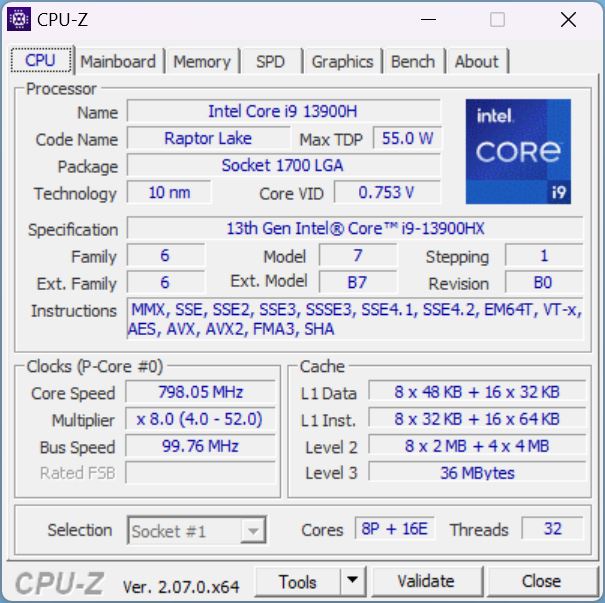
İşlemci
Intel Core i9-13900HXraptor-Lake serisinden gerçek bir üst düzey CPU'dur. 8 P-çekirdeği (hyperthreading dahil) ve 16 E-çekirdeği ile 32 iş parçacığı çalıştırabilir. Çekirdekleri 1,6 (E çekirdekleri) ve 2,2 GHz (P çekirdekleri) temel saate sahiptir ve 3,9 - 5,4 GHz tek çekirdekli turboya ulaşır.
Cinebench R15 döngüsünde (CB15 döngüsü), Helios güçlü ve her şeyden önce tutarlı bir performans sunar, ancakMSI GE78HX ve Alienware m18 R1 biraz daha güçlü bir CPU ile (i9-13950HX und i9-13980HXaynı CPU'ya sahip HP Omen, HX CPU yerine H CPU'lu rakip cihazlar gibi Helios'tan kolayca daha iyi performans gösterir.
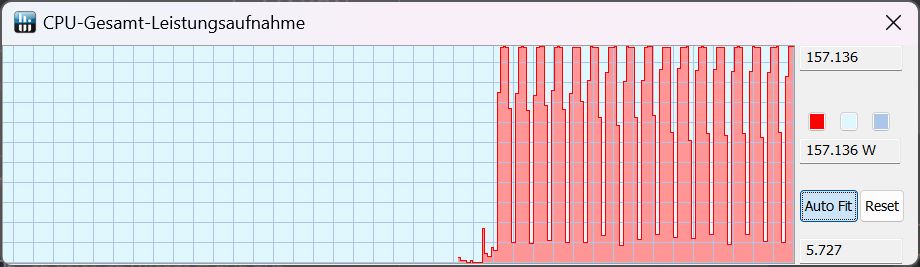
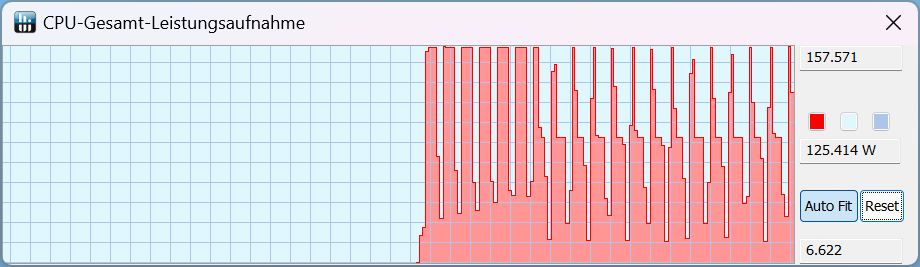
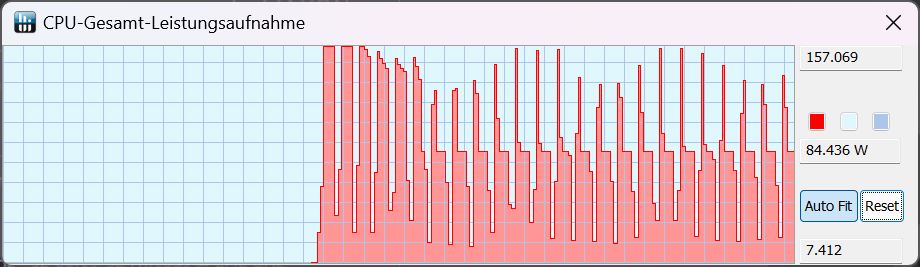
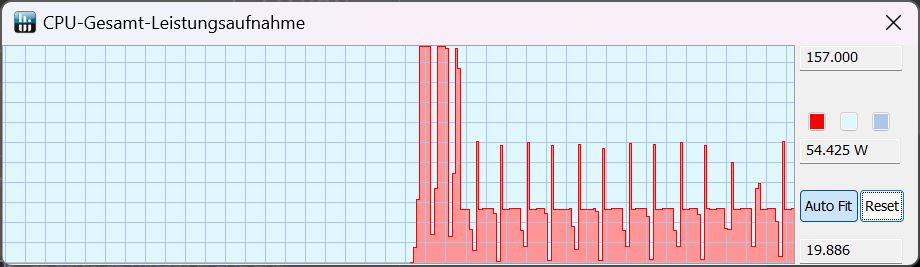
CB15 döngüleri sırasında her bir performans modu için elde edilen tüm TDP değerlerini aşağıdaki tabloda listeledik. Pil modunda, Dengeli ve Eko modları arasında seçim yapabilirsiniz. Her iki modda da TDP hala 25 W ve CB15 %70'in üzerinde bir düşüşle yaklaşık 1.300 puan alıyor! Yani iki mod arasında gerçek bir performans farkı yok.
| TDP/Performans modu | Turbo | Performans | Dengeli | Sessiz | Batarya Dengeli | Batarya Sessiz |
|---|---|---|---|---|---|---|
| CB15'in başlangıcı | 157 | 157 | 157 | 157 | 25 | 25 |
| Daha sonraki CB15 tarihi | 157 | 125 | 85 | 25 | 55 | 25 |
Cinebench R15 Multi Sustained Load
Cinebench R23: Multi Core | Single Core
Cinebench R20: CPU (Multi Core) | CPU (Single Core)
Cinebench R15: CPU Multi 64Bit | CPU Single 64Bit
Blender: v2.79 BMW27 CPU
7-Zip 18.03: 7z b 4 | 7z b 4 -mmt1
Geekbench 5.5: Multi-Core | Single-Core
HWBOT x265 Benchmark v2.2: 4k Preset
LibreOffice : 20 Documents To PDF
R Benchmark 2.5: Overall mean
| CPU Performance rating | |
| MSI GE78HX 13VH-070US | |
| Alienware m18 R1 | |
| Acer Predator Helios 18 N23Q2 | |
| Razer Blade 18 RTX 4070 | |
| Ortalama Intel Core i9-13900HX | |
| HP Omen 17-ck2097ng | |
| Sınıf ortalaması Gaming | |
| Asus ROG Strix G18 G814JI | |
| Cinebench R23 / Multi Core | |
| MSI GE78HX 13VH-070US | |
| Alienware m18 R1 | |
| Acer Predator Helios 18 N23Q2 | |
| Razer Blade 18 RTX 4070 | |
| Ortalama Intel Core i9-13900HX (24270 - 32623, n=23) | |
| HP Omen 17-ck2097ng | |
| Sınıf ortalaması Gaming (10488 - 40970, n=110, son 2 yıl) | |
| Asus ROG Strix G18 G814JI | |
| Cinebench R23 / Single Core | |
| MSI GE78HX 13VH-070US | |
| Alienware m18 R1 | |
| HP Omen 17-ck2097ng | |
| Acer Predator Helios 18 N23Q2 | |
| Razer Blade 18 RTX 4070 | |
| Ortalama Intel Core i9-13900HX (1867 - 2105, n=20) | |
| Sınıf ortalaması Gaming (1166 - 2356, n=110, son 2 yıl) | |
| Asus ROG Strix G18 G814JI | |
| Cinebench R20 / CPU (Multi Core) | |
| MSI GE78HX 13VH-070US | |
| Alienware m18 R1 | |
| Acer Predator Helios 18 N23Q2 | |
| Razer Blade 18 RTX 4070 | |
| Ortalama Intel Core i9-13900HX (9152 - 12541, n=21) | |
| HP Omen 17-ck2097ng | |
| Sınıf ortalaması Gaming (4029 - 16108, n=109, son 2 yıl) | |
| Asus ROG Strix G18 G814JI | |
| Cinebench R20 / CPU (Single Core) | |
| Alienware m18 R1 | |
| HP Omen 17-ck2097ng | |
| Acer Predator Helios 18 N23Q2 | |
| MSI GE78HX 13VH-070US | |
| Razer Blade 18 RTX 4070 | |
| Ortalama Intel Core i9-13900HX (722 - 810, n=21) | |
| Sınıf ortalaması Gaming (442 - 895, n=109, son 2 yıl) | |
| Asus ROG Strix G18 G814JI | |
| Cinebench R15 / CPU Multi 64Bit | |
| MSI GE78HX 13VH-070US | |
| Alienware m18 R1 | |
| Acer Predator Helios 18 N23Q2 | |
| Ortalama Intel Core i9-13900HX (3913 - 4970, n=22) | |
| Razer Blade 18 RTX 4070 | |
| HP Omen 17-ck2097ng | |
| Sınıf ortalaması Gaming (1578 - 6271, n=108, son 2 yıl) | |
| Asus ROG Strix G18 G814JI | |
| Cinebench R15 / CPU Single 64Bit | |
| MSI GE78HX 13VH-070US | |
| Alienware m18 R1 | |
| HP Omen 17-ck2097ng | |
| Razer Blade 18 RTX 4070 | |
| Acer Predator Helios 18 N23Q2 | |
| Sınıf ortalaması Gaming (188.8 - 343, n=109, son 2 yıl) | |
| Ortalama Intel Core i9-13900HX (247 - 304, n=22) | |
| Asus ROG Strix G18 G814JI | |
| Blender / v2.79 BMW27 CPU | |
| Asus ROG Strix G18 G814JI | |
| HP Omen 17-ck2097ng | |
| Sınıf ortalaması Gaming (80 - 330, n=107, son 2 yıl) | |
| Ortalama Intel Core i9-13900HX (101 - 153, n=22) | |
| Razer Blade 18 RTX 4070 | |
| Acer Predator Helios 18 N23Q2 | |
| MSI GE78HX 13VH-070US | |
| Alienware m18 R1 | |
| 7-Zip 18.03 / 7z b 4 | |
| Alienware m18 R1 | |
| MSI GE78HX 13VH-070US | |
| Acer Predator Helios 18 N23Q2 | |
| Razer Blade 18 RTX 4070 | |
| Ortalama Intel Core i9-13900HX (90675 - 127283, n=21) | |
| HP Omen 17-ck2097ng | |
| Sınıf ortalaması Gaming (33491 - 148086, n=108, son 2 yıl) | |
| Asus ROG Strix G18 G814JI | |
| 7-Zip 18.03 / 7z b 4 -mmt1 | |
| MSI GE78HX 13VH-070US | |
| Acer Predator Helios 18 N23Q2 | |
| HP Omen 17-ck2097ng | |
| Alienware m18 R1 | |
| Razer Blade 18 RTX 4070 | |
| Ortalama Intel Core i9-13900HX (6340 - 7177, n=21) | |
| Sınıf ortalaması Gaming (4199 - 7436, n=108, son 2 yıl) | |
| Asus ROG Strix G18 G814JI | |
| Geekbench 5.5 / Multi-Core | |
| Alienware m18 R1 | |
| MSI GE78HX 13VH-070US | |
| Acer Predator Helios 18 N23Q2 | |
| HP Omen 17-ck2097ng | |
| Razer Blade 18 RTX 4070 | |
| Ortalama Intel Core i9-13900HX (17614 - 21075, n=22) | |
| Sınıf ortalaması Gaming (6460 - 27010, n=108, son 2 yıl) | |
| Asus ROG Strix G18 G814JI | |
| Geekbench 5.5 / Single-Core | |
| MSI GE78HX 13VH-070US | |
| HP Omen 17-ck2097ng | |
| Alienware m18 R1 | |
| Acer Predator Helios 18 N23Q2 | |
| Sınıf ortalaması Gaming (986 - 2474, n=108, son 2 yıl) | |
| Razer Blade 18 RTX 4070 | |
| Ortalama Intel Core i9-13900HX (1345 - 2093, n=22) | |
| Asus ROG Strix G18 G814JI | |
| HWBOT x265 Benchmark v2.2 / 4k Preset | |
| MSI GE78HX 13VH-070US | |
| Alienware m18 R1 | |
| Razer Blade 18 RTX 4070 | |
| Acer Predator Helios 18 N23Q2 | |
| Ortalama Intel Core i9-13900HX (23.5 - 34.4, n=22) | |
| Sınıf ortalaması Gaming (11.5 - 44.3, n=108, son 2 yıl) | |
| HP Omen 17-ck2097ng | |
| Asus ROG Strix G18 G814JI | |
| LibreOffice / 20 Documents To PDF | |
| Asus ROG Strix G18 G814JI | |
| Acer Predator Helios 18 N23Q2 | |
| Sınıf ortalaması Gaming (19 - 88.8, n=108, son 2 yıl) | |
| MSI GE78HX 13VH-070US | |
| Alienware m18 R1 | |
| HP Omen 17-ck2097ng | |
| Razer Blade 18 RTX 4070 | |
| Ortalama Intel Core i9-13900HX (32.8 - 51.1, n=21) | |
| R Benchmark 2.5 / Overall mean | |
| Asus ROG Strix G18 G814JI | |
| Sınıf ortalaması Gaming (0.3439 - 0.759, n=109, son 2 yıl) | |
| Ortalama Intel Core i9-13900HX (0.375 - 0.4564, n=22) | |
| Acer Predator Helios 18 N23Q2 | |
| Razer Blade 18 RTX 4070 | |
| Alienware m18 R1 | |
| HP Omen 17-ck2097ng | |
| MSI GE78HX 13VH-070US | |
* ... daha küçük daha iyidir
AIDA64: FP32 Ray-Trace | FPU Julia | CPU SHA3 | CPU Queen | FPU SinJulia | FPU Mandel | CPU AES | CPU ZLib | FP64 Ray-Trace | CPU PhotoWorxx
| Performance rating | |
| Alienware m18 R1 | |
| Acer Predator Helios 18 N23Q2 | |
| MSI GE78HX 13VH-070US | |
| Razer Blade 18 RTX 4070 | |
| Sınıf ortalaması Gaming | |
| Ortalama Intel Core i9-13900HX | |
| HP Omen 17-ck2097ng | |
| Asus ROG Strix G18 G814JI | |
| AIDA64 / FP32 Ray-Trace | |
| Sınıf ortalaması Gaming (10227 - 85542, n=107, son 2 yıl) | |
| Alienware m18 R1 | |
| MSI GE78HX 13VH-070US | |
| Acer Predator Helios 18 N23Q2 | |
| Razer Blade 18 RTX 4070 | |
| Ortalama Intel Core i9-13900HX (17589 - 27615, n=22) | |
| Asus ROG Strix G18 G814JI | |
| HP Omen 17-ck2097ng | |
| AIDA64 / FPU Julia | |
| Alienware m18 R1 | |
| MSI GE78HX 13VH-070US | |
| Acer Predator Helios 18 N23Q2 | |
| Sınıf ortalaması Gaming (51376 - 238426, n=107, son 2 yıl) | |
| Razer Blade 18 RTX 4070 | |
| Ortalama Intel Core i9-13900HX (88686 - 137015, n=22) | |
| Asus ROG Strix G18 G814JI | |
| HP Omen 17-ck2097ng | |
| AIDA64 / CPU SHA3 | |
| Alienware m18 R1 | |
| MSI GE78HX 13VH-070US | |
| Acer Predator Helios 18 N23Q2 | |
| Razer Blade 18 RTX 4070 | |
| Sınıf ortalaması Gaming (2180 - 9817, n=107, son 2 yıl) | |
| Ortalama Intel Core i9-13900HX (4362 - 7029, n=22) | |
| Asus ROG Strix G18 G814JI | |
| HP Omen 17-ck2097ng | |
| AIDA64 / CPU Queen | |
| Alienware m18 R1 | |
| MSI GE78HX 13VH-070US | |
| Razer Blade 18 RTX 4070 | |
| Acer Predator Helios 18 N23Q2 | |
| HP Omen 17-ck2097ng | |
| Ortalama Intel Core i9-13900HX (125644 - 141385, n=22) | |
| Sınıf ortalaması Gaming (49785 - 173351, n=94, son 2 yıl) | |
| Asus ROG Strix G18 G814JI | |
| AIDA64 / FPU SinJulia | |
| MSI GE78HX 13VH-070US | |
| Alienware m18 R1 | |
| Razer Blade 18 RTX 4070 | |
| Acer Predator Helios 18 N23Q2 | |
| Ortalama Intel Core i9-13900HX (12334 - 17179, n=22) | |
| Sınıf ortalaması Gaming (4424 - 33636, n=107, son 2 yıl) | |
| HP Omen 17-ck2097ng | |
| Asus ROG Strix G18 G814JI | |
| AIDA64 / FPU Mandel | |
| Alienware m18 R1 | |
| Sınıf ortalaması Gaming (25115 - 128721, n=107, son 2 yıl) | |
| MSI GE78HX 13VH-070US | |
| Acer Predator Helios 18 N23Q2 | |
| Razer Blade 18 RTX 4070 | |
| Ortalama Intel Core i9-13900HX (43850 - 69202, n=22) | |
| Asus ROG Strix G18 G814JI | |
| HP Omen 17-ck2097ng | |
| AIDA64 / CPU AES | |
| Acer Predator Helios 18 N23Q2 | |
| Ortalama Intel Core i9-13900HX (89413 - 237881, n=22) | |
| Alienware m18 R1 | |
| MSI GE78HX 13VH-070US | |
| Razer Blade 18 RTX 4070 | |
| Sınıf ortalaması Gaming (39258 - 247074, n=107, son 2 yıl) | |
| HP Omen 17-ck2097ng | |
| Asus ROG Strix G18 G814JI | |
| AIDA64 / CPU ZLib | |
| MSI GE78HX 13VH-070US | |
| Alienware m18 R1 | |
| Acer Predator Helios 18 N23Q2 | |
| Razer Blade 18 RTX 4070 | |
| Ortalama Intel Core i9-13900HX (1284 - 1958, n=22) | |
| Sınıf ortalaması Gaming (574 - 2531, n=107, son 2 yıl) | |
| HP Omen 17-ck2097ng | |
| Asus ROG Strix G18 G814JI | |
| AIDA64 / FP64 Ray-Trace | |
| Sınıf ortalaması Gaming (5509 - 45446, n=107, son 2 yıl) | |
| Alienware m18 R1 | |
| MSI GE78HX 13VH-070US | |
| Acer Predator Helios 18 N23Q2 | |
| Razer Blade 18 RTX 4070 | |
| Ortalama Intel Core i9-13900HX (9481 - 15279, n=22) | |
| Asus ROG Strix G18 G814JI | |
| HP Omen 17-ck2097ng | |
| AIDA64 / CPU PhotoWorxx | |
| Alienware m18 R1 | |
| HP Omen 17-ck2097ng | |
| Acer Predator Helios 18 N23Q2 | |
| MSI GE78HX 13VH-070US | |
| Razer Blade 18 RTX 4070 | |
| Ortalama Intel Core i9-13900HX (42994 - 51994, n=22) | |
| Sınıf ortalaması Gaming (12271 - 89891, n=107, son 2 yıl) | |
| Asus ROG Strix G18 G814JI | |
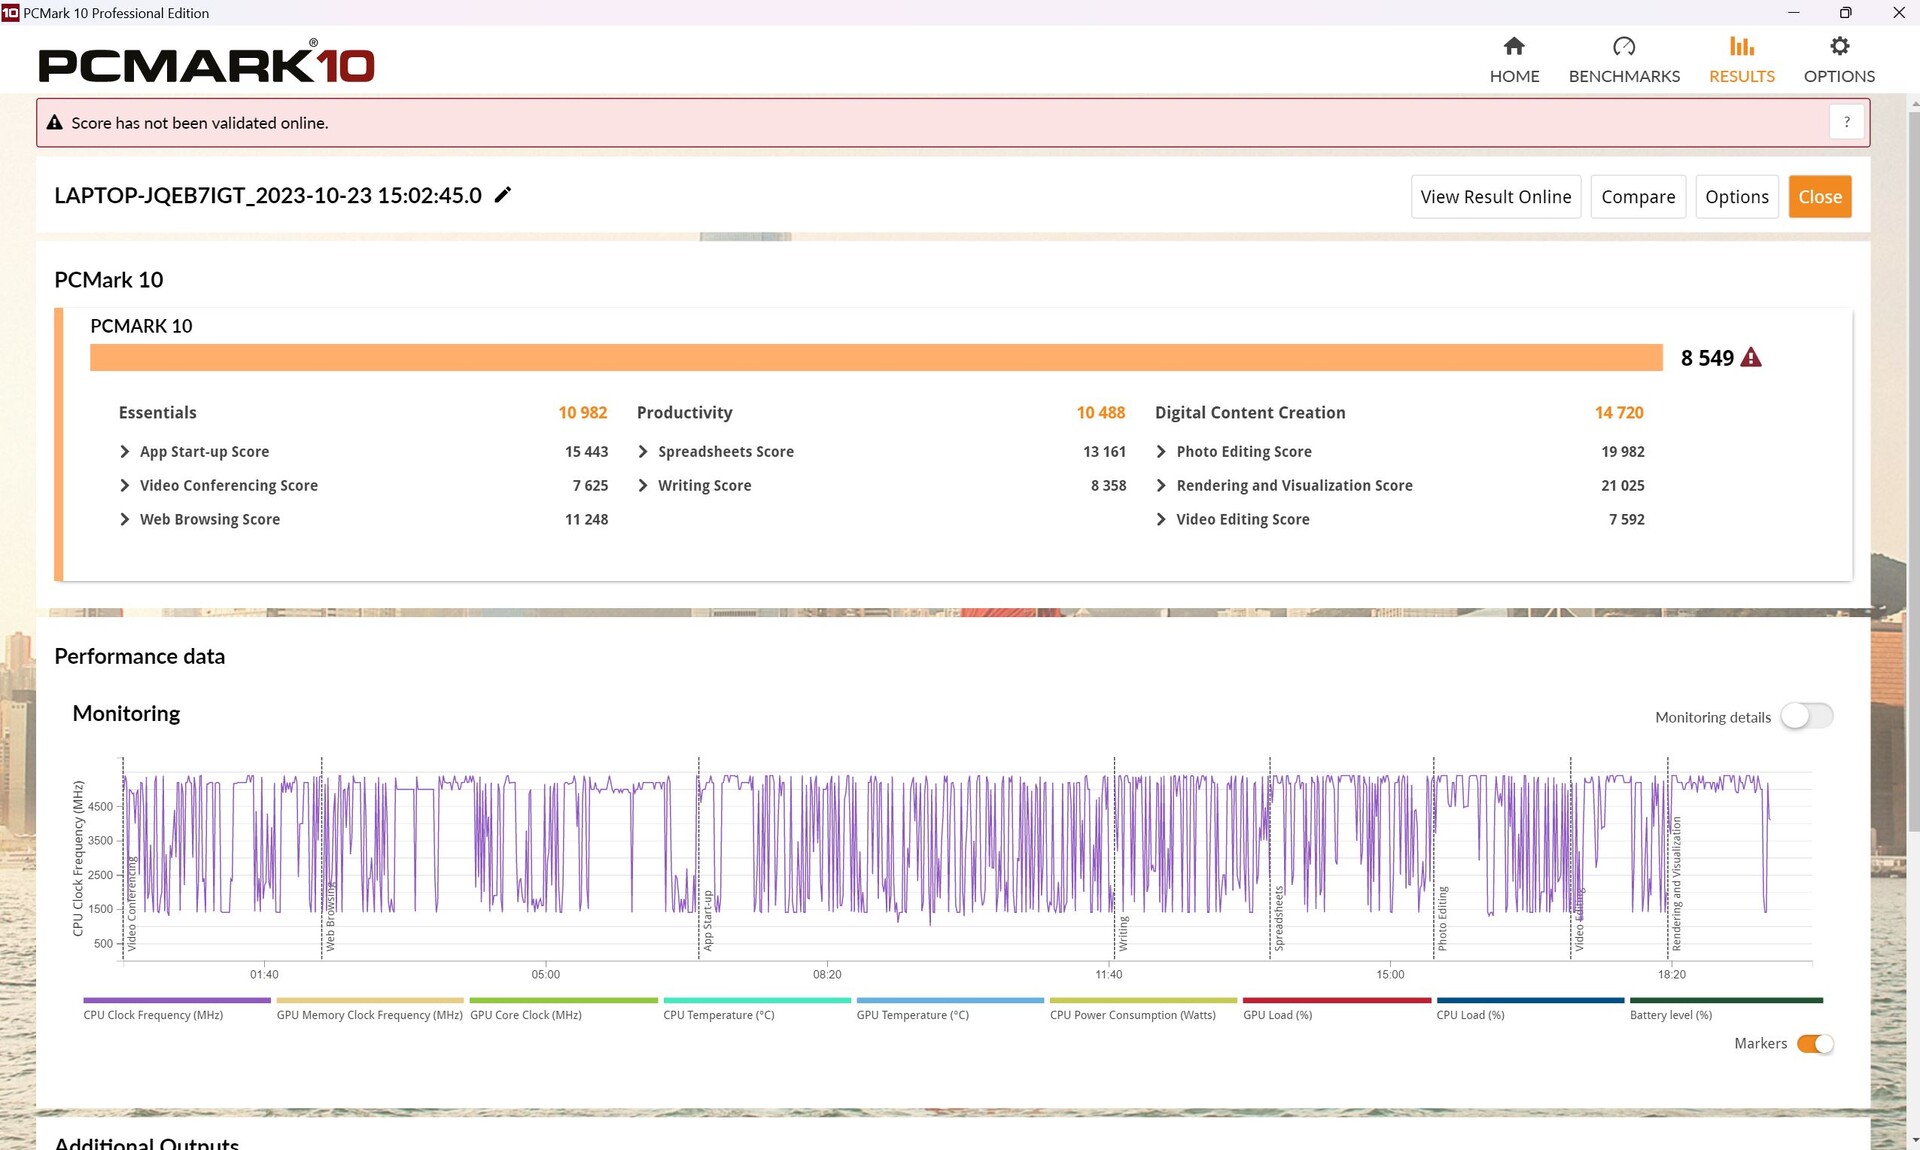
Sistem Performansı
Tıpkı CPU performansında olduğu gibi, Helios sadece marjinal olarakMSI GE78HX ve Alienware m18 R1.
Çoğu uygulama öznel olarak sorunsuz hissettiriyor. Yalnızca grafik geçişi (Advanced Optimus) dizüstü bilgisayar için sürekli bir sorun. Bu ve gecikme sorunları hakkında daha fazla bilgiyi ilerleyen bölümlerde bulabilirsiniz.
CrossMark: Overall | Productivity | Creativity | Responsiveness
| PCMark 10 / Score | |
| MSI GE78HX 13VH-070US | |
| Alienware m18 R1 | |
| Acer Predator Helios 18 N23Q2 | |
| Sınıf ortalaması Gaming (5828 - 11574, n=95, son 2 yıl) | |
| Ortalama Intel Core i9-13900HX, NVIDIA GeForce RTX 4080 Laptop GPU (7609 - 8549, n=3) | |
| Razer Blade 18 RTX 4070 | |
| HP Omen 17-ck2097ng | |
| Asus ROG Strix G18 G814JI | |
| PCMark 10 / Essentials | |
| HP Omen 17-ck2097ng | |
| Razer Blade 18 RTX 4070 | |
| Ortalama Intel Core i9-13900HX, NVIDIA GeForce RTX 4080 Laptop GPU (10982 - 11824, n=3) | |
| MSI GE78HX 13VH-070US | |
| Alienware m18 R1 | |
| Acer Predator Helios 18 N23Q2 | |
| Sınıf ortalaması Gaming (8810 - 12600, n=99, son 2 yıl) | |
| Asus ROG Strix G18 G814JI | |
| PCMark 10 / Productivity | |
| Sınıf ortalaması Gaming (6845 - 21327, n=97, son 2 yıl) | |
| Acer Predator Helios 18 N23Q2 | |
| MSI GE78HX 13VH-070US | |
| Ortalama Intel Core i9-13900HX, NVIDIA GeForce RTX 4080 Laptop GPU (9976 - 10788, n=3) | |
| Alienware m18 R1 | |
| HP Omen 17-ck2097ng | |
| Razer Blade 18 RTX 4070 | |
| Asus ROG Strix G18 G814JI | |
| PCMark 10 / Digital Content Creation | |
| Alienware m18 R1 | |
| MSI GE78HX 13VH-070US | |
| Acer Predator Helios 18 N23Q2 | |
| Sınıf ortalaması Gaming (7602 - 19657, n=97, son 2 yıl) | |
| Ortalama Intel Core i9-13900HX, NVIDIA GeForce RTX 4080 Laptop GPU (10135 - 14720, n=3) | |
| Razer Blade 18 RTX 4070 | |
| HP Omen 17-ck2097ng | |
| Asus ROG Strix G18 G814JI | |
| CrossMark / Overall | |
| Acer Predator Helios 18 N23Q2 | |
| Alienware m18 R1 | |
| Razer Blade 18 RTX 4070 | |
| Ortalama Intel Core i9-13900HX, NVIDIA GeForce RTX 4080 Laptop GPU (1991 - 2194, n=2) | |
| HP Omen 17-ck2097ng | |
| Sınıf ortalaması Gaming (1366 - 2409, n=96, son 2 yıl) | |
| MSI GE78HX 13VH-070US | |
| CrossMark / Productivity | |
| Acer Predator Helios 18 N23Q2 | |
| Alienware m18 R1 | |
| Razer Blade 18 RTX 4070 | |
| Ortalama Intel Core i9-13900HX, NVIDIA GeForce RTX 4080 Laptop GPU (1828 - 2059, n=2) | |
| Sınıf ortalaması Gaming (1386 - 2254, n=96, son 2 yıl) | |
| MSI GE78HX 13VH-070US | |
| HP Omen 17-ck2097ng | |
| CrossMark / Creativity | |
| Alienware m18 R1 | |
| Acer Predator Helios 18 N23Q2 | |
| Razer Blade 18 RTX 4070 | |
| Ortalama Intel Core i9-13900HX, NVIDIA GeForce RTX 4080 Laptop GPU (2239 - 2411, n=2) | |
| HP Omen 17-ck2097ng | |
| Sınıf ortalaması Gaming (1343 - 2729, n=96, son 2 yıl) | |
| MSI GE78HX 13VH-070US | |
| CrossMark / Responsiveness | |
| Acer Predator Helios 18 N23Q2 | |
| Alienware m18 R1 | |
| Ortalama Intel Core i9-13900HX, NVIDIA GeForce RTX 4080 Laptop GPU (1808 - 1998, n=2) | |
| Razer Blade 18 RTX 4070 | |
| HP Omen 17-ck2097ng | |
| Sınıf ortalaması Gaming (1226 - 2334, n=96, son 2 yıl) | |
| MSI GE78HX 13VH-070US | |
| PCMark 10 Score | 8549 puan | |
Yardım | ||
| AIDA64 / Memory Copy | |
| Alienware m18 R1 | |
| Acer Predator Helios 18 N23Q2 | |
| HP Omen 17-ck2097ng | |
| MSI GE78HX 13VH-070US | |
| Razer Blade 18 RTX 4070 | |
| Ortalama Intel Core i9-13900HX (67716 - 79193, n=22) | |
| Sınıf ortalaması Gaming (21750 - 129946, n=107, son 2 yıl) | |
| Asus ROG Strix G18 G814JI | |
| AIDA64 / Memory Read | |
| Alienware m18 R1 | |
| Acer Predator Helios 18 N23Q2 | |
| HP Omen 17-ck2097ng | |
| Razer Blade 18 RTX 4070 | |
| MSI GE78HX 13VH-070US | |
| Ortalama Intel Core i9-13900HX (73998 - 88462, n=22) | |
| Sınıf ortalaması Gaming (22956 - 118858, n=107, son 2 yıl) | |
| Asus ROG Strix G18 G814JI | |
| AIDA64 / Memory Write | |
| Alienware m18 R1 | |
| HP Omen 17-ck2097ng | |
| MSI GE78HX 13VH-070US | |
| Sınıf ortalaması Gaming (22297 - 135096, n=107, son 2 yıl) | |
| Razer Blade 18 RTX 4070 | |
| Acer Predator Helios 18 N23Q2 | |
| Ortalama Intel Core i9-13900HX (65472 - 77045, n=22) | |
| Asus ROG Strix G18 G814JI | |
| AIDA64 / Memory Latency | |
| Sınıf ortalaması Gaming (75.3 - 259, n=107, son 2 yıl) | |
| Ortalama Intel Core i9-13900HX (75.3 - 91.1, n=22) | |
| HP Omen 17-ck2097ng | |
| Razer Blade 18 RTX 4070 | |
| MSI GE78HX 13VH-070US | |
| Asus ROG Strix G18 G814JI | |
| Acer Predator Helios 18 N23Q2 | |
| Alienware m18 R1 | |
* ... daha küçük daha iyidir
DPC gecikme süresi
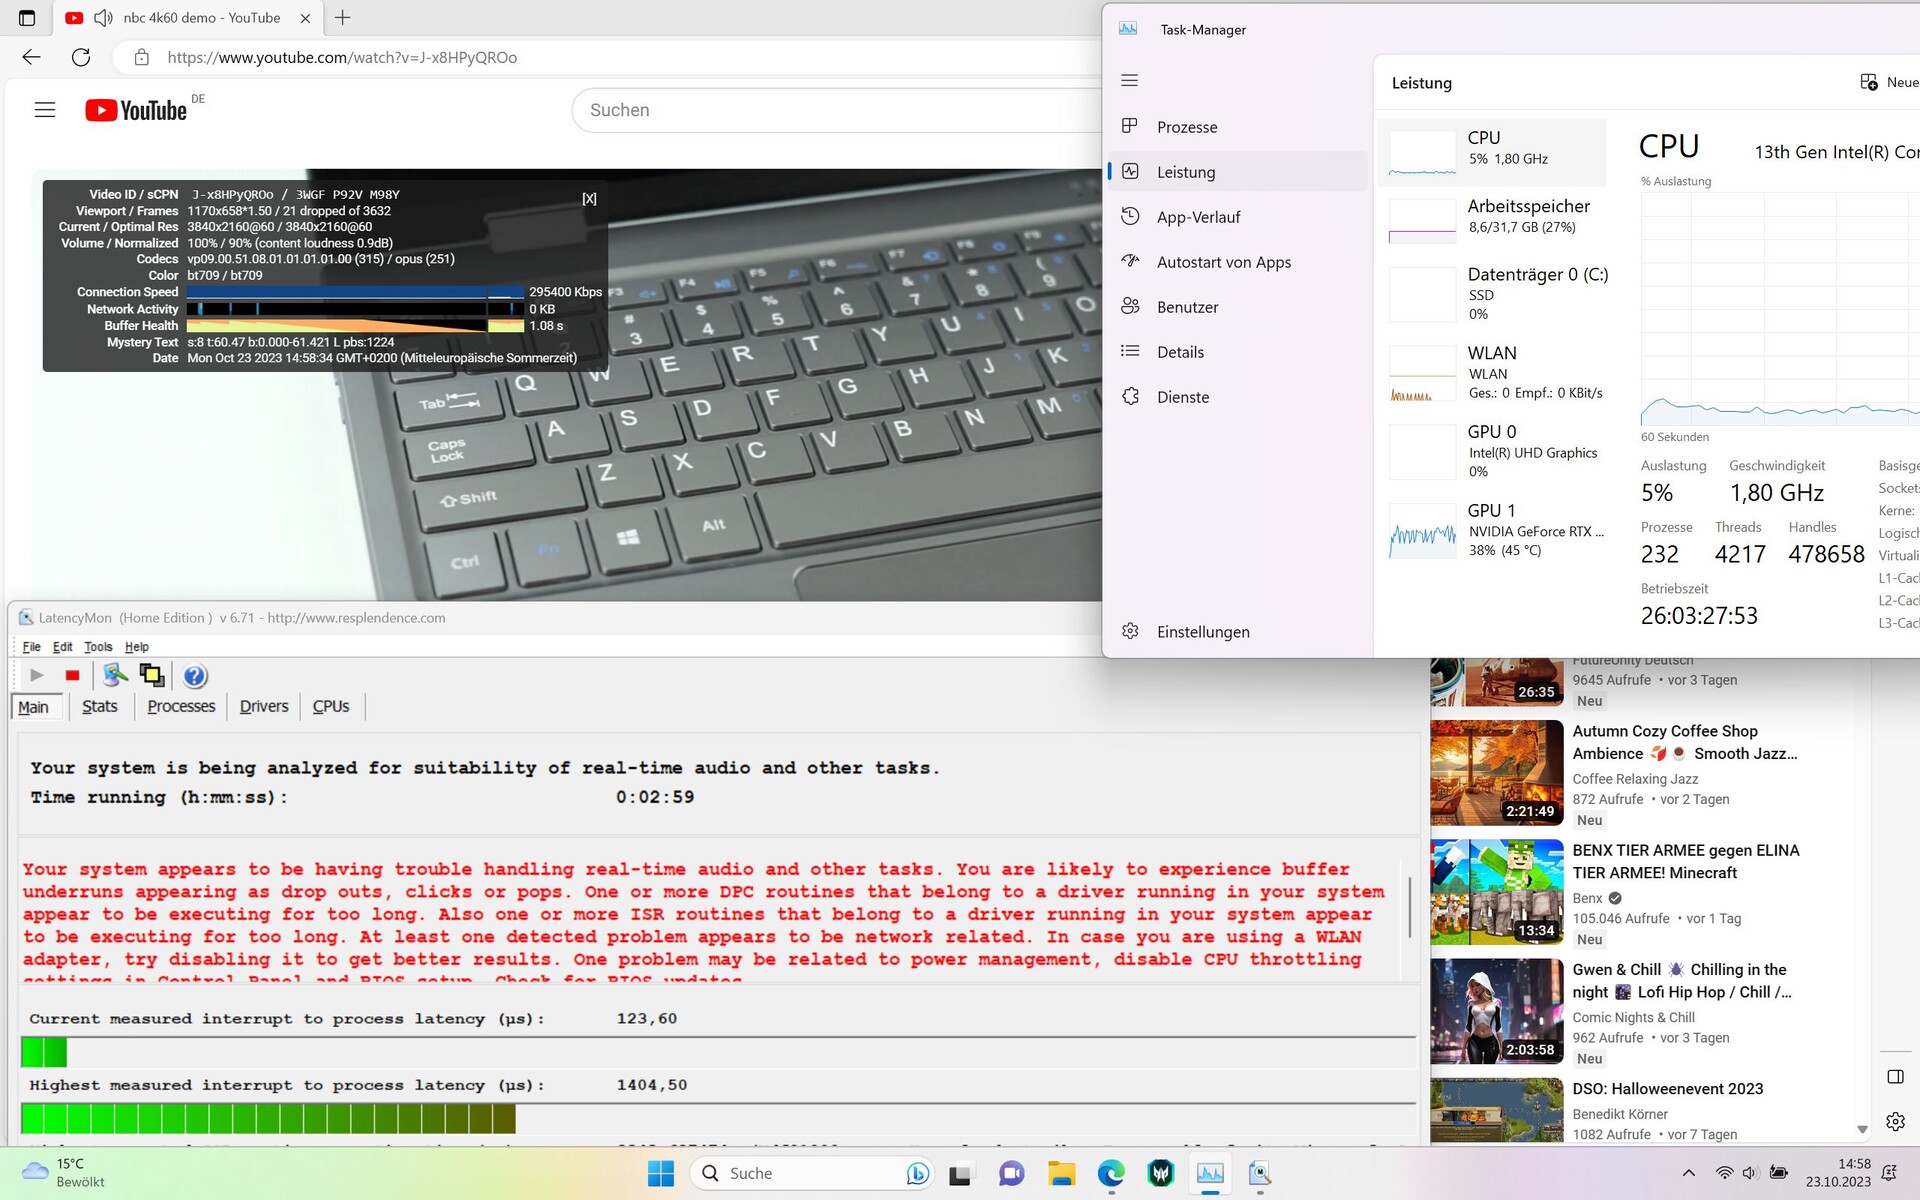
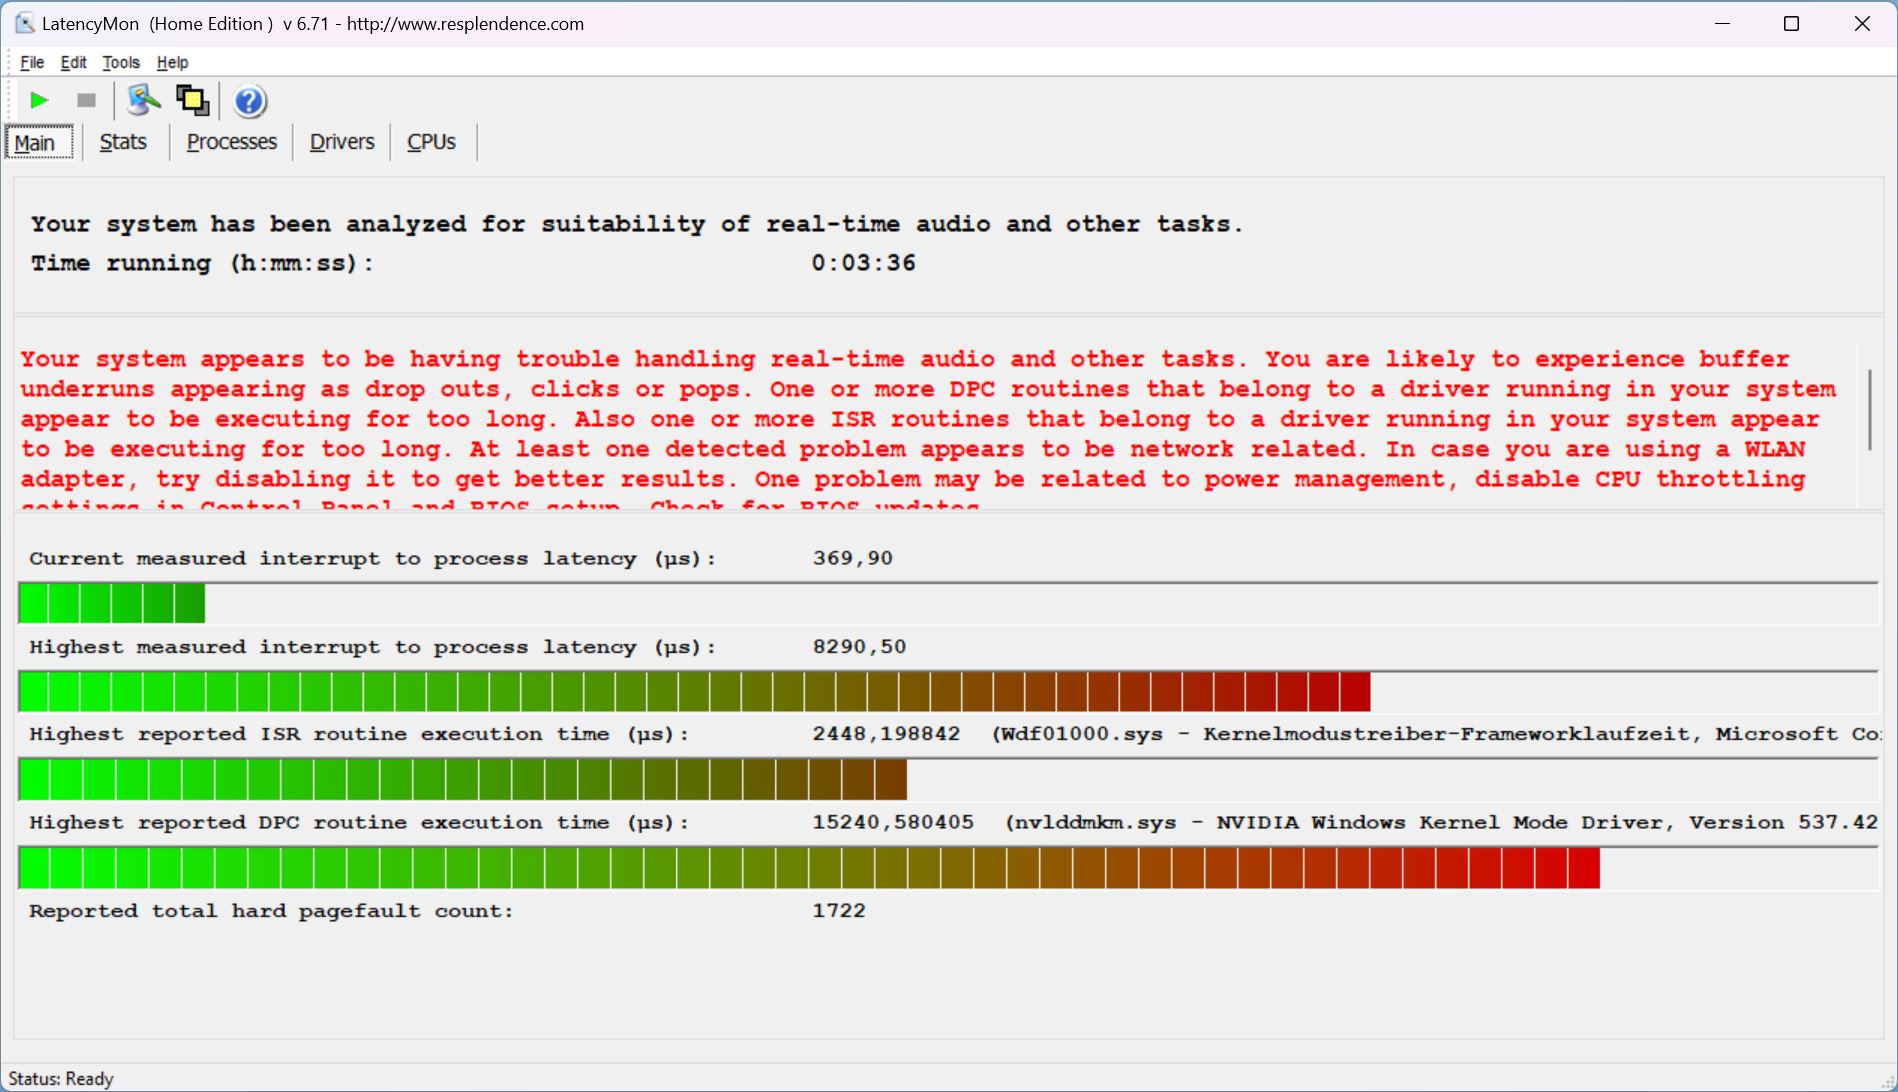
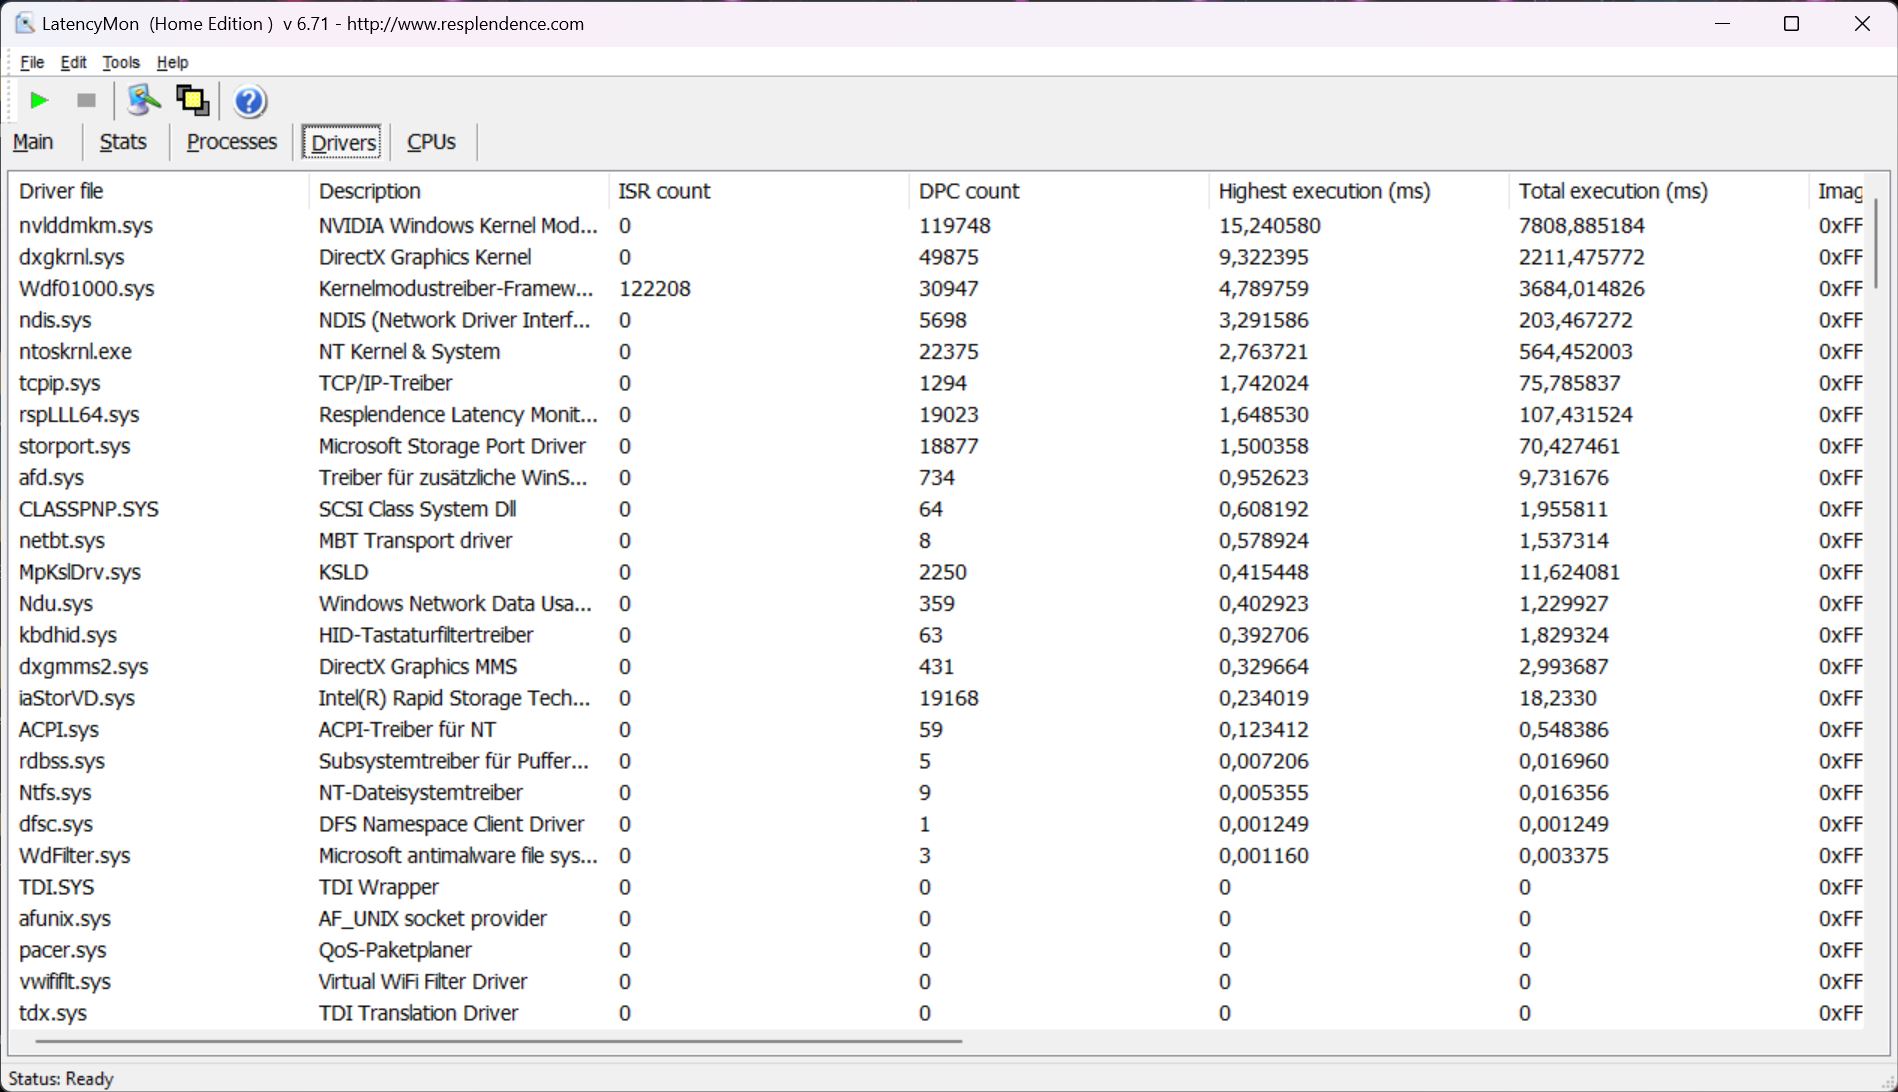
Mevcut sürücü durumunda, LatencyMon'un ortaya koyduğu gibi dizüstü bilgisayarda ciddi gecikme sorunları var. Dengeli modda, tarayıcı açılırken veya bir masaüstü penceresi hareket ettirilirken gecikmeler meydana geliyor. Bunlar web sitemizde birden fazla tarayıcı sekmesi açarken artıyor ve 4K/60 fps YouTube videosu oynatırken bile tam 18 kare atlanıyor. Acer'ın burada sürücüyü geliştirmesi gerekiyor. Ancak rakip dizüstü bilgisayarlarda da benzer sorunlar var.
| DPC Latencies / LatencyMon - interrupt to process latency (max), Web, Youtube, Prime95 | |
| Acer Predator Helios 18 N23Q2 | |
| MSI GE78HX 13VH-070US | |
| Alienware m18 R1 | |
| HP Omen 17-ck2097ng | |
| Razer Blade 18 RTX 4070 | |
| Asus ROG Strix G18 G814JI | |
* ... daha küçük daha iyidir
Depolama Cihazları
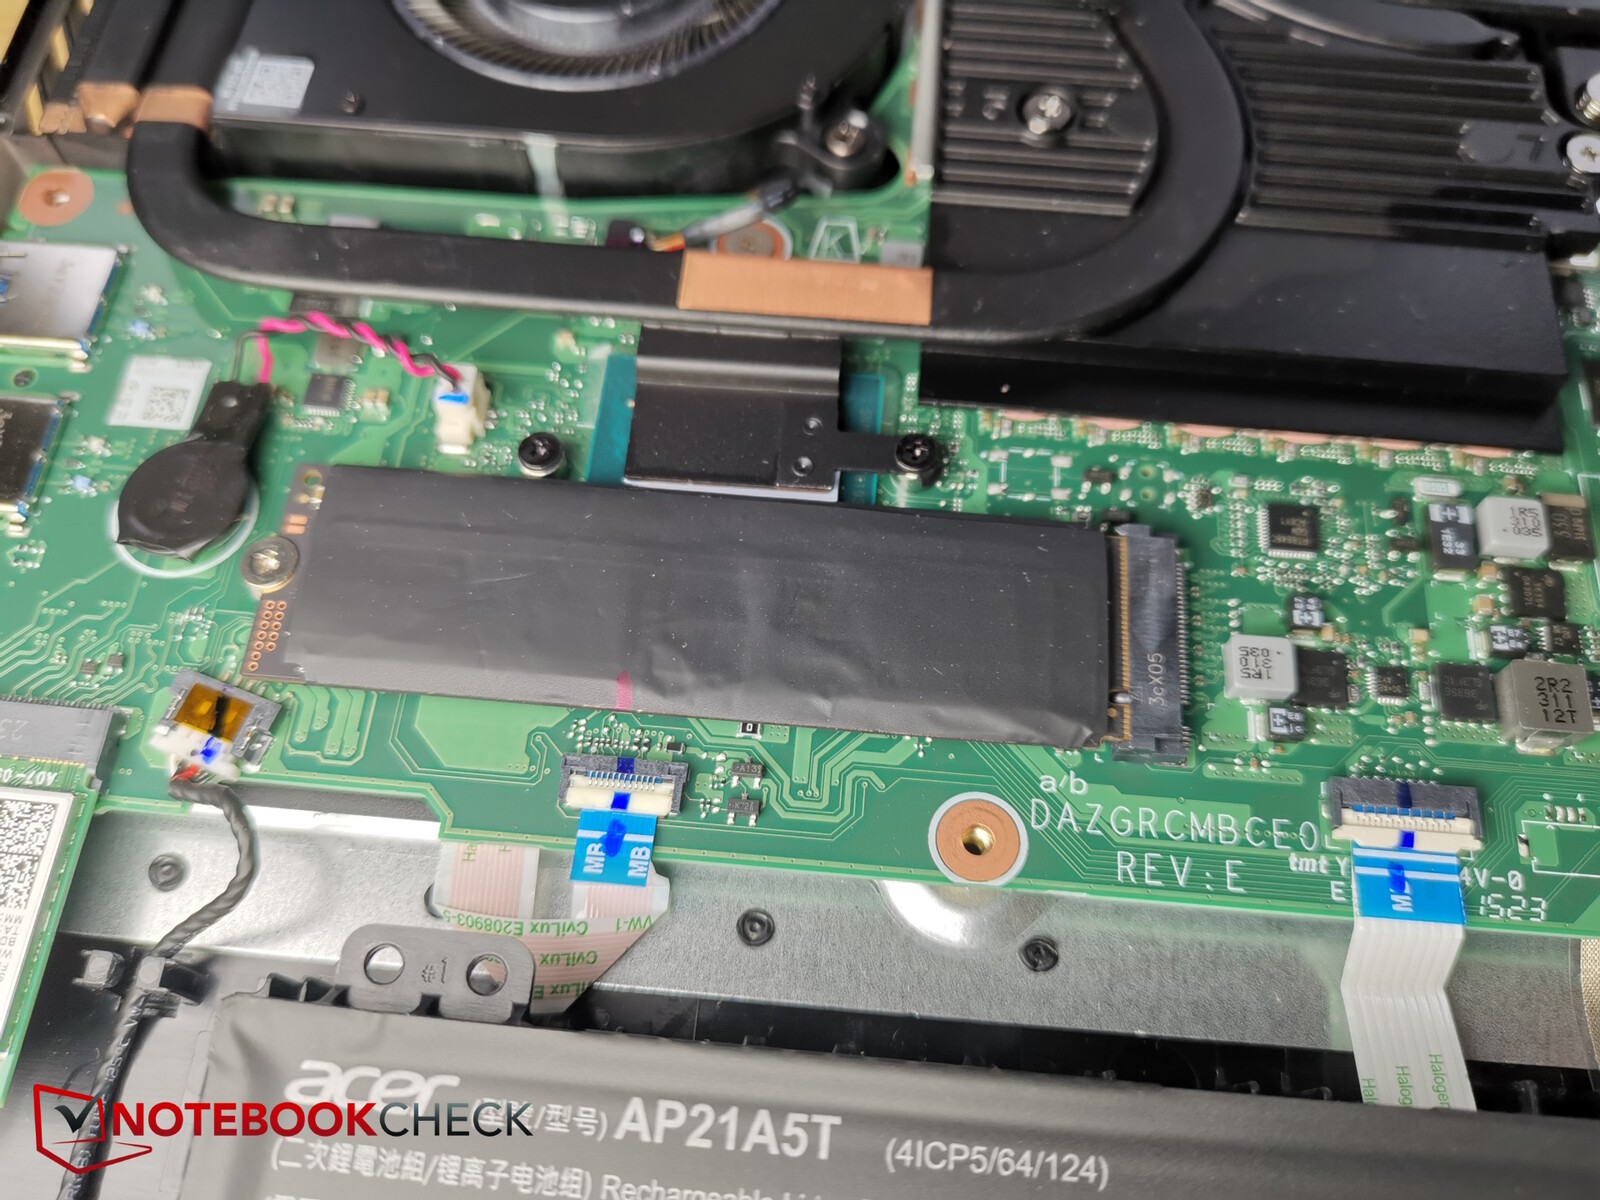
Helios 18, ürün yelpazemizdeki en hızlı SSD'lerden biri olan Samsung PM9A1 ile donatılmıştır.SSD en iyi listesine yazık ki bu Predator'da iyi bir performans göstermiyor ve aşağıdaki grafikte de görüldüğü gibi performansı çok hızlı bir şekilde düşüyor. Aynı testi daha sonra tekrarladık ve aynı sonucu aldık çünkü hızlı ve güçlü düşüş bizi şaşırttı. Benzer SSD azaltma davranışı, daha önce incelenen Predator Helios 16.

* ... daha küçük daha iyidir
Sustained Read Performance: DiskSpd Read Loop, Queue Depth 8
Grafikkarte
Bu RTX 40802023'ün başlarında tanıtılan üst düzey bir GPU'dur. Helios 18'de, Dynamic Boost dahil olmak üzere maksimum 175 W çekebilir.
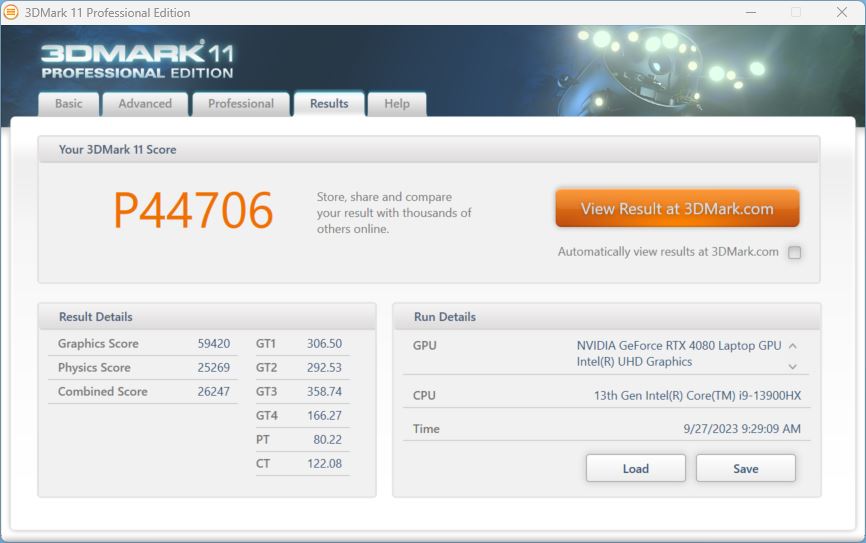
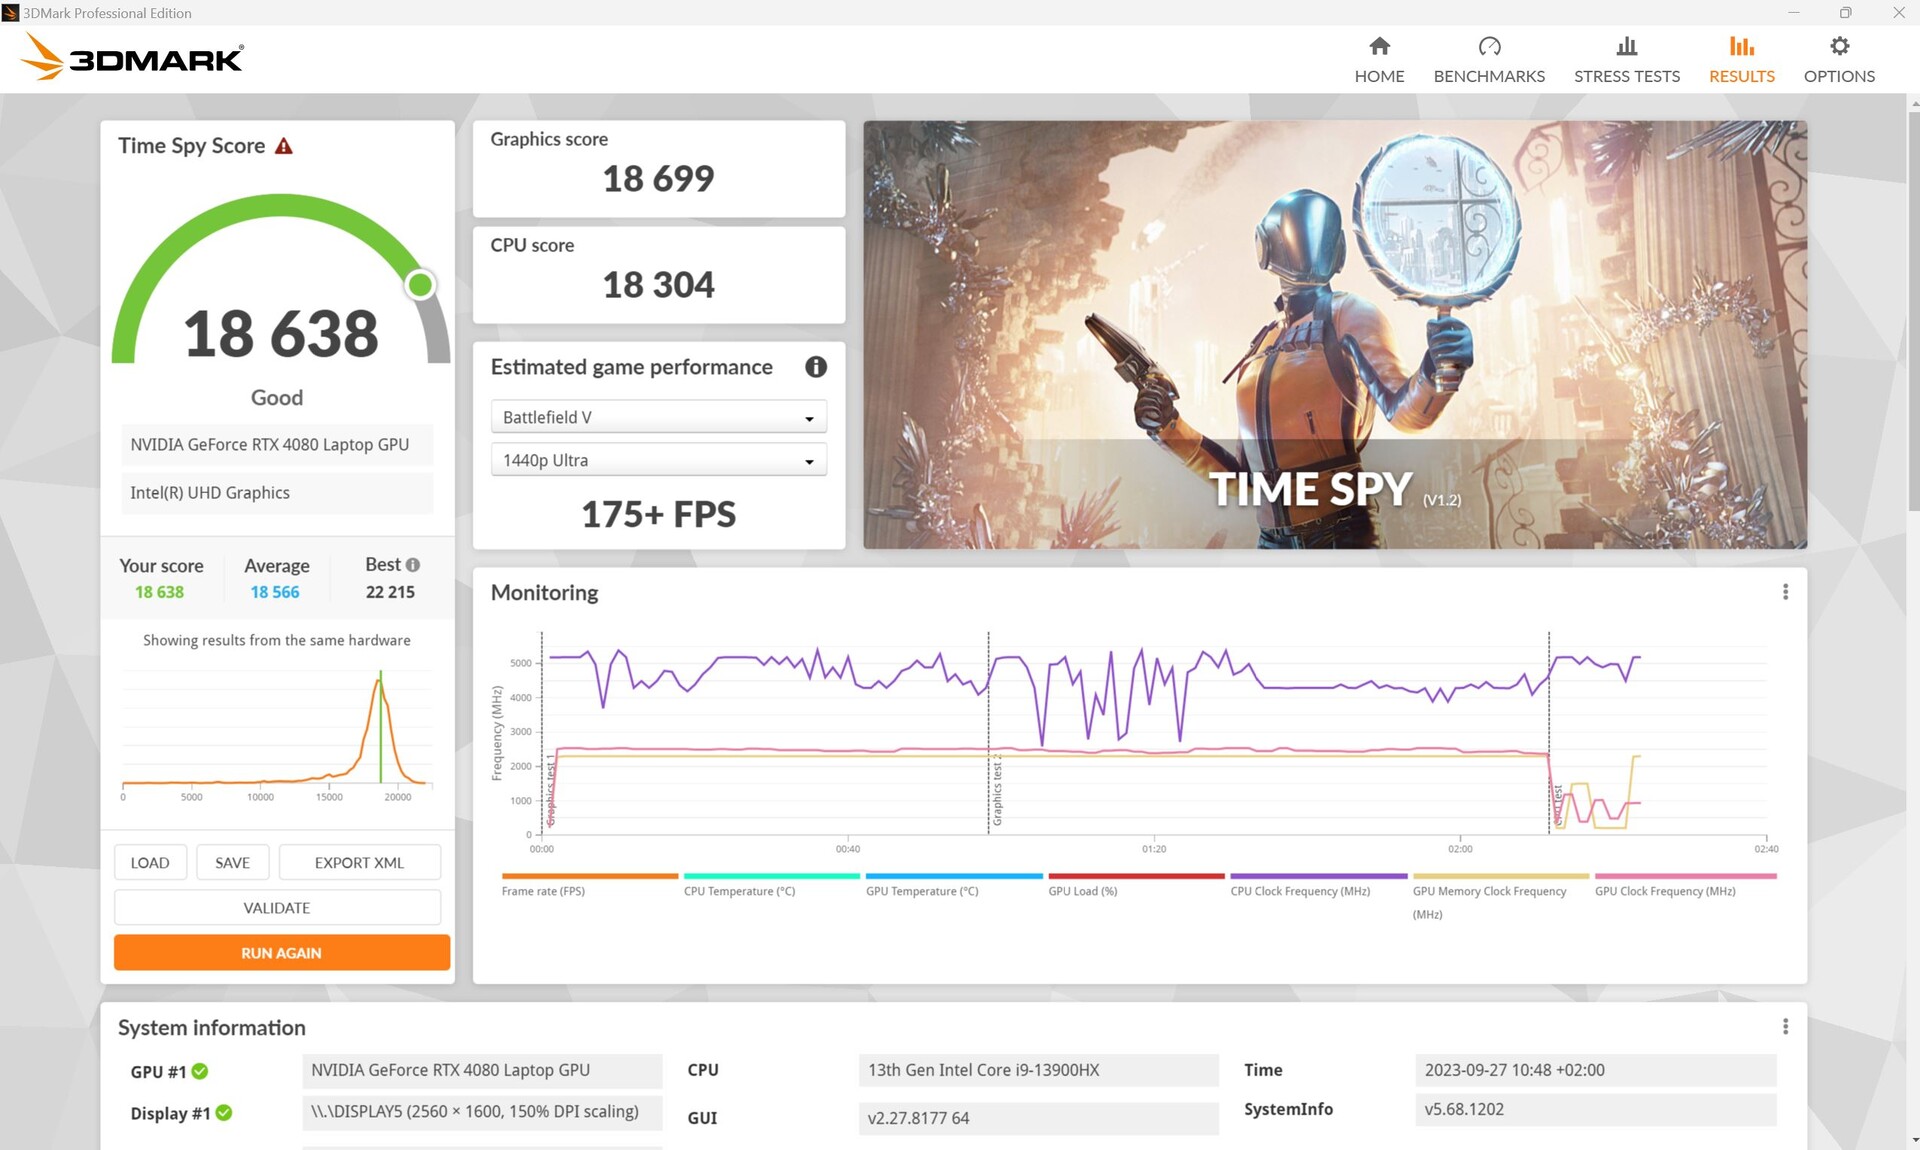
Sentetik 3DMark testlerinde, Helios az bir farkla MSI GE78HXilk kez aynı GPU ile. RTX 4080'in performansı, veritabanımızdaki aynı GPU'ya sahip tüm dizüstü bilgisayarların ortalamasından yaklaşık %10 daha yüksektir.
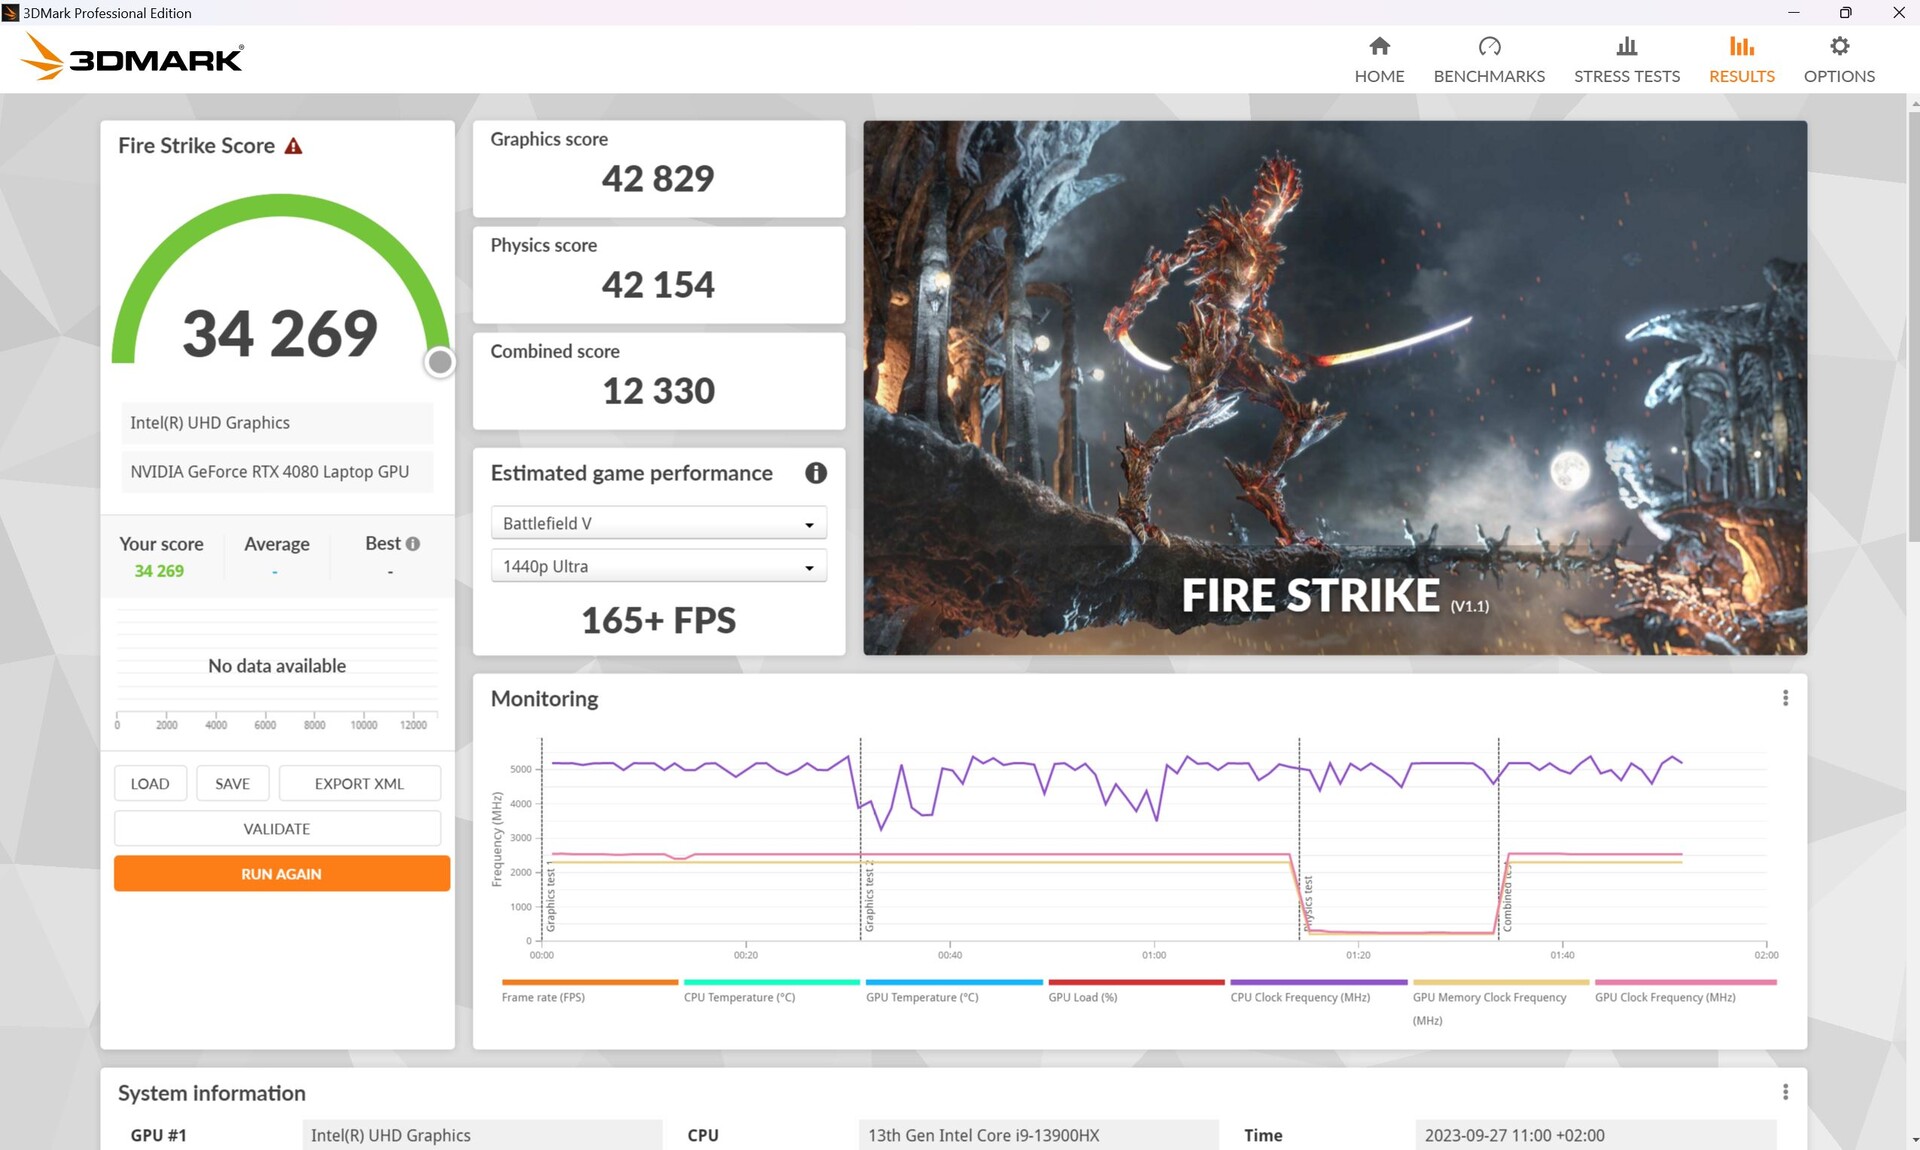
Predator, soketten uzakta Fire Strike adresinde yüzde 84'lük bir düşüşle 6.897 grafik puanı almayı başarıyor!
| 3DMark Performance rating - Percent | |
| Alienware m18 R1 -1! | |
| Acer Predator Helios 18 N23Q2 | |
| MSI GE78HX 13VH-070US -1! | |
| Ortalama NVIDIA GeForce RTX 4080 Laptop GPU | |
| HP Omen 17-ck2097ng | |
| Sınıf ortalaması Gaming | |
| Asus ROG Strix G18 G814JI | |
| Razer Blade 18 RTX 4070 -1! | |
| 3DMark 11 Performance | 44706 puan | |
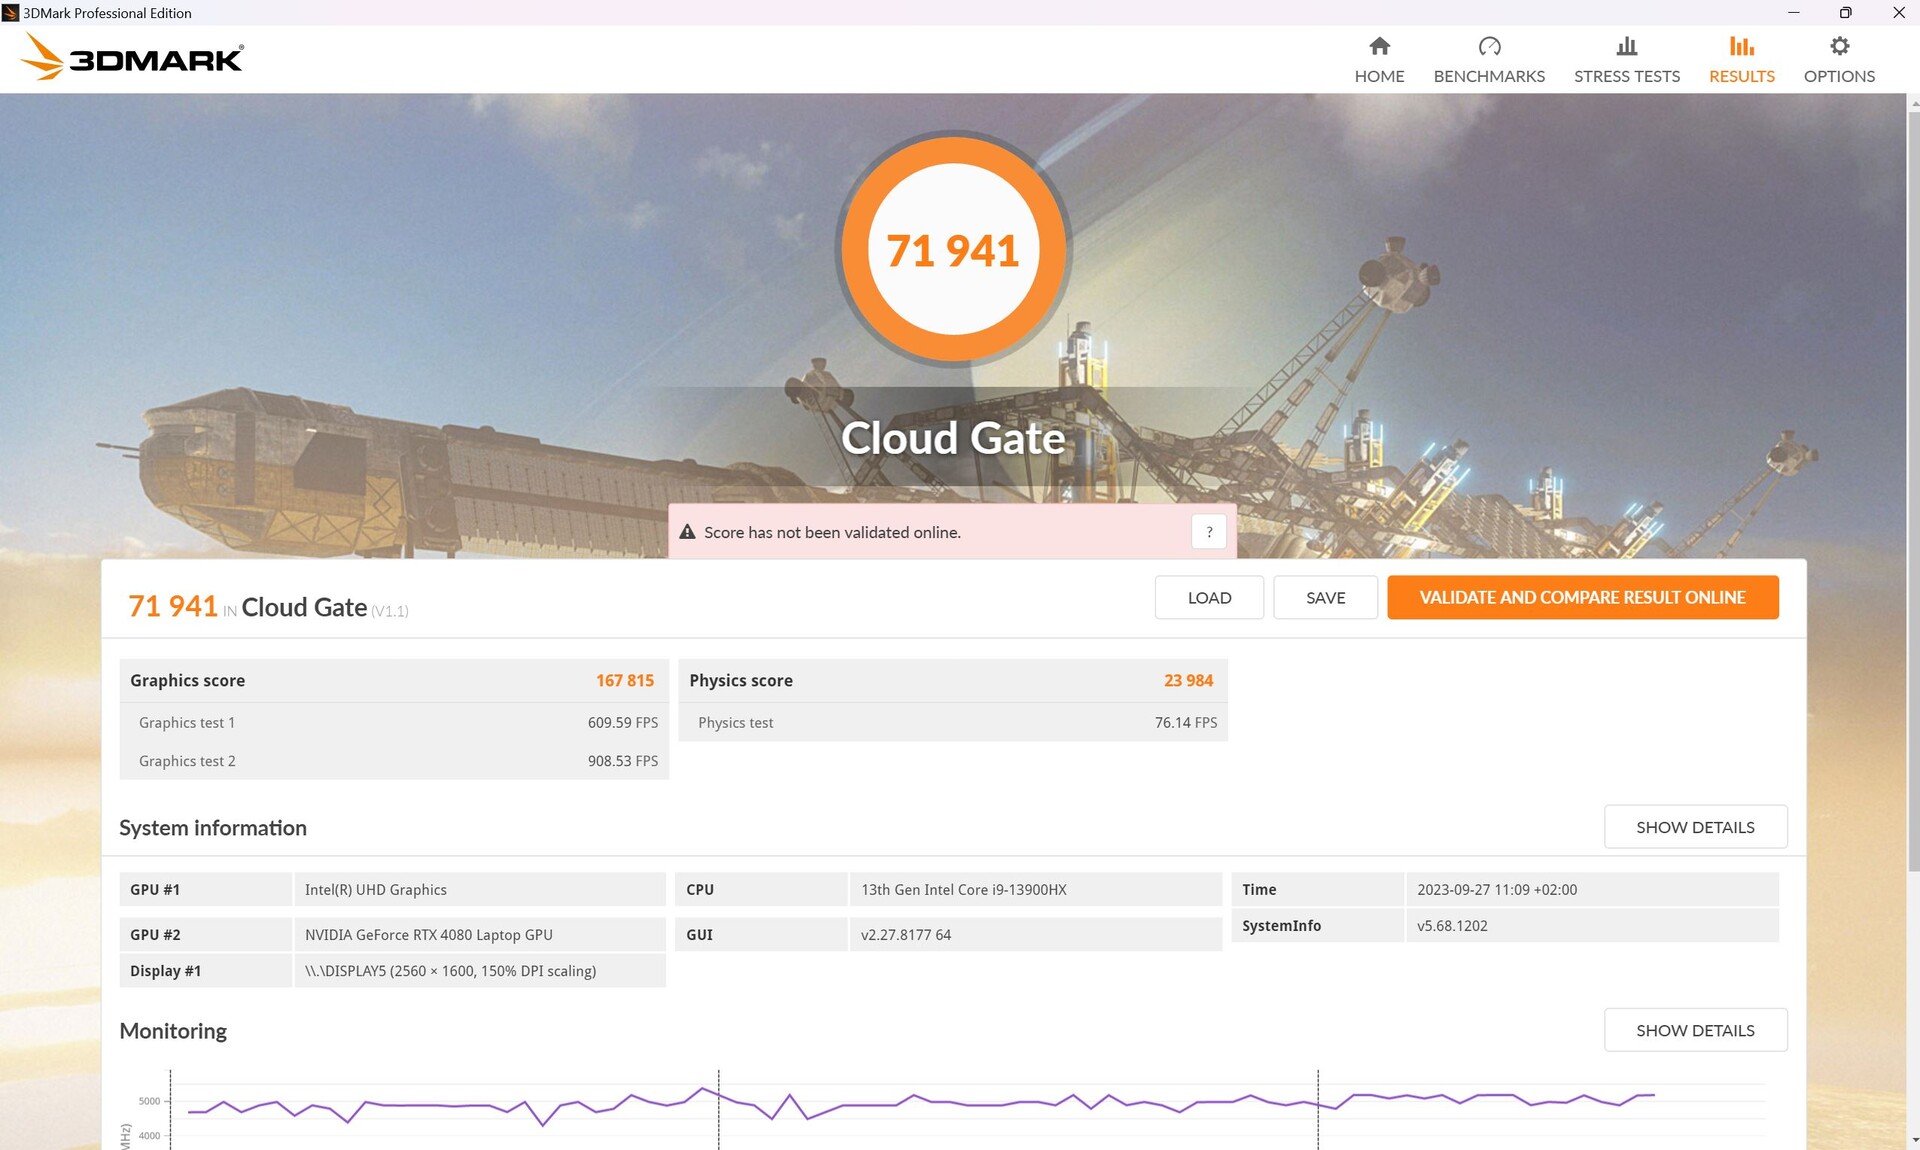
| 3DMark Cloud Gate Standard Score | 71941 puan | |
| 3DMark Fire Strike Score | 34269 puan | |
| 3DMark Time Spy Score | 18638 puan | |
Yardım | ||
* ... daha küçük daha iyidir
Oyun Performansı
Helios 18 aynı zamandaMSI GE78HX ancak her ikisi de sonuçta eşit seviyededir. Alienware m18 R1 ile RTX 4090 yaklaşık %7 daha hızlıdır; fark en fazla Witcher 3 'da +%22'dir ve Predator'ümüz GTA V'te bile liderdir.
| Performance rating - Percent | |
| Alienware m18 R1 | |
| Acer Predator Helios 18 N23Q2 | |
| HP Omen 17-ck2097ng | |
| Sınıf ortalaması Gaming | |
| MSI GE78HX 13VH-070US | |
| Razer Blade 18 RTX 4070 | |
| Asus ROG Strix G18 G814JI | |
| The Witcher 3 - 1920x1080 Ultra Graphics & Postprocessing (HBAO+) | |
| Alienware m18 R1 | |
| Sınıf ortalaması Gaming (95 - 240, n=7, son 2 yıl) | |
| MSI GE78HX 13VH-070US | |
| Acer Predator Helios 18 N23Q2 | |
| HP Omen 17-ck2097ng | |
| Asus ROG Strix G18 G814JI | |
| Razer Blade 18 RTX 4070 | |
| GTA V - 1920x1080 Highest AA:4xMSAA + FX AF:16x | |
| Acer Predator Helios 18 N23Q2 | |
| Alienware m18 R1 | |
| Sınıf ortalaması Gaming (48.3 - 186.9, n=97, son 2 yıl) | |
| Razer Blade 18 RTX 4070 | |
| HP Omen 17-ck2097ng | |
| Asus ROG Strix G18 G814JI | |
| MSI GE78HX 13VH-070US | |
| Final Fantasy XV Benchmark - 1920x1080 High Quality | |
| Alienware m18 R1 | |
| Acer Predator Helios 18 N23Q2 | |
| MSI GE78HX 13VH-070US | |
| Sınıf ortalaması Gaming (41 - 215, n=98, son 2 yıl) | |
| HP Omen 17-ck2097ng | |
| Asus ROG Strix G18 G814JI | |
| Razer Blade 18 RTX 4070 | |
| Strange Brigade - 1920x1080 ultra AA:ultra AF:16 | |
| Alienware m18 R1 | |
| Acer Predator Helios 18 N23Q2 | |
| Sınıf ortalaması Gaming (76.3 - 456, n=88, son 2 yıl) | |
| HP Omen 17-ck2097ng | |
| MSI GE78HX 13VH-070US | |
| Asus ROG Strix G18 G814JI | |
| Razer Blade 18 RTX 4070 | |
| Dota 2 Reborn - 1920x1080 ultra (3/3) best looking | |
| Alienware m18 R1 | |
| Acer Predator Helios 18 N23Q2 | |
| Razer Blade 18 RTX 4070 | |
| HP Omen 17-ck2097ng | |
| Asus ROG Strix G18 G814JI | |
| Sınıf ortalaması Gaming (84.8 - 248, n=110, son 2 yıl) | |
| MSI GE78HX 13VH-070US | |
| X-Plane 11.11 - 1920x1080 high (fps_test=3) | |
| Alienware m18 R1 | |
| Acer Predator Helios 18 N23Q2 | |
| Razer Blade 18 RTX 4070 | |
| MSI GE78HX 13VH-070US | |
| HP Omen 17-ck2097ng | |
| Asus ROG Strix G18 G814JI | |
| Sınıf ortalaması Gaming (52.1 - 143.5, n=113, son 2 yıl) | |
| The Witcher 3 | |
| 1920x1080 High Graphics & Postprocessing (Nvidia HairWorks Off) | |
| Alienware m18 R1 | |
| MSI GE78HX 13VH-070US | |
| Acer Predator Helios 18 N23Q2 | |
| Ortalama NVIDIA GeForce RTX 4080 Laptop GPU (246 - 385, n=14) | |
| HP Omen 17-ck2097ng | |
| Sınıf ortalaması Gaming (181 - 341, n=2, son 2 yıl) | |
| Razer Blade 18 RTX 4070 | |
| Asus ROG Strix G18 G814JI | |
| 1920x1080 Ultra Graphics & Postprocessing (HBAO+) | |
| Alienware m18 R1 | |
| Sınıf ortalaması Gaming (95 - 240, n=7, son 2 yıl) | |
| MSI GE78HX 13VH-070US | |
| Acer Predator Helios 18 N23Q2 | |
| Ortalama NVIDIA GeForce RTX 4080 Laptop GPU (130.4 - 186.1, n=20) | |
| HP Omen 17-ck2097ng | |
| Asus ROG Strix G18 G814JI | |
| Razer Blade 18 RTX 4070 | |
| Hogwarts Legacy | |
| 1920x1080 Ultra Preset AA:High T | |
| Ortalama NVIDIA GeForce RTX 4080 Laptop GPU (108 - 131, n=3) | |
| Sınıf ortalaması Gaming (n=1son 2 yıl) | |
| Acer Predator Helios 18 N23Q2 | |
| Asus ROG Strix G18 G814JI | |
| 2560x1440 Ultra Preset AA:High T | |
| Sınıf ortalaması Gaming (n=1son 2 yıl) | |
| Ortalama NVIDIA GeForce RTX 4080 Laptop GPU (76 - 102, n=3) | |
| Acer Predator Helios 18 N23Q2 | |
| Asus ROG Strix G18 G814JI | |
| 1920x1080 Ultra Preset + Full Ray Tracing AA:High T | |
| Acer Predator Helios 18 N23Q2 | |
| Ortalama NVIDIA GeForce RTX 4080 Laptop GPU (53 - 66, n=2) | |
| Asus ROG Strix G18 G814JI | |
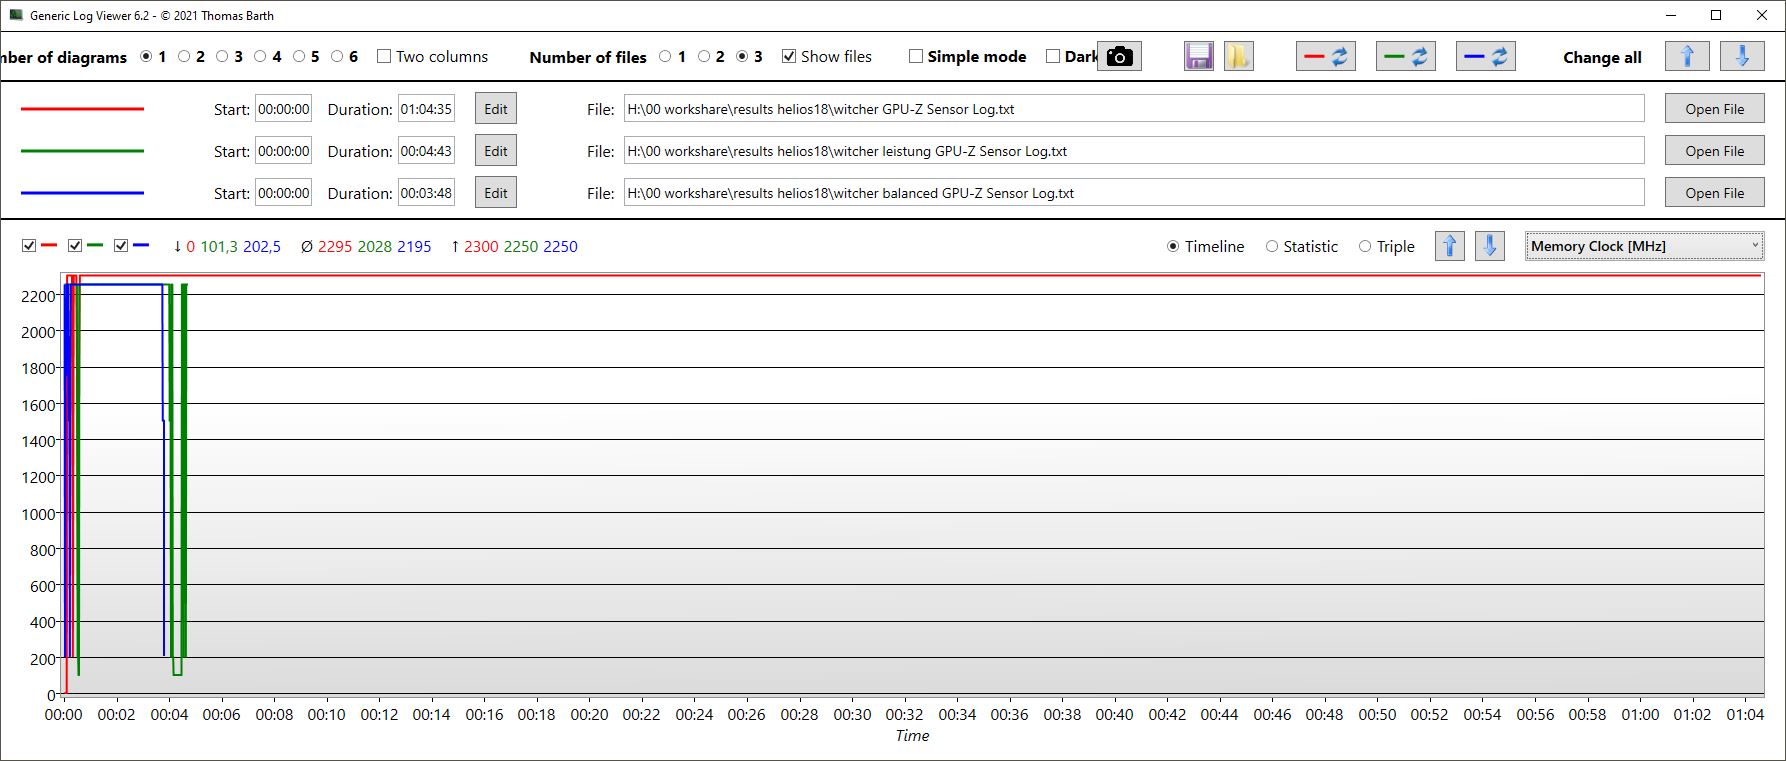
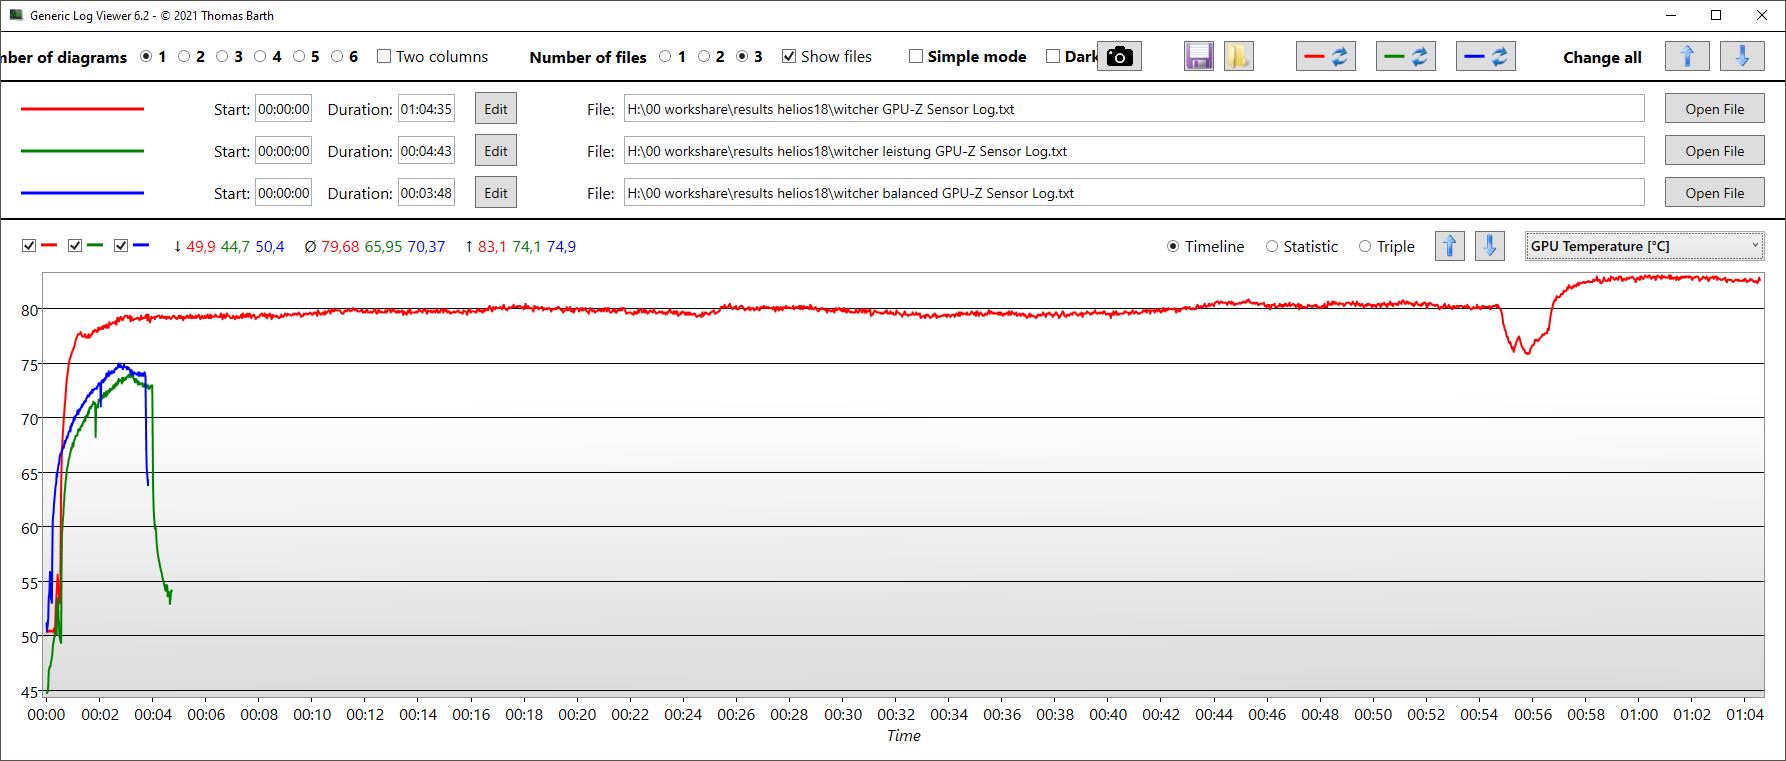
Bir saat boyunca Witcher 3 adresindeki kare hızı oldukça sabit kalıyor; hafif dalgalanmalar oyundaki tipik gece/gündüz döngüsünden kaynaklanıyor.
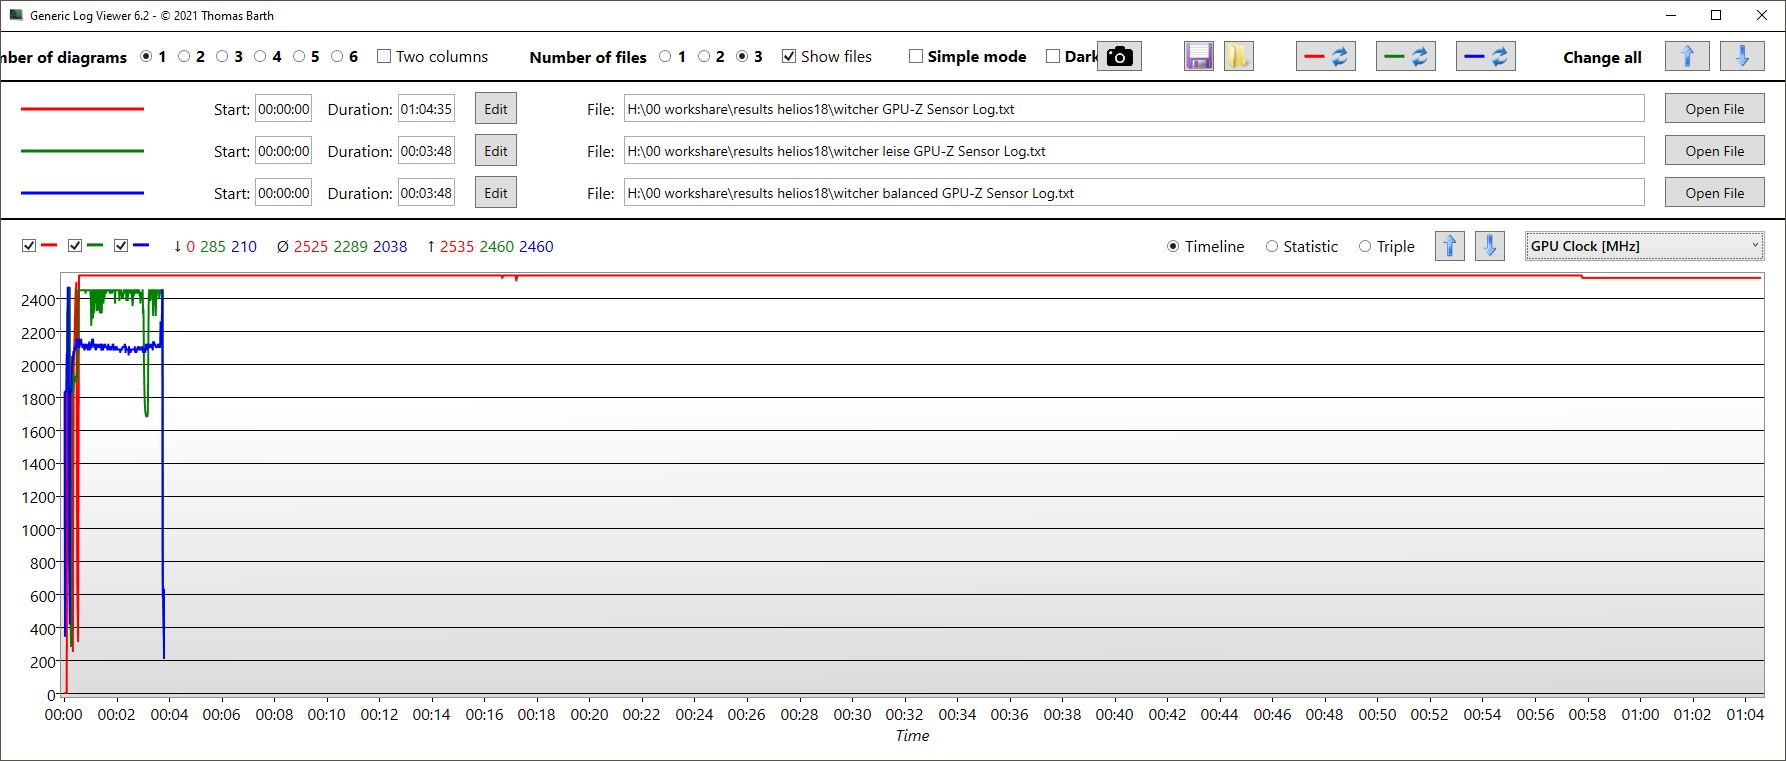
CPU kıyaslamasının aksine, oyun oynarken Dengeli ve Sessiz modlar arasında artık net bir fark var. İkincisi, ismine sadık kalarak çok sessiz ve aynı zamanda daha az güç kullanıyor. Witcher 3 Ultra için ayrı performans modlarının fps, tüketim ve hacim tabloları aşağıdaki Emisyon/Sıcaklık bölümlerinde bulunabilir.
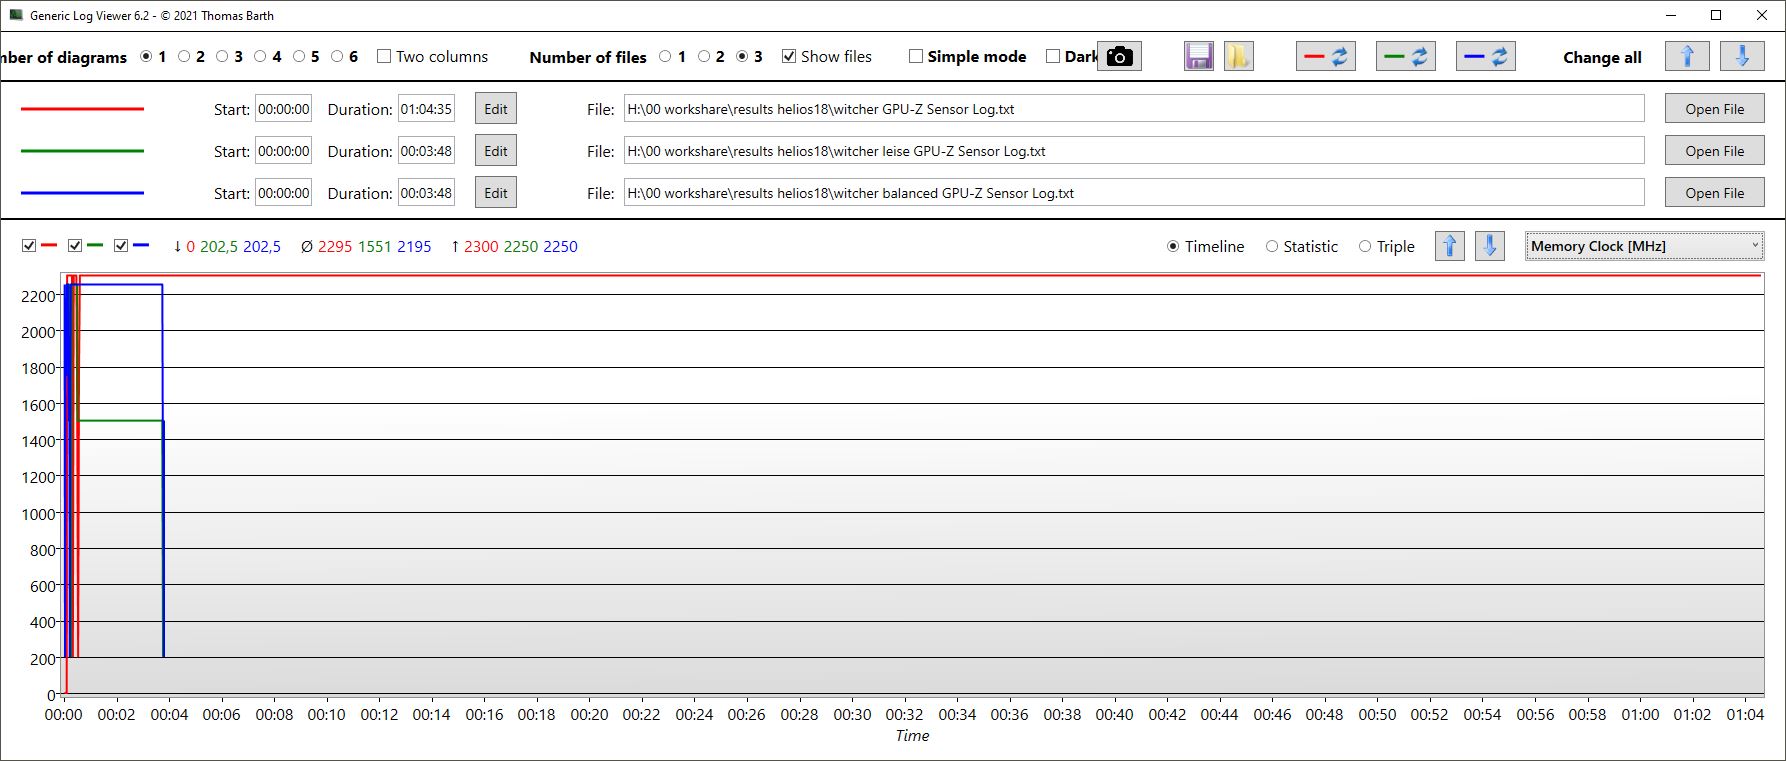
İlginç bir şekilde, GPU Sessiz modda Dengeli'ye göre biraz daha yüksek saat hızına sahiptir, ancak bellek saati önemli ölçüde daha düşüktür ve güç tüketimi de daha düşüktür.
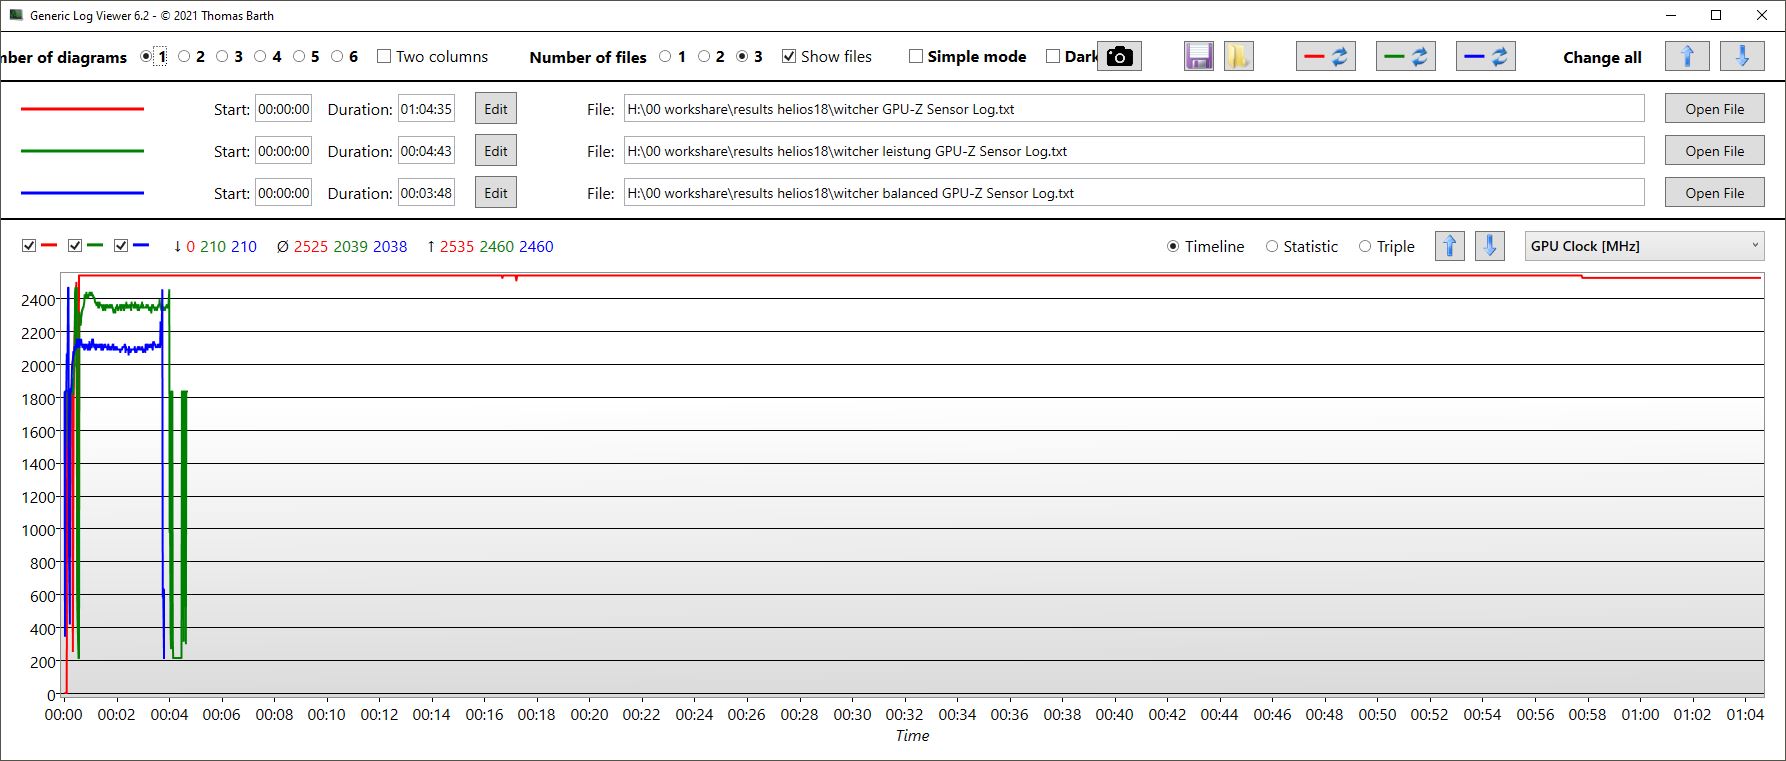
Witcher 3 FPS chart
| düşük | orta | yüksek | ultra | QHD | 4K | |
|---|---|---|---|---|---|---|
| GTA V (2015) | 187.3 | 187.6 | 186.7 | 152.7 | 140.7 | |
| The Witcher 3 (2015) | 642 | 568 | 368 | 175 | 153 | |
| Dota 2 Reborn (2015) | 234 | 211 | 202 | 186.4 | 131 | |
| Final Fantasy XV Benchmark (2018) | 234 | 225 | 182.1 | 136.6 | 79.4 | |
| X-Plane 11.11 (2018) | 199 | 183.5 | 139.5 | 143.7 | ||
| Far Cry 5 (2018) | 199 | 175 | 168 | 158 | 155 | |
| Strange Brigade (2018) | 562 | 448 | 382 | 339 | 238 | |
| Call of Duty Modern Warfare 2 2022 (2022) | 167 | 124 | ||||
| Hogwarts Legacy (2023) | 173 | 157 | 134 | 108 | 81 | |
| F1 23 (2023) | 329 | 329 | 304 | 111 | 73 | |
| Cyberpunk 2077 (2023) | 127.13 | 77.03 | ||||
| Alan Wake 2 (2023) | 100.7 | 71 |
Emisyonlar - Helios 18 turboda çok gürültülü
Gürültü
Fan gürültüsü doğal olarak büyük ölçüde seçilen performans moduna bağlıdır. Turbo modunda, arka plan gürültüsü yük altında çok yüksektir; maksimum 60 dB'nin biraz altında ölçtük, bu da onu karşılaştırma alanındaki en gürültülü cihaz yapıyor. GürültüAlienware rTX 4090 ile daha sessiz kalıyor; sadece MSI benzer şekilde yüksek ses çıkarıyor. Maksimum ses seviyesinde kasa hafifçe titremeye bile başlıyor. Bu nedenle Performans modunu veya daha düşük bir modu öneriyoruz. İlkinde, Witcher 3 adresindeki performansın yalnızca yüzde 3 ila 5'inden vazgeçersiniz, ancak ses seviyesi neredeyse 10 dB düşer!
En azından Helios 18, fanlarını yüke bağlı olarak iyi bir şekilde düzenler ve orta yük altında kullanıcılara hemen tam ses vermez. Bununla birlikte, fan dönüşü oyun oynarken sabit kalmıyor, ancak bazen daha fazla ve bazen daha az yüksek sesle döngüsel olarak dalgalanıyor (Witcher 3).
Diğer performans modları gürültü seviyesini önemli ölçüde azaltabilir, aşağıdaki tabloya bakın.
| Parametreler/Performans modu | Turbo | Performans | Dengeli | Sessiz |
|---|---|---|---|---|
| fps | 176 | 171 | 157 | 100 |
| DB cinsinden ses seviyesi | 59.82 | 50.74 | 40.77 | 32.36 |
| W cinsinden tüketim | 289 | 227 | 182 | 153 |
Ses yüksekliği
| Boşta |
| 23 / 23 / 23 dB |
| Çalışırken |
| 45.26 / 59.94 dB |
 | ||
30 dB sessiz 40 dB(A) duyulabilirlik 50 dB(A) gürültülü |
||
min: | ||
| Acer Predator Helios 18 N23Q2 GeForce RTX 4080 Laptop GPU, i9-13900HX, Samsung PM9A1 MZVL22T0HBLB | MSI GE78HX 13VH-070US GeForce RTX 4080 Laptop GPU, i9-13950HX, Samsung PM9A1 MZVL22T0HBLB | HP Omen 17-ck2097ng GeForce RTX 4080 Laptop GPU, i9-13900HX, SK hynix PC801 HFS001TEJ9X101N | Alienware m18 R1 GeForce RTX 4090 Laptop GPU, i9-13980HX, SK hynix PC801 HFS001TEJ9X101N | Asus ROG Strix G18 G814JI GeForce RTX 4070 Laptop GPU, i7-13650HX, Micron 2400 MTFDKBA1T0QFM | Razer Blade 18 RTX 4070 GeForce RTX 4070 Laptop GPU, i9-13950HX, SSSTC CA6-8D1024 | |
|---|---|---|---|---|---|---|
| Noise | -6% | -11% | 6% | -2% | 3% | |
| kapalı / ortam * (dB) | 23 | 23.4 -2% | 24 -4% | 22.8 1% | 25 -9% | 23.5 -2% |
| Idle Minimum * (dB) | 23 | 24.2 -5% | 31 -35% | 23 -0% | 26 -13% | 23.8 -3% |
| Idle Average * (dB) | 23 | 25.6 -11% | 32 -39% | 23 -0% | 28 -22% | 23.8 -3% |
| Idle Maximum * (dB) | 23 | 31 -35% | 33 -43% | 23 -0% | 29 -26% | 26.8 -17% |
| Load Average * (dB) | 45.26 | 43.3 4% | 45 1% | 35.6 21% | 41 9% | 37.3 18% |
| Witcher 3 ultra * (dB) | 59.82 | 56.3 6% | 45 25% | 51.3 14% | 44 26% | 48 20% |
| Load Maximum * (dB) | 59.94 | 59.1 1% | 50 17% | 56.7 5% | 46 23% | 53.5 11% |
* ... daha küçük daha iyidir
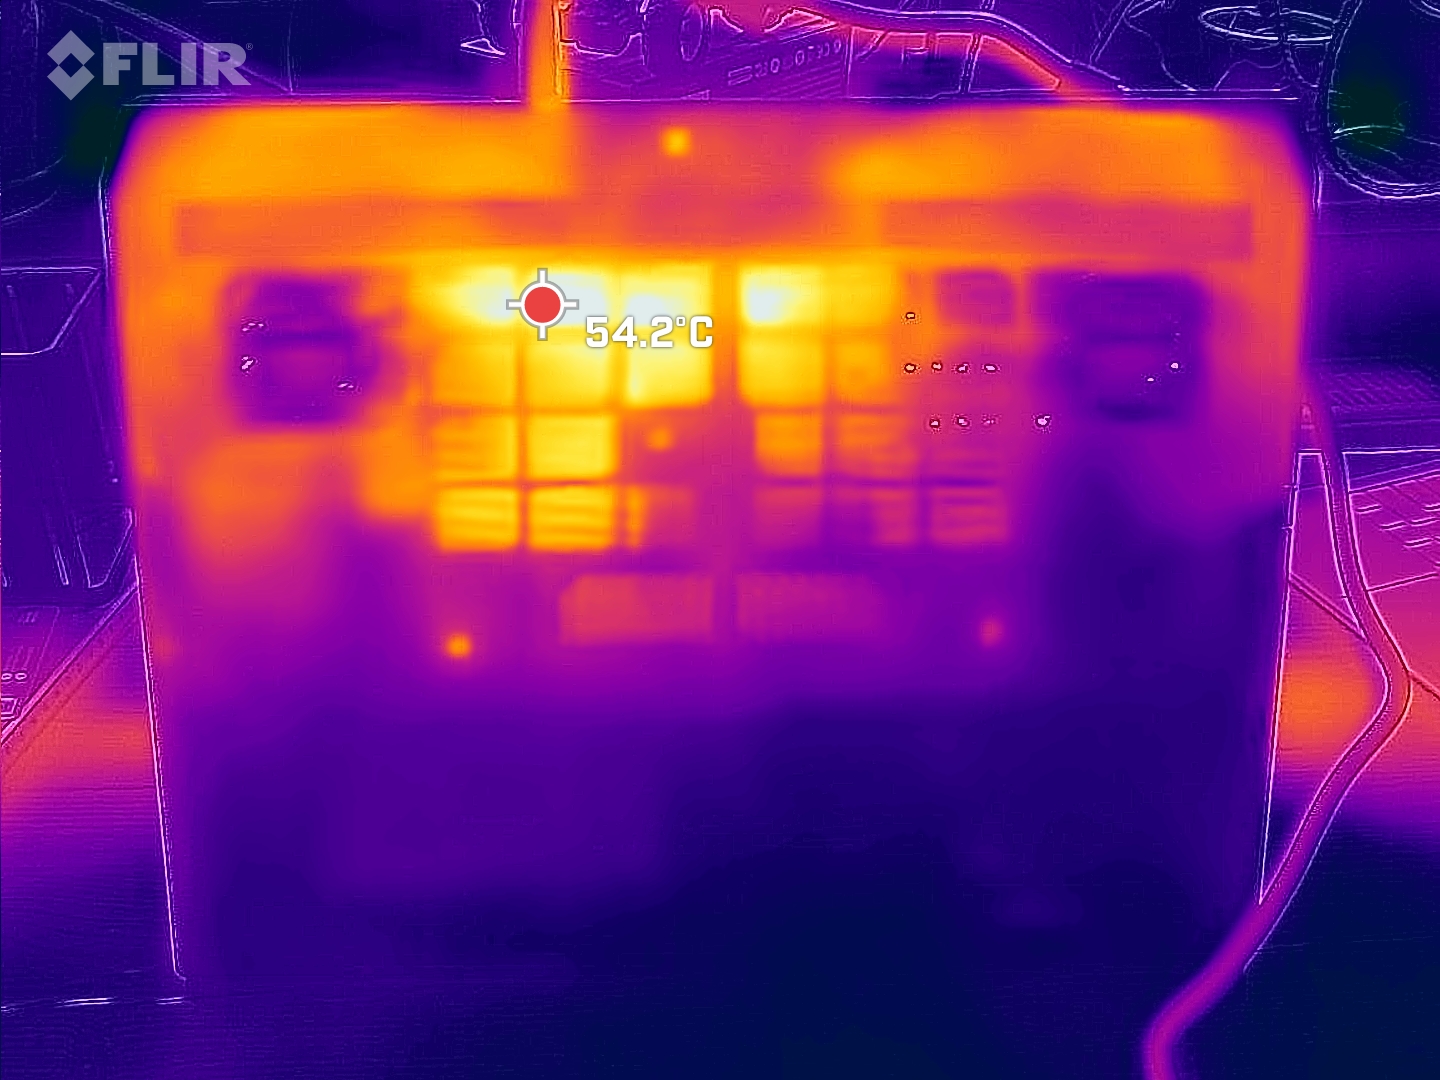
Sıcaklık
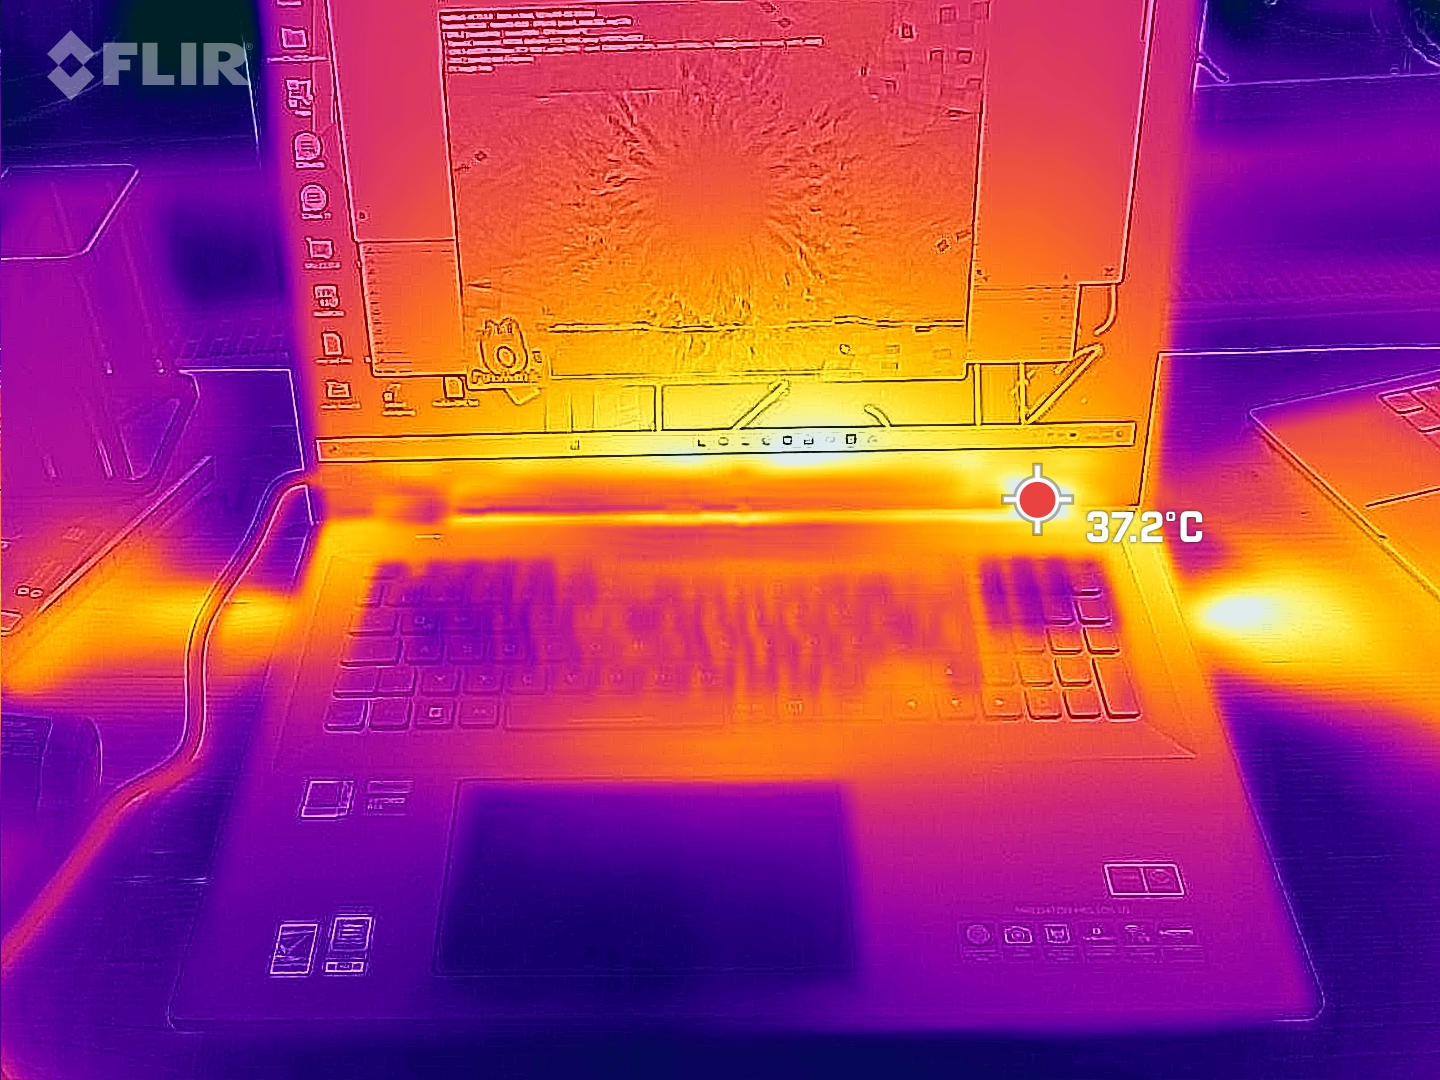
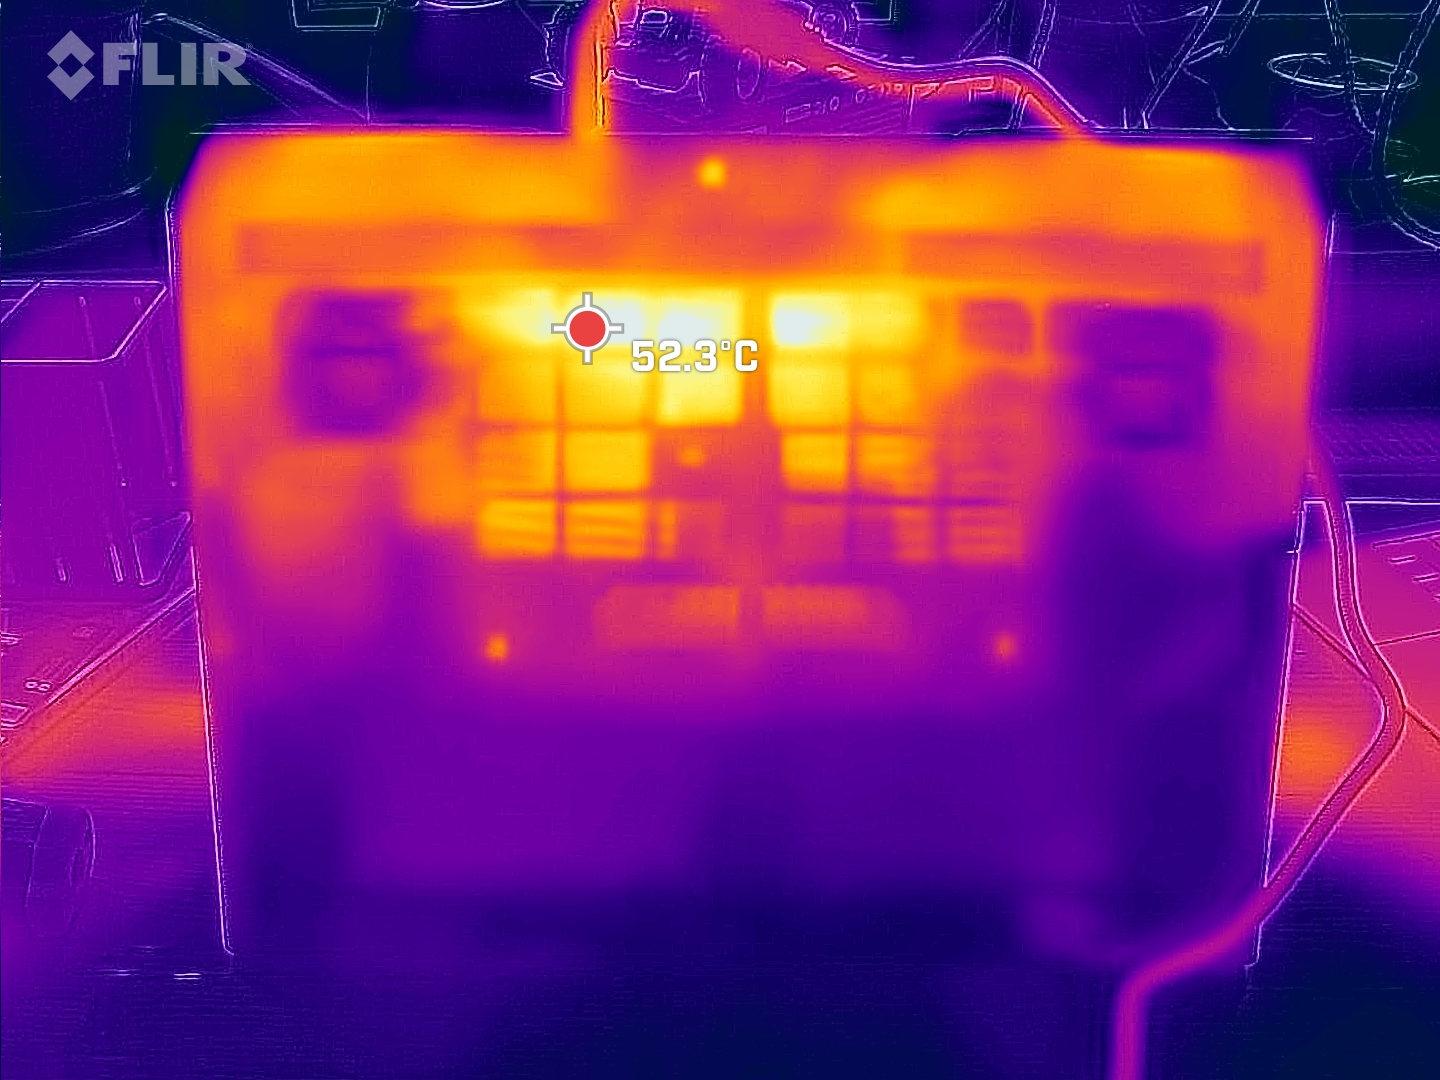
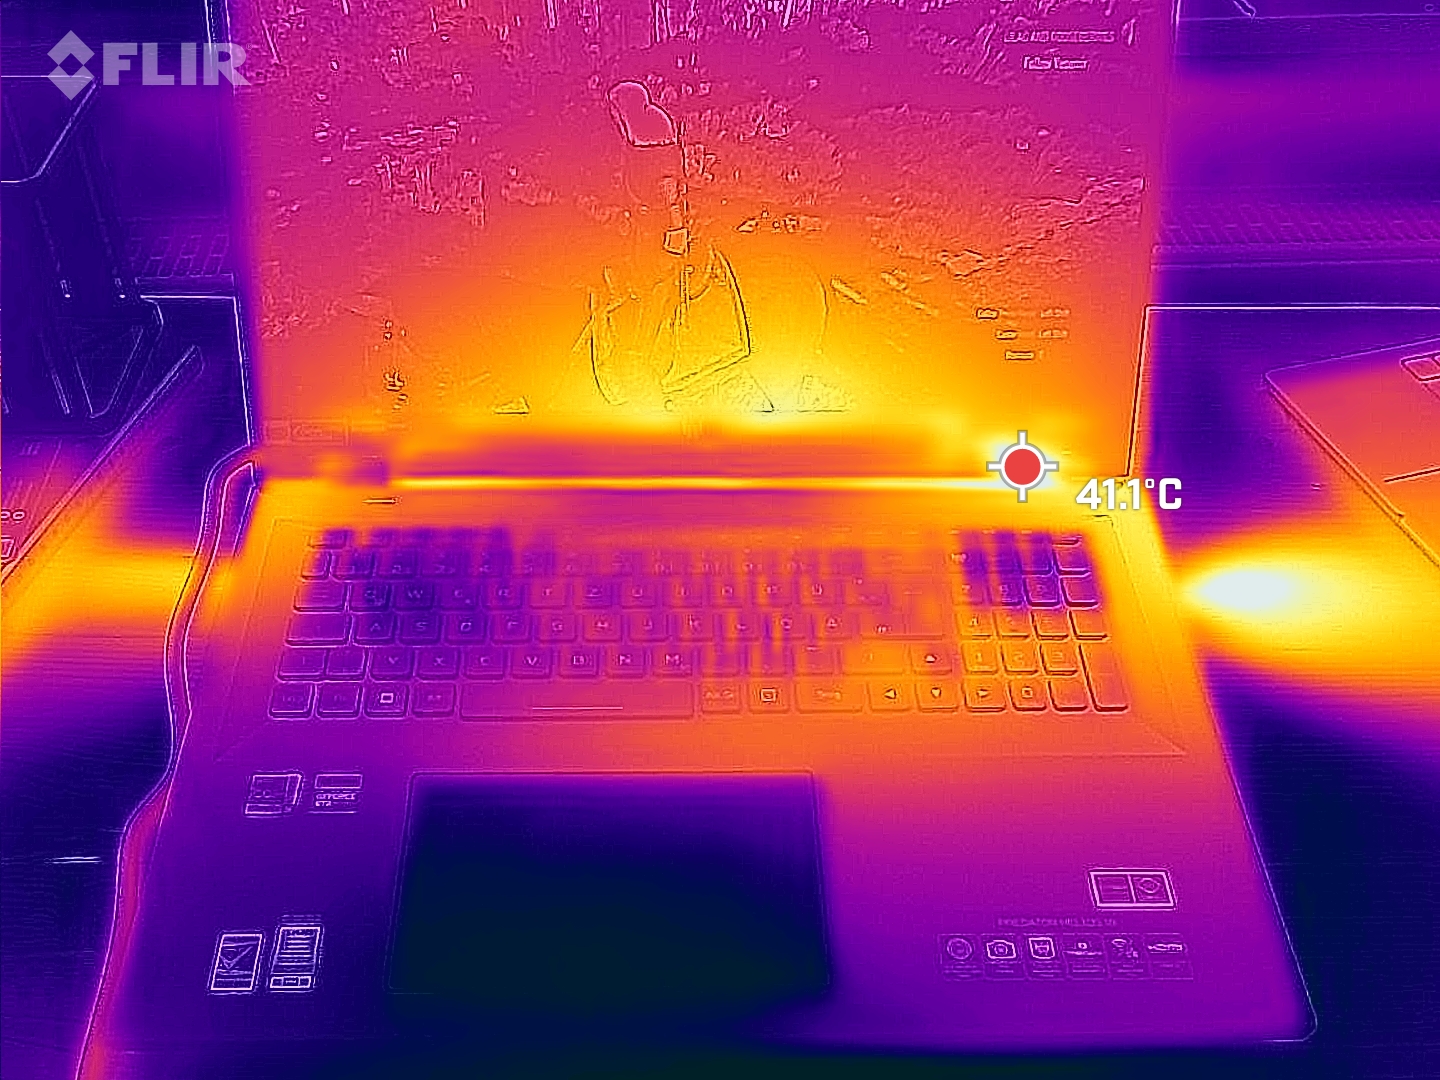
Yüzey sıcaklıkları, yüksek sesli fanların da olumlu bir yönü olduğunu gösteriyor. Helios 18 yalnızca çok seçici bir şekilde ısınıyor (ekranın alt orta kısmı ve sol tarafı), ancak bunun dışında neredeyse alışılmadık derecede soğuk kalıyor. Örneğin, sol avuç içi dayanağı bir saatlik oyundan sonra düpedüz soğuk hissediyor. Bu, bir yandan yüksek sesli fanların çok agresif bir şekilde yapılandırıldığını ve diğer yandan ısının çok iyi dağıtılmadığını gösteriyor.
(+) Üst taraftaki maksimum sıcaklık, 40.4 °C / 105 F ortalamasına kıyasla 35 °C / 95 F'dir. , Gaming sınıfı için 21.2 ile 68.8 °C arasında değişir.
(-) Alt kısım, 43.2 °C / 110 F ortalamasına kıyasla maksimum 56 °C / 133 F'ye kadar ısınır
(+) Boşta kullanımda, üst tarafın ortalama sıcaklığı 31.1 °C / 88 F olup, cihazın 33.9 °C / 93 F.
(+) The Witcher 3 oynarken, üst tarafın ortalama sıcaklığı 30.7 °C / 87 F olup, cihazın 33.9 °C / 93 F.
(+) Avuç içi dayanakları ve dokunmatik yüzey, maksimum 29 °C / 84.2 F ile cilt sıcaklığından daha soğuktur ve bu nedenle dokunulduğunda soğuktur.
(±) Benzer cihazların avuç içi dayanağı alanının ortalama sıcaklığı 28.8 °C / 83.8 F (-0.2 °C / -0.4 F) idi.
| Acer Predator Helios 18 N23Q2 Intel Core i9-13900HX, NVIDIA GeForce RTX 4080 Laptop GPU | MSI GE78HX 13VH-070US Intel Core i9-13950HX, NVIDIA GeForce RTX 4080 Laptop GPU | HP Omen 17-ck2097ng Intel Core i9-13900HX, NVIDIA GeForce RTX 4080 Laptop GPU | Alienware m18 R1 Intel Core i9-13980HX, NVIDIA GeForce RTX 4090 Laptop GPU | Asus ROG Strix G18 G814JI Intel Core i7-13650HX, NVIDIA GeForce RTX 4070 Laptop GPU | Razer Blade 18 RTX 4070 Intel Core i9-13950HX, NVIDIA GeForce RTX 4070 Laptop GPU | |
|---|---|---|---|---|---|---|
| Heat | 11% | 14% | 17% | 7% | 11% | |
| Maximum Upper Side * (°C) | 35 | 37.4 -7% | 41 -17% | 39 -11% | 45 -29% | 39.2 -12% |
| Maximum Bottom * (°C) | 56 | 45 20% | 51 9% | 36.4 35% | 47 16% | 35.6 36% |
| Idle Upper Side * (°C) | 34 | 29.8 12% | 24 29% | 29.2 14% | 28 18% | 31.8 6% |
| Idle Bottom * (°C) | 39 | 32.4 17% | 25 36% | 27.8 29% | 31 21% | 33.2 15% |
* ... daha küçük daha iyidir
Stres testi
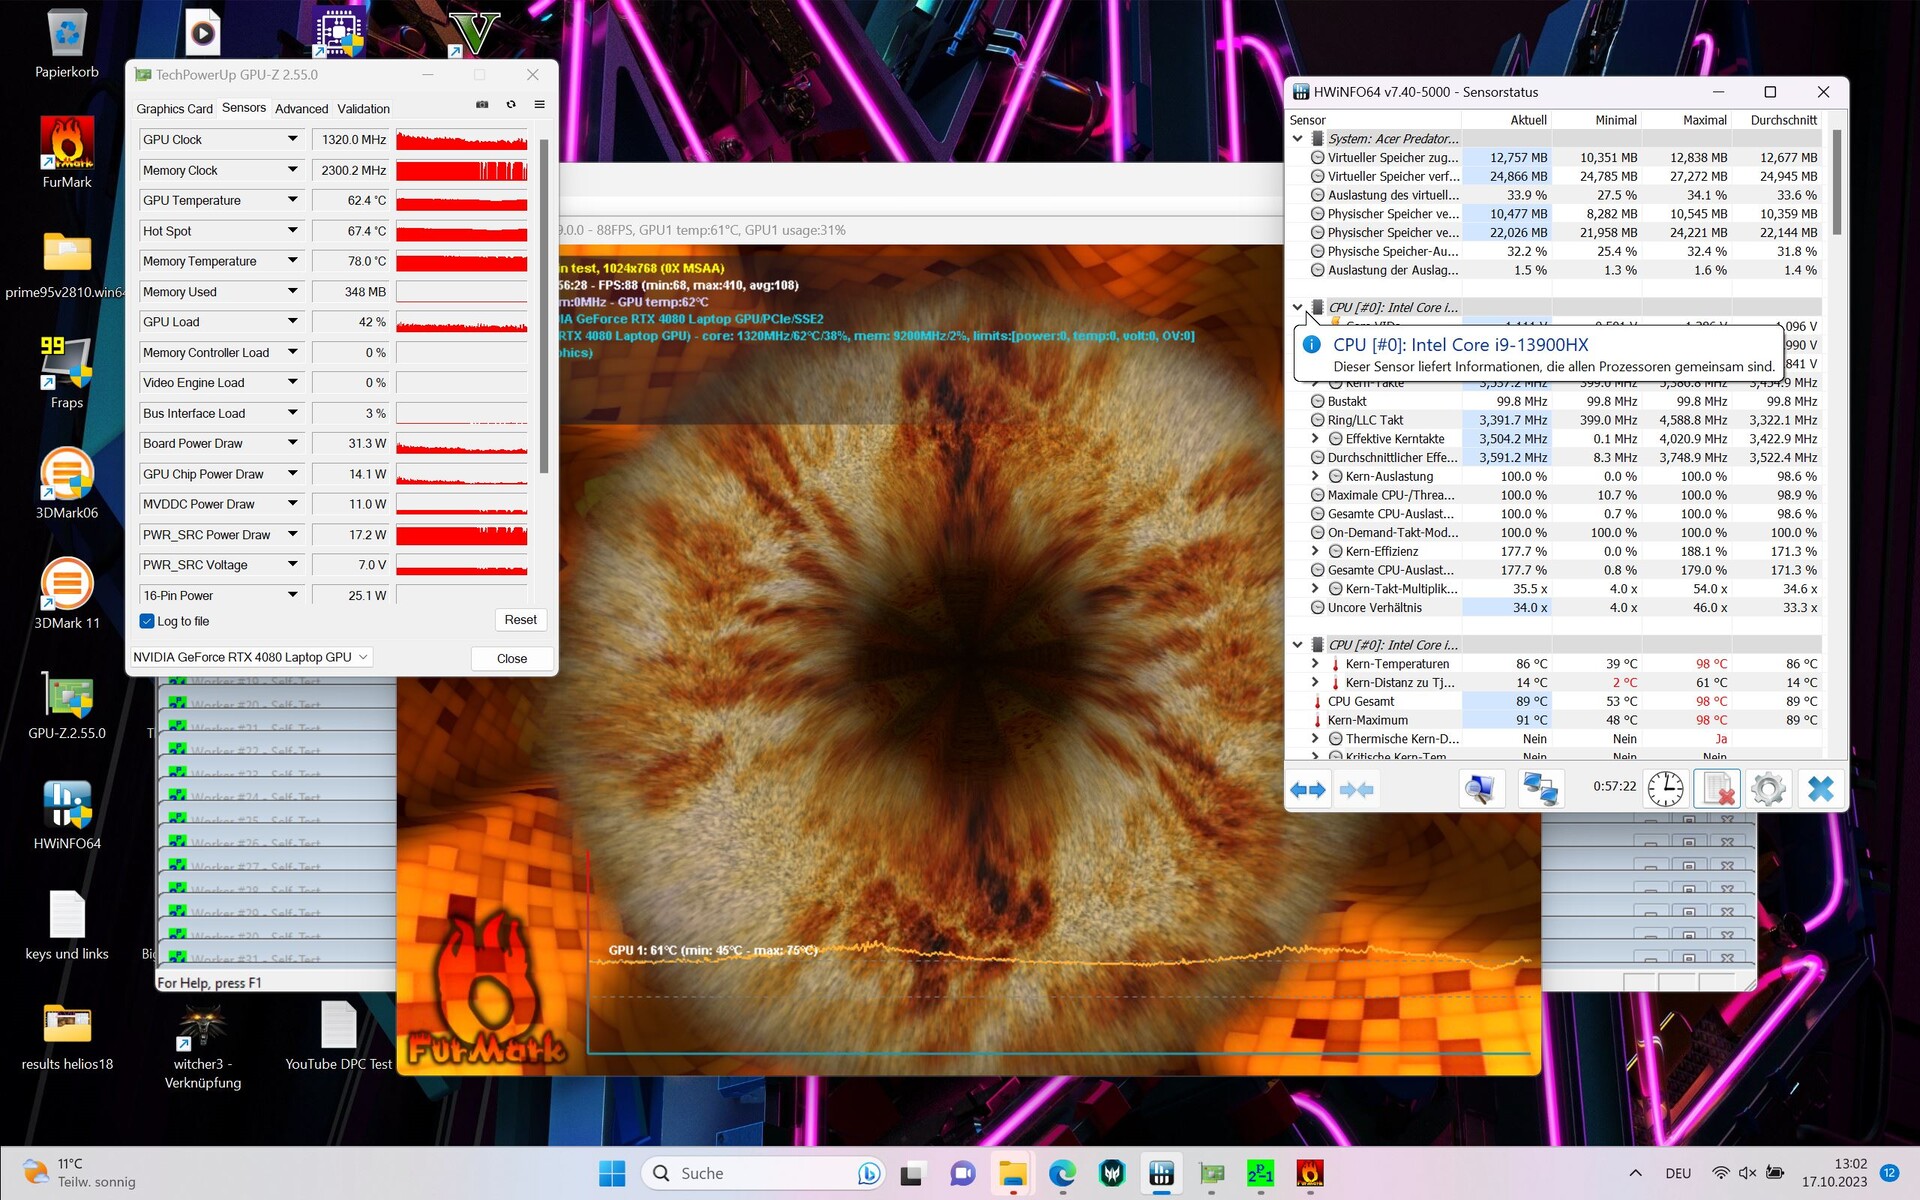
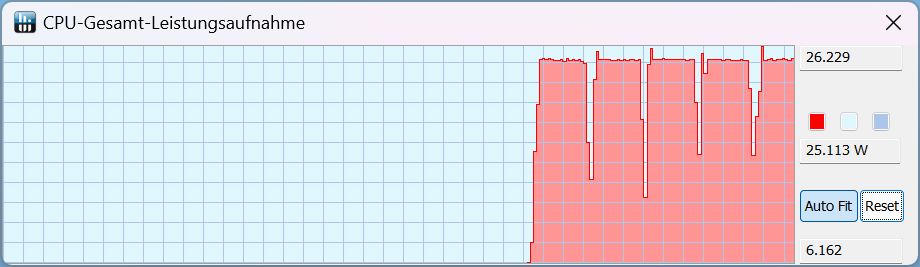
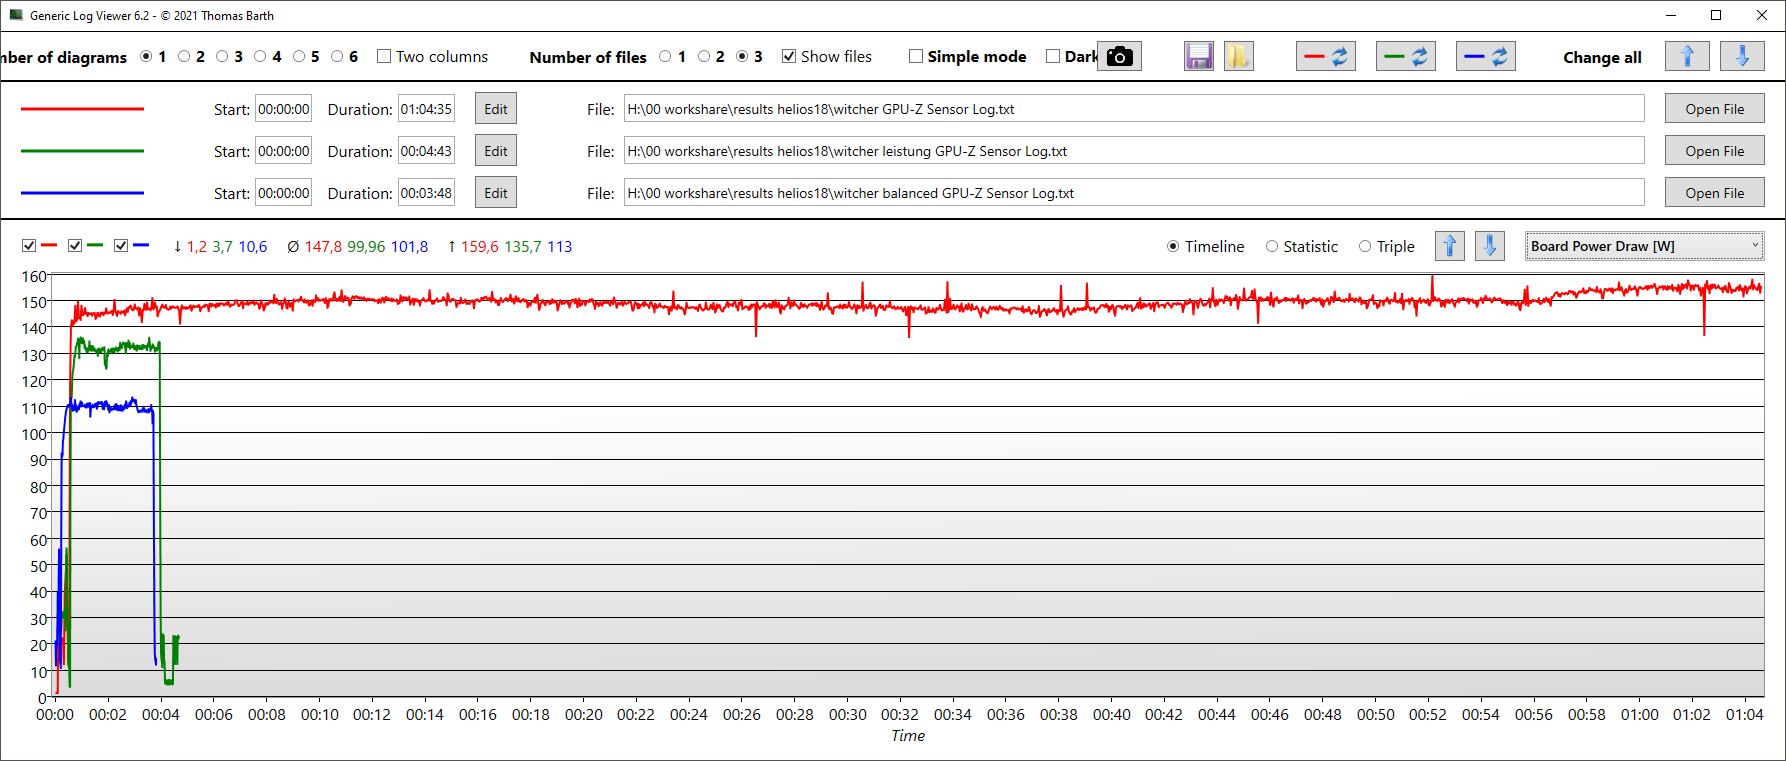
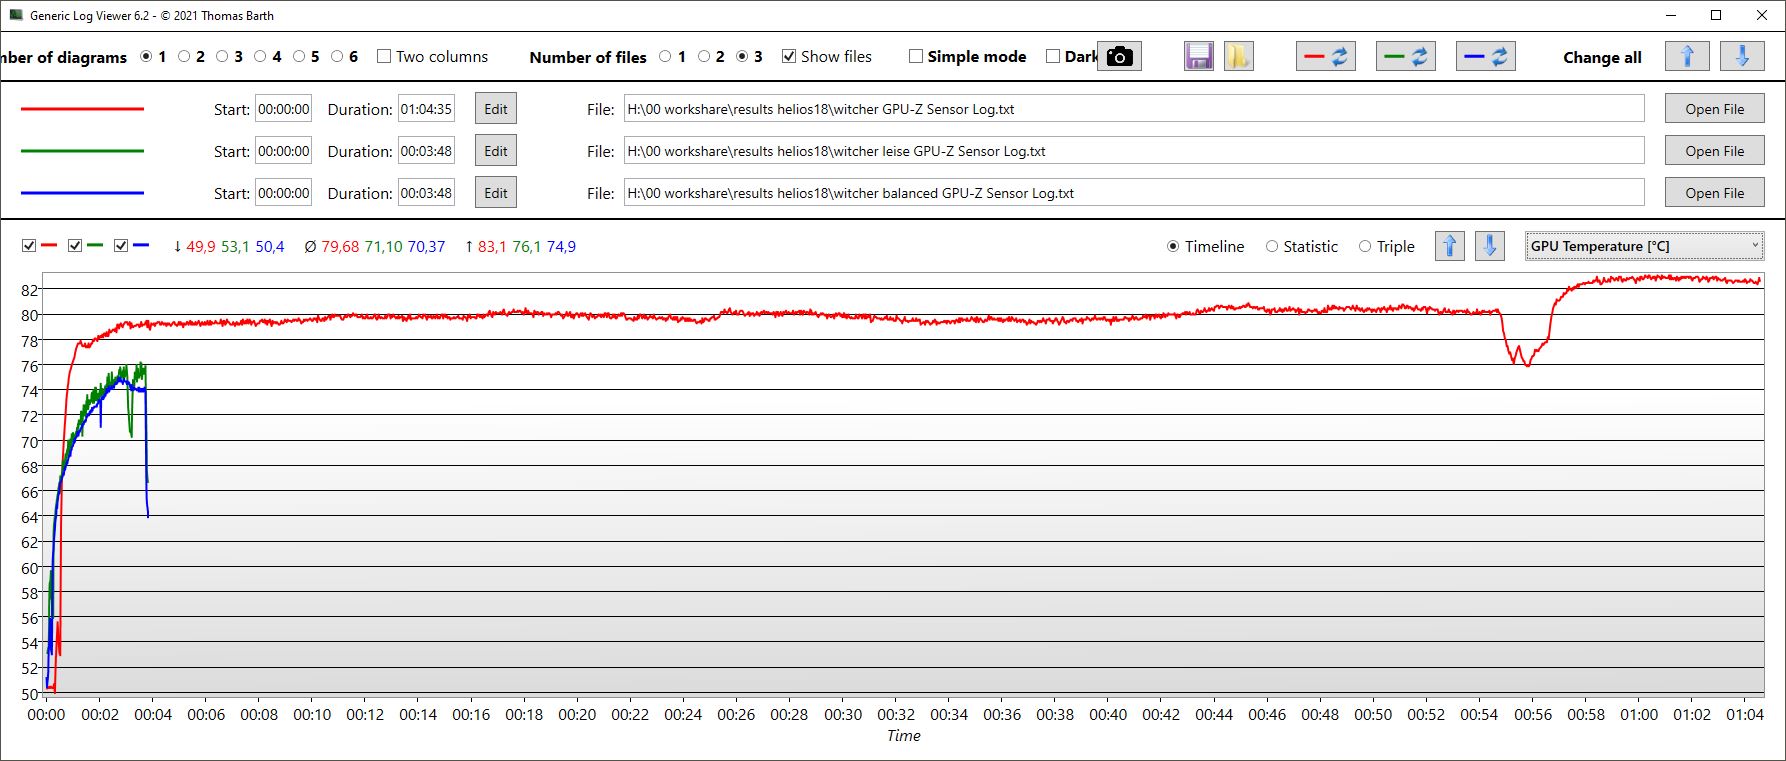
Stres testimizi başlattıktan sonra, Predator'un CPU performansı nispeten sabit kalıyor ve çekirdekler sürekli olarak 3,4 ile 3,6 GHz arasında çalışıyor. Güç tüketimine ve ayrıca çekirdek sıcaklığına yansıyan küçük dalgalanmalar her zaman vardır. CPU çekirdek sıcaklıkları 98 °C'ye kadar yükselir, ancak ortalama 89 °C'dir. CPU güç tüketimi 156 W ile zirve yapıyor ve ortalama 137 W.
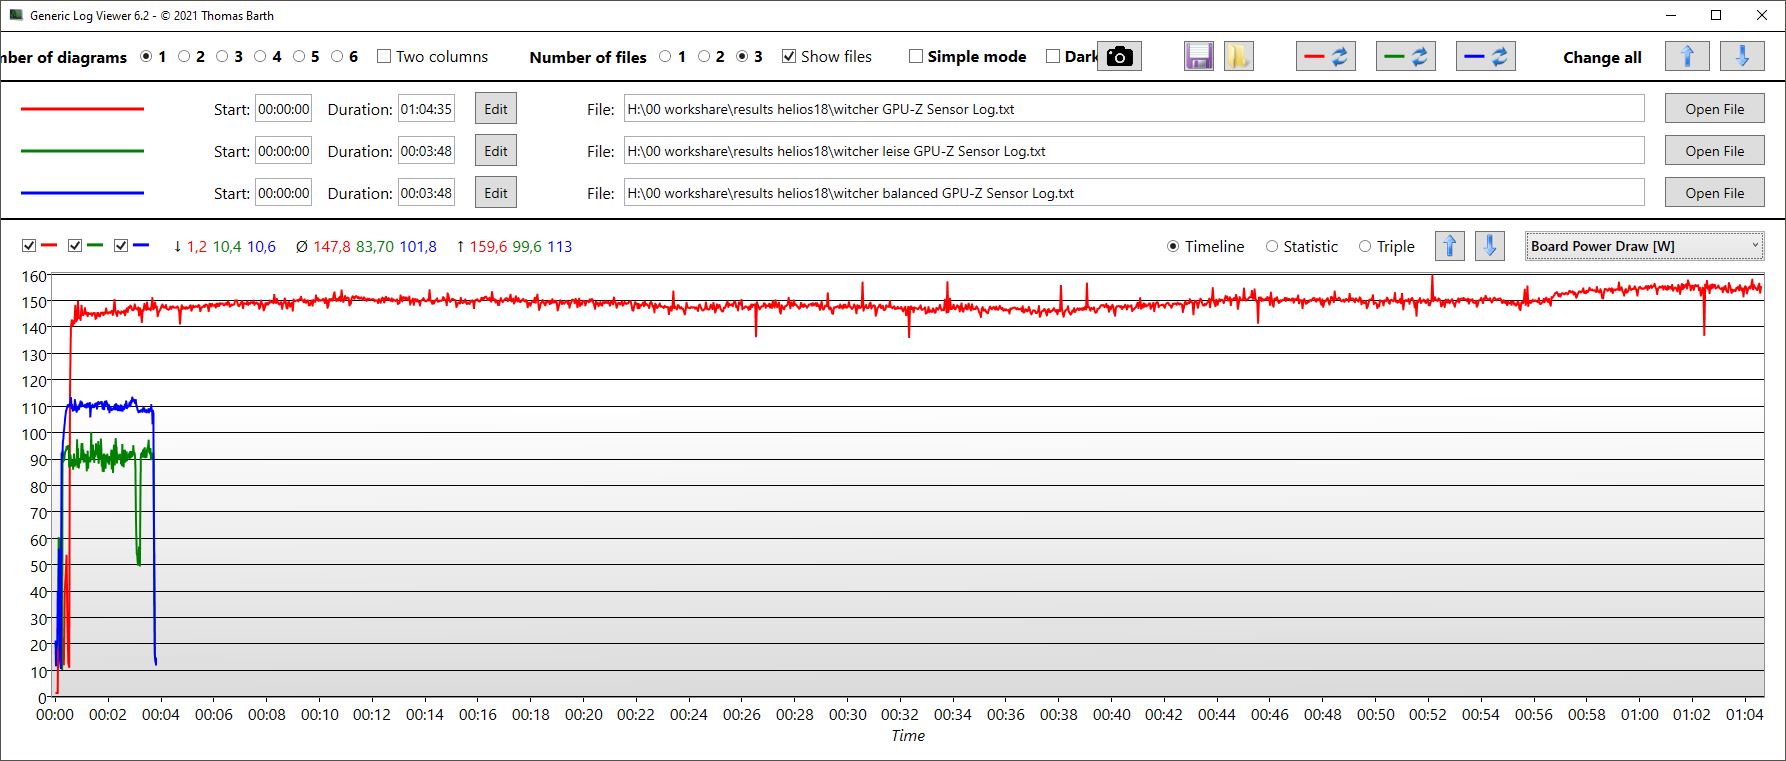
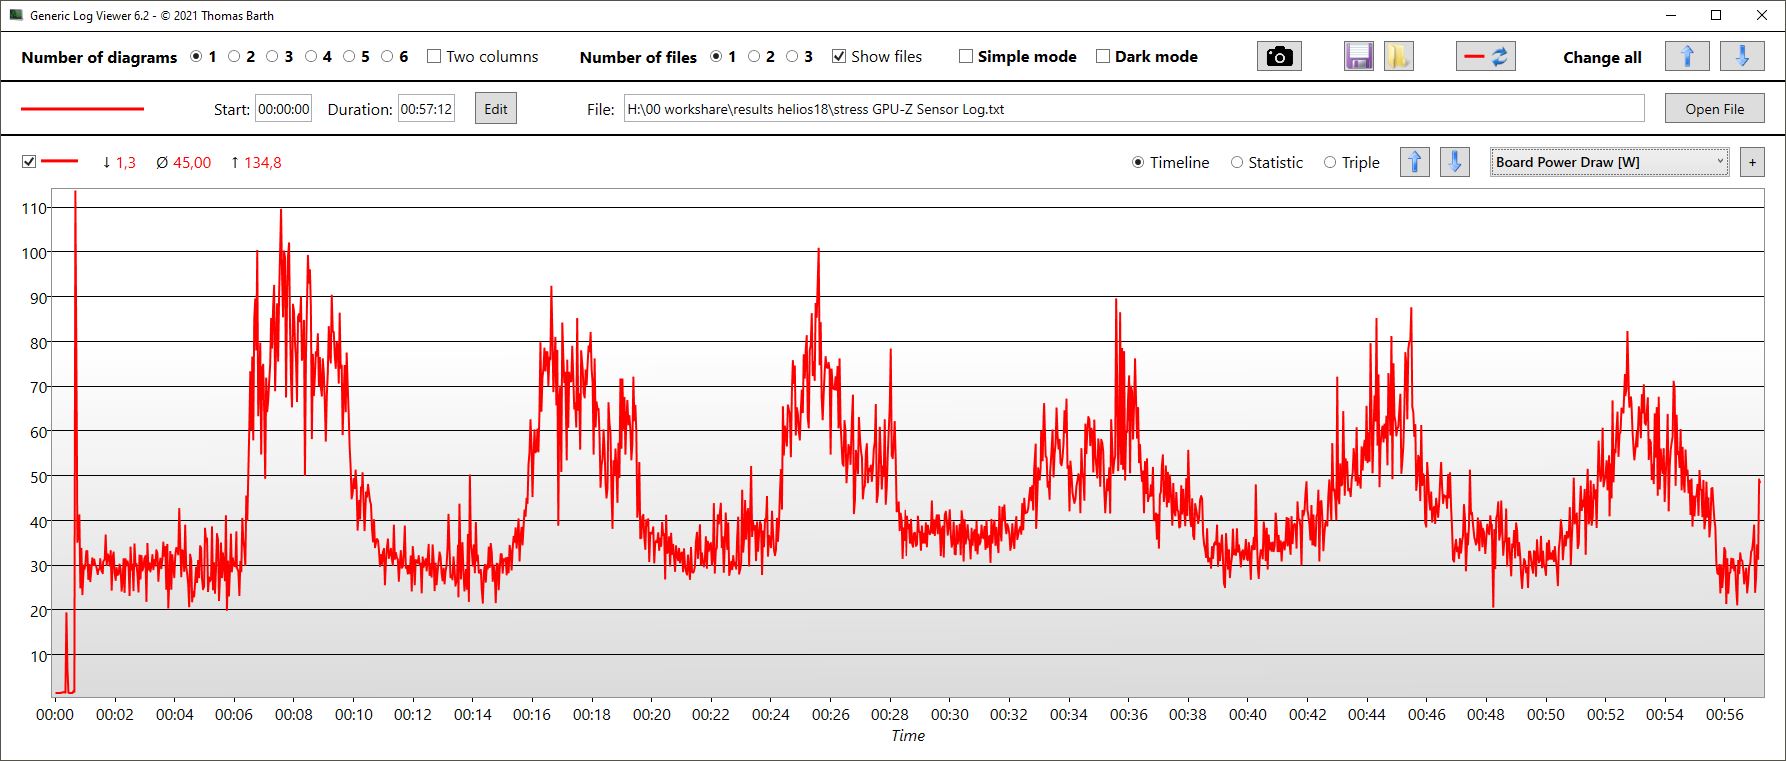
GPU çok daha az tutarlıdır ve bir performans dalgası eğrisi sergiler. Saat hızı döngüsel olarak yinelenen maksimum 2,5 GHz'e ulaşıyor ve eğri vadileri 1,2 GHz civarında. Aynı zamanda, 2,3 GHz'lik sabit bellek saatinde bir saniyenin kesirleri için sadece 200 MHz'e kadar çok spontane düşüşler ölçtük. GPU sıcaklığı da dalgalanıyor, ancak ortalama olarak sadece 64 °C, maksimum 76 °C. Güç tüketimi 25 W ile 90 ila 100 W arasında dalgalanıyor.
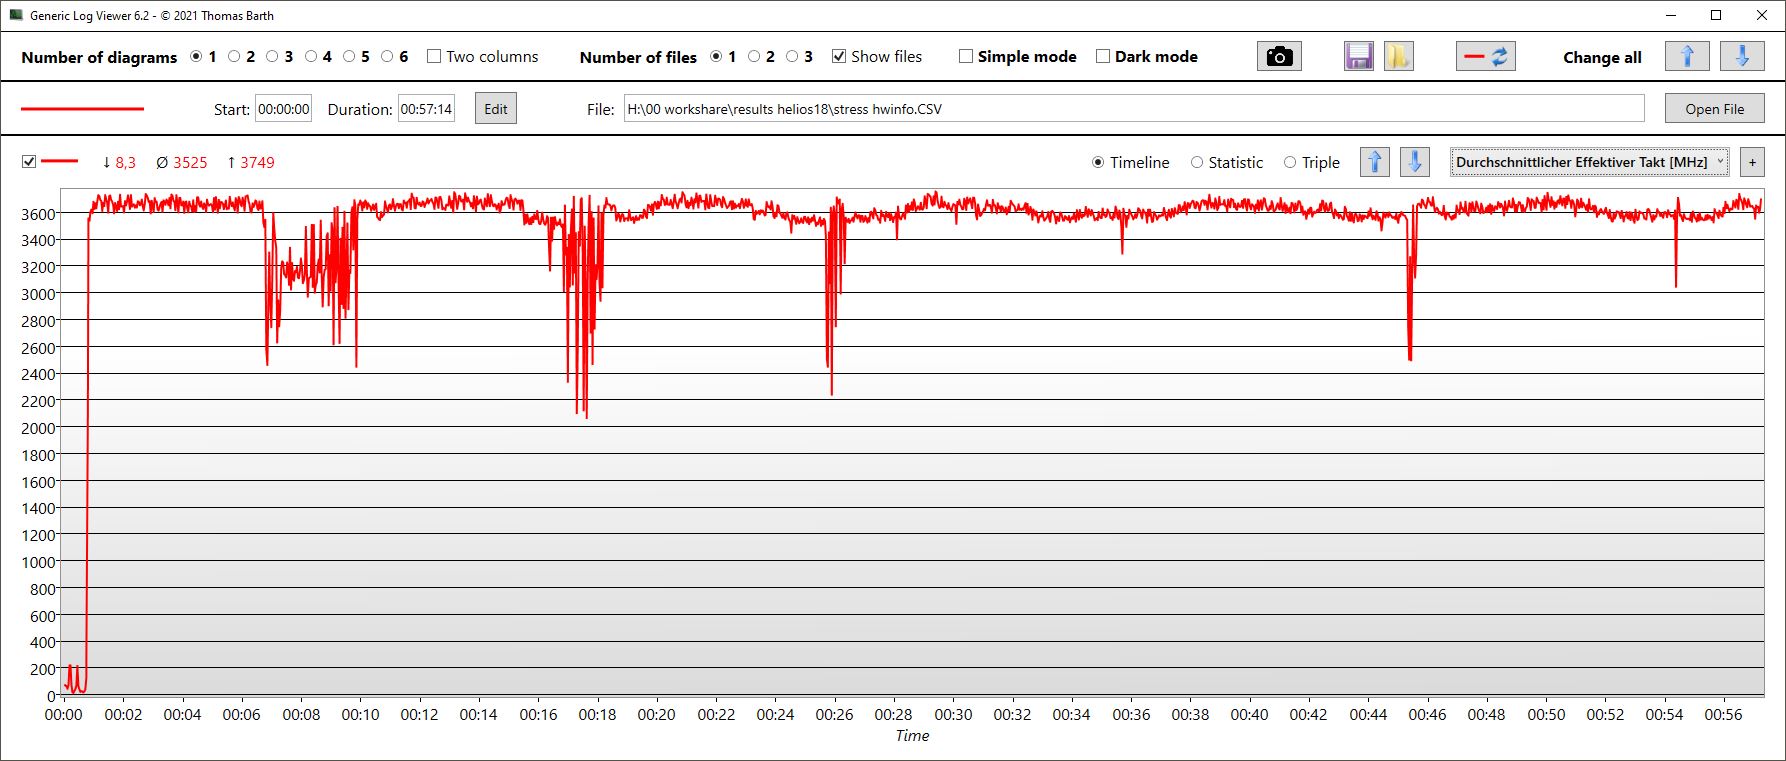
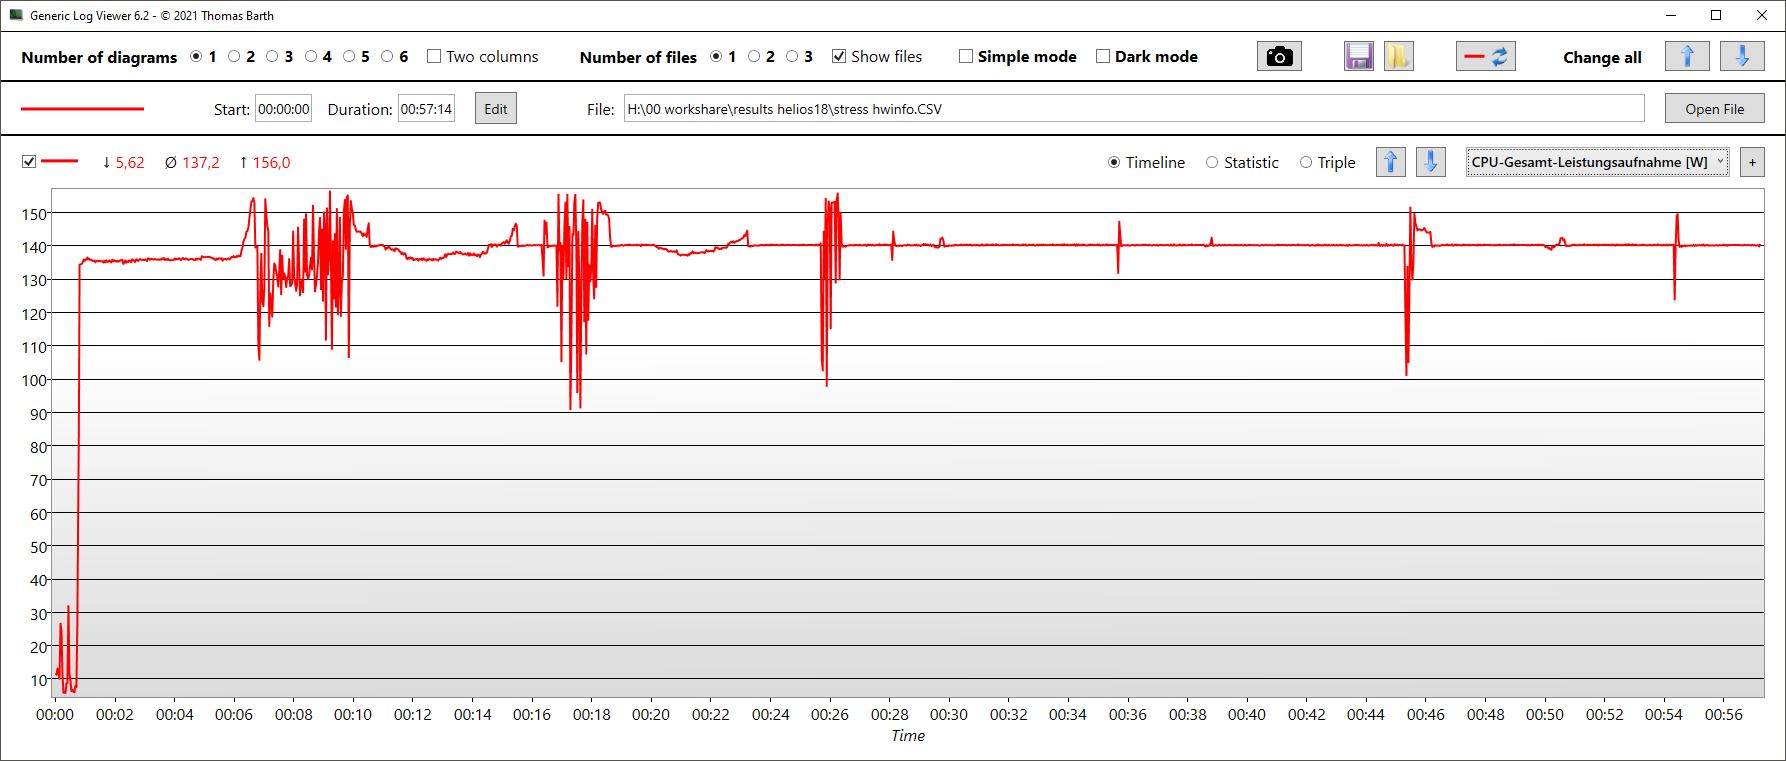
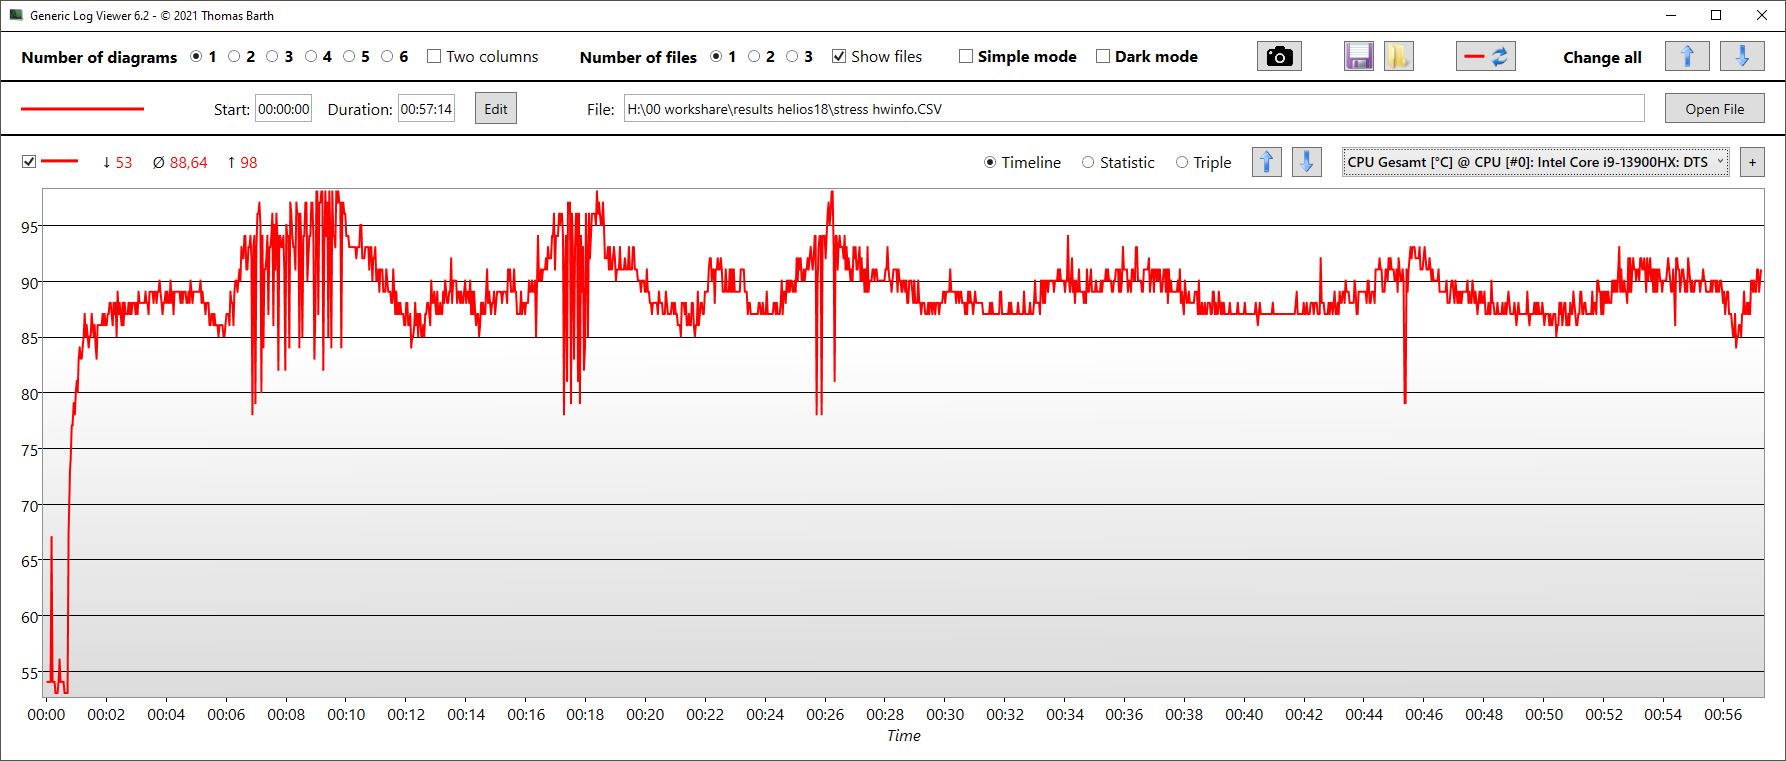
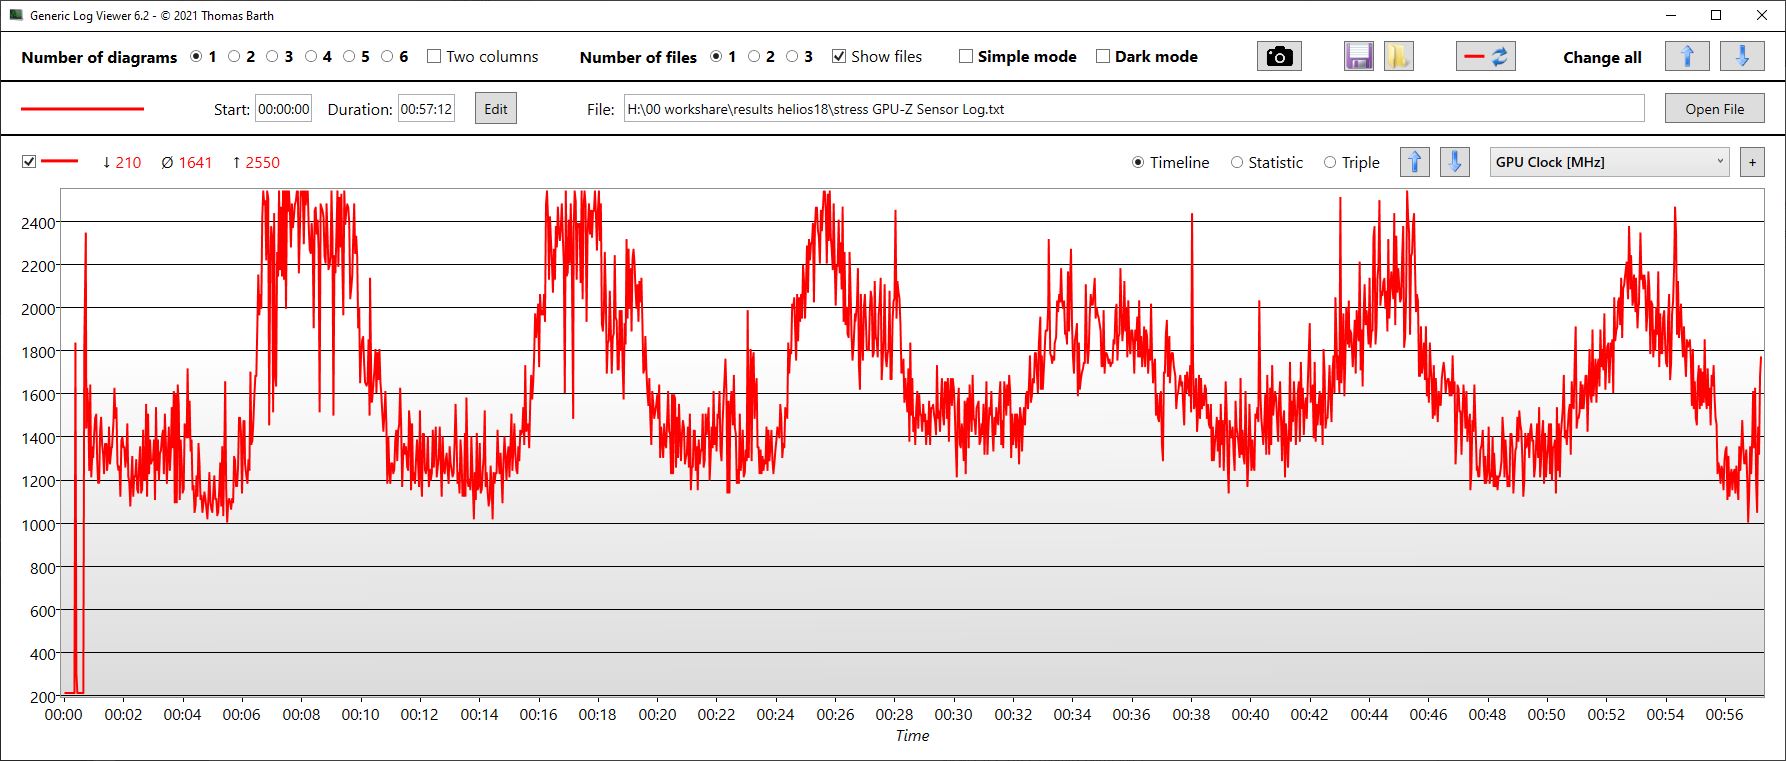
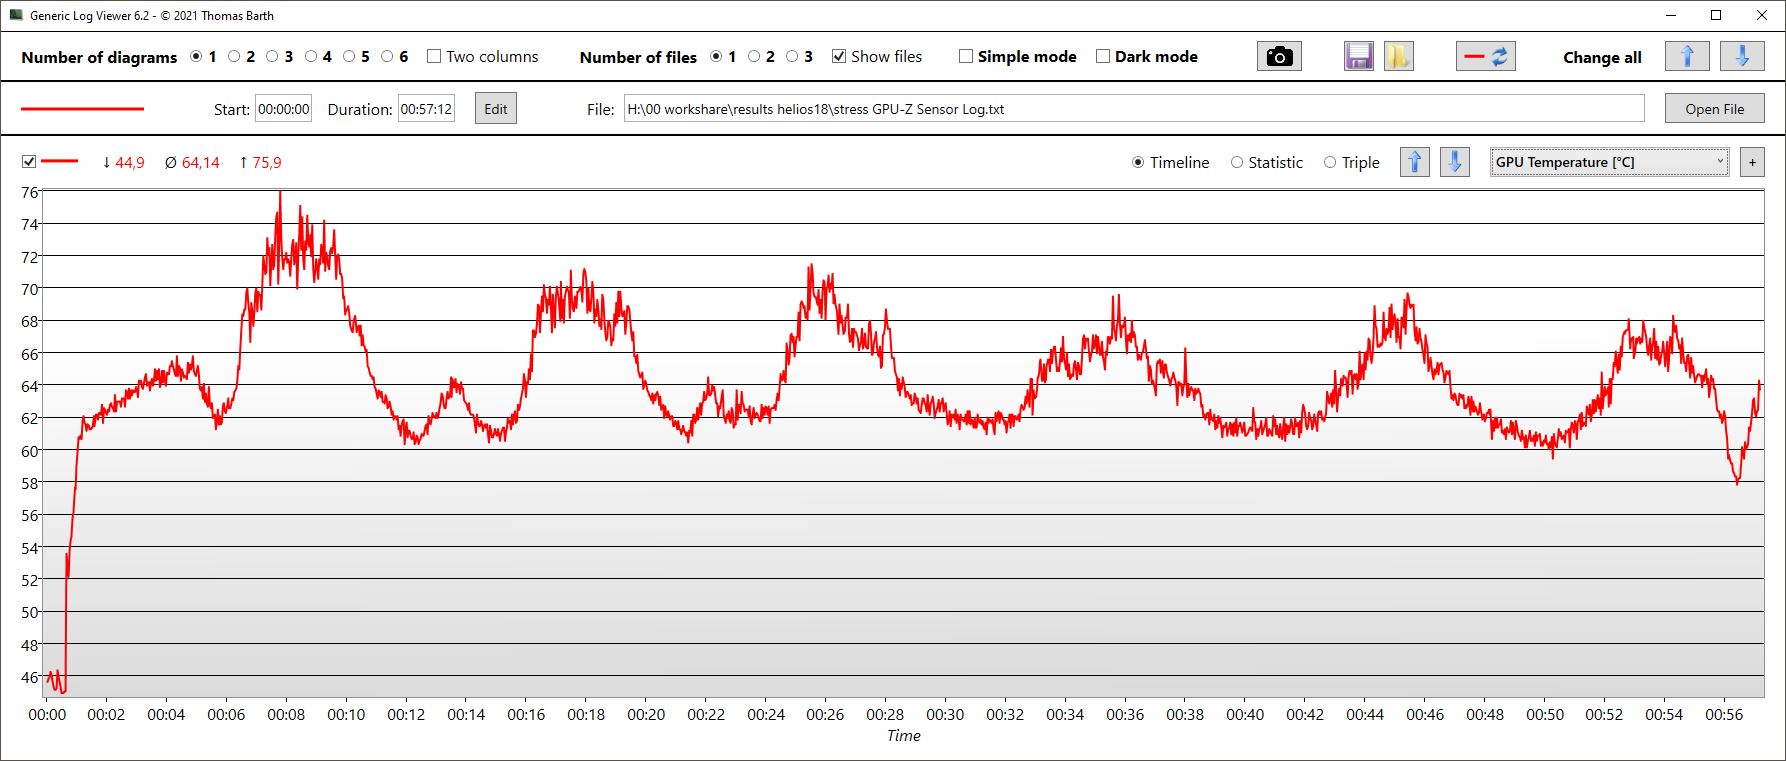
| CPU Saati (GHz) | GPU Saati (MHz) | Ortalama CPU Sıcaklığı (°C) | Ortalama GPU Sıcaklığı (°C) | |
| Prime95 + FurMark Stres | 3,5 | 1.640 | 89 | 64 |
| Witcher 3 Stres | 527 | 2.525 | 88,5 | 80 |
Konuşmacılar
Hoparlörler oldukça gürültülü olabilir, ancak olumlu haberler bu kadar. Ses tiz, bas neredeyse hiç yok ve hatta orta ve tizler bile özellikle dengeli değil. Özellikle bu kadar büyük bir dizüstü bilgisayardan daha iyi bir ses kalitesi bekliyorduk.
Harici ses cihazları, diğer şeylerin yanı sıra birleşik kulaklık girişi üzerinden bağlanabilir. Yüksek sesli Turbo modunda oynarken kulaklık zaten bir zorunluluktur.
Acer Predator Helios 18 N23Q2 ses analizi
(+) | hoparlörler nispeten yüksek sesle çalabilir (82.74 dB)
Bas 100 - 315Hz
(-) | neredeyse hiç bas yok - ortalama olarak medyandan 17.6% daha düşük
(±) | Bas doğrusallığı ortalamadır (9.8% delta - önceki frekans)
Ortalar 400 - 2000 Hz
(±) | daha yüksek ortalar - ortalama olarak medyandan 9.1% daha yüksek
(±) | Ortaların doğrusallığı ortalamadır (8.8% delta - önceki frekans)
Yüksekler 2 - 16 kHz
(±) | daha yüksek en yüksekler - ortalama olarak medyandan 5.3% daha yüksek
(+) | yüksekler doğrusaldır (6.4% deltadan önceki frekansa)
Toplam 100 - 16.000 Hz
(±) | Genel sesin doğrusallığı ortalamadır (20.3% ortancaya göre fark)
Aynı sınıfla karşılaştırıldığında
» Bu sınıftaki tüm test edilen cihazların %72%'si daha iyi, 6% benzer, 23% daha kötüydü
» En iyisinin deltası 6% idi, ortalama 18% idi, en kötüsü 132% idi
Test edilen tüm cihazlarla karşılaştırıldığında
» Test edilen tüm cihazların %53'si daha iyi, 8 benzer, % 39 daha kötüydü
» En iyisinin deltası 4% idi, ortalama 24% idi, en kötüsü 134% idi
Apple MacBook Pro 16 2021 M1 Pro ses analizi
(+) | hoparlörler nispeten yüksek sesle çalabilir (84.7 dB)
Bas 100 - 315Hz
(+) | iyi bas - medyandan yalnızca 3.8% uzakta
(+) | bas doğrusaldır (5.2% delta ile önceki frekans)
Ortalar 400 - 2000 Hz
(+) | dengeli ortalar - medyandan yalnızca 1.3% uzakta
(+) | orta frekanslar doğrusaldır (2.1% deltadan önceki frekansa)
Yüksekler 2 - 16 kHz
(+) | dengeli yüksekler - medyandan yalnızca 1.9% uzakta
(+) | yüksekler doğrusaldır (2.7% deltadan önceki frekansa)
Toplam 100 - 16.000 Hz
(+) | genel ses doğrusaldır (4.6% ortancaya göre fark)
Aynı sınıfla karşılaştırıldığında
» Bu sınıftaki tüm test edilen cihazların %0%'si daha iyi, 0% benzer, 100% daha kötüydü
» En iyisinin deltası 5% idi, ortalama 17% idi, en kötüsü 45% idi
Test edilen tüm cihazlarla karşılaştırıldığında
» Test edilen tüm cihazların %0'si daha iyi, 0 benzer, % 100 daha kötüydü
» En iyisinin deltası 4% idi, ortalama 24% idi, en kötüsü 134% idi
Güç yönetimi - Beklentilere uygun tüketim ve çalışma süresi
Güç tüketimi
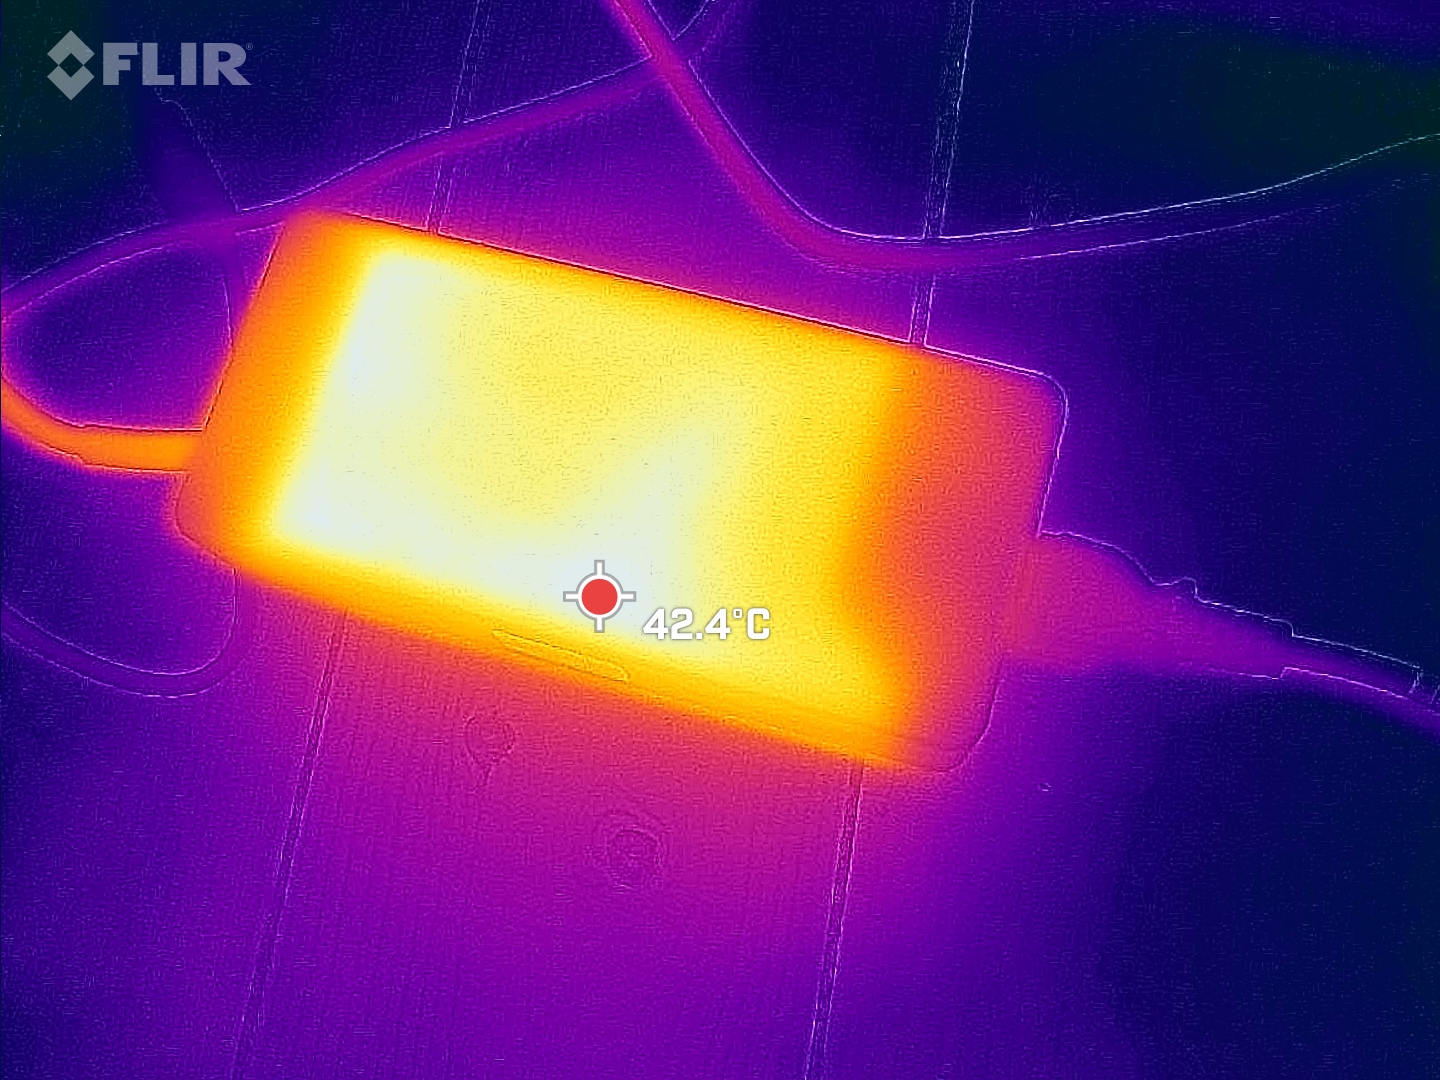
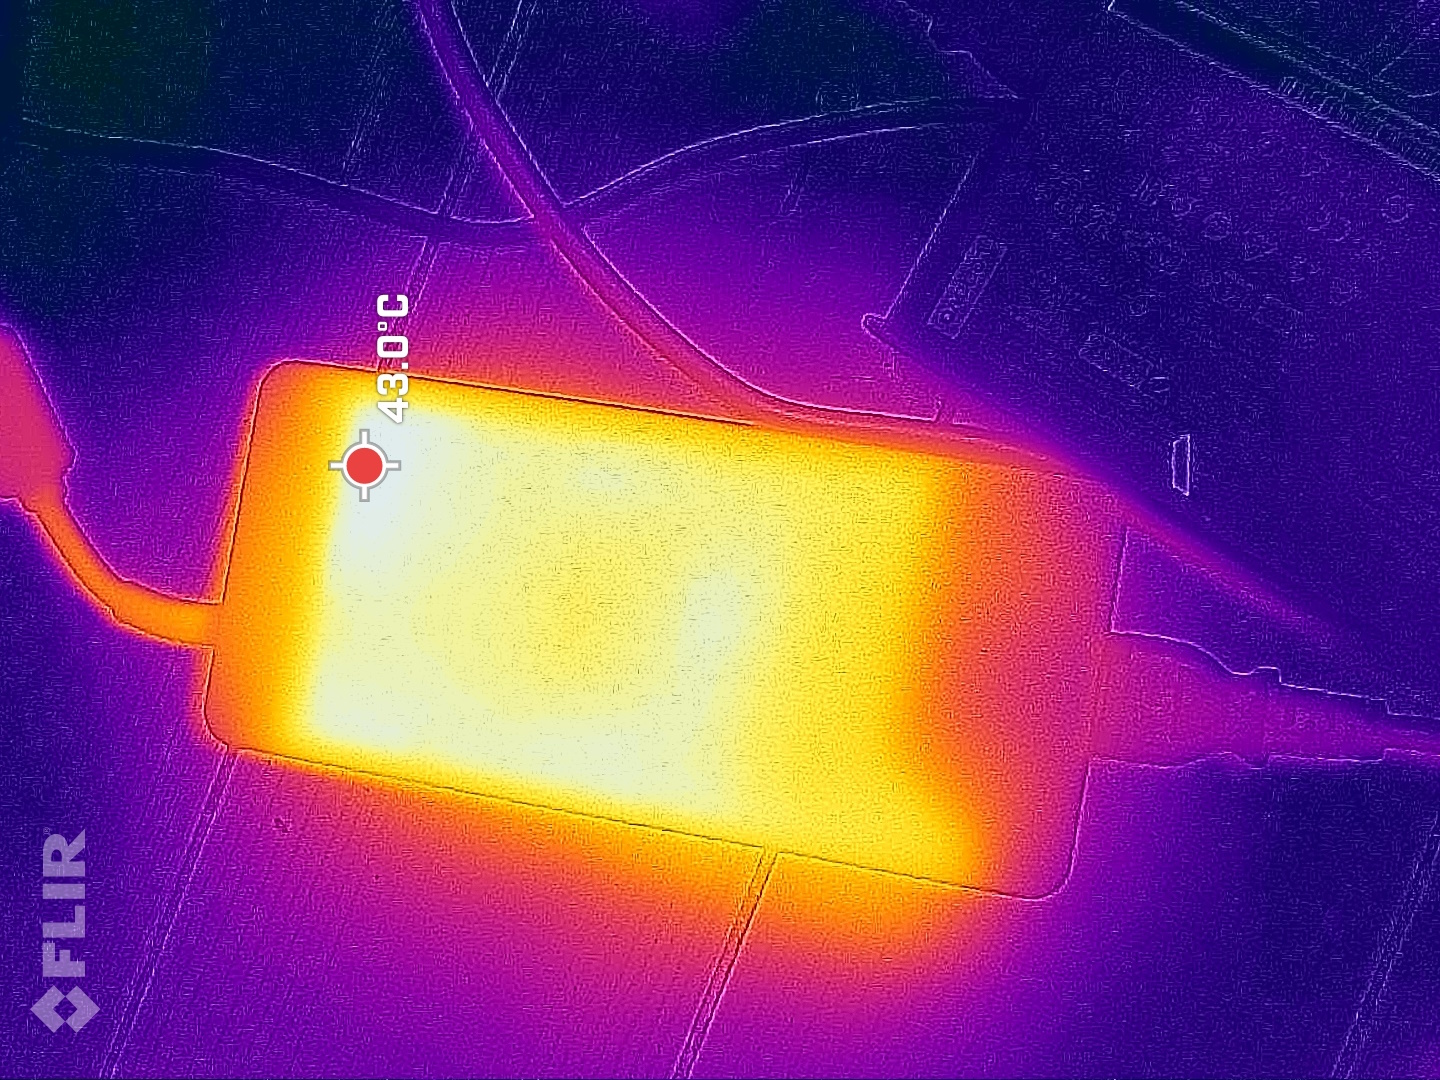
Kimse bir HX CPU ve bir RTX 4080'den tutumluluk beklemiyor ve bu nedenle Helios 18 sürpriz değil. Boştayken oldukça tutumludur, ancak oyun oynarken neredeyse eşit derecede güçlü olanMSI GE78HXyalnızca 319 W'lık kısa vadeli maksimum tüketim MSI'dan daha yüksektir. Büyük ve ağır Chicony güç kaynağı 330 W olarak derecelendirilmiştir ve Predator'a zorlu senaryolarda bile her zaman yeterli gücü sağlayabilmelidir.
| Kapalı / Bekleme modu | |
| Boşta | |
| Çalışırken |
|
Key:
min: | |
| Acer Predator Helios 18 N23Q2 i9-13900HX, GeForce RTX 4080 Laptop GPU, Samsung PM9A1 MZVL22T0HBLB, IPS, 2560x1600, 18" | MSI GE78HX 13VH-070US i9-13950HX, GeForce RTX 4080 Laptop GPU, Samsung PM9A1 MZVL22T0HBLB, IPS, 2560x1600, 17" | HP Omen 17-ck2097ng i9-13900HX, GeForce RTX 4080 Laptop GPU, SK hynix PC801 HFS001TEJ9X101N, IPS, 2560x1440, 17.3" | Alienware m18 R1 i9-13980HX, GeForce RTX 4090 Laptop GPU, SK hynix PC801 HFS001TEJ9X101N, IPS, 1920x1200, 18" | Asus ROG Strix G18 G814JI i7-13650HX, GeForce RTX 4070 Laptop GPU, Micron 2400 MTFDKBA1T0QFM, IPS, 2560x1600, 18" | Razer Blade 18 RTX 4070 i9-13950HX, GeForce RTX 4070 Laptop GPU, SSSTC CA6-8D1024, IPS, 2560x1600, 18" | Ortalama NVIDIA GeForce RTX 4080 Laptop GPU | Sınıf ortalaması Gaming | |
|---|---|---|---|---|---|---|---|---|
| Power Consumption | -13% | -1% | -47% | 20% | -37% | -14% | 7% | |
| Idle Minimum * (Watt) | 16 | 16.1 -1% | 16 -0% | 21.6 -35% | 8 50% | 24.5 -53% | 16.9 ? -6% | 13.1 ? 18% |
| Idle Average * (Watt) | 19 | 24 -26% | 20 -5% | 25.2 -33% | 15 21% | 34.1 -79% | 22 ? -16% | 18.8 ? 1% |
| Idle Maximum * (Watt) | 21.3 | 34 -60% | 26 -22% | 56.7 -166% | 26 -22% | 47.7 -124% | 34.1 ? -60% | 24.4 ? -15% |
| Load Average * (Watt) | 124 | 123.6 -0% | 135 -9% | 164.1 -32% | 102 18% | 140 -13% | 117.9 ? 5% | 108.6 ? 12% |
| Witcher 3 ultra * (Watt) | 289 | 286 1% | 215 26% | 311 -8% | 178.6 38% | 202 30% | ||
| Load Maximum * (Watt) | 319 | 285.7 10% | 299 6% | 338.9 -6% | 267 16% | 261 18% | 297 ? 7% | 255 ? 20% |
* ... daha küçük daha iyidir
Power consumption Witcher 3 / Stress test
Power consumption with an external monitor
Pil ömrü
Acer 90 Wh pil takarken, MSI ve Alienware sırasıyla 99 ve 97 Wh pile sahip. Kullanıcılar pil modunda ekran için kesinlikle SDR modunu kullanmalıdır, aksi takdirde 1000 HDR nit pili çok daha hızlı tüketecektir.
Helios 18, 150 nit azaltılmış parlaklıkta WiFi ve video testinde 4,5 ila neredeyse 5 saat dayanıyor. MSI biraz daha dayanıklıdır ve Alienware WiFi testinde benzer şekilde uzun süre dayanır.
| Acer Predator Helios 18 N23Q2 i9-13900HX, GeForce RTX 4080 Laptop GPU, 90 Wh | MSI GE78HX 13VH-070US i9-13950HX, GeForce RTX 4080 Laptop GPU, 99 Wh | HP Omen 17-ck2097ng i9-13900HX, GeForce RTX 4080 Laptop GPU, 83 Wh | Alienware m18 R1 i9-13980HX, GeForce RTX 4090 Laptop GPU, 97 Wh | Asus ROG Strix G18 G814JI i7-13650HX, GeForce RTX 4070 Laptop GPU, 90 Wh | Razer Blade 18 RTX 4070 i9-13950HX, GeForce RTX 4070 Laptop GPU, 91.7 Wh | Sınıf ortalaması Gaming | |
|---|---|---|---|---|---|---|---|
| Pil Çalışma Süresi | 14% | -20% | -31% | 28% | -17% | 44% | |
| H.264 (h) | 4.8 | 3.7 -23% | 8.9 ? 85% | ||||
| WiFi v1.3 (h) | 4.4 | 6.1 39% | 3.6 -18% | 4.3 -2% | 8.1 84% | 4 -9% | 7 ? 59% |
| Load (h) | 1.7 | 1.5 -12% | 1.4 -18% | 0.7 -59% | 1.2 -29% | 1.3 -24% | 1.51 ? -11% |
| Reader / Idle (h) | 7.3 | 4.2 | 5.6 | 11.7 | 7 | 8.71 ? |
Artılar
Eksiler
Karar - Soğutmada optimizasyon potansiyeline sahip güçlü oyuncu

Oyuncu performans açısından sıfır zayıflık ortaya koyuyor. Hem CPU hem de GPU, veritabanımızdaki aynı konfigürasyona sahip ortalama bir dizüstü bilgisayardan biraz daha iyi performans gösteriyor. Parlak ve yüksek kontrastlı MiniLED ekranın yanı sıra işçilik ve özellikler de etkileyici.
RTX 4060 ile iyi ayarlanmış Helios 16'nın aksine, daha zorlu bir RTX 4080'e sahip Helios 18'in zayıf yönleri ortaya çıkıyor: soğutma sistemi Turbo modunda çok gürültülü ve diğer alanlarda optimize edilmiş görünmüyor. Dizüstü bilgisayarın çoğu alanı alışılmadık derecede serin kalırken, sıcak nokta hala sınıftaki en sıcak noktalardan biri. Aynı zamanda, teorik olarak güçlü SSD modeli çok hızlı bir şekilde kısılıyor. Dizüstü bilgisayarı daha sessiz Performans modunda çalıştırmanızı öneririz.
Acer Predator Helios 18 güçlü performansa sahip bir dev, ancak yüksek sesli soğutma sisteminin optimizasyona ihtiyacı var.
Bugüne kadar yalnızca daha zayıf GPU'lara sahip 18 inçlik rakipleri inceledik, bu yüzden alternatif önermek o kadar kolay değil. Performans açısından, 17 inç MSI Raider GE78HX ayak uydurabilir, ancak daha zayıf bir ekranı vardır.
Fiyat ve bulunabilirlik
Acer Predator Helios 18 N23Q2
- 10/25/2023 v7 (old)
Christian Hintze
Şeffaflık
İncelenecek cihazların seçimi editör ekibimiz tarafından yapılır. Test örneği, bu incelemenin amacı doğrultusunda üretici veya perakendeci tarafından yazara ödünç olarak sağlanmıştır. Borç verenin bu inceleme üzerinde herhangi bir etkisi olmadığı gibi, üretici de yayınlanmadan önce bu incelemenin bir kopyasını almamıştır. Bu incelemeyi yayınlama zorunluluğu yoktu. Bağımsız bir medya şirketi olarak Notebookcheck, üreticilerin, perakendecilerin veya yayıncıların otoritesine tabi değildir.
Notebookcheck bu şekilde test yapıyor
Notebookcheck, tüm sonuçların karşılaştırılabilir olmasını sağlamak için her yıl yüzlerce dizüstü bilgisayarı ve akıllı telefonu standart prosedürler kullanarak bağımsız olarak inceliyor. Yaklaşık 20 yıldır test yöntemlerimizi sürekli olarak geliştirdik ve bu süreçte endüstri standartlarını belirledik. Test laboratuvarlarımızda deneyimli teknisyenler ve editörler tarafından yüksek kaliteli ölçüm ekipmanları kullanılmaktadır. Bu testler çok aşamalı bir doğrulama sürecini içerir. Karmaşık derecelendirme sistemimiz, nesnelliği koruyan yüzlerce sağlam temellere dayanan ölçüm ve kıyaslamaya dayanmaktadır.Price comparison

