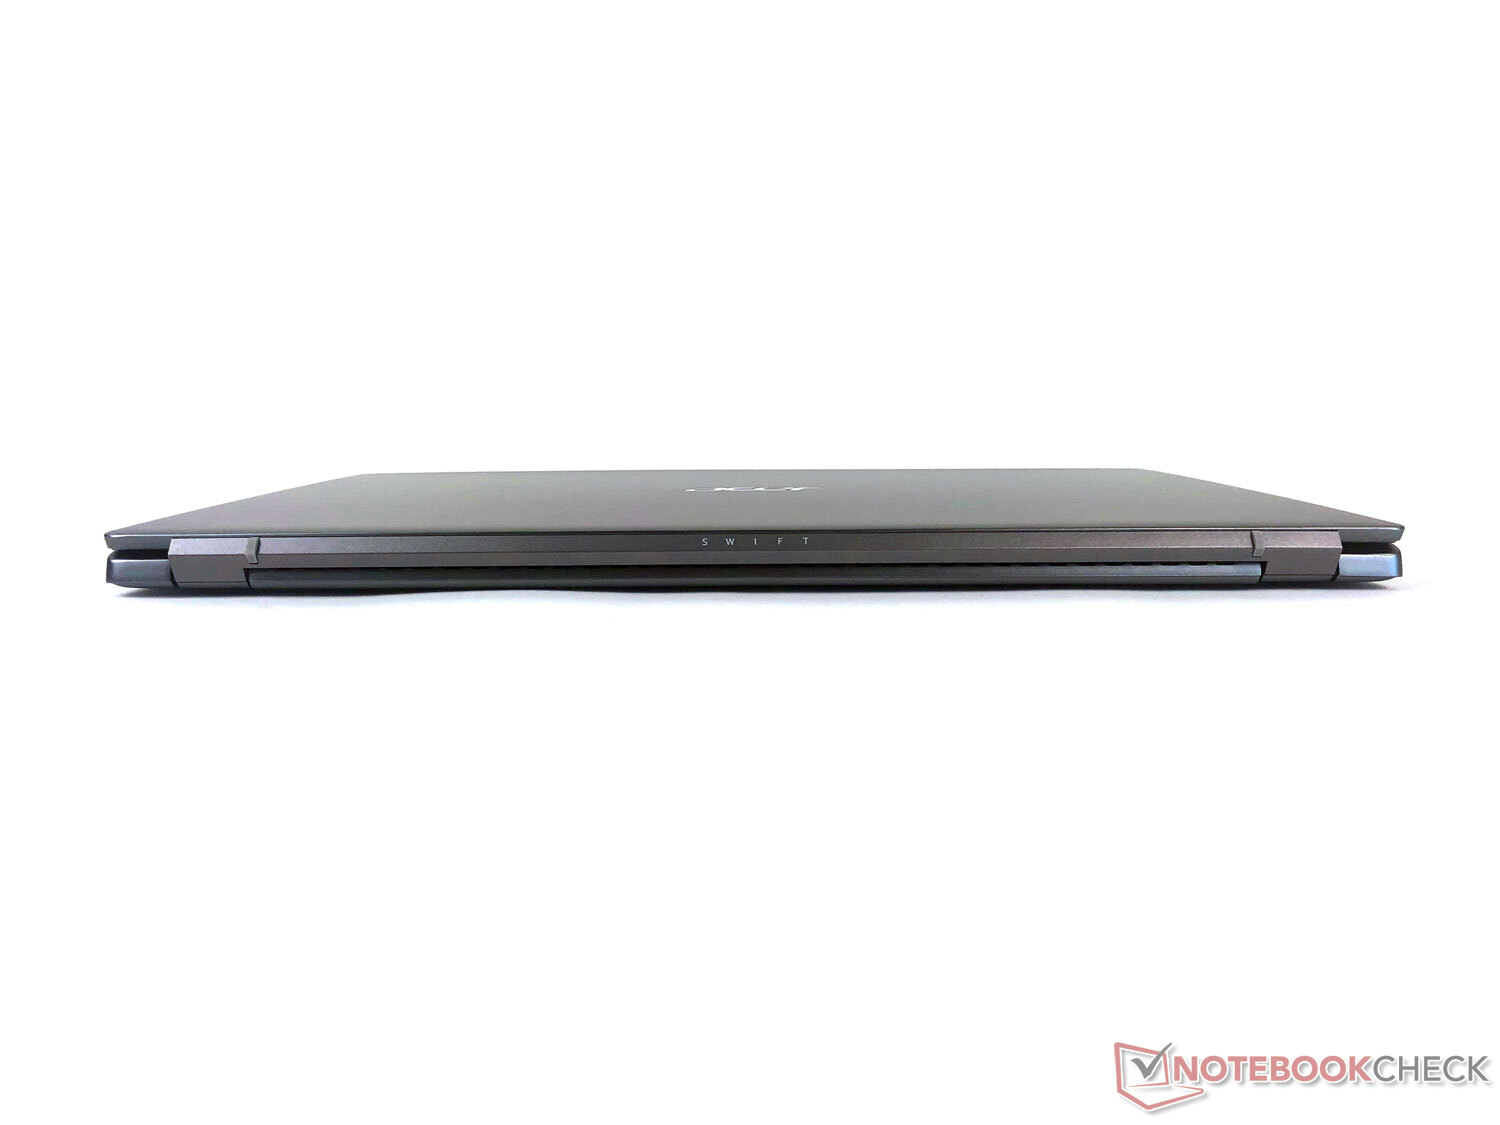
Acer Swift 3 SF316-51 rövid értékelés: Vajon nevéhez méltóan teljesít-e a laptop?
Possible contenders in comparison
Derecelendirme | Tarih | Modeli | Ağırlık | Yükseklik | Boyut | Çözünürlük | Fiyat |
|---|---|---|---|---|---|---|---|
| 86.4 % v7 (old) | 12/2021 | Acer Swift 3 SF316-51 i7-11370H, Iris Xe G7 96EUs | 1.7 kg | 15.9 mm | 16.10" | 1920x1080 | |
| 83.2 % v7 (old) | 09/2021 | Xiaomi RedmiBook Pro 15 i7-11370H, GeForce MX450 | 1.7 kg | 16 mm | 15.60" | 3200x2000 | |
| 82.3 % v7 (old) | Dell Inspiron 15 5518-2X3JR i5-11300H, GeForce MX450 | 1.8 kg | 18 mm | 15.60" | 1920x1080 | ||
| 86 % v7 (old) | 09/2021 | Lenovo IdeaPad 5 Pro 16IHU6 i5-11300H, GeForce MX450 | 1.9 kg | 18.4 mm | 16.00" | 2560x1600 | |
| 82.1 % v7 (old) | Asus VivoBook S15 D533UA R7 5700U, Vega 8 | 1.8 kg | 16.1 mm | 15.60" | 1920x1080 | ||
| 86 % v7 (old) | 04/2021 | Huawei MateBook D 16-53011VFJ R5 4600H, Vega 6 | 1.7 kg | 18.4 mm | 16.10" | 1920x1080 |


| |||||||||||||||||||||||||
Aydınlatma: 88 %
Batarya modunda parlaklık: 257 cd/m²
Kontrast: 1842:1 (Siyah: 0.165 cd/m²)
ΔE ColorChecker Calman: 1.44 | ∀{0.5-29.43 Ø4.73}
ΔE Greyscale Calman: 2.6 | ∀{0.09-98 Ø4.97}
99.5% sRGB (Argyll 1.6.3 3D)
68.5% AdobeRGB 1998 (Argyll 1.6.3 3D)
68.5% AdobeRGB 1998 (Argyll 3D)
99.5% sRGB (Argyll 3D)
66.6% Display P3 (Argyll 3D)
Gamma: 2.41
CCT: 6527 K
| Acer Swift 3 SF316-51 Chi Mei CMN160B, IPS, 1920x1080, 16.1" | Xiaomi RedmiBook Pro 15 IPS, 3200x2000, 15.6" | Dell Inspiron 15 5518-2X3JR BOE NV15N4V, IPS, 1920x1080, 15.6" | Lenovo IdeaPad 5 Pro 16IHU6 Lenovo LEN160WQXGA, IPS, 2560x1600, 16" | Asus VivoBook S15 D533UA Chi Mei N156HCA-EAB, IPS, 1920x1080, 15.6" | Huawei MateBook D 16-53011VFJ N161HCA-EA3, IPS, 1920x1080, 16.1" | |
|---|---|---|---|---|---|---|
| Display | -1% | -40% | 6% | -34% | 0% | |
| Display P3 Coverage (%) | 66.6 | 66.7 0% | 39.92 -40% | 74 11% | 43.6 -35% | 66.8 0% |
| sRGB Coverage (%) | 99.5 | 96.3 -3% | 58.8 -41% | 98.7 -1% | 65.2 -34% | 99 -1% |
| AdobeRGB 1998 Coverage (%) | 68.5 | 68.5 0% | 41.24 -40% | 74.5 9% | 45 -34% | 69 1% |
| Response Times | -15% | -42% | 60% | 25% | 6% | |
| Response Time Grey 50% / Grey 80% * (ms) | 32 ? | 34.8 ? -9% | 41 ? -28% | 13 ? 59% | 18 ? 44% | 25 ? 22% |
| Response Time Black / White * (ms) | 20 ? | 24 ? -20% | 31 ? -55% | 8 ? 60% | 19 ? 5% | 22 ? -10% |
| PWM Frequency (Hz) | 2500 ? | 1000 ? | 2500 ? | |||
| Screen | -60% | -55% | -21% | -69% | -2% | |
| Brightness middle (cd/m²) | 304 | 312 3% | 286 -6% | 356 17% | 289 -5% | 352 16% |
| Brightness (cd/m²) | 284 | 298 5% | 268 -6% | 322 13% | 267 -6% | 330 16% |
| Brightness Distribution (%) | 88 | 87 -1% | 87 -1% | 80 -9% | 85 -3% | 89 1% |
| Black Level * (cd/m²) | 0.165 | 0.18 -9% | 0.275 -67% | 0.27 -64% | 0.56 -239% | 0.28 -70% |
| Contrast (:1) | 1842 | 1733 -6% | 1040 -44% | 1319 -28% | 516 -72% | 1257 -32% |
| Colorchecker dE 2000 * | 1.44 | 5.39 -274% | 4.74 -229% | 2.4 -67% | 3.96 -175% | 1.35 6% |
| Colorchecker dE 2000 max. * | 3.62 | 9.95 -175% | 8.27 -128% | 4.42 -22% | 6.76 -87% | 2.58 29% |
| Greyscale dE 2000 * | 2.6 | 6.3 -142% | 1.57 40% | 2.81 -8% | 3.43 -32% | 2.02 22% |
| Gamma | 2.41 91% | 2.192 100% | 2.24 98% | 2.4 92% | 2.28 96% | 2.49 88% |
| CCT | 6527 100% | 7473 87% | 6348 102% | 6294 103% | 7191 90% | 6445 101% |
| Color Space (Percent of AdobeRGB 1998) (%) | 68.5 | 69 1% | 42 -39% | 63 -8% | ||
| Color Space (Percent of sRGB) (%) | 99.5 | 96 -4% | 65 -35% | 99 -1% | ||
| Colorchecker dE 2000 calibrated * | 3.15 | |||||
| Toplam Ortalama (Program / Ayarlar) | -25% /
-42% | -46% /
-50% | 15% /
-2% | -26% /
-50% | 1% /
-1% |
* ... daha küçük daha iyidir
Yanıt Sürelerini Görüntüle
| ↔ Tepki Süresi Siyahtan Beyaza | ||
|---|---|---|
| 20 ms ... yükseliş ↗ ve sonbahar↘ birleşimi | ↗ 11 ms yükseliş |  |
| ↘ 9 ms sonbahar | ||
| Ekran, testlerimizde iyi yanıt oranları gösteriyor ancak rekabetçi oyuncular için çok yavaş olabilir. Karşılaştırıldığında, test edilen tüm cihazlar 0.1 (minimum) ile 240 (maksimum) ms arasında değişir. » Tüm cihazların 44 %'si daha iyi. Bu, ölçülen yanıt süresinin test edilen tüm cihazların ortalamasına benzer olduğu anlamına gelir (19.9 ms). | ||
| ↔ Tepki Süresi %50 Griden %80 Griye | ||
| 32 ms ... yükseliş ↗ ve sonbahar↘ birleşimi | ↗ 15 ms yükseliş |  |
| ↘ 17 ms sonbahar | ||
| Ekran, testlerimizde yavaş yanıt oranları gösteriyor ve oyuncular için yetersiz olacaktır. Karşılaştırıldığında, test edilen tüm cihazlar 0.165 (minimum) ile 636 (maksimum) ms arasında değişir. » Tüm cihazların 43 %'si daha iyi. Bu, ölçülen yanıt süresinin test edilen tüm cihazların ortalamasına benzer olduğu anlamına gelir (31.1 ms). | ||
Ekran Titremesi / PWM (Darbe Genişliği Modülasyonu)
| Ekran titriyor / PWM algılandı | 2500 Hz | ≤ 10 % parlaklık ayarı |  |
Ekran arka ışığı 2500 Hz'de titriyor (en kötü durum, örneğin PWM kullanılması) 10 % ve altındaki parlaklık ayarında titreme algılandı. Bu parlaklık ayarının üzerinde titreme veya PWM olmamalıdır. 2500 Hz frekansı oldukça yüksektir, bu nedenle PWM'ye duyarlı çoğu kullanıcı herhangi bir titremeyi fark etmemelidir. Karşılaştırıldığında: Test edilen tüm cihazların %52 %'si ekranı karartmak için PWM kullanmıyor. PWM tespit edilirse, ortalama 7784 (minimum: 5 - maksimum: 343500) Hz ölçüldü. | |||
Cinebench R15 Multi endurance test
Cinebench R20: CPU (Single Core) | CPU (Multi Core)
Cinebench R15: CPU Single 64Bit | CPU Multi 64Bit
Blender: v2.79 BMW27 CPU
7-Zip 18.03: 7z b 4 -mmt1 | 7z b 4
Geekbench 5.5: Single-Core | Multi-Core
HWBOT x265 Benchmark v2.2: 4k Preset
LibreOffice : 20 Documents To PDF
R Benchmark 2.5: Overall mean
| Cinebench R23 / Single Core | |
| Sınıf ortalaması Multimedia (1128 - 2459, n=73, son 2 yıl) | |
| Acer Swift 3 SF316-51 | |
| Xiaomi RedmiBook Pro 15 | |
| Ortalama Intel Core i7-11370H (1081 - 1556, n=11) | |
| Lenovo IdeaPad 5 Pro 16IHU6 | |
| Dell Inspiron 15 5518-2X3JR | |
| Asus VivoBook S15 D533UA | |
| Huawei MateBook D 16-53011VFJ | |
| Cinebench R23 / Multi Core | |
| Sınıf ortalaması Multimedia (4861 - 33362, n=81, son 2 yıl) | |
| Asus VivoBook S15 D533UA | |
| Huawei MateBook D 16-53011VFJ | |
| Lenovo IdeaPad 5 Pro 16IHU6 | |
| Acer Swift 3 SF316-51 | |
| Xiaomi RedmiBook Pro 15 | |
| Xiaomi RedmiBook Pro 15 | |
| Ortalama Intel Core i7-11370H (3696 - 6646, n=12) | |
| Dell Inspiron 15 5518-2X3JR | |
| Cinebench R20 / CPU (Single Core) | |
| Sınıf ortalaması Multimedia (425 - 853, n=64, son 2 yıl) | |
| Acer Swift 3 SF316-51 | |
| Xiaomi RedmiBook Pro 15 | |
| Ortalama Intel Core i7-11370H (475 - 601, n=11) | |
| Lenovo IdeaPad 5 Pro 16IHU6 | |
| Dell Inspiron 15 5518-2X3JR | |
| Asus VivoBook S15 D533UA | |
| Huawei MateBook D 16-53011VFJ | |
| Cinebench R20 / CPU (Multi Core) | |
| Sınıf ortalaması Multimedia (1887 - 12912, n=64, son 2 yıl) | |
| Asus VivoBook S15 D533UA | |
| Huawei MateBook D 16-53011VFJ | |
| Lenovo IdeaPad 5 Pro 16IHU6 | |
| Acer Swift 3 SF316-51 | |
| Xiaomi RedmiBook Pro 15 | |
| Ortalama Intel Core i7-11370H (1438 - 2578, n=11) | |
| Dell Inspiron 15 5518-2X3JR | |
| Cinebench R15 / CPU Single 64Bit | |
| Sınıf ortalaması Multimedia (184.8 - 326, n=66, son 2 yıl) | |
| Xiaomi RedmiBook Pro 15 | |
| Xiaomi RedmiBook Pro 15 | |
| Acer Swift 3 SF316-51 | |
| Ortalama Intel Core i7-11370H (162.9 - 233, n=15) | |
| Asus VivoBook S15 D533UA | |
| Huawei MateBook D 16-53011VFJ | |
| Lenovo IdeaPad 5 Pro 16IHU6 | |
| Dell Inspiron 15 5518-2X3JR | |
| Cinebench R15 / CPU Multi 64Bit | |
| Sınıf ortalaması Multimedia (856 - 5224, n=68, son 2 yıl) | |
| Asus VivoBook S15 D533UA | |
| Huawei MateBook D 16-53011VFJ | |
| Xiaomi RedmiBook Pro 15 | |
| Xiaomi RedmiBook Pro 15 | |
| Xiaomi RedmiBook Pro 15 | |
| Acer Swift 3 SF316-51 | |
| Lenovo IdeaPad 5 Pro 16IHU6 | |
| Ortalama Intel Core i7-11370H (606 - 1086, n=17) | |
| Dell Inspiron 15 5518-2X3JR | |
| Blender / v2.79 BMW27 CPU | |
| Dell Inspiron 15 5518-2X3JR | |
| Lenovo IdeaPad 5 Pro 16IHU6 | |
| Xiaomi RedmiBook Pro 15 | |
| Ortalama Intel Core i7-11370H (432 - 762, n=11) | |
| Acer Swift 3 SF316-51 | |
| Huawei MateBook D 16-53011VFJ | |
| Asus VivoBook S15 D533UA | |
| Sınıf ortalaması Multimedia (100 - 557, n=65, son 2 yıl) | |
| 7-Zip 18.03 / 7z b 4 -mmt1 | |
| Sınıf ortalaması Multimedia (3666 - 7545, n=63, son 2 yıl) | |
| Xiaomi RedmiBook Pro 15 | |
| Acer Swift 3 SF316-51 | |
| Ortalama Intel Core i7-11370H (5074 - 5550, n=11) | |
| Lenovo IdeaPad 5 Pro 16IHU6 | |
| Dell Inspiron 15 5518-2X3JR | |
| Asus VivoBook S15 D533UA | |
| Huawei MateBook D 16-53011VFJ | |
| 7-Zip 18.03 / 7z b 4 | |
| Sınıf ortalaması Multimedia (29095 - 130368, n=62, son 2 yıl) | |
| Asus VivoBook S15 D533UA | |
| Huawei MateBook D 16-53011VFJ | |
| Acer Swift 3 SF316-51 | |
| Xiaomi RedmiBook Pro 15 | |
| Lenovo IdeaPad 5 Pro 16IHU6 | |
| Ortalama Intel Core i7-11370H (18961 - 28520, n=11) | |
| Dell Inspiron 15 5518-2X3JR | |
| Geekbench 5.5 / Single-Core | |
| Sınıf ortalaması Multimedia (805 - 2974, n=62, son 2 yıl) | |
| Acer Swift 3 SF316-51 | |
| Xiaomi RedmiBook Pro 15 | |
| Ortalama Intel Core i7-11370H (1376 - 1607, n=10) | |
| Lenovo IdeaPad 5 Pro 16IHU6 | |
| Dell Inspiron 15 5518-2X3JR | |
| Asus VivoBook S15 D533UA | |
| Huawei MateBook D 16-53011VFJ | |
| Geekbench 5.5 / Multi-Core | |
| Sınıf ortalaması Multimedia (4652 - 20422, n=62, son 2 yıl) | |
| Asus VivoBook S15 D533UA | |
| Acer Swift 3 SF316-51 | |
| Huawei MateBook D 16-53011VFJ | |
| Ortalama Intel Core i7-11370H (3828 - 6115, n=10) | |
| Xiaomi RedmiBook Pro 15 | |
| Lenovo IdeaPad 5 Pro 16IHU6 | |
| Dell Inspiron 15 5518-2X3JR | |
| HWBOT x265 Benchmark v2.2 / 4k Preset | |
| Sınıf ortalaması Multimedia (5.26 - 36.1, n=63, son 2 yıl) | |
| Asus VivoBook S15 D533UA | |
| Huawei MateBook D 16-53011VFJ | |
| Acer Swift 3 SF316-51 | |
| Ortalama Intel Core i7-11370H (4.98 - 8.82, n=11) | |
| Lenovo IdeaPad 5 Pro 16IHU6 | |
| Xiaomi RedmiBook Pro 15 | |
| Dell Inspiron 15 5518-2X3JR | |
| LibreOffice / 20 Documents To PDF | |
| Huawei MateBook D 16-53011VFJ | |
| Asus VivoBook S15 D533UA | |
| Lenovo IdeaPad 5 Pro 16IHU6 | |
| Sınıf ortalaması Multimedia (23.9 - 146.7, n=64, son 2 yıl) | |
| Xiaomi RedmiBook Pro 15 | |
| Dell Inspiron 15 5518-2X3JR | |
| Ortalama Intel Core i7-11370H (23.6 - 56.5, n=11) | |
| Acer Swift 3 SF316-51 | |
| R Benchmark 2.5 / Overall mean | |
| Dell Inspiron 15 5518-2X3JR | |
| Huawei MateBook D 16-53011VFJ | |
| Lenovo IdeaPad 5 Pro 16IHU6 | |
| Asus VivoBook S15 D533UA | |
| Ortalama Intel Core i7-11370H (0.544 - 0.596, n=11) | |
| Xiaomi RedmiBook Pro 15 | |
| Acer Swift 3 SF316-51 | |
| Sınıf ortalaması Multimedia (0.3604 - 0.947, n=63, son 2 yıl) | |
* ... daha küçük daha iyidir
PCMark 8: Storage Score v2 | Work Score Accelerated v2 | Creative Score Accelerated v2 | Home Score Accelerated v2
| PCMark 10 / Score | |
| Sınıf ortalaması Multimedia (4325 - 10386, n=58, son 2 yıl) | |
| Xiaomi RedmiBook Pro 15 | |
| Acer Swift 3 SF316-51 | |
| Asus VivoBook S15 D533UA | |
| Ortalama Intel Core i7-11370H, Intel Iris Xe Graphics G7 96EUs (5199 - 5459, n=6) | |
| Lenovo IdeaPad 5 Pro 16IHU6 | |
| Huawei MateBook D 16-53011VFJ | |
| Dell Inspiron 15 5518-2X3JR | |
| PCMark 10 / Essentials | |
| Sınıf ortalaması Multimedia (8025 - 11664, n=57, son 2 yıl) | |
| Ortalama Intel Core i7-11370H, Intel Iris Xe Graphics G7 96EUs (9996 - 10650, n=6) | |
| Acer Swift 3 SF316-51 | |
| Asus VivoBook S15 D533UA | |
| Huawei MateBook D 16-53011VFJ | |
| Lenovo IdeaPad 5 Pro 16IHU6 | |
| Xiaomi RedmiBook Pro 15 | |
| Dell Inspiron 15 5518-2X3JR | |
| PCMark 10 / Productivity | |
| Sınıf ortalaması Multimedia (7323 - 18233, n=57, son 2 yıl) | |
| Xiaomi RedmiBook Pro 15 | |
| Lenovo IdeaPad 5 Pro 16IHU6 | |
| Dell Inspiron 15 5518-2X3JR | |
| Asus VivoBook S15 D533UA | |
| Huawei MateBook D 16-53011VFJ | |
| Acer Swift 3 SF316-51 | |
| Ortalama Intel Core i7-11370H, Intel Iris Xe Graphics G7 96EUs (6911 - 7388, n=6) | |
| PCMark 10 / Digital Content Creation | |
| Sınıf ortalaması Multimedia (3651 - 16240, n=57, son 2 yıl) | |
| Xiaomi RedmiBook Pro 15 | |
| Acer Swift 3 SF316-51 | |
| Ortalama Intel Core i7-11370H, Intel Iris Xe Graphics G7 96EUs (5483 - 5838, n=6) | |
| Asus VivoBook S15 D533UA | |
| Lenovo IdeaPad 5 Pro 16IHU6 | |
| Huawei MateBook D 16-53011VFJ | |
| Dell Inspiron 15 5518-2X3JR | |
| PCMark 8 / Storage Score v2 | |
| Huawei MateBook D 16-53011VFJ | |
| Xiaomi RedmiBook Pro 15 | |
| Acer Swift 3 SF316-51 | |
| Ortalama Intel Core i7-11370H, Intel Iris Xe Graphics G7 96EUs (n=1) | |
| PCMark 8 / Work Score Accelerated v2 | |
| Xiaomi RedmiBook Pro 15 | |
| Asus VivoBook S15 D533UA | |
| Huawei MateBook D 16-53011VFJ | |
| Lenovo IdeaPad 5 Pro 16IHU6 | |
| Acer Swift 3 SF316-51 | |
| Ortalama Intel Core i7-11370H, Intel Iris Xe Graphics G7 96EUs (2996 - 3234, n=2) | |
| PCMark 8 / Creative Score Accelerated v2 | |
| Xiaomi RedmiBook Pro 15 | |
| Acer Swift 3 SF316-51 | |
| Ortalama Intel Core i7-11370H, Intel Iris Xe Graphics G7 96EUs (n=1) | |
| Huawei MateBook D 16-53011VFJ | |
| Lenovo IdeaPad 5 Pro 16IHU6 | |
| Asus VivoBook S15 D533UA | |
| PCMark 8 / Home Score Accelerated v2 | |
| Acer Swift 3 SF316-51 | |
| Sınıf ortalaması Multimedia (n=1son 2 yıl) | |
| Ortalama Intel Core i7-11370H, Intel Iris Xe Graphics G7 96EUs (5025 - 5575, n=2) | |
| Xiaomi RedmiBook Pro 15 | |
| Huawei MateBook D 16-53011VFJ | |
| Asus VivoBook S15 D533UA | |
| Lenovo IdeaPad 5 Pro 16IHU6 | |
| PCMark 8 Home Score Accelerated v2 | 5575 puan | |
| PCMark 8 Creative Score Accelerated v2 | 7666 puan | |
| PCMark 8 Work Score Accelerated v2 | 3234 puan | |
| PCMark 10 Score | 5459 puan | |
Yardım | ||
| DPC Latencies / LatencyMon - interrupt to process latency (max), Web, Youtube, Prime95 | |
| Xiaomi RedmiBook Pro 15 | |
| Dell Inspiron 15 5518-2X3JR | |
| Huawei MateBook D 16-53011VFJ | |
| Lenovo IdeaPad 5 Pro 16IHU6 | |
| Asus VivoBook S15 D533UA | |
| Acer Swift 3 SF316-51 | |
* ... daha küçük daha iyidir
| Acer Swift 3 SF316-51 Micron 2210 MTFDHBA512QFD | Xiaomi RedmiBook Pro 15 Toshiba KBG40ZNV512G | Dell Inspiron 15 5518-2X3JR Toshiba KBG40ZNS512G NVMe | Lenovo IdeaPad 5 Pro 16IHU6 Samsung SSD PM981a MZVLB512HBJQ | Asus VivoBook S15 D533UA WDC PC SN530 SDBPNPZ-1T00 | Huawei MateBook D 16-53011VFJ Samsung SSD PM981a MZVLB512HBJQ | Ortalama Micron 2210 MTFDHBA512QFD | |
|---|---|---|---|---|---|---|---|
| CrystalDiskMark 5.2 / 6 | 1% | 13% | 48% | 10% | 46% | -8% | |
| Write 4K (MB/s) | 171.8 | 136 -21% | 207.3 21% | 203 18% | 116.8 -32% | 147 -14% | 153.1 ? -11% |
| Read 4K (MB/s) | 79.4 | 60.4 -24% | 61.3 -23% | 52.3 -34% | 43.92 -45% | 65.5 -18% | 64.6 ? -19% |
| Write Seq (MB/s) | 1099 | 1447 32% | 1499 36% | 2138 95% | 1990 81% | 2680 144% | 1125 ? 2% |
| Read Seq (MB/s) | 1847 | 1507 -18% | 1858 1% | 1974 7% | 1959 6% | 2556 38% | 1808 ? -2% |
| Write 4K Q32T1 (MB/s) | 539 | 235.6 -56% | 510 -5% | 640 19% | 373.3 -31% | 413.4 -23% | 367 ? -32% |
| Read 4K Q32T1 (MB/s) | 555 | 737 33% | 640 15% | 707 27% | 524 -6% | 500 -10% | 507 ? -9% |
| Write Seq Q32T1 (MB/s) | 1095 | 1529 40% | 1521 39% | 2973 172% | 1985 81% | 2978 172% | 1138 ? 4% |
| Read Seq Q32T1 (MB/s) | 1988 | 2357 19% | 2316 16% | 3559 79% | 2456 24% | 3567 79% | 1997 ? 0% |
| AS SSD | -100% | -36% | 56% | 15% | 39% | -15% | |
| Seq Read (MB/s) | 2015 | 1972 -2% | 2086 4% | 2541 26% | 2082 3% | 2829 40% | 1885 ? -6% |
| Seq Write (MB/s) | 1055 | 981 -7% | 1124 7% | 2555 142% | 1844 75% | 2423 130% | 998 ? -5% |
| 4K Read (MB/s) | 73.9 | 55.8 -24% | 54.1 -27% | 56 -24% | 44.33 -40% | 42.06 -43% | 62.2 ? -16% |
| 4K Write (MB/s) | 223.2 | 133.5 -40% | 138.1 -38% | 129.6 -42% | 157.5 -29% | 126.1 -44% | 162 ? -27% |
| 4K-64 Read (MB/s) | 589 | 1277 117% | 1295 120% | 1633 177% | 1039 76% | 1481 151% | 585 ? -1% |
| 4K-64 Write (MB/s) | 1029 | 313.9 -69% | 750 -27% | 1863 81% | 1556 51% | 2009 95% | 863 ? -16% |
| Access Time Read * (ms) | 0.056 | 0.15 -168% | 0.141 -152% | 0.077 -38% | 0.05 11% | 0.079 -41% | 0.07329 ? -31% |
| Access Time Write * (ms) | 0.039 | 0.513 -1215% | 0.169 -333% | 0.029 26% | 0.065 -67% | 0.029 26% | 0.04957 ? -27% |
| Score Read (Points) | 865 | 1530 77% | 1558 80% | 1944 125% | 1292 49% | 1806 109% | 836 ? -3% |
| Score Write (Points) | 1358 | 546 -60% | 1001 -26% | 2248 66% | 1898 40% | 2377 75% | 1125 ? -17% |
| Score Total (Points) | 2644 | 2819 7% | 3316 25% | 5192 96% | 3845 45% | 5087 92% | 2366 ? -11% |
| Copy ISO MB/s (MB/s) | 1186 | 1105 -7% | 678 -43% | 2246 89% | 1441 22% | 1358 15% | 1191 ? 0% |
| Copy Program MB/s (MB/s) | 782 | 799 2% | 364.8 -53% | 861 10% | 484.9 -38% | 407.1 -48% | 477 ? -39% |
| Copy Game MB/s (MB/s) | 1028 | 957 -7% | 557 -46% | 1552 51% | 1098 7% | 918 -11% | 857 ? -17% |
| Toplam Ortalama (Program / Ayarlar) | -50% /
-63% | -12% /
-19% | 52% /
53% | 13% /
13% | 43% /
42% | -12% /
-13% |
* ... daha küçük daha iyidir

Continuous load read: DiskSpd Read Loop, Queue Depth 8
| 3DMark 11 - 1280x720 Performance GPU | |
| Sınıf ortalaması Multimedia (3765 - 60002, n=62, son 2 yıl) | |
| Lenovo IdeaPad 5 Pro 16IHU6 | |
| Dell Inspiron 15 5518-2X3JR | |
| Xiaomi RedmiBook Pro 15 | |
| Acer Swift 3 SF316-51 | |
| Ortalama Intel Iris Xe Graphics G7 96EUs (2867 - 7676, n=209) | |
| Asus VivoBook S15 D533UA | |
| Huawei MateBook D 16-53011VFJ | |
| 3DMark | |
| 1280x720 Cloud Gate Standard Graphics | |
| Sınıf ortalaması Multimedia (16765 - 143501, n=34, son 2 yıl) | |
| Lenovo IdeaPad 5 Pro 16IHU6 | |
| Acer Swift 3 SF316-51 | |
| Dell Inspiron 15 5518-2X3JR | |
| Ortalama Intel Iris Xe Graphics G7 96EUs (13162 - 39880, n=187) | |
| Xiaomi RedmiBook Pro 15 | |
| Huawei MateBook D 16-53011VFJ | |
| 1920x1080 Fire Strike Graphics | |
| Sınıf ortalaması Multimedia (2328 - 48907, n=66, son 2 yıl) | |
| Acer Swift 3 SF316-51 | |
| Lenovo IdeaPad 5 Pro 16IHU6 | |
| Ortalama Intel Iris Xe Graphics G7 96EUs (2286 - 6624, n=222) | |
| Dell Inspiron 15 5518-2X3JR | |
| Xiaomi RedmiBook Pro 15 | |
| Asus VivoBook S15 D533UA | |
| Huawei MateBook D 16-53011VFJ | |
| 2560x1440 Time Spy Graphics | |
| Sınıf ortalaması Multimedia (696 - 19403, n=67, son 2 yıl) | |
| Lenovo IdeaPad 5 Pro 16IHU6 | |
| Dell Inspiron 15 5518-2X3JR | |
| Acer Swift 3 SF316-51 | |
| Ortalama Intel Iris Xe Graphics G7 96EUs (707 - 1890, n=218) | |
| Asus VivoBook S15 D533UA | |
| Huawei MateBook D 16-53011VFJ | |
| 3DMark 11 Performance | 7431 puan | |
| 3DMark Cloud Gate Standard Score | 22314 puan | |
| 3DMark Fire Strike Score | 5300 puan | |
| 3DMark Time Spy Score | 1917 puan | |
Yardım | ||
| Rise of the Tomb Raider | |
| 1024x768 Lowest Preset | |
| Acer Swift 3 SF316-51 | |
| Ortalama Intel Iris Xe Graphics G7 96EUs (46 - 85.5, n=5) | |
| 1366x768 Medium Preset AF:2x | |
| Acer Swift 3 SF316-51 | |
| Ortalama Intel Iris Xe Graphics G7 96EUs (35.1 - 49, n=5) | |
| 1920x1080 High Preset AA:FX AF:4x | |
| Acer Swift 3 SF316-51 | |
| Ortalama Intel Iris Xe Graphics G7 96EUs (19.9 - 28.2, n=5) | |
| 1920x1080 Very High Preset AA:FX AF:16x | |
| Acer Swift 3 SF316-51 | |
| Ortalama Intel Iris Xe Graphics G7 96EUs (16.4 - 22.7, n=5) | |
| düşük | orta | yüksek | ultra | |
|---|---|---|---|---|
| The Witcher 3 (2015) | 101 | 62.6 | 33.3 | 17 |
| Dota 2 Reborn (2015) | 139 | 87.1 | 59 | 55.6 |
| Rise of the Tomb Raider (2016) | 81.1 | 49 | 28.2 | 22.7 |
| X-Plane 11.11 (2018) | 46.4 | 38.2 | 35.7 | |
| Strange Brigade (2018) | 90.8 | 40.3 | 32.5 | 26.4 |
Ses yüksekliği
| Boşta |
| 26 / 26 / 27.7 dB |
| Çalışırken |
| 32.7 / 39 dB |
 | ||
30 dB sessiz 40 dB(A) duyulabilirlik 50 dB(A) gürültülü |
||
min: | ||
(±) Üst taraftaki maksimum sıcaklık, 36.8 °C / 98 F ortalamasına kıyasla 40 °C / 104 F'dir. , Multimedia sınıfı için 21 ile 71 °C arasında değişir.
(-) Alt kısım, 39.1 °C / 102 F ortalamasına kıyasla maksimum 47 °C / 117 F'ye kadar ısınır
(+) Boşta kullanımda, üst tarafın ortalama sıcaklığı 28.2 °C / 83 F olup, cihazın 31.3 °C / 88 F.
(+) Avuç içi dayanakları ve dokunmatik yüzey maksimum (32.6 °C / 90.7 F) cilt sıcaklığına ulaşıyor ve bu nedenle sıcak değil.
(-) Benzer cihazların avuç içi dayanağı alanının ortalama sıcaklığı 28.7 °C / 83.7 F (-3.9 °C / -7 F) idi.
Acer Swift 3 SF316-51 ses analizi
(±) | hoparlör ses yüksekliği ortalama ama iyi (75.2 dB)
Bas 100 - 315Hz
(-) | neredeyse hiç bas yok - ortalama olarak medyandan 25.5% daha düşük
(±) | Bas doğrusallığı ortalamadır (12.1% delta - önceki frekans)
Ortalar 400 - 2000 Hz
(+) | dengeli ortalar - medyandan yalnızca 2.7% uzakta
(+) | orta frekanslar doğrusaldır (5.2% deltadan önceki frekansa)
Yüksekler 2 - 16 kHz
(+) | dengeli yüksekler - medyandan yalnızca 3.8% uzakta
(+) | yüksekler doğrusaldır (2.9% deltadan önceki frekansa)
Toplam 100 - 16.000 Hz
(±) | Genel sesin doğrusallığı ortalamadır (17.7% ortancaya göre fark)
Aynı sınıfla karşılaştırıldığında
» Bu sınıftaki tüm test edilen cihazların %51%'si daha iyi, 7% benzer, 42% daha kötüydü
» En iyisinin deltası 5% idi, ortalama 17% idi, en kötüsü 45% idi
Test edilen tüm cihazlarla karşılaştırıldığında
» Test edilen tüm cihazların %35'si daha iyi, 8 benzer, % 57 daha kötüydü
» En iyisinin deltası 4% idi, ortalama 24% idi, en kötüsü 134% idi
Apple MacBook 12 (Early 2016) 1.1 GHz ses analizi
(+) | hoparlörler nispeten yüksek sesle çalabilir (83.6 dB)
Bas 100 - 315Hz
(±) | azaltılmış bas - ortalama olarak medyandan 11.3% daha düşük
(±) | Bas doğrusallığı ortalamadır (14.2% delta - önceki frekans)
Ortalar 400 - 2000 Hz
(+) | dengeli ortalar - medyandan yalnızca 2.4% uzakta
(+) | orta frekanslar doğrusaldır (5.5% deltadan önceki frekansa)
Yüksekler 2 - 16 kHz
(+) | dengeli yüksekler - medyandan yalnızca 2% uzakta
(+) | yüksekler doğrusaldır (4.5% deltadan önceki frekansa)
Toplam 100 - 16.000 Hz
(+) | genel ses doğrusaldır (10.2% ortancaya göre fark)
Aynı sınıfla karşılaştırıldığında
» Bu sınıftaki tüm test edilen cihazların %7%'si daha iyi, 2% benzer, 91% daha kötüydü
» En iyisinin deltası 5% idi, ortalama 18% idi, en kötüsü 53% idi
Test edilen tüm cihazlarla karşılaştırıldığında
» Test edilen tüm cihazların %5'si daha iyi, 1 benzer, % 94 daha kötüydü
» En iyisinin deltası 4% idi, ortalama 24% idi, en kötüsü 134% idi
| Kapalı / Bekleme modu | |
| Boşta | |
| Çalışırken |
|
Key:
min: | |
| Acer Swift 3 SF316-51 i7-11370H, Iris Xe G7 96EUs, Micron 2210 MTFDHBA512QFD, IPS, 1920x1080, 16.1" | Xiaomi RedmiBook Pro 15 i7-11370H, GeForce MX450, Toshiba KBG40ZNV512G, IPS, 3200x2000, 15.6" | Dell Inspiron 15 5518-2X3JR i5-11300H, GeForce MX450, Toshiba KBG40ZNS512G NVMe, IPS, 1920x1080, 15.6" | Lenovo IdeaPad 5 Pro 16IHU6 i5-11300H, GeForce MX450, Samsung SSD PM981a MZVLB512HBJQ, IPS, 2560x1600, 16" | Asus VivoBook S15 D533UA R7 5700U, Vega 8, WDC PC SN530 SDBPNPZ-1T00, IPS, 1920x1080, 15.6" | Huawei MateBook D 16-53011VFJ R5 4600H, Vega 6, Samsung SSD PM981a MZVLB512HBJQ, IPS, 1920x1080, 16.1" | Ortalama Intel Iris Xe Graphics G7 96EUs | Sınıf ortalaması Multimedia | |
|---|---|---|---|---|---|---|---|---|
| Power Consumption | -62% | -18% | -56% | -18% | -14% | -23% | -59% | |
| Idle Minimum * (Watt) | 4.8 | 6 -25% | 4 17% | 5 -4% | 5 -4% | 5.2 -8% | 5.51 ? -15% | 5.71 ? -19% |
| Idle Average * (Watt) | 7.4 | 9 -22% | 7.6 -3% | 9 -22% | 7.7 -4% | 8.2 -11% | 8.66 ? -17% | 10.1 ? -36% |
| Idle Maximum * (Watt) | 9 | 12 -33% | 10.2 -13% | 9.4 -4% | 12.2 -36% | 9.4 -4% | 10.9 ? -21% | 12.4 ? -38% |
| Load Average * (Watt) | 34.9 | 74 -112% | 49.4 -42% | 71 -103% | 41 -17% | 40 -15% | 45.6 ? -31% | 65 ? -86% |
| Witcher 3 ultra * (Watt) | 34.9 | 70.7 -103% | 49.4 -42% | 72.4 -107% | 43 -23% | 40.5 -16% | ||
| Load Maximum * (Watt) | 51.4 | 91 -77% | 63.4 -23% | 99 -93% | 65 -26% | 67 -30% | 67.8 ? -32% | 112.2 ? -118% |
* ... daha küçük daha iyidir
Energy consumption during The Witcher 3 / stress test
| Acer Swift 3 SF316-51 i7-11370H, Iris Xe G7 96EUs, 56 Wh | Xiaomi RedmiBook Pro 15 i7-11370H, GeForce MX450, 70 Wh | Dell Inspiron 15 5518-2X3JR i5-11300H, GeForce MX450, 54 Wh | Lenovo IdeaPad 5 Pro 16IHU6 i5-11300H, GeForce MX450, 75 Wh | Asus VivoBook S15 D533UA R7 5700U, Vega 8, 50 Wh | Huawei MateBook D 16-53011VFJ R5 4600H, Vega 6, 56 Wh | Sınıf ortalaması Multimedia | |
|---|---|---|---|---|---|---|---|
| Pil Çalışma Süresi | -35% | -4% | -7% | -8% | -31% | 26% | |
| Reader / Idle (h) | 20.1 | 10.8 -46% | 19.4 -3% | 11.8 -41% | 25.2 ? 25% | ||
| H.264 (h) | 10.3 | 5.4 -48% | 10.4 1% | 8.5 -17% | 16.4 ? 59% | ||
| WiFi v1.3 (h) | 9.8 | 8.2 -16% | 9.4 -4% | 9.1 -7% | 9 -8% | 9 -8% | 12 ? 22% |
| Witcher 3 ultra (h) | 2.2 | 1 -55% | |||||
| Load (h) | 1.7 | 1.2 -29% | 1.4 -18% | 1.1 -35% | 1.675 ? -1% |
Artılar
Eksiler
Összegzés: Az Acer Swift 3 meggyőzött minket a tesztben

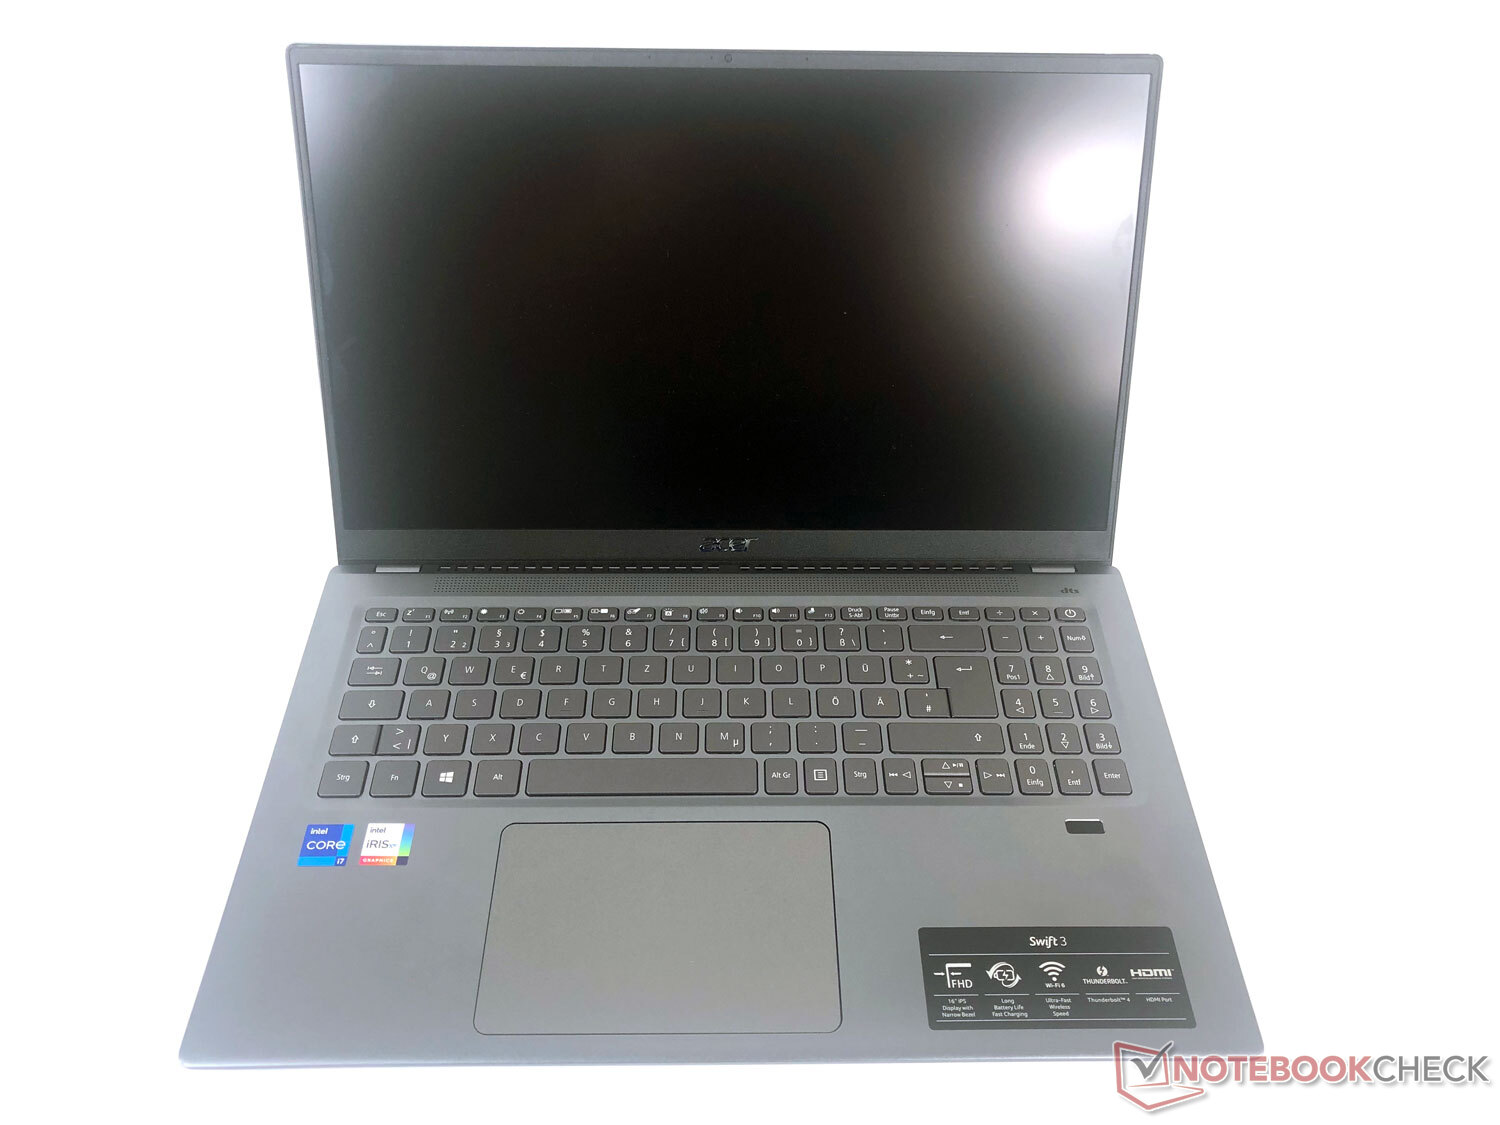
Az Acer Swift 3 SF316-51-75MK tesztünkben egy kiforrott készülék hatását keltette.
Az Acer Swift 3 teljesítménye ebben a laptop kategóriában több mint elegendő az általános alkalmazásokhoz, mint például webböngészés, irodai feladatok vagy streaming. A CPU a valamivel nagyobb igényű alkalmazásokkal is megbirkózik. Néhány játékot is képes futtatni, még ha legtöbbször csak közepes grafikai beállítások mellett is.
A Swift 3 bizonyította, hogy kiemelkedő tulajdonságokkal rendelkezik az energiafogyasztás és így az üzemidő tekintetében is - a meglehetősen kis méretű akkumulátor ellenére. A választott versenytársaknak e tekintetben alig volt esélye. A nagy kontrasztú és élénk kijelző is tetszetős, de lehetett volna egy kicsit világosabb is.
A vásárlók 1000 euró körüli összegért egy kiegyensúlyozott laptopot kapnak, amely nem mutat komolyabb gyengeségeket a tesztben, és amelynek nem kell visszariadnia a versenytársaktól ebben az árkategóriában. Egy jó mindenes, amely munkára és szórakozásra egyaránt alkalmas.
Az összehasonlításra használt modellek közül ez nyújtja a legjobb teljesítményt, de néhány esetben 100-200 euróval drágább is, mint a versenytársak. A teljesítmény szempontjából közel álló alternatívák közé tartozik a Xiaomi RedmiBook Pro 15 ugyanezzel a processzorral, vagy a Lenovo IdeaPad 5 Pro 16IHU6 a gyengébb i5-11300H-val, és mindkettő dedikált grafikus megoldásként GeForce MX450-nel felszerelt.
Ár és elérhetőség
A cikk írásakor az Acer Swift 3 (Intel Core i7-11370H, Intel Iris Xe Graphics G7 96EUs, 16 GB DDR4x RAM, 512 GB SSD) az Amazonon 999 dollár körüli áron kapható.
Acer Swift 3 SF316-51
- 10/01/2021 v7 (old)
Marcus Schwarten
Price comparison

