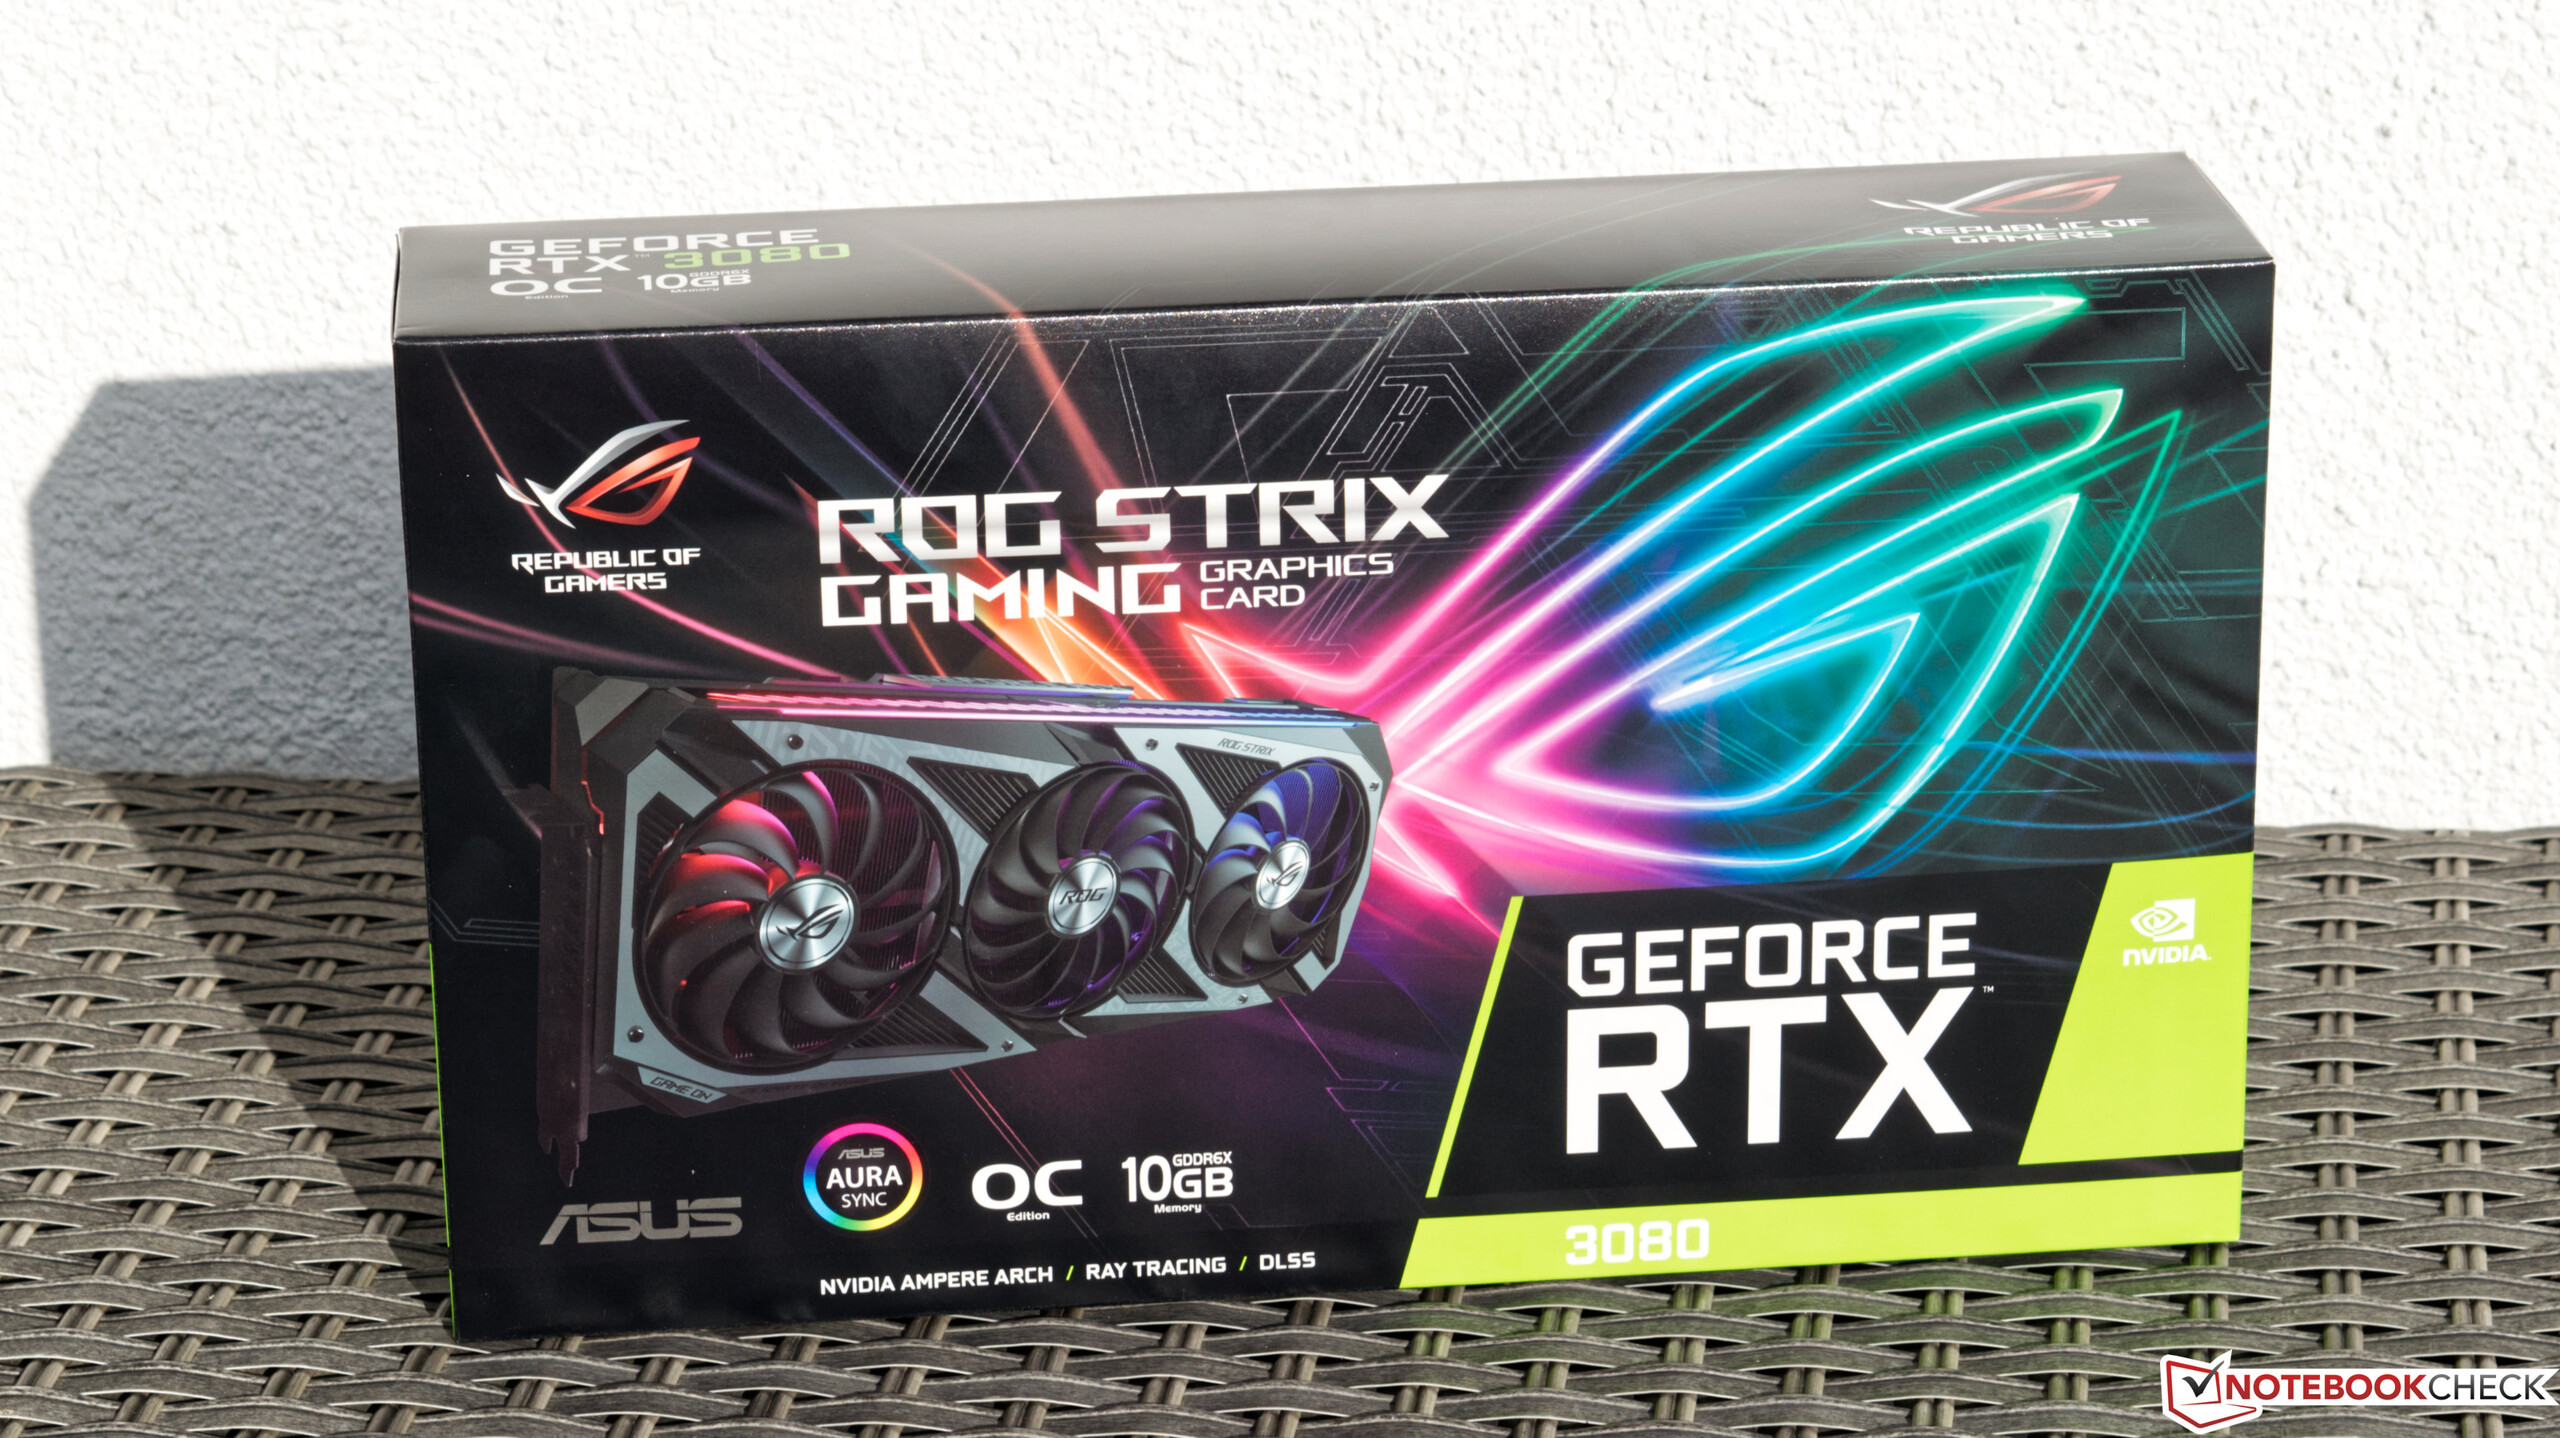
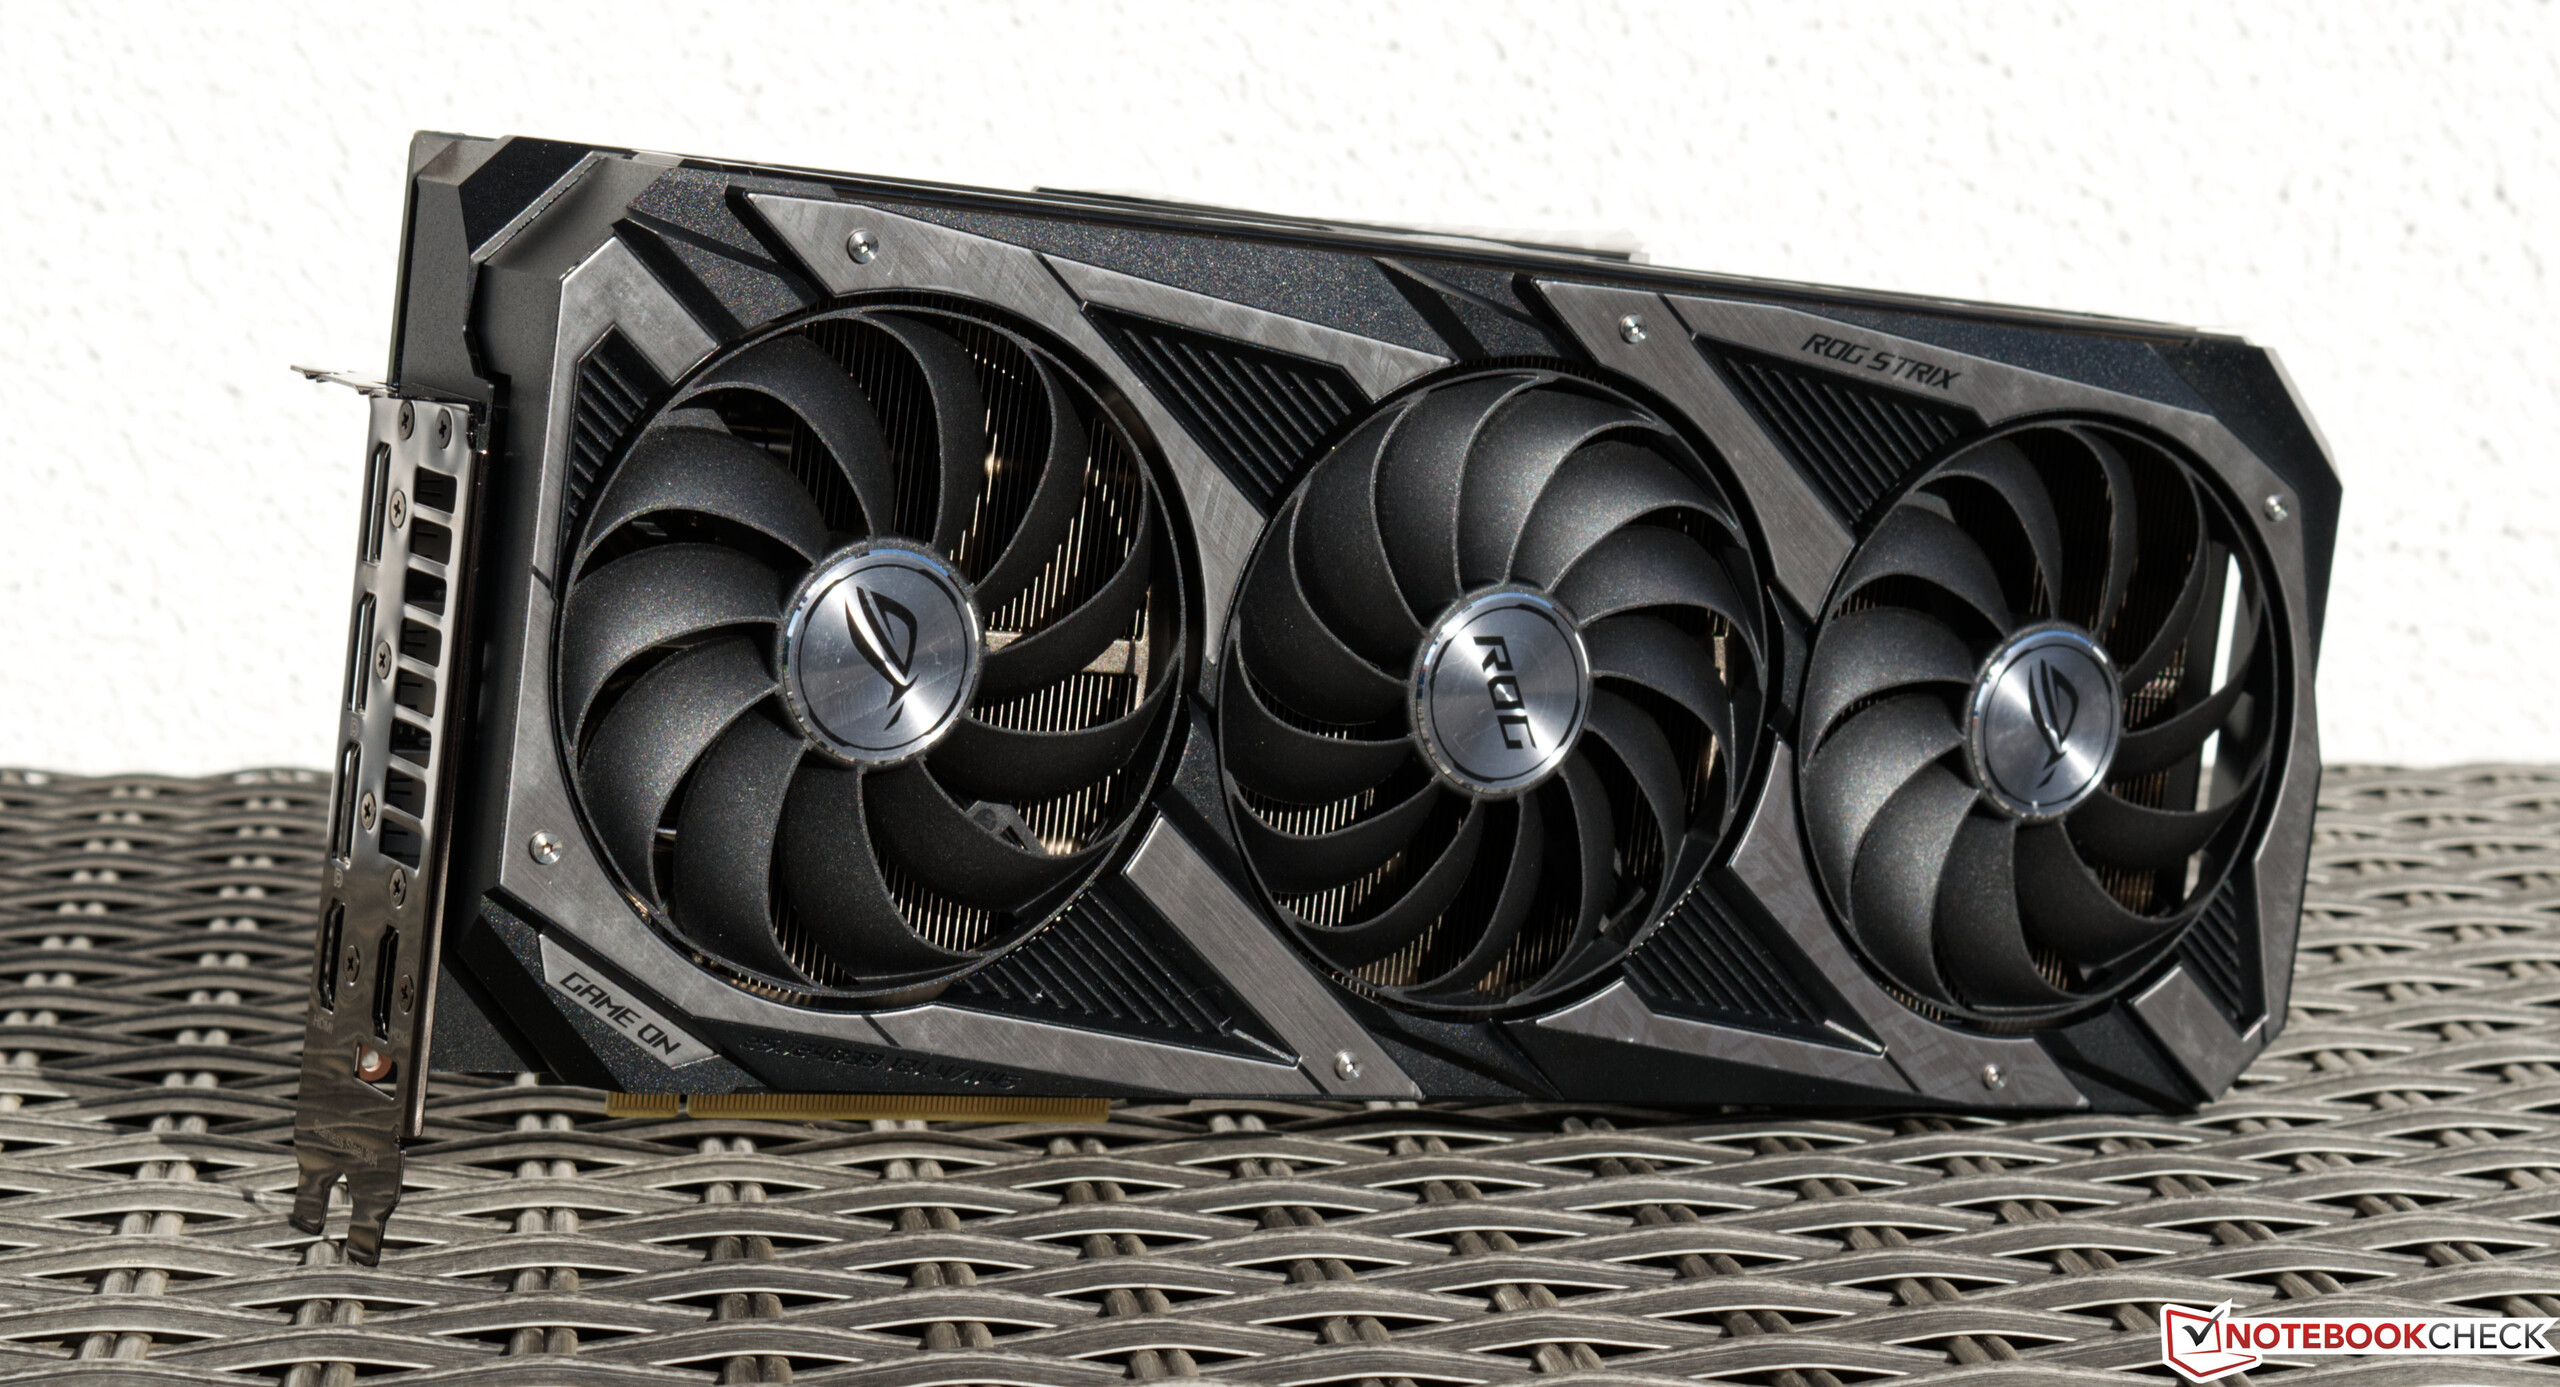
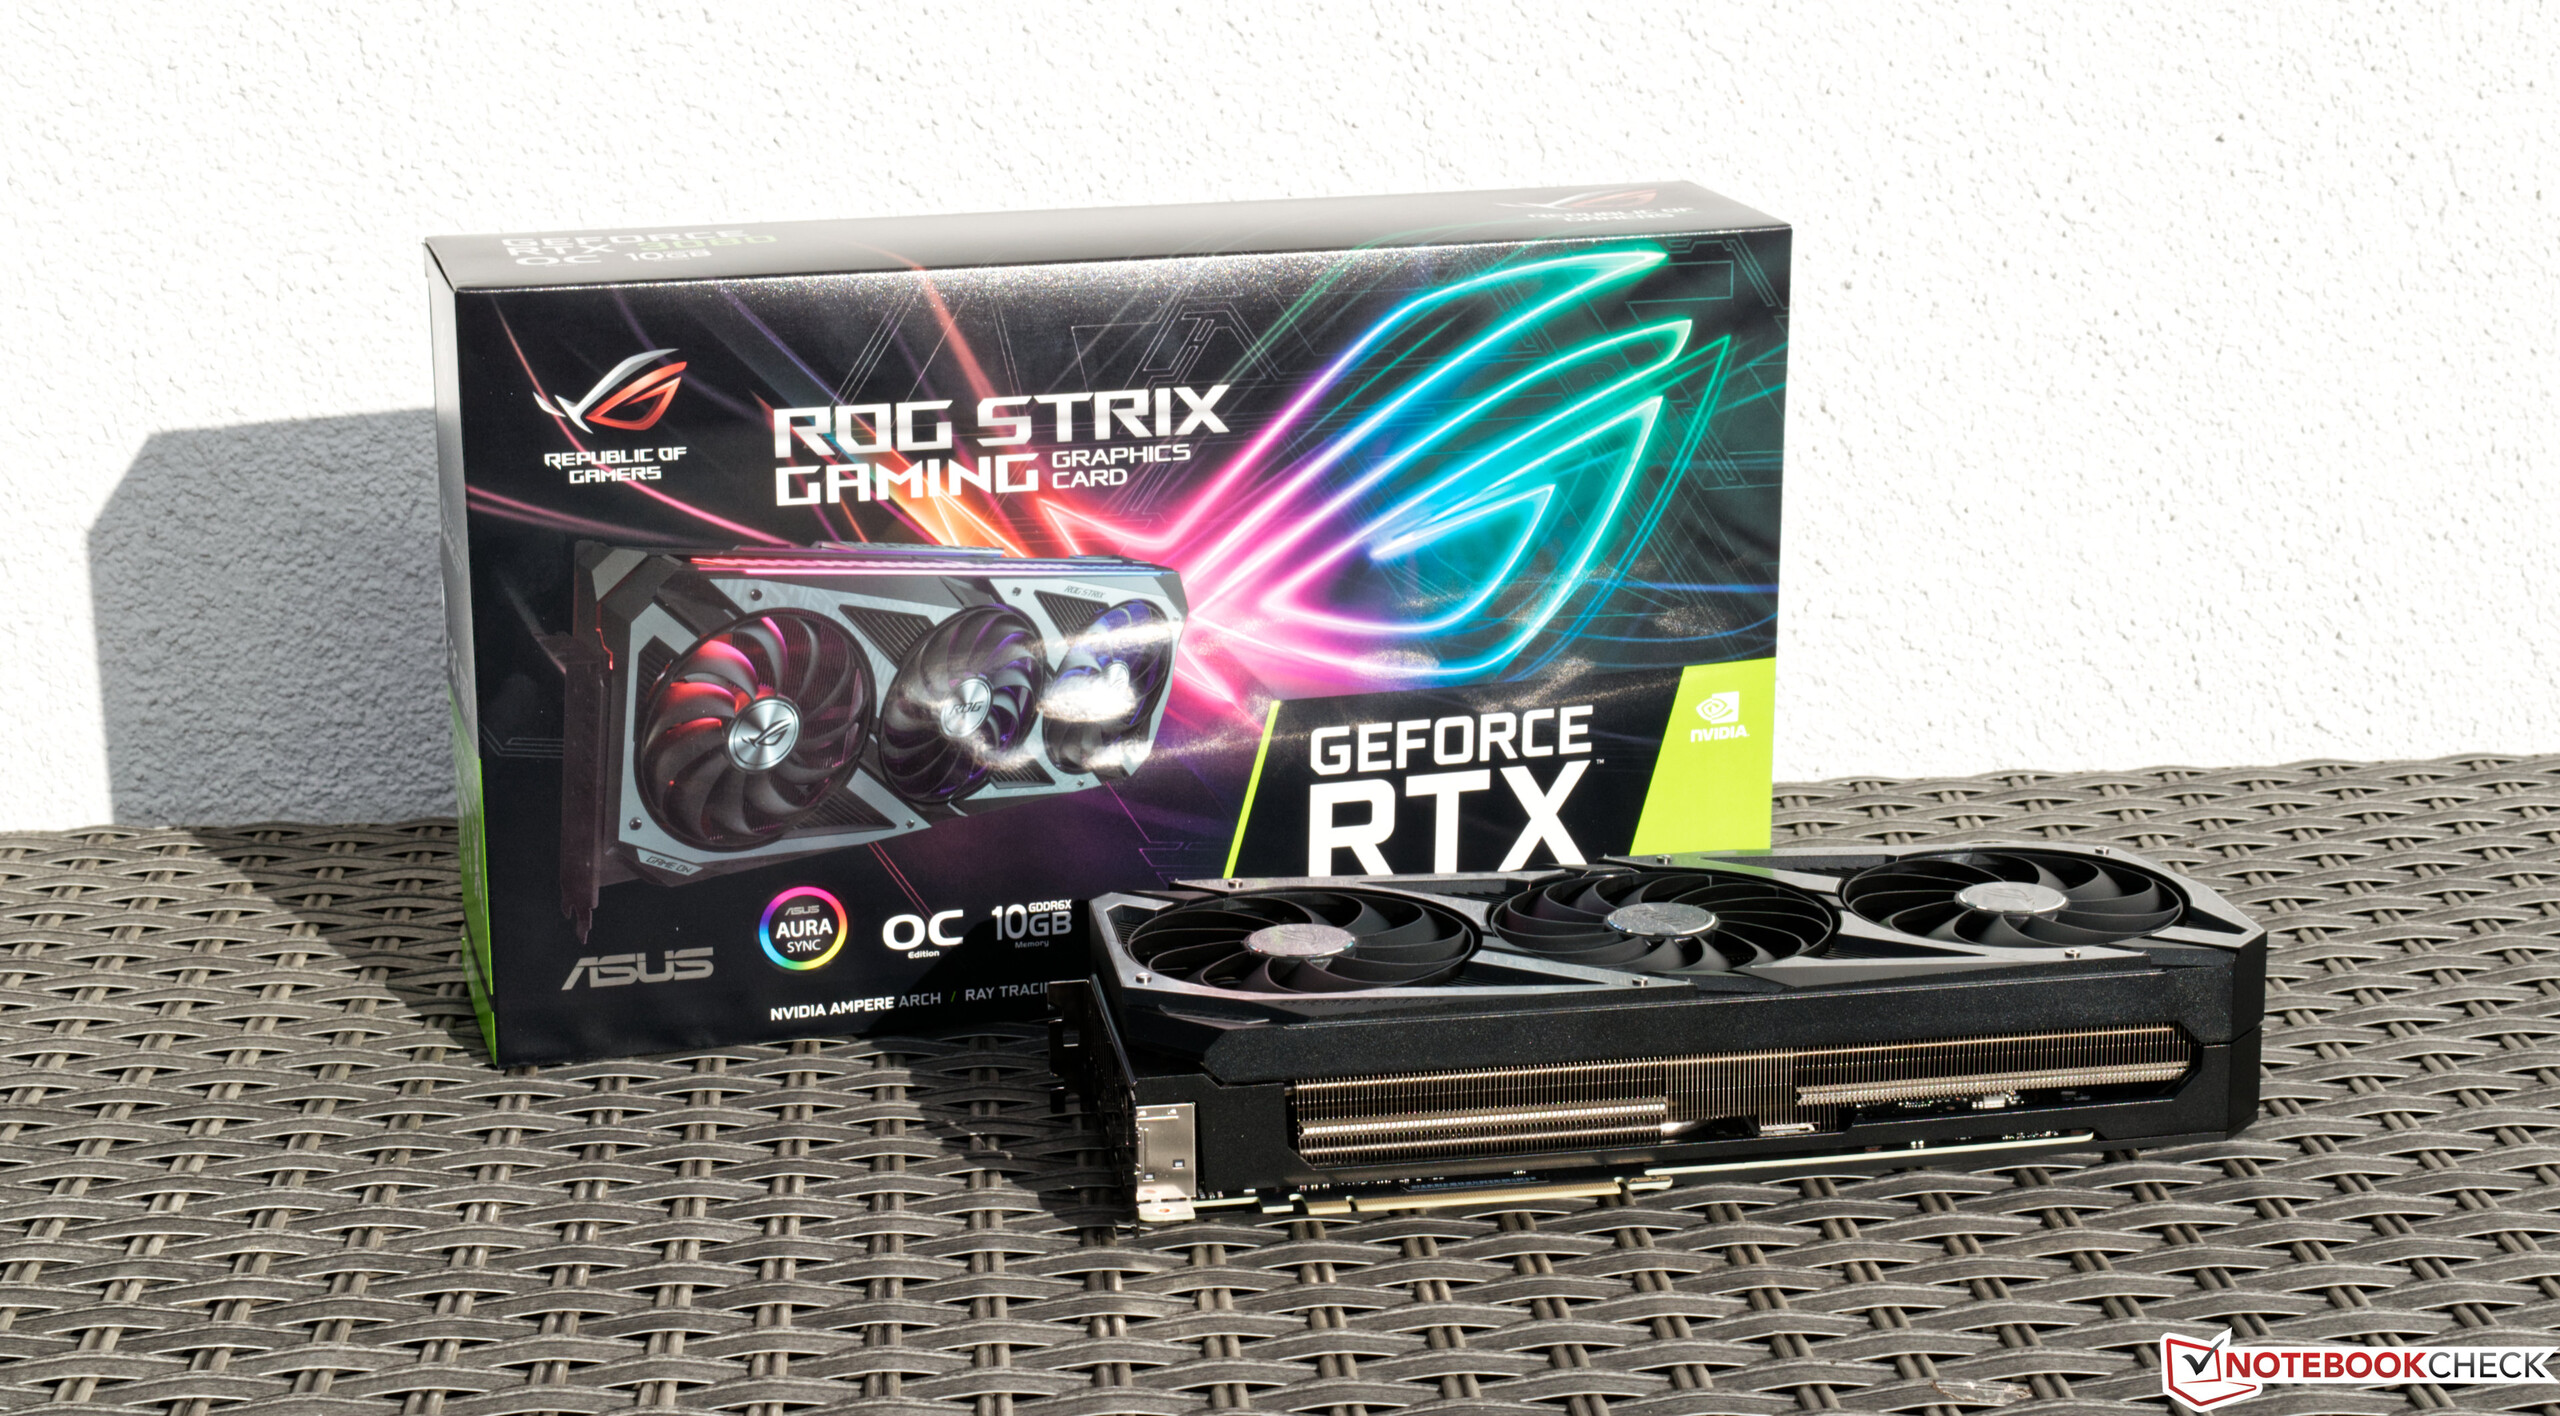
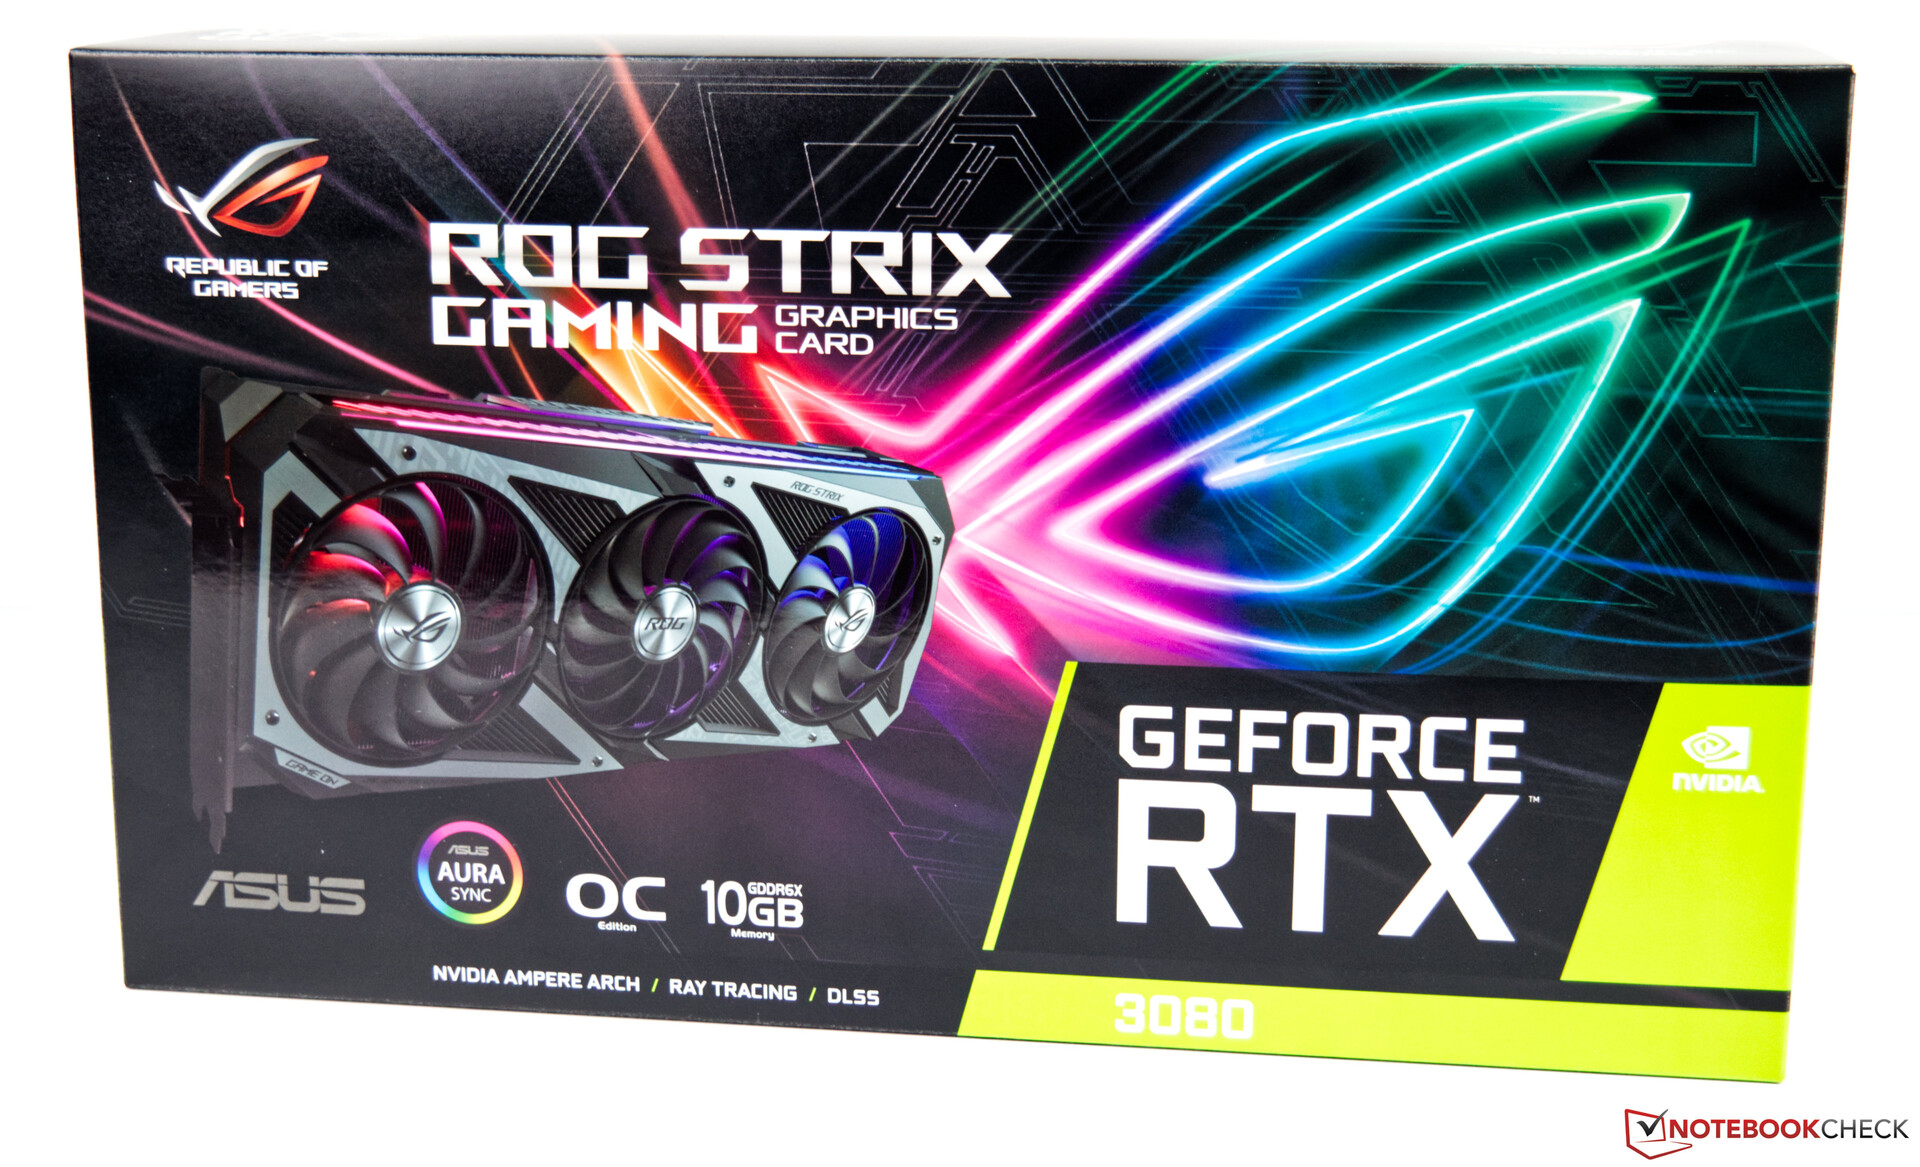
Asus GeForce RTX 3080 ROG Strix Gaming OC masaüstü GPU incelemede
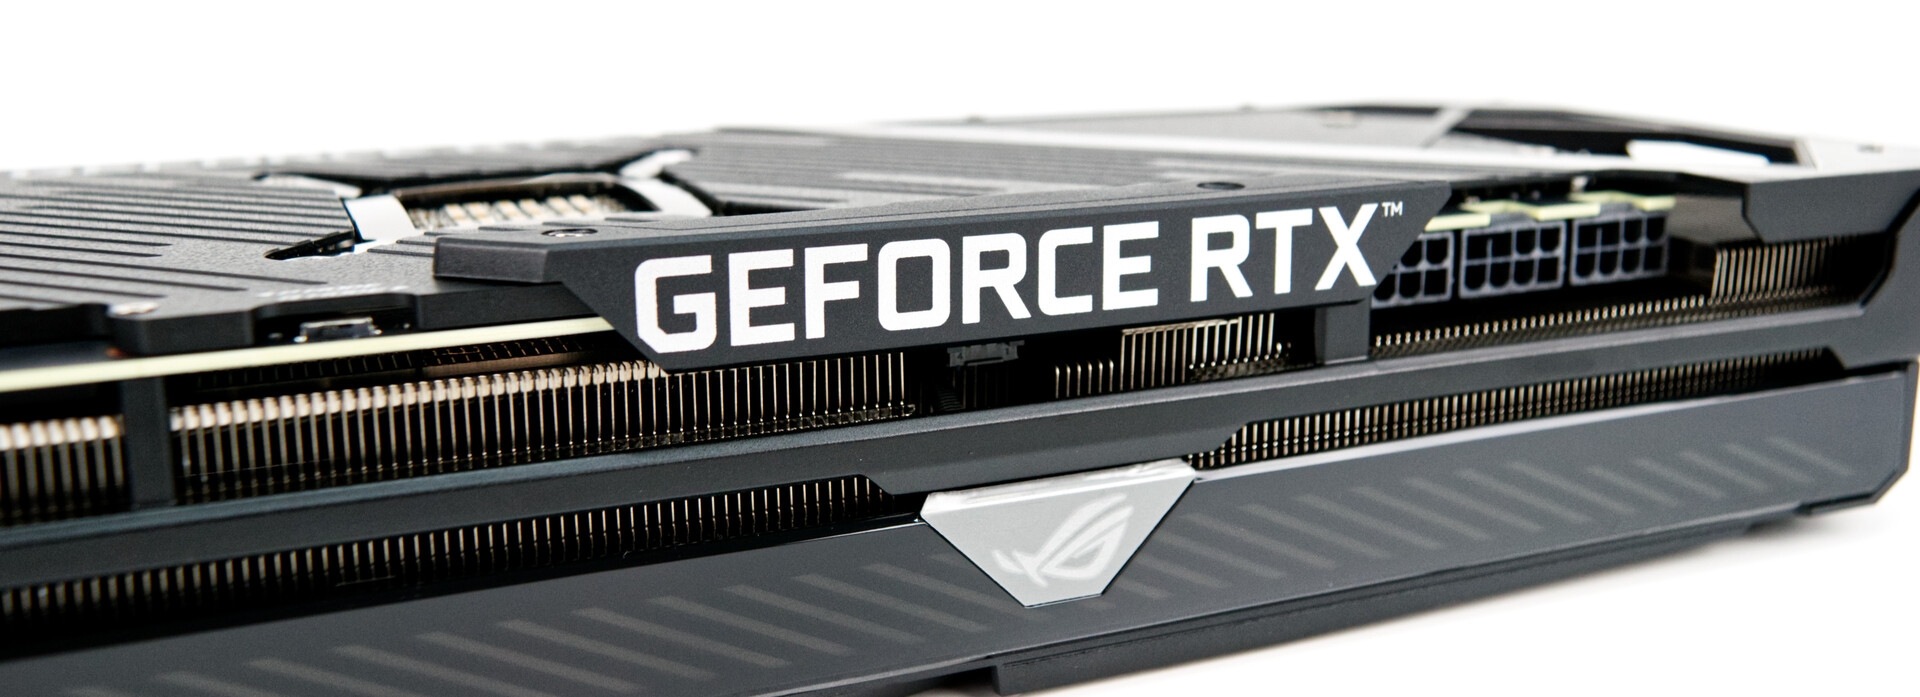
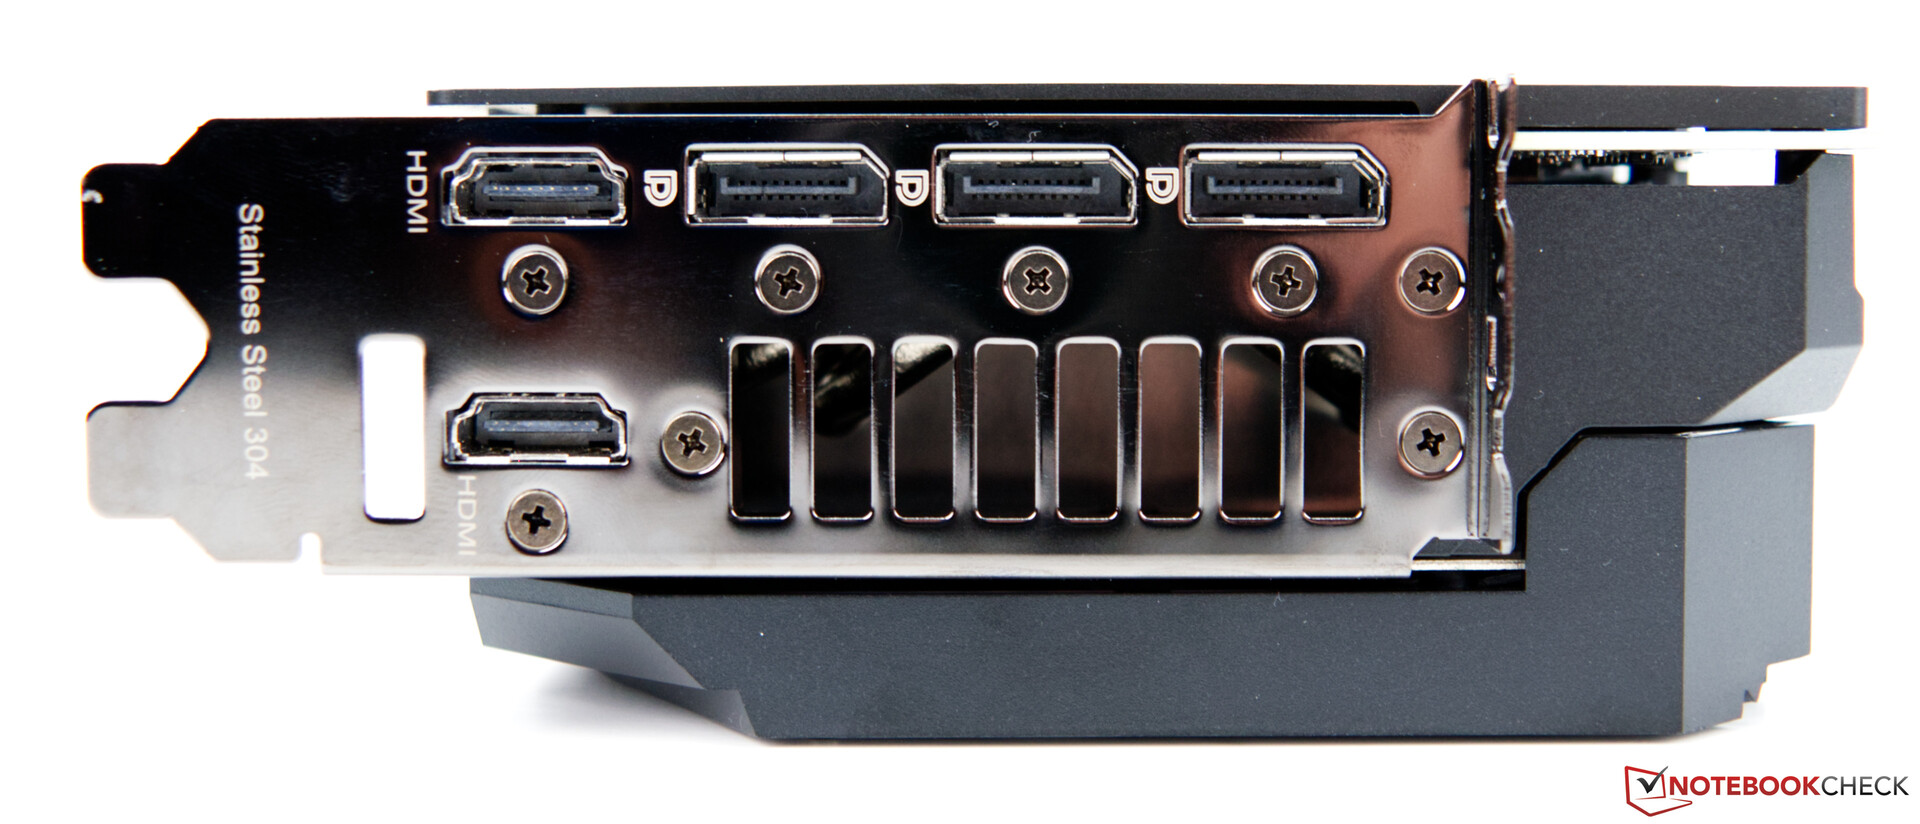
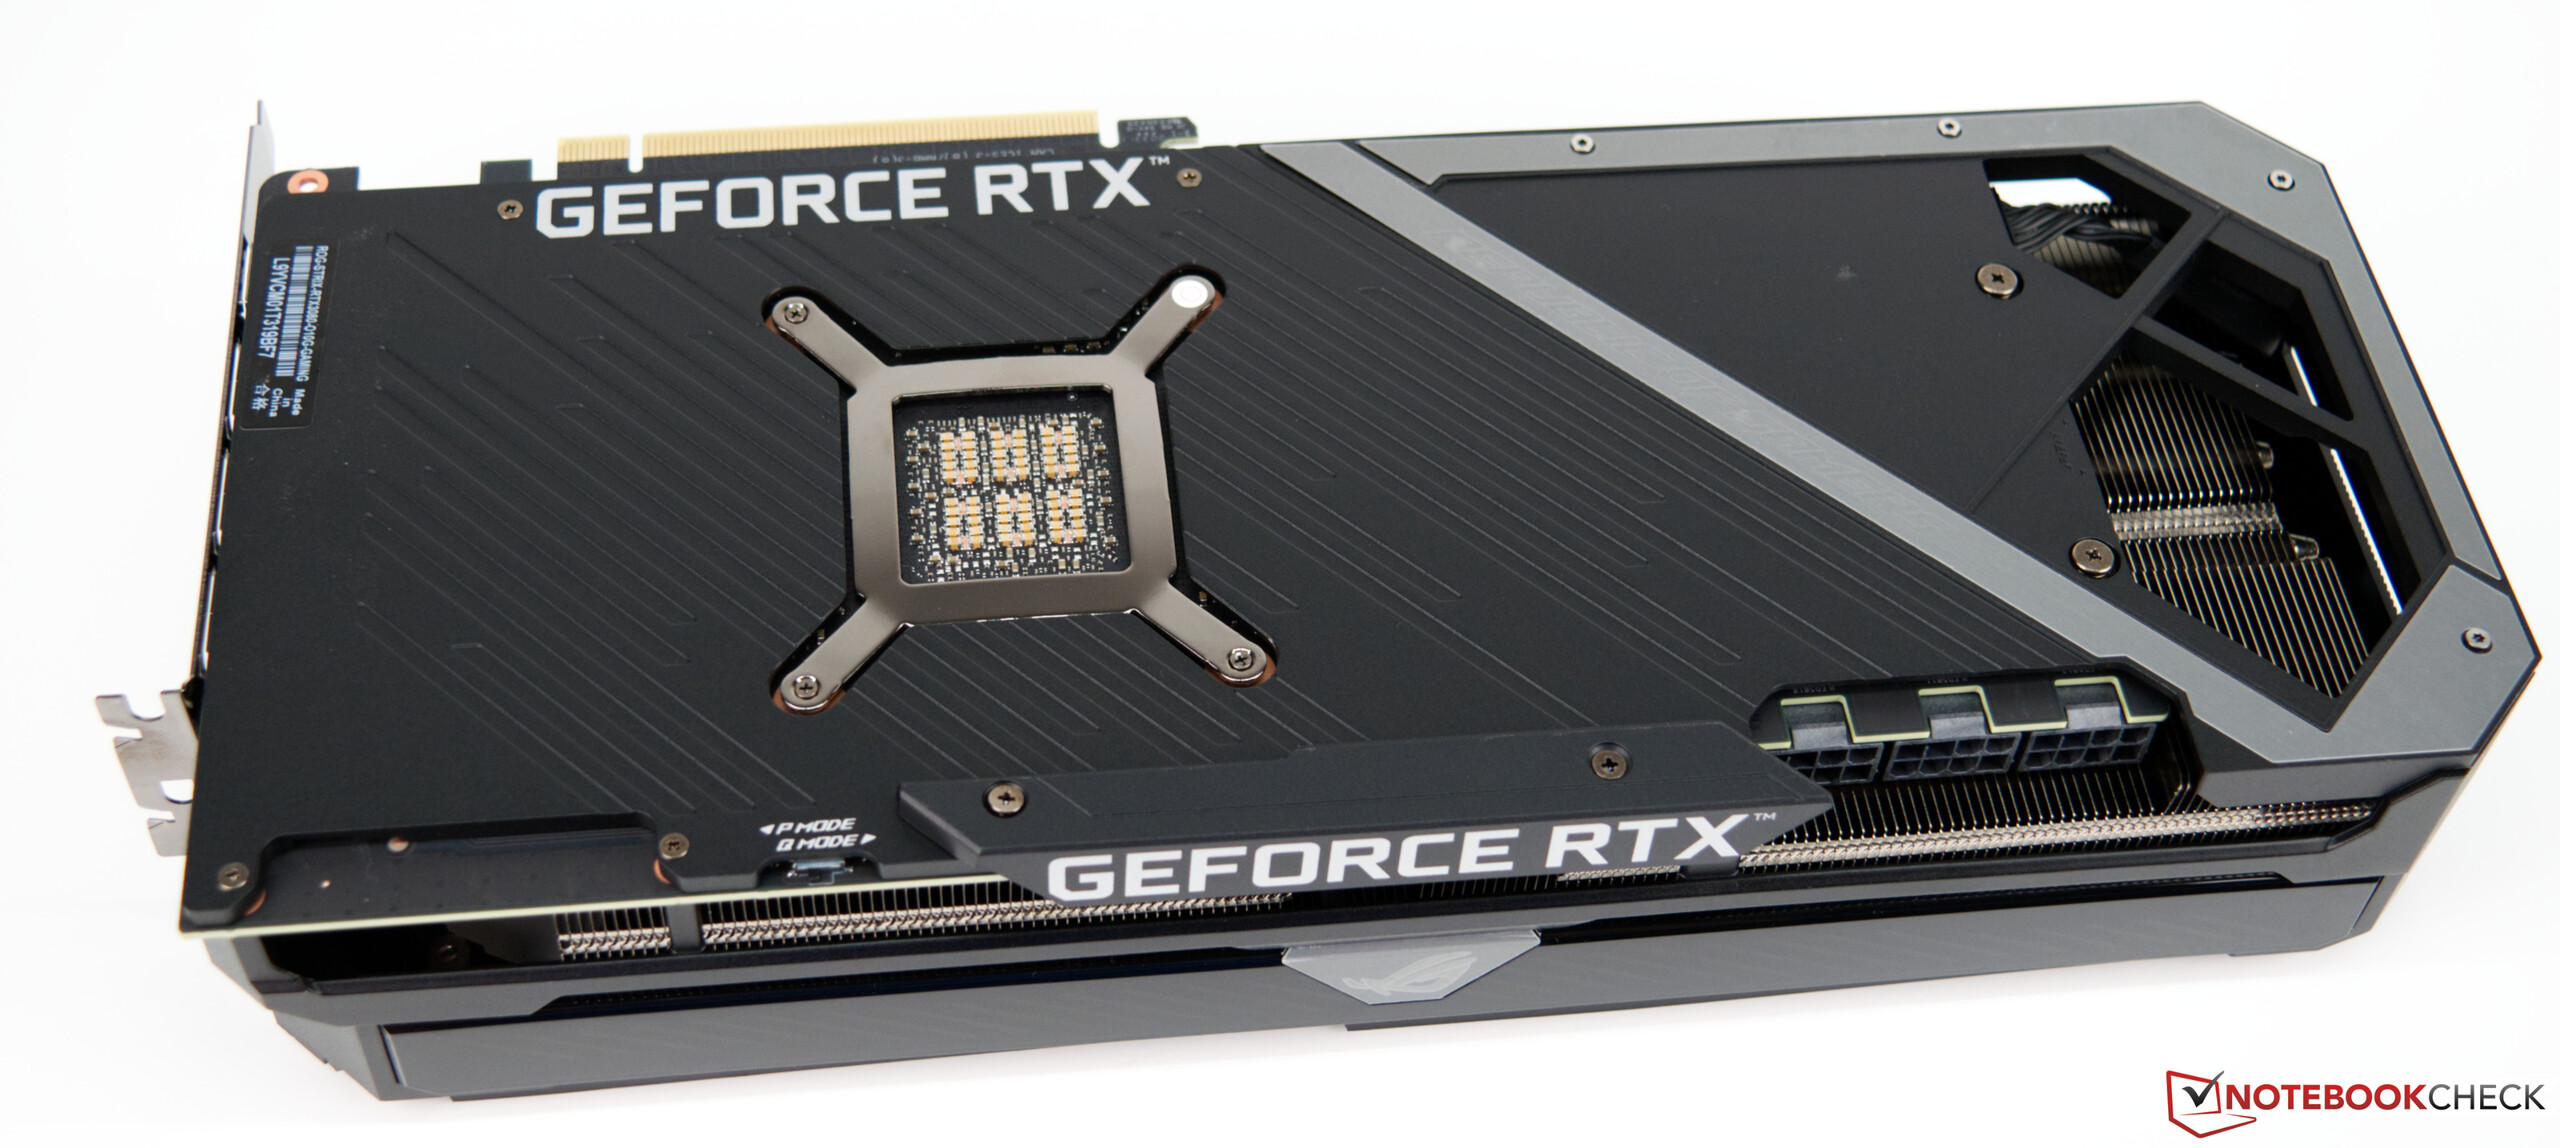
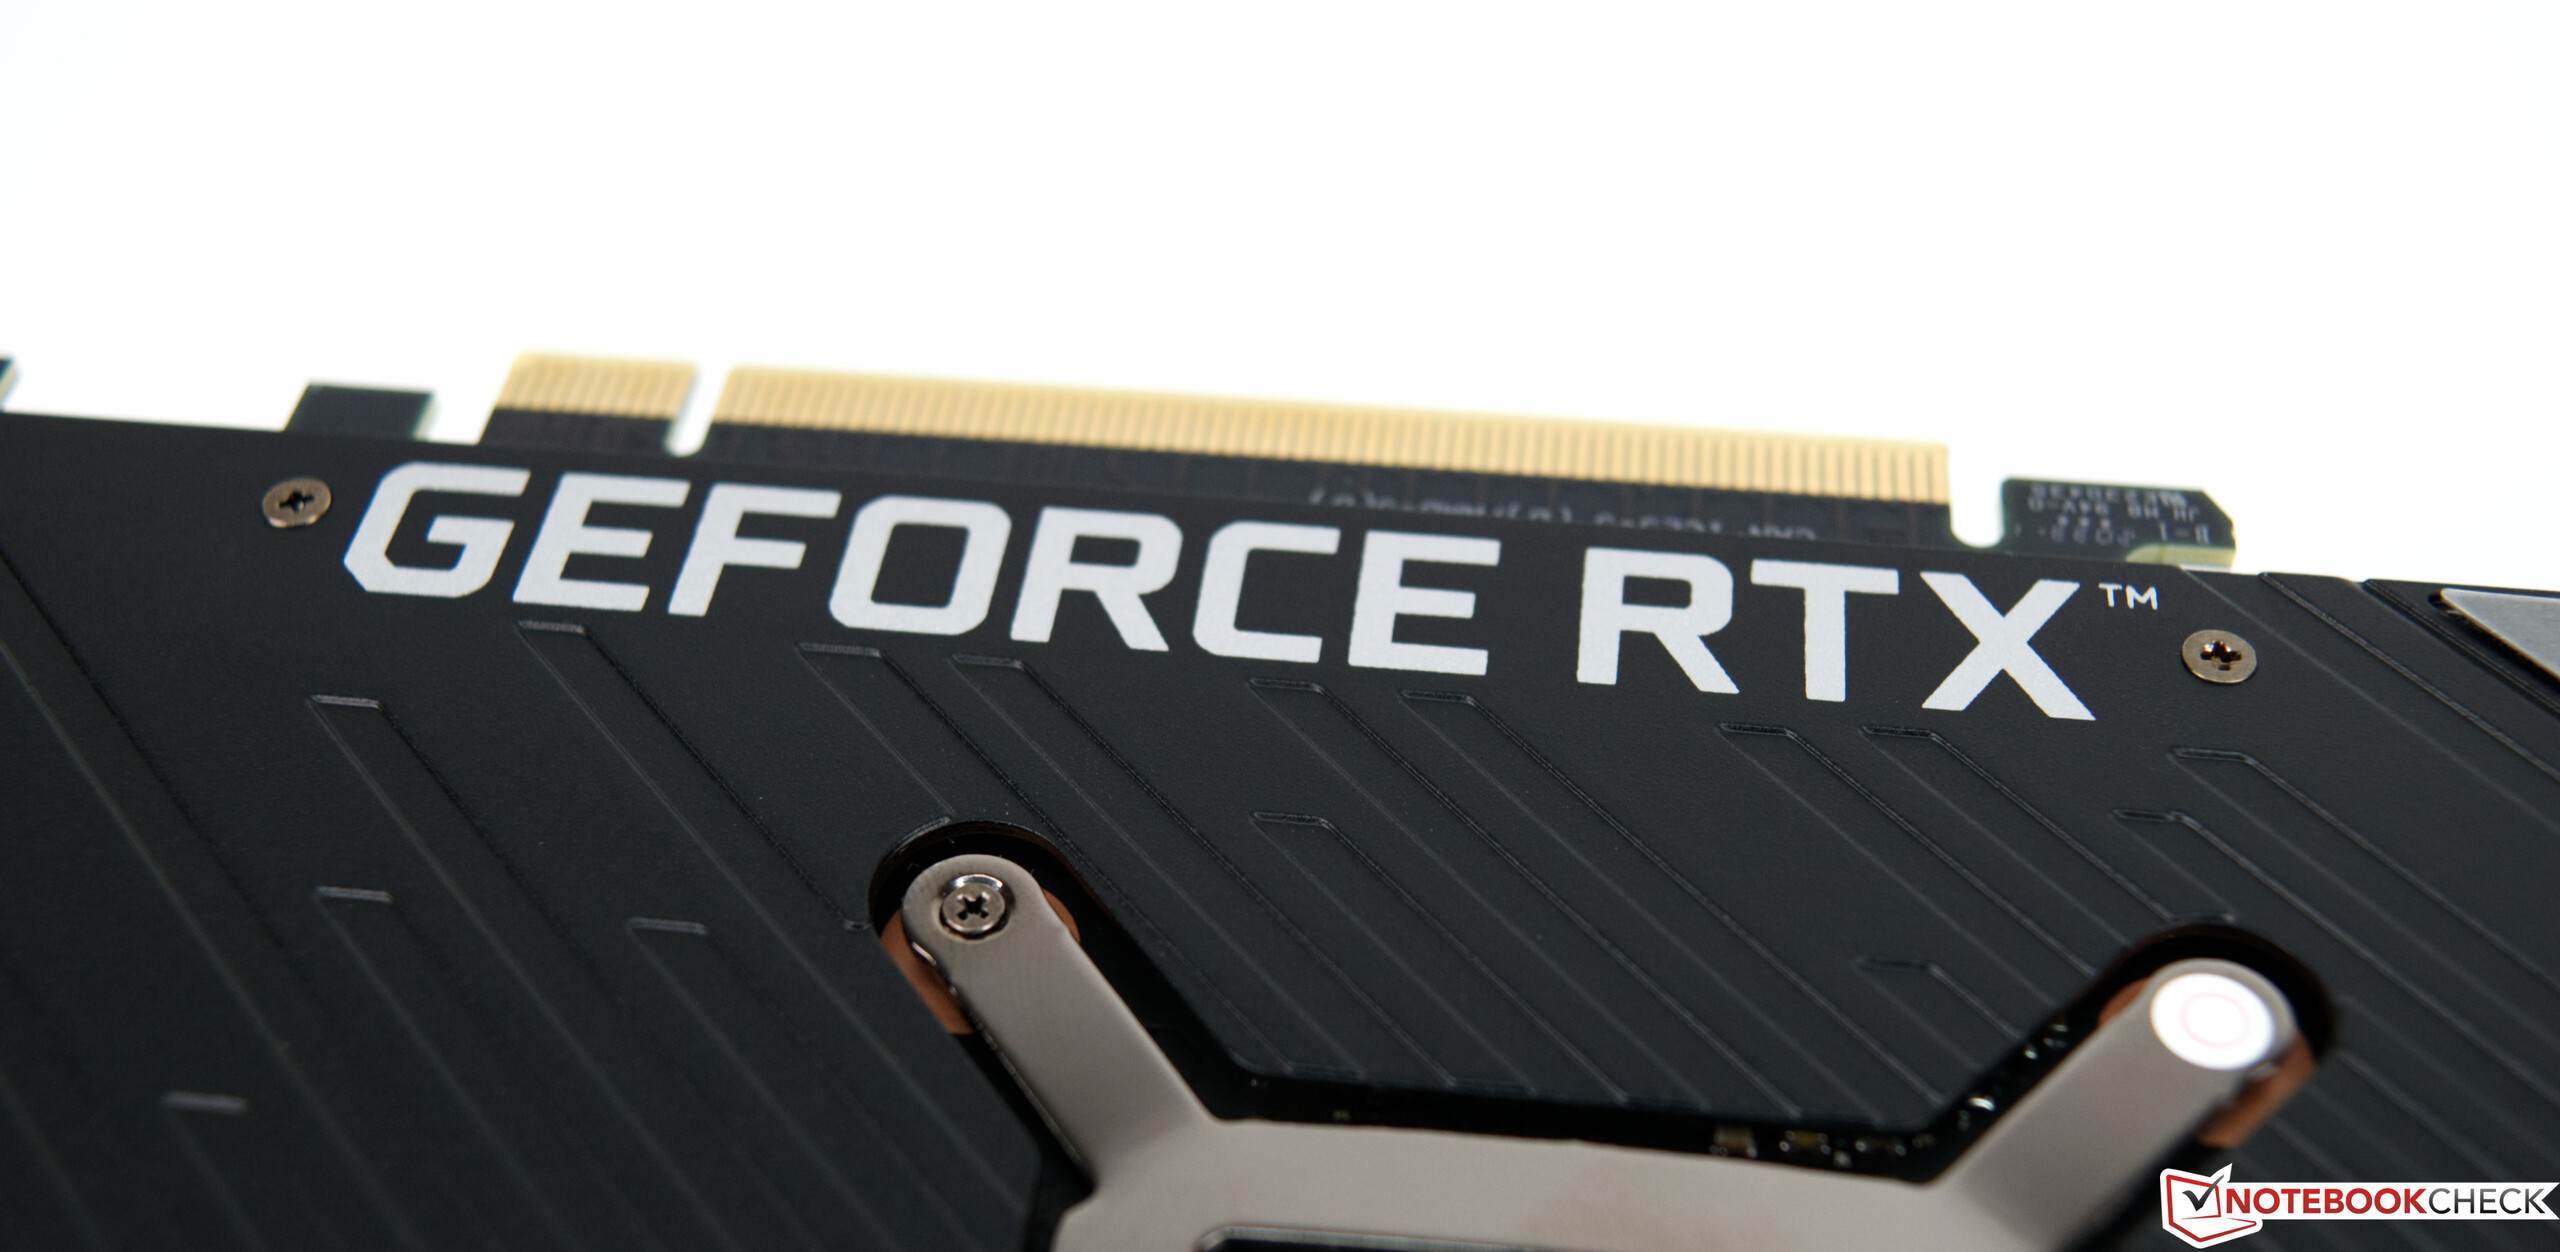
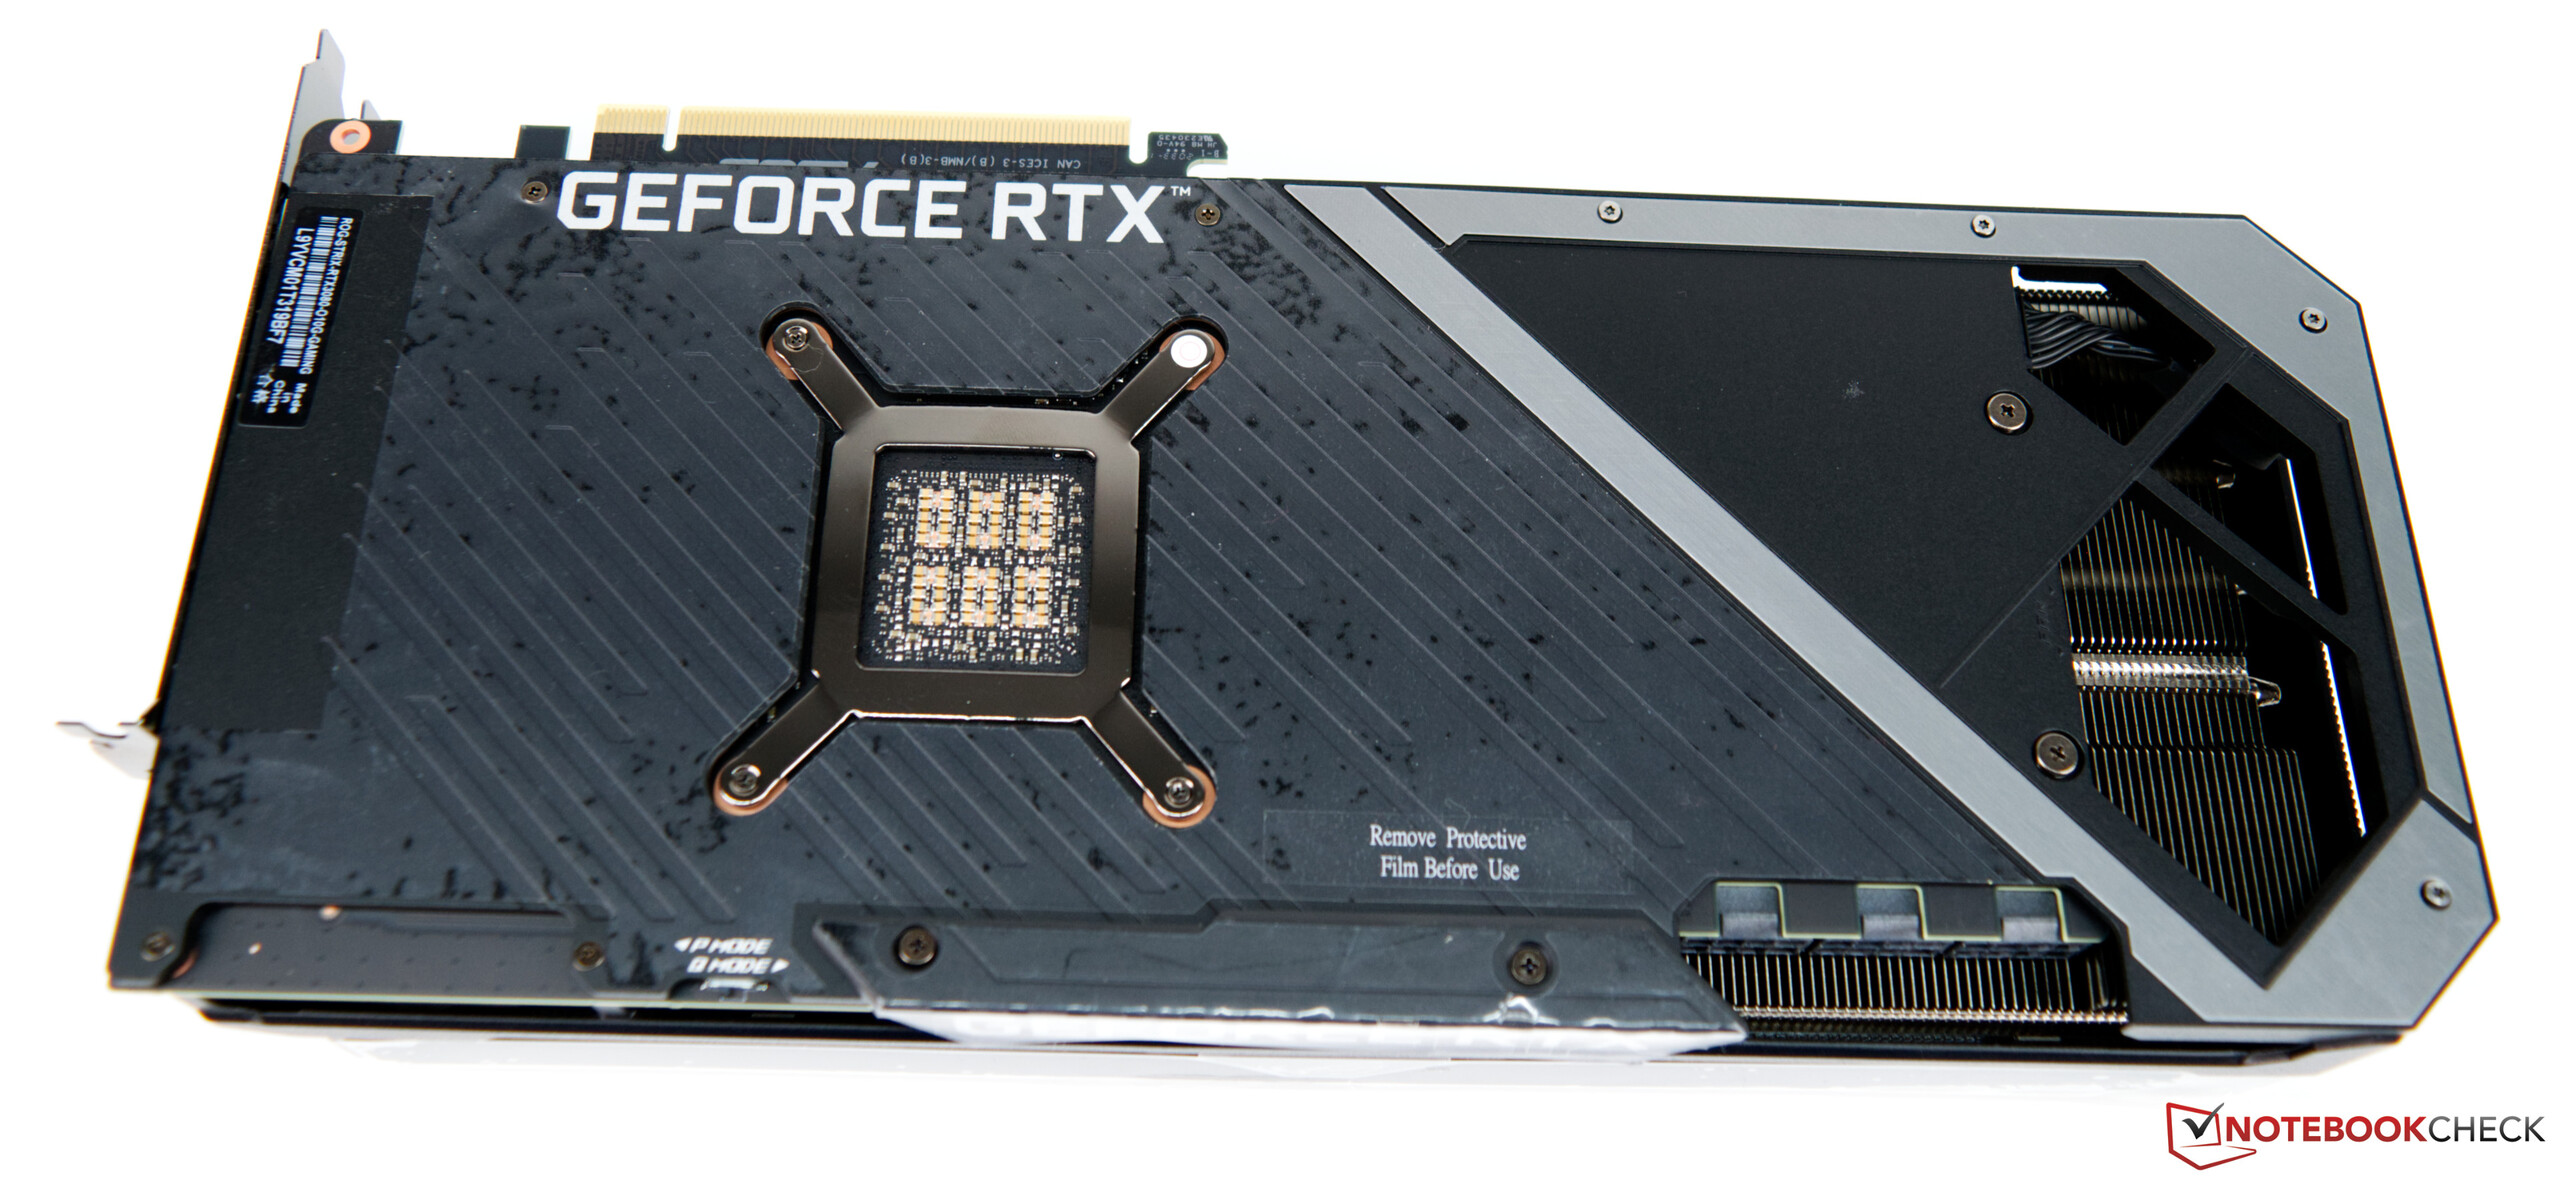
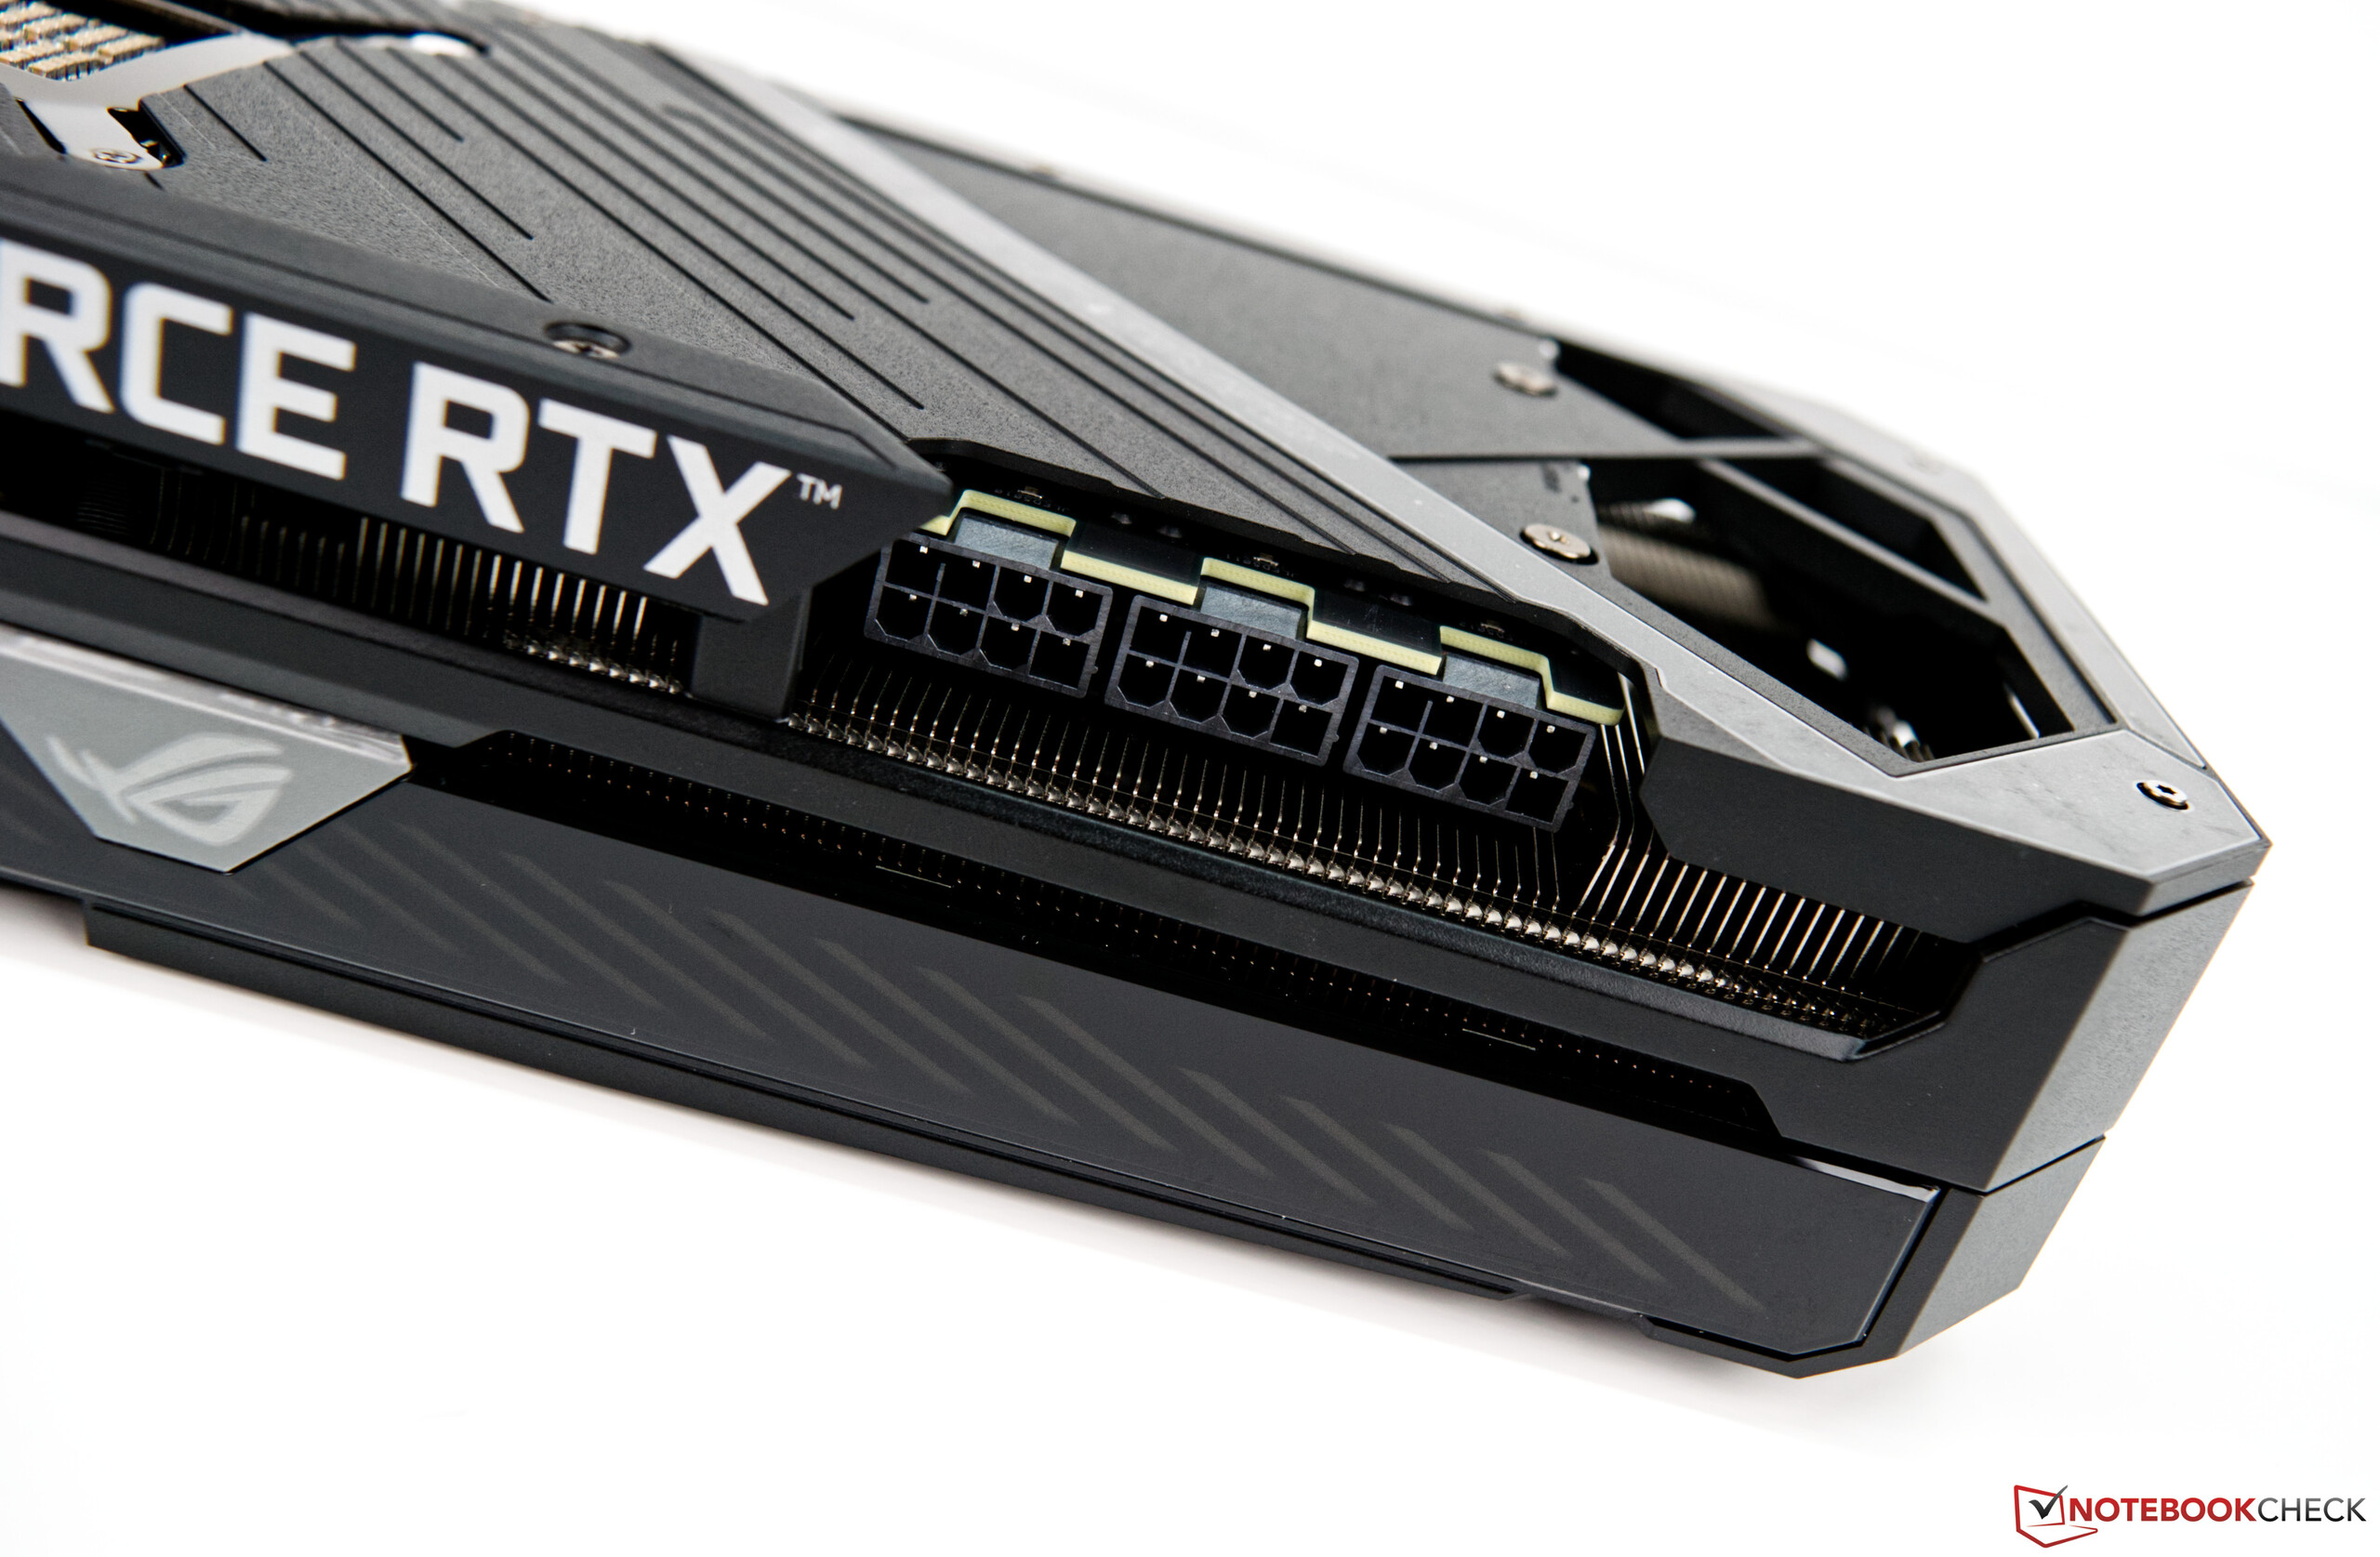
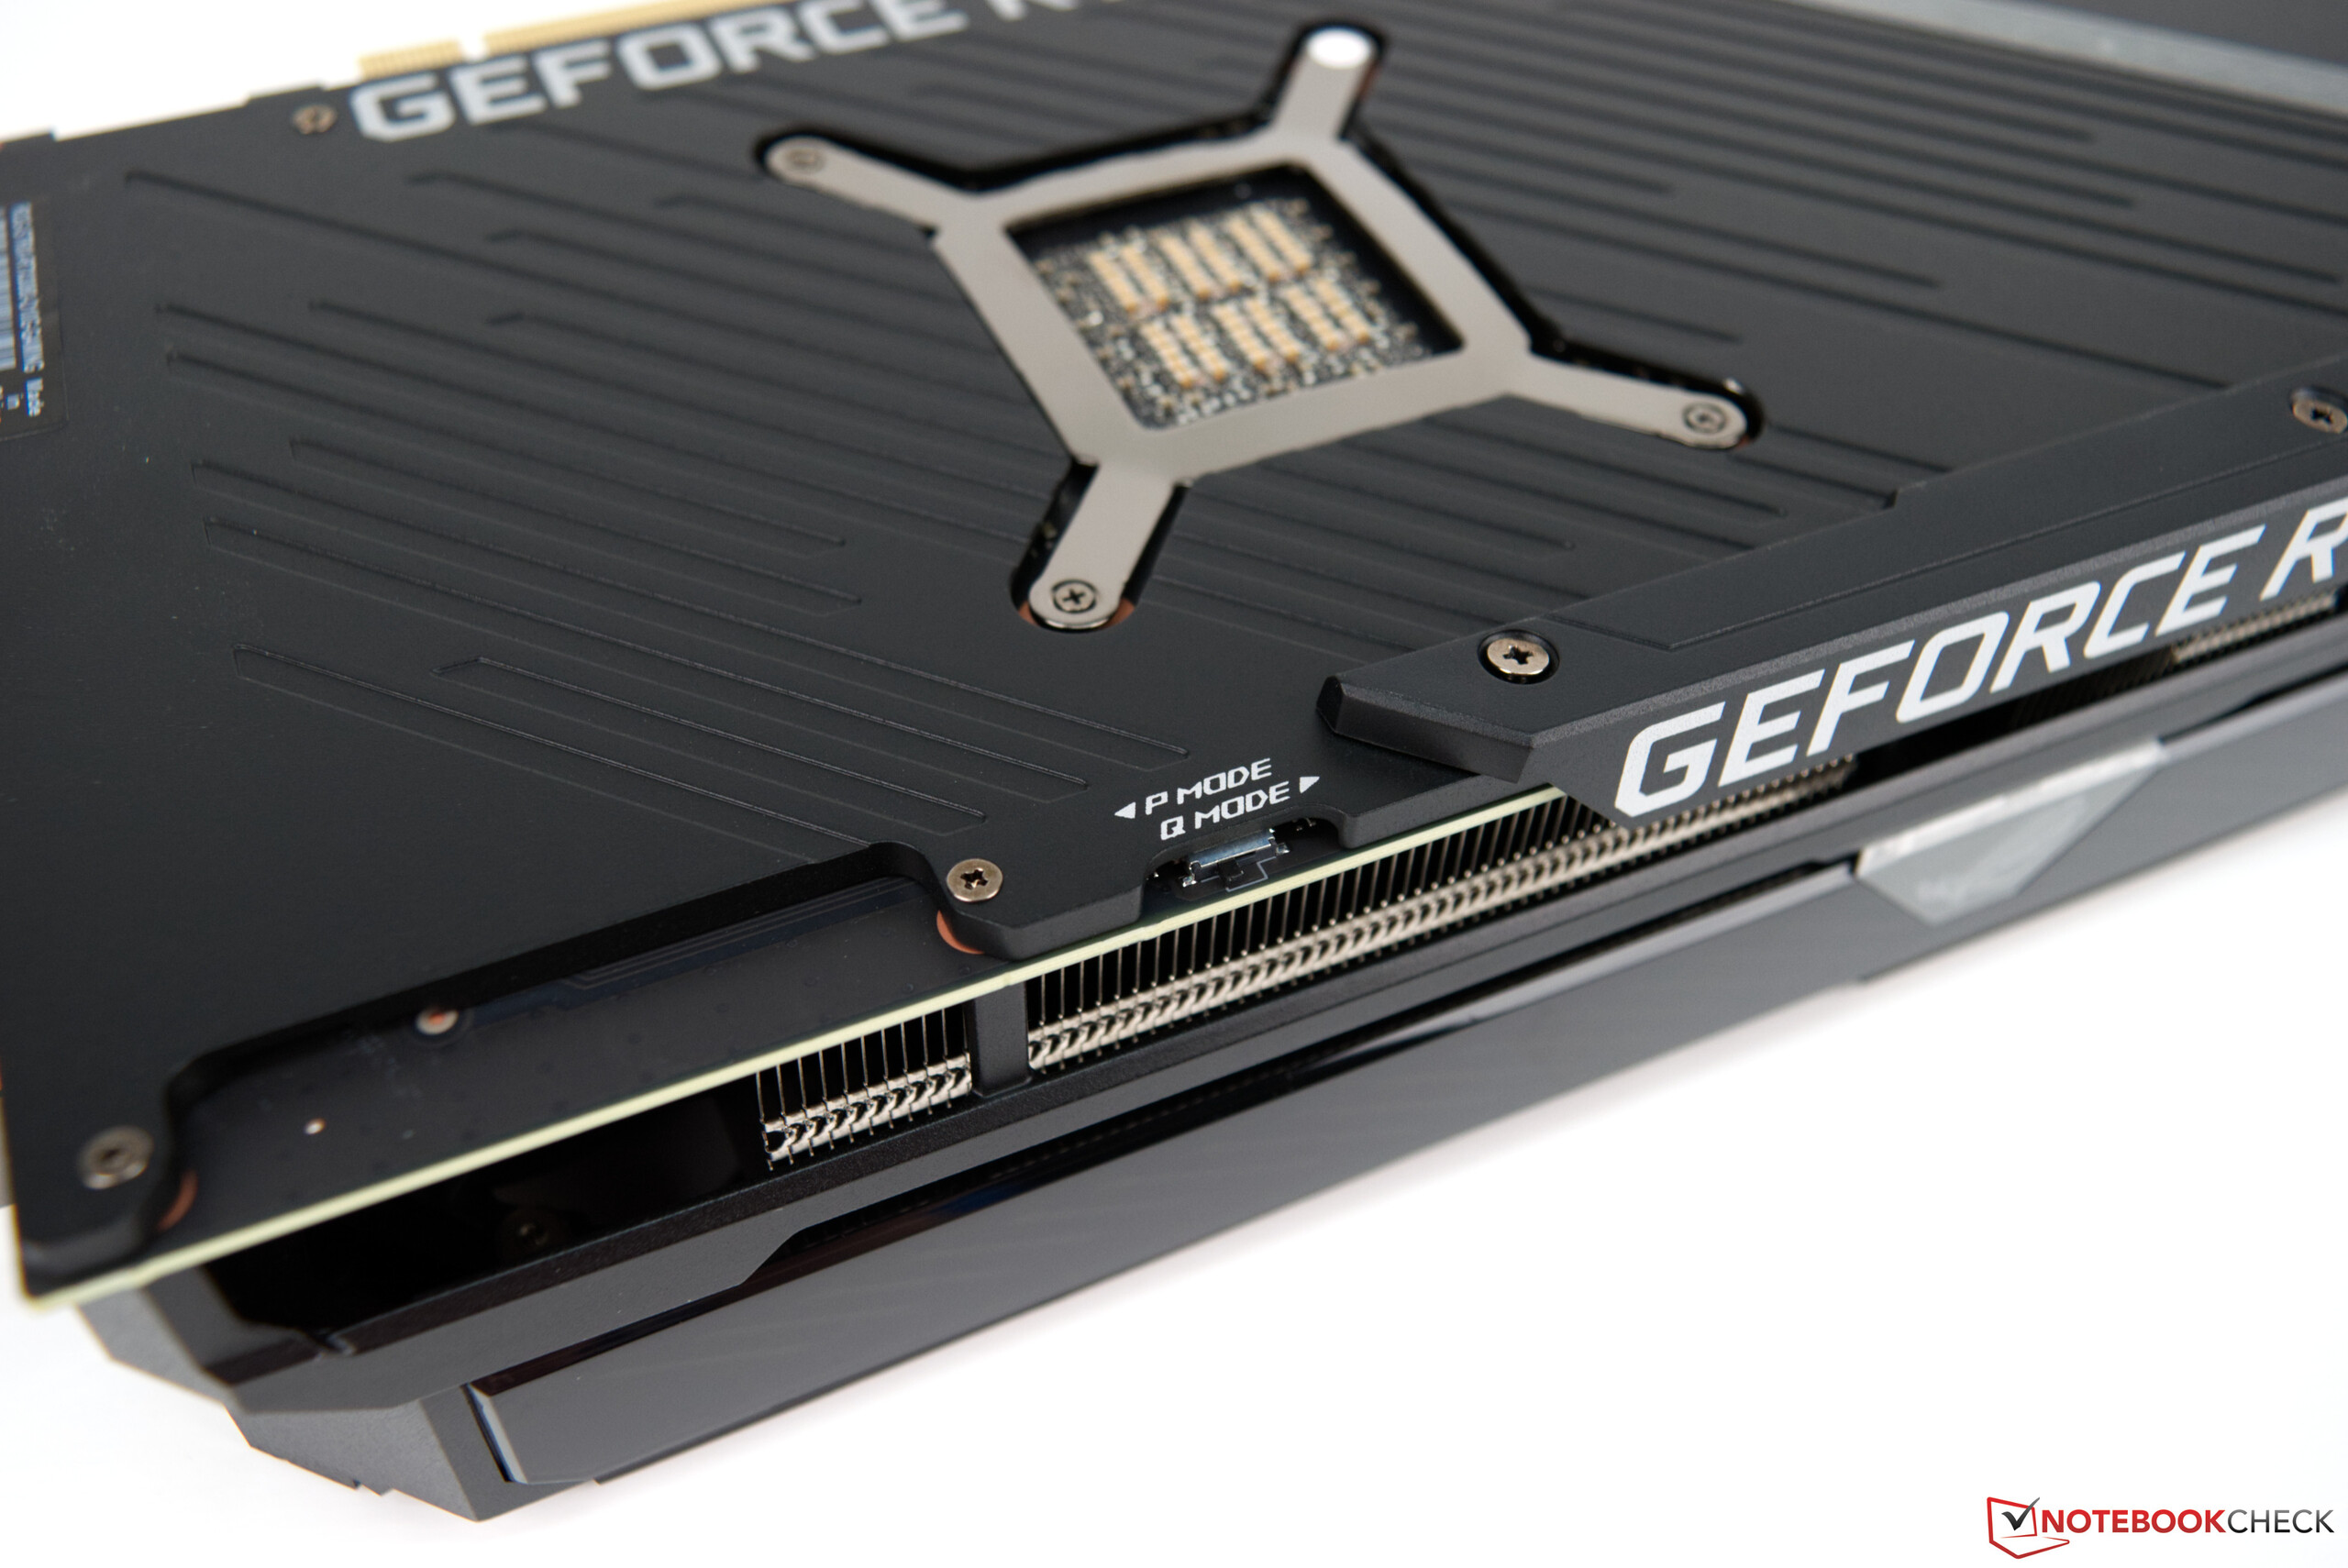
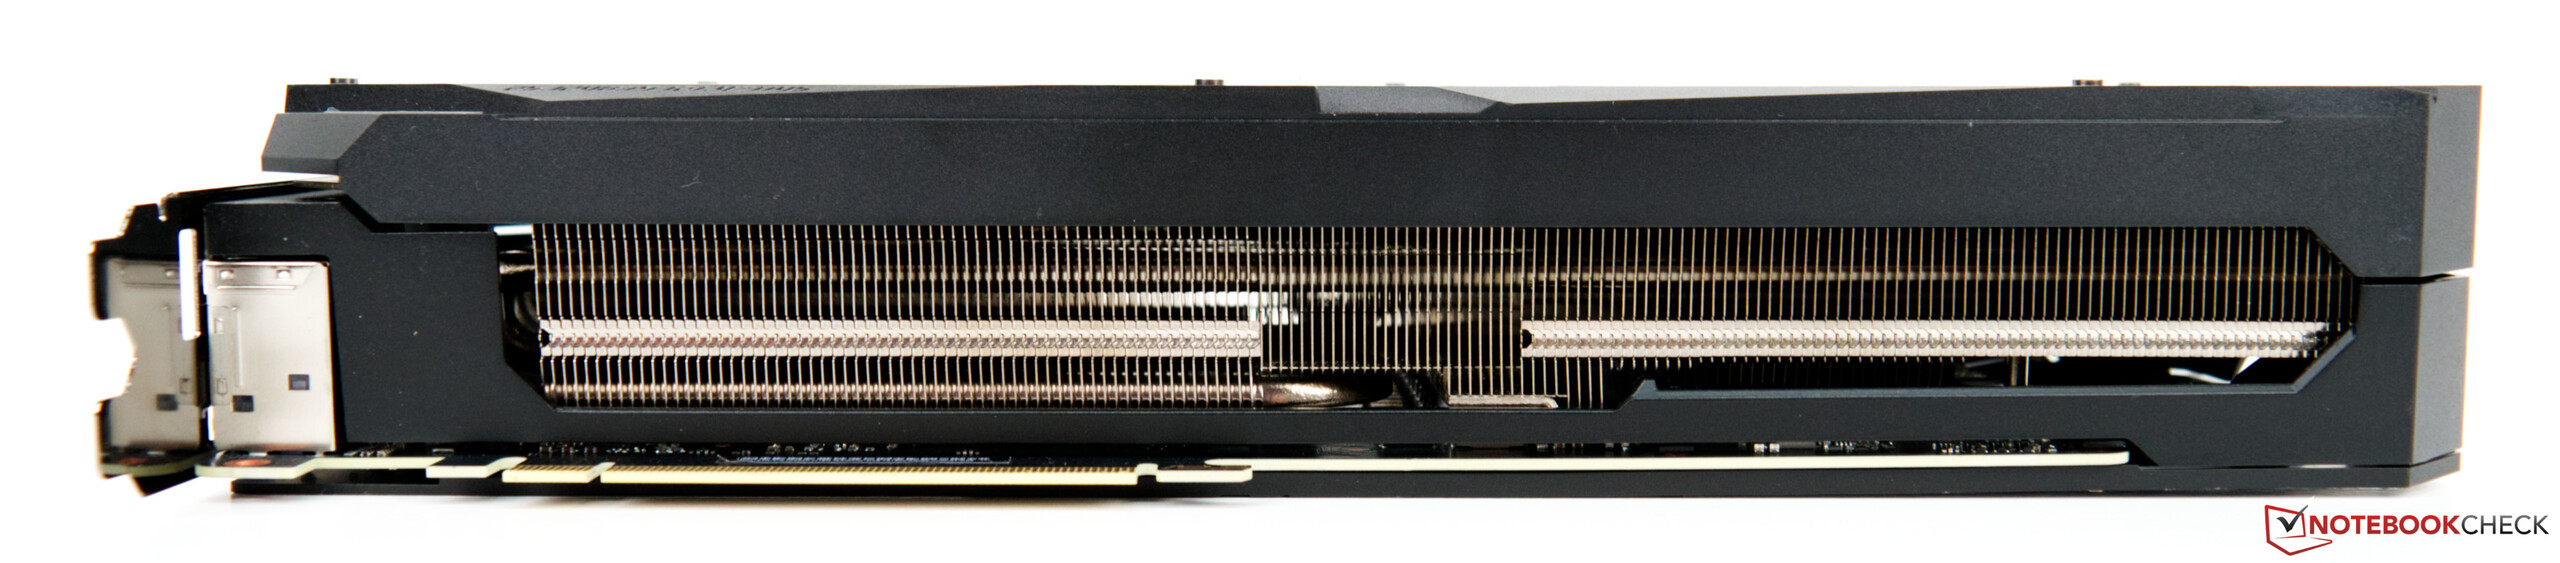
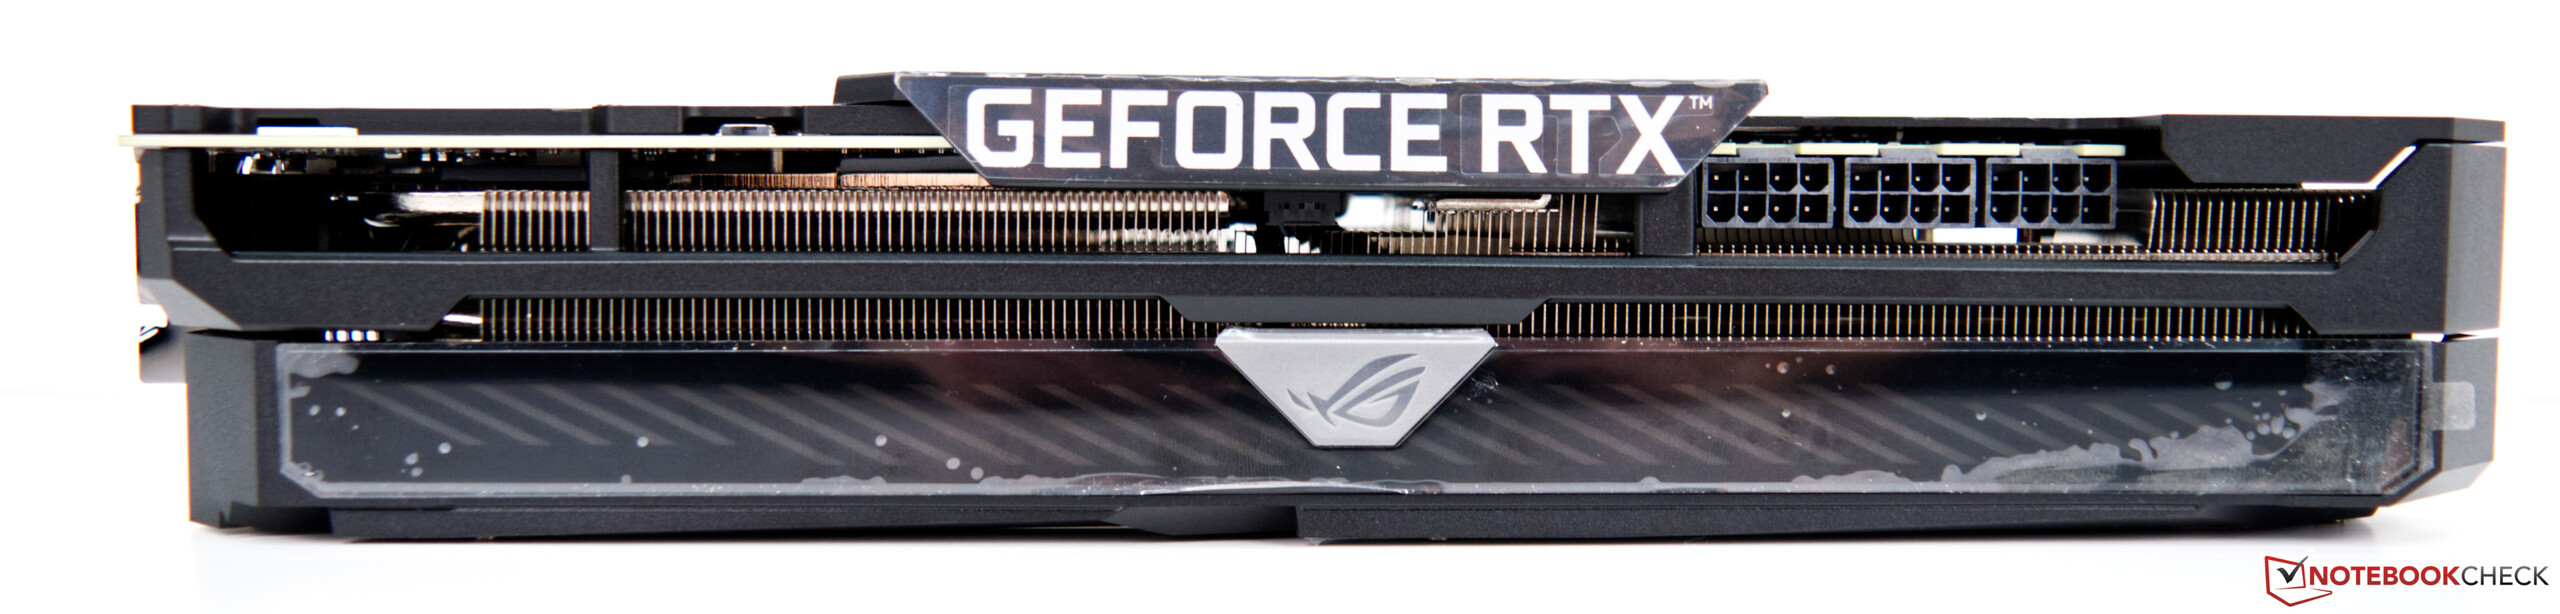
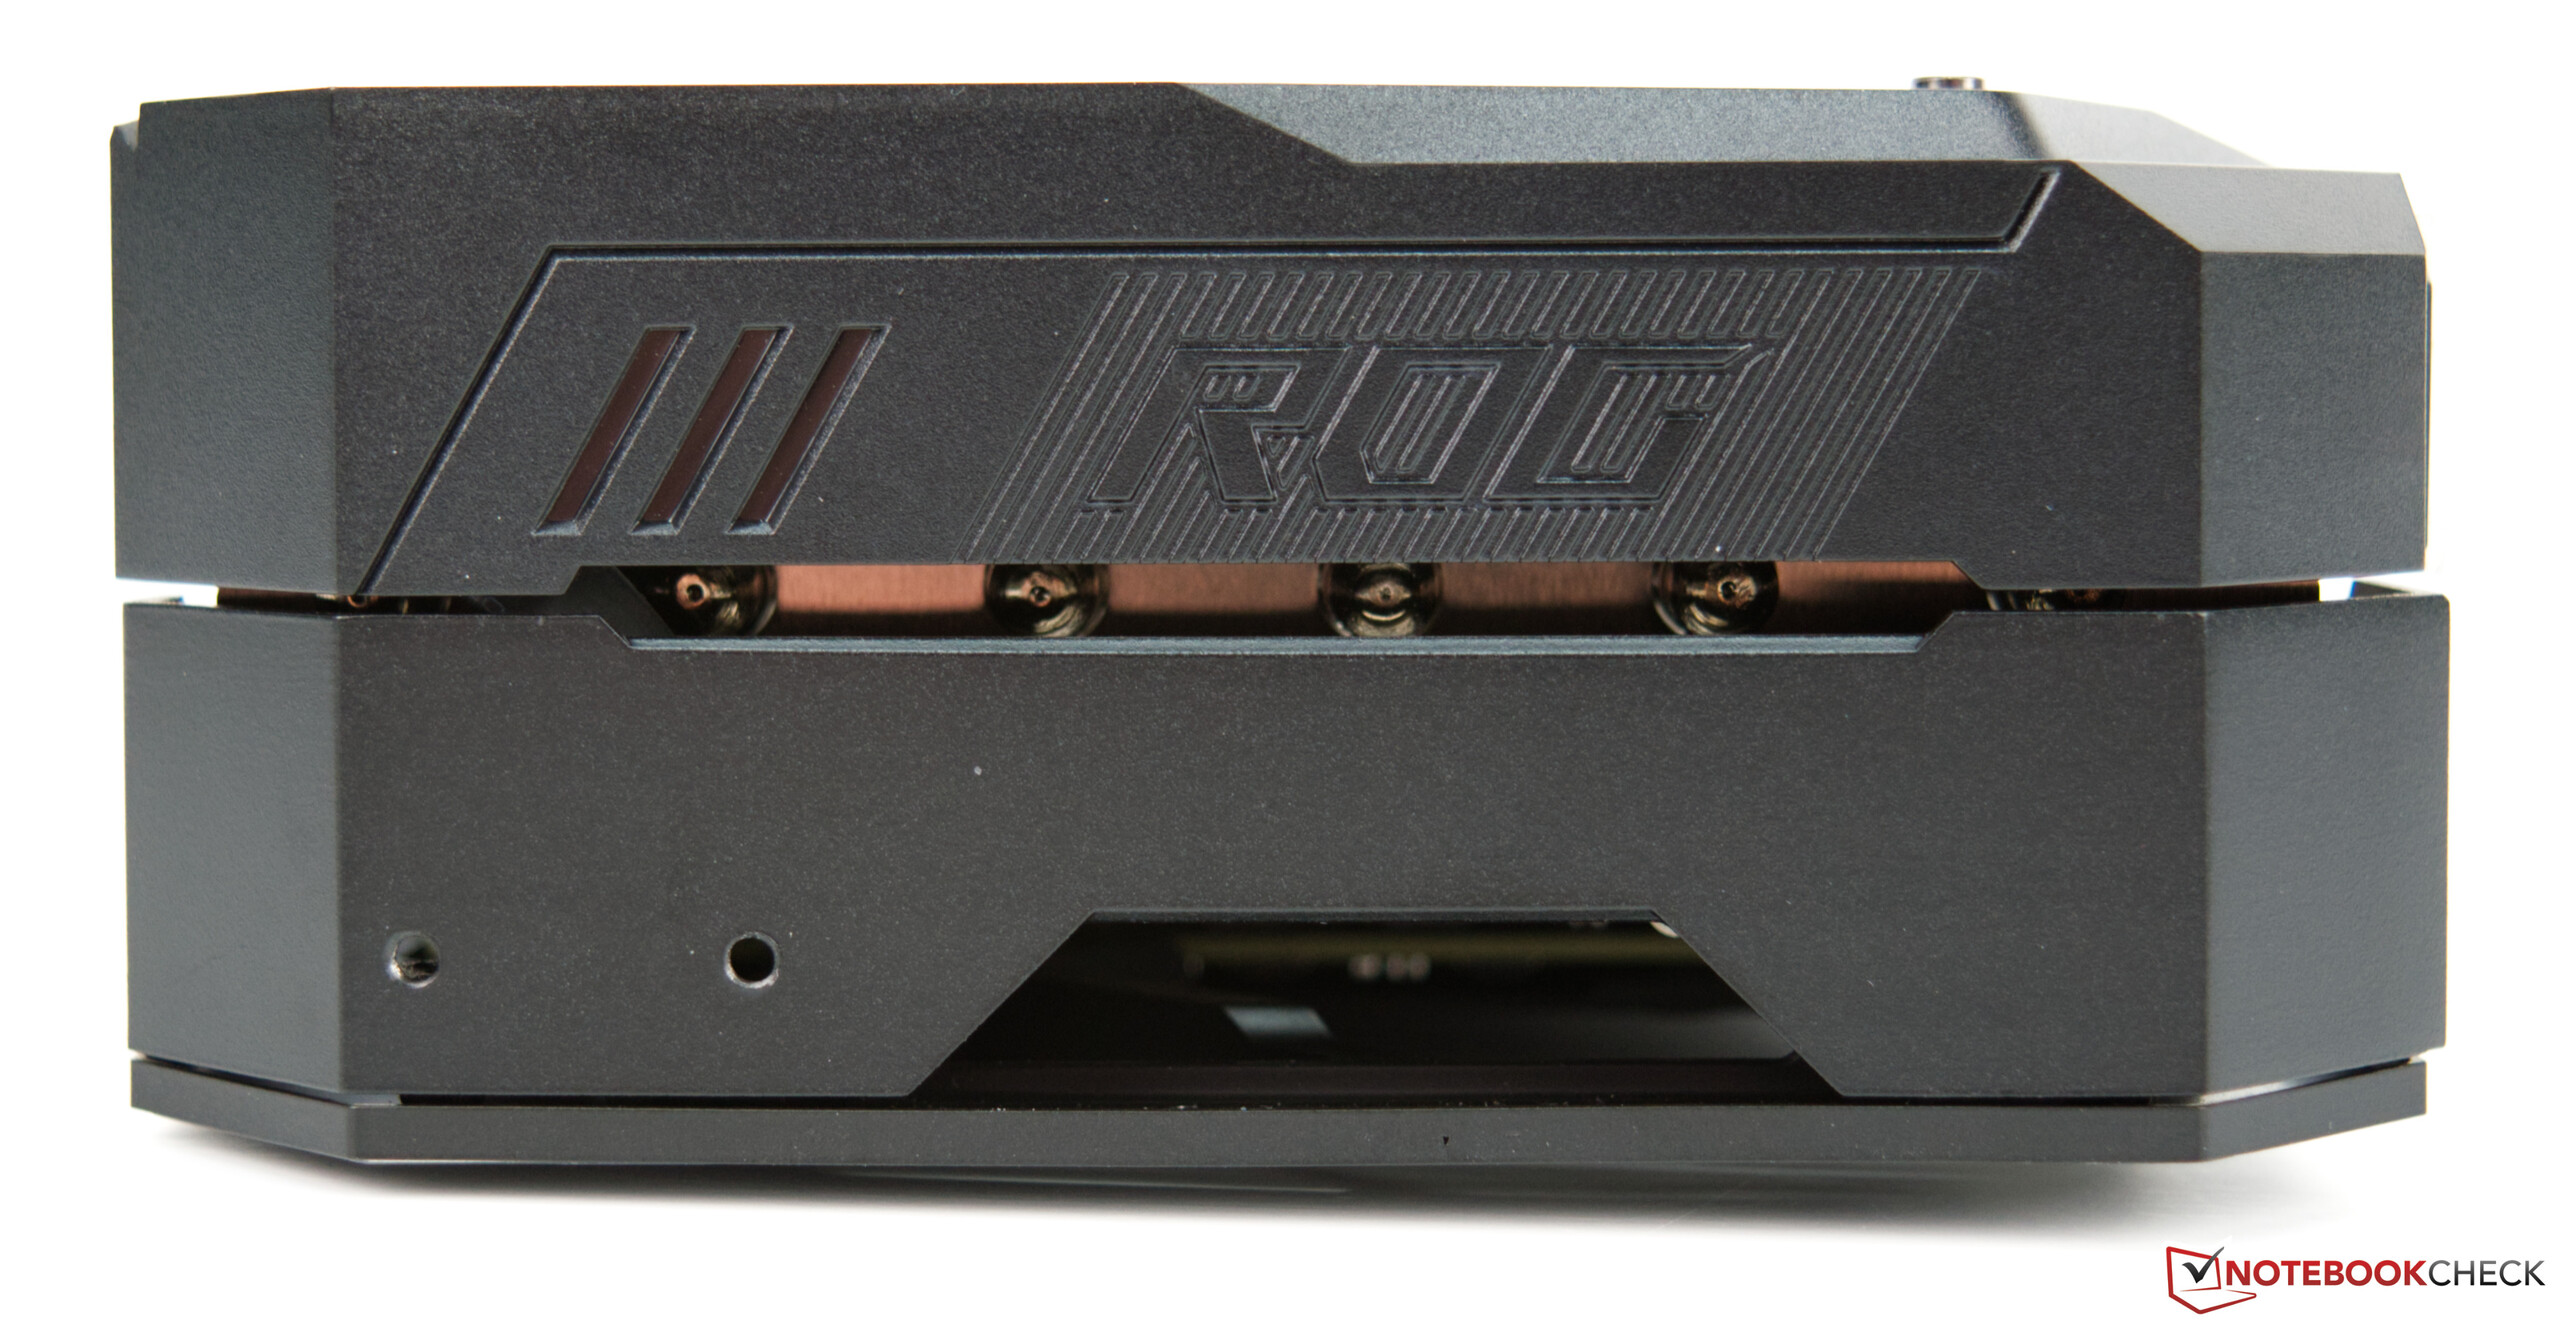
Sunucu segmenti, 2020'nin başlarında Nvidia grafik kartlarının yeni Ampere mimarisinden yararlanmaya başladı. Yaklaşık yarım yıl sonra, masaüstü grafik kartı pazarına yeni bir soluk getirmesi gereken tüketici modelleri takip etti. Bununla birlikte, yeni RTX 3000 serisinin piyasaya sürülmesinden sonra, hayal kırıklığı çok büyüktü, çünkü çok sayıda sipariş tam olarak karşılanmadı ve hala da mümkün değil. Yeni bir modeli hala güvence altına alabilenler Nvidia grafik kartları çok iyi bir performansla ödüllendirilecek; bunu önceden açığa çıkarabiliriz. Ancak bu inceleme için Asus'tan Founders Edition'dan önemli ölçüde farklı bir test örneği aldık. Ancak GA102 Ampere çipinin tabanı açısından hiçbir şey değişmedi. Aynısı, tüm RTX 3080 modellerinde 10 GB GDDR6X ile aynı olan VRAM için de geçerlidir. Asus, GeForce RTX 3080 ROG Strix Gaming OC'ye güçlendirme söz konusu olduğunda biraz daha fazla alan sağlıyor - Nvidia'nın Founders Edition'ına kıyasla neredeyse 200 MHz.Ayrıca Asus, en iyi RTX 3080 modeline çok güçlü bir üçlü yuvalı soğutucu verdi. Genel olarak, grafik kartı 32 santimetrenin biraz altındadır ve bu GPU'yu satın alırken kesinlikle dikkate alınması gerekir. Her durum böyle bir ekran kartı canavarı için çok fazla alan sunmuyor. Asus, güç kaynağı söz konusu olduğunda eski tanıdık yolu izliyor ve Nvidia'nın RTX 3000 kartlarıyla kullandığı 12 pimli konektörü tercih etmiyor. GeForce RTX 3080 ROG Strix Gaming OC, çalışması için üç adet 8 pimli konektöre ihtiyaç duyar. Sonuç olarak, güçlü bir güç adaptörü kaçınılmazdır ve Asus'un kendisi en az 850 watt'tan bahseder. Aynı anda dört adede kadar harici monitör bağlanabilir. Bu amaçla, GPU, en son standardı (2.1) ve DisplayPort bağlantılarını (1.4a) destekleyen HDMI özelliğine sahiptir.


The RTX 3080 compared with other NVIDIA GPUs
| Specification | RTX 3090 | RTX 3080 (Asus ROG) | RTX 3080 FE | RTX 3070 FE | Titan RTX | TITAN X Pascal | RTX 2080 Ti | RTX 2080 |
| Chip | GA102 | GA102 | GA102 | GA104 | TU102 | GP102 | TU102 | TU104 |
| FinFET process | 8 nm | 8 nm | 8 nm | 8 nm | 12 nm | 16 nm | 12 nm | 12 nm |
| CUDA cores | 10,496 | 8,704 | 8,704 | 5,888 | 4,608 | 3,584 | 4,352 | 2,944 |
| Texture units | 328 | 272 | 272 | 184 | 288 | 224 | 272 | 184 |
| Tensor cores | 328 3rd Gen. | 272 3rd Gen. | 272 3rd Gen. | 184 3rd Gen. | 576 2nd Gen. | - | 544 2nd Gen. | 368 2nd Gen. |
| RT Cores | 82 | 68 | 68 | 46 | 72 | - | 68 | 46 |
| GPU base clock | 1,395 MHz | 1,440 MHz | 1,440 MHz | 1,500 MHz | 1,350 MHz | 1,417 MHz | 1,350 MHz | 1,515 MHz |
| GPU boost clock | 1,695 MHz | 1,905 MHz | 1,710 MHz | 1,725 MHz | 1,770 MHz | 1,531 MHz | 1,545 MHz | 1,710 MHz |
| Memory bus | 384-bit | 320-bit | 320-bit | 256-bit | 384-bit | 384-bit | 352-bit | 256-bit |
| Memory bandwidth | 936 GB/s | 760 GB/s | 760 GB/s | 448 GB/s | 672 GB/s | 480.4 GB/s | 616 GB/s | 448 GB/s |
| Video memory | 24 GB GDDR6X | 10 GB GDDR6X | 10 GB GDDR6X | 8 GB GDDR6 | 24 GB GDDR6 | 12 GB GDDR5X | 11 GB GDDR6 | 8 GB GDDR6 |
| Power consumption | 350 W | 320 W | 320 W | 220 W | 280 W | 250 W | 250 W | 215 W |
Temel olarak AMD Ryzen 9 3900X ile test sistemimiz
Asus X570 ROG Crosshair VIII tabanlı güncel bir AMD platformu test sistemimiz olarak hizmet veriyor. CPU (AMD Ryzen 9 5900X) iyi bir CPU performansı sunuyor ve soğutma için bir AIO (Alphacool Eisbaer 280cmm) kullandık. 32 GB RAM, Corsair'den geliyor ve 4,000 MHz'de çalışıyor. Monitör olarak Acer Predator XB321HK kullanıyoruz. UHD özelliği nedeniyle bizi sınırlamaz. Bu noktada test platformunu sağladığı için AMD'ye ve RAM kiti için Corsair'e teşekkür etmek istiyoruz.

Yaklaşan kıyaslamalar ve testler için aşağıdaki sistemi kullanıyoruz: Corsair Carbide Air 540 ATX CubeAMD Ryzen 9 5900XAsus GeForce RTX 3080 ROG Strix Gaming OC (Nvidia sürücüsü 457.09) Asus X570 ROG Crosshair VIII (BIOS 2402, varsayılan ayarlar, DDR4 için XMP 1 4000) Corsair RM1000X 1000 watt güç kaynağı ünitesiCorsair Vengeance RGB Pro DDR4 4000 2x 16 GB RAM kitiCorsair MP600 2 TB M.2 PCIe 4.0 SSDCrucial MX500 2 TB (oyunlar için)
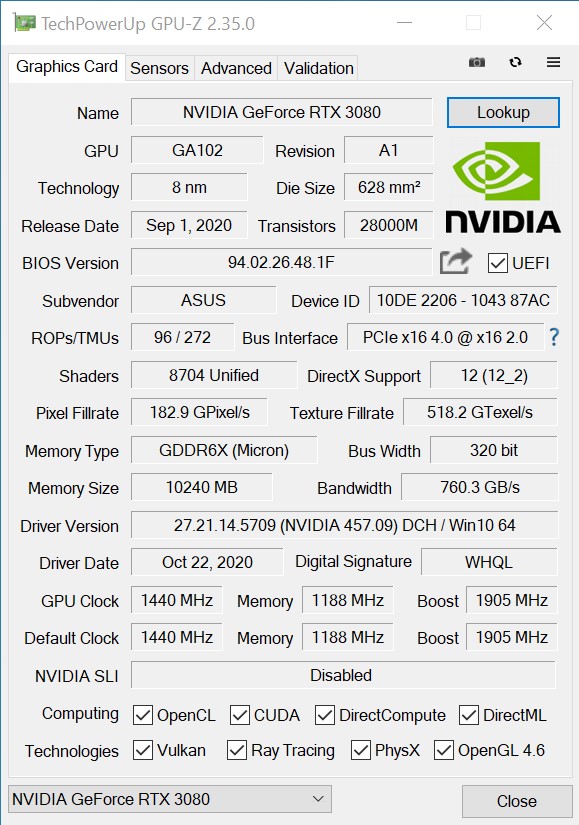
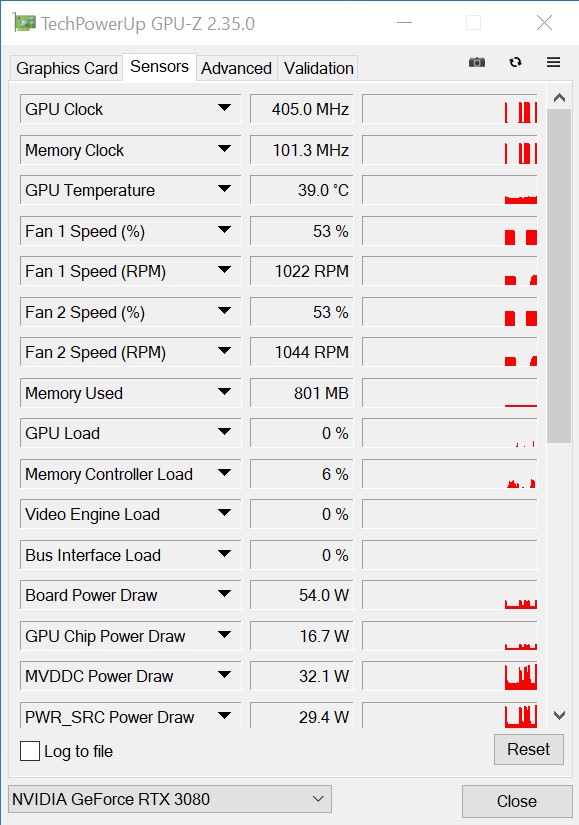
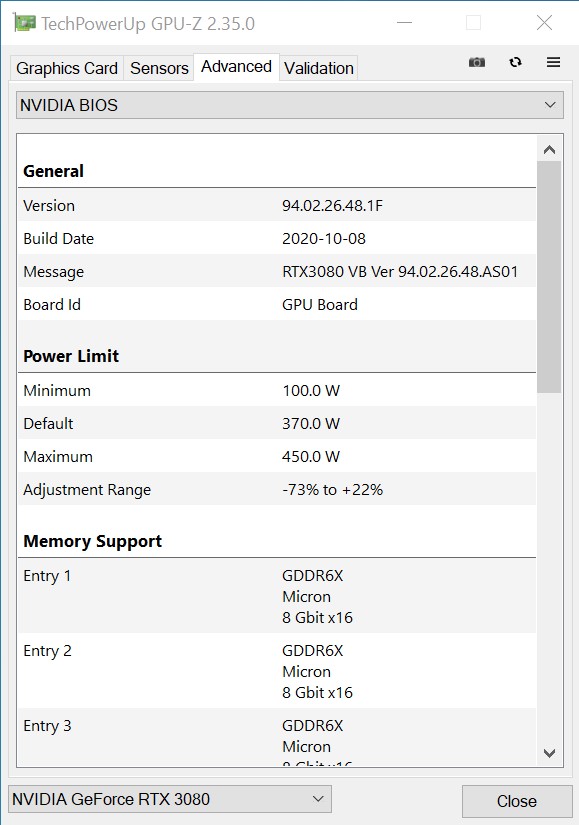
Asus GeForce RTX 3080 ROG Strix Gaming OC'nin saat hızları
1.440 MHz'de Asus GeForce RTX 3080 ROG Strix Gaming OC'nin temel saat hızı, referans modele göre değişmeden kaldı. Bununla birlikte, Asus, artırma saat hızı söz konusu olduğunda farklı bir yol izliyor ve modelinin 1.905 MHz'e kadar oldukça yüksek bir hıza ulaşmasına izin veriyor. Bu saat hızı, yük altında da sorunsuz olarak korunabilir ve genellikle aşılır. Üstelik Asus,% 21'e varan daha yüksek bir güç hedefine de izin veriyor. Sonuç olarak, GeForce RTX 3080 ROG Strix Gaming OC, 2 GHz'in üzerinde bile kararlı bir şekilde çalıştırılabilir. VRAM açısından, daha önce kullanılan GDDR6 yerine artık GDDR6X var, ancak şimdi RTX 2080 Ti ile karşılaştırıldığında 10 GB yeterli olmalı. Şu anda, sadece mevcut Ampere serisinin GeForce RTX 3090'ı daha fazla grafik belleği sunuyor.

Sentetik testler
Sentetik kıyaslamalarda Asus GeForce RTX 3080 ROG Strix Gaming OC, potansiyelini oldukça net bir şekilde göstermeye başladı. Yalnızca GeForce RTX 3090 daha fazla performans sunar; ortağımız Zotac'ın yapılandırmasında bunu zaten inceledik. GeForce RTX 2080 Ti ile karşılaştırıldığında, test örneğimiz yaklaşık% 30'luk bir kurşunla kendisini diğerlerinden ayırabilir. Önemli ölçüde daha pahalı olan Nvidia Titan RTX, karşılaştırmamızda yalnızca üçüncü sırada yer almayı başarıyor ve GeForce RTX 3080'e ayak uyduramıyor. Founders Edition'ın aksine Asus, GeForce RTX 3080 ROG Strix Gaming OC'de daha iyi bir soğutma yapısına sahip. , bu da referans modele göre hafif bir performans avantajı sağlar.
| 3DMark | |
| 1920x1080 Fire Strike Graphics | |
| GeForce RTX 3090 | |
| Asus GeForce RTX 3080 ROG Strix Gaming OC | |
| Titan RTX | |
| GeForce RTX 2080 Ti (Desktop) | |
| GeForce RTX 2080 (Desktop) | |
| Radeon VII | |
| GeForce RTX 2080 Super (Desktop) | |
| Radeon RX 5700 XT (Desktop) | |
| GeForce RTX 2070 Super (Desktop) | |
| GeForce RTX 2070 (Desktop) | |
| Radeon RX 5700 (Desktop) | |
| RX Vega 64 | |
| GeForce RTX 2060 Super (Desktop) | |
| GeForce RTX 2060 (Desktop) | |
| Fire Strike Extreme Graphics | |
| GeForce RTX 3090 | |
| Asus GeForce RTX 3080 ROG Strix Gaming OC | |
| Titan RTX | |
| GeForce RTX 2080 Ti (Desktop) | |
| Radeon VII | |
| GeForce RTX 2080 (Desktop) | |
| GeForce RTX 2080 Super (Desktop) | |
| Radeon RX 5700 XT (Desktop) | |
| GeForce RTX 2070 Super (Desktop) | |
| GeForce RTX 2070 (Desktop) | |
| Radeon RX 5700 (Desktop) | |
| RX Vega 64 | |
| GeForce RTX 2060 Super (Desktop) | |
| GeForce RTX 2060 (Desktop) | |
| 3840x2160 Fire Strike Ultra Graphics | |
| GeForce RTX 3090 | |
| Asus GeForce RTX 3080 ROG Strix Gaming OC | |
| Titan RTX | |
| GeForce RTX 2080 Ti (Desktop) | |
| Radeon VII | |
| GeForce RTX 2080 (Desktop) | |
| GeForce RTX 2080 Super (Desktop) | |
| Radeon RX 5700 XT (Desktop) | |
| GeForce RTX 2070 Super (Desktop) | |
| GeForce RTX 2070 (Desktop) | |
| RX Vega 64 | |
| Radeon RX 5700 (Desktop) | |
| GeForce RTX 2060 Super (Desktop) | |
| GeForce RTX 2060 (Desktop) | |
| 2560x1440 Time Spy Graphics | |
| GeForce RTX 3090 | |
| Asus GeForce RTX 3080 ROG Strix Gaming OC | |
| Titan RTX | |
| GeForce RTX 2080 Ti (Desktop) | |
| GeForce RTX 2080 Super (Desktop) | |
| GeForce RTX 2080 (Desktop) | |
| GeForce RTX 2070 Super (Desktop) | |
| GeForce RTX 2070 (Desktop) | |
| Radeon VII | |
| GeForce RTX 2060 Super (Desktop) | |
| Radeon RX 5700 XT (Desktop) | |
| GeForce RTX 2060 (Desktop) | |
| Radeon RX 5700 (Desktop) | |
| RX Vega 64 | |
| Unigine Superposition | |
| 1280x720 720p Low | |
| Titan RTX | |
| Asus GeForce RTX 3080 ROG Strix Gaming OC | |
| 1920x1080 1080p High | |
| GeForce RTX 3090 | |
| Asus GeForce RTX 3080 ROG Strix Gaming OC | |
| Titan RTX | |
| 1920x1080 1080p Extreme | |
| GeForce RTX 3090 | |
| Asus GeForce RTX 3080 ROG Strix Gaming OC | |
| Titan RTX | |
| 3840x2160 4k Optimized | |
| GeForce RTX 3090 | |
| Asus GeForce RTX 3080 ROG Strix Gaming OC | |
| Titan RTX | |
| 7680x4320 8k Optimized | |
| GeForce RTX 3090 | |
| Asus GeForce RTX 3080 ROG Strix Gaming OC | |
| Titan RTX | |
| Unigine Heaven 4.0 | |
| Extreme Preset OpenGL | |
| Asus GeForce RTX 3080 ROG Strix Gaming OC | |
| Titan RTX | |
| GeForce RTX 2080 Ti (Desktop) | |
| GeForce RTX 2080 Super (Desktop) | |
| GeForce RTX 2080 (Desktop) | |
| GeForce RTX 2070 Super (Desktop) | |
| GeForce RTX 2070 (Desktop) | |
| GeForce RTX 2060 Super (Desktop) | |
| GeForce RTX 2060 (Desktop) | |
| Radeon RX 5700 XT (Desktop) | |
| Radeon VII | |
| Radeon RX 5700 (Desktop) | |
| Extreme Preset DX11 | |
| GeForce RTX 3090 | |
| Titan RTX | |
| Asus GeForce RTX 3080 ROG Strix Gaming OC | |
| GeForce RTX 2080 Ti (Desktop) | |
| GeForce RTX 2080 (Desktop) | |
| GeForce RTX 2080 Super (Desktop) | |
| GeForce RTX 2070 Super (Desktop) | |
| GeForce RTX 2070 (Desktop) | |
| GeForce RTX 2060 Super (Desktop) | |
| Radeon VII | |
| Radeon RX 5700 XT (Desktop) | |
| GeForce RTX 2060 (Desktop) | |
| Radeon RX 5700 (Desktop) | |
| Unigine Valley 1.0 | |
| 1920x1080 Extreme HD DirectX AA:x8 | |
| GeForce RTX 3090 | |
| Titan RTX | |
| Asus GeForce RTX 3080 ROG Strix Gaming OC | |
| GeForce RTX 2080 Ti (Desktop) | |
| GeForce RTX 2080 Super (Desktop) | |
| GeForce RTX 2080 (Desktop) | |
| GeForce RTX 2070 Super (Desktop) | |
| GeForce RTX 2070 (Desktop) | |
| Radeon VII | |
| GeForce RTX 2060 Super (Desktop) | |
| Radeon RX 5700 XT (Desktop) | |
| Radeon RX 5700 (Desktop) | |
| GeForce RTX 2060 (Desktop) | |
| 1920x1080 Extreme HD Preset OpenGL AA:x8 | |
| Asus GeForce RTX 3080 ROG Strix Gaming OC | |
| Titan RTX | |
| GeForce RTX 2080 Ti (Desktop) | |
| GeForce RTX 2080 Super (Desktop) | |
| GeForce RTX 2080 (Desktop) | |
| GeForce RTX 2070 Super (Desktop) | |
| GeForce RTX 2070 (Desktop) | |
| GeForce RTX 2060 Super (Desktop) | |
| Radeon RX 5700 XT (Desktop) | |
| GeForce RTX 2060 (Desktop) | |
| Radeon RX 5700 (Desktop) | |
| Radeon VII | |
| SiSoft Sandra 2016 | |
| GP Financial Analysis (FP High/Double Precision) | |
| Radeon VII | |
| Asus GeForce RTX 3080 ROG Strix Gaming OC | |
| GeForce RTX 2080 Ti (Desktop) | |
| GeForce RTX 2080 (Desktop) | |
| GeForce RTX 2080 Super (Desktop) | |
| GeForce RTX 2070 Super (Desktop) | |
| GeForce RTX 2070 (Desktop) | |
| GeForce RTX 2060 Super (Desktop) | |
| GeForce RTX 2060 (Desktop) | |
| Radeon RX 5700 XT (Desktop) | |
| Radeon RX 5700 (Desktop) | |
| GP Cryptography (Higher Security AES256+SHA2-512) | |
| Asus GeForce RTX 3080 ROG Strix Gaming OC | |
| GeForce RTX 2080 Ti (Desktop) | |
| GeForce RTX 2080 (Desktop) | |
| Radeon VII | |
| GeForce RTX 2080 Super (Desktop) | |
| GeForce RTX 2070 Super (Desktop) | |
| GeForce RTX 2070 (Desktop) | |
| GeForce RTX 2060 Super (Desktop) | |
| GeForce RTX 2060 (Desktop) | |
| Image Processing | |
| Asus GeForce RTX 3080 ROG Strix Gaming OC | |
| Radeon VII | |
| GeForce RTX 2080 Ti (Desktop) | |
| GeForce RTX 2080 Super (Desktop) | |
| GeForce RTX 2080 (Desktop) | |
| GeForce RTX 2070 Super (Desktop) | |
| GeForce RTX 2070 (Desktop) | |
| GeForce RTX 2060 Super (Desktop) | |
| Radeon RX 5700 XT (Desktop) | |
| GeForce RTX 2060 (Desktop) | |
| Radeon RX 5700 (Desktop) | |
| 3DMark 05 Standard | 46192 puan | |
| 3DMark 06 Standard Score | 44255 puan | |
| 3DMark Vantage P Result | 93066 puan | |
| 3DMark 11 Performance | 32211 puan | |
| 3DMark Ice Storm Standard Score | 238949 puan | |
| 3DMark Cloud Gate Standard Score | 75364 puan | |
| 3DMark Fire Strike Score | 33440 puan | |
| 3DMark Fire Strike Extreme Score | 20455 puan | |
| 3DMark Time Spy Score | 15712 puan | |
Yardım | ||
Oyun kıyaslamaları
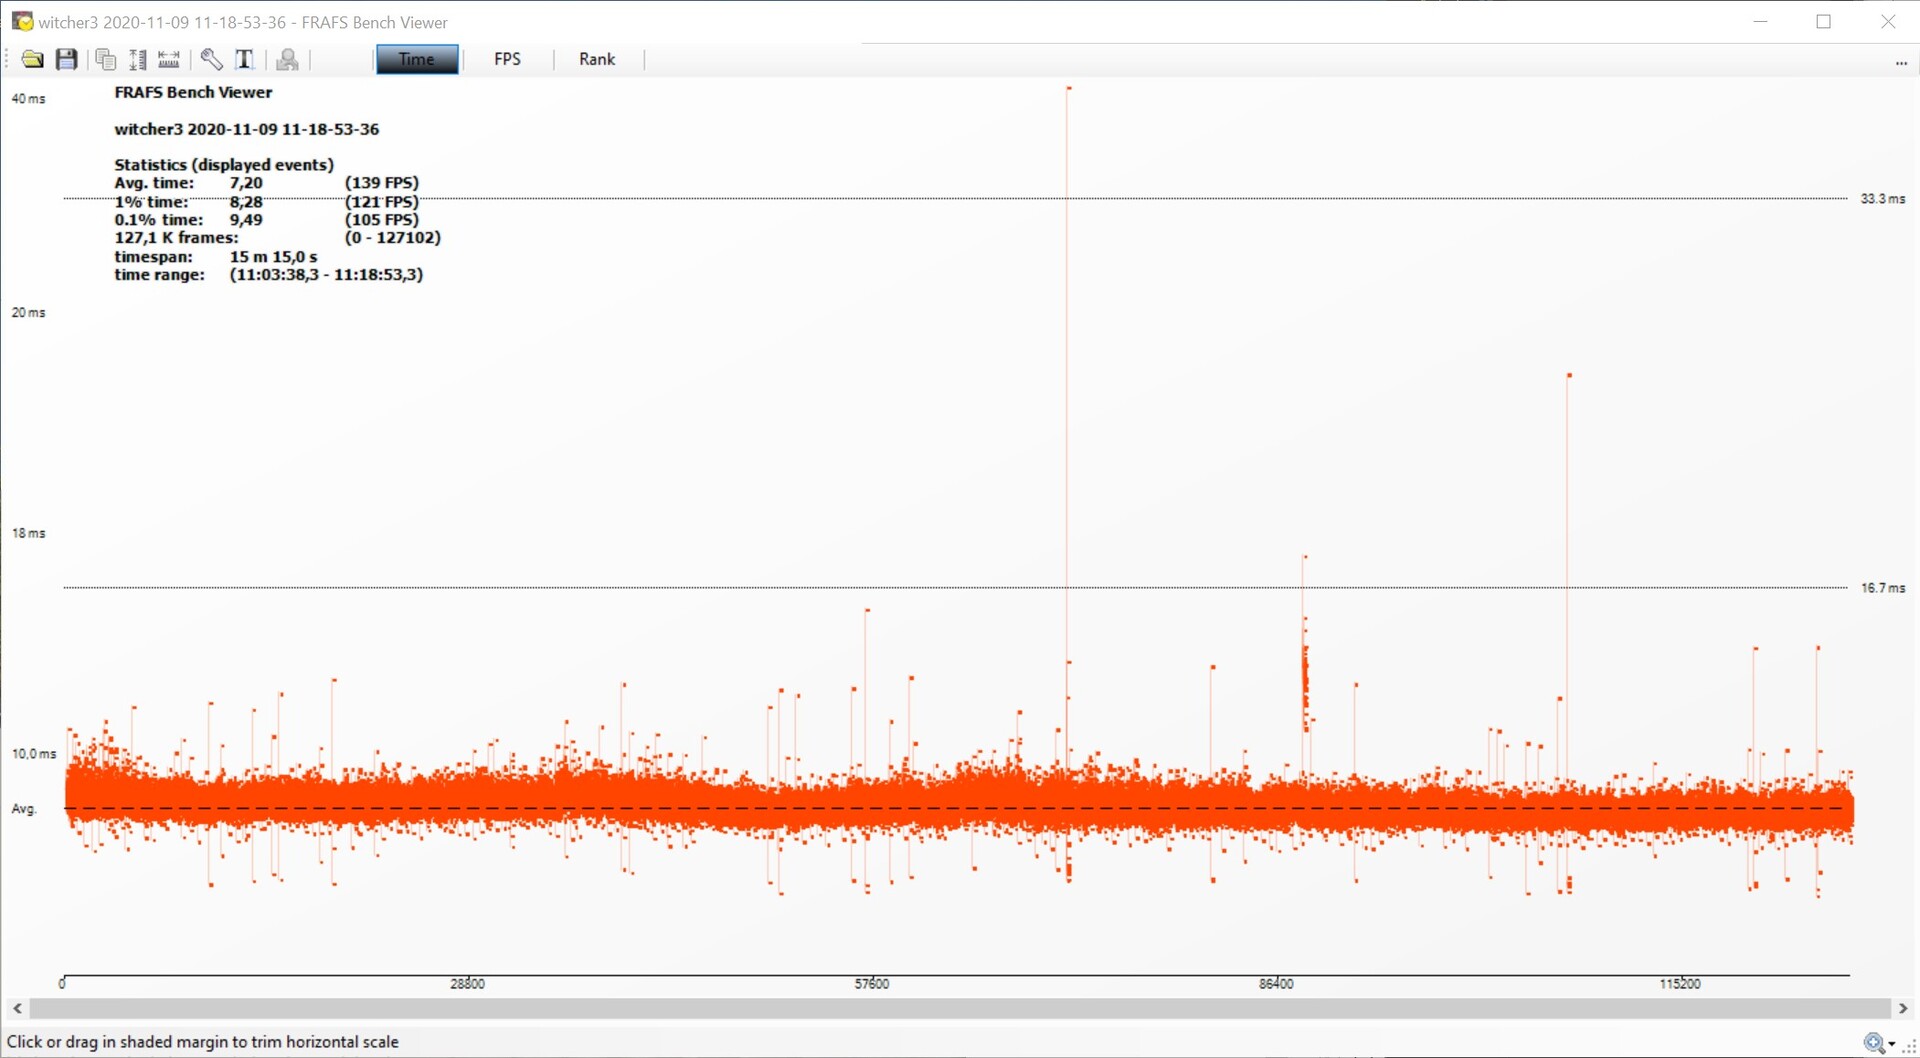
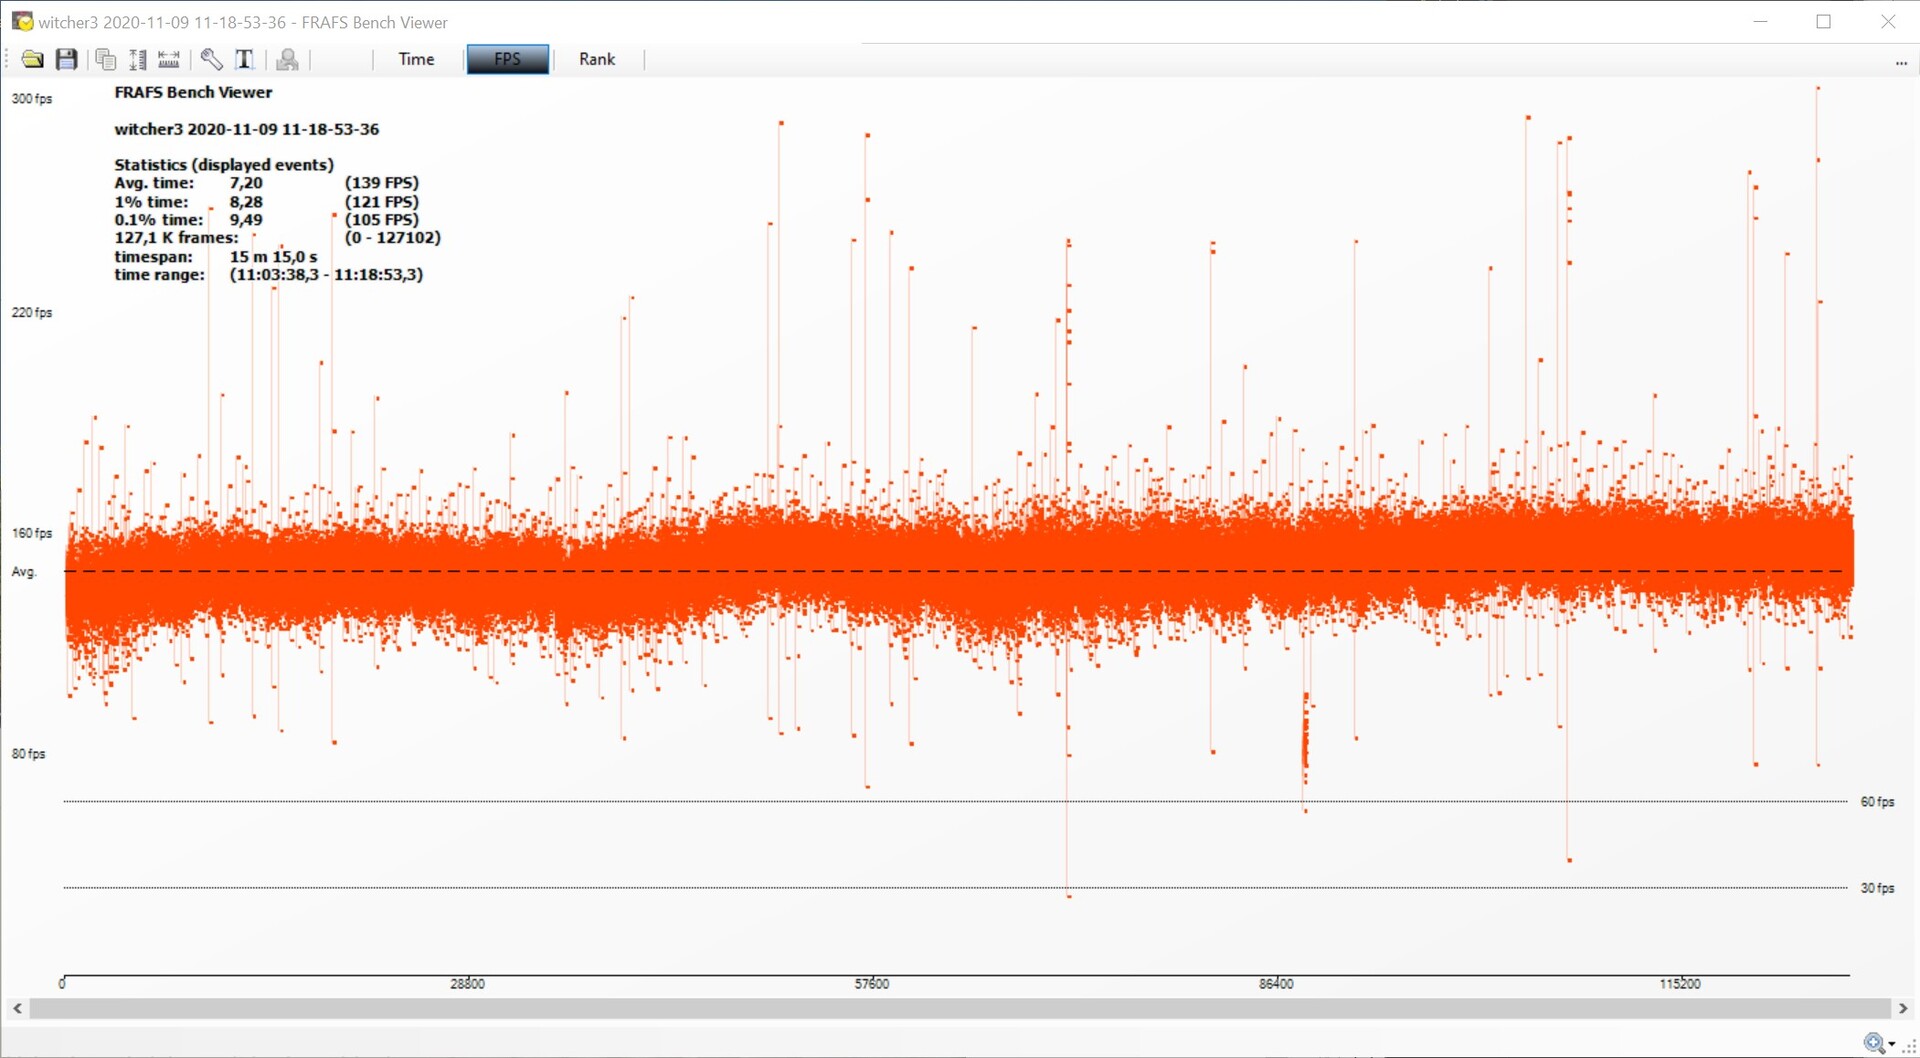
Yapılan oyun testleri GeForce RTX 3080'in yüksek çözünürlükler için daha uygun olduğunu ortaya koyuyor. Test ettiğimiz neredeyse tüm oyunlar 2160p'de sorunsuz oynanabiliyordu. Bununla birlikte, GeForce RTX 3080'in bile sınırlarına ulaştığı Flight Simulator 2020 gibi belirli oyunlar var. Yeni grafik kartı, 1080p'nin ötesine geçtiğinde en büyük avantajı gösteriyor. Yüksek çözünürlüklerde oynamıyorsanız, şu anda bir RTX 3080 satın almaya değmez, ancak Asus GeForce RTX 3080 ROG Strix Gaming OC ile sorunsuz oyun garanti edilmektedir. The Witcher 3 (Ultra ön ayar) oyunundaki kare ilerlemesini ve kare sürelerini inceledik ve kayda değer bir düzensizlik bulamadık. Bireysel aykırı değerleri belgeledik. Bununla birlikte, 139 FPS'de sorunsuz oyun kesinlikle garantilidir.
The Witcher 3 kare ilerlemesi - Ultra ön ayar
| Far Cry New Dawn - 3840x2160 Ultra Preset | |
| GeForce RTX 3090 | |
| Asus GeForce RTX 3080 ROG Strix Gaming OC | |
| Titan RTX | |
| Titan RTX | |
| GeForce RTX 2080 Ti (Desktop) | |
| GeForce RTX 2080 Super (Desktop) | |
| GeForce RTX 2080 (Desktop) | |
| Radeon VII | |
| GeForce RTX 2070 Super (Desktop) | |
| Radeon RX 5700 XT (Desktop) | |
| GeForce RTX 2070 (Desktop) | |
| Radeon RX 5700 (Desktop) | |
| GeForce RTX 2060 Super (Desktop) | |
| RX Vega 64 | |
| GeForce RTX 2060 (Desktop) | |
| Far Cry 5 - 3840x2160 Ultra Preset AA:T | |
| GeForce RTX 3090 | |
| Asus GeForce RTX 3080 ROG Strix Gaming OC | |
| Titan RTX | |
| Titan RTX | |
| GeForce RTX 2080 Ti (Desktop) | |
| GeForce RTX 2080 Super (Desktop) | |
| GeForce RTX 2080 (Desktop) | |
| Radeon VII | |
| GeForce RTX 2070 Super (Desktop) | |
| Radeon RX 5700 XT (Desktop) | |
| GeForce RTX 2070 (Desktop) | |
| GeForce RTX 2060 Super (Desktop) | |
| Radeon RX 5700 (Desktop) | |
| RX Vega 64 | |
| GeForce RTX 2060 (Desktop) | |
| F1 2020 - 3840x2160 Ultra High Preset AA:T AF:16x | |
| GeForce RTX 3090 | |
| Asus GeForce RTX 3080 ROG Strix Gaming OC | |
| Titan RTX | |
| Borderlands 3 - 3840x2160 Badass Overall Quality (DX11) | |
| GeForce RTX 3090 | |
| Asus GeForce RTX 3080 ROG Strix Gaming OC | |
| Titan RTX | |
| Titan RTX | |
| GeForce RTX 2080 Ti (Desktop) | |
| Metro Exodus - 3840x2160 Ultra Quality AF:16x | |
| GeForce RTX 3090 | |
| Asus GeForce RTX 3080 ROG Strix Gaming OC | |
| Titan RTX | |
| Titan RTX | |
| GeForce RTX 2080 Ti (Desktop) | |
| RX Vega 64 | |
| GeForce RTX 2080 Super (Desktop) | |
| GeForce RTX 2080 (Desktop) | |
| Radeon VII | |
| GeForce RTX 2070 Super (Desktop) | |
| GeForce RTX 2070 (Desktop) | |
| GeForce RTX 2060 Super (Desktop) | |
| Radeon RX 5700 XT (Desktop) | |
| Radeon RX 5700 (Desktop) | |
| GeForce RTX 2060 (Desktop) | |
| Red Dead Redemption 2 - 3840x2160 Maximum Settings | |
| GeForce RTX 3090 | |
| Asus GeForce RTX 3080 ROG Strix Gaming OC | |
| Titan RTX | |
| Rise of the Tomb Raider - 3840x2160 High Preset AA:FX AF:4x | |
| Asus GeForce RTX 3080 ROG Strix Gaming OC | |
| GeForce RTX 2080 Ti (Desktop) | |
| GeForce RTX 2080 Super (Desktop) | |
| GeForce RTX 2080 (Desktop) | |
| GeForce RTX 2070 Super (Desktop) | |
| GeForce RTX 2070 (Desktop) | |
| Radeon VII | |
| GeForce RTX 2060 Super (Desktop) | |
| RX Vega 64 | |
| GeForce RTX 2060 (Desktop) | |
| Shadow of the Tomb Raider - 3840x2160 Highest Preset AA:T | |
| GeForce RTX 3090 | |
| Asus GeForce RTX 3080 ROG Strix Gaming OC | |
| Titan RTX | |
| Titan RTX | |
| GeForce RTX 2080 Ti (Desktop) | |
| GeForce RTX 2080 Super (Desktop) | |
| GeForce RTX 2080 (Desktop) | |
| Radeon VII | |
| GeForce RTX 2070 Super (Desktop) | |
| GeForce RTX 2070 (Desktop) | |
| Radeon RX 5700 XT (Desktop) | |
| GeForce RTX 2060 Super (Desktop) | |
| Radeon RX 5700 (Desktop) | |
| GeForce RTX 2060 (Desktop) | |
| RX Vega 64 | |
| düşük | orta | yüksek | ultra | QHD | 4K | |
|---|---|---|---|---|---|---|
| GTA V (2015) | 187 | 187 | 184 | 130 | 122 | 136 |
| The Witcher 3 (2015) | 427 | 375 | 286 | 152 | 115 | |
| Dota 2 Reborn (2015) | 216.6 | 197.1 | 184.4 | 168.7 | 159.1 | |
| Rise of the Tomb Raider (2016) | 327 | 231 | 217 | 217 | 107 | |
| Final Fantasy XV Benchmark (2018) | 228 | 205 | 156 | 124 | 76.1 | |
| X-Plane 11.11 (2018) | 165 | 153 | 123 | 105 | ||
| Far Cry 5 (2018) | 184 | 162 | 155 | 145 | 137 | 95 |
| Strange Brigade (2018) | 567 | 416 | 336 | 289 | 220 | 135 |
| Shadow of the Tomb Raider (2018) | 227 | 206 | 198 | 185 | 147 | 83.9 |
| Battlefield V (2018) | 192 | 178 | 163 | 152 | 132 | 94.2 |
| Apex Legends (2019) | 144 | 144 | 144 | 144 | 144 | 143 |
| Far Cry New Dawn (2019) | 150 | 132 | 127 | 115 | 110 | 89 |
| Metro Exodus (2019) | 212 | 155 | 143 | 111 | 92.2 | 64.1 |
| The Division 2 (2019) | 240 | 197 | 168 | 140 | 107 | 65 |
| Anno 1800 (2019) | 142 | 139 | 99.3 | 54.1 | 52.5 | 46.3 |
| Rage 2 (2019) | 294 | 209 | 182 | 180 | 134 | 72.1 |
| Control (2019) | 240 | 196 | 155 | 106 | 56.2 | |
| Borderlands 3 (2019) | 165 | 143 | 129 | 128 | 103 | 61.5 |
| Star Wars Jedi Fallen Order (2019) | 134 | 132 | 133 | 132 | 92.9 | |
| Red Dead Redemption 2 (2019) | 167 | 154 | 135 | 96 | 81 | 56 |
| Hunt Showdown (2020) | 236 | 173 | 172 | 155 | 95.8 | |
| Doom Eternal (2020) | 283 | 277 | 270 | 268 | 248 | 153 |
| F1 2020 (2020) | 367 | 255 | 239 | 185 | 155 | 118 |
| Horizon Zero Dawn (2020) | 164 | 151 | 147 | 141 | 133 | 95 |
| Flight Simulator 2020 (2020) | 115 | 97.4 | 79.9 | 62.8 | 55.6 | 37.3 |
| Serious Sam 4 (2020) | 182.5 | 148.6 | 138.1 | 135.2 | 124.8 | 117 |
| Mafia Definitive Edition (2020) | 199 | 184 | 169 | 137 | 78.2 | |
| Star Wars Squadrons (2020) | 586 | 433 | 379 | 358 | 266 | 169 |
| FIFA 21 (2020) | 306 | 312 | 293 | 295 | 295 | 284 |
| Watch Dogs Legion (2020) | 147 | 146 | 125 | 103 | 81.6 | 54.1 |
| Dirt 5 (2020) | 176 | 121 | 111 | 111 | 69.1 | 55.3 |
Hesaplama performansı
LuxMark ve ComputeMark'ta, Asus GeForce RTX 3080 ROG Strix Gaming OC, eski karşılaştırma modellerinden önemli ölçüde daha iyi puan alıyor. SPECviewperf testleri öncelikle iş istasyonlarına yöneliktir. Burada, Quadro ve FirePro modelleri, sürücü optimizasyonları nedeniyle genellikle daha fazla performans sunar. Nvidia Titan RTX, yapımında Quadro serisinin RTX 6000'iyle aynı olduğu için burada özel bir konuma sahiptir. Yeni Ampere grafik kartları bireysel disiplinlerde daha iyi değerler sunsa da, genel olarak burada en iyi performansı sunar.
| LuxMark v2.0 64Bit | |
| Room GPUs-only | |
| Zotac Gaming GeForce RTX 3090 Trinity | |
| ASUS GeForce RTX 3080 ROG STRIX OC GAMING | |
| Nvidia Titan RTX | |
| MSI RTX 2080 Ti Gaming X Trio | |
| KFA2 GeForce RTX 2080 Ti EX | |
| AMD Radeon VII | |
| MSI RTX 2080 Gaming X Trio | |
| Nvidia GeForce RTX 2080 Super | |
| Nvidia GeForce RTX 2070 Super | |
| MSI RTX 2070 Gaming Z 8G | |
| Nvidia GeForce RTX 2060 Super | |
| MSI RTX 2060 Gaming Z 6G | |
| AMD Radeon RX 5700 XT | |
| AMD Radeon RX 5700 | |
| Sala GPUs-only | |
| Zotac Gaming GeForce RTX 3090 Trinity | |
| ASUS GeForce RTX 3080 ROG STRIX OC GAMING | |
| Nvidia Titan RTX | |
| MSI RTX 2080 Ti Gaming X Trio | |
| KFA2 GeForce RTX 2080 Ti EX | |
| MSI RTX 2080 Gaming X Trio | |
| Nvidia GeForce RTX 2080 Super | |
| Nvidia GeForce RTX 2070 Super | |
| MSI RTX 2070 Gaming Z 8G | |
| Nvidia GeForce RTX 2060 Super | |
| AMD Radeon VII | |
| AMD Radeon RX 5700 XT | |
| MSI RTX 2060 Gaming Z 6G | |
| AMD Radeon RX 5700 | |
| ComputeMark v2.1 | |
| 1024x600 Normal, QJuliaRayTrace | |
| Zotac Gaming GeForce RTX 3090 Trinity | |
| ASUS GeForce RTX 3080 ROG STRIX OC GAMING | |
| MSI RTX 2080 Ti Gaming X Trio | |
| Nvidia Titan RTX | |
| KFA2 GeForce RTX 2080 Ti EX | |
| MSI RTX 2080 Gaming X Trio | |
| Nvidia GeForce RTX 2080 Super | |
| Nvidia GeForce RTX 2070 Super | |
| AMD Radeon VII | |
| AMD Radeon RX 5700 XT | |
| MSI RTX 2070 Gaming Z 8G | |
| Nvidia GeForce RTX 2060 Super | |
| MSI RTX 2060 Gaming Z 6G | |
| AMD Radeon RX 5700 | |
| 1024x600 Normal, Mandel Scalar | |
| Zotac Gaming GeForce RTX 3090 Trinity | |
| ASUS GeForce RTX 3080 ROG STRIX OC GAMING | |
| AMD Radeon VII | |
| MSI RTX 2080 Ti Gaming X Trio | |
| Nvidia Titan RTX | |
| KFA2 GeForce RTX 2080 Ti EX | |
| AMD Radeon RX 5700 XT | |
| MSI RTX 2080 Gaming X Trio | |
| Nvidia GeForce RTX 2080 Super | |
| AMD Radeon RX 5700 | |
| Nvidia GeForce RTX 2070 Super | |
| MSI RTX 2070 Gaming Z 8G | |
| Nvidia GeForce RTX 2060 Super | |
| MSI RTX 2060 Gaming Z 6G | |
| 1024x600 Normal, Mandel Vector | |
| Zotac Gaming GeForce RTX 3090 Trinity | |
| ASUS GeForce RTX 3080 ROG STRIX OC GAMING | |
| MSI RTX 2080 Ti Gaming X Trio | |
| Nvidia Titan RTX | |
| AMD Radeon VII | |
| KFA2 GeForce RTX 2080 Ti EX | |
| AMD Radeon RX 5700 XT | |
| MSI RTX 2080 Gaming X Trio | |
| Nvidia GeForce RTX 2080 Super | |
| AMD Radeon RX 5700 | |
| Nvidia GeForce RTX 2070 Super | |
| MSI RTX 2070 Gaming Z 8G | |
| Nvidia GeForce RTX 2060 Super | |
| MSI RTX 2060 Gaming Z 6G | |
| 1024x600 Normal, Fluid 2DTexArr | |
| Zotac Gaming GeForce RTX 3090 Trinity | |
| ASUS GeForce RTX 3080 ROG STRIX OC GAMING | |
| Nvidia Titan RTX | |
| MSI RTX 2080 Ti Gaming X Trio | |
| KFA2 GeForce RTX 2080 Ti EX | |
| Nvidia GeForce RTX 2080 Super | |
| MSI RTX 2080 Gaming X Trio | |
| Nvidia GeForce RTX 2070 Super | |
| AMD Radeon VII | |
| MSI RTX 2070 Gaming Z 8G | |
| Nvidia GeForce RTX 2060 Super | |
| AMD Radeon RX 5700 XT | |
| AMD Radeon RX 5700 | |
| MSI RTX 2060 Gaming Z 6G | |
| 1024x600 Normal, Fluid 3DTex | |
| Zotac Gaming GeForce RTX 3090 Trinity | |
| ASUS GeForce RTX 3080 ROG STRIX OC GAMING | |
| Nvidia Titan RTX | |
| MSI RTX 2080 Ti Gaming X Trio | |
| AMD Radeon VII | |
| KFA2 GeForce RTX 2080 Ti EX | |
| Nvidia GeForce RTX 2080 Super | |
| MSI RTX 2080 Gaming X Trio | |
| Nvidia GeForce RTX 2070 Super | |
| MSI RTX 2070 Gaming Z 8G | |
| AMD Radeon RX 5700 XT | |
| AMD Radeon RX 5700 | |
| Nvidia GeForce RTX 2060 Super | |
| MSI RTX 2060 Gaming Z 6G | |
| 1024x600 Normal, Score | |
| Zotac Gaming GeForce RTX 3090 Trinity | |
| ASUS GeForce RTX 3080 ROG STRIX OC GAMING | |
| MSI RTX 2080 Ti Gaming X Trio | |
| Nvidia Titan RTX | |
| KFA2 GeForce RTX 2080 Ti EX | |
| AMD Radeon VII | |
| Nvidia GeForce RTX 2080 Super | |
| MSI RTX 2080 Gaming X Trio | |
| AMD Radeon RX 5700 XT | |
| Nvidia GeForce RTX 2070 Super | |
| MSI RTX 2070 Gaming Z 8G | |
| AMD Radeon RX 5700 | |
| Nvidia GeForce RTX 2060 Super | |
| MSI RTX 2060 Gaming Z 6G | |
| SPECviewperf 13 | |
| Solidworks (sw-04) | |
| Nvidia Titan RTX | |
| AMD Radeon RX 5700 XT | |
| MSI RTX 2080 Ti Gaming X Trio | |
| KFA2 GeForce RTX 2080 Ti EX | |
| Zotac Gaming GeForce RTX 3090 Trinity | |
| AMD Radeon RX 5700 | |
| MSI RTX 2080 Gaming X Trio | |
| Nvidia GeForce RTX 2080 Super | |
| AMD Radeon VII | |
| Nvidia GeForce RTX 2070 Super | |
| ASUS GeForce RTX 3080 ROG STRIX OC GAMING | |
| MSI RTX 2070 Gaming Z 8G | |
| MSI RTX 2060 Gaming Z 6G | |
| Nvidia GeForce RTX 2060 Super | |
| Siemens NX (snx-03) | |
| Nvidia Titan RTX | |
| AMD Radeon RX 5700 XT | |
| AMD Radeon RX 5700 | |
| AMD Radeon VII | |
| Zotac Gaming GeForce RTX 3090 Trinity | |
| ASUS GeForce RTX 3080 ROG STRIX OC GAMING | |
| MSI RTX 2080 Ti Gaming X Trio | |
| KFA2 GeForce RTX 2080 Ti EX | |
| Nvidia GeForce RTX 2080 Super | |
| MSI RTX 2080 Gaming X Trio | |
| Nvidia GeForce RTX 2070 Super | |
| MSI RTX 2070 Gaming Z 8G | |
| Nvidia GeForce RTX 2060 Super | |
| MSI RTX 2060 Gaming Z 6G | |
| Showcase (showcase-02) | |
| Zotac Gaming GeForce RTX 3090 Trinity | |
| Nvidia Titan RTX | |
| KFA2 GeForce RTX 2080 Ti EX | |
| MSI RTX 2080 Ti Gaming X Trio | |
| Nvidia GeForce RTX 2080 Super | |
| AMD Radeon RX 5700 XT | |
| Nvidia GeForce RTX 2070 Super | |
| AMD Radeon RX 5700 | |
| Nvidia GeForce RTX 2060 Super | |
| MSI RTX 2060 Gaming Z 6G | |
| Medical (medical-02) | |
| Zotac Gaming GeForce RTX 3090 Trinity | |
| ASUS GeForce RTX 3080 ROG STRIX OC GAMING | |
| Nvidia Titan RTX | |
| MSI RTX 2080 Ti Gaming X Trio | |
| AMD Radeon RX 5700 XT | |
| KFA2 GeForce RTX 2080 Ti EX | |
| AMD Radeon VII | |
| Nvidia GeForce RTX 2080 Super | |
| MSI RTX 2080 Gaming X Trio | |
| AMD Radeon RX 5700 | |
| Nvidia GeForce RTX 2070 Super | |
| MSI RTX 2070 Gaming Z 8G | |
| Nvidia GeForce RTX 2060 Super | |
| MSI RTX 2060 Gaming Z 6G | |
| Maya (maya-05) | |
| Zotac Gaming GeForce RTX 3090 Trinity | |
| MSI RTX 2080 Ti Gaming X Trio | |
| KFA2 GeForce RTX 2080 Ti EX | |
| Nvidia Titan RTX | |
| ASUS GeForce RTX 3080 ROG STRIX OC GAMING | |
| Nvidia GeForce RTX 2080 Super | |
| Nvidia GeForce RTX 2070 Super | |
| MSI RTX 2070 Gaming Z 8G | |
| Nvidia GeForce RTX 2060 Super | |
| MSI RTX 2060 Gaming Z 6G | |
| AMD Radeon RX 5700 XT | |
| AMD Radeon VII | |
| AMD Radeon RX 5700 | |
| Energy (energy-02) | |
| Nvidia Titan RTX | |
| Zotac Gaming GeForce RTX 3090 Trinity | |
| ASUS GeForce RTX 3080 ROG STRIX OC GAMING | |
| AMD Radeon VII | |
| MSI RTX 2080 Ti Gaming X Trio | |
| KFA2 GeForce RTX 2080 Ti EX | |
| AMD Radeon RX 5700 XT | |
| AMD Radeon RX 5700 | |
| Nvidia GeForce RTX 2080 Super | |
| Nvidia GeForce RTX 2070 Super | |
| MSI RTX 2070 Gaming Z 8G | |
| Nvidia GeForce RTX 2060 Super | |
| MSI RTX 2060 Gaming Z 6G | |
| Creo (creo-02) | |
| Zotac Gaming GeForce RTX 3090 Trinity | |
| Nvidia Titan RTX | |
| MSI RTX 2080 Ti Gaming X Trio | |
| KFA2 GeForce RTX 2080 Ti EX | |
| ASUS GeForce RTX 3080 ROG STRIX OC GAMING | |
| MSI RTX 2080 Gaming X Trio | |
| Nvidia GeForce RTX 2080 Super | |
| MSI RTX 2070 Gaming Z 8G | |
| Nvidia GeForce RTX 2060 Super | |
| Nvidia GeForce RTX 2070 Super | |
| MSI RTX 2060 Gaming Z 6G | |
| AMD Radeon RX 5700 XT | |
| AMD Radeon RX 5700 | |
| AMD Radeon VII | |
| Catia (catia-05) | |
| Nvidia Titan RTX | |
| AMD Radeon RX 5700 XT | |
| AMD Radeon VII | |
| AMD Radeon RX 5700 | |
| Zotac Gaming GeForce RTX 3090 Trinity | |
| ASUS GeForce RTX 3080 ROG STRIX OC GAMING | |
| MSI RTX 2080 Ti Gaming X Trio | |
| KFA2 GeForce RTX 2080 Ti EX | |
| Nvidia GeForce RTX 2080 Super | |
| Nvidia GeForce RTX 2070 Super | |
| MSI RTX 2070 Gaming Z 8G | |
| Nvidia GeForce RTX 2060 Super | |
| MSI RTX 2060 Gaming Z 6G | |
| 3ds Max (3dsmax-06) | |
| Zotac Gaming GeForce RTX 3090 Trinity | |
| MSI RTX 2080 Ti Gaming X Trio | |
| KFA2 GeForce RTX 2080 Ti EX | |
| Nvidia Titan RTX | |
| ASUS GeForce RTX 3080 ROG STRIX OC GAMING | |
| Nvidia GeForce RTX 2080 Super | |
| Nvidia GeForce RTX 2070 Super | |
| MSI RTX 2070 Gaming Z 8G | |
| Nvidia GeForce RTX 2060 Super | |
| MSI RTX 2060 Gaming Z 6G | |
| AMD Radeon RX 5700 XT | |
| AMD Radeon VII | |
| AMD Radeon RX 5700 | |
| SPECviewperf 12 | |
| 1900x1060 Solidworks (sw-03) | |
| Nvidia Titan RTX | |
| AMD Radeon RX 5700 XT | |
| MSI RTX 2080 Ti Gaming X Trio | |
| AMD Radeon RX 5700 | |
| KFA2 GeForce RTX 2080 Ti EX | |
| Zotac Gaming GeForce RTX 3090 Trinity | |
| AMD Radeon VII | |
| ASUS GeForce RTX 3080 ROG STRIX OC GAMING | |
| Nvidia GeForce RTX 2080 Super | |
| MSI RTX 2080 Gaming X Trio | |
| Nvidia GeForce RTX 2070 Super | |
| MSI RTX 2070 Gaming Z 8G | |
| Nvidia GeForce RTX 2060 Super | |
| MSI RTX 2060 Gaming Z 6G | |
| 1900x1060 Siemens NX (snx-02) | |
| Nvidia Titan RTX | |
| AMD Radeon RX 5700 XT | |
| AMD Radeon RX 5700 | |
| AMD Radeon VII | |
| ASUS GeForce RTX 3080 ROG STRIX OC GAMING | |
| Zotac Gaming GeForce RTX 3090 Trinity | |
| MSI RTX 2080 Ti Gaming X Trio | |
| Nvidia GeForce RTX 2080 Super | |
| KFA2 GeForce RTX 2080 Ti EX | |
| MSI RTX 2080 Gaming X Trio | |
| Nvidia GeForce RTX 2070 Super | |
| MSI RTX 2070 Gaming Z 8G | |
| Nvidia GeForce RTX 2060 Super | |
| MSI RTX 2060 Gaming Z 6G | |
| 1900x1060 Showcase (showcase-01) | |
| Zotac Gaming GeForce RTX 3090 Trinity | |
| ASUS GeForce RTX 3080 ROG STRIX OC GAMING | |
| Nvidia Titan RTX | |
| MSI RTX 2080 Ti Gaming X Trio | |
| KFA2 GeForce RTX 2080 Ti EX | |
| Nvidia GeForce RTX 2080 Super | |
| AMD Radeon RX 5700 XT | |
| Nvidia GeForce RTX 2070 Super | |
| AMD Radeon RX 5700 | |
| Nvidia GeForce RTX 2060 Super | |
| MSI RTX 2060 Gaming Z 6G | |
| 1900x1060 Medical (medical-01) | |
| Nvidia Titan RTX | |
| Zotac Gaming GeForce RTX 3090 Trinity | |
| AMD Radeon VII | |
| MSI RTX 2080 Ti Gaming X Trio | |
| ASUS GeForce RTX 3080 ROG STRIX OC GAMING | |
| KFA2 GeForce RTX 2080 Ti EX | |
| AMD Radeon RX 5700 XT | |
| Nvidia GeForce RTX 2080 Super | |
| MSI RTX 2080 Gaming X Trio | |
| Nvidia GeForce RTX 2070 Super | |
| AMD Radeon RX 5700 | |
| MSI RTX 2070 Gaming Z 8G | |
| Nvidia GeForce RTX 2060 Super | |
| MSI RTX 2060 Gaming Z 6G | |
| 1900x1060 Maya (maya-04) | |
| ASUS GeForce RTX 3080 ROG STRIX OC GAMING | |
| MSI RTX 2080 Ti Gaming X Trio | |
| KFA2 GeForce RTX 2080 Ti EX | |
| Zotac Gaming GeForce RTX 3090 Trinity | |
| MSI RTX 2080 Gaming X Trio | |
| Nvidia GeForce RTX 2060 Super | |
| MSI RTX 2070 Gaming Z 8G | |
| Nvidia GeForce RTX 2080 Super | |
| Nvidia Titan RTX | |
| MSI RTX 2060 Gaming Z 6G | |
| Nvidia GeForce RTX 2070 Super | |
| AMD Radeon VII | |
| AMD Radeon RX 5700 XT | |
| AMD Radeon RX 5700 | |
| 1900x1060 Energy (energy-01) | |
| Nvidia Titan RTX | |
| Zotac Gaming GeForce RTX 3090 Trinity | |
| ASUS GeForce RTX 3080 ROG STRIX OC GAMING | |
| MSI RTX 2080 Ti Gaming X Trio | |
| AMD Radeon VII | |
| KFA2 GeForce RTX 2080 Ti EX | |
| Nvidia GeForce RTX 2080 Super | |
| AMD Radeon RX 5700 XT | |
| MSI RTX 2080 Gaming X Trio | |
| Nvidia GeForce RTX 2070 Super | |
| AMD Radeon RX 5700 | |
| MSI RTX 2070 Gaming Z 8G | |
| Nvidia GeForce RTX 2060 Super | |
| MSI RTX 2060 Gaming Z 6G | |
| 1900x1060 Creo (creo-01) | |
| Nvidia Titan RTX | |
| ASUS GeForce RTX 3080 ROG STRIX OC GAMING | |
| Zotac Gaming GeForce RTX 3090 Trinity | |
| AMD Radeon RX 5700 XT | |
| MSI RTX 2080 Ti Gaming X Trio | |
| KFA2 GeForce RTX 2080 Ti EX | |
| AMD Radeon RX 5700 | |
| AMD Radeon VII | |
| Nvidia GeForce RTX 2080 Super | |
| MSI RTX 2080 Gaming X Trio | |
| Nvidia GeForce RTX 2070 Super | |
| MSI RTX 2070 Gaming Z 8G | |
| MSI RTX 2060 Gaming Z 6G | |
| Nvidia GeForce RTX 2060 Super | |
| 1900x1060 Catia (catia-04) | |
| Nvidia Titan RTX | |
| AMD Radeon VII | |
| AMD Radeon RX 5700 XT | |
| AMD Radeon RX 5700 | |
| Zotac Gaming GeForce RTX 3090 Trinity | |
| ASUS GeForce RTX 3080 ROG STRIX OC GAMING | |
| MSI RTX 2080 Ti Gaming X Trio | |
| KFA2 GeForce RTX 2080 Ti EX | |
| MSI RTX 2080 Gaming X Trio | |
| Nvidia GeForce RTX 2080 Super | |
| Nvidia GeForce RTX 2070 Super | |
| MSI RTX 2070 Gaming Z 8G | |
| Nvidia GeForce RTX 2060 Super | |
| MSI RTX 2060 Gaming Z 6G | |
| 1900x1060 3ds Max (3dsmax-05) | |
| Zotac Gaming GeForce RTX 3090 Trinity | |
| ASUS GeForce RTX 3080 ROG STRIX OC GAMING | |
| MSI RTX 2080 Ti Gaming X Trio | |
| Nvidia Titan RTX | |
| KFA2 GeForce RTX 2080 Ti EX | |
| MSI RTX 2080 Gaming X Trio | |
| Nvidia GeForce RTX 2080 Super | |
| Nvidia GeForce RTX 2070 Super | |
| MSI RTX 2070 Gaming Z 8G | |
| Nvidia GeForce RTX 2060 Super | |
| MSI RTX 2060 Gaming Z 6G | |
| AMD Radeon RX 5700 XT | |
| AMD Radeon VII | |
| AMD Radeon RX 5700 | |
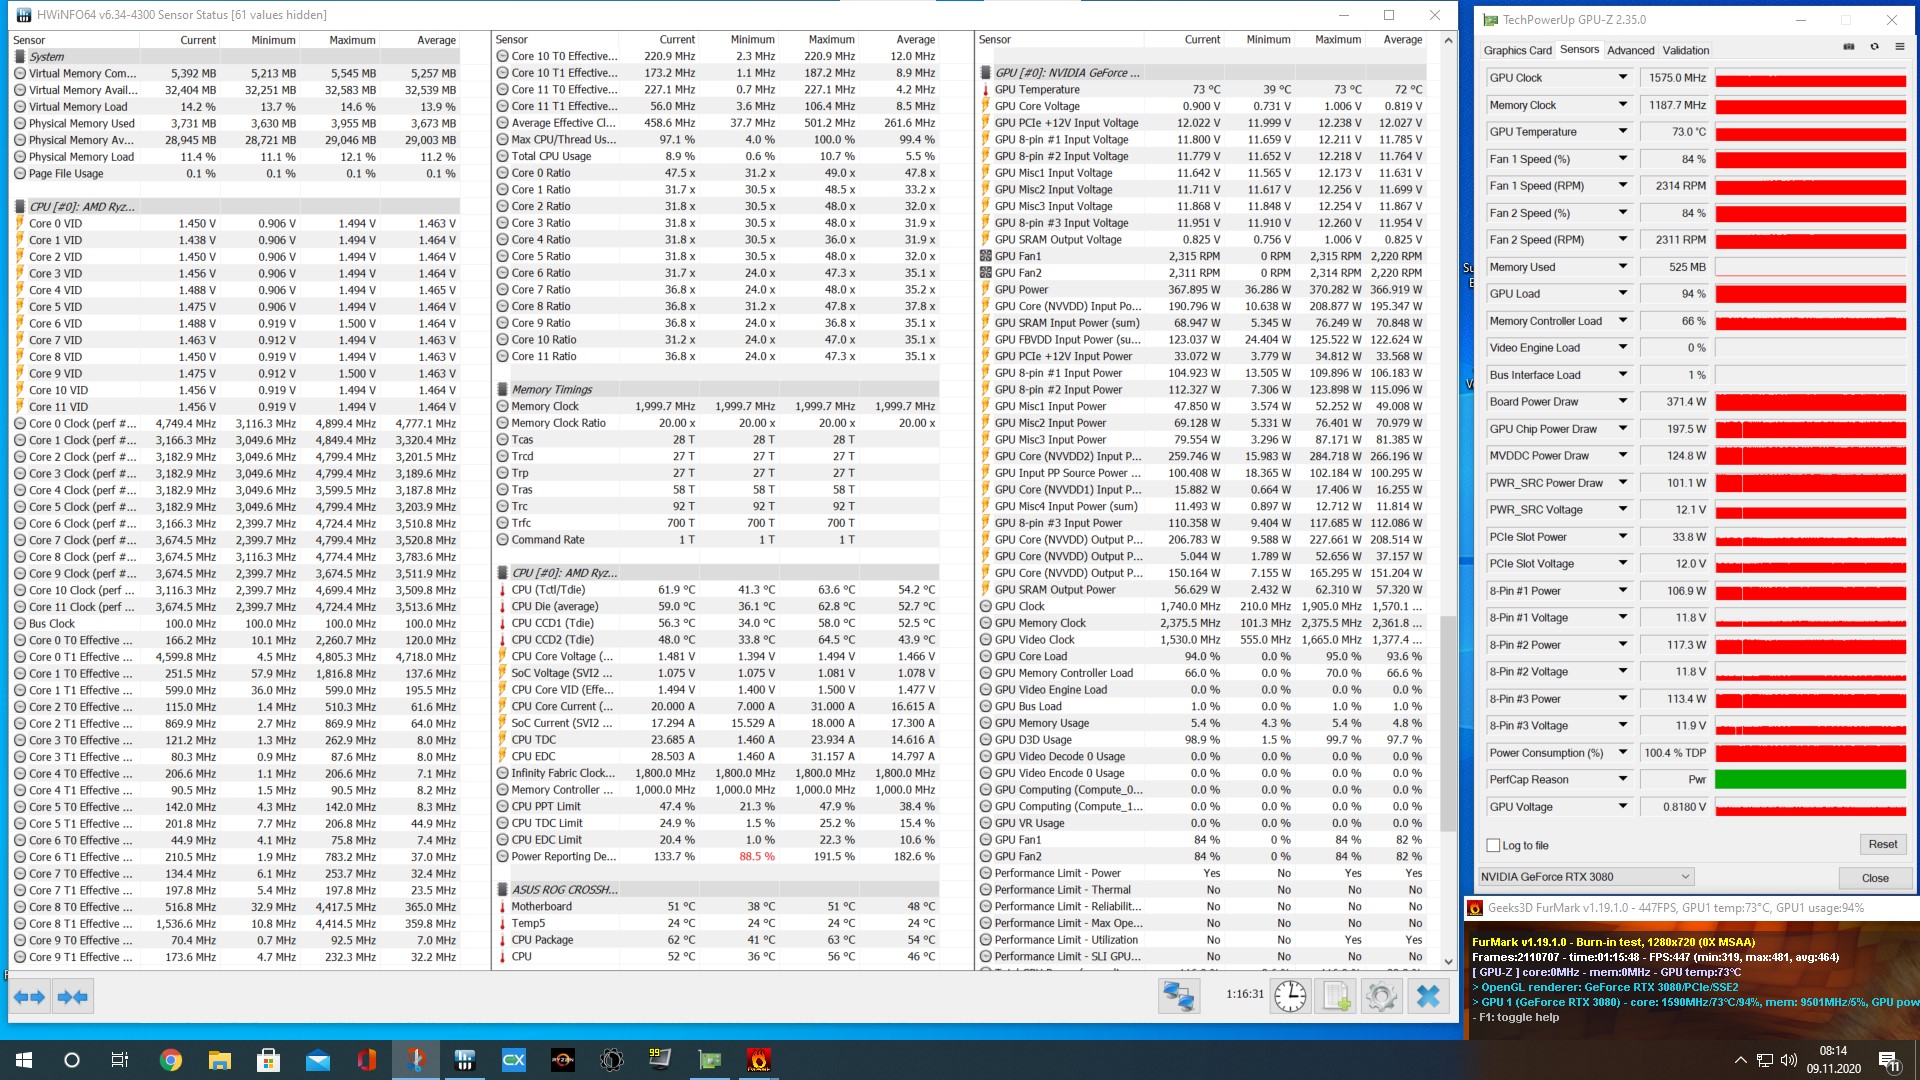
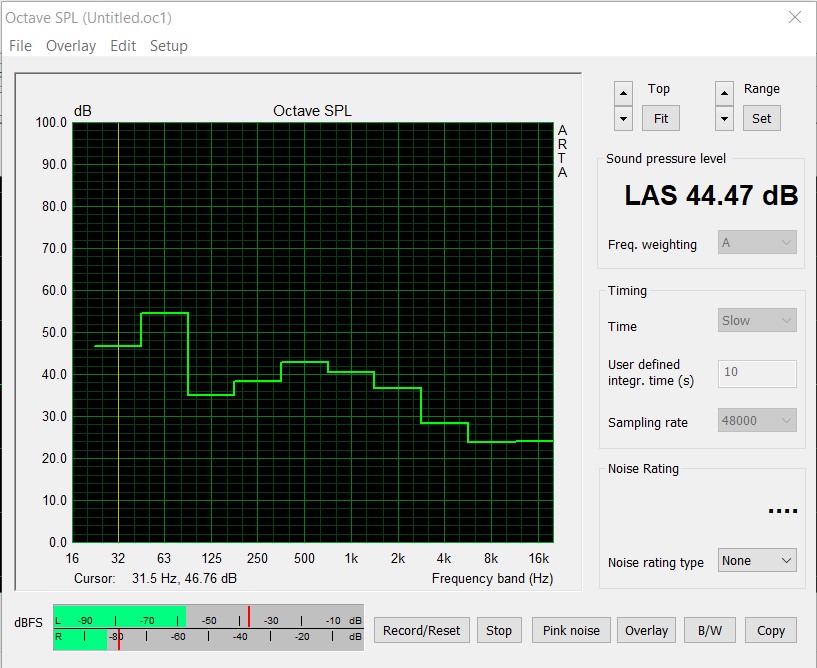
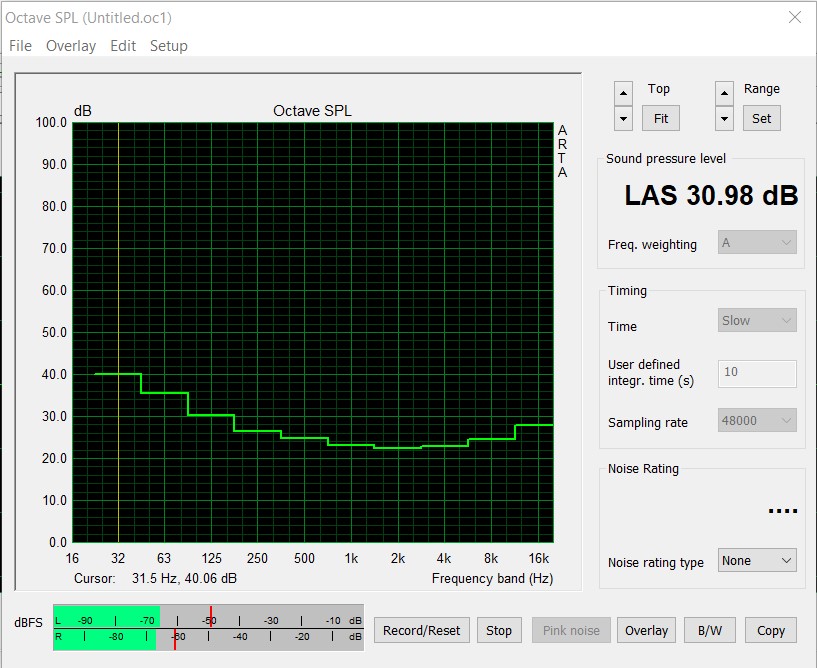
Asus GeForce RTX 3080 ROG Strix Gaming OC Emisyonları
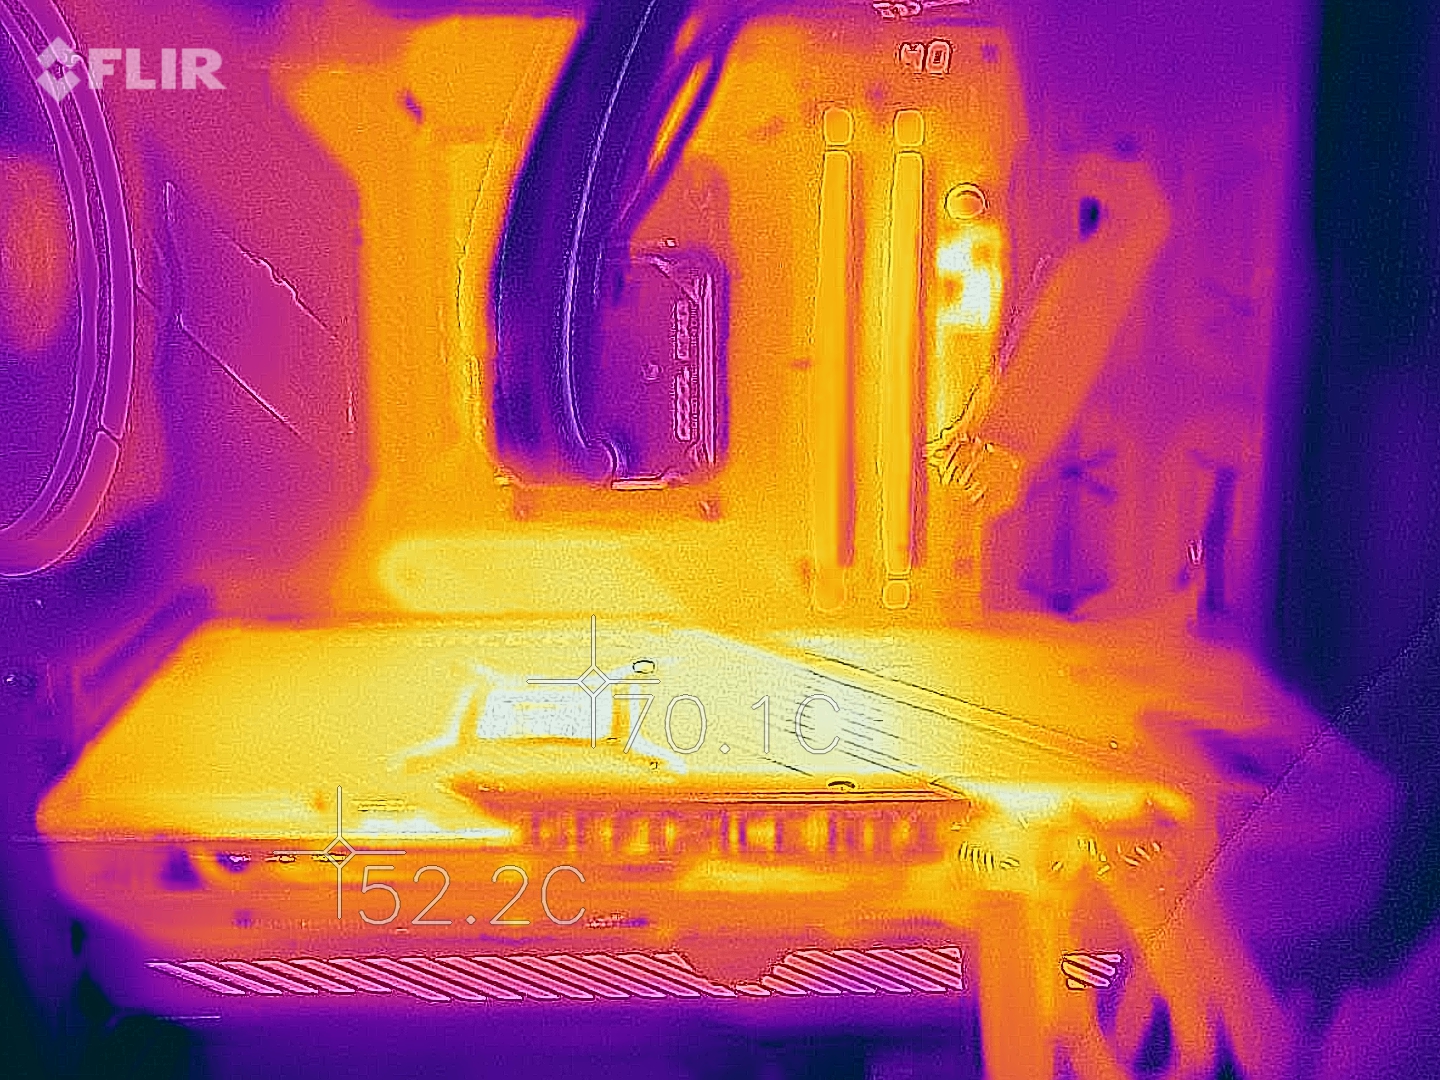
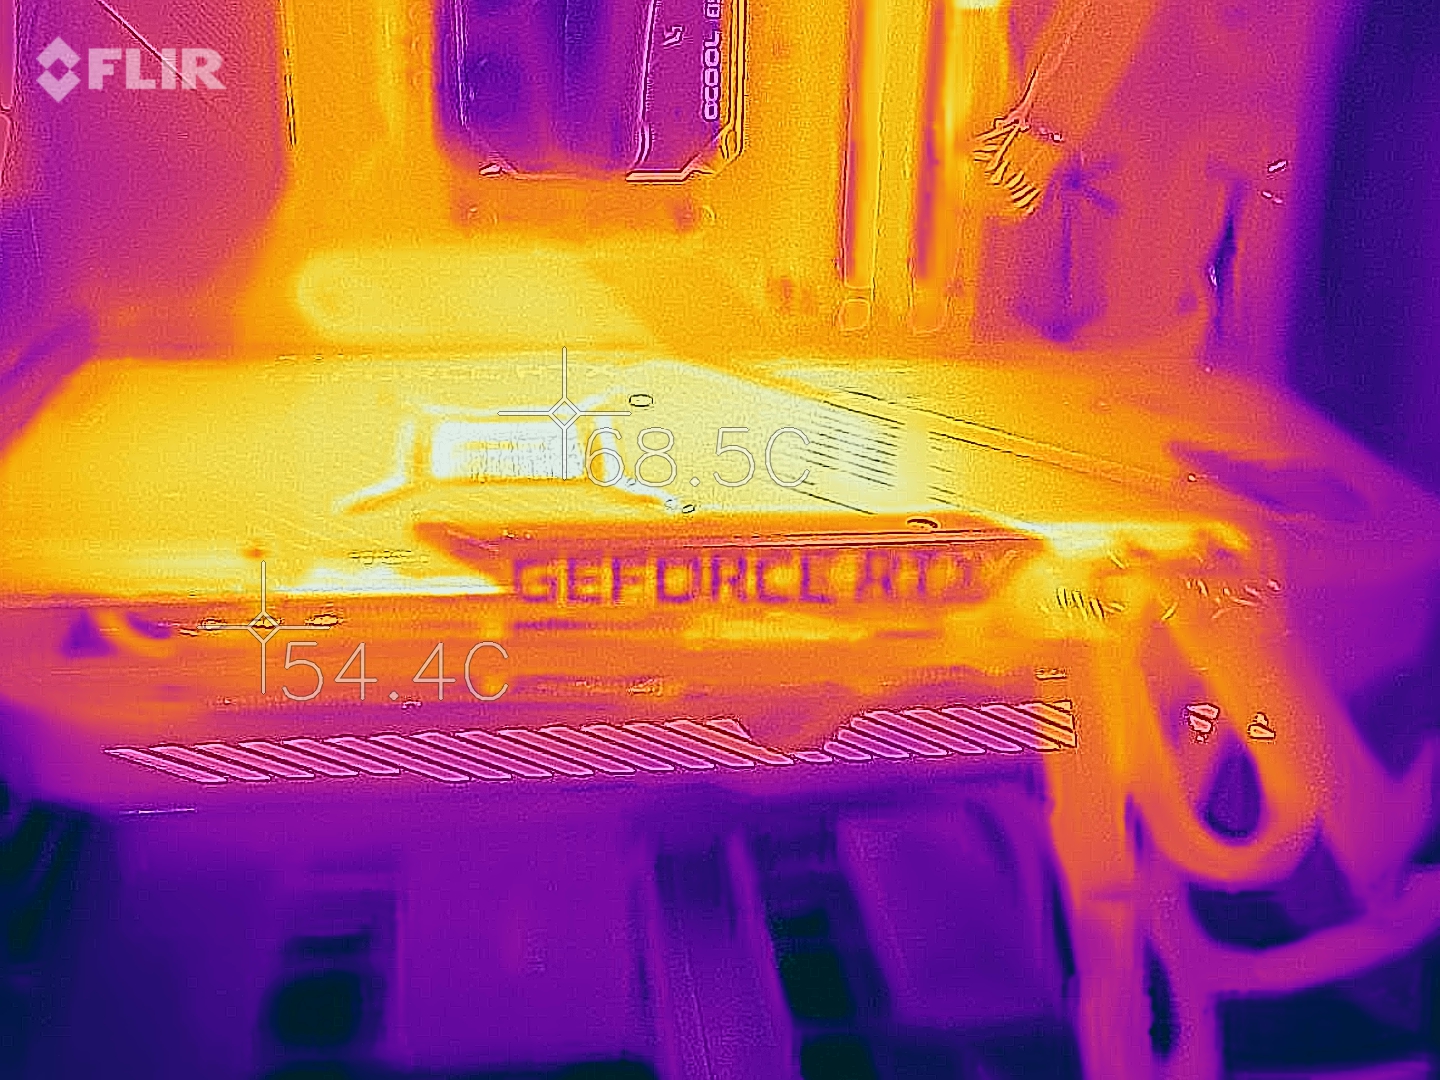
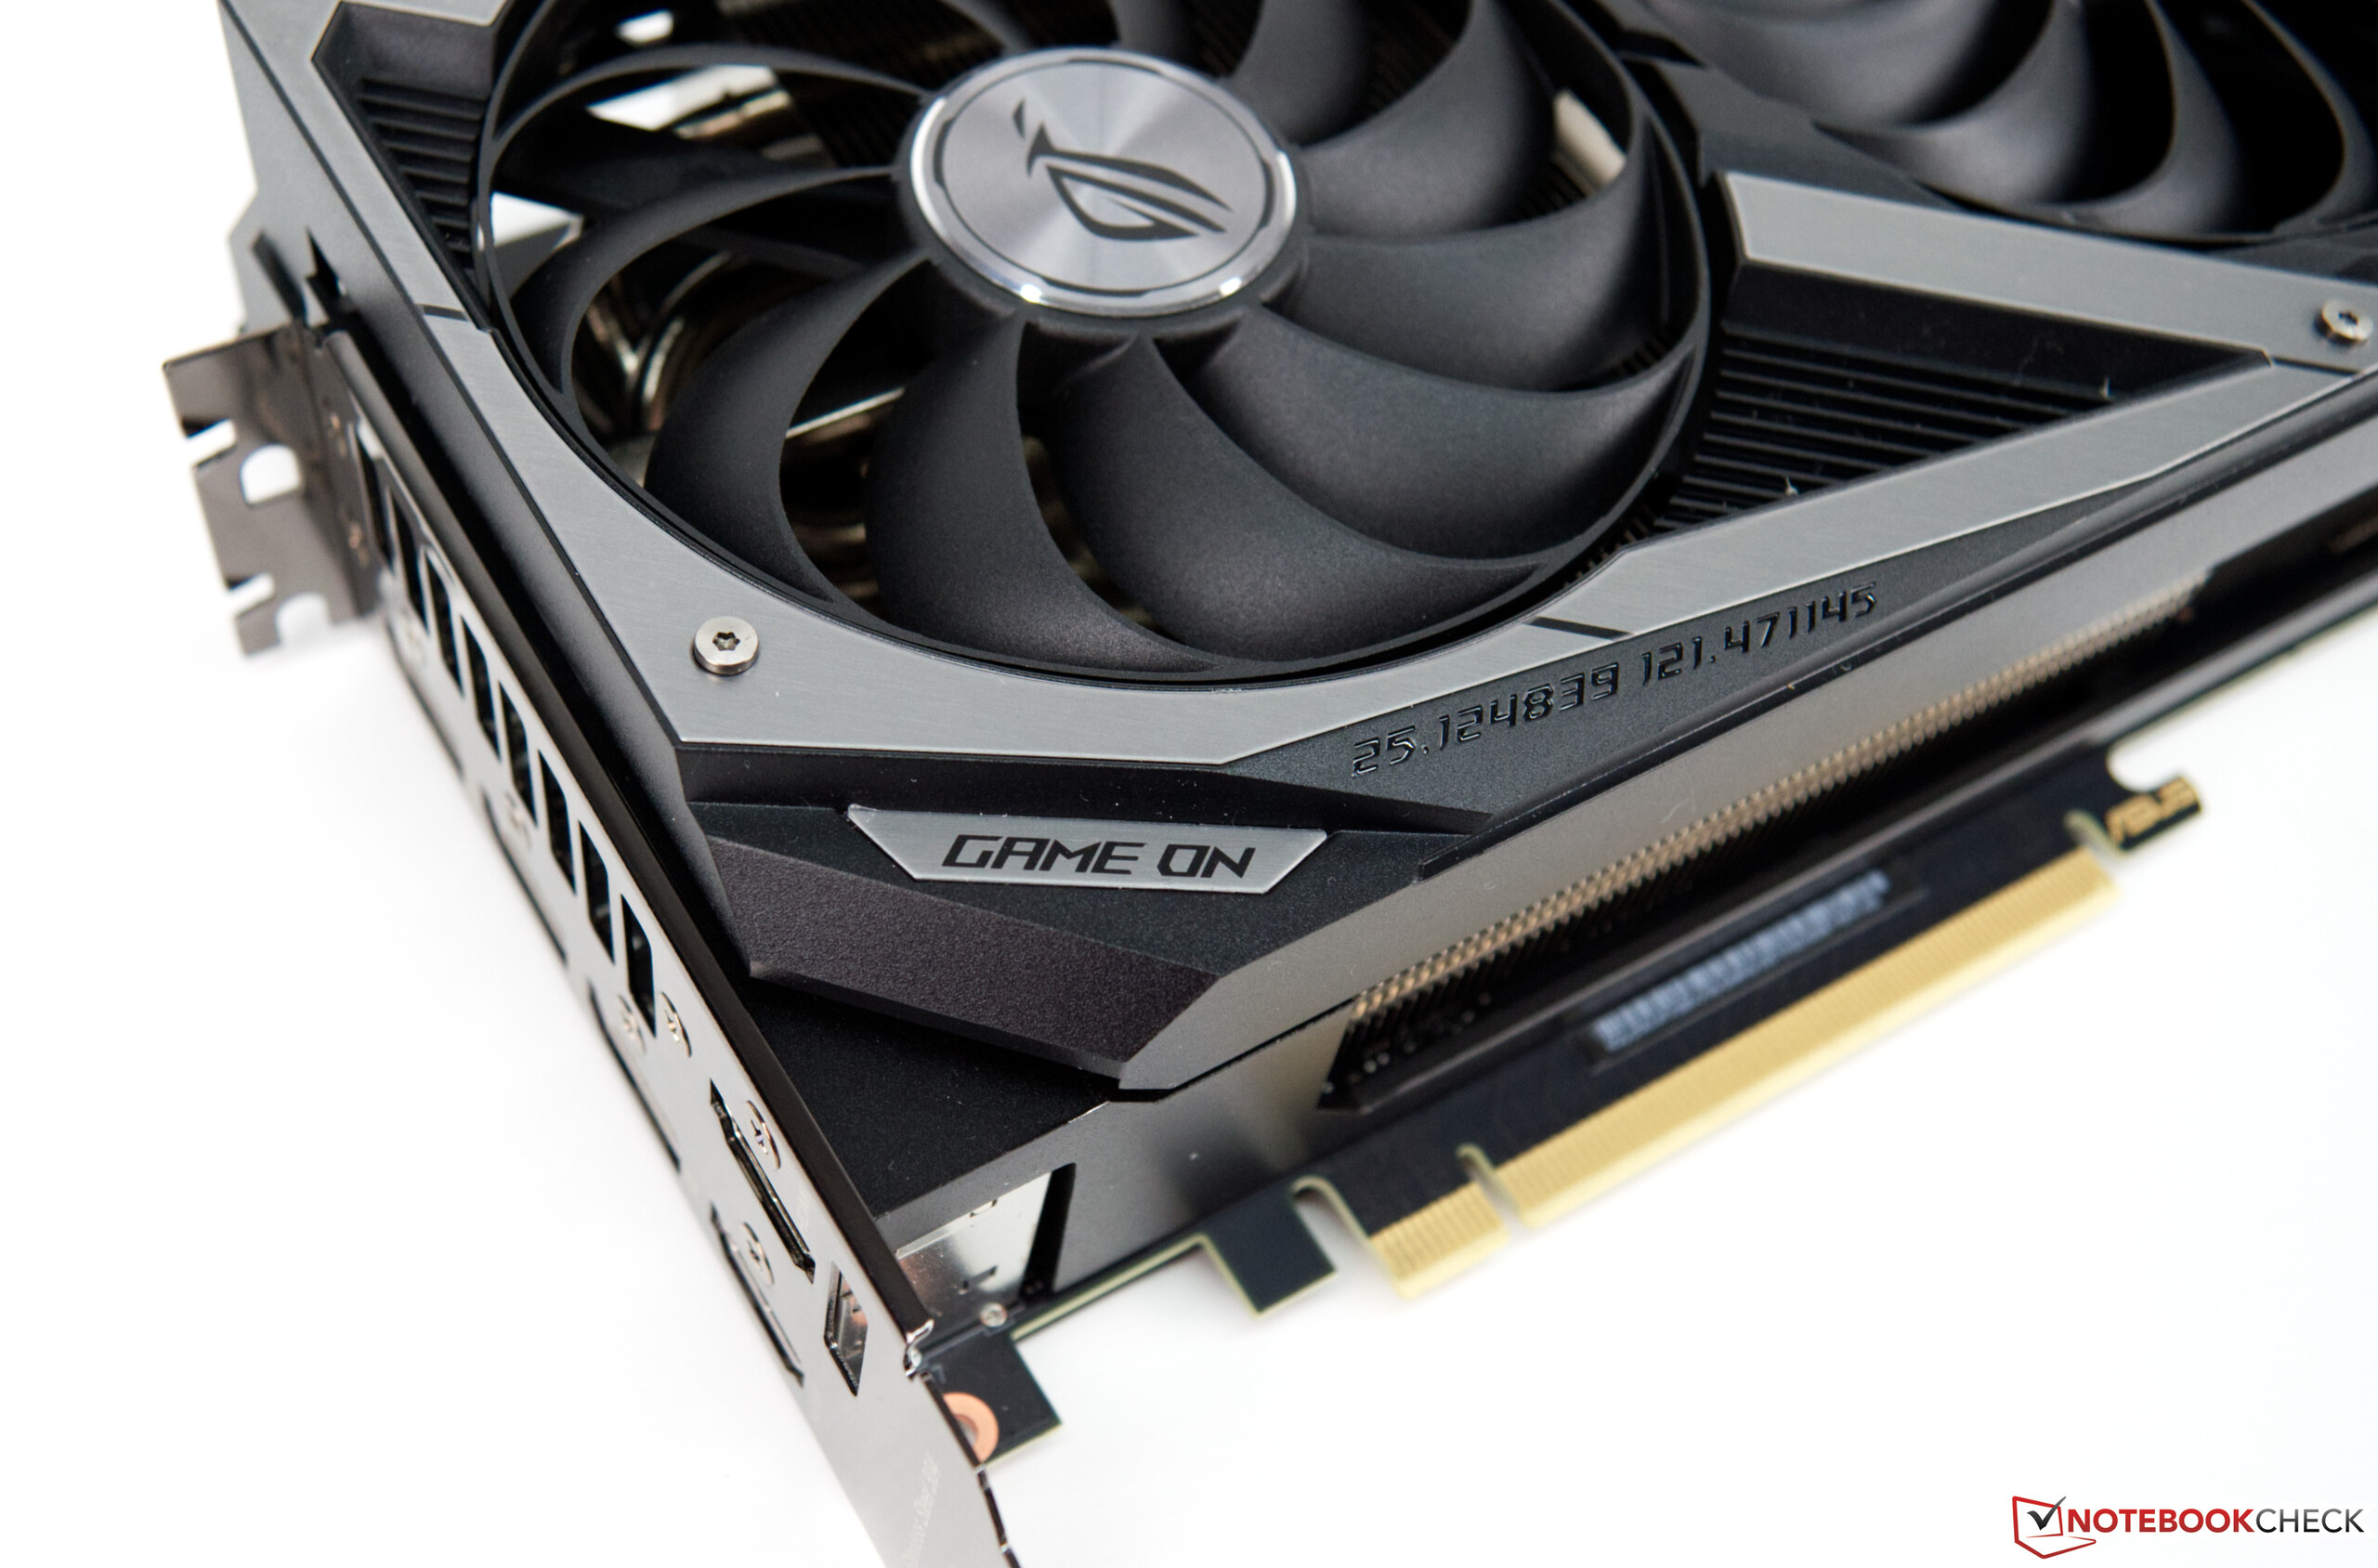
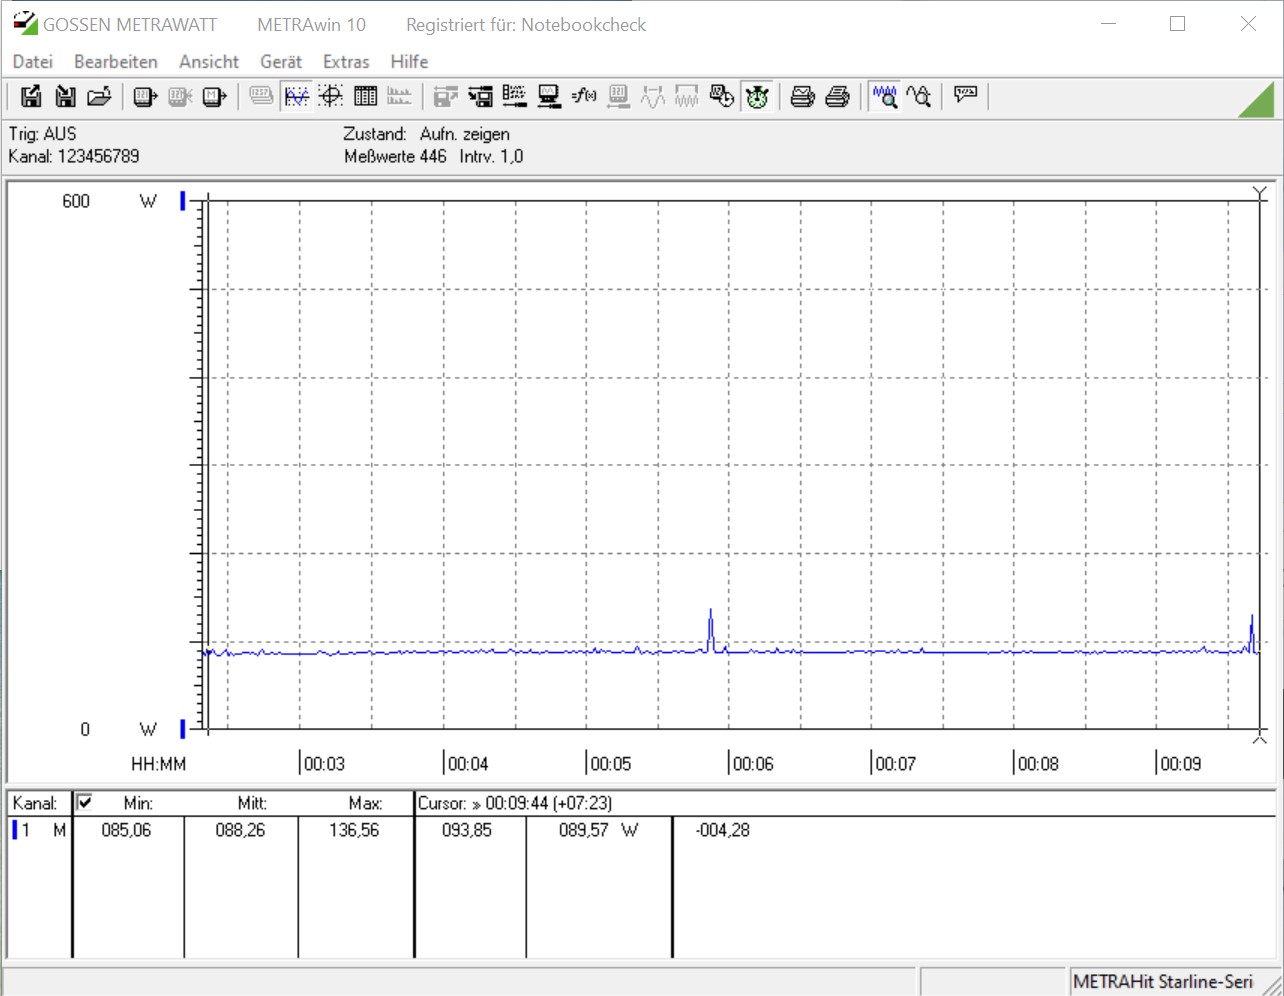
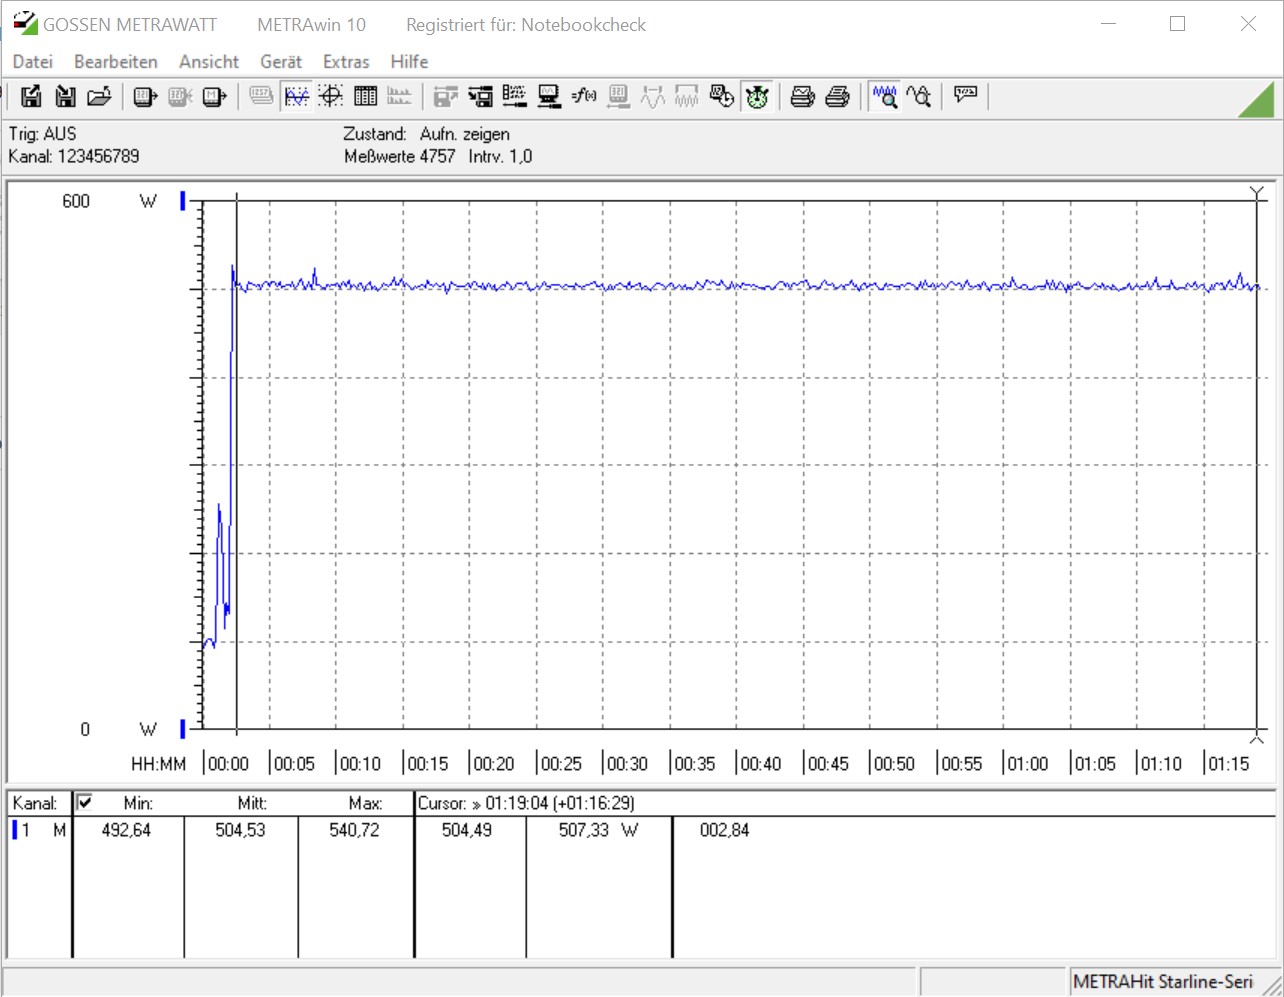
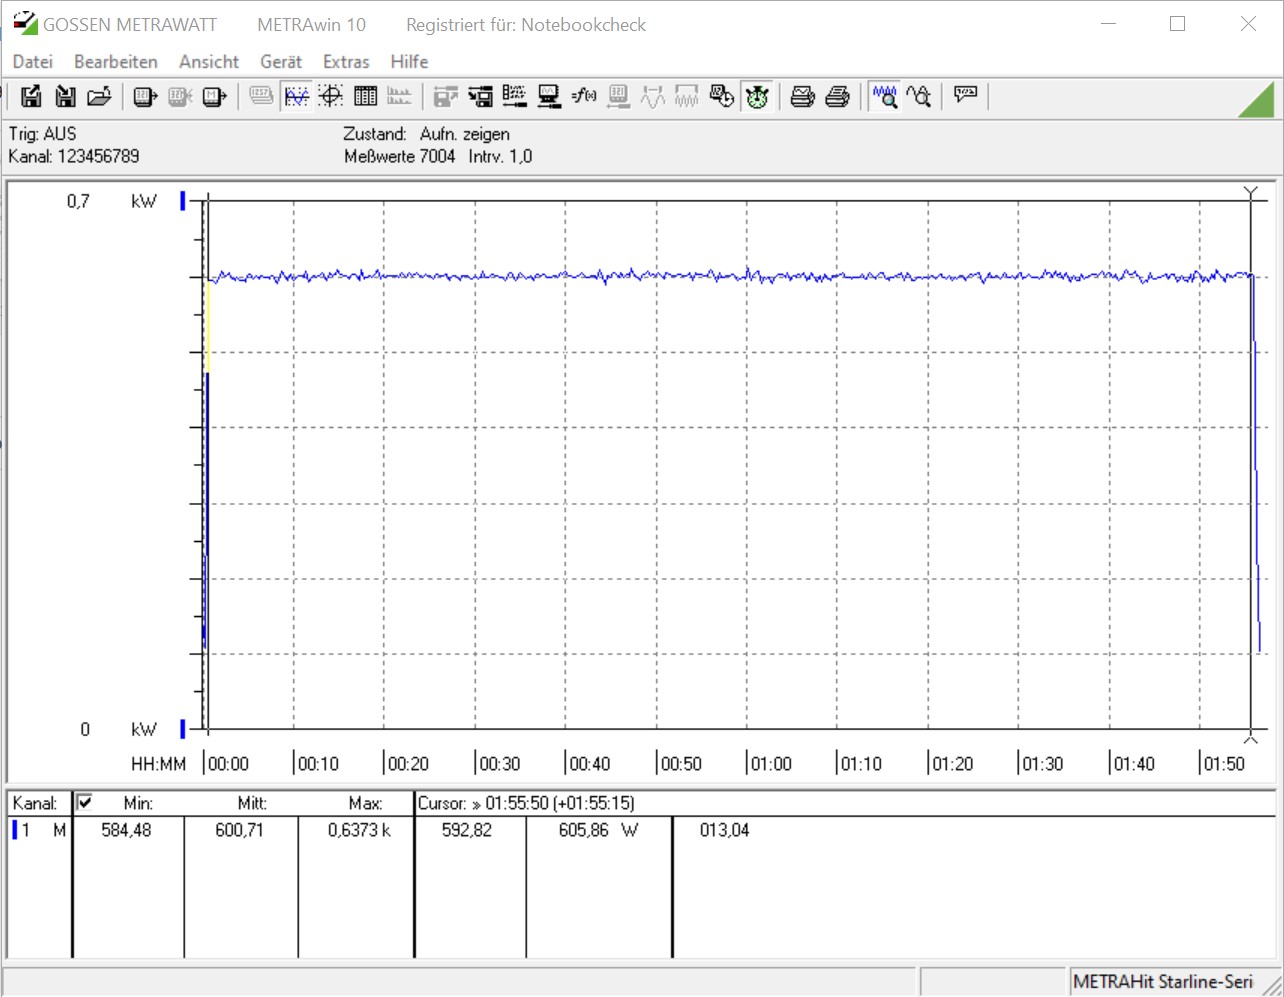
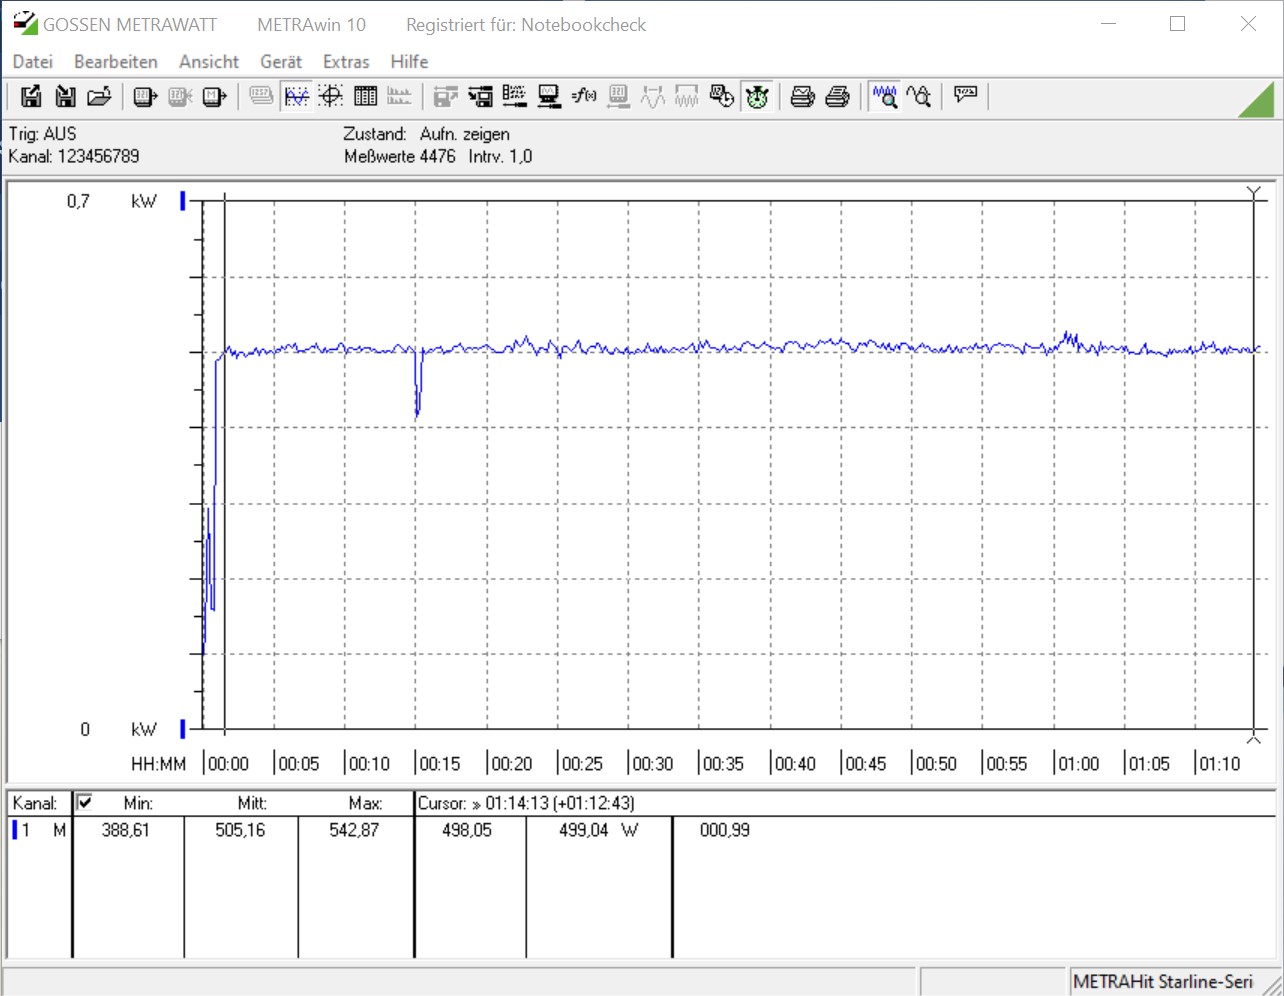
Asus GeForce RTX 3080 ROG Strix Gaming OC, kesinlikle güç tasarrufu sağlayan bir grafik kartı değildir. Ancak 320 watt'lık bir TDP ile Founders Edition ile aynı seviyede. Aşırı derecede çıkıntı yapan soğutucu, üç eksenel fan ile havalandırılır ve bu, testte iyi sıcaklıklarla telafi edilmiştir. Ortadaki fanın iki yan tarafın tersi yönde döndüğünü belirtmekte fayda var. Kasa kapalıyken yapılan stres testinde, grafik kartı 73 ° C'ye (~ 163 ° F) kadar ısındı ki bu kesinlikle çok iyi bir sonuç olarak kabul edilebilir. Ayrıca, fanlar dakikada 2.300 devirde iyi bir dönüşle döndüğünde bile gürültü seviyesi çok yüksek değil. Ölçüm sistemimizle yaklaşık 44 dB (A) tespit edebildik. Boşta kullanımda, fan durdurma modu nedeniyle grafik kartı tamamen sessizdir. Menülerdeki kare hızları 1.000'i aşar aşmaz, zaman zaman düşük bobin sesi oluşur. Genel olarak sorun, daha önce test ettiğimiz diğer ekran kartlarında olduğu gibi Asus GeForce RTX 3080 ROG Strix Gaming OC'de mevcut değil. GeForce RTX 3080, enerji tüketimi açısından oldukça fazla güç tüketiyor. Asus GeForce RTX 3080 ROG Strix Gaming OC, üç adet 8 pimli güç bağlantısı gerektirdiğinden, grafik kartına hızlıca bakıldığında burada güçlü bir güç kaynağı birimine ihtiyaç duyulduğu anlaşılıyor. Yaklaşık 505 watt'ta, hem stres testinde hem de oyun testinde yük altındaki tüm sistem için neredeyse aynı değerleri ölçtük. Şimdi güç hedefini% 121'e yükseltirsek, ölçüm cihazımız stres testinde 600 watt'ın biraz üzerinde gösteriyor. Sonuç olarak, Asus'un en az 850 watt'lık bir güç kaynağı önerisi belirtmesi şaşırtıcı değil.
| Power Consumption | |
| 1920x1080 The Witcher 3 ultra (external Monitor) | |
| ASUS GeForce RTX 3080 ROG STRIX OC GAMING (Idle: 88.3 W) | |
| KFA2 GeForce RTX 2080 Ti EX (Idle: 100.5 W) | |
| AMD Radeon RX Vega 64 (Idle: 74.3 W) | |
| MSI RTX 2080 Gaming X Trio (Idle: 87.78 W) | |
| Nvidia GeForce RTX 2080 Super (Idle: 78.87 W) | |
| AMD Radeon RX 5700 XT (Idle: 69.8 W) | |
| Nvidia GeForce RTX 2070 Super (96.8 fps, Idle: 80.5 W) | |
| MSI RTX 2070 Gaming Z 8G (Idle: 73.3 W) | |
| AMD Radeon VII (Idle: 81.39 W) | |
| Nvidia GeForce RTX 2060 Super (82.7 fps, Idle: 77.12 W) | |
| AMD Radeon RX 5700 (84.2 fps, Idle: 64.5 W) | |
| MSI RTX 2060 Gaming Z 6G (Idle: 74.66 W) | |
| 1280x720 FurMark 1.19 GPU Stress Test (external Monitor) | |
| ASUS GeForce RTX 3080 ROG STRIX OC GAMING (Idle: 88.3 W) | |
| AMD Radeon VII (Idle: 81.39 W) | |
| MSI RTX 2080 Gaming X Trio | |
| KFA2 GeForce RTX 2080 Ti EX (Idle: 100.5 W) | |
| Nvidia GeForce RTX 2080 Super (Idle: 78.87 W) | |
| MSI RTX 2070 Gaming Z 8G (Idle: 73.3 W) | |
| AMD Radeon RX 5700 XT (239 fps, Idle: 69.8 W) | |
| Nvidia GeForce RTX 2070 Super (283 fps, Idle: 80.5 W) | |
| MSI RTX 2060 Gaming Z 6G (Idle: 74.66 W) | |
| Nvidia GeForce RTX 2060 Super (237 fps, Idle: 77.12 W) | |
| AMD Radeon RX 5700 (207 fps, Idle: 64.5 W) | |
* ... daha küçük daha iyidir
Artılar
Eksiler
Karar - Yük altında hızlı ve sessiz
GeForce RTX 3080 ROG Strix Gaming OC ile Asus, şüphesiz piyasada çok hızlı bir grafik kartına sahip. En yeni oyunların tümü onunla sorunsuz bir şekilde oynanabilir. Ancak bu grafik kartı yalnızca 1080p doğal çözünürlüğün ötesine geçtiğinde iyi hissetmeye başlar. Mevcut Amper üretimi, kendisini burada Turing'den açıkça ayırabilir. En üste DLSS veya Işın İzleme eklerseniz, yeni mimarinin avantajı daha da büyür. Bununla birlikte, kullanıcıların VRAM açısından bir RTX 2080 Ti'ye kıyasla dezavantajlarla yaşaması gerekir, çünkü RTX 3080'de 10 GB, 2080 Ti'den (11 GB) daha küçüktür. Uzun vadede bu RTX 3080'in çöküşü olabilir, çünkü AMD 6000 serisinin en üstteki üç modelini zaten duyurdu ve burada sürekli olarak 16 GB VRAM kullanıyor. Nvidia'nın söylenti değirmenleri vızıldıyor ve daha fazla gölgelendiriciye ve 20 GB VRAM'e sahip bir RTX 3080 Ti'nin halihazırda iş başında olması gerekiyordu, ancak satın alınamazsa hızlı bir ekran kartı ne işe yarar? Nvidia ve dolayısıyla yönetim kurulu ortakları da burada çok fazla potansiyeli boşa harcadılar çünkü talep hala karşılanamıyor. İç raporlara göre bu durumun 2021 yılına kadar devam etmesi bekleniyor. Asus GeForce RTX 3080 ROG Strix Gaming OC, aynı zamanda iyi soğutmayla gelen en hızlı RTX 3080 grafik kartlarından biri. İyi düşünülmüş soğutma ünitesi ikna edicidir ve sağduyulu RGB aydınlatması ile gözlerinizi bayram ettirecek bir şey de var. RTX 3080 modelini halihazırda ellerine almayı başaranlar, iyi miktarda grafik gücü ile ödüllendirilecekler. . Ancak bu aynı zamanda satın alırken dikkate alınması gereken yüksek enerji tüketimine neden olur. Yük altında çirkin sistem çökmelerinden muzdarip olmamak için doğru güç kaynağı birimi seçimi burada önemlidir. Asus, test örneğimiz için en az 850 watt'lık bir güç kaynağı önermektedir. Asus GeForce RTX 3080 ROG Strix Gaming OC şu anda 999 Euro (~ 1.185 $) fiyatla satılıyor. Bu, Founders Edition'ın MSRP'sinden 300 Euro (~ 356 $) fazla; ancak küçük miktarlar fiyatları aşırı derecede yükseltiyor, bu nedenle Founders Edition bile kısmen 1.000 Euro'nun (~ 1.186 $) üzerinde teklif ediliyor. Bu nedenle tavsiyemiz, daha sonra satın alma kararınızdan pişman olmamanız için beklemek ve rekabetin ne yaptığını görmektir. RTX 3080 için tüm kıyaslamalar ve test değerleri GeForce RTX 3080 grafik kartı sitesinde bulunabilir ( düzenli olarak güncellenir).

