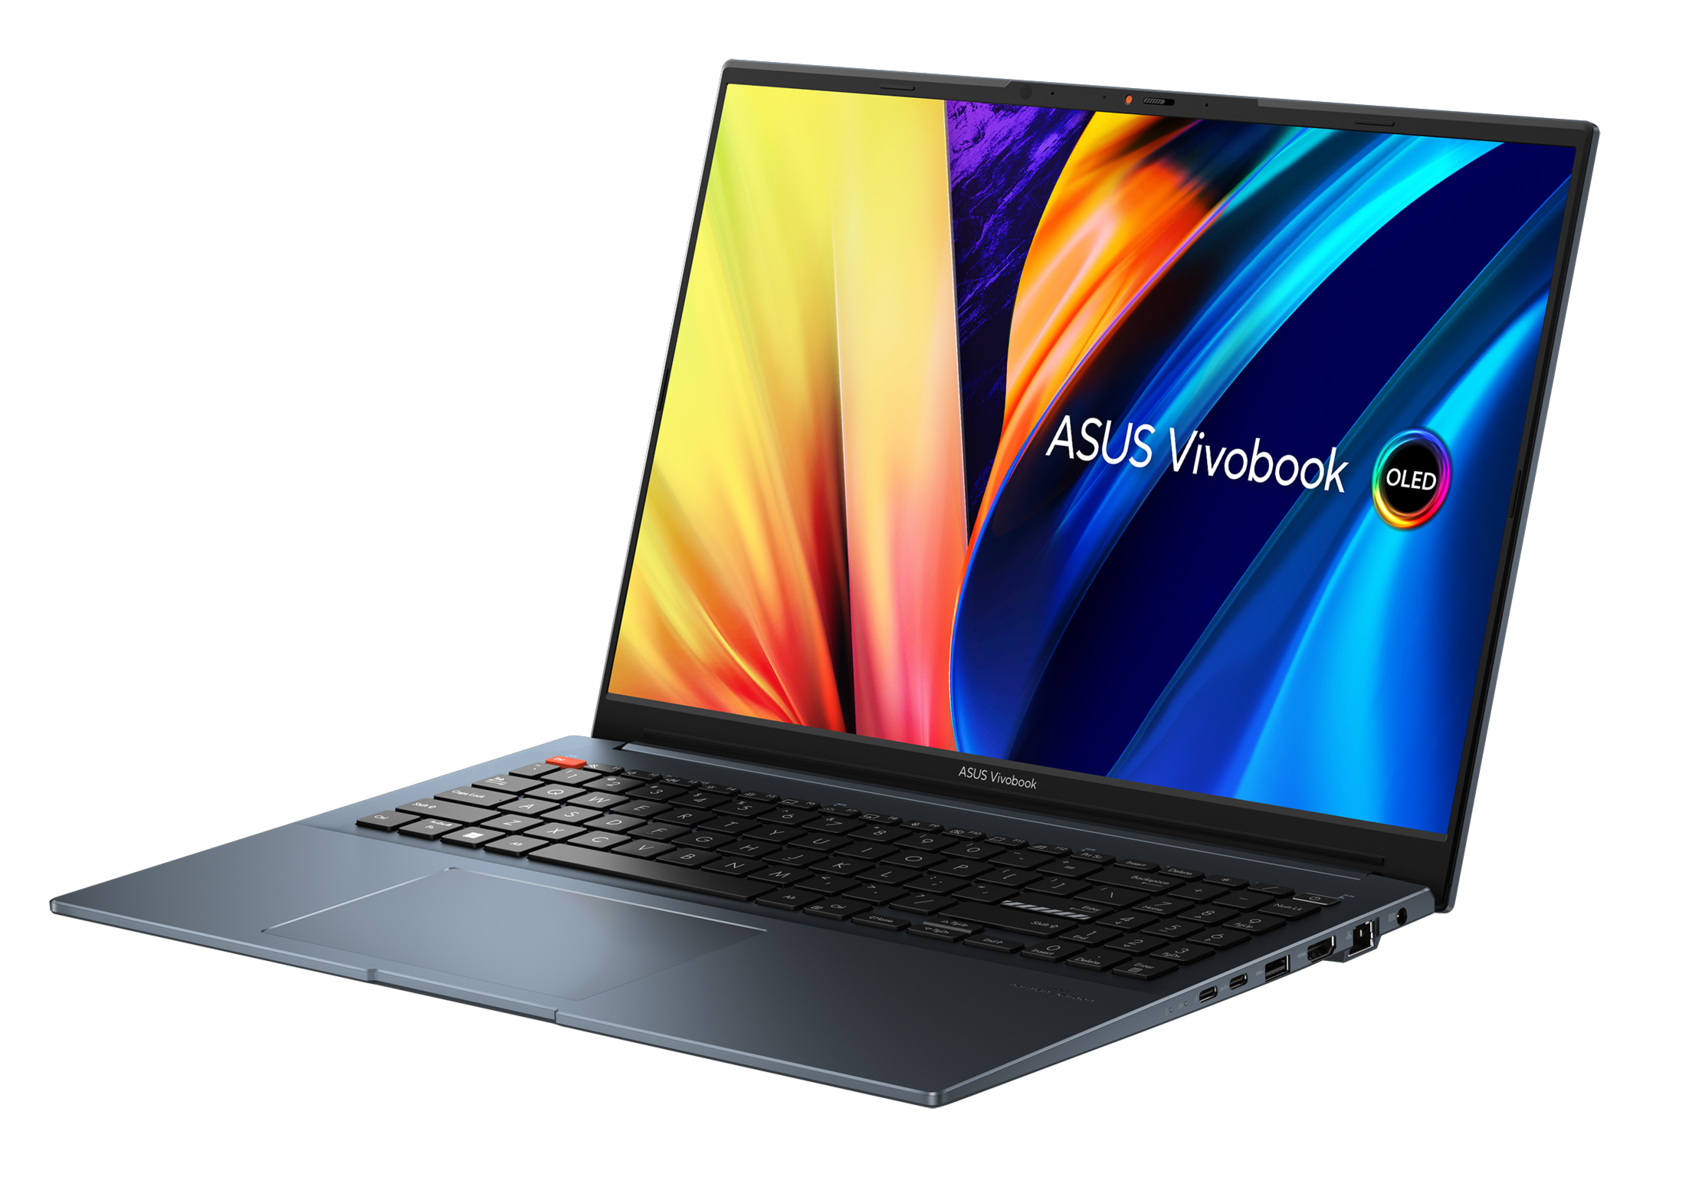
Asus VivoBook Pro 16 (2023) Dizüstü Bilgisayar İncelemesi: Core i9-13900H, RTX 4050 ve 3.2K OLED hobi amaçlı içerik üretenler için iyi haber

Asus, 2023 yılında VivoBook serisini birkaç yeni modelle yeniledi. İnceledikten sonraAsus VivoBook 14X,VivoBook 15XveVivoBook Pro 16X K6604şimdi dikkatimizi en son eklenen VivoBook Pro 16 K6602VU'ya çeviriyoruz.
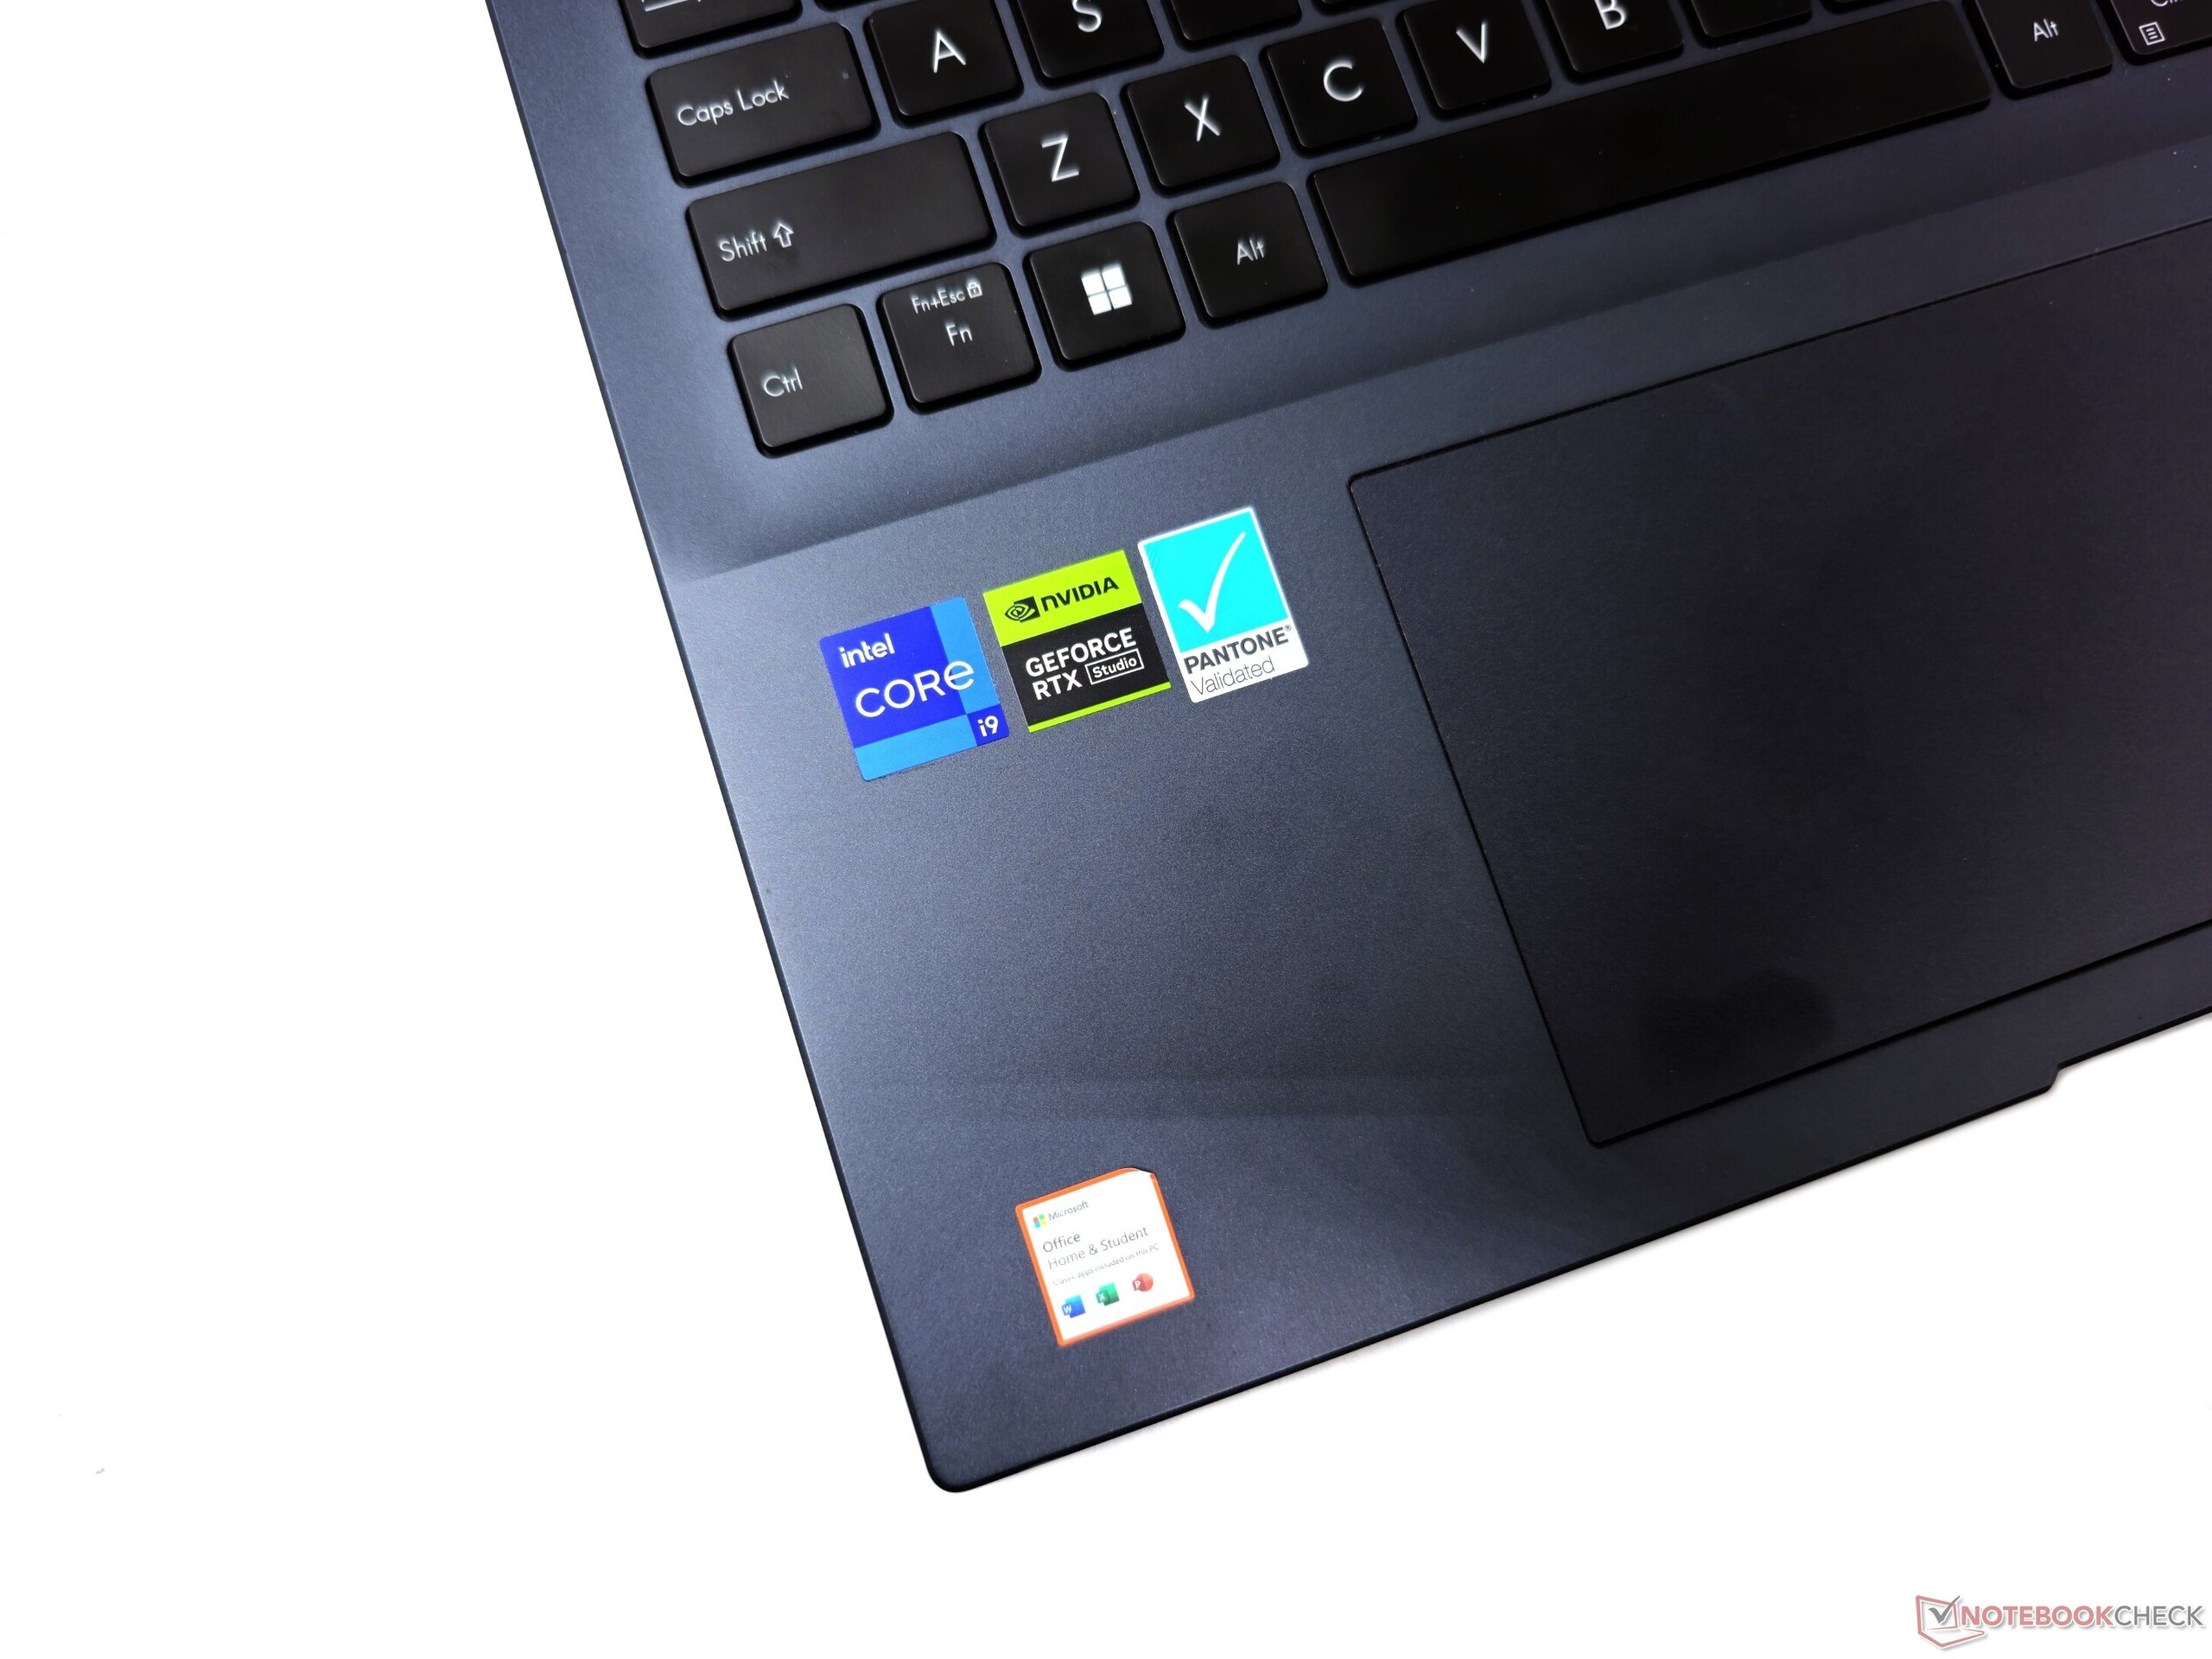
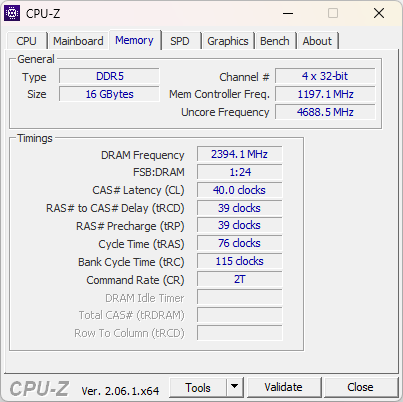
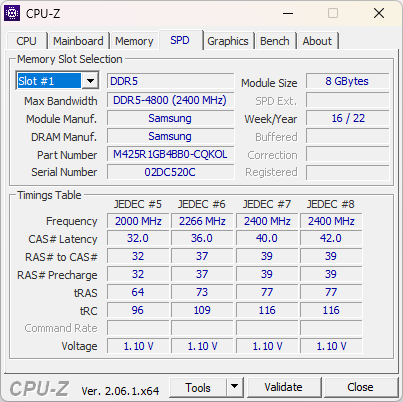
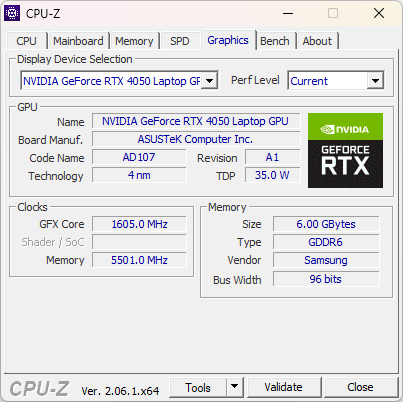
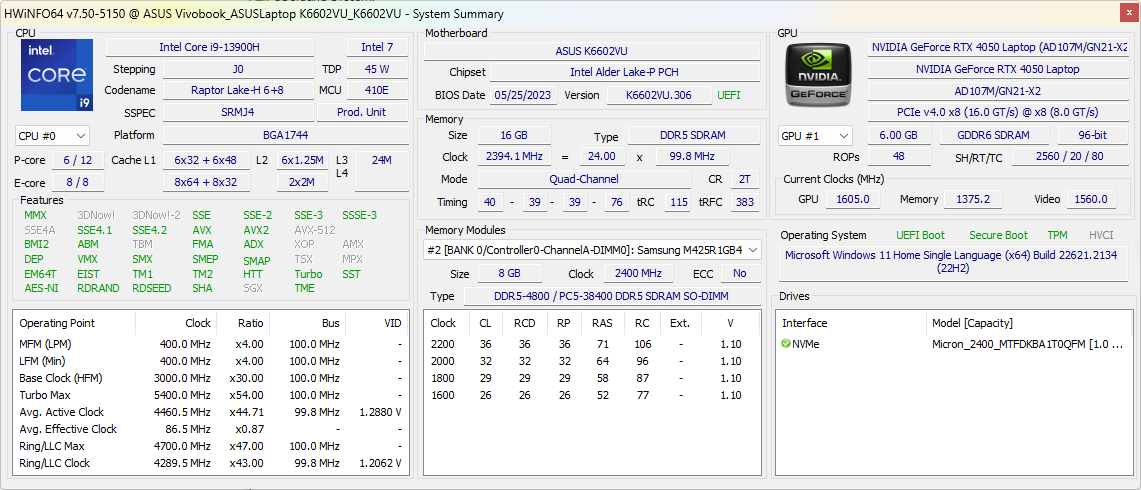
2023 VivoBook Pro 16, aşağıdakilere kıyasla birkaç önemli yükseltme sunarson nesil. Bazı güçlü bileşenleri bir arada barındırır.Intel Core i9-13900HcPU veNvidia GeForce RTX 4050grafikler. Test ünitemiz ayrıca 16 GB hızlı DDR5-4800 RAM, 1 TB PCIe Gen4 SSD ve Dolby Vision destekli canlı 120Hz 16:10 3.2K OLED ekran ile donatılmış olarak geldi.
Ancak bu iyi donanımlı kurulum ucuza gelmiyor - VivoBook Pro 16 konfigürasyonumuz Hindistan pazarında 1.54.990 ₹ (KDV dahil 2.199 €) ile kasaları çalıyor. VivoBook Pro 16'yı, yüksek fiyat etiketini karşılayıp karşılamadığını görmek için test ettik.
Karşılaştırmalı olarak olası rakipler
Derecelendirme | Tarih | Modeli | Ağırlık | Yükseklik | Boyut | Çözünürlük | Fiyat |
|---|---|---|---|---|---|---|---|
| 87.6 % v7 (old) | 11/2023 | Asus VivoBook Pro 16 K6602VU i9-13900H, GeForce RTX 4050 Laptop GPU | 1.9 kg | 19 mm | 16.00" | 3200x2000 | |
| 86.2 % v7 (old) | Asus Vivobook Pro 16X K6604JV-MX016W i9-13980HX, GeForce RTX 4060 Laptop GPU | 2.1 kg | 22.8 mm | 16.00" | 3200x2000 | ||
| 89.7 % v7 (old) | 05/2023 | Asus ROG Flow X16 GV601V i9-13900H, GeForce RTX 4060 Laptop GPU | 2.1 kg | 19.4 mm | 16.00" | 2560x1600 | |
| 89 % v7 (old) | Lenovo Legion Pro 5 16ARX8 (R5 7645HX, RTX 4050) R5 7645HX, GeForce RTX 4050 Laptop GPU | 2.5 kg | 27.3 mm | 16.00" | 2560x1600 | ||
| 86.9 % v7 (old) | 06/2023 | Asus TUF Gaming A16 FA617XS R9 7940HS, Radeon RX 7600S | 2.2 kg | 22.1 mm | 16.00" | 1920x1200 | |
| 86.3 % v7 (old) | 05/2023 | Asus VivoBook Pro 16 i7-12700H, GeForce RTX 3050 Ti Laptop GPU | 1.9 kg | 20 mm | 16.00" | 2560x1600 | |
| 86.2 % v7 (old) | 05/2023 | Gigabyte AERO 16 OLED BSF i9-13900H, GeForce RTX 4070 Laptop GPU | 2.1 kg | 18 mm | 16.00" | 3840x2400 |
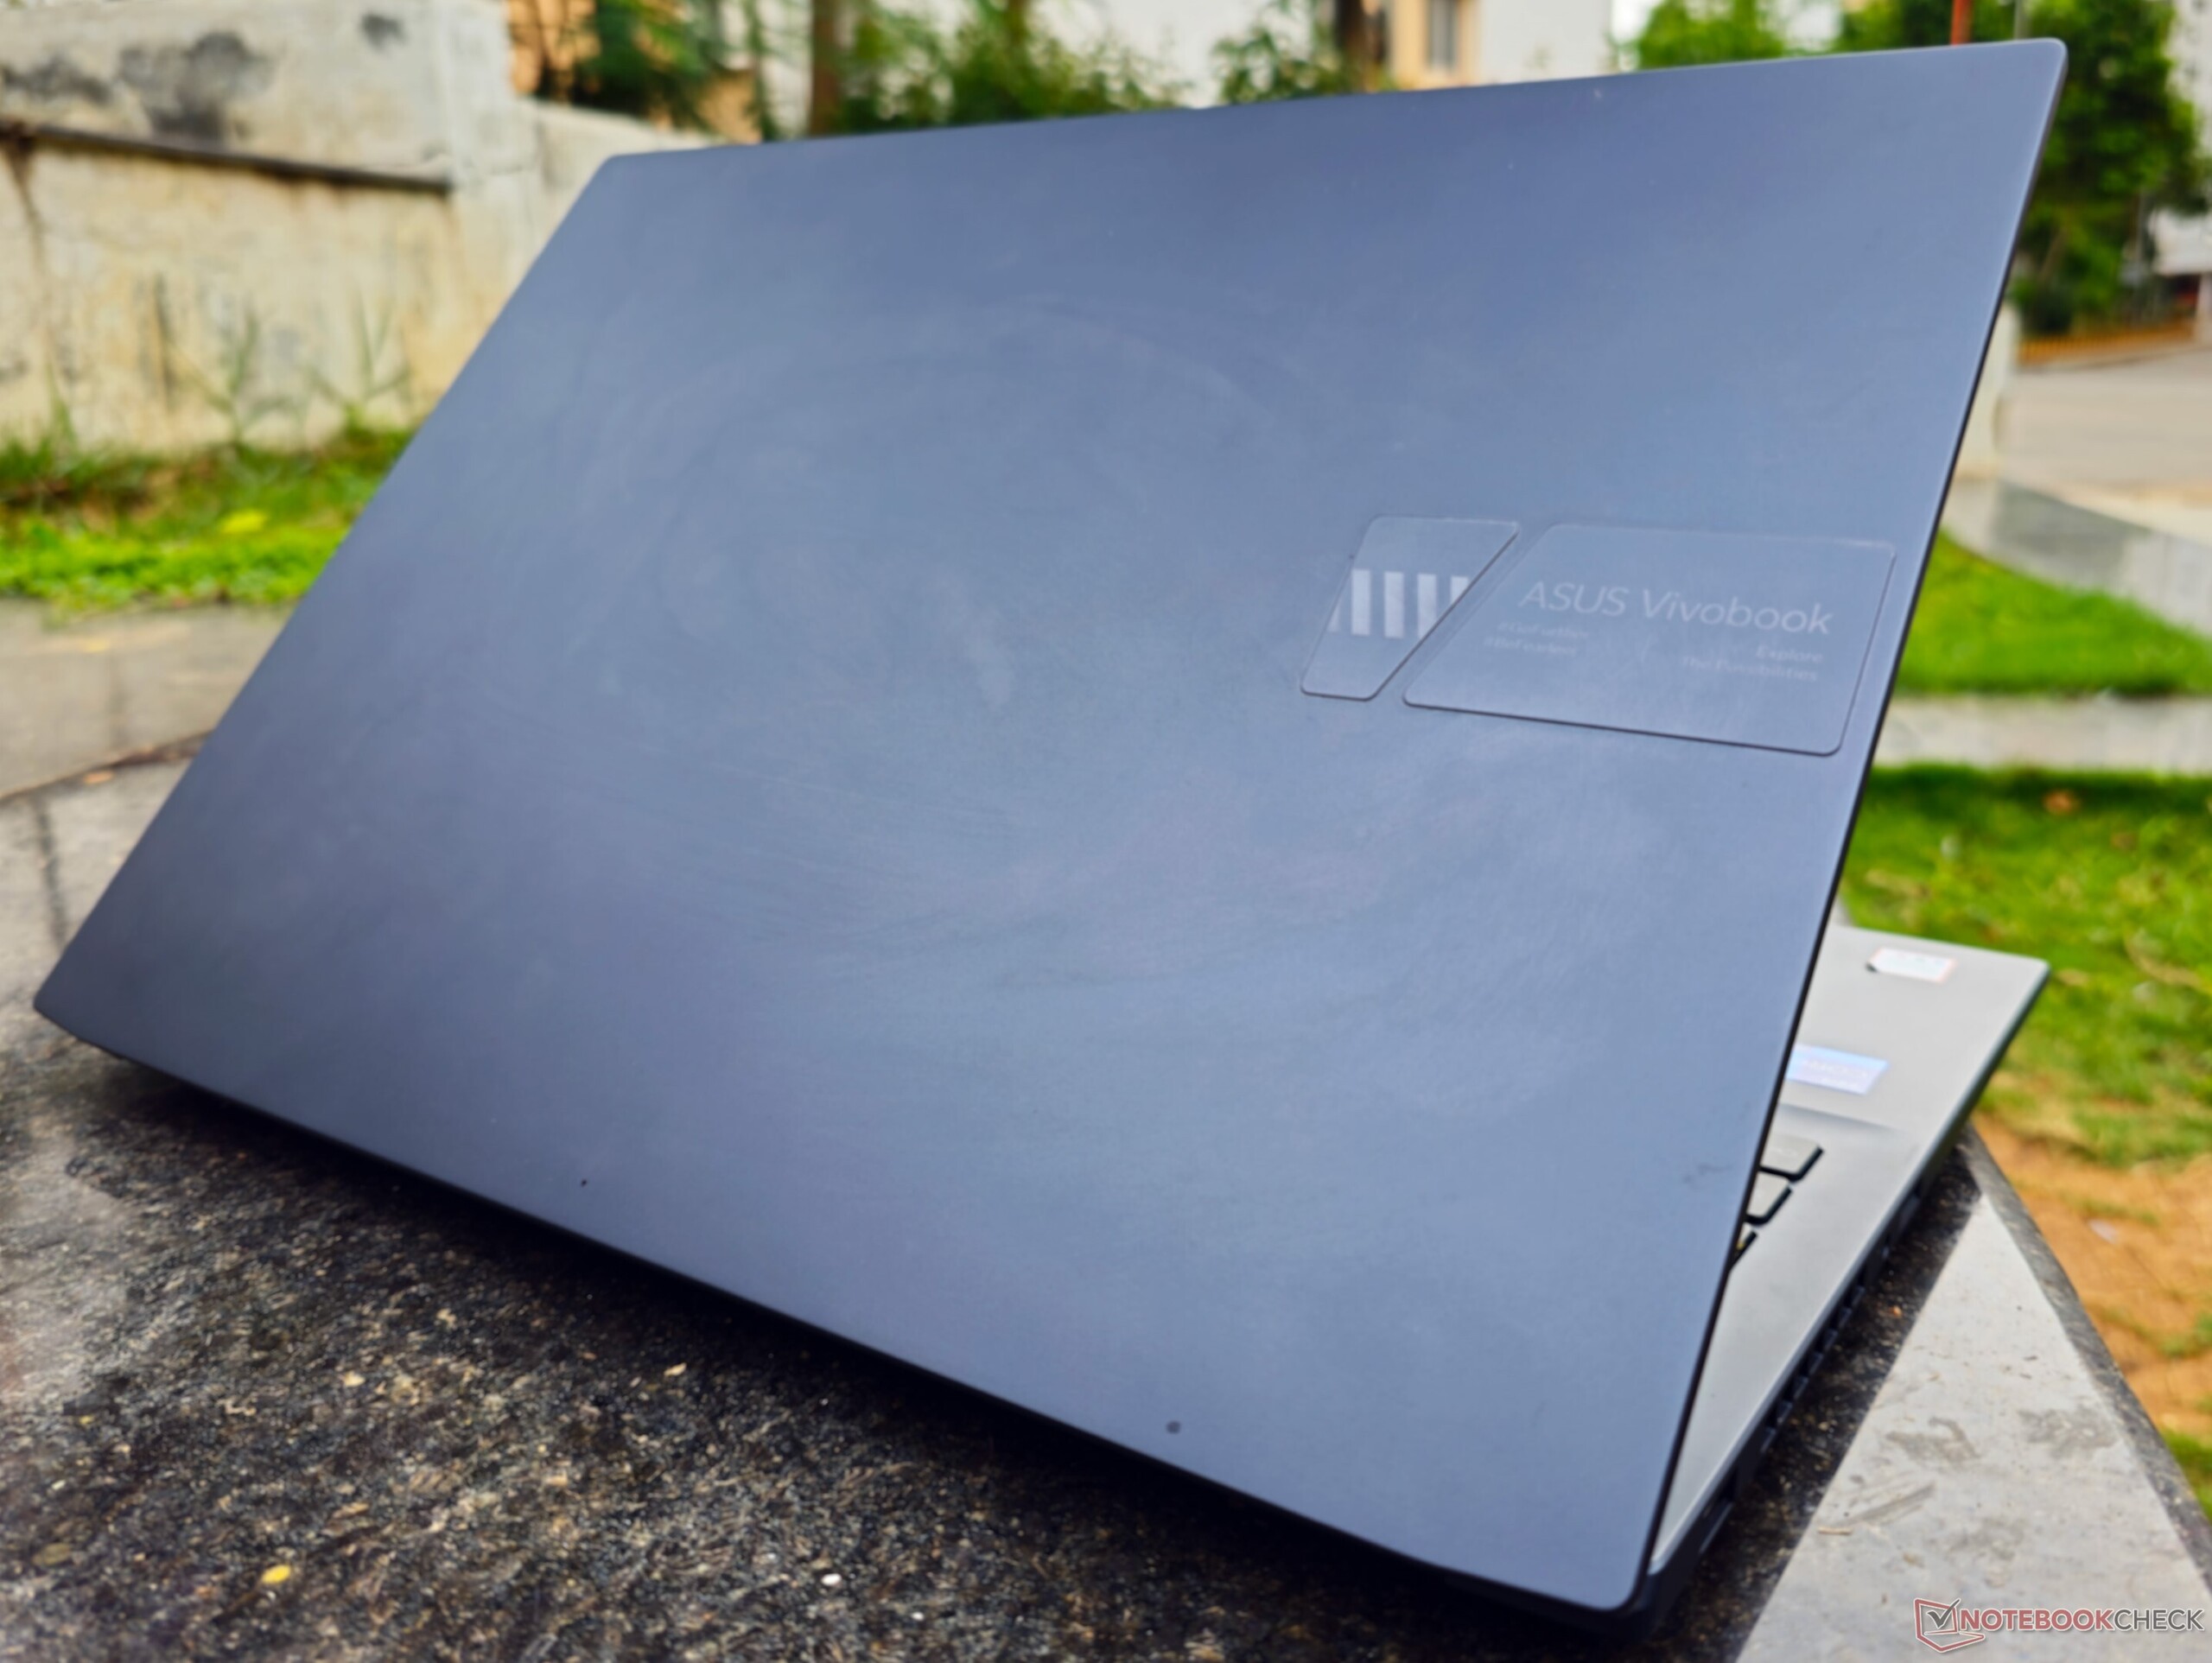
Şasi: 180° metalik kapaklı plastik yapı
VivoBook Pro 16 kasa, 1,9 kg ağırlığında Cool Silver ve Quiet Blue (inceleme birimimiz) renk seçenekleriyle geliyor. Diğer VivoBook'larda olduğu gibi, yapı esas olarak 180 derecede tamamen düz durabilen ve dizüstü bilgisayar tabanını kaydırmadan tek elle kolayca açılabilen metal bir kapağa sahip plastiktir.
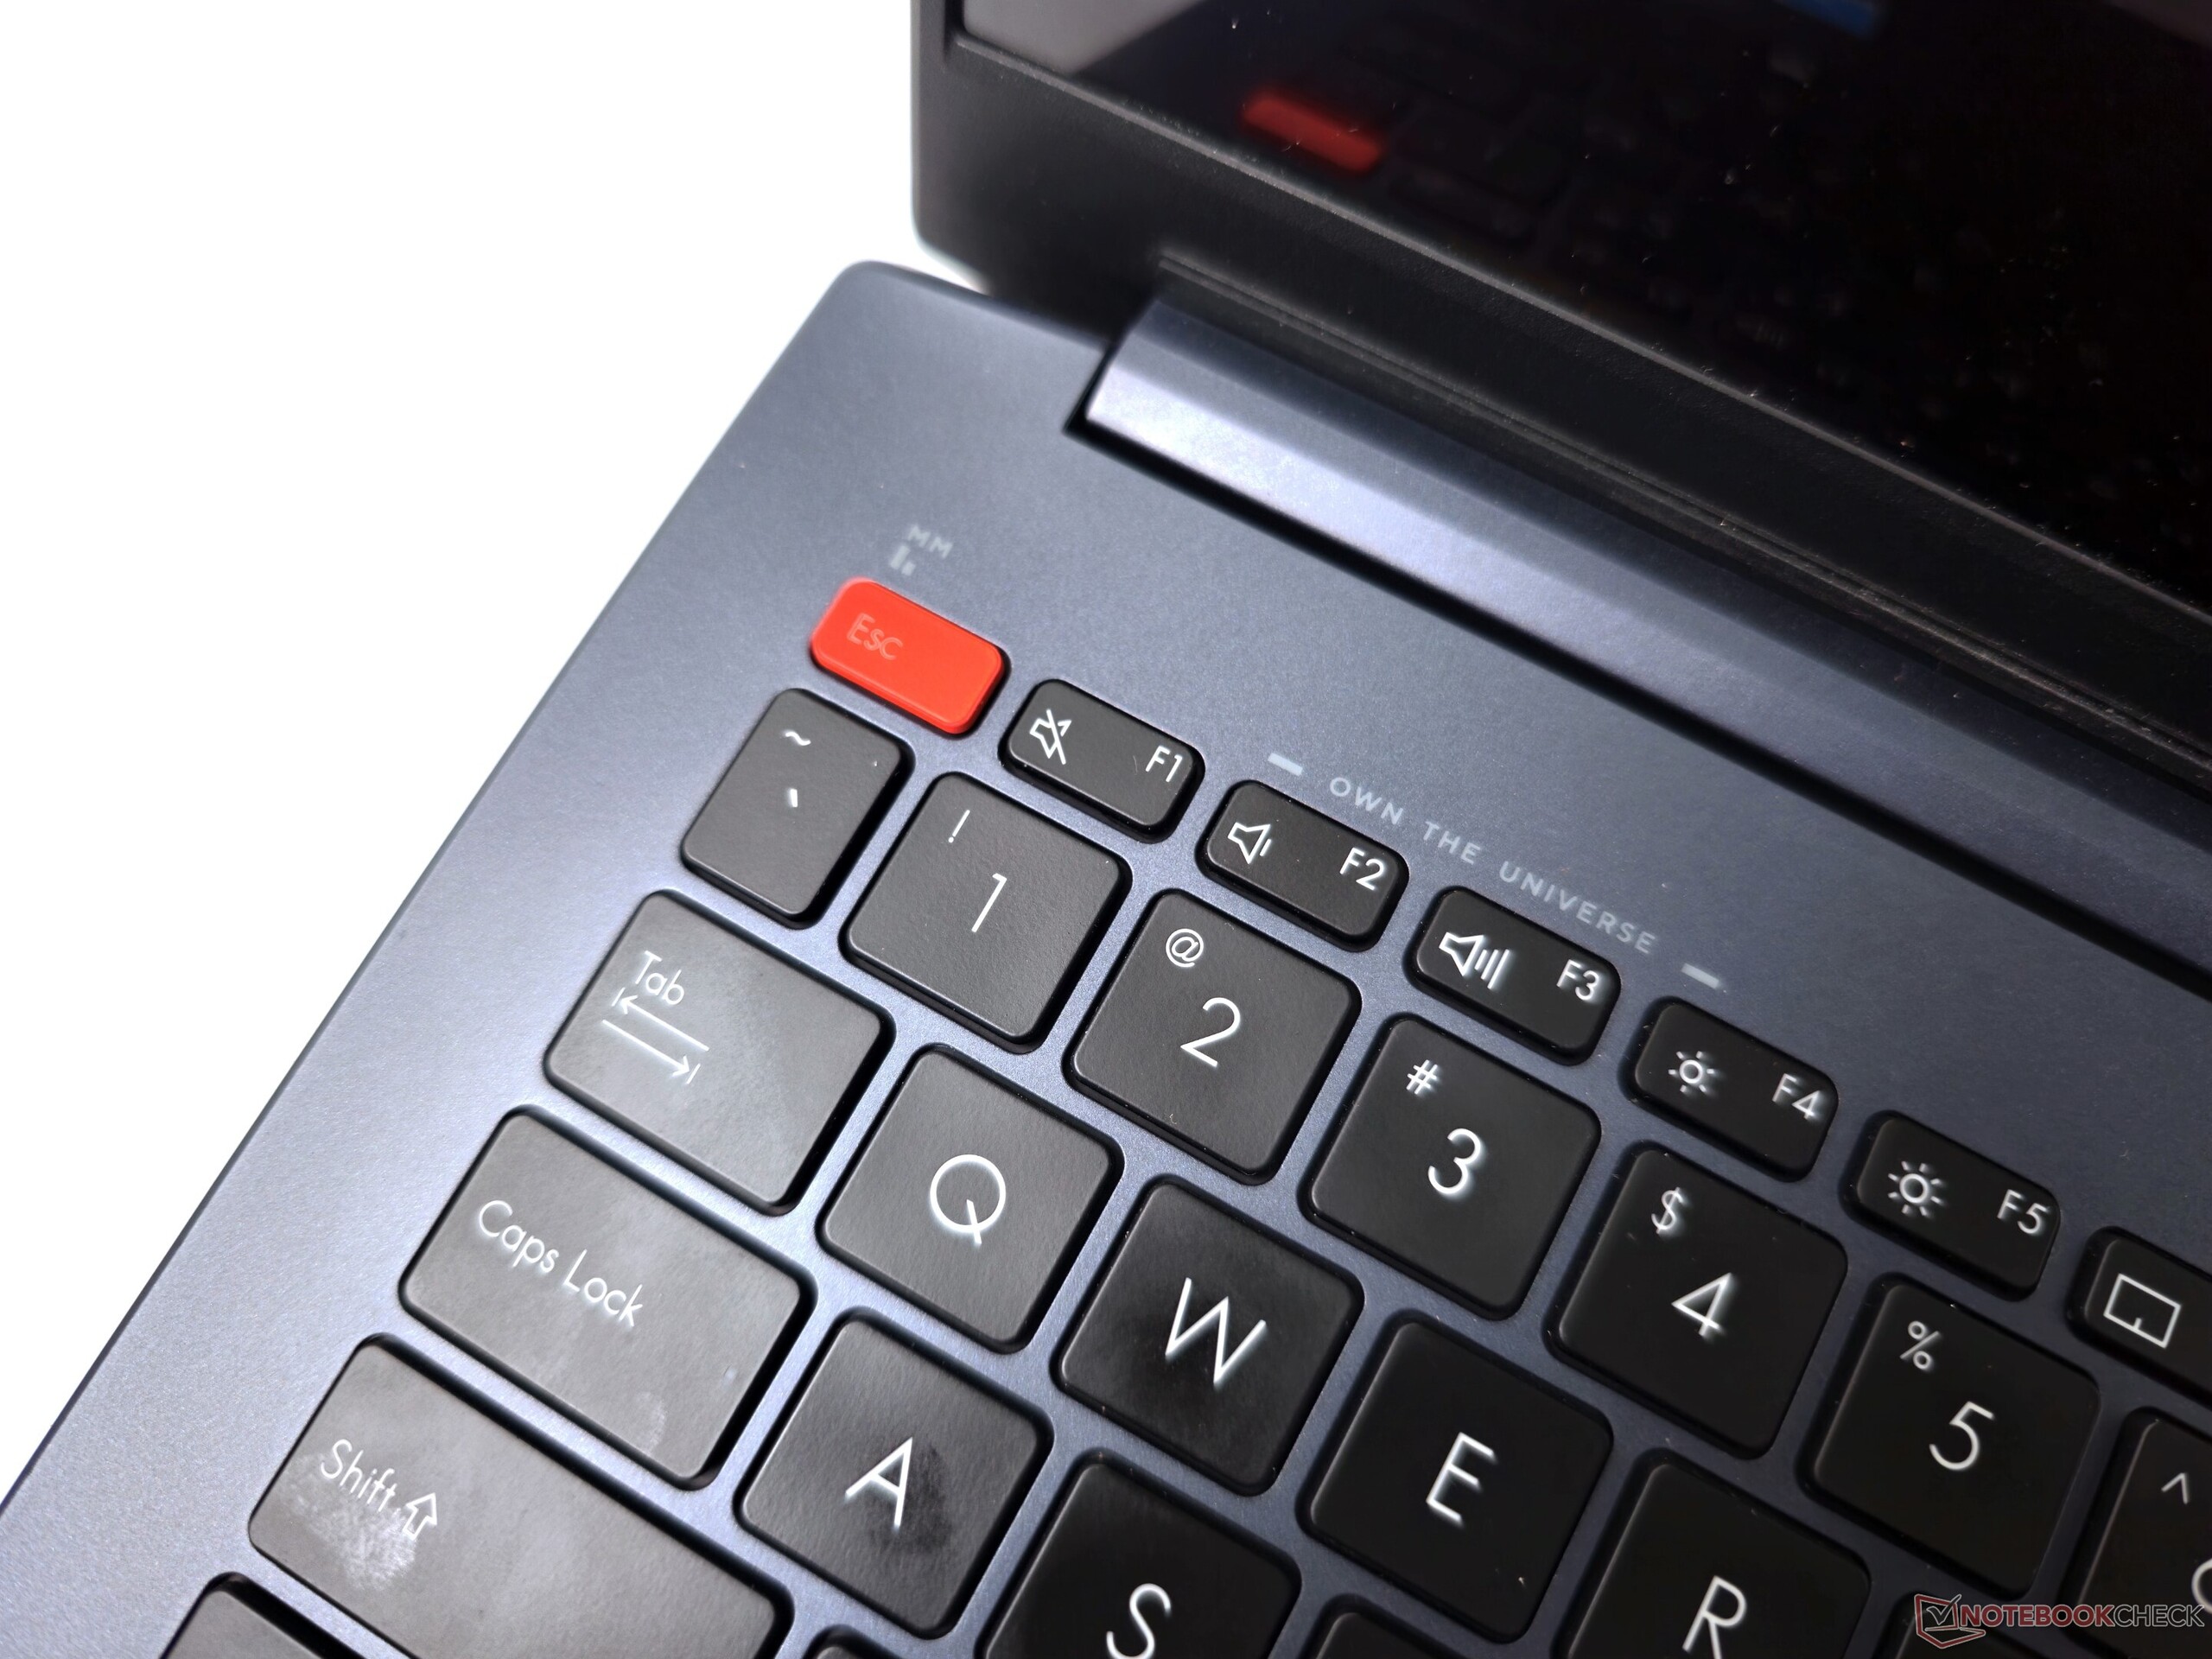
Mat, pürüzsüz yüzeyler ince ama çekici bir estetik sunuyor. Kapaktaki logo ve çizgili Enter tuşu vurgusu gibi VivoBook tasarım özellikleri mevcuttur. Turuncu boyalı Esc tuşu, VivoBook Pro 16X'e benzer bir renk sıçraması sağlar.
Yapı kalitesi genel olarak iyi, klavye güvertesinde ve ekranda biraz esneme var, ancak düzenli kullanımda endişe verici bir şey yok. Menteşeler, ekranı herhangi bir açıda gıcırdatmadan sıkıca tutacak kadar sağlamdır.
Bağlanabilirlik: Wi-Fi 6E verimi biraz ince ayar gerektirebilir
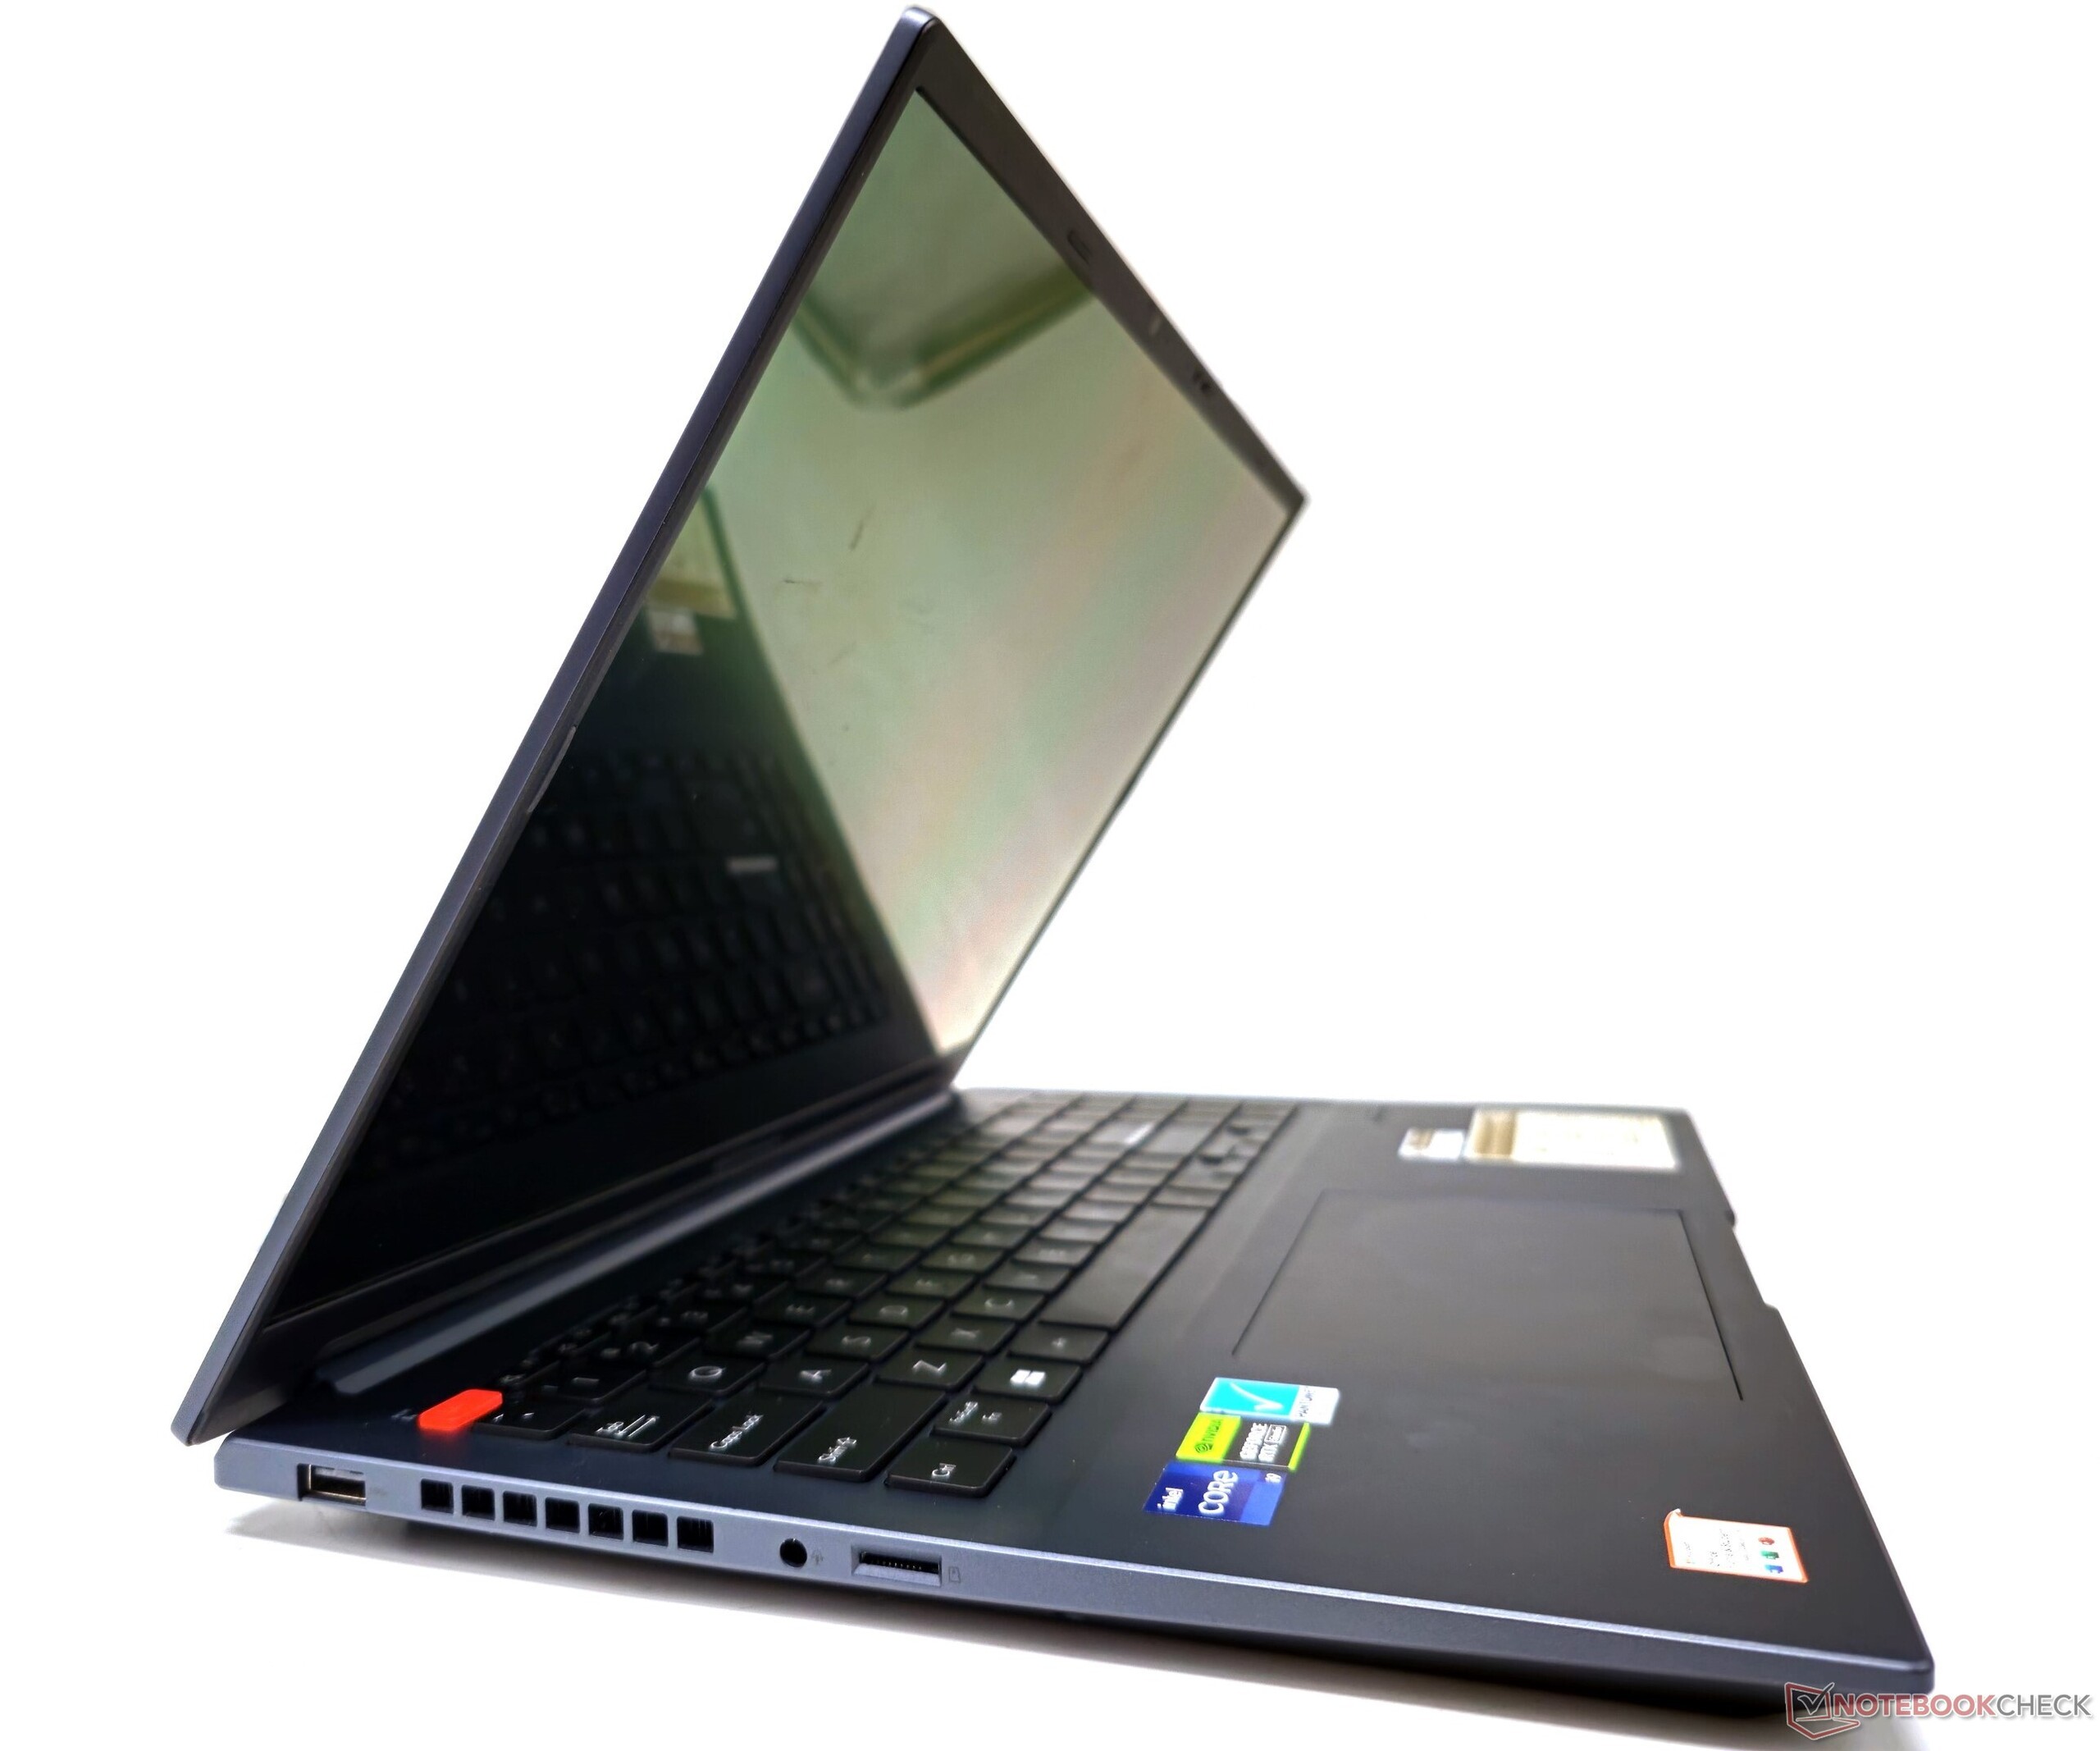
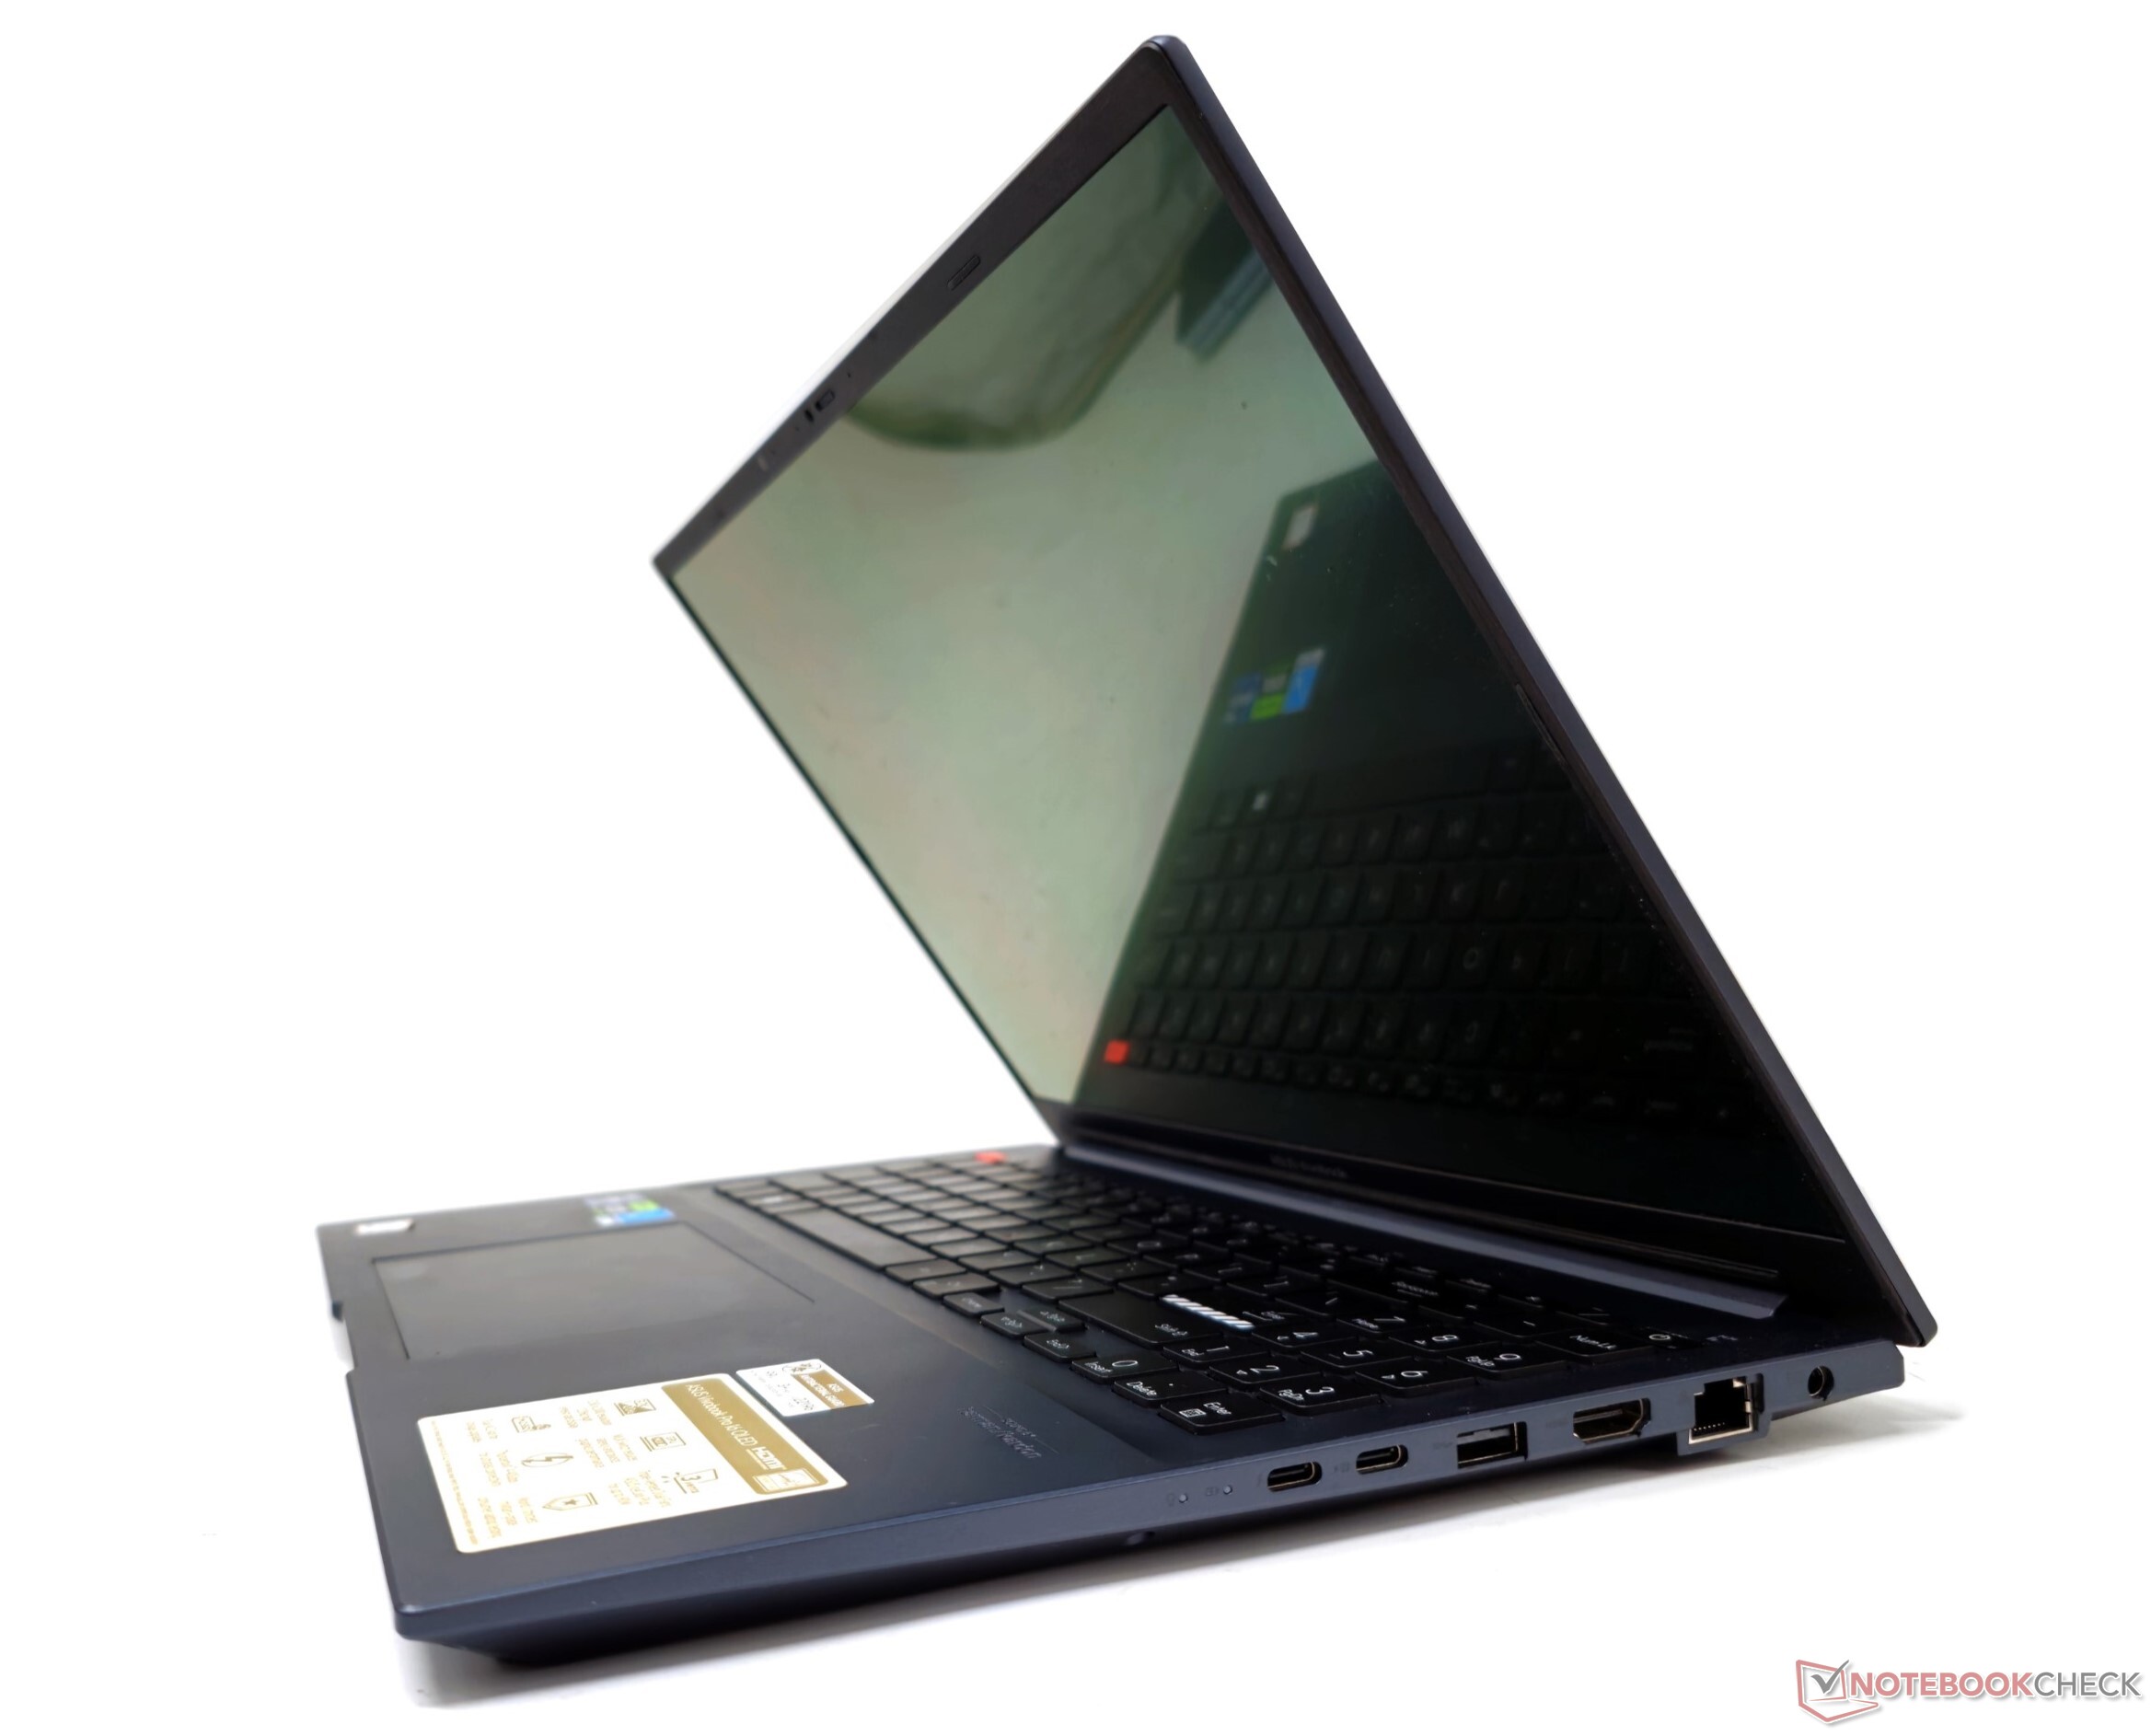
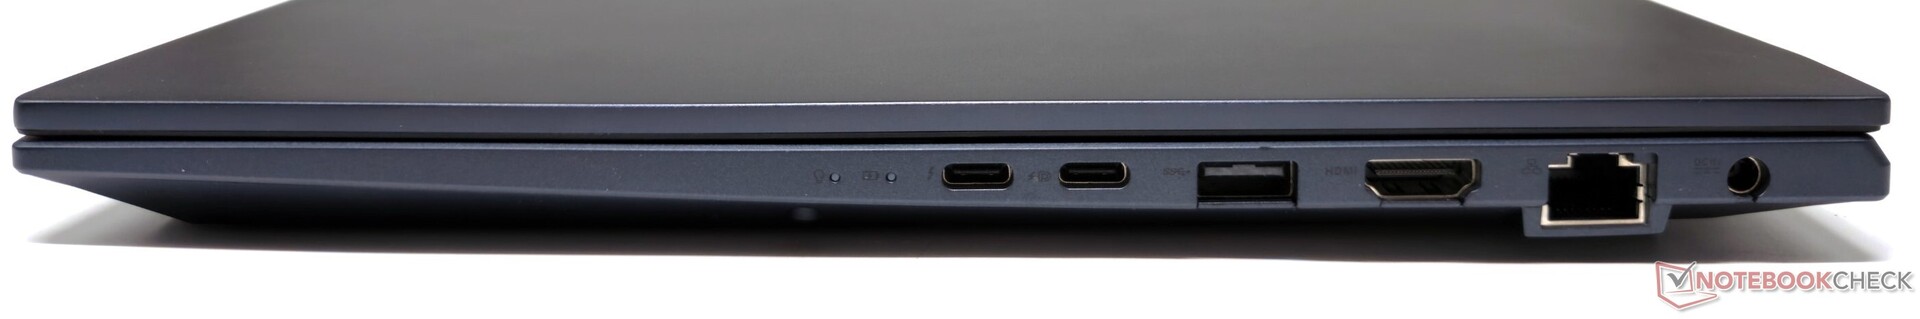
Asus, VivoBook Pro 16'yı Thunderbolt 4 de dahil olmak üzere iyi bir bağlantı noktası setiyle donattı. USB 3.2 Gen2 Type-C bağlantı noktası hem DisplayPort-out hem de Power Delivery'yi destekliyor.
Bu yıl gördüğümüz diğer VivoBook'larda olduğu gibi, bağlantı noktası dağılımı cihazın sağ tarafını tercih ediyor, bu da kablolu bir fare kullanırken rahatsız edici olabilir. Neyse ki, tüm bağlantı noktaları aynı anda parazitsiz olarak kullanılabiliyor.
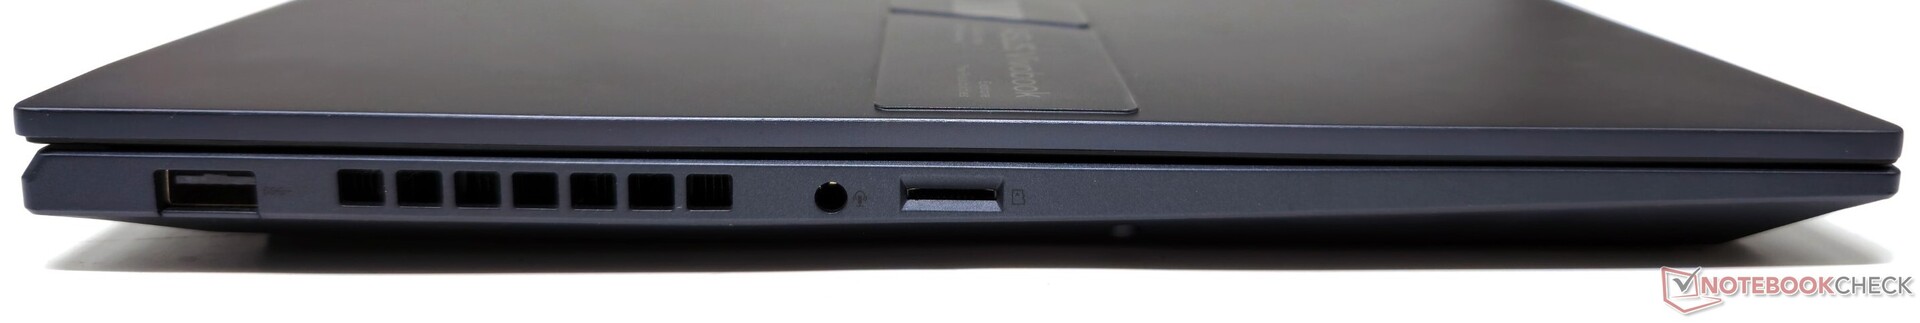
SD Kart Okuyucu
Asus'a göre, VivoBook Pro 16'nın dahili microSD kart okuyucusu 312 MB/s'ye kadar en yüksek aktarım hızlarını destekliyor. Angelbird AV Pro V60 microSD kart ile yaptığımız testlerde, AS-SSD sıralı okuma kıyaslamasında 232 MB/s'ye kadar sıralı okuma hızları kaydettik. Karttan çeşitli JPG dosyalarının kopyalanması 163,5 MB/s'ye ulaştı.
Asus'un iddia ettiği maksimum değerin biraz altında olsa da, kart okuyucu hızları önceki nesil modele kıyasla önemli ölçüde daha yüksek.
| SD Card Reader | |
| average JPG Copy Test (av. of 3 runs) | |
| Gigabyte AERO 16 OLED BSF | |
| Asus VivoBook Pro 16 K6602VU (Angelbird AV Pro V60) | |
| Sınıf ortalaması Multimedia (23 - 531, n=37, son 2 yıl) | |
| Asus Vivobook Pro 16X K6604JV-MX016W | |
| Asus ROG Flow X16 GV601V | |
| Asus VivoBook Pro 16 (AV Pro SD microSD 128 GB V60) | |
| maximum AS SSD Seq Read Test (1GB) | |
| Asus ROG Flow X16 GV601V | |
| Asus VivoBook Pro 16 K6602VU (Angelbird AV Pro V60) | |
| Sınıf ortalaması Multimedia (37.3 - 1455, n=36, son 2 yıl) | |
| Gigabyte AERO 16 OLED BSF | |
| Asus Vivobook Pro 16X K6604JV-MX016W | |
| Asus VivoBook Pro 16 (AV Pro SD microSD 128 GB V60) | |
İletişim
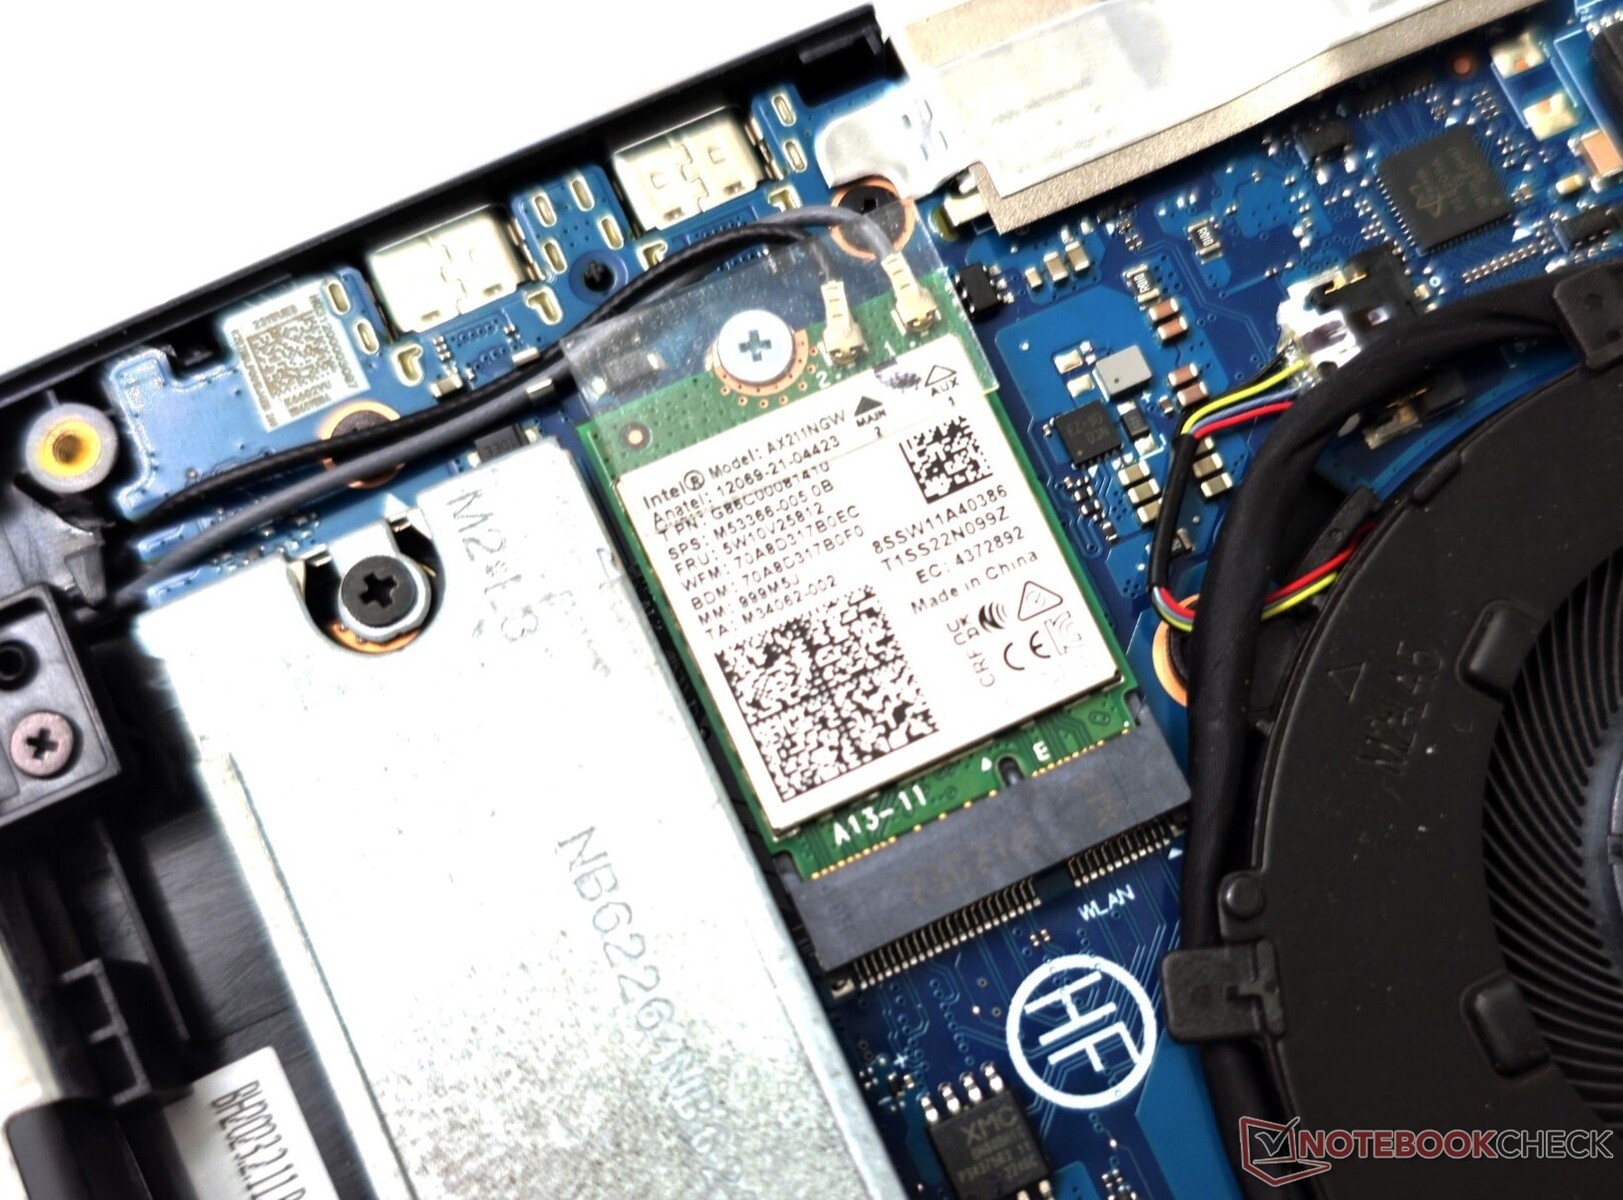
VivoBook Pro 16, Intel Wi-Fi 6E AX211 kablosuz kart ile donatılmış olarak geliyor. Testlerde, 5 GHz Wi-Fi üzerinden güçlü gönderme ve alma hızları kaydettik.
Asus ROG Rapture GT-AXE11000 referans yönlendiricisini kullandığımız kurulumda 6 GHz bandındaki performans, 5 GHz kadar hızlı olmasa da iyiydi.
Karşılaştırma yapmak gerekirseLenovo Legion Pro 5 mediaTek Wi-Fi 6E MT7922 kartı ile iyi ve nispeten istikrarlı bir 6 GHz verim sunuyor.
| Networking / iperf3 transmit AXE11000 | |
| Lenovo Legion Pro 5 16ARX8 (R5 7645HX, RTX 4050) | |
| Asus VivoBook Pro 16 K6602VU | |
| Asus VivoBook Pro 16 | |
| Asus Vivobook Pro 16X K6604JV-MX016W | |
| Sınıf ortalaması Multimedia (606 - 1978, n=54, son 2 yıl) | |
| Ortalama Intel Wi-Fi 6E AX211 (64 - 1921, n=276) | |
| Asus ROG Flow X16 GV601V | |
| Asus TUF Gaming A16 FA617XS | |
| Networking / iperf3 receive AXE11000 | |
| Asus Vivobook Pro 16X K6604JV-MX016W | |
| Asus VivoBook Pro 16 K6602VU | |
| Lenovo Legion Pro 5 16ARX8 (R5 7645HX, RTX 4050) | |
| Ortalama Intel Wi-Fi 6E AX211 (582 - 1890, n=276) | |
| Sınıf ortalaması Multimedia (682 - 1818, n=54, son 2 yıl) | |
| Asus ROG Flow X16 GV601V | |
| Asus TUF Gaming A16 FA617XS | |
| Networking / iperf3 transmit AXE11000 6GHz | |
| Lenovo Legion Pro 5 16ARX8 (R5 7645HX, RTX 4050) | |
| Asus ROG Flow X16 GV601V | |
| Asus Vivobook Pro 16X K6604JV-MX016W | |
| Sınıf ortalaması Multimedia (869 - 2373, n=23, son 2 yıl) | |
| Gigabyte AERO 16 OLED BSF | |
| Asus VivoBook Pro 16 K6602VU | |
| Ortalama Intel Wi-Fi 6E AX211 (385 - 1851, n=226) | |
| Networking / iperf3 receive AXE11000 6GHz | |
| Asus Vivobook Pro 16X K6604JV-MX016W | |
| Asus VivoBook Pro 16 | |
| Lenovo Legion Pro 5 16ARX8 (R5 7645HX, RTX 4050) | |
| Sınıf ortalaması Multimedia (1212 - 2361, n=23, son 2 yıl) | |
| Asus ROG Flow X16 GV601V | |
| Asus VivoBook Pro 16 K6602VU | |
| Gigabyte AERO 16 OLED BSF | |
| Ortalama Intel Wi-Fi 6E AX211 (700 - 1857, n=226) | |
Web kamerası
Fiziksel bir gizlilik deklanşörüne sahip 1080p web kamerası büyük renk sapmaları gösterir, ancak genel görüntü kalitesi temel video görüşmeleri ve konferanslar için kullanılabilir. Ayrıntılar oldukça iyi korunmuş, ancak netlik ve keskinlikte pek çok iyileştirme yapılabilir.


Güvenlik
VivoBook Pro 16, Windows Hello tabanlı girişler için güç düğmesinde bir parmak izi okuyucu sunar. Parmak izi okuyucu hızlı çalışıyor ve oldukça duyarlı. Windows 11'in gereksinimlerini karşılamak için bir TPM 2.0 modülü mevcuttur.
Aksesuarlar ve Garanti
Ünitemizin kutusunda 150 W güç adaptörü ve olağan evraklar dışında ek bir aksesuar yoktu.
Hindistan'da Asus, VivoBook Pro 16 için standart bir yıllık garanti sunuyor. Ayrıca, alıcılar çeşitli garanti ve kaza sonucu hasar koruma seçenekleri arasından seçim yapabilirler 999 ile ₹2,999 arasında değişen fiyatlarla, 15 takvim günü içinde satın alma işlemlerini kaydettirmeleri koşuluyla.
Bakım
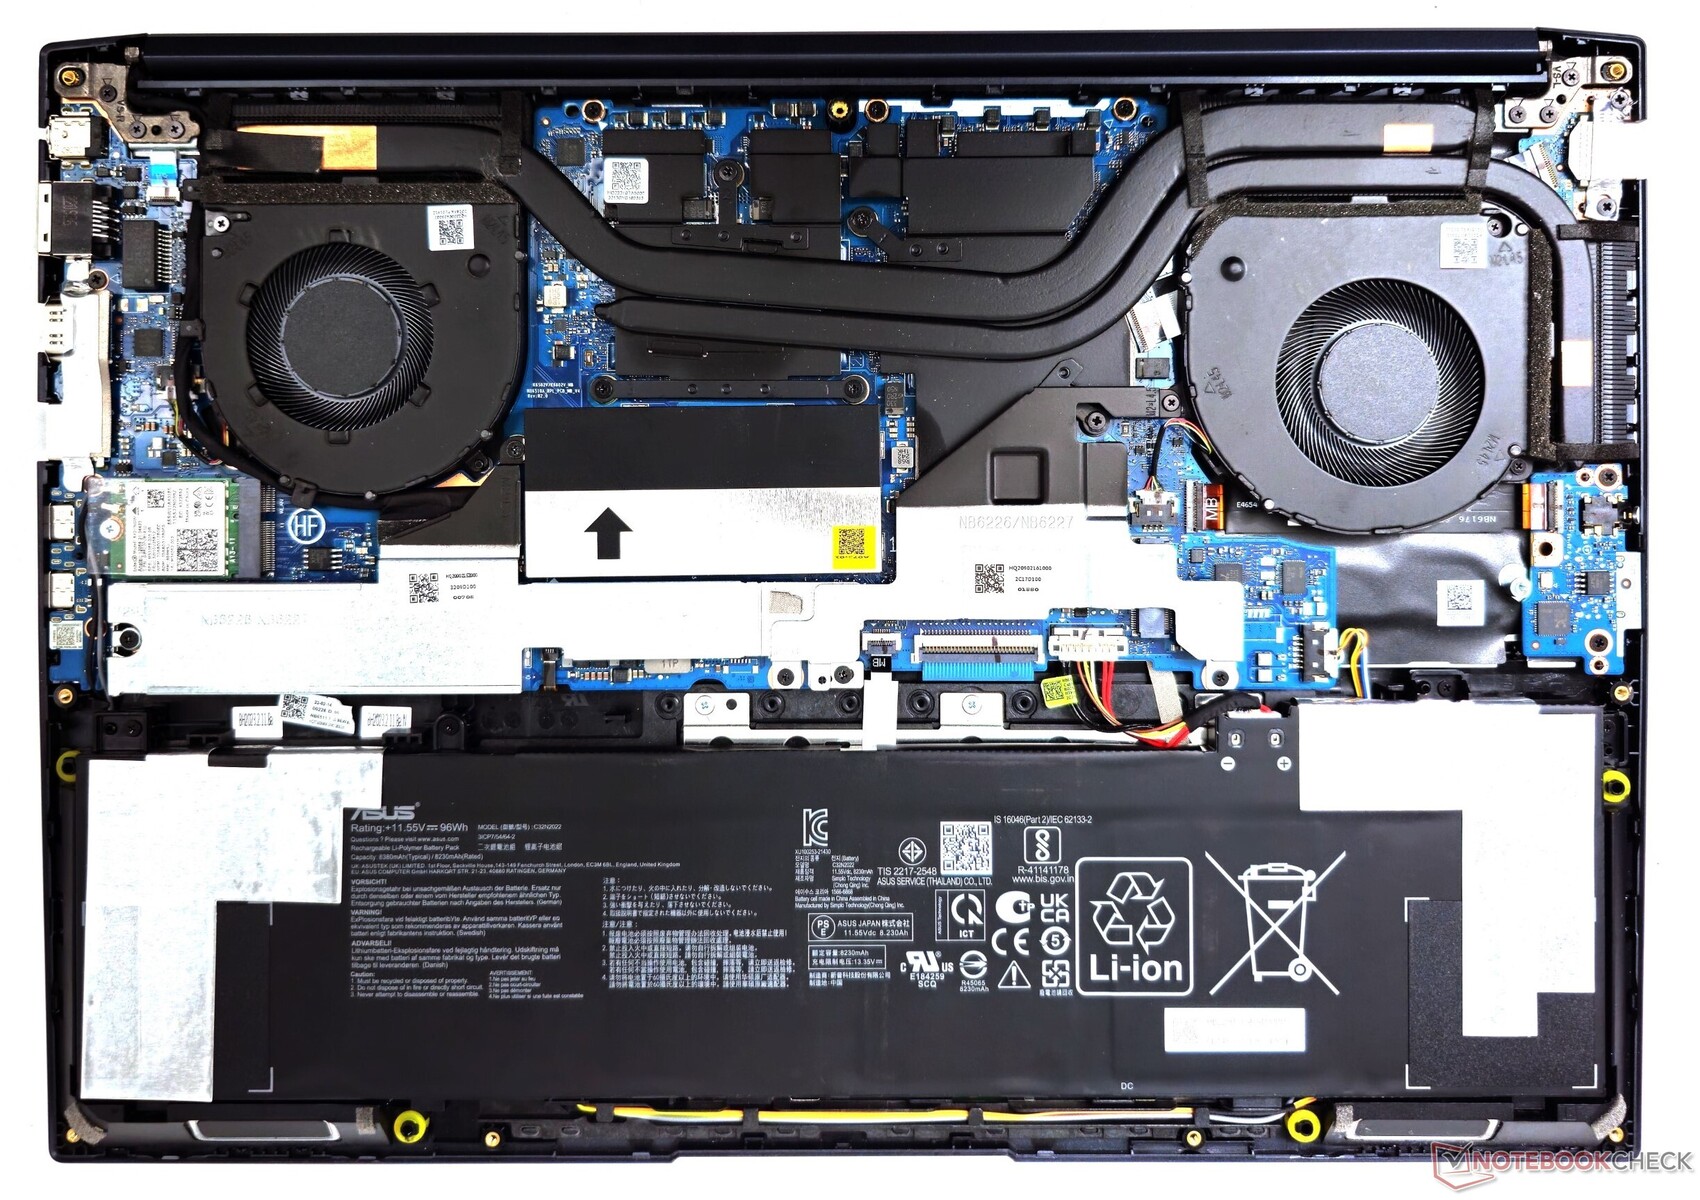
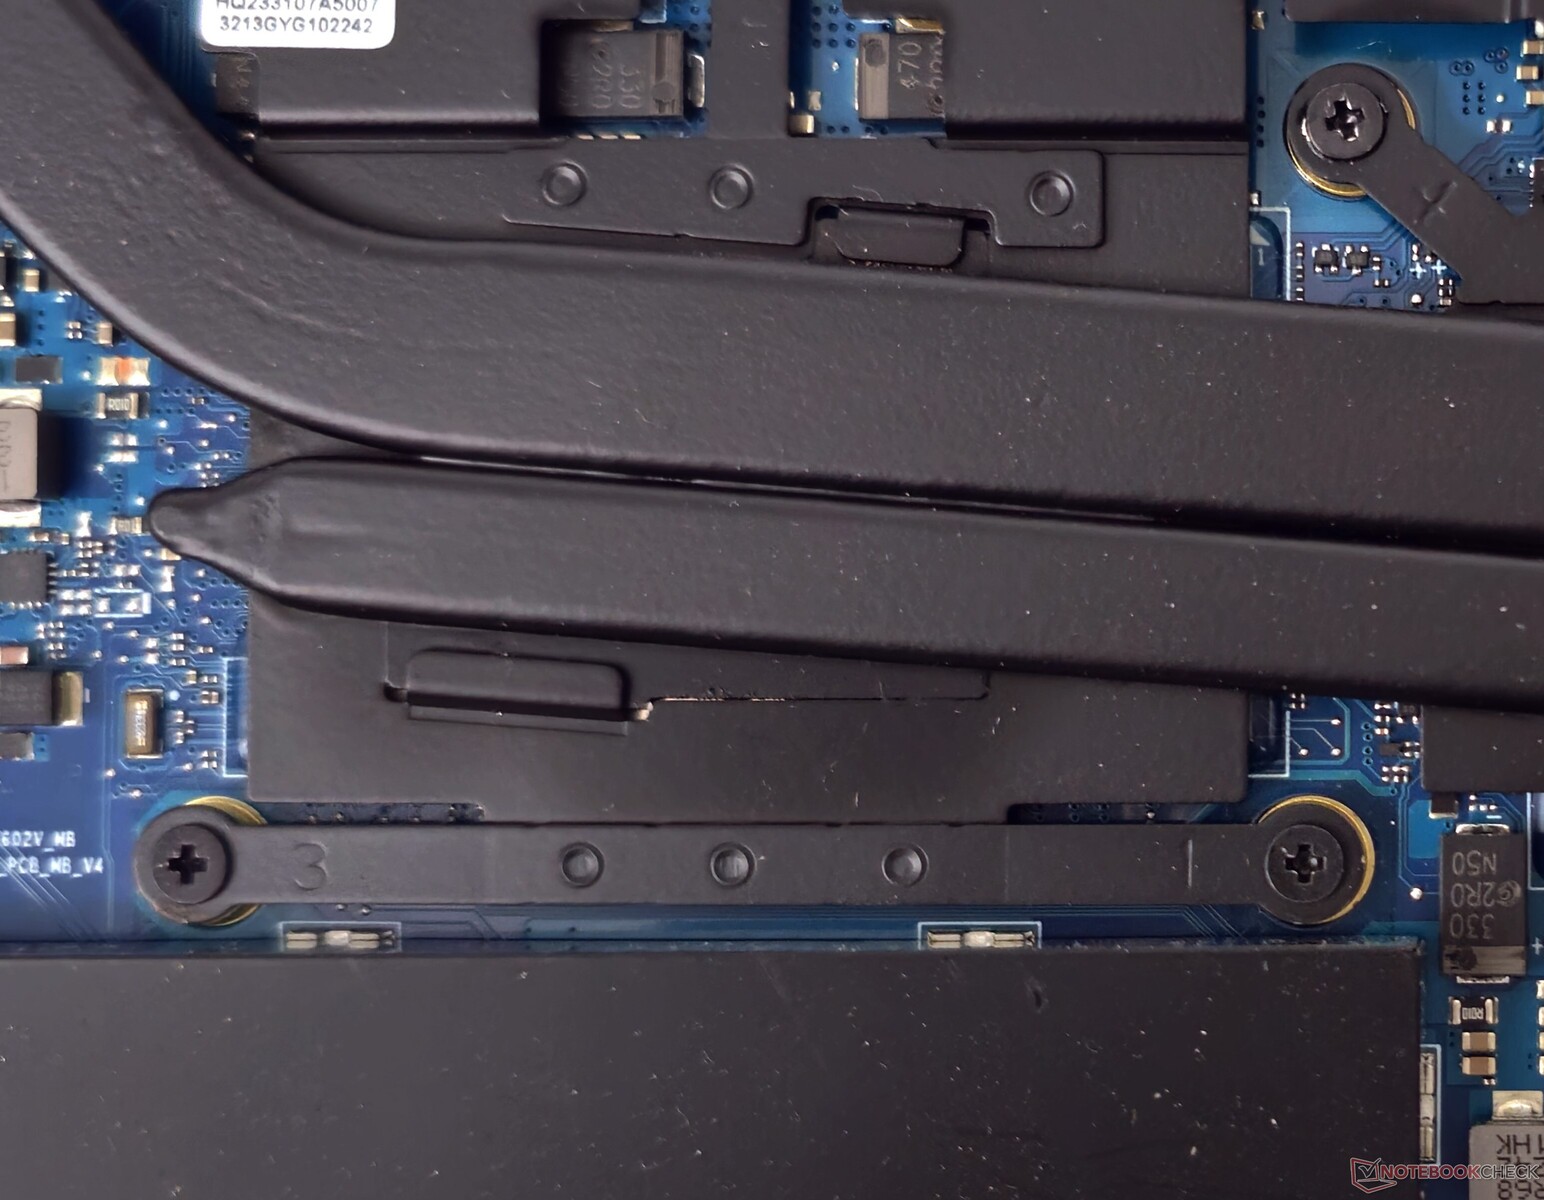
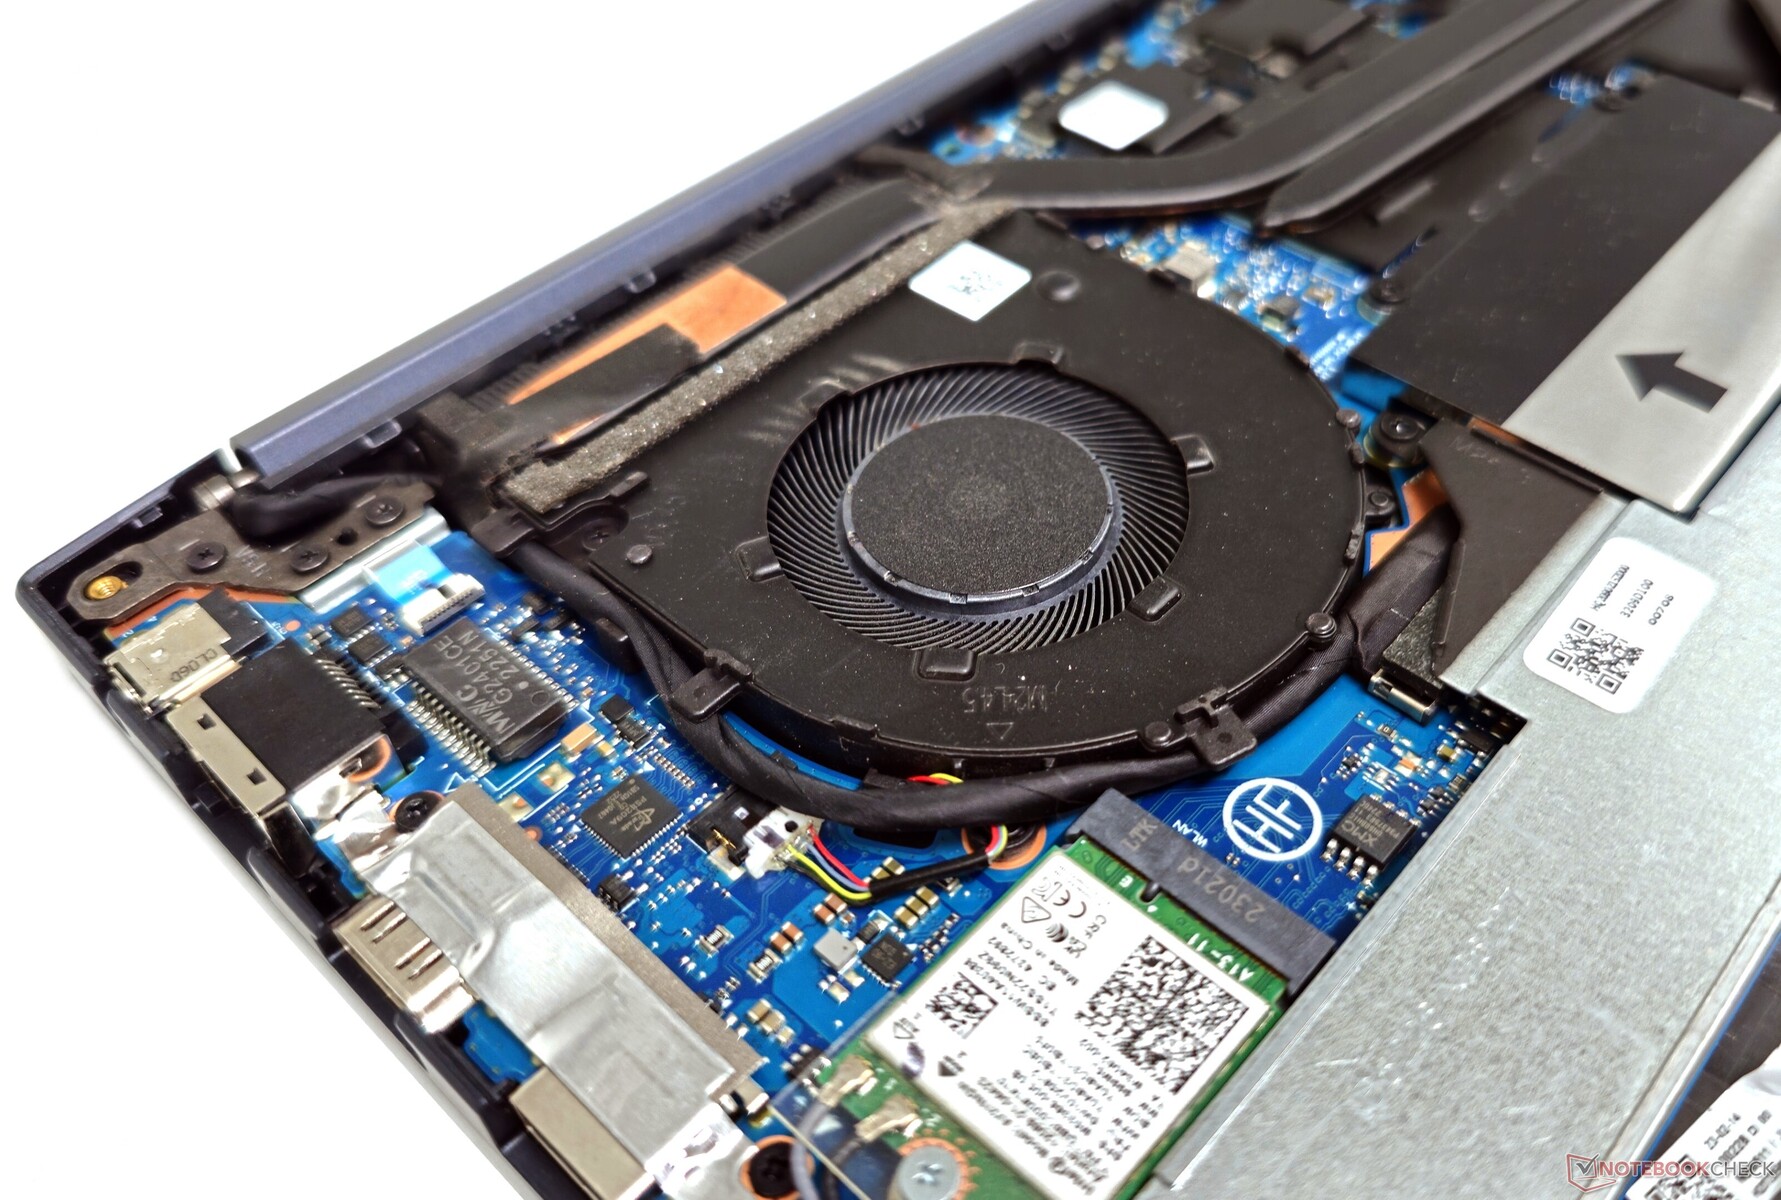
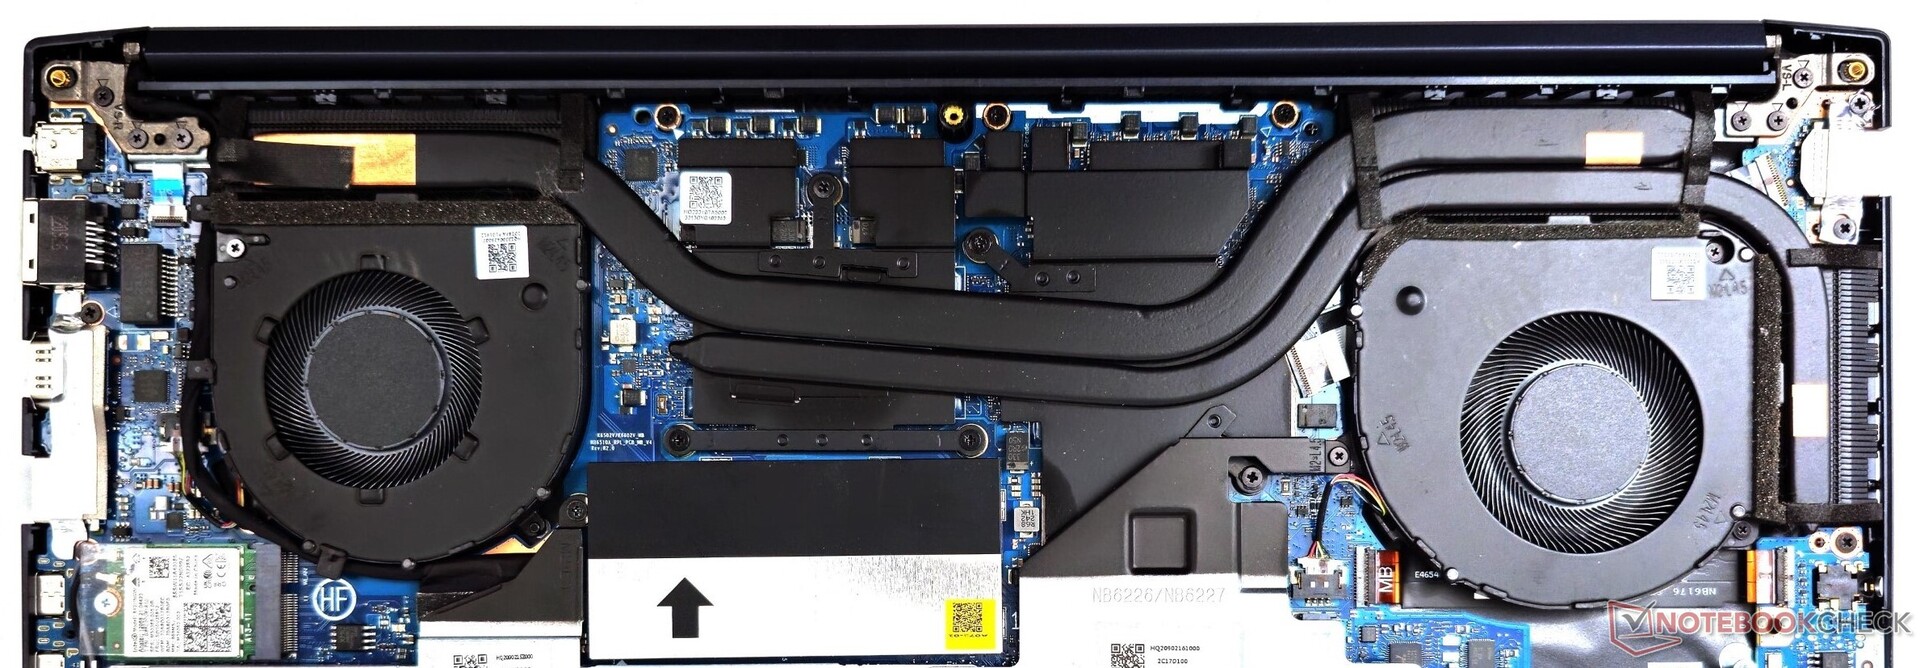
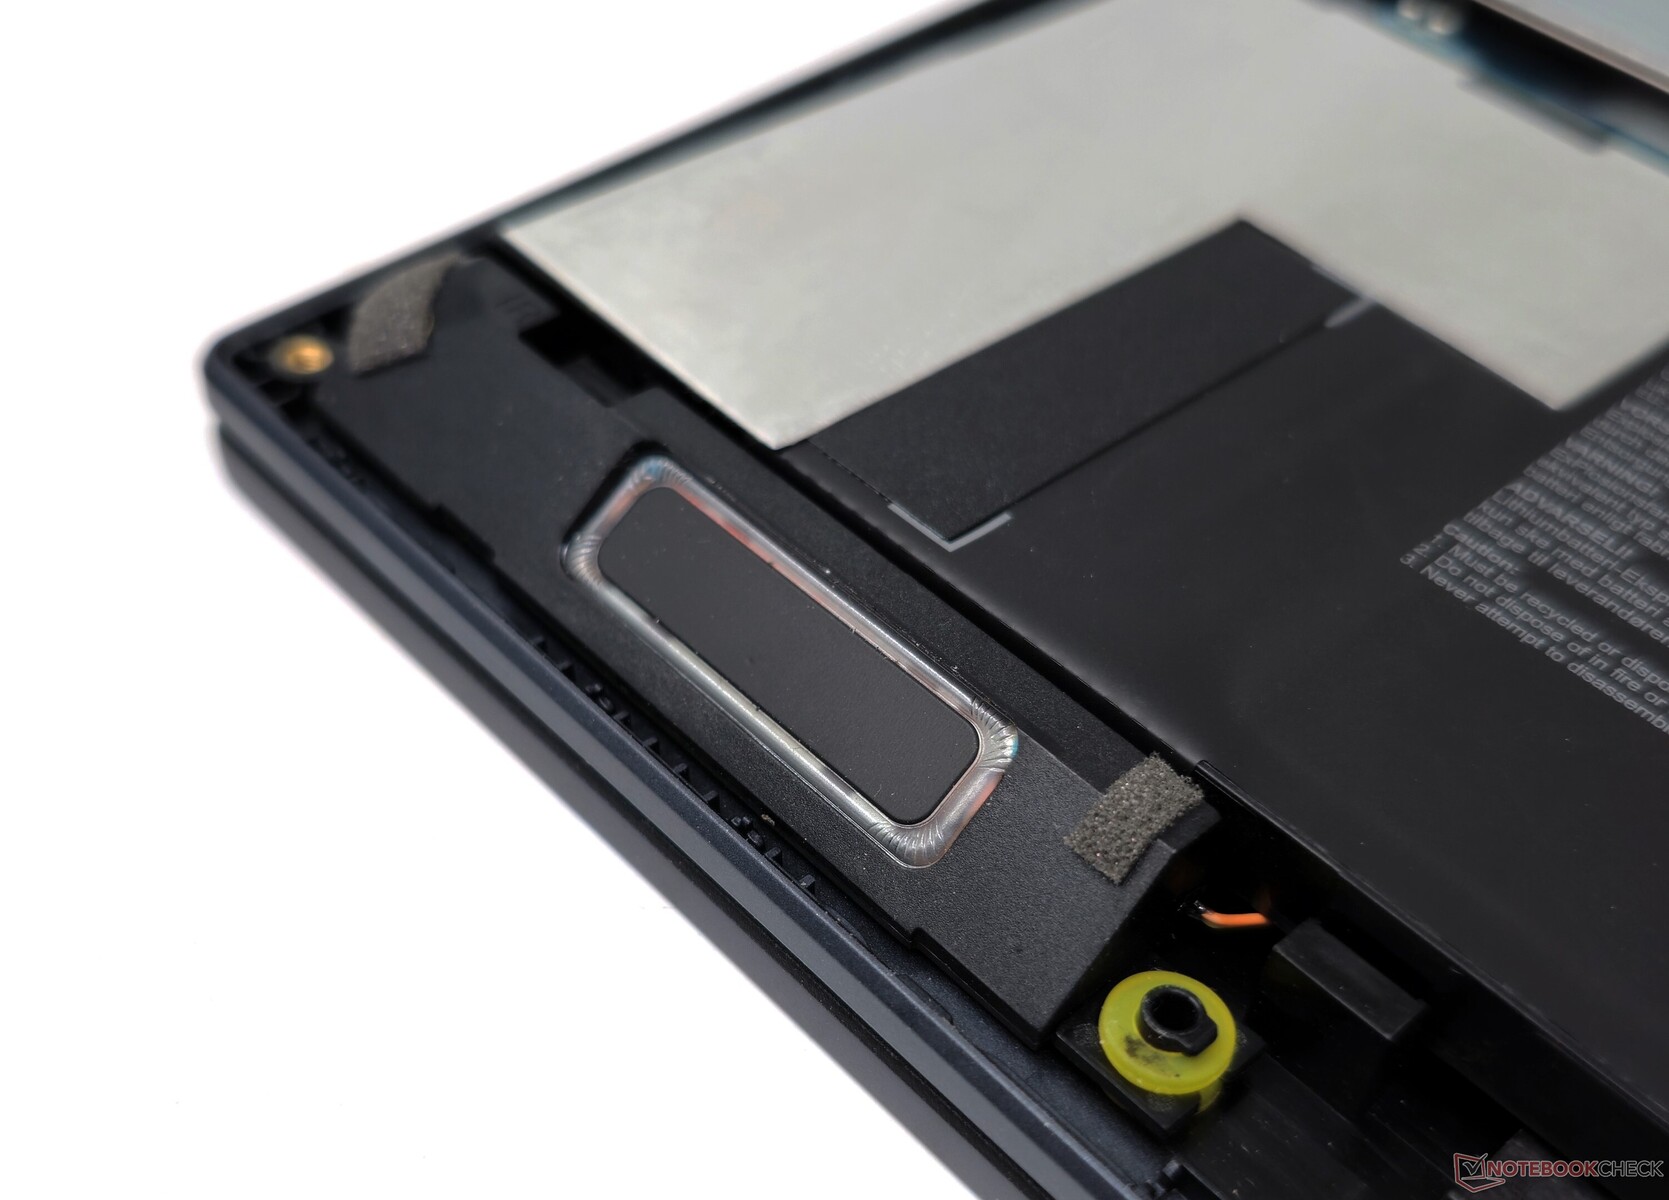
VivoBook Pro 16'nın içine girmek için alt paneli ayırmak üzere dokuz Torx vidasının çıkarılması gerekir. İçeride RAM, NVMe SSD ve Wi-Fi kartı gibi temel bileşenlere yükseltme için erişilebilir. Pil de gerektiğinde sökülerek değiştirilebilir.
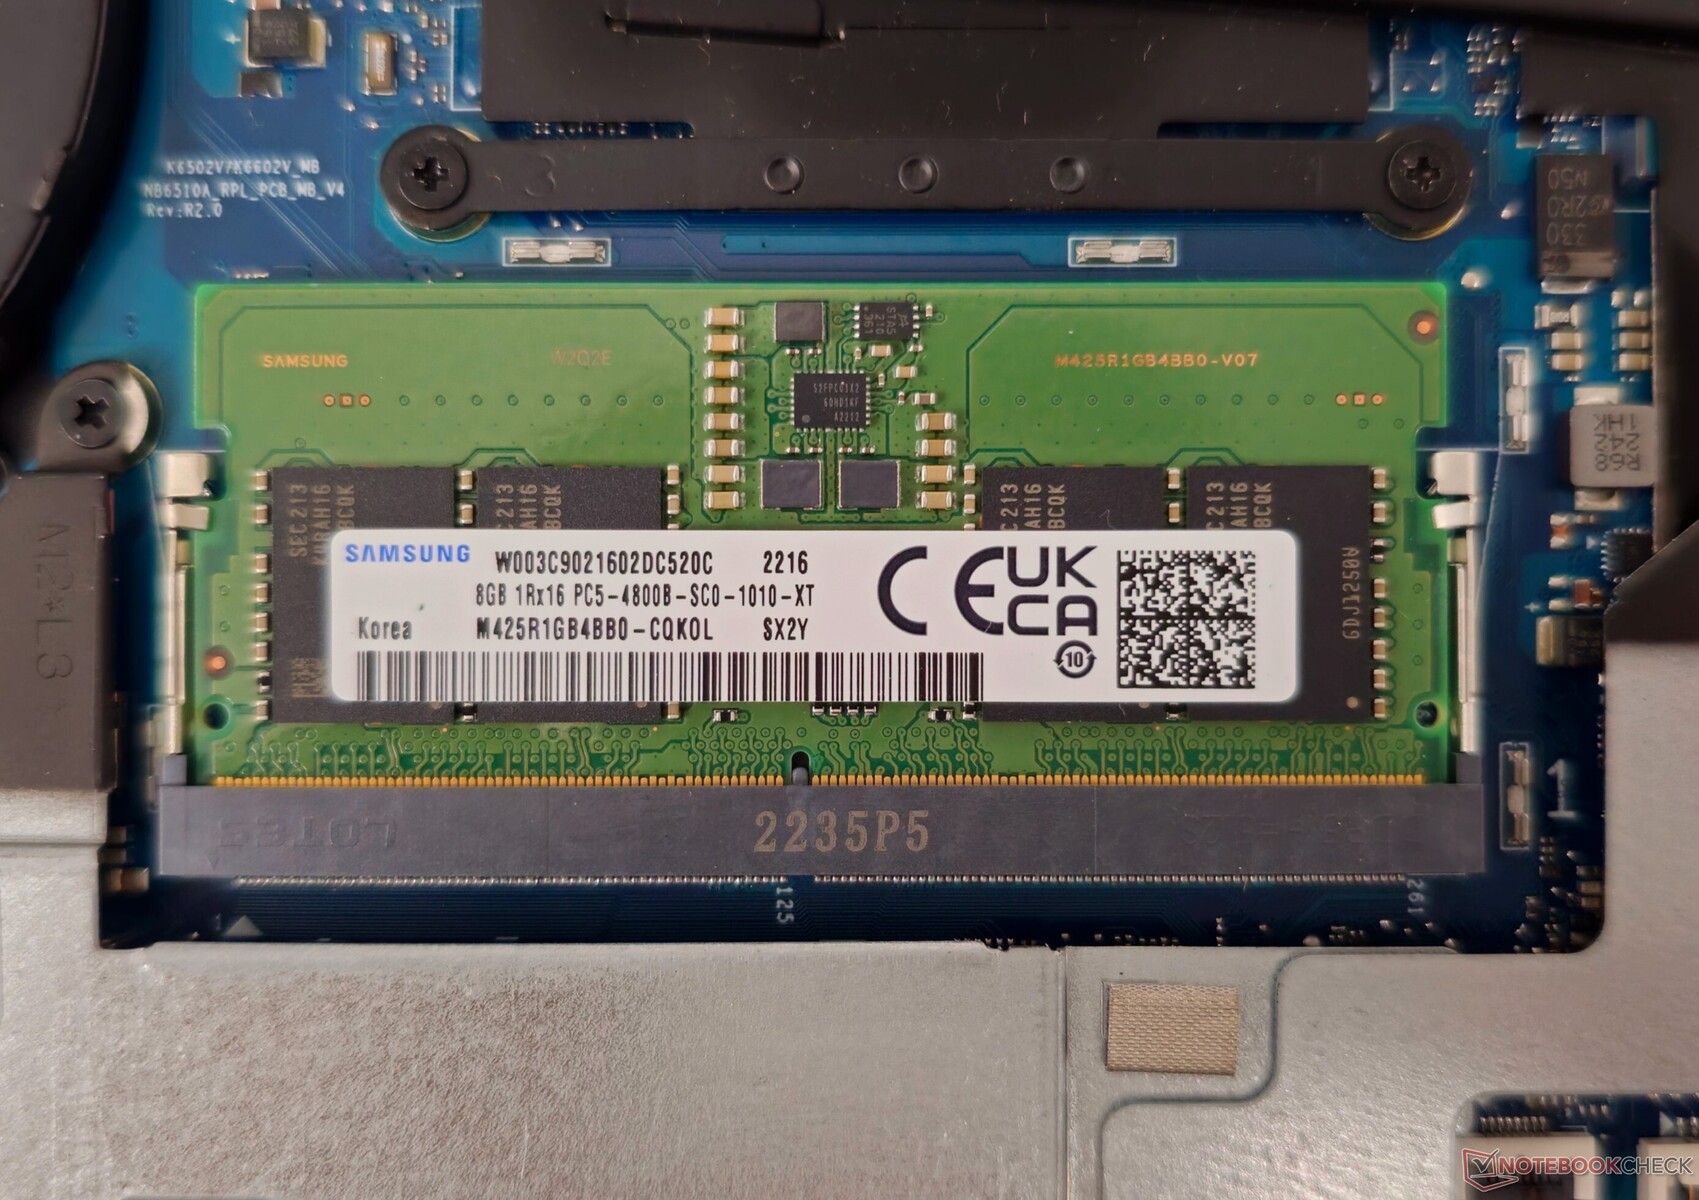
Anakarta lehimlenmiş olarak 8 GB DDR5 bellek geldiğinden ve daha fazla RAM eklemek için yalnızca bir SO-DIMM yuvası bulunduğundan RAM genişletmesi maksimum 24 GB ile sınırlıdır.
Giriş Aygıtları: Sıkışık ok tuşlarına sahip tam boyutlu klavye
Klavye
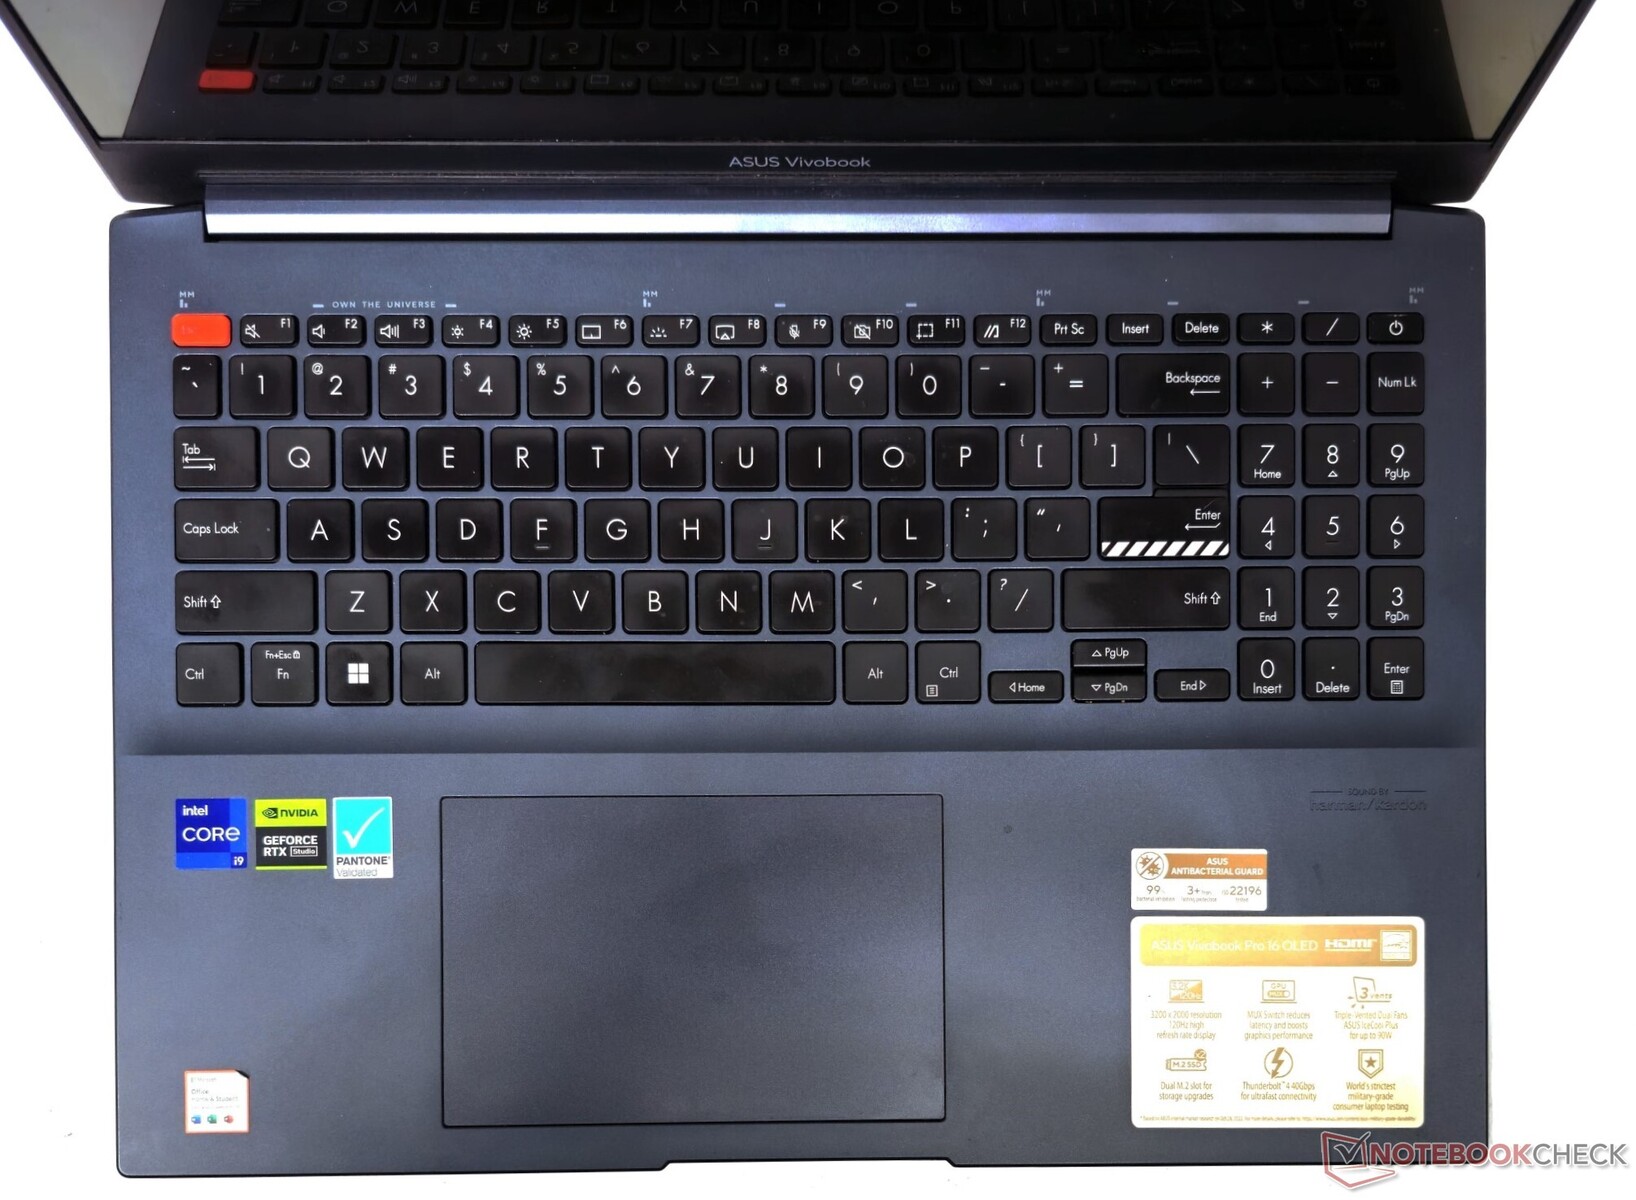
Asus, VivoBook Pro 16'yı VivoBook 15X ve Pro 16X modellerinde gördüğümüze benzer şekilde imzalı ErgoSense klavyesi ile donatıyor. Klavye, 1,4 mm tuş hareketiyle duyarlı bir yazma deneyimi sağlıyor. MyAsus uygulaması, F1-F12 veya özel kısayollar için üst sıra tuşlarının birincil işlevini ayarlamaya izin veriyor.
Ok tuşları sıkışık hissettirse de, günlük üretkenlik için rahat bir yazma hissi veriyor. Üç seviyeli beyaz arka aydınlatma karanlıkta yazmaya yardımcı oluyor.
Dokunmatik yüzey
9 cm x 13 cm boyutlarındaki yüzey, tüm yüzeyi sol fare düğmesi gibi davranarak pürüzsüz ve duyarlı bir kayma sunar. Windows Precision hareketleri tamamen destekleniyor. VivoBook Pro 16X'te gördüğümüzden farklı olarak yerleşik Asus Dial yok.
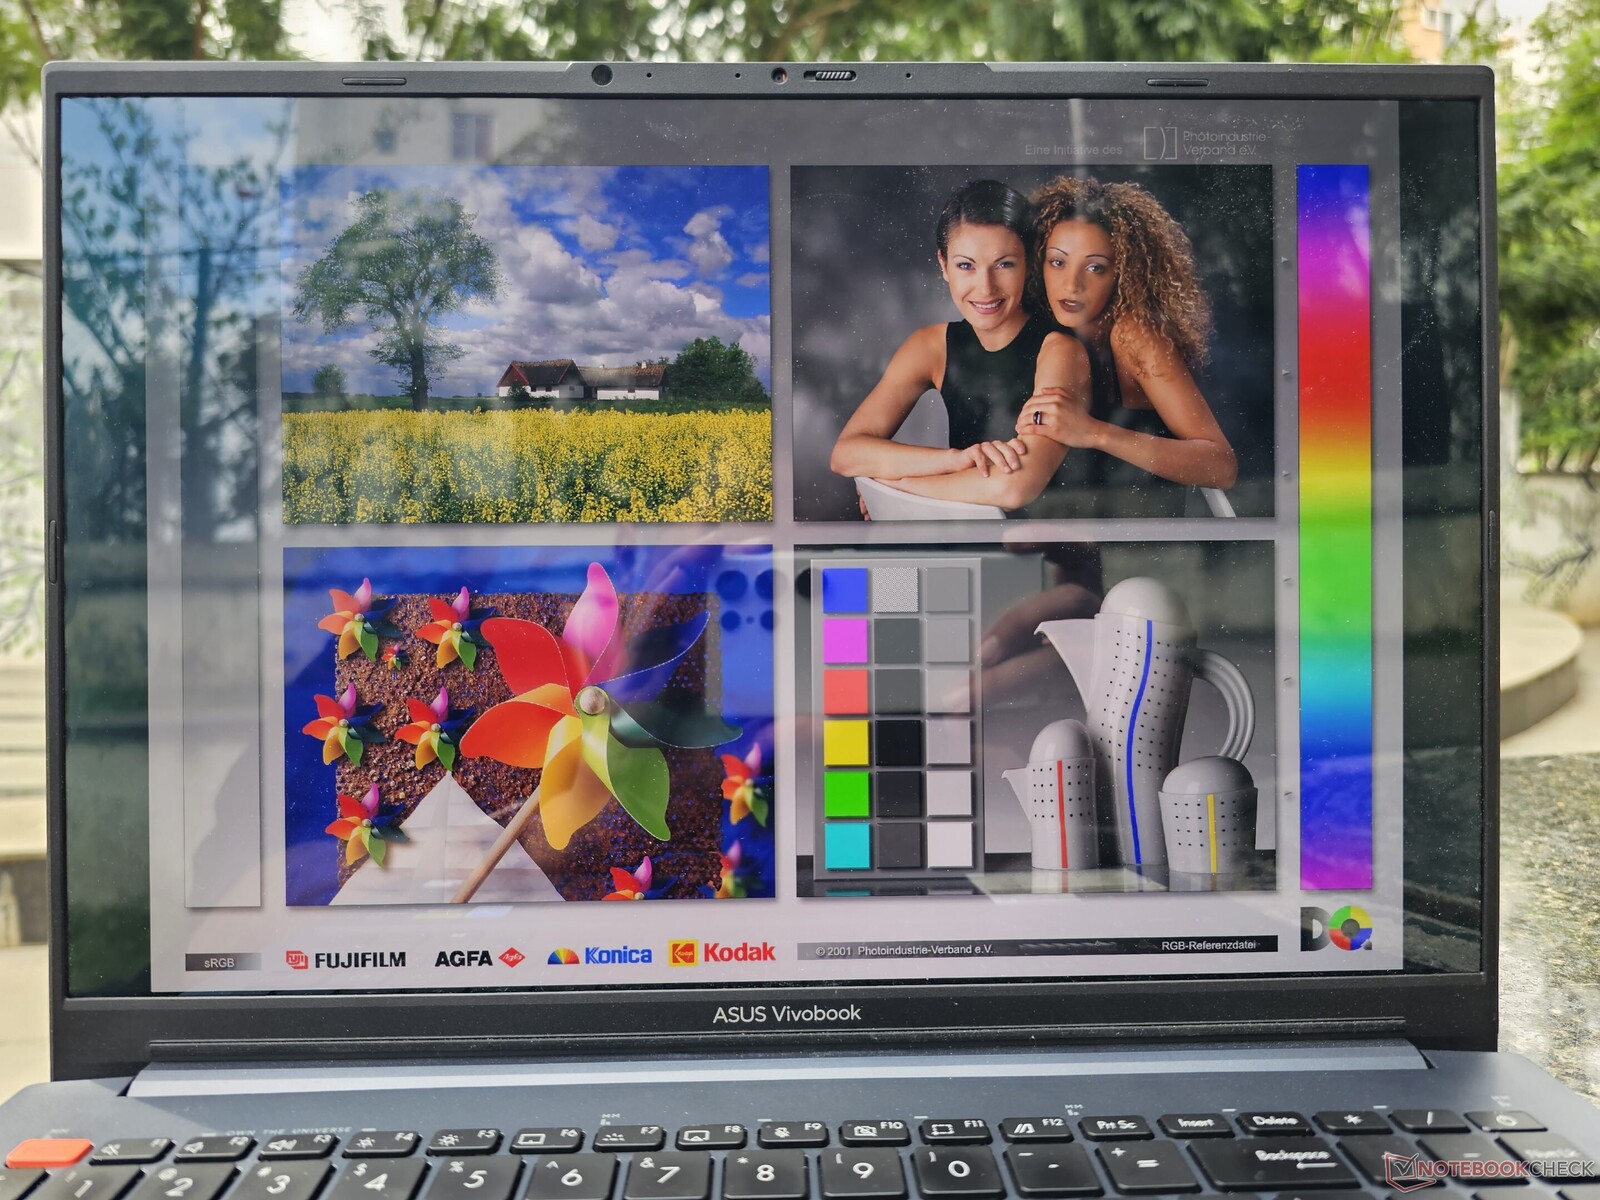
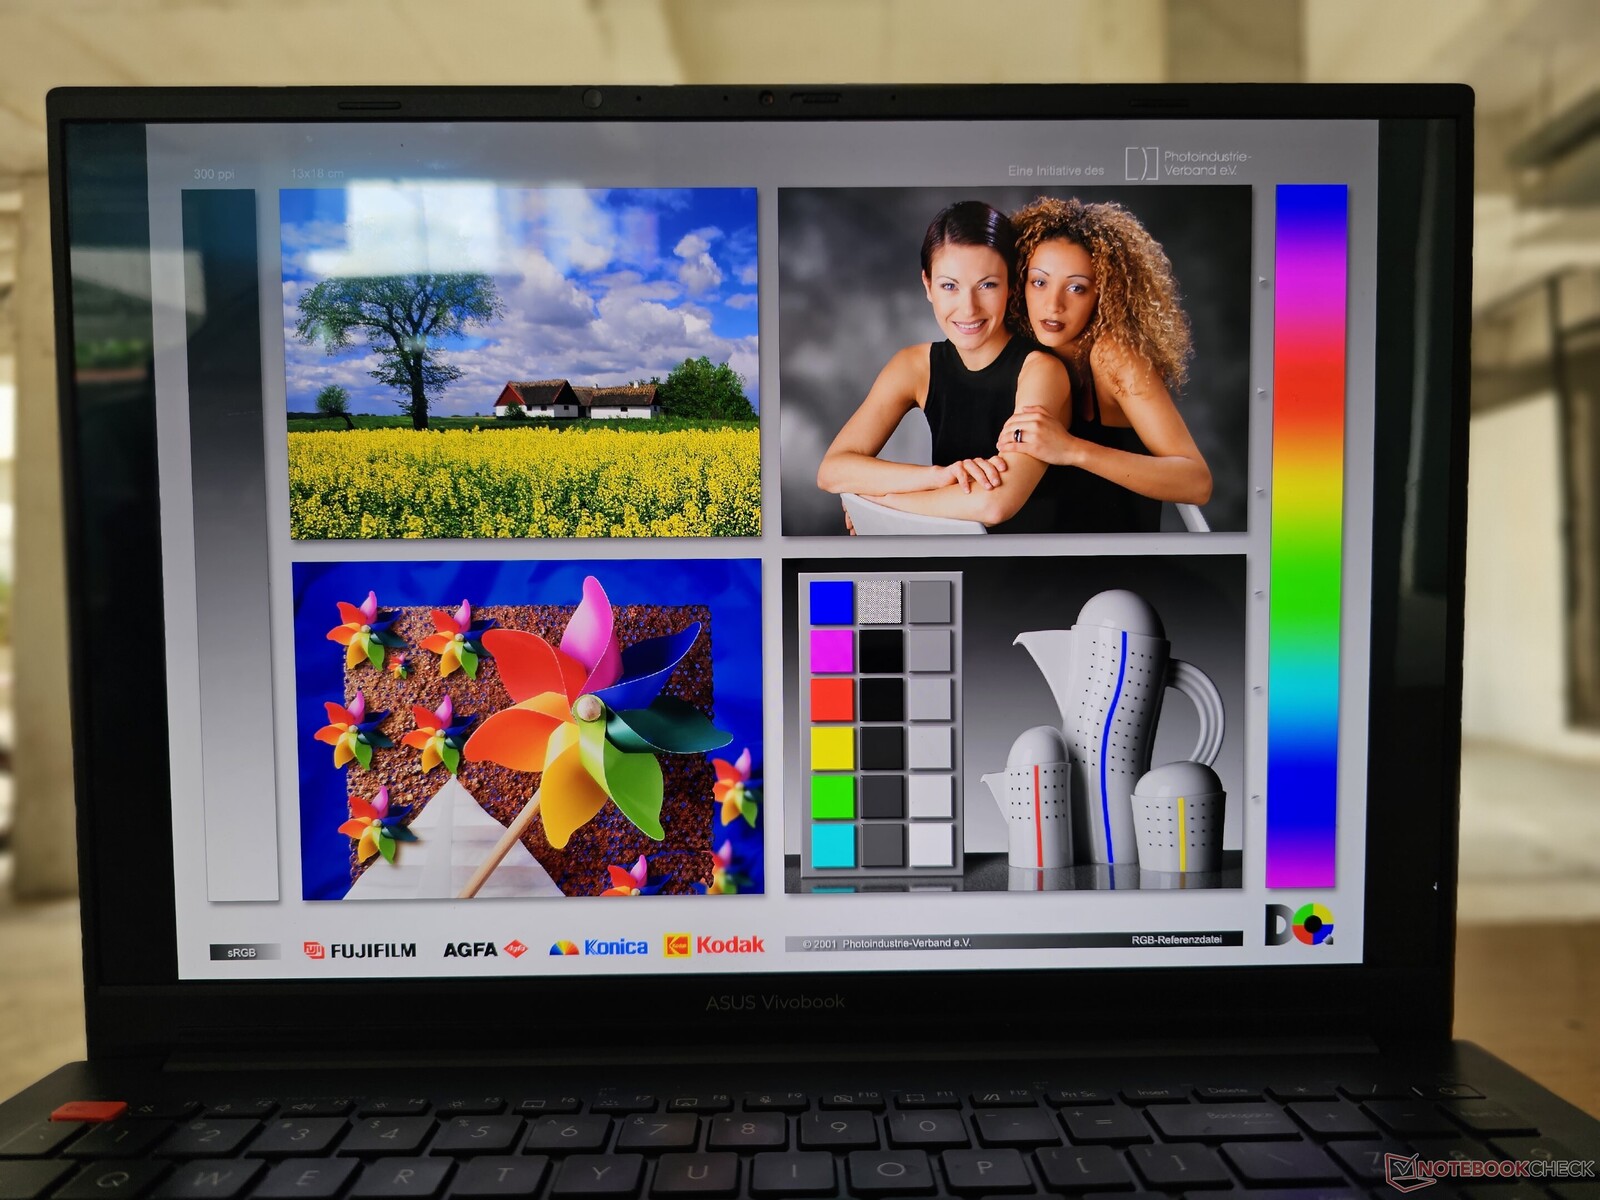
Ekran: 3.240 Hz DC karartma özellikli 2K Dolby Vision HDR OLED
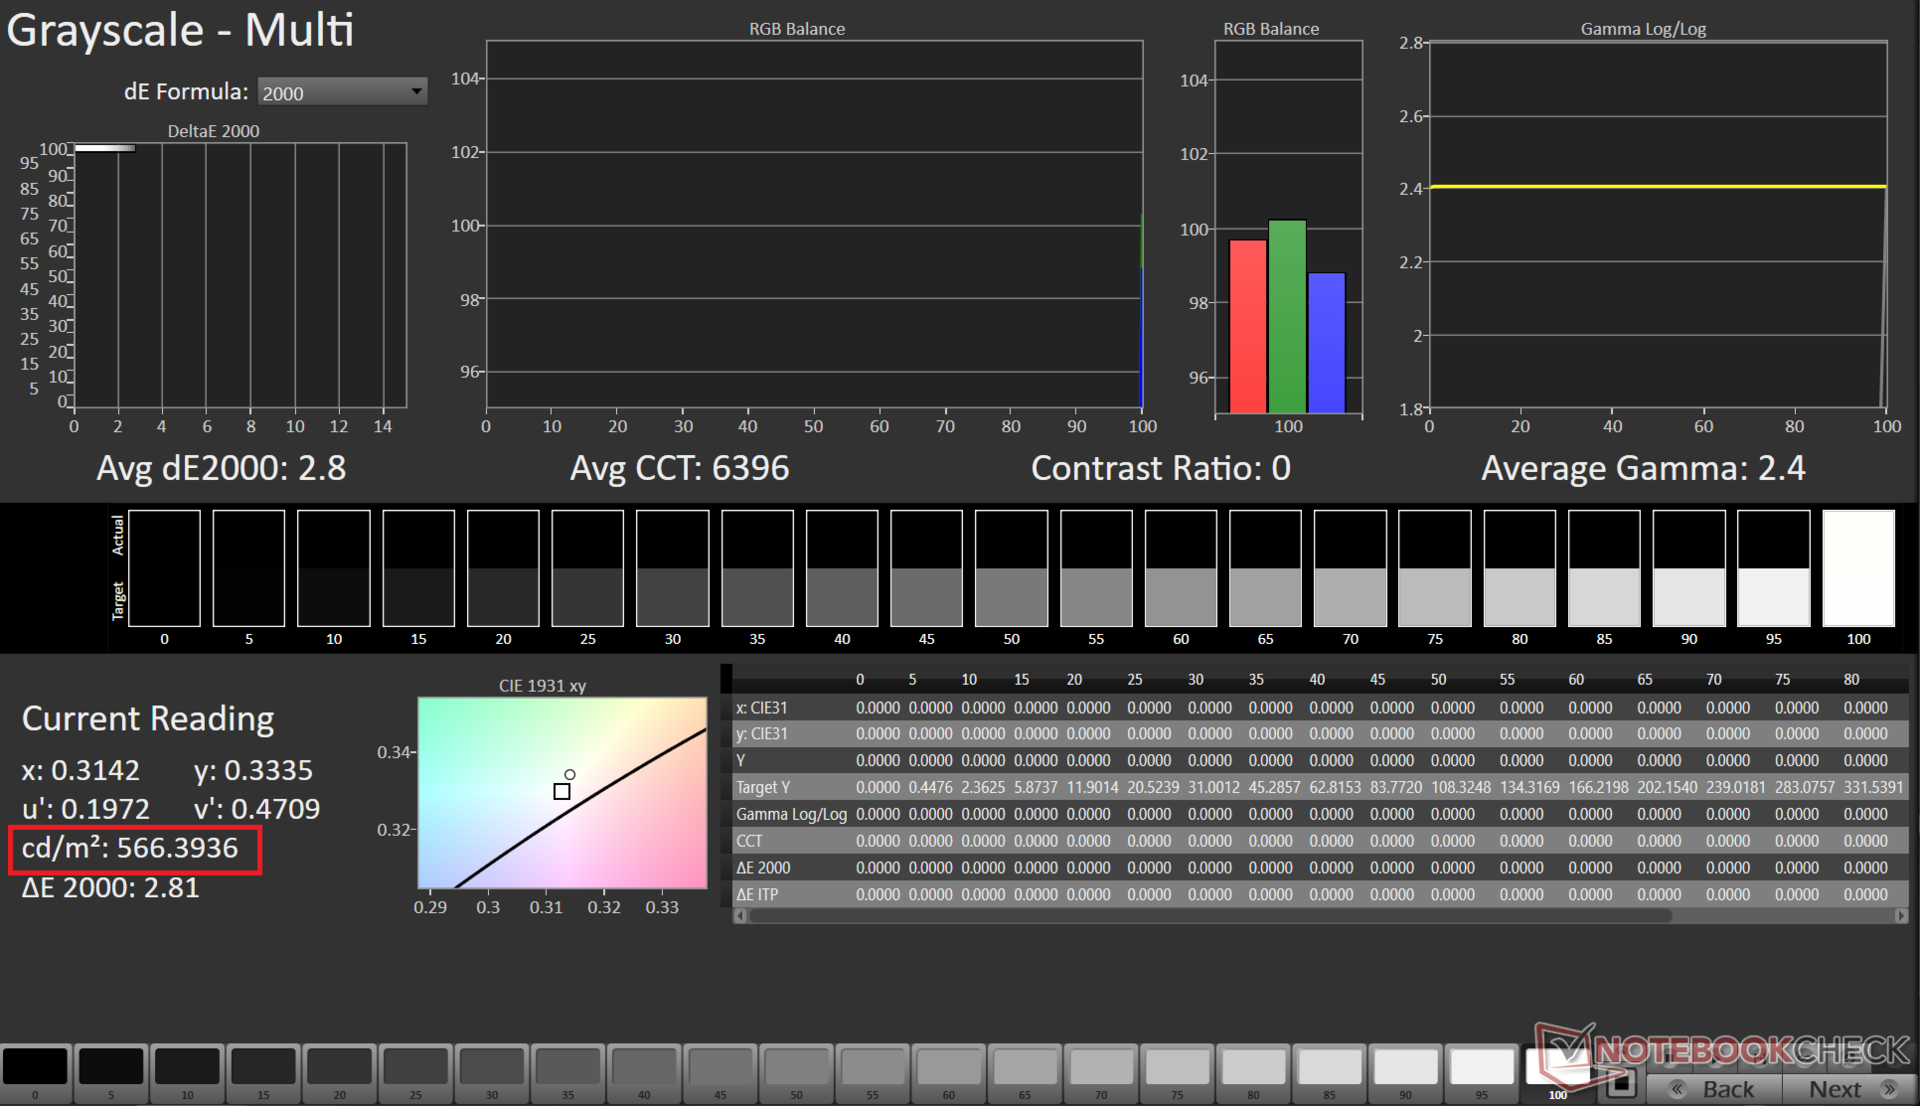
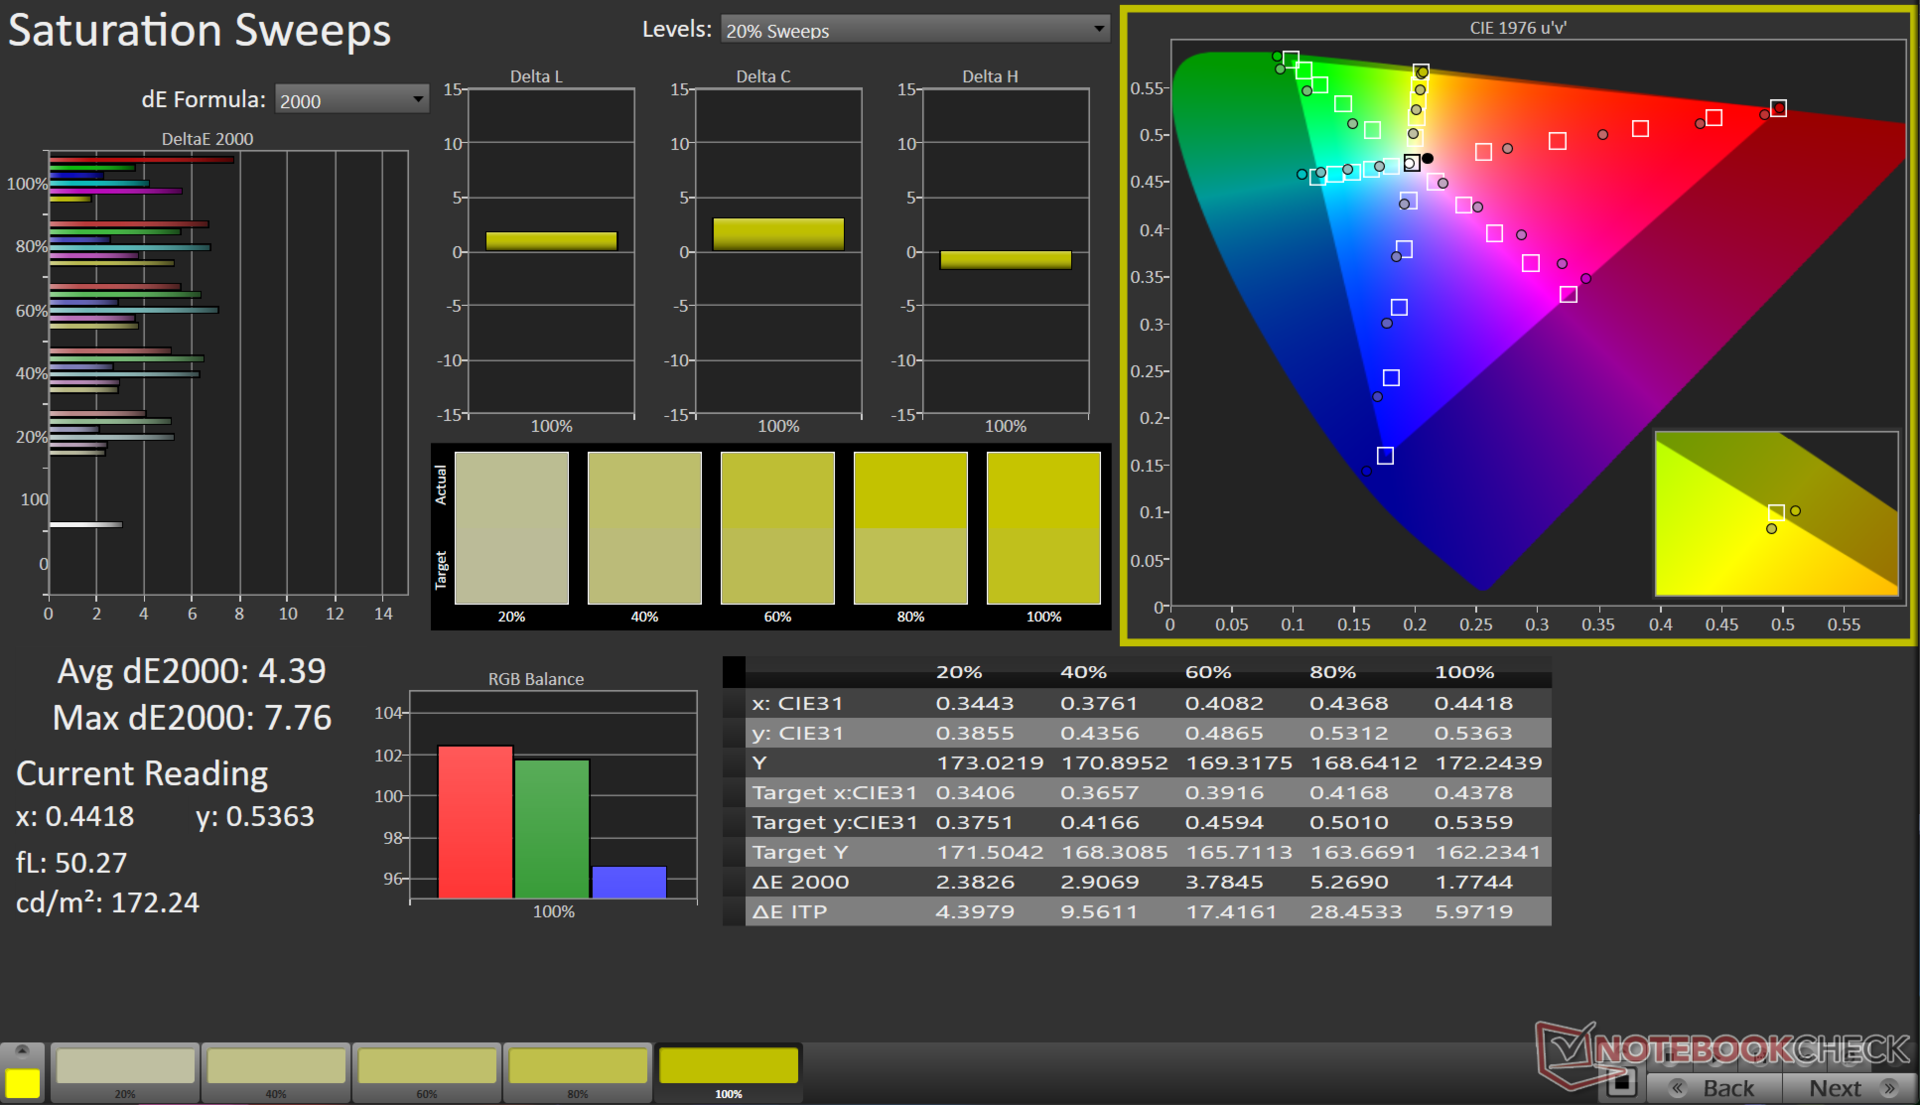
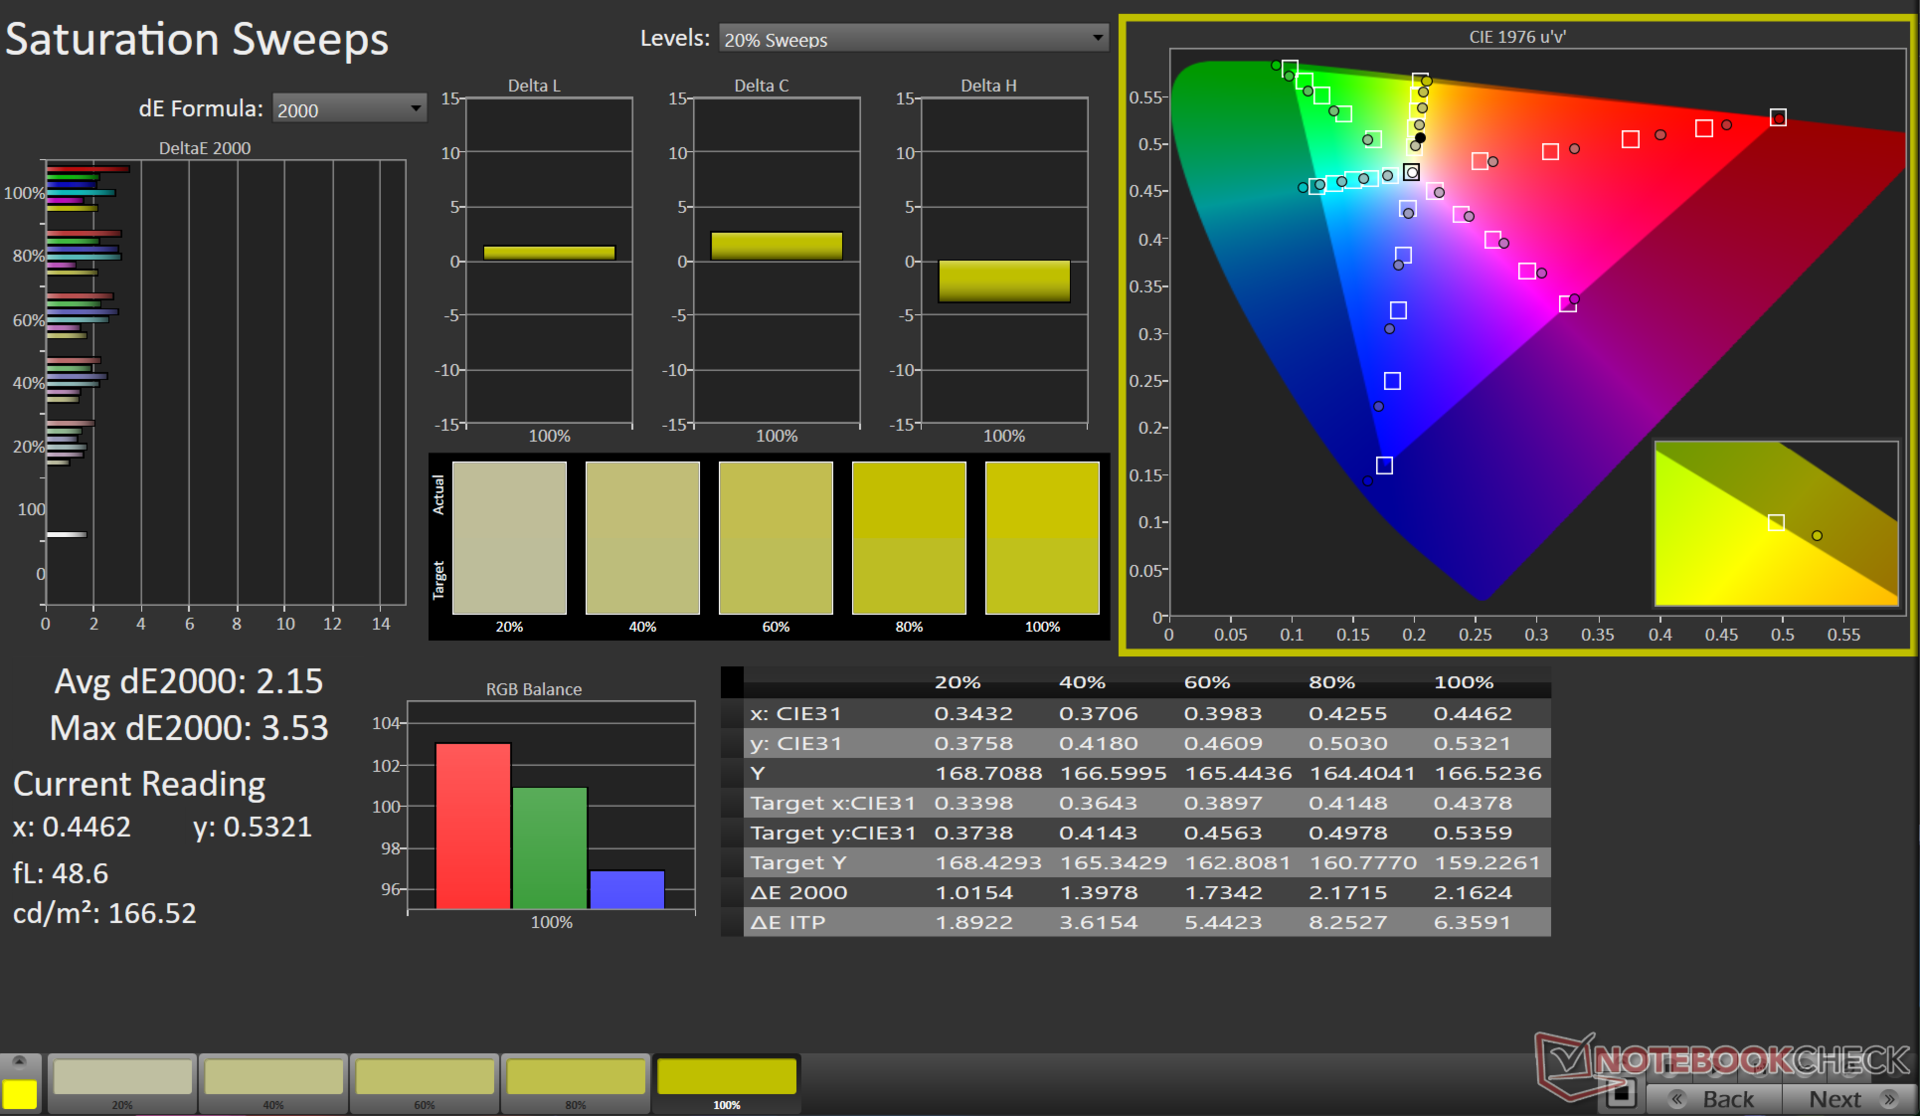
VivoBook Pro 16, Pro 16X ile aynı 16:10 Samsung ATNA60BX01 OLED panelini kullanır ve ProArt StudioBook 163200 x 2000 çözünürlüğe ve 120 Hz yenileme hızına sahip. Bir OLED panelden beklendiği gibi, derin siyahlarla ve herhangi bir arka ışık akması olmadan neredeyse sonsuz bir kontrast oranı sunar. Parlaklık dağılımı da son derece eşit.
SDR modunda, 358 nitlik bir tepe parlaklığı kaydettik. HDR etkinleştirildiğinde, ekran VESA DisplayHDR 600 spesifikasyonuna yakın bir değer olan 566 nit'e kadar ulaşabiliyor. MyAsus uygulaması DC karartma, renk gamı ve yanmayı önleyen OLED piksel kaydırma gibi çeşitli ayarlamalar sağlıyor.
Maksimum SDR parlaklığı idealden biraz daha düşük olsa da OLED panelin mükemmel siyahları her şeye rağmen sürükleyici bir izleme deneyimi yaratıyor.

| |||||||||||||||||||||||||
Aydınlatma: 98 %
Batarya modunda parlaklık: 348 cd/m²
Kontrast: ∞:1 (Siyah: 0 cd/m²)
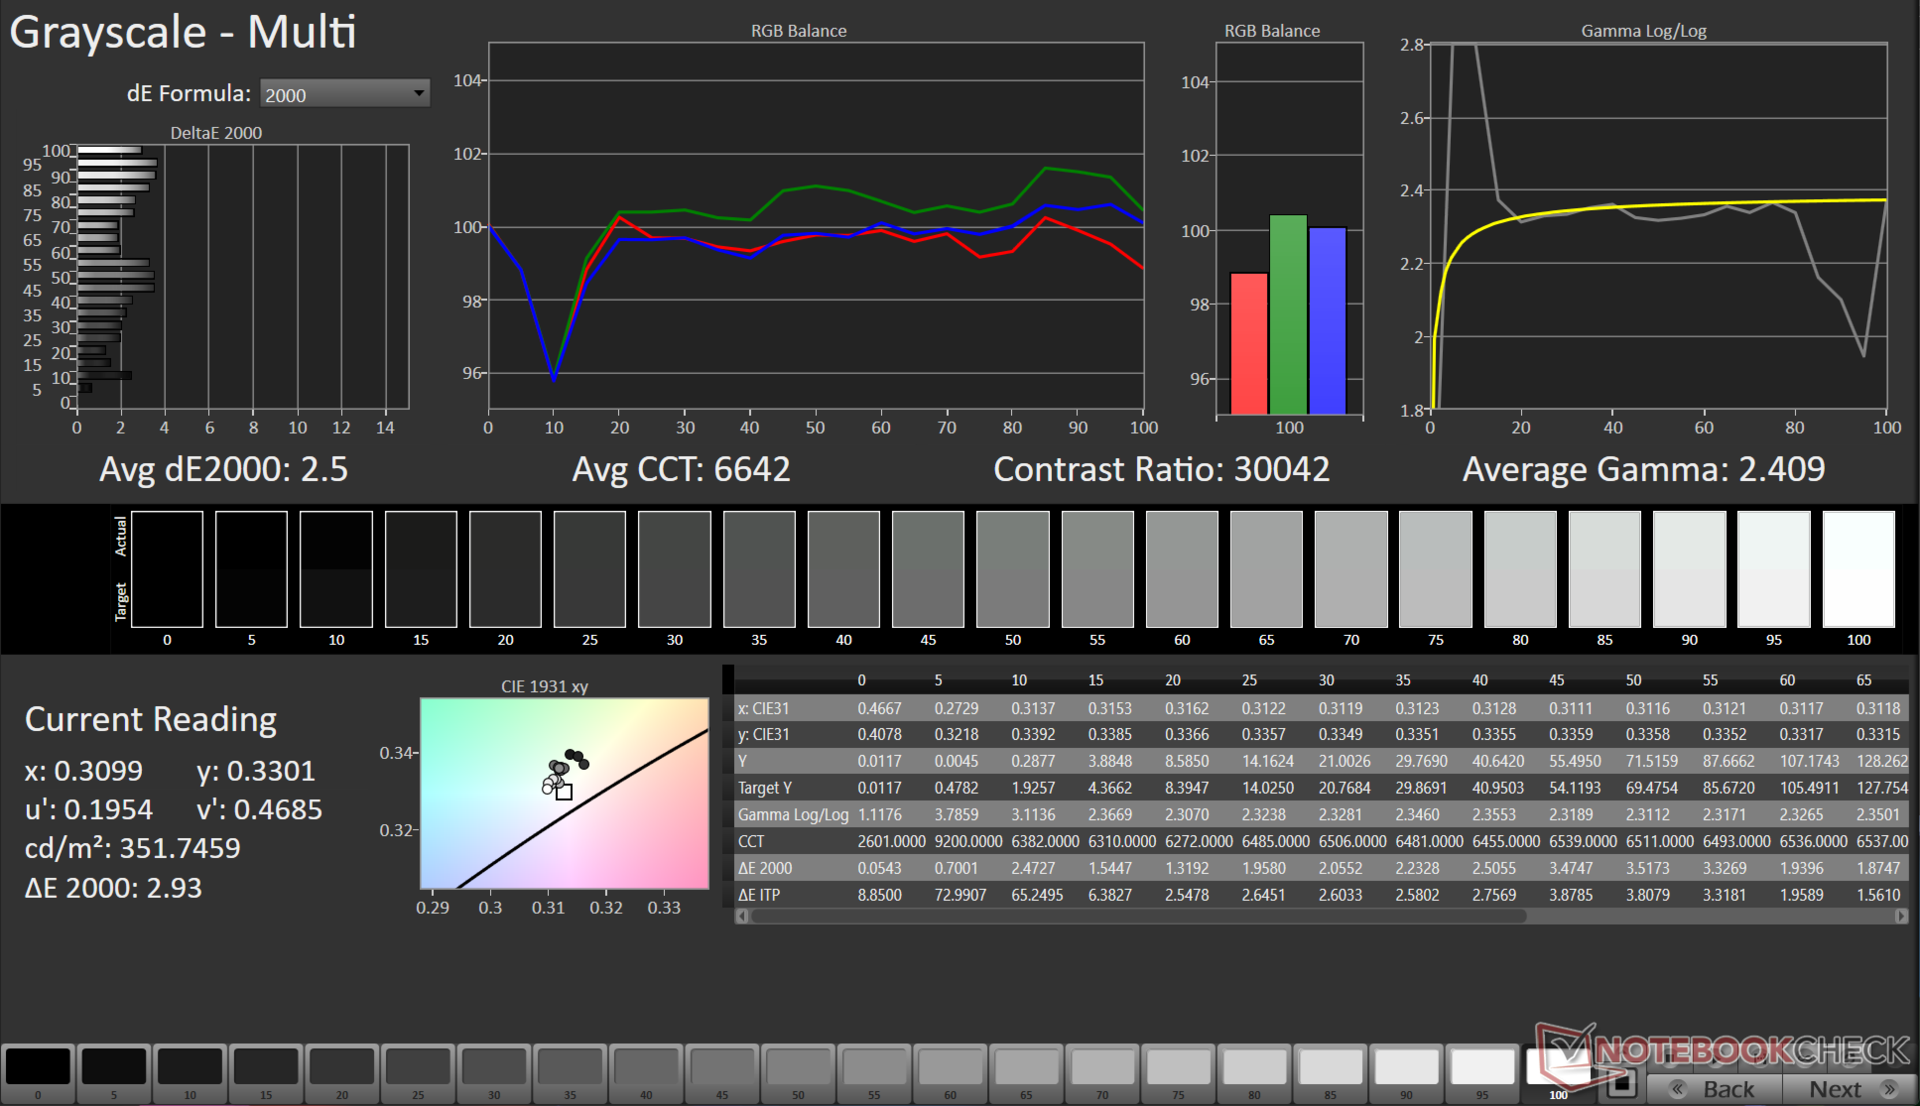
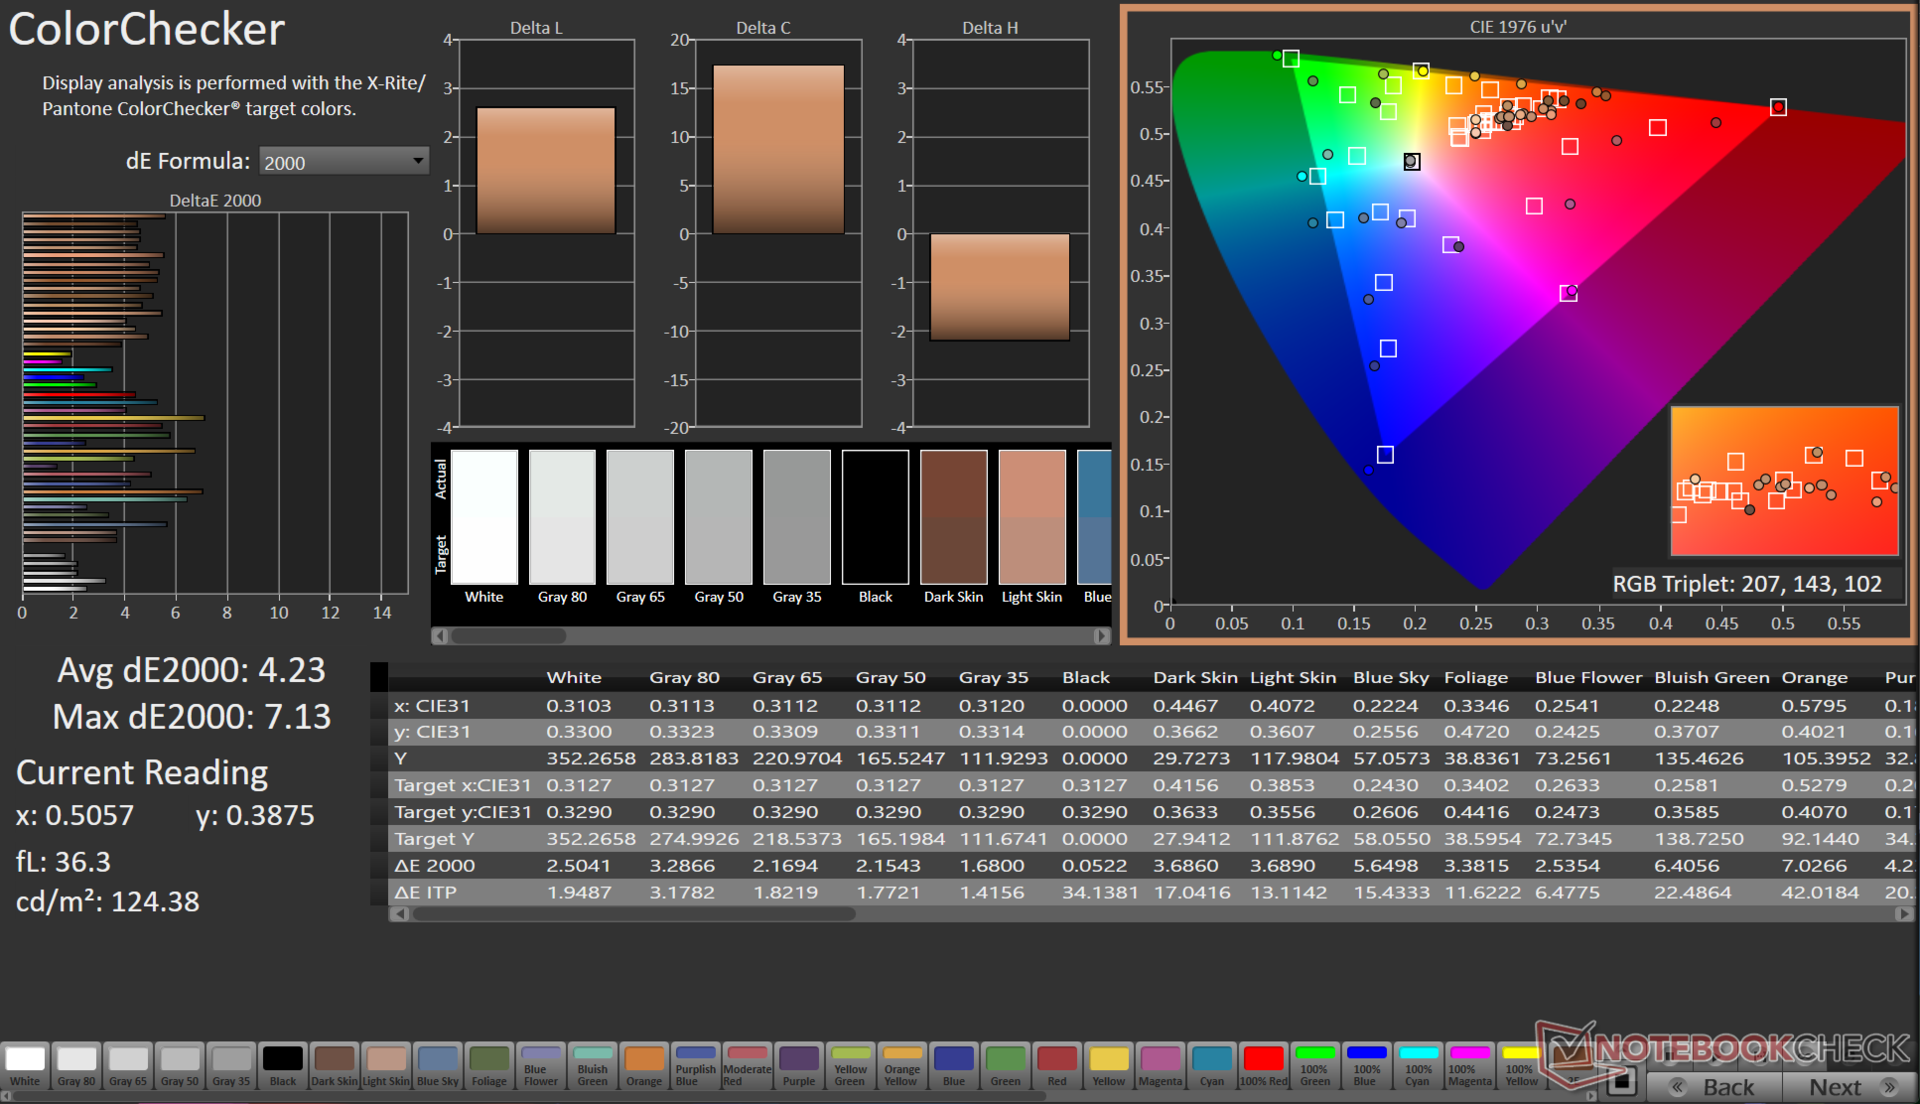
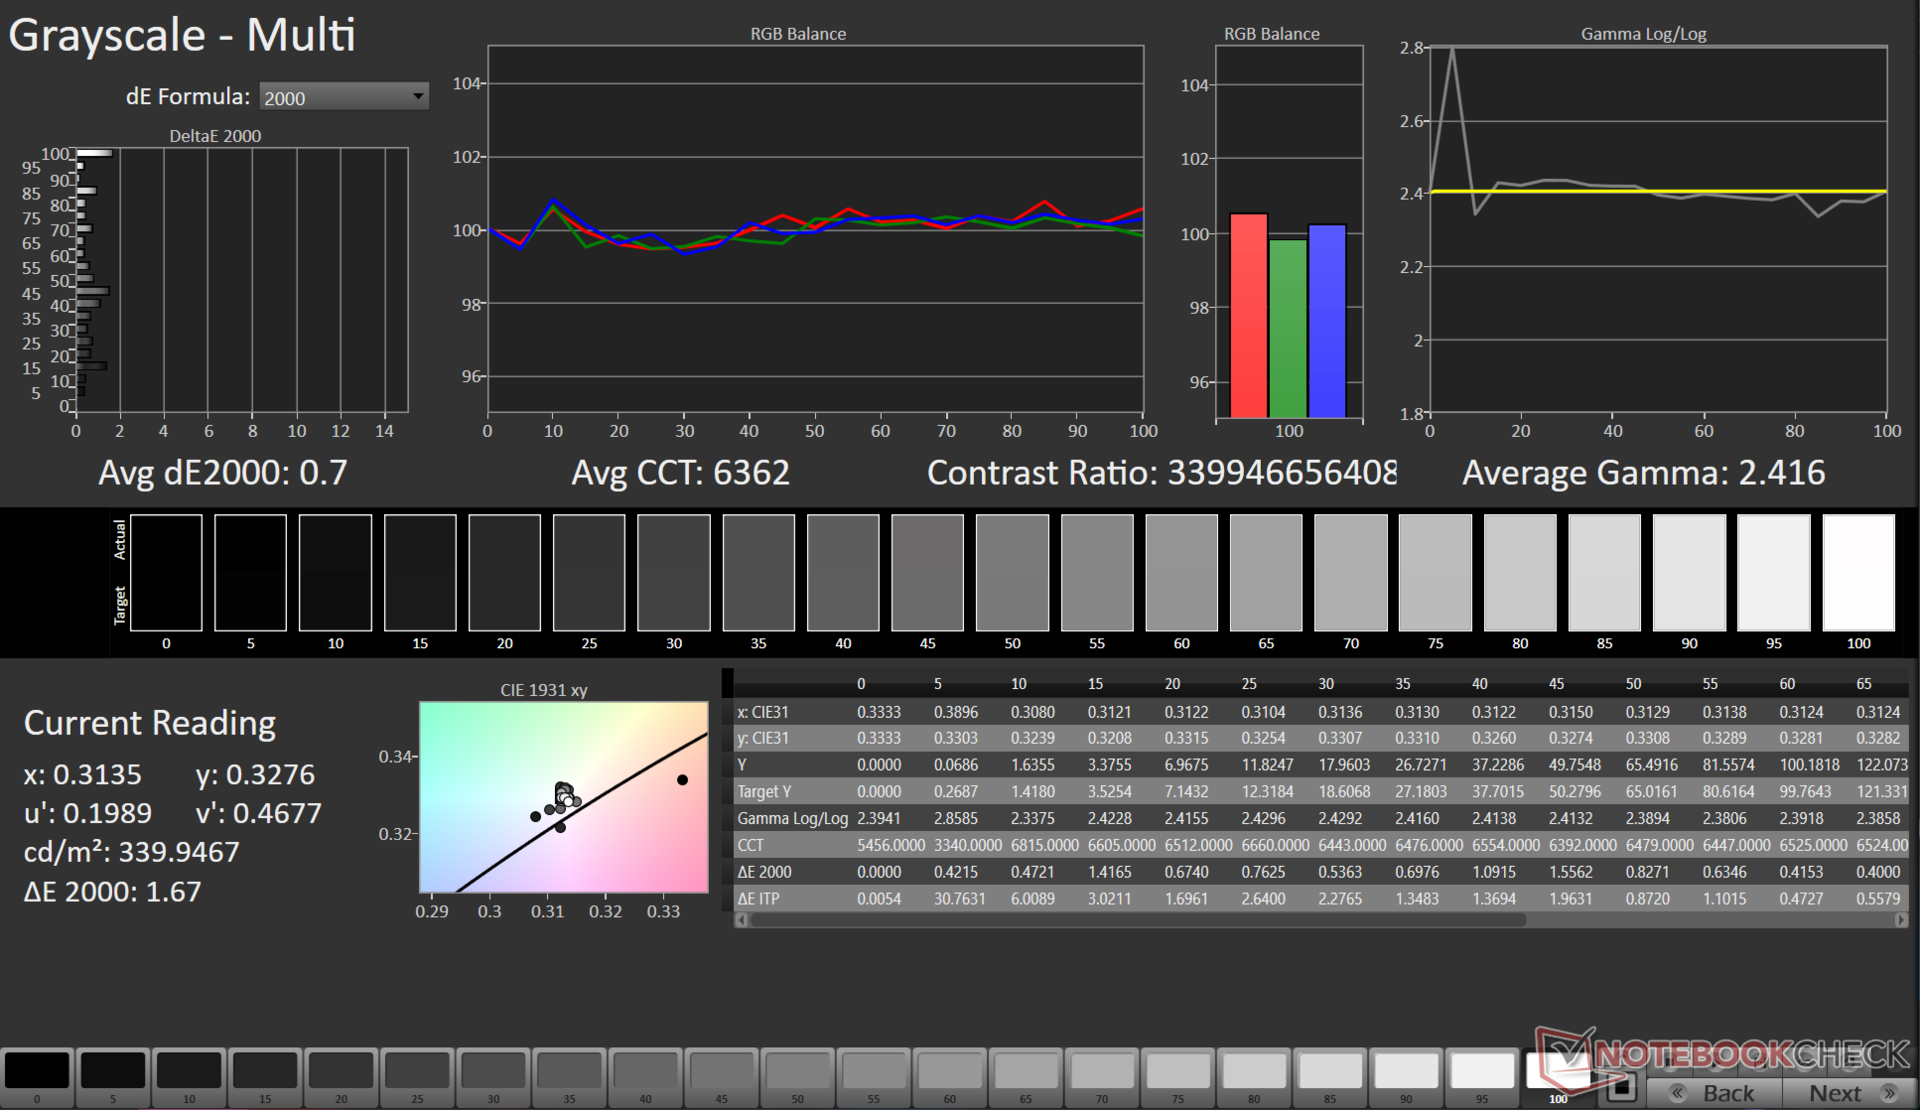
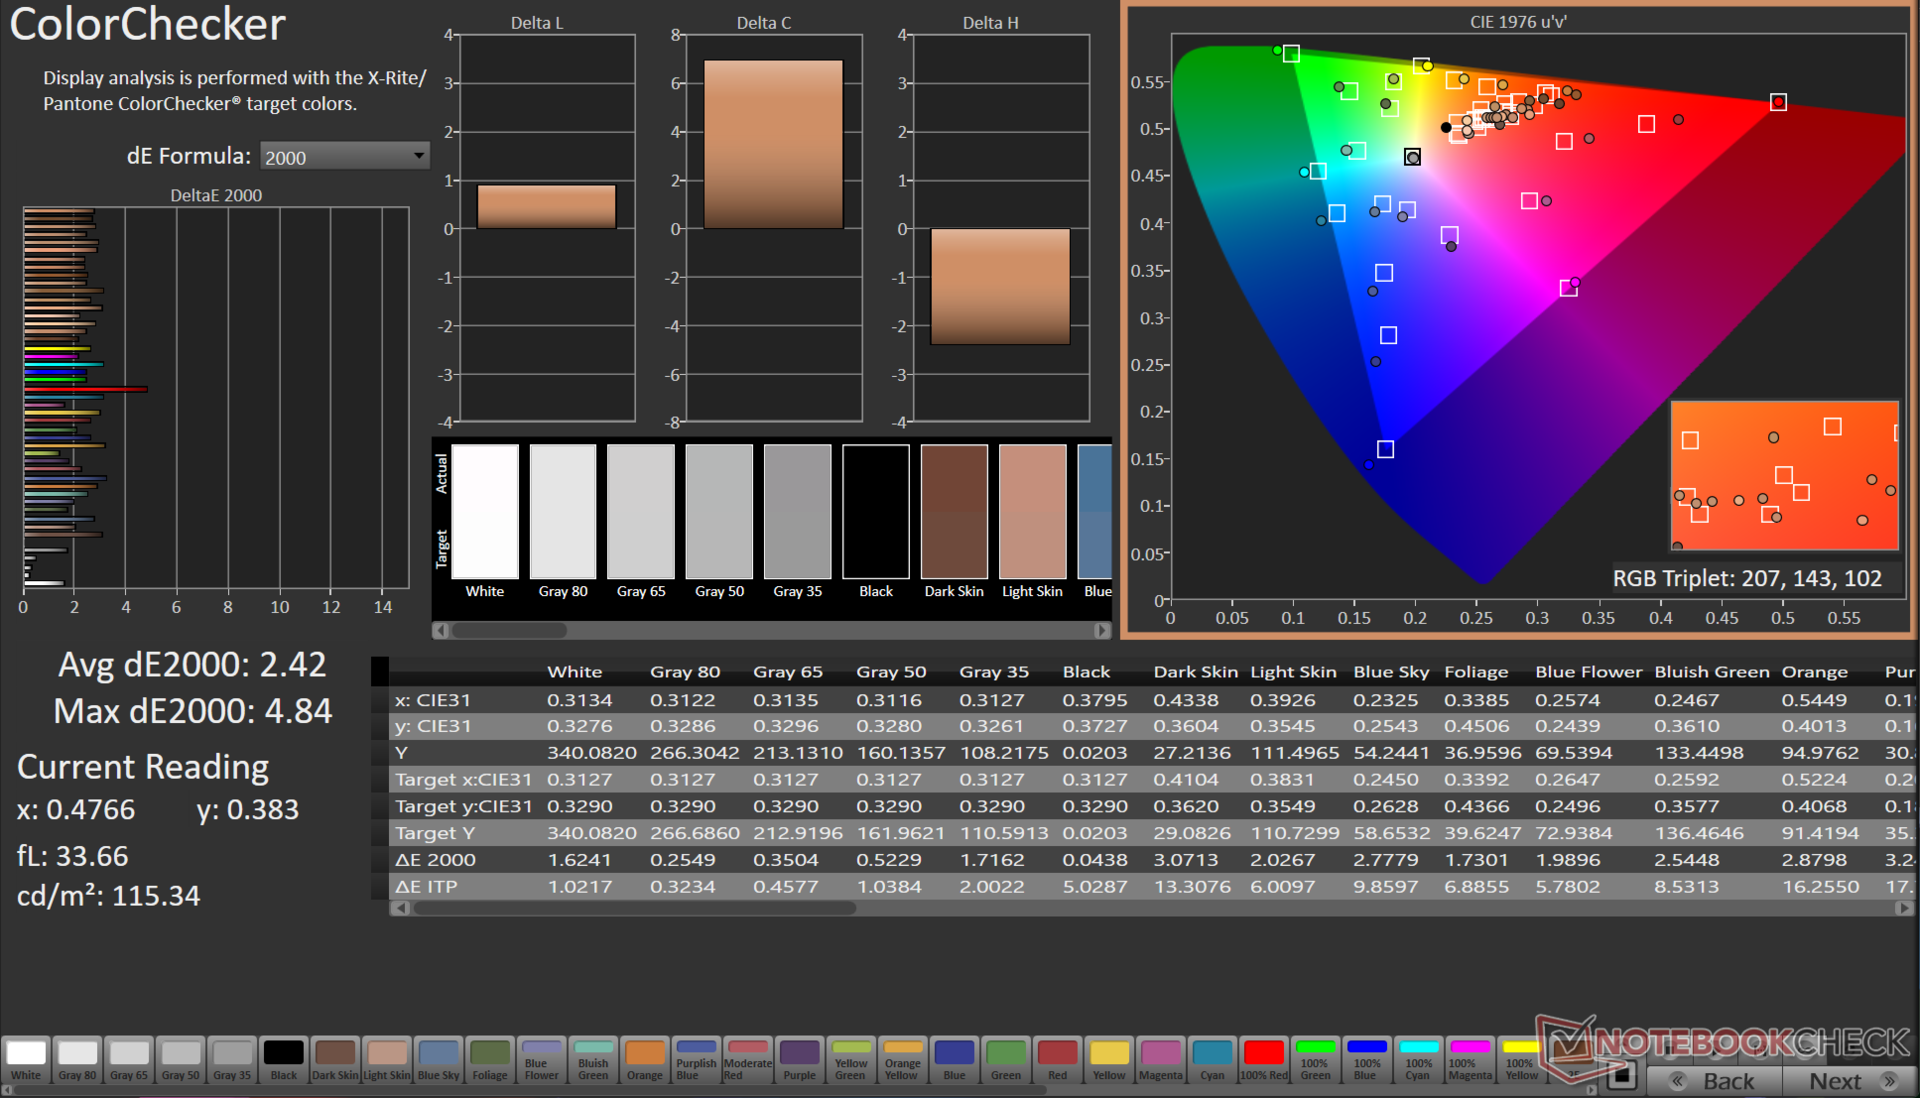
ΔE ColorChecker Calman: 4.23 | ∀{0.5-29.43 Ø4.71}
calibrated: 2.42
ΔE Greyscale Calman: 2.5 | ∀{0.09-98 Ø4.96}
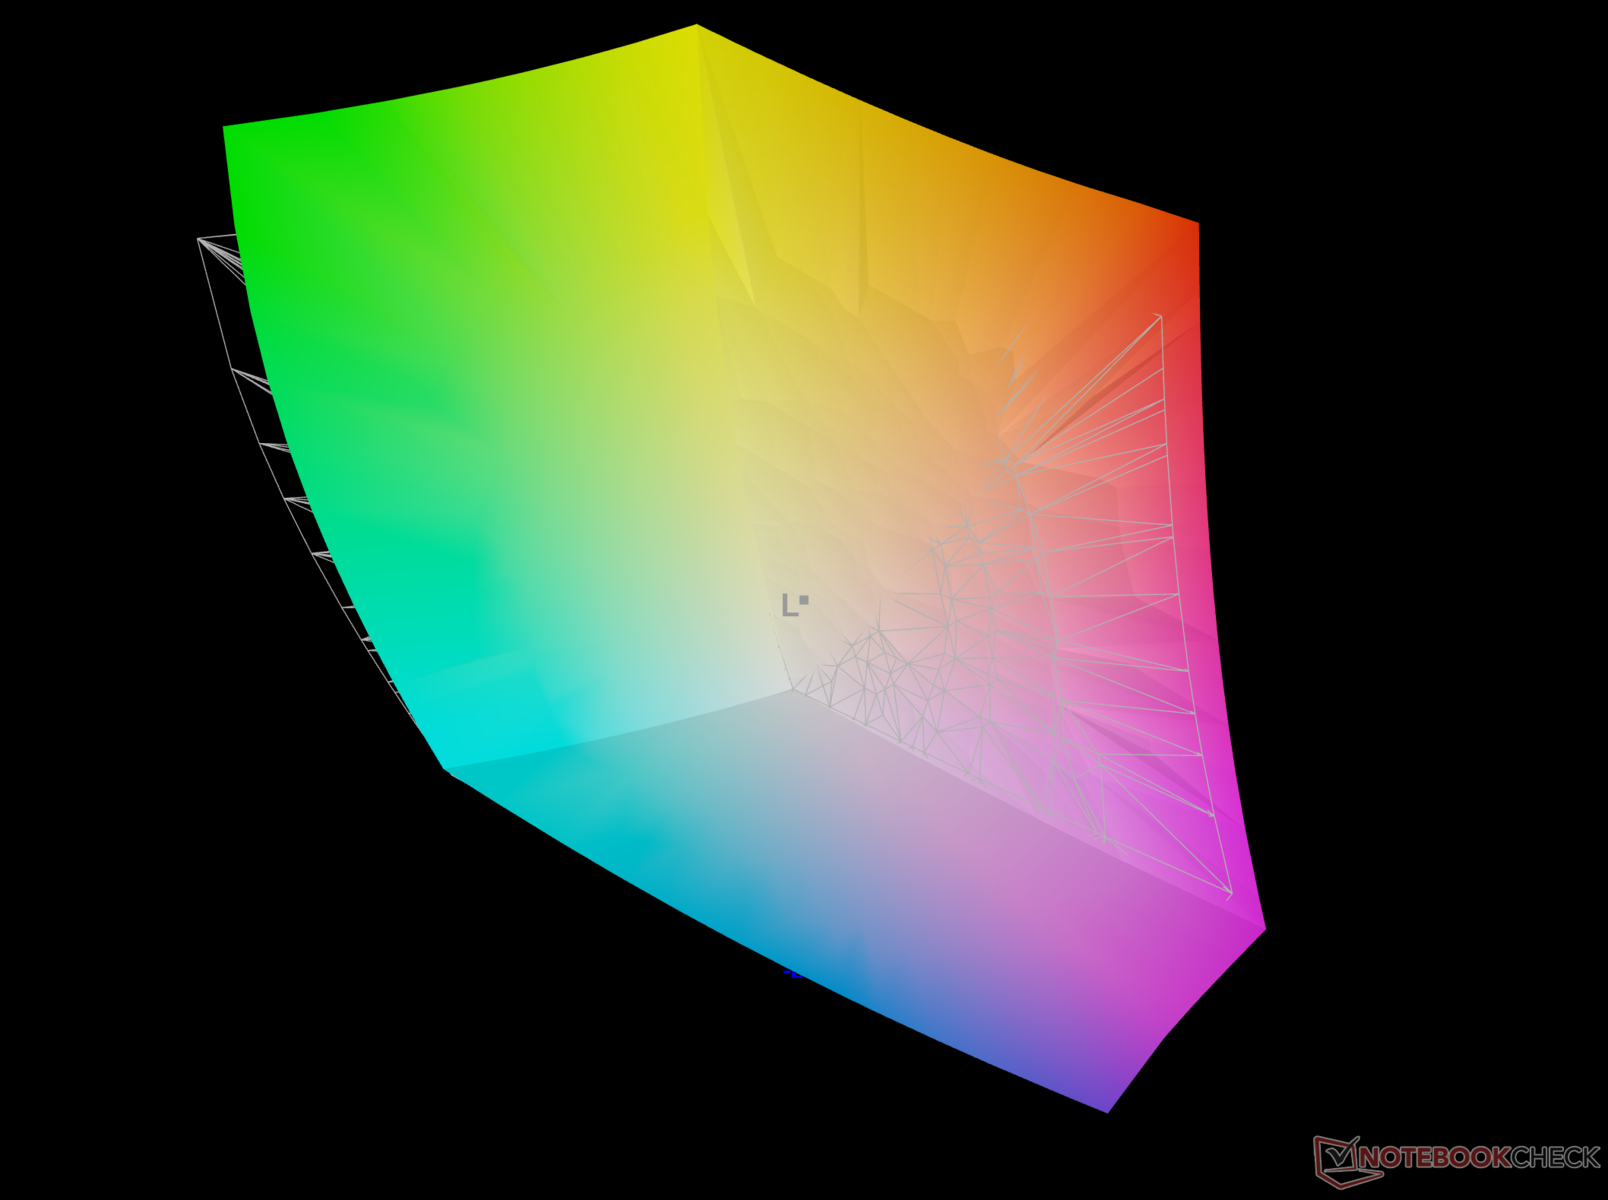
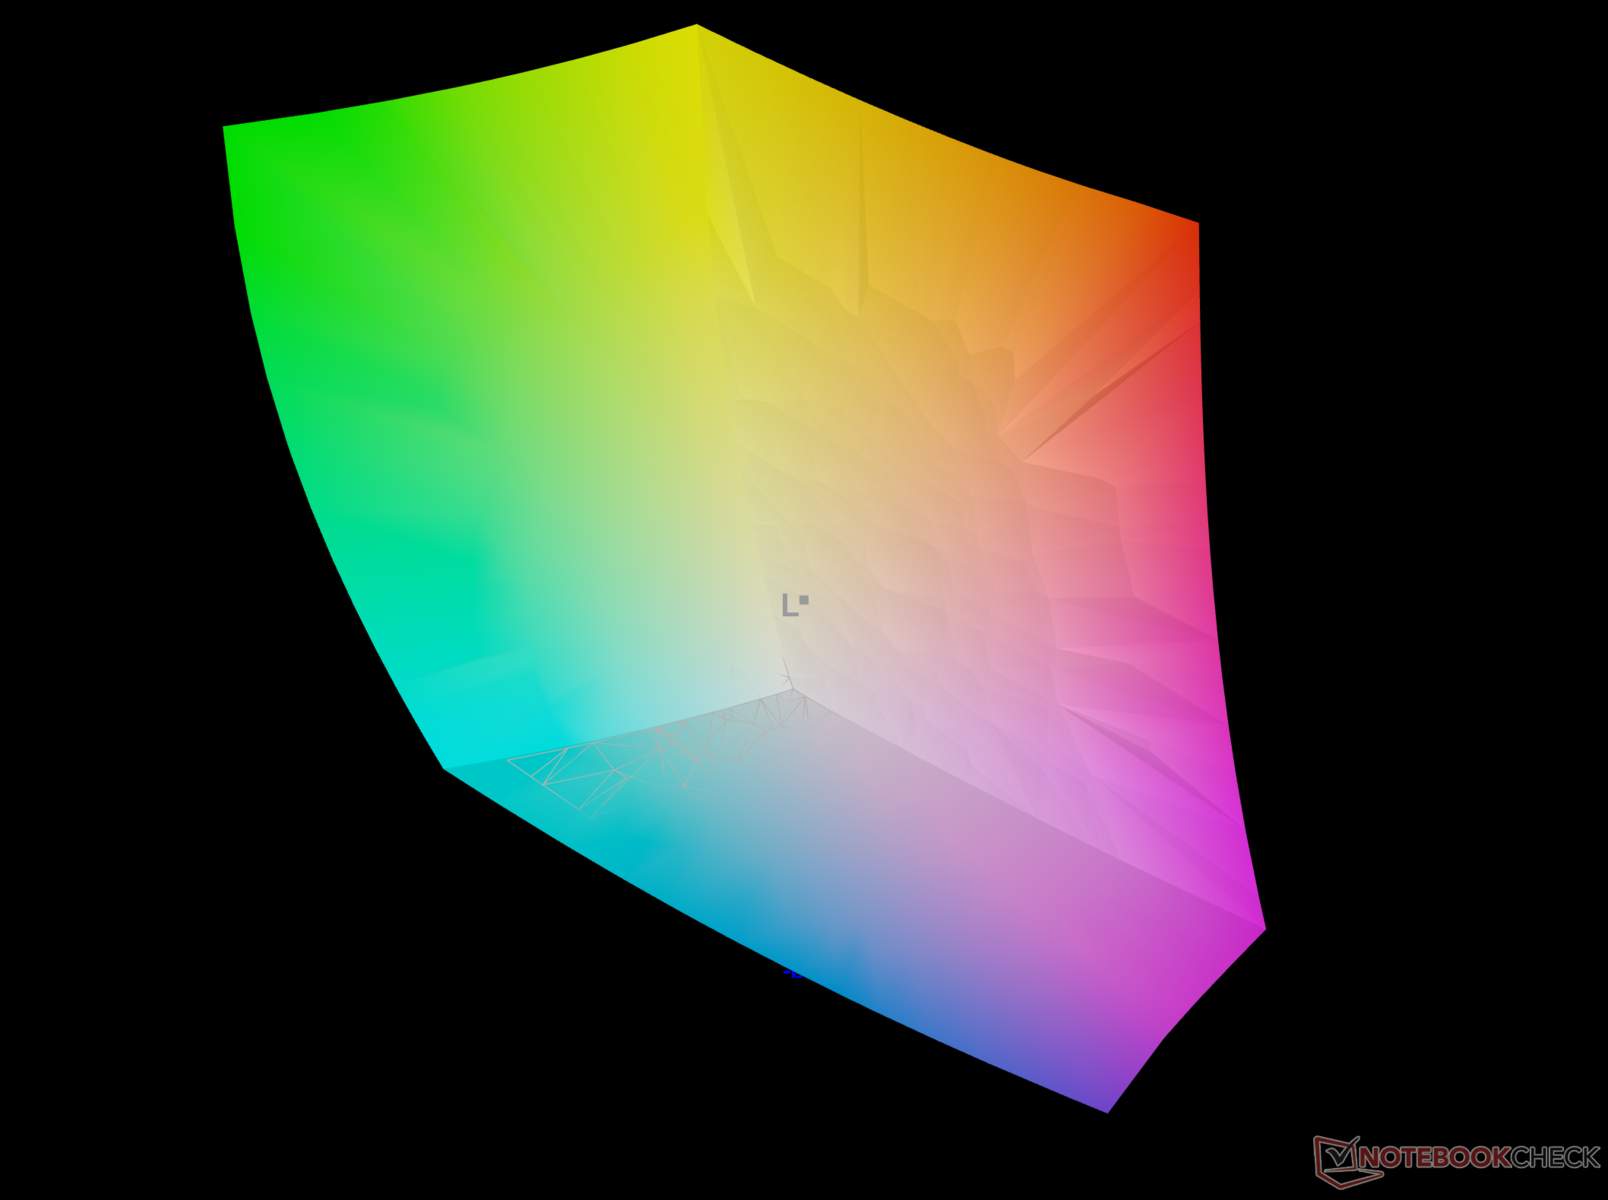
96.5% AdobeRGB 1998 (Argyll 3D)
99.7% sRGB (Argyll 3D)
98.7% Display P3 (Argyll 3D)
Gamma: 2.4
CCT: 6642 K
| Asus VivoBook Pro 16 K6602VU Samsung ATNA60BX01-1, OLED, 3200x2000, 16" | Asus Vivobook Pro 16X K6604JV-MX016W Samsung SDC4178 ATNA60BX01-1, OLED, 3200x2000, 16" | Gigabyte AERO 16 OLED BSF Samsung SDC4191 (ATNA60YV09-0, OLED, 3840x2400, 16" | Asus ROG Flow X16 GV601V TMX1603 (TL160ADMP03-0), IPS, 2560x1600, 16" | Lenovo Legion Pro 5 16ARX8 (R5 7645HX, RTX 4050) CSOT T3 MNG007DA2-2, IPS, 2560x1600, 16" | Asus TUF Gaming A16 FA617XS BOE NE160WUM-NX2, IPS, 1920x1200, 16" | Asus VivoBook Pro 16 Au Optronics B160QAN02.L, IPS, 2560x1600, 16" | |
|---|---|---|---|---|---|---|---|
| Display | -0% | 0% | -5% | -17% | -20% | -4% | |
| Display P3 Coverage (%) | 98.7 | 98.4 0% | 99.9 1% | 96.61 -2% | 71.6 -27% | 69.3 -30% | 98.5 0% |
| sRGB Coverage (%) | 99.7 | 99.7 0% | 100 0% | 99.92 0% | 99.8 0% | 97.3 -2% | 99.9 0% |
| AdobeRGB 1998 Coverage (%) | 96.5 | 95.8 -1% | 96.4 0% | 84.63 -12% | 72.9 -24% | 70.7 -27% | 86.1 -11% |
| Response Times | -23% | -55% | -209% | -802% | -1085% | -78% | |
| Response Time Grey 50% / Grey 80% * (ms) | 0.68 ? | 1.6 ? -135% | 2 ? -194% | 3.8 ? -459% | 12 ? -1665% | 15.6 ? -2194% | 2 ? -194% |
| Response Time Black / White * (ms) | 13.2 ? | 1.4 ? 89% | 1.98 ? 85% | 7.6 ? 42% | 5.2 ? 61% | 10 ? 24% | 8 ? 39% |
| PWM Frequency (Hz) | 240 ? | 120 ? | 60 | ||||
| Screen | 23% | 23% | 24% | 45% | 18% | 24% | |
| Brightness middle (cd/m²) | 353 | 347 -2% | 389.97 10% | 486 38% | 543 54% | 301 -15% | 504 43% |
| Brightness (cd/m²) | 354 | 346 -2% | 395 12% | 469 32% | 516 46% | 294 -17% | 465 31% |
| Brightness Distribution (%) | 98 | 97 -1% | 97 -1% | 91 -7% | 87 -11% | 94 -4% | 87 -11% |
| Black Level * (cd/m²) | 0.06 | 0.03 | 0.39 | 0.58 | 0.21 | 0.35 | |
| Colorchecker dE 2000 * | 4.23 | 1.89 55% | 2 53% | 2.27 46% | 1.35 68% | 1.79 58% | 1.83 57% |
| Colorchecker dE 2000 max. * | 7.13 | 3.26 54% | 4.1 42% | 5.73 20% | 3.22 55% | 3.48 51% | 5.51 23% |
| Colorchecker dE 2000 calibrated * | 2.42 | 1.97 19% | 1.68 31% | 0.6 75% | 1.31 46% | 1.2 50% | 1.34 45% |
| Greyscale dE 2000 * | 2.5 | 1.55 38% | 2.23 11% | 3.36 -34% | 1.03 59% | 2.5 -0% | 3.02 -21% |
| Gamma | 2.4 92% | 2.39 92% | 2.41 91% | 2.46 89% | 2.38 92% | 2.265 97% | 2.39 92% |
| CCT | 6642 98% | 6458 101% | 6323 103% | 6625 98% | 6452 101% | 6157 106% | 6688 97% |
| Contrast (:1) | 5783 | 12999 | 1246 | 936 | 1433 | 1440 | |
| Toplam Ortalama (Program / Ayarlar) | 0% /
10% | -11% /
4% | -63% /
-22% | -258% /
-112% | -362% /
-176% | -19% /
0% |
* ... daha küçük daha iyidir
Renk ölçümleri ve kalibrasyonu Normal modda yerel renk profiliyle ve Display P3 renk alanında gerçekleştirilmiştir.
Panel, etkileyici %96,5 Adobe RGB kapsamının yanı sıra sRGB ve Display P3 renk gamlarının tamamını aşağı yukarı kapsıyor. Geniş gam desteği, VivoBook Pro 16'nın ekranını hem multimedya tüketimi hem de içerik oluşturma için oldukça elverişli hale getiriyor.

Kutudan çıkar çıkmaz, VivoBook Pro 16'nın renk doğruluğu, ColorChecker testimizde ideal ortalama Delta E değerlerinden daha yüksek olan iyileştirme için yer gösteriyor.
X-Rite i1Basic Pro 3 spektrofotometre ve Portrait Displays'in Calman Ultimate yazılımını kullanan kalibrasyon rutinimiz Gri Tonlama (0,7) ve ColorChecker Delta E 2000 (2,42) değerlerini önemli ölçüde iyileştiriyor.
Bununla birlikte, özellikle tam doymuş kırmızı tonlar ve belirli cilt tonlarında bazı küçük renk yorumlama sorunları devam etmektedir.
Kalibre edilmiş ICC dosyası yukarıdaki bağlantıdan indirilebilir.
Yanıt Sürelerini Görüntüle
| ↔ Tepki Süresi Siyahtan Beyaza | ||
|---|---|---|
| 13.2 ms ... yükseliş ↗ ve sonbahar↘ birleşimi | ↗ 10.8 ms yükseliş | 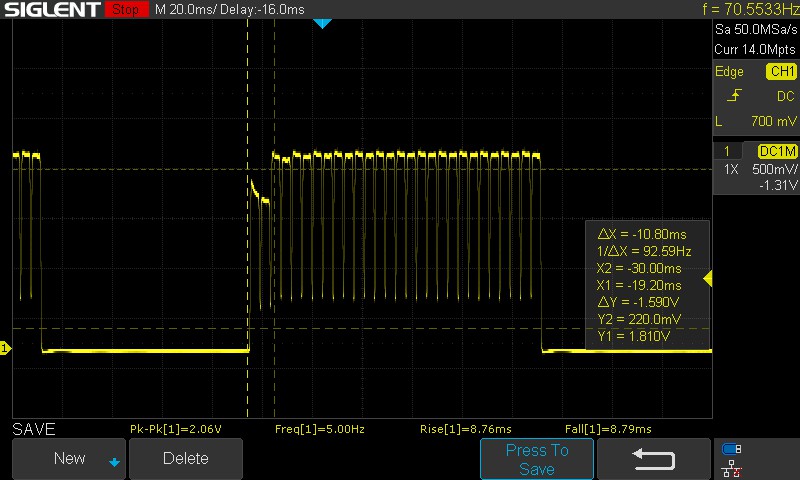 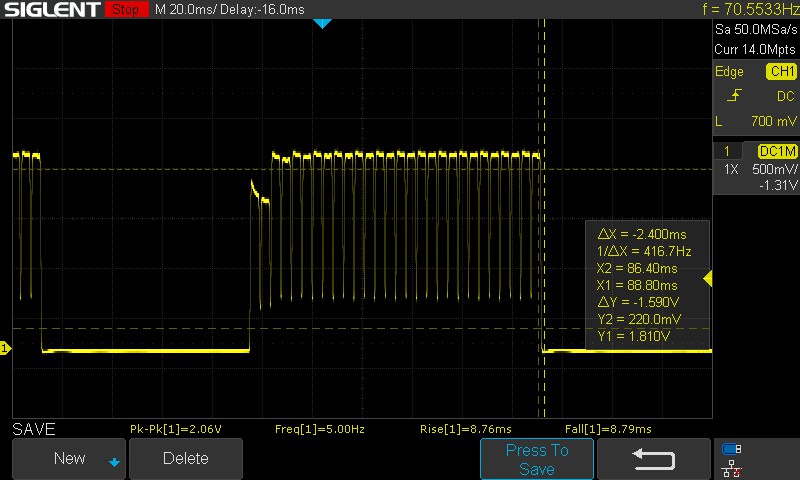 |
| ↘ 2.4 ms sonbahar | ||
| Ekran, testlerimizde iyi yanıt oranları gösteriyor ancak rekabetçi oyuncular için çok yavaş olabilir. Karşılaştırıldığında, test edilen tüm cihazlar 0.1 (minimum) ile 240 (maksimum) ms arasında değişir. » Tüm cihazların 34 %'si daha iyi. Bu, ölçülen yanıt süresinin test edilen tüm cihazların ortalamasından (19.8 ms) daha iyi olduğu anlamına gelir. | ||
| ↔ Tepki Süresi %50 Griden %80 Griye | ||
| 0.68 ms ... yükseliş ↗ ve sonbahar↘ birleşimi | ↗ 0.32 ms yükseliş | 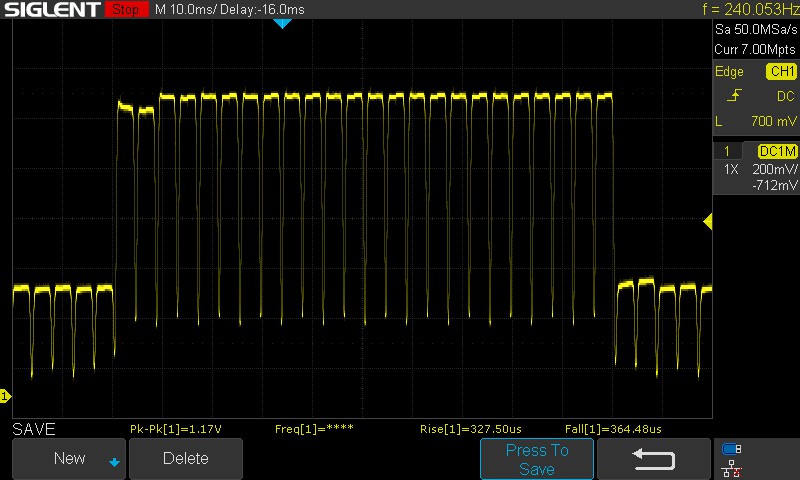 |
| ↘ 0.36 ms sonbahar | ||
| Ekran, testlerimizde çok hızlı yanıt oranları gösteriyor ve hızlı oyun oynamaya çok uygun olmalı. Karşılaştırıldığında, test edilen tüm cihazlar 0.165 (minimum) ile 636 (maksimum) ms arasında değişir. » Tüm cihazların 2 %'si daha iyi. Bu, ölçülen yanıt süresinin test edilen tüm cihazların ortalamasından (31 ms) daha iyi olduğu anlamına gelir. | ||
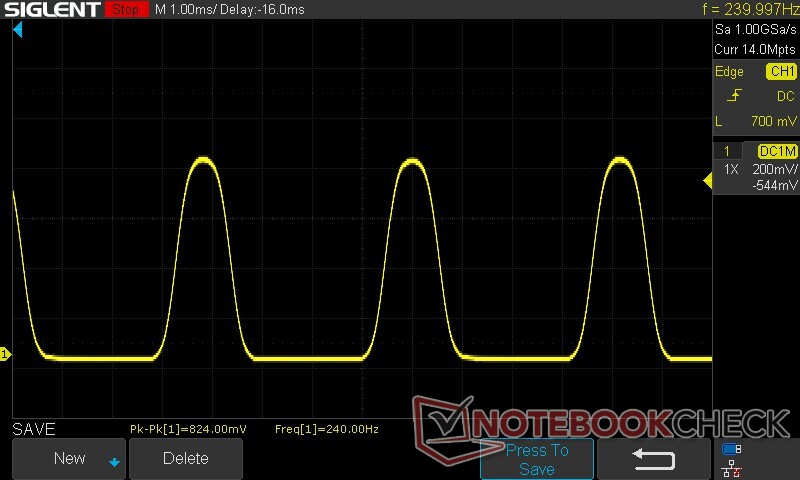
100 siyahtan %100 beyaza geçiş manuel tahminle yaklaşık 13,2 ms sürüyor ki bu çok da kötü değil. 50 griden %80 griye geçişler yaklaşık 0,68 ms ile çok daha hızlıdır.
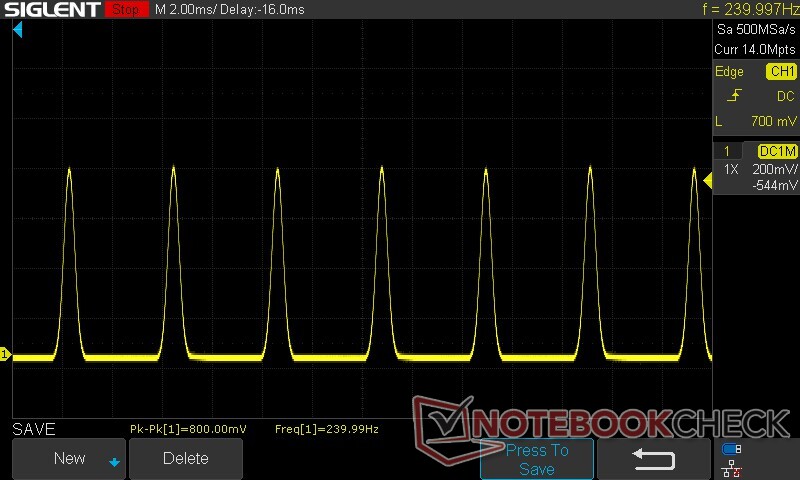
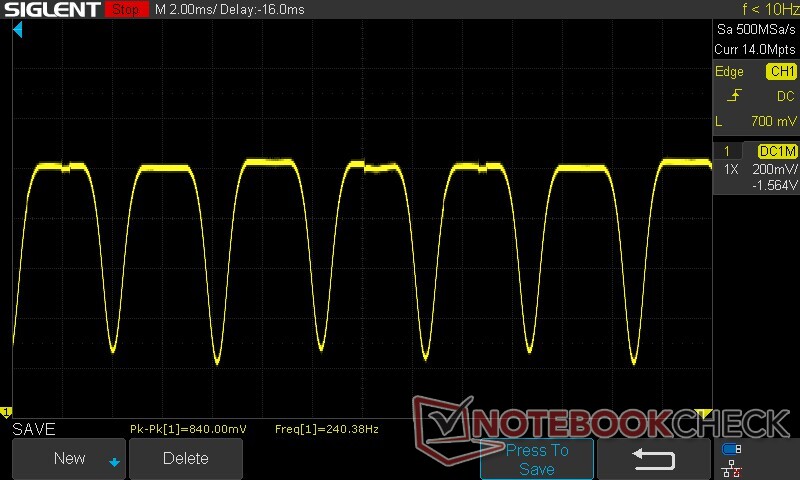
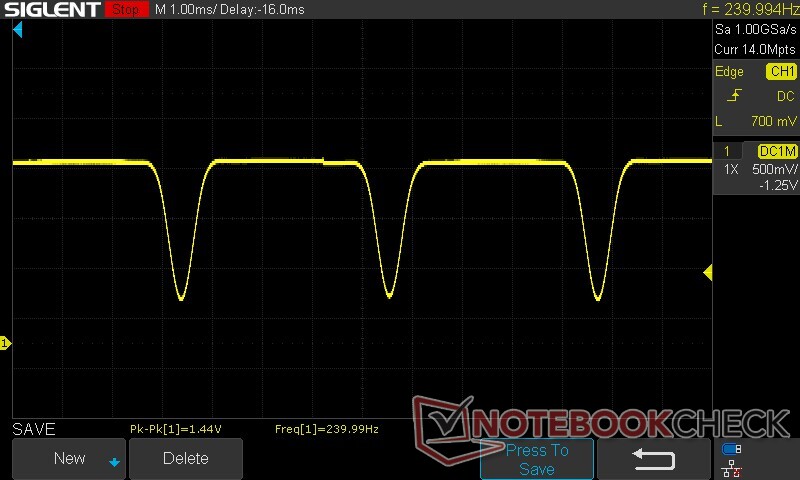
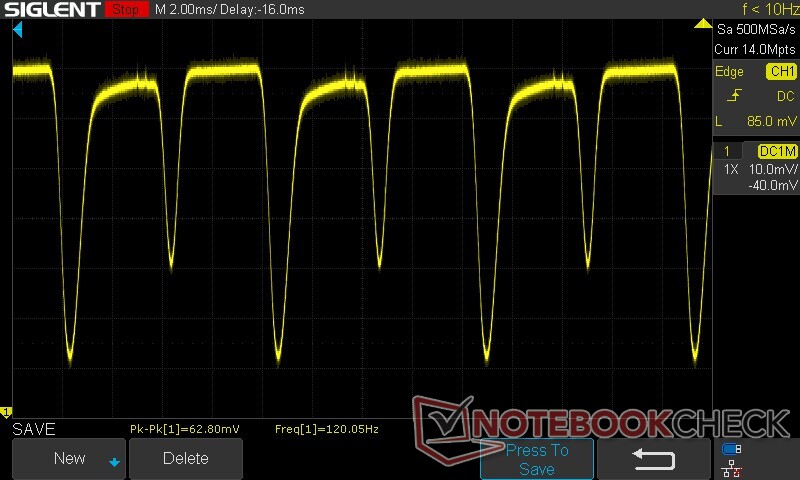
Ekran Titremesi / PWM (Darbe Genişliği Modülasyonu)
| Ekran titriyor / PWM algılandı | 240 Hz | ≤ 100 % parlaklık ayarı | 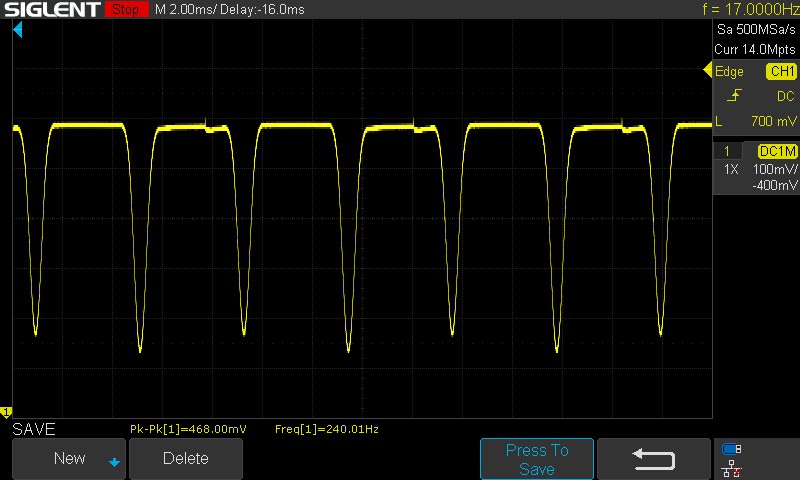 |
Ekran arka ışığı 240 Hz'de titriyor (en kötü durum, örneğin PWM kullanılması) 100 % ve altındaki parlaklık ayarında titreme algılandı. Bu parlaklık ayarının üzerinde titreme veya PWM olmamalıdır. 240 Hz frekansı nispeten düşüktür, bu nedenle hassas kullanıcılar belirtilen parlaklık ayarında ve altında muhtemelen titremeyi fark edecek ve göz yorgunluğu yaşayacaktır. Karşılaştırıldığında: Test edilen tüm cihazların %52 %'si ekranı karartmak için PWM kullanmıyor. PWM tespit edilirse, ortalama 7757 (minimum: 5 - maksimum: 343500) Hz ölçüldü. | |||
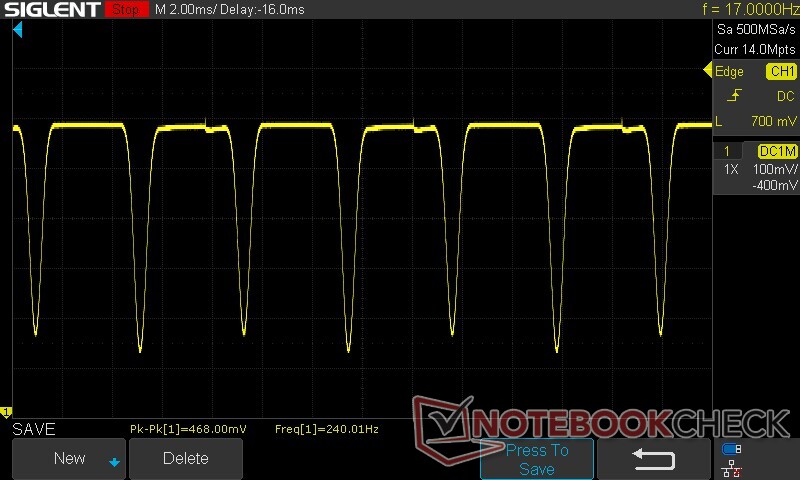
VivoBook Pro 16'nın OLED paneli, %60 parlaklığın altında 240 Hz PWM uygular ve bu eşiğin üzerinde 240 Hz DC karartmaya geçer. PWM'den daha az yorucu olsa da, daha yüksek frekanslı bir DC karartma tercih edilebilirdi.
60 Hz yenileme hızında DC karartma frekansı 120 Hz'e düşüyor. Olası göz yorgunluğunu azaltmak için parlaklığı %60'ın üzerine ayarlamanızı öneririz.
Daha fazla bilgiyi makalelerimizde bulabilirsiniz, "PWM neden bu kadar baş ağrısıdır?" ve "Analiz: DC Karartma vs PWM - AMOLED ekranları titreme olmadan karartabilir misiniz?". Ayrıca, incelenen cihazlarda ölçülen PWM'ye genel bir bakış için PWM Sıralama tablosu.
Parlak ekran, doğrudan güneş ışığı altında dış mekanda görüntülemeyi rahatsız edici hale getiriyor. Görüntüleme açıları sabittir, ancak OLED ekranlarda yaygın olduğu gibi aşırı açılarda bazı yeşil renk tonlamaları gözlemledik.
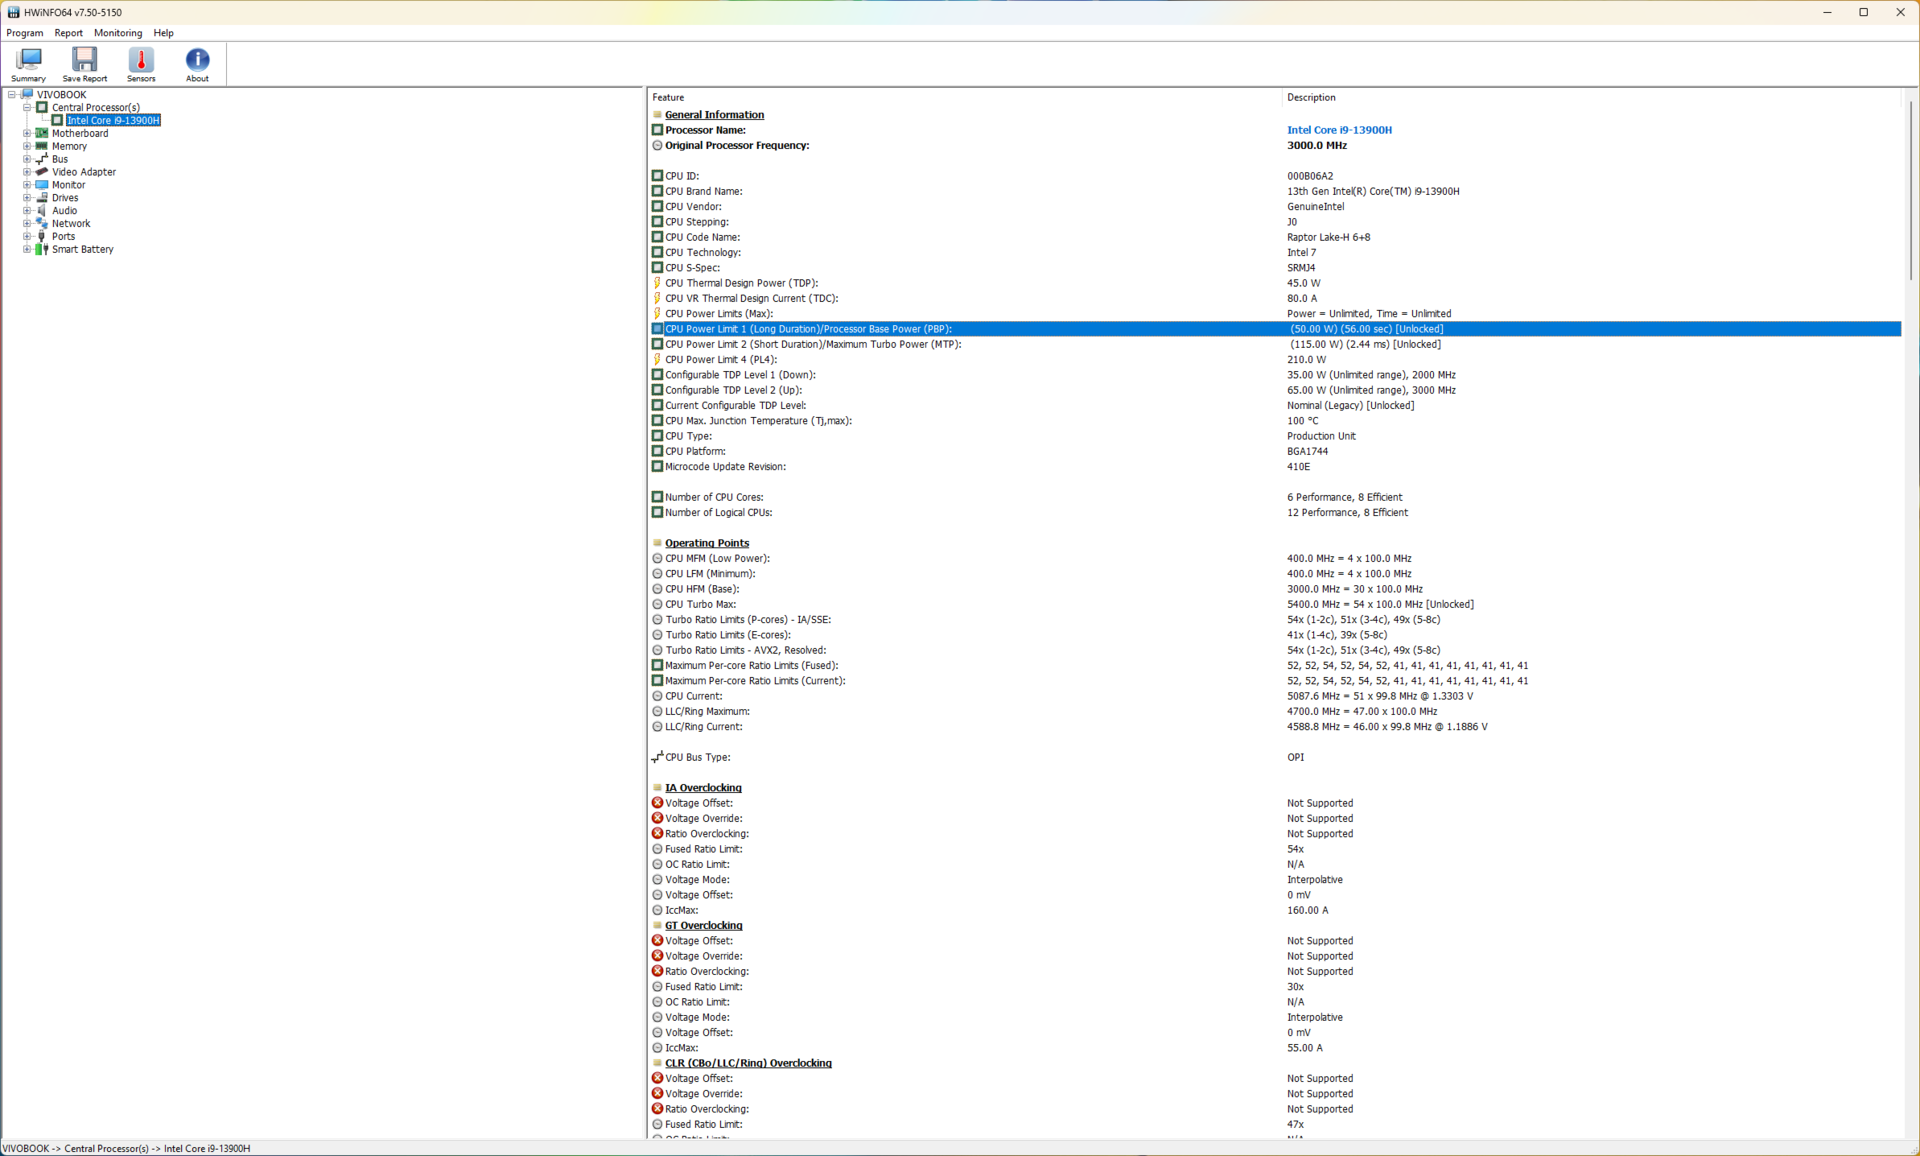
Performans: Core i9-13900H ve RTX 4050 kombinasyonu tam potansiyeliyle kullanılmıyor
Asus, Intel 13. nesil VivoBook Pro 16 K6602VU'yu sunuyor Core i5-13500H ve Core i9-13900H seçenekleri, her ikisi de Nvidia GeForce RTX 4050 grafikler. Ayrıca daha eski grafiklere sahip bir VivoBook Pro 16 K6602HC de mevcuttur Core i9-11900H, RTX 3050 Dizüstü Bilgisayar GPU'suve FHD+ 120 Hz ekrana sahiptir.
Test Koşulları
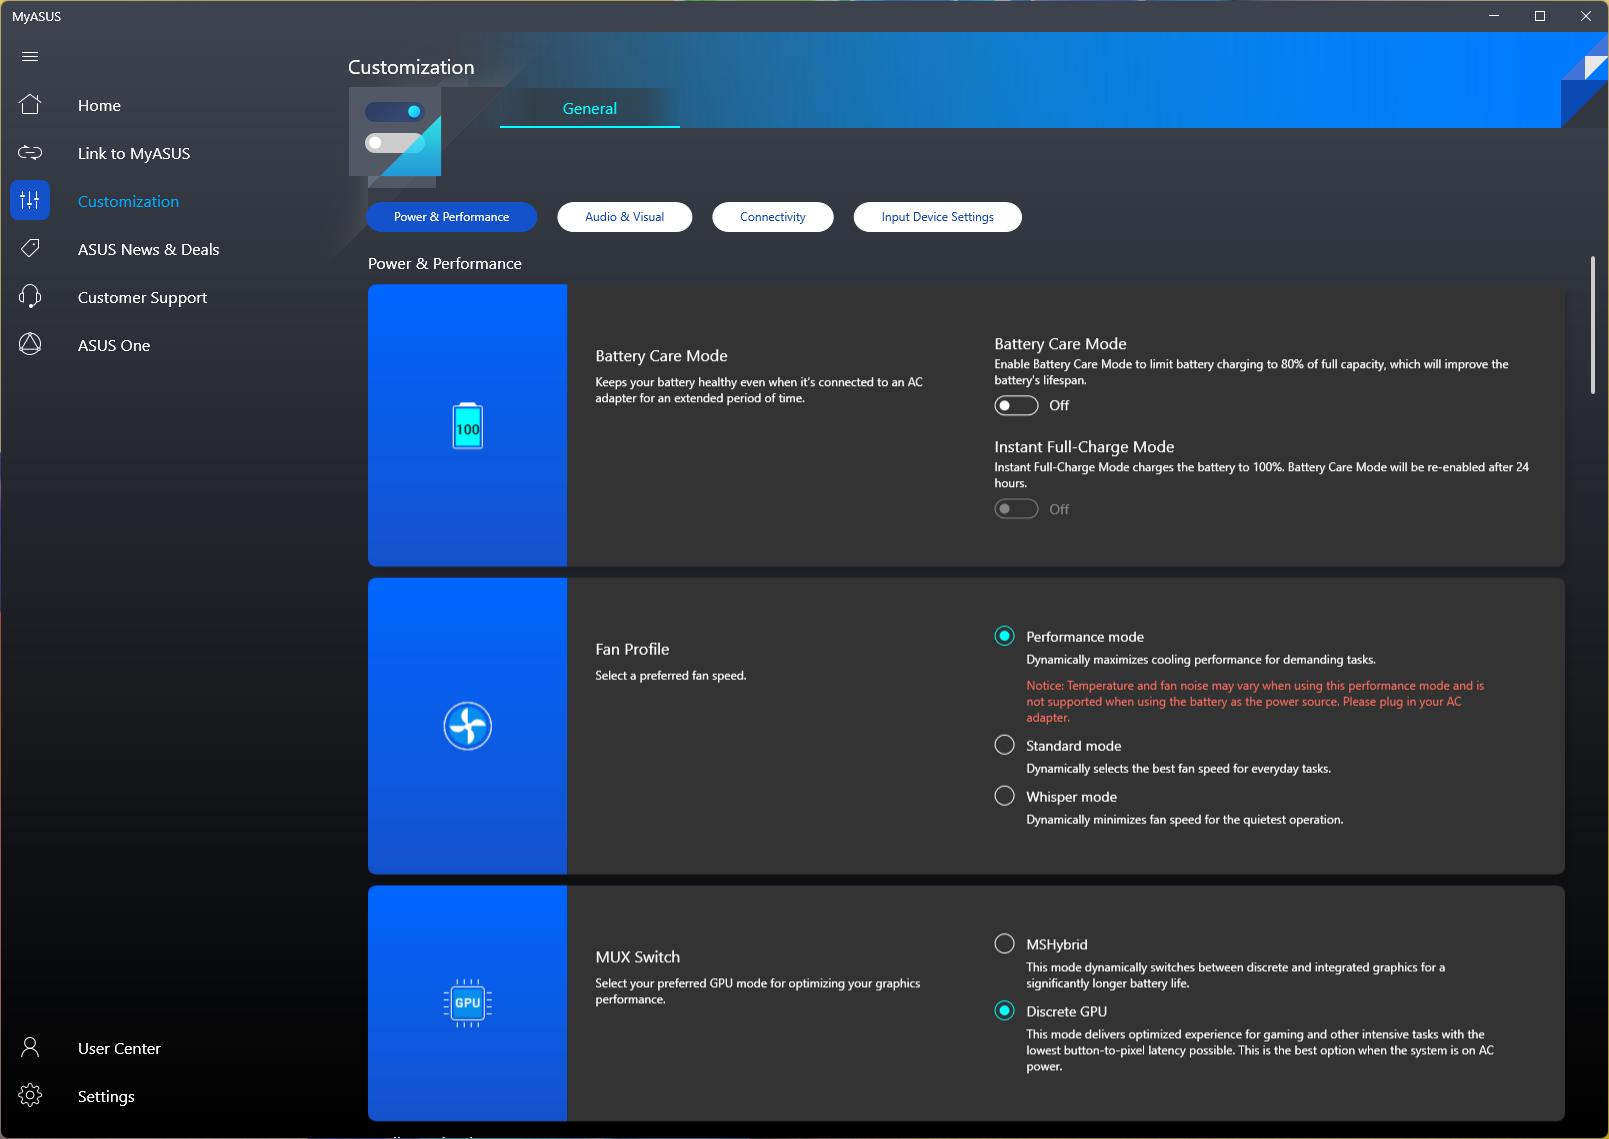
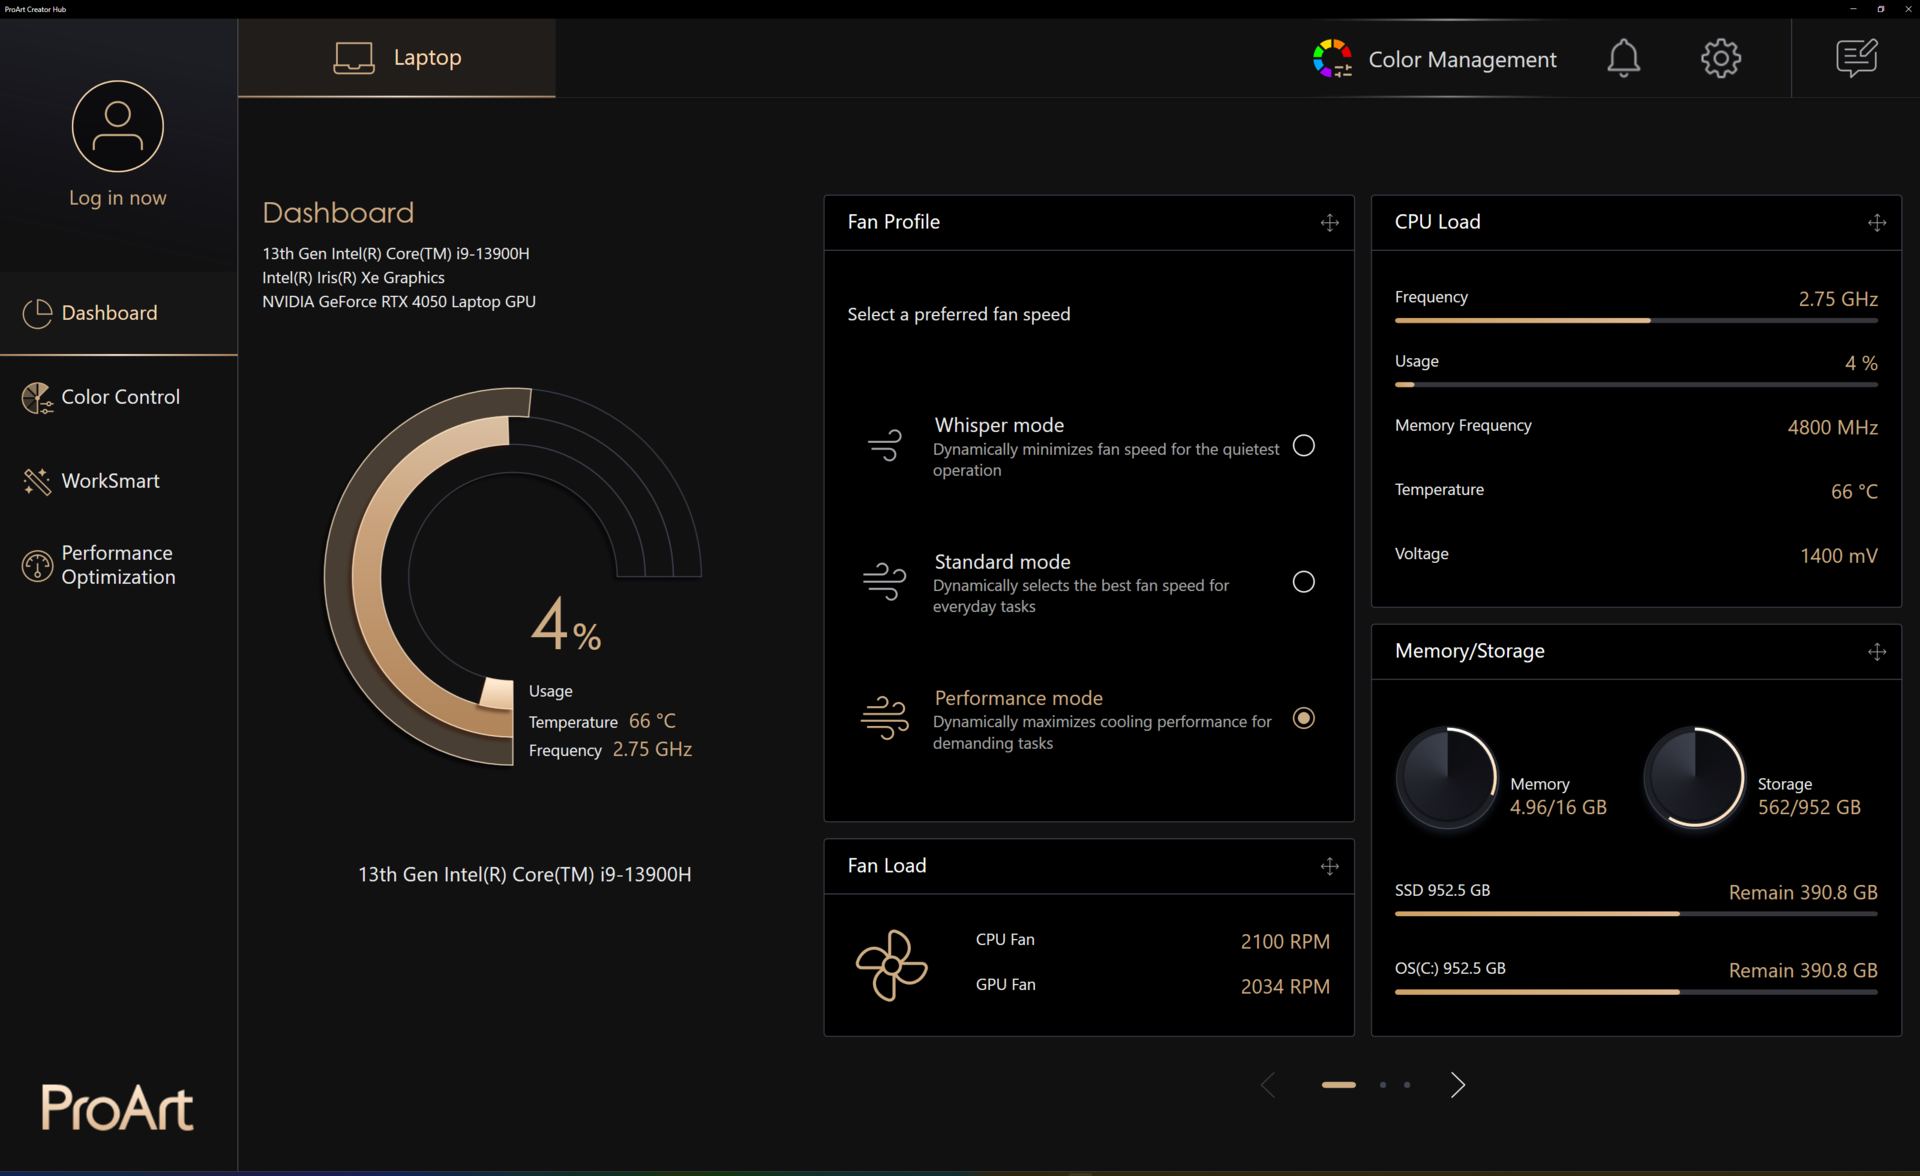
Performans ayarları hem MyAsus hem de ProArt Creator Hub uygulamalarında tekrarlanıyor. Tüm kıyaslamalar için MUX'un ayrı RTX 4050 GPU'ya geçtiği Performans modunu kullandık. Pil testleri MSHybrid modunda Whisper ayarında çalıştırıldı.
Güç sınırları hem Standart hem de Performans modlarında aynıdır. Bununla birlikte, ikincisi daha iyi soğutma sayesinde daha iyi sürdürülebilir performans sağlar.
| Performans modu | PL1 (PBP) / Tau | PL2 (MTP) / Tau | Cinebench R15 Çoklu skor | Cinebench R15 Çoklu skor (30 döngü) |
|---|---|---|---|---|
| Fısıltı | 25 W / 56 sn | 115 W / 2,44 ms | 1584 (-%36) | 766 (-%63) |
| Standart | 50 W / 56 sn | 115 W / 2,44 ms | 2445 (-%1,1) | 1748 (-%16) |
| Performans | 50 W / 56 sn | 115 W / 2,44 ms | 2473 (%100) | 2084 (%100) |
İşlemci
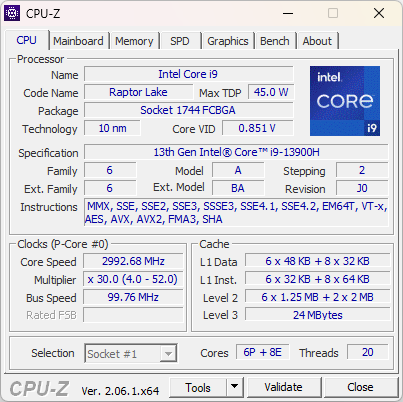
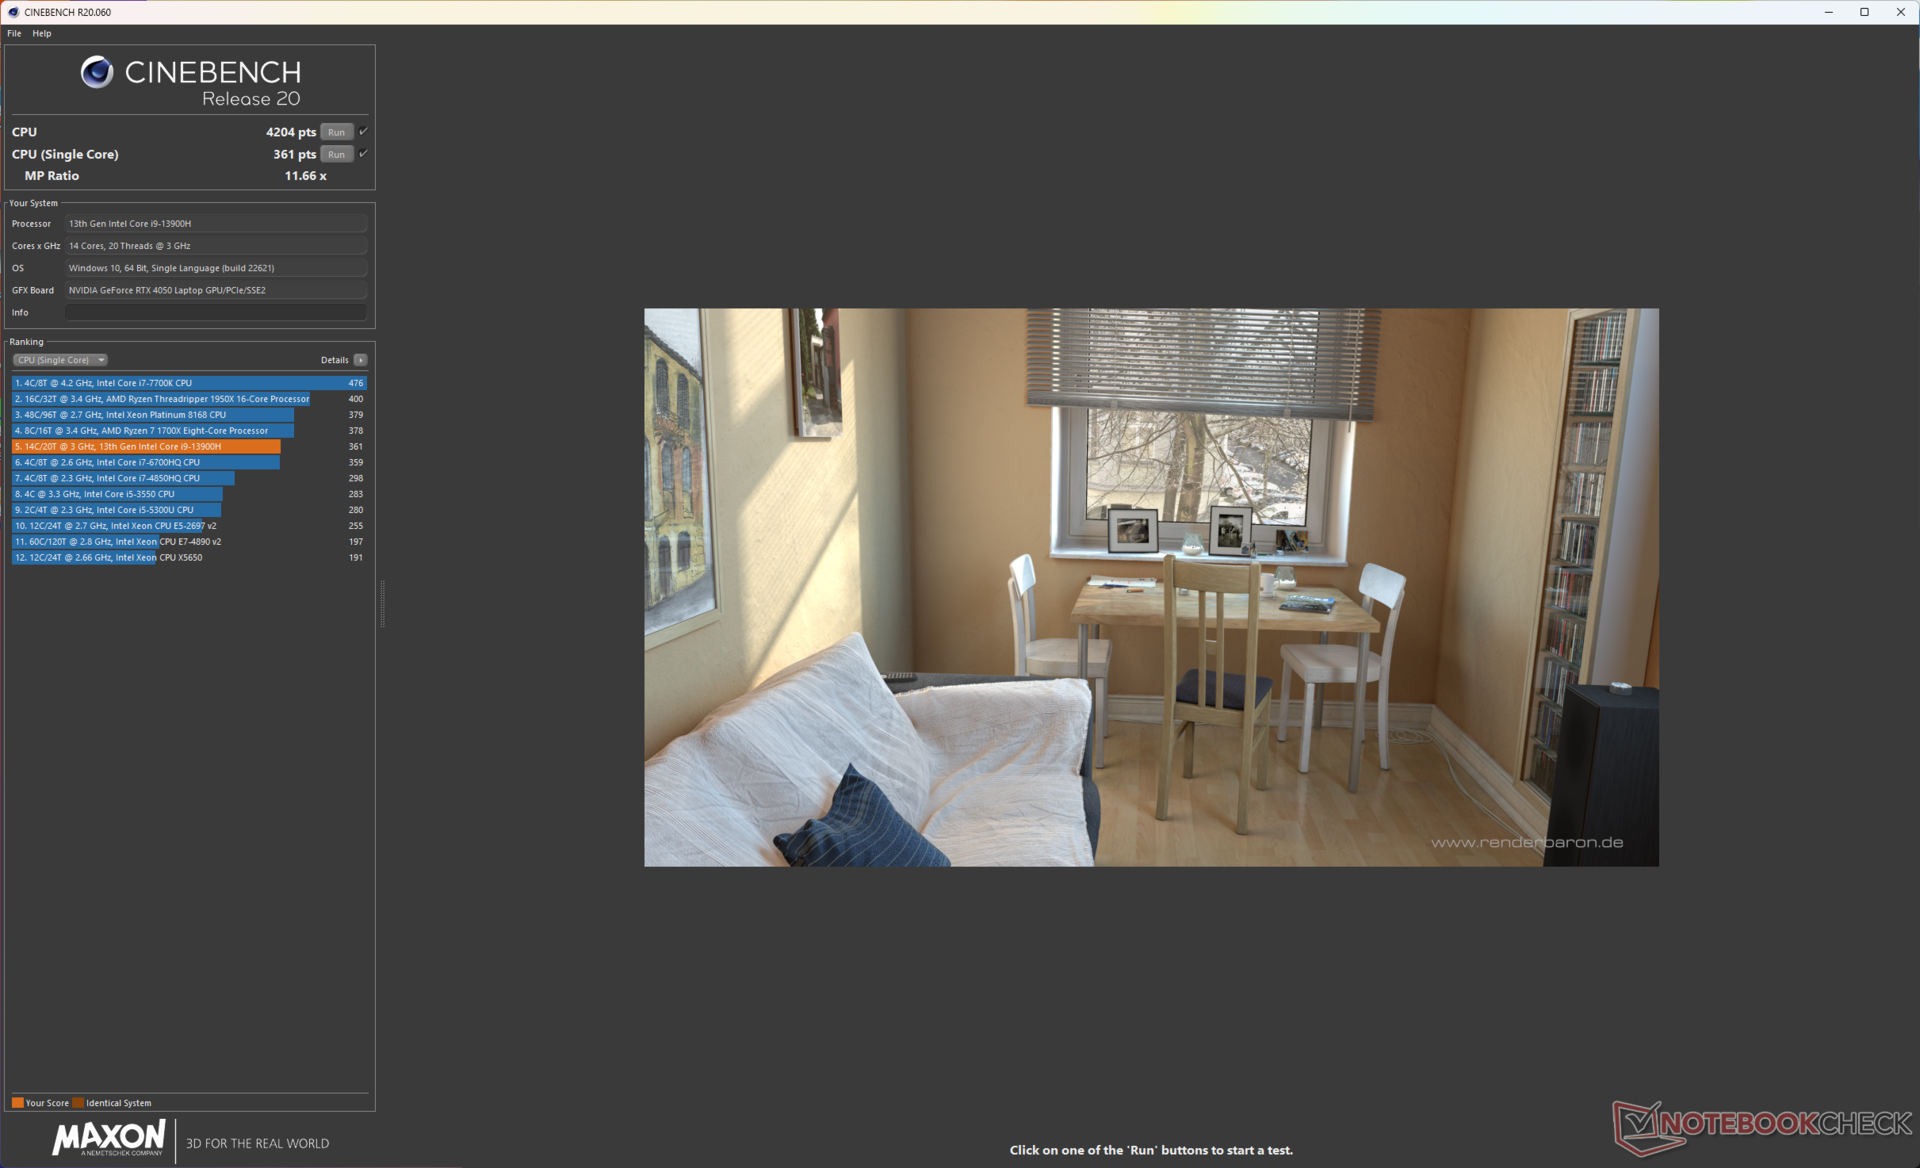
Intel Core i9-13900H, altı P-çekirdeği, sekiz E-çekirdeği ve 5,4 GHz'lik maksimum tek çekirdek artışına sahip 14 çekirdekli 20 iş parçacıklı bir işlemcidir. Yine de bu gördüğümüz en hızlı Core i9-13900H değil.
Genel CPU performansı, son nesil VivoBook Pro 16'nınkinden biraz daha iyi Core i7-12700H...ve hatta Ryzen 5 7645HX lenovo Legion Pro 5'te %6 oranında. Test cihazımızdaki sınırlı güç bütçesi, Core i9-13900H'nin performansını Lenovo Pro 5 gibi dizüstü bilgisayarlara kıyasla düşürmektedir Gigabyte Aero 16 OLED ve Asus ROG Flow X16 aynı işlemci ile.
Bu performans, bu tür bir Core i9-13980HX vivoBook Pro 16X'te bulunan ve kümülatif olarak %46'lık devasa bir farkla önde olan.
Bununla birlikte, VivoBook Pro 16'nın soğutması, oldukça tutarlı Cinebench R15 çok çekirdekli döngü grafiğinden de anlaşılacağı üzere iyi bir iş çıkarıyor gibi görünüyor.
Cinebench R15 Multi Loop
Cinebench R23: Multi Core | Single Core
Cinebench R20: CPU (Multi Core) | CPU (Single Core)
Cinebench R15: CPU Multi 64Bit | CPU Single 64Bit
Blender: v2.79 BMW27 CPU
7-Zip 18.03: 7z b 4 | 7z b 4 -mmt1
Geekbench 5.5: Multi-Core | Single-Core
HWBOT x265 Benchmark v2.2: 4k Preset
LibreOffice : 20 Documents To PDF
R Benchmark 2.5: Overall mean
| CPU Performance rating | |
| Asus Vivobook Pro 16X K6604JV-MX016W | |
| Asus ROG Flow X16 GV601V | |
| Asus TUF Gaming A16 FA617XS | |
| Ortalama Intel Core i9-13900H | |
| Gigabyte AERO 16 OLED BSF | |
| Sınıf ortalaması Multimedia | |
| Lenovo Legion Pro 5 16ARX8 (R5 7645HX, RTX 4050) | |
| Asus VivoBook Pro 16 K6602VU | |
| Asus VivoBook Pro 16 | |
| Cinebench R23 / Multi Core | |
| Asus Vivobook Pro 16X K6604JV-MX016W | |
| Asus ROG Flow X16 GV601V | |
| Gigabyte AERO 16 OLED BSF | |
| Asus TUF Gaming A16 FA617XS | |
| Ortalama Intel Core i9-13900H (11997 - 20385, n=28) | |
| Sınıf ortalaması Multimedia (4861 - 33362, n=74, son 2 yıl) | |
| Asus VivoBook Pro 16 K6602VU | |
| Asus VivoBook Pro 16 | |
| Lenovo Legion Pro 5 16ARX8 (R5 7645HX, RTX 4050) | |
| Cinebench R23 / Single Core | |
| Asus ROG Flow X16 GV601V | |
| Sınıf ortalaması Multimedia (1128 - 2459, n=66, son 2 yıl) | |
| Ortalama Intel Core i9-13900H (1297 - 2054, n=26) | |
| Asus Vivobook Pro 16X K6604JV-MX016W | |
| Lenovo Legion Pro 5 16ARX8 (R5 7645HX, RTX 4050) | |
| Asus TUF Gaming A16 FA617XS | |
| Asus VivoBook Pro 16 K6602VU | |
| Asus VivoBook Pro 16 | |
| Gigabyte AERO 16 OLED BSF | |
| Cinebench R20 / CPU (Multi Core) | |
| Asus Vivobook Pro 16X K6604JV-MX016W | |
| Asus ROG Flow X16 GV601V | |
| Gigabyte AERO 16 OLED BSF | |
| Asus TUF Gaming A16 FA617XS | |
| Ortalama Intel Core i9-13900H (4935 - 7716, n=25) | |
| Sınıf ortalaması Multimedia (1887 - 12912, n=57, son 2 yıl) | |
| Asus VivoBook Pro 16 K6602VU | |
| Asus VivoBook Pro 16 | |
| Lenovo Legion Pro 5 16ARX8 (R5 7645HX, RTX 4050) | |
| Cinebench R20 / CPU (Single Core) | |
| Asus ROG Flow X16 GV601V | |
| Sınıf ortalaması Multimedia (425 - 853, n=57, son 2 yıl) | |
| Ortalama Intel Core i9-13900H (428 - 792, n=25) | |
| Asus Vivobook Pro 16X K6604JV-MX016W | |
| Asus TUF Gaming A16 FA617XS | |
| Lenovo Legion Pro 5 16ARX8 (R5 7645HX, RTX 4050) | |
| Asus VivoBook Pro 16 K6602VU | |
| Asus VivoBook Pro 16 | |
| Gigabyte AERO 16 OLED BSF | |
| Cinebench R15 / CPU Multi 64Bit | |
| Asus Vivobook Pro 16X K6604JV-MX016W | |
| Asus ROG Flow X16 GV601V | |
| Gigabyte AERO 16 OLED BSF | |
| Ortalama Intel Core i9-13900H (2061 - 3100, n=26) | |
| Asus TUF Gaming A16 FA617XS | |
| Sınıf ortalaması Multimedia (856 - 5224, n=61, son 2 yıl) | |
| Asus VivoBook Pro 16 K6602VU | |
| Asus VivoBook Pro 16 | |
| Lenovo Legion Pro 5 16ARX8 (R5 7645HX, RTX 4050) | |
| Cinebench R15 / CPU Single 64Bit | |
| Lenovo Legion Pro 5 16ARX8 (R5 7645HX, RTX 4050) | |
| Asus Vivobook Pro 16X K6604JV-MX016W | |
| Asus ROG Flow X16 GV601V | |
| Asus TUF Gaming A16 FA617XS | |
| Sınıf ortalaması Multimedia (184.8 - 326, n=59, son 2 yıl) | |
| Ortalama Intel Core i9-13900H (211 - 297, n=26) | |
| Asus VivoBook Pro 16 | |
| Asus VivoBook Pro 16 K6602VU | |
| Gigabyte AERO 16 OLED BSF | |
| Blender / v2.79 BMW27 CPU | |
| Sınıf ortalaması Multimedia (100 - 557, n=58, son 2 yıl) | |
| Asus VivoBook Pro 16 | |
| Lenovo Legion Pro 5 16ARX8 (R5 7645HX, RTX 4050) | |
| Asus VivoBook Pro 16 K6602VU | |
| Ortalama Intel Core i9-13900H (166 - 268, n=24) | |
| Asus TUF Gaming A16 FA617XS | |
| Asus ROG Flow X16 GV601V | |
| Gigabyte AERO 16 OLED BSF | |
| Asus Vivobook Pro 16X K6604JV-MX016W | |
| 7-Zip 18.03 / 7z b 4 | |
| Asus Vivobook Pro 16X K6604JV-MX016W | |
| Gigabyte AERO 16 OLED BSF | |
| Asus ROG Flow X16 GV601V | |
| Asus TUF Gaming A16 FA617XS | |
| Ortalama Intel Core i9-13900H (45045 - 79032, n=25) | |
| Asus VivoBook Pro 16 K6602VU | |
| Lenovo Legion Pro 5 16ARX8 (R5 7645HX, RTX 4050) | |
| Sınıf ortalaması Multimedia (26062 - 130368, n=55, son 2 yıl) | |
| Asus VivoBook Pro 16 | |
| 7-Zip 18.03 / 7z b 4 -mmt1 | |
| Lenovo Legion Pro 5 16ARX8 (R5 7645HX, RTX 4050) | |
| Asus Vivobook Pro 16X K6604JV-MX016W | |
| Asus TUF Gaming A16 FA617XS | |
| Asus ROG Flow X16 GV601V | |
| Ortalama Intel Core i9-13900H (3665 - 6600, n=25) | |
| Sınıf ortalaması Multimedia (3666 - 7545, n=56, son 2 yıl) | |
| Asus VivoBook Pro 16 K6602VU | |
| Asus VivoBook Pro 16 | |
| Gigabyte AERO 16 OLED BSF | |
| Geekbench 5.5 / Multi-Core | |
| Asus Vivobook Pro 16X K6604JV-MX016W | |
| Asus ROG Flow X16 GV601V | |
| Gigabyte AERO 16 OLED BSF | |
| Sınıf ortalaması Multimedia (4652 - 20422, n=56, son 2 yıl) | |
| Ortalama Intel Core i9-13900H (9094 - 15410, n=26) | |
| Asus TUF Gaming A16 FA617XS | |
| Asus VivoBook Pro 16 K6602VU | |
| Lenovo Legion Pro 5 16ARX8 (R5 7645HX, RTX 4050) | |
| Asus VivoBook Pro 16 | |
| Geekbench 5.5 / Single-Core | |
| Asus TUF Gaming A16 FA617XS | |
| Asus Vivobook Pro 16X K6604JV-MX016W | |
| Asus ROG Flow X16 GV601V | |
| Sınıf ortalaması Multimedia (805 - 2974, n=56, son 2 yıl) | |
| Lenovo Legion Pro 5 16ARX8 (R5 7645HX, RTX 4050) | |
| Ortalama Intel Core i9-13900H (1140 - 2043, n=26) | |
| Asus VivoBook Pro 16 K6602VU | |
| Gigabyte AERO 16 OLED BSF | |
| Asus VivoBook Pro 16 | |
| HWBOT x265 Benchmark v2.2 / 4k Preset | |
| Asus Vivobook Pro 16X K6604JV-MX016W | |
| Asus ROG Flow X16 GV601V | |
| Gigabyte AERO 16 OLED BSF | |
| Asus TUF Gaming A16 FA617XS | |
| Lenovo Legion Pro 5 16ARX8 (R5 7645HX, RTX 4050) | |
| Sınıf ortalaması Multimedia (5.26 - 36.1, n=56, son 2 yıl) | |
| Ortalama Intel Core i9-13900H (14.1 - 22.3, n=25) | |
| Asus VivoBook Pro 16 K6602VU | |
| Asus VivoBook Pro 16 | |
| LibreOffice / 20 Documents To PDF | |
| Gigabyte AERO 16 OLED BSF | |
| Asus VivoBook Pro 16 K6602VU | |
| Lenovo Legion Pro 5 16ARX8 (R5 7645HX, RTX 4050) | |
| Asus Vivobook Pro 16X K6604JV-MX016W | |
| Sınıf ortalaması Multimedia (23.9 - 146.7, n=57, son 2 yıl) | |
| Ortalama Intel Core i9-13900H (34.4 - 82.8, n=25) | |
| Asus VivoBook Pro 16 | |
| Asus TUF Gaming A16 FA617XS | |
| Asus ROG Flow X16 GV601V | |
| R Benchmark 2.5 / Overall mean | |
| Gigabyte AERO 16 OLED BSF | |
| Asus VivoBook Pro 16 | |
| Asus VivoBook Pro 16 K6602VU | |
| Sınıf ortalaması Multimedia (0.3604 - 0.947, n=56, son 2 yıl) | |
| Ortalama Intel Core i9-13900H (0.4052 - 0.723, n=25) | |
| Lenovo Legion Pro 5 16ARX8 (R5 7645HX, RTX 4050) | |
| Asus TUF Gaming A16 FA617XS | |
| Asus ROG Flow X16 GV601V | |
| Asus Vivobook Pro 16X K6604JV-MX016W | |
* ... daha küçük daha iyidir
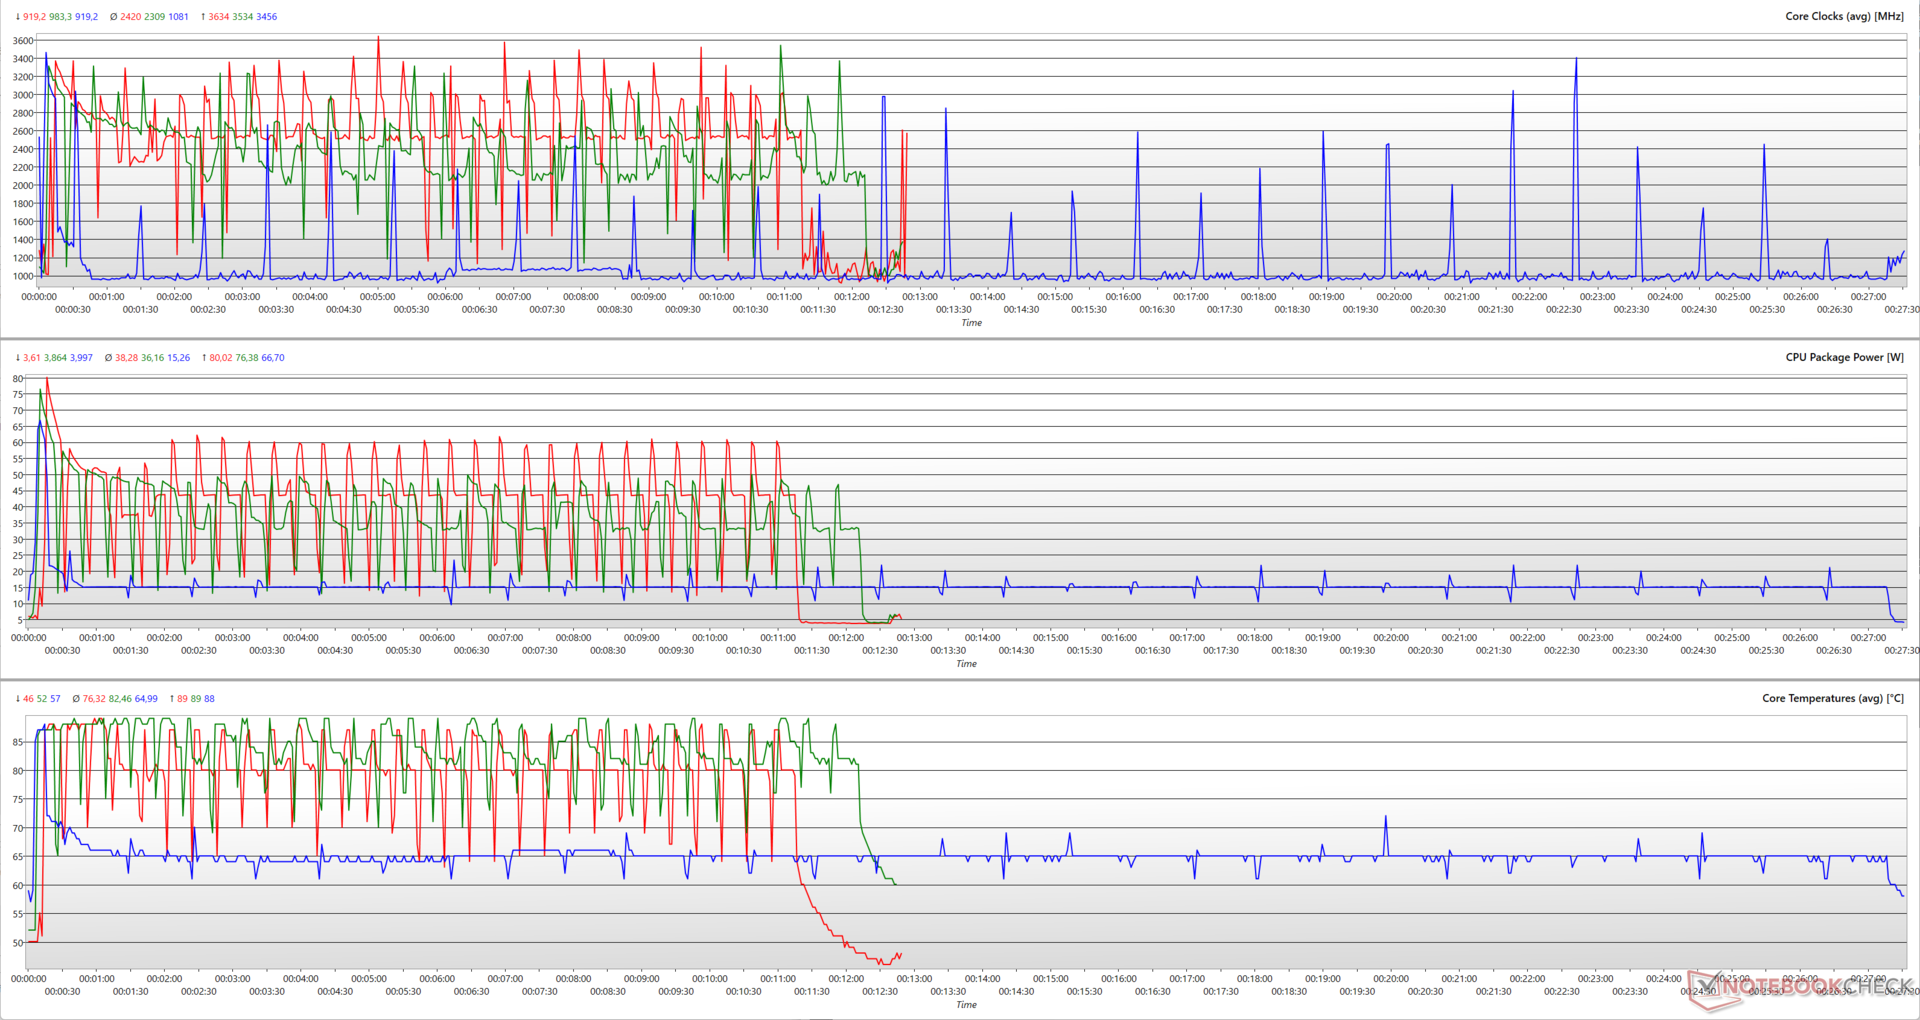
Cinebench R15 çoklu çekirdek testi, VivoBook Pro 16'nın Performans modunda bile Core i9-13900H'nin 115 W güç sınırını tam olarak kullanmakta zorlandığını görüyor. Performans modunda sadece 80 W'lık en yüksek CPU paket gücünü kaydettik ve maksimum güçlendirme saatleri sadece 3,6 GHz'e ulaştı
Standart mod, 76 W tepe paket gücü ve 3,5 GHz artırma saatleri ile biraz daha muhafazakârdır.
Whisper'da VivoBook Pro 16 maksimum 66,7 W'a ulaşıyor ancak ortalama CPU paket gücü yaklaşık 15 W. Bu, çalışma sırasında ortalama 1 GHz olan 3,45 GHz'lik maksimum saatlerle sonuçlanıyor.
AC gücüne kıyasla Cinebench R20 skorlarının tek çekirdekte %46,3 ve çok çekirdekte %27 düşmesiyle performans pille daha da sınırlı kalıyor.
AIDA64: FP32 Ray-Trace | FPU Julia | CPU SHA3 | CPU Queen | FPU SinJulia | FPU Mandel | CPU AES | CPU ZLib | FP64 Ray-Trace | CPU PhotoWorxx
| Performance rating | |
| Asus TUF Gaming A16 FA617XS | |
| Asus Vivobook Pro 16X K6604JV-MX016W | |
| Gigabyte AERO 16 OLED BSF | |
| Asus ROG Flow X16 GV601V | |
| Lenovo Legion Pro 5 16ARX8 (R5 7645HX, RTX 4050) | |
| Sınıf ortalaması Multimedia | |
| Ortalama Intel Core i9-13900H | |
| Asus VivoBook Pro 16 K6602VU | |
| Asus VivoBook Pro 16 | |
| AIDA64 / FP32 Ray-Trace | |
| Asus TUF Gaming A16 FA617XS | |
| Lenovo Legion Pro 5 16ARX8 (R5 7645HX, RTX 4050) | |
| Asus Vivobook Pro 16X K6604JV-MX016W | |
| Gigabyte AERO 16 OLED BSF | |
| Sınıf ortalaması Multimedia (2214 - 50388, n=53, son 2 yıl) | |
| Ortalama Intel Core i9-13900H (6788 - 19557, n=25) | |
| Asus VivoBook Pro 16 | |
| Asus VivoBook Pro 16 K6602VU | |
| Asus ROG Flow X16 GV601V | |
| AIDA64 / FPU Julia | |
| Asus TUF Gaming A16 FA617XS | |
| Asus Vivobook Pro 16X K6604JV-MX016W | |
| Lenovo Legion Pro 5 16ARX8 (R5 7645HX, RTX 4050) | |
| Gigabyte AERO 16 OLED BSF | |
| Asus ROG Flow X16 GV601V | |
| Sınıf ortalaması Multimedia (12867 - 201874, n=54, son 2 yıl) | |
| Ortalama Intel Core i9-13900H (22551 - 95579, n=25) | |
| Asus VivoBook Pro 16 | |
| Asus VivoBook Pro 16 K6602VU | |
| AIDA64 / CPU SHA3 | |
| Asus Vivobook Pro 16X K6604JV-MX016W | |
| Asus TUF Gaming A16 FA617XS | |
| Asus ROG Flow X16 GV601V | |
| Gigabyte AERO 16 OLED BSF | |
| Sınıf ortalaması Multimedia (626 - 8623, n=54, son 2 yıl) | |
| Lenovo Legion Pro 5 16ARX8 (R5 7645HX, RTX 4050) | |
| Ortalama Intel Core i9-13900H (2491 - 4270, n=25) | |
| Asus VivoBook Pro 16 | |
| Asus VivoBook Pro 16 K6602VU | |
| AIDA64 / CPU Queen | |
| Asus Vivobook Pro 16X K6604JV-MX016W | |
| Asus TUF Gaming A16 FA617XS | |
| Asus ROG Flow X16 GV601V | |
| Ortalama Intel Core i9-13900H (65121 - 120936, n=25) | |
| Asus VivoBook Pro 16 | |
| Lenovo Legion Pro 5 16ARX8 (R5 7645HX, RTX 4050) | |
| Gigabyte AERO 16 OLED BSF | |
| Asus VivoBook Pro 16 K6602VU | |
| Sınıf ortalaması Multimedia (13483 - 181505, n=41, son 2 yıl) | |
| AIDA64 / FPU SinJulia | |
| Asus TUF Gaming A16 FA617XS | |
| Asus Vivobook Pro 16X K6604JV-MX016W | |
| Lenovo Legion Pro 5 16ARX8 (R5 7645HX, RTX 4050) | |
| Asus ROG Flow X16 GV601V | |
| Gigabyte AERO 16 OLED BSF | |
| Ortalama Intel Core i9-13900H (6108 - 11631, n=25) | |
| Asus VivoBook Pro 16 | |
| Asus VivoBook Pro 16 K6602VU | |
| Sınıf ortalaması Multimedia (886 - 28794, n=54, son 2 yıl) | |
| AIDA64 / FPU Mandel | |
| Asus TUF Gaming A16 FA617XS | |
| Asus Vivobook Pro 16X K6604JV-MX016W | |
| Lenovo Legion Pro 5 16ARX8 (R5 7645HX, RTX 4050) | |
| Gigabyte AERO 16 OLED BSF | |
| Asus ROG Flow X16 GV601V | |
| Sınıf ortalaması Multimedia (6395 - 105740, n=53, son 2 yıl) | |
| Ortalama Intel Core i9-13900H (11283 - 48474, n=25) | |
| Asus VivoBook Pro 16 | |
| Asus VivoBook Pro 16 K6602VU | |
| AIDA64 / CPU AES | |
| Gigabyte AERO 16 OLED BSF | |
| Asus VivoBook Pro 16 K6602VU | |
| Asus Vivobook Pro 16X K6604JV-MX016W | |
| Ortalama Intel Core i9-13900H (3691 - 149377, n=25) | |
| Asus TUF Gaming A16 FA617XS | |
| Asus ROG Flow X16 GV601V | |
| Asus VivoBook Pro 16 | |
| Sınıf ortalaması Multimedia (8171 - 126790, n=54, son 2 yıl) | |
| Lenovo Legion Pro 5 16ARX8 (R5 7645HX, RTX 4050) | |
| AIDA64 / CPU ZLib | |
| Asus Vivobook Pro 16X K6604JV-MX016W | |
| Asus ROG Flow X16 GV601V | |
| Gigabyte AERO 16 OLED BSF | |
| Asus TUF Gaming A16 FA617XS | |
| Ortalama Intel Core i9-13900H (789 - 1254, n=25) | |
| Sınıf ortalaması Multimedia (143.8 - 2022, n=54, son 2 yıl) | |
| Asus VivoBook Pro 16 K6602VU | |
| Asus VivoBook Pro 16 | |
| Lenovo Legion Pro 5 16ARX8 (R5 7645HX, RTX 4050) | |
| AIDA64 / FP64 Ray-Trace | |
| Asus TUF Gaming A16 FA617XS | |
| Lenovo Legion Pro 5 16ARX8 (R5 7645HX, RTX 4050) | |
| Asus Vivobook Pro 16X K6604JV-MX016W | |
| Gigabyte AERO 16 OLED BSF | |
| Asus ROG Flow X16 GV601V | |
| Sınıf ortalaması Multimedia (1014 - 26875, n=54, son 2 yıl) | |
| Ortalama Intel Core i9-13900H (3655 - 10716, n=25) | |
| Asus VivoBook Pro 16 | |
| Asus VivoBook Pro 16 K6602VU | |
| AIDA64 / CPU PhotoWorxx | |
| Sınıf ortalaması Multimedia (8187 - 88154, n=54, son 2 yıl) | |
| Gigabyte AERO 16 OLED BSF | |
| Asus Vivobook Pro 16X K6604JV-MX016W | |
| Ortalama Intel Core i9-13900H (10871 - 50488, n=25) | |
| Asus VivoBook Pro 16 K6602VU | |
| Asus ROG Flow X16 GV601V | |
| Asus TUF Gaming A16 FA617XS | |
| Lenovo Legion Pro 5 16ARX8 (R5 7645HX, RTX 4050) | |
| Asus VivoBook Pro 16 | |
Kendimizi işimize adamış Intel Core i9-13900H sayfası daha fazla bilgi ve kıyaslama karşılaştırmaları sunmaktadır.
Sistem Performansı
Benzer bir eğilim PCMark 10 ve CrossMark testlerinde de görülüyor. Bu Core i9-13980HX-güçlendirilmiş VivoBook Pro 16X, genel PCMark 10 puanlarında test modelimizle neredeyse başa baş giderken, birleşik CrossMark testlerinde %19'luk bir başarı elde etti.
Bununla birlikte, olağan üretkenlik, multimedya veya web tarama görevleri için günlük kullanımda endişe verici bir şey bulamadık.
CrossMark: Overall | Productivity | Creativity | Responsiveness
AIDA64: Memory Copy | Memory Read | Memory Write | Memory Latency
| PCMark 10 / Score | |
| Lenovo Legion Pro 5 16ARX8 (R5 7645HX, RTX 4050) | |
| Gigabyte AERO 16 OLED BSF | |
| Asus TUF Gaming A16 FA617XS | |
| Asus ROG Flow X16 GV601V | |
| Sınıf ortalaması Multimedia (4325 - 10386, n=52, son 2 yıl) | |
| Asus VivoBook Pro 16 K6602VU | |
| Ortalama Intel Core i9-13900H, NVIDIA GeForce RTX 4050 Laptop GPU (n=1) | |
| Asus Vivobook Pro 16X K6604JV-MX016W | |
| Asus VivoBook Pro 16 | |
| PCMark 10 / Essentials | |
| Lenovo Legion Pro 5 16ARX8 (R5 7645HX, RTX 4050) | |
| Asus ROG Flow X16 GV601V | |
| Gigabyte AERO 16 OLED BSF | |
| Asus TUF Gaming A16 FA617XS | |
| Asus Vivobook Pro 16X K6604JV-MX016W | |
| Sınıf ortalaması Multimedia (8025 - 11664, n=51, son 2 yıl) | |
| Asus VivoBook Pro 16 K6602VU | |
| Ortalama Intel Core i9-13900H, NVIDIA GeForce RTX 4050 Laptop GPU (n=1) | |
| Asus VivoBook Pro 16 | |
| PCMark 10 / Productivity | |
| Sınıf ortalaması Multimedia (7323 - 18233, n=51, son 2 yıl) | |
| Lenovo Legion Pro 5 16ARX8 (R5 7645HX, RTX 4050) | |
| Asus TUF Gaming A16 FA617XS | |
| Asus ROG Flow X16 GV601V | |
| Gigabyte AERO 16 OLED BSF | |
| Asus Vivobook Pro 16X K6604JV-MX016W | |
| Asus VivoBook Pro 16 | |
| Asus VivoBook Pro 16 K6602VU | |
| Ortalama Intel Core i9-13900H, NVIDIA GeForce RTX 4050 Laptop GPU (n=1) | |
| PCMark 10 / Digital Content Creation | |
| Gigabyte AERO 16 OLED BSF | |
| Asus TUF Gaming A16 FA617XS | |
| Asus ROG Flow X16 GV601V | |
| Lenovo Legion Pro 5 16ARX8 (R5 7645HX, RTX 4050) | |
| Asus VivoBook Pro 16 K6602VU | |
| Ortalama Intel Core i9-13900H, NVIDIA GeForce RTX 4050 Laptop GPU (n=1) | |
| Sınıf ortalaması Multimedia (3651 - 16240, n=51, son 2 yıl) | |
| Asus Vivobook Pro 16X K6604JV-MX016W | |
| Asus VivoBook Pro 16 | |
| CrossMark / Overall | |
| Asus Vivobook Pro 16X K6604JV-MX016W | |
| Asus ROG Flow X16 GV601V | |
| Lenovo Legion Pro 5 16ARX8 (R5 7645HX, RTX 4050) | |
| Gigabyte AERO 16 OLED BSF | |
| Sınıf ortalaması Multimedia (866 - 2728, n=60, son 2 yıl) | |
| Asus TUF Gaming A16 FA617XS | |
| Asus VivoBook Pro 16 K6602VU | |
| Ortalama Intel Core i9-13900H, NVIDIA GeForce RTX 4050 Laptop GPU (n=1) | |
| Asus VivoBook Pro 16 | |
| CrossMark / Productivity | |
| Asus Vivobook Pro 16X K6604JV-MX016W | |
| Lenovo Legion Pro 5 16ARX8 (R5 7645HX, RTX 4050) | |
| Asus ROG Flow X16 GV601V | |
| Gigabyte AERO 16 OLED BSF | |
| Sınıf ortalaması Multimedia (931 - 2489, n=60, son 2 yıl) | |
| Asus TUF Gaming A16 FA617XS | |
| Asus VivoBook Pro 16 | |
| Asus VivoBook Pro 16 K6602VU | |
| Ortalama Intel Core i9-13900H, NVIDIA GeForce RTX 4050 Laptop GPU (n=1) | |
| CrossMark / Creativity | |
| Asus Vivobook Pro 16X K6604JV-MX016W | |
| Sınıf ortalaması Multimedia (907 - 3465, n=60, son 2 yıl) | |
| Asus ROG Flow X16 GV601V | |
| Lenovo Legion Pro 5 16ARX8 (R5 7645HX, RTX 4050) | |
| Asus TUF Gaming A16 FA617XS | |
| Gigabyte AERO 16 OLED BSF | |
| Asus VivoBook Pro 16 K6602VU | |
| Ortalama Intel Core i9-13900H, NVIDIA GeForce RTX 4050 Laptop GPU (n=1) | |
| Asus VivoBook Pro 16 | |
| CrossMark / Responsiveness | |
| Gigabyte AERO 16 OLED BSF | |
| Lenovo Legion Pro 5 16ARX8 (R5 7645HX, RTX 4050) | |
| Asus ROG Flow X16 GV601V | |
| Asus VivoBook Pro 16 | |
| Asus Vivobook Pro 16X K6604JV-MX016W | |
| Asus VivoBook Pro 16 K6602VU | |
| Ortalama Intel Core i9-13900H, NVIDIA GeForce RTX 4050 Laptop GPU (n=1) | |
| Sınıf ortalaması Multimedia (605 - 2024, n=60, son 2 yıl) | |
| Asus TUF Gaming A16 FA617XS | |
| AIDA64 / Memory Copy | |
| Sınıf ortalaması Multimedia (11299 - 132135, n=54, son 2 yıl) | |
| Asus Vivobook Pro 16X K6604JV-MX016W | |
| Gigabyte AERO 16 OLED BSF | |
| Asus ROG Flow X16 GV601V | |
| Asus TUF Gaming A16 FA617XS | |
| Asus VivoBook Pro 16 K6602VU | |
| Ortalama Intel Core i9-13900H, NVIDIA GeForce RTX 4050 Laptop GPU (n=1) | |
| Lenovo Legion Pro 5 16ARX8 (R5 7645HX, RTX 4050) | |
| Asus VivoBook Pro 16 | |
| AIDA64 / Memory Read | |
| Sınıf ortalaması Multimedia (11624 - 174586, n=54, son 2 yıl) | |
| Asus Vivobook Pro 16X K6604JV-MX016W | |
| Gigabyte AERO 16 OLED BSF | |
| Asus ROG Flow X16 GV601V | |
| Asus VivoBook Pro 16 K6602VU | |
| Ortalama Intel Core i9-13900H, NVIDIA GeForce RTX 4050 Laptop GPU (n=1) | |
| Asus TUF Gaming A16 FA617XS | |
| Lenovo Legion Pro 5 16ARX8 (R5 7645HX, RTX 4050) | |
| Asus VivoBook Pro 16 | |
| AIDA64 / Memory Write | |
| Sınıf ortalaması Multimedia (11755 - 134998, n=54, son 2 yıl) | |
| Asus TUF Gaming A16 FA617XS | |
| Gigabyte AERO 16 OLED BSF | |
| Asus Vivobook Pro 16X K6604JV-MX016W | |
| Asus ROG Flow X16 GV601V | |
| Asus VivoBook Pro 16 K6602VU | |
| Ortalama Intel Core i9-13900H, NVIDIA GeForce RTX 4050 Laptop GPU (n=1) | |
| Lenovo Legion Pro 5 16ARX8 (R5 7645HX, RTX 4050) | |
| Asus VivoBook Pro 16 | |
| AIDA64 / Memory Latency | |
| Sınıf ortalaması Multimedia (7 - 535, n=53, son 2 yıl) | |
| Gigabyte AERO 16 OLED BSF | |
| Asus VivoBook Pro 16 K6602VU | |
| Ortalama Intel Core i9-13900H, NVIDIA GeForce RTX 4050 Laptop GPU (n=1) | |
| Asus ROG Flow X16 GV601V | |
| Asus VivoBook Pro 16 | |
| Asus TUF Gaming A16 FA617XS | |
| Asus Vivobook Pro 16X K6604JV-MX016W | |
| Lenovo Legion Pro 5 16ARX8 (R5 7645HX, RTX 4050) | |
* ... daha küçük daha iyidir
| PCMark 8 Home Score Accelerated v2 | 4484 puan | |
| PCMark 8 Work Score Accelerated v2 | 5200 puan | |
| PCMark 10 Score | 7054 puan | |
Yardım | ||
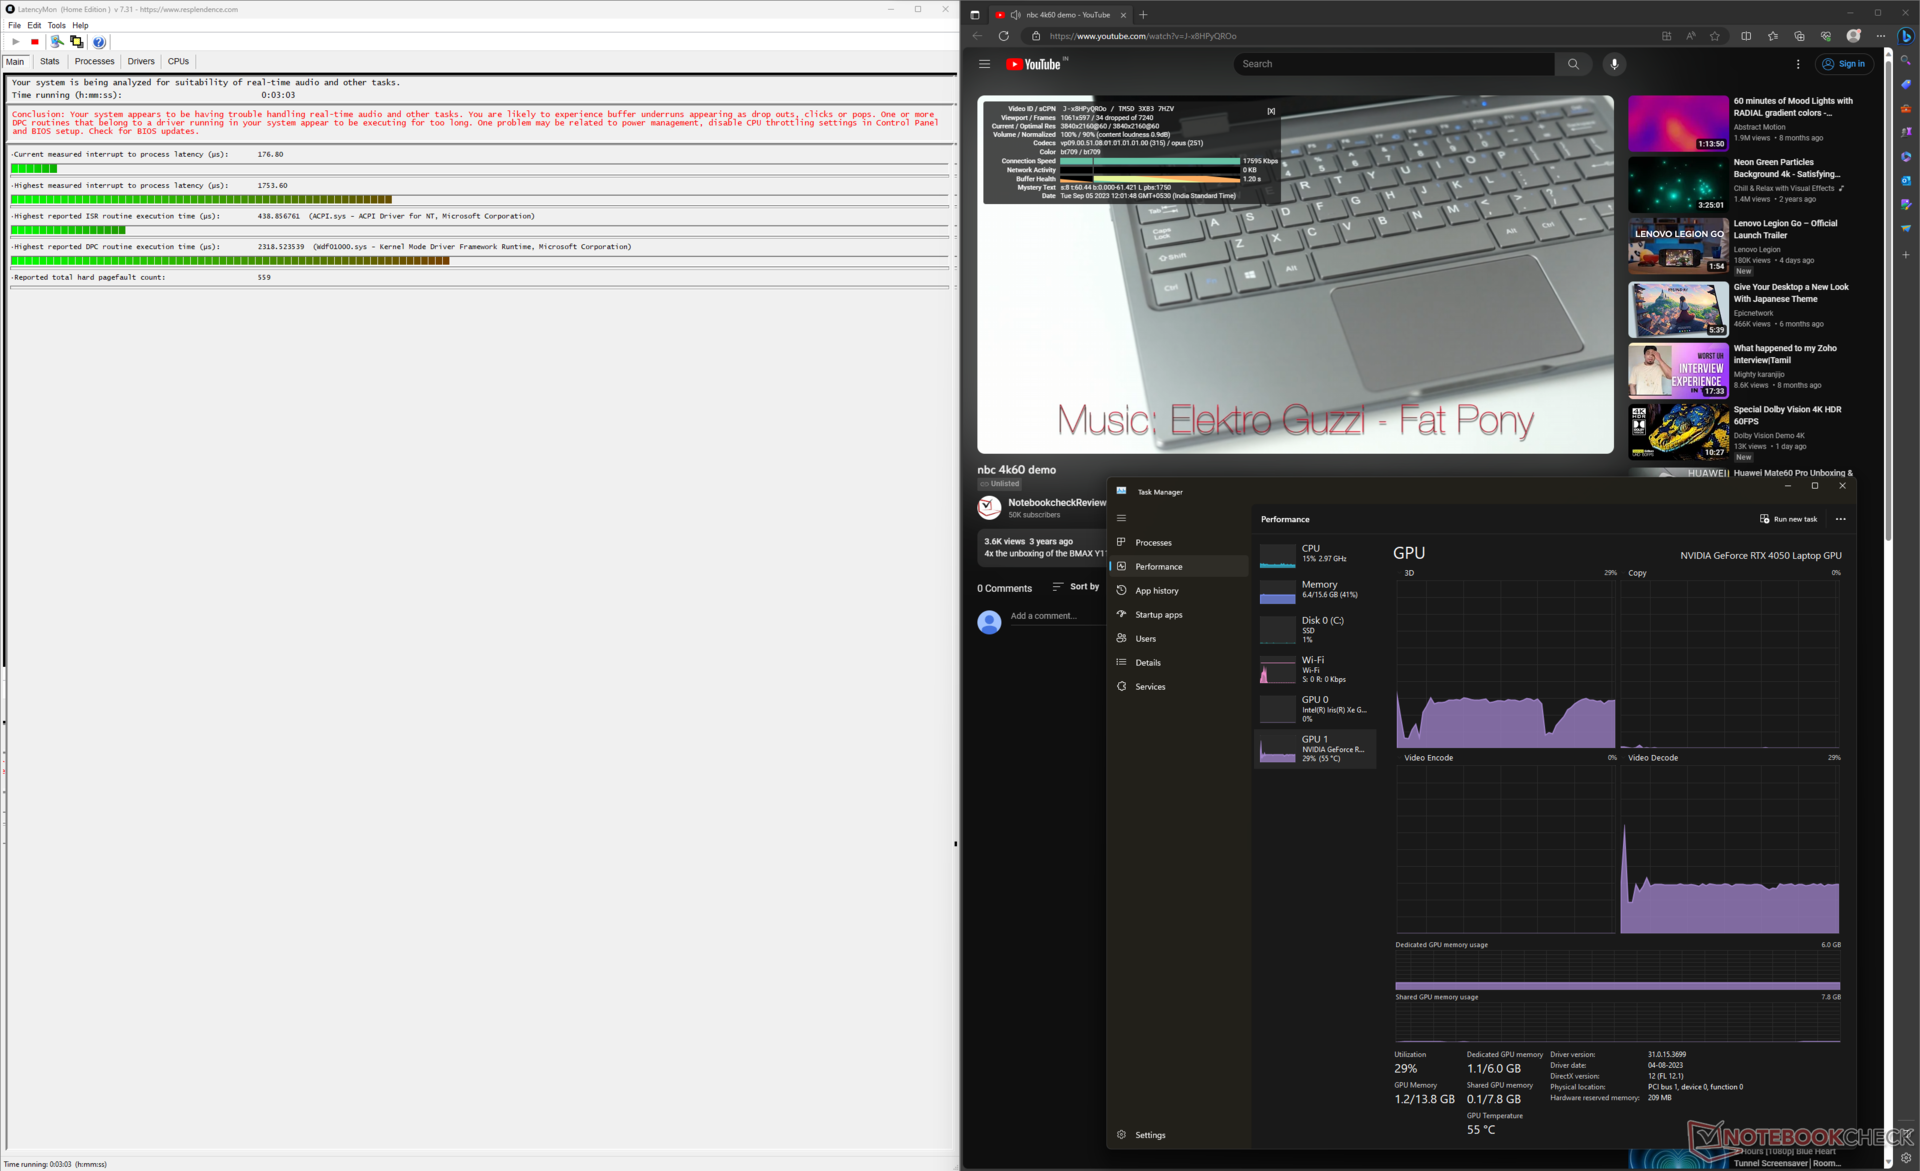
DPC Gecikme Süresi
En yüksek kesme-işlem gecikmesini yaklaşık 1.753,6 µs olarak ölçtük, bu da gerçek zamanlı ses/video düzenleme iş akışlarında potansiyel olarak sorunlara yol açabilir.
| DPC Latencies / LatencyMon - interrupt to process latency (max), Web, Youtube, Prime95 | |
| Asus Vivobook Pro 16X K6604JV-MX016W | |
| Asus VivoBook Pro 16 K6602VU | |
| Asus VivoBook Pro 16 | |
| Asus ROG Flow X16 GV601V | |
| Asus TUF Gaming A16 FA617XS | |
| Gigabyte AERO 16 OLED BSF | |
| Lenovo Legion Pro 5 16ARX8 (R5 7645HX, RTX 4050) | |
* ... daha küçük daha iyidir
Daha fazla DPC gecikme karşılaştırması için DPC Gecikme Sıralaması sayfa.
Depolama Cihazları
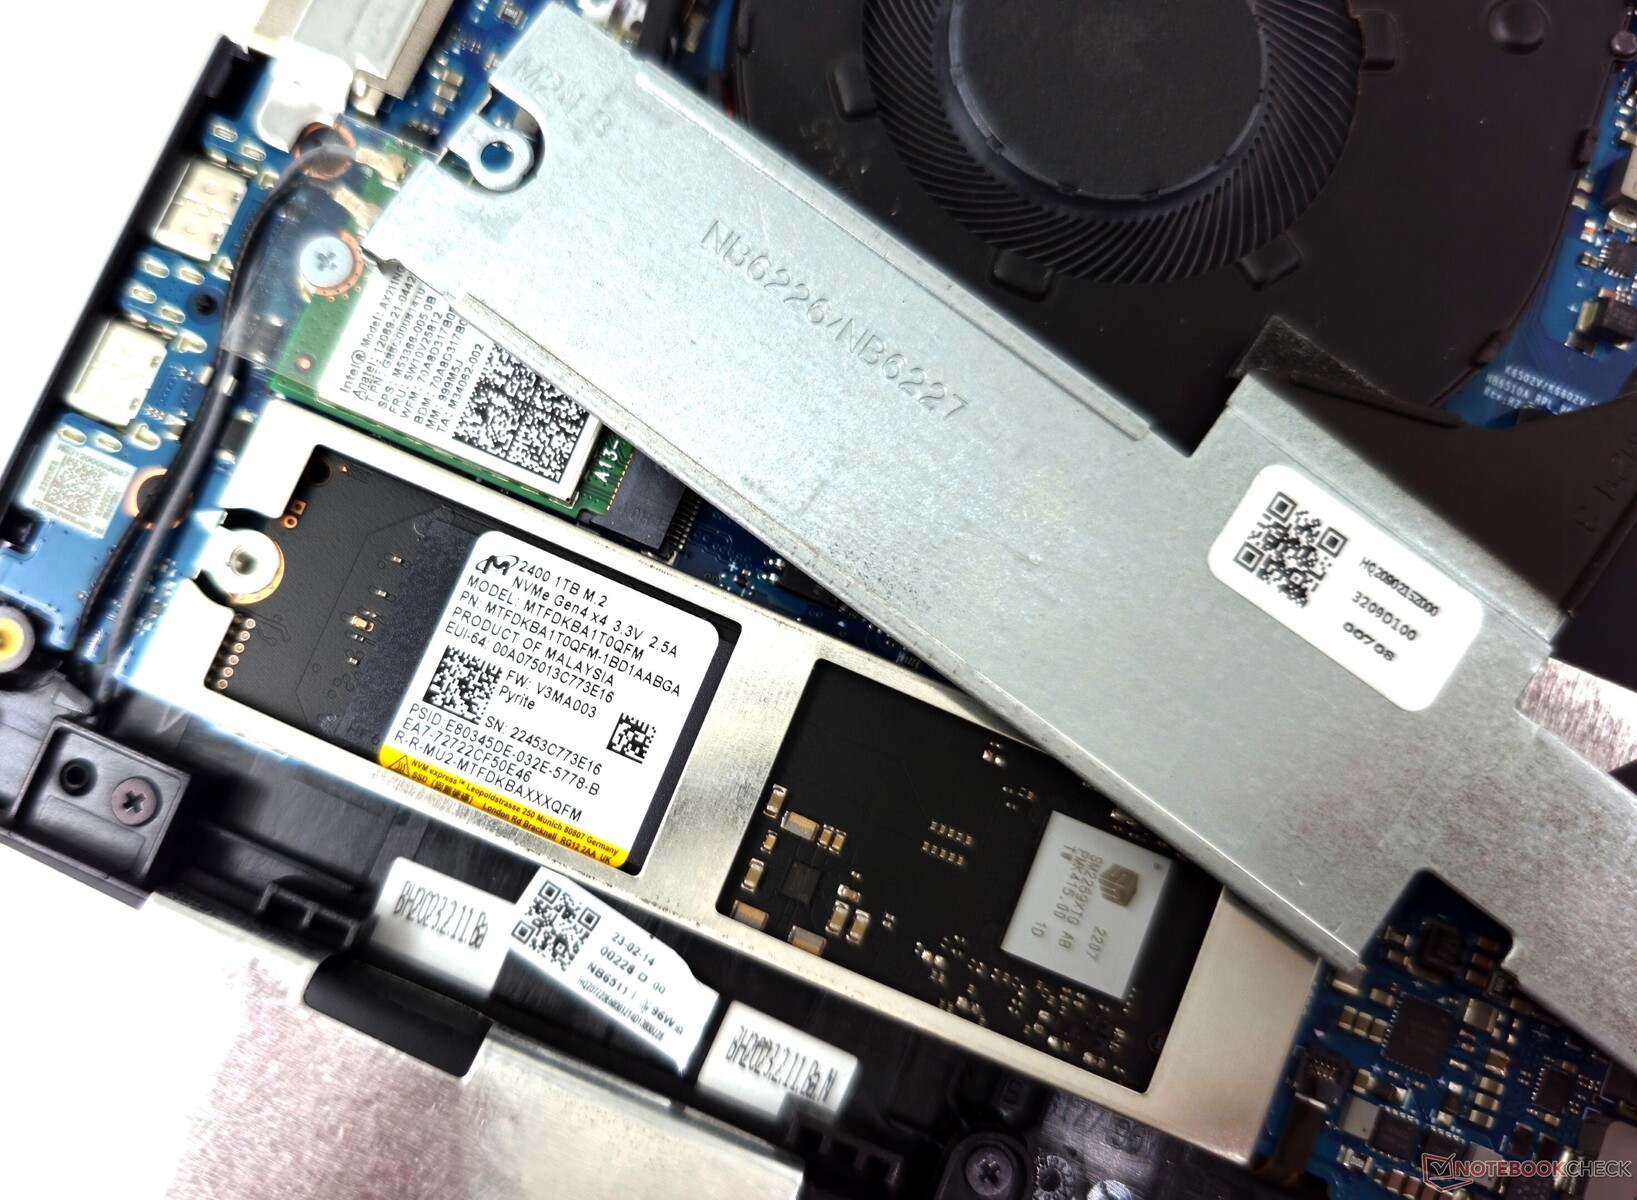
Micron 2400 1 TB PCIe Gen4 M.2 SSD, çıkarması biraz zahmetli olan uzun bir alüminyum kapağın altına yerleştirilmiştir. Sürücünün genel performansı, Micron 2400 512 GB sürücüden biraz daha iyidir ancak rakipleri arasında bulunan WD SN560, Gigabyte ve SK Hynix PC801'in önemli ölçüde gerisindedir.
Micron 2400, 1 kuyruk derinliğinde 4K okumalarda en fazla darbeyi alıyor, ancak 4K Q32 okumalarda çok daha iyi performans gösteriyor.
Depolama genişletmesi için yedek bir M.2 yuvası mevcuttur. Ancak 2,5 inç SATA sürücüler eklemek için bir alan yok.

| Drive Performance rating - Percent | |
| Lenovo Legion Pro 5 16ARX8 (R5 7645HX, RTX 4050) | |
| Gigabyte AERO 16 OLED BSF | |
| Sınıf ortalaması Multimedia | |
| Asus ROG Flow X16 GV601V | |
| Asus VivoBook Pro 16 | |
| Ortalama Micron 2400 MTFDKBA1T0QFM | |
| Asus Vivobook Pro 16X K6604JV-MX016W | |
| Asus VivoBook Pro 16 K6602VU | |
| Asus TUF Gaming A16 FA617XS | |
* ... daha küçük daha iyidir
Kuyruk derinliği 8 olan sürekli bir DiskSpd okuma döngüsü ile herhangi bir disk performansı düşüşü gözlemlemedik.
Disk Throttling: DiskSpd Read Loop, Queue Depth 8
Bizim göz atın HDD ve SSD karşılaştırmaları sayfasında daha fazla depolama performansı karşılaştırması bulabilirsiniz.
GPU Performansı
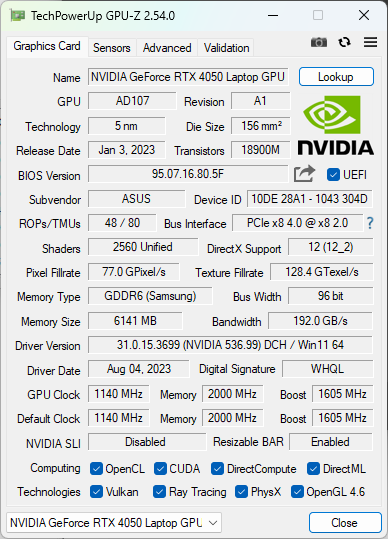
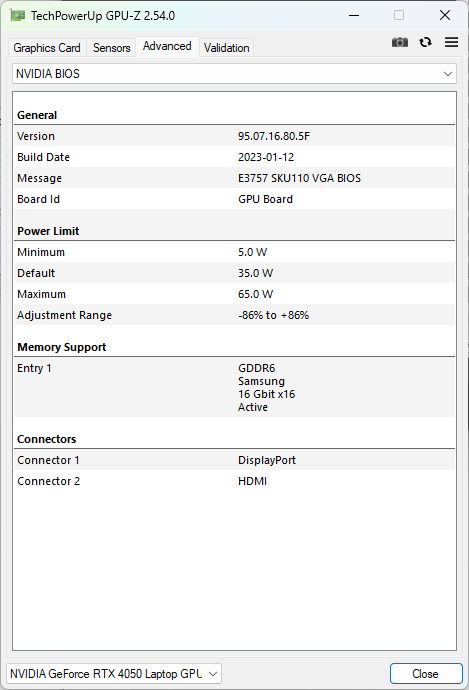
VivoBook Pro 16, 1.605 MHz'e kadar artırabilen 60 W Nvidia GeForce RTX 4050 Dizüstü Bilgisayar GPU'sunu kullanıyor.
GPU'nun kümülatif 3DMark performansı, diğer GPU'lardan %58 daha yüksektir RTX 3050 Ti geçen yılın VivoBook Pro 16'sında. Ancak, Legion Pro 5'teki 140 W RTX 4050'nin %16 gerisinde kalıyor.
VivoBook Pro 16X ve 140 W ile karşılaştırıldığında RTX 4060ünitemizin 60 W RTX 4050'si genel 3DMark ölçümlerinde yalnızca %7 geride kalıyor.
3DMark Time Spy Grafik puanları pil gücüyle %21 oranında düşebilir.
| 3DMark Performance rating - Percent | |
| Gigabyte AERO 16 OLED BSF | |
| Asus ROG Flow X16 GV601V | |
| Asus TUF Gaming A16 FA617XS | |
| Lenovo Legion Pro 5 16ARX8 (R5 7645HX, RTX 4050) | |
| Asus Vivobook Pro 16X K6604JV-MX016W | |
| Ortalama NVIDIA GeForce RTX 4050 Laptop GPU | |
| Asus VivoBook Pro 16 K6602VU | |
| Sınıf ortalaması Multimedia | |
| Asus VivoBook Pro 16 | |
| 3DMark 11 - 1280x720 Performance GPU | |
| Gigabyte AERO 16 OLED BSF | |
| Asus ROG Flow X16 GV601V | |
| Asus Vivobook Pro 16X K6604JV-MX016W | |
| Asus TUF Gaming A16 FA617XS | |
| Lenovo Legion Pro 5 16ARX8 (R5 7645HX, RTX 4050) | |
| Ortalama NVIDIA GeForce RTX 4050 Laptop GPU (13339 - 32642, n=41) | |
| Asus VivoBook Pro 16 K6602VU | |
| Sınıf ortalaması Multimedia (3749 - 60002, n=55, son 2 yıl) | |
| Asus VivoBook Pro 16 | |
| 3DMark 11 Performance | 25180 puan | |
| 3DMark Ice Storm Standard Score | 232668 puan | |
| 3DMark Cloud Gate Standard Score | 40077 puan | |
| 3DMark Fire Strike Score | 18333 puan | |
| 3DMark Fire Strike Extreme Score | 8859 puan | |
| 3DMark Time Spy Score | 7458 puan | |
Yardım | ||
| Blender / v3.3 Classroom OPTIX/RTX | |
| Asus VivoBook Pro 16 | |
| Sınıf ortalaması Multimedia (12 - 105, n=22, son 2 yıl) | |
| Asus VivoBook Pro 16 K6602VU | |
| Ortalama NVIDIA GeForce RTX 4050 Laptop GPU (25 - 37, n=40) | |
| Lenovo Legion Pro 5 16ARX8 (R5 7645HX, RTX 4050) | |
| Asus Vivobook Pro 16X K6604JV-MX016W | |
| Asus ROG Flow X16 GV601V | |
| Gigabyte AERO 16 OLED BSF | |
| Blender / v3.3 Classroom CUDA | |
| Asus VivoBook Pro 16 | |
| Sınıf ortalaması Multimedia (20 - 186, n=22, son 2 yıl) | |
| Ortalama NVIDIA GeForce RTX 4050 Laptop GPU (47 - 68, n=39) | |
| Asus VivoBook Pro 16 K6602VU | |
| Lenovo Legion Pro 5 16ARX8 (R5 7645HX, RTX 4050) | |
| Asus Vivobook Pro 16X K6604JV-MX016W | |
| Asus ROG Flow X16 GV601V | |
| Gigabyte AERO 16 OLED BSF | |
| Blender / v3.3 Classroom CPU | |
| Sınıf ortalaması Multimedia (134.5 - 1042, n=62, son 2 yıl) | |
| Ortalama NVIDIA GeForce RTX 4050 Laptop GPU (243 - 907, n=40) | |
| Asus VivoBook Pro 16 | |
| Asus VivoBook Pro 16 K6602VU | |
| Lenovo Legion Pro 5 16ARX8 (R5 7645HX, RTX 4050) | |
| Asus ROG Flow X16 GV601V | |
| Gigabyte AERO 16 OLED BSF | |
| Asus TUF Gaming A16 FA617XS | |
| Asus Vivobook Pro 16X K6604JV-MX016W | |
* ... daha küçük daha iyidir
Oyun Performansı
VivoBook Pro 16'nın RTX 4050'si şu özelliklere sahip Asus TUF Gaming A16's Radeon RX 7600S birleşik 1080p Ultra oyun performansında. Ancak, Legion Pro 5'in daha yüksek watt gücüne sahip RTX 4050'si burada hissedilir bir üstünlük sağlıyor.
Bununla birlikte, bu yılın Pro 16 yinelemesi, RTX 3050 Ti ile önceki nesle göre %44'lük etkileyici bir artış sunuyor.
| Performance rating - Percent | |
| Gigabyte AERO 16 OLED BSF | |
| Asus ROG Flow X16 GV601V | |
| Asus Vivobook Pro 16X K6604JV-MX016W | |
| Lenovo Legion Pro 5 16ARX8 (R5 7645HX, RTX 4050) | |
| Asus VivoBook Pro 16 K6602VU | |
| Asus TUF Gaming A16 FA617XS | |
| Asus VivoBook Pro 16 | |
| Sınıf ortalaması Multimedia | |
| The Witcher 3 - 1920x1080 Ultra Graphics & Postprocessing (HBAO+) | |
| Gigabyte AERO 16 OLED BSF | |
| Asus ROG Flow X16 GV601V | |
| Asus TUF Gaming A16 FA617XS | |
| Asus Vivobook Pro 16X K6604JV-MX016W | |
| Lenovo Legion Pro 5 16ARX8 (R5 7645HX, RTX 4050) | |
| Asus VivoBook Pro 16 K6602VU | |
| Sınıf ortalaması Multimedia (11 - 121, n=7, son 2 yıl) | |
| Asus VivoBook Pro 16 | |
| GTA V - 1920x1080 Highest AA:4xMSAA + FX AF:16x | |
| Gigabyte AERO 16 OLED BSF | |
| Asus ROG Flow X16 GV601V | |
| Asus Vivobook Pro 16X K6604JV-MX016W | |
| Lenovo Legion Pro 5 16ARX8 (R5 7645HX, RTX 4050) | |
| Asus TUF Gaming A16 FA617XS | |
| Asus VivoBook Pro 16 K6602VU | |
| Sınıf ortalaması Multimedia (7.92 - 141.6, n=55, son 2 yıl) | |
| Asus VivoBook Pro 16 | |
| Final Fantasy XV Benchmark - 1920x1080 High Quality | |
| Gigabyte AERO 16 OLED BSF | |
| Asus ROG Flow X16 GV601V | |
| Lenovo Legion Pro 5 16ARX8 (R5 7645HX, RTX 4050) | |
| Asus TUF Gaming A16 FA617XS | |
| Asus Vivobook Pro 16X K6604JV-MX016W | |
| Asus VivoBook Pro 16 K6602VU | |
| Sınıf ortalaması Multimedia (7.61 - 144.4, n=57, son 2 yıl) | |
| Asus VivoBook Pro 16 | |
| Strange Brigade - 1920x1080 ultra AA:ultra AF:16 | |
| Gigabyte AERO 16 OLED BSF | |
| Asus ROG Flow X16 GV601V | |
| Asus Vivobook Pro 16X K6604JV-MX016W | |
| Asus TUF Gaming A16 FA617XS | |
| Lenovo Legion Pro 5 16ARX8 (R5 7645HX, RTX 4050) | |
| Asus VivoBook Pro 16 K6602VU | |
| Sınıf ortalaması Multimedia (13.3 - 303, n=57, son 2 yıl) | |
| Asus VivoBook Pro 16 | |
| Dota 2 Reborn - 1920x1080 ultra (3/3) best looking | |
| Lenovo Legion Pro 5 16ARX8 (R5 7645HX, RTX 4050) | |
| Asus Vivobook Pro 16X K6604JV-MX016W | |
| Asus ROG Flow X16 GV601V | |
| Gigabyte AERO 16 OLED BSF | |
| Asus VivoBook Pro 16 K6602VU | |
| Asus TUF Gaming A16 FA617XS | |
| Asus VivoBook Pro 16 | |
| Sınıf ortalaması Multimedia (29 - 179.9, n=59, son 2 yıl) | |
| X-Plane 11.11 - 1920x1080 high (fps_test=3) | |
| Asus ROG Flow X16 GV601V | |
| Gigabyte AERO 16 OLED BSF | |
| Lenovo Legion Pro 5 16ARX8 (R5 7645HX, RTX 4050) | |
| Asus Vivobook Pro 16X K6604JV-MX016W | |
| Asus VivoBook Pro 16 K6602VU | |
| Asus VivoBook Pro 16 | |
| Asus TUF Gaming A16 FA617XS | |
| Sınıf ortalaması Multimedia (16.9 - 141.1, n=54, son 2 yıl) | |
Eski oyunlarda RTX 4050 ile QHD Ultra doğal ayarlarda oynanabilir kare hızlarına ulaşmak mümkündür. Daha modern oyunlar için Nvidia DLSS, AMD FSR veya Intel XeSS gibi yükselticilerin yardımına ihtiyacınız olacak.
| The Witcher 3 | |
| 1920x1080 Ultra Graphics & Postprocessing (HBAO+) | |
| Gigabyte AERO 16 OLED BSF | |
| Asus ROG Flow X16 GV601V | |
| Asus TUF Gaming A16 FA617XS | |
| Asus Vivobook Pro 16X K6604JV-MX016W | |
| Lenovo Legion Pro 5 16ARX8 (R5 7645HX, RTX 4050) | |
| Asus VivoBook Pro 16 K6602VU | |
| Ortalama NVIDIA GeForce RTX 4050 Laptop GPU (18.5 - 94.7, n=40) | |
| Sınıf ortalaması Multimedia (11 - 121, n=7, son 2 yıl) | |
| Asus VivoBook Pro 16 | |
| 2560x1440 Ultra Graphics & Postprocessing (HBAO+) | |
| Sınıf ortalaması Multimedia (78 - 88, n=2, son 2 yıl) | |
| Asus VivoBook Pro 16 K6602VU | |
| Ortalama NVIDIA GeForce RTX 4050 Laptop GPU (39 - 61.3, n=8) | |
| F1 23 | |
| 1920x1080 Ultra High Preset AA:T AF:16x | |
| Asus Vivobook Pro 16X K6604JV-MX016W | |
| Lenovo Legion Pro 5 16ARX8 (R5 7645HX, RTX 4050) | |
| Ortalama NVIDIA GeForce RTX 4050 Laptop GPU (25.7 - 60.8, n=14) | |
| Asus VivoBook Pro 16 K6602VU | |
| Sınıf ortalaması Multimedia (11 - 70.3, n=3, son 2 yıl) | |
| 2560x1440 Ultra High Preset AA:T AF:16x | |
| Sınıf ortalaması Multimedia (n=1son 2 yıl) | |
| Lenovo Legion Pro 5 16ARX8 (R5 7645HX, RTX 4050) | |
| Asus Vivobook Pro 16X K6604JV-MX016W | |
| Ortalama NVIDIA GeForce RTX 4050 Laptop GPU (16.7 - 40.8, n=11) | |
| Asus VivoBook Pro 16 K6602VU | |
| Cyberpunk 2077 1.6 | |
| 1920x1080 Ultra Preset | |
| Gigabyte AERO 16 OLED BSF | |
| Asus ROG Flow X16 GV601V | |
| Ortalama NVIDIA GeForce RTX 4050 Laptop GPU (44.4 - 79.4, n=14) | |
| Asus VivoBook Pro 16 K6602VU | |
| 2560x1440 Ultra Preset | |
| Gigabyte AERO 16 OLED BSF | |
| Asus ROG Flow X16 GV601V | |
| Asus VivoBook Pro 16 K6602VU | |
| Ortalama NVIDIA GeForce RTX 4050 Laptop GPU (27.2 - 43.1, n=10) | |
| Far Cry 5 | |
| 1920x1080 Ultra Preset AA:T | |
| Gigabyte AERO 16 OLED BSF | |
| Asus ROG Flow X16 GV601V | |
| Asus Vivobook Pro 16X K6604JV-MX016W | |
| Lenovo Legion Pro 5 16ARX8 (R5 7645HX, RTX 4050) | |
| Asus TUF Gaming A16 FA617XS | |
| Asus VivoBook Pro 16 K6602VU | |
| Ortalama NVIDIA GeForce RTX 4050 Laptop GPU (50 - 127, n=24) | |
| Sınıf ortalaması Multimedia (17 - 145, n=16, son 2 yıl) | |
| 2560x1440 Ultra Preset AA:T | |
| Gigabyte AERO 16 OLED BSF | |
| Asus ROG Flow X16 GV601V | |
| Asus Vivobook Pro 16X K6604JV-MX016W | |
| Sınıf ortalaması Multimedia (45 - 106, n=4, son 2 yıl) | |
| Lenovo Legion Pro 5 16ARX8 (R5 7645HX, RTX 4050) | |
| Ortalama NVIDIA GeForce RTX 4050 Laptop GPU (47 - 88, n=14) | |
| Asus VivoBook Pro 16 K6602VU | |
Witcher 3 FPS Tablosu
GPU soğutmasının yeterli olduğunu gösteren 1080p Ultra'da The Witcher 3 ile stres yaparken nispeten sabit bir kare hızı gözlemledik.
| düşük | orta | yüksek | ultra | QHD | 4K | |
|---|---|---|---|---|---|---|
| GTA V (2015) | 184.8 | 180.2 | 163.2 | 89 | 65.1 | |
| The Witcher 3 (2015) | 356 | 258 | 138.7 | 76.6 | 56.1 | 44.7 |
| Dota 2 Reborn (2015) | 169.6 | 153.7 | 140.1 | 126 | ||
| Final Fantasy XV Benchmark (2018) | 167 | 107.2 | 75.6 | 53.6 | ||
| X-Plane 11.11 (2018) | 159.2 | 134.6 | 108.4 | |||
| Far Cry 5 (2018) | 147 | 114 | 107 | 104 | 68 | |
| Strange Brigade (2018) | 449 | 187.4 | 151.6 | 132 | ||
| Cyberpunk 2077 1.6 (2022) | 97.5 | 74.4 | 62.2 | 57.4 | 43.1 | |
| F1 22 (2022) | 182.4 | 193.1 | 152.1 | 47.5 | 29.6 | |
| F1 23 (2023) | 197 | 200 | 140.7 | 39.7 | 25.6 |
Daha fazla kıyaslama ve oyun karşılaştırmasını özel sayfamızda bulabilirsiniz Nvidia GeForce RTX 4050 Dizüstü Bilgisayar GPU'su sayfa.
Emisyonlar: İddia edilen 90 W kombine TDP'nin altında kalıyor
Sistem Gürültüsü
Asus, daha önce diğer VivoBook'larda gördüğümüze benzer şekilde, her VivoBook Pro 16 performans profili için önceden ayarlanmış fan gürültü sınırlarını zorlar.
Standart profil, Asus'un teknik özelliklerine göre 40 dB(A)'dan daha düşük ses basınç seviyesini (SPL) hedefliyor ve testlerimiz de bunu doğruluyor. Fısıltı modu SPL'yi daha da düşürerek 30 dB(A)'nın altına indirir.
Performans modu, fanları en üst seviyeye çıkararak ölçümlerimizde 52 dB (A)'ya kadar önemli ölçüde daha yüksek gürültü seviyelerine neden olur.
Standart ve Performans modları benzer güç sınırlarına sahip olduğundan, rahatsız edici fan gürültüsü olmadan daha tolere edilebilir akustik için birincisini seçmenizi öneririz.
Ses yüksekliği
| Boşta |
| 25.28 / 25.28 / 25.28 dB |
| Çalışırken |
| 51.88 / 51.8 dB |
 | ||
30 dB sessiz 40 dB(A) duyulabilirlik 50 dB(A) gürültülü |
||
min: | ||
| Performans modu | Rölanti dB(A) | Yük ortalama dB(A) | Yük maksimum dB(A) | Witcher 3 1080p Ultra dB(A) |
|---|---|---|---|---|
| Fısıltı | 22.22 | 27.73 | 28.47 | 28.17 |
| Standart | 25.08 | 37.63 | 38.81 | 39.12 |
| Performans | 25.28 | 51.88 | 51.80 | 49.03 |
| Asus VivoBook Pro 16 K6602VU i9-13900H, GeForce RTX 4050 Laptop GPU | Asus Vivobook Pro 16X K6604JV-MX016W i9-13980HX, GeForce RTX 4060 Laptop GPU | Asus ROG Flow X16 GV601V i9-13900H, GeForce RTX 4060 Laptop GPU | Lenovo Legion Pro 5 16ARX8 (R5 7645HX, RTX 4050) R5 7645HX, GeForce RTX 4050 Laptop GPU | Asus TUF Gaming A16 FA617XS R9 7940HS, Radeon RX 7600S | Asus VivoBook Pro 16 i7-12700H, GeForce RTX 3050 Ti Laptop GPU | Gigabyte AERO 16 OLED BSF i9-13900H, GeForce RTX 4070 Laptop GPU | |
|---|---|---|---|---|---|---|---|
| Noise | -10% | 4% | 8% | -3% | -8% | -6% | |
| kapalı / ortam * (dB) | 20.96 | 25.2 -20% | 24 -15% | 23 -10% | 25 -19% | 25.2 -20% | 23 -10% |
| Idle Minimum * (dB) | 25.28 | 26.6 -5% | 24 5% | 23 9% | 25 1% | 25.2 -0% | 23 9% |
| Idle Average * (dB) | 25.28 | 26.6 -5% | 24 5% | 23 9% | 26 -3% | 25.2 -0% | 23 9% |
| Idle Maximum * (dB) | 25.28 | 29.2 -16% | 24 5% | 24.42 3% | 28 -11% | 25.2 -0% | 33.64 -33% |
| Load Average * (dB) | 51.88 | 53.4 -3% | 36.71 29% | 34.94 33% | 43 17% | 55.1 -6% | 51.49 1% |
| Witcher 3 ultra * (dB) | 49 | 50.92 -4% | 43.79 11% | 51 -4% | 55.27 -13% | ||
| Load Maximum * (dB) | 51.8 | 56.9 -10% | 50.92 2% | 50 3% | 53 -2% | 61.5 -19% | 55.24 -7% |
* ... daha küçük daha iyidir
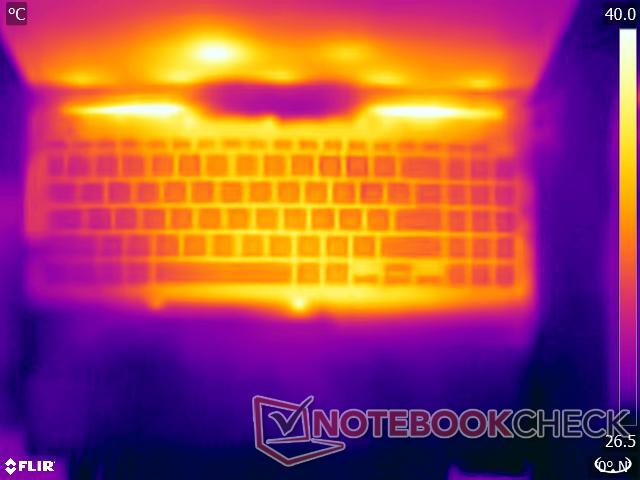
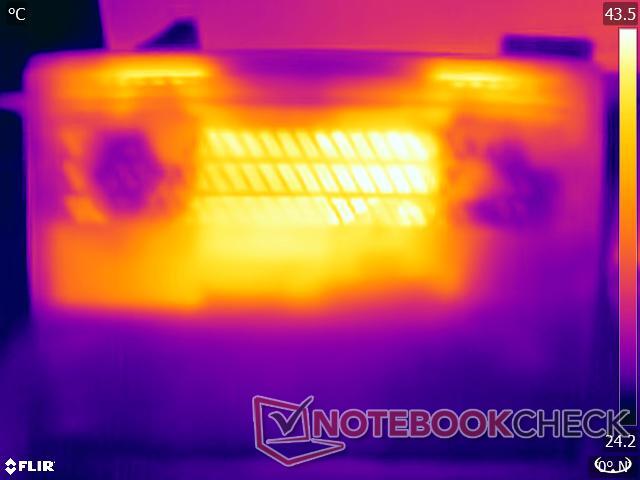
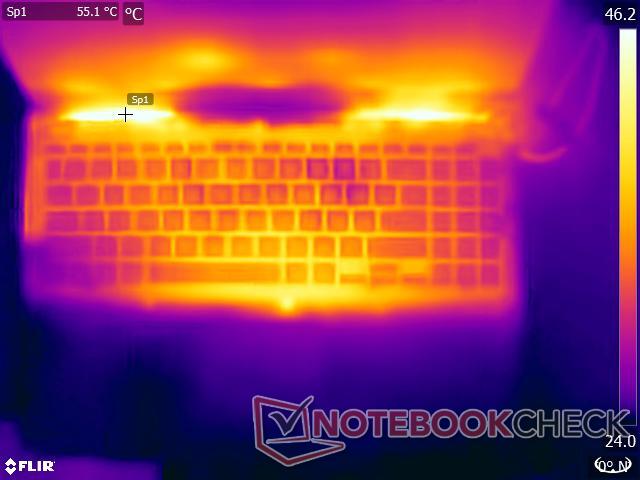
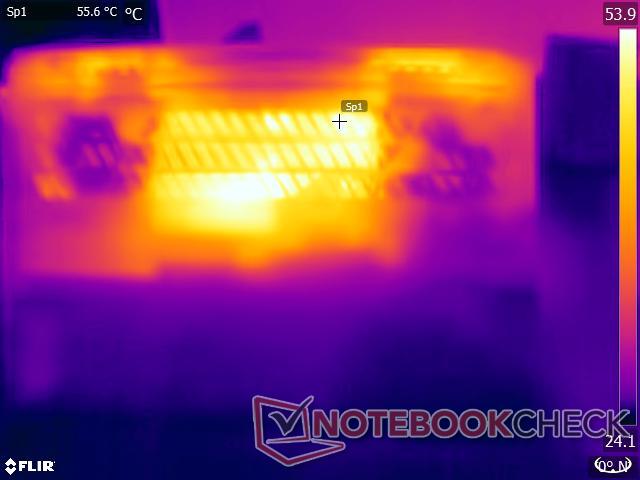
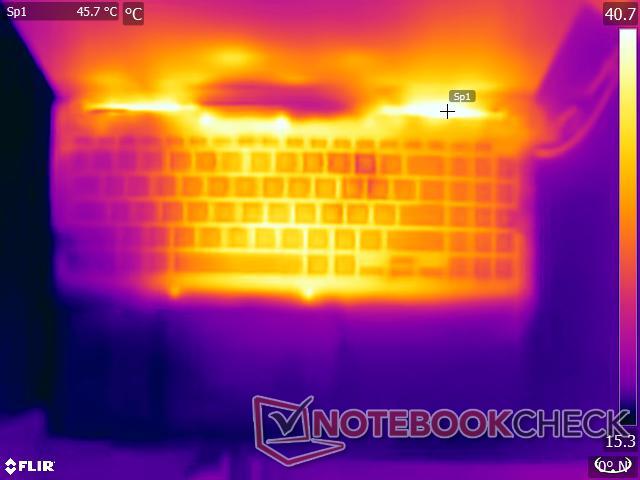
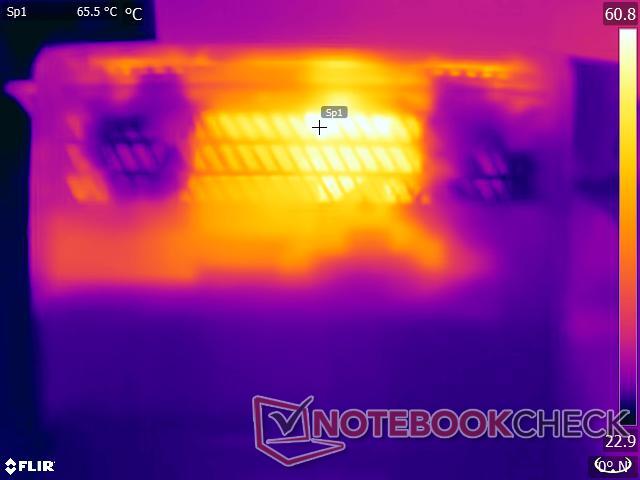
Sıcaklık
Performans modunda, maksimum yük altında üst ve alt yüzeylerde sırasıyla 42,6 °C ve 48,4 °C'ye varan sıcaklıklar kaydettik. 1080p Ultra'da Witcher 3 stresi sırasında, alt sıcaklık sıcak noktası 63,6 °C'ye ulaştı.
Bu sıcaklıklar zorlu test senaryolarında ortaya çıksa da, ağır iş yükleri çalıştırılırken tur kullanımı yine de tavsiye edilmez. Hafif üretkenliğin ötesinde herhangi bir şey potansiyel olarak fark edilebilir ısı birikimine ve rahatsızlığa neden olabilir.
Dokunmatik yüzey ve avuç içi dayanağı alanları tam yük altında bile nispeten serin kalmaktadır.
(±) Üst taraftaki maksimum sıcaklık, 36.8 °C / 98 F ortalamasına kıyasla 42.6 °C / 109 F'dir. , Multimedia sınıfı için 21 ile 71 °C arasında değişir.
(-) Alt kısım, 39.1 °C / 102 F ortalamasına kıyasla maksimum 48.4 °C / 119 F'ye kadar ısınır
(±) Boşta kullanımda, üst tarafın ortalama sıcaklığı 33.2 °C / 92 F olup, cihazın 31.3 °C / 88 F.
(-) The Witcher 3 oynarken, üst tarafın ortalama sıcaklığı 39.3 °C / 103 F olup, cihazın 31.3 °C / 88 F.
(+) Avuç içi dayanakları ve dokunmatik yüzey, maksimum 29.4 °C / 84.9 F ile cilt sıcaklığından daha soğuktur ve bu nedenle dokunulduğunda soğuktur.
(±) Benzer cihazların avuç içi dayanağı alanının ortalama sıcaklığı 28.7 °C / 83.7 F (-0.7 °C / -1.2 F) idi.
| Asus VivoBook Pro 16 K6602VU Intel Core i9-13900H, NVIDIA GeForce RTX 4050 Laptop GPU | Asus Vivobook Pro 16X K6604JV-MX016W Intel Core i9-13980HX, NVIDIA GeForce RTX 4060 Laptop GPU | Asus ROG Flow X16 GV601V Intel Core i9-13900H, NVIDIA GeForce RTX 4060 Laptop GPU | Lenovo Legion Pro 5 16ARX8 (R5 7645HX, RTX 4050) AMD Ryzen 5 7645HX, NVIDIA GeForce RTX 4050 Laptop GPU | Asus TUF Gaming A16 FA617XS AMD Ryzen 9 7940HS, AMD Radeon RX 7600S | Asus VivoBook Pro 16 Intel Core i7-12700H, NVIDIA GeForce RTX 3050 Ti Laptop GPU | Gigabyte AERO 16 OLED BSF Intel Core i9-13900H, NVIDIA GeForce RTX 4070 Laptop GPU | |
|---|---|---|---|---|---|---|---|
| Heat | 5% | 8% | -1% | 7% | 2% | 23% | |
| Maximum Upper Side * (°C) | 42.6 | 39.7 7% | 46 -8% | 45 -6% | 53 -24% | 44.2 -4% | 41 4% |
| Maximum Bottom * (°C) | 48.4 | 60 -24% | 41 15% | 54 -12% | 48 1% | 53 -10% | 47 3% |
| Idle Upper Side * (°C) | 39.4 | 30.9 22% | 36 9% | 36 9% | 30 24% | 32.1 19% | 23 42% |
| Idle Bottom * (°C) | 39.8 | 34.7 13% | 33 17% | 38 5% | 30 25% | 38.4 4% | 23 42% |
* ... daha küçük daha iyidir
Stres Testi
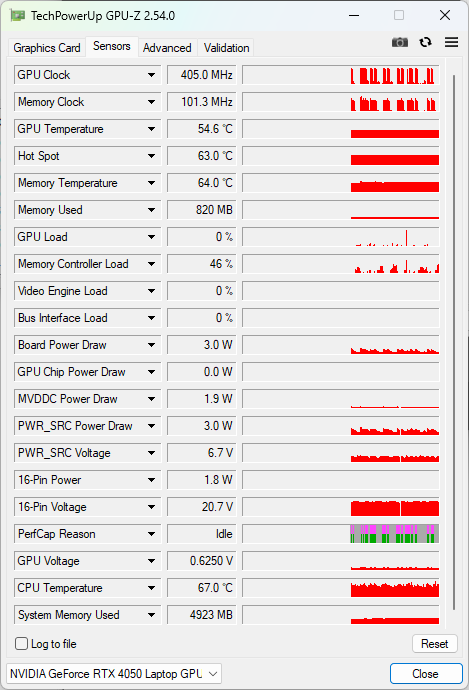
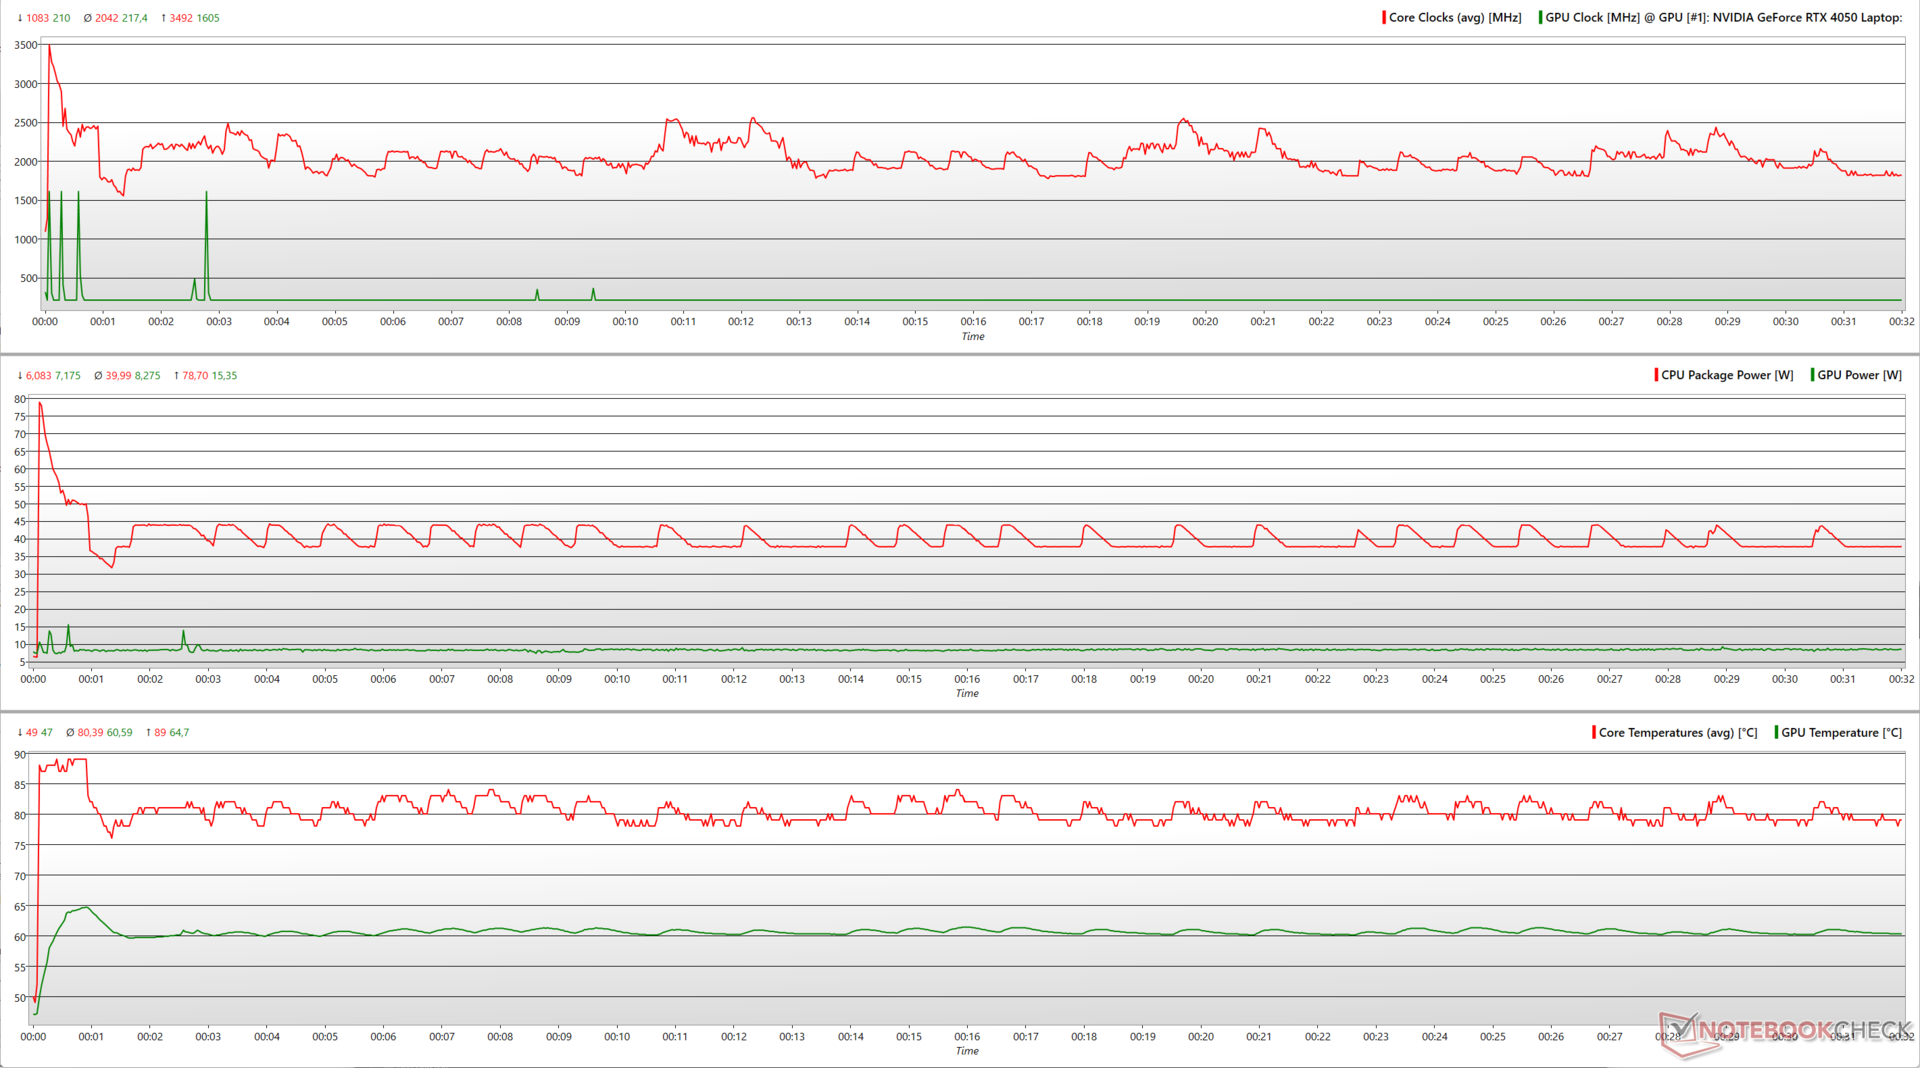
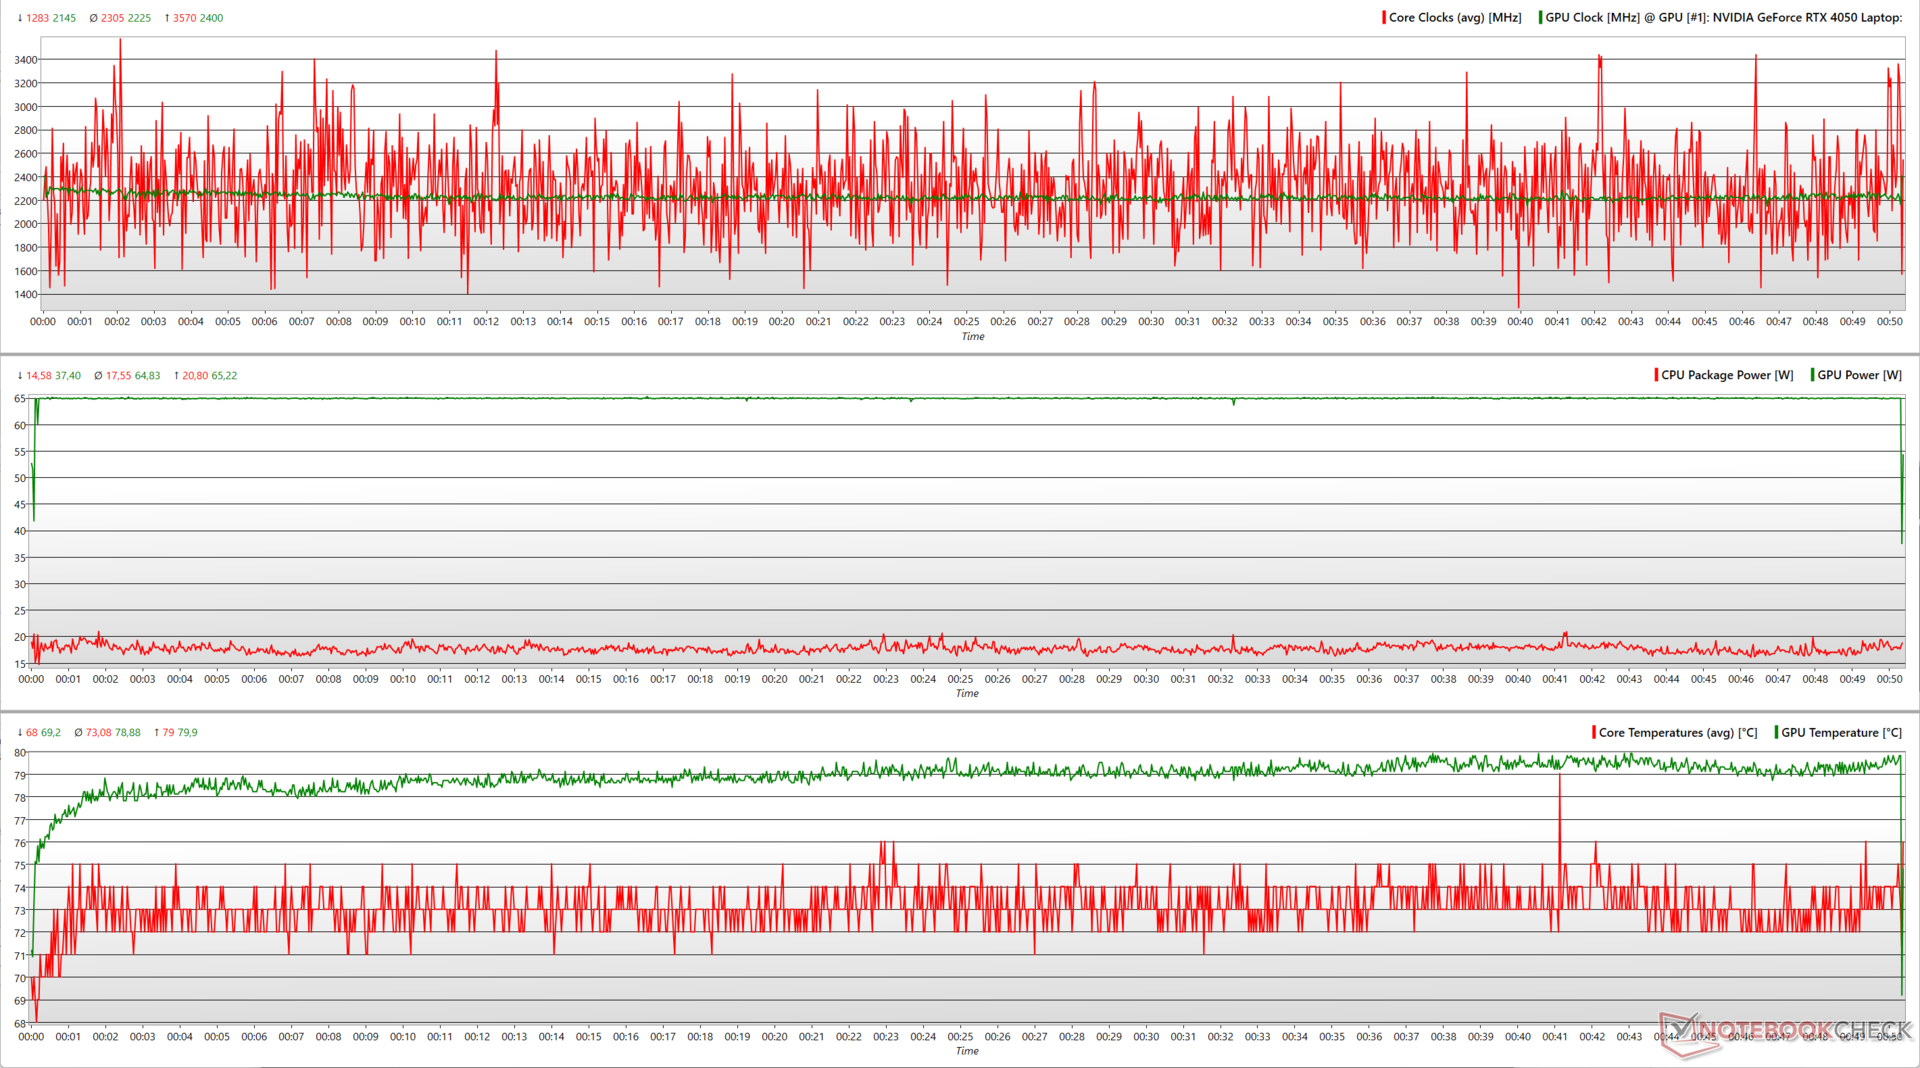
Prime95 yerinde büyük FFT stres testinde, VivoBook Pro 16'nın Core i9-13900H'si 78,7 W güç çekiminde en yüksek 3,49 GHz saat hızına ulaştı. Ortalama saatler 40 W kullanarak 2 GHz civarında sabitlendi.
FurMark GPU stresi eklendiğinde, Core i9-13900H ve RTX 4050 ortak termal boşluk için rekabet ediyor. CPU 23,5 W ile sadece 1,1 GHz ortalamaya düşerken, GPU 82 W kullanarak 2.415 MHz tepe noktasına kadar yükseliyor.
| Stres Testi | CPU Saati (GHz) | GPU Saati (MHz) | Ortalama CPU Sıcaklığı (°C) | Ortalama GPU Sıcaklığı (°C) |
| Sistem Boşta | 1,7 | 210 | 49 | 46,4 |
| Prime95 | 2.01 | 210 | 79 | 60.6 |
| Prime95 + FurMark | 1.07 | 2,415 | 71 | 64.9 |
| Witcher 3 1080p Ultra | 2,3 | 2.400 | 72 | 77,7 |
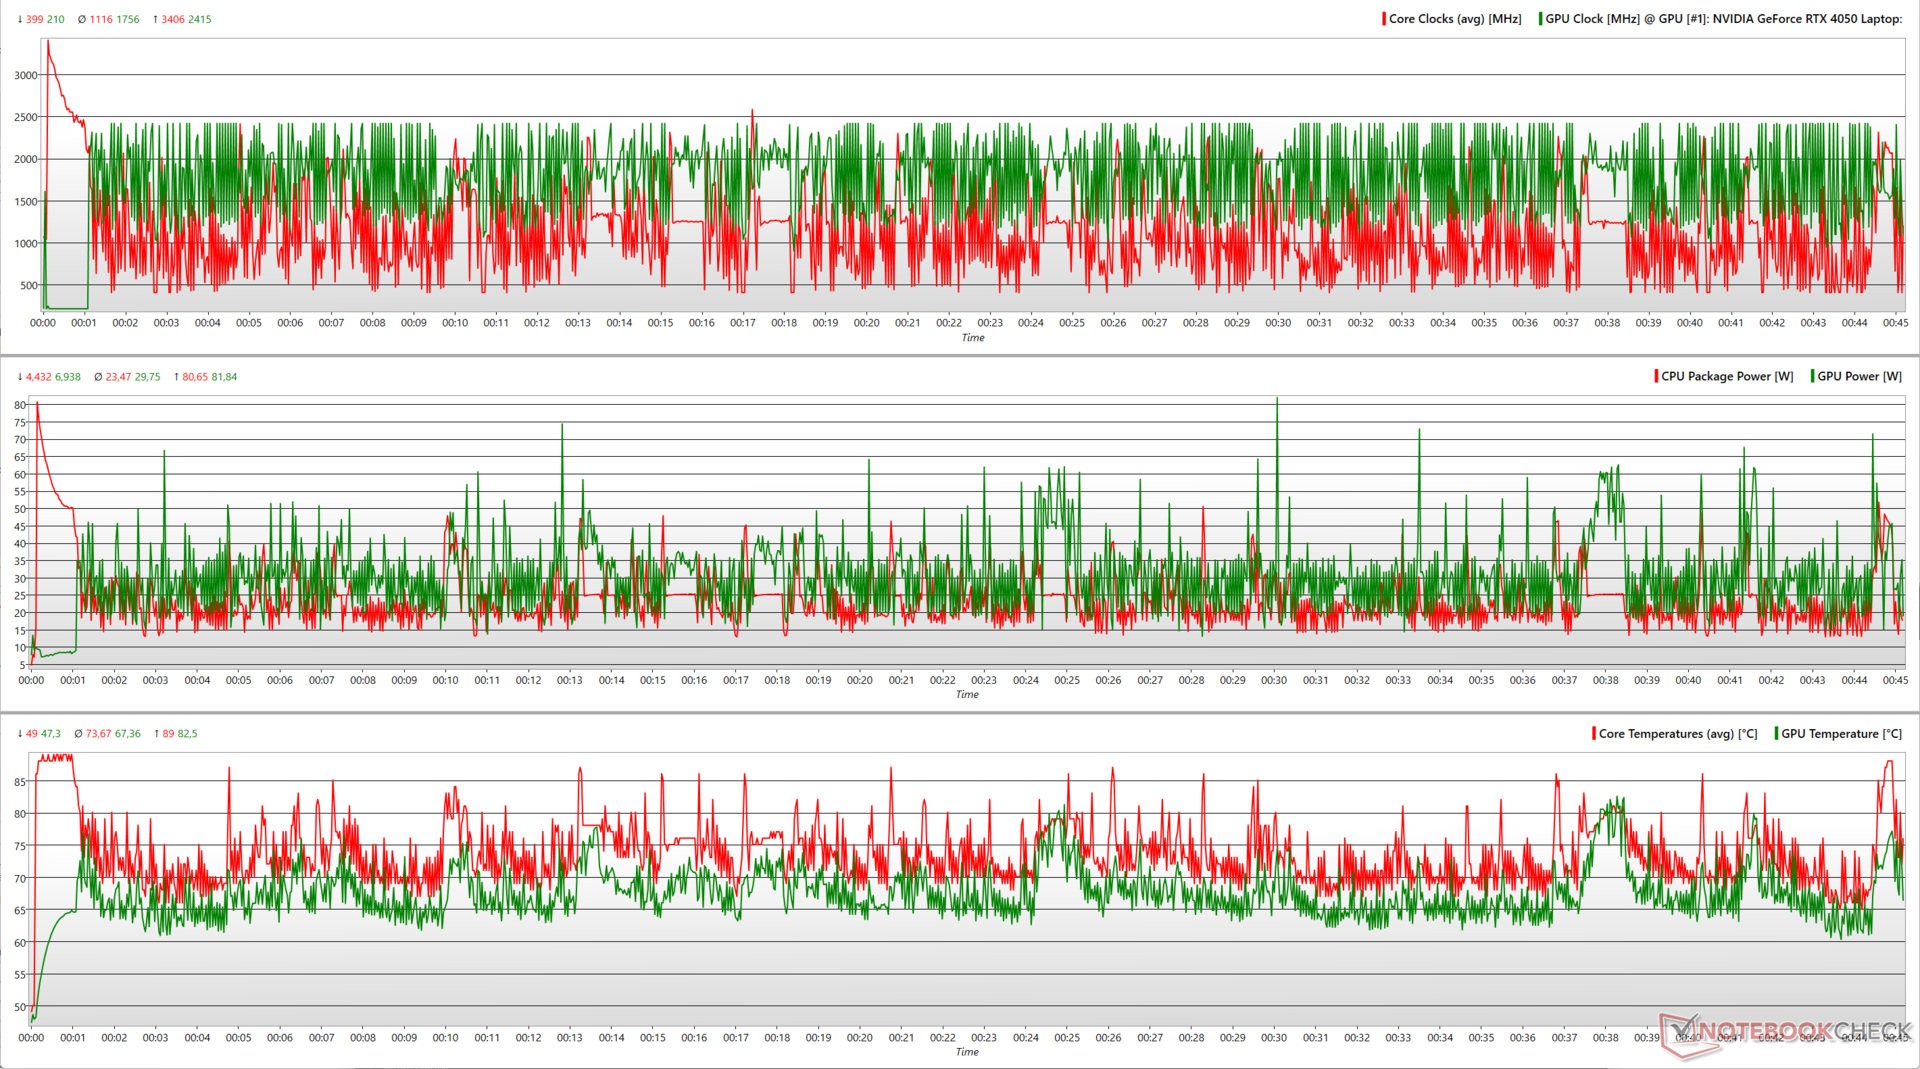
Gerçek dünya oyun yükünde( 1080p Ultra'da Witcher 3 ), VivoBook Pro 16, Core i9-13900H (ortalama 17,5 W'da 2,3 GHz) ve RTX 4050 (ortalama 65 W'da 2.225 MHz) arasında daha makul bir güç paylaşımı gösteriyor.
Asus'a göre, Performans profili CPU ve GPU arasında 90 W'a kadar birleşik TDP'ye izin vermelidir. Ancak, stres testlerimiz hiçbir zaman iddia edilen değere ulaşmadı.
Prime95 + FurMark'ta, birleşik tepe gücü kısaca 162,5 W'a ulaştı, ancak ortalama sadece 53 W. Dizüstü bilgisayar, CPU ve GPU arasında paylaşılan birleşik 86 W tepe ve 82 W ortalamaya ulaşarak The Witcher 3 stresinde daha iyi performans gösterdi.
Konuşmacılar
Asus, Smart Amp, Audio Booster ve Harman Kardon ayarlama gibi çeşitli ses geliştirmeleri sunuyor. Yerleşik hoparlörler orta ve yüksek sesleri iyi bir şekilde üretir, ancak baslar eksiktir.
Testlerimizde, en yüksek ses yüksekliği 81,6 dB(A)'ya ulaştı, bu da iç mekan kullanımı için yeterli olmalıdır. Özellikle müzik ve filmler için 3,5 mm jak veya Bluetooth 5.3 üzerinden harici ses çok daha iyi bir deneyim sağlar.
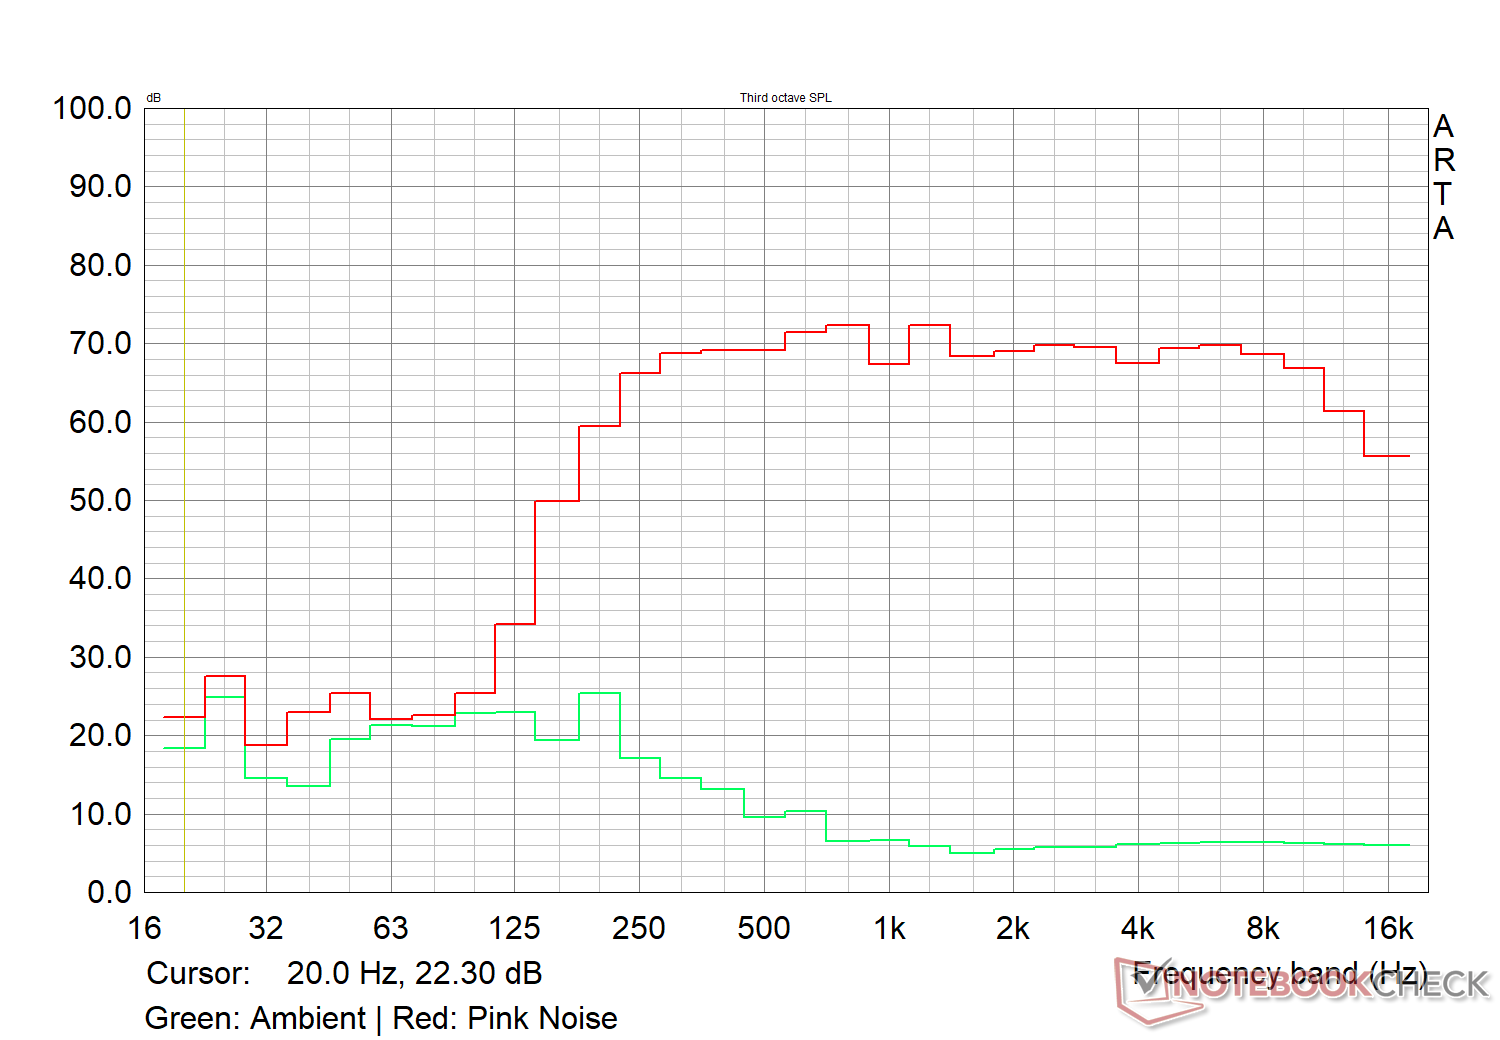
Asus VivoBook Pro 16 K6602VU ses analizi
(±) | hoparlör ses yüksekliği ortalama ama iyi (81.6 dB)
Bas 100 - 315Hz
(-) | neredeyse hiç bas yok - ortalama olarak medyandan 18% daha düşük
(±) | Bas doğrusallığı ortalamadır (12.4% delta - önceki frekans)
Ortalar 400 - 2000 Hz
(+) | dengeli ortalar - medyandan yalnızca 1.7% uzakta
(+) | orta frekanslar doğrusaldır (3.7% deltadan önceki frekansa)
Yüksekler 2 - 16 kHz
(+) | dengeli yüksekler - medyandan yalnızca 1% uzakta
(+) | yüksekler doğrusaldır (1.9% deltadan önceki frekansa)
Toplam 100 - 16.000 Hz
(+) | genel ses doğrusaldır (11.2% ortancaya göre fark)
Aynı sınıfla karşılaştırıldığında
» Bu sınıftaki tüm test edilen cihazların %17%'si daha iyi, 4% benzer, 80% daha kötüydü
» En iyisinin deltası 5% idi, ortalama 17% idi, en kötüsü 45% idi
Test edilen tüm cihazlarla karşılaştırıldığında
» Test edilen tüm cihazların %7'si daha iyi, 2 benzer, % 91 daha kötüydü
» En iyisinin deltası 4% idi, ortalama 23% idi, en kötüsü 134% idi
Apple MacBook Pro 16 2021 M1 Pro ses analizi
(+) | hoparlörler nispeten yüksek sesle çalabilir (84.7 dB)
Bas 100 - 315Hz
(+) | iyi bas - medyandan yalnızca 3.8% uzakta
(+) | bas doğrusaldır (5.2% delta ile önceki frekans)
Ortalar 400 - 2000 Hz
(+) | dengeli ortalar - medyandan yalnızca 1.3% uzakta
(+) | orta frekanslar doğrusaldır (2.1% deltadan önceki frekansa)
Yüksekler 2 - 16 kHz
(+) | dengeli yüksekler - medyandan yalnızca 1.9% uzakta
(+) | yüksekler doğrusaldır (2.7% deltadan önceki frekansa)
Toplam 100 - 16.000 Hz
(+) | genel ses doğrusaldır (4.6% ortancaya göre fark)
Aynı sınıfla karşılaştırıldığında
» Bu sınıftaki tüm test edilen cihazların %0%'si daha iyi, 0% benzer, 100% daha kötüydü
» En iyisinin deltası 5% idi, ortalama 17% idi, en kötüsü 45% idi
Test edilen tüm cihazlarla karşılaştırıldığında
» Test edilen tüm cihazların %0'si daha iyi, 0 benzer, % 100 daha kötüydü
» En iyisinin deltası 4% idi, ortalama 23% idi, en kötüsü 134% idi
Enerji Yönetimi: Boşta daha yüksek güç çeker ancak yük altında tutumludur
Güç Tüketimi
VivoBook Pro 16'nın yük altındaki genel güç tüketimi rakiplerine kıyasla çok ekonomiktir. Bununla birlikte, bekleme ve boşta güç çekimleri endişe kaynağı gibi görünüyor.
Birlikte verilen 150 W güç adaptörü, dizüstü bilgisayarı stres altında çalıştırmak için fazlasıyla yeterli.
| Kapalı / Bekleme modu | |
| Boşta | |
| Çalışırken |
|
Key:
min: | |
| Asus VivoBook Pro 16 K6602VU i9-13900H, GeForce RTX 4050 Laptop GPU, OLED, 3200x2000, 16" | Asus Vivobook Pro 16X K6604JV-MX016W i9-13980HX, GeForce RTX 4060 Laptop GPU, OLED, 3200x2000, 16" | Asus ROG Flow X16 GV601V i9-13900H, GeForce RTX 4060 Laptop GPU, IPS, 2560x1600, 16" | Lenovo Legion Pro 5 16ARX8 (R5 7645HX, RTX 4050) R5 7645HX, GeForce RTX 4050 Laptop GPU, IPS, 2560x1600, 16" | Asus TUF Gaming A16 FA617XS R9 7940HS, Radeon RX 7600S, IPS, 1920x1200, 16" | Asus VivoBook Pro 16 i7-12700H, GeForce RTX 3050 Ti Laptop GPU, IPS, 2560x1600, 16" | Gigabyte AERO 16 OLED BSF i9-13900H, GeForce RTX 4070 Laptop GPU, OLED, 3840x2400, 16" | Ortalama NVIDIA GeForce RTX 4050 Laptop GPU | Sınıf ortalaması Multimedia | |
|---|---|---|---|---|---|---|---|---|---|
| Power Consumption | -32% | -9% | -10% | 6% | -1% | -10% | 4% | 36% | |
| Idle Minimum * (Watt) | 21.06 | 13.8 34% | 9.6 54% | 13 38% | 7 67% | 8.7 59% | 11.8 44% | 9.95 ? 53% | 5.66 ? 73% |
| Idle Average * (Watt) | 24.27 | 16 34% | 16 34% | 17.4 28% | 10 59% | 13.1 46% | 16.1 34% | 15.8 ? 35% | 10.2 ? 58% |
| Idle Maximum * (Watt) | 25.12 | 19 24% | 16.9 33% | 21.8 13% | 15 40% | 18.3 27% | 17 32% | 20.1 ? 20% | 12.5 ? 50% |
| Load Average * (Watt) | 52.4 | 147 -181% | 104 -98% | 96.4 -84% | 86 -64% | 116 -121% | 100.6 -92% | 88 ? -68% | 65.2 ? -24% |
| Witcher 3 ultra * (Watt) | 110.2 | 147.8 -34% | 142 -29% | 125 -13% | 160.6 -46% | 117.6 -7% | 158 -43% | ||
| Load Maximum * (Watt) | 146 | 244 -67% | 214 -47% | 204 -40% | 172 -18% | 162 -11% | 192 -32% | 176.3 ? -21% | 113.5 ? 22% |
* ... daha küçük daha iyidir
Power Consumption: The Witcher 3 / Stress test
Power Consumption: External monitor
Pil Ömrü
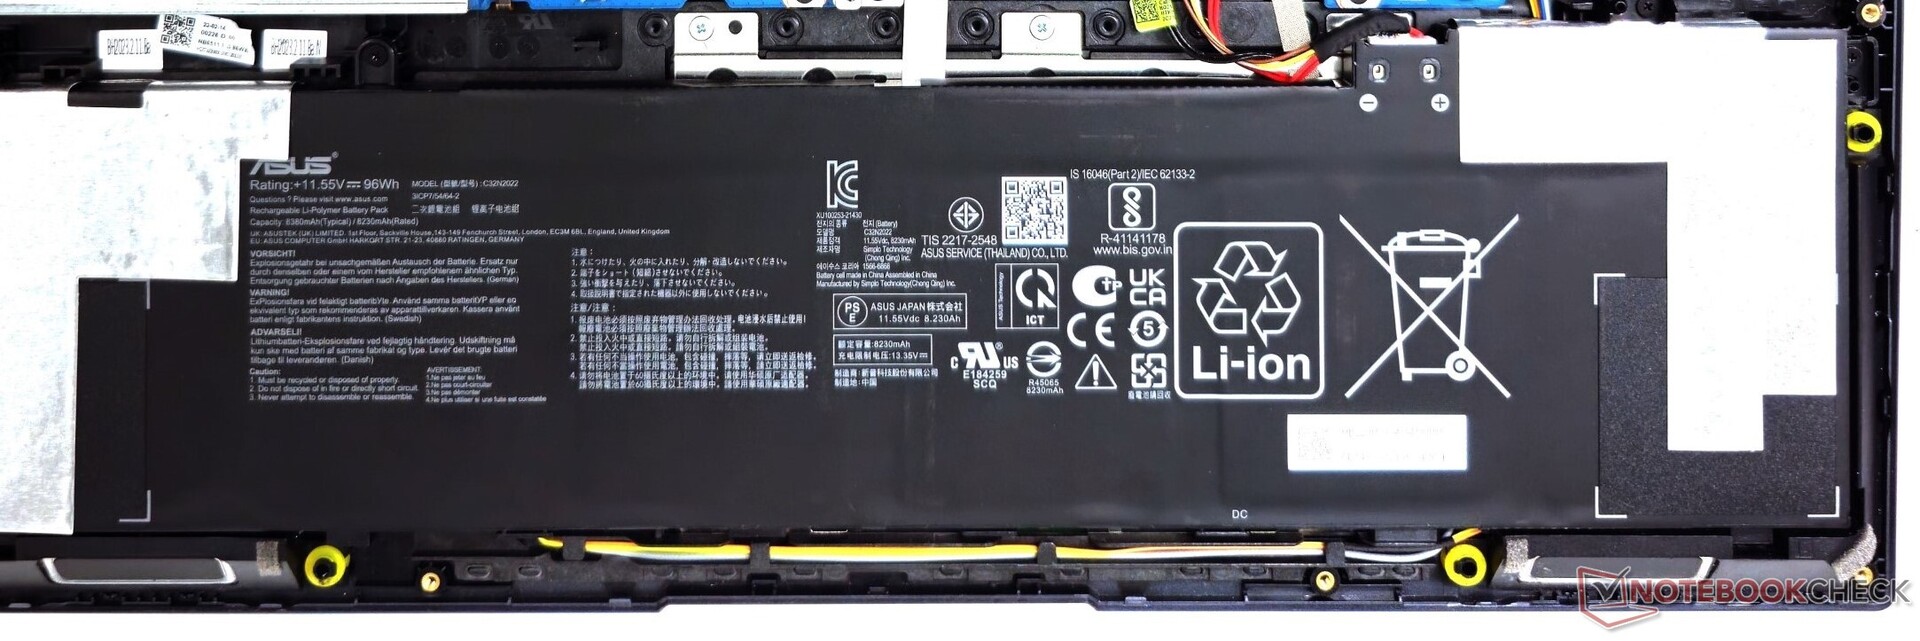
96 WHr pil, geçen yılın modelindeki 70 WHr kapasiteye göre belirgin bir gelişme. Pil, web'de gezinme ve 150 nit'te H.264 1080p video oynatma sırasında ~10 saat çalışma süresi sağlayabilir.
Ürünle birlikte verilen güç adaptörü pili yaklaşık 30 dakikada %50'ye kadar hızlı şarj edebiliyor.
| Asus VivoBook Pro 16 K6602VU i9-13900H, GeForce RTX 4050 Laptop GPU, 96 Wh | Asus Vivobook Pro 16X K6604JV-MX016W i9-13980HX, GeForce RTX 4060 Laptop GPU, 90 Wh | Asus ROG Flow X16 GV601V i9-13900H, GeForce RTX 4060 Laptop GPU, 90 Wh | Lenovo Legion Pro 5 16ARX8 (R5 7645HX, RTX 4050) R5 7645HX, GeForce RTX 4050 Laptop GPU, 80 Wh | Asus TUF Gaming A16 FA617XS R9 7940HS, Radeon RX 7600S, 90 Wh | Asus VivoBook Pro 16 i7-12700H, GeForce RTX 3050 Ti Laptop GPU, 70 Wh | Gigabyte AERO 16 OLED BSF i9-13900H, GeForce RTX 4070 Laptop GPU, 88 Wh | Sınıf ortalaması Multimedia | |
|---|---|---|---|---|---|---|---|---|
| Pil Çalışma Süresi | -41% | -16% | -45% | 25% | -28% | -25% | 48% | |
| H.264 (h) | 9.8 | 5.3 -46% | 8.9 -9% | 5.4 -45% | 12.4 27% | 7.4 -24% | 17.1 ? 74% | |
| WiFi v1.3 (h) | 10.1 | 6.5 -36% | 7.9 -22% | 5.6 -45% | 12.4 23% | 7.3 -28% | 7.5 -26% | 12.2 ? 21% |
| Load (h) | 1.5 | 1.5 | 0.9 | 2.1 | 1.664 ? | |||
| Witcher 3 ultra (h) | 0.8 | |||||||
| Reader / Idle (h) | 20.3 | 24.9 ? |
Artılar
Eksiler
Karar: ProArt serisine para yatırmadan önce ilk durak
2023 Asus VivoBook Pro 16 K6602VU, önceki modele göre kayda değer yükseltmeler getiriyor selef. Lüks olmasa da VivoBook Pro 16 sağlam bir yapıya sahip.
Göze çarpan özelliği, Asus'un daha pahalı ProArt serisinden ödünç alınan ve hem içerik oluşturmak hem de tüketmek için mükemmel olan muhteşem 3.2K 120 Hz OLED ekranıdır. 96 WHr'lik yeni pil sayesinde pil çalışma süreleri de yaklaşık 10 saate çıkmıştır.
Multimedya kullanıcılarını ve hobi amaçlı içerik oluşturucuları hedefleyen Asus VivoBook Pro 16 K6602, daha pahalı ProArt StudioBook serisini düşünmeden önce tatlı bir noktaya ulaşıyor. Core i9-13900H ve RTX 4050 kombinasyonu çoğu işi halledebilirken, güçlü kullanıcılar başka bir yere bakmak isteyecektir.
Wi-Fi 6E performansı daha iyi optimize edilebilir ve bağlantı noktası yerleşimi iyileştirilebilir. Bununla birlikte, bu dizüstü bilgisayarla ilgili ana sorunumuz, Asus'un Core i9-13900H CPU'nun potansiyelini, güç sınırlarını yeteneklerinin altında kısıtlayarak sınırlamasıdır.
CPU ve GPU kombinasyonu, Asus'un iddia ettiği 90 W birleşik TDP hedefinin altında kalıyor. Bununla birlikte, günlük üretkenlik ve amatör yaratıcı çalışmalar için hala yeterli performans sağlıyor. RTX 4050, yükseltici desteği ile makul yüksek çözünürlüklü oyunlara bile olanak sağlıyor.
Birkaç eksikliğine rağmen VivoBook Pro 16, ₹1,54,990 (2,199 €) civarında oyun oynamanın yanı sıra yaratabilecek çok yönlü bir multimedya dizüstü bilgisayar arayan alıcılar için güçlü bir rakip.
VivoBook estetiğini seven ancak daha da güçlü bir şey isteyenler için
Asus VivoBook Pro 16X K6604 core i9-13980HX ile uygun olacaktır. Bu Gigabyte Aero 16 OLED BSF daha kaliteli bir yapı ve güçlü bir GPU arıyorsanız bir başka uygun ancak pahalı seçenektir.Fiyat ve Bulunabilirlik
Asus VivoBook Pro 16 OLED K6602VU'nun test edilen konfigürasyonu Asus Hindistan mağazasından ve Amazon Hindistan'dan ₹1,54,990'a alınabilir.
ABD'de Best Buy şu anda RTX 4060 ile VivoBook Pro 16 K6602VV'yi 1.700 ABD dolarına sunarken Amazon ABD 1.673 ABD dolarına stoklamaktadır. Bu SKU'nun FHD + varyantı Amazon ABD'de 1.300 ABD Doları karşılığında alınabilir.
Asus VivoBook Pro 16 K6602VU
- 11/09/2023 v7 (old)
Vaidyanathan Subramaniam
Şeffaflık
İncelenecek cihazların seçimi editör ekibimiz tarafından yapılır. Test örneği, bu incelemenin amacı doğrultusunda üretici veya perakendeci tarafından yazara ödünç olarak sağlanmıştır. Borç verenin bu inceleme üzerinde herhangi bir etkisi olmadığı gibi, üretici de yayınlanmadan önce bu incelemenin bir kopyasını almamıştır. Bu incelemeyi yayınlama zorunluluğu yoktu. Bağımsız bir medya şirketi olarak Notebookcheck, üreticilerin, perakendecilerin veya yayıncıların otoritesine tabi değildir.
Notebookcheck bu şekilde test yapıyor
Notebookcheck, tüm sonuçların karşılaştırılabilir olmasını sağlamak için her yıl yüzlerce dizüstü bilgisayarı ve akıllı telefonu standart prosedürler kullanarak bağımsız olarak inceliyor. Yaklaşık 20 yıldır test yöntemlerimizi sürekli olarak geliştirdik ve bu süreçte endüstri standartlarını belirledik. Test laboratuvarlarımızda deneyimli teknisyenler ve editörler tarafından yüksek kaliteli ölçüm ekipmanları kullanılmaktadır. Bu testler çok aşamalı bir doğrulama sürecini içerir. Karmaşık derecelendirme sistemimiz, nesnelliği koruyan yüzlerce sağlam temellere dayanan ölçüm ve kıyaslamaya dayanmaktadır.Price comparison

