Core i7 ve GeForce RTX 3070’li Zotac Magnus One masaüstü PC incelemede
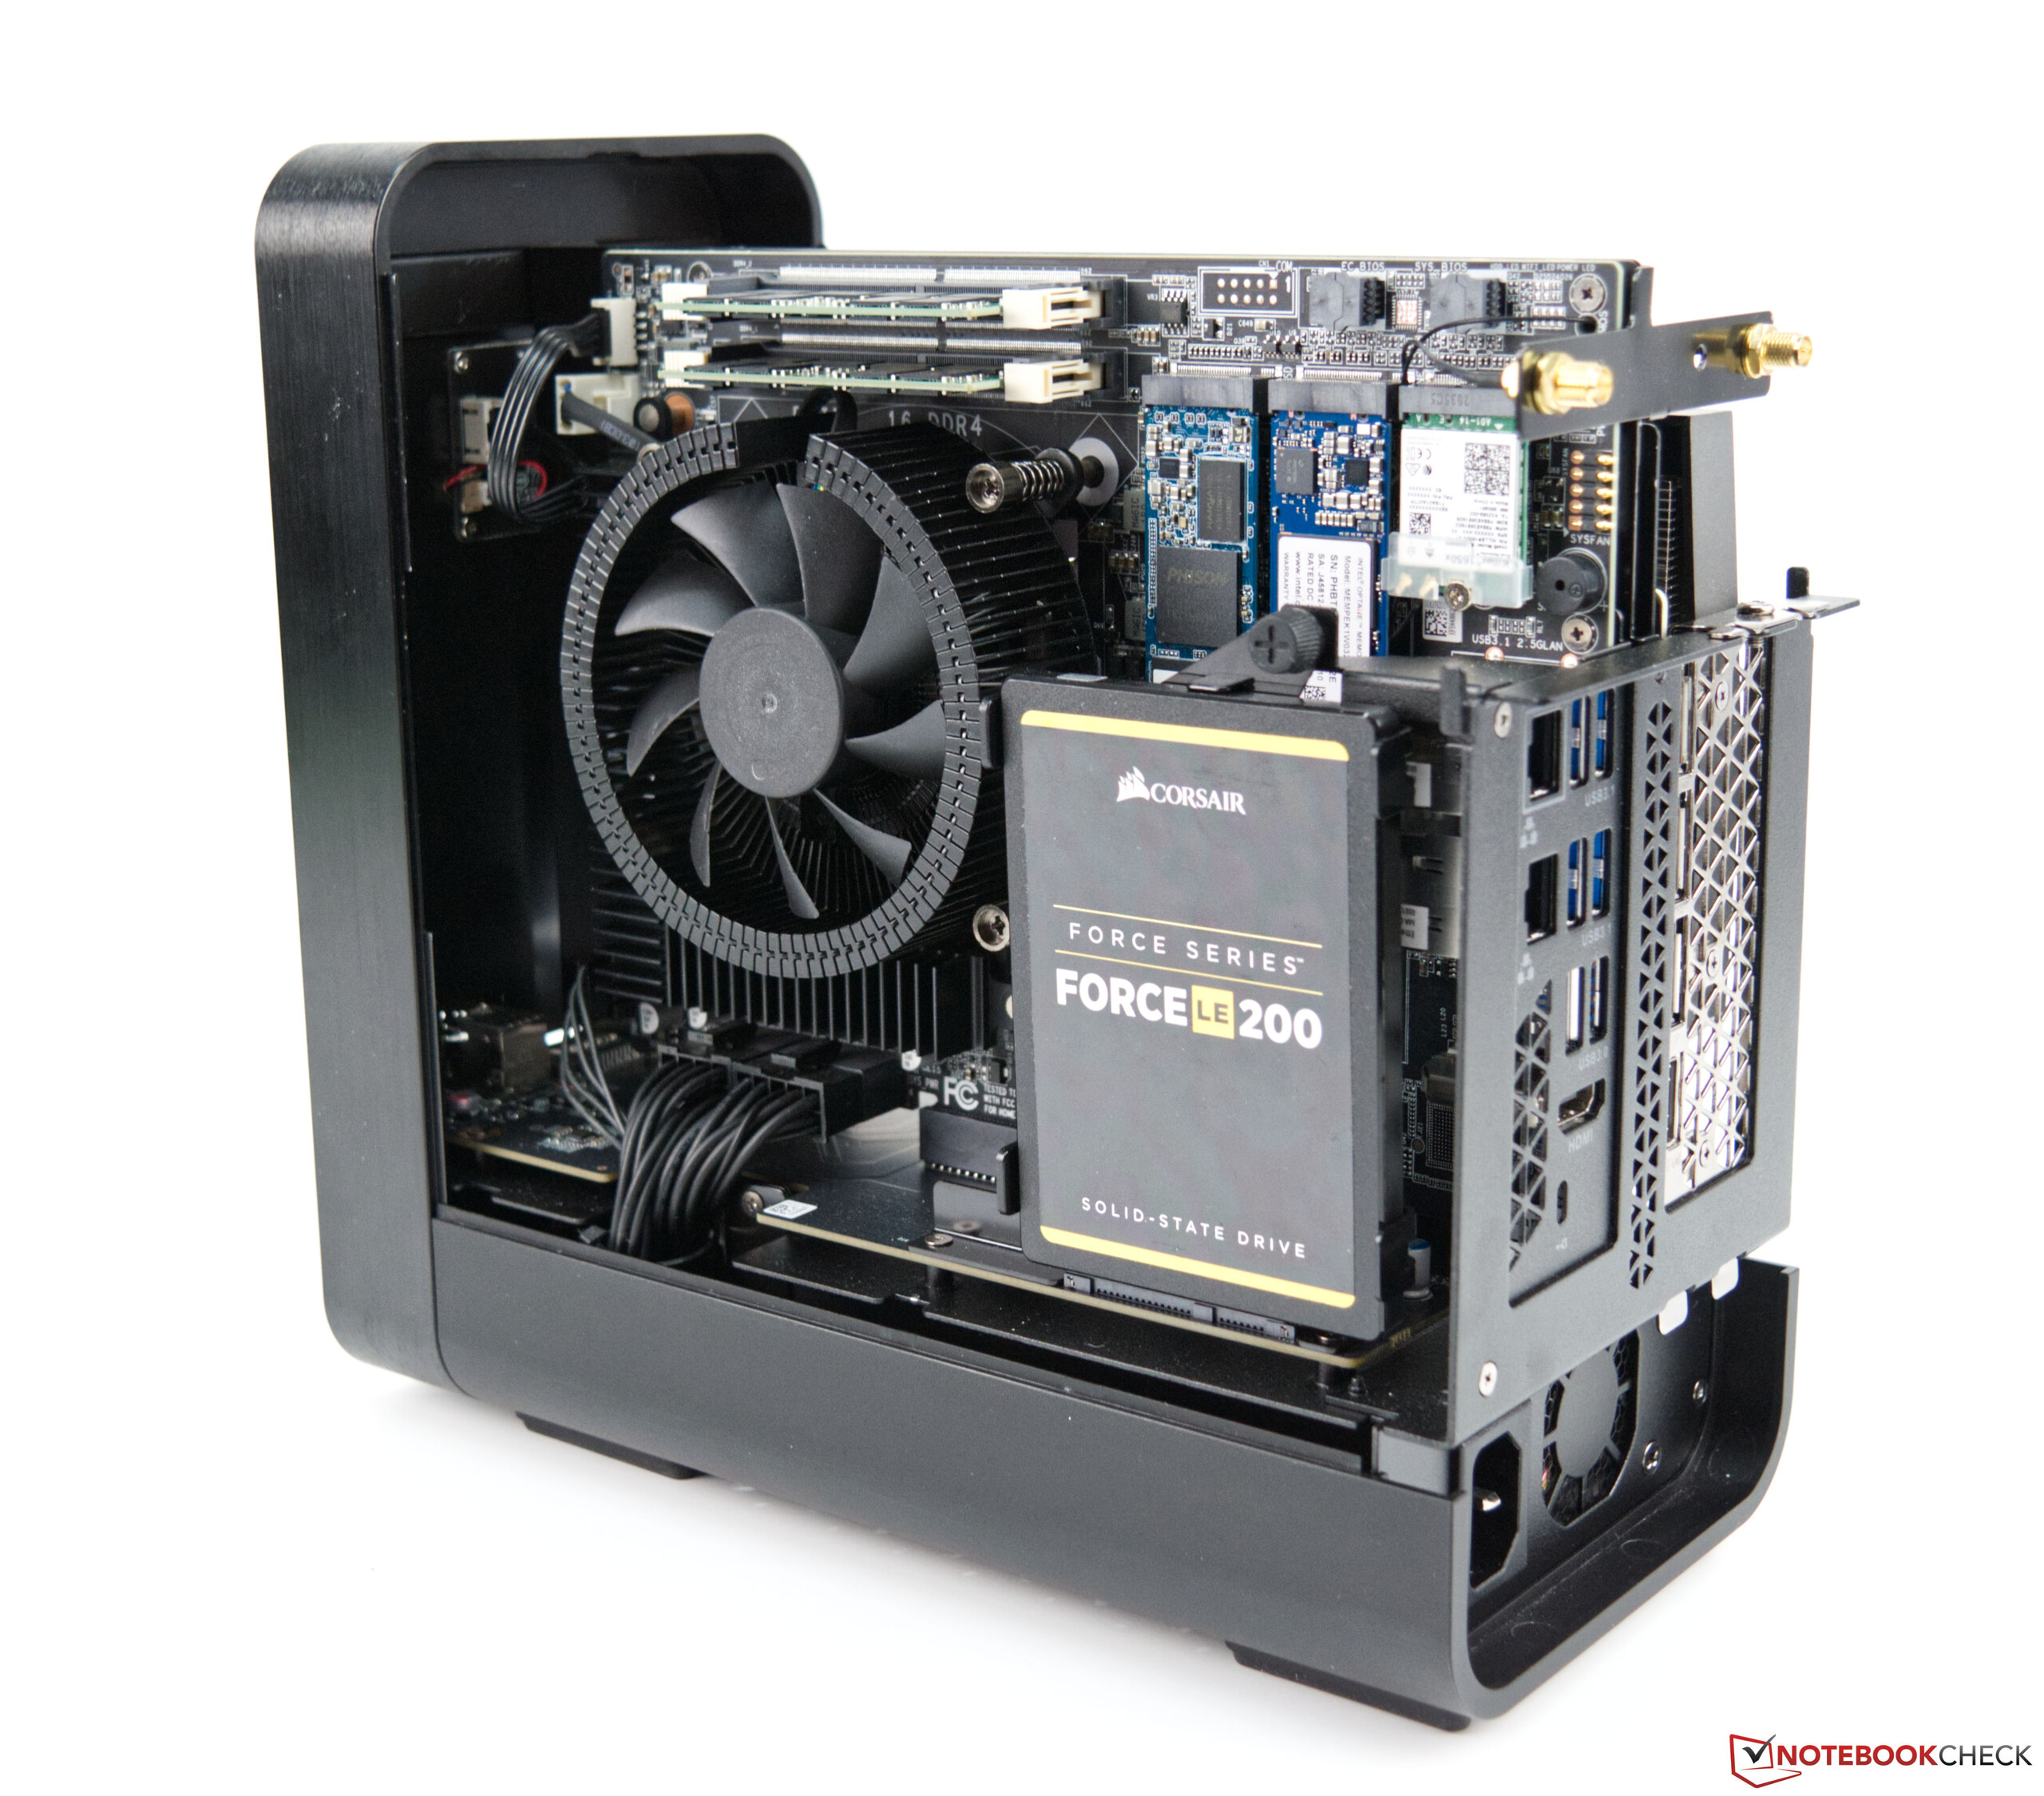
Yeni Magnus One serisi ile Zotac, portföylerine başka bir kompakt oyun bilgisayarı sunuyor. Ancak hemen söylememiz gerekir ki Zotac Magnus One bir barebone sistemdir. Bu, RAM, yığın depolama ve ayrıca işletim sisteminin ayrı olarak satın alınması gerektiği anlamına gelir. Benzer bir yaklaşım Zotac tarafından daha da kompakt olan ZBOX Magnus ile benimsenmiştir.
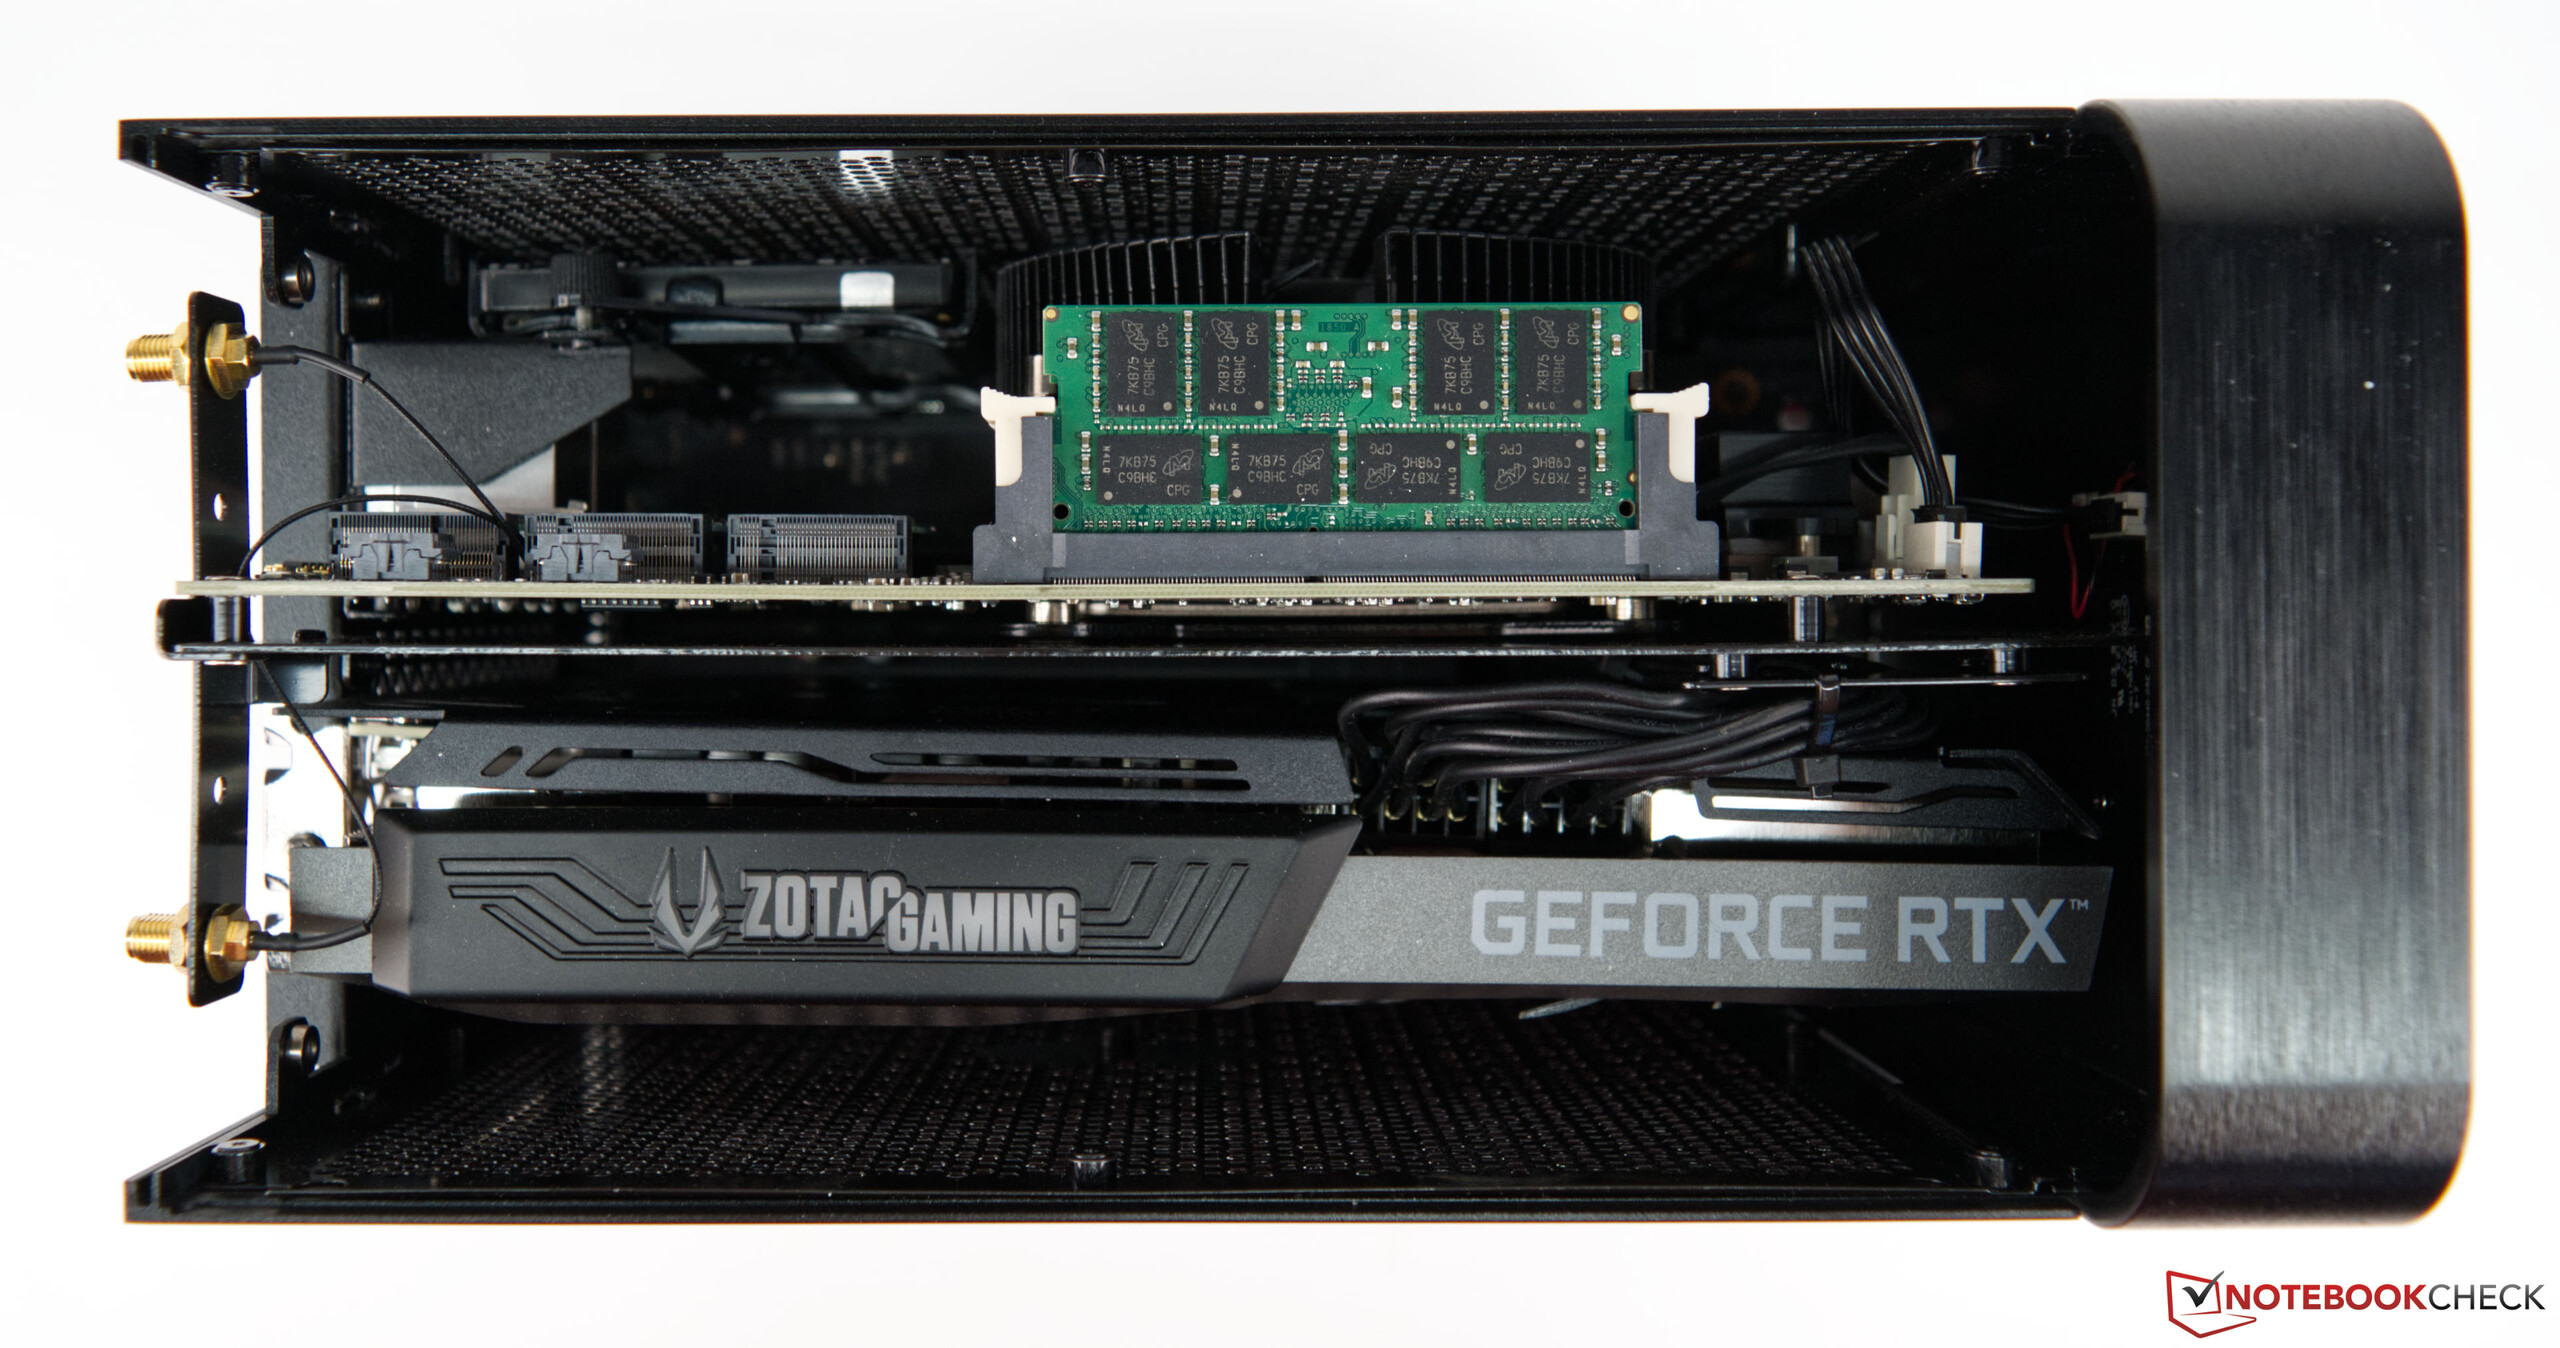
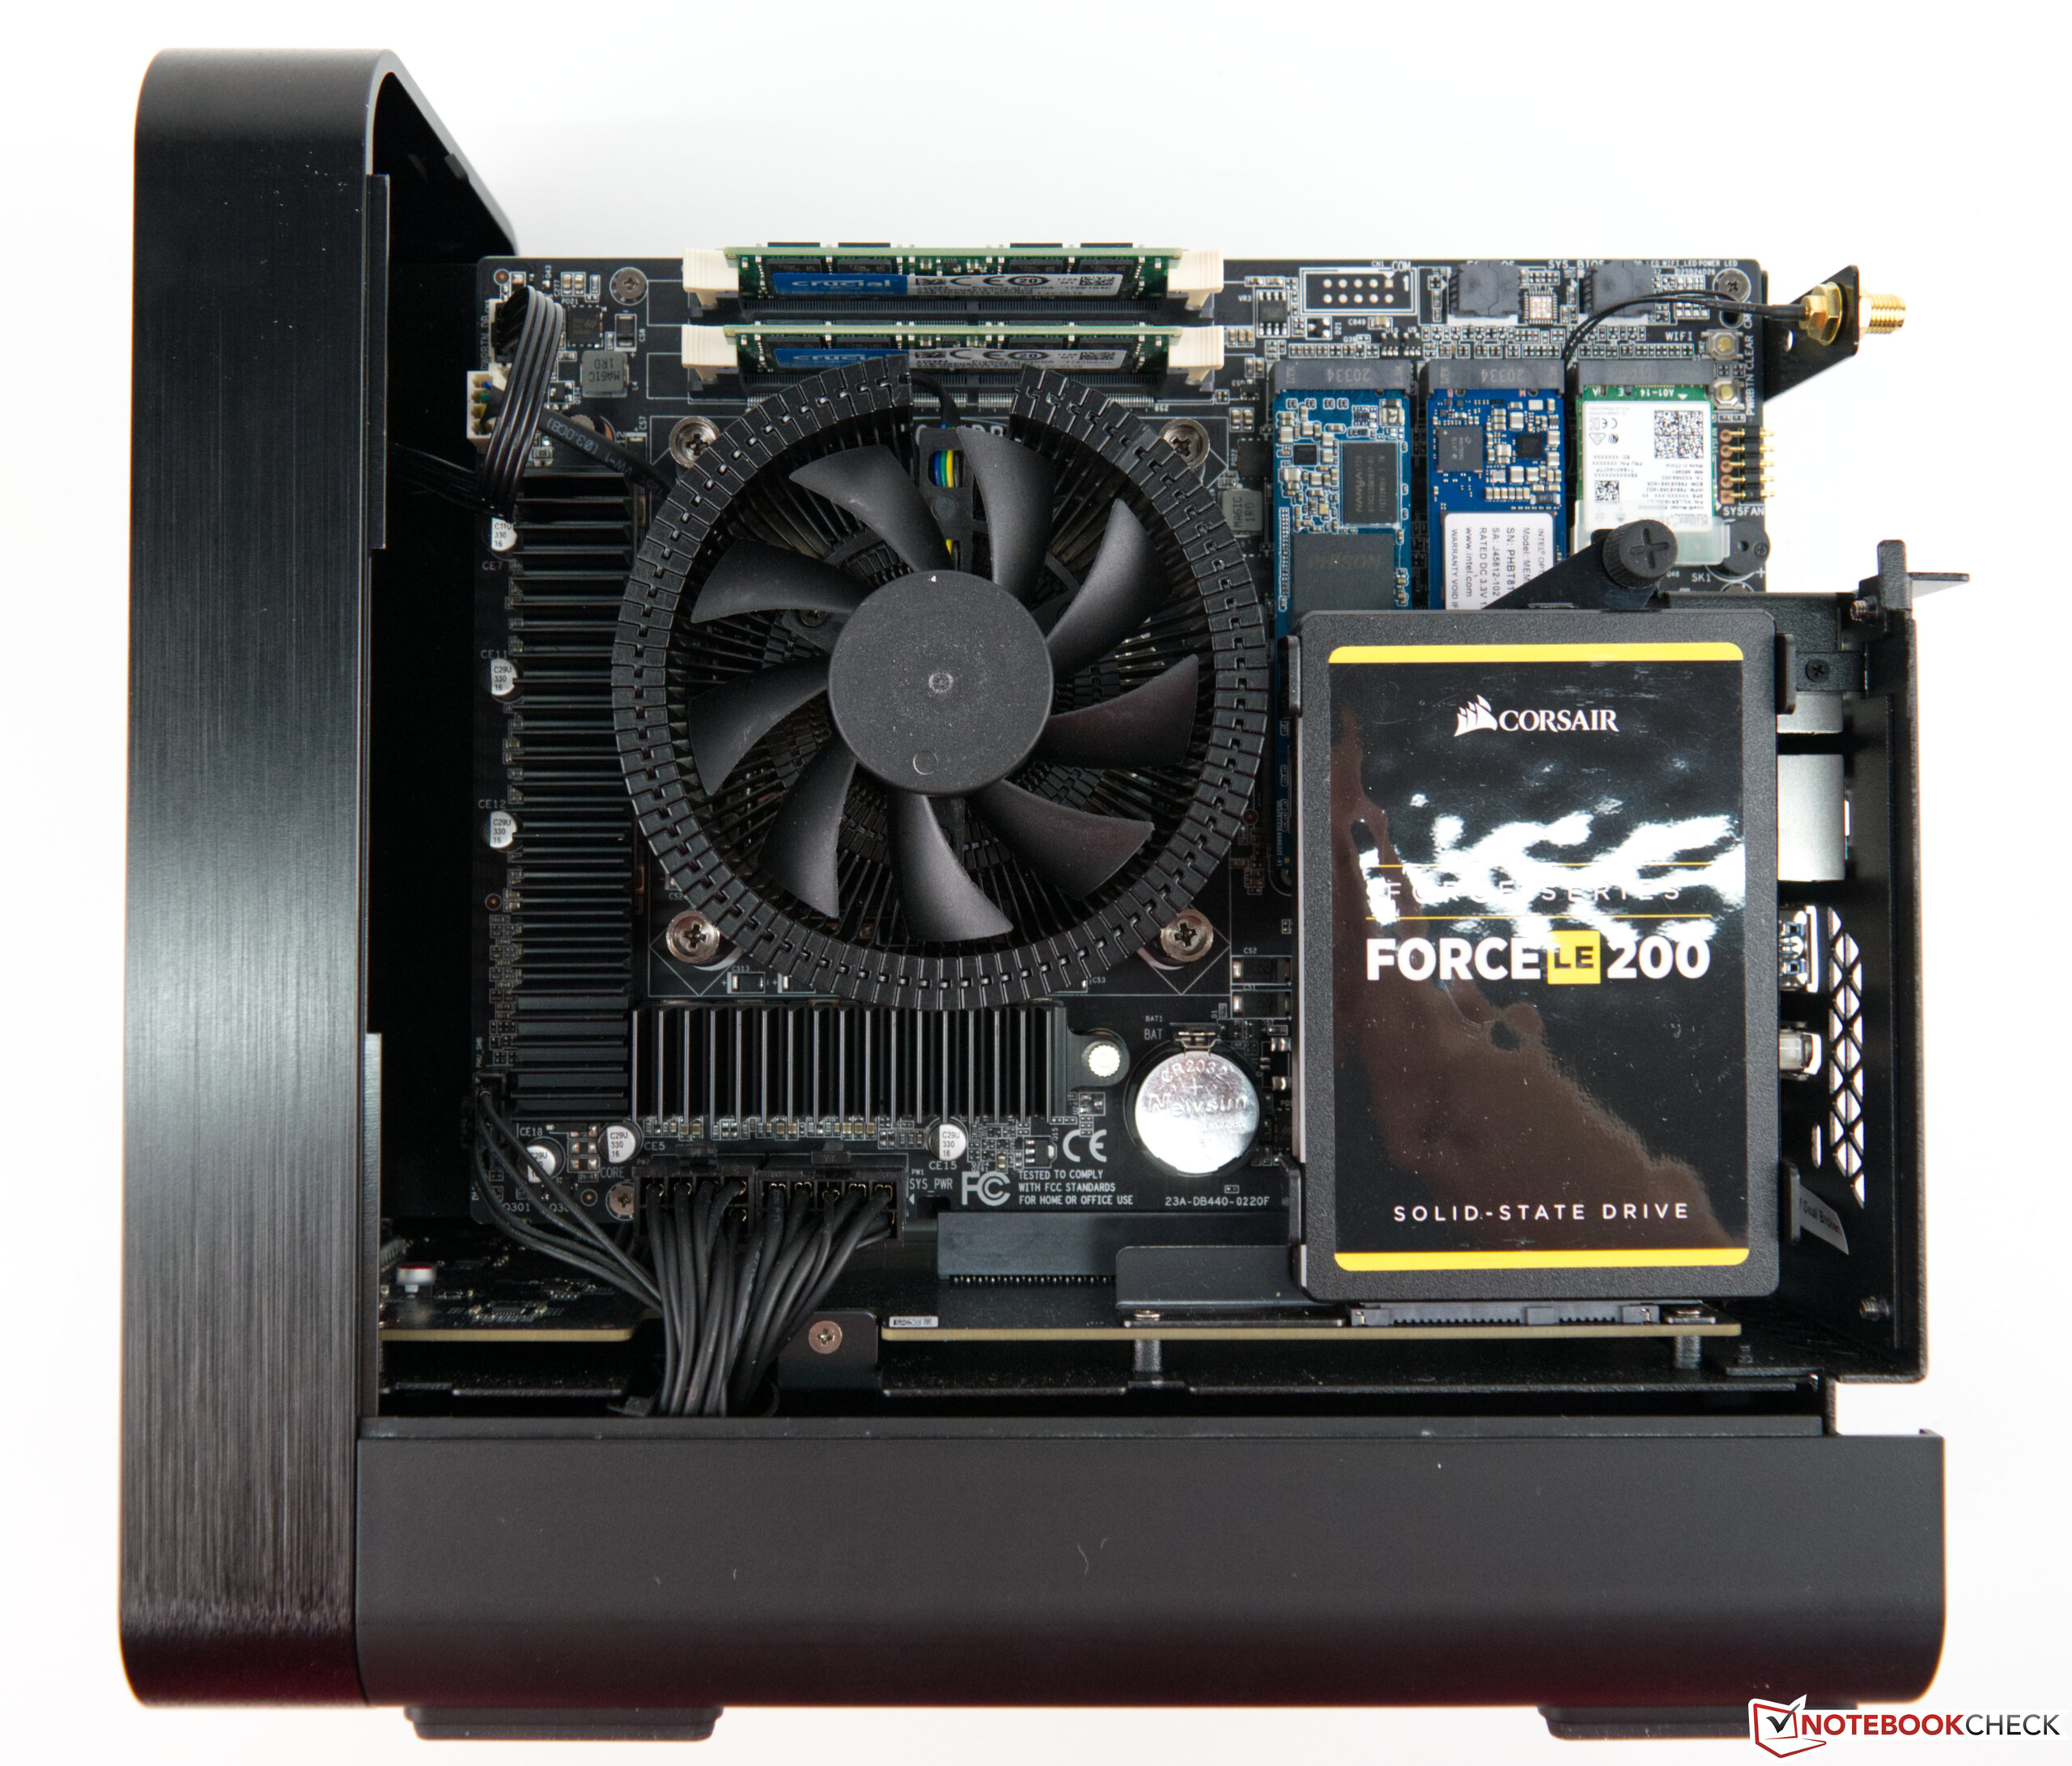
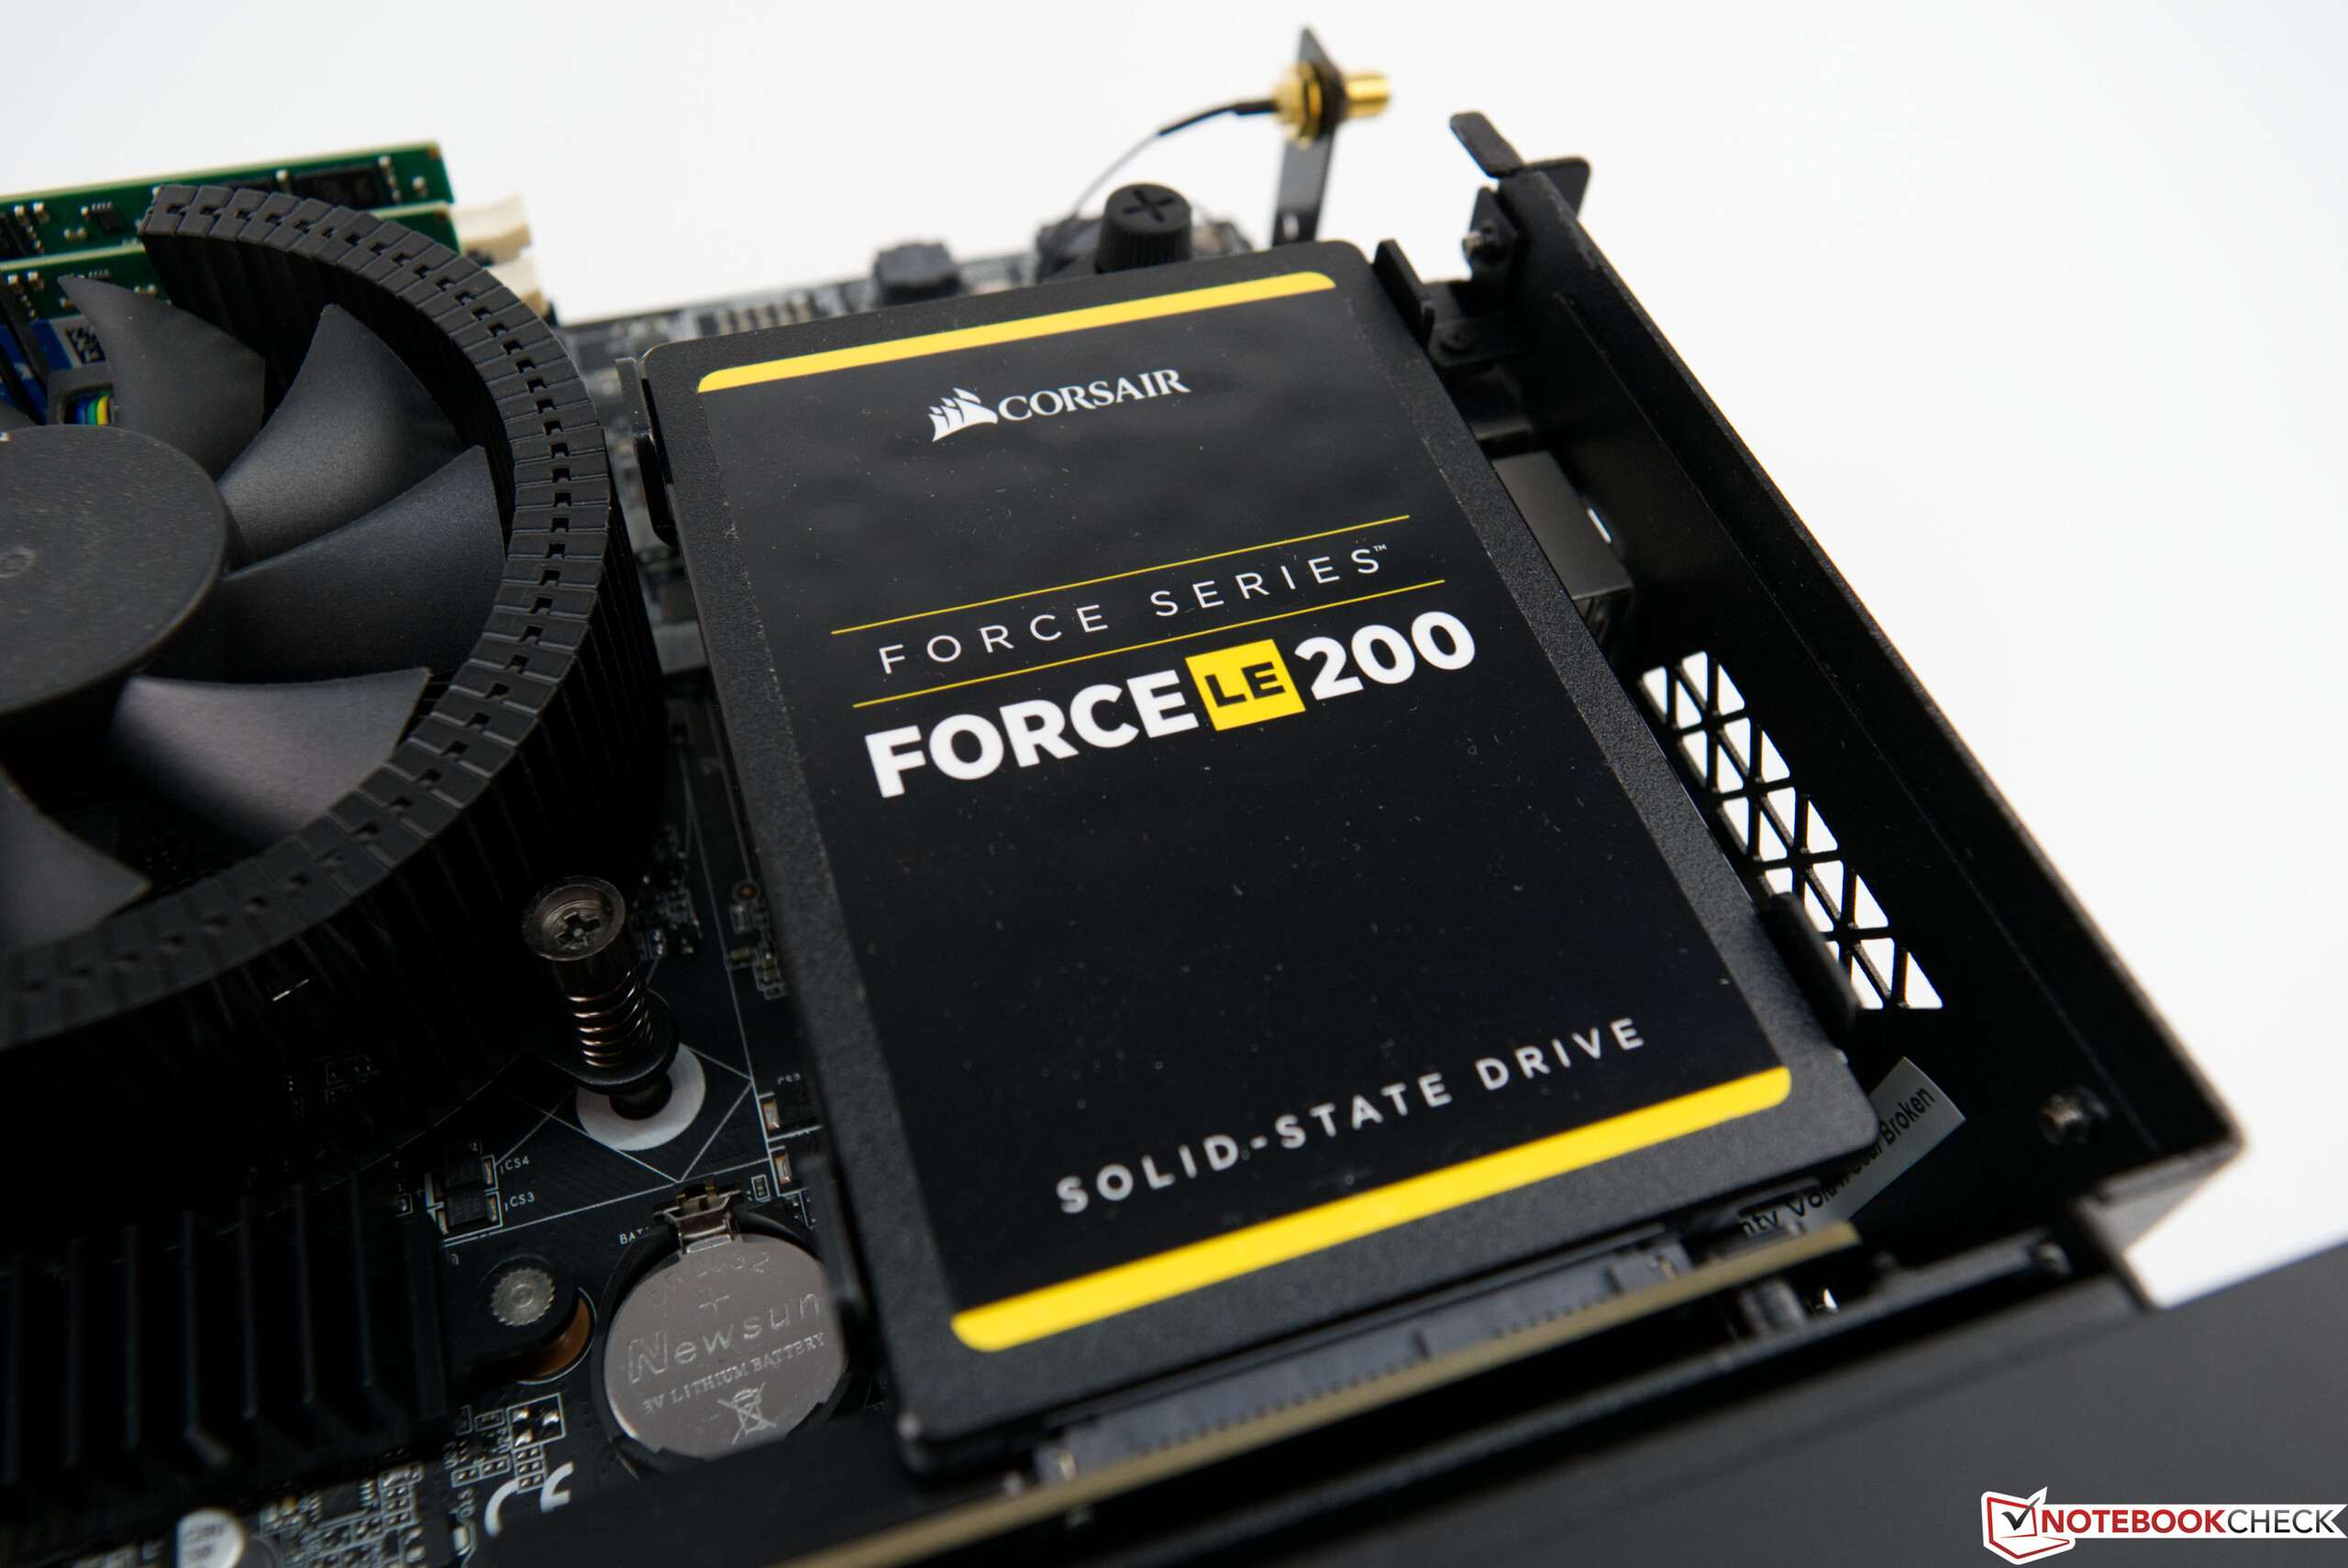
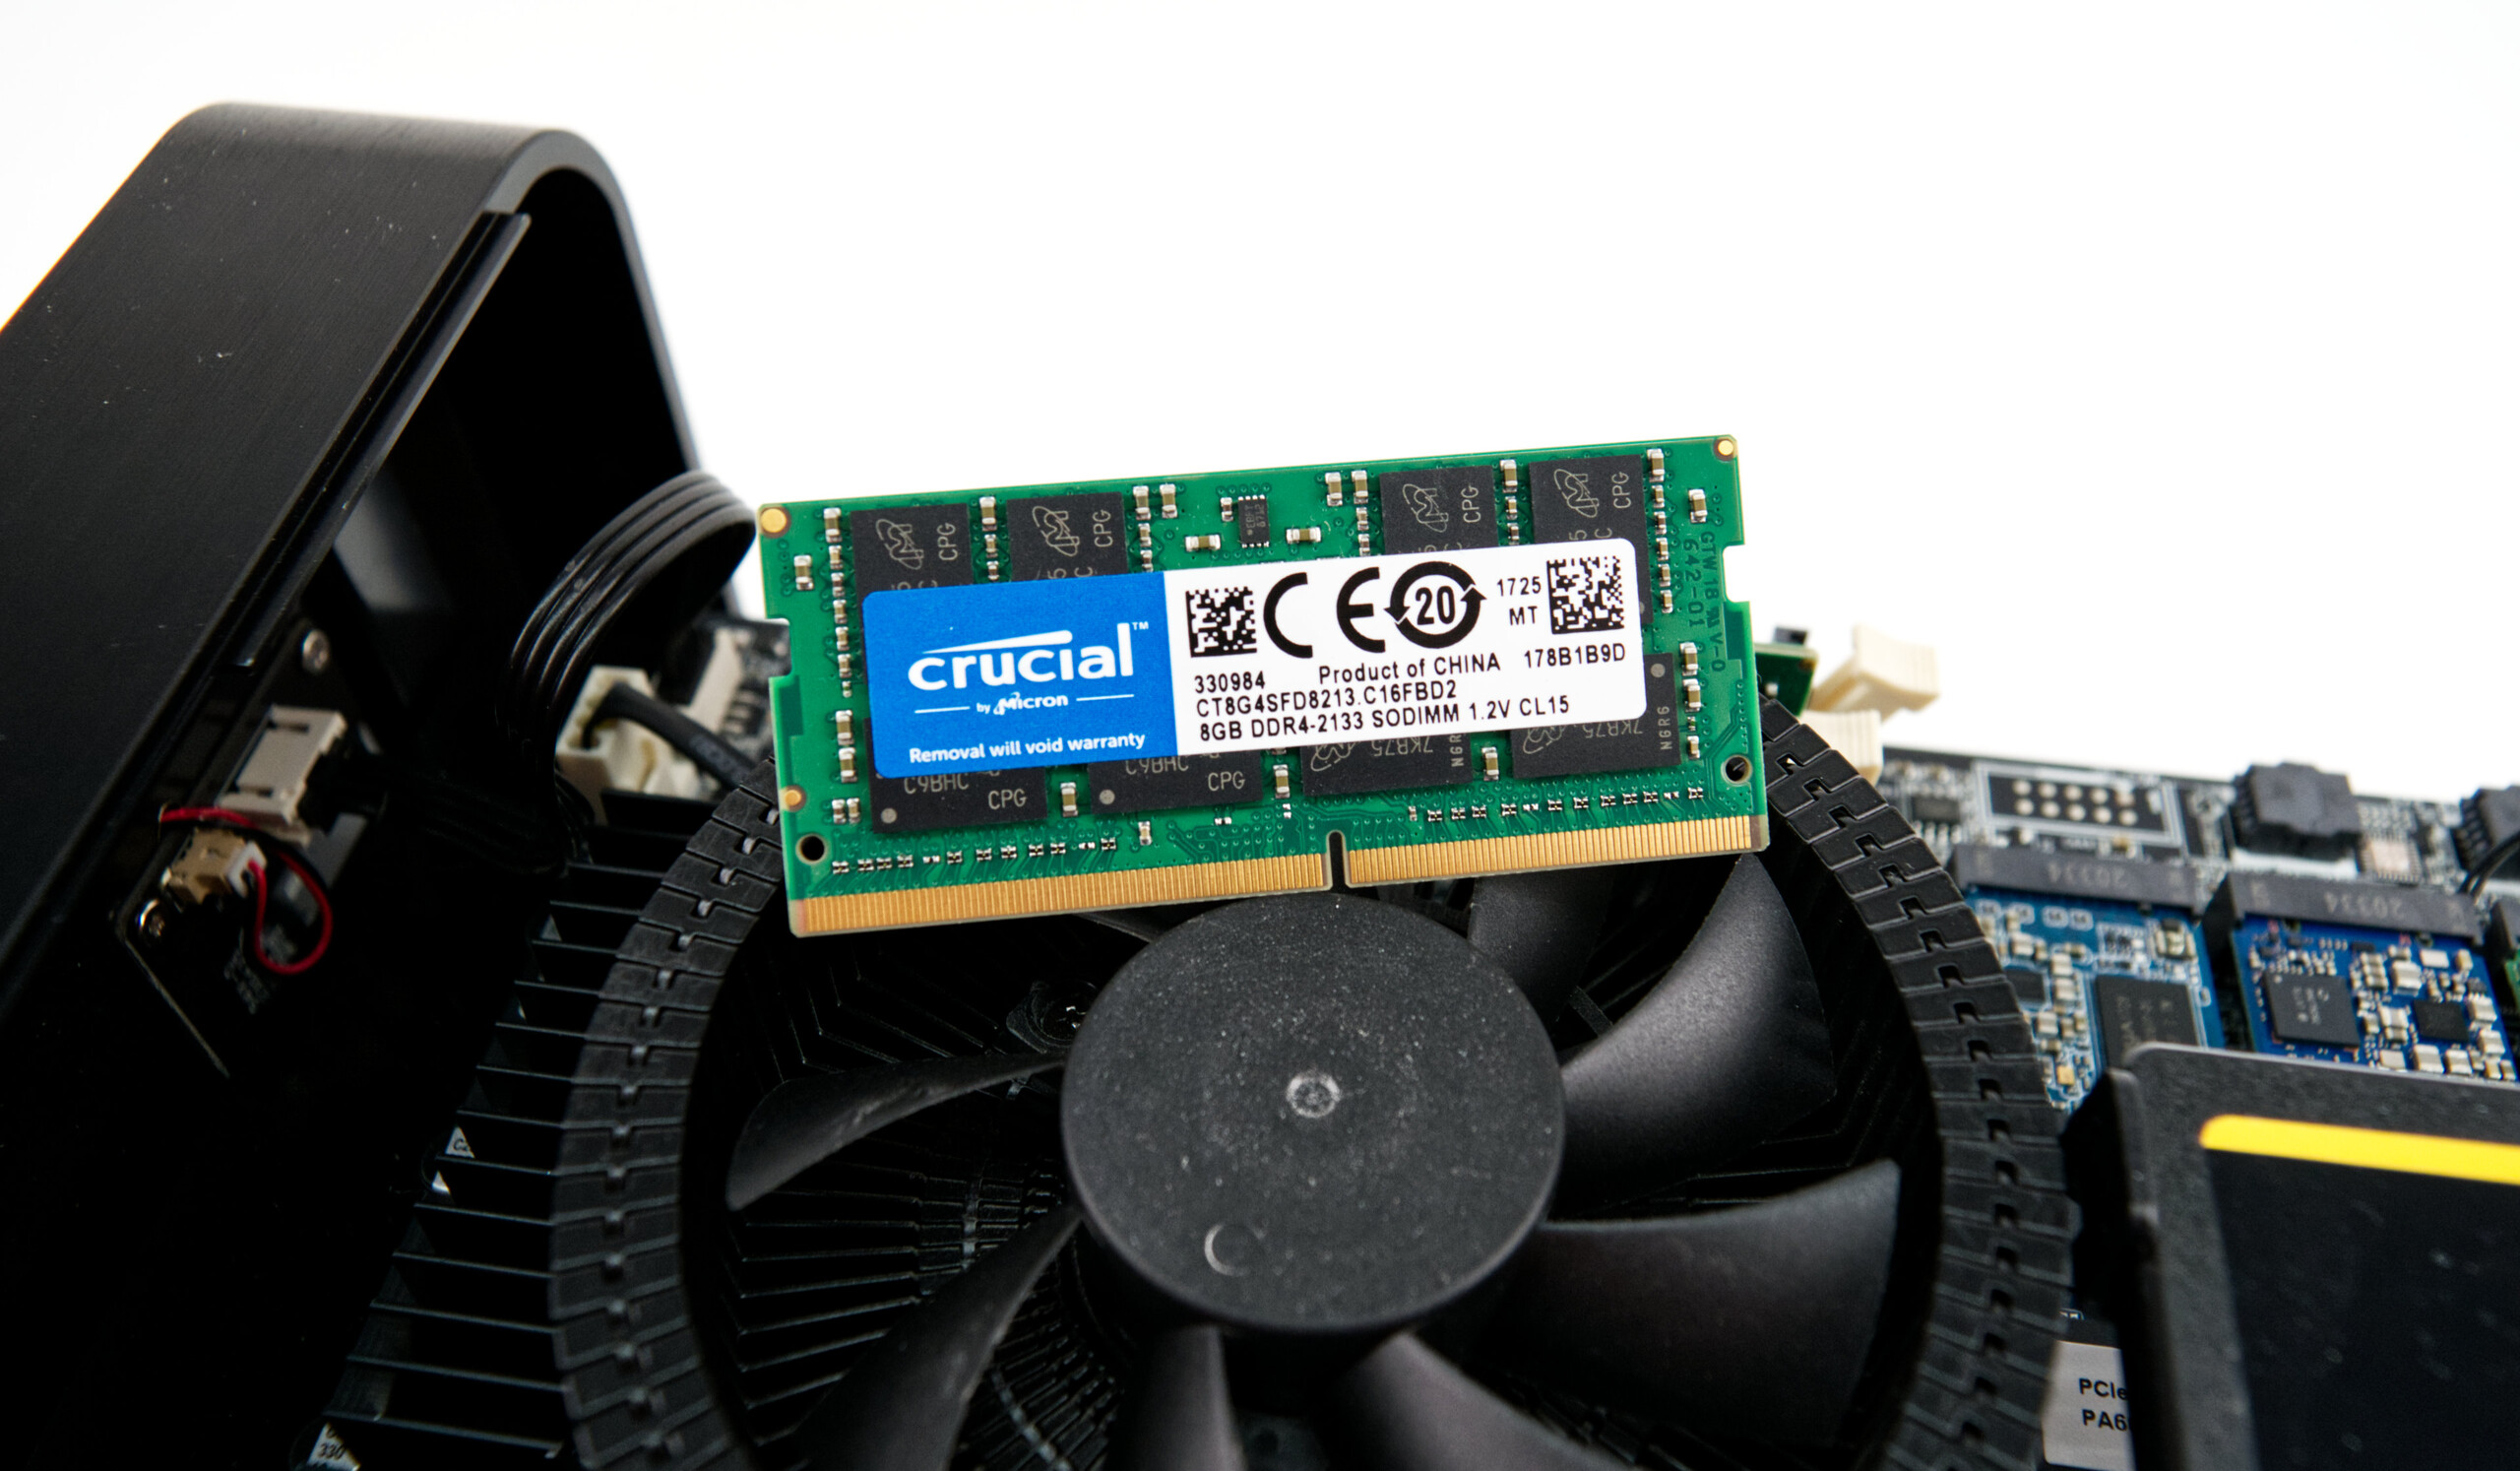
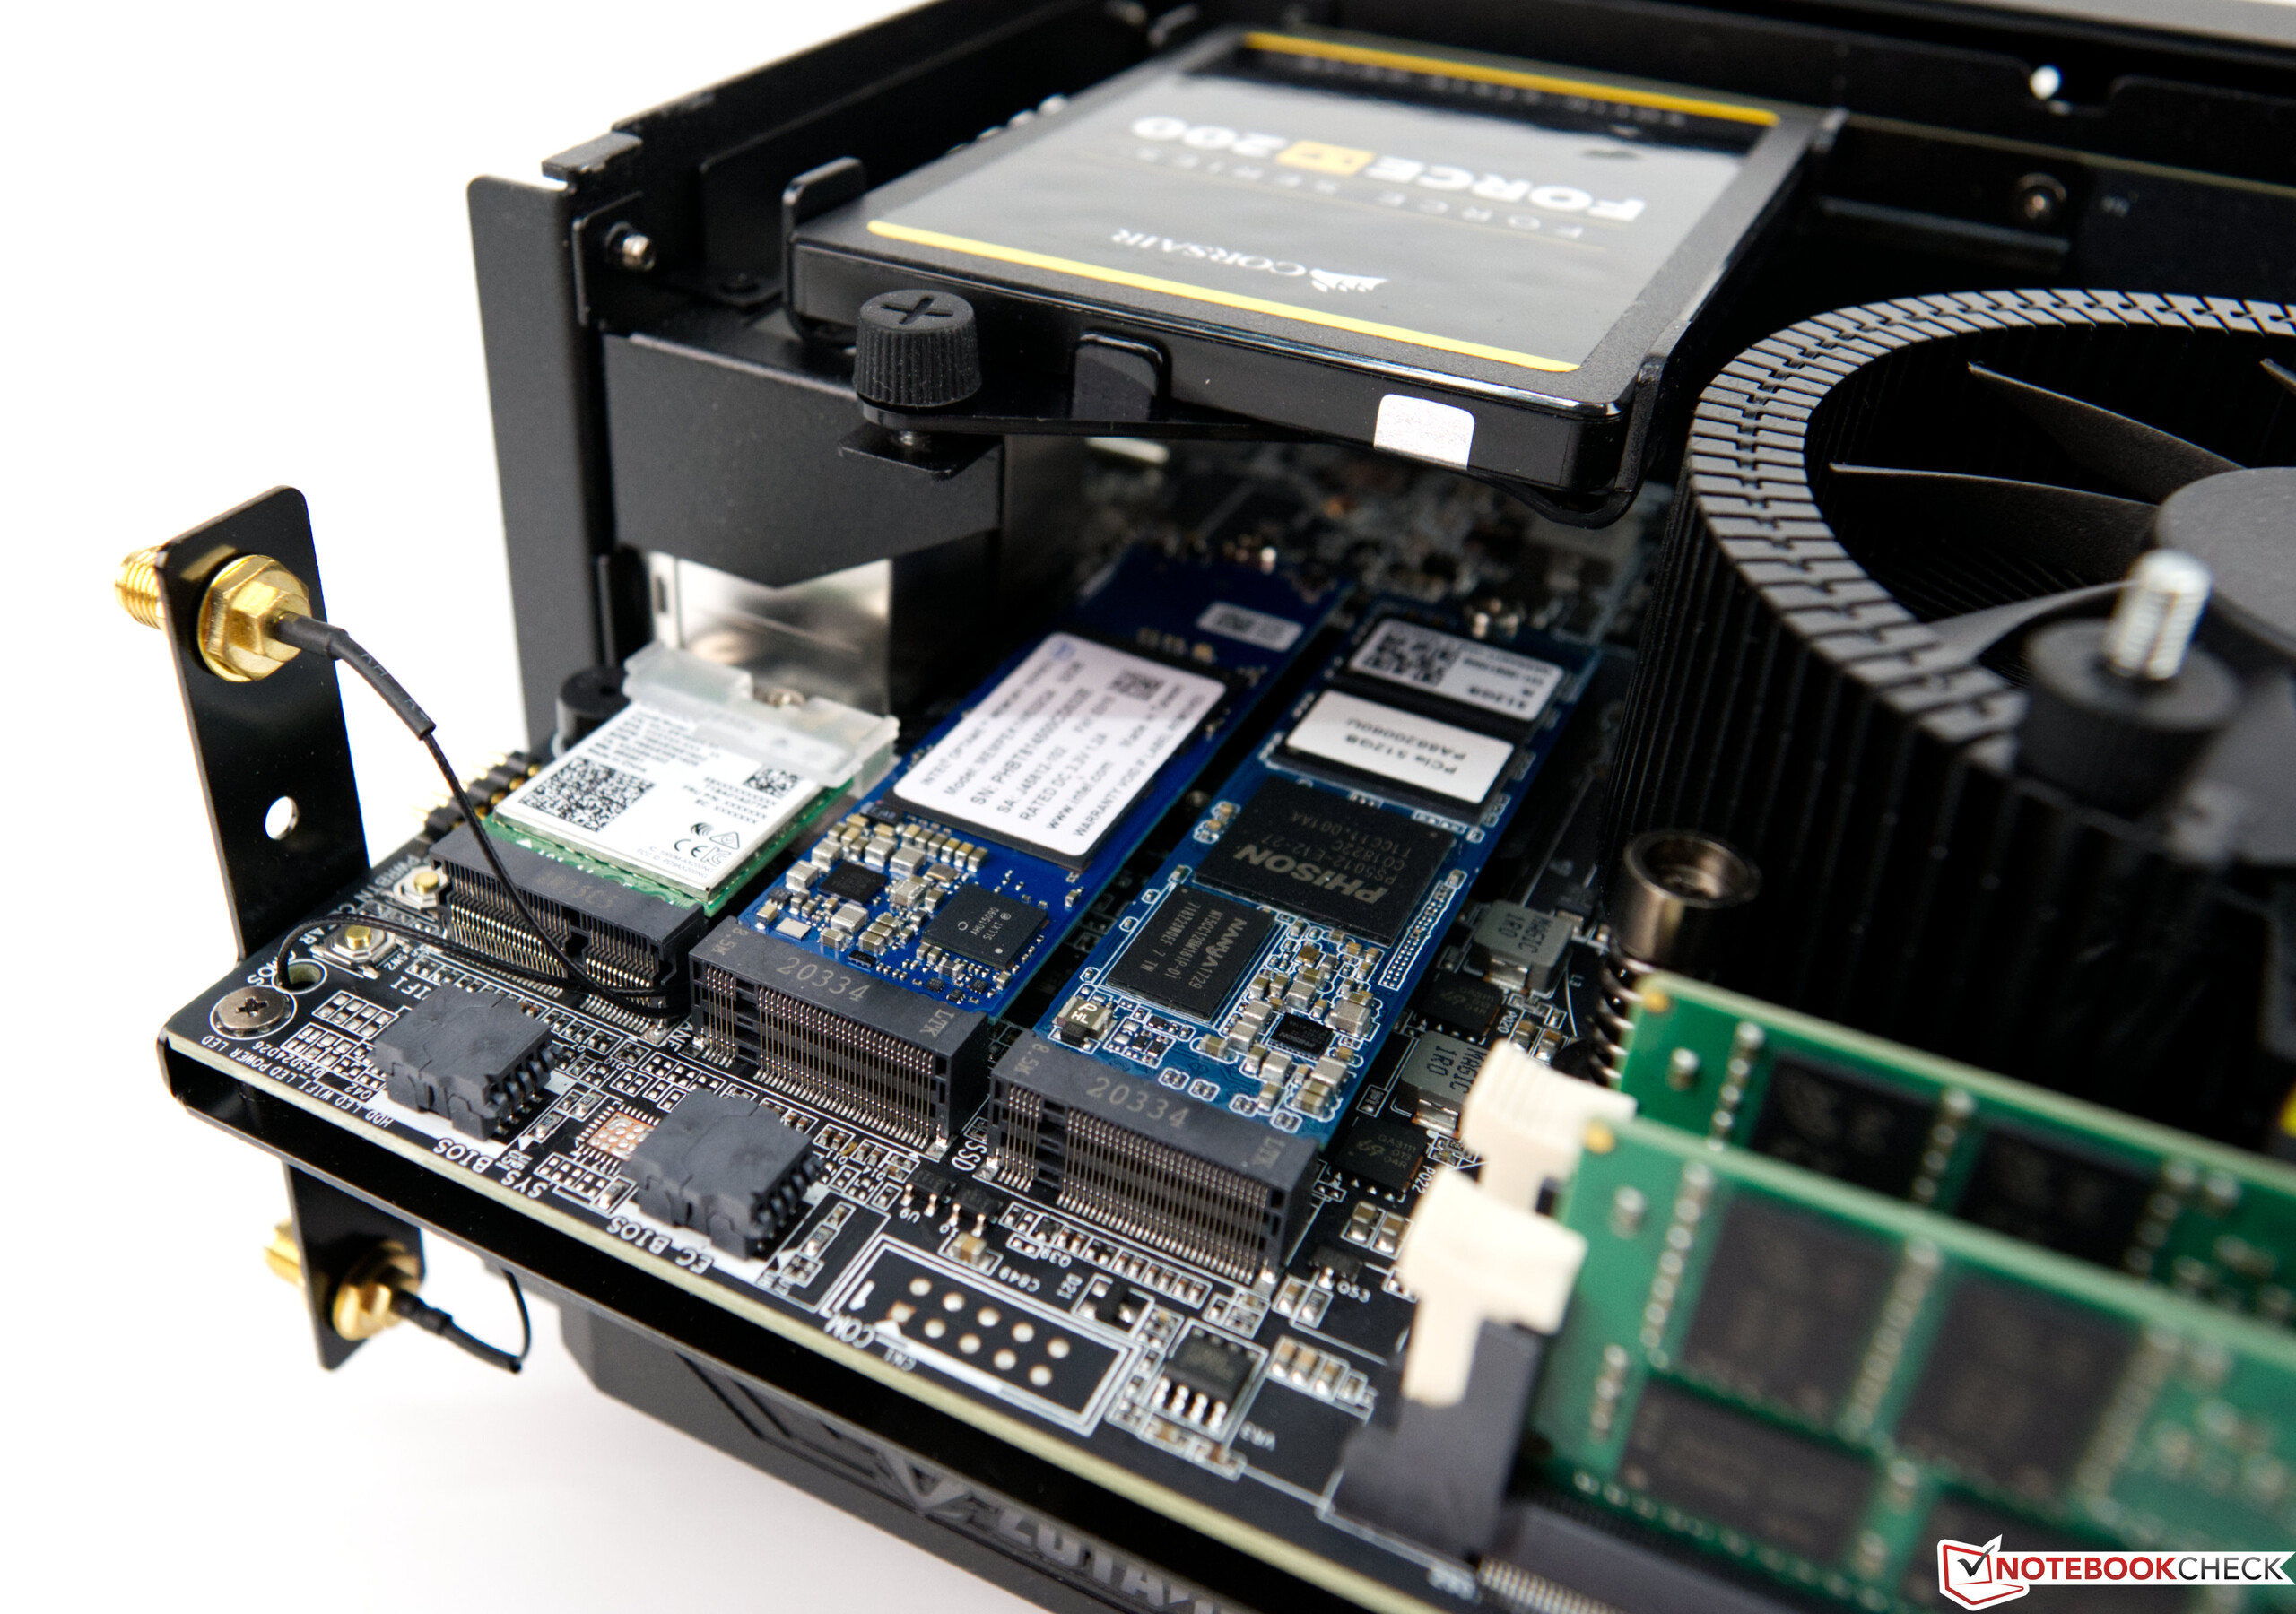
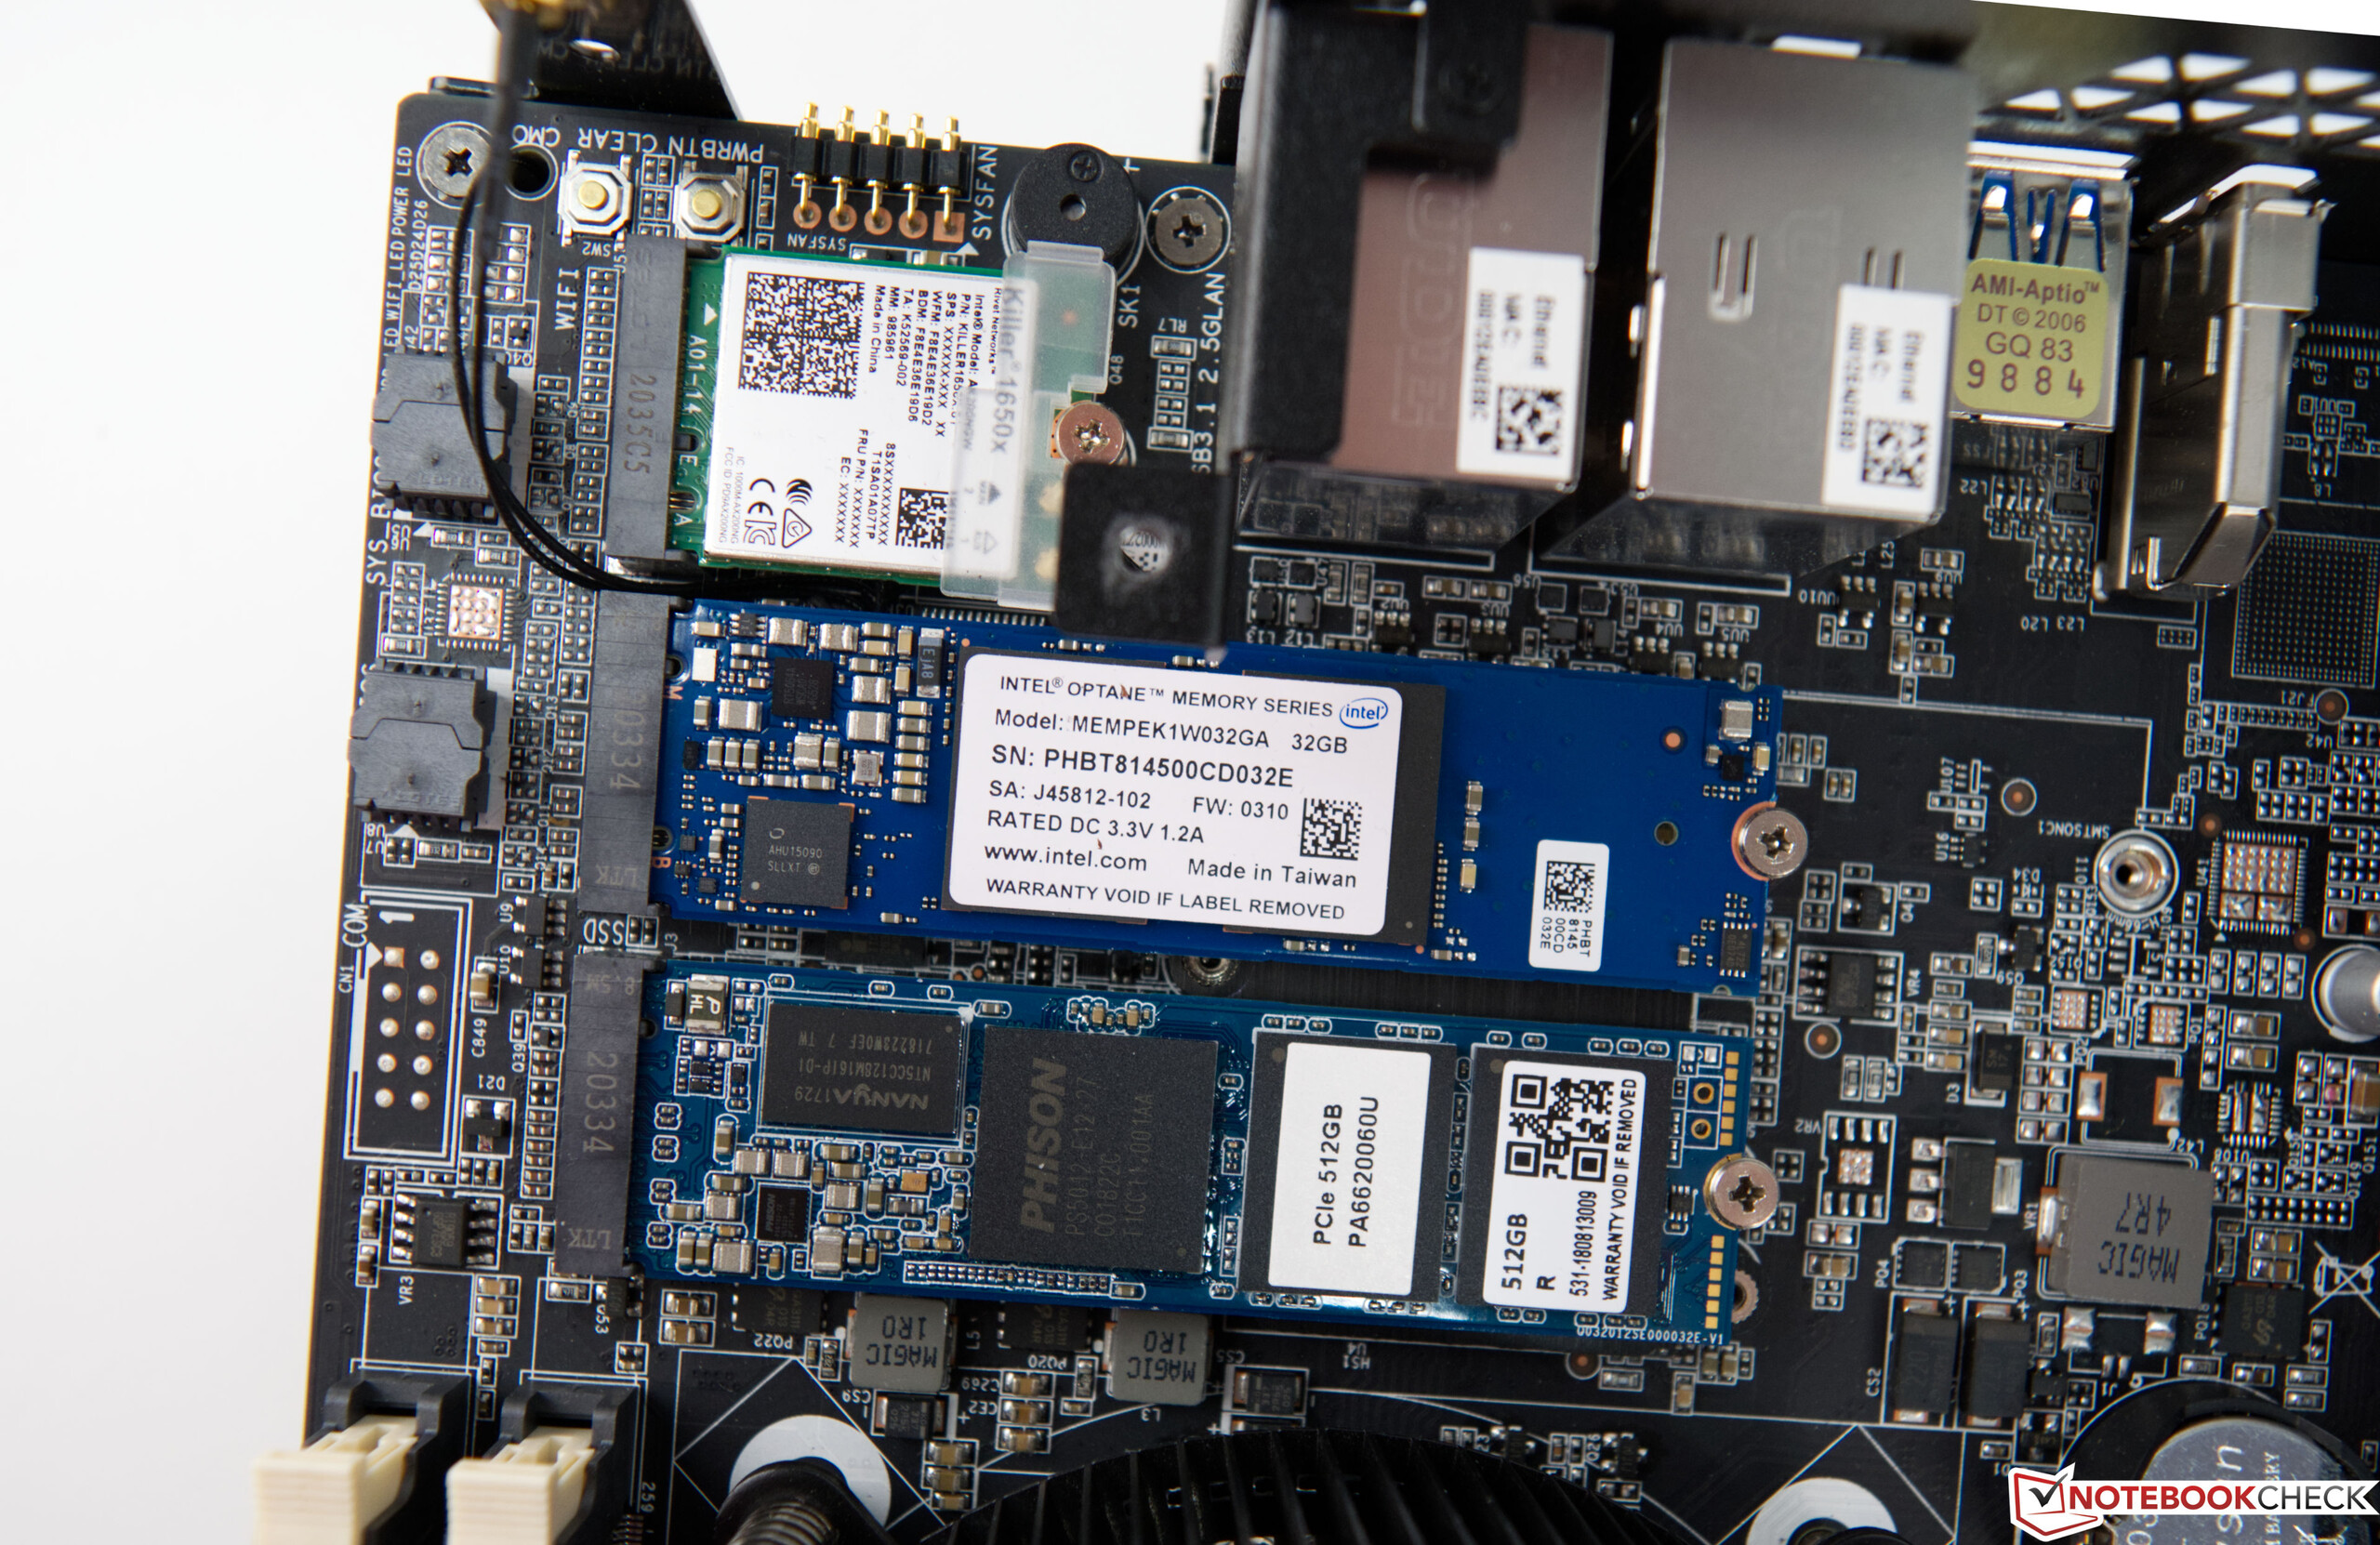
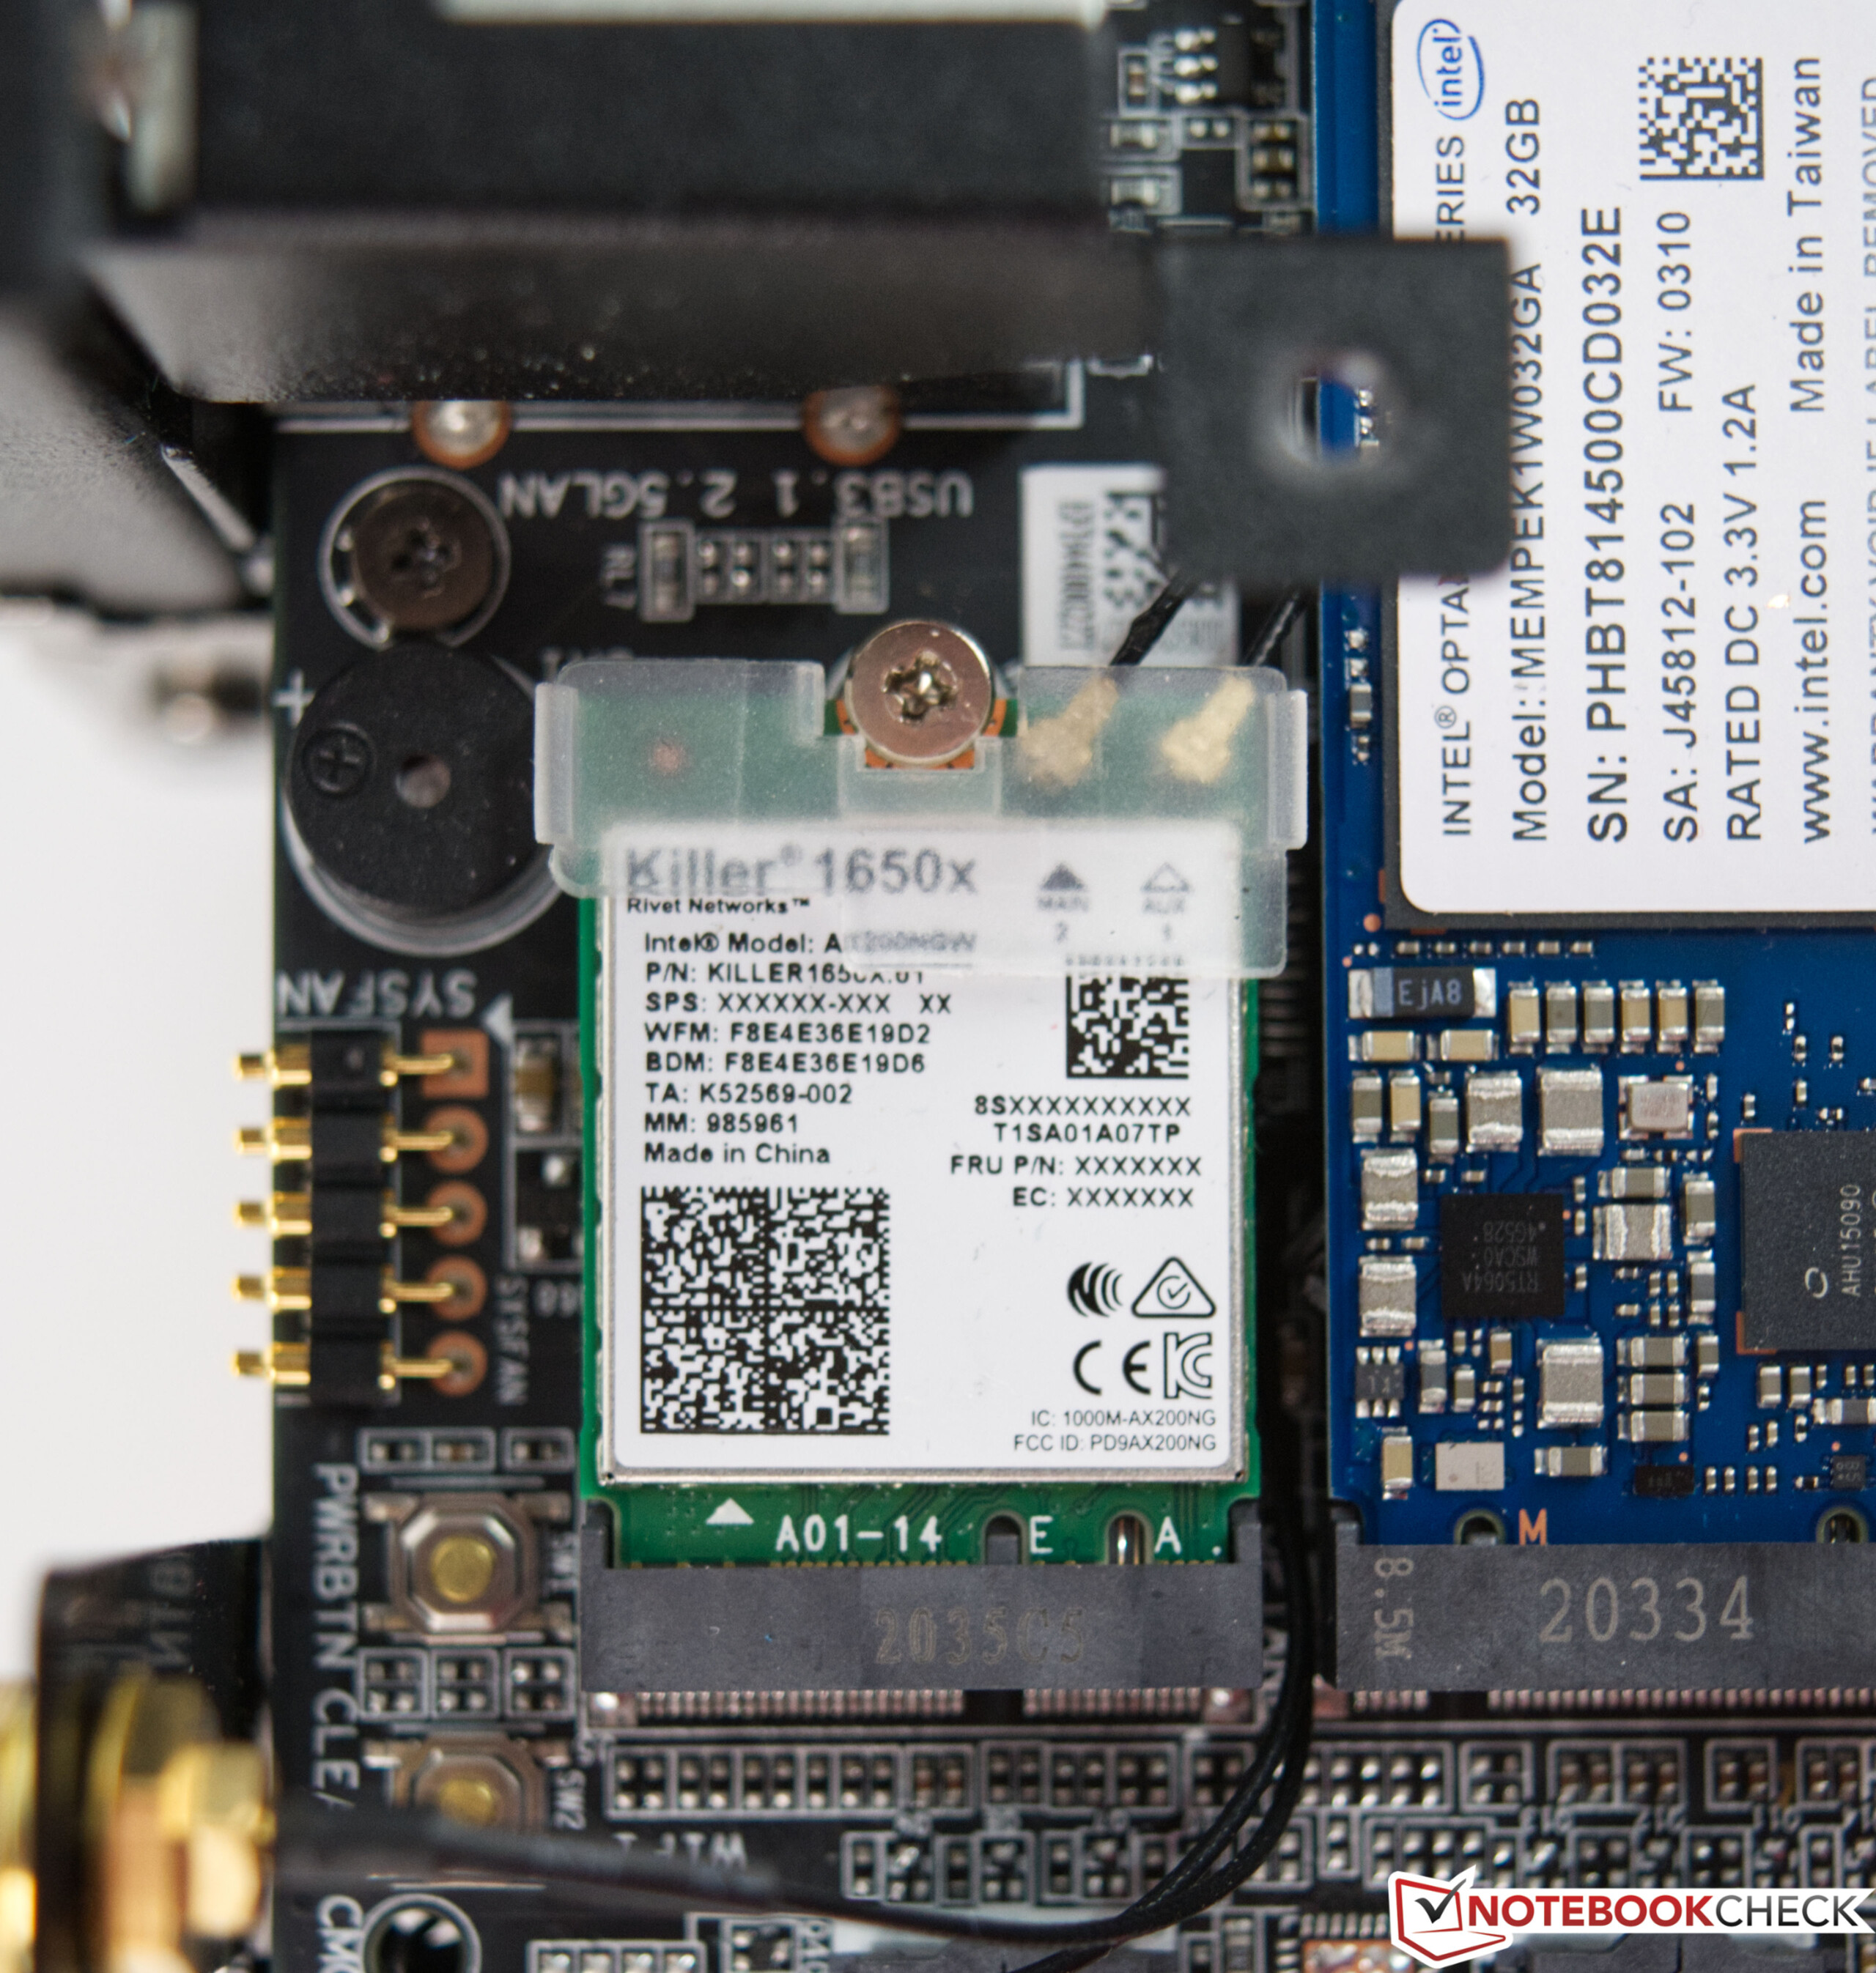
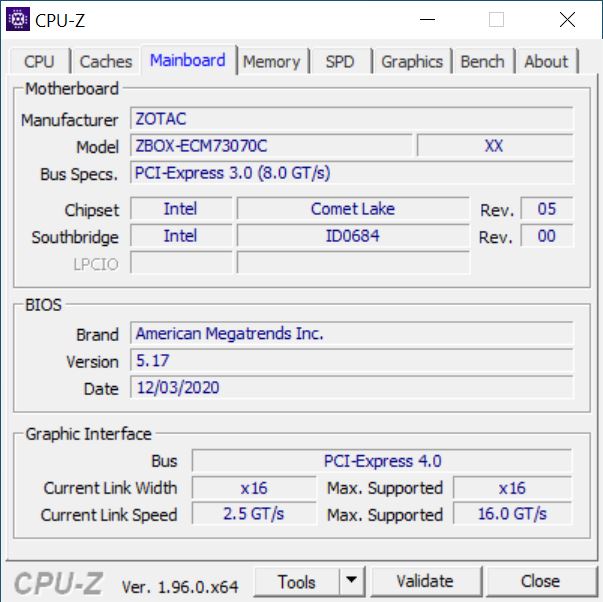
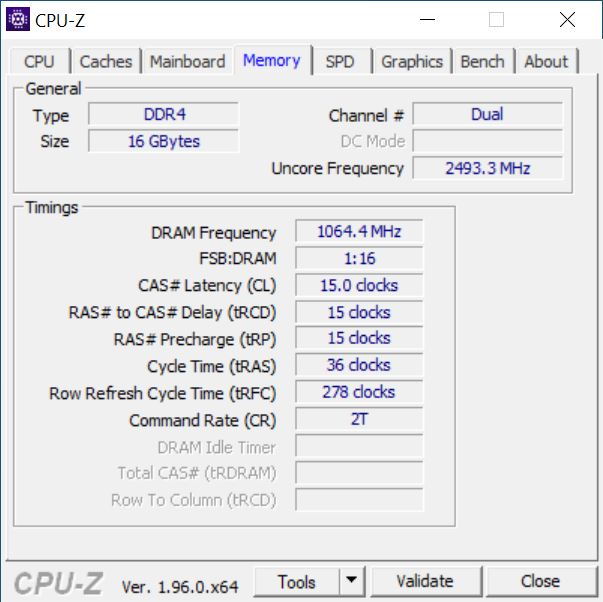
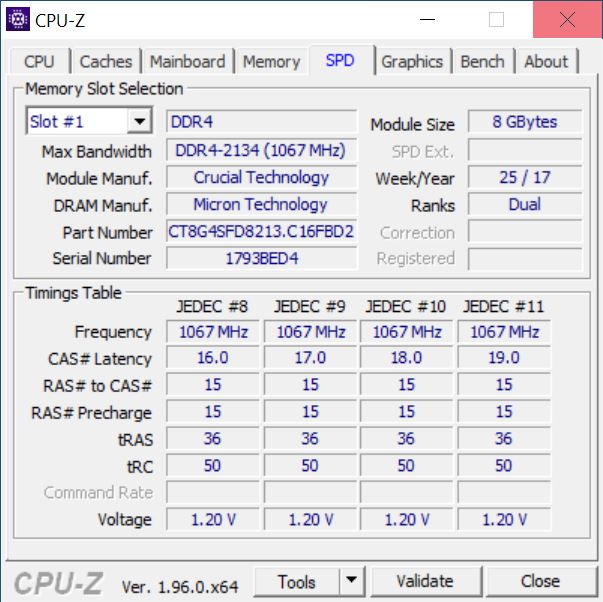
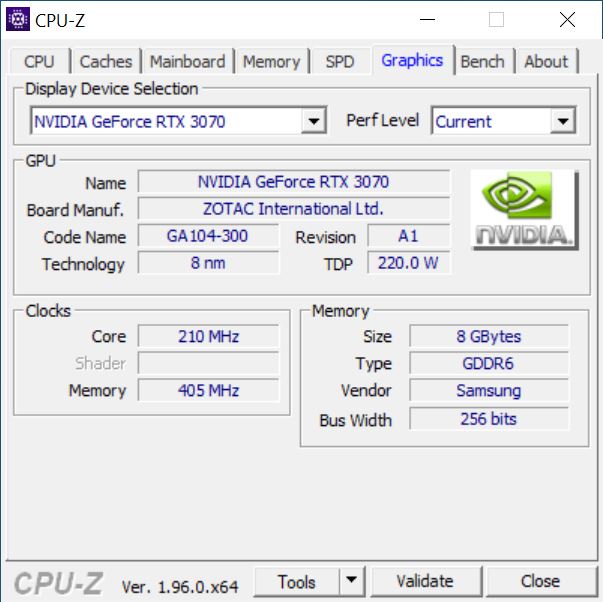
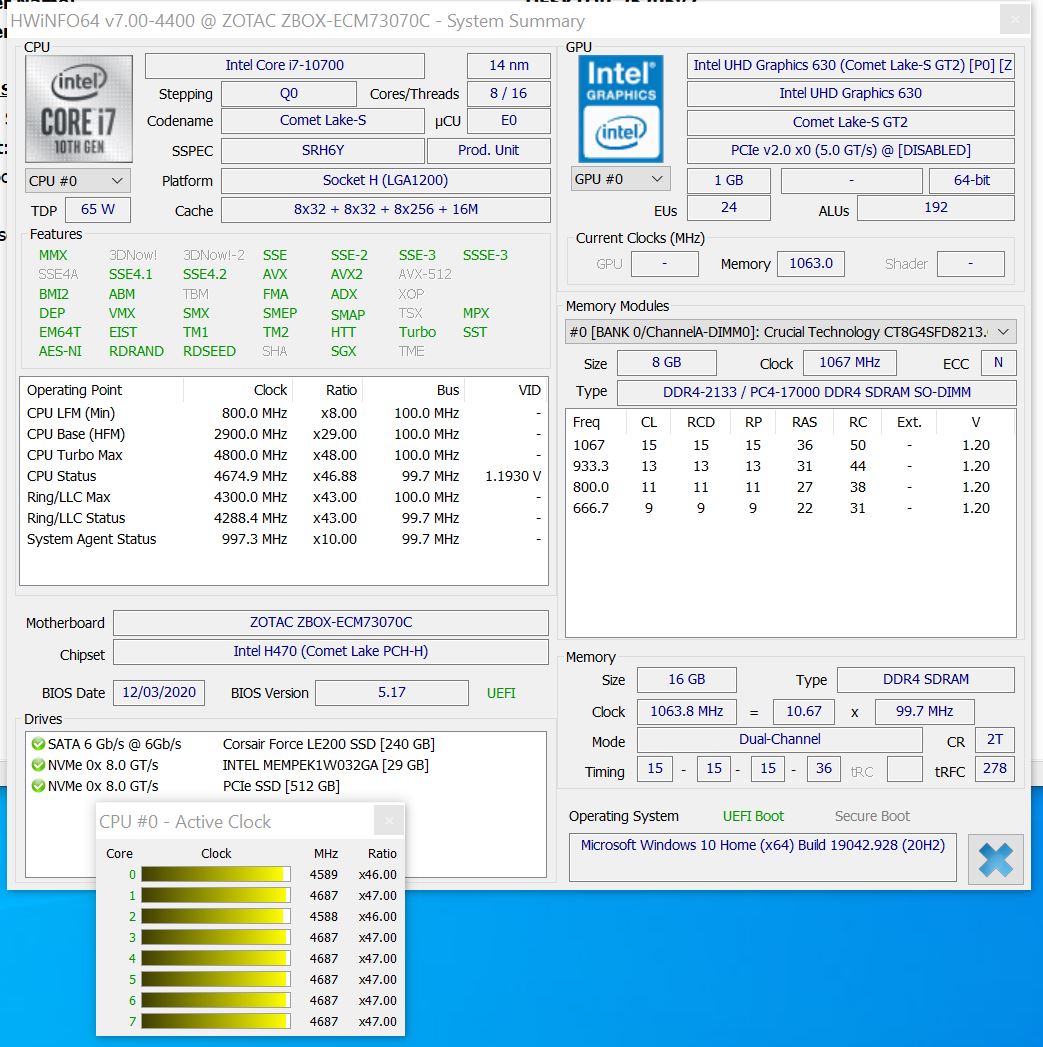
Son derece kompakt kasası, eksiksiz bir oyun bilgisayarı için ihtiyacınız olan her şeyi içerir. Güç kaynağı bile kasanın içindedir ve MEK Mini'deki gibi ayrıca bağlanmasına gerek yoktur. Intel'in 1200 soketine dayalı özel olarak geliştirilmiş bir platform temel görevi görür. Intel Core i7-10700 ile, işini iyi yapan oldukça modern bir işlemci elde edersiniz, çünkü 8 çekirdeği ve 16 iş parçacığıyla zorlu görevlerin bile üstesinden gelinebilir. 65 watt'lık model iyi bir seçimdir çünkü ısı gelişimi göz ardı edilmemelidir. Ayrıca, sistem bir Zotac GeForce RTX 3070 ile donatılmıştır. Sınırlı alan nedeniyle Zotac, RAM için çoğunlukla dizüstü bilgisayarlarda bulunan bir SO-DIMM modülü kullanmaya karar vermiştir. Yığın depolama için geleneksel bir 2,5 inçlik varyant veya bir M.2 varyantı arasında seçim yapabilirsiniz. Ancak her ikisini birleştirmek de mümkündür. Slotlar birbirine karışmaz.
Zotac bize toplam 750 GB depolama alanı sunan 16 GB DDR4 RAM ve SSD'lere sahip bir Magnus One verdi. GeForce RTX 3070'e sahip barebone sistemi, resmi olarak Zotac tarafından 1.499 Euro'luk (~1.825$) bir MSRP(Tavsiye edilen satış fiyatı) ile sunuluyor. Bununla birlikte, mevcut modeller, grafik kartlarının düşük stok seviyelerine bağlı olarak, test sırasında MSRP'nin (1,650 Euro'dan (~ 2,009 $) başlayan) önemli ölçüde üzerinde listelenmiştir.
İşlemci testleri
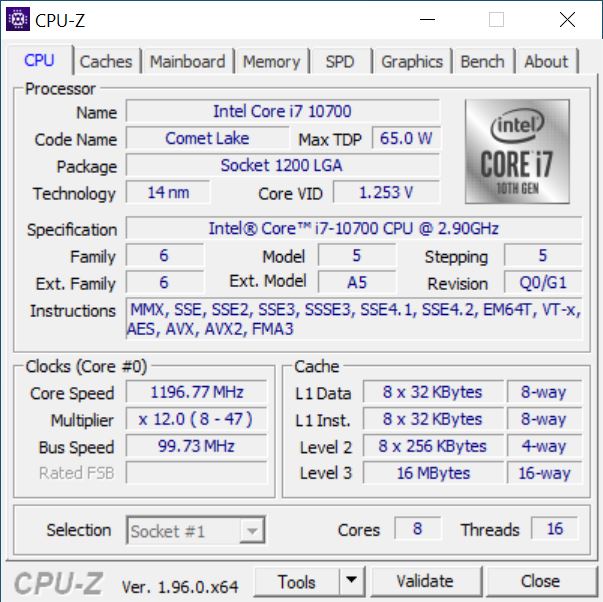
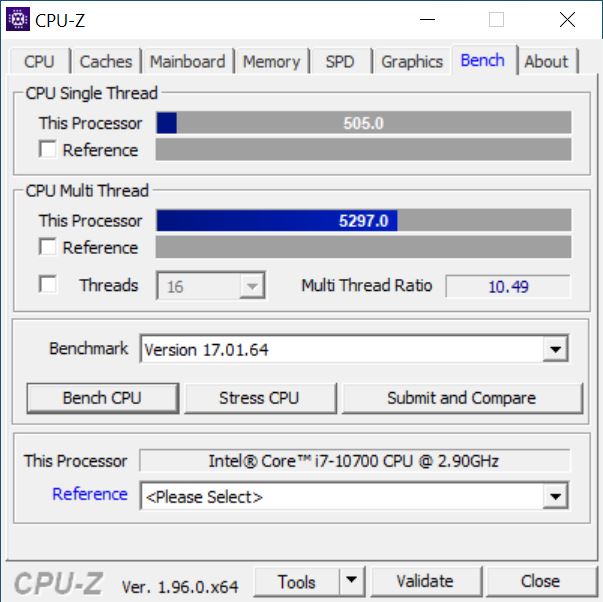
Intel Core i7-10700, 65 watt TDP'ye sahip sekiz çekirdekli bir işlemcidir. Temel saat hızı 2,9 GHz'dir ve maksimum yükseltme hızı 4,8 GHz olarak belirtilmiştir. Core i7-10700, Zotac Magnus One'da sağlam bir sonuç elde eder ve kompaktlığı nedeniyle daha fazlasına yer bırakmaz. Yine de sistem iyi bir performans sergiliyor ve çoklu iş parçacığı testlerinde Intel Core i7-9700K'yı büyük ölçüde geride bırakabiliyor. Tek çekirdekli testlerde ise test sistemimizdeki Intel Core i7-10700, Intel Core i5-10600K ile neredeyse eşittir.
Daha fazla karşılaştırma ve kıyaslama için buradan CPU karşılaştırma tablomuza bekliyoruz.
| Cinebench R15 | |
| CPU Single 64Bit | |
| AMD Ryzen 7 5800X, AMD Ryzen 7 5800X | |
| AMD Ryzen 5 5600X, AMD Ryzen 5 5600X | |
| Intel Core i9-10900K, Intel Core i9-10900K | |
| Intel Core i7-9700K, AMD Radeon RX Vega 64, Intel Core i7-9700K | |
| Intel Core i5-10600K, Intel Core i5-10600K | |
| Corsair One i160, Intel Core i9-9900K | |
| Zotac Magnus One (ECM73070C), Intel Core i7-10700 | |
| Intel Core i5-10400F, Intel Core i5-10400F | |
| CPU Multi 64Bit | |
| Intel Core i9-10900K, Intel Core i9-10900K | |
| AMD Ryzen 7 5800X, AMD Ryzen 7 5800X | |
| Corsair One i160, Intel Core i9-9900K | |
| AMD Ryzen 5 5600X, AMD Ryzen 5 5600X | |
| Zotac Magnus One (ECM73070C), Intel Core i7-10700 | |
| Intel Core i5-10600K, Intel Core i5-10600K | |
| Intel Core i7-9700K, AMD Radeon RX Vega 64, Intel Core i7-9700K | |
| Intel Core i5-10400F, Intel Core i5-10400F | |
| Cinebench R20 | |
| CPU (Single Core) | |
| AMD Ryzen 7 5800X, AMD Ryzen 7 5800X | |
| AMD Ryzen 5 5600X, AMD Ryzen 5 5600X | |
| Intel Core i9-10900K, Intel Core i9-10900K | |
| Corsair One i160, Intel Core i9-9900K | |
| Intel Core i7-9700K, AMD Radeon RX Vega 64, Intel Core i7-9700K | |
| Intel Core i5-10600K, Intel Core i5-10600K | |
| Intel Core i5-10400F, Intel Core i5-10400F | |
| CPU (Multi Core) | |
| Intel Core i9-10900K, Intel Core i9-10900K | |
| AMD Ryzen 7 5800X, AMD Ryzen 7 5800X | |
| Corsair One i160, Intel Core i9-9900K | |
| AMD Ryzen 5 5600X, AMD Ryzen 5 5600X | |
| Intel Core i5-10600K, Intel Core i5-10600K | |
| Intel Core i7-9700K, AMD Radeon RX Vega 64, Intel Core i7-9700K | |
| Intel Core i5-10400F, Intel Core i5-10400F | |
| Cinebench R11.5 | |
| CPU Single 64Bit | |
| AMD Ryzen 7 5800X, AMD Ryzen 7 5800X | |
| AMD Ryzen 5 5600X, AMD Ryzen 5 5600X | |
| Intel Core i9-10900K, Intel Core i9-10900K | |
| Intel Core i7-9700K, AMD Radeon RX Vega 64, Intel Core i7-9700K | |
| Corsair One i160, Intel Core i9-9900K | |
| Zotac Magnus One (ECM73070C), Intel Core i7-10700 | |
| Intel Core i5-10600K, Intel Core i5-10600K | |
| Intel Core i5-10400F, Intel Core i5-10400F | |
| CPU Multi 64Bit | |
| AMD Ryzen 7 5800X, AMD Ryzen 7 5800X | |
| Intel Core i9-10900K, Intel Core i9-10900K | |
| Corsair One i160, Intel Core i9-9900K | |
| AMD Ryzen 5 5600X, AMD Ryzen 5 5600X | |
| Zotac Magnus One (ECM73070C), Intel Core i7-10700 | |
| Intel Core i7-9700K, AMD Radeon RX Vega 64, Intel Core i7-9700K | |
| Intel Core i5-10600K, Intel Core i5-10600K | |
| Intel Core i5-10400F, Intel Core i5-10400F | |
| Cinebench R10 | |
| Rendering Single CPUs 64Bit | |
| AMD Ryzen 7 5800X, AMD Ryzen 7 5800X | |
| AMD Ryzen 5 5600X, AMD Ryzen 5 5600X | |
| Intel Core i9-10900K, Intel Core i9-10900K | |
| Corsair One i160, Intel Core i9-9900K | |
| Zotac Magnus One (ECM73070C), Intel Core i7-10700 | |
| Intel Core i7-9700K, AMD Radeon RX Vega 64, Intel Core i7-9700K | |
| Intel Core i5-10600K, Intel Core i5-10600K | |
| Intel Core i5-10400F, Intel Core i5-10400F | |
| Rendering Multiple CPUs 64Bit | |
| AMD Ryzen 7 5800X, AMD Ryzen 7 5800X | |
| Intel Core i9-10900K, Intel Core i9-10900K | |
| AMD Ryzen 5 5600X, AMD Ryzen 5 5600X | |
| Corsair One i160, Intel Core i9-9900K | |
| Intel Core i7-9700K, AMD Radeon RX Vega 64, Intel Core i7-9700K | |
| Zotac Magnus One (ECM73070C), Intel Core i7-10700 | |
| Intel Core i5-10600K, Intel Core i5-10600K | |
| Intel Core i5-10400F, Intel Core i5-10400F | |
| Blender - v2.79 BMW27 CPU | |
| Intel Core i3-10100, Intel Core i3-10100 | |
| Intel Core i5-10400F, Intel Core i5-10400F | |
| Zotac Magnus One (ECM73070C), Intel Core i7-10700 | |
| Intel Core i7-9700K, AMD Radeon RX Vega 64, Intel Core i7-9700K | |
| Intel Core i5-10600K, Intel Core i5-10600K | |
| AMD Ryzen 5 5600X, AMD Ryzen 5 5600X | |
| Corsair One i160, Intel Core i9-9900K | |
| AMD Ryzen 7 5800X, AMD Ryzen 7 5800X | |
| Intel Core i9-10900K, Intel Core i9-10900K | |
| wPrime 2.10 | |
| 32m | |
| Intel Core i5-10400F, Intel Core i5-10400F | |
| Intel Core i5-10600K, Intel Core i5-10600K | |
| Intel Core i7-9700K, AMD Radeon RX Vega 64, Intel Core i7-9700K | |
| AMD Ryzen 5 5600X, AMD Ryzen 5 5600X | |
| Intel Core i9-10900K, Intel Core i9-10900K | |
| Corsair One i160, Intel Core i9-9900K | |
| Zotac Magnus One (ECM73070C), Intel Core i7-10700 | |
| AMD Ryzen 7 5800X, AMD Ryzen 7 5800X | |
| 1024m | |
| Intel Core i5-10400F, Intel Core i5-10400F | |
| Intel Core i7-9700K, AMD Radeon RX Vega 64, Intel Core i7-9700K | |
| Zotac Magnus One (ECM73070C), Intel Core i7-10700 | |
| AMD Ryzen 5 5600X, AMD Ryzen 5 5600X | |
| Intel Core i5-10600K, Intel Core i5-10600K | |
| Corsair One i160, Intel Core i9-9900K | |
| AMD Ryzen 7 5800X, AMD Ryzen 7 5800X | |
| Intel Core i9-10900K, Intel Core i9-10900K | |
| X264 HD Benchmark 4.0 | |
| Pass 1 | |
| AMD Ryzen 7 5800X, AMD Ryzen 7 5800X | |
| AMD Ryzen 5 5600X, AMD Ryzen 5 5600X | |
| Intel Core i9-10900K, Intel Core i9-10900K | |
| Intel Core i7-9700K, AMD Radeon RX Vega 64, Intel Core i7-9700K | |
| Corsair One i160, Intel Core i9-9900K | |
| Intel Core i5-10600K, Intel Core i5-10600K | |
| Zotac Magnus One (ECM73070C), Intel Core i7-10700 | |
| Intel Core i5-10400F, Intel Core i5-10400F | |
| Pass 2 | |
| AMD Ryzen 7 5800X, AMD Ryzen 7 5800X | |
| Intel Core i9-10900K, Intel Core i9-10900K | |
| Corsair One i160, Intel Core i9-9900K | |
| AMD Ryzen 5 5600X, AMD Ryzen 5 5600X | |
| Intel Core i7-9700K, AMD Radeon RX Vega 64, Intel Core i7-9700K | |
| Intel Core i5-10600K, Intel Core i5-10600K | |
| Zotac Magnus One (ECM73070C), Intel Core i7-10700 | |
| Intel Core i5-10400F, Intel Core i5-10400F | |
| WinRAR - Result | |
| AMD Ryzen 7 5800X, AMD Ryzen 7 5800X | |
| AMD Ryzen 5 5600X, AMD Ryzen 5 5600X | |
| Intel Core i9-10900K, Intel Core i9-10900K | |
| Corsair One i160, Intel Core i9-9900K | |
| Intel Core i7-9700K, AMD Radeon RX Vega 64, Intel Core i7-9700K | |
| Zotac Magnus One (ECM73070C), Intel Core i7-10700 | |
| Intel Core i5-10600K, Intel Core i5-10600K | |
| TrueCrypt | |
| AES Mean 100MB | |
| AMD Ryzen 7 5800X, AMD Ryzen 7 5800X | |
| Intel Core i9-10900K, Intel Core i9-10900K | |
| Corsair One i160, Intel Core i9-9900K | |
| AMD Ryzen 5 5600X, AMD Ryzen 5 5600X | |
| Zotac Magnus One (ECM73070C), Intel Core i7-10700 | |
| Intel Core i7-9700K, AMD Radeon RX Vega 64, Intel Core i7-9700K | |
| Intel Core i5-10600K, Intel Core i5-10600K | |
| Twofish Mean 100MB | |
| Intel Core i9-10900K, Intel Core i9-10900K | |
| AMD Ryzen 7 5800X, AMD Ryzen 7 5800X | |
| Corsair One i160, Intel Core i9-9900K | |
| Zotac Magnus One (ECM73070C), Intel Core i7-10700 | |
| AMD Ryzen 5 5600X, AMD Ryzen 5 5600X | |
| Intel Core i5-10600K, Intel Core i5-10600K | |
| Intel Core i7-9700K, AMD Radeon RX Vega 64, Intel Core i7-9700K | |
| Serpent Mean 100MB | |
| Intel Core i9-10900K, Intel Core i9-10900K | |
| AMD Ryzen 7 5800X, AMD Ryzen 7 5800X | |
| Corsair One i160, Intel Core i9-9900K | |
| Zotac Magnus One (ECM73070C), Intel Core i7-10700 | |
| AMD Ryzen 5 5600X, AMD Ryzen 5 5600X | |
| Intel Core i5-10600K, Intel Core i5-10600K | |
| Intel Core i7-9700K, AMD Radeon RX Vega 64, Intel Core i7-9700K | |
| Geekbench 5.5 | |
| Multi-Core | |
| Intel Core i9-10900K, Intel Core i9-10900K | |
| AMD Ryzen 7 5800X, AMD Ryzen 7 5800X | |
| AMD Ryzen 5 5600X, AMD Ryzen 5 5600X | |
| Zotac Magnus One (ECM73070C), Intel Core i7-10700 | |
| Intel Core i7-9700K, AMD Radeon RX Vega 64, Intel Core i7-9700K | |
| Intel Core i5-10600K, Intel Core i5-10600K | |
| Intel Core i5-10400F, Intel Core i5-10400F | |
| Intel Core i5-10400F, Intel Core i5-10400F | |
| Intel Core i3-10100, Intel Core i3-10100 | |
| Single-Core | |
| AMD Ryzen 7 5800X, AMD Ryzen 7 5800X | |
| AMD Ryzen 5 5600X, AMD Ryzen 5 5600X | |
| Intel Core i9-10900K, Intel Core i9-10900K | |
| Intel Core i7-9700K, AMD Radeon RX Vega 64, Intel Core i7-9700K | |
| Zotac Magnus One (ECM73070C), Intel Core i7-10700 | |
| Intel Core i5-10600K, Intel Core i5-10600K | |
| Intel Core i5-10400F, Intel Core i5-10400F | |
| Intel Core i5-10400F, Intel Core i5-10400F | |
| Intel Core i3-10100, Intel Core i3-10100 | |
| Geekbench 5.0 | |
| 5.0 Multi-Core | |
| Intel Core i9-10900K, Intel Core i9-10900K | |
| AMD Ryzen 7 5800X, AMD Ryzen 7 5800X | |
| AMD Ryzen 5 5600X, AMD Ryzen 5 5600X | |
| Zotac Magnus One (ECM73070C), Intel Core i7-10700 | |
| Intel Core i5-10600K, Intel Core i5-10600K | |
| Intel Core i5-10400F, Intel Core i5-10400F | |
| Intel Core i3-10100, Intel Core i3-10100 | |
| 5.0 Single-Core | |
| AMD Ryzen 7 5800X, AMD Ryzen 7 5800X | |
| AMD Ryzen 5 5600X, AMD Ryzen 5 5600X | |
| Intel Core i9-10900K, Intel Core i9-10900K | |
| Zotac Magnus One (ECM73070C), Intel Core i7-10700 | |
| Intel Core i5-10600K, Intel Core i5-10600K | |
| Intel Core i5-10400F, Intel Core i5-10400F | |
| Intel Core i3-10100, Intel Core i3-10100 | |
| Geekbench 4.4 | |
| 64 Bit Single-Core Score | |
| AMD Ryzen 7 5800X, AMD Ryzen 7 5800X | |
| AMD Ryzen 5 5600X, AMD Ryzen 5 5600X | |
| Intel Core i9-10900K, Intel Core i9-10900K | |
| Intel Core i7-9700K, AMD Radeon RX Vega 64, Intel Core i7-9700K | |
| Corsair One i160, Intel Core i9-9900K | |
| Intel Core i5-10600K, Intel Core i5-10600K | |
| Zotac Magnus One (ECM73070C), Intel Core i7-10700 | |
| Intel Core i5-10400F, Intel Core i5-10400F | |
| Intel Core i3-10100, Intel Core i3-10100 | |
| 64 Bit Multi-Core Score | |
| AMD Ryzen 7 5800X, AMD Ryzen 7 5800X | |
| Intel Core i9-10900K, Intel Core i9-10900K | |
| AMD Ryzen 5 5600X, AMD Ryzen 5 5600X | |
| Corsair One i160, Intel Core i9-9900K | |
| Zotac Magnus One (ECM73070C), Intel Core i7-10700 | |
| Intel Core i7-9700K, AMD Radeon RX Vega 64, Intel Core i7-9700K | |
| Intel Core i5-10600K, Intel Core i5-10600K | |
| Intel Core i5-10400F, Intel Core i5-10400F | |
| Intel Core i3-10100, Intel Core i3-10100 | |
| 3DMark 11 - 1280x720 Performance Physics | |
| AMD Ryzen 7 5800X, AMD Ryzen 7 5800X | |
| Intel Core i9-10900K, Intel Core i9-10900K | |
| AMD Ryzen 5 5600X, AMD Ryzen 5 5600X | |
| Corsair One i160, Intel Core i9-9900K | |
| Intel Core i7-9700K, AMD Radeon RX Vega 64, Intel Core i7-9700K | |
| Intel Core i5-10600K, Intel Core i5-10600K | |
| Zotac Magnus One (ECM73070C), Intel Core i7-10700 | |
| Intel Core i5-10400F, Intel Core i5-10400F | |
| 7-Zip 18.03 | |
| 7z b 4 | |
| AMD Ryzen 7 5800X, AMD Ryzen 7 5800X | |
| Intel Core i9-10900K, Intel Core i9-10900K | |
| AMD Ryzen 5 5600X, AMD Ryzen 5 5600X | |
| Corsair One i160, Intel Core i9-9900K | |
| Zotac Magnus One (ECM73070C), Intel Core i7-10700 | |
| Intel Core i5-10600K, Intel Core i5-10600K | |
| Intel Core i5-10400F, Intel Core i5-10400F | |
| Intel Core i3-10100, Intel Core i3-10100 | |
| 7z b 4 -mmt1 | |
| AMD Ryzen 7 5800X, AMD Ryzen 7 5800X | |
| AMD Ryzen 5 5600X, AMD Ryzen 5 5600X | |
| Intel Core i9-10900K, Intel Core i9-10900K | |
| Corsair One i160, Intel Core i9-9900K | |
| Zotac Magnus One (ECM73070C), Intel Core i7-10700 | |
| Intel Core i5-10600K, Intel Core i5-10600K | |
| Intel Core i5-10400F, Intel Core i5-10400F | |
| Intel Core i3-10100, Intel Core i3-10100 | |
| HWBOT x265 Benchmark v2.2 - 4k Preset | |
| Intel Core i9-10900K, Intel Core i9-10900K | |
| AMD Ryzen 7 5800X, AMD Ryzen 7 5800X | |
| Corsair One i160, Intel Core i9-9900K | |
| AMD Ryzen 5 5600X, AMD Ryzen 5 5600X | |
| Intel Core i7-9700K, AMD Radeon RX Vega 64, Intel Core i7-9700K | |
| Intel Core i5-10600K, Intel Core i5-10600K | |
| Zotac Magnus One (ECM73070C), Intel Core i7-10700 | |
| Intel Core i5-10400F, Intel Core i5-10400F | |
| Intel Core i3-10100, Intel Core i3-10100 | |
| R Benchmark 2.5 - Overall mean | |
| Intel Core i3-10100, Intel Core i3-10100 | |
| Intel Core i5-10400F, Intel Core i5-10400F | |
| Intel Core i5-10600K, Intel Core i5-10600K | |
| Zotac Magnus One (ECM73070C), Intel Core i7-10700 | |
| Intel Core i9-10900K, Intel Core i9-10900K | |
| AMD Ryzen 5 5600X, AMD Ryzen 5 5600X | |
| AMD Ryzen 7 5800X, AMD Ryzen 7 5800X | |
| LibreOffice - 20 Documents To PDF | |
| Intel Core i9-10900K, Intel Core i9-10900K | |
| Zotac Magnus One (ECM73070C), Intel Core i7-10700 | |
| Intel Core i3-10100, Intel Core i3-10100 | |
| Intel Core i5-10400F, Intel Core i5-10400F | |
| Intel Core i5-10600K, Intel Core i5-10600K | |
| AMD Ryzen 5 5600X, AMD Ryzen 5 5600X | |
| AMD Ryzen 7 5800X, AMD Ryzen 7 5800X | |
| WebXPRT 3 - Overall | |
| AMD Ryzen 7 5800X, AMD Ryzen 7 5800X | |
| AMD Ryzen 5 5600X, AMD Ryzen 5 5600X | |
| Intel Core i9-10900K, Intel Core i9-10900K | |
| Zotac Magnus One (ECM73070C), Intel Core i7-10700 | |
| Intel Core i5-10600K, Intel Core i5-10600K | |
| Intel Core i5-10400F, Intel Core i5-10400F | |
| Intel Core i3-10100, Intel Core i3-10100 | |
| Mozilla Kraken 1.1 - Total | |
| Intel Core i5-10400F, Intel Core i5-10400F | |
| Intel Core i3-10100, Intel Core i3-10100 | |
| Intel Core i5-10600K, Intel Core i5-10600K | |
| Zotac Magnus One (ECM73070C), Intel Core i7-10700 | |
| Intel Core i9-10900K, Intel Core i9-10900K | |
| AMD Ryzen 5 5600X, AMD Ryzen 5 5600X | |
| AMD Ryzen 7 5800X, AMD Ryzen 7 5800X | |
| 3DMark | |
| 3840x2160 Fire Strike Ultra Physics | |
| Intel Core i3-10100, Intel Core i3-10100 | |
| AMD Ryzen 7 5800X, AMD Ryzen 7 5800X | |
| Intel Core i9-10900K, Intel Core i9-10900K | |
| AMD Ryzen 5 5600X, AMD Ryzen 5 5600X | |
| Corsair One i160, Intel Core i9-9900K | |
| Zotac Magnus One (ECM73070C), Intel Core i7-10700 | |
| Intel Core i5-10600K, Intel Core i5-10600K | |
| Intel Core i7-9700K, AMD Radeon RX Vega 64, Intel Core i7-9700K | |
| Intel Core i5-10400F, Intel Core i5-10400F | |
| 1920x1080 Fire Strike Physics | |
| Intel Core i3-10100, Intel Core i3-10100 | |
| AMD Ryzen 7 5800X, AMD Ryzen 7 5800X | |
| Intel Core i9-10900K, Intel Core i9-10900K | |
| AMD Ryzen 5 5600X, AMD Ryzen 5 5600X | |
| Corsair One i160, Intel Core i9-9900K | |
| Zotac Magnus One (ECM73070C), Intel Core i7-10700 | |
| Intel Core i5-10600K, Intel Core i5-10600K | |
| Intel Core i7-9700K, AMD Radeon RX Vega 64, Intel Core i7-9700K | |
| 2560x1440 Time Spy CPU | |
| Intel Core i9-10900K, Intel Core i9-10900K | |
| AMD Ryzen 7 5800X, AMD Ryzen 7 5800X | |
| Corsair One i160, Intel Core i9-9900K | |
| AMD Ryzen 5 5600X, AMD Ryzen 5 5600X | |
| Zotac Magnus One (ECM73070C), Intel Core i7-10700 | |
| Intel Core i7-9700K, AMD Radeon RX Vega 64, Intel Core i7-9700K | |
| Intel Core i5-10600K, Intel Core i5-10600K | |
| Intel Core i5-10400F, Intel Core i5-10400F | |
| Intel Core i3-10100, Intel Core i3-10100 | |
* ... daha küçük daha iyidir
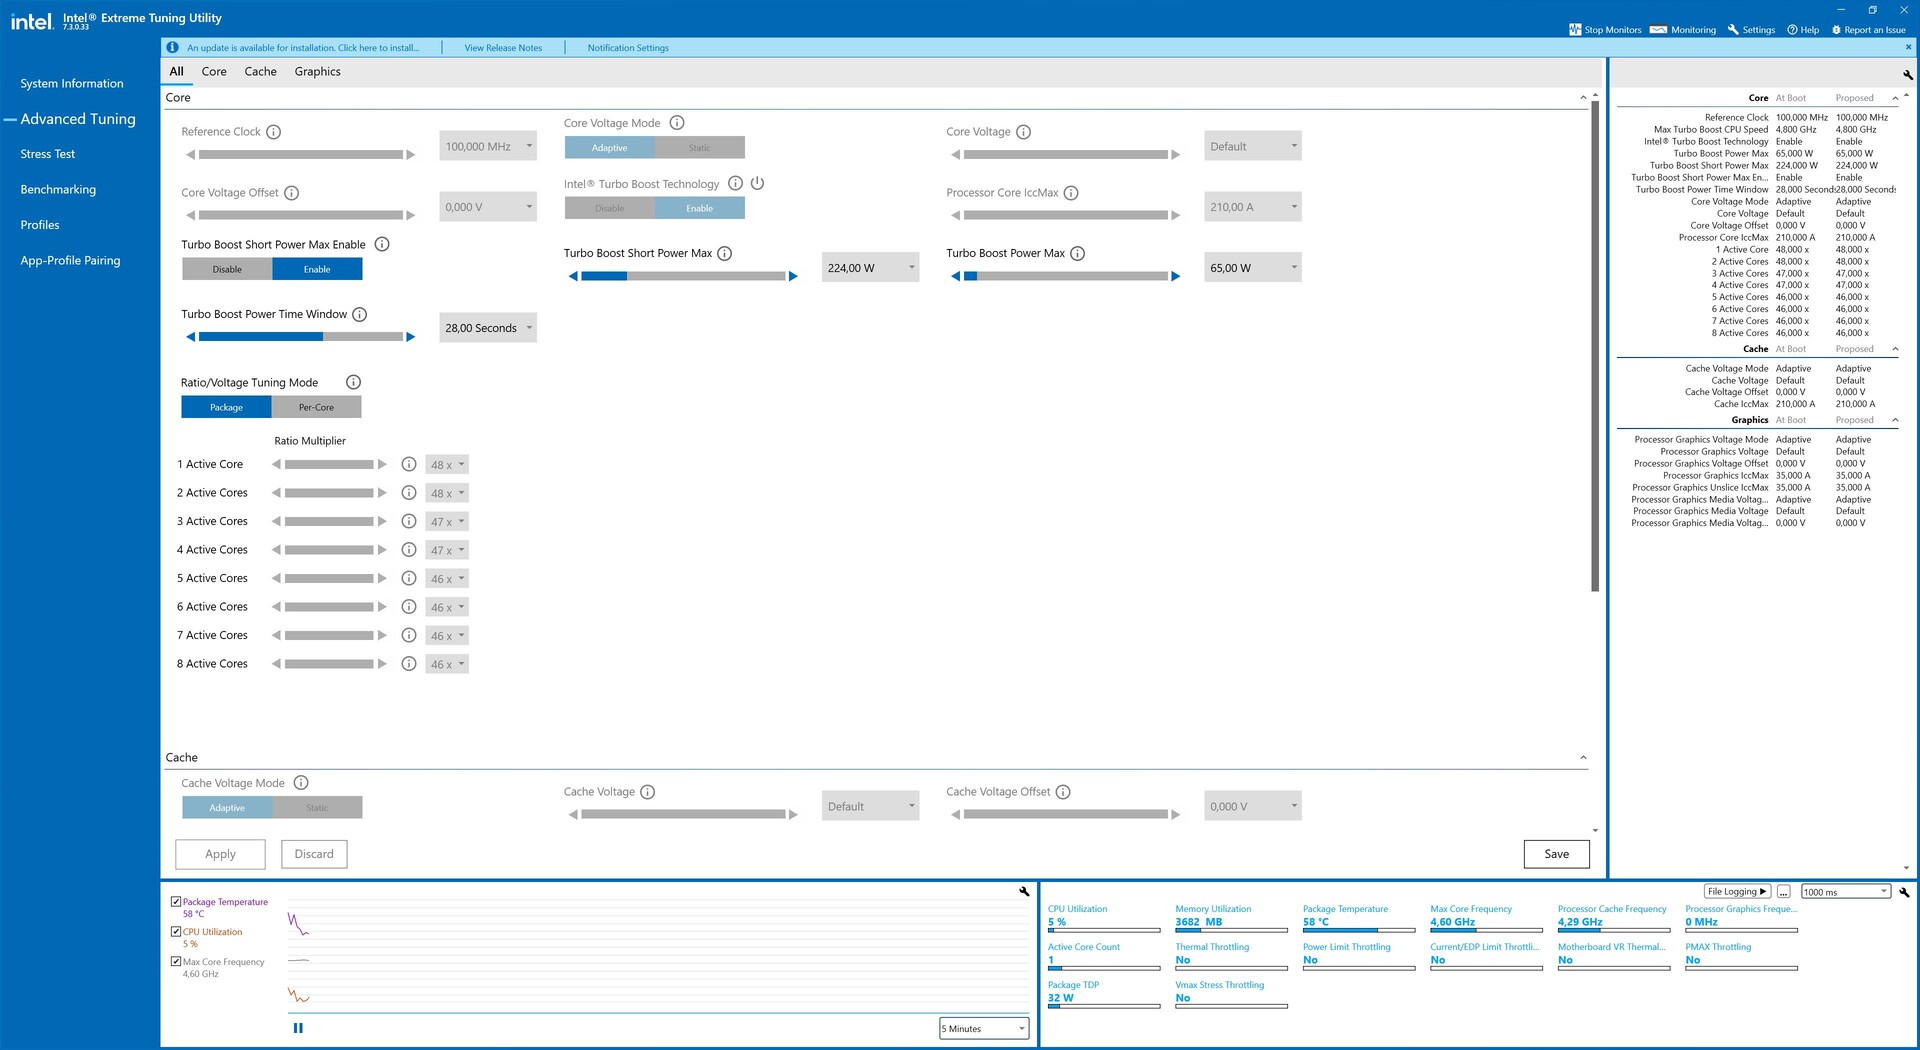
Cinebench R15 çoklu-döngü’de Zotac Magnus One
Intel Core i7-10700, ilk çalıştırmadan sonra hafif bir performans düşüşü yaşıyor, ancak testin sonraki aşamasında giderek daha kararlı hale geliyor. Buna rağmen performans ortalama 1.338 puanla yüksek seviyede.
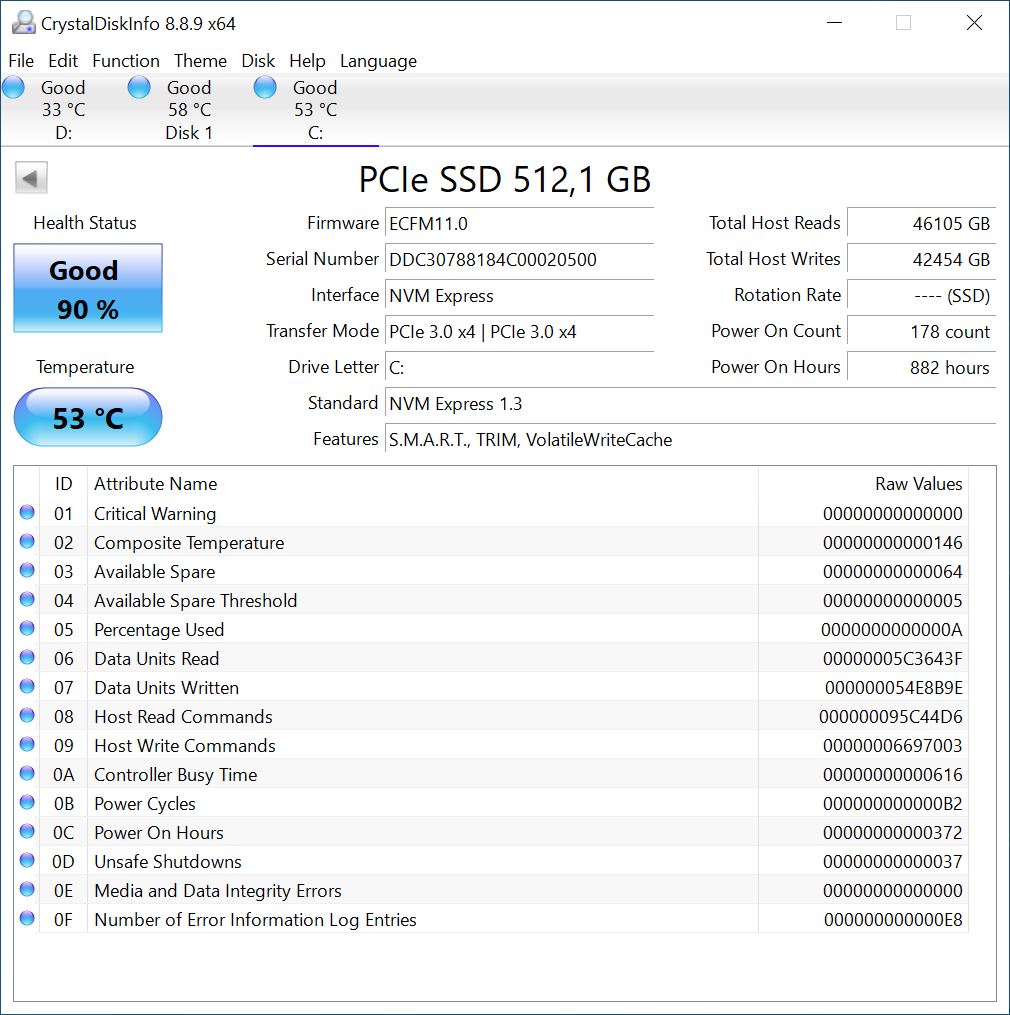
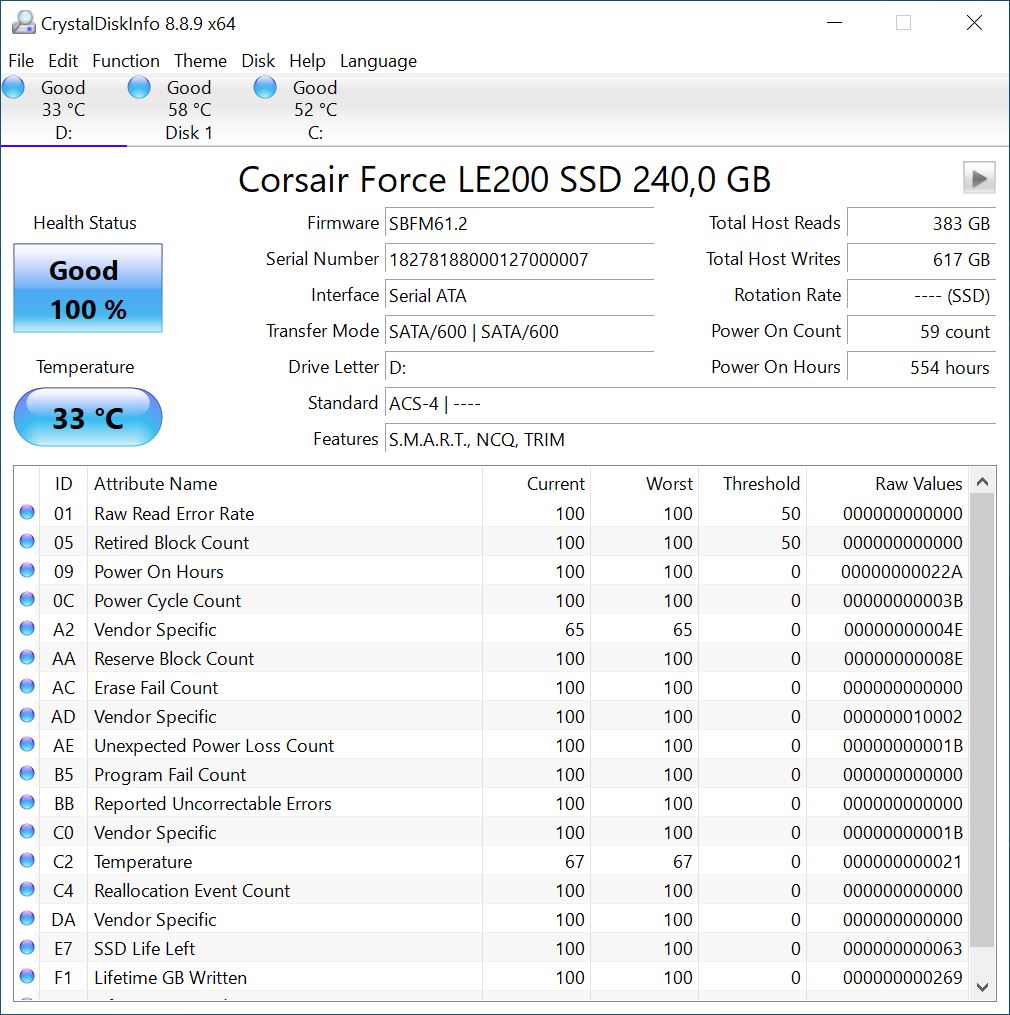
Uygulama performansı
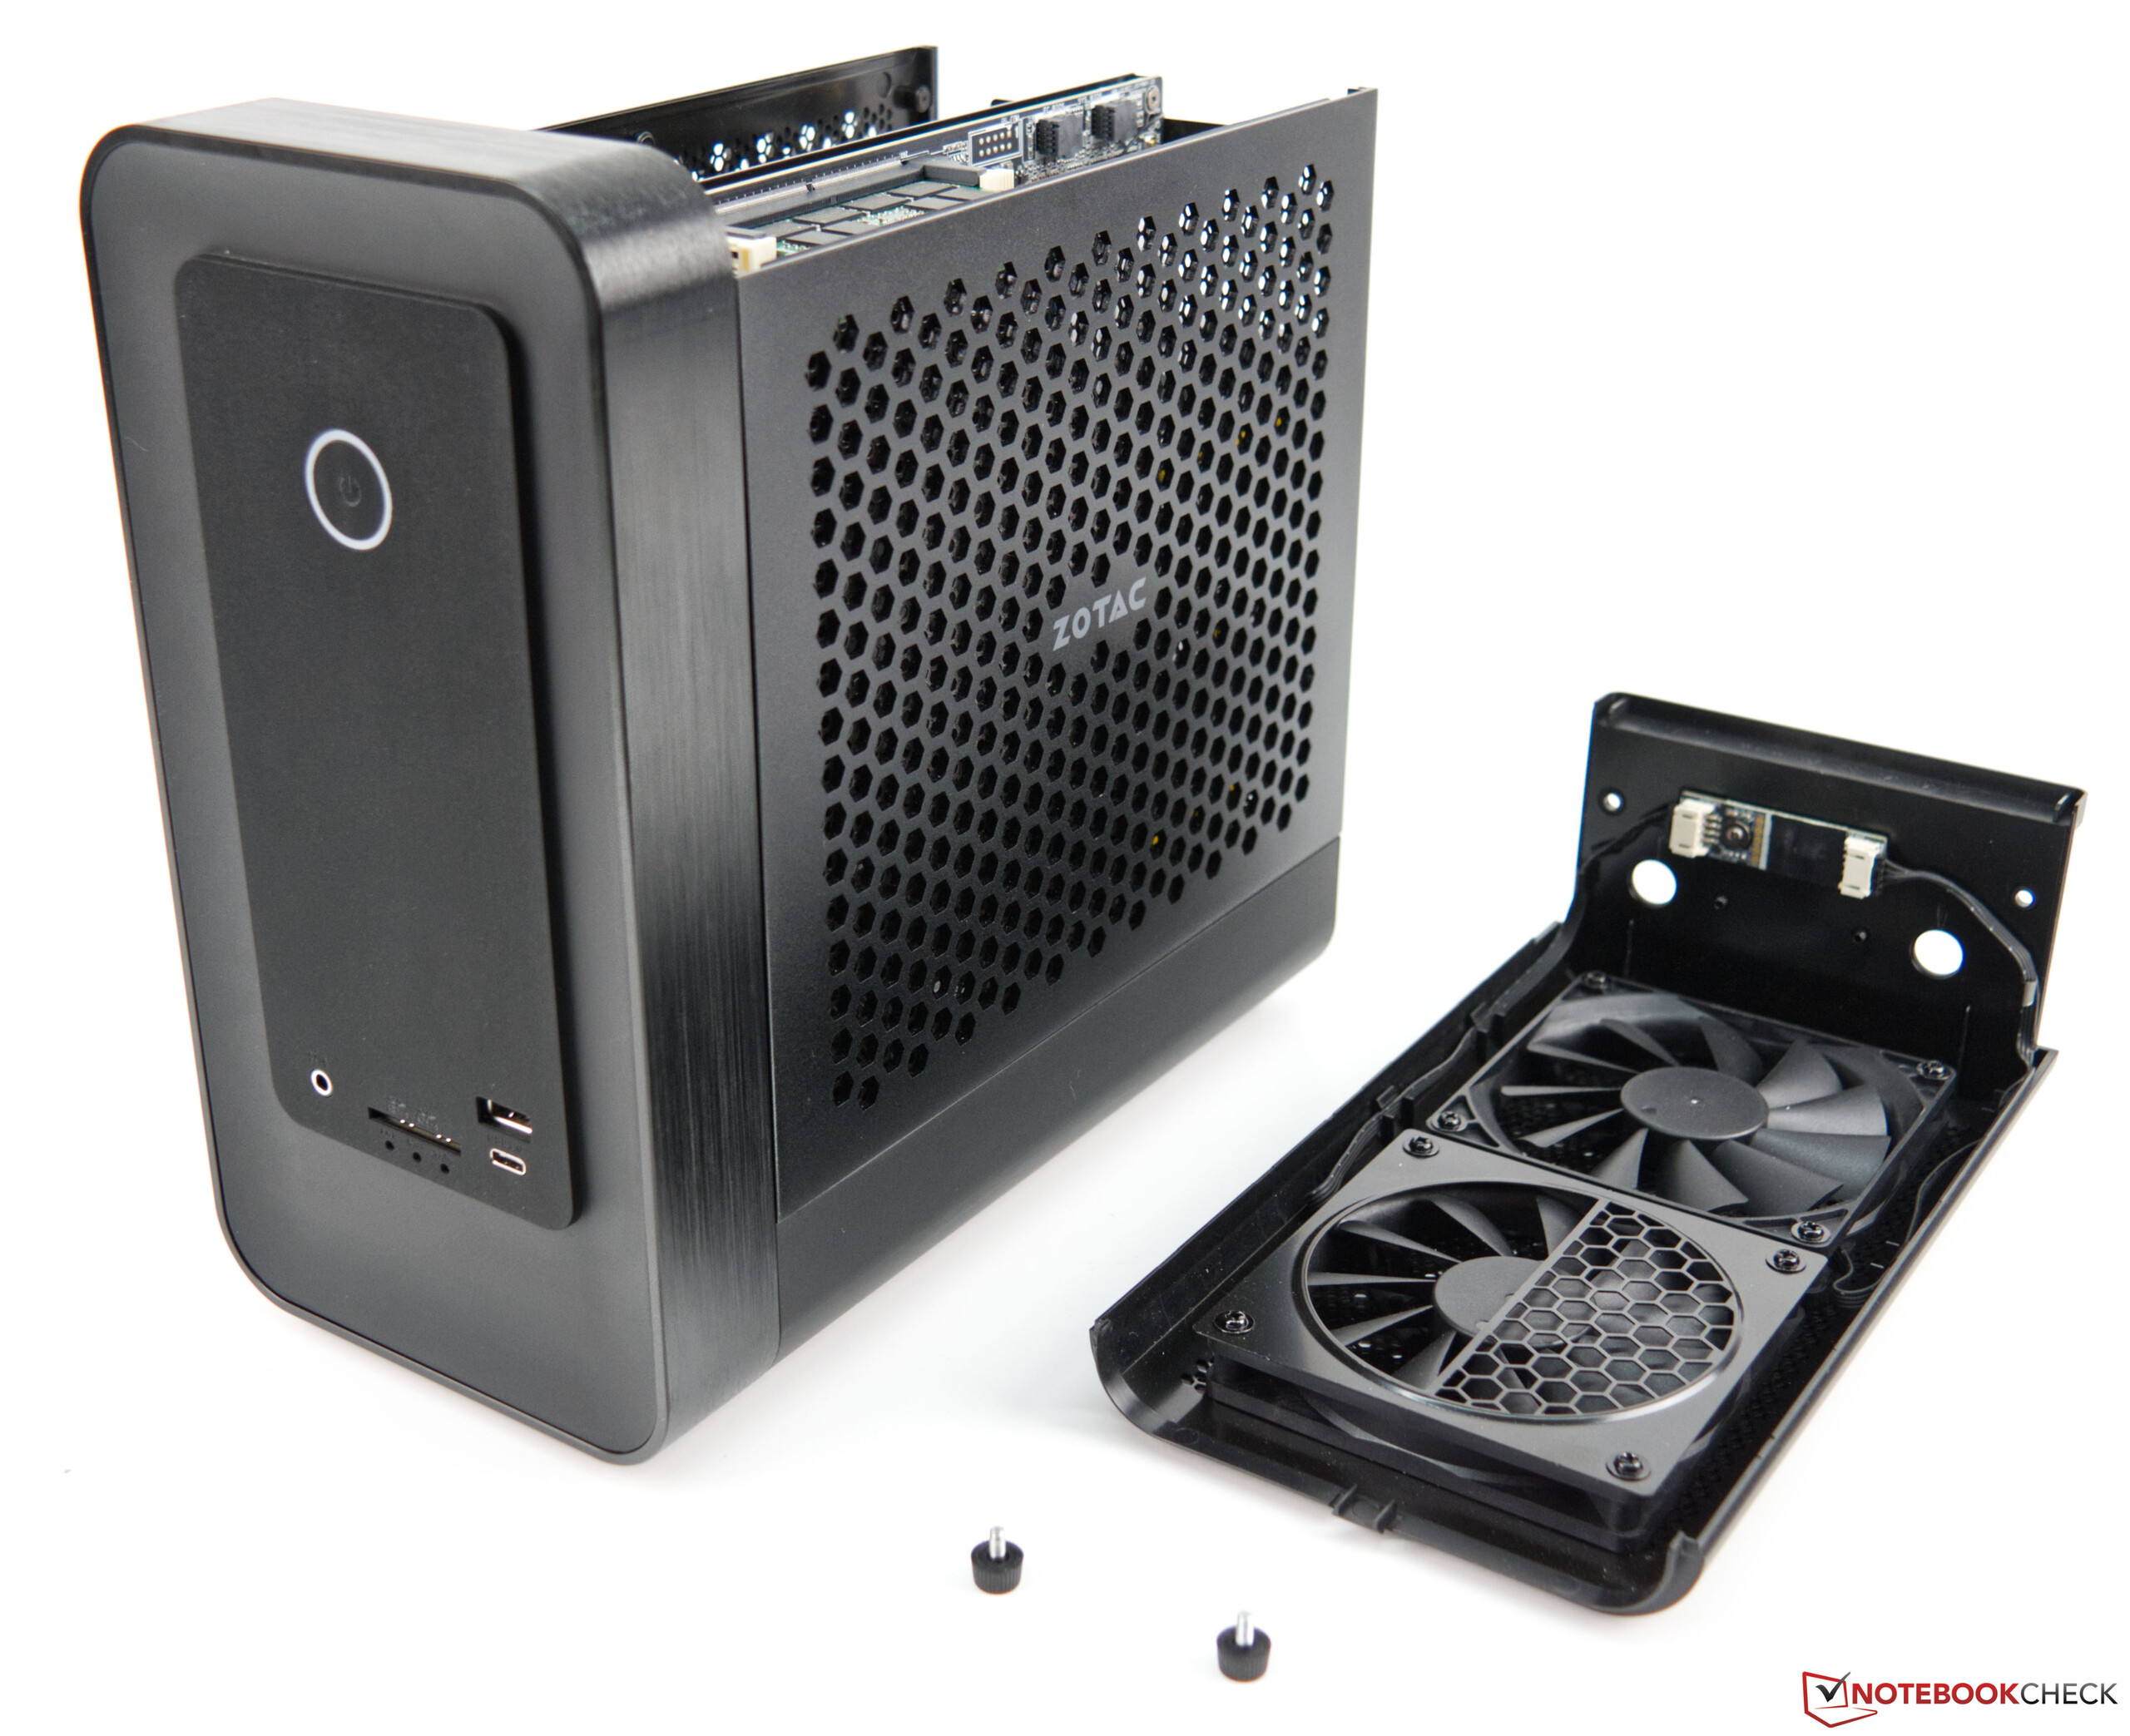
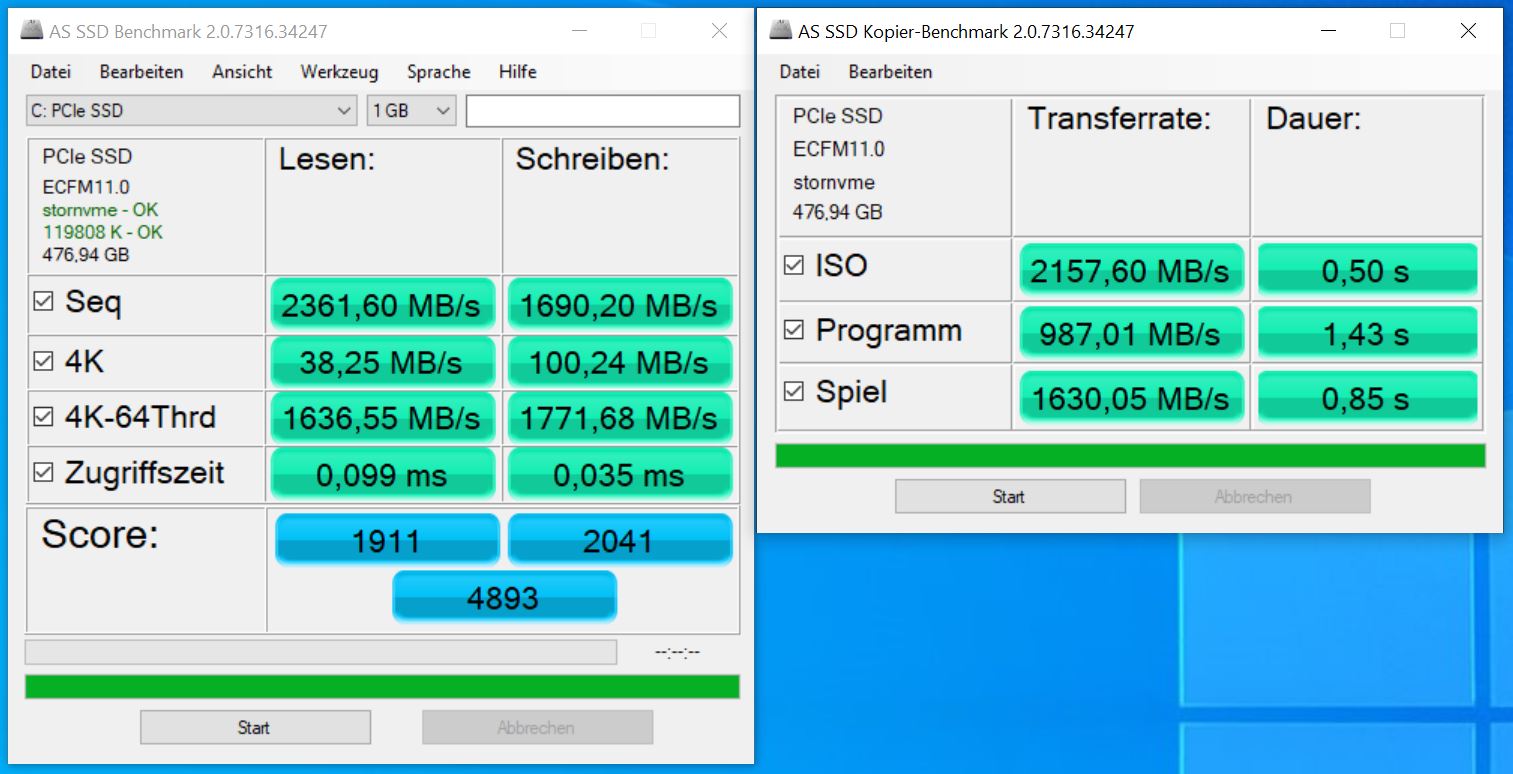
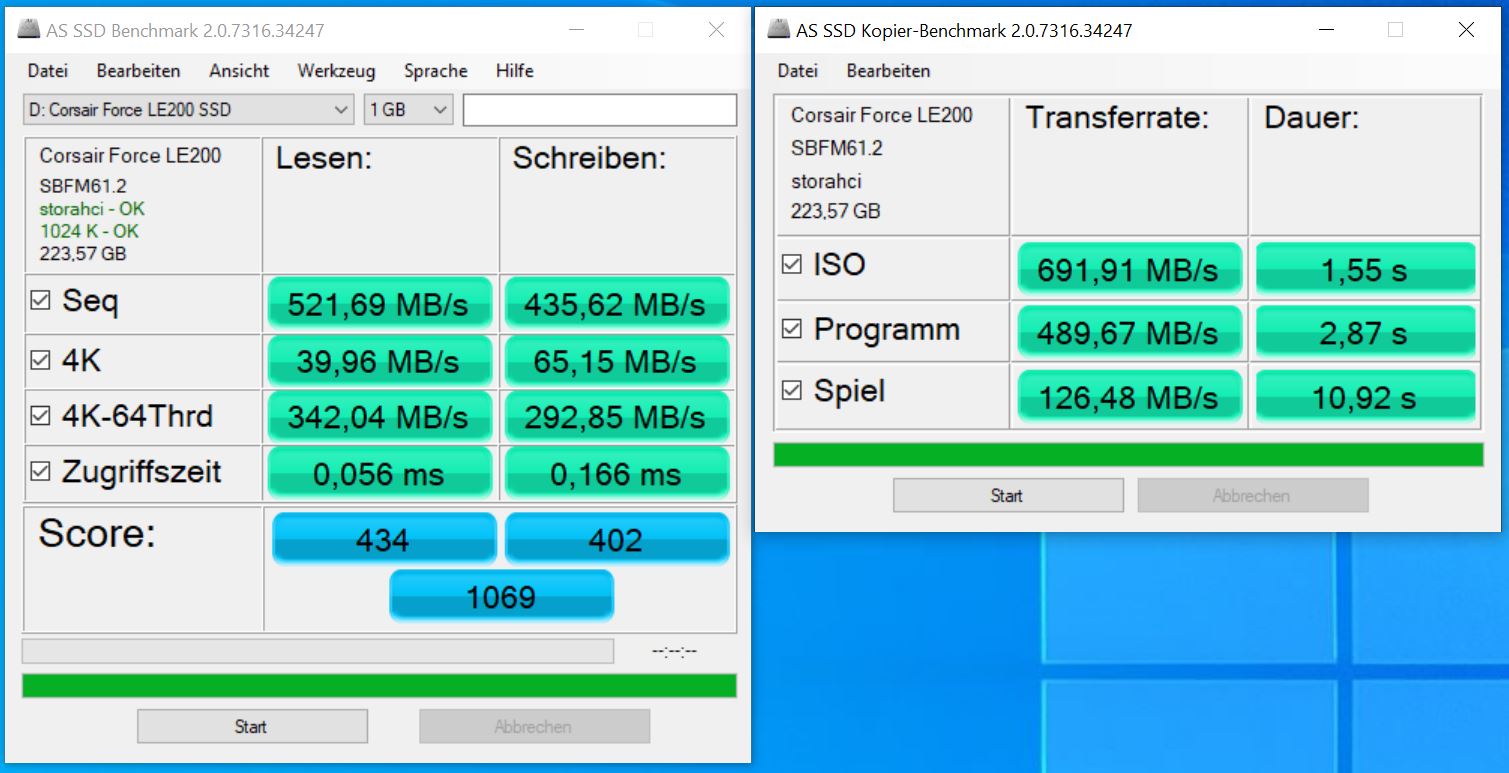
Magnus One'ın test konfigürasyonumuz, uygulama karşılaştırmalarımızda iyi denilebilen oranlara ulaşıyor. Bununla birlikte, yerleşik bileşenler nedeniyle daha iyi performans bekliyorduk. Diğer test sistemlerimizle karşılaştırıldığında Magnus One genellikle geride kalıyor. Geleneksel bir sabit diske sahip olmamasını sevdik. Ancak, kullanıcılar kullanmak istedikleri yığın depolama aygıtı türünü seçme özgürlüğüne sahip. Ekteki ekran görüntüleri, beklenebilecek performans hakkında kabaca bir fikir vermektedir. Kasaya toplam üç yığın depolama cihazı yerleştirilebilir.
| PCMark 10 | |
| Score | |
| AMD Ryzen 5 5600X, AMD Ryzen 5 5600X | |
| AMD Ryzen 7 5800X, AMD Ryzen 7 5800X | |
| Intel Core i3-10100, Intel Core i3-10100 | |
| Intel Core i9-10900K, Intel Core i9-10900K | |
| Intel Core i5-10600K, Intel Core i5-10600K | |
| Intel Core i7-9700K, AMD Radeon RX Vega 64, Intel Core i7-9700K | |
| Intel Core i5-10400F, Intel Core i5-10400F | |
| Zotac Magnus One (ECM73070C), Intel Core i7-10700 | |
| Digital Content Creation | |
| Intel Core i3-10100, Intel Core i3-10100 | |
| AMD Ryzen 7 5800X, AMD Ryzen 7 5800X | |
| Intel Core i9-10900K, Intel Core i9-10900K | |
| AMD Ryzen 5 5600X, AMD Ryzen 5 5600X | |
| Intel Core i5-10600K, Intel Core i5-10600K | |
| Zotac Magnus One (ECM73070C), Intel Core i7-10700 | |
| Intel Core i5-10400F, Intel Core i5-10400F | |
| Intel Core i7-9700K, AMD Radeon RX Vega 64, Intel Core i7-9700K | |
| Productivity | |
| AMD Ryzen 7 5800X, AMD Ryzen 7 5800X | |
| AMD Ryzen 5 5600X, AMD Ryzen 5 5600X | |
| Intel Core i3-10100, Intel Core i3-10100 | |
| Intel Core i5-10600K, Intel Core i5-10600K | |
| Intel Core i7-9700K, AMD Radeon RX Vega 64, Intel Core i7-9700K | |
| Intel Core i9-10900K, Intel Core i9-10900K | |
| Intel Core i5-10400F, Intel Core i5-10400F | |
| Zotac Magnus One (ECM73070C), Intel Core i7-10700 | |
| Essentials | |
| AMD Ryzen 7 5800X, AMD Ryzen 7 5800X | |
| AMD Ryzen 5 5600X, AMD Ryzen 5 5600X | |
| Intel Core i9-10900K, Intel Core i9-10900K | |
| Intel Core i3-10100, Intel Core i3-10100 | |
| Intel Core i5-10600K, Intel Core i5-10600K | |
| Intel Core i7-9700K, AMD Radeon RX Vega 64, Intel Core i7-9700K | |
| Zotac Magnus One (ECM73070C), Intel Core i7-10700 | |
| Intel Core i5-10400F, Intel Core i5-10400F | |
| SPECviewperf 12 | |
| 1900x1060 Solidworks (sw-03) | |
| AMD Ryzen 7 5800X, AMD Ryzen 7 5800X | |
| AMD Ryzen 5 5600X, AMD Ryzen 5 5600X | |
| Intel Core i9-10900K, Intel Core i9-10900K | |
| Intel Core i5-10600K, Intel Core i5-10600K | |
| Intel Core i3-10100, Intel Core i3-10100 | |
| Intel Core i5-10400F, Intel Core i5-10400F | |
| Intel Core i7-9700K, AMD Radeon RX Vega 64, Intel Core i7-9700K | |
| Zotac Magnus One (ECM73070C), Intel Core i7-10700 | |
| 1900x1060 Siemens NX (snx-02) | |
| Intel Core i3-10100, Intel Core i3-10100 | |
| AMD Ryzen 7 5800X, AMD Ryzen 7 5800X | |
| AMD Ryzen 5 5600X, AMD Ryzen 5 5600X | |
| Intel Core i9-10900K, Intel Core i9-10900K | |
| Intel Core i5-10400F, Intel Core i5-10400F | |
| Intel Core i5-10600K, Intel Core i5-10600K | |
| Intel Core i7-9700K, AMD Radeon RX Vega 64, Intel Core i7-9700K | |
| Zotac Magnus One (ECM73070C), Intel Core i7-10700 | |
| 1900x1060 Showcase (showcase-01) | |
| Intel Core i5-10600K, Intel Core i5-10600K | |
| Intel Core i5-10400F, Intel Core i5-10400F | |
| Intel Core i3-10100, Intel Core i3-10100 | |
| Intel Core i9-10900K, Intel Core i9-10900K | |
| AMD Ryzen 5 5600X, AMD Ryzen 5 5600X | |
| AMD Ryzen 7 5800X, AMD Ryzen 7 5800X | |
| Zotac Magnus One (ECM73070C), Intel Core i7-10700 | |
| Intel Core i7-9700K, AMD Radeon RX Vega 64, Intel Core i7-9700K | |
| 1900x1060 Medical (medical-01) | |
| Intel Core i5-10600K, Intel Core i5-10600K | |
| Intel Core i9-10900K, Intel Core i9-10900K | |
| Intel Core i5-10400F, Intel Core i5-10400F | |
| Intel Core i3-10100, Intel Core i3-10100 | |
| AMD Ryzen 7 5800X, AMD Ryzen 7 5800X | |
| AMD Ryzen 5 5600X, AMD Ryzen 5 5600X | |
| Intel Core i7-9700K, AMD Radeon RX Vega 64, Intel Core i7-9700K | |
| Zotac Magnus One (ECM73070C), Intel Core i7-10700 | |
| 1900x1060 Maya (maya-04) | |
| AMD Ryzen 7 5800X, AMD Ryzen 7 5800X | |
| AMD Ryzen 5 5600X, AMD Ryzen 5 5600X | |
| Zotac Magnus One (ECM73070C), Intel Core i7-10700 | |
| Intel Core i9-10900K, Intel Core i9-10900K | |
| Intel Core i5-10600K, Intel Core i5-10600K | |
| Intel Core i3-10100, Intel Core i3-10100 | |
| Intel Core i5-10400F, Intel Core i5-10400F | |
| Intel Core i7-9700K, AMD Radeon RX Vega 64, Intel Core i7-9700K | |
| 1900x1060 Energy (energy-01) | |
| Intel Core i5-10600K, Intel Core i5-10600K | |
| Intel Core i9-10900K, Intel Core i9-10900K | |
| Intel Core i5-10400F, Intel Core i5-10400F | |
| Intel Core i3-10100, Intel Core i3-10100 | |
| AMD Ryzen 7 5800X, AMD Ryzen 7 5800X | |
| AMD Ryzen 5 5600X, AMD Ryzen 5 5600X | |
| Zotac Magnus One (ECM73070C), Intel Core i7-10700 | |
| Intel Core i7-9700K, AMD Radeon RX Vega 64, Intel Core i7-9700K | |
| 1900x1060 Creo (creo-01) | |
| AMD Ryzen 7 5800X, AMD Ryzen 7 5800X | |
| AMD Ryzen 5 5600X, AMD Ryzen 5 5600X | |
| Intel Core i9-10900K, Intel Core i9-10900K | |
| Intel Core i5-10600K, Intel Core i5-10600K | |
| Intel Core i3-10100, Intel Core i3-10100 | |
| Intel Core i5-10400F, Intel Core i5-10400F | |
| Intel Core i7-9700K, AMD Radeon RX Vega 64, Intel Core i7-9700K | |
| Zotac Magnus One (ECM73070C), Intel Core i7-10700 | |
| 1900x1060 Catia (catia-04) | |
| AMD Ryzen 7 5800X, AMD Ryzen 7 5800X | |
| AMD Ryzen 5 5600X, AMD Ryzen 5 5600X | |
| Intel Core i9-10900K, Intel Core i9-10900K | |
| Intel Core i5-10600K, Intel Core i5-10600K | |
| Intel Core i3-10100, Intel Core i3-10100 | |
| Intel Core i5-10400F, Intel Core i5-10400F | |
| Intel Core i7-9700K, AMD Radeon RX Vega 64, Intel Core i7-9700K | |
| Zotac Magnus One (ECM73070C), Intel Core i7-10700 | |
| 1900x1060 3ds Max (3dsmax-05) | |
| AMD Ryzen 5 5600X, AMD Ryzen 5 5600X | |
| Intel Core i9-10900K, Intel Core i9-10900K | |
| Intel Core i5-10600K, Intel Core i5-10600K | |
| AMD Ryzen 7 5800X, AMD Ryzen 7 5800X | |
| Intel Core i5-10400F, Intel Core i5-10400F | |
| Intel Core i3-10100, Intel Core i3-10100 | |
| Zotac Magnus One (ECM73070C), Intel Core i7-10700 | |
| Intel Core i7-9700K, AMD Radeon RX Vega 64, Intel Core i7-9700K | |
| SPECviewperf 13 | |
| Solidworks (sw-04) | |
| AMD Ryzen 7 5800X, AMD Ryzen 7 5800X | |
| AMD Ryzen 5 5600X, AMD Ryzen 5 5600X | |
| Intel Core i9-10900K, Intel Core i9-10900K | |
| Intel Core i5-10600K, Intel Core i5-10600K | |
| Intel Core i3-10100, Intel Core i3-10100 | |
| Intel Core i5-10400F, Intel Core i5-10400F | |
| Zotac Magnus One (ECM73070C), Intel Core i7-10700 | |
| Intel Core i7-9700K, AMD Radeon RX Vega 64, Intel Core i7-9700K | |
| Siemens NX (snx-03) | |
| Intel Core i3-10100, Intel Core i3-10100 | |
| AMD Ryzen 7 5800X, AMD Ryzen 7 5800X | |
| AMD Ryzen 5 5600X, AMD Ryzen 5 5600X | |
| Intel Core i9-10900K, Intel Core i9-10900K | |
| Intel Core i5-10600K, Intel Core i5-10600K | |
| Intel Core i5-10400F, Intel Core i5-10400F | |
| Intel Core i7-9700K, AMD Radeon RX Vega 64, Intel Core i7-9700K | |
| Zotac Magnus One (ECM73070C), Intel Core i7-10700 | |
| Showcase (showcase-02) | |
| Intel Core i5-10600K, Intel Core i5-10600K | |
| Intel Core i9-10900K, Intel Core i9-10900K | |
| Intel Core i5-10400F, Intel Core i5-10400F | |
| Intel Core i3-10100, Intel Core i3-10100 | |
| AMD Ryzen 7 5800X, AMD Ryzen 7 5800X | |
| AMD Ryzen 5 5600X, AMD Ryzen 5 5600X | |
| Zotac Magnus One (ECM73070C), Intel Core i7-10700 | |
| Intel Core i7-9700K, AMD Radeon RX Vega 64, Intel Core i7-9700K | |
| Medical (medical-02) | |
| AMD Ryzen 7 5800X, AMD Ryzen 7 5800X | |
| AMD Ryzen 5 5600X, AMD Ryzen 5 5600X | |
| Intel Core i3-10100, Intel Core i3-10100 | |
| Intel Core i5-10600K, Intel Core i5-10600K | |
| Intel Core i9-10900K, Intel Core i9-10900K | |
| Intel Core i5-10400F, Intel Core i5-10400F | |
| Zotac Magnus One (ECM73070C), Intel Core i7-10700 | |
| Intel Core i7-9700K, AMD Radeon RX Vega 64, Intel Core i7-9700K | |
| Maya (maya-05) | |
| AMD Ryzen 7 5800X, AMD Ryzen 7 5800X | |
| AMD Ryzen 5 5600X, AMD Ryzen 5 5600X | |
| Intel Core i9-10900K, Intel Core i9-10900K | |
| Intel Core i3-10100, Intel Core i3-10100 | |
| Intel Core i5-10600K, Intel Core i5-10600K | |
| Zotac Magnus One (ECM73070C), Intel Core i7-10700 | |
| Intel Core i5-10400F, Intel Core i5-10400F | |
| Intel Core i7-9700K, AMD Radeon RX Vega 64, Intel Core i7-9700K | |
| Energy (energy-02) | |
| Intel Core i5-10600K, Intel Core i5-10600K | |
| Intel Core i9-10900K, Intel Core i9-10900K | |
| Intel Core i5-10400F, Intel Core i5-10400F | |
| AMD Ryzen 7 5800X, AMD Ryzen 7 5800X | |
| AMD Ryzen 5 5600X, AMD Ryzen 5 5600X | |
| Intel Core i3-10100, Intel Core i3-10100 | |
| Zotac Magnus One (ECM73070C), Intel Core i7-10700 | |
| Intel Core i7-9700K, AMD Radeon RX Vega 64, Intel Core i7-9700K | |
| Creo (creo-02) | |
| AMD Ryzen 7 5800X, AMD Ryzen 7 5800X | |
| AMD Ryzen 5 5600X, AMD Ryzen 5 5600X | |
| Intel Core i3-10100, Intel Core i3-10100 | |
| Intel Core i9-10900K, Intel Core i9-10900K | |
| Intel Core i5-10600K, Intel Core i5-10600K | |
| Intel Core i5-10400F, Intel Core i5-10400F | |
| Zotac Magnus One (ECM73070C), Intel Core i7-10700 | |
| Intel Core i7-9700K, AMD Radeon RX Vega 64, Intel Core i7-9700K | |
| Catia (catia-05) | |
| AMD Ryzen 5 5600X, AMD Ryzen 5 5600X | |
| AMD Ryzen 7 5800X, AMD Ryzen 7 5800X | |
| Intel Core i9-10900K, Intel Core i9-10900K | |
| Intel Core i5-10600K, Intel Core i5-10600K | |
| Intel Core i3-10100, Intel Core i3-10100 | |
| Intel Core i5-10400F, Intel Core i5-10400F | |
| Intel Core i7-9700K, AMD Radeon RX Vega 64, Intel Core i7-9700K | |
| Zotac Magnus One (ECM73070C), Intel Core i7-10700 | |
| 3ds Max (3dsmax-06) | |
| AMD Ryzen 5 5600X, AMD Ryzen 5 5600X | |
| AMD Ryzen 7 5800X, AMD Ryzen 7 5800X | |
| Intel Core i5-10600K, Intel Core i5-10600K | |
| Intel Core i9-10900K, Intel Core i9-10900K | |
| Intel Core i5-10400F, Intel Core i5-10400F | |
| Intel Core i3-10100, Intel Core i3-10100 | |
| Zotac Magnus One (ECM73070C), Intel Core i7-10700 | |
| Intel Core i7-9700K, AMD Radeon RX Vega 64, Intel Core i7-9700K | |
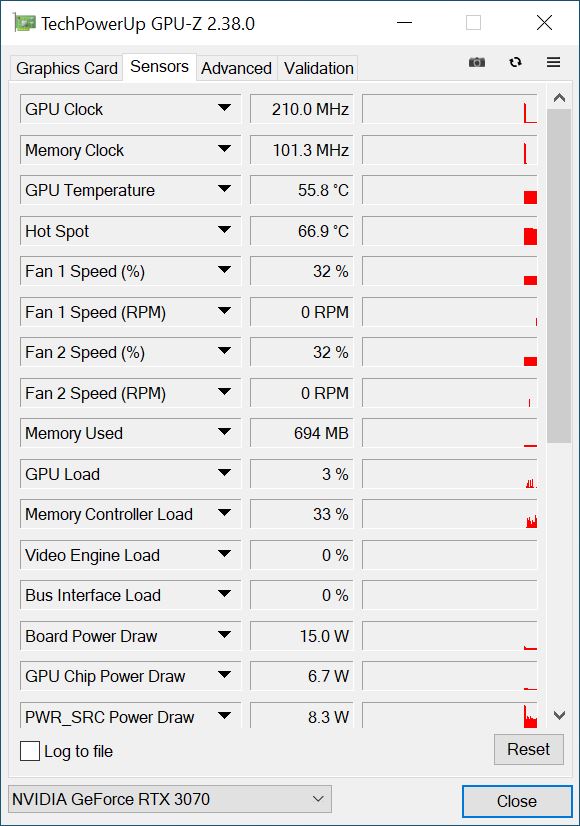
3D ve oyun performansı
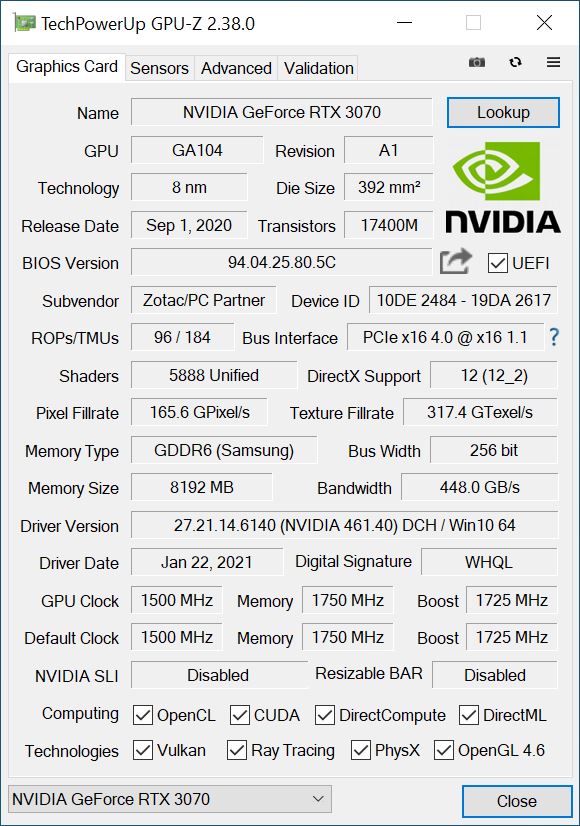
Doğrudan Zotac'ın şirket içi stoğundan gelen bir Nvidia GeForce RTX 3070, iyi 3D performansı sunmaktan sorumludur. Sistem, testte sağlam bir performans sergiledi ve genel olarak, yalnızca CPU'yu inceleyen önceki testlerden biraz daha iyi puan aldı. Saf performans açısından, GeForce RTX 3070'li Magnus One, biraz daha hızlı AMD Ryzen 9 5900X ve MSI GeForce RTX 3070 Ventus 3X'e dayanan test sistemimizin hemen arkasında yer alıyor. Ancak, biraz daha düşük performans fark edilir olarak tanımlanamaz. Bununla birlikte, RTX 2070 Super ile donatılmış önceki nesil söz konusu olduğunda RTX 3070'in işi kolay. Performansta %30'a varan bir artış mümkün ve bu kesinlikle oyun oynarken de hissediliyor. Magnus One'ın donanımı kesinlikle birçok oyunun 2160p'de oynanmasına izin veriyor, ancak 1440p oyun ana hedef olmalıdır.
RTX 3070'in performansıyla ilgili daha fazla karşılaştırma ve kıyaslama için lütfen GPU karşılaştırma tablomuzu inceleyin.
| Borderlands 3 - 1920x1080 Badass Overall Quality (DX11) | |
| Zotac Magnus One (ECM73070C) | |
| MSI GeForce RTX 3070 Ventus 3X | |
| Ortalama NVIDIA GeForce RTX 2070 Super (Desktop) (74.3 - 86, n=5) | |
| Nvidia GeForce RTX 2070 Super | |
| KFA2 GeForce RTX 2070 Super Work The Frames | |
| Ortalama NVIDIA GeForce RTX 2070 (Desktop) (70.9 - 74.4, n=2) | |
| Ortalama NVIDIA GeForce RTX 2060 Super (Desktop) (68.6 - 74.1, n=4) | |
| Metro Exodus - 1920x1080 Ultra Quality AF:16x | |
| MSI GeForce RTX 3070 Ventus 3X | |
| Zotac Magnus One (ECM73070C) | |
| Ortalama NVIDIA GeForce RTX 2070 Super (Desktop) (67.8 - 79.1, n=5) | |
| KFA2 GeForce RTX 2070 Super Work The Frames | |
| Nvidia GeForce RTX 2070 Super | |
| Ortalama NVIDIA GeForce RTX 2060 Super (Desktop) (58 - 67.4, n=4) | |
| Ortalama NVIDIA GeForce RTX 2070 (Desktop) (33.4 - 62.8, n=4) | |
| Far Cry New Dawn - 1920x1080 Ultra Preset | |
| MSI GeForce RTX 3070 Ventus 3X | |
| Ortalama NVIDIA GeForce RTX 2070 Super (Desktop) (80 - 133, n=5) | |
| Ortalama NVIDIA GeForce RTX 2060 Super (Desktop) (85 - 121, n=4) | |
| KFA2 GeForce RTX 2070 Super Work The Frames | |
| Zotac Magnus One (ECM73070C) | |
| Ortalama NVIDIA GeForce RTX 2070 (Desktop) (79 - 94, n=3) | |
| Nvidia GeForce RTX 2070 Super | |
| Far Cry 5 - 1920x1080 Ultra Preset AA:T | |
| MSI GeForce RTX 3070 Ventus 3X | |
| Ortalama NVIDIA GeForce RTX 2070 Super (Desktop) (99 - 148, n=5) | |
| Zotac Magnus One (ECM73070C) | |
| Ortalama NVIDIA GeForce RTX 2060 Super (Desktop) (99 - 130, n=4) | |
| KFA2 GeForce RTX 2070 Super Work The Frames | |
| Ortalama NVIDIA GeForce RTX 2070 (Desktop) (86 - 105, n=4) | |
| Nvidia GeForce RTX 2070 Super | |
| X-Plane 11.11 - 1920x1080 high (fps_test=3) | |
| Ortalama NVIDIA GeForce RTX 2060 Super (Desktop) (77 - 158.2, n=4) | |
| Ortalama NVIDIA GeForce RTX 2070 Super (Desktop) (66.8 - 157.3, n=6) | |
| MSI GeForce RTX 3070 Ventus 3X | |
| Ortalama NVIDIA GeForce RTX 2070 (Desktop) (n=1) | |
| KFA2 GeForce RTX 2070 Super Work The Frames | |
| Zotac Magnus One (ECM73070C) | |
| Nvidia GeForce RTX 2070 Super | |
| Final Fantasy XV Benchmark - 1920x1080 High Quality | |
| MSI GeForce RTX 3070 Ventus 3X | |
| Zotac Magnus One (ECM73070C) | |
| Ortalama NVIDIA GeForce RTX 2070 Super (Desktop) (75.5 - 120, n=6) | |
| Nvidia GeForce RTX 2070 Super | |
| Ortalama NVIDIA GeForce RTX 2060 Super (Desktop) (79 - 93.8, n=4) | |
| Ortalama NVIDIA GeForce RTX 2070 (Desktop) (60.8 - 90.6, n=5) | |
| KFA2 GeForce RTX 2070 Super Work The Frames | |
| Dota 2 Reborn - 1920x1080 ultra (3/3) best looking | |
| Ortalama NVIDIA GeForce RTX 2060 Super (Desktop) (109.8 - 241, n=4) | |
| Ortalama NVIDIA GeForce RTX 2070 Super (Desktop) (103.2 - 236, n=6) | |
| KFA2 GeForce RTX 2070 Super Work The Frames | |
| MSI GeForce RTX 3070 Ventus 3X | |
| Ortalama NVIDIA GeForce RTX 2070 (Desktop) (n=1) | |
| Zotac Magnus One (ECM73070C) | |
| Nvidia GeForce RTX 2070 Super | |
| The Witcher 3 - 1920x1080 Ultra Graphics & Postprocessing (HBAO+) | |
| MSI GeForce RTX 3070 Ventus 3X | |
| Zotac Magnus One (ECM73070C) | |
| Ortalama NVIDIA GeForce RTX 2070 Super (Desktop) (95.6 - 109.6, n=6) | |
| KFA2 GeForce RTX 2070 Super Work The Frames | |
| Nvidia GeForce RTX 2070 Super | |
| Ortalama NVIDIA GeForce RTX 2060 Super (Desktop) (79 - 91.1, n=5) | |
| Ortalama NVIDIA GeForce RTX 2070 (Desktop) (40.9 - 95, n=5) | |
| 3DMark 11 | |
| 1280x720 Performance GPU | |
| MSI GeForce RTX 3070 Ventus 3X | |
| Zotac Magnus One (ECM73070C) | |
| Nvidia GeForce RTX 2070 Super | |
| Ortalama NVIDIA GeForce RTX 2070 Super (Desktop) (33257 - 37235, n=8) | |
| Nvidia GeForce RTX 2070 Super | |
| KFA2 GeForce RTX 2070 Super Work The Frames | |
| Ortalama NVIDIA GeForce RTX 2070 (Desktop) (22174 - 32373, n=7) | |
| Ortalama NVIDIA GeForce RTX 2060 Super (Desktop) (29148 - 30342, n=8) | |
| 1280x720 Performance | |
| MSI GeForce RTX 3070 Ventus 3X | |
| Ortalama NVIDIA GeForce RTX 2070 Super (Desktop) (24879 - 35274, n=8) | |
| Zotac Magnus One (ECM73070C) | |
| Nvidia GeForce RTX 2070 Super | |
| KFA2 GeForce RTX 2070 Super Work The Frames | |
| Ortalama NVIDIA GeForce RTX 2060 Super (Desktop) (22211 - 30712, n=8) | |
| Nvidia GeForce RTX 2070 Super | |
| Ortalama NVIDIA GeForce RTX 2070 (Desktop) (15341 - 27206, n=7) | |
| düşük | orta | yüksek | ultra | QHD | 4K | |
|---|---|---|---|---|---|---|
| GTA V (2015) | 180 | 173 | 161 | 95.6 | 91.6 | 110 |
| The Witcher 3 (2015) | 367 | 316 | 235 | 121 | 84 | |
| Dota 2 Reborn (2015) | 164.2 | 143.8 | 138.2 | 129.7 | 127.4 | |
| Final Fantasy XV Benchmark (2018) | 167 | 146 | 112 | 89.2 | 54.8 | |
| X-Plane 11.11 (2018) | 124 | 110 | 91 | 78.8 | ||
| Far Cry 5 (2018) | 150 | 133 | 126 | 117 | 112 | 70 |
| Strange Brigade (2018) | 430 | 311 | 253 | 222 | 165 | 97.1 |
| Far Cry New Dawn (2019) | 126 | 110 | 106 | 95 | 92 | 70 |
| Metro Exodus (2019) | 166 | 136 | 116 | 93.1 | 76.1 | 49 |
| Borderlands 3 (2019) | 149 | 132 | 118 | 98.8 | 75.5 | 42.7 |
Emisyonlar
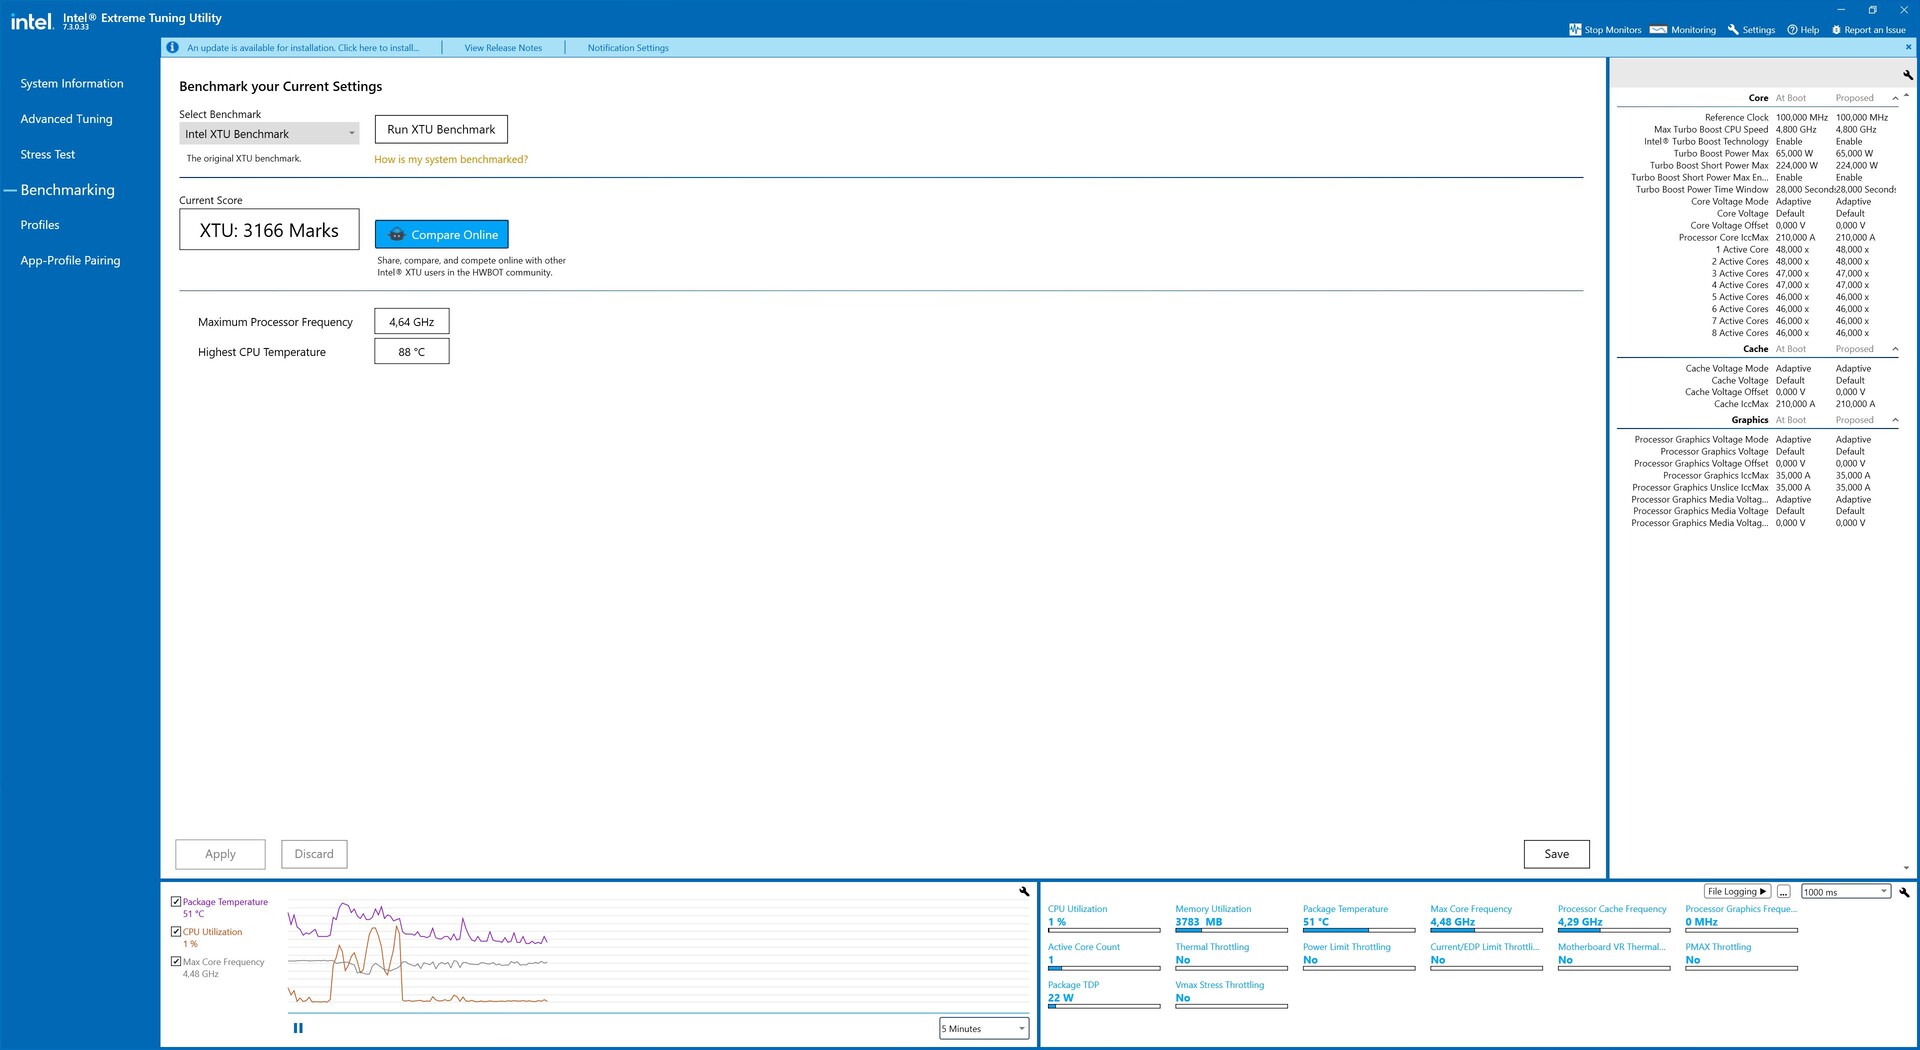
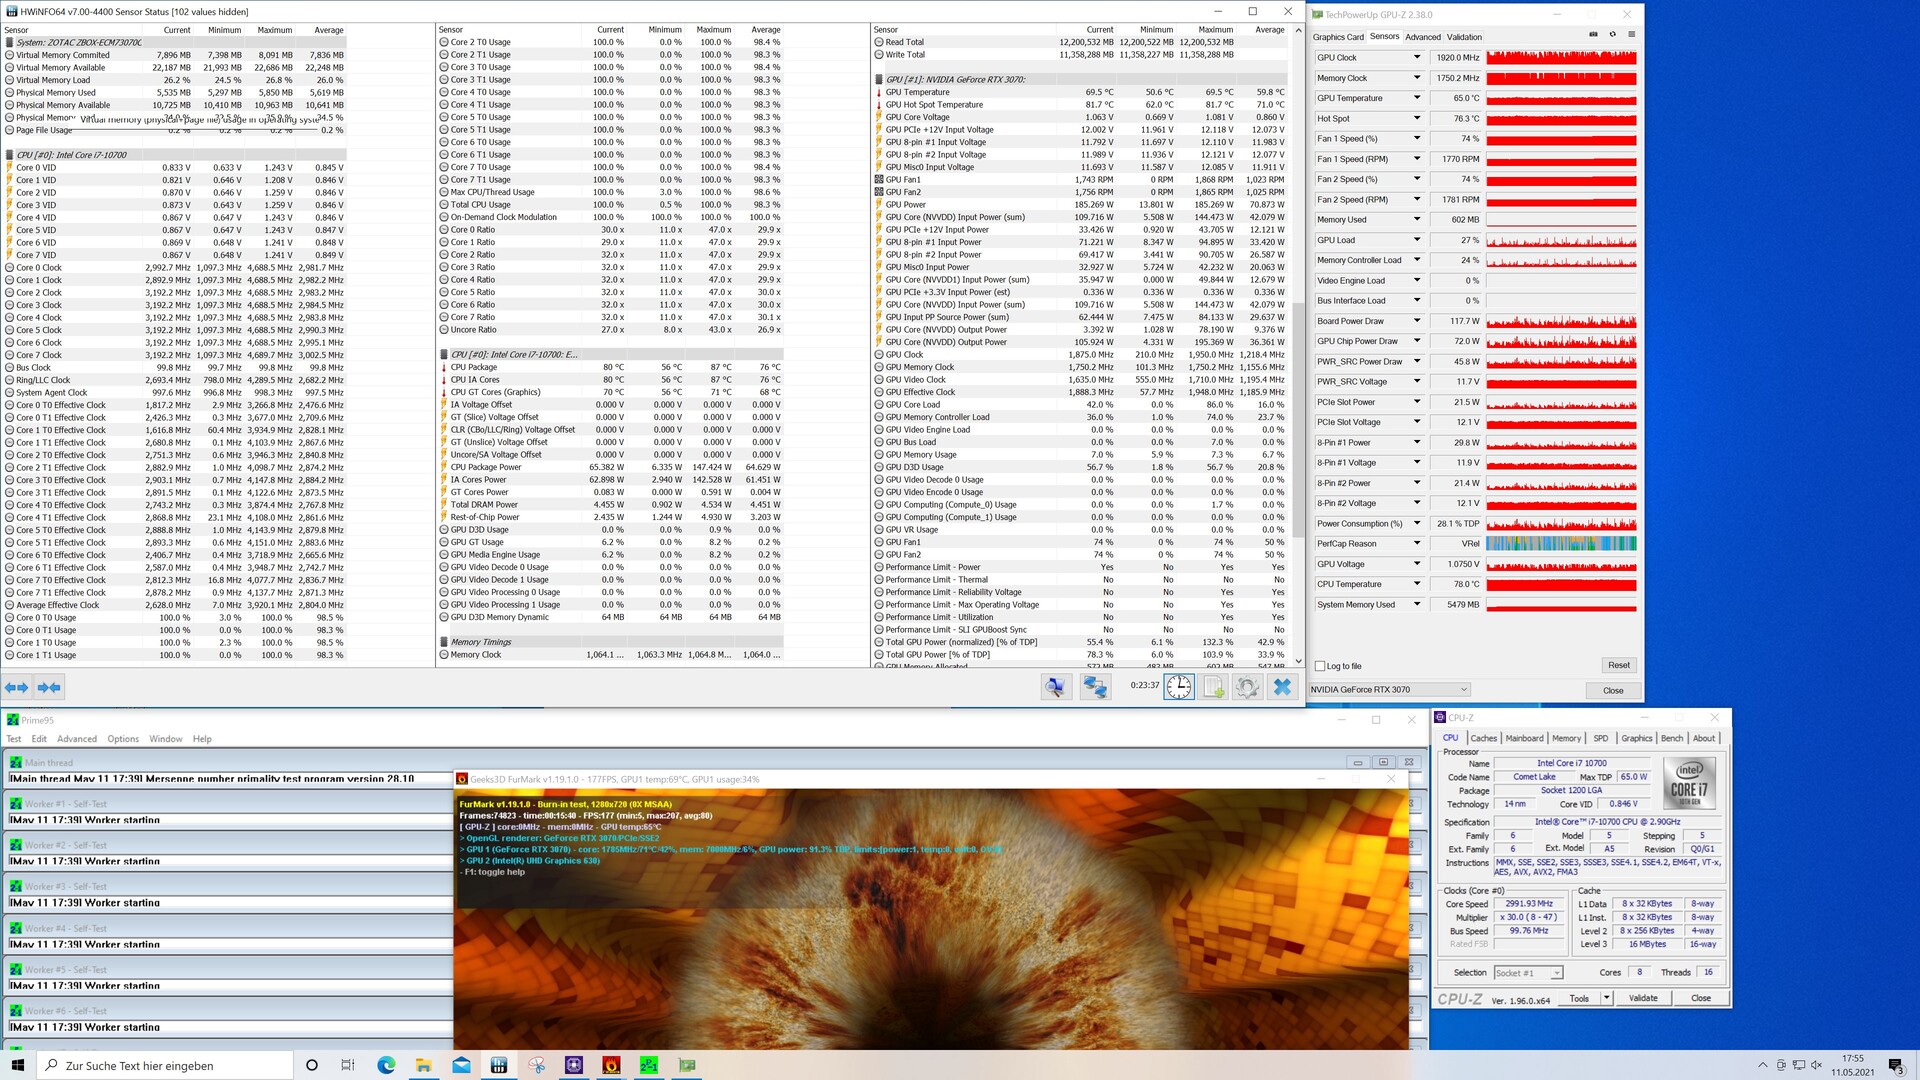
Zotac Magnus One stres testinde
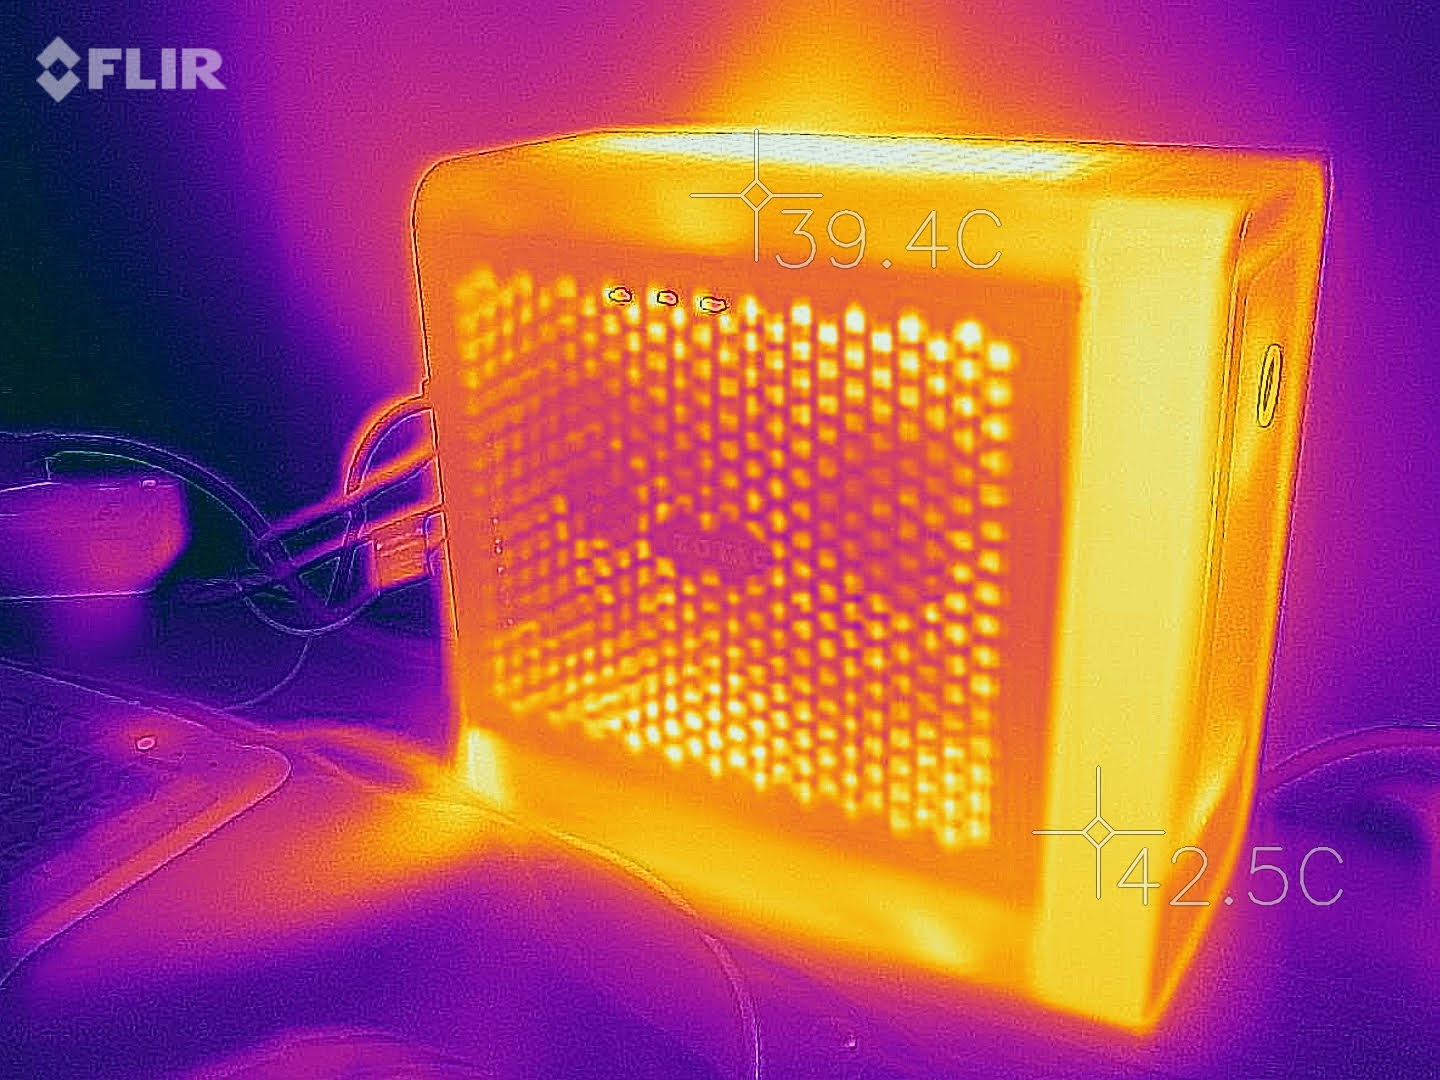
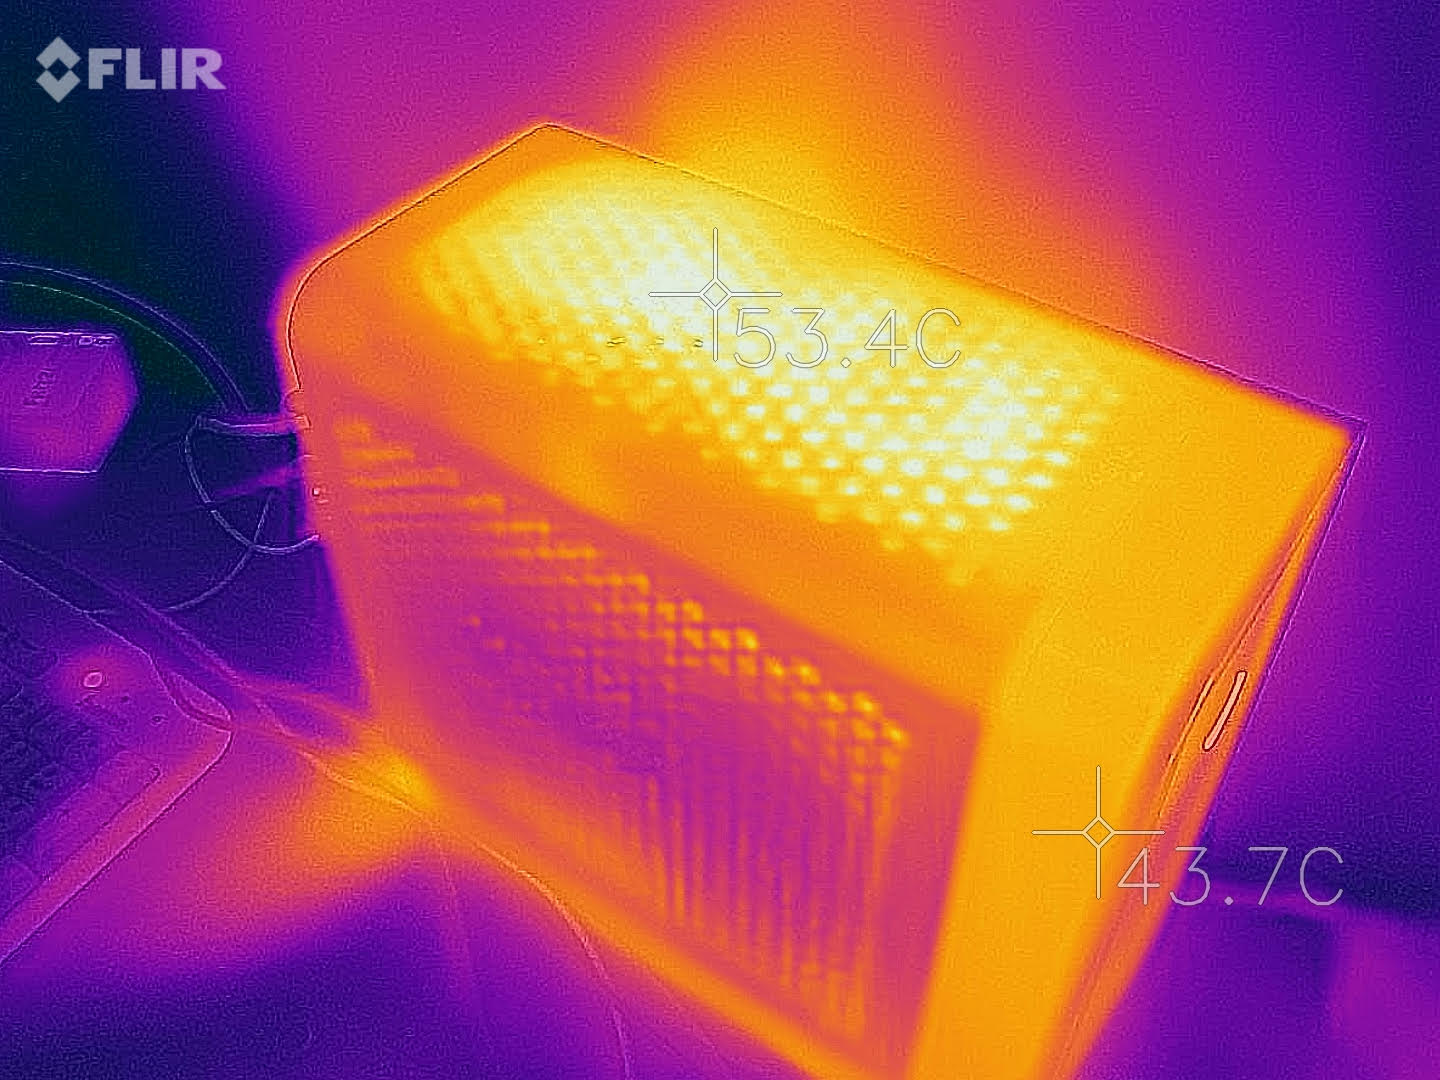
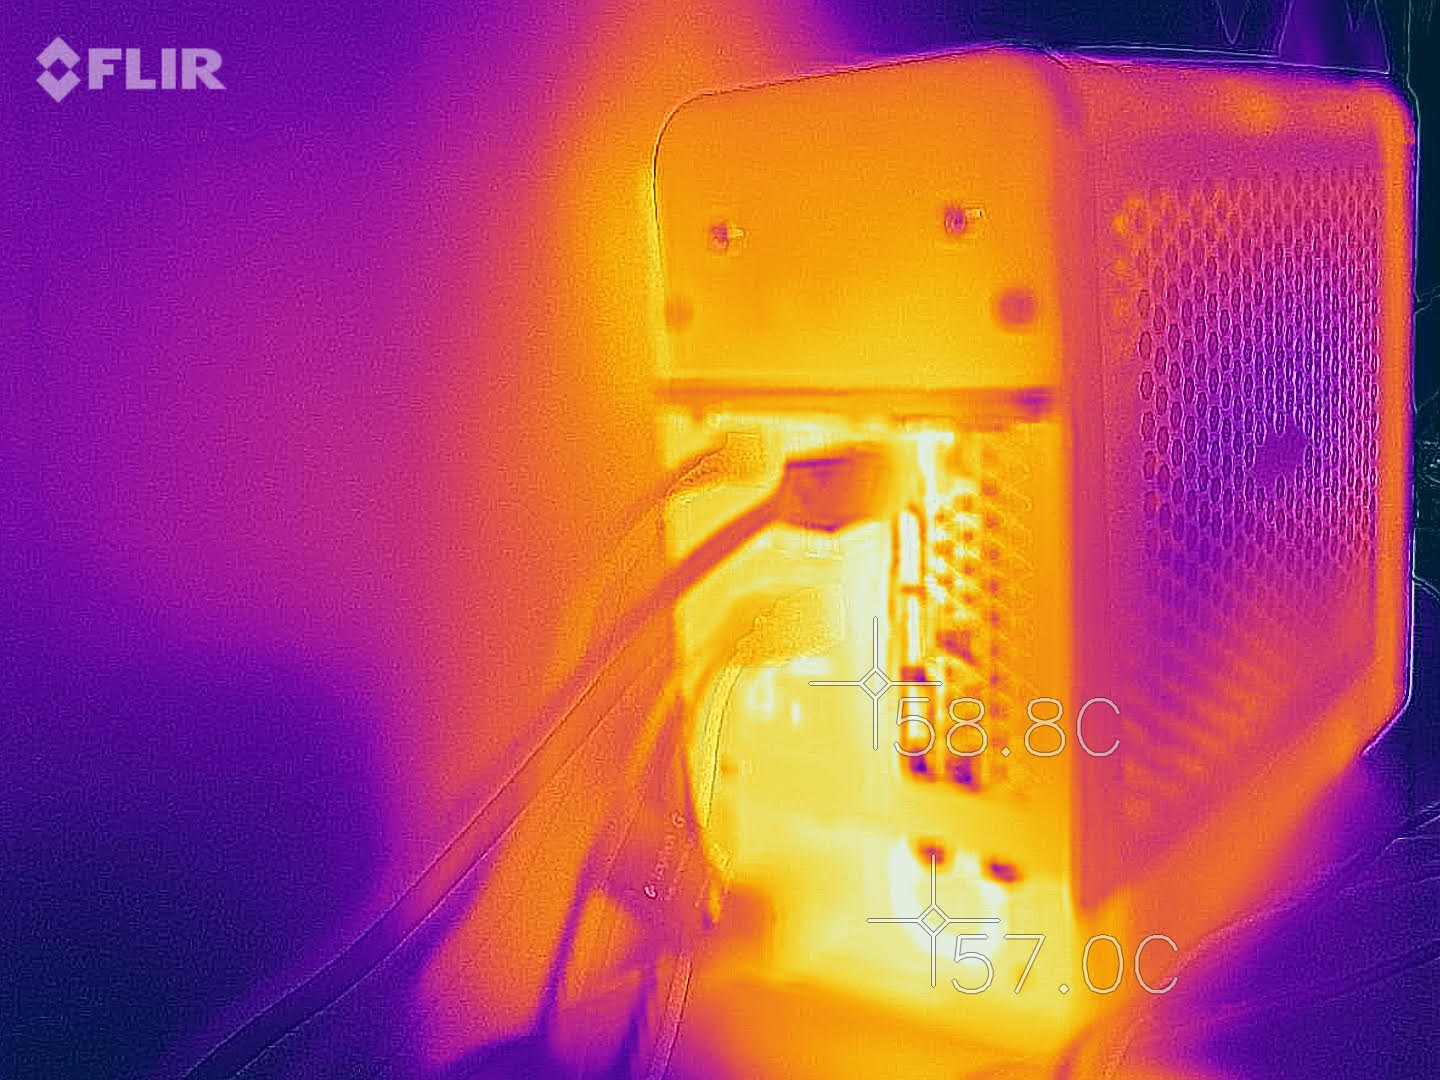
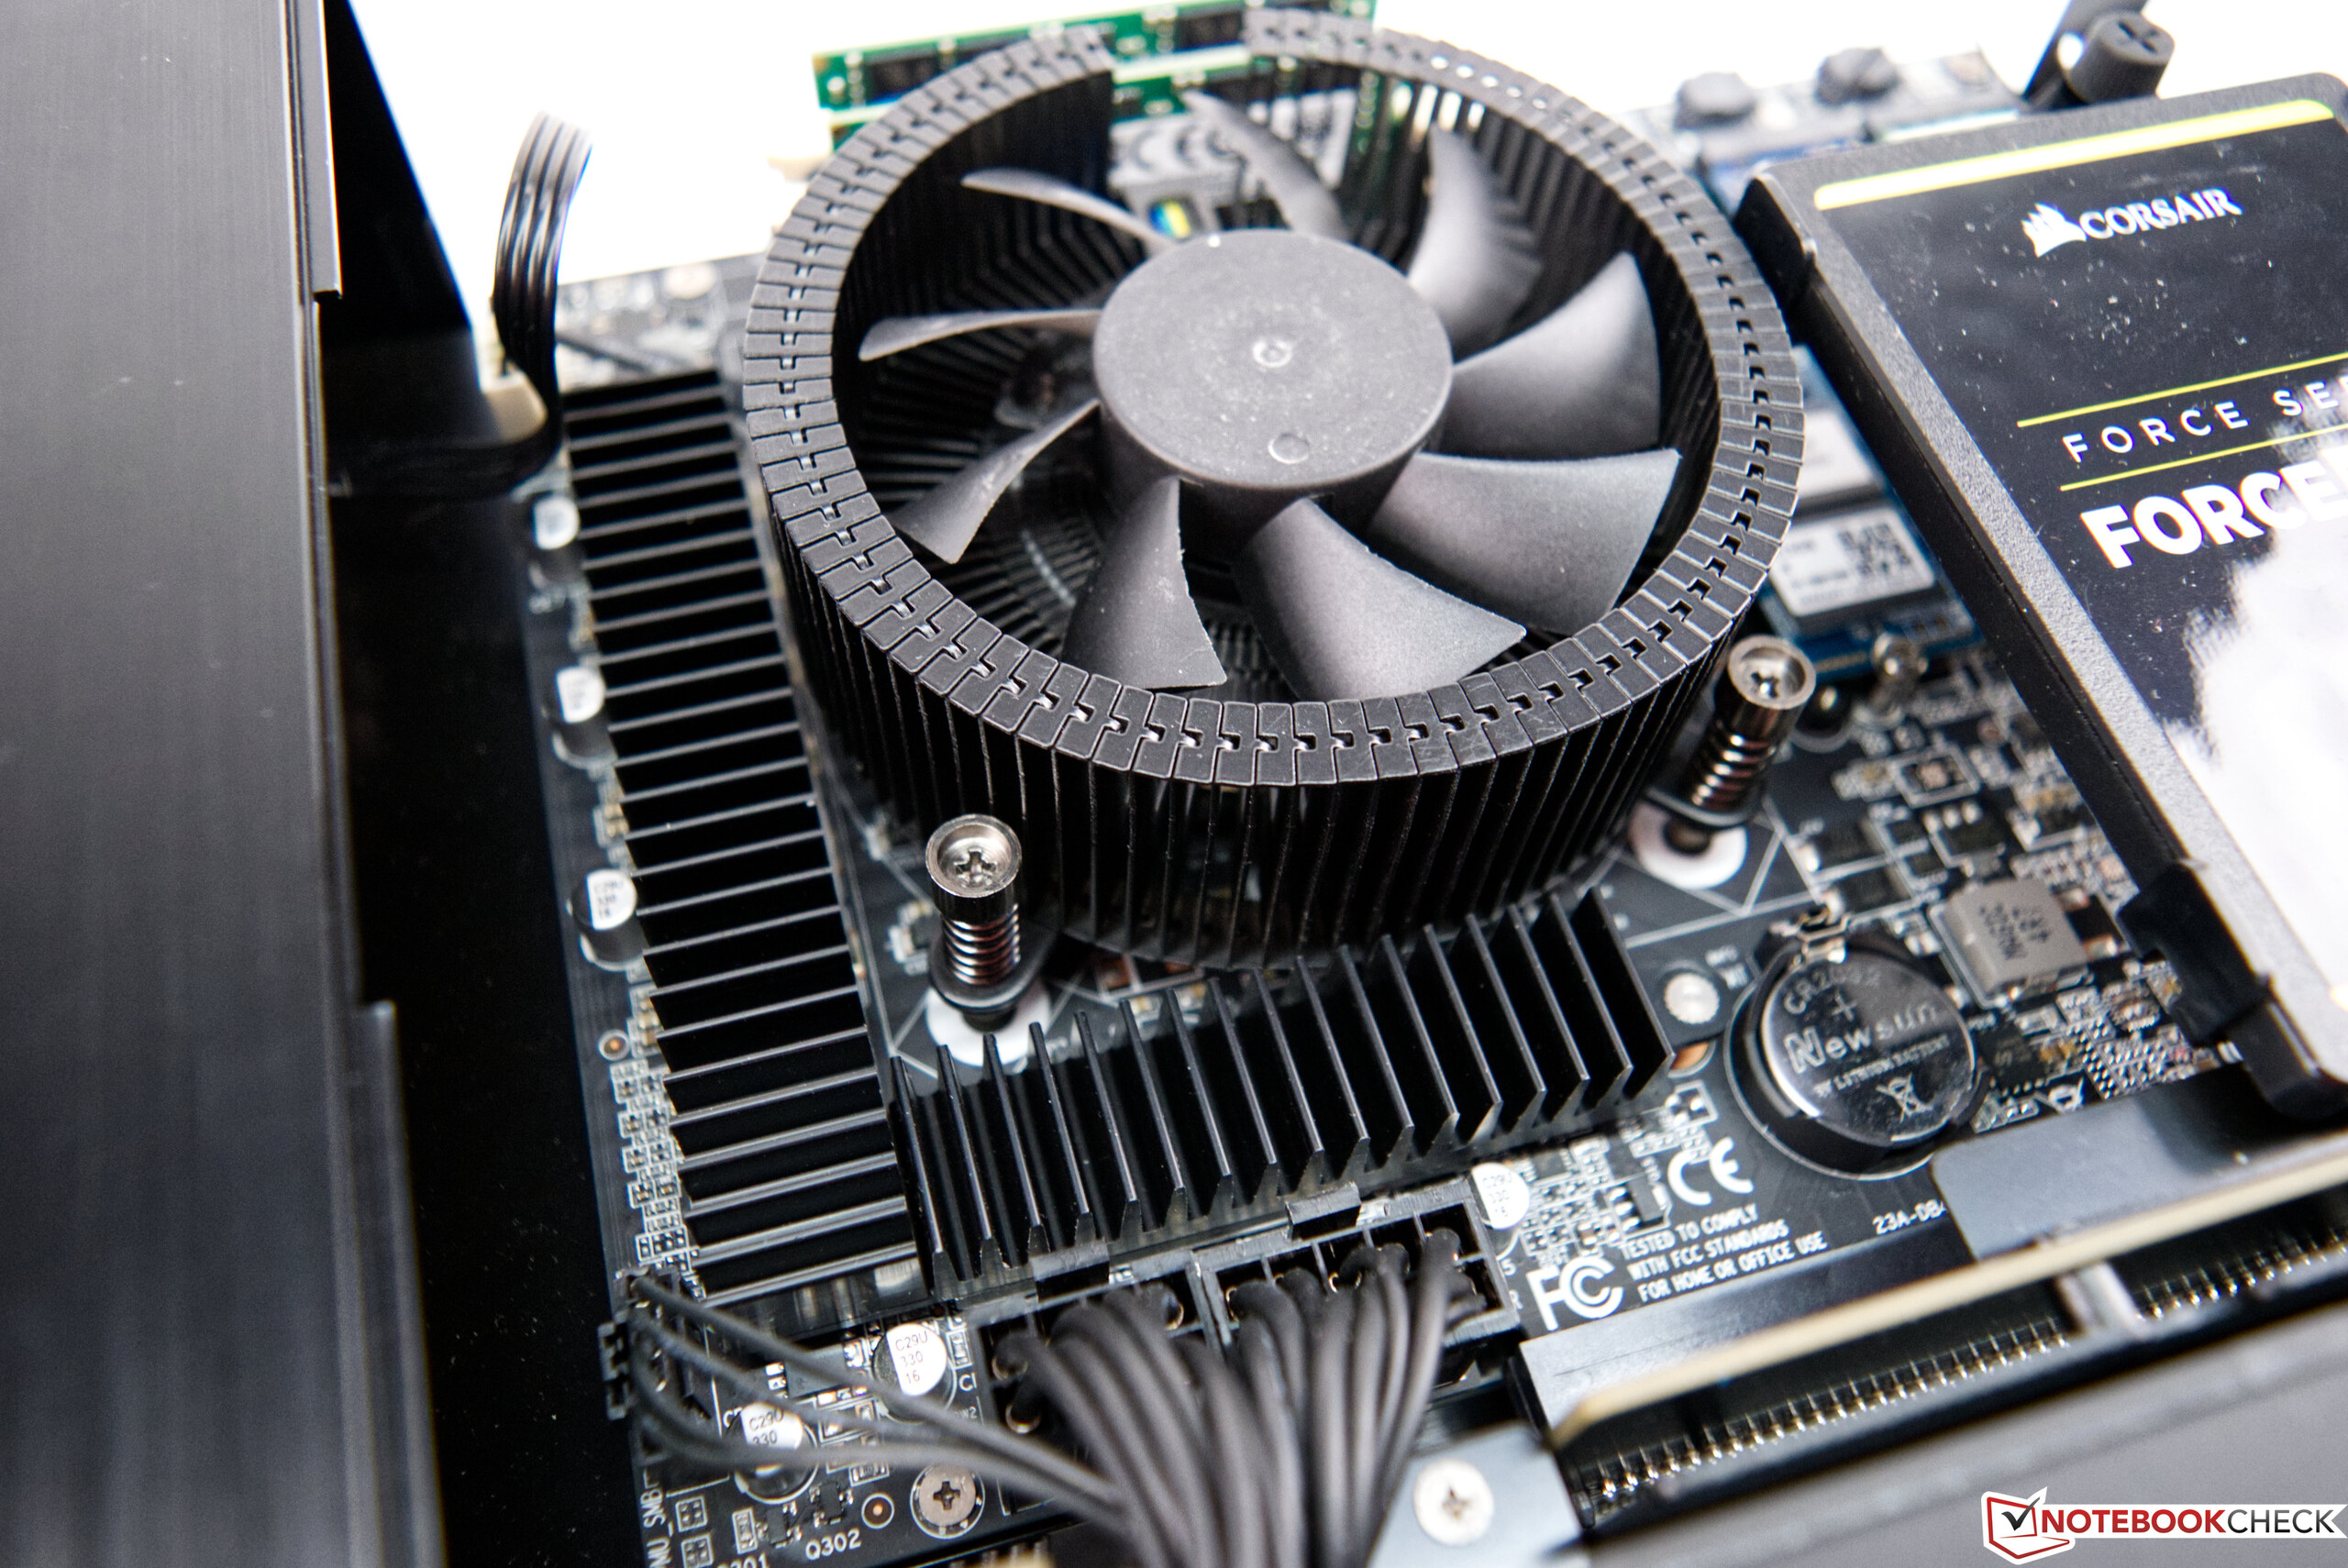
Kompakt bir tasarım, akıllı bir soğutma sistemi gerektirir. Zotac burada "chimney effect(baca etkisi)" adı verilen tasarımı kullanıyor ve ortaya çıkan atık ısıyı kasadan kuyuya ileten iki fan tepeye yerleştirilmiş. Yine de Intel Core i7-10700, stres testi sırasında maksimum 87 °C'ye (~187 °F) kadar ısındı. Ayrıca, stres testi sırasında GeForce RTX 3070'in sıcaklığı neredeyse 81 °C'ye (~178 °F) çıktı. Bunların hepsi hala kabul edilebilir sınırlar içinde ve endişeye gerek yok. Uzun oyun seansları sırasında bile, sıcaklıkların çok yüksek olduğunu gösteren belirgin performans düşüşleri olmadı.
Ancak bir masaüstü sistem için Magnus One, soğutma durumu nedeniyle yük altında net bir şekilde duyulabiliyor. Oyun oynarken 48,7 dB(A) ile oldukça yüksek olmasına rağmen, boşta kullanımda yalnızca 33,5 dB(A) ölçtük. Gürültü seviyesi stres testinde 44,2 dB(A) ile biraz daha düşüktü. Bu noktada, herhangi bir yüksek frekanslı fan gürültüsü veya bobin vızıltısı duymadığımızı olumlu olarak belirtmek isteriz.
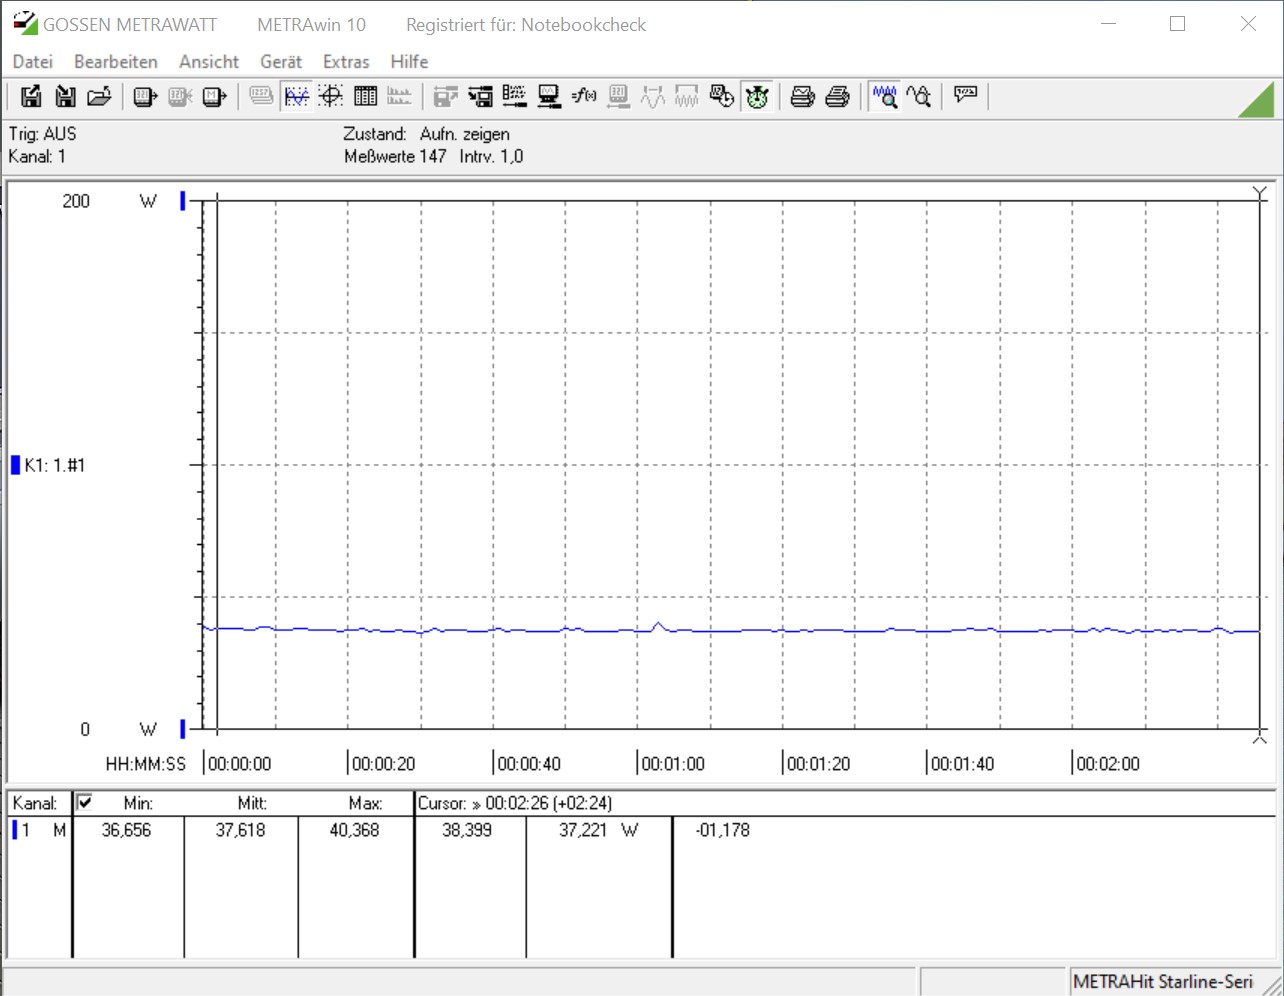
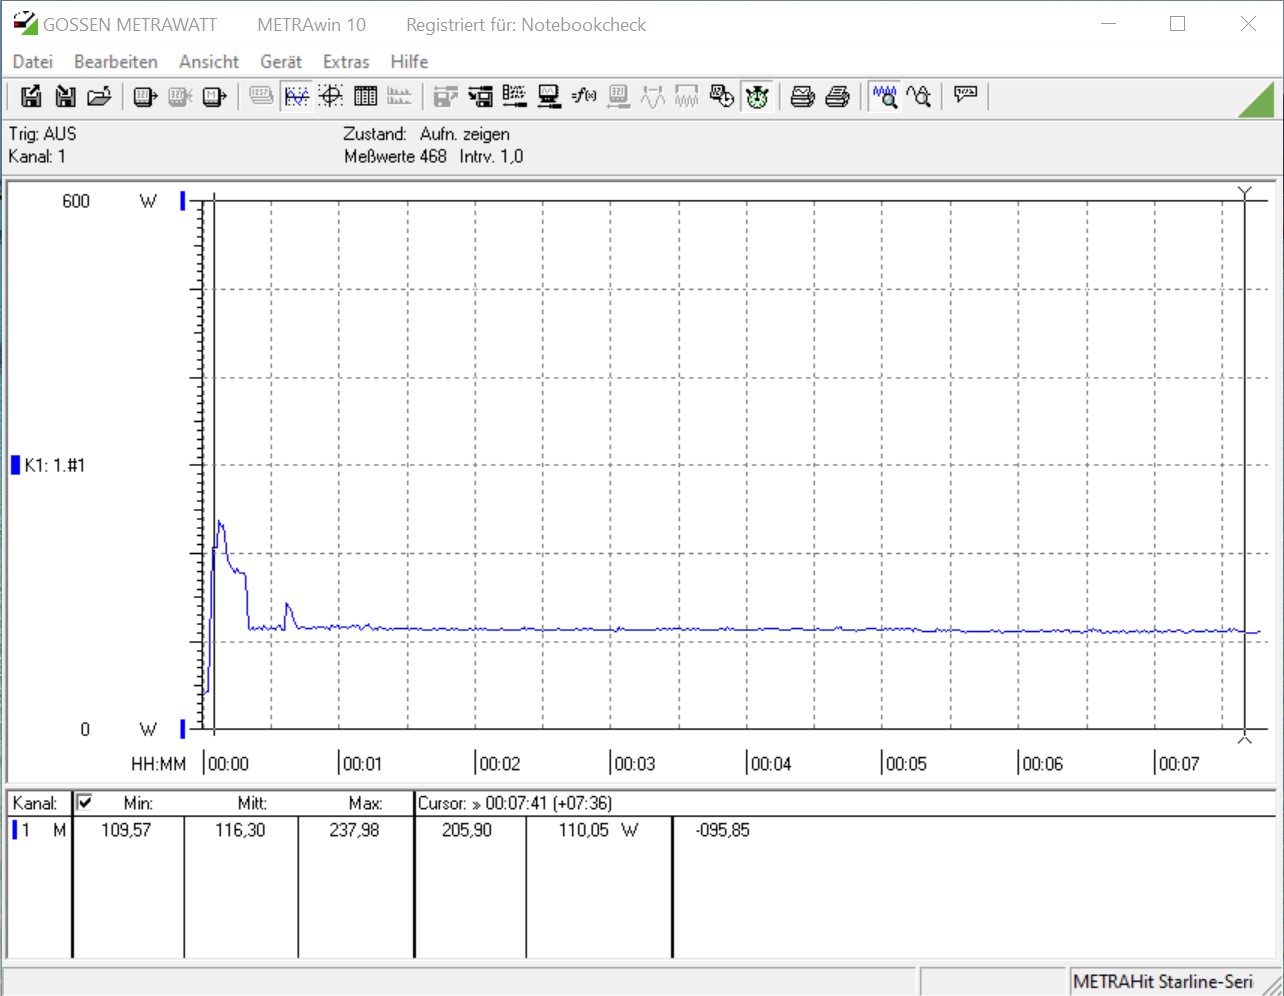
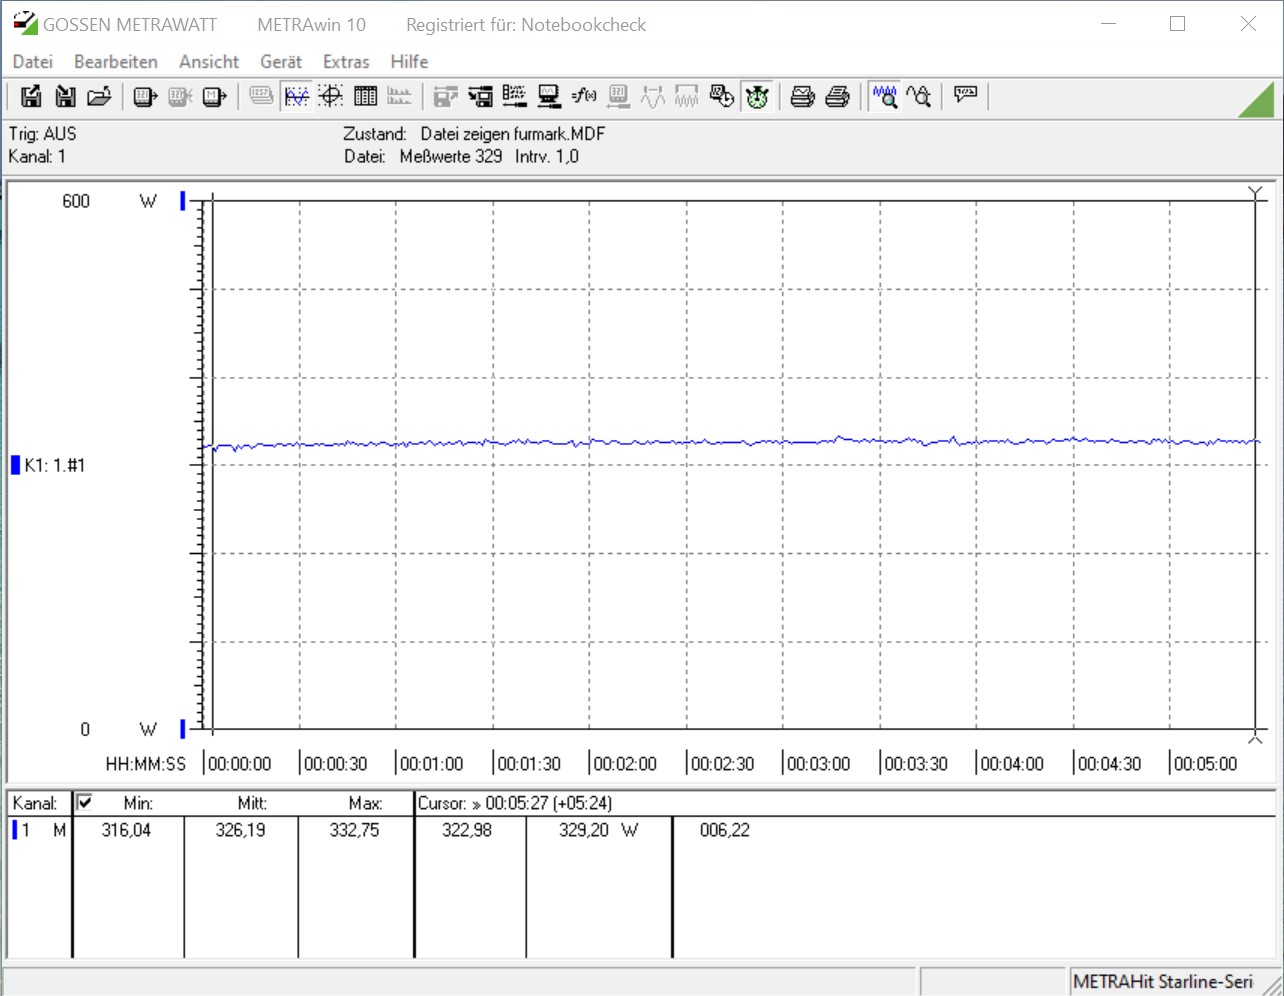
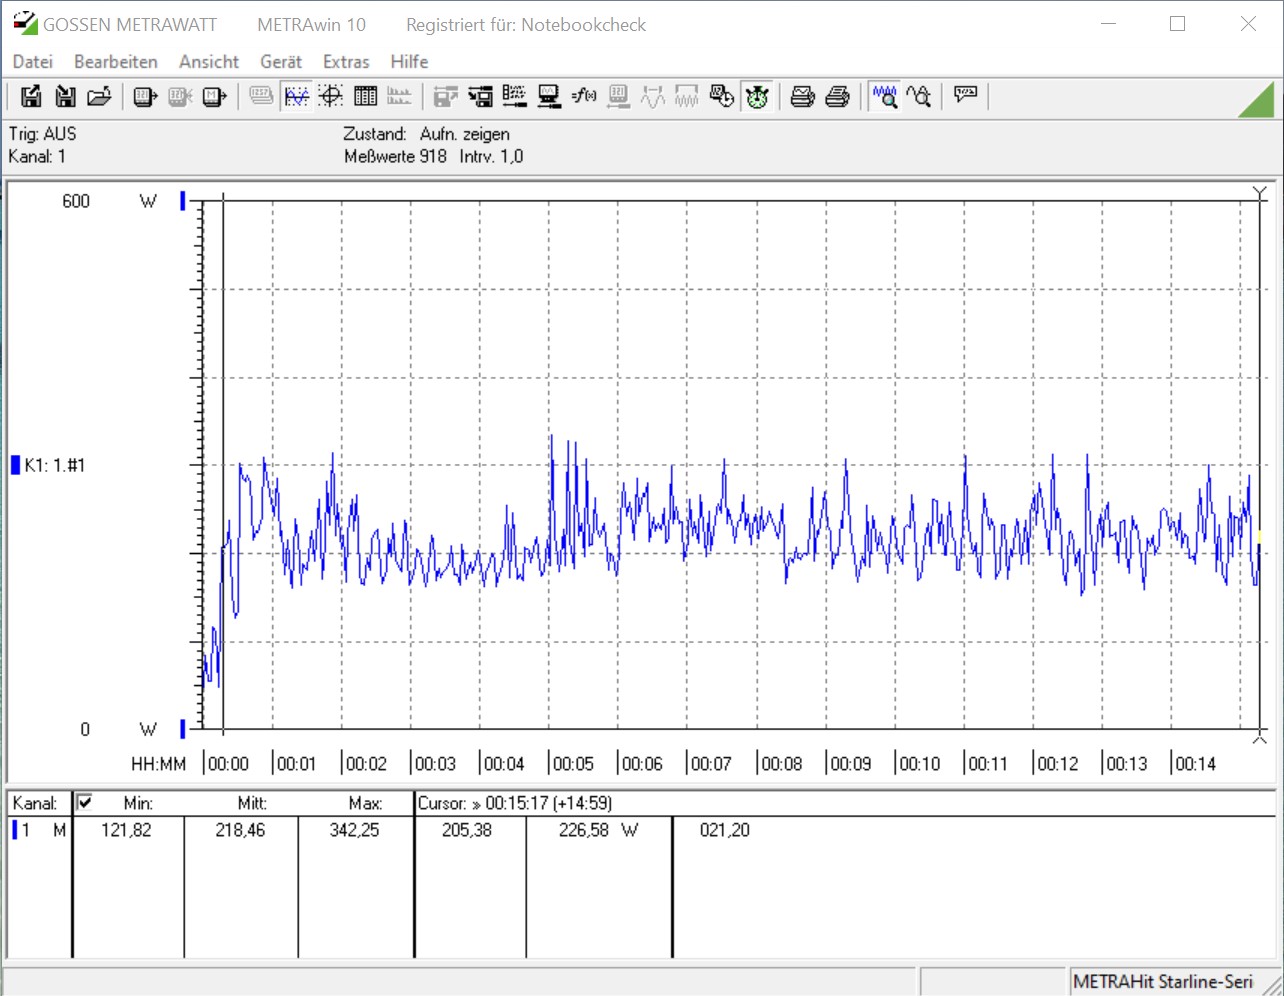
Bir yandan Magnus One güç tüketimi açısından ekonomiktir denebilir, ancak diğer yandan oyun söz konusu olduğunda da çok güç tüketiyor. Ölçüm cihazımız oyun testinde ortalama 550 watt gösterdi. Kurulu güç kaynağı 500 watt olarak belirtilmiştir. Bununla birlikte, test sırasında aşırı yüklenmeye işaret edecek herhangi bir çökme,hata olmadı.
| Power Consumption | |
| 1920x1080 The Witcher 3 ultra (external Monitor) | |
| Zotac Magnus One (ECM73070C) (Idle: 37.6 W) | |
| AMD Ryzen 7 5800X (Idle: 77.5 W) | |
| AMD Ryzen 5 5600X (Idle: 79.23 W) | |
| Intel Core i5-10600K (Idle: 52.2 W) | |
| Intel Core i7-9700K, AMD Radeon RX Vega 64 | |
| MSI GeForce RTX 3070 Ventus 3X (Idle: 91.46 W) | |
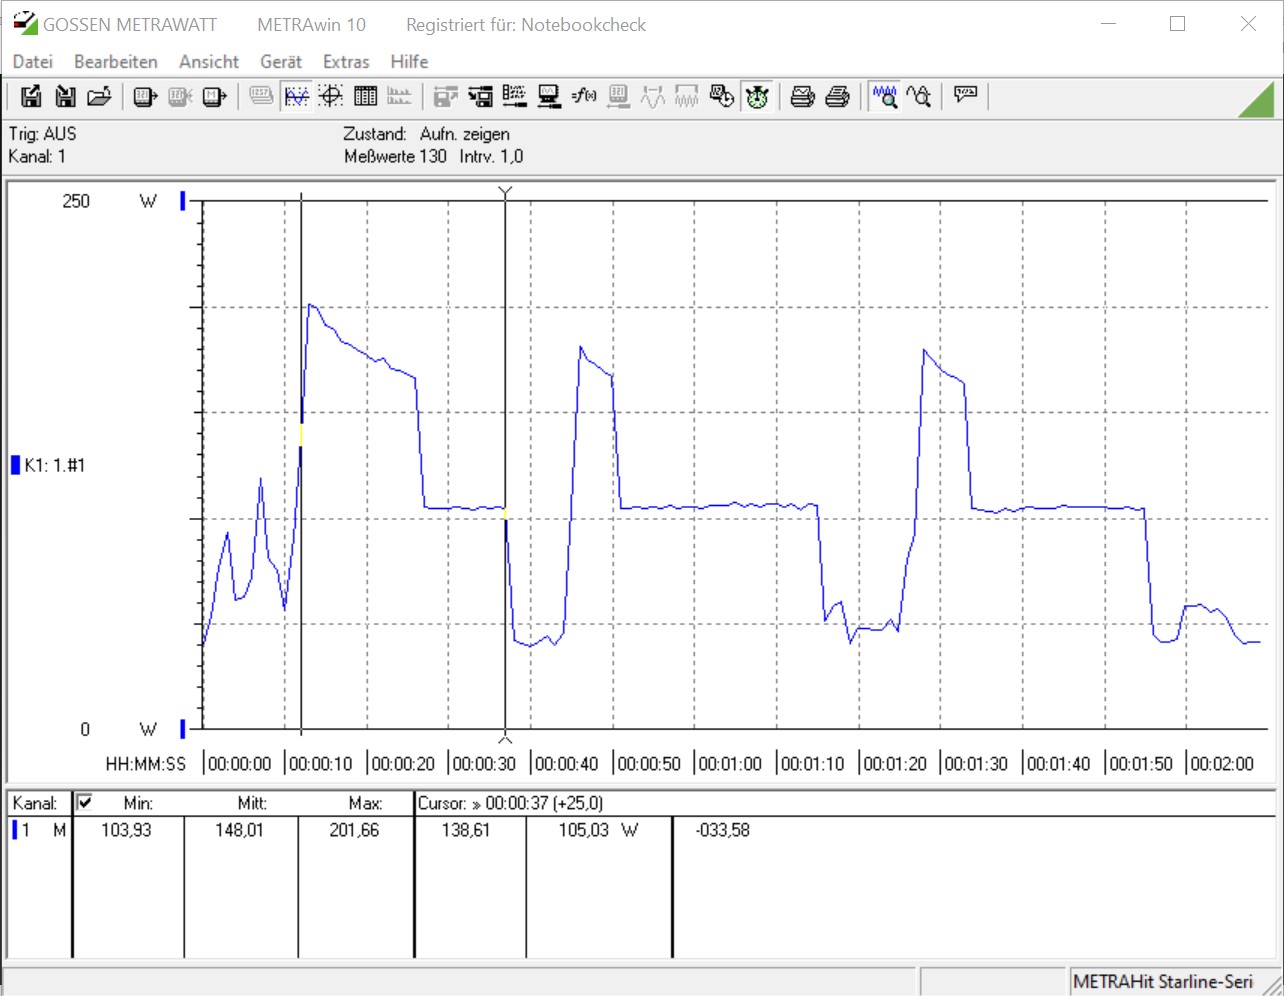
| Prime95 V2810 Stress (external Monitor) | |
| AMD Ryzen 7 5800X (Idle: 77.5 W) | |
| Intel Core i7-9700K, AMD Radeon RX Vega 64 | |
| Intel Core i5-10600K (Idle: 52.2 W) | |
| AMD Ryzen 5 5600X (Idle: 79.23 W) | |
| Zotac Magnus One (ECM73070C) (Idle: 37.6 W) | |
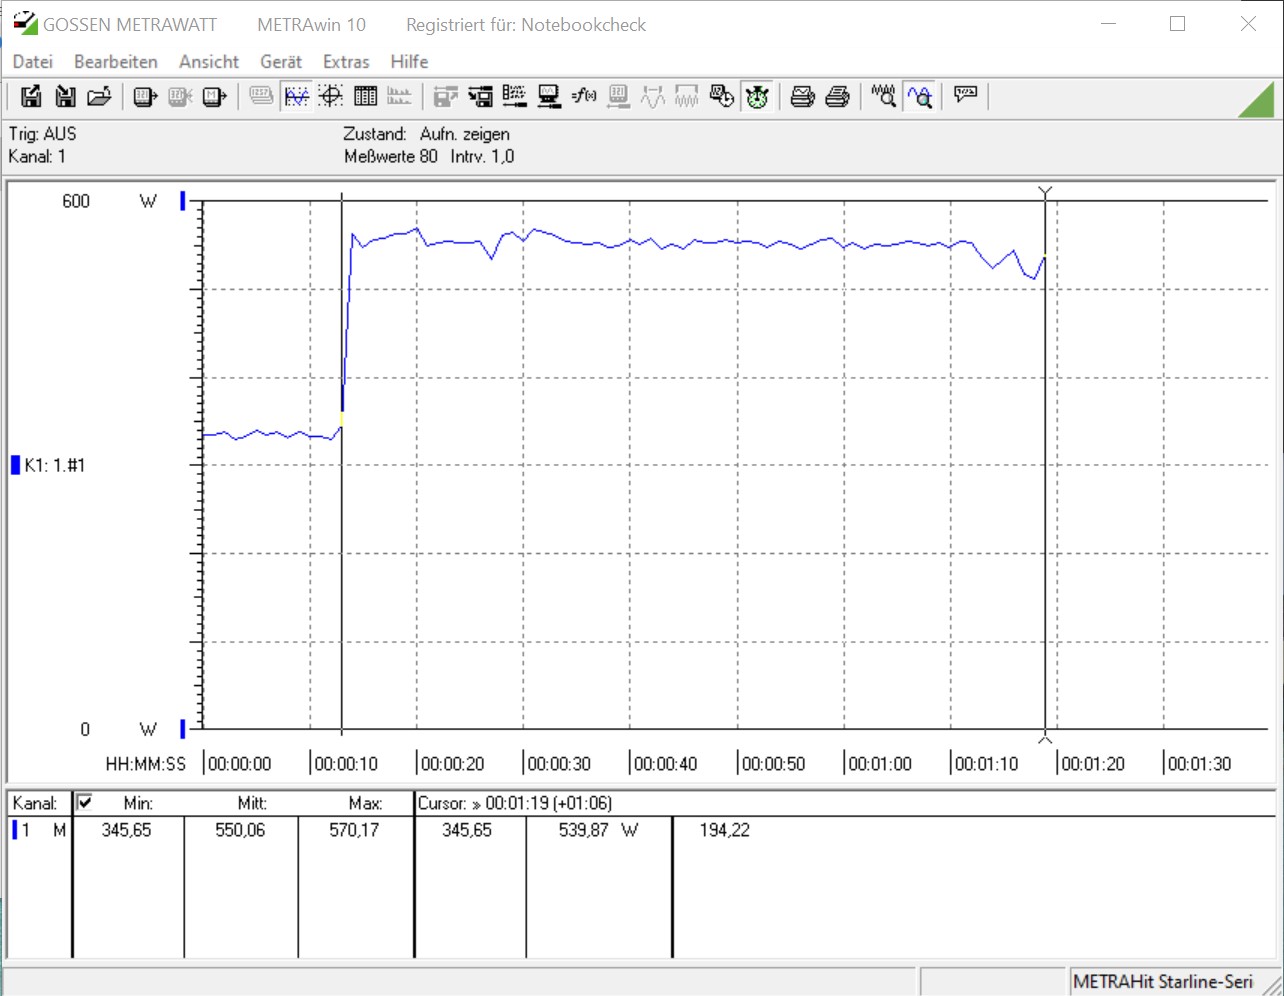
| Cinebench R15 Multi (external Monitor) | |
| AMD Ryzen 7 5800X (Idle: 77.5 W) | |
| Intel Core i7-9700K, AMD Radeon RX Vega 64 | |
| Intel Core i5-10600K (Idle: 52.2 W) | |
| AMD Ryzen 5 5600X (Idle: 79.23 W) | |
| Zotac Magnus One (ECM73070C) (Idle: 37.6 W) | |
| Temperatures - CPU Temperature Prime95 | |
| AMD Ryzen 7 5800X | |
| Intel Core i5-10600K | |
* ... daha küçük daha iyidir
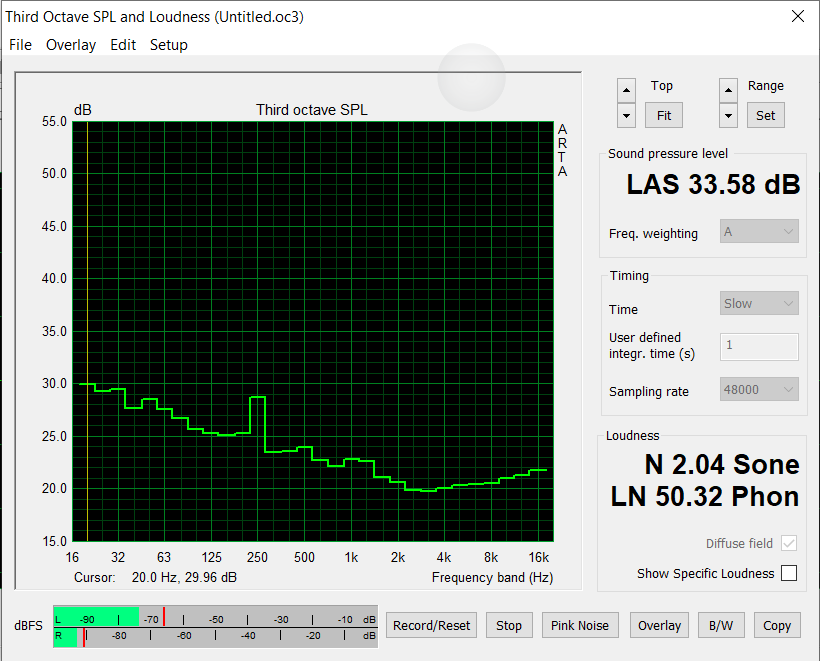
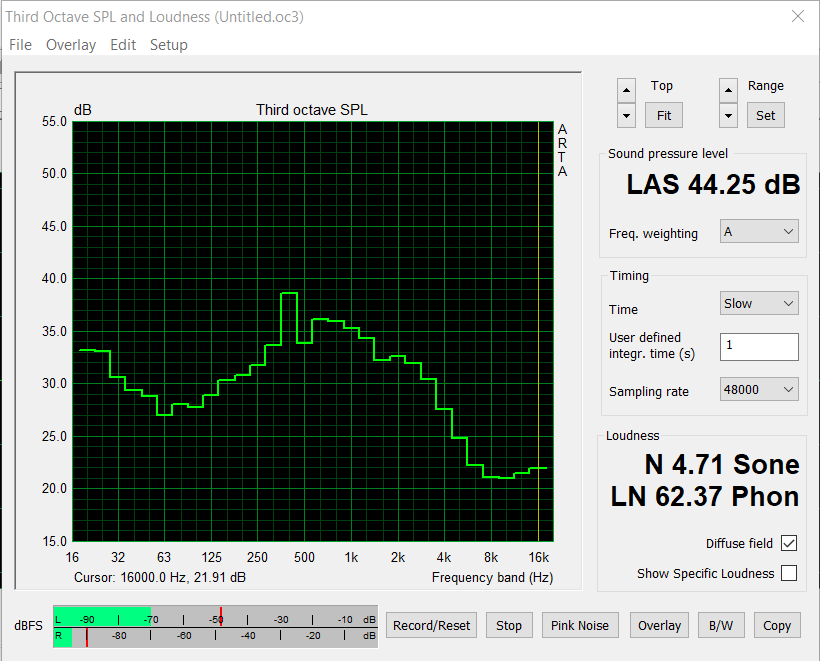
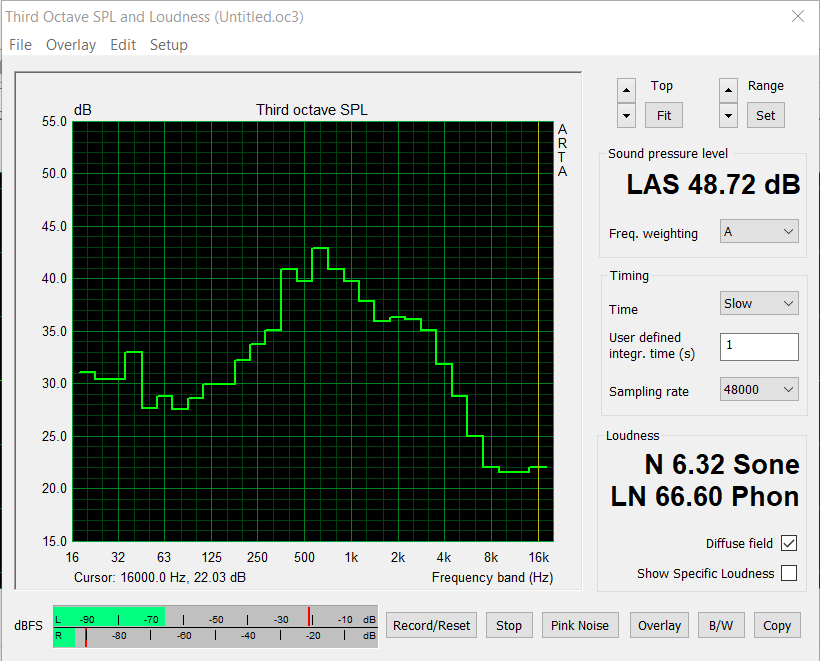
Ses yüksekliği
| Boşta |
| 33.58 / / dB |
| Çalışırken |
| 44.25 / 48.72 dB |
 | ||
30 dB sessiz 40 dB(A) duyulabilirlik 50 dB(A) gürültülü |
||
min: | ||
Artılar
Eksiler
Son görüş - İyi performans ve iyi bağlanılabilirlik
Zotac Magnus One, en küçük alanlarda çok yüksek performans sunan kompakt bir cihazdır. Bunun RAM, yığın depolama ve işletim sisteminin de 1.499 Euro'luk (~1.825 $) MSRP'nin parçası olmadığı bir barebone sistem olduğunu unutmayalım. Ancak, test sırasında gerçekçi pazar fiyatları 1.650 Euro'dan (~ 2,009 $) ve yukarısından başlıyor. Magnus One'ı iyi bir fiyata alabilen kullanıcılar, bir pazarlıkla bile alabilirler, çünkü GeForce RTX 3070 tek başına zaten 1.000 Euro'dan (~ 1.218 $) çok daha pahalı. Intel Core i7-10700, Core işlemcilerin en son sürümü değil, ancak bu günlük kullanımda bir sorun değil. Sonuç olarak, TDP açısından sınırlı olmayan küçük Core i7-10700, genel sisteme iyi uyuyor. Ancak Magnus One, özel CPU testlerine göre 3D ve oyun testlerimizde daha iyi puan alıyor. AMD, Ryzen 5000 serisi ile burada biraz daha iyi konumlandırılmış. Belki Zotac, AMD'ye dayalı bir sistem geliştirmeyi de düşünür.
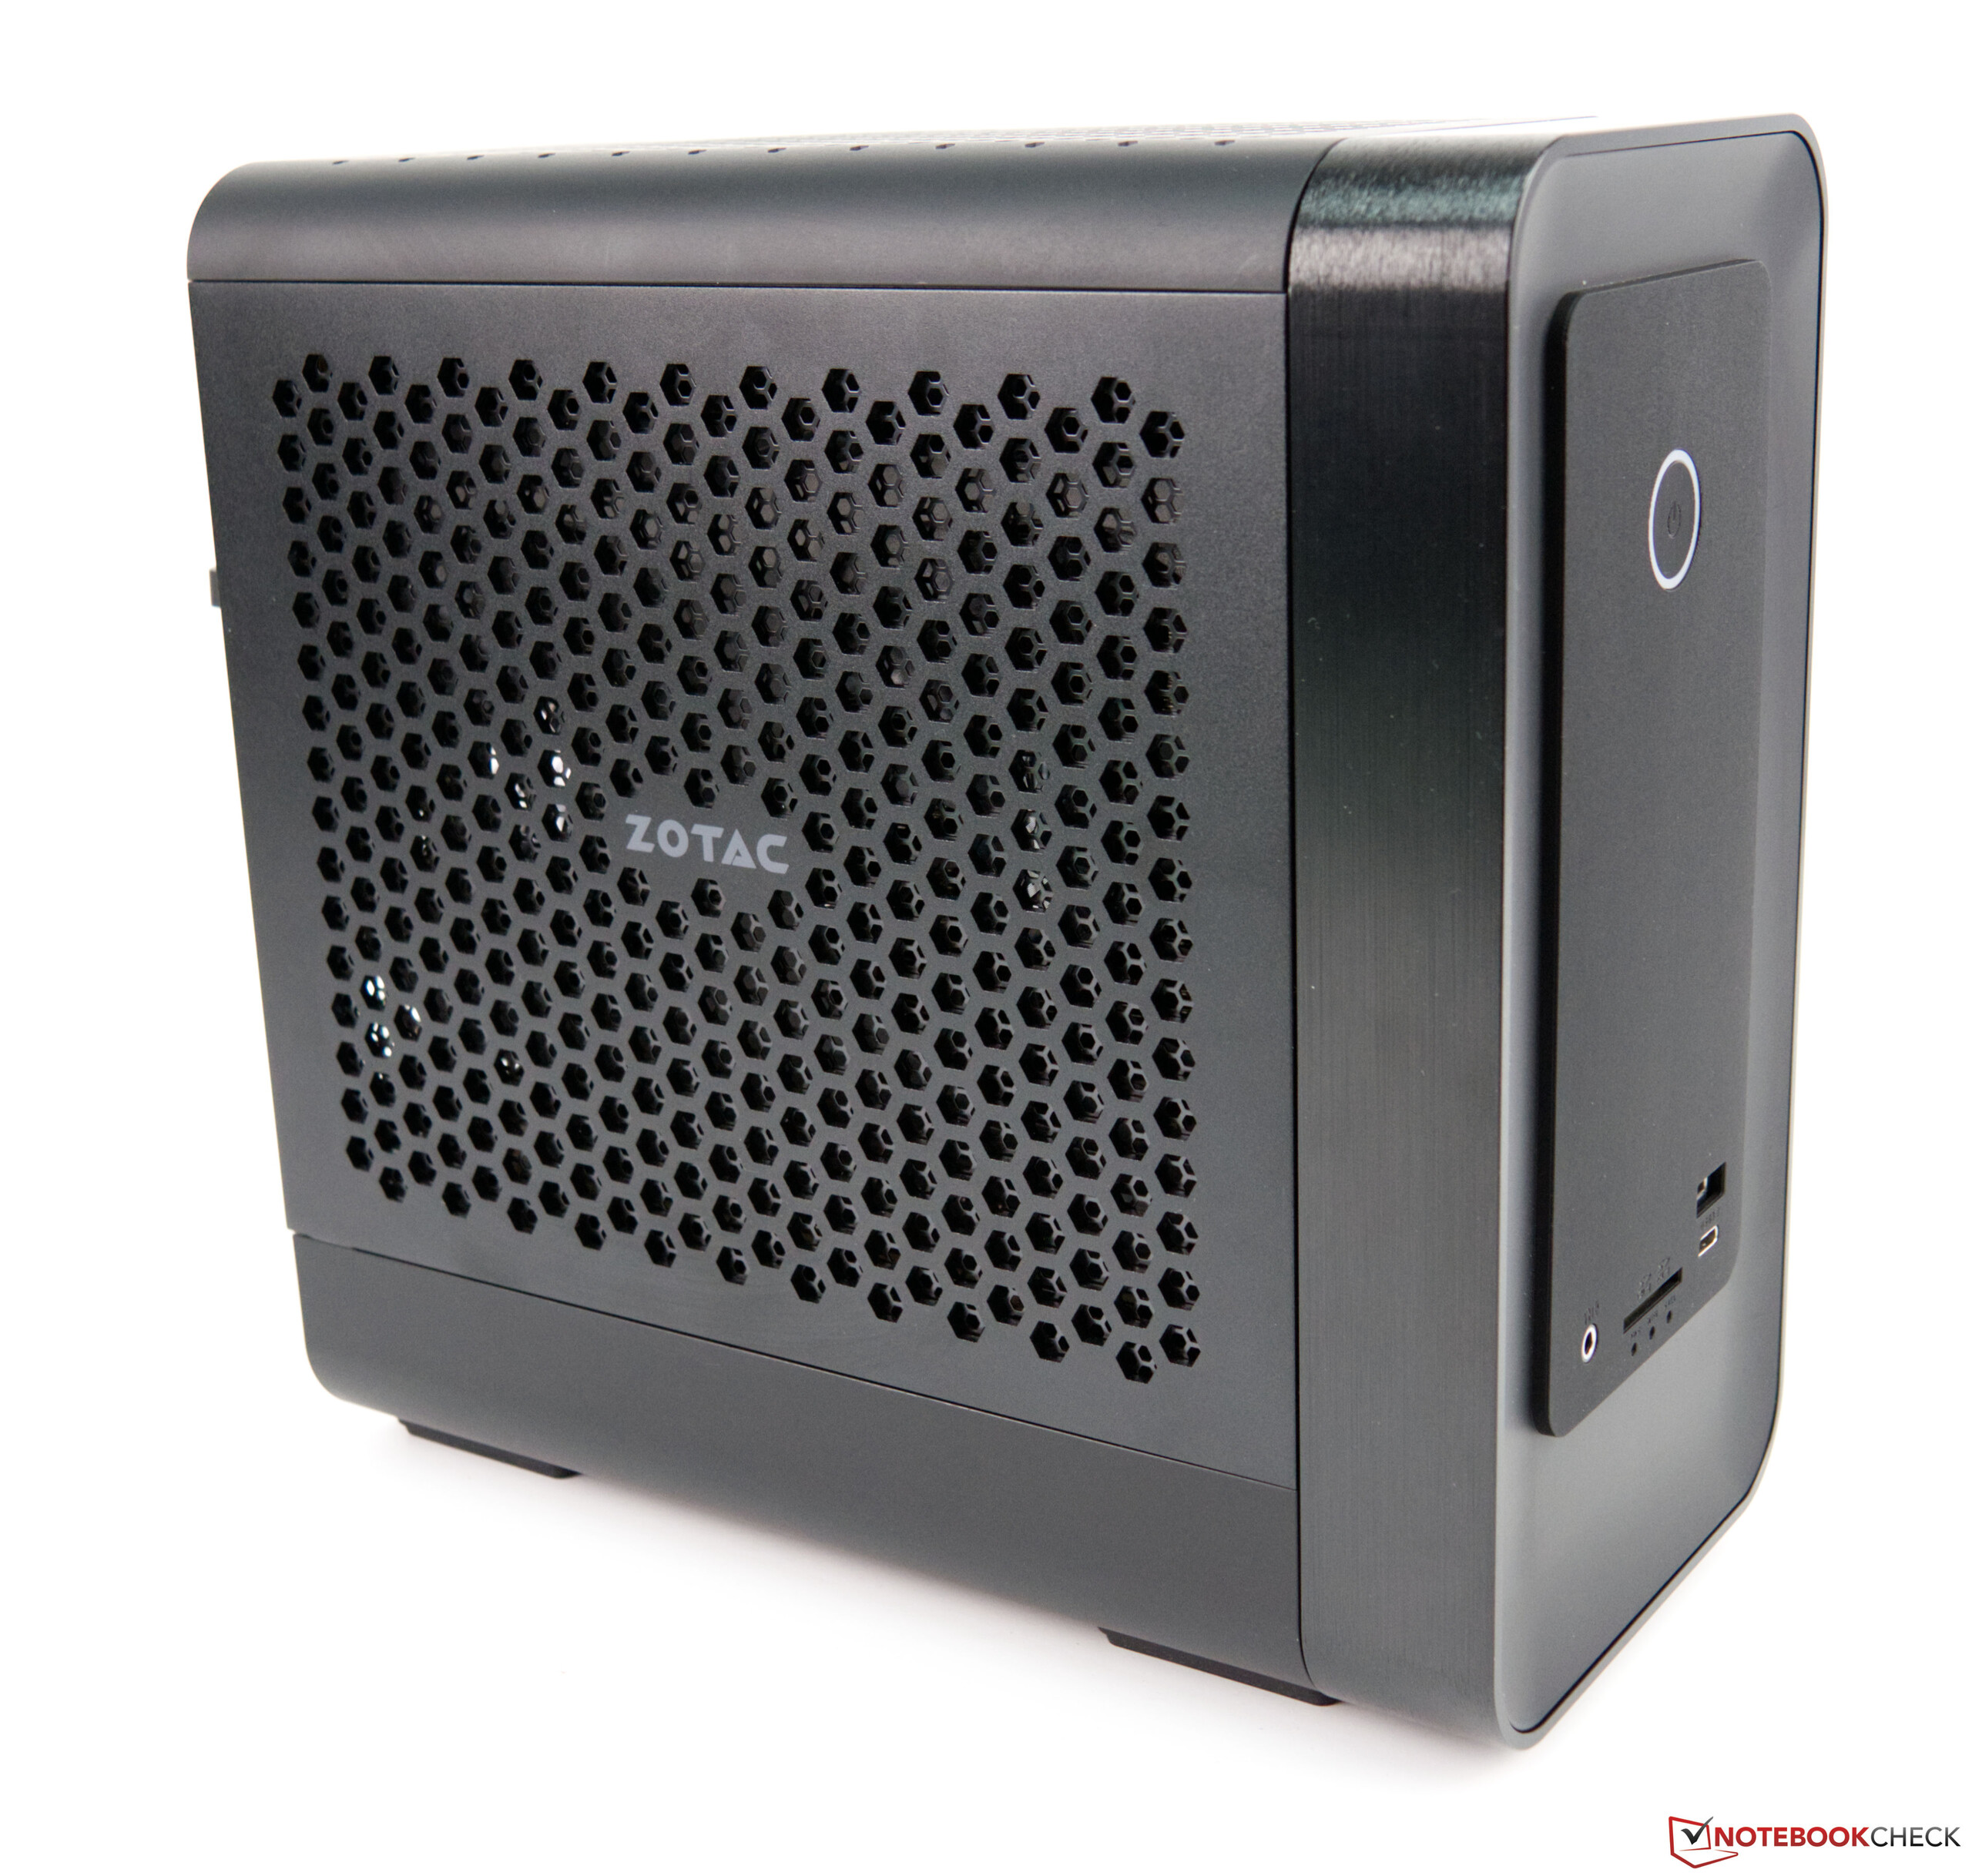
Magnus One, RGB olmadan bile göz alıcı olan, güçlü ve kompakt bir sistemdir.
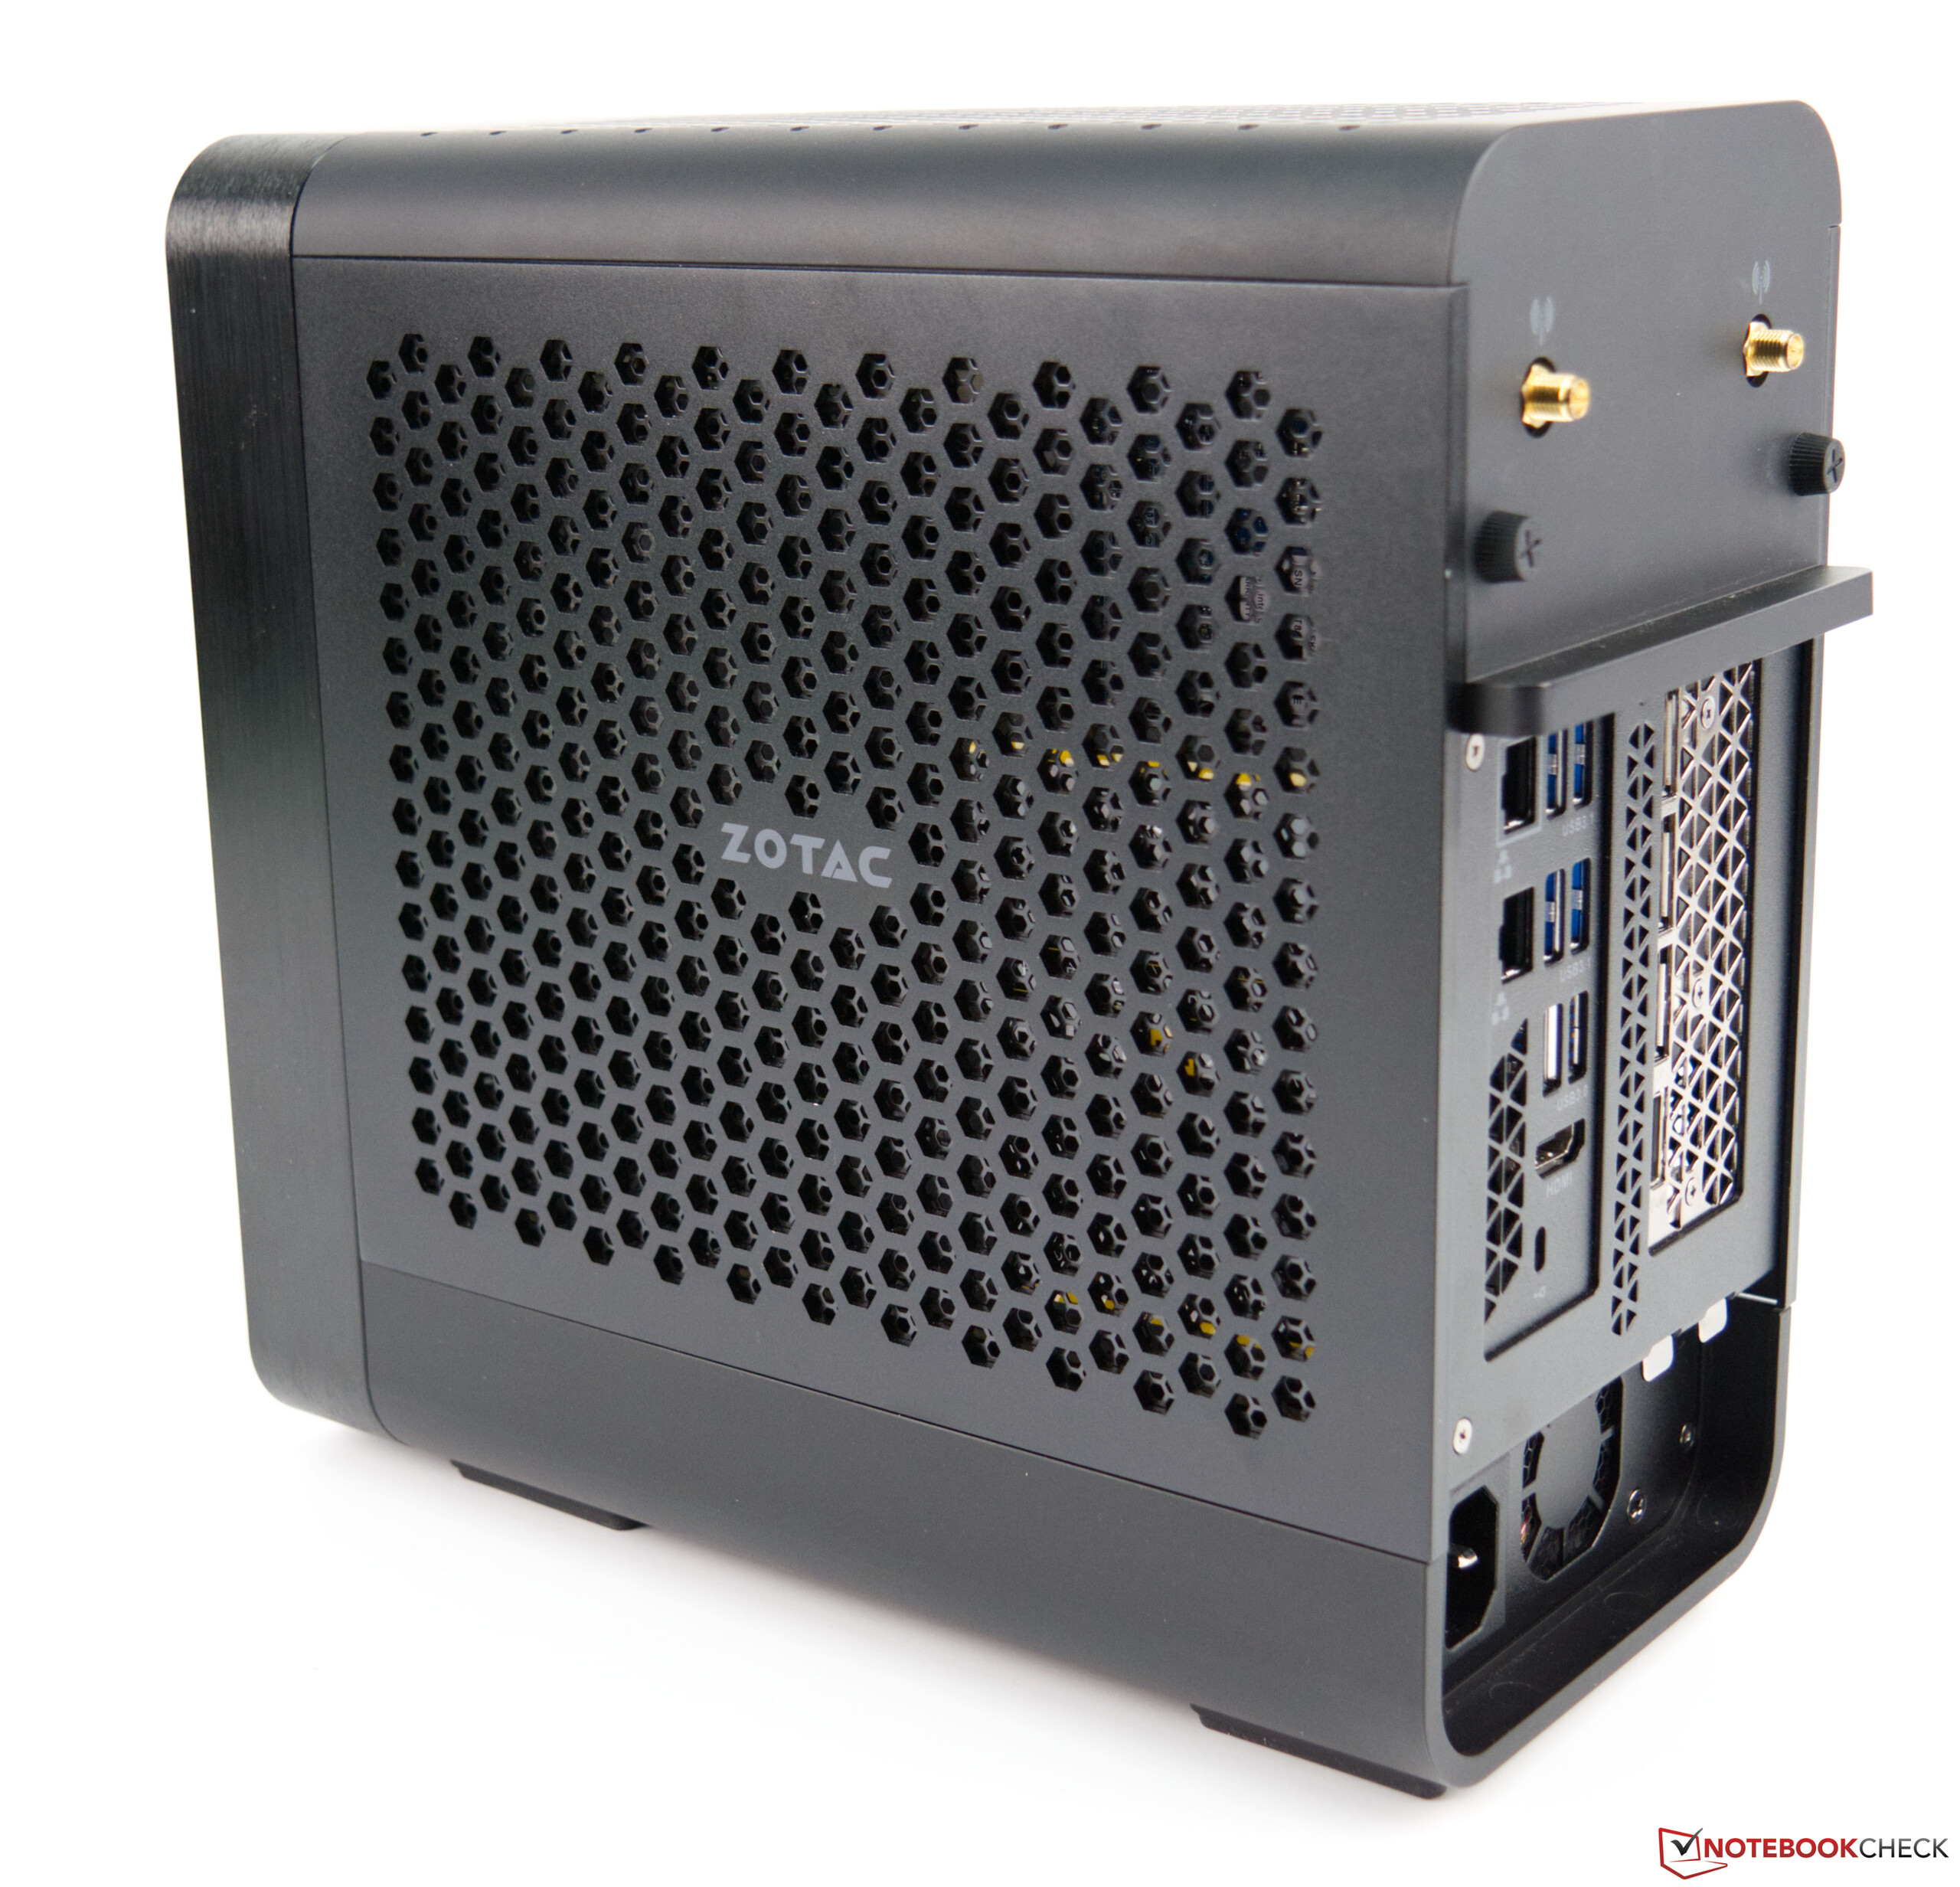
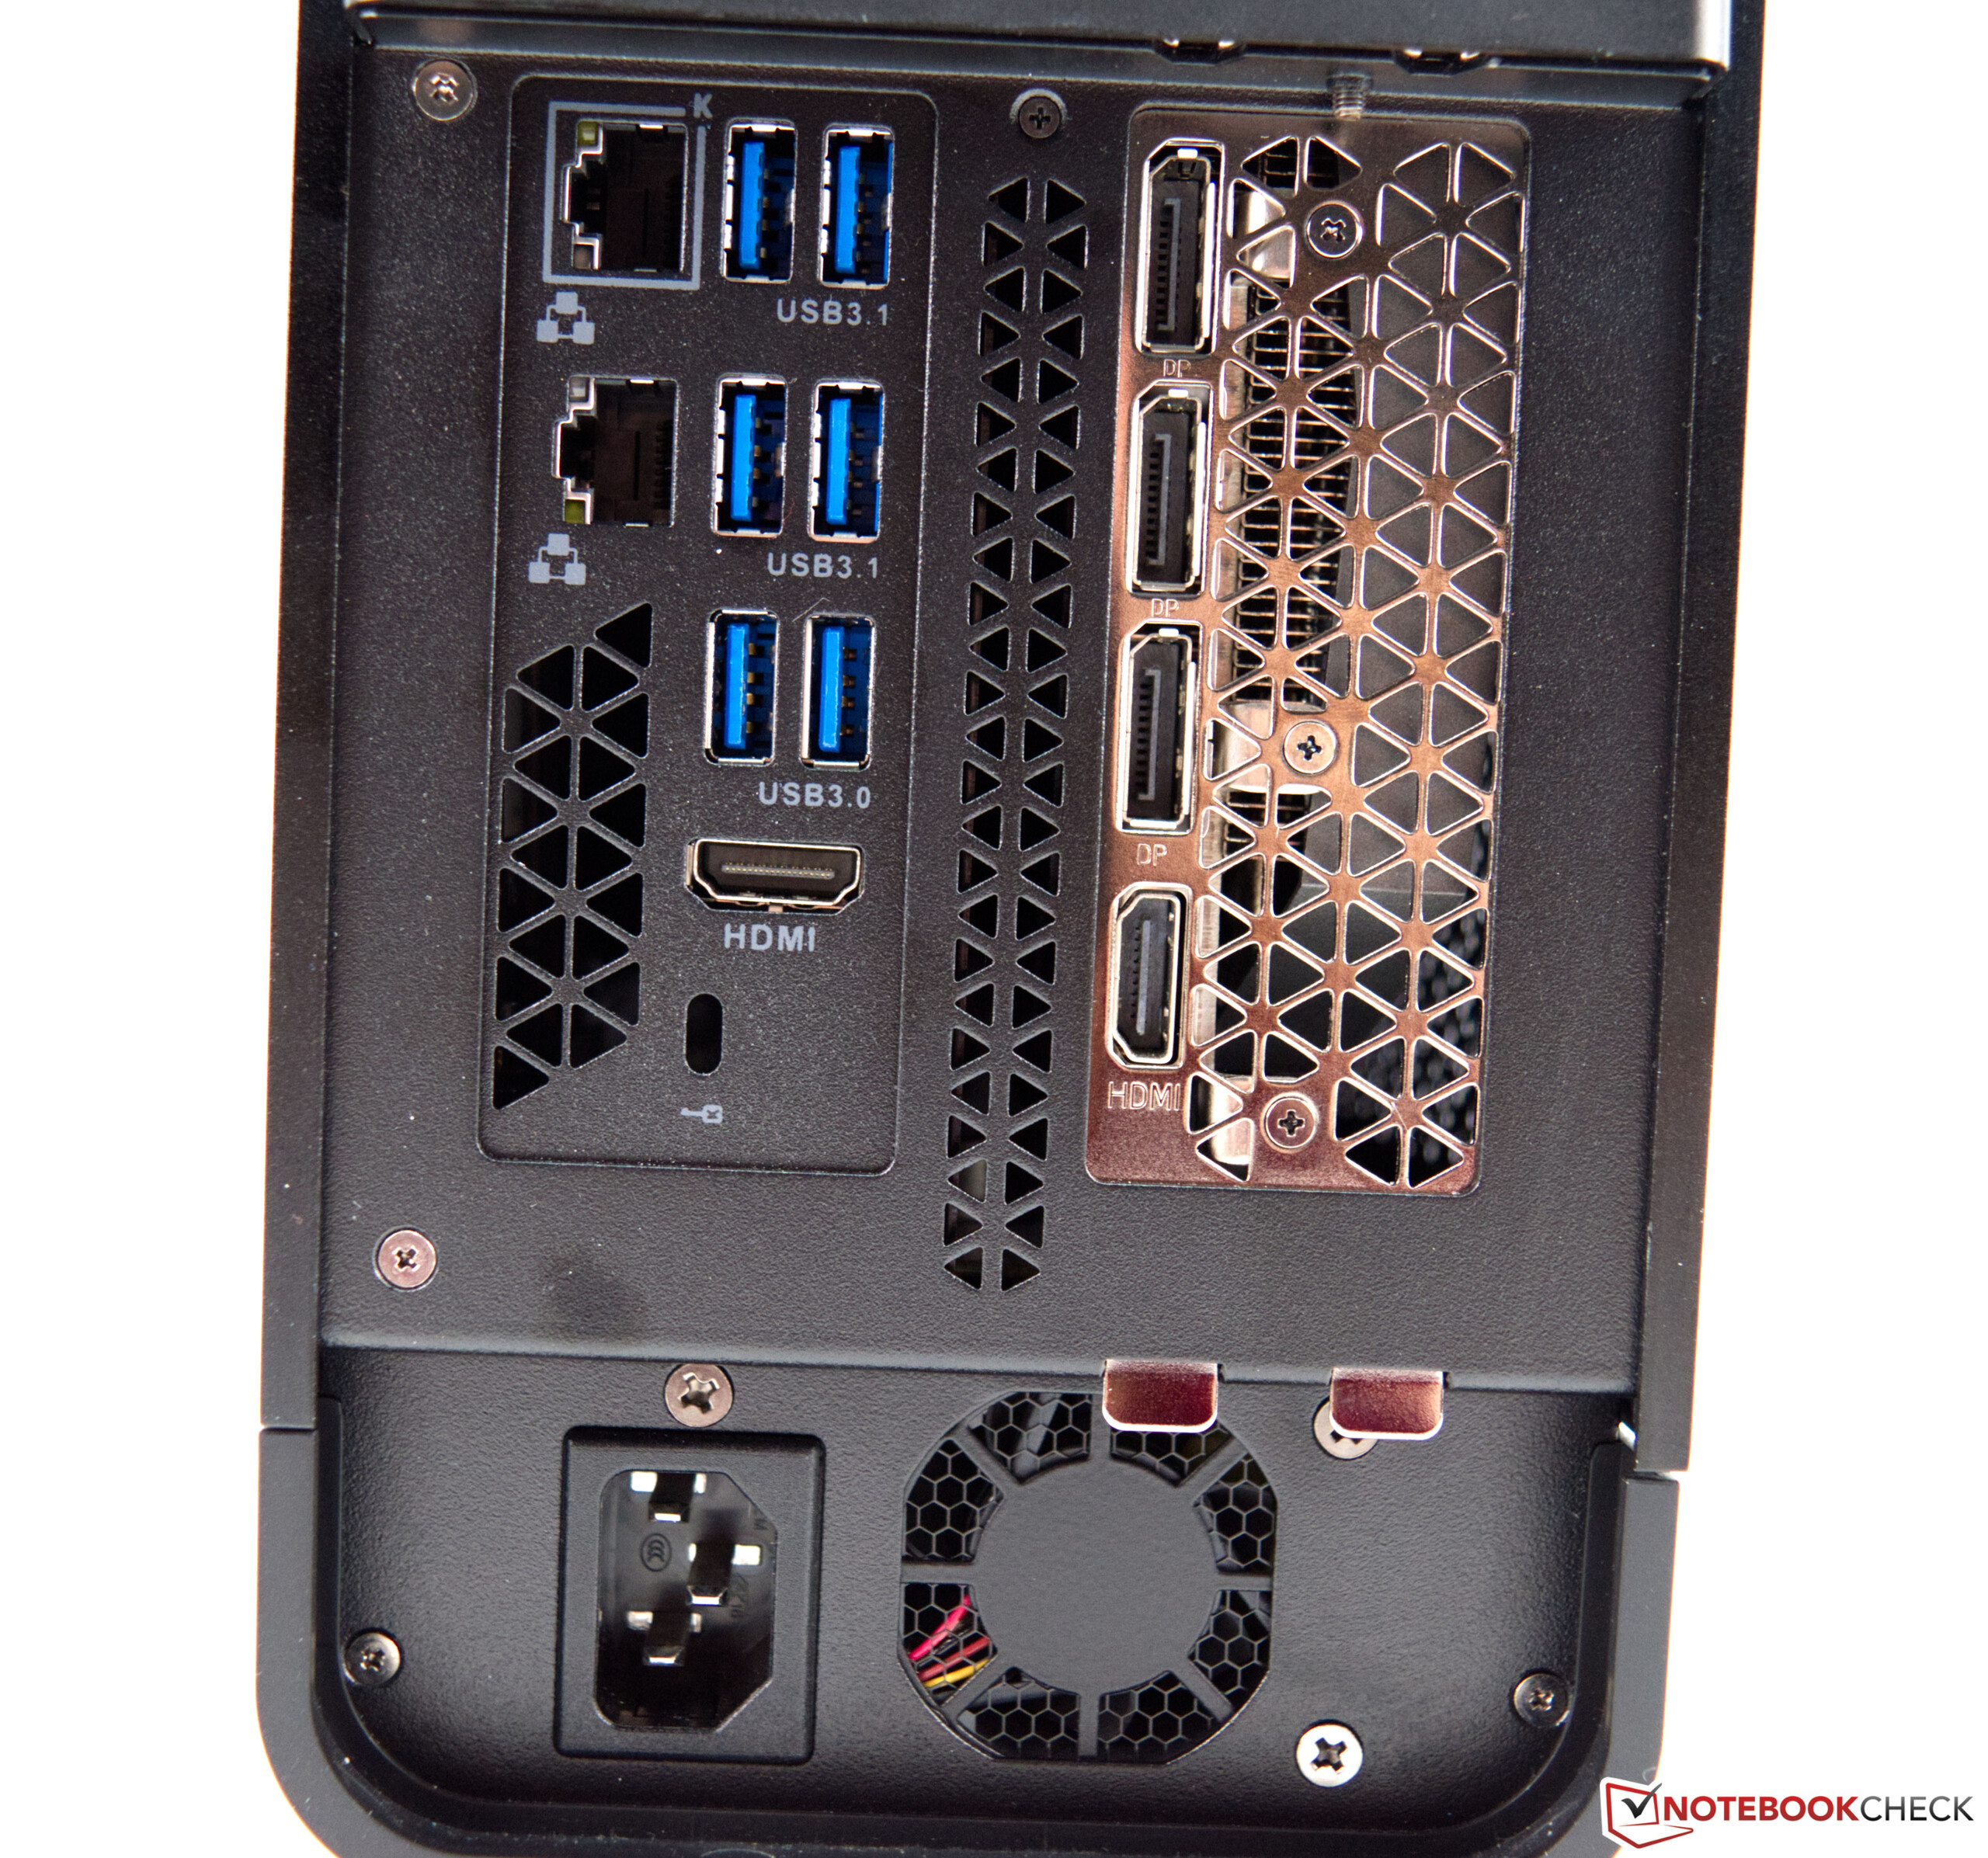
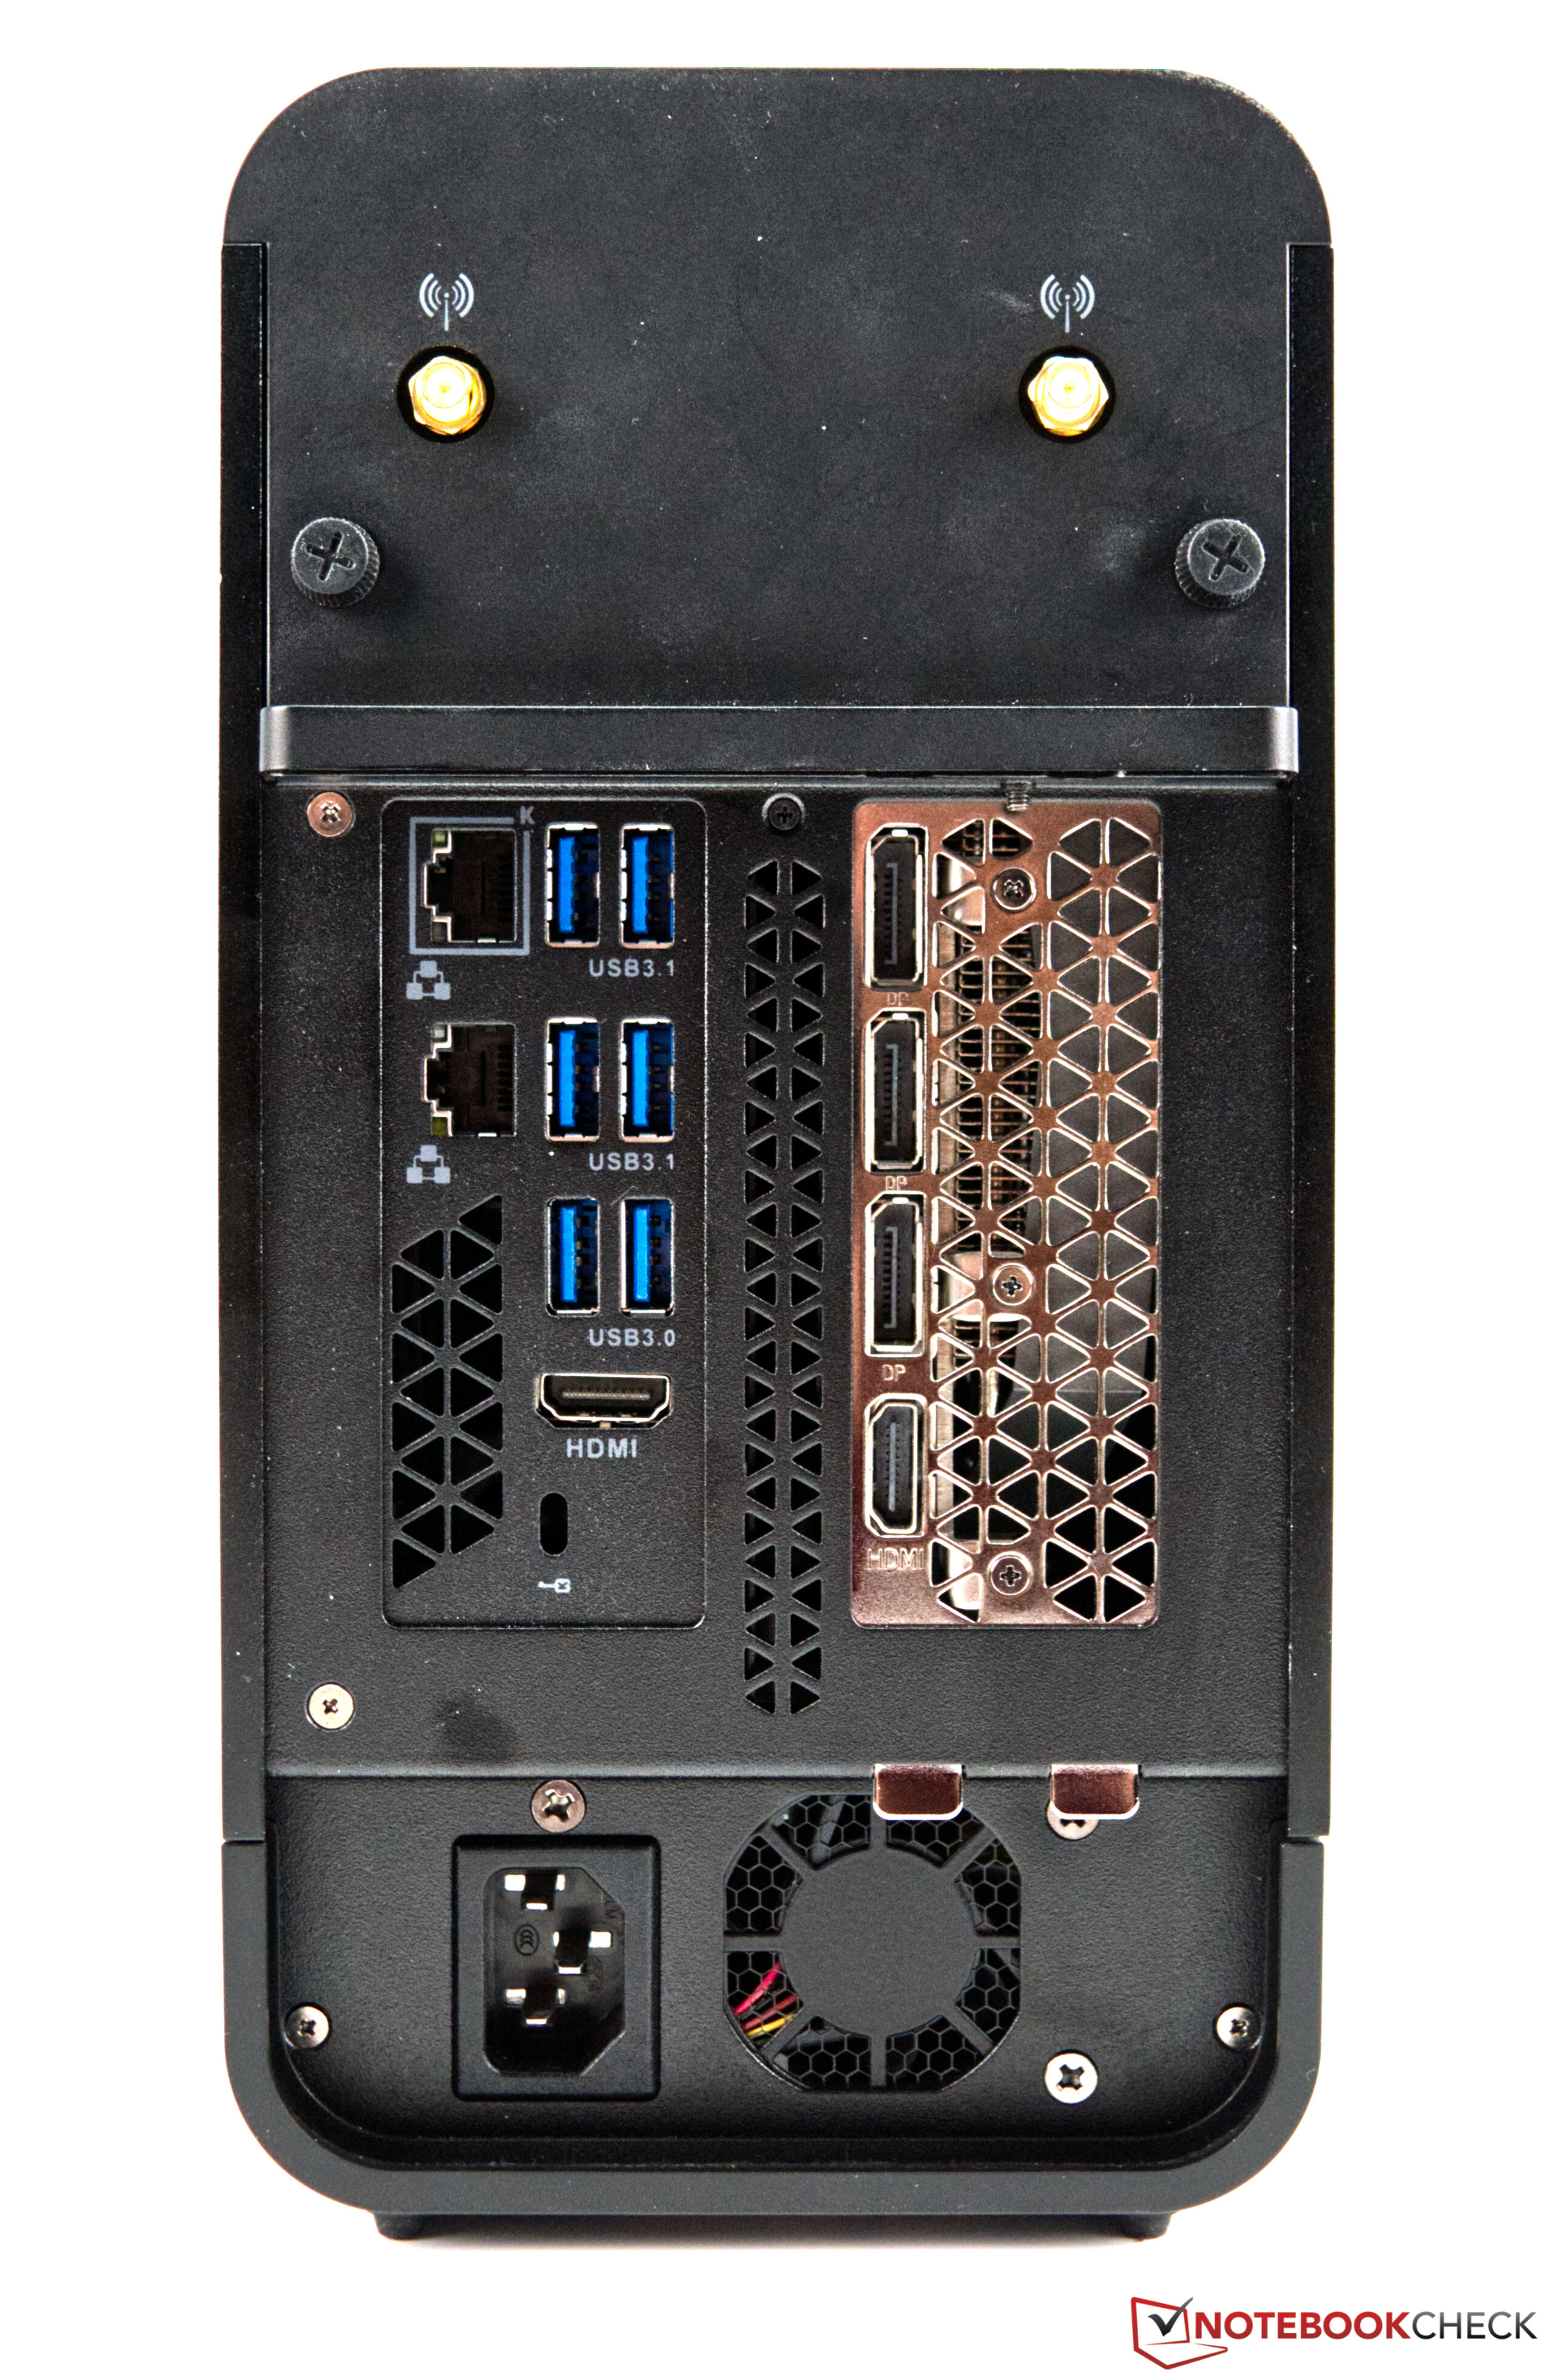
PC'nin kasası fazlalık görülebilecek gösterişler olmadan iyi görünüyor ve RGB özellikleri de tamamen terk edildi. Bu kesinlikle kötü bir şey değil, çünkü birçok kullanıcı düz, sade bir kasa arıyor ve Zotac bunu Magnus One ile yaratmayı başardı. Ayrıca kasanın çoğu metal olduğu için malzeme seçimi de oldukça iyi. Bağlantı noktası seçimi de çok yönlüdür ve arzulanıpta olmayan birşey yok. Yine de, yük altında biraz rahatsız edici soğutmayı eleştirmemiz gerekiyor.
Yine de, popüler üreticiler genellikle hazır sistemlere odaklandığından, Zotac Magnus One'a çok fazla alternatif yok. Ancak karşılaştırma için MSI MEG Trident X serisine göz atabilirsiniz. Çekici ve kompakt bir kasada benzer bir konfigürasyon sunuyor.

