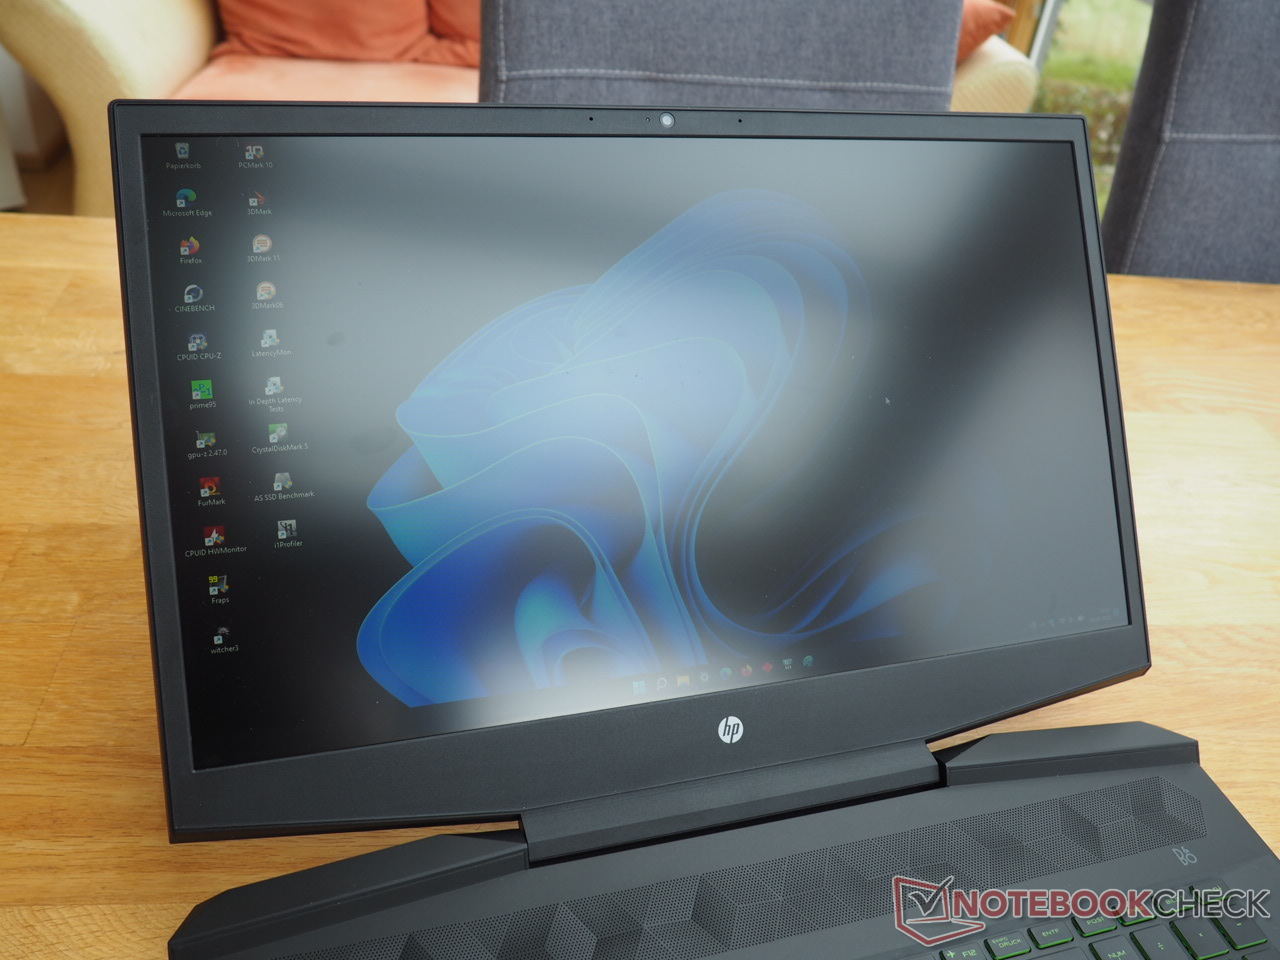
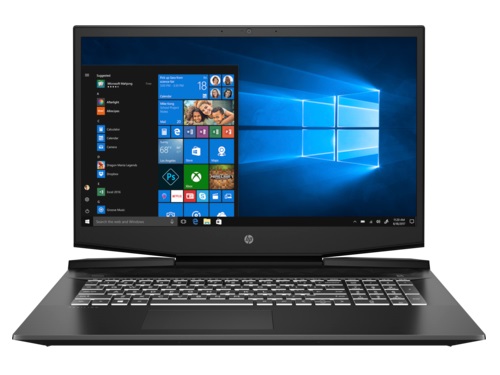
HP Pavilion Gaming 17 dizüstü bilgisayar incelemesi: Uygun fiyata iyi bir ekran
1.000 Euro'dan (~ 1,002 $) daha düşük bir fiyata bir oyun dizüstü bilgisayarı arayan kullanıcılar, Pavilion Gaming 17 ile karşılaşmış olabilir. İncelediğimiz cd2146ng modeli, iyi dengelenmiş orta sınıf bileşenlerle, yani Core i5-11300H ve bir GeForce RTX 3050 Ti 4 GB VRAM dahil. 16 GB DDR4 RAM (çift kanalda 2x 8 GB) ve 512 GB NVMe SSD de bu fiyat aralığında uygun. Ekran tatmin edici olmaktan da öte: Mat Full HD IPS ekran 144 Hz'i destekliyor ve HP'ye göre yaklaşık 300 nite ulaşması bekleniyor. Bu iddianın doğru olup olmadığını birazdan analiz edeceğiz. Bu arada, inceleme modelimizin "gerçek" bir işletim sisteminden yoksun olması biraz utanç verici (sadece FreeDOS gemide). Ancak, daha sonra yüklediğimiz 11 Pro sürümü gibi uyumlu Windows lisansları çevrimiçi olarak çok ucuza satın alınabilir.
Pavilion Gaming 17'nin ana rakipleri arasında, Dell G15 5510, the Lenovo IdeaPad Gaming 3 15IHU, ve şirket içi HP Victus 16. gibi GeForce RTX 3050 Ti ile donatılmış diğer 15 inç ila 17 inç arası bütçeye uygun dizüstü bilgisayarlar yer alıyor . İkinci dizüstü bilgisayarların her biri, tablolarda karşılaştırma cihazları olarak görünür.
Possible contenders in comparison
Derecelendirme | Tarih | Modeli | Ağırlık | Yükseklik | Boyut | Çözünürlük | Fiyat |
|---|---|---|---|---|---|---|---|
| 82.7 % v7 (old) | 10/2022 | HP Pavilion Gaming 17-cd2146ng i5-11300H, GeForce RTX 3050 Ti Laptop GPU | 2.8 kg | 25 mm | 17.30" | 1920x1080 | |
| 79.1 % v7 (old) | Dell G15 5510-43NHT i5-10200H, GeForce RTX 3050 Ti Laptop GPU | 2.5 kg | 23.33 mm | 15.60" | 1920x1080 | ||
| 79.7 % v7 (old) | 06/2022 | Lenovo Ideapad Gaming 3 15IHU-82K1002RGE i5-11300H, GeForce RTX 3050 Ti Laptop GPU | 2 kg | 24.2 mm | 15.60" | 1920x1080 | |
| 82.3 % v7 (old) | 09/2023 | HP Victus 16-e0145ng R5 5600H, GeForce RTX 3050 Ti Laptop GPU | 2.4 kg | 23.5 mm | 16.10" | 1920x1080 | |
| 81.6 % v7 (old) | HP Pavilion Gaming 17-cd0085cl i7-9750H, GeForce GTX 1660 Ti Max-Q | 2.8 kg | 25 mm | 17.30" | 1920x1080 |
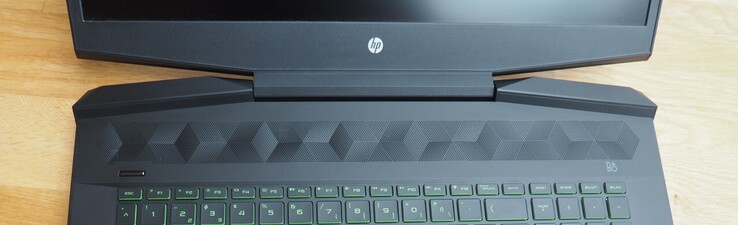
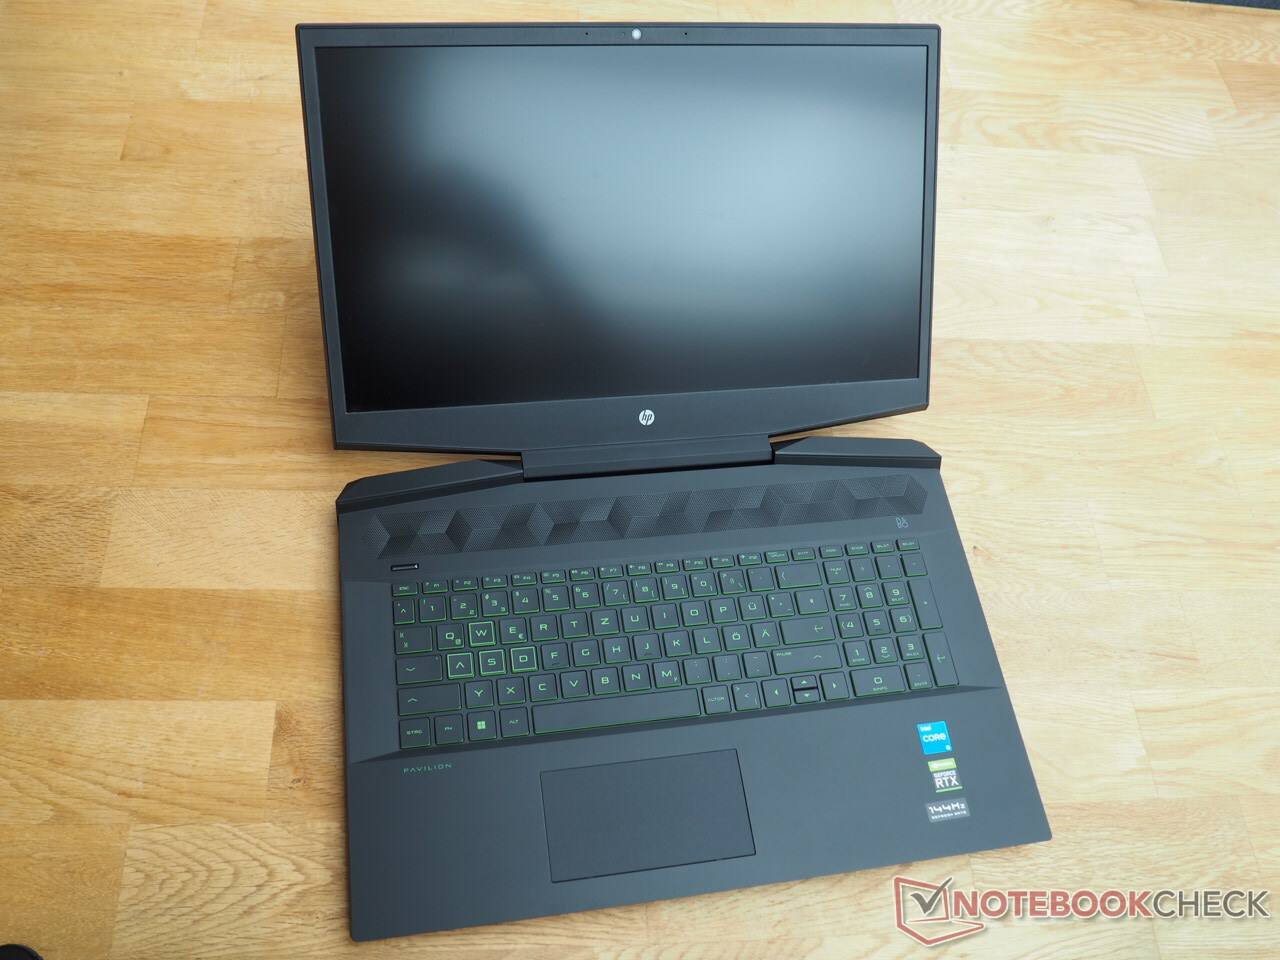
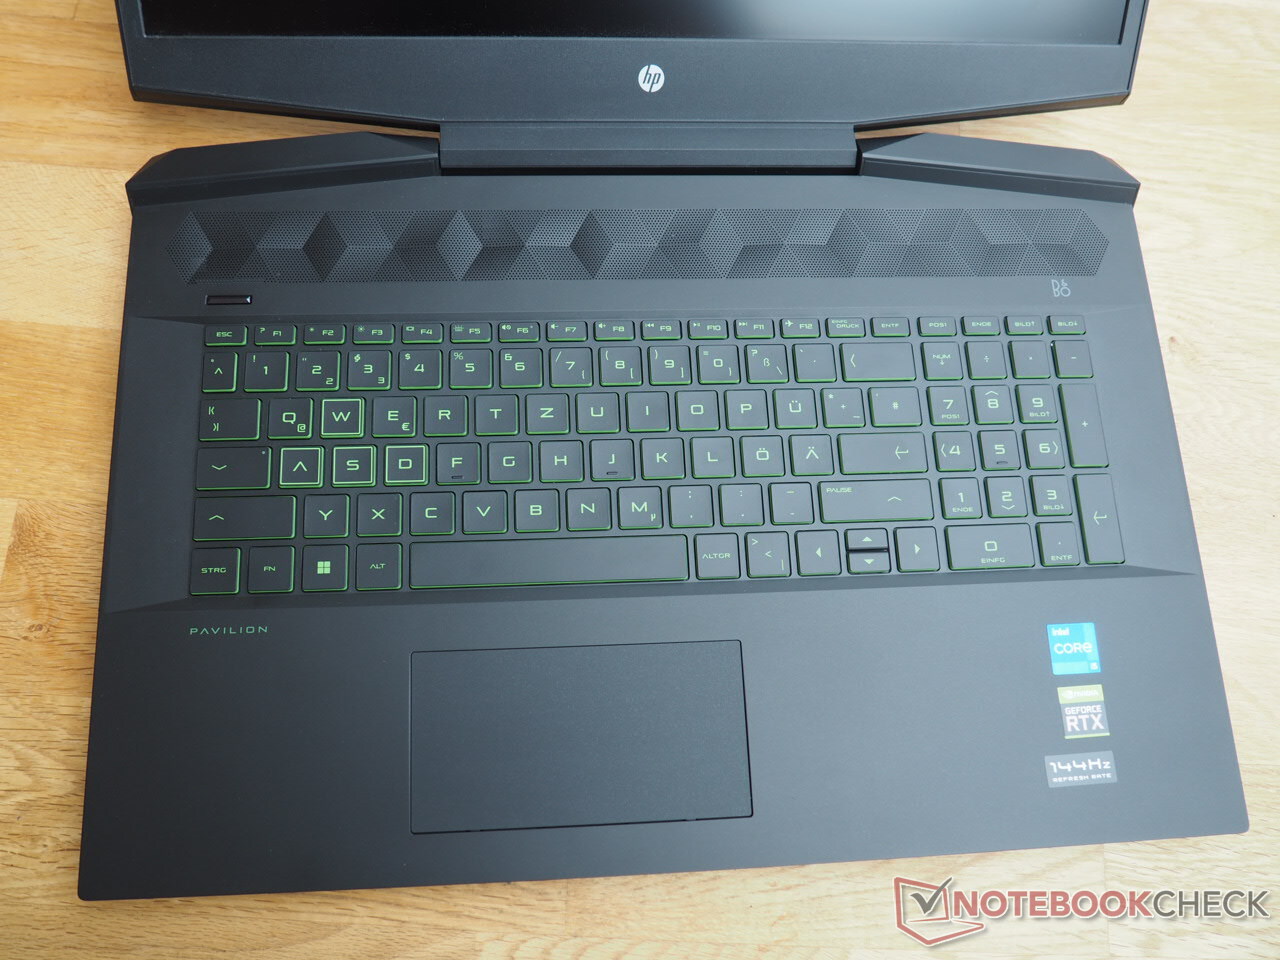
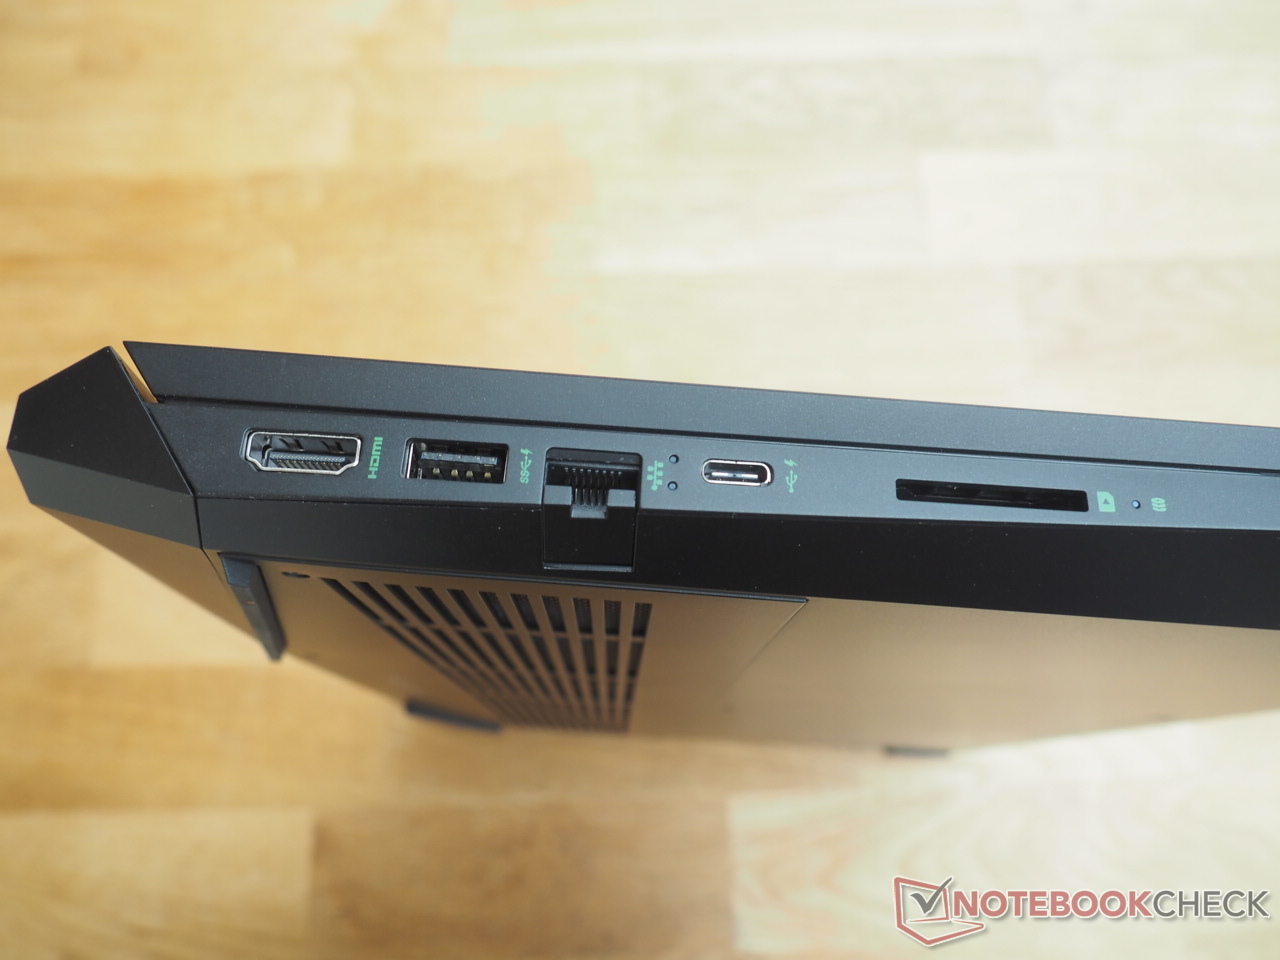
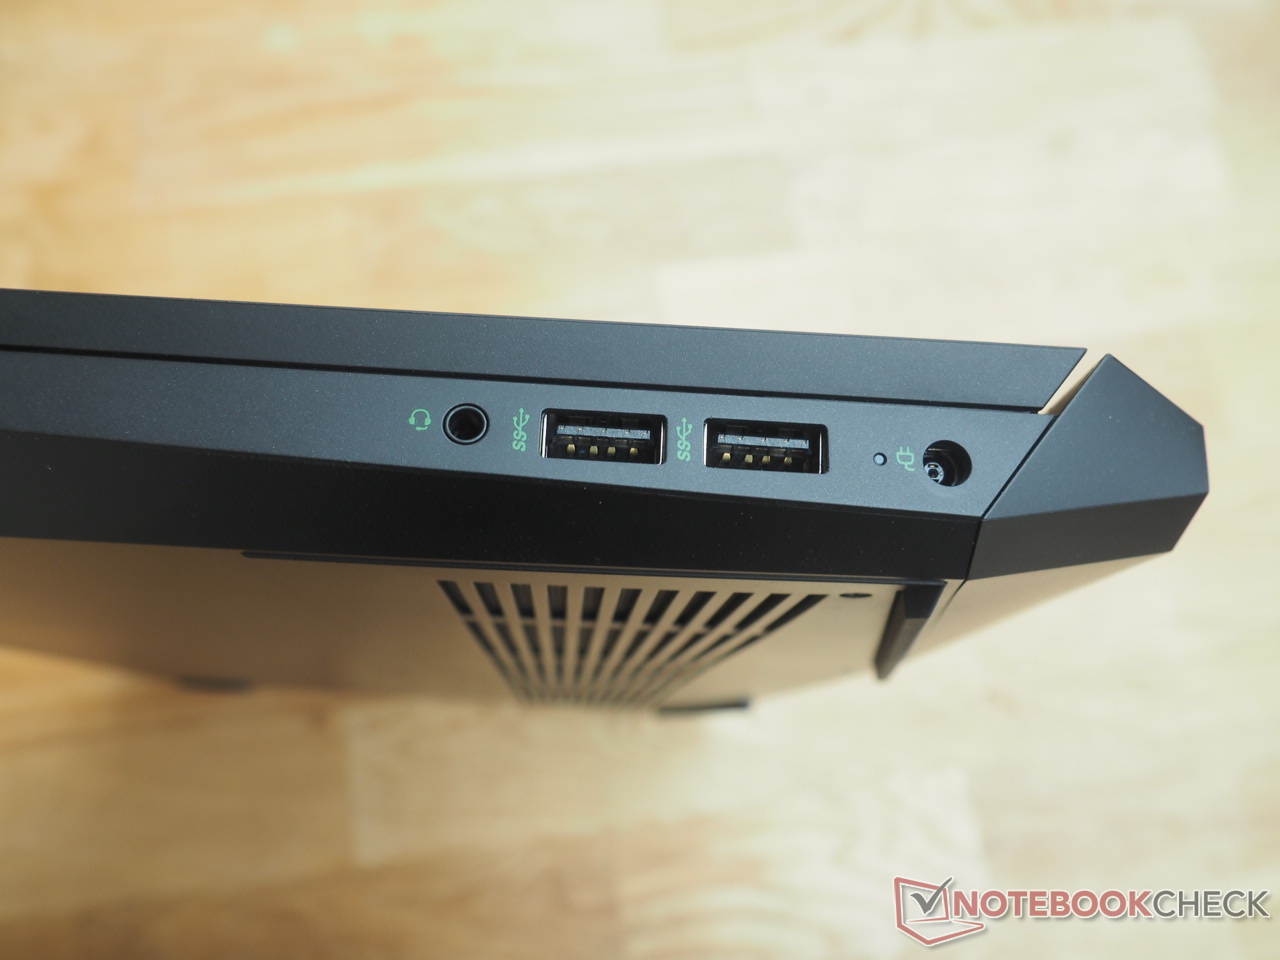
Kasa harici olarak (ön)öncekiyle aynı olduğundan, bu makalede kasaya, giriş aygıtlarına ve bağlantıya tekrar girmeyeceğiz. İlgili bilgileri Pavilion Gaming 17-cd0085cl incelememizde bulabilirsiniz.
SD kart okuyucu
| SD Card Reader - average JPG Copy Test (av. of 3 runs) | |
| Sınıf ortalaması Gaming (20.9 - 210, n=54, son 2 yıl) | |
| HP Pavilion Gaming 17-cd0085cl (Toshiba Exceria Pro SDXC 64 GB UHS-II) | |
| HP Victus 16-e0145ng (AV PRO microSD 128 GB V60) | |
| HP Pavilion Gaming 17-cd2146ng (AV PRO microSD 128 GB V60) | |
İletişim
| Networking - iperf3 receive AXE11000 | |
| Sınıf ortalaması Gaming (680 - 1745, n=87, son 2 yıl) | |
| HP Pavilion Gaming 17-cd2146ng | |
| Ortalama Realtek RTL8852AE (n=1) | |
| HP Victus 16-e0145ng | |
Kamera


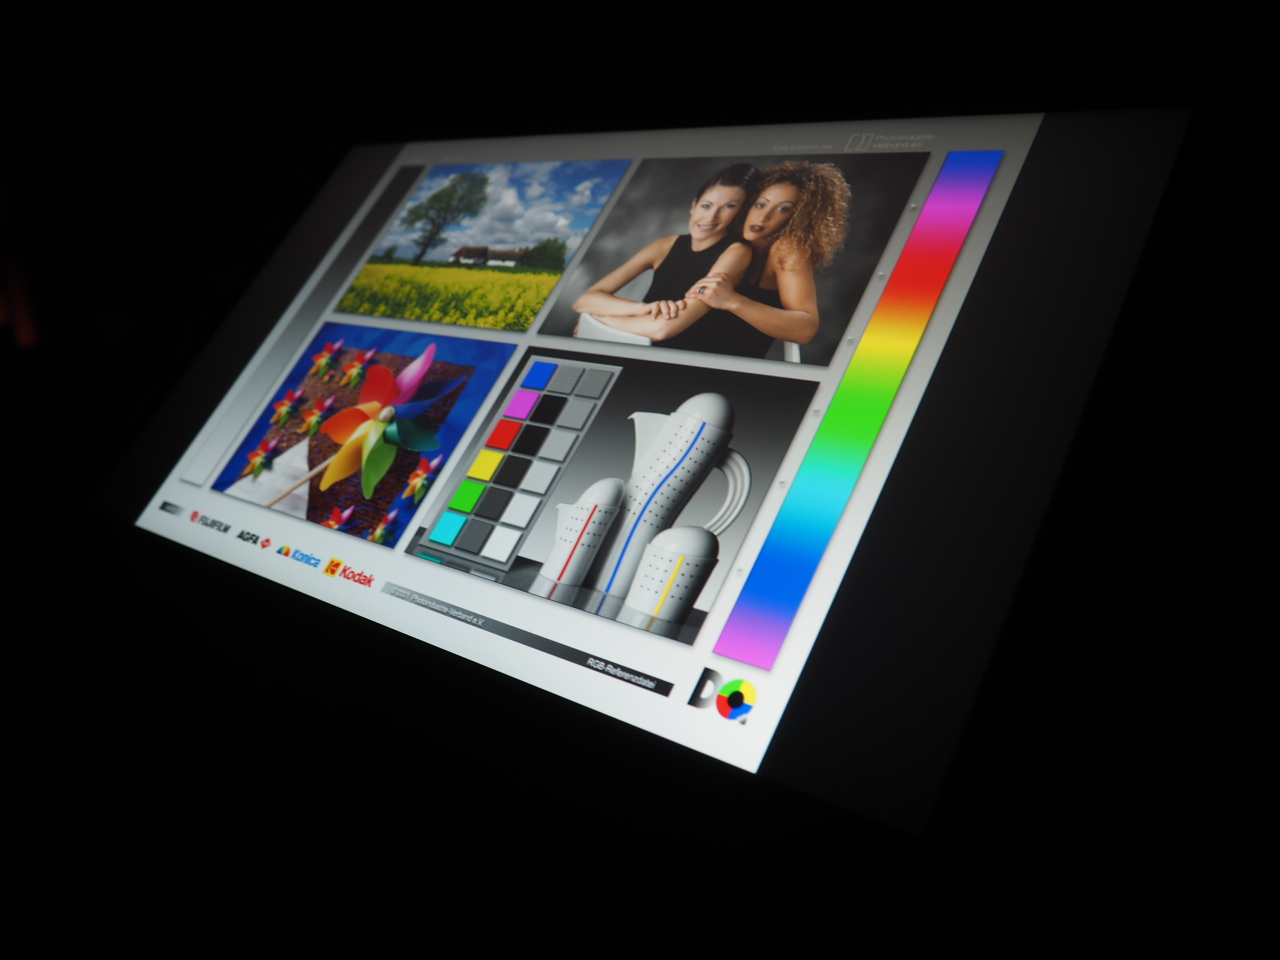
Ekran
Daha önce de belirtildiği gibi, düşük fiyatlı oyun dizüstü bilgisayarlarında iyi ekranlar bulmak oldukça nadirdir. Neyse ki, Pavilion Gaming 17 birkaç istisnadan biridir.
| |||||||||||||||||||||||||
Aydınlatma: 94 %
Batarya modunda parlaklık: 328 cd/m²
Kontrast: 1426:1 (Siyah: 0.23 cd/m²)
ΔE ColorChecker Calman: 3.83 | ∀{0.5-29.43 Ø4.71}
calibrated: 0.83
ΔE Greyscale Calman: 4.9 | ∀{0.09-98 Ø4.96}
66.5% AdobeRGB 1998 (Argyll 3D)
96.8% sRGB (Argyll 3D)
64.8% Display P3 (Argyll 3D)
Gamma: 2.177
CCT: 7881 K
| HP Pavilion Gaming 17-cd2146ng LGD0611, IPS, 1920x1080, 17.3" | Dell G15 5510-43NHT Dell 156GL05, IPS, 1920x1080, 15.6" | Lenovo Ideapad Gaming 3 15IHU-82K1002RGE LEN156FHD, IPS, 1920x1080, 15.6" | HP Victus 16-e0145ng CMN1609, IPS, 1920x1080, 16.1" | HP Pavilion Gaming 17-cd0085cl BOE0825, IPS, 1920x1080, 17.3" | |
|---|---|---|---|---|---|
| Display | -37% | -38% | -36% | -4% | |
| Display P3 Coverage (%) | 64.8 | 40.8 -37% | 39.7 -39% | 41.6 -36% | 63.3 -2% |
| sRGB Coverage (%) | 96.8 | 61.4 -37% | 59.6 -38% | 61.9 -36% | 90.2 -7% |
| AdobeRGB 1998 Coverage (%) | 66.5 | 42.2 -37% | 41.1 -38% | 43 -35% | 64.3 -3% |
| Response Times | -193% | -285% | -128% | -137% | |
| Response Time Grey 50% / Grey 80% * (ms) | 12.7 ? | 35 ? -176% | 46.4 ? -265% | 29.6 ? -133% | 31.6 ? -149% |
| Response Time Black / White * (ms) | 8.7 ? | 27 ? -210% | 35.2 ? -305% | 19.4 ? -123% | 19.6 ? -125% |
| PWM Frequency (Hz) | |||||
| Screen | -117% | -77% | -80% | -40% | |
| Brightness middle (cd/m²) | 328 | 290 -12% | 307 -6% | 257 -22% | 299.6 -9% |
| Brightness (cd/m²) | 317 | 267 -16% | 292 -8% | 239 -25% | 285 -10% |
| Brightness Distribution (%) | 94 | 87 -7% | 88 -6% | 88 -6% | 86 -9% |
| Black Level * (cd/m²) | 0.23 | 1.085 -372% | 0.21 9% | 0.25 -9% | 0.33 -43% |
| Contrast (:1) | 1426 | 267 -81% | 1462 3% | 1028 -28% | 908 -36% |
| Colorchecker dE 2000 * | 3.83 | 6.5 -70% | 5.9 -54% | 6.91 -80% | 3.68 4% |
| Colorchecker dE 2000 max. * | 8.51 | 16.96 -99% | 21.6 -154% | 22.27 -162% | 8.05 5% |
| Colorchecker dE 2000 calibrated * | 0.83 | 4.11 -395% | 4.8 -478% | 3.61 -335% | 3.15 -280% |
| Greyscale dE 2000 * | 4.9 | 4.85 1% | 4.9 -0% | 7.5 -53% | 3.8 22% |
| Gamma | 2.177 101% | 2.22 99% | 2.26 97% | 2.125 104% | 2.12 104% |
| CCT | 7881 82% | 7401 88% | 6504 100% | 6025 108% | 7240 90% |
| Color Space (Percent of AdobeRGB 1998) (%) | 58.1 | ||||
| Color Space (Percent of sRGB) (%) | 89.8 | ||||
| Toplam Ortalama (Program / Ayarlar) | -116% /
-111% | -133% /
-99% | -81% /
-77% | -60% /
-46% |
* ... daha küçük daha iyidir
Üreticinin spesifikasyonuna yakın olan %97'lik kayıtlı sRGB kapsamı ile HP dizüstü bilgisayar, rekabette kat kat öndedir. Hem Dell G15 hem de Lenovo IdeaPad Gaming 3, yalnızca yaklaşık %60'a ulaşıyor ve kontrast ne olursa olsun çok daha soluk bir görüntüyle sonuçlanıyor; bu, yalnızca ofis ve İnternet'te gezinme için uygun, ancak medya tüketimi (videolar, filmler, oyunlar) için uygun değil. vb.). Buna karşılık, Pavilion 17 her uygulamada güzel bir figür oluşturuyor.
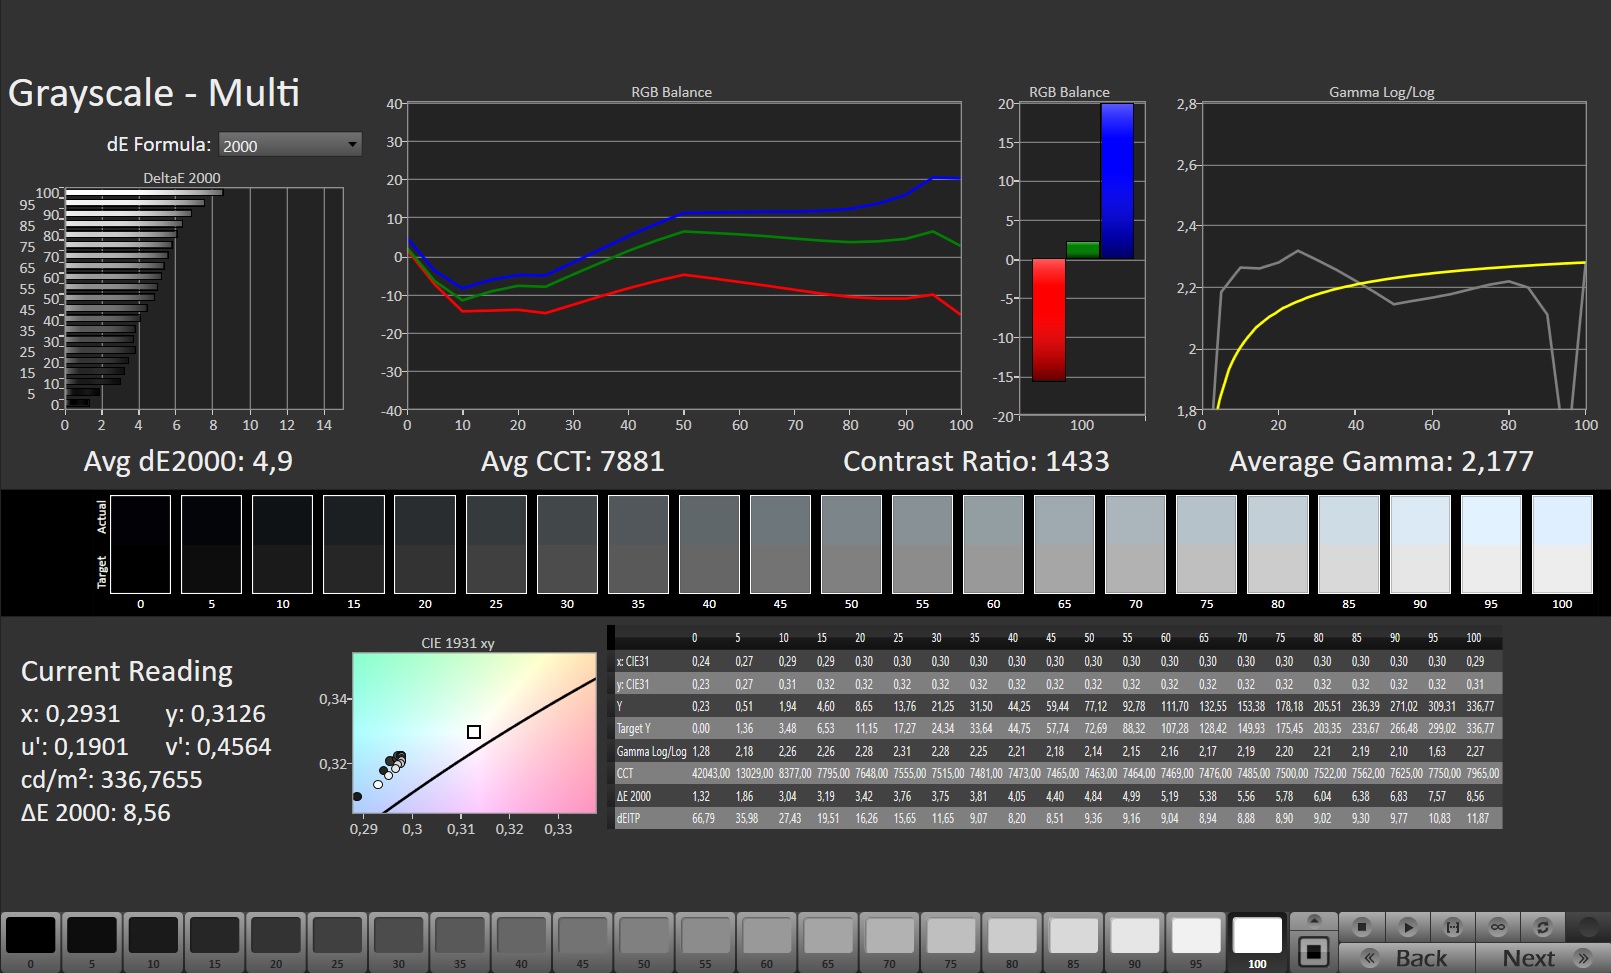
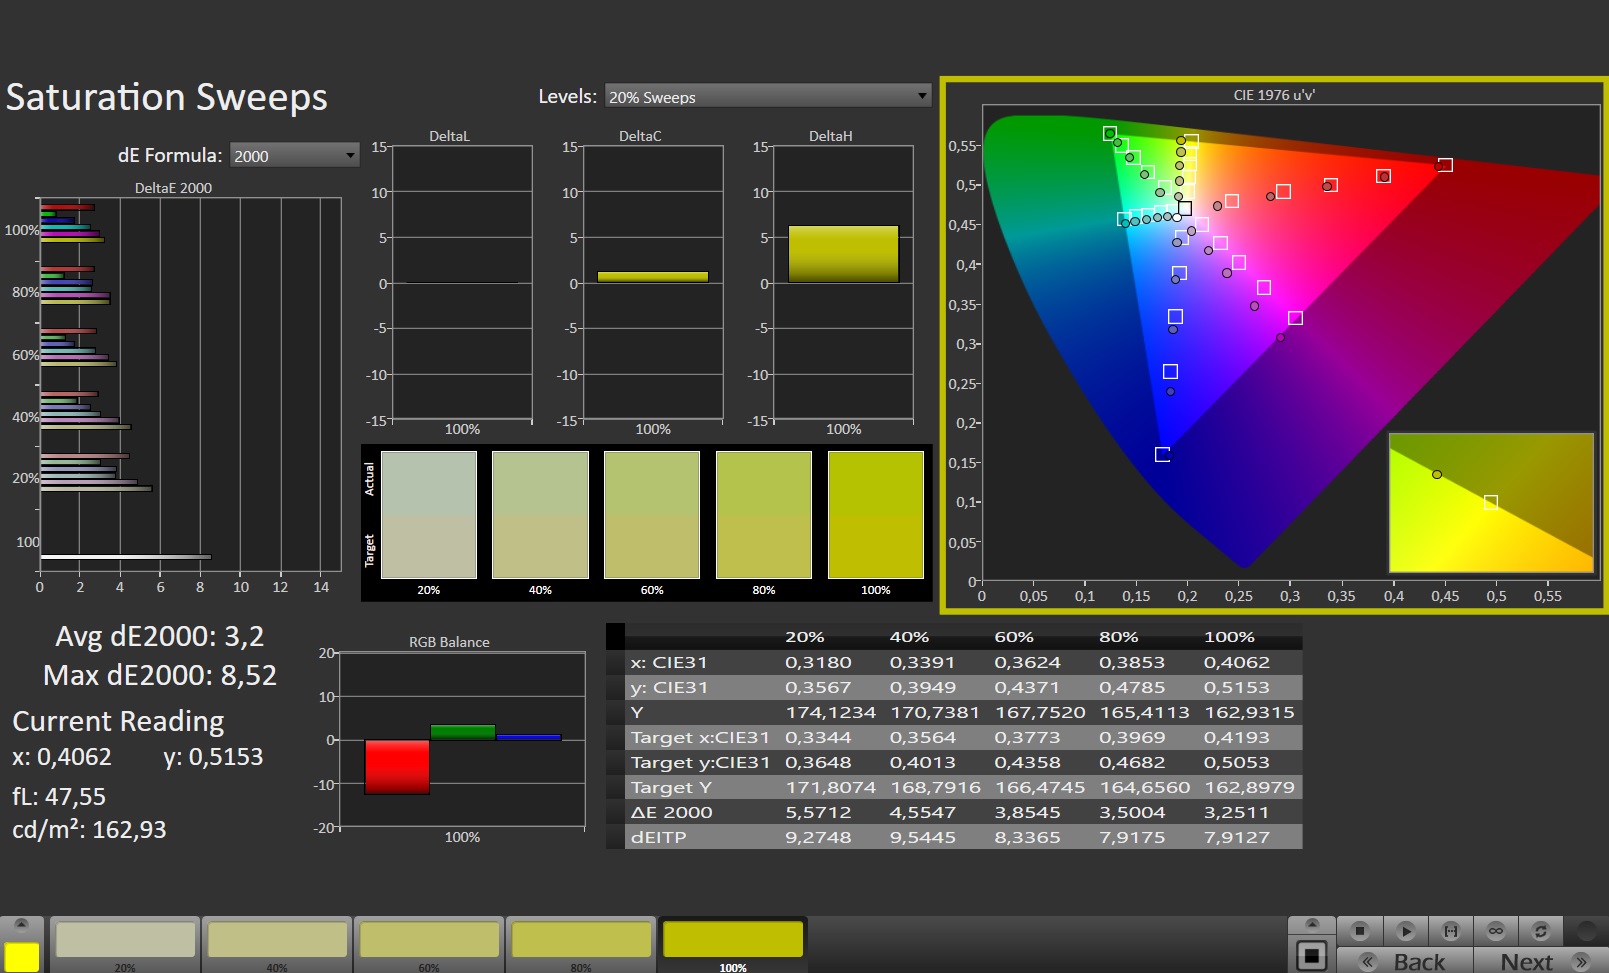
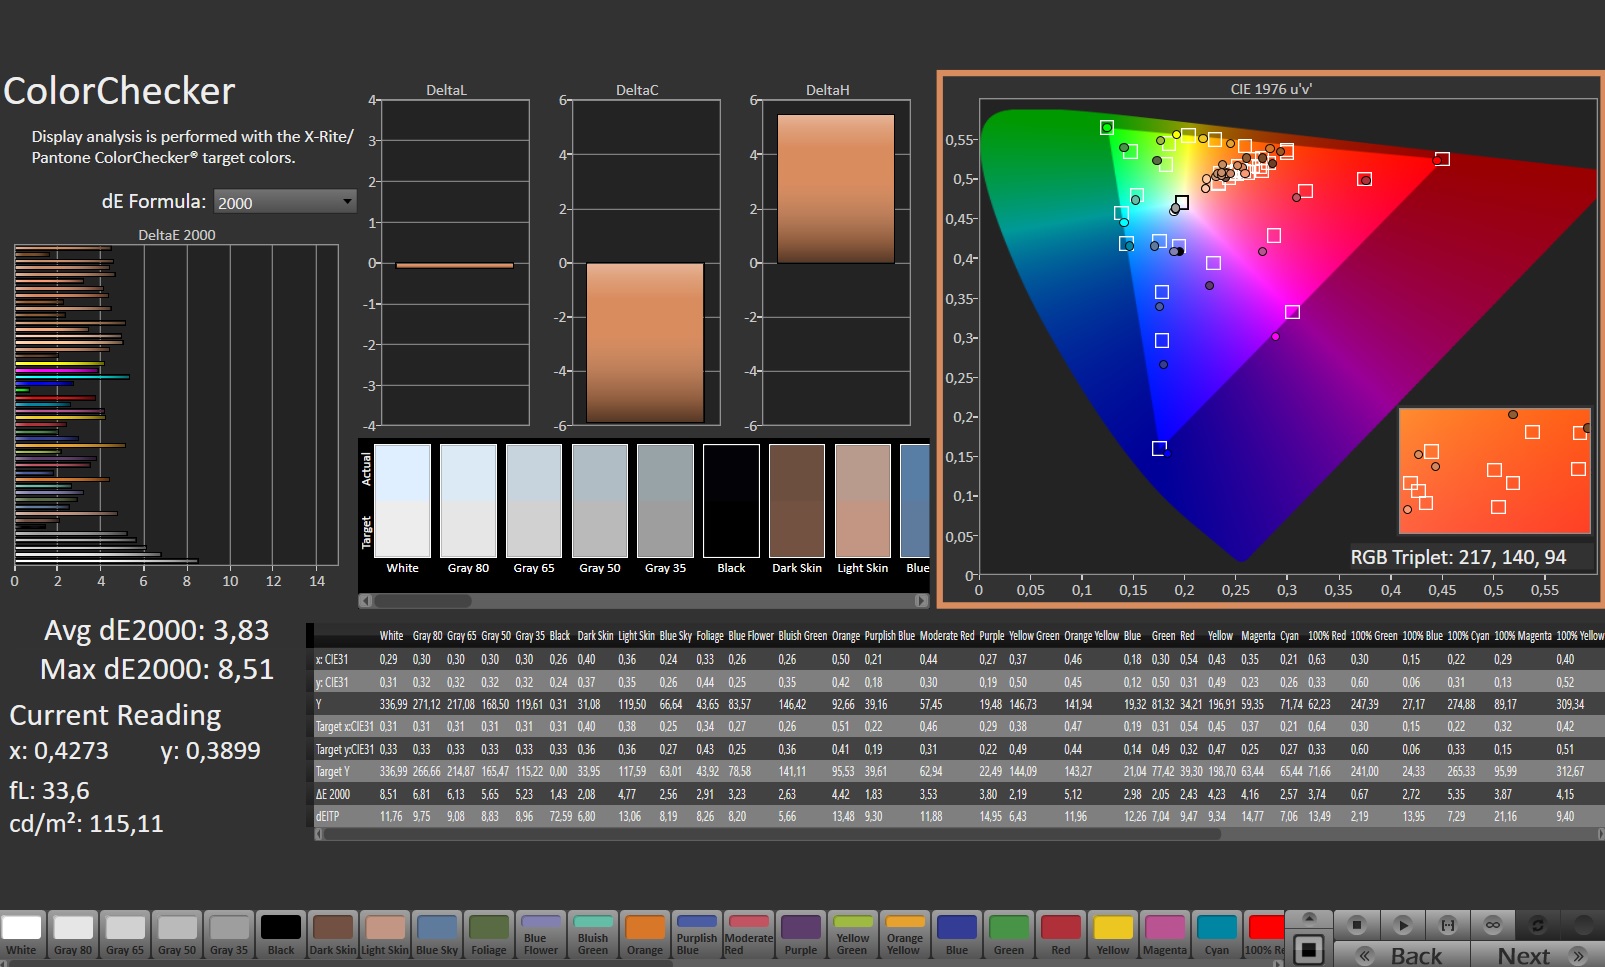
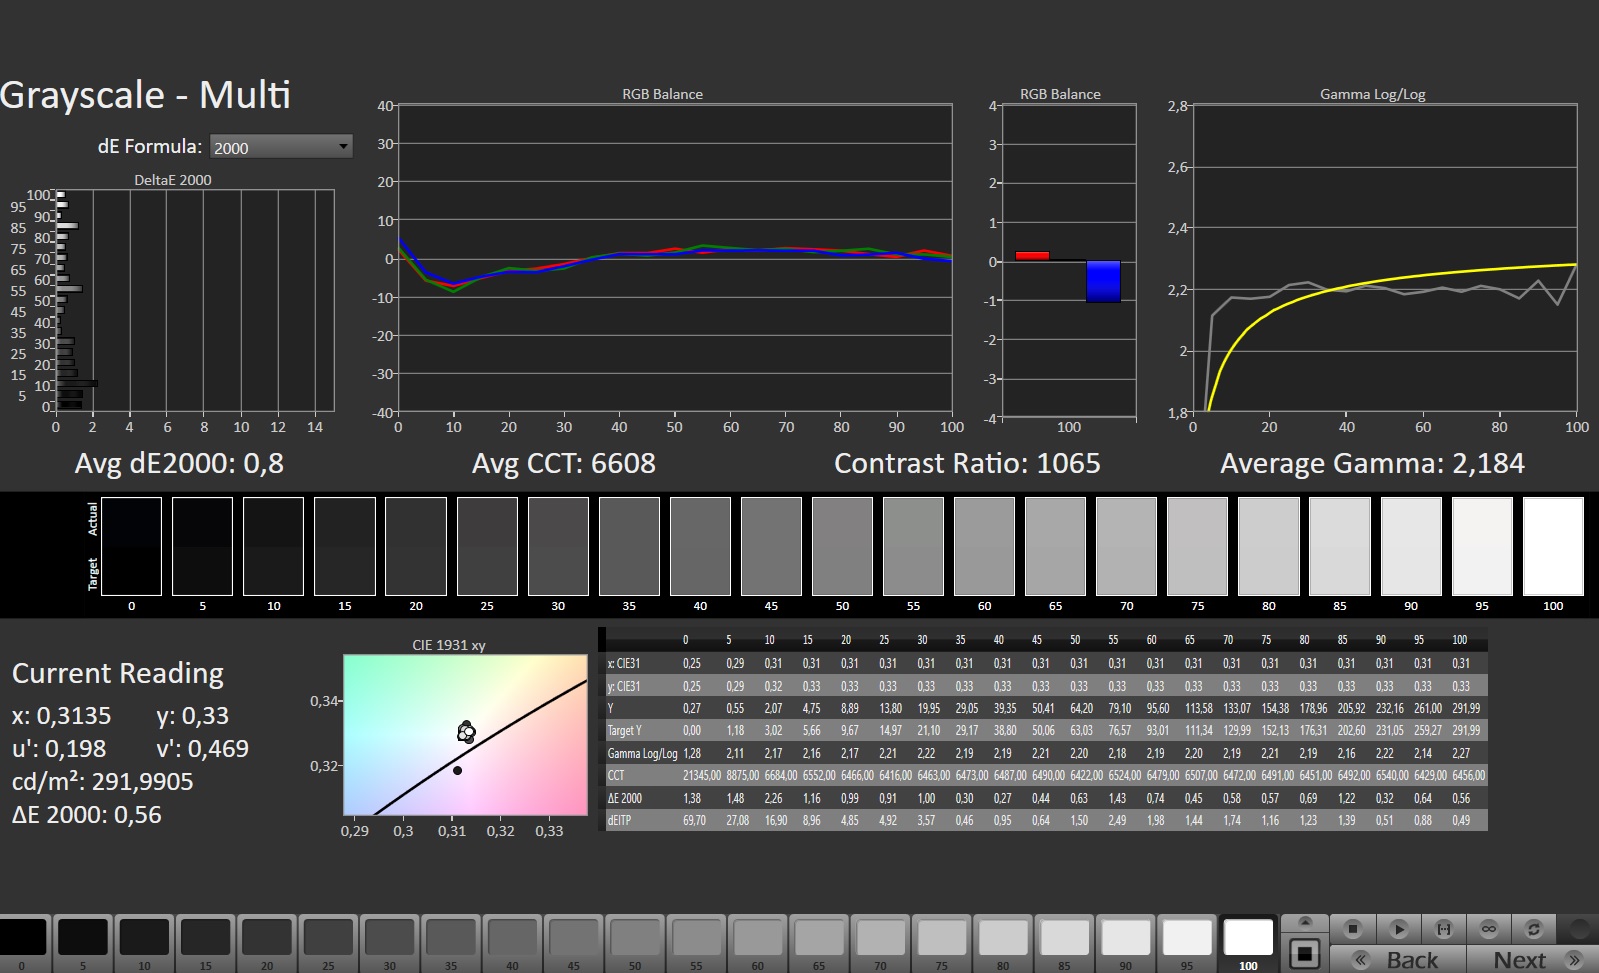
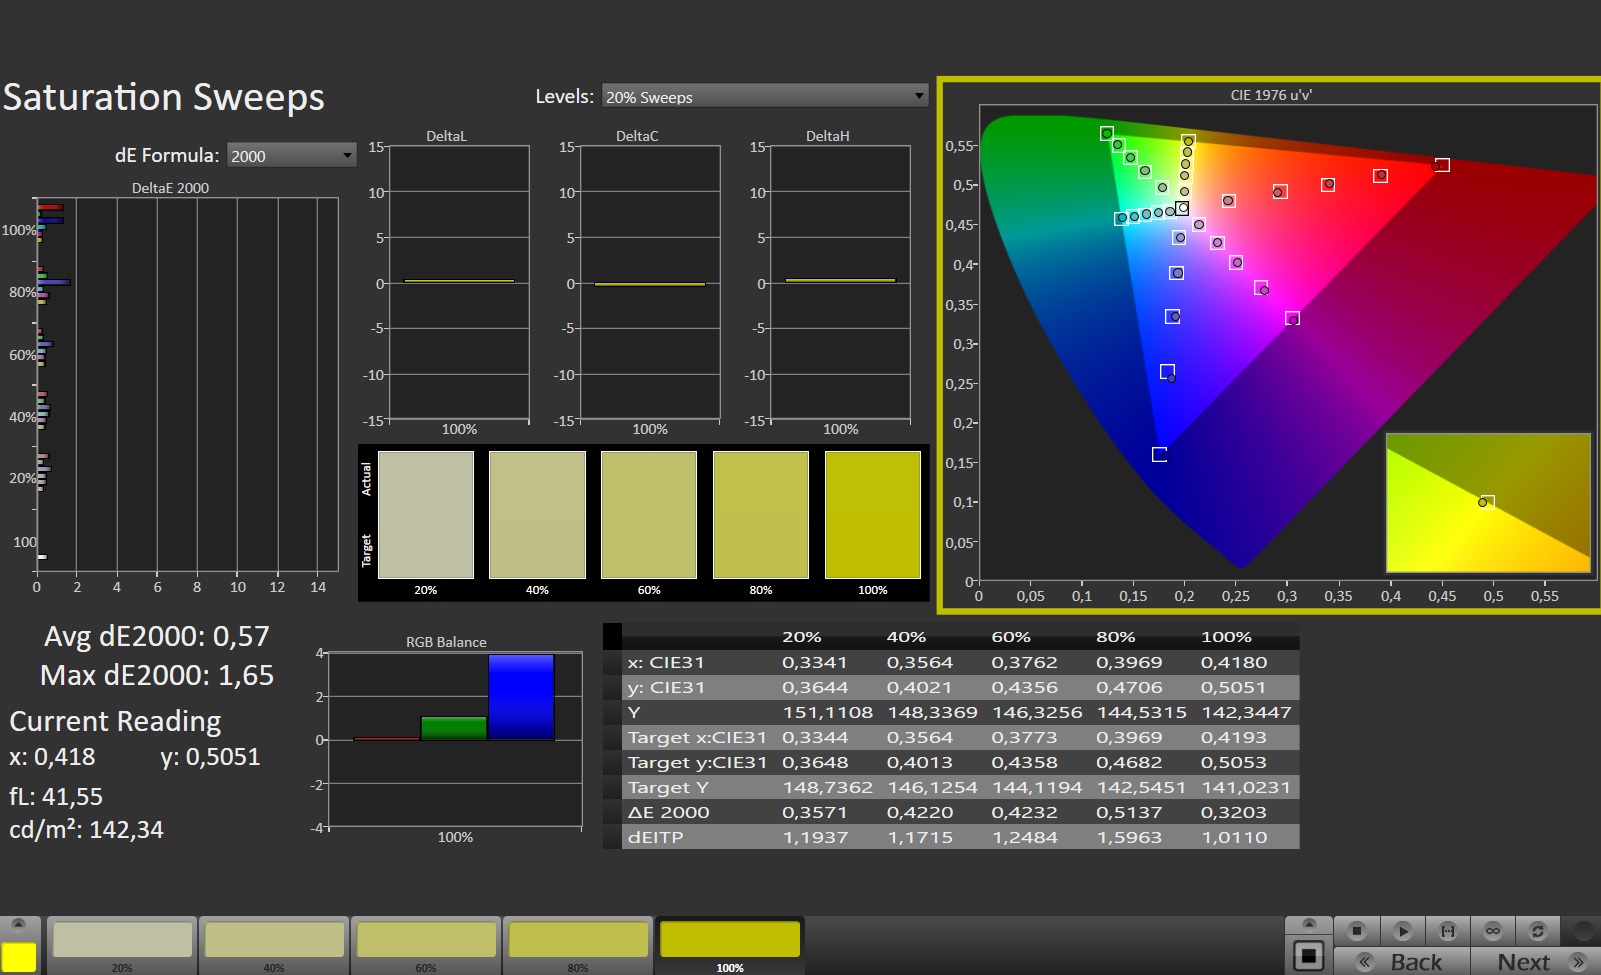
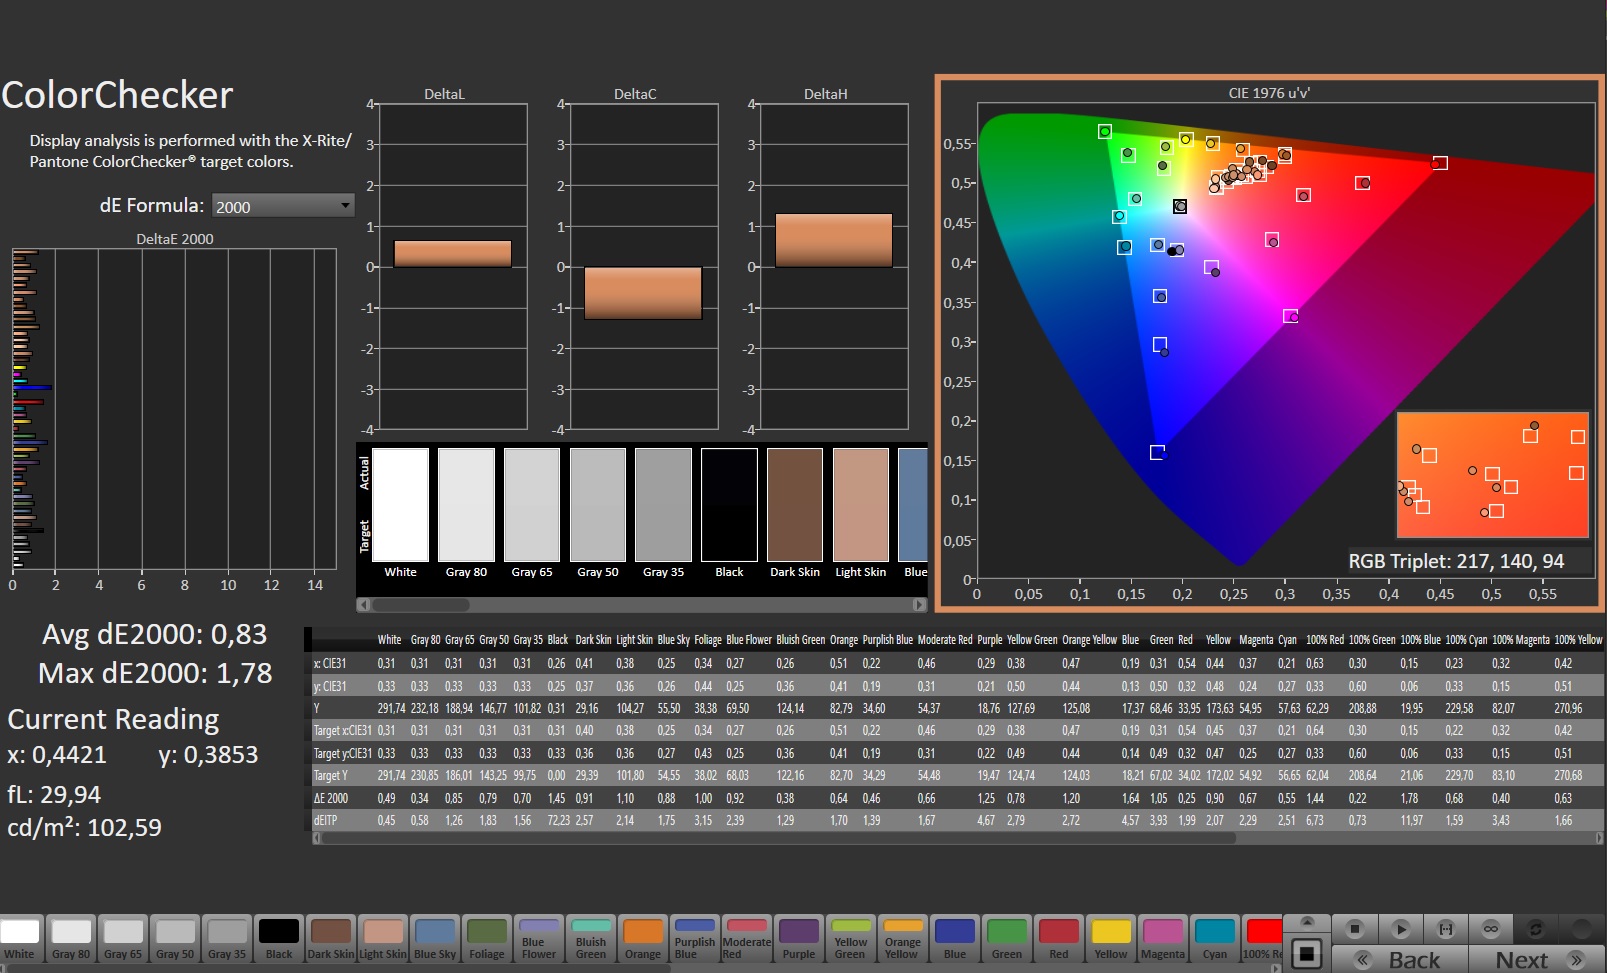
Kontrast açısından da şikayet edilecek bir şey yok. 1.426:1, IPS standartlarına göre çok yüksektir ve bu değer yalnızca Lenovo dizüstü bilgisayar tarafından geçilebilir. Parlaklık söz konusu olduğunda, Pavilion bir kez daha üst sıralarda yer alıyor. Ortalama 317 cd/m² en yüksek oran değildir, ancak özellikle parlak veya güneşli yerlerden kaçındığınız sürece çoğu ihtiyaç için yeterli olmalıdır. Karşılaştırma için: Rakip ortalama 300 cd/m²'nin altında kalıyor.
HP dizüstü bilgisayar, hiçbir rakibin erişemeyeceği hızlı yanıt süreleri için daha da fazla puan alıyor. Ancak üretici, renk doğruluğu açısından bazı iyileştirmeler kullanabilir. Panel, kutunun dışında kalibrasyonla düzeltilebilecek hafif bir mavi renk tonu gösteriyor (sağ üst köşede parlaklık dağılım tablosunun yanında ICC dosyamıza bir bağlantı var). Görüş açıları tipik IPS standartlarına uygundur. 17 inçlik cihaz, aşırı ekran kanaması veya titremesinden muzdarip değil.
Yanıt Sürelerini Görüntüle
| ↔ Tepki Süresi Siyahtan Beyaza | ||
|---|---|---|
| 8.7 ms ... yükseliş ↗ ve sonbahar↘ birleşimi | ↗ 4.4 ms yükseliş | 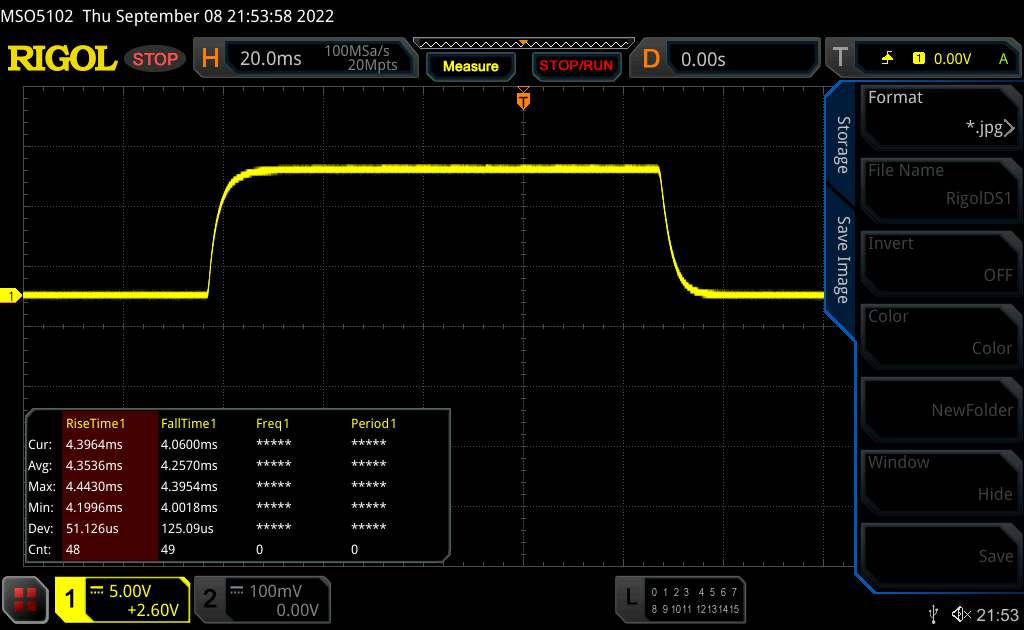 |
| ↘ 4.3 ms sonbahar | ||
| Ekran, testlerimizde hızlı yanıt oranları gösteriyor ve oyun oynamaya uygun olmalı. Karşılaştırıldığında, test edilen tüm cihazlar 0.1 (minimum) ile 240 (maksimum) ms arasında değişir. » Tüm cihazların 24 %'si daha iyi. Bu, ölçülen yanıt süresinin test edilen tüm cihazların ortalamasından (19.8 ms) daha iyi olduğu anlamına gelir. | ||
| ↔ Tepki Süresi %50 Griden %80 Griye | ||
| 12.7 ms ... yükseliş ↗ ve sonbahar↘ birleşimi | ↗ 6.1 ms yükseliş | 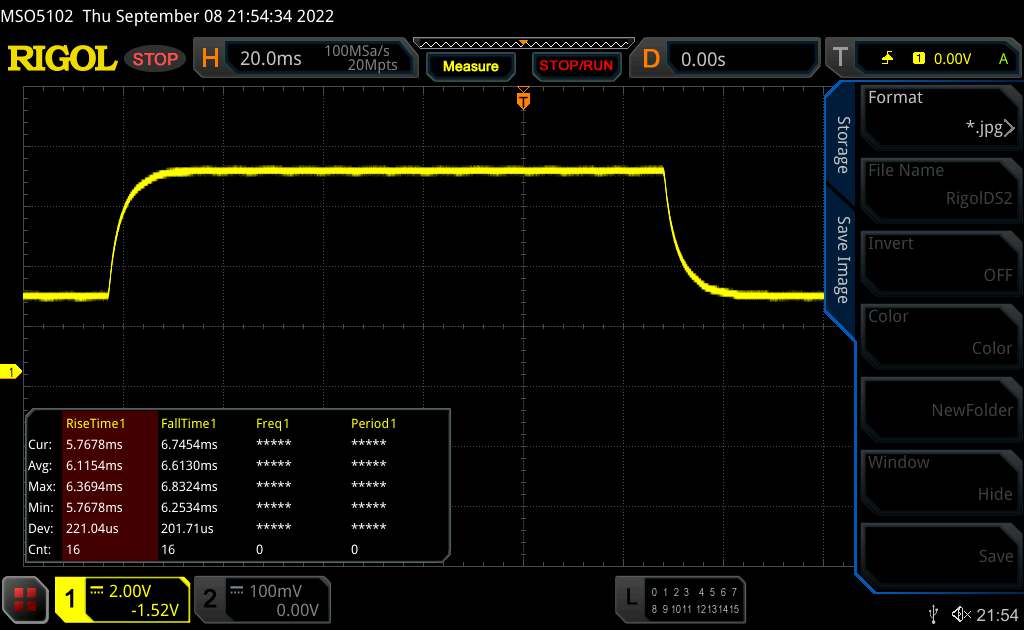 |
| ↘ 6.6 ms sonbahar | ||
| Ekran, testlerimizde iyi yanıt oranları gösteriyor ancak rekabetçi oyuncular için çok yavaş olabilir. Karşılaştırıldığında, test edilen tüm cihazlar 0.165 (minimum) ile 636 (maksimum) ms arasında değişir. » Tüm cihazların 26 %'si daha iyi. Bu, ölçülen yanıt süresinin test edilen tüm cihazların ortalamasından (30.9 ms) daha iyi olduğu anlamına gelir. | ||
Ekran Titremesi / PWM (Darbe Genişliği Modülasyonu)
| Ekran titriyor / PWM algılanmadı |  | ||
Karşılaştırıldığında: Test edilen tüm cihazların %52 %'si ekranı karartmak için PWM kullanmıyor. PWM tespit edilirse, ortalama 7744 (minimum: 5 - maksimum: 343500) Hz ölçüldü. | |||
Performans
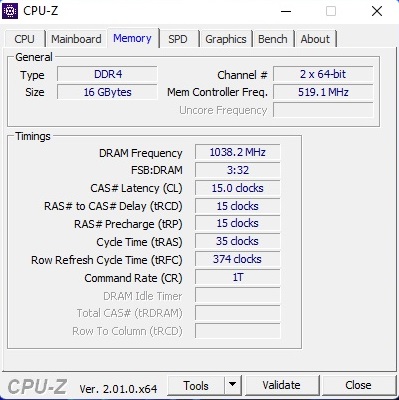
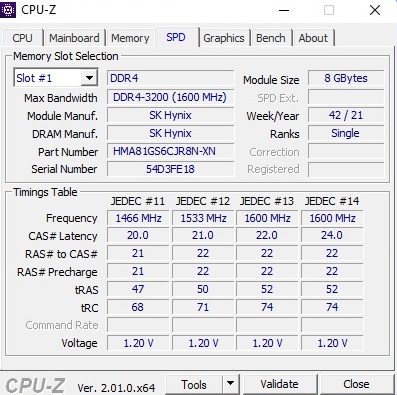
Dört çekirdekli CPU ve 4 GB GPU ile Pavilion Gaming 17 orta sınıf segmentte konumlanıyor. Önümüzdeki birkaç yıl için 16 GB RAM yeterli olacaktır. Birkaç (büyük) oyun yüklendiğinde SSD ile işler sıkışabilir. Bununla birlikte, depolama ve RAM sorunsuz bir şekilde değiştirilebilir.
Test koşulları
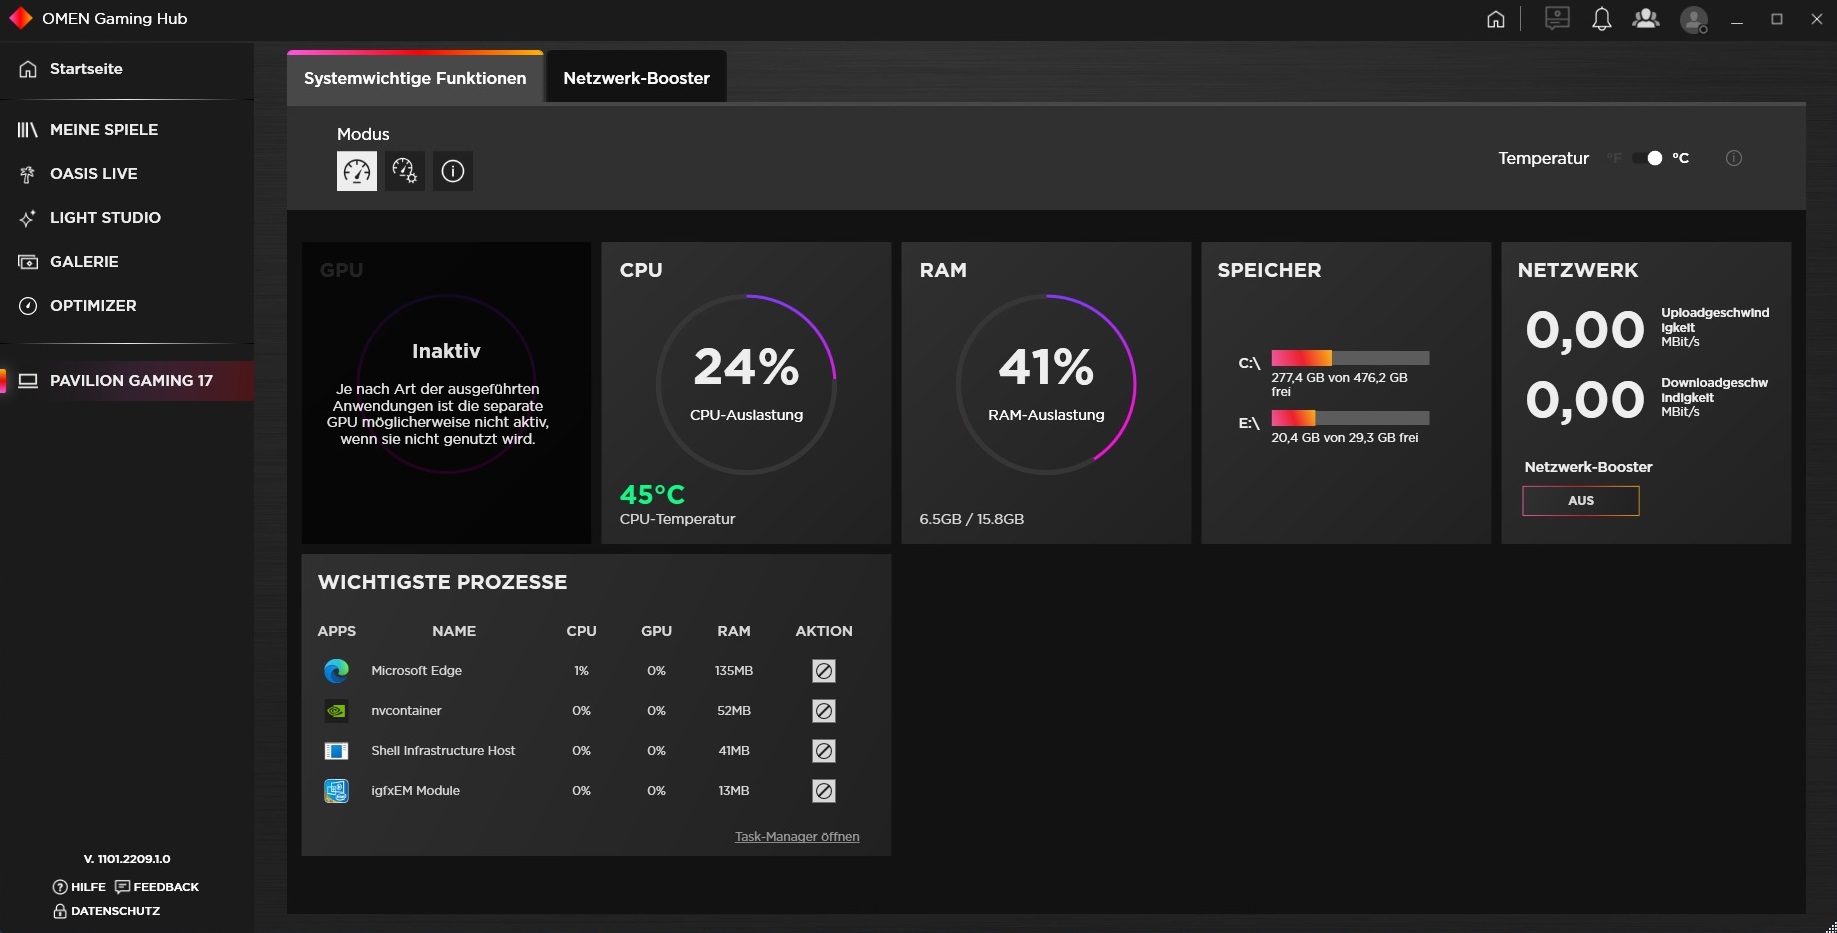
Windows tarafından otomatik olarak yüklenen sürücüler ve güncellemelerin yanı sıra cihaza sadece Omen Gaming Hub'ı kurduk. Bununla birlikte, Pavilion Gaming 17'de, diğer dizüstü bilgisayarlarda olduğu gibi, orada farklı performans modları mevcut değildi.
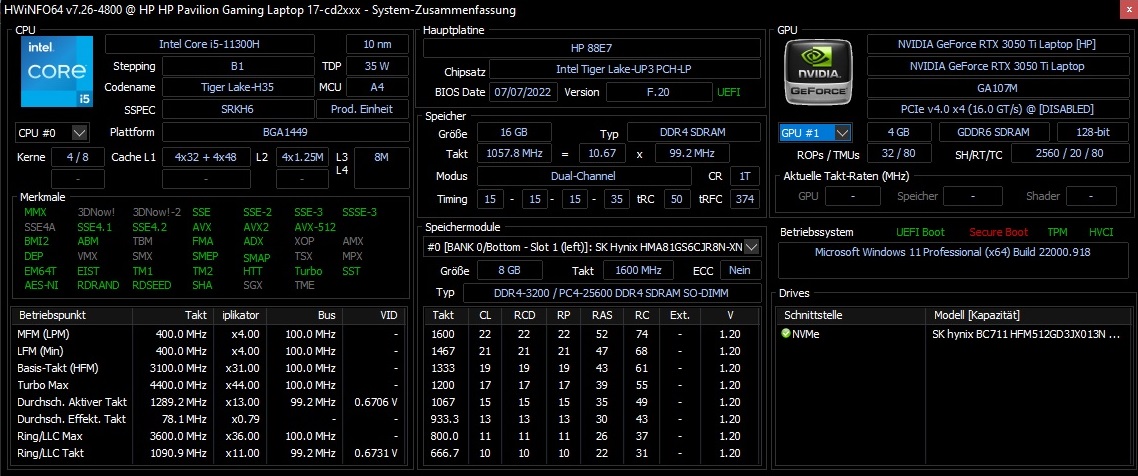
İşlemci
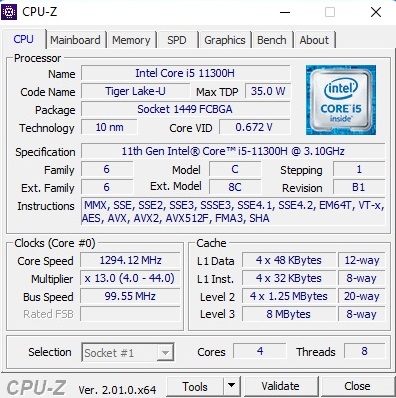
Core i5-11300H, Intel'in Tiger-Lake nesline ait olan ve eskisi kadar yepyeni olmayan güçlü bir dört çekirdekli CPU'dur. 10 nm yonga, 8 MB L3 önbelleğin yanı sıra Hyper-Threading aracılığıyla paralel olarak işlenebilen 8 adede kadar iş parçacığı sunar. İşlemci, kıyaslama kursumuzda herhangi bir sorun olmadan davrandı. Performansı, aynı zamanda bir i5-11300H ile donatılmış Lenovo IdeaPad Gaming 3'ün performansına benzer. Ancak, çok çekirdekli uygulamalar söz konusu olduğunda, CPU'nun özellikle eski Core i7-9750H ve Ryzen 5 5600H (her biri 6 çekirdek) karşısında şansı yok . Bununla birlikte, i5-11300H çok yönlü iyi bir modeldir.
Cinebench R15 Multi endurance test
| CPU Performance rating - Percent | |
| Sınıf ortalaması Gaming | |
| HP Victus 16-e0145ng | |
| HP Pavilion Gaming 17-cd0085cl -12! | |
| Lenovo Ideapad Gaming 3 15IHU-82K1002RGE | |
| HP Pavilion Gaming 17-cd2146ng | |
| Ortalama Intel Core i5-11300H | |
| Dell G15 5510-43NHT | |
| Cinebench R20 | |
| CPU (Multi Core) | |
| Sınıf ortalaması Gaming (4029 - 16433, n=103, son 2 yıl) | |
| HP Victus 16-e0145ng | |
| HP Pavilion Gaming 17-cd2146ng | |
| Lenovo Ideapad Gaming 3 15IHU-82K1002RGE | |
| Ortalama Intel Core i5-11300H (1300 - 2533, n=10) | |
| Dell G15 5510-43NHT | |
| CPU (Single Core) | |
| Sınıf ortalaması Gaming (622 - 913, n=103, son 2 yıl) | |
| HP Victus 16-e0145ng | |
| HP Pavilion Gaming 17-cd2146ng | |
| Ortalama Intel Core i5-11300H (431 - 548, n=11) | |
| Lenovo Ideapad Gaming 3 15IHU-82K1002RGE | |
| Dell G15 5510-43NHT | |
| Cinebench R15 | |
| CPU Multi 64Bit | |
| Sınıf ortalaması Gaming (1578 - 6330, n=102, son 2 yıl) | |
| HP Victus 16-e0145ng | |
| HP Pavilion Gaming 17-cd0085cl | |
| HP Pavilion Gaming 17-cd2146ng | |
| Lenovo Ideapad Gaming 3 15IHU-82K1002RGE | |
| Ortalama Intel Core i5-11300H (632 - 990, n=11) | |
| Dell G15 5510-43NHT | |
| CPU Single 64Bit | |
| Sınıf ortalaması Gaming (188.8 - 350, n=103, son 2 yıl) | |
| HP Victus 16-e0145ng | |
| Lenovo Ideapad Gaming 3 15IHU-82K1002RGE | |
| HP Pavilion Gaming 17-cd2146ng | |
| HP Pavilion Gaming 17-cd0085cl | |
| Ortalama Intel Core i5-11300H (123 - 211, n=8) | |
| Dell G15 5510-43NHT | |
| Blender - v2.79 BMW27 CPU | |
| Ortalama Intel Core i5-11300H (466 - 862, n=10) | |
| HP Pavilion Gaming 17-cd2146ng | |
| Dell G15 5510-43NHT | |
| Lenovo Ideapad Gaming 3 15IHU-82K1002RGE | |
| HP Victus 16-e0145ng | |
| Sınıf ortalaması Gaming (79 - 330, n=101, son 2 yıl) | |
| HWBOT x265 Benchmark v2.2 - 4k Preset | |
| Sınıf ortalaması Gaming (11.5 - 44.4, n=102, son 2 yıl) | |
| HP Victus 16-e0145ng | |
| Lenovo Ideapad Gaming 3 15IHU-82K1002RGE | |
| HP Pavilion Gaming 17-cd2146ng | |
| Ortalama Intel Core i5-11300H (4.32 - 8.38, n=10) | |
| Dell G15 5510-43NHT | |
| LibreOffice - 20 Documents To PDF | |
| HP Victus 16-e0145ng | |
| Dell G15 5510-43NHT | |
| HP Pavilion Gaming 17-cd2146ng | |
| Lenovo Ideapad Gaming 3 15IHU-82K1002RGE | |
| Sınıf ortalaması Gaming (33.2 - 88.8, n=102, son 2 yıl) | |
| Ortalama Intel Core i5-11300H (43.6 - 59.4, n=10) | |
| R Benchmark 2.5 - Overall mean | |
| Dell G15 5510-43NHT | |
| HP Pavilion Gaming 17-cd2146ng | |
| Ortalama Intel Core i5-11300H (0.6 - 0.644, n=10) | |
| Lenovo Ideapad Gaming 3 15IHU-82K1002RGE | |
| HP Victus 16-e0145ng | |
| Sınıf ortalaması Gaming (0.3439 - 0.59, n=102, son 2 yıl) | |
* ... daha küçük daha iyidir
AIDA64: FP32 Ray-Trace | FPU Julia | CPU SHA3 | CPU Queen | FPU SinJulia | FPU Mandel | CPU AES | CPU ZLib | FP64 Ray-Trace | CPU PhotoWorxx
| Performance rating | |
| Sınıf ortalaması Gaming | |
| HP Victus 16-e0145ng | |
| Lenovo Ideapad Gaming 3 15IHU-82K1002RGE | |
| Ortalama Intel Core i5-11300H | |
| HP Pavilion Gaming 17-cd2146ng | |
| Dell G15 5510-43NHT | |
| AIDA64 / FP32 Ray-Trace | |
| Sınıf ortalaması Gaming (10227 - 85542, n=102, son 2 yıl) | |
| HP Victus 16-e0145ng | |
| Lenovo Ideapad Gaming 3 15IHU-82K1002RGE | |
| Ortalama Intel Core i5-11300H (6128 - 8440, n=9) | |
| HP Pavilion Gaming 17-cd2146ng | |
| Dell G15 5510-43NHT | |
| AIDA64 / FPU Julia | |
| Sınıf ortalaması Gaming (51376 - 372155, n=102, son 2 yıl) | |
| HP Victus 16-e0145ng | |
| Lenovo Ideapad Gaming 3 15IHU-82K1002RGE | |
| Dell G15 5510-43NHT | |
| Ortalama Intel Core i5-11300H (25739 - 33986, n=9) | |
| HP Pavilion Gaming 17-cd2146ng | |
| AIDA64 / CPU SHA3 | |
| Sınıf ortalaması Gaming (2180 - 10115, n=102, son 2 yıl) | |
| HP Victus 16-e0145ng | |
| Lenovo Ideapad Gaming 3 15IHU-82K1002RGE | |
| Ortalama Intel Core i5-11300H (1773 - 2286, n=9) | |
| HP Pavilion Gaming 17-cd2146ng | |
| Dell G15 5510-43NHT | |
| AIDA64 / CPU Queen | |
| Sınıf ortalaması Gaming (49785 - 173351, n=86, son 2 yıl) | |
| HP Victus 16-e0145ng | |
| Lenovo Ideapad Gaming 3 15IHU-82K1002RGE | |
| Ortalama Intel Core i5-11300H (41257 - 49312, n=9) | |
| Dell G15 5510-43NHT | |
| HP Pavilion Gaming 17-cd2146ng | |
| AIDA64 / FPU SinJulia | |
| Sınıf ortalaması Gaming (4424 - 33636, n=102, son 2 yıl) | |
| HP Victus 16-e0145ng | |
| Dell G15 5510-43NHT | |
| Lenovo Ideapad Gaming 3 15IHU-82K1002RGE | |
| Ortalama Intel Core i5-11300H (3925 - 4677, n=9) | |
| HP Pavilion Gaming 17-cd2146ng | |
| AIDA64 / FPU Mandel | |
| Sınıf ortalaması Gaming (25115 - 196829, n=102, son 2 yıl) | |
| HP Victus 16-e0145ng | |
| Lenovo Ideapad Gaming 3 15IHU-82K1002RGE | |
| Ortalama Intel Core i5-11300H (15820 - 20669, n=9) | |
| HP Pavilion Gaming 17-cd2146ng | |
| Dell G15 5510-43NHT | |
| AIDA64 / CPU AES | |
| Sınıf ortalaması Gaming (39258 - 247074, n=102, son 2 yıl) | |
| Lenovo Ideapad Gaming 3 15IHU-82K1002RGE | |
| Ortalama Intel Core i5-11300H (37694 - 71519, n=9) | |
| HP Victus 16-e0145ng | |
| HP Pavilion Gaming 17-cd2146ng | |
| Dell G15 5510-43NHT | |
| AIDA64 / CPU ZLib | |
| Sınıf ortalaması Gaming (574 - 2531, n=102, son 2 yıl) | |
| HP Victus 16-e0145ng | |
| Lenovo Ideapad Gaming 3 15IHU-82K1002RGE | |
| Ortalama Intel Core i5-11300H (269 - 390, n=9) | |
| Dell G15 5510-43NHT | |
| HP Pavilion Gaming 17-cd2146ng | |
| AIDA64 / FP64 Ray-Trace | |
| Sınıf ortalaması Gaming (5509 - 45446, n=102, son 2 yıl) | |
| HP Victus 16-e0145ng | |
| Lenovo Ideapad Gaming 3 15IHU-82K1002RGE | |
| Ortalama Intel Core i5-11300H (3322 - 4613, n=9) | |
| HP Pavilion Gaming 17-cd2146ng | |
| Dell G15 5510-43NHT | |
| AIDA64 / CPU PhotoWorxx | |
| Sınıf ortalaması Gaming (12271 - 89891, n=102, son 2 yıl) | |
| HP Pavilion Gaming 17-cd2146ng | |
| Ortalama Intel Core i5-11300H (9705 - 38002, n=9) | |
| HP Victus 16-e0145ng | |
| Lenovo Ideapad Gaming 3 15IHU-82K1002RGE | |
| Dell G15 5510-43NHT | |
Sistem performansı
Sistem performansı açısından, 17 inçlik dizüstü bilgisayar, rekabetin ortasında rahatça oturuyor. PCMark 10'daki 5,442 puan sağlam bir sonuç ve tahmini fiyat için kesinlikle yeterli.
CrossMark: Overall | Productivity | Creativity | Responsiveness
| PCMark 10 / Score | |
| Sınıf ortalaması Gaming (5828 - 12414, n=93, son 2 yıl) | |
| HP Victus 16-e0145ng | |
| Lenovo Ideapad Gaming 3 15IHU-82K1002RGE | |
| Ortalama Intel Core i5-11300H, NVIDIA GeForce RTX 3050 Ti Laptop GPU (5442 - 5641, n=2) | |
| HP Pavilion Gaming 17-cd2146ng | |
| HP Pavilion Gaming 17-cd0085cl | |
| Dell G15 5510-43NHT | |
| PCMark 10 / Essentials | |
| Sınıf ortalaması Gaming (8810 - 11935, n=97, son 2 yıl) | |
| HP Victus 16-e0145ng | |
| HP Pavilion Gaming 17-cd0085cl | |
| HP Pavilion Gaming 17-cd2146ng | |
| Ortalama Intel Core i5-11300H, NVIDIA GeForce RTX 3050 Ti Laptop GPU (8524 - 8829, n=2) | |
| Lenovo Ideapad Gaming 3 15IHU-82K1002RGE | |
| Dell G15 5510-43NHT | |
| PCMark 10 / Productivity | |
| Sınıf ortalaması Gaming (6845 - 25323, n=95, son 2 yıl) | |
| Lenovo Ideapad Gaming 3 15IHU-82K1002RGE | |
| Ortalama Intel Core i5-11300H, NVIDIA GeForce RTX 3050 Ti Laptop GPU (7664 - 9112, n=2) | |
| HP Victus 16-e0145ng | |
| HP Pavilion Gaming 17-cd2146ng | |
| HP Pavilion Gaming 17-cd0085cl | |
| Dell G15 5510-43NHT | |
| PCMark 10 / Digital Content Creation | |
| Sınıf ortalaması Gaming (7602 - 19954, n=95, son 2 yıl) | |
| HP Victus 16-e0145ng | |
| HP Pavilion Gaming 17-cd0085cl | |
| HP Pavilion Gaming 17-cd2146ng | |
| Ortalama Intel Core i5-11300H, NVIDIA GeForce RTX 3050 Ti Laptop GPU (6271 - 6462, n=2) | |
| Lenovo Ideapad Gaming 3 15IHU-82K1002RGE | |
| Dell G15 5510-43NHT | |
| CrossMark / Overall | |
| Sınıf ortalaması Gaming (1366 - 2409, n=94, son 2 yıl) | |
| Lenovo Ideapad Gaming 3 15IHU-82K1002RGE | |
| Ortalama Intel Core i5-11300H, NVIDIA GeForce RTX 3050 Ti Laptop GPU (n=1) | |
| CrossMark / Productivity | |
| Sınıf ortalaması Gaming (1386 - 2254, n=94, son 2 yıl) | |
| Lenovo Ideapad Gaming 3 15IHU-82K1002RGE | |
| Ortalama Intel Core i5-11300H, NVIDIA GeForce RTX 3050 Ti Laptop GPU (n=1) | |
| CrossMark / Creativity | |
| Sınıf ortalaması Gaming (1343 - 2786, n=94, son 2 yıl) | |
| Lenovo Ideapad Gaming 3 15IHU-82K1002RGE | |
| Ortalama Intel Core i5-11300H, NVIDIA GeForce RTX 3050 Ti Laptop GPU (n=1) | |
| CrossMark / Responsiveness | |
| Sınıf ortalaması Gaming (1226 - 2334, n=94, son 2 yıl) | |
| Lenovo Ideapad Gaming 3 15IHU-82K1002RGE | |
| Ortalama Intel Core i5-11300H, NVIDIA GeForce RTX 3050 Ti Laptop GPU (n=1) | |
| PCMark 10 Score | 5442 puan | |
Yardım | ||
| AIDA64 / Memory Copy | |
| Sınıf ortalaması Gaming (21750 - 129946, n=102, son 2 yıl) | |
| HP Victus 16-e0145ng | |
| Ortalama Intel Core i5-11300H (19947 - 60141, n=9) | |
| HP Pavilion Gaming 17-cd2146ng | |
| Lenovo Ideapad Gaming 3 15IHU-82K1002RGE | |
| Dell G15 5510-43NHT | |
| AIDA64 / Memory Read | |
| Sınıf ortalaması Gaming (22956 - 118858, n=102, son 2 yıl) | |
| HP Victus 16-e0145ng | |
| Ortalama Intel Core i5-11300H (22688 - 62684, n=9) | |
| HP Pavilion Gaming 17-cd2146ng | |
| Lenovo Ideapad Gaming 3 15IHU-82K1002RGE | |
| Dell G15 5510-43NHT | |
| AIDA64 / Memory Write | |
| Sınıf ortalaması Gaming (22297 - 135096, n=102, son 2 yıl) | |
| HP Victus 16-e0145ng | |
| Ortalama Intel Core i5-11300H (20959 - 65245, n=9) | |
| HP Pavilion Gaming 17-cd2146ng | |
| Lenovo Ideapad Gaming 3 15IHU-82K1002RGE | |
| Dell G15 5510-43NHT | |
| AIDA64 / Memory Latency | |
| Sınıf ortalaması Gaming (75.3 - 165.4, n=102, son 2 yıl) | |
| Lenovo Ideapad Gaming 3 15IHU-82K1002RGE | |
| HP Pavilion Gaming 17-cd2146ng | |
| Ortalama Intel Core i5-11300H (76.3 - 93.6, n=9) | |
| HP Victus 16-e0145ng | |
| Dell G15 5510-43NHT | |
* ... daha küçük daha iyidir
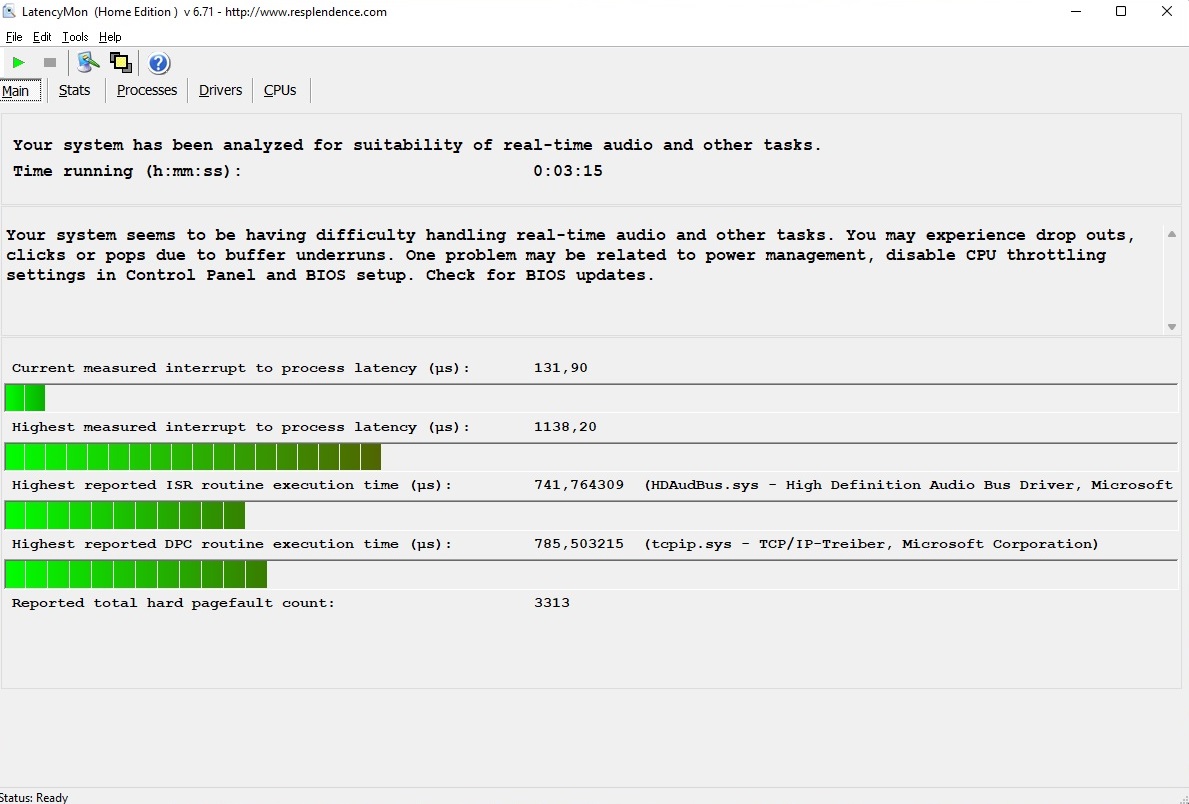
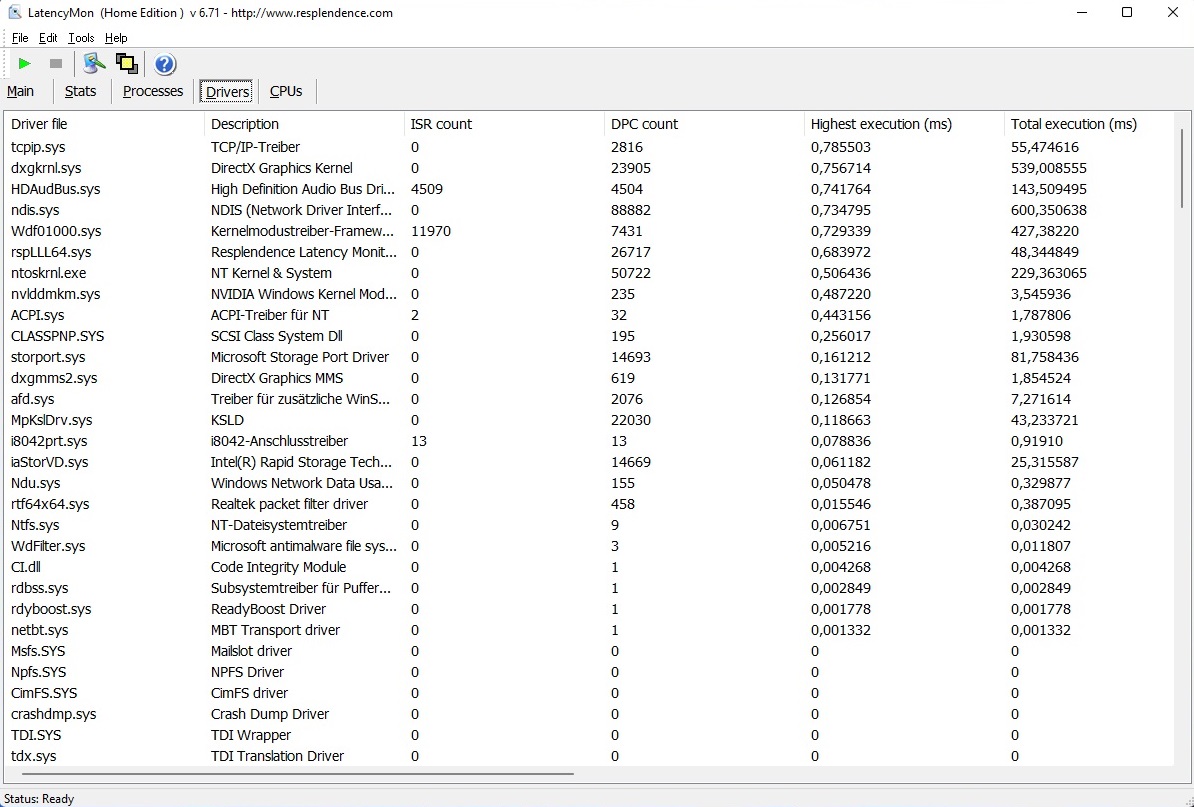
DPC gecikmeleri
Gecikmeler söz konusu olduğunda işler tamamen optimal değildir. Diğer birçok dizüstü bilgisayar gibi, Pavilion Gaming 17 de LatencyMon aracına göre gerçek zamanlı ses ve video düzenleme için özellikle uygun değil.
| DPC Latencies / LatencyMon - interrupt to process latency (max), Web, Youtube, Prime95 | |
| Dell G15 5510-43NHT | |
| HP Pavilion Gaming 17-cd2146ng | |
| Lenovo Ideapad Gaming 3 15IHU-82K1002RGE | |
| HP Victus 16-e0145ng | |
* ... daha küçük daha iyidir
Depolama
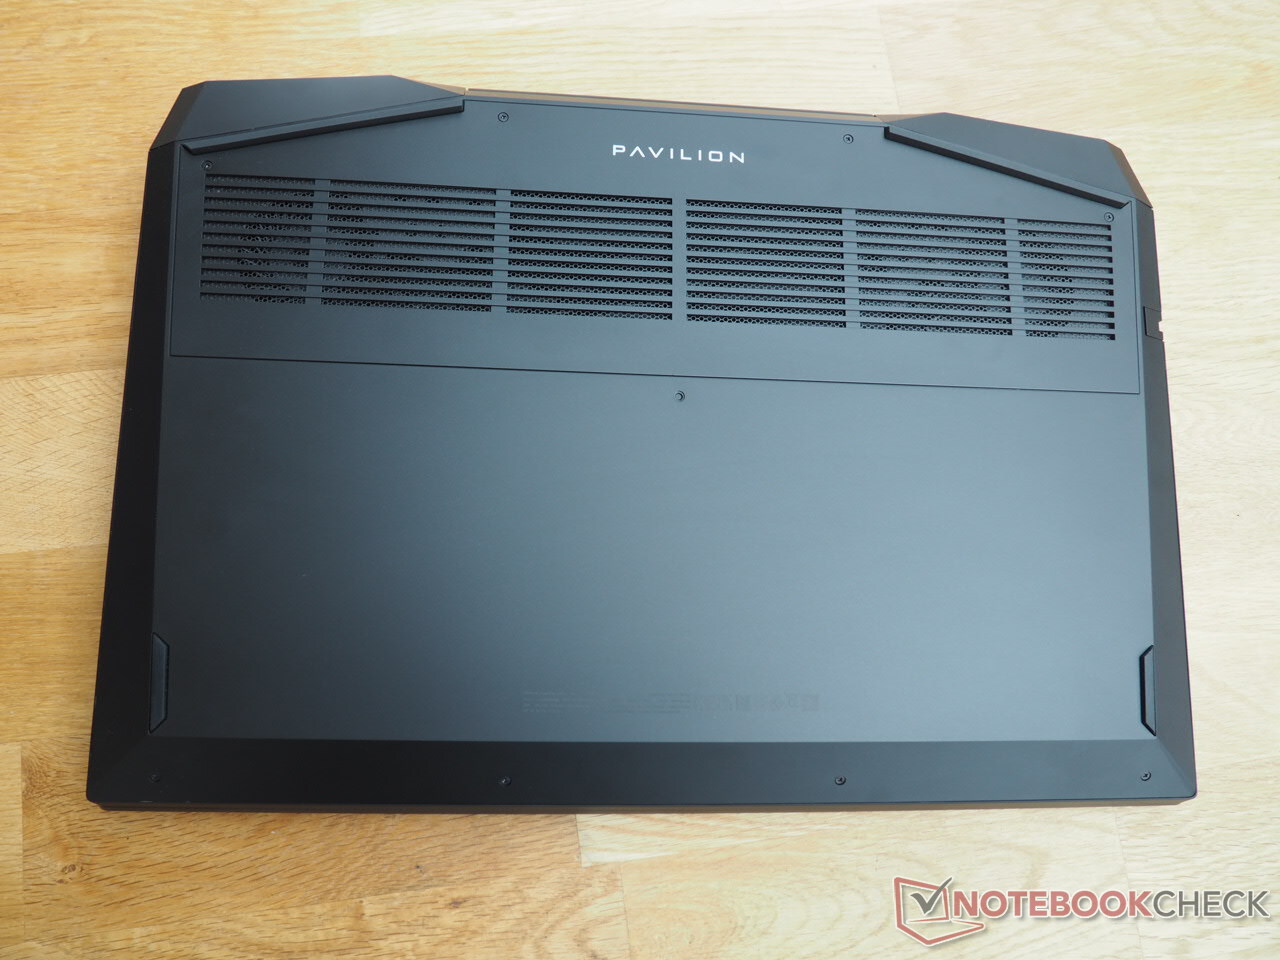
Hızlı depolama cihazı olumlu bir şekilde vurgulanmalıdır. HP, inceleme modelimizi SK Hynix'ten (BC711) 512 GB PCIe sürücüsü (M.2 2280) ile donattı ve bu, yalnızca HP Victus 16'nın başarabileceği bir şey olan 2.500 MB/sn'nin üzerinde sıralı okuma ve yazma hızlarına ulaşıyor. Can sıkıcı: Ne yazık ki, bir "HDD kuklası" içeren mevcut 2,5 inçlik yuva, entegre uygun bir kablo olmadığından kullanılamaz.

| Drive Performance rating - Percent | |
| Sınıf ortalaması Gaming | |
| HP Pavilion Gaming 17-cd2146ng | |
| HP Victus 16-e0145ng | |
| Ortalama SK Hynix BC711 512GB HFM512GD3GX013N | |
| HP Pavilion Gaming 17-cd0085cl -8! | |
| Lenovo Ideapad Gaming 3 15IHU-82K1002RGE | |
| Dell G15 5510-43NHT | |
* ... daha küçük daha iyidir
Continuous load read: DiskSpd Read Loop, Queue Depth 8
Ekran kartı
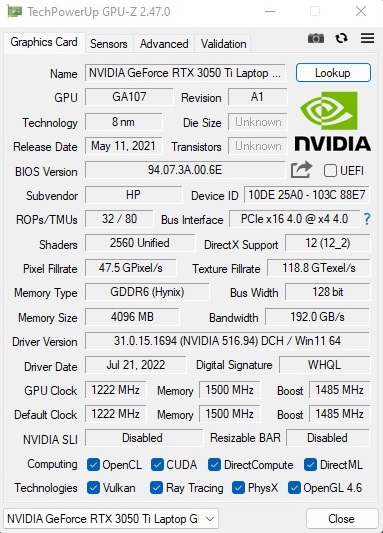
Nvidia'dan GeForce RTX 3050 Ti, her yeni oyunu maksimum ayrıntılarla oynamak istemeyen sıradan oyuncular için ideal bir grafik kartıdır. 8 nm modeli, en son Amper mimarisine dayanmaktadır ve 2.560 gölgelendirici birimi ile donatılmıştır. Nvidia yongalarının performansı, dizüstü bilgisayar üreticilerinin belirli bir aralıkta özgürce seçebilecekleri belirtilen TGP'ye çok bağlıdır. Bu durumda HP, RTX 3050 Ti için orta seviyeye karşılık gelen 60 watt'ı seçti. Yine de Pavilion Gaming 17, GPU devresinde 3050 Ti ortalamasına kıyasla biraz daha iyi performans gösteriyor.
| 3DMark Performance rating - Percent | |
| Sınıf ortalaması Gaming | |
| HP Pavilion Gaming 17-cd2146ng | |
| HP Victus 16-e0145ng | |
| HP Pavilion Gaming 17-cd0085cl | |
| Lenovo Ideapad Gaming 3 15IHU-82K1002RGE | |
| Dell G15 5510-43NHT | |
| Ortalama NVIDIA GeForce RTX 3050 Ti Laptop GPU | |
| 3DMark 11 - 1280x720 Performance GPU | |
| Sınıf ortalaması Gaming (21841 - 80022, n=103, son 2 yıl) | |
| Dell G15 5510-43NHT | |
| Lenovo Ideapad Gaming 3 15IHU-82K1002RGE | |
| HP Victus 16-e0145ng | |
| HP Pavilion Gaming 17-cd2146ng | |
| Ortalama NVIDIA GeForce RTX 3050 Ti Laptop GPU (7952 - 20905, n=27) | |
| HP Pavilion Gaming 17-cd0085cl | |
| 3DMark | |
| 1280x720 Cloud Gate Standard Graphics | |
| Sınıf ortalaması Gaming (86886 - 223650, n=60, son 2 yıl) | |
| HP Pavilion Gaming 17-cd0085cl | |
| HP Pavilion Gaming 17-cd2146ng | |
| HP Victus 16-e0145ng | |
| Ortalama NVIDIA GeForce RTX 3050 Ti Laptop GPU (30158 - 102432, n=23) | |
| Lenovo Ideapad Gaming 3 15IHU-82K1002RGE | |
| Dell G15 5510-43NHT | |
| 1920x1080 Fire Strike Graphics | |
| Sınıf ortalaması Gaming (18629 - 62849, n=112, son 2 yıl) | |
| Dell G15 5510-43NHT | |
| HP Victus 16-e0145ng | |
| Lenovo Ideapad Gaming 3 15IHU-82K1002RGE | |
| HP Pavilion Gaming 17-cd2146ng | |
| HP Pavilion Gaming 17-cd0085cl | |
| Ortalama NVIDIA GeForce RTX 3050 Ti Laptop GPU (7917 - 15611, n=26) | |
| 2560x1440 Time Spy Graphics | |
| Sınıf ortalaması Gaming (6387 - 26212, n=112, son 2 yıl) | |
| Dell G15 5510-43NHT | |
| HP Victus 16-e0145ng | |
| Lenovo Ideapad Gaming 3 15IHU-82K1002RGE | |
| Ortalama NVIDIA GeForce RTX 3050 Ti Laptop GPU (3744 - 6122, n=27) | |
| HP Pavilion Gaming 17-cd2146ng | |
| HP Pavilion Gaming 17-cd0085cl | |
| 3DMark 11 Performance | 15245 puan | |
| 3DMark Ice Storm Standard Score | 98555 puan | |
| 3DMark Cloud Gate Standard Score | 26005 puan | |
| 3DMark Fire Strike Score | 11649 puan | |
| 3DMark Time Spy Score | 5155 puan | |
Yardım | ||
Oyun performansı
Doğal 1920x1080 piksele bağlı kaldığınız ve yüksek çözünürlüklü harici bir ekran bağlamadığınız sürece, RTX 3050 Ti sağlam bir 3D performansı sunar. God of War gibi çok zorlu veya orta derecede optimize edilmiş oyunların yanı sıra , 144 Hz'den genellikle tam olarak yararlanılmaktan uzak olsa da, mevcut oyunların çoğu maksimum ayarlarda bile sorunsuz çalışır. GPU, özellikle F1 22'de gösterilen ışın izlemedeki zayıflıkları ortaya koyuyor . 4 GB VRAM da uzun vadede ideal değil. Belli bir dereceye kadar geleceğe dönük koruma arıyorsanız, en az 6 veya tercihen 8 GB VRAM'e sahip bir grafik kartı satın almalısınız.
| The Witcher 3 | |
| 1920x1080 High Graphics & Postprocessing (Nvidia HairWorks Off) | |
| Sınıf ortalaması Gaming (341 - 404, n=2, son 2 yıl) | |
| HP Victus 16-e0145ng | |
| HP Pavilion Gaming 17-cd2146ng | |
| HP Pavilion Gaming 17-cd0085cl | |
| Lenovo Ideapad Gaming 3 15IHU-82K1002RGE | |
| Ortalama NVIDIA GeForce RTX 3050 Ti Laptop GPU (30 - 110, n=26) | |
| Dell G15 5510-43NHT | |
| 1920x1080 Ultra Graphics & Postprocessing (HBAO+) | |
| Sınıf ortalaması Gaming (104.7 - 240, n=7, son 2 yıl) | |
| HP Victus 16-e0145ng | |
| Dell G15 5510-43NHT | |
| HP Pavilion Gaming 17-cd2146ng | |
| HP Pavilion Gaming 17-cd0085cl | |
| Ortalama NVIDIA GeForce RTX 3050 Ti Laptop GPU (19 - 58.5, n=29) | |
| Lenovo Ideapad Gaming 3 15IHU-82K1002RGE | |
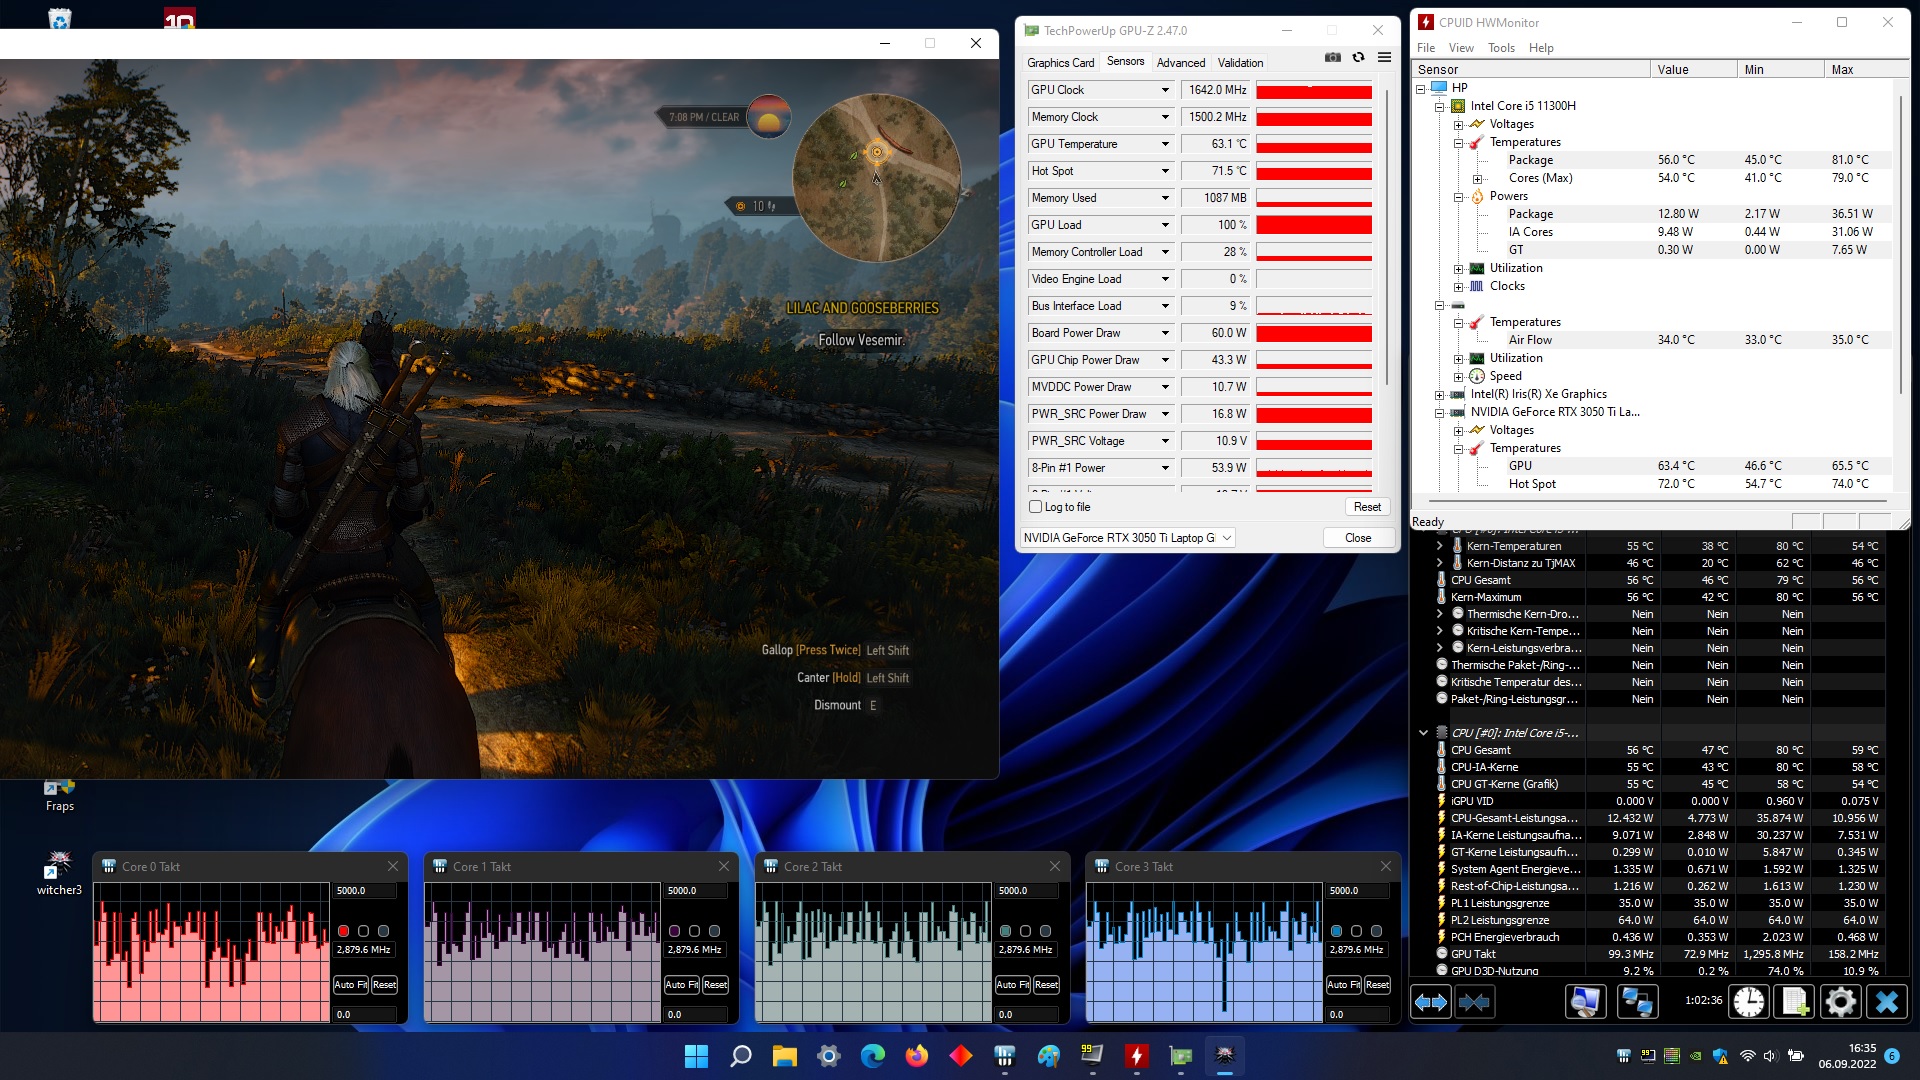
Dayanıklılık testimizde (bir saatlik The Witcher 3). herhangi bir düzensizlik olmadı. Kare hızı, tüm zaman aralığı boyunca oldukça sabit kaldı.
The Witcher 3 FPS diagram
| düşük | orta | yüksek | ultra | |
|---|---|---|---|---|
| GTA V (2015) | 156.1 | 119.9 | 66.9 | |
| The Witcher 3 (2015) | 170 | 94.4 | 51.4 | |
| Dota 2 Reborn (2015) | 119.7 | 108.5 | 104.8 | 100.7 |
| Final Fantasy XV Benchmark (2018) | 76 | 53.3 | ||
| X-Plane 11.11 (2018) | 87.5 | 75.3 | 64.3 | |
| Strange Brigade (2018) | 132.8 | 105.8 | 90.3 | |
| God of War (2022) | 60.7 | 48.6 | 30.6 | |
| Rainbow Six Extraction (2022) | 112 | 108 | 83 | |
| Dying Light 2 (2022) | 46.7 | 38.8 | ||
| Elden Ring (2022) | 55.4 | 53.8 | 52.7 | |
| Elex 2 (2022) | 52.2 | 50.9 | 46.1 | |
| F1 22 (2022) | 132 | 93 | 28 | |
| The Quarry (2022) | 63.1 | 51.5 | 39.7 |
Emisyonlar
Gürültü emisyonları
Core i7-9750H ve GeForce GTX 1660 Ti Max-Q ile selefine baktığımızda , özellikle düşük gürültü gelişimini övdük. Yeni Pavilion Gaming 17 hala daha sessiz oyun dizüstü bilgisayarlarından biri olsa da, 17 inçlik artık gerçekten sessiz değil. Yük altında 34 ila 44 dB(A) yerine 39 ila 46 dB(A) ölçtük, bu açıkça duyulabilir, ancak rahatsız edici değil. Öte yandan, fanlar hiçbir zaman tamamen kapanmasa da, cihaz boşta kullanımda 27 ila 30 dB(A) ile hoş bir sessizliğe sahiptir. Ancak, ikincisi BIOS'ta "her zaman açık" seçeneği devre dışı bırakılarak değiştirilebilir. Bu, zaman zaman basit görevler sırasında fanların devre dışı bırakılmasına neden olur.
Ses yüksekliği
| Boşta |
| 27 / 28 / 30 dB |
| Çalışırken |
| 39 / 46 dB |
 | ||
30 dB sessiz 40 dB(A) duyulabilirlik 50 dB(A) gürültülü |
||
min: | ||
| HP Pavilion Gaming 17-cd2146ng i5-11300H, GeForce RTX 3050 Ti Laptop GPU | Dell G15 5510-43NHT i5-10200H, GeForce RTX 3050 Ti Laptop GPU | Lenovo Ideapad Gaming 3 15IHU-82K1002RGE i5-11300H, GeForce RTX 3050 Ti Laptop GPU | HP Victus 16-e0145ng R5 5600H, GeForce RTX 3050 Ti Laptop GPU | HP Pavilion Gaming 17-cd0085cl i7-9750H, GeForce GTX 1660 Ti Max-Q | |
|---|---|---|---|---|---|
| Noise | -2% | 1% | -7% | 1% | |
| kapalı / ortam * (dB) | 25 | 25 -0% | 23.9 4% | 26 -4% | 28.2 -13% |
| Idle Minimum * (dB) | 27 | 25 7% | 23.9 11% | 26 4% | 30.1 -11% |
| Idle Average * (dB) | 28 | 25 11% | 26.8 4% | 28 -0% | 30.1 -8% |
| Idle Maximum * (dB) | 30 | 25 17% | 26.8 11% | 34 -13% | 30.1 -0% |
| Load Average * (dB) | 39 | 52.2 -34% | 43.5 -12% | 44 -13% | 34.2 12% |
| Witcher 3 ultra * (dB) | 44 | 43.5 1% | 48 -9% | 34.2 22% | |
| Load Maximum * (dB) | 46 | 52.2 -13% | 53.1 -15% | 53 -15% | 43.8 5% |
* ... daha küçük daha iyidir
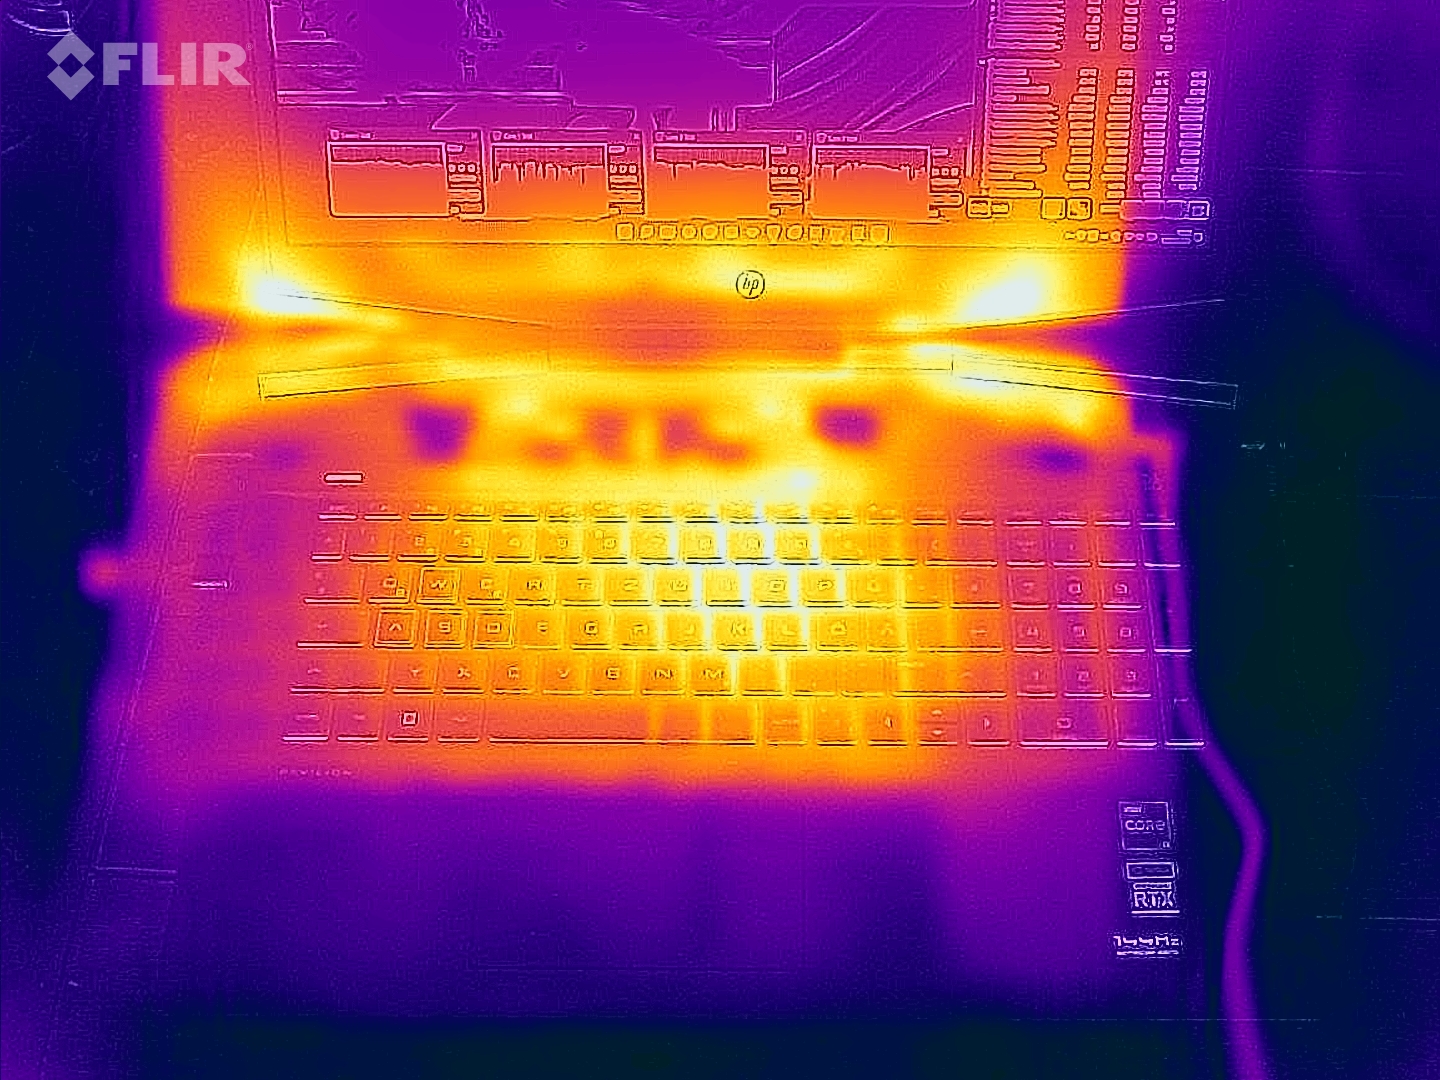
Sıcaklıklar
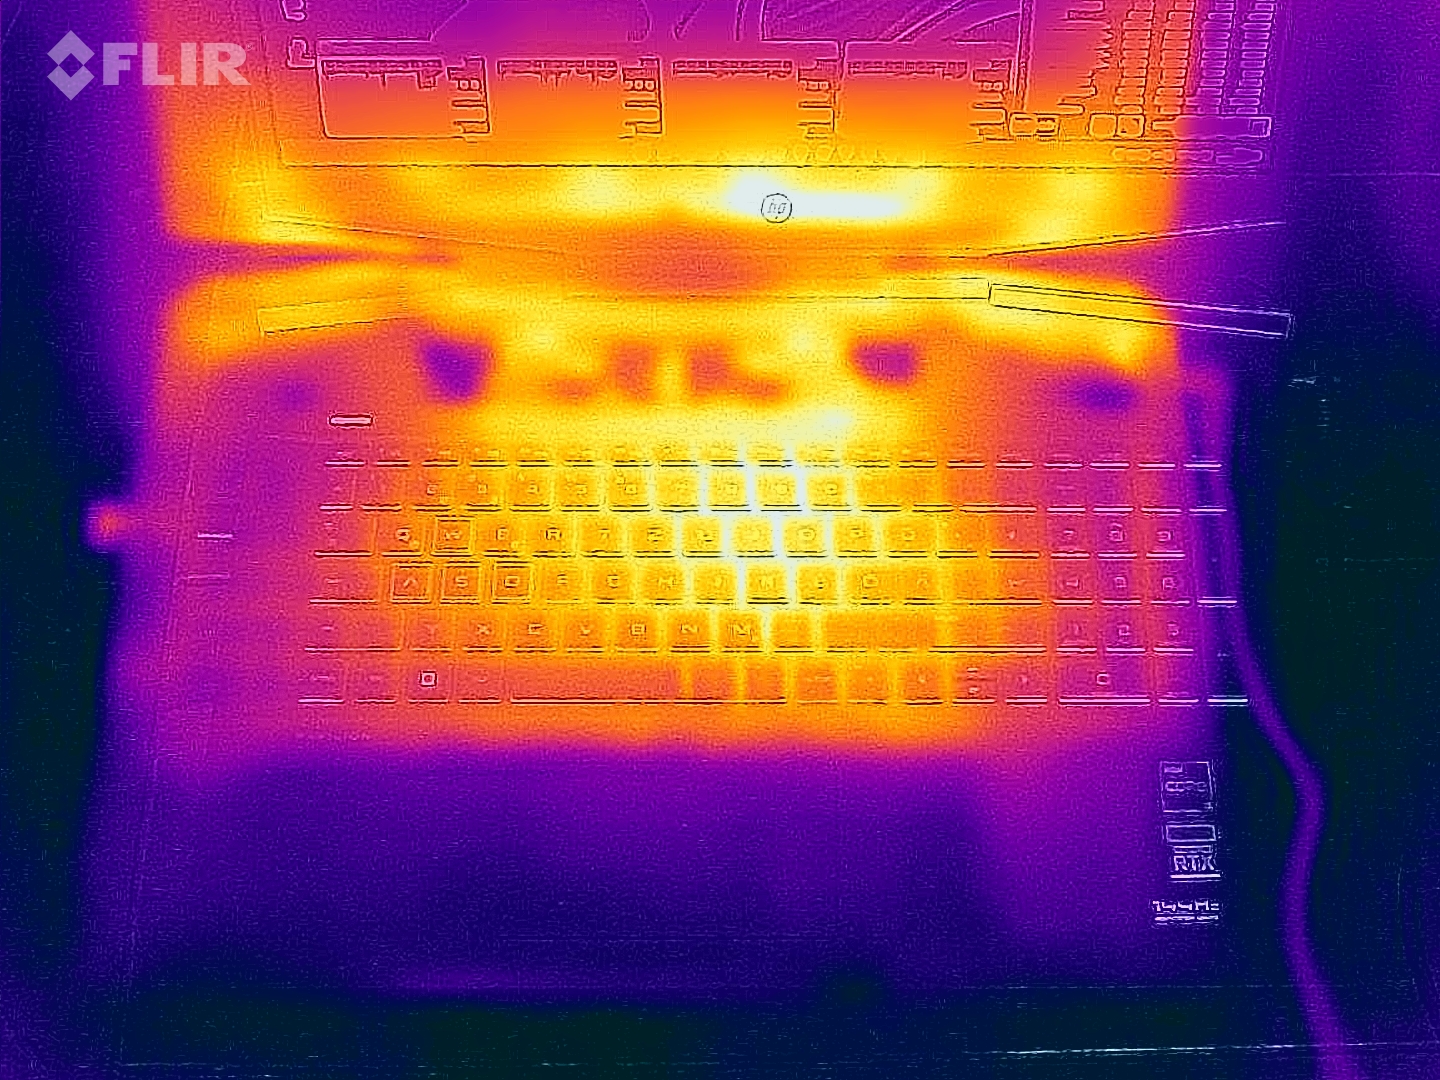
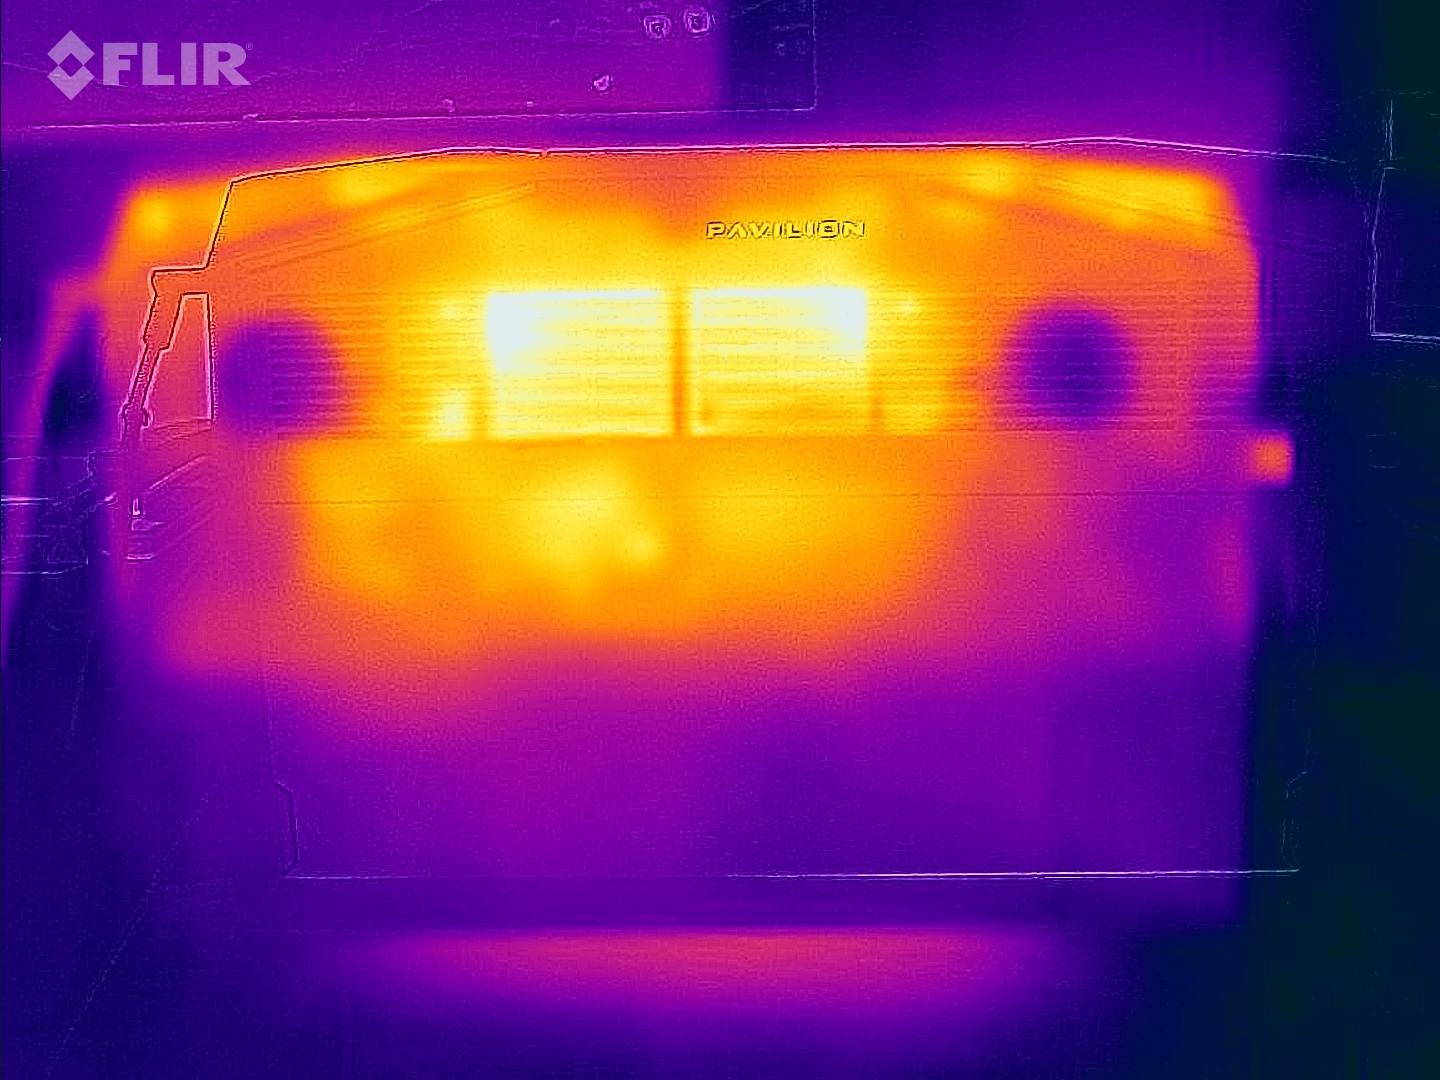
Pavilion Gaming 17'nin ısı gelişimi de olağandışı bir şey göstermiyor. FurMark ve Prime95 araçlarıyla 60 dakikalık stres testinden sonra üstte maksimum 44 °C (~111 °F) ve altta 48 °C (~115 °F) yerleşik donanım için tipiktir. Tüm kasa, boşta kullanımda 30 °C (~86 °F) işaretinin altında kalır ve bu da onu hoş bir şekilde serinletir.
(±) Üst taraftaki maksimum sıcaklık, 40.4 °C / 105 F ortalamasına kıyasla 44 °C / 111 F'dir. , Gaming sınıfı için 21.2 ile 68.8 °C arasında değişir.
(-) Alt kısım, 43.2 °C / 110 F ortalamasına kıyasla maksimum 48 °C / 118 F'ye kadar ısınır
(+) Boşta kullanımda, üst tarafın ortalama sıcaklığı 26.6 °C / 80 F olup, cihazın 33.9 °C / 93 F.
(±) The Witcher 3 oynarken, üst tarafın ortalama sıcaklığı 36.2 °C / 97 F olup, cihazın 33.9 °C / 93 F.
(+) Avuç içi dayanakları ve dokunmatik yüzey maksimum (34 °C / 93.2 F) cilt sıcaklığına ulaşıyor ve bu nedenle sıcak değil.
(-) Benzer cihazların avuç içi dayanağı alanının ortalama sıcaklığı 28.8 °C / 83.8 F (-5.2 °C / -9.4 F) idi.
| HP Pavilion Gaming 17-cd2146ng i5-11300H, GeForce RTX 3050 Ti Laptop GPU | Dell G15 5510-43NHT i5-10200H, GeForce RTX 3050 Ti Laptop GPU | Lenovo Ideapad Gaming 3 15IHU-82K1002RGE i5-11300H, GeForce RTX 3050 Ti Laptop GPU | HP Victus 16-e0145ng R5 5600H, GeForce RTX 3050 Ti Laptop GPU | HP Pavilion Gaming 17-cd0085cl i7-9750H, GeForce GTX 1660 Ti Max-Q | |
|---|---|---|---|---|---|
| Heat | -9% | 3% | -22% | -18% | |
| Maximum Upper Side * (°C) | 44 | 45.9 -4% | 43.2 2% | 54 -23% | 42.6 3% |
| Maximum Bottom * (°C) | 48 | 51.9 -8% | 47.9 -0% | 47 2% | 49 -2% |
| Idle Upper Side * (°C) | 27 | 30.1 -11% | 24.9 8% | 41 -52% | 34 -26% |
| Idle Bottom * (°C) | 27 | 30.1 -11% | 27 -0% | 31 -15% | 39.4 -46% |
* ... daha küçük daha iyidir
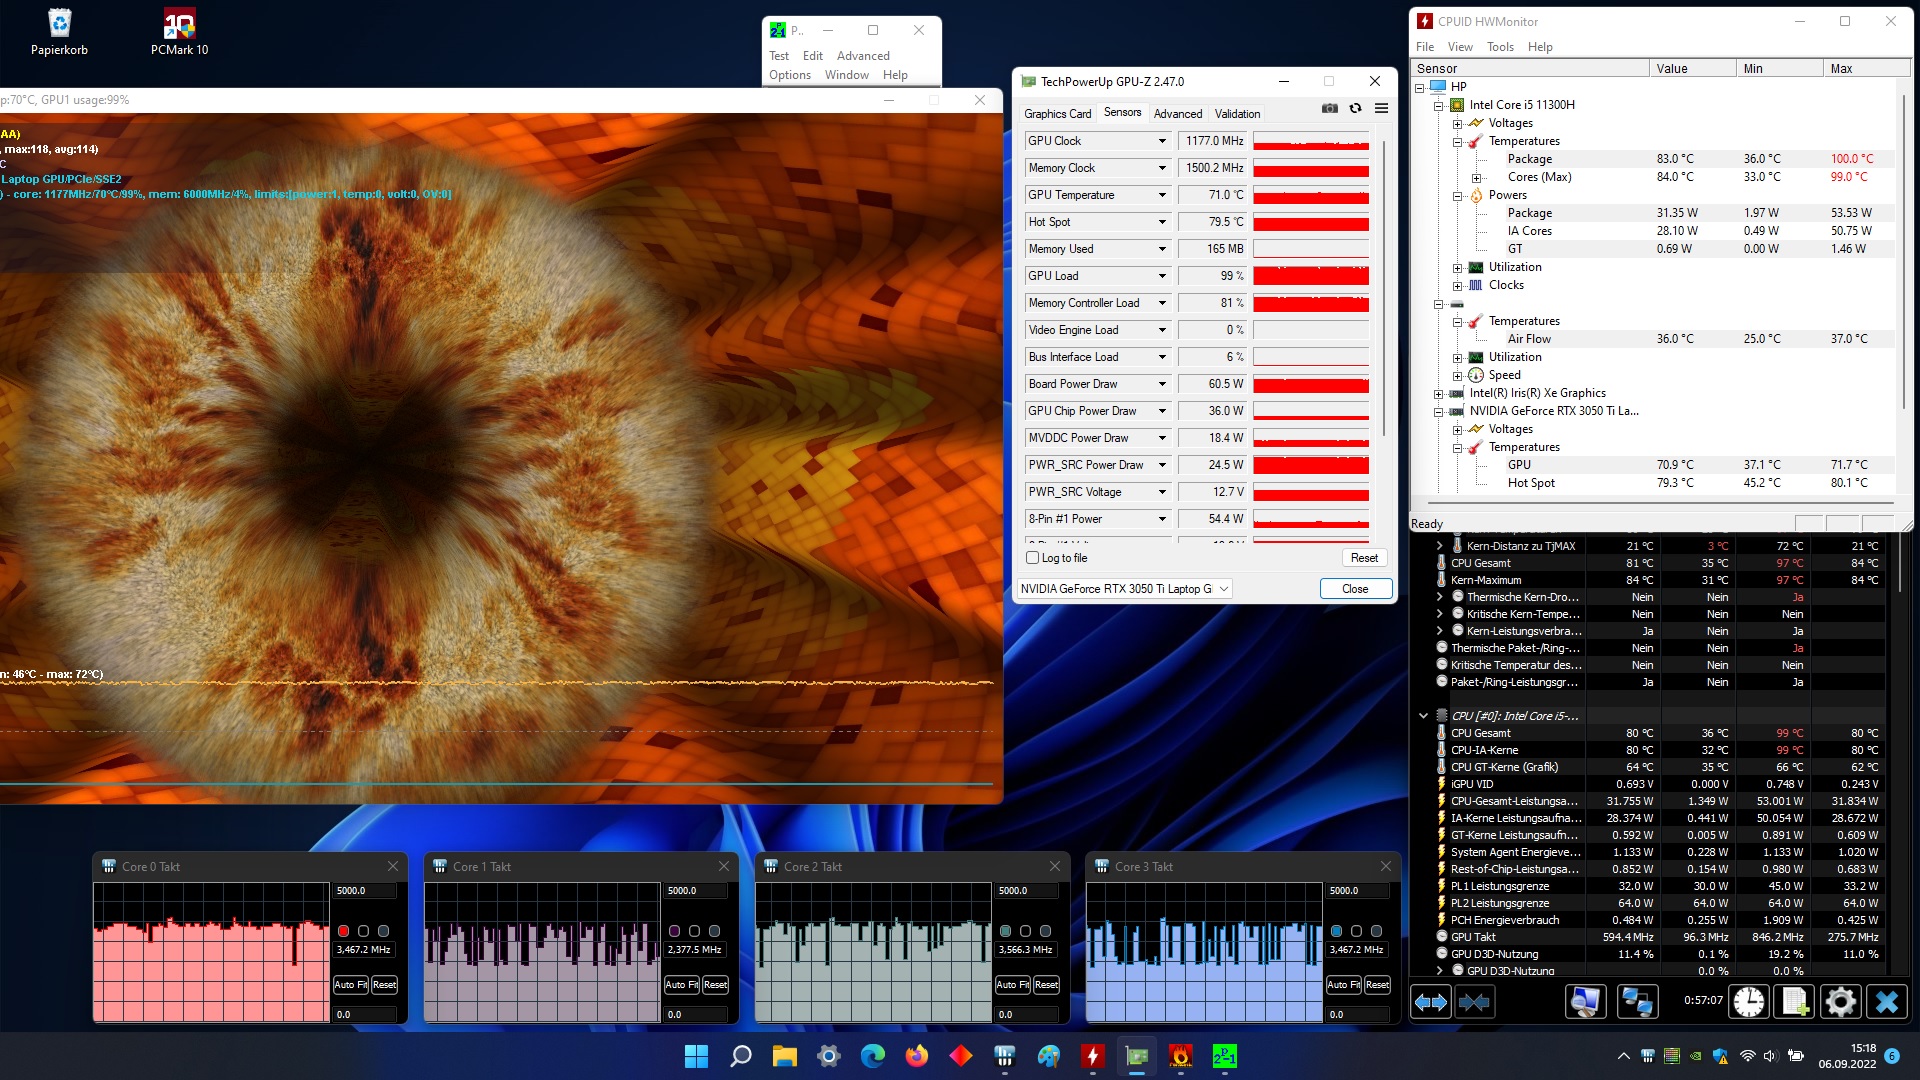
Stres testi
Bileşenler de aşırı ısınmadan zarar görmez. Core i5-11300H, tam yük altında (HWMonitor aracına göre) kısa süreliğine 100 °C'ye (~212 °F) ulaşsa da, bir süre sonra (bir hızda) sıcaklık kabul edilebilir bir 83 °C'ye (~181 °F) düşer. iyi saat hızı). GeForce RTX 3050 Ti, aynı zamanda kabul edilebilir ve zararsız bir değer olan 71 °C (~160 °F) ortalama sıcaklığa ulaşır.
Hoparlörler
HP Pavilion Gaming 17-cd2146ng ses analizi
(±) | hoparlör ses yüksekliği ortalama ama iyi (80 dB)
Bas 100 - 315Hz
(-) | neredeyse hiç bas yok - ortalama olarak medyandan 19.5% daha düşük
(±) | Bas doğrusallığı ortalamadır (11.5% delta - önceki frekans)
Ortalar 400 - 2000 Hz
(+) | dengeli ortalar - medyandan yalnızca 3.2% uzakta
(+) | orta frekanslar doğrusaldır (3.8% deltadan önceki frekansa)
Yüksekler 2 - 16 kHz
(±) | daha yüksek en yüksekler - ortalama olarak medyandan 8.6% daha yüksek
(±) | Yükseklerin doğrusallığı ortalamadır (8% delta - önceki frekans)
Toplam 100 - 16.000 Hz
(±) | Genel sesin doğrusallığı ortalamadır (20.5% ortancaya göre fark)
Aynı sınıfla karşılaştırıldığında
» Bu sınıftaki tüm test edilen cihazların %73%'si daha iyi, 5% benzer, 22% daha kötüydü
» En iyisinin deltası 6% idi, ortalama 18% idi, en kötüsü 132% idi
Test edilen tüm cihazlarla karşılaştırıldığında
» Test edilen tüm cihazların %54'si daha iyi, 8 benzer, % 38 daha kötüydü
» En iyisinin deltası 4% idi, ortalama 23% idi, en kötüsü 134% idi
HP Victus 16-e0145ng ses analizi
(±) | hoparlör ses yüksekliği ortalama ama iyi (79 dB)
Bas 100 - 315Hz
(-) | neredeyse hiç bas yok - ortalama olarak medyandan 21% daha düşük
(±) | Bas doğrusallığı ortalamadır (12.6% delta - önceki frekans)
Ortalar 400 - 2000 Hz
(+) | dengeli ortalar - medyandan yalnızca 1.1% uzakta
(+) | orta frekanslar doğrusaldır (3.6% deltadan önceki frekansa)
Yüksekler 2 - 16 kHz
(+) | dengeli yüksekler - medyandan yalnızca 4.2% uzakta
(+) | yüksekler doğrusaldır (5.3% deltadan önceki frekansa)
Toplam 100 - 16.000 Hz
(±) | Genel sesin doğrusallığı ortalamadır (16.2% ortancaya göre fark)
Aynı sınıfla karşılaştırıldığında
» Bu sınıftaki tüm test edilen cihazların %40%'si daha iyi, 7% benzer, 53% daha kötüydü
» En iyisinin deltası 6% idi, ortalama 18% idi, en kötüsü 132% idi
Test edilen tüm cihazlarla karşılaştırıldığında
» Test edilen tüm cihazların %26'si daha iyi, 6 benzer, % 68 daha kötüydü
» En iyisinin deltası 4% idi, ortalama 23% idi, en kötüsü 134% idi
Enerji yönetimi
| Kapalı / Bekleme modu | |
| Boşta | |
| Çalışırken |
|
Key:
min: | |
| HP Pavilion Gaming 17-cd2146ng i5-11300H, GeForce RTX 3050 Ti Laptop GPU | Dell G15 5510-43NHT i5-10200H, GeForce RTX 3050 Ti Laptop GPU | Lenovo Ideapad Gaming 3 15IHU-82K1002RGE i5-11300H, GeForce RTX 3050 Ti Laptop GPU | HP Victus 16-e0145ng R5 5600H, GeForce RTX 3050 Ti Laptop GPU | HP Pavilion Gaming 17-cd0085cl i7-9750H, GeForce GTX 1660 Ti Max-Q | Sınıf ortalaması Gaming | |
|---|---|---|---|---|---|---|
| Power Consumption | -13% | -4% | -28% | -12% | -112% | |
| Idle Minimum * (Watt) | 3 | 4.6 -53% | 4.9 -63% | 7 -133% | 5.4 -80% | 13.1 ? -337% |
| Idle Average * (Watt) | 8 | 6.5 19% | 8.3 -4% | 9 -13% | 9.2 -15% | 19 ? -138% |
| Idle Maximum * (Watt) | 28 | 10.1 64% | 8.9 68% | 15 46% | 13 54% | 24.6 ? 12% |
| Load Average * (Watt) | 88 | 129 -47% | 81 8% | 93 -6% | 85.9 2% | 111.3 ? -26% |
| Witcher 3 ultra * (Watt) | 98.2 | 129 -31% | 119 -21% | 134.5 -37% | 107.9 -10% | |
| Load Maximum * (Watt) | 152 | 195 -28% | 172 -13% | 185 -22% | 182.2 -20% | 260 ? -71% |
* ... daha küçük daha iyidir
Witcher 3 enerji tüketimi The Witcher 3 / stress test
Harici bir monitörle enerji tüketimi
Pil ömrü
HP'nin daha büyük bir pil yerine 2,5 inçlik bir yuva takma kararını tam olarak anlamıyoruz. 52,5 Wh oldukça mütevazı, bu da pil çalışma sürelerinde fark edilir hale geliyor. Orta parlaklıkta Wi-Fi üzerinden 5 saatin biraz altında internette gezinmek artık günümüzde kutlama yapmak için bir neden değil. Burada rekabet biraz önde.
| HP Pavilion Gaming 17-cd2146ng i5-11300H, GeForce RTX 3050 Ti Laptop GPU, 52.5 Wh | Dell G15 5510-43NHT i5-10200H, GeForce RTX 3050 Ti Laptop GPU, 56 Wh | Lenovo Ideapad Gaming 3 15IHU-82K1002RGE i5-11300H, GeForce RTX 3050 Ti Laptop GPU, 45 Wh | HP Victus 16-e0145ng R5 5600H, GeForce RTX 3050 Ti Laptop GPU, 70 Wh | HP Pavilion Gaming 17-cd0085cl i7-9750H, GeForce GTX 1660 Ti Max-Q, 52.5 Wh | Sınıf ortalaması Gaming | |
|---|---|---|---|---|---|---|
| Pil Çalışma Süresi | 26% | 32% | 42% | 14% | 42% | |
| WiFi v1.3 (h) | 5 | 6.3 26% | 6.6 32% | 7.1 42% | 5.7 14% | 7.08 ? 42% |
| H.264 (h) | 8.6 | 7.7 | 8.27 ? | |||
| Load (h) | 1.1 | 1.1 | 1 | 1.496 ? | ||
| Reader / Idle (h) | 11.6 | 7.84 ? |
Artılar
Eksiler
Son Görüş
HP, Pavilion Gaming 17-cd2146ng ile oyun oynamak için uygun fiyatlı bir dizüstü bilgisayar sunuyor.
Çoğu rakibin aksine, 17 inç dizüstü bilgisayar, kontrast veya renk alanı içermeyen şaşırtıcı derecede iyi bir ekrana sahip. Parlaklık ve tepki süreleri de nispeten iyi.
17 inçlik, giriş cihazları, kasa, bağlantı noktaları, emisyonlar veya ses kalitesi fark etmeksizin diğer kategorilerdeki kalabalığın arasından olumlu veya olumsuz bir şekilde öne çıkmıyor.
Sonuç olarak, Pavilion Gaming 17'yi satın almakla yanlış yapmış olmazsınız. 1.000 Euro'nun (~ 1,002 $) altında olan cihaz, fiyat bilincine sahip oyuncular için çok çekici ve tavsiye edilebilir bir seçenek.
Fiyat ve Stok Durumu
Yazma sırasında, inceleme yapılandırmamız Amerika Birleşik Devletleri'nde mevcut görünmüyor. Yine de, Amazon'a göz kulak olabilir ve cihazın burada açılıp açılmadığını görebilirsiniz.
HP Pavilion Gaming 17-cd2146ng
- 09/10/2022 v7 (old)
Florian Glaser
Price comparison

