İnceleme: AMD Trinity ve FX masaüstü işlemciler

Daha çok akıllı cihaz, tablet ve notebooklar gibi mobil cihazlara odaklansak da bu testimizde AMD'nin mevcut işlemci serilerine bakıyor olacağız. Özellikle Trinity-APUs A4-5300, A8-5600K, ve A10-5800K işlemcileri Intel serisi işlemcilerle kıyaslıyacağız.
İşlemcilerin performanslarının yanısıra dahili grafik kartı çözümlerinin performanslarına da göz atarken, mevcut oyunları çalıştırma kapasitelerine de değineceğiz.
Test sistemi
Test sistemimizde kullanılan işlemcileri ve diğer parçaları aşağıda görebilirsiniz:
- AMD işlemciler: FX-8350, A10-5800K, A8-5600K, A4-5300
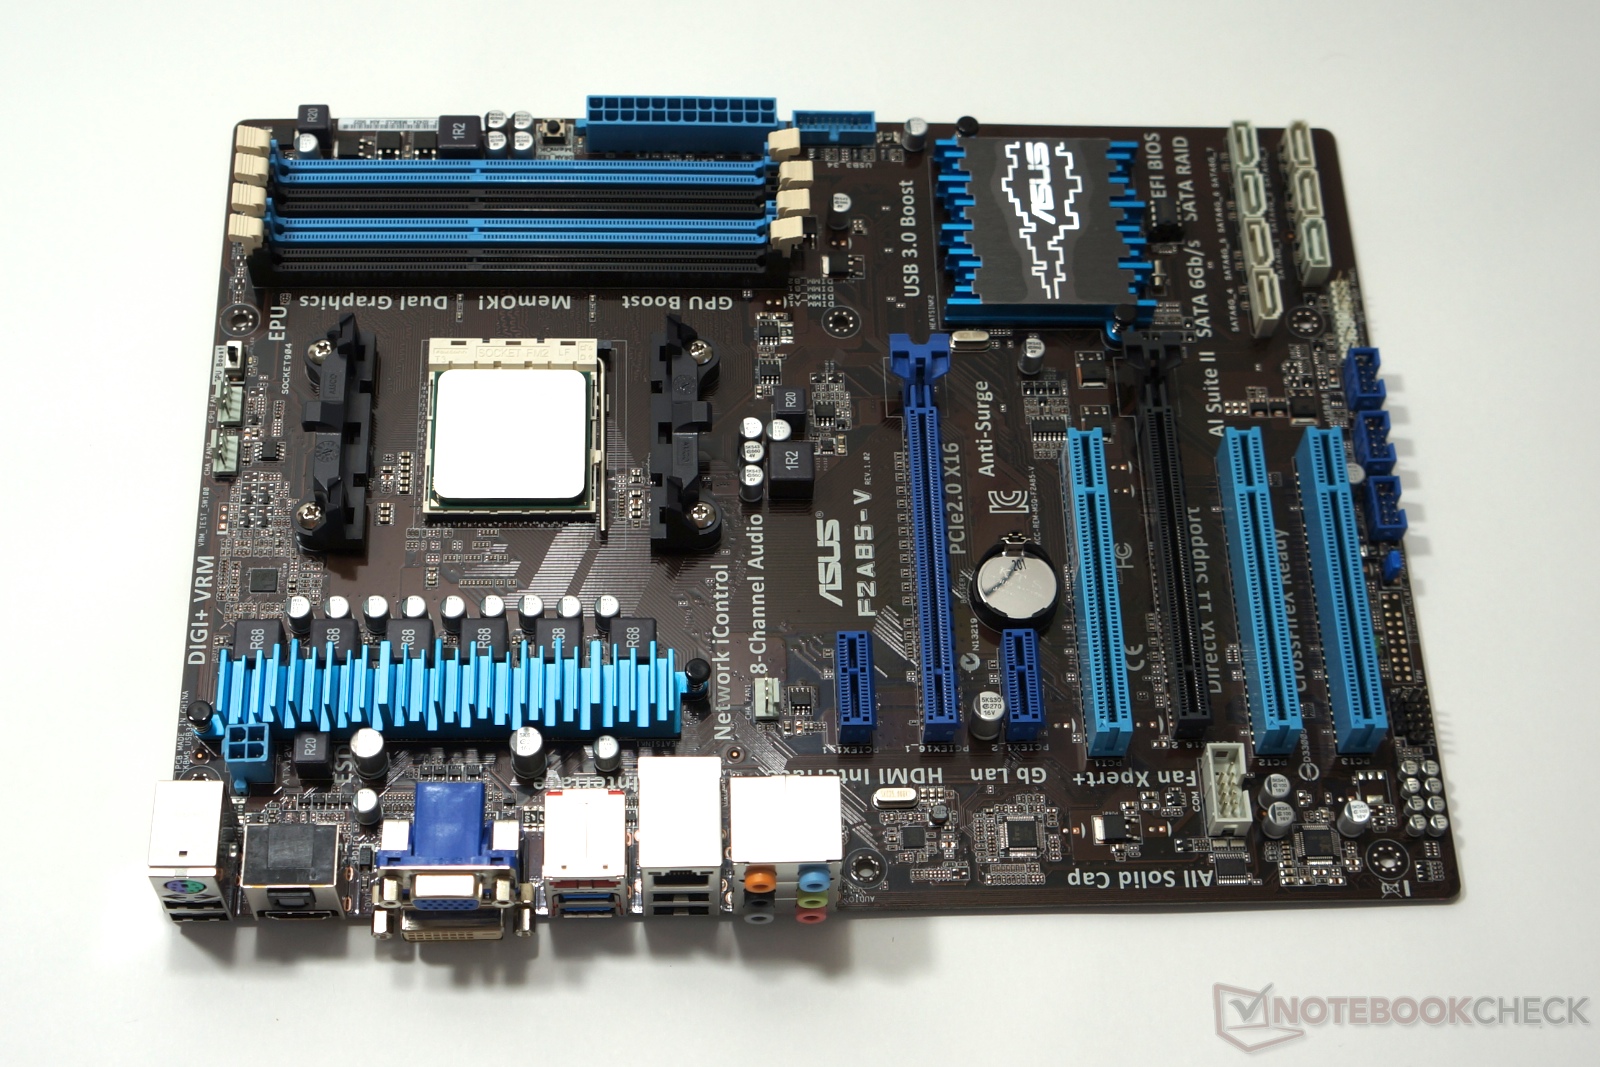
- AMD anakartlar: Asus F2A85-V (FM2), M5A97 Evo (AM3+, BIOS 1006)
- Intel işlemciler: Core i7-3770K, Core i5-3550, Core i5-3470 Core i3-3220, Pentium G860
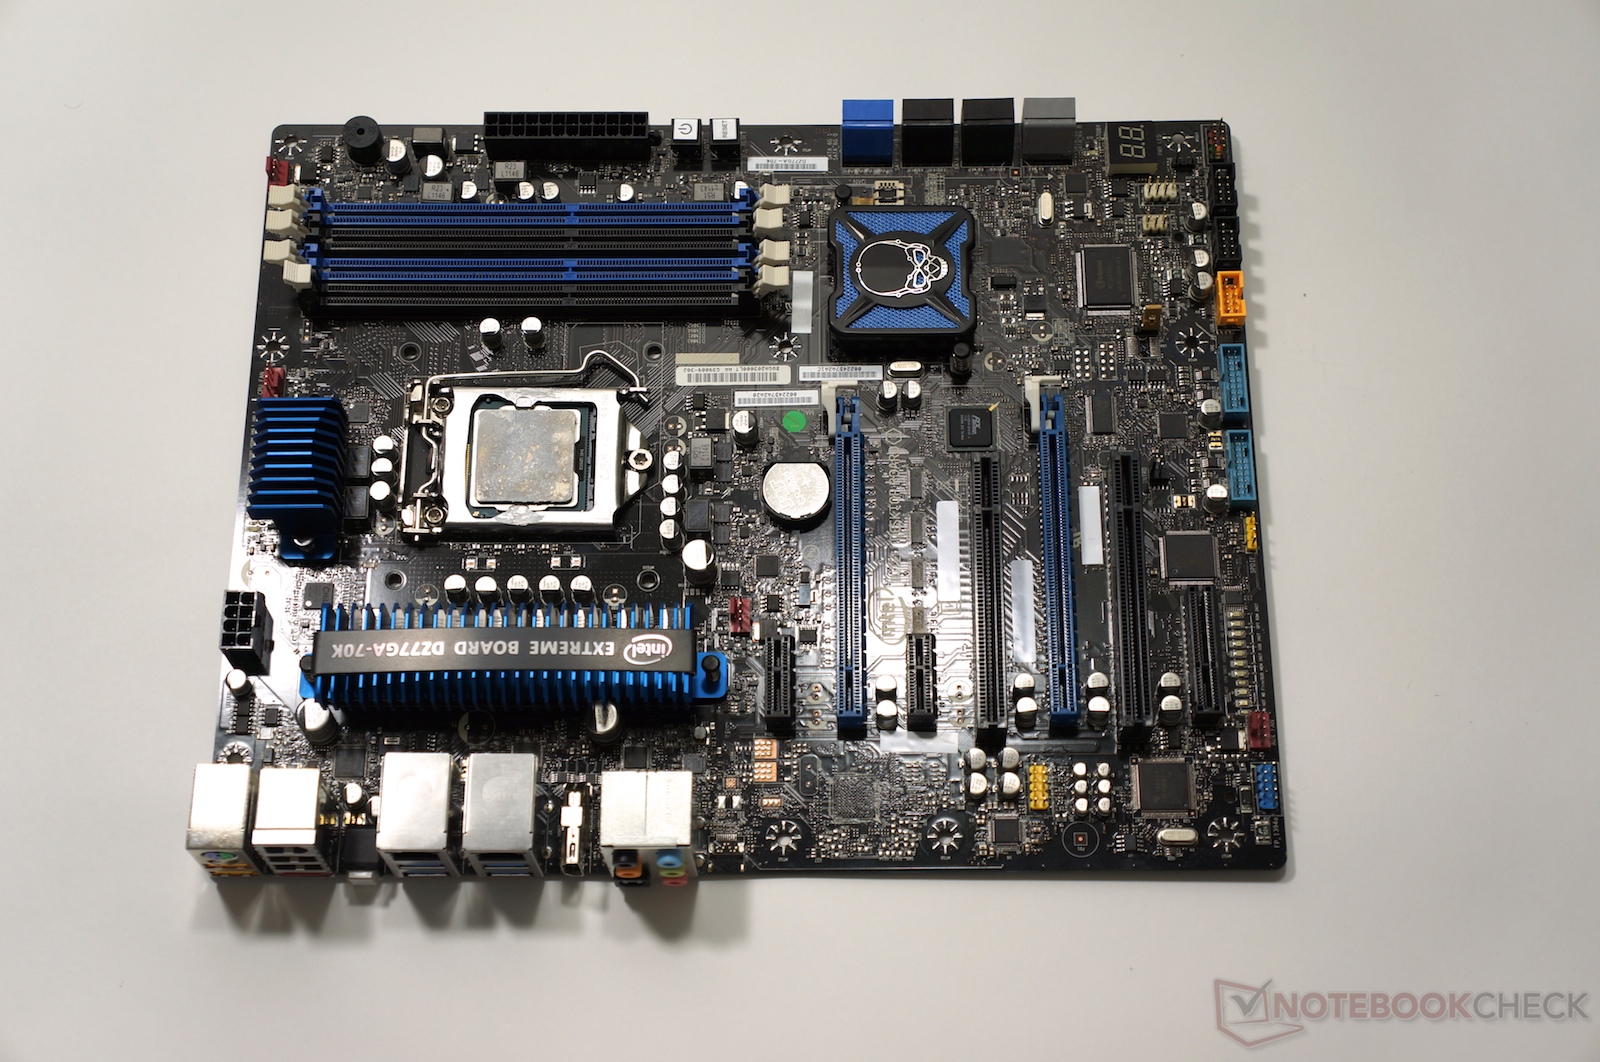
- Intel anakart: DZ77GA-70K üretim örneği
- RAM: 2x 4 GB ADATA XPG X Series DDR3-2133
- Sistem Sürücüleri: Intel SSD 520 and Samsung SSD 840 Pro
- Grafik sürücüleri: 9.17.10.2932 (Intel), Catalyst 13.2 (AMD)
Katılımcılar
AMD işlemciler hakkında en önemli teknik detayları aşağıda bulabilirsiniz.
- AMD A10-5800K: 2 modules (4 integer cores, 2 FPUs), 3.8 - 4.2 GHz, Radeon HD 7660D (384 shader units, 800 MHz), 100 Watt TDP;
Özellik: ek katlayıcı
- AMD A8-5600K: 2 modules (4 integer cores, 2 FPUs), 3.6 - 3.9 GHz, Radeon HD 7560D (256 shader units, 760 MHz), 100 Watt TDP;
Özellik: ek katlayıcı
- AMD A4-5300: 1 module (2 integer cores, 1 FPU), 3.4 - 3.6 GHz, Radeon HD 7480D (128 shader units, 724 MHz), 65 Watt TDP
- AMD FX-8350: 4 modules (8 integer cores, 4 FPUs), 4.0 - 4.2 GHz, 125 Watt TDP; Özellik: ek katlayıcı, ekran kartı yok
İşlemci performansı
| Cinebench R10 | |
| Rendering Single CPUs 64Bit (değere göre sırala) | |
| A10-5800K DDR3-1600 | |
| A10-5800K DDR3-1866 | |
| A8-5600K | |
| A4-5300 | |
| FX-8350 | |
| i7-3770K | |
| Pentium G860 | |
| Core i3-3220 | |
| Core i5-3550 | |
| Core i5-3470 | |
| Rendering Multiple CPUs 64Bit (değere göre sırala) | |
| A10-5800K DDR3-1600 | |
| A10-5800K DDR3-1866 | |
| A8-5600K | |
| A4-5300 | |
| FX-8350 | |
| i7-3770K | |
| Pentium G860 | |
| Core i3-3220 | |
| Core i5-3550 | |
| Core i5-3470 | |
| Rendering Single 32Bit (değere göre sırala) | |
| A10-5800K DDR3-1600 | |
| A10-5800K DDR3-1866 | |
| A8-5600K | |
| A4-5300 | |
| FX-8350 | |
| i7-3770K | |
| Pentium G860 | |
| Core i3-3220 | |
| Core i5-3550 | |
| Core i5-3470 | |
| Rendering Multiple CPUs 32Bit (değere göre sırala) | |
| A10-5800K DDR3-1600 | |
| A10-5800K DDR3-1866 | |
| A8-5600K | |
| A4-5300 | |
| FX-8350 | |
| i7-3770K | |
| Pentium G860 | |
| Core i3-3220 | |
| Core i5-3550 | |
| Core i5-3470 | |
| Cinebench R11.5 | |
| CPU Single 64Bit (değere göre sırala) | |
| A10-5800K DDR3-1600 | |
| A10-5800K DDR3-1866 | |
| A8-5600K | |
| A4-5300 | |
| FX-8350 | |
| i7-3770K | |
| Pentium G860 | |
| Core i3-3220 | |
| Core i5-3550 | |
| Core i5-3470 | |
| CPU Multi 64Bit (değere göre sırala) | |
| A10-5800K DDR3-1600 | |
| A10-5800K DDR3-1866 | |
| A8-5600K | |
| A4-5300 | |
| FX-8350 | |
| i7-3770K | |
| Pentium G860 | |
| Core i3-3220 | |
| Core i5-3550 | |
| Core i5-3470 | |
| Geekbench 2 - 32 Bit - Total Score (değere göre sırala) | |
| A10-5800K DDR3-1600 | |
| A10-5800K DDR3-1866 | |
| A8-5600K | |
| A4-5300 | |
| FX-8350 | |
| i7-3770K | |
| Pentium G860 | |
| Core i3-3220 | |
| Core i5-3550 | |
| Core i5-3470 | |
| wPrime 2.10 - 32m (değere göre sırala) | |
| A10-5800K DDR3-1600 | |
| A10-5800K DDR3-1866 | |
| A8-5600K | |
| A4-5300 | |
| FX-8350 | |
| i7-3770K | |
| Pentium G860 | |
| Core i3-3220 | |
| Core i5-3550 | |
| TrueCrypt | |
| AES Mean 100MB (değere göre sırala) | |
| A10-5800K DDR3-1600 | |
| A10-5800K DDR3-1866 | |
| A8-5600K | |
| A4-5300 | |
| FX-8350 | |
| i7-3770K | |
| Pentium G860 | |
| Core i3-3220 | |
| Core i5-3550 | |
| Twofish Mean 100MB (değere göre sırala) | |
| A10-5800K DDR3-1600 | |
| A10-5800K DDR3-1866 | |
| A8-5600K | |
| A4-5300 | |
| FX-8350 | |
| i7-3770K | |
| Pentium G860 | |
| Core i3-3220 | |
| Core i5-3550 | |
| Serpent Mean 100MB (değere göre sırala) | |
| A10-5800K DDR3-1600 | |
| A10-5800K DDR3-1866 | |
| A8-5600K | |
| A4-5300 | |
| FX-8350 | |
| i7-3770K | |
| Pentium G860 | |
| Core i3-3220 | |
| Core i5-3550 | |
| X264 HD Benchmark 4.0 | |
| Pass 1 (değere göre sırala) | |
| A10-5800K DDR3-1600 | |
| A10-5800K DDR3-1866 | |
| A8-5600K | |
| A4-5300 | |
| FX-8350 | |
| i7-3770K | |
| Pentium G860 | |
| Core i3-3220 | |
| Core i5-3550 | |
| Pass 2 (değere göre sırala) | |
| A10-5800K DDR3-1600 | |
| A10-5800K DDR3-1866 | |
| A8-5600K | |
| A4-5300 | |
| FX-8350 | |
| i7-3770K | |
| Pentium G860 | |
| Core i3-3220 | |
| Core i5-3550 | |
| WinRAR - Result (değere göre sırala) | |
| A10-5800K DDR3-1600 | |
| A10-5800K DDR3-1866 | |
| A8-5600K | |
| A4-5300 | |
| FX-8350 | |
| i7-3770K | |
| Pentium G860 | |
| Core i3-3220 | |
| Core i5-3550 | |
| 3DMark 06 - CPU - CPU Score (değere göre sırala) | |
| A10-5800K DDR3-1600 | |
| A10-5800K DDR3-1866 | |
| A8-5600K | |
| A4-5300 | |
| FX-8350 GTX 470 | |
| i7-3770K | |
| Pentium G860 | |
| Core i3-3220 | |
| Core i5-3550 | |
| Core i5-3470 | |
* ... daha küçük daha iyidir
Oyun performansı
Rakamlarla bu duruma açıklık getirmeye çalışacağız. Ortalamada en hızlı AMD işlemci A10-5800K iken Intel Core i3-3220 ile neredeyse aynı performansı veriyor. Ancak bu sonuçlar yapılan teste göre değişmekte. i3 işlemci MHz başına daha yüksek performanstan faydalanırken, A10 4 integer çekirdeğinden faydalanmakta. Bu yüzden AMD işlemci paralel işlem uygulamalarında daha iyi performans verirken i3 tek çekirdekli uygulamalarda daha iyi performans vermekte. Öte yandan AES-NI komut seti sadece Intel Core i5 ve i7 işlemcilerde bulunurken, AMD tüm işlemcilerinde bu komutsetini kullandığından daha iyi performans sunabilmekte.
A8-5600K, A10-5800K işlemciden düşük saat hızından biraz daha yavaş iken a4-5300 ve A6-5400K (testimize dahil değil) oldukça daha yavaş. Sonuç olarak testimizde A4-5300 performans yönünden ancak Pentium G860 seviyelerine erişebiliyor. AMD'nin CMT teknolojisi gerçek işlemci çekirdeklerinin performansına erişemiyor.
FX-8350, Core i5-3470/3550 ve Core i7-3770K en yüksek fiyat ve performansa sahipler. Core i5 modelleri ile kıyaslanıldığında FX ortalamada daha iyi performans verebilmekte. Ancak testlerin paralel işleme uygun programlarda yapılmış olması bunda bir etken. i7-3770K ise yeri sarsılmaz şampiyon olarak yerini koruyor. Ancak gerek performansı, gerek etkin enerji tüketimi olsun paha yönünden biraz fazlaya çıkıyor.
| 3DMark 06 - 1280x1024 Standard Score AA:0x AF:0x (değere göre sırala) | |
| A10-5800K DDR3-1600 | |
| A10-5800K DDR3-1866 | |
| A8-5600K | |
| A4-5300 | |
| FX-8350 GTX 470 | |
| i7-3770K | |
| Pentium G860 | |
| Core i3-3220 | |
| Core i5-3550 | |
| Core i5-3470 | |
| 3DMark 11 - 1280x720 Performance GPU (değere göre sırala) | |
| A10-5800K DDR3-1600 | |
| A10-5800K DDR3-1866 | |
| A8-5600K | |
| A4-5300 | |
| FX-8350 GTX 470 | |
| i7-3770K | |
| Core i3-3220 | |
| Core i5-3550 | |
| Core i5-3470 | |
| 3DMark Vantage - 1280x1024 P GPU no PhysX (değere göre sırala) | |
| A10-5800K DDR3-1600 | |
| A10-5800K DDR3-1866 | |
| A8-5600K | |
| A4-5300 | |
| FX-8350 GTX 470 | |
| i7-3770K | |
| Pentium G860 | |
| Core i3-3220 | |
| Core i5-3550 | |
| Core i5-3470 | |
| 3DMark | |
| 1920x1080 Fire Strike Graphics (değere göre sırala) | |
| A10-5800K DDR3-1600 | |
| A10-5800K DDR3-1866 | |
| A8-5600K | |
| A4-5300 | |
| FX-8350 GTX 470 | |
| i7-3770K | |
| Core i3-3220 | |
| Core i5-3550 | |
| Core i5-3470 | |
| 1280x720 Cloud Gate Standard Graphics (değere göre sırala) | |
| A10-5800K DDR3-1600 | |
| A10-5800K DDR3-1866 | |
| A8-5600K | |
| A4-5300 | |
| FX-8350 GTX 470 | |
| i7-3770K | |
| Pentium G860 | |
| Core i3-3220 | |
| Core i5-3550 | |
| Core i5-3470 | |
| 1280x720 Ice Storm Standard Graphics (değere göre sırala) | |
| A10-5800K DDR3-1600 | |
| A10-5800K DDR3-1866 | |
| A8-5600K | |
| A4-5300 | |
| FX-8350 GTX 470 | |
| i7-3770K | |
| Pentium G860 | |
| Core i3-3220 | |
| Core i5-3550 | |
| Core i5-3470 | |
Dahili grafik kartlarına biraz bakalım. Beklenildiği gibi Intel bu noktada AMD ile pek fazla yarışamıyor. Bu kısa sürece çıkacak olan Haswell mimarisi ile değişebilir. Ancak şu anda Trinity serisi işlemciler rekabeti önde götürüyor. Radeon HD 7660D birçok özelliği kesilmiş Radeon HD7480D'den iki kattan daha fazla hızlı. Orta seviye Radeon HD7560D de iki kartın arasında kendisine yer buluyor ve HD Graphics 4000 grafik kartından biraz daha hızlı. Ancak en hızlı model bile halen kat ve kat orta seviye bir harici grafik kartından daha yavaş.
| Hitman: Absolution | |
| 1920x1080 Ultra Preset AA:4xMS AF:16x (değere göre sırala) | |
| A10-5800K DDR3-1600 | |
| A10-5800K DDR3-1866 | |
| A8-5600K | |
| A4-5300 | |
| Core i5-3470 | |
| 1366x768 High Preset AA:2xMS AF:8x (değere göre sırala) | |
| A10-5800K DDR3-1600 | |
| A10-5800K DDR3-1866 | |
| A8-5600K | |
| A4-5300 | |
| Core i5-3470 | |
| 1366x768 Medium Preset AF:2x (değere göre sırala) | |
| A10-5800K DDR3-1600 | |
| A10-5800K DDR3-1866 | |
| A8-5600K | |
| A4-5300 | |
| Core i3-3220 | |
| Core i5-3470 | |
| 1024x768 Lowest Preset (değere göre sırala) | |
| A10-5800K DDR3-1600 | |
| A10-5800K DDR3-1866 | |
| A8-5600K | |
| A4-5300 | |
| Core i3-3220 | |
| Core i5-3470 | |
| BioShock Infinite | |
| 1920x1080 Ultra Preset, DX11 (DDOF) (değere göre sırala) | |
| A10-5800K DDR3-1600 | |
| A10-5800K DDR3-1866 | |
| A8-5600K | |
| A4-5300 | |
| FX-8350 GTX 470 | |
| 1366x768 High Preset (değere göre sırala) | |
| A10-5800K DDR3-1600 | |
| A10-5800K DDR3-1866 | |
| A8-5600K | |
| A4-5300 | |
| FX-8350 GTX 470 | |
| 1366x768 Medium Preset (değere göre sırala) | |
| A10-5800K DDR3-1600 | |
| A10-5800K DDR3-1600 | |
| A10-5800K DDR3-1866 | |
| A8-5600K | |
| A4-5300 | |
| FX-8350 GTX 470 | |
| 1280x720 Very Low Preset (değere göre sırala) | |
| A10-5800K DDR3-1600 | |
| A10-5800K DDR3-1866 | |
| A8-5600K | |
| A4-5300 | |
| FX-8350 GTX 470 | |
| SimCity | |
| 1920x1080 Ultra / High AA:on (değere göre sırala) | |
| A10-5800K DDR3-1600 | |
| A10-5800K DDR3-1866 | |
| A8-5600K | |
| A4-5300 | |
| FX-8350 GTX 470 | |
| 1366x768 High AA:on (değere göre sırala) | |
| A10-5800K DDR3-1600 | |
| A10-5800K DDR3-1866 | |
| A8-5600K | |
| A4-5300 | |
| 1366x768 Medium (değere göre sırala) | |
| A10-5800K DDR3-1600 | |
| A10-5800K DDR3-1866 | |
| A8-5600K | |
| A4-5300 | |
| Core i5-3550 | |
| 1024x768 Low (değere göre sırala) | |
| A10-5800K DDR3-1600 | |
| A10-5800K DDR3-1866 | |
| A8-5600K | |
| A4-5300 | |
| FX-8350 GTX 470 | |
| Core i5-3550 | |
| Tomb Raider | |
| 1920x1080 Ultra Preset AA:FX AF:16x (değere göre sırala) | |
| A10-5800K DDR3-1600 | |
| A10-5800K DDR3-1866 | |
| A8-5600K | |
| A4-5300 | |
| FX-8350 GTX 470 | |
| 1366x768 High Preset AA:FX AF:8x (değere göre sırala) | |
| A10-5800K DDR3-1600 | |
| A10-5800K DDR3-1866 | |
| A8-5600K | |
| A4-5300 | |
| FX-8350 GTX 470 | |
| 1366x768 Normal Preset AA:FX AF:4x (değere göre sırala) | |
| A10-5800K DDR3-1600 | |
| A10-5800K DDR3-1866 | |
| A8-5600K | |
| A4-5300 | |
| FX-8350 GTX 470 | |
| 1024x768 Low Preset (değere göre sırala) | |
| A10-5800K DDR3-1600 | |
| A10-5800K DDR3-1866 | |
| A8-5600K | |
| A4-5300 | |
| FX-8350 GTX 470 | |
| F1 2012 | |
| 1920x1080 Ultra Preset AA:4xMS (değere göre sırala) | |
| A10-5800K DDR3-1600 | |
| A10-5800K DDR3-1866 | |
| A8-5600K | |
| A4-5300 | |
| Core i3-3220 | |
| Core i5-3470 | |
| 1366x768 High Preset AA:2xMS (değere göre sırala) | |
| A10-5800K DDR3-1600 | |
| A10-5800K DDR3-1866 | |
| A8-5600K | |
| A4-5300 | |
| Core i3-3220 | |
| Core i5-3470 | |
| 1366x768 Medium Preset (değere göre sırala) | |
| A10-5800K DDR3-1600 | |
| A10-5800K DDR3-1866 | |
| A8-5600K | |
| A4-5300 | |
| Core i3-3220 | |
| Core i5-3470 | |
| 1024x768 Ultra Low Preset (değere göre sırala) | |
| A10-5800K DDR3-1600 | |
| A10-5800K DDR3-1866 | |
| A8-5600K | |
| A4-5300 | |
| Core i3-3220 | |
| Core i5-3470 | |
Bu testin en enteresan sorularından biri ise acaba işlemci/grafik kartı çözümleri özellikle küçük olanlar mevcut 3D oyunları nasıl çalıştırıcaktı. Bu teste A10-5800K / Radeon HD 7660D kombinasyonu ile başlıyoruz. Beklenilen grafiğe göre oyunlar orta ayarlar ve 1366x768 çözünürlükte çalıştırılabilmekte. Yani genel oyuncular için bir sorun gözükmemekte.
A8-5600K / Radeon HD 7560D ise A10-5800K'nın biraz gerisinde kalıyor. A4-5400 / Radeon HD 7480D ise üst modelin yarısı kadar performans vermekte. Bu yüzden kullanıcı minimum detay ve 1024x768 piksel ile oyunları ancak oynayabilemkte ki bu bile akıcı bir oyun deneyimi için garanti değil.
Compute Performance
| ComputeMark v2.1 | |
| 1024x600 Normal, QJuliaRayTrace (değere göre sırala) | |
| A10-5800K DDR3-1600 | |
| A10-5800K DDR3-1866 | |
| A8-5600K | |
| A4-5300 | |
| i7-3770K | |
| Core i3-3220 | |
| Core i5-3550 | |
| Core i5-3470 | |
| 1024x600 Normal, Mandel Scalar (değere göre sırala) | |
| A10-5800K DDR3-1600 | |
| A10-5800K DDR3-1866 | |
| A8-5600K | |
| A4-5300 | |
| i7-3770K | |
| Core i3-3220 | |
| Core i5-3550 | |
| Core i5-3470 | |
| 1024x600 Normal, Mandel Vector (değere göre sırala) | |
| A10-5800K DDR3-1600 | |
| A10-5800K DDR3-1866 | |
| A8-5600K | |
| A4-5300 | |
| i7-3770K | |
| Core i3-3220 | |
| Core i5-3550 | |
| Core i5-3470 | |
| 1024x600 Normal, Fluid 2DTexArr (değere göre sırala) | |
| A10-5800K DDR3-1600 | |
| A10-5800K DDR3-1866 | |
| A8-5600K | |
| A4-5300 | |
| i7-3770K | |
| Core i3-3220 | |
| Core i5-3550 | |
| Core i5-3470 | |
| 1024x600 Normal, Fluid 3DTex (değere göre sırala) | |
| A10-5800K DDR3-1600 | |
| A10-5800K DDR3-1866 | |
| A8-5600K | |
| A4-5300 | |
| i7-3770K | |
| Core i3-3220 | |
| Core i5-3550 | |
| Core i5-3470 | |
| 1024x600 Normal, Score (değere göre sırala) | |
| A10-5800K DDR3-1600 | |
| A10-5800K DDR3-1866 | |
| A8-5600K | |
| A4-5300 | |
| i7-3770K | |
| Core i3-3220 | |
| Core i5-3550 | |
| Core i5-3470 | |
| LuxMark v2.0 64Bit | |
| Room GPUs-only (değere göre sırala) | |
| A10-5800K DDR3-1600 | |
| A10-5800K DDR3-1866 | |
| A8-5600K | |
| A4-5300 | |
| i7-3770K | |
| Core i3-3220 | |
| Core i5-3550 | |
| Core i5-3470 | |
| Sala GPUs-only (değere göre sırala) | |
| A10-5800K DDR3-1600 | |
| A10-5800K DDR3-1866 | |
| A8-5600K | |
| A4-5300 | |
| i7-3770K | |
| Core i3-3220 | |
| Core i5-3550 | |
| Core i5-3470 | |
OpenCL veya DirectCompute gibi standardize arayüzler sayesinde dahili grafik kartları da genel işlemleri yapabilmekte. Ama bu Sandy Bridge grafik kartları için geçerki değil. Burada da AMD işlemciler kazanıyor. Bununla beraber Intel'in HD 4000 grafik kartı A4-5300 ile aynı seviyelerde işlem gücü sunmakta.
Not: Yeni 15.31 versiyonlu sürücü ile Ivy Bridge işlemcilerin OpenCL performansı artmış olup Radeon HD 7660D grafik kartından daha iyi sonuç vermekte.
Mevcut olarak pratikte işlem gücünden faydalanan çok az uygulama var ancak bu kısa dönemde değişebilir. Bu yüzden hızlı bir grafik kartı artık sadece oyunlarda iyi sonuçlar almaya yaramayacak. AMD ve Intel'in grafik kartının artık daha önemli olduğunu düşünmelerinin bir sebebi de bu. AMD bu noktada biraz daha iyi olsa da, Intel hızla yükselmeye devam ediyor.

Sonuç
A serisi işlemciler FX serisi ekran kartına sahip olmayan işlemcilere göre ucuz alternatifler olarak karşımıza çıkıyor ve gündelik işler için yeterli performansı sunuyor.
Eğer performans gerektiren ama ekran kartı desteğine ihtiyaç duymayan uygulamalar kullanıyorsanız A8-5600K veya A10-5800K da işinizi görecektir. Dahili ekran kartları da mevcut çoğu oyunu sorunsuz şekilde çalıştıracaktır. İstenirse K eklentisine sahip işlemciler overclock edilerek daha yüksek saat hızına da ulaşılabilmekte. Ancak bunun için iyi bir soğutma sistemine sahip olmanız gerekli. Intel işlemciler overclock edilemese de daha düşük güç tüketimi gibi özelliklere sahip.
FX-8350 işlemcinin en büyük dezavantajı ise güç tüketimi olacaktır. Eğer dahili grafik kartına ihtiyaç duymuyorsanız makul bir fiyata iyi bir performans almanız mümkün. Paralel komutlara uyumlu uygulamalarda FX işlemci Core i7-3770K işlemciye yakın bir performans sunmakta ki bu işlemci 100 Euro kadar daha pahalı. Ancak ortalama da FX işlemci Core i5 işlemcilerle aynı performansı sunmakta.
| A10-5800K DDR3-1600 Radeon HD 7660D, AMD A10-5800K | A10-5800K DDR3-1866 Radeon HD 7660D, AMD A10-5800K | A8-5600K Radeon HD 7560D, AMD A8-5600K | A4-5300 Radeon HD 7480D, AMD A4-5300, Intel SSD 520 Series SSDSC2CW240A | FX-8350 Radeon HD 6450 GDDR5, FX-8350, Intel SSD 520 Series SSDSC2CW240A | FX-8350 GTX 470 GeForce GTX 470, FX-8350, Intel SSD 520 Series SSDSC2CW240A | i7-3770K HD Graphics 4000, 3770K, Intel SSD 520 Series SSDSC2CW240A | Pentium G860 HD Graphics (Sandy Bridge), G860, Intel SSD 520 Series SSDSC2CW240A | Core i3-3220 HD Graphics 2500, 3220, Intel SSD 520 Series SSDSC2CW240A | Core i5-3550 HD Graphics 2500, 3550, Intel SSD 520 Series SSDSC2CW240A | Core i5-3470 HD Graphics 2500, 3470, Intel SSD 520 Series SSDSC2CW240A | |
|---|---|---|---|---|---|---|---|---|---|---|---|
| Cinebench R10 | -1% | -5% | -34% | 42% | 98% | -1% | 24% | 72% | 65% | ||
| Rendering Single CPUs 64Bit (Points) | 4221 | 4139 -2% | 3983 -6% | 3645 -14% | 4346 3% | 6972 65% | 4953 17% | 5847 39% | 6568 56% | 6328 50% | |
| Rendering Multiple CPUs 64Bit (Points) | 12987 | 12959 0% | 12505 -4% | 5867 -55% | 23538 81% | 27536 112% | 9063 -30% | 12546 -3% | 22729 75% | 21594 66% | |
| Rendering Single 32Bit (Points) | 3131 | 3056 -2% | 2941 -6% | 2734 -13% | 3201 2% | 5536 77% | 3964 27% | 4626 48% | 5191 66% | 5006 60% | |
| Rendering Multiple CPUs 32Bit (Points) | 9285 | 9266 0% | 8838 -5% | 4345 -53% | 16904 82% | 22190 139% | 7695 -17% | 10193 10% | 17762 91% | 17192 85% | |
| Cinebench R11.5 | -1% | -5% | -34% | 58% | 99% | -7% | 17% | 63% | 57% | ||
| CPU Single 64Bit (Points) | 1.04 | 1.02 -2% | 0.98 -6% | 0.91 -12% | 1.1 6% | 1.65 59% | 1.2 15% | 1.38 33% | 1.56 50% | 1.51 45% | |
| CPU Multi 64Bit (Points) | 3.3 | 3.33 1% | 3.2 -3% | 1.45 -56% | 6.89 109% | 7.88 139% | 2.34 -29% | 3.31 0% | 5.81 76% | 5.57 69% | |
| Geekbench 2 - 32 Bit | |||||||||||
| Total Score (Points) | 6969 | 6945 0% | 6520 -6% | 4268 -39% | 11198 61% | 12435 78% | 5393 -23% | 7008 1% | 8990 29% | 9721 39% | |
| wPrime 2.10 | |||||||||||
| 32m * (s) | 15.9 | 15.9 -0% | 16.7 -5% | 35.5 -123% | 7.96 50% | 6.39 60% | 23.6 -48% | 14.66 8% | 9.98 37% | ||
| TrueCrypt | 0% | -5% | -57% | 96% | 90% | -64% | -43% | 31% | |||
| AES Mean 100MB (GB/s) | 1.9 | 1.9 0% | 1.8 -5% | 0.823 -57% | 3.6 89% | 3.9 105% | 0.229 -88% | 0.318 -83% | 2.7 42% | ||
| Twofish Mean 100MB (GB/s) | 0.38 | 0.379 0% | 0.36 -5% | 0.165 -57% | 0.749 97% | 0.678 78% | 0.179 -53% | 0.288 -24% | 0.448 18% | ||
| Serpent Mean 100MB (GB/s) | 0.209 | 0.208 0% | 0.198 -5% | 0.093 -56% | 0.423 102% | 0.392 88% | 0.102 -51% | 0.166 -21% | 0.28 34% | ||
| X264 HD Benchmark 4.0 | -1% | -5% | -55% | 64% | 79% | -39% | -11% | 51% | |||
| Pass 1 (fps) | 107.6 | 105.6 -2% | 102.4 -5% | 50 -54% | 139 29% | 172.3 60% | 70.3 -35% | 98.6 -8% | 163.8 52% | ||
| Pass 2 (fps) | 21.9 | 21.8 0% | 20.93 -4% | 9.62 -56% | 43.5 99% | 43.4 98% | 12.69 -42% | 18.82 -14% | 32.7 49% | ||
| WinRAR | |||||||||||
| Result (KB/s) | 2530 | 2472 -2% | 2449 -3% | 1347 -47% | 4562 80% | 3698 46% | 1655 -35% | 2695 7% | 3375 33% | ||
| 3DMark 06 - CPU | |||||||||||
| CPU Score (Points) | 4311 | 4464 4% | 4295 0% | 2284 -47% | 6648 54% | 7606 76% | 3065 -29% | 4019 -7% | 6405 49% | 6179 43% | |
| Toplam Ortalama (Program / Ayarlar) | -0% /
-0% | -4% /
-5% | -55% /
-49% | 64% /
64% | 54% /
54% | 78% /
85% | -31% /
-28% | -1% /
-1% | 46% /
50% | 51% /
57% |
* ... daha küçük daha iyidir