İnceleme: Dell XPS 13 7390 Core i7-10710U Laptop
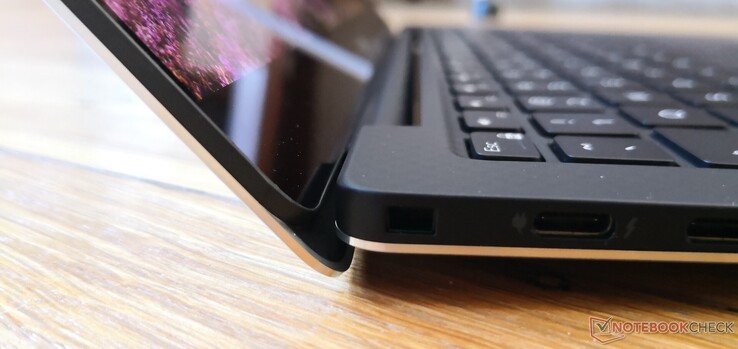
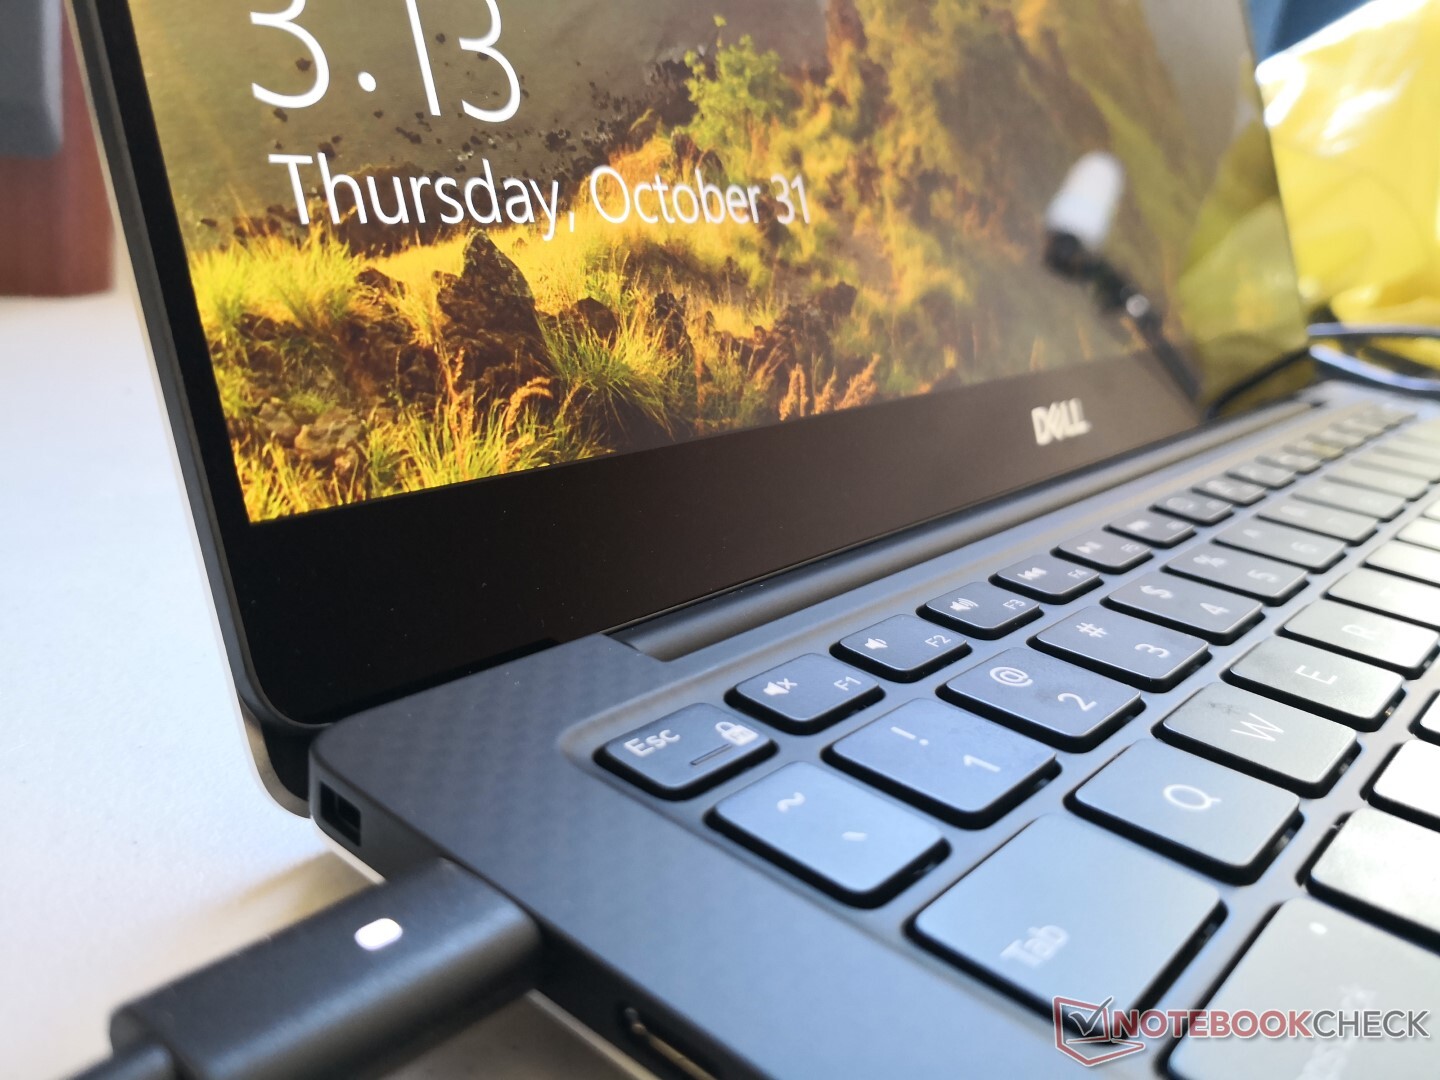
Kısa bir gecikmeden sonra, Intel'in en son 10. nesil Core i7-10710U işlemcisine sahip Dell XPS 13 7390 istiridye kabuğu nihayet nakliyeye başladı. Dell, geçen ayın başlarında bir Intel Core i7 Buz Gölü sunan ilk kapıdan çıktı ve şimdi Intel'in Core i7 Comet Lake-U CPU'su ile yine ilk oldu. Bu özel işlemci, 15 W Core U serisindeki ilk hexa-core CPU olduğu için dikkate değerdir, oysa tüm önceki Core U CPU'ları maksimum iki veya dört fiziksel çekirdeğe sahipti. CPU takasından başka, şasi burada aynı kalır Ondan önce gelen XPS 13 modelleri. Model adındaki değişiklik (7390 - 9390) de bu yılın başlarında burada belirtildiği gibi açıklandı. Bu nedenle, XPS 13'ün klavye, ekran, bağlantı noktaları ve diğer fiziksel özellikleri hakkında daha fazla bilgi edinmek için XPS 13 9380 ve XPS 13 9370 hakkındaki mevcut incelemelerimizi gözden geçirmenizi öneririz. Bu gözden geçirme bunun yerine yeni Core i7-10710U ve performans artışı ne kadar çok bekleyebilir. Daha fazla Dell XPS incelemesi: XPS 13 9380XPS 13 9370XPS 13 9360XPS 13 9350XPS 13 7390 2'si bir arada
Derecelendirme | Tarih | Modeli | Ağırlık | Yükseklik | Boyut | Çözünürlük | Fiyat |
|---|---|---|---|---|---|---|---|
| 85.9 % v7 (old) | 11/2019 | Dell XPS 13 7390 Core i7-10710U i7-10710U, UHD Graphics 620 | 1.2 kg | 11.6 mm | 13.30" | 3840x2160 | |
| 86.6 % v6 (old) | 03/2019 | Asus ZenBook S13 UX392FN i7-8565U, GeForce MX150 | 1.1 kg | 12.9 mm | 13.90" | 1920x1080 | |
| 82.7 % v7 (old) | 12/2019 | Acer Swift 3 SF314-41-R8HZ R5 3500U, Vega 8 | 1.5 kg | 18 mm | 14.00" | 1920x1080 | |
| 84.1 % v6 (old) | 09/2023 | Lenovo Yoga 530-14ARR-81H9000VGE R7 2700U, Vega 10 | 1.7 kg | 17.6 mm | 14.00" | 1920x1080 | |
| 87.7 % v6 (old) | 02/2019 | Dell XPS 13 9380 i7 4K i7-8565U, UHD Graphics 620 | 1.2 kg | 11.6 mm | 13.30" | 3840x2160 |
Durum
SD Kart Okuyucu
| SD Card Reader | |
| average JPG Copy Test (av. of 3 runs) | |
| Dell XPS 13 9380 i7 4K (Toshiba Exceria Pro M501 64 GB UHS-II) | |
| Dell XPS 13 7390 2-in-1 Core i3 (Toshiba Exceria Pro M501 64 GB UHS-II) | |
| Dell XPS 13 7390 Core i7-10710U (Toshiba Exceria Pro M501 64 GB UHS-II) | |
| Dell XPS 13 7390 2-in-1 Core i7 (Toshiba Exceria Pro M501 64 GB UHS-II) | |
| maximum AS SSD Seq Read Test (1GB) | |
| Dell XPS 13 9380 i7 4K (Toshiba Exceria Pro M501 64 GB UHS-II) | |
| Dell XPS 13 7390 2-in-1 Core i3 (Toshiba Exceria Pro M501 64 GB UHS-II) | |
| Dell XPS 13 7390 Core i7-10710U (Toshiba Exceria Pro M501 64 GB UHS-II) | |
| Dell XPS 13 7390 2-in-1 Core i7 (Toshiba Exceria Pro M501 64 GB UHS-II) | |
İletişim
Görüntüle
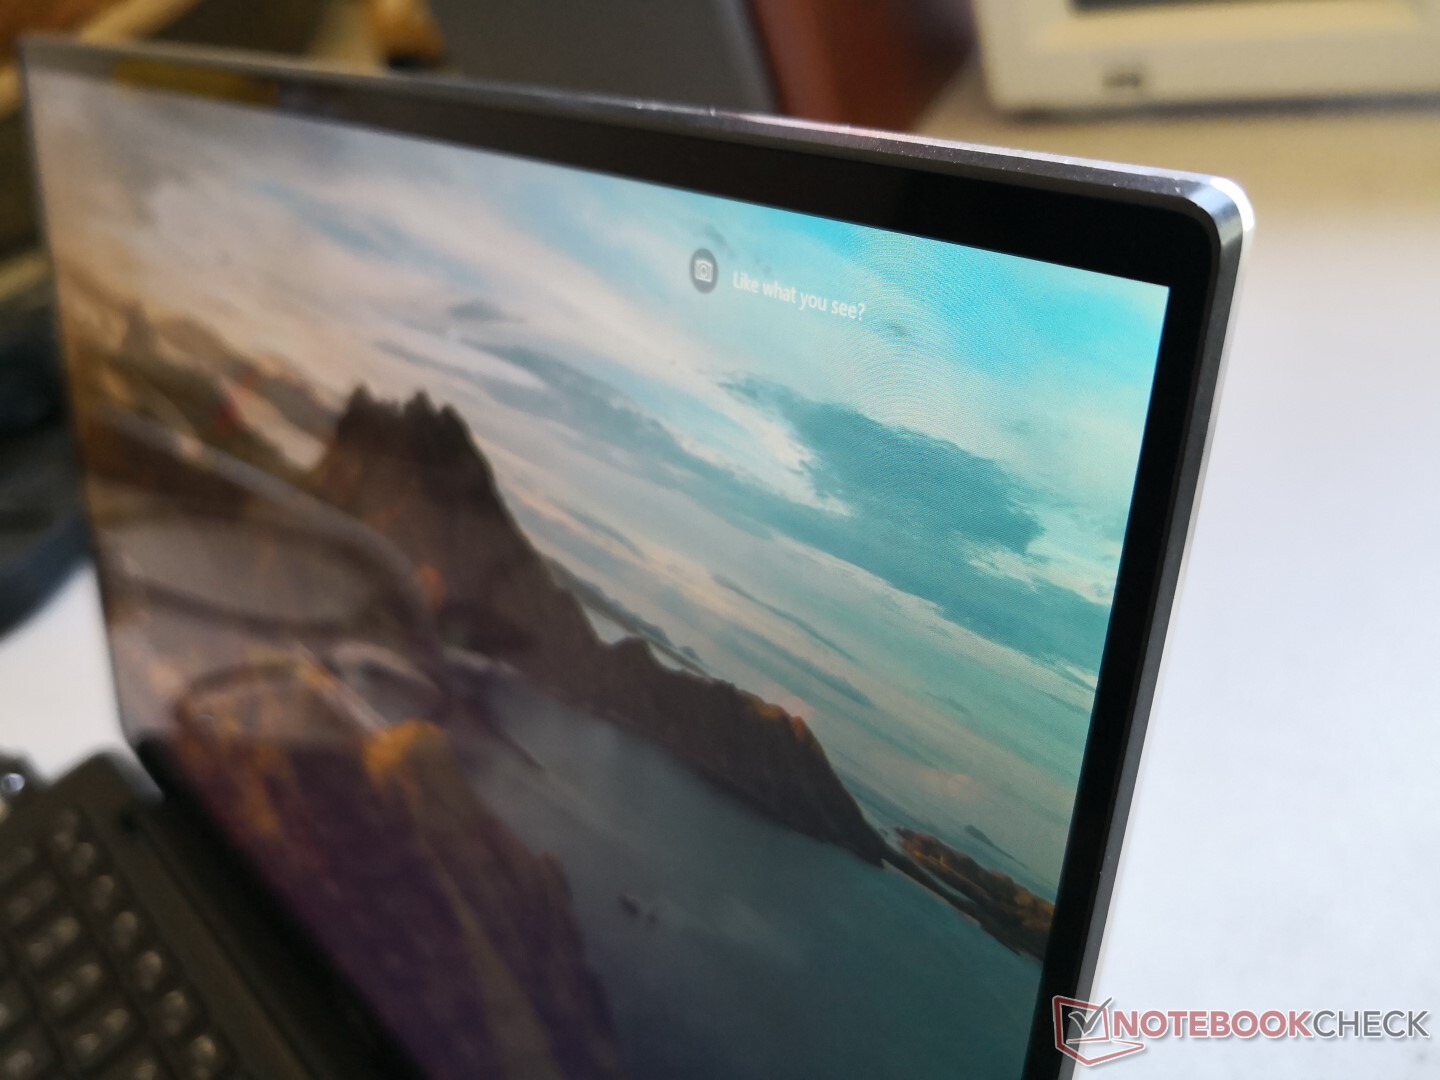
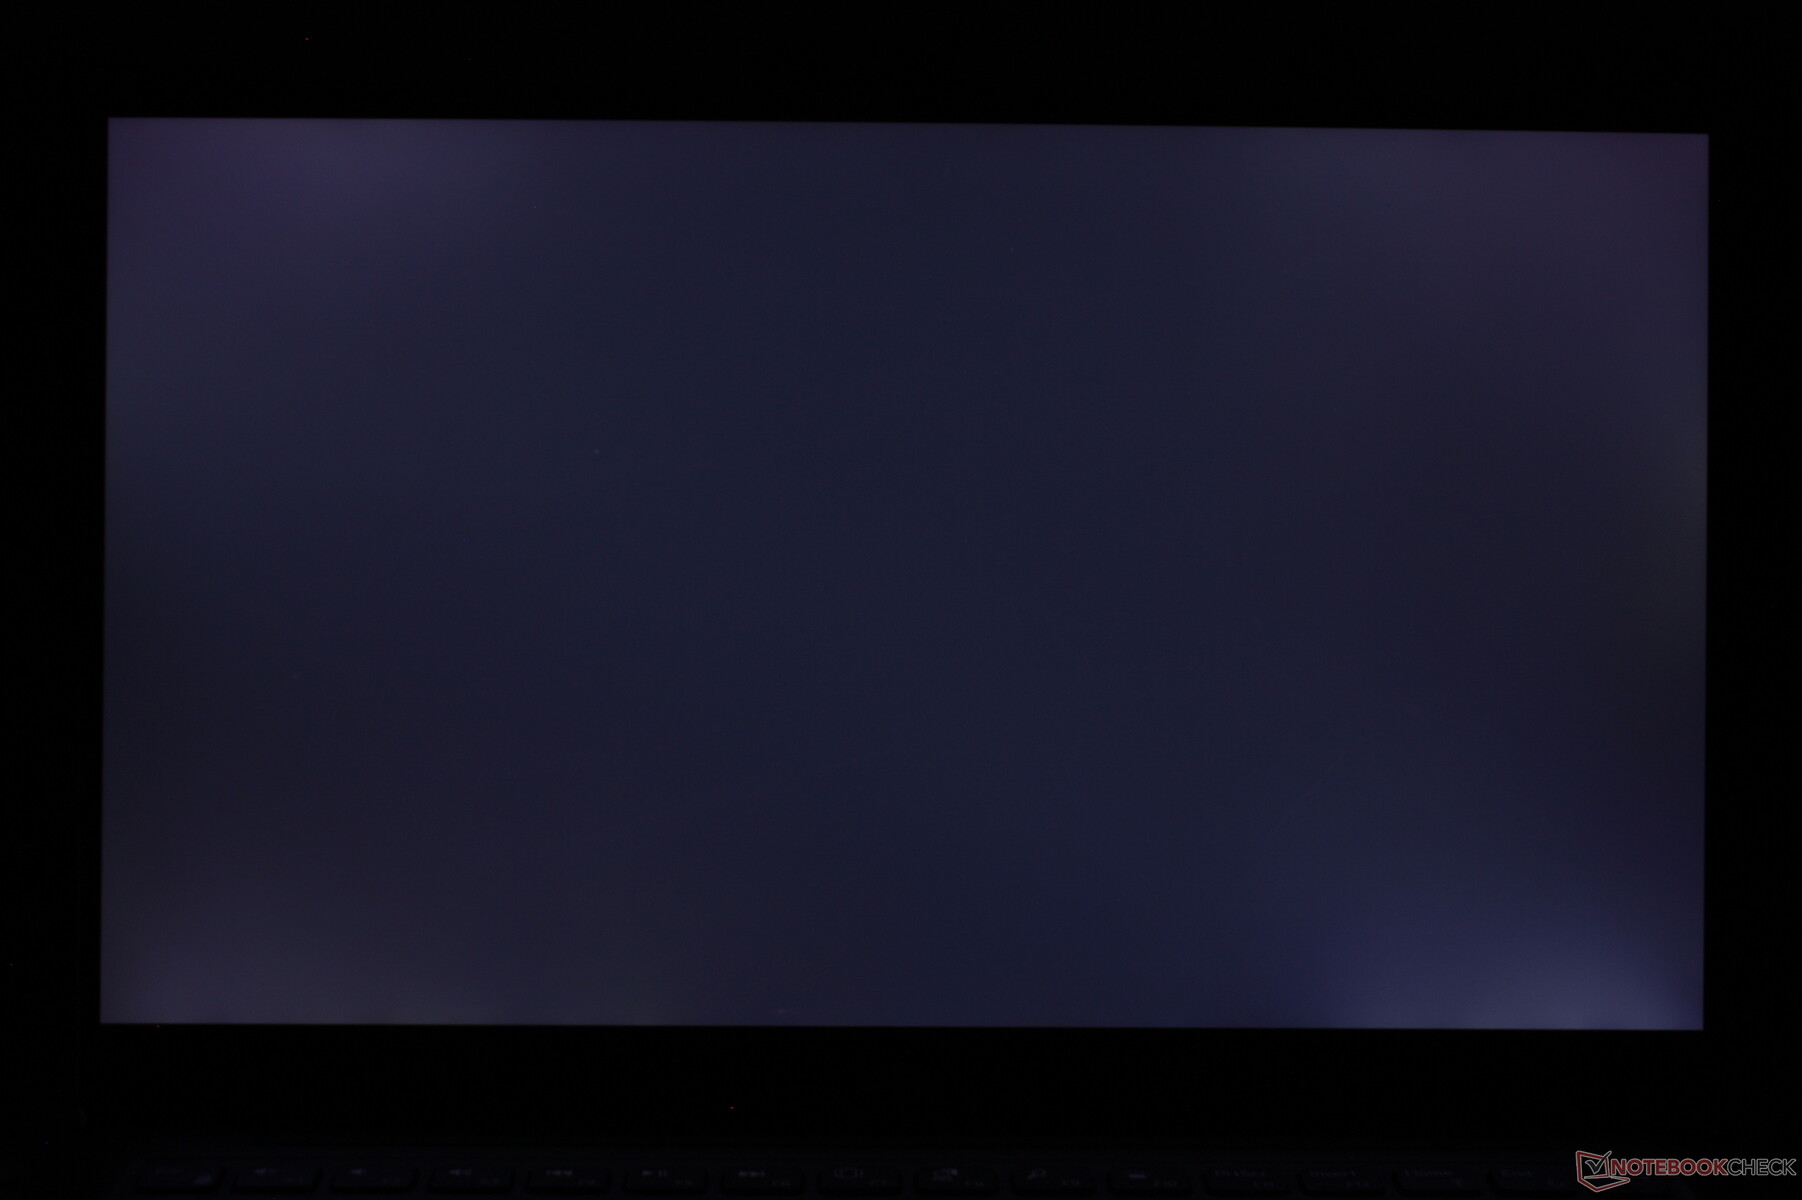
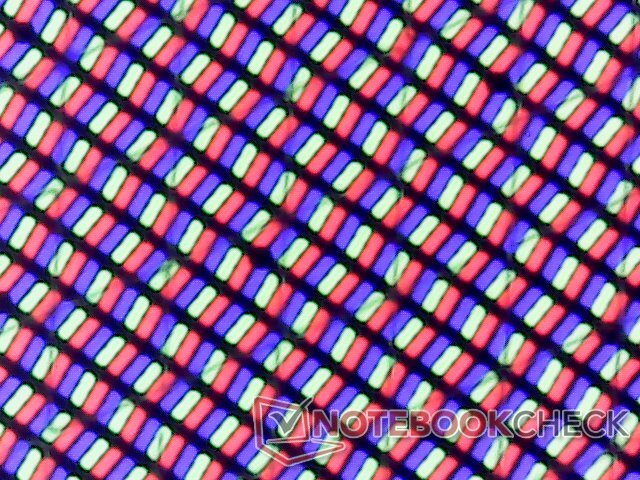
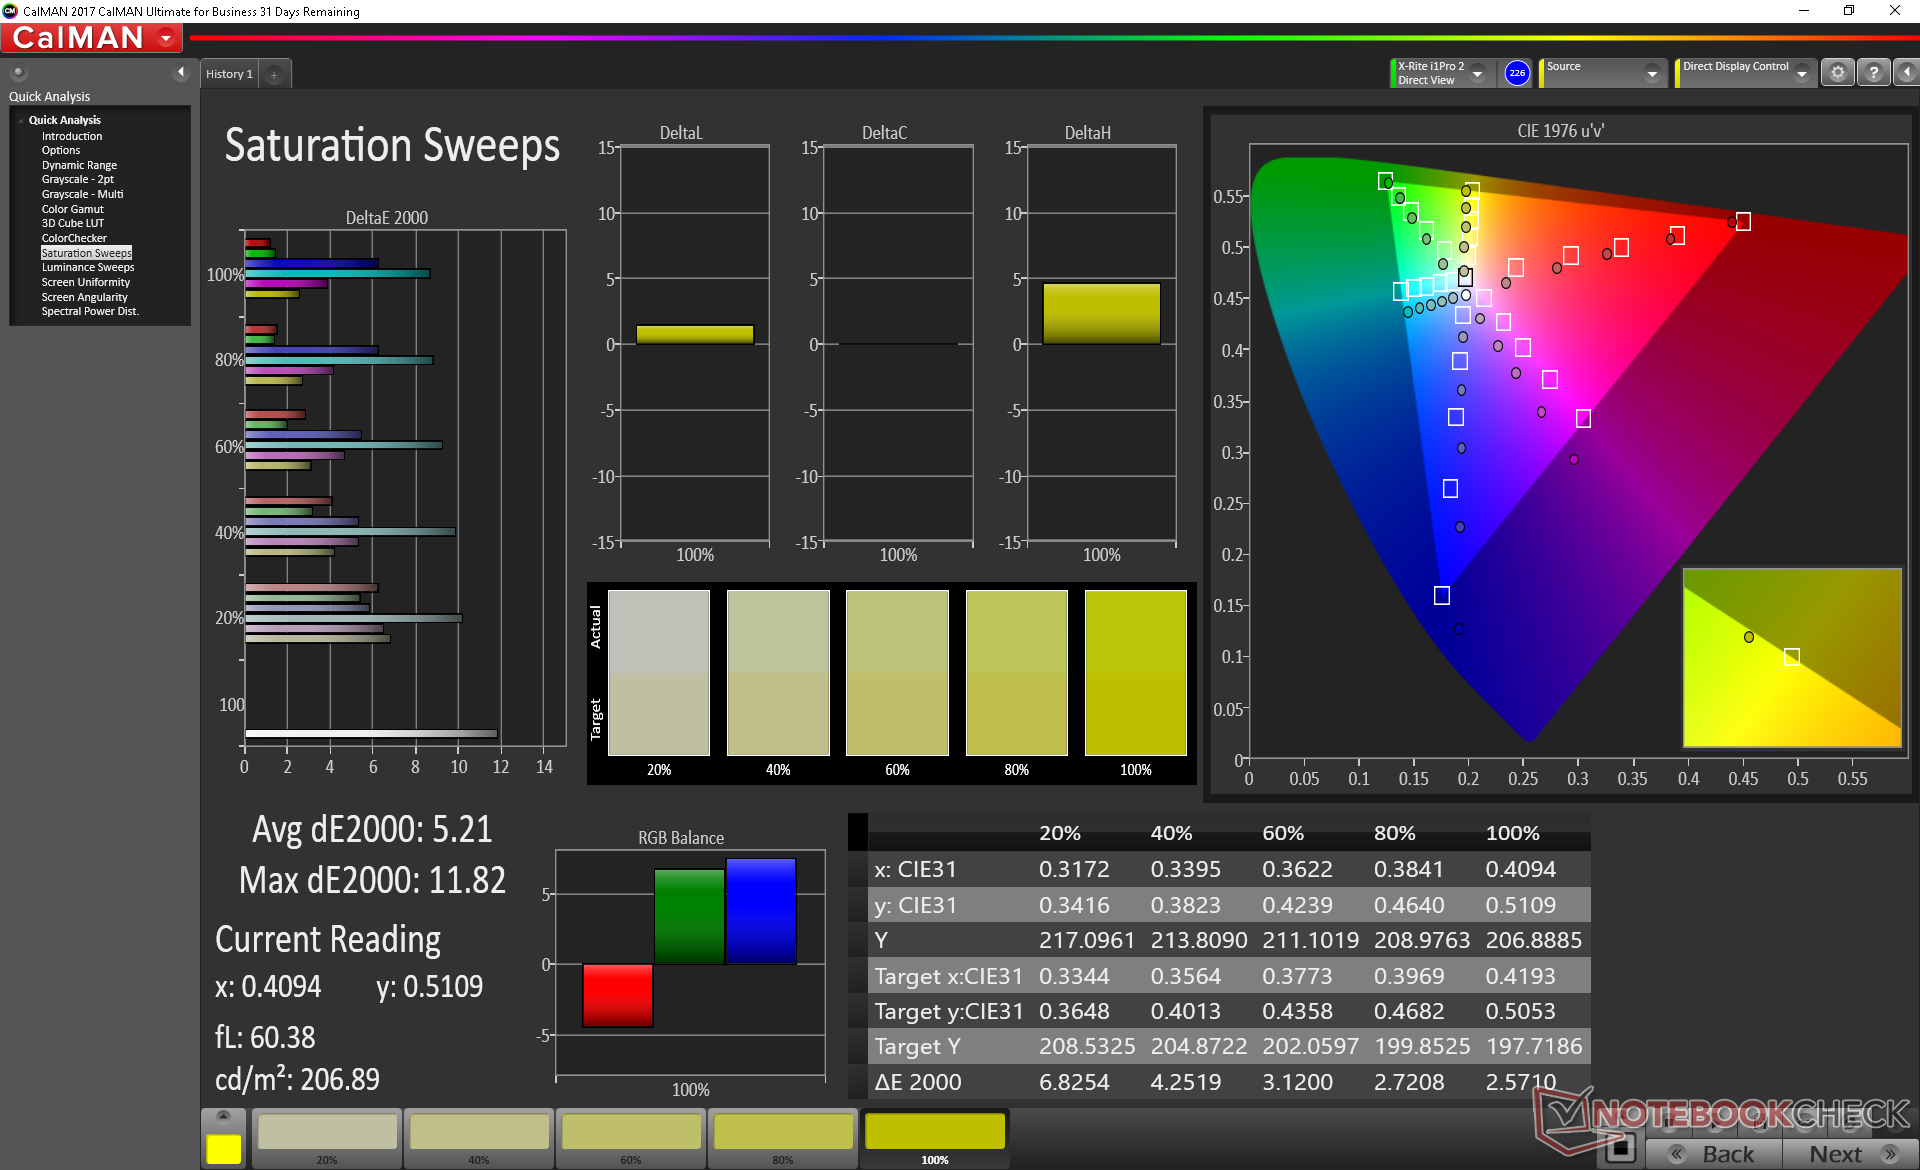
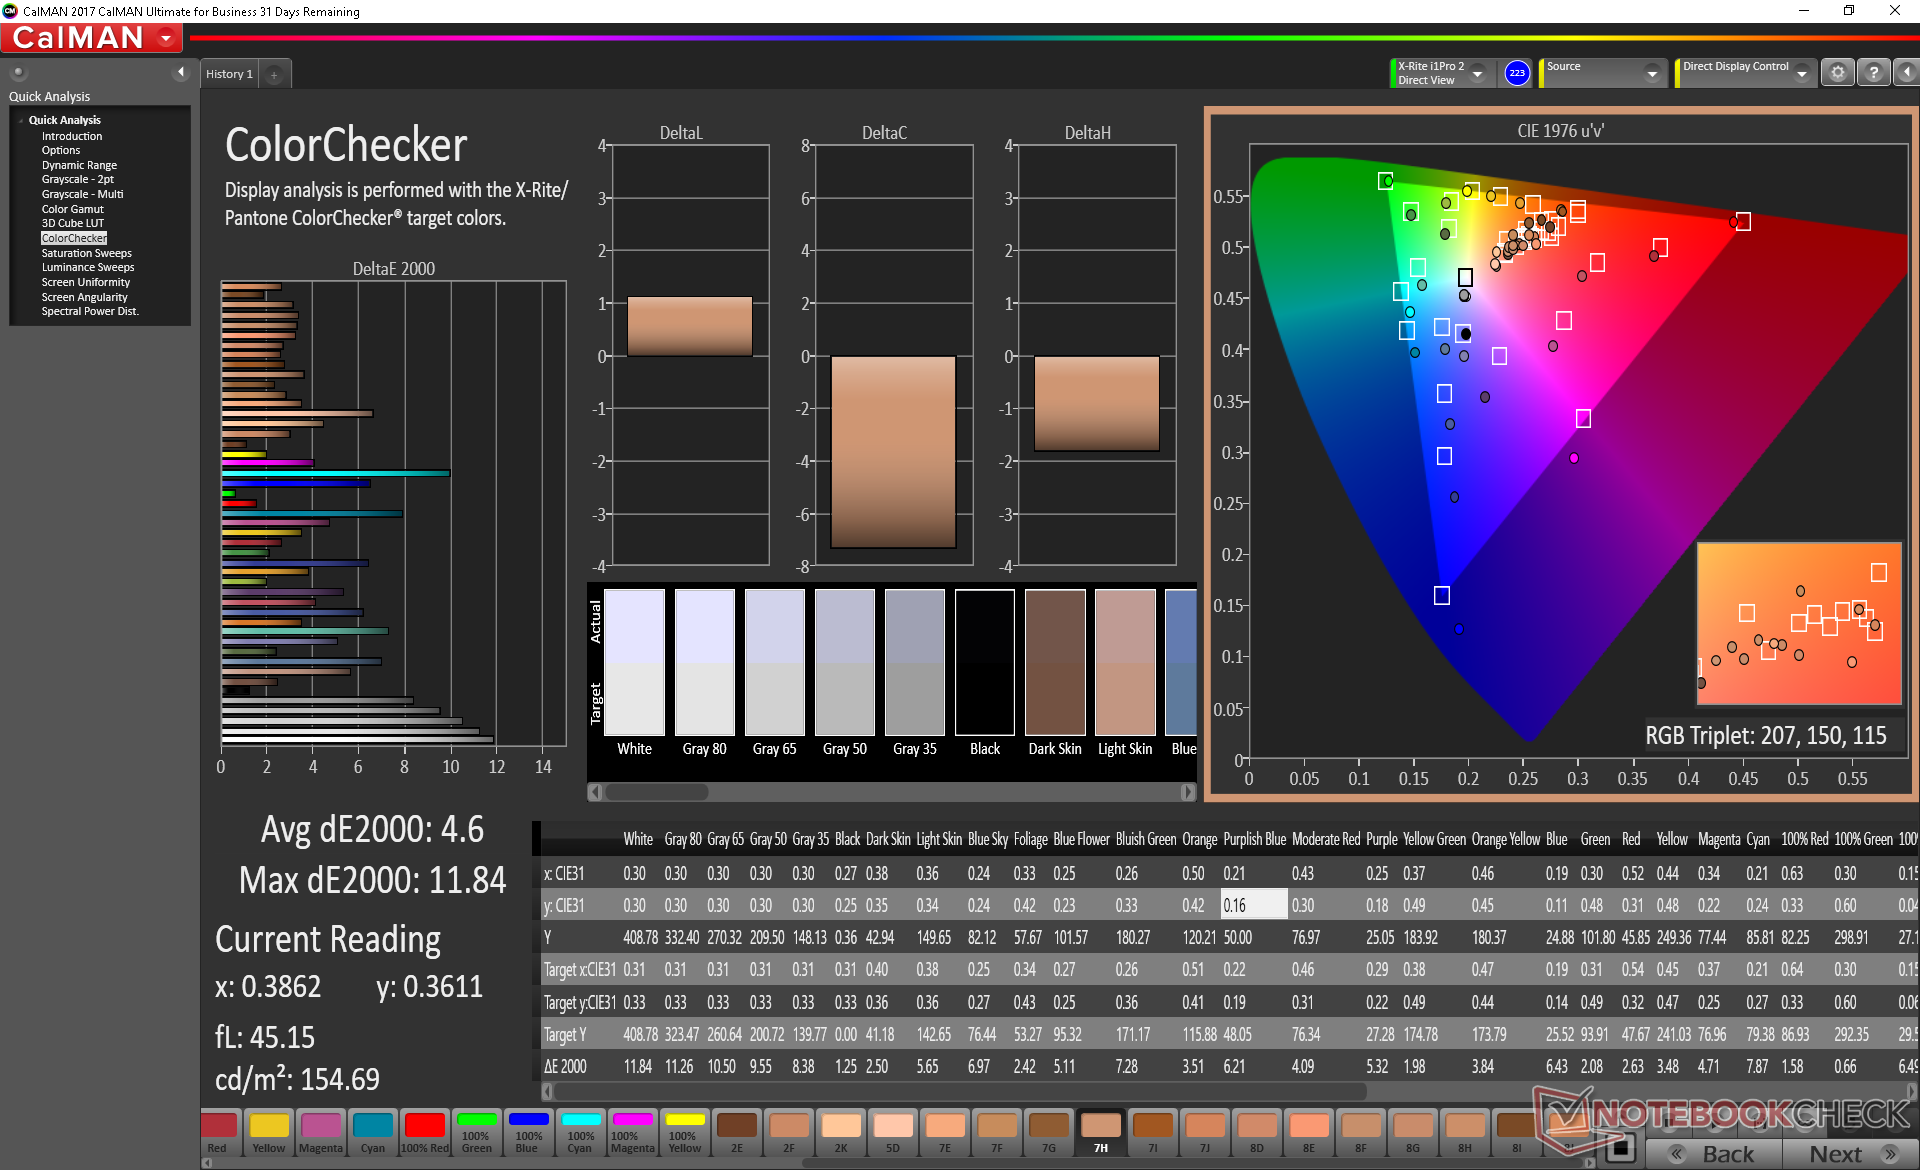
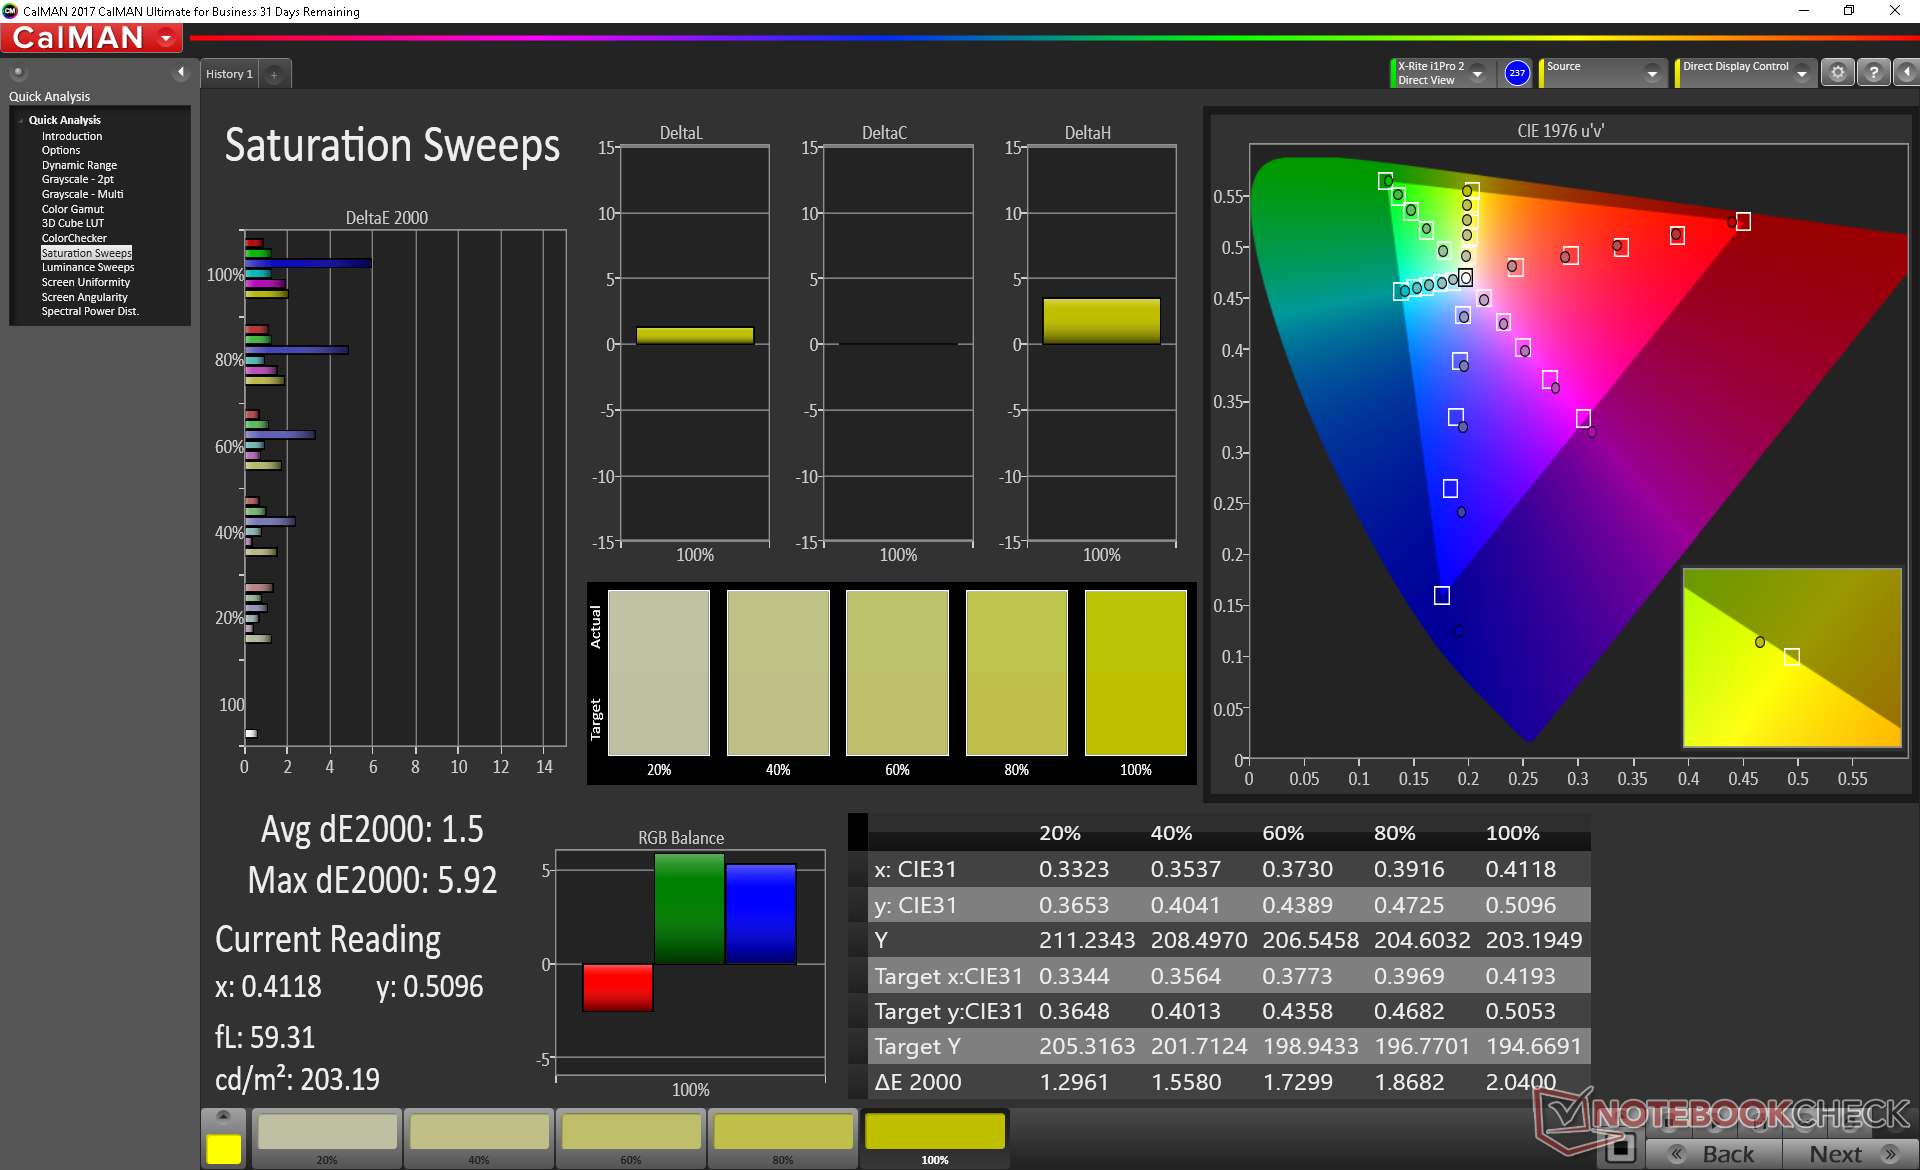
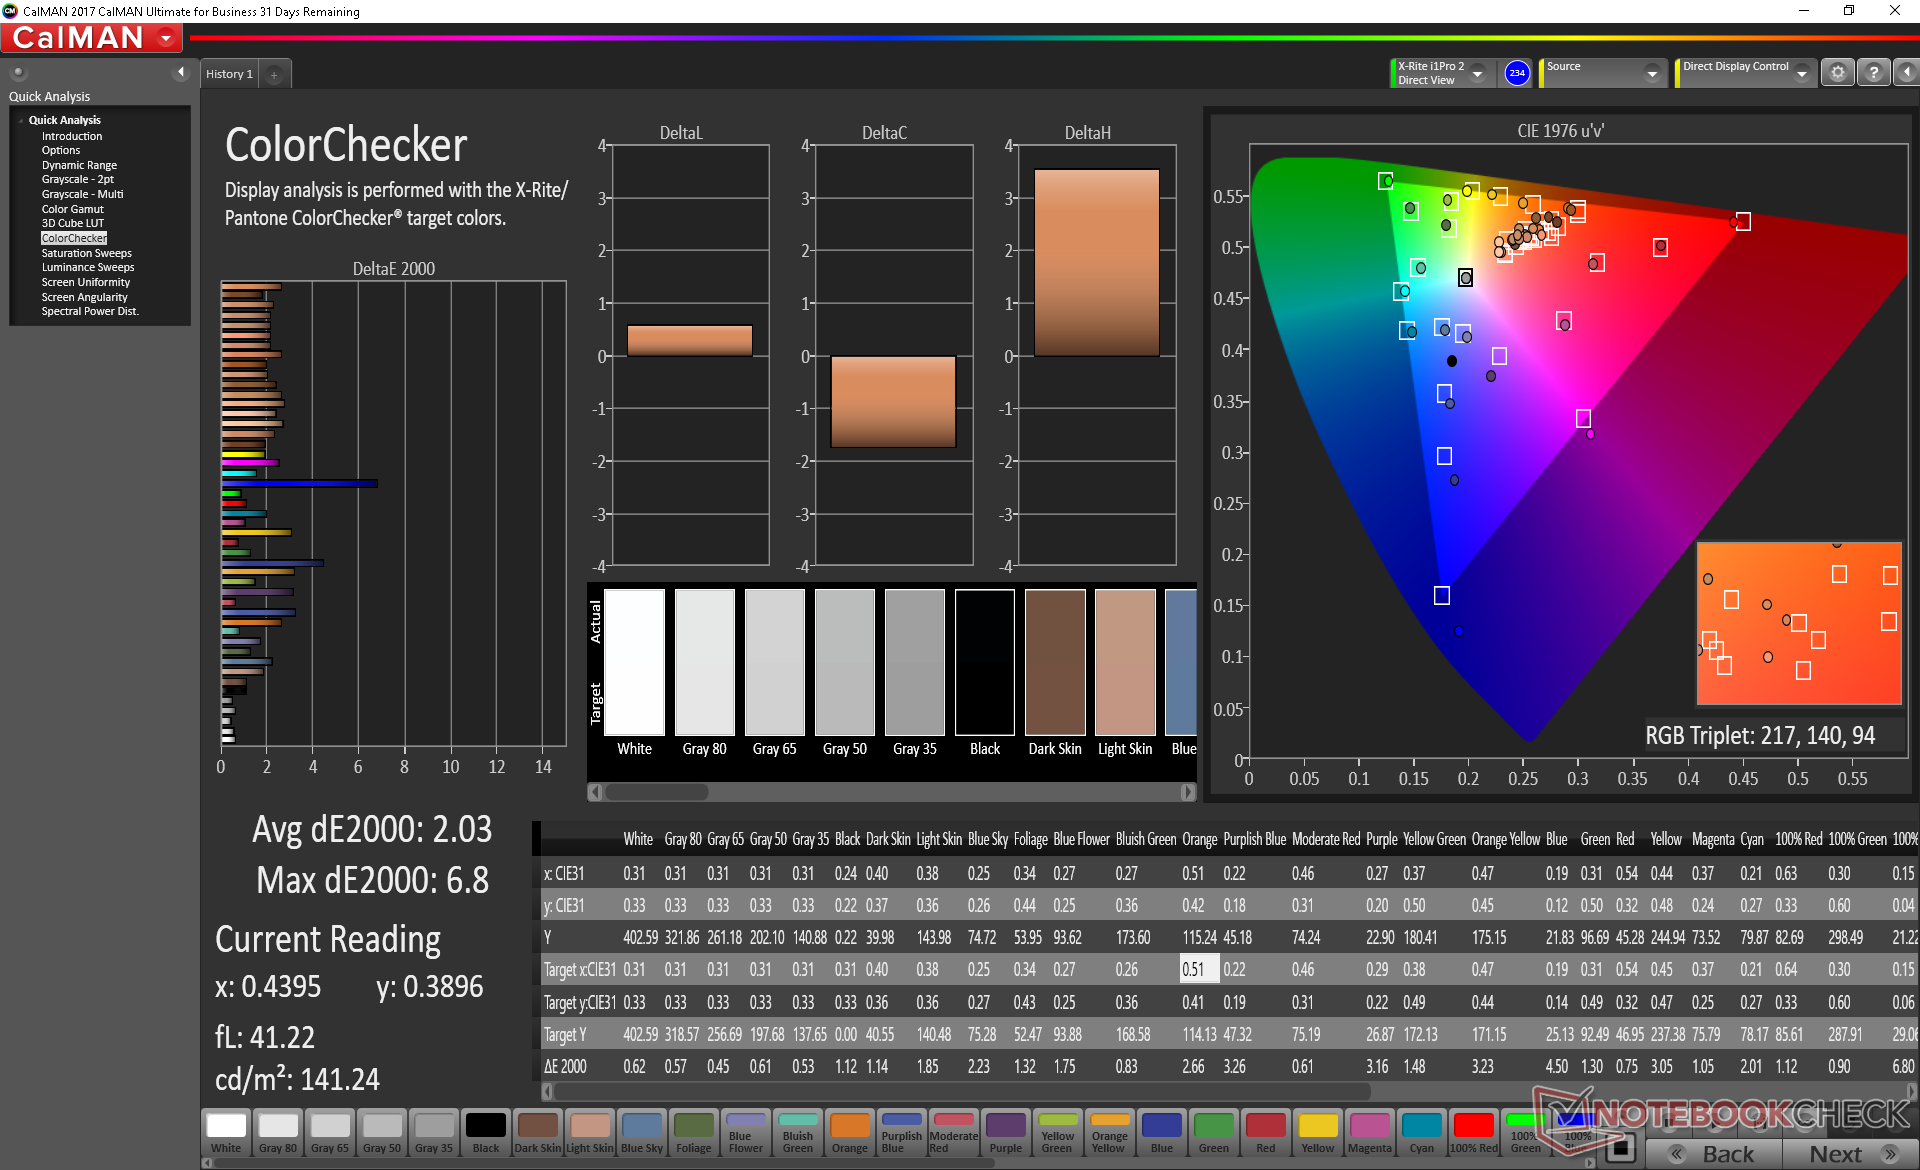
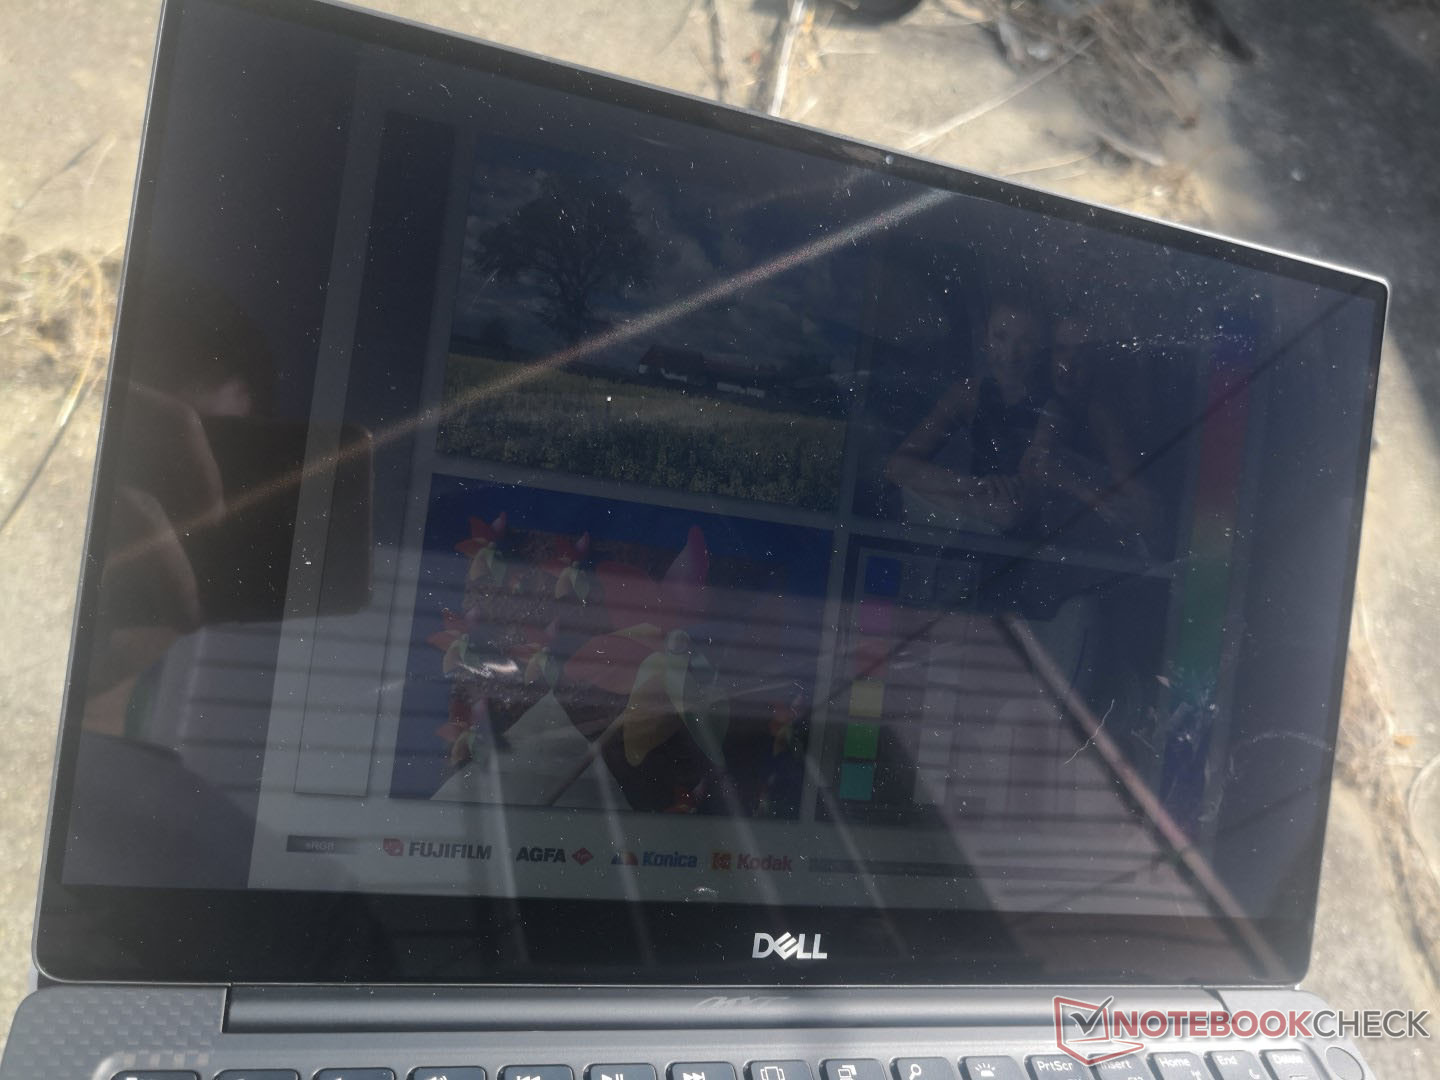
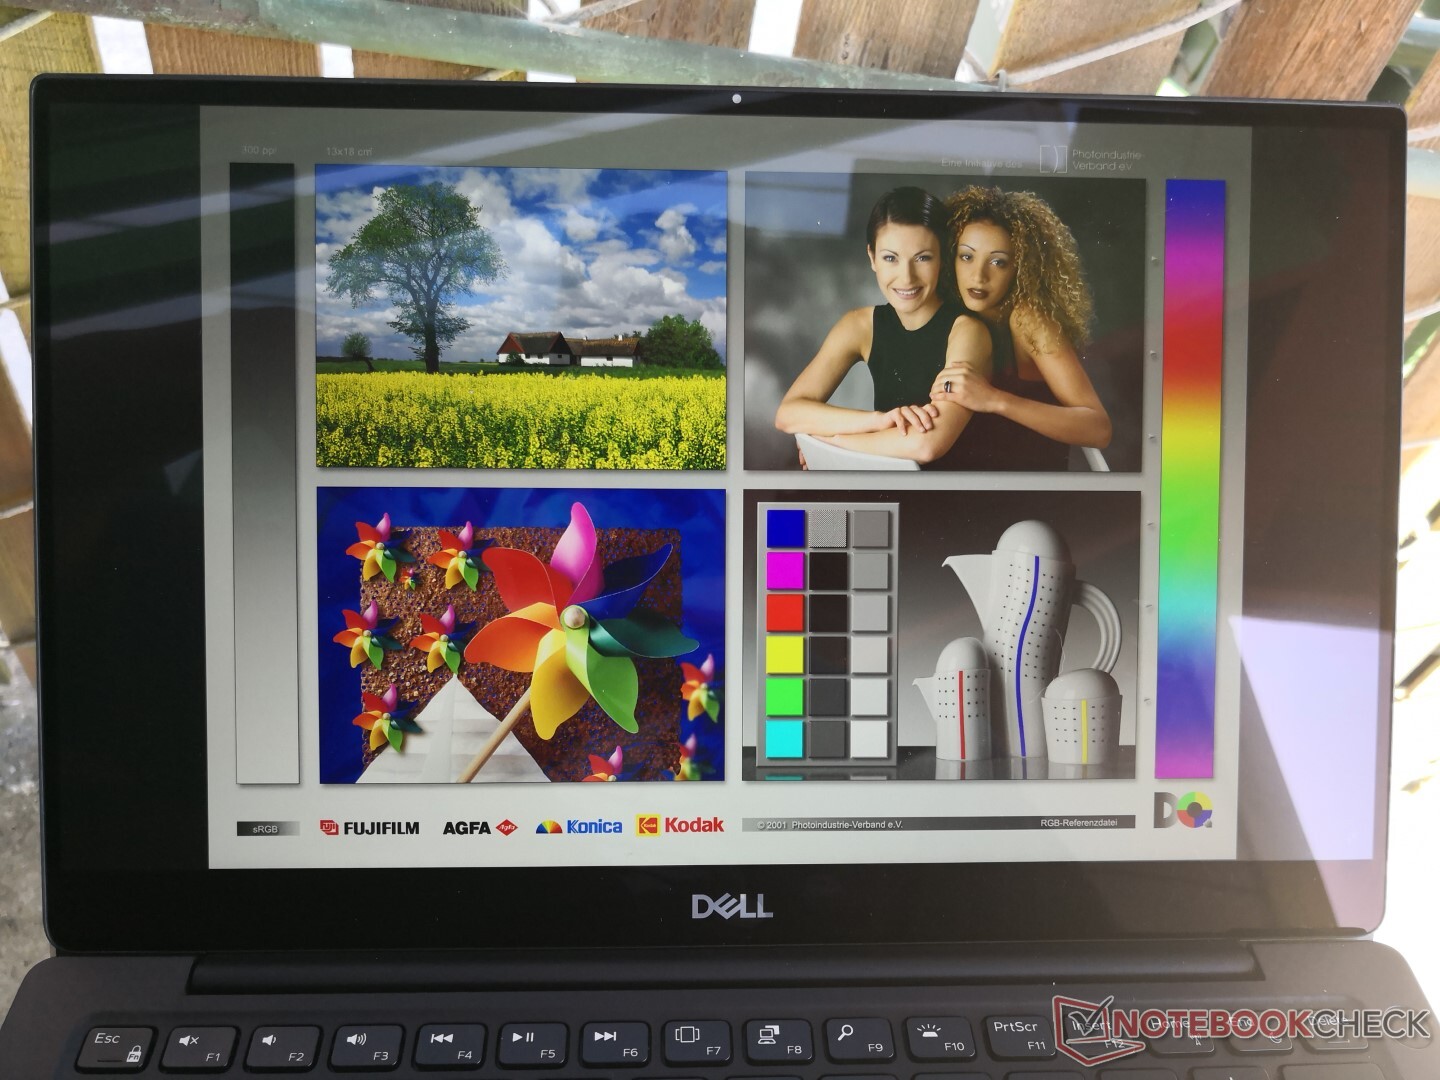
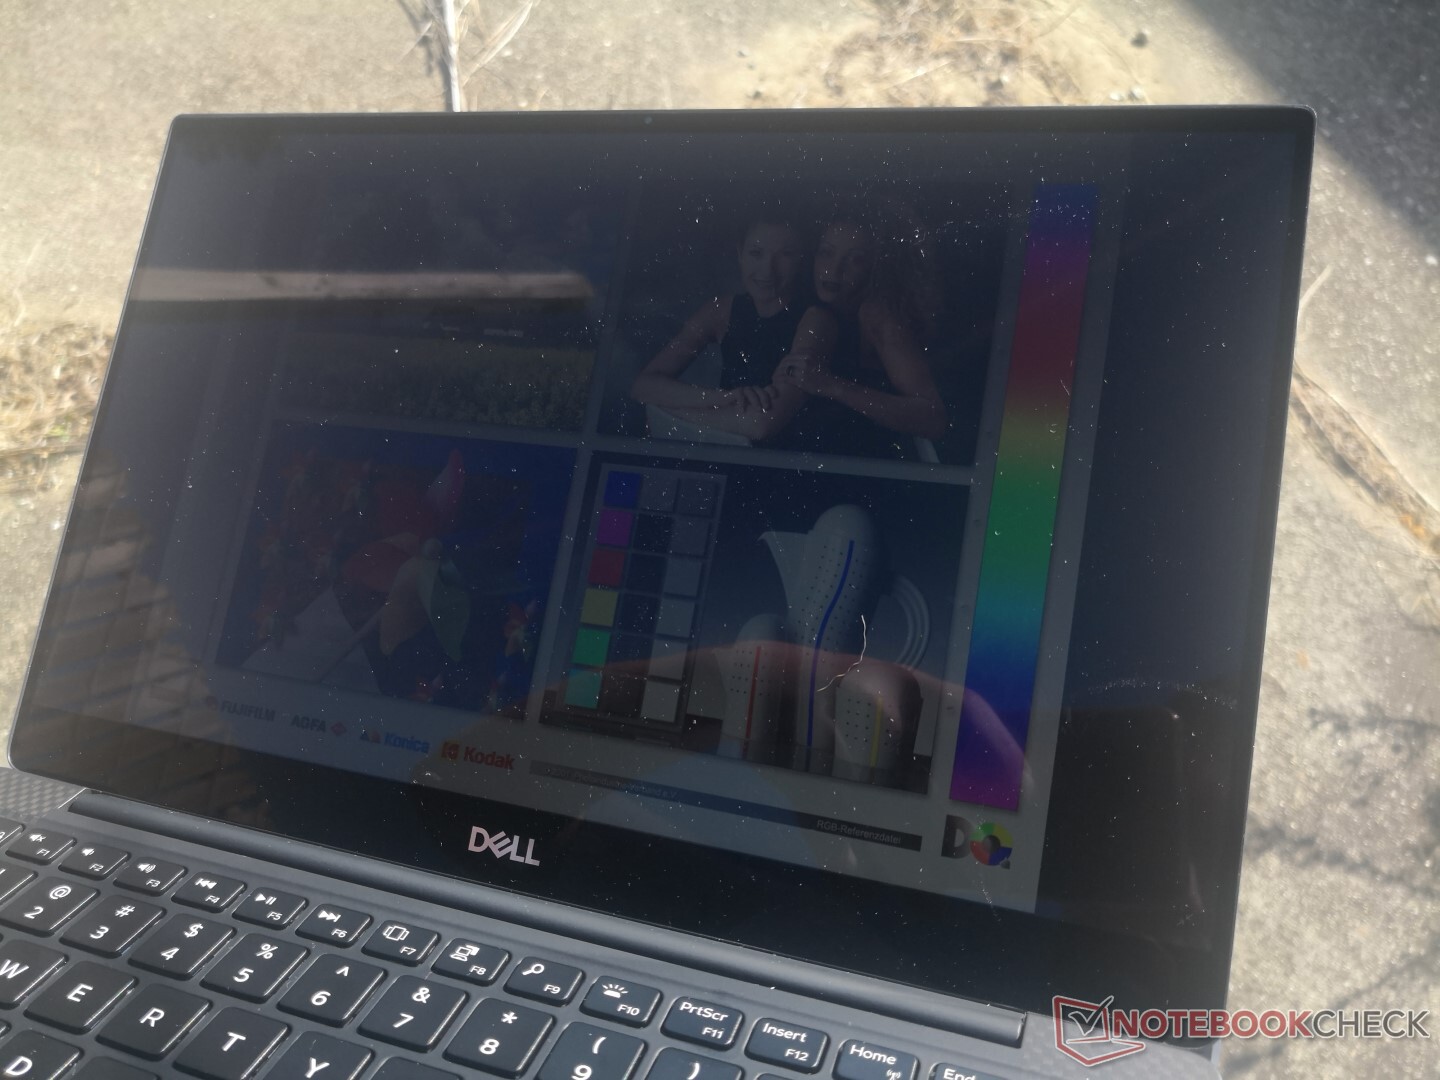
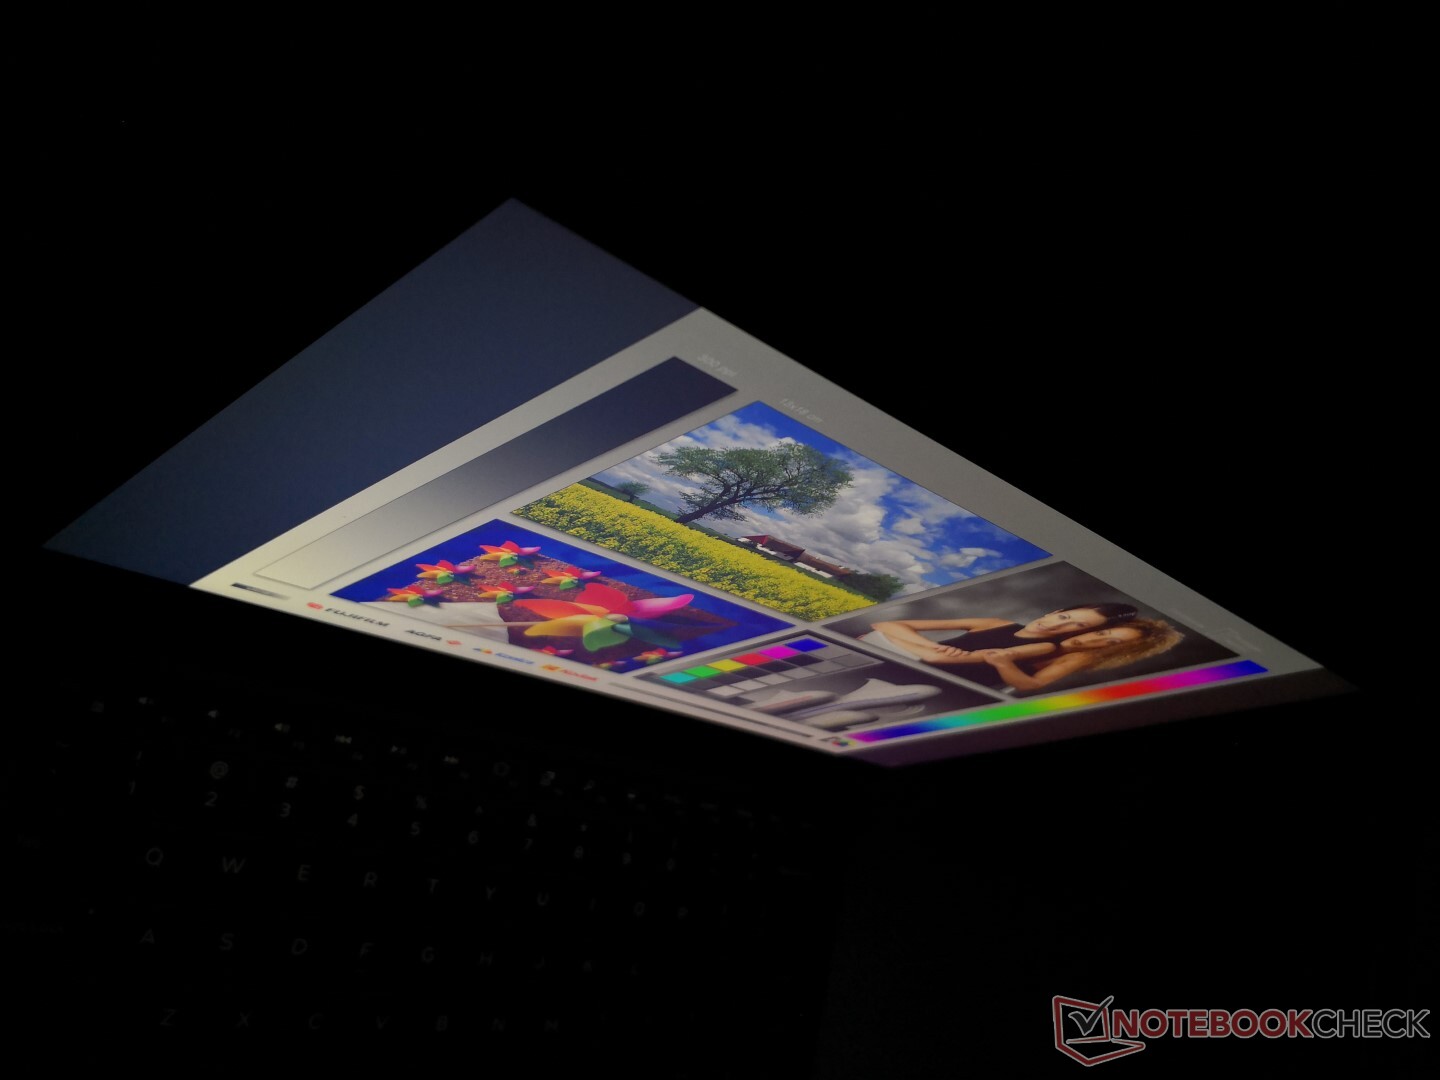
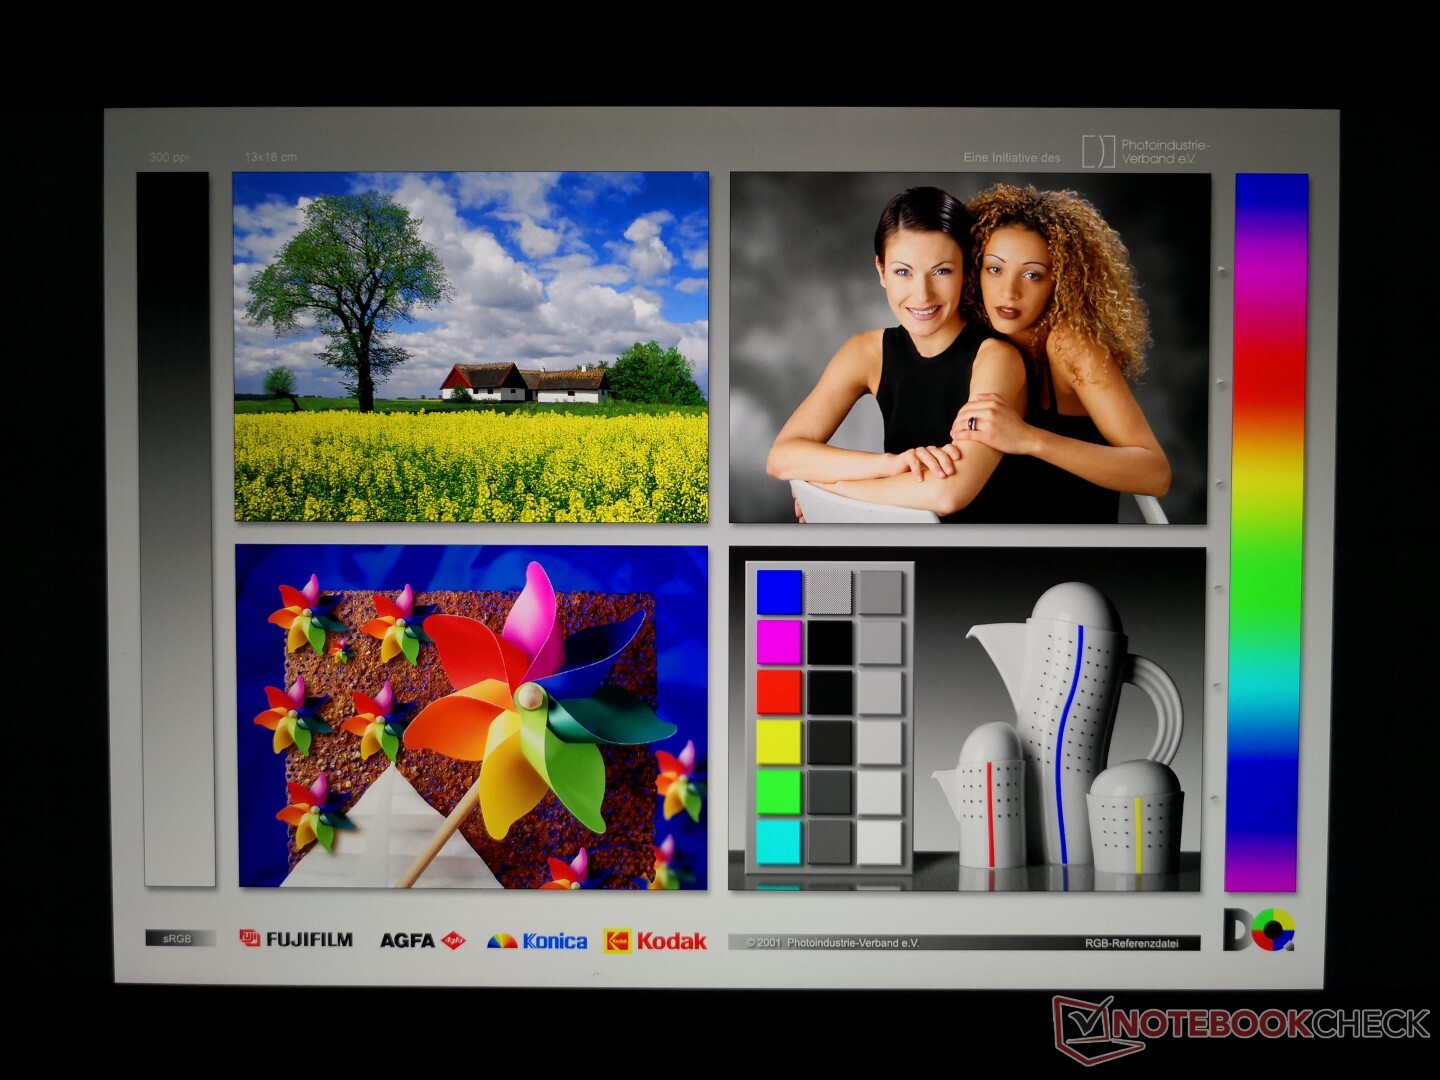
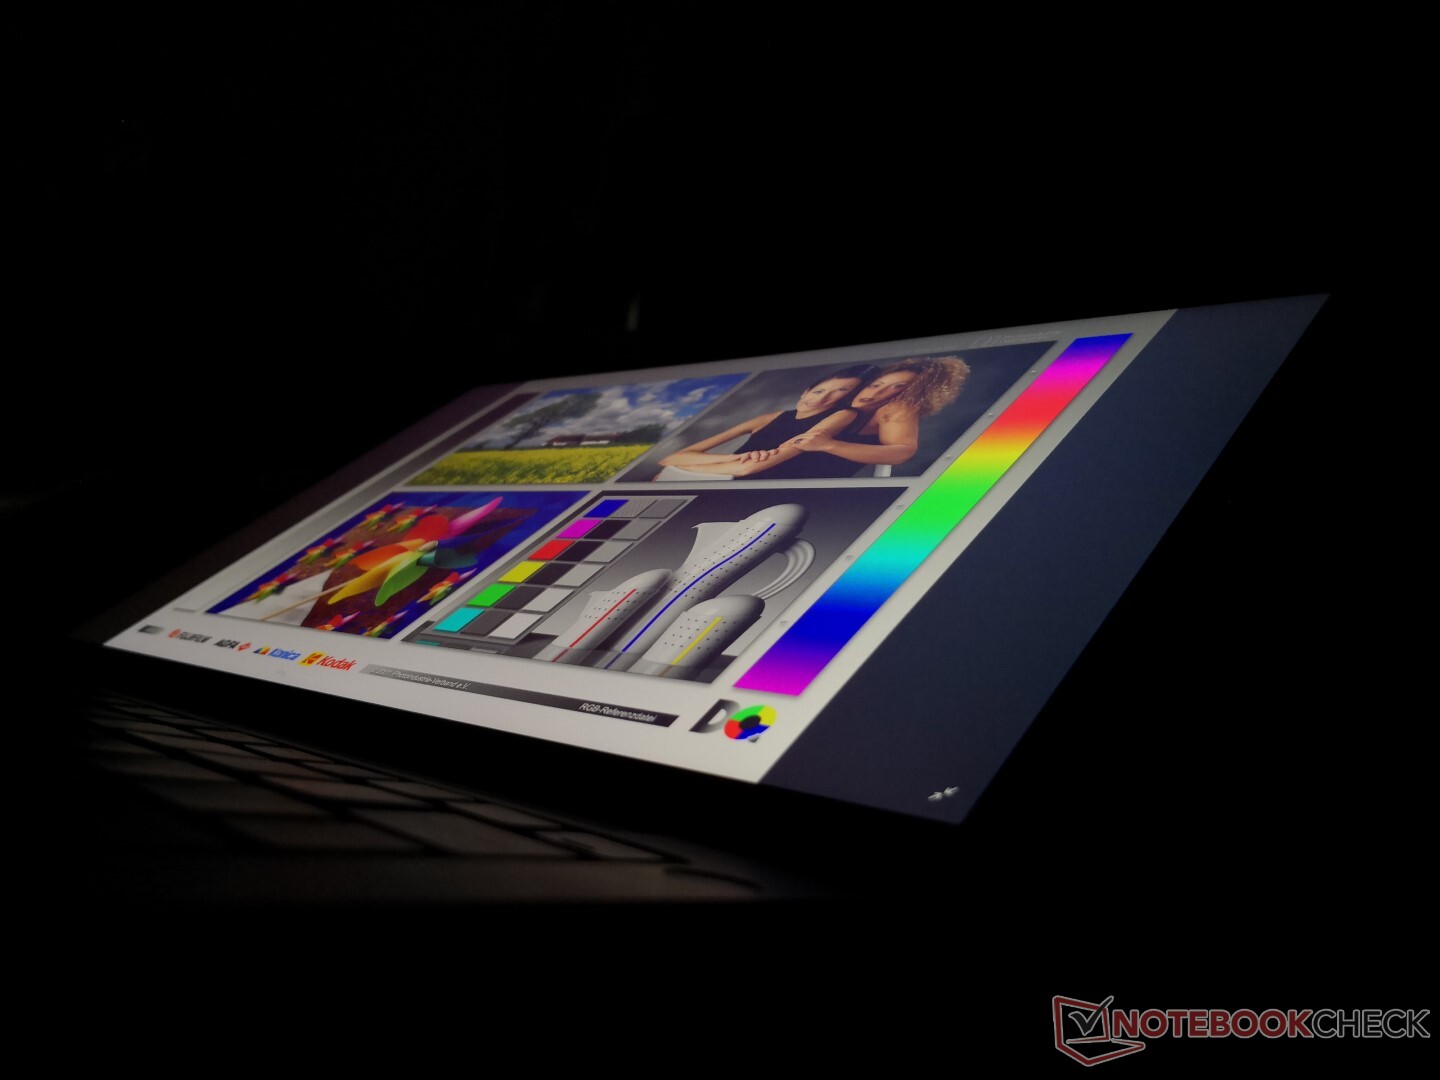
Dell, Comet Lake-U ünitemizi, XPS 13 9380 serisinde bulunan aynı 4K UHD AU Optronics B133ZAN IPS paneliyle donattı. Bu nedenle, renk kapsamı, tepki süreleri ve kontrast oranları gibi doğuştan gelen özellikler, aralarında neredeyse aynıdır. Ancak, arka ışık kanamasının azalması, bu sefer biraz daha kötüdür. Resmimiz siyah kenarlıklı videoları izlerken farkedilir hale gelen ekranın köşelerinde orta derecede kanama gösterir. Maksimum parlaklık, bir prizden çekildiğinde 400 nit'den yaklaşık 300 nit'e düşer. Diğer dizüstü bilgisayarların aksine, bu güç tasarrufu davranışı yalnızca XPS 13 BIOS üzerinden değiştirilebilir.
| |||||||||||||||||||||||||
Aydınlatma: 89 %
Batarya modunda parlaklık: 311.7 cd/m²
Kontrast: 1047:1 (Siyah: 0.39 cd/m²)
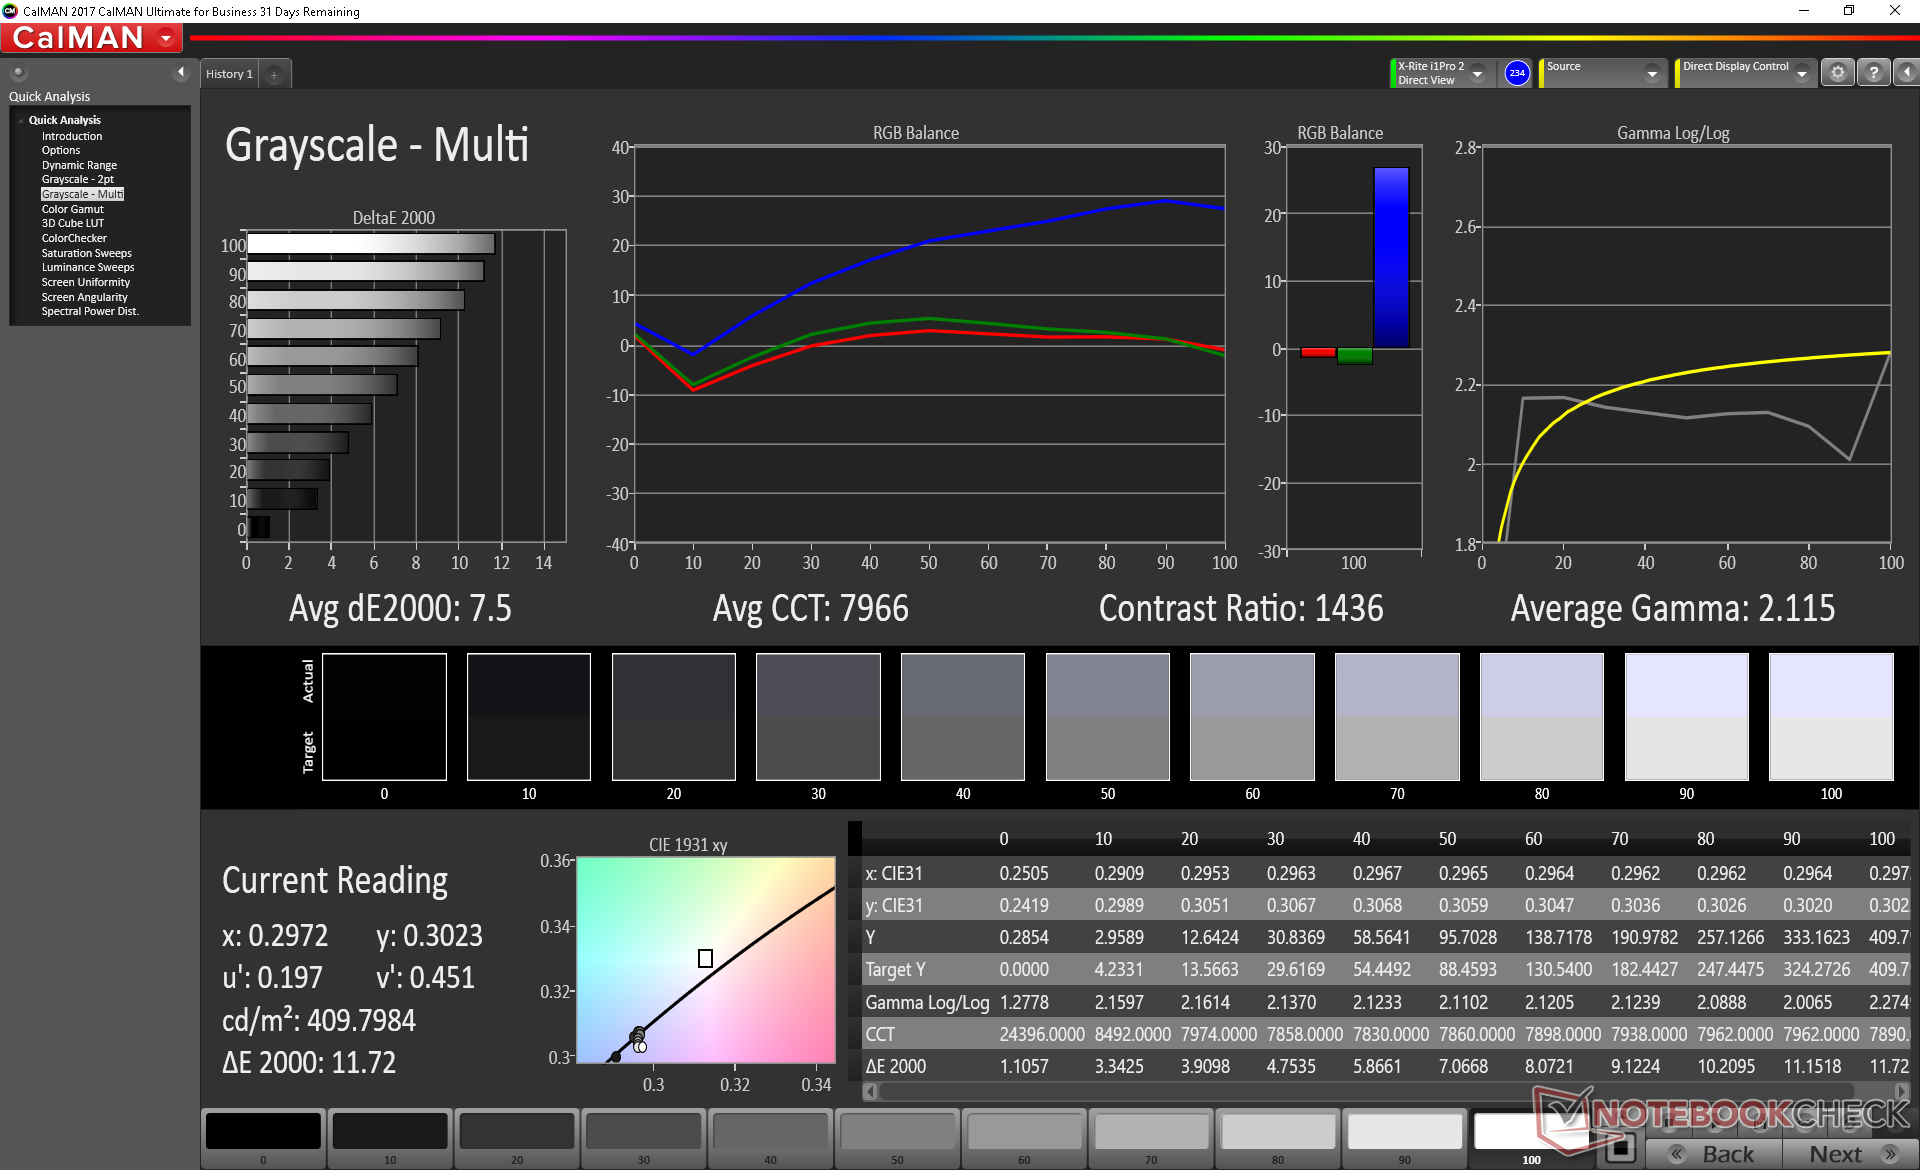
ΔE ColorChecker Calman: 4.6 | ∀{0.5-29.43 Ø4.73}
calibrated: 2.03
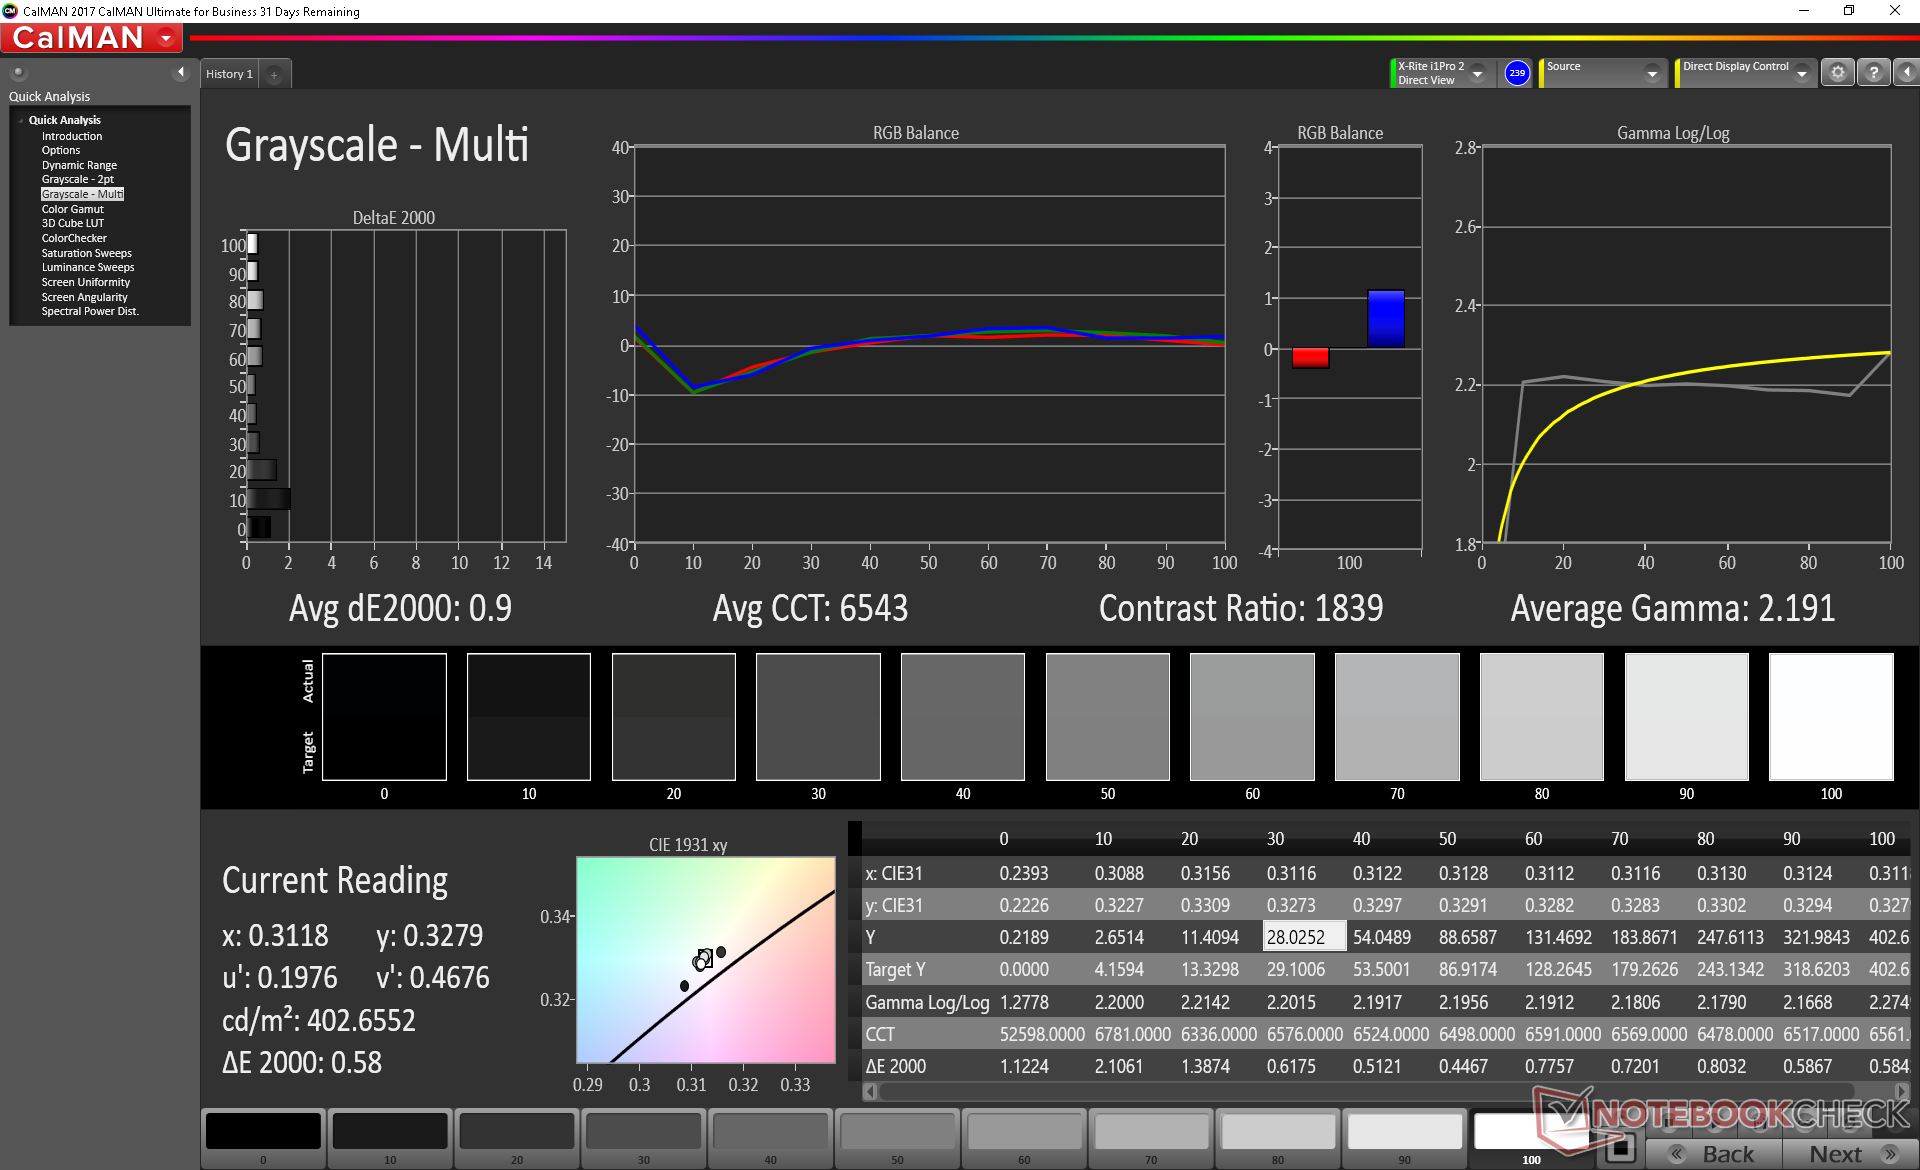
ΔE Greyscale Calman: 7.5 | ∀{0.09-98 Ø4.97}
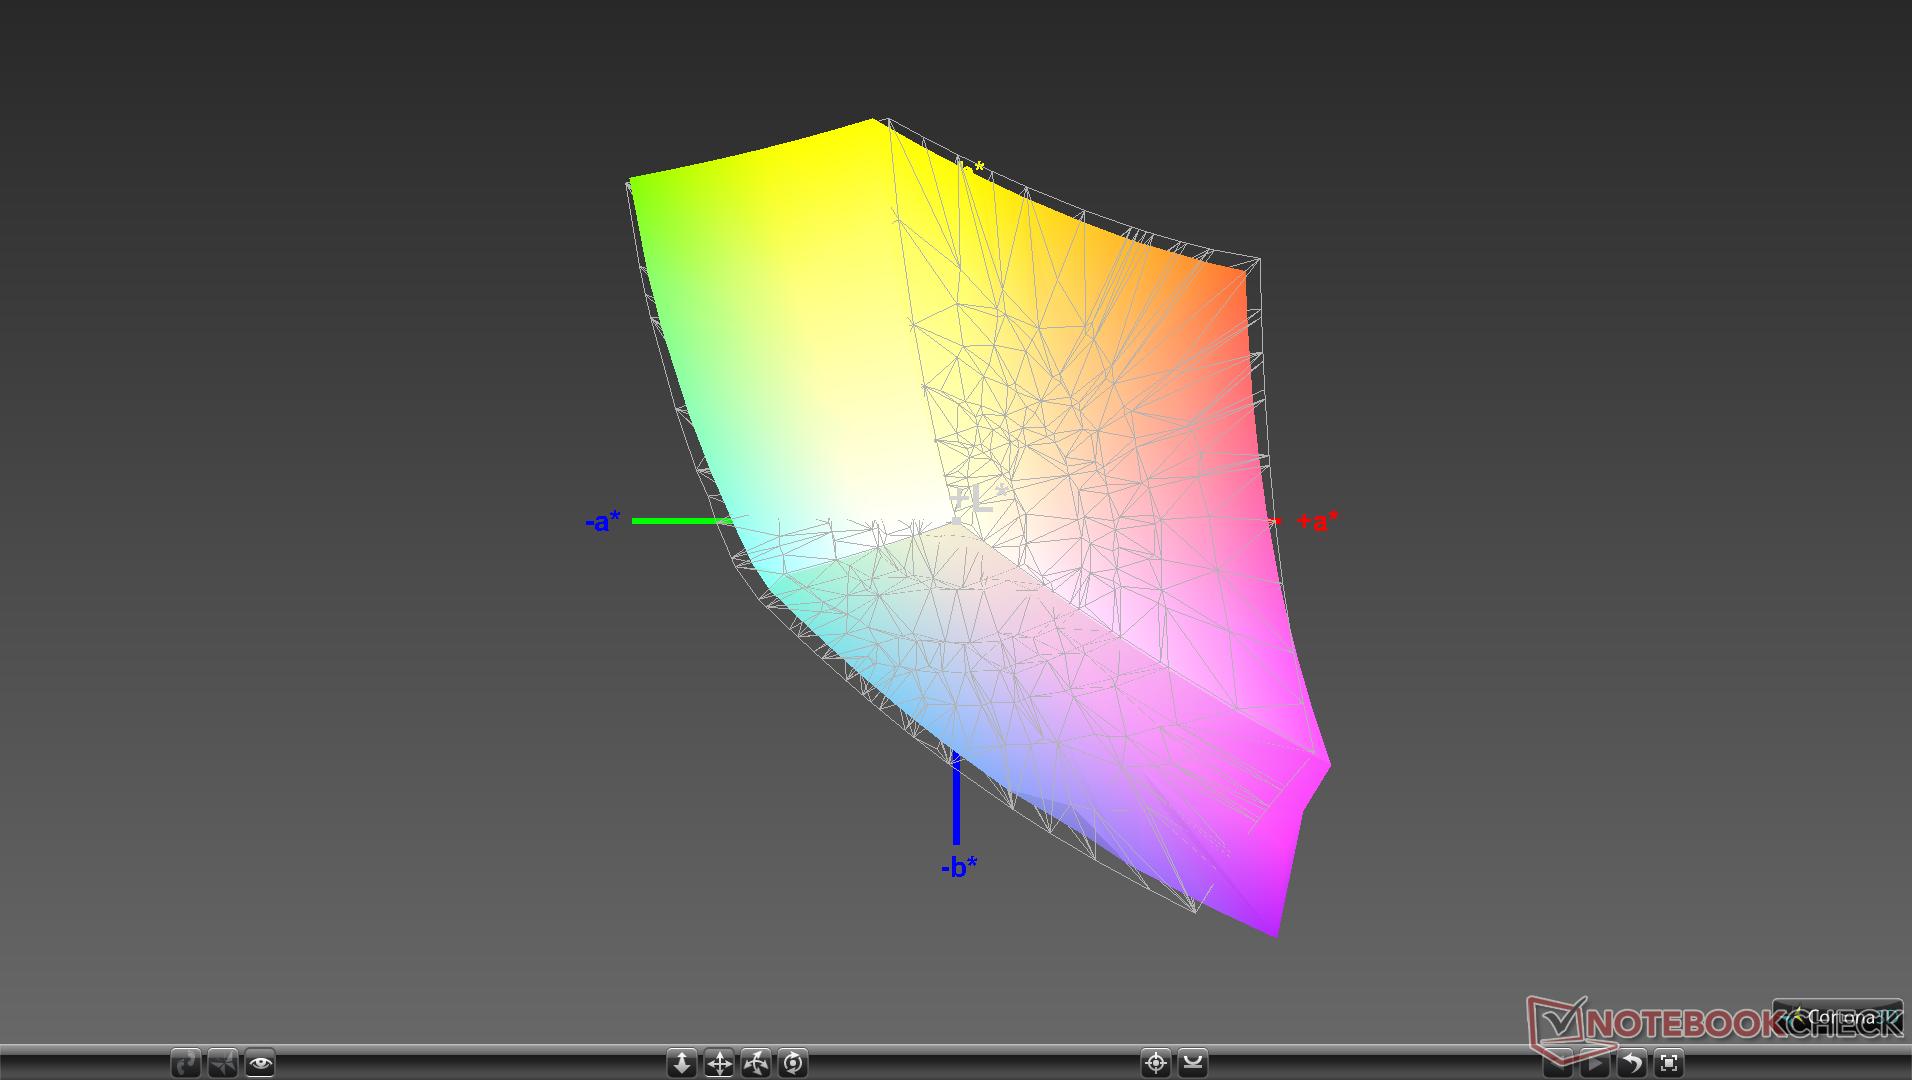
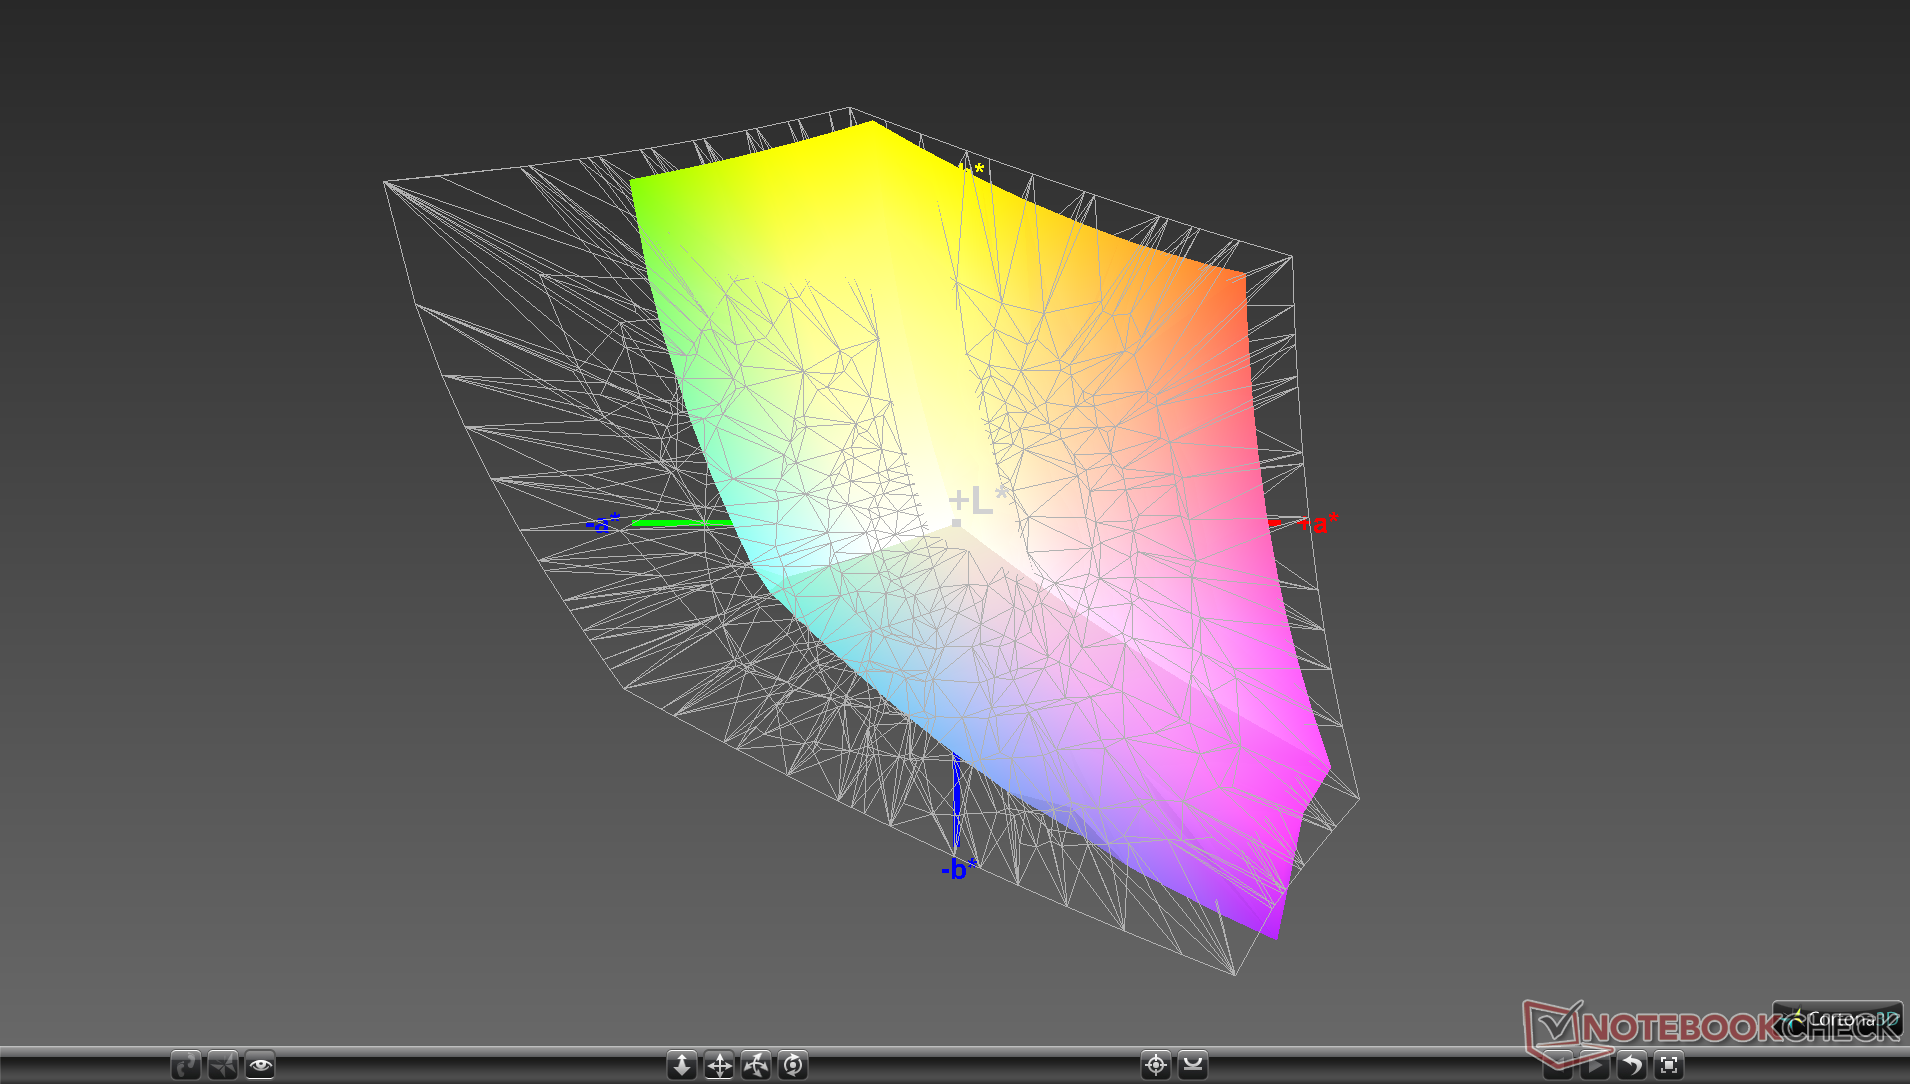
93.5% sRGB (Argyll 1.6.3 3D)
59.5% AdobeRGB 1998 (Argyll 1.6.3 3D)
64.3% AdobeRGB 1998 (Argyll 3D)
93.7% sRGB (Argyll 3D)
63.4% Display P3 (Argyll 3D)
Gamma: 2.12
CCT: 7966 K
| Dell XPS 13 7390 Core i7-10710U AU Optronics B133ZAN, Dell P/N: 90NTH, IPS, 13.3", 3840x2160 | Dell XPS 13 7390 2-in-1 Core i7 Sharp LQ134N1, IPS, 13.4", 1920x1200 | Dell XPS 13 9380 i7 4K ID: AUO 282B B133ZAN Dell: 90NTH, IPS, 13.3", 3840x2160 | Dell XPS 13 9380 2019 ID: AUO 282B B133ZAN Dell: 90NTH, IPS, 13.3", 3840x2160 | Dell XPS 13 9370 i7 UHD ID: Sharp SHP148B, Name: LQ133D1, Dell P/N: 8XDHY, IPS, 13.3", 3840x2160 | Dell XPS 13 i5-8250U ID: Sharp SHP144A, Name: LQ133Z1, IGZO IPS, 13.3", 3200x1800 | |
|---|---|---|---|---|---|---|
| Display | 9% | 1% | 1% | 7% | 0% | |
| Display P3 Coverage (%) | 63.4 | 69.9 10% | 64.8 2% | 64.7 2% | 68.9 9% | 63.9 1% |
| sRGB Coverage (%) | 93.7 | 99.2 6% | 93.6 0% | 93.1 -1% | 98.4 5% | 91.7 -2% |
| AdobeRGB 1998 Coverage (%) | 64.3 | 71.5 11% | 65.8 2% | 65.3 2% | 69.5 8% | 65.7 2% |
| Response Times | 11% | -20% | -10% | -33% | 28% | |
| Response Time Grey 50% / Grey 80% * (ms) | 51.6 ? | 47.6 ? 8% | 64.8 ? -26% | 58 ? -12% | 69.6 ? -35% | 29 ? 44% |
| Response Time Black / White * (ms) | 33.6 ? | 29.2 ? 13% | 38 ? -13% | 36 ? -7% | 44 ? -31% | 30 ? 11% |
| PWM Frequency (Hz) | 2500 ? | 3759 ? | 19500 ? | |||
| Screen | 30% | 21% | 9% | 18% | 1% | |
| Brightness middle (cd/m²) | 408.2 | 549.8 35% | 428.3 5% | 404 -1% | 478.5 17% | 361 -12% |
| Brightness (cd/m²) | 399 | 520 30% | 414 4% | 389 -3% | 466 17% | 303 -24% |
| Brightness Distribution (%) | 89 | 86 -3% | 88 -1% | 85 -4% | 86 -3% | 72 -19% |
| Black Level * (cd/m²) | 0.39 | 0.39 -0% | 0.27 31% | 0.37 5% | 0.43 -10% | 0.33 15% |
| Contrast (:1) | 1047 | 1410 35% | 1586 51% | 1092 4% | 1113 6% | 1094 4% |
| Colorchecker dE 2000 * | 4.6 | 2.12 54% | 2.69 42% | 3.72 19% | 3.09 33% | 5.26 -14% |
| Colorchecker dE 2000 max. * | 11.84 | 3.66 69% | 6.19 48% | 7.38 38% | 5.94 50% | 7.79 34% |
| Colorchecker dE 2000 calibrated * | 2.03 | 1.37 33% | 2.01 1% | 2.06 -1% | 2.06 -1% | |
| Greyscale dE 2000 * | 7.5 | 2.6 65% | 3.7 51% | 4.44 41% | 2.4 68% | 5.69 24% |
| Gamma | 2.12 104% | 2.3 96% | 2.1 105% | 2.34 94% | 2.063 107% | 1.63 135% |
| CCT | 7966 82% | 6884 94% | 6706 97% | 7095 92% | 6883 94% | 6499 100% |
| Color Space (Percent of AdobeRGB 1998) (%) | 59.5 | 65.4 10% | 60.4 2% | 60 1% | 69.47 17% | 59 -1% |
| Color Space (Percent of sRGB) (%) | 93.5 | 99.7 7% | 93.5 0% | 93 -1% | 98.36 5% | 92 -2% |
| Toplam Ortalama (Program / Ayarlar) | 17% /
24% | 1% /
12% | 0% /
5% | -3% /
10% | 10% /
4% |
* ... daha küçük daha iyidir
Yanıt Sürelerini Görüntüle
| ↔ Tepki Süresi Siyahtan Beyaza | ||
|---|---|---|
| 33.6 ms ... yükseliş ↗ ve sonbahar↘ birleşimi | ↗ 17.2 ms yükseliş | 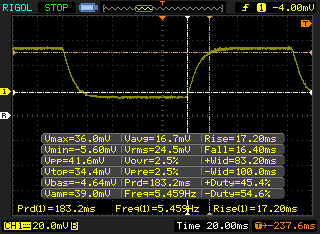 |
| ↘ 16.4 ms sonbahar | ||
| Ekran, testlerimizde yavaş yanıt oranları gösteriyor ve oyuncular için yetersiz olacaktır. Karşılaştırıldığında, test edilen tüm cihazlar 0.1 (minimum) ile 240 (maksimum) ms arasında değişir. » Tüm cihazların 90 %'si daha iyi. Bu, ölçülen yanıt süresinin test edilen tüm cihazların ortalamasından (19.9 ms) daha kötü olduğu anlamına gelir. | ||
| ↔ Tepki Süresi %50 Griden %80 Griye | ||
| 51.6 ms ... yükseliş ↗ ve sonbahar↘ birleşimi | ↗ 26.4 ms yükseliş | 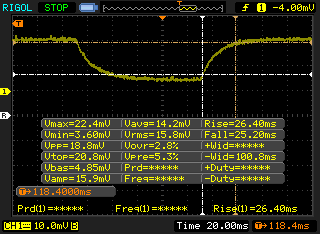 |
| ↘ 25.2 ms sonbahar | ||
| Ekran, testlerimizde yavaş yanıt oranları gösteriyor ve oyuncular için yetersiz olacaktır. Karşılaştırıldığında, test edilen tüm cihazlar 0.165 (minimum) ile 636 (maksimum) ms arasında değişir. » Tüm cihazların 88 %'si daha iyi. Bu, ölçülen yanıt süresinin test edilen tüm cihazların ortalamasından (31.1 ms) daha kötü olduğu anlamına gelir. | ||
Ekran Titremesi / PWM (Darbe Genişliği Modülasyonu)
| Ekran titriyor / PWM algılanmadı | 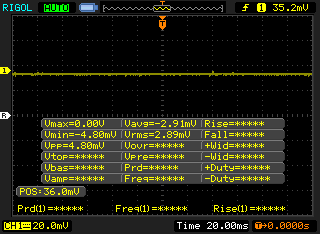 | ||
Karşılaştırıldığında: Test edilen tüm cihazların %52 %'si ekranı karartmak için PWM kullanmıyor. PWM tespit edilirse, ortalama 7798 (minimum: 5 - maksimum: 343500) Hz ölçüldü. | |||
Verim
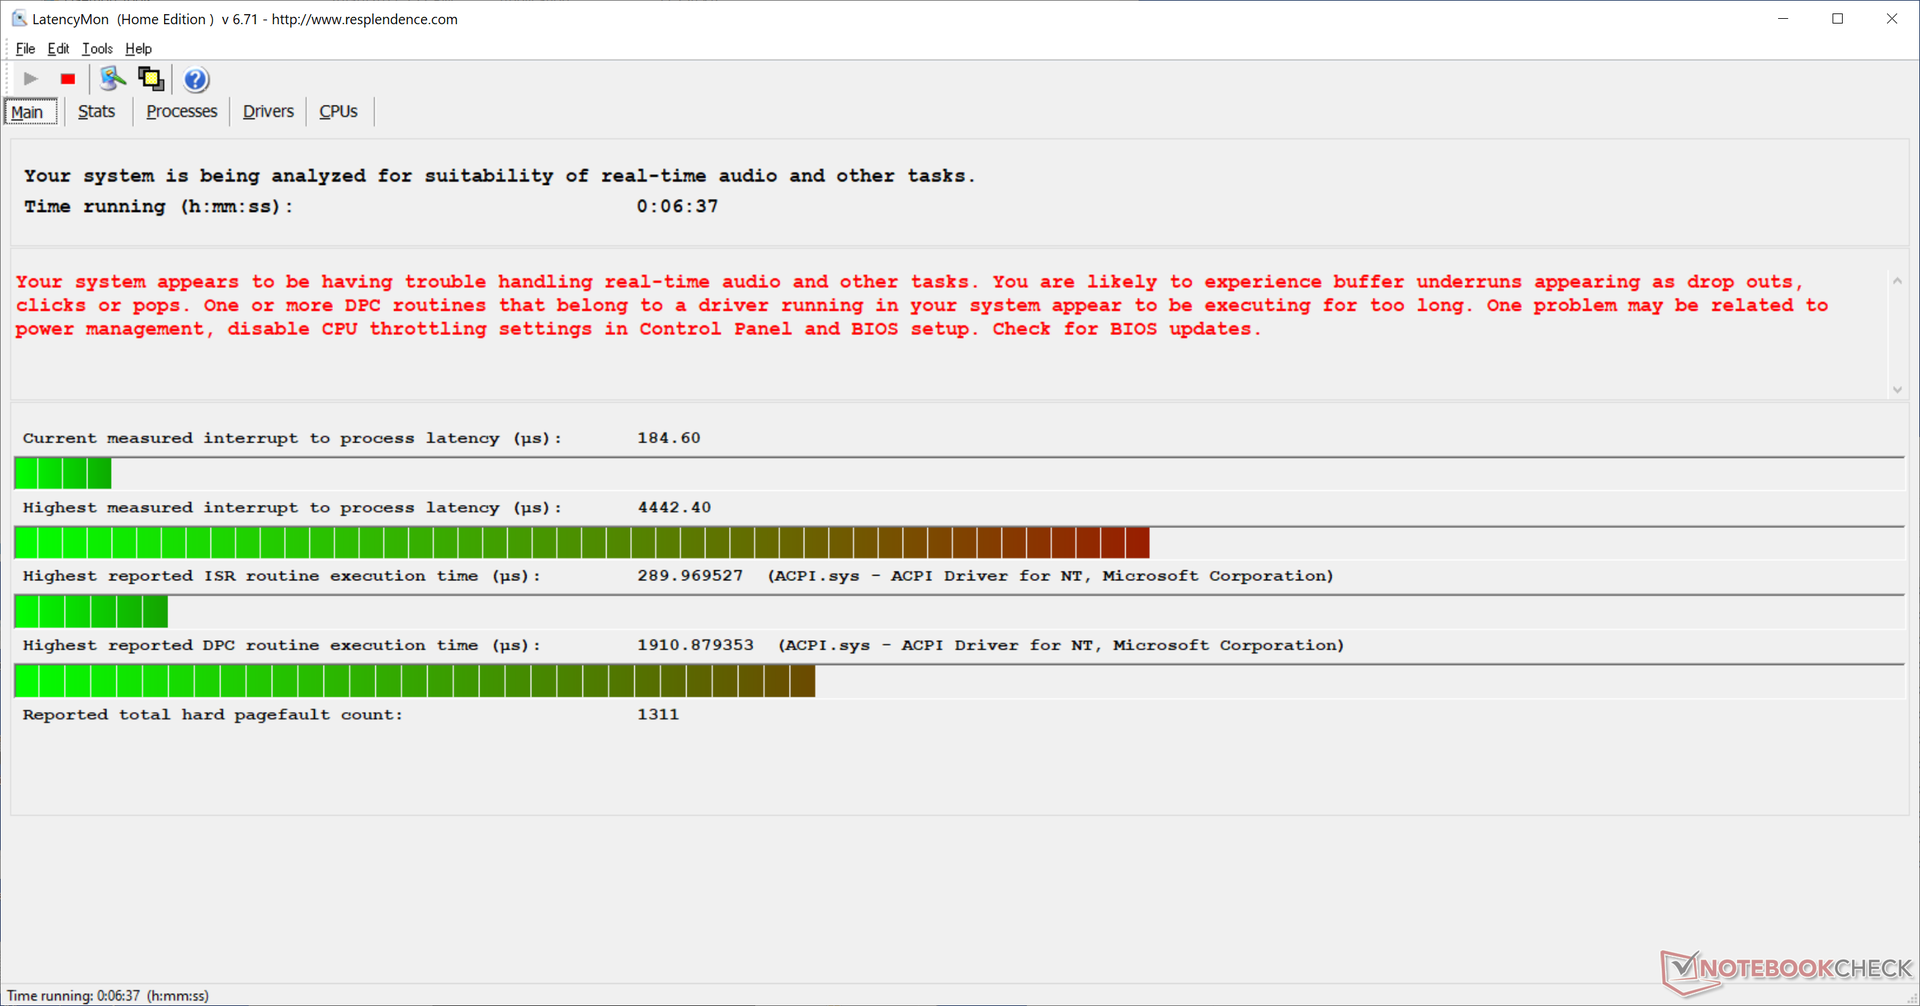
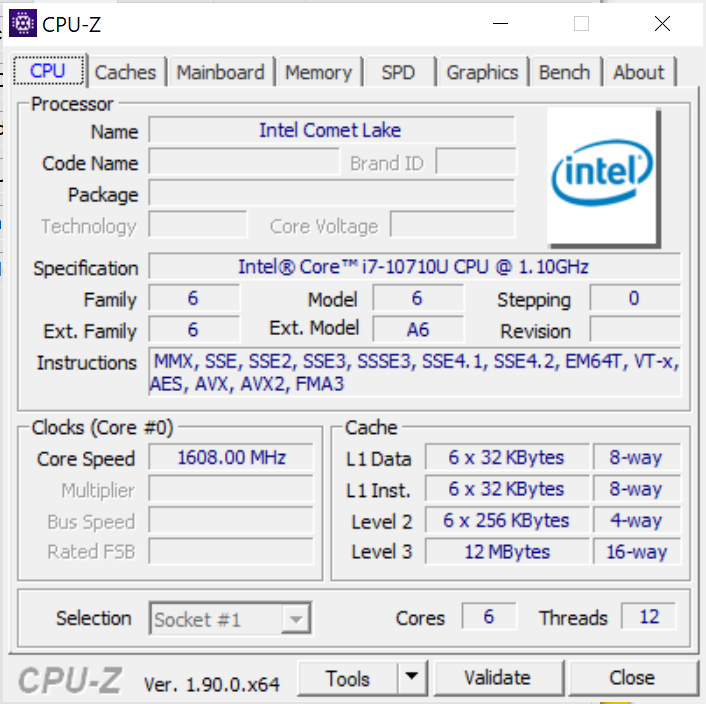
Çift çekirdekli Kaby Gölü'nden dört çekirdekli Kaby Gölü-R'ye atlamaya benzer şekilde, heksa çekirdekli Comet Gölü-U, aynı 15 W ila 25 W güç zarfının altındaki toplam 12 iplik için iki fiziksel çekirdek daha ekler. Intel, Core i7-8565U’daki 4.6 GHz’den Core i7-857U’daki 4.7 GHz’e tek çekirdekli Turbo Boost frekansını yükseltmeyi bile başardı. Daha az Core i5-10210U Comet Lake-U seçeneği dört çekirdekli olduğundan sadece Core i7 SKU'nun hexa-core olduğuna dikkat edin. Beklendiği gibi, XPS 13 hala eski kardeşlerinin çoğu gibi DPC gecikme sorunlarından muzdariptir.
İşlemci
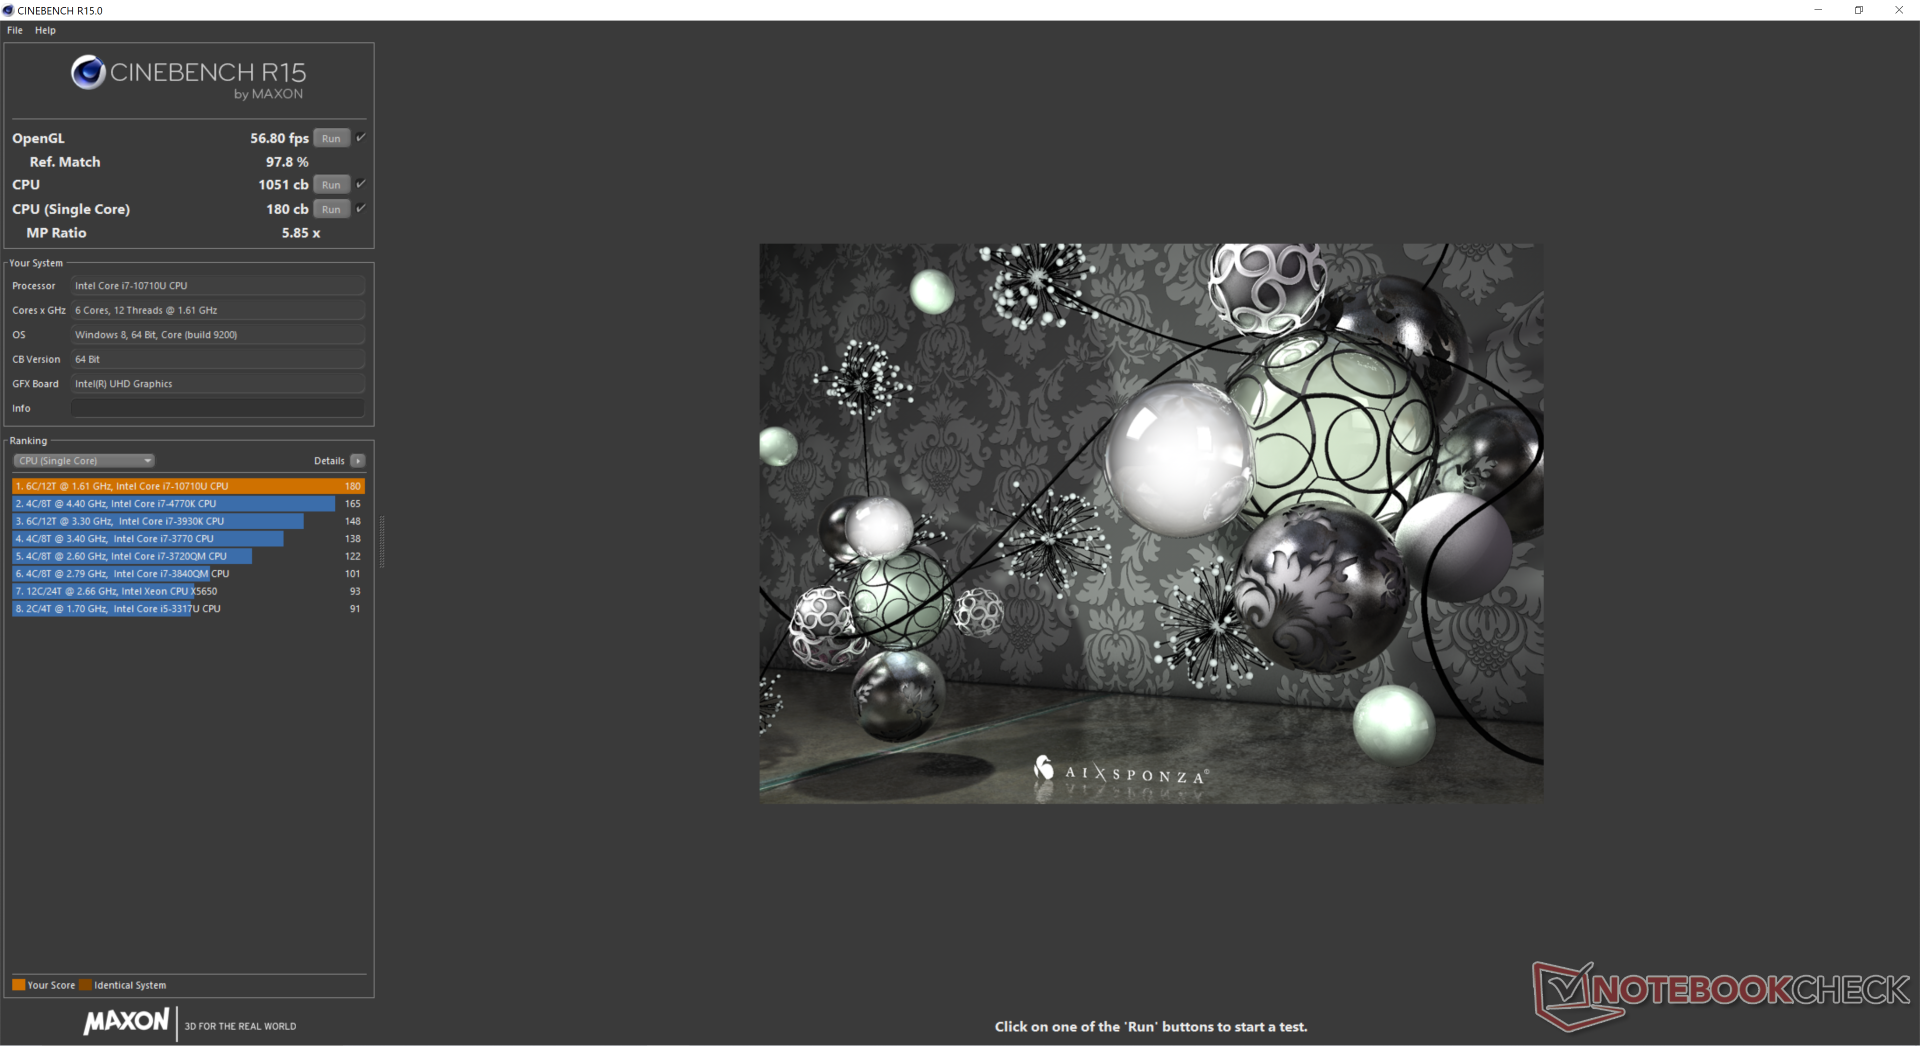
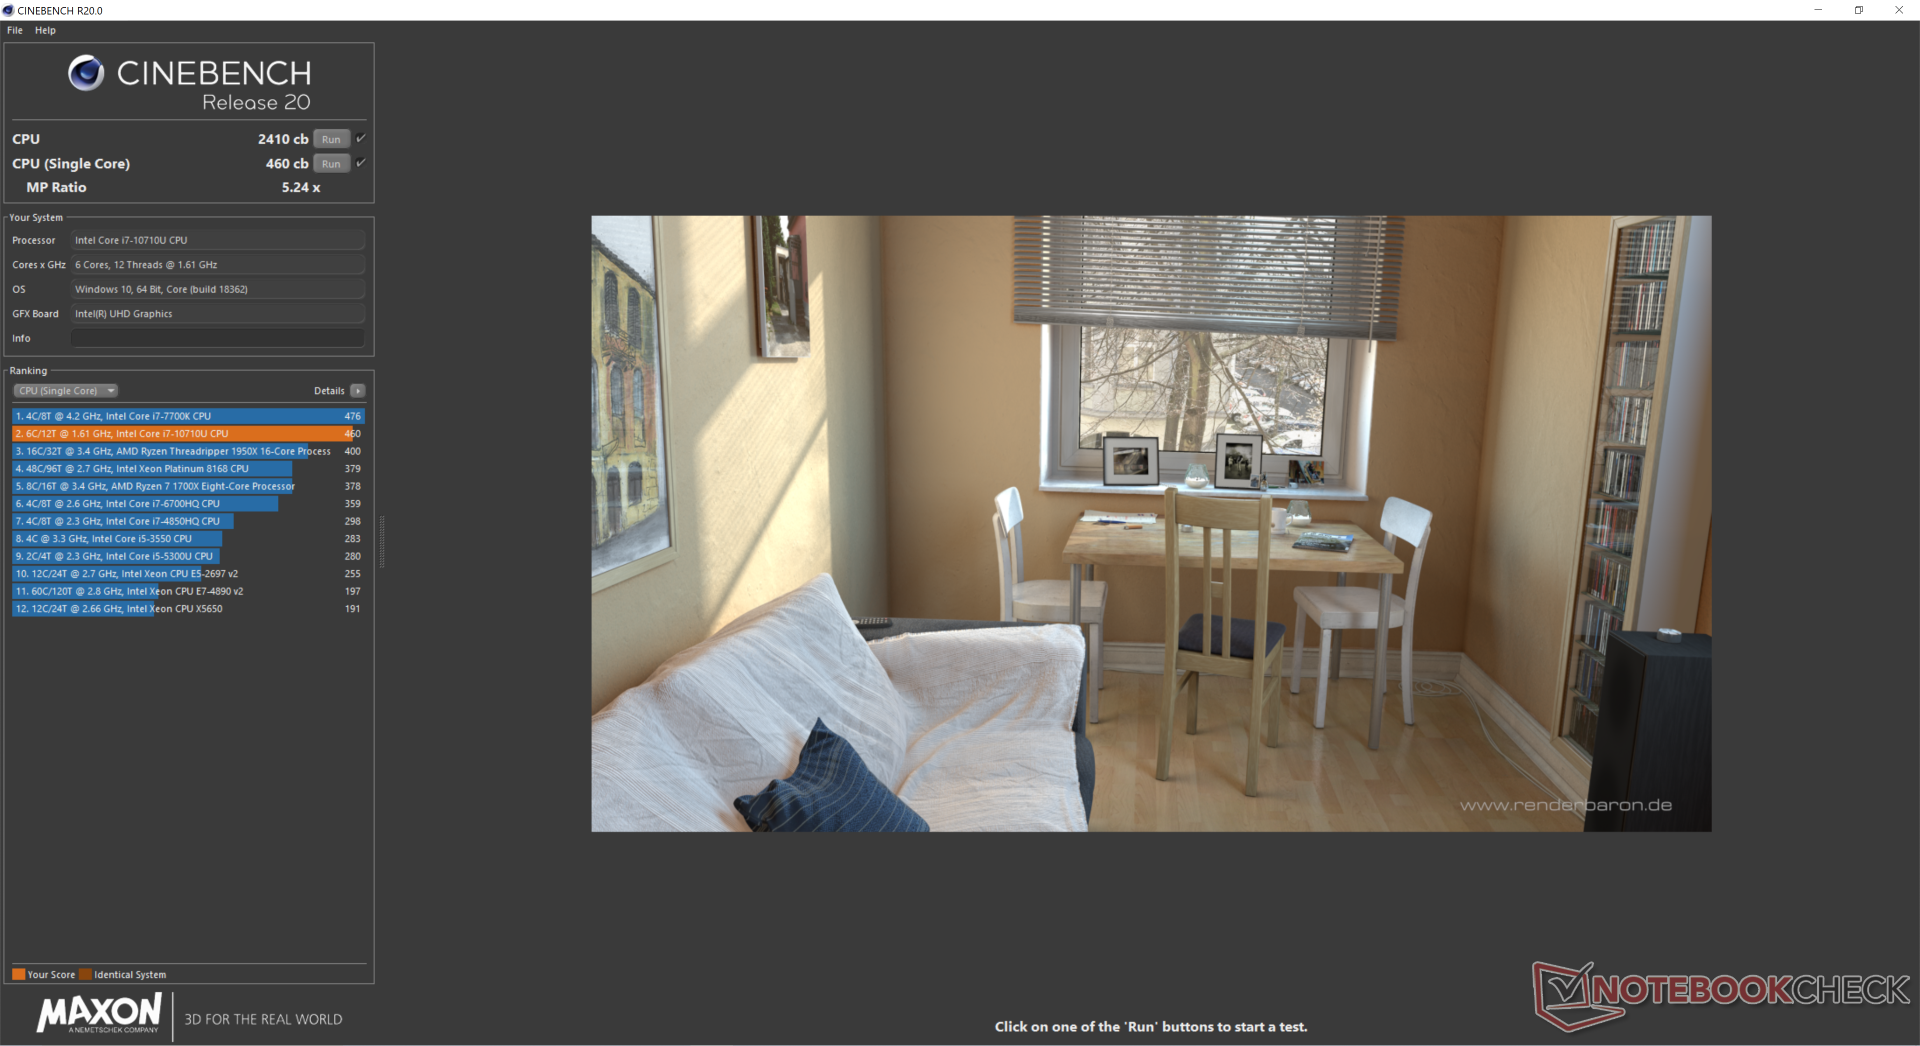
İşlemci performansı, ilk bakışta, heksa çekirdekli işlemcinin çok hızlı ancak kısa ömürlü çok çekirdekli Turbo Boost potansiyeli nedeniyle etkileyici. Aşağıdaki grafiğimizde gösterildiği gibi, CineBench R15 Multi-Thread'ı bir ilmekle çalıştırmak, termiklerin kontrol altında tutulması için zamanla performans düşmeden önce yüksek başlangıç skorlarına neden olur. Bu davranış ULV CPU'lar için normal olsa da, bunun meydana gelme derecesi hexa-core XPS 13 7390'da daha aşırıdır. Hexa-core ünitemizde kaydedilen en yüksek ve en düşük puanlar, örneğin, 1062 puan ve Core i7-8550U işlemci ile eski XPS 13 9370'deki 637 puan ve 581 puan sırasıyla 689 puan. Bu, yüksek CPU performansına sahip kısa seri çekimler istendiğinde hexa-core XPS 13 7390’ın en iyi durumda olduğu anlamına gelir. Daha fazla teknik bilgi ve kıyaslama karşılaştırması için Core i7-10710U’daki özel sayfalarımıza bakın.
| Cinebench R15 | |
| CPU Single 64Bit | |
| Alienware Area-51m i9-9900K RTX 2080 | |
| Lenovo ThinkPad T590-20N4002VGE | |
| Dell Precision 7530 | |
| Dell XPS 13 7390 Core i7-10710U | |
| Ortalama Intel Core i7-10710U (138 - 194, n=8) | |
| Dell XPS 13 7390 2-in-1 Core i7 | |
| Dell G3 3590 | |
| Dell G7 7590 | |
| Dell XPS 13 9370 i7 UHD | |
| Dell XPS 13 7390 2-in-1 Core i3 | |
| Dell Inspiron 15 7000 7577 4K | |
| Dell XPS 13 9380 2019 | |
| Acer Swift 3 SF314-41-R8HZ | |
| Dell XPS 13 i5-8250U | |
| Lenovo Yoga 530-14ARR-81H9000VGE | |
| HP ProBook 445 G6 | |
| Dell Inspiron 15 5000 5585 | |
| CPU Multi 64Bit | |
| Alienware Area-51m i9-9900K RTX 2080 | |
| Dell G7 7590 | |
| Dell Precision 7530 | |
| Dell XPS 13 7390 Core i7-10710U | |
| Ortalama Intel Core i7-10710U (513 - 1113, n=8) | |
| Dell XPS 13 7390 2-in-1 Core i7 | |
| Dell G3 3590 | |
| Dell Inspiron 15 7000 7577 4K | |
| Lenovo ThinkPad T590-20N4002VGE | |
| Dell Inspiron 15 5000 5585 | |
| Dell XPS 13 9380 2019 | |
| Lenovo Yoga 530-14ARR-81H9000VGE | |
| Acer Swift 3 SF314-41-R8HZ | |
| Dell XPS 13 9370 i7 UHD | |
| HP ProBook 445 G6 | |
| Dell XPS 13 i5-8250U | |
| Dell XPS 13 7390 2-in-1 Core i3 | |
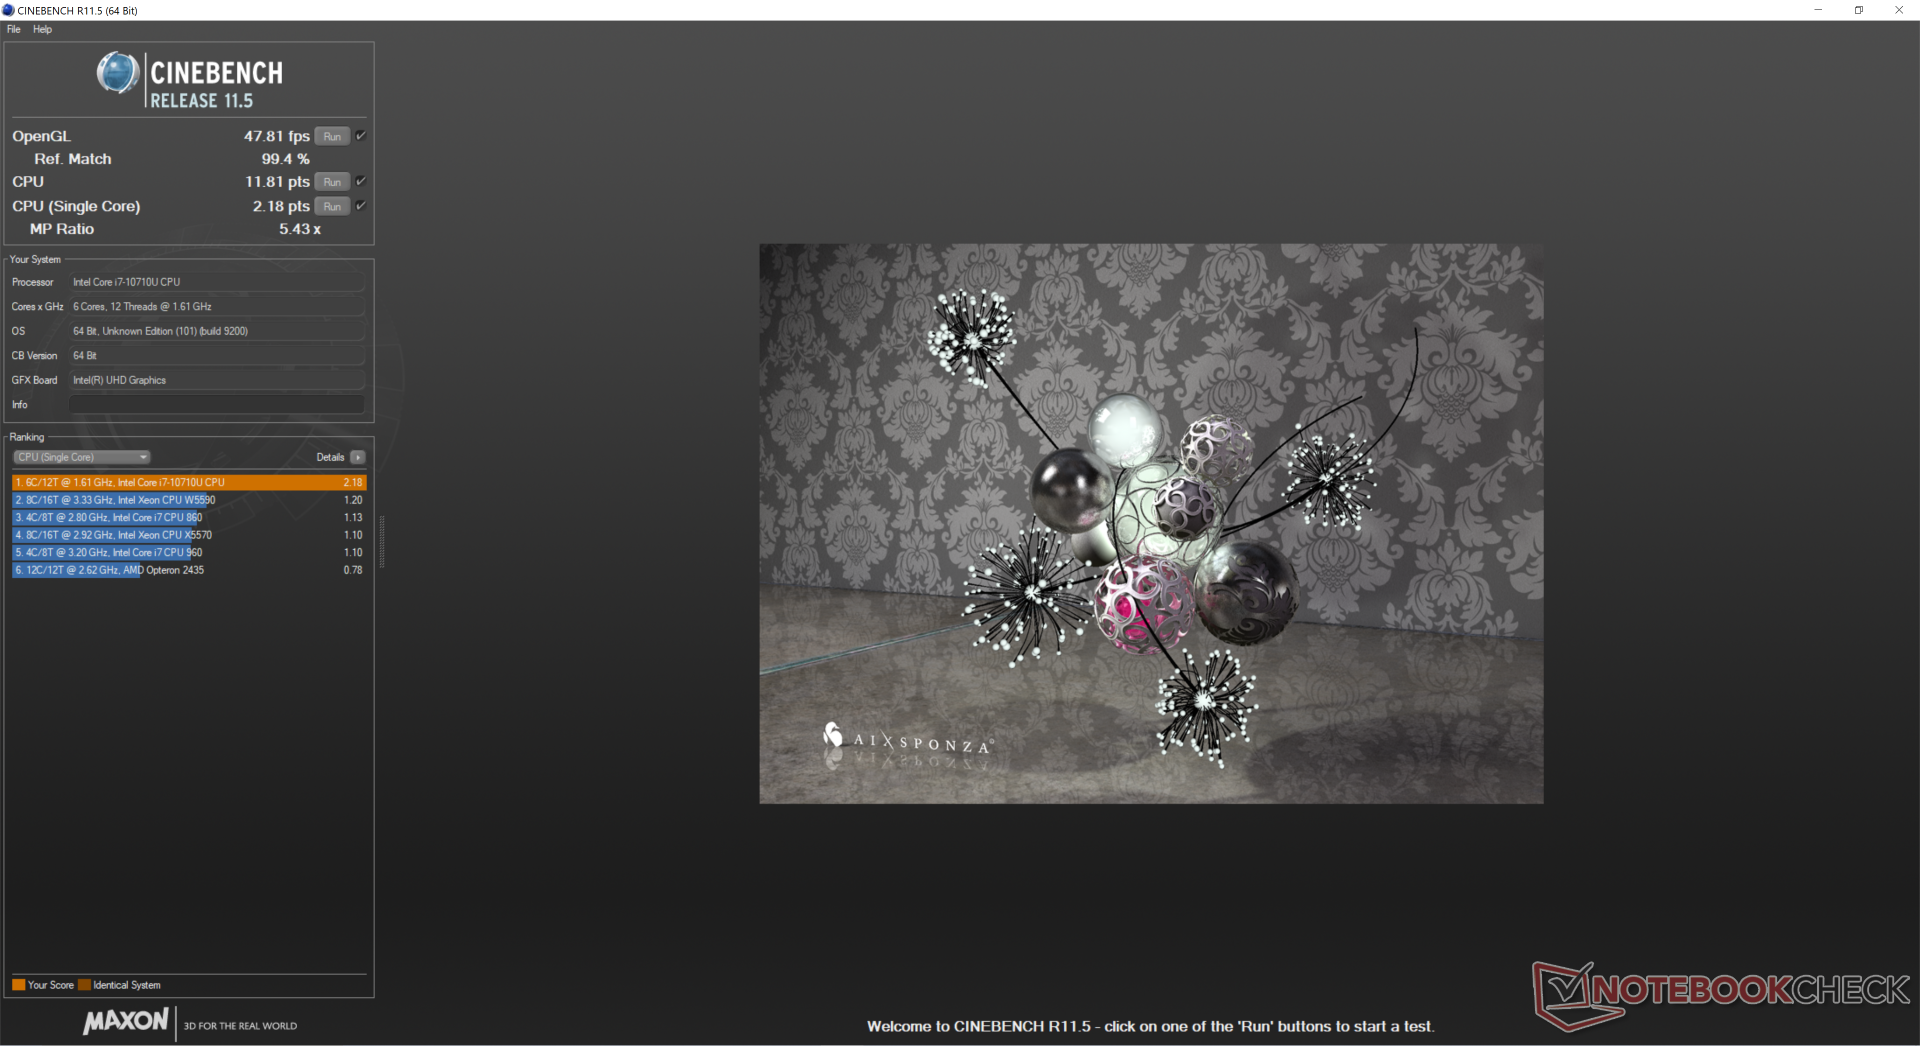
| Cinebench R11.5 | |
| CPU Single 64Bit | |
| Dell XPS 13 7390 Core i7-10710U | |
| Dell Precision 7530 | |
| Ortalama Intel Core i7-10710U (2.07 - 2.19, n=3) | |
| Dell XPS 13 7390 2-in-1 Core i7 | |
| Dell XPS 13 9370 i7 UHD | |
| Dell XPS 13 7390 2-in-1 Core i3 | |
| Dell Inspiron 15 7000 7577 4K | |
| Dell Inspiron 15 5000 5585 | |
| CPU Multi 64Bit | |
| Dell Precision 7530 | |
| Dell XPS 13 7390 Core i7-10710U | |
| Ortalama Intel Core i7-10710U (10.9 - 12.3, n=3) | |
| Dell XPS 13 7390 2-in-1 Core i7 | |
| Dell Inspiron 15 7000 7577 4K | |
| Dell Inspiron 15 5000 5585 | |
| Dell XPS 13 9370 i7 UHD | |
| Dell XPS 13 7390 2-in-1 Core i3 | |
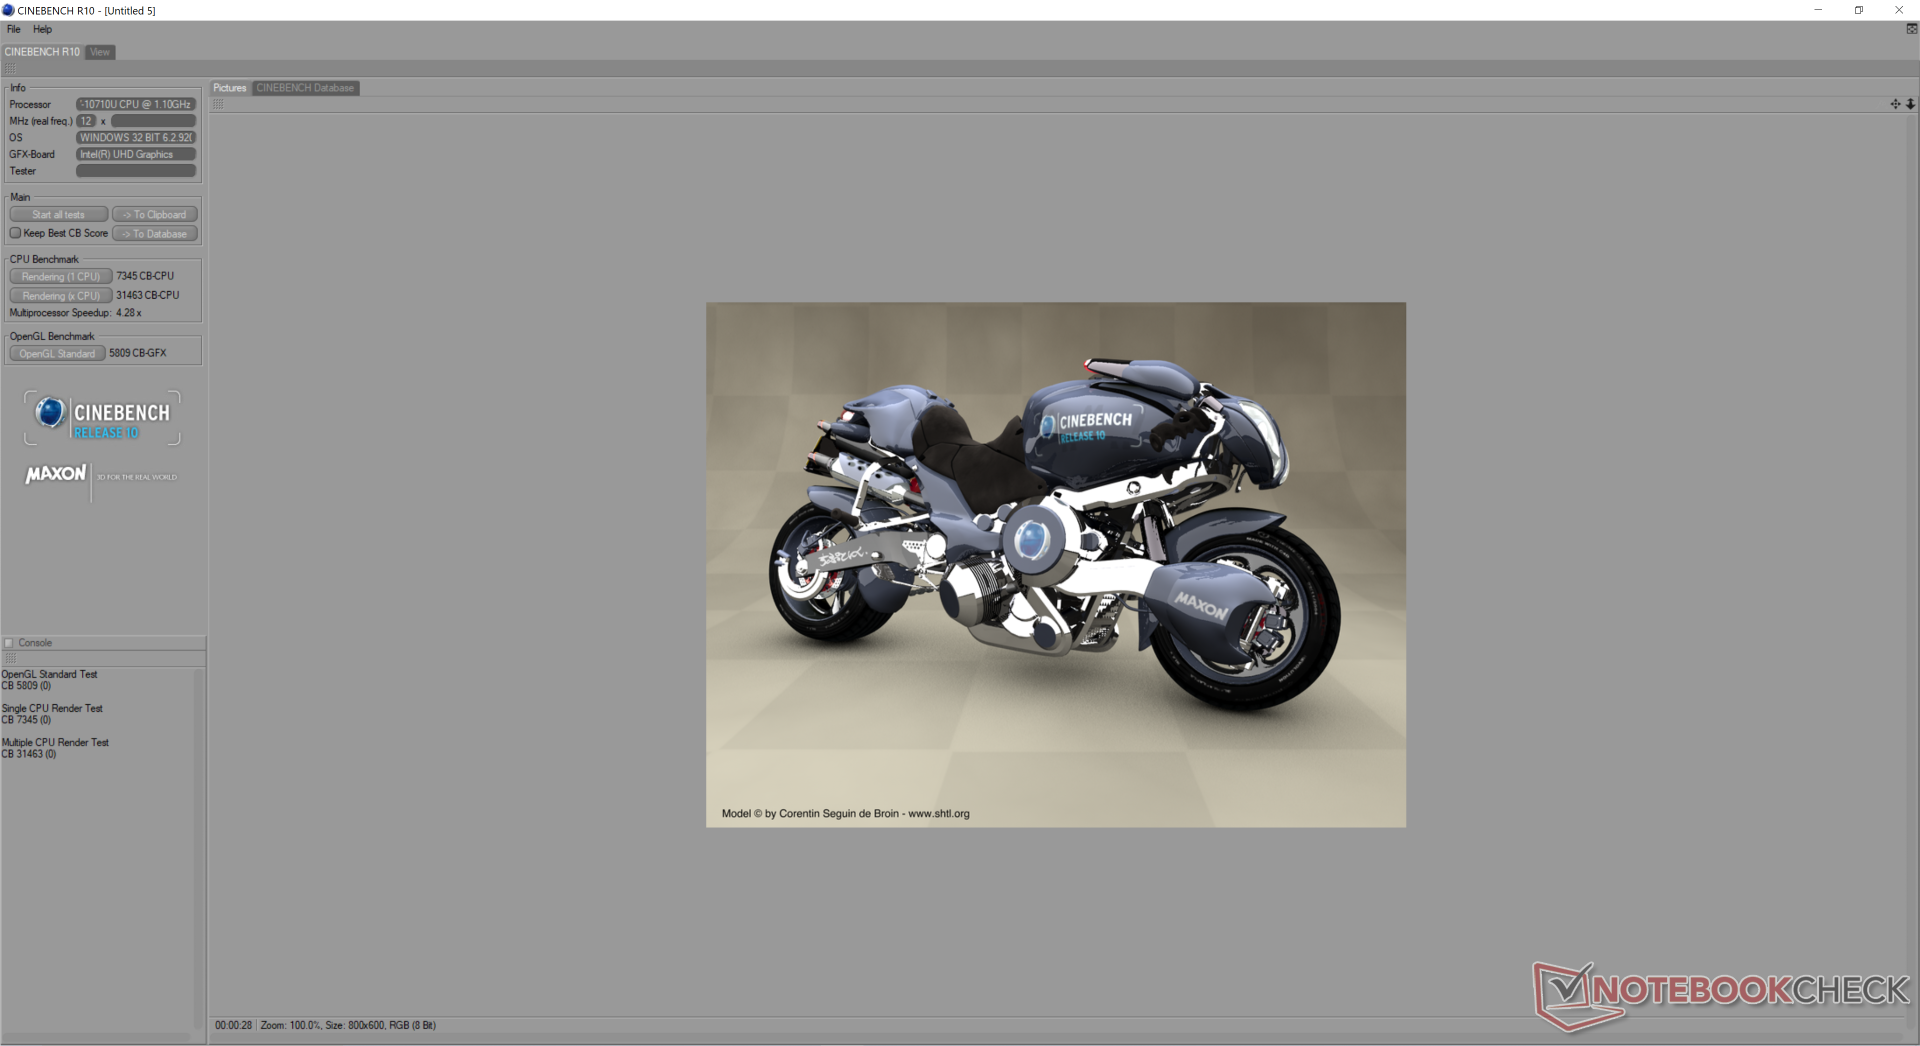
| Cinebench R10 | |
| Rendering Multiple CPUs 32Bit | |
| Dell Precision 7530 | |
| Ortalama Intel Core i7-10710U (31463 - 31824, n=2) | |
| Dell XPS 13 7390 Core i7-10710U | |
| Dell XPS 13 7390 2-in-1 Core i7 | |
| Dell Inspiron 15 7000 7577 4K | |
| Dell XPS 13 9370 i7 UHD | |
| Lenovo Yoga 530-14ARR-81H9000VGE | |
| Acer Swift 3 SF314-41-R8HZ | |
| HP ProBook 445 G6 | |
| Dell XPS 13 7390 2-in-1 Core i3 | |
| Rendering Single 32Bit | |
| Dell XPS 13 7390 Core i7-10710U | |
| Dell XPS 13 7390 2-in-1 Core i7 | |
| Dell Precision 7530 | |
| Ortalama Intel Core i7-10710U (6599 - 7345, n=2) | |
| Dell XPS 13 7390 2-in-1 Core i3 | |
| Dell XPS 13 9370 i7 UHD | |
| Dell Inspiron 15 7000 7577 4K | |
| Acer Swift 3 SF314-41-R8HZ | |
| Lenovo Yoga 530-14ARR-81H9000VGE | |
| HP ProBook 445 G6 | |
| wPrime 2.10 - 1024m | |
| Dell XPS 13 7390 2-in-1 Core i3 | |
| Dell XPS 13 9370 i7 UHD | |
| Dell XPS 13 7390 2-in-1 Core i7 | |
| Dell Inspiron 15 7000 7577 4K | |
| Ortalama Intel Core i7-10710U (171.1 - 177.4, n=2) | |
| Dell XPS 13 7390 Core i7-10710U | |
| Cinebench R20 | |
| CPU (Single Core) | |
| Lenovo ThinkPad T590-20N4002VGE | |
| Dell XPS 13 7390 2-in-1 Core i7 | |
| Dell XPS 13 7390 Core i7-10710U | |
| Ortalama Intel Core i7-10710U (429 - 480, n=4) | |
| Dell G3 3590 | |
| Dell G7 7590 | |
| Dell XPS 13 7390 2-in-1 Core i3 | |
| Acer Swift 3 SF314-41-R8HZ | |
| HP ProBook 445 G6 | |
| Lenovo Yoga 530-14ARR-81H9000VGE | |
| Dell Inspiron 15 5000 5585 | |
| CPU (Multi Core) | |
| Dell G7 7590 | |
| Dell XPS 13 7390 Core i7-10710U | |
| Dell XPS 13 7390 2-in-1 Core i7 | |
| Ortalama Intel Core i7-10710U (1181 - 2598, n=5) | |
| Dell G3 3590 | |
| Lenovo ThinkPad T590-20N4002VGE | |
| Lenovo Yoga 530-14ARR-81H9000VGE | |
| Dell Inspiron 15 5000 5585 | |
| Acer Swift 3 SF314-41-R8HZ | |
| HP ProBook 445 G6 | |
| Dell XPS 13 7390 2-in-1 Core i3 | |
* ... daha küçük daha iyidir
Sistem performansı
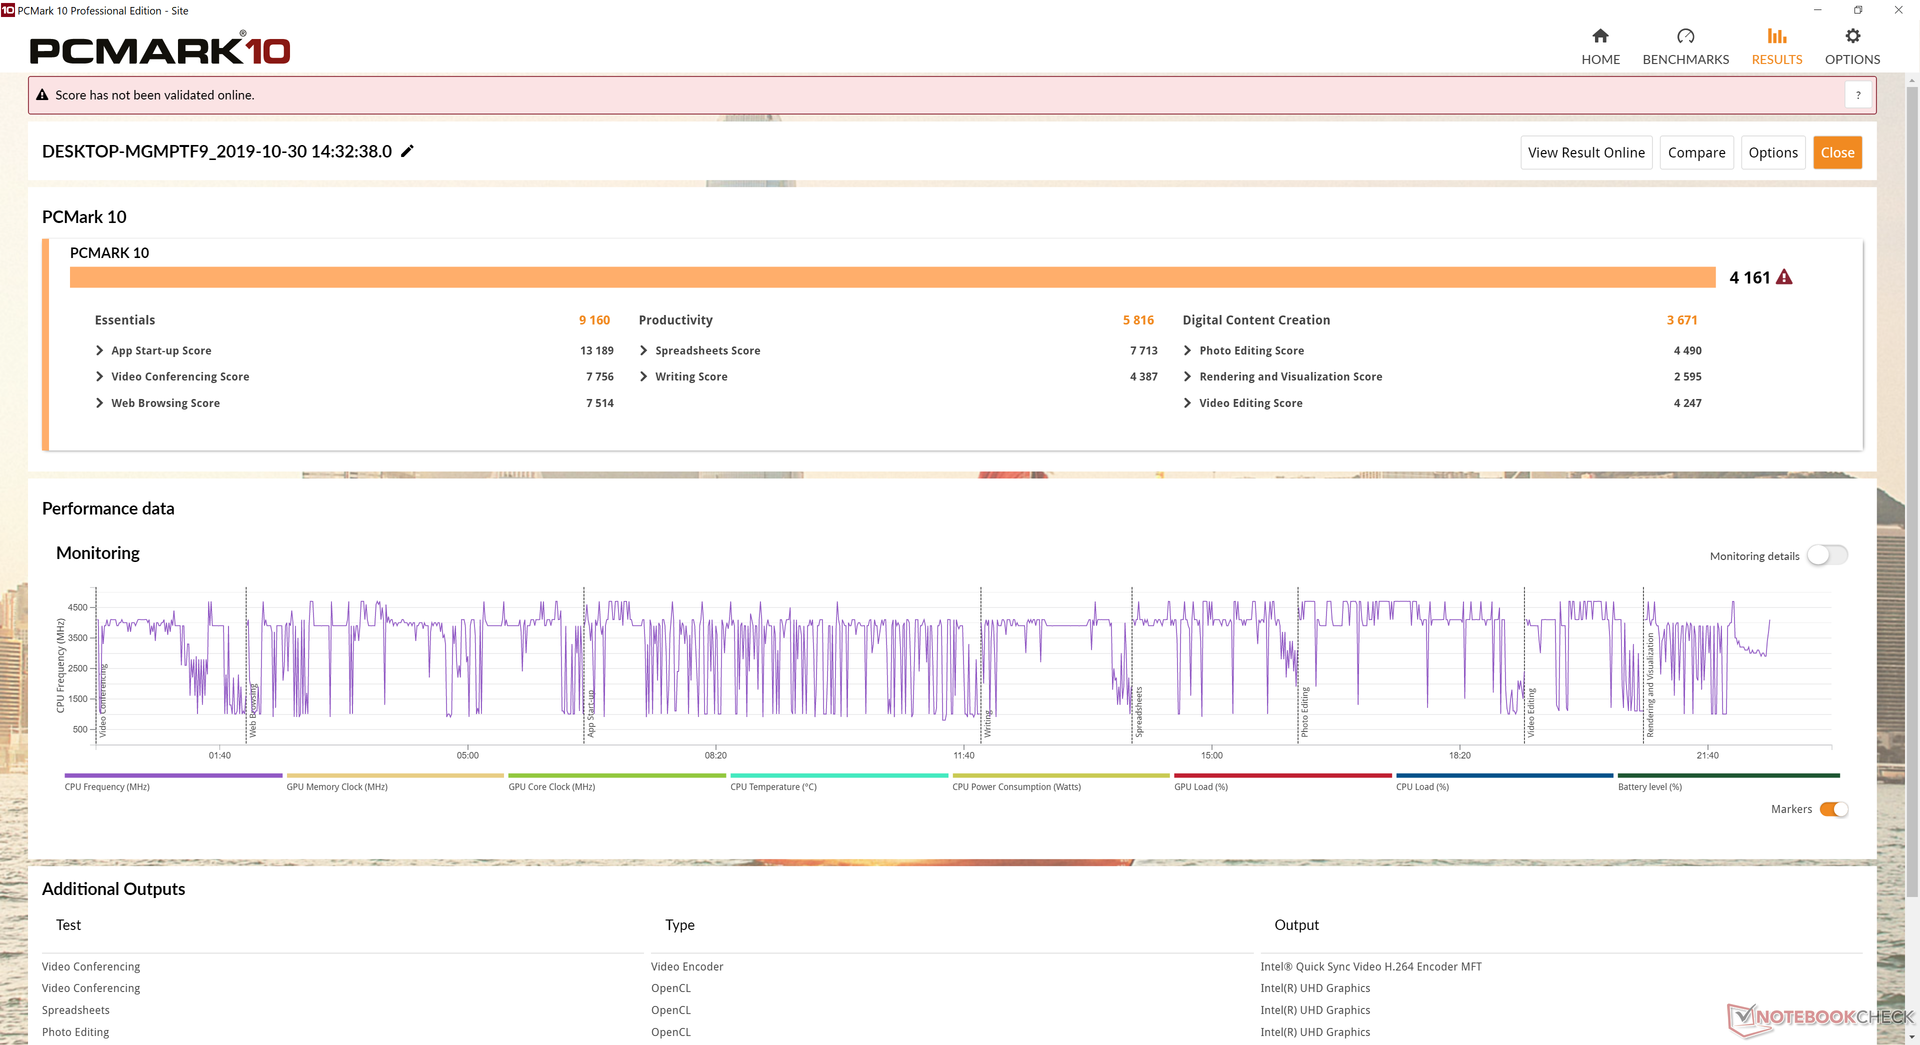
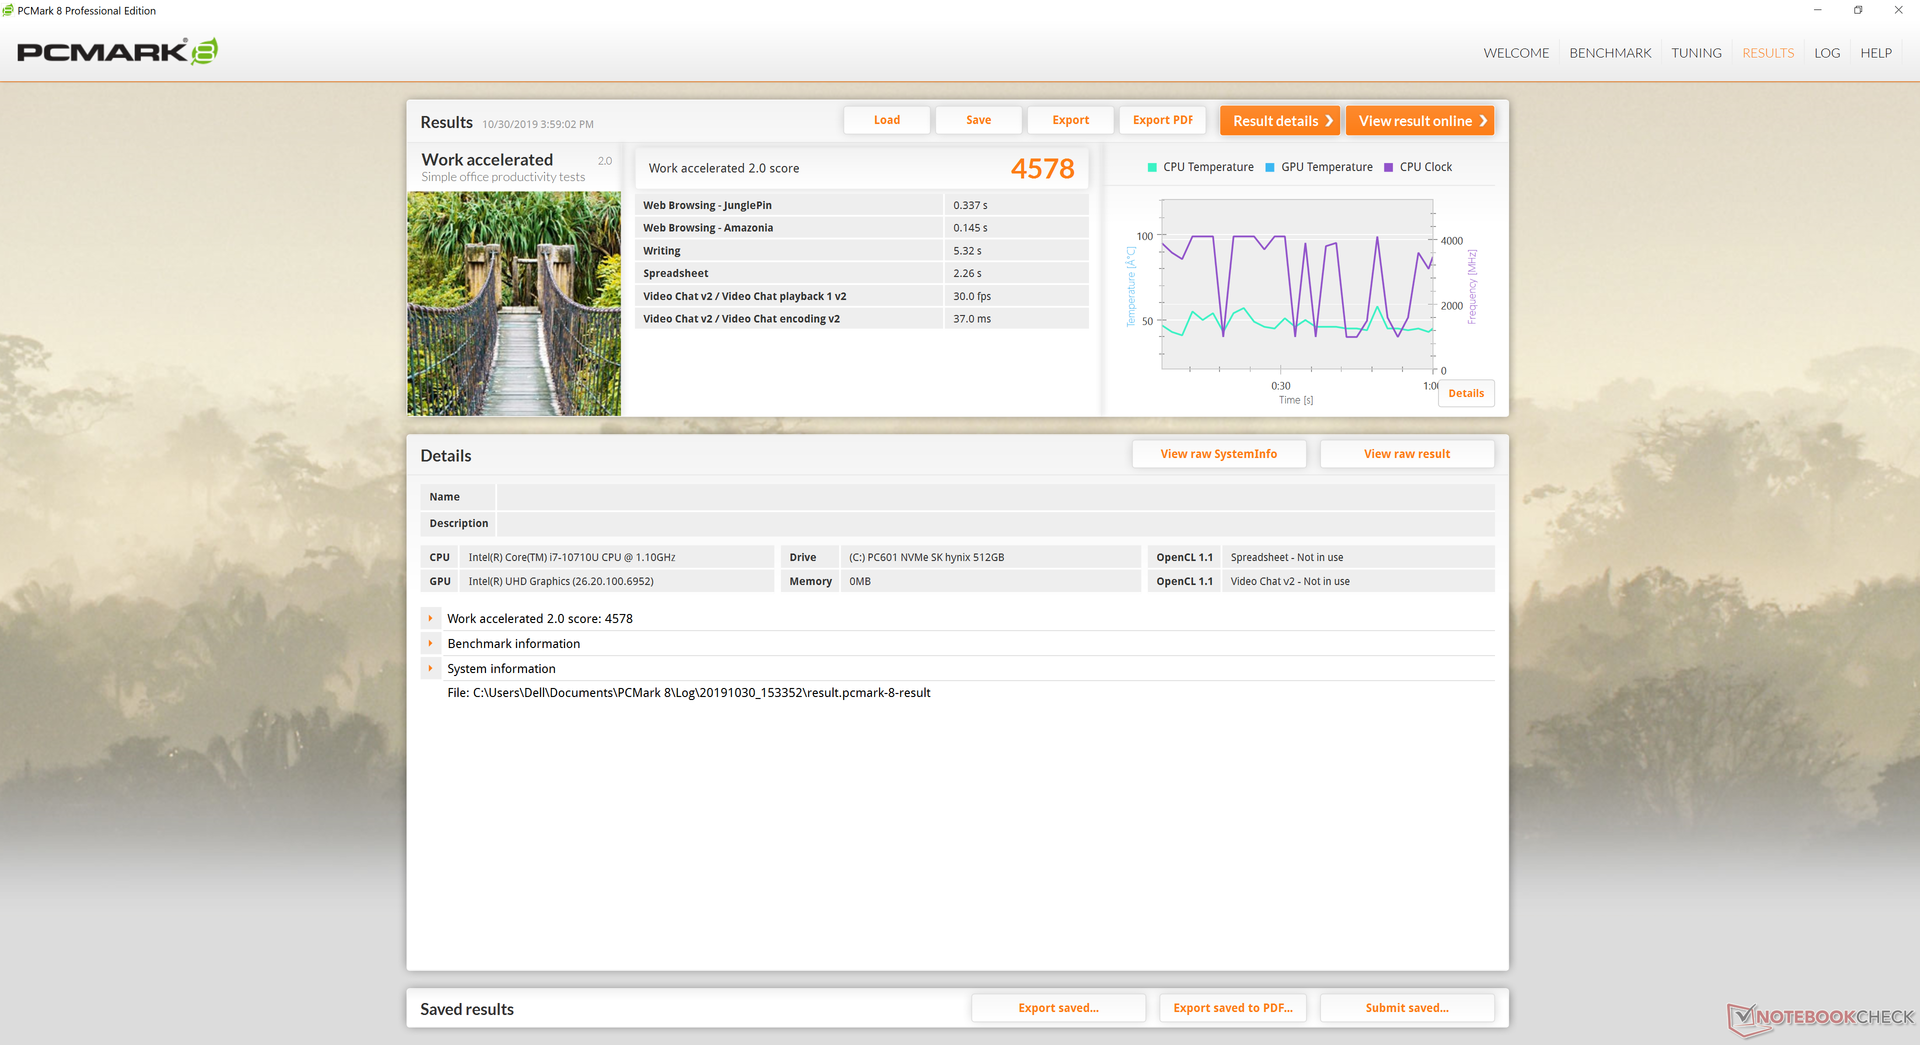
PCMark benchmarkları Comet Lake-U destekli XPS 13 7390 modelimizi Ice Lake-U destekli XPS 13 7390 2-in-1 arkasında daha önceki işlemcilerin daha hızlı CPU performansına sahip olarak değerlendirdi. Core i7-1065G7'nin önemli ölçüde daha güçlü olan Iris Plus GPU'sunun XPS 13 7390'ı 2'si 1 arada kapaklı kardeşi üzerinde ilerletmek için yeterli olduğu düşünülüyordu. Ünitemizle birlikte herhangi bir yazılım veya donanım sorunu yaşamadık. Kullanıcıların, güç profilleri, performans düzeyi ve pil sağlığı gibi temel işlevlere buradan erişilebildiğinden Dell Power Manager uygulamasını tanımalarını öneririz.
| PCMark 10 | |
| Score | |
| Dell XPS 13 7390 2-in-1 Core i7 | |
| Dell XPS 13 9380 i7 4K | |
| Dell XPS 13 7390 Core i7-10710U | |
| Dell XPS 13 9380 2019 | |
| Dell XPS 13 9370 i7 UHD | |
| Dell XPS 13 7390 2-in-1 Core i3 | |
| Essentials | |
| Dell XPS 13 7390 2-in-1 Core i7 | |
| Dell XPS 13 7390 Core i7-10710U | |
| Dell XPS 13 9380 i7 4K | |
| Dell XPS 13 7390 2-in-1 Core i3 | |
| Dell XPS 13 9380 2019 | |
| Dell XPS 13 9370 i7 UHD | |
| Productivity | |
| Dell XPS 13 7390 2-in-1 Core i7 | |
| Dell XPS 13 9380 i7 4K | |
| Dell XPS 13 9380 2019 | |
| Dell XPS 13 7390 2-in-1 Core i3 | |
| Dell XPS 13 7390 Core i7-10710U | |
| Dell XPS 13 9370 i7 UHD | |
| Digital Content Creation | |
| Dell XPS 13 7390 2-in-1 Core i7 | |
| Dell XPS 13 7390 Core i7-10710U | |
| Dell XPS 13 9380 i7 4K | |
| Dell XPS 13 9380 2019 | |
| Dell XPS 13 9370 i7 UHD | |
| Dell XPS 13 7390 2-in-1 Core i3 | |
| PCMark 8 | |
| Home Score Accelerated v2 | |
| Dell XPS 13 7390 2-in-1 Core i7 | |
| Dell XPS 13 9380 2019 | |
| Dell XPS 13 7390 Core i7-10710U | |
| Dell XPS 13 9370 i7 UHD | |
| Dell XPS 13 9380 i7 4K | |
| Dell XPS 13 7390 2-in-1 Core i3 | |
| Dell XPS 13 i5-8250U | |
| Work Score Accelerated v2 | |
| Dell XPS 13 7390 2-in-1 Core i7 | |
| Dell XPS 13 7390 Core i7-10710U | |
| Dell XPS 13 7390 2-in-1 Core i3 | |
| Dell XPS 13 9380 i7 4K | |
| Dell XPS 13 9380 2019 | |
| Dell XPS 13 9370 i7 UHD | |
| Dell XPS 13 i5-8250U | |
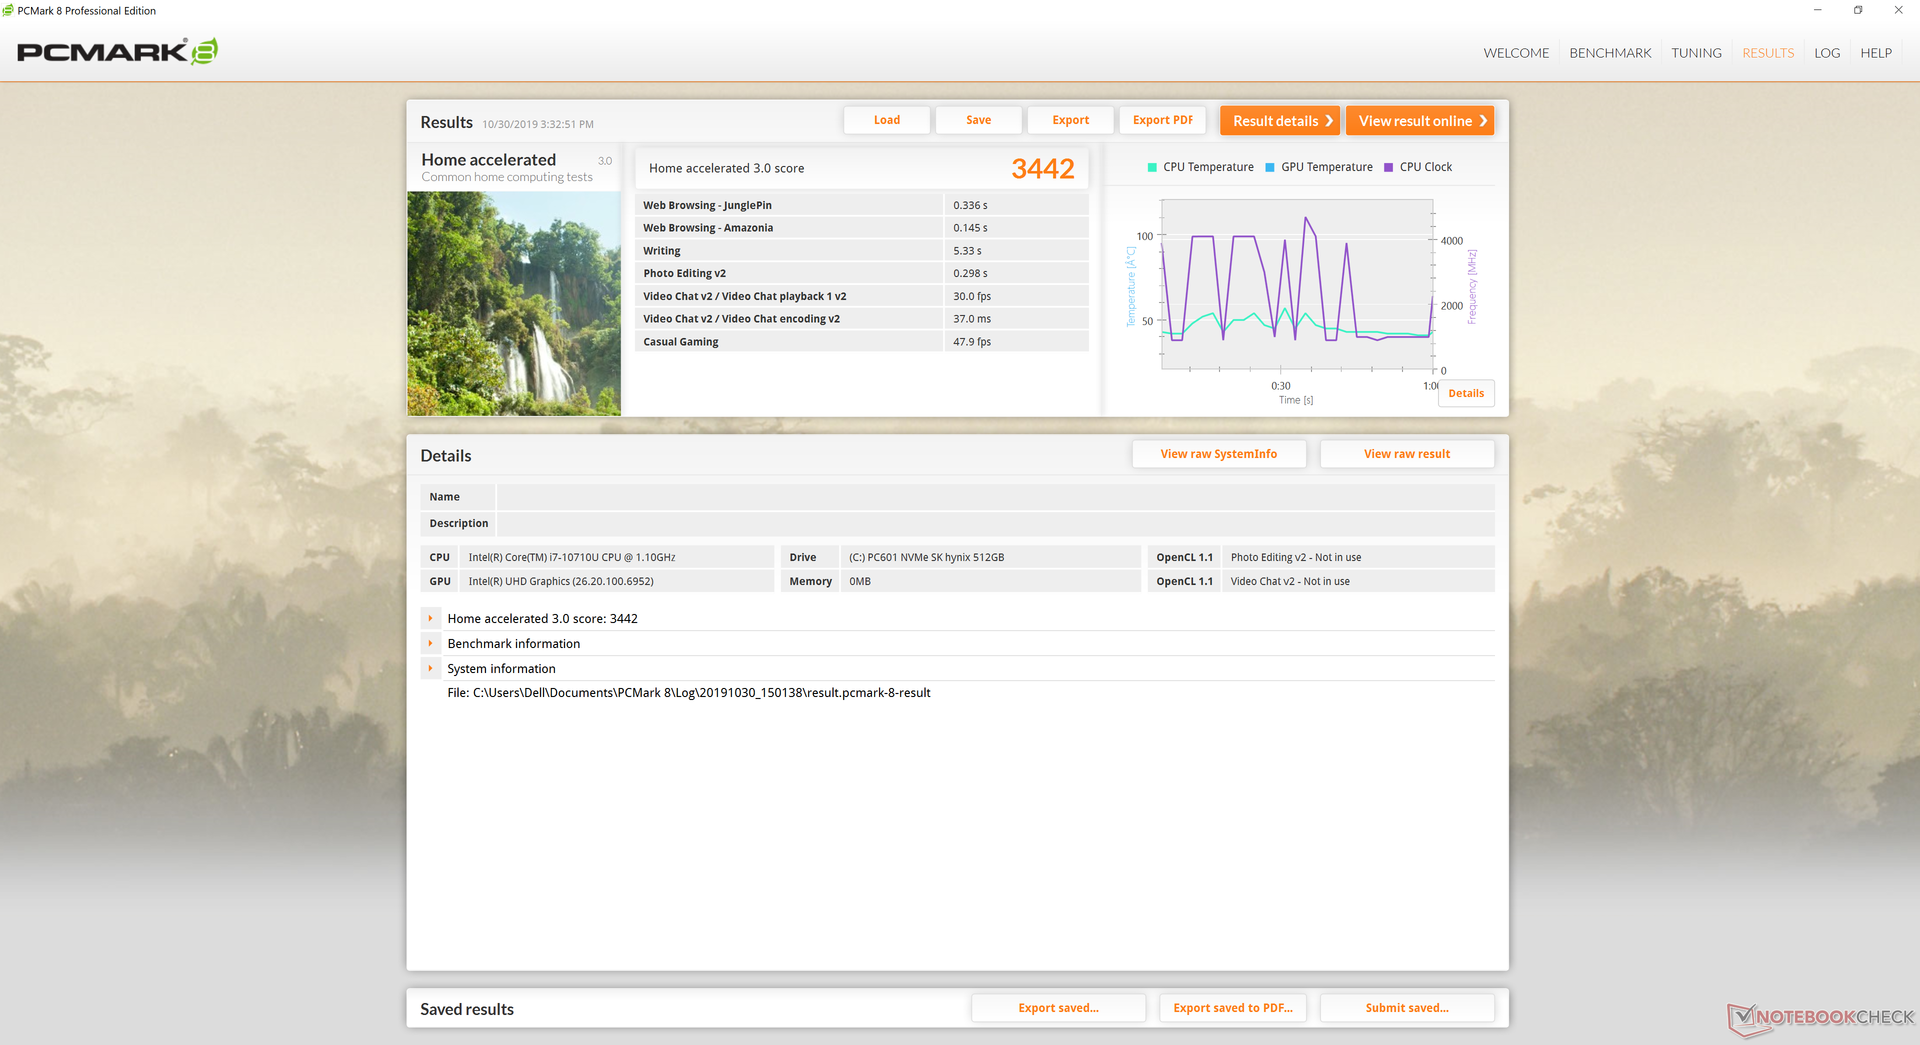
| PCMark 8 Home Score Accelerated v2 | 3442 puan | |
| PCMark 8 Work Score Accelerated v2 | 4578 puan | |
| PCMark 10 Score | 4161 puan | |
Yardım | ||
Depolama aygıtları
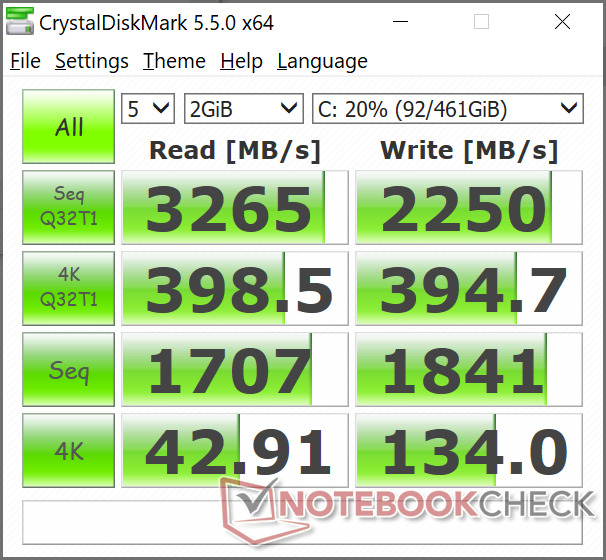
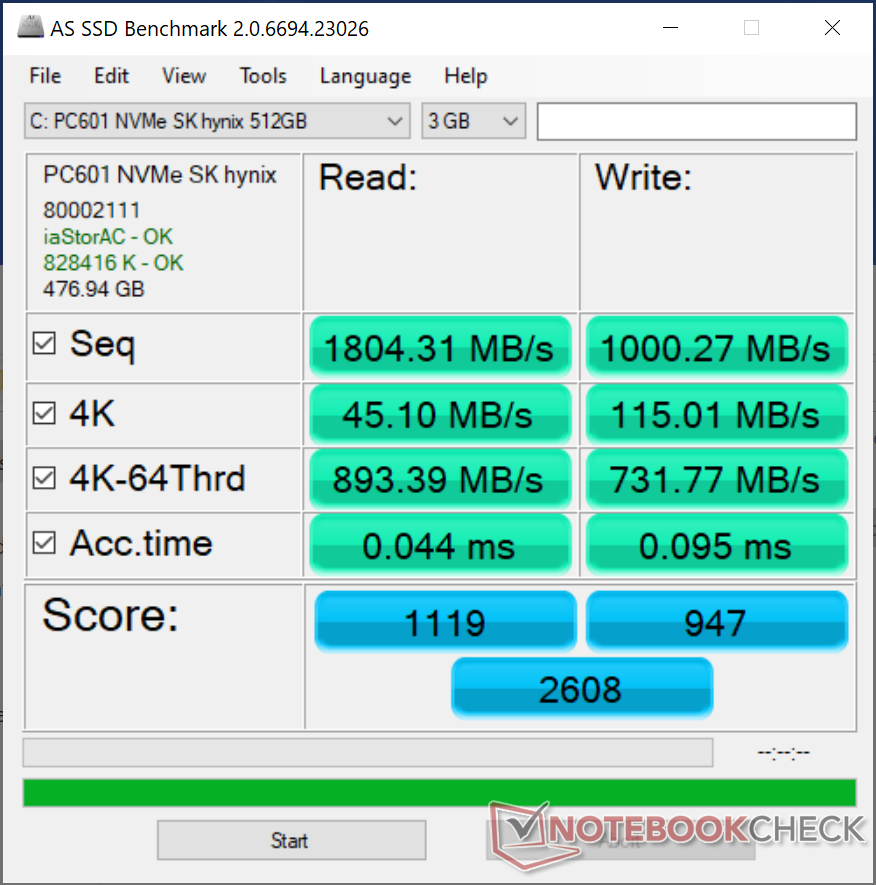
Dell, SSD'lerini tüm dizüstü bilgisayarları için birden fazla tedarikçiden alır. Samsung, Toshiba veya SK Hynix ile donatılmış XPS 13 ünitelerini bizzat test ettik ve bu yüzden bir sonraki XPS satın alımınızın bu üç üreticiden birini alacağı güvenli bir bahis. XPS 13 7390'ımız, geçen yılki XPS 13 9380'deki SK Hynix PC401'in aksine yeni SK Hynix PC601 SSD'yi kullanıyor.
| Dell XPS 13 7390 Core i7-10710U SK Hynix PC601 NVMe 512 GB | Dell XPS 13 7390 2-in-1 Core i7 Toshiba BG4 KBG40ZPZ512G | Dell XPS 13 7390 2-in-1 Core i3 Toshiba BG4 KBG40ZPZ256G | Dell XPS 13 9380 i7 4K Samsung SSD PM981 MZVLB512HAJQ | Dell XPS 13 9380 2019 SK hynix PC401 HFS256GD9TNG | Dell XPS 13 9370 i7 UHD Toshiba XG5 KXG50ZNV512G | |
|---|---|---|---|---|---|---|
| AS SSD | -53% | -69% | 44% | -29% | -23% | |
| Seq Read (MB/s) | 1804 | 1801 0% | 1558 -14% | 1981 10% | 2035 13% | 2205 22% |
| Seq Write (MB/s) | 1000 | 1125 13% | 1103 10% | 1473 47% | 658 -34% | 435.8 -56% |
| 4K Read (MB/s) | 45.1 | 39.7 -12% | 37.52 -17% | 53.3 18% | 39.74 -12% | 29.36 -35% |
| 4K Write (MB/s) | 115 | 67 -42% | 59 -49% | 127.4 11% | 105.7 -8% | 107.4 -7% |
| 4K-64 Read (MB/s) | 893 | 1253 40% | 1684 89% | 1179 32% | 461 -48% | 678 -24% |
| 4K-64 Write (MB/s) | 732 | 209 -71% | 198.9 -73% | 2105 188% | 300.1 -59% | 444.8 -39% |
| Access Time Read * (ms) | 0.044 | 0.069 -57% | 0.099 -125% | 0.036 18% | 0.061 -39% | 0.059 -34% |
| Access Time Write * (ms) | 0.095 | 0.625 -558% | 0.722 -660% | 0.029 69% | 0.051 46% | 0.055 42% |
| Score Read (Points) | 1119 | 1472 32% | 1877 68% | 1430 28% | 704 -37% | 926 -17% |
| Score Write (Points) | 947 | 388 -59% | 368 -61% | 2379 151% | 471 -50% | 596 -37% |
| Score Total (Points) | 2608 | 2583 -1% | 3180 22% | 4526 74% | 1479 -43% | 1911 -27% |
| Copy ISO MB/s (MB/s) | 1515 | 1293 -15% | 677 -55% | 1294 -15% | 893 -41% | 585 -61% |
| Copy Program MB/s (MB/s) | 535 | 560 5% | 298.4 -44% | 503 -6% | 287.9 -46% | 570 7% |
| Copy Game MB/s (MB/s) | 1211 | 927 -23% | 496.1 -59% | 1148 -5% | 618 -49% | 503 -58% |
* ... daha küçük daha iyidir

GPU Performansı
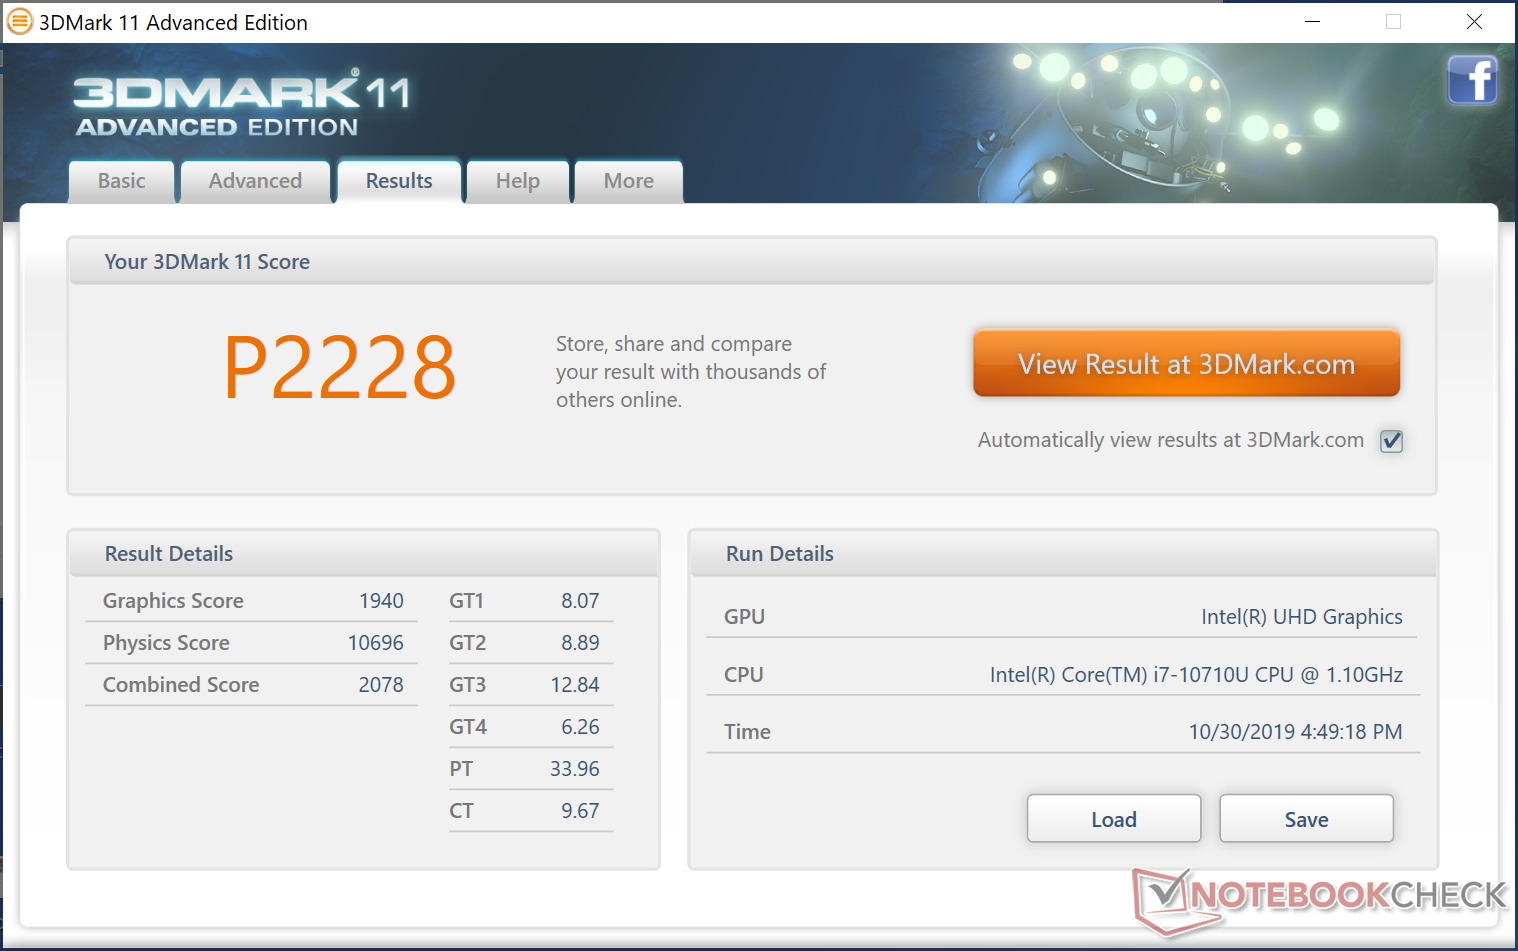
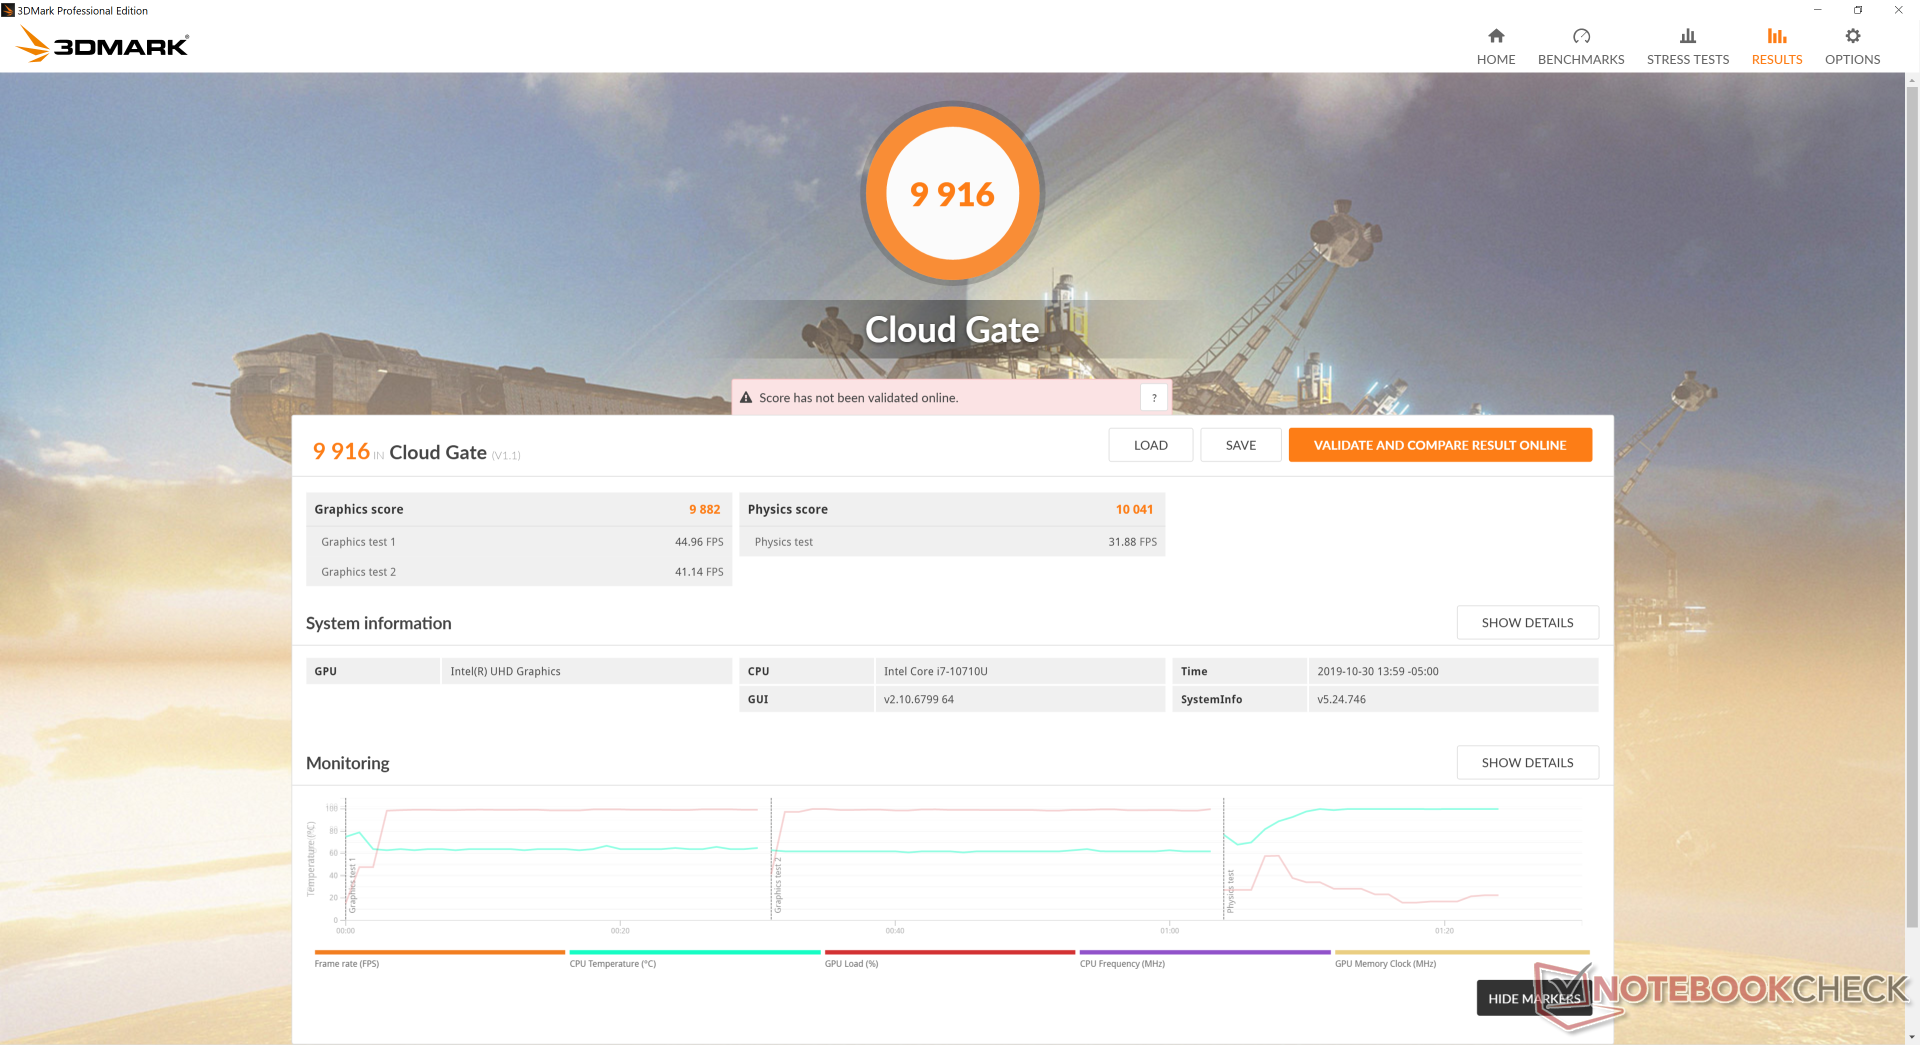
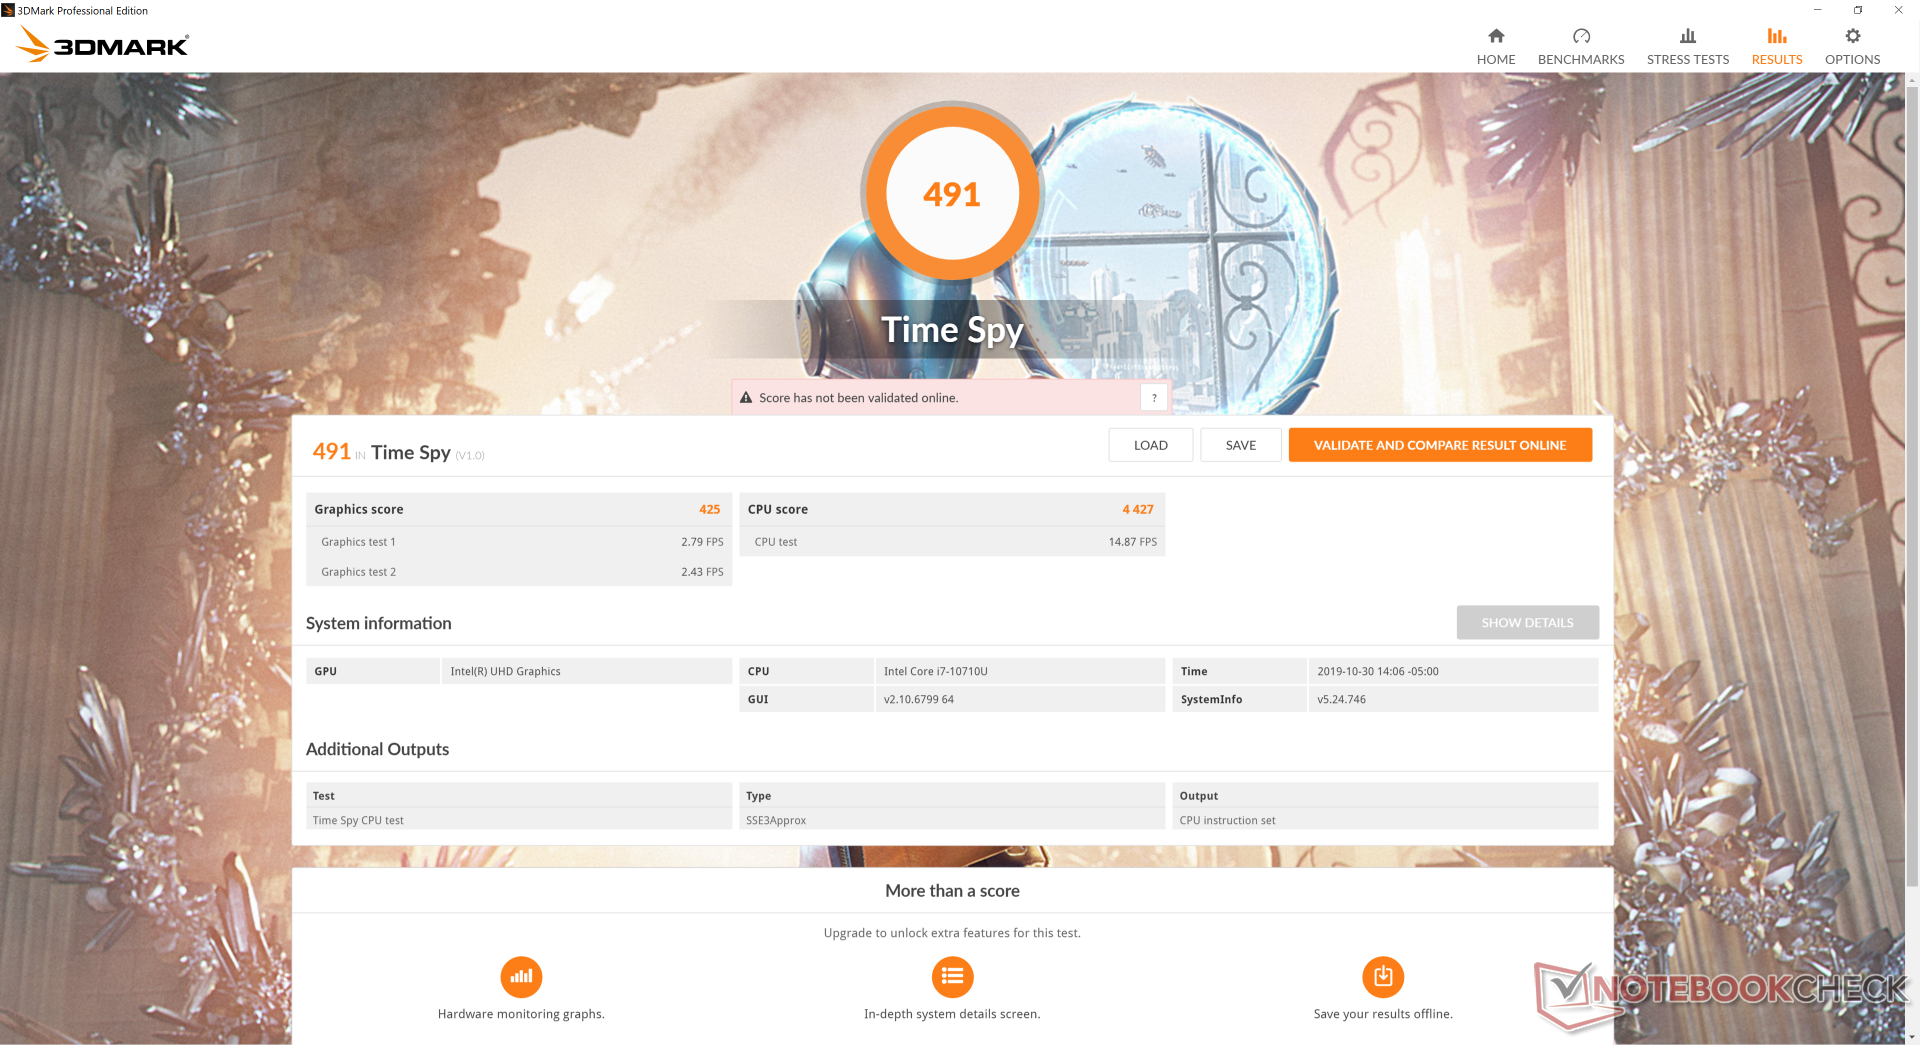
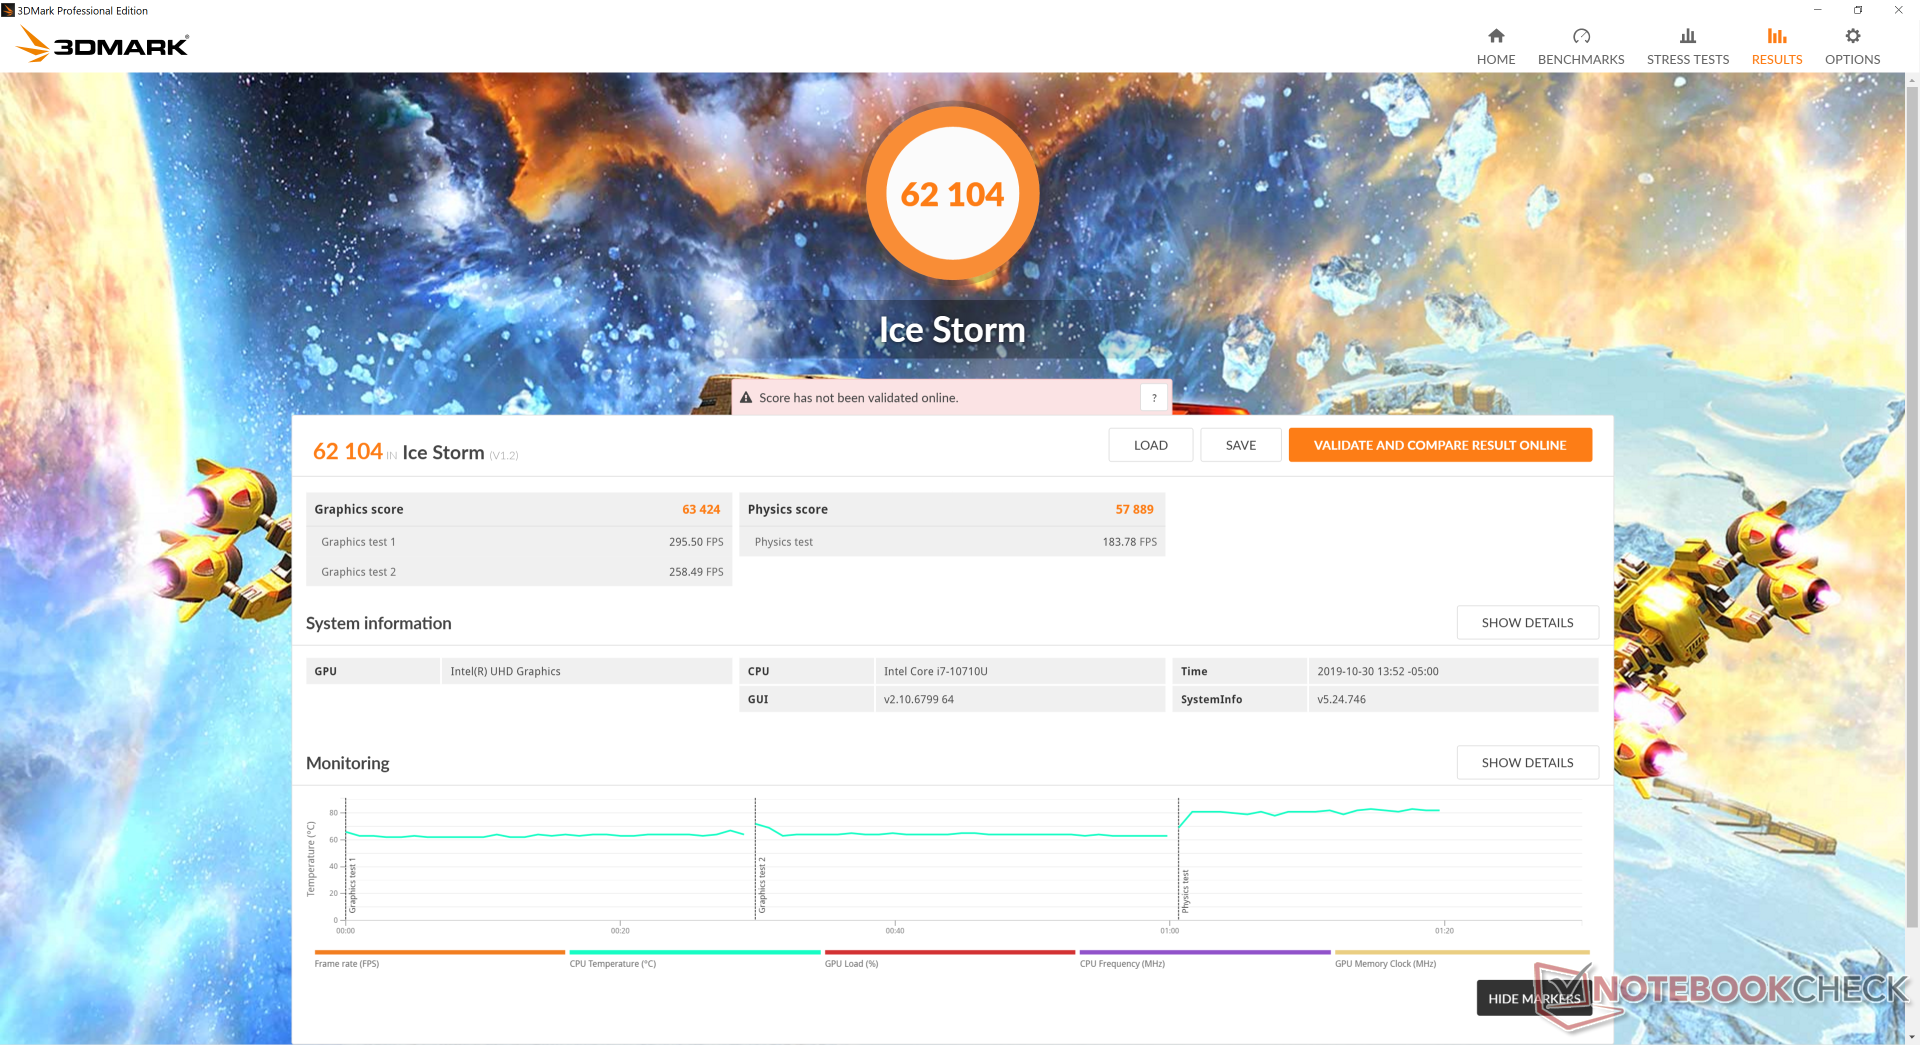
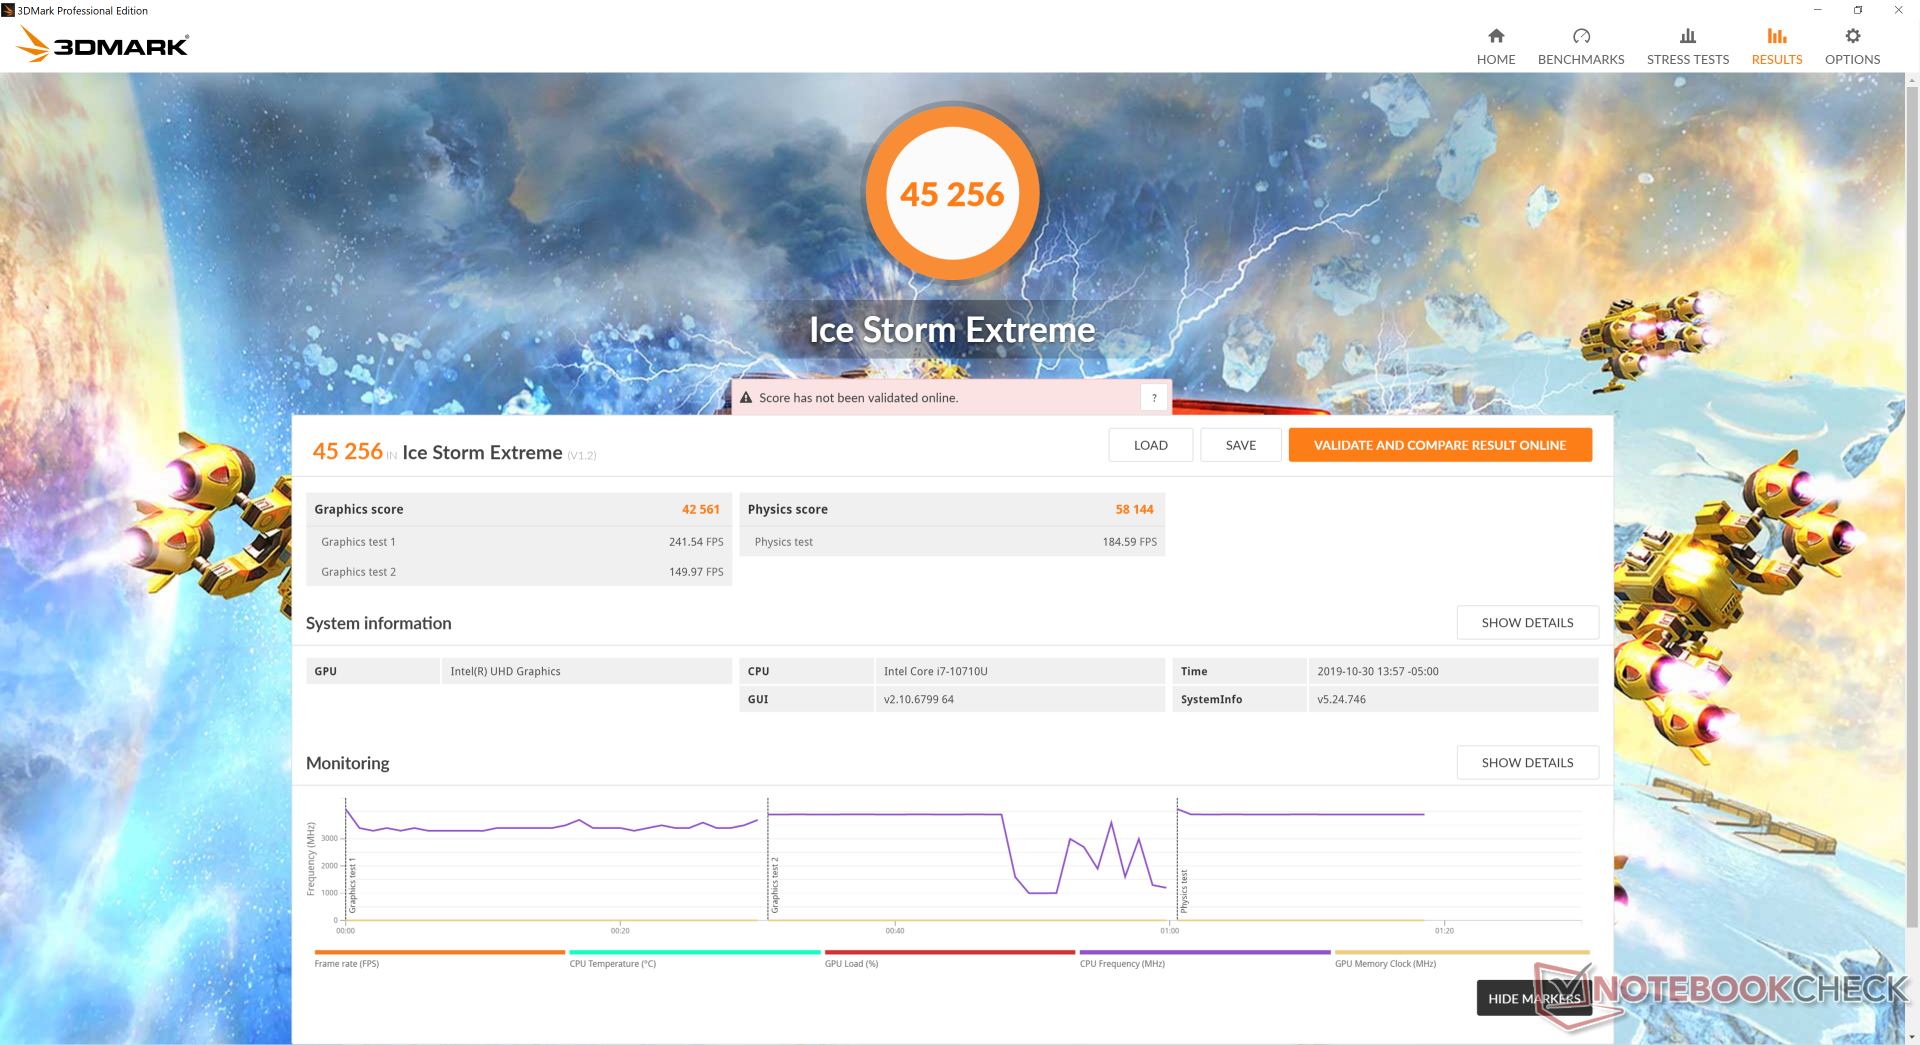
Entegre UHD Graphics 620 önceki nesilden değişmedi. Fire Strike ve Time Spy Graphics puanları, veritabanımızdaki ortalama UHD Graphics 620'den yüzde 19 daha yüksek olsa da, bu GPU yaşından beri pek bir şey ifade etmiyor. Daha fazla GPU beygir gücü istiyorsanız, Core i7-1065G7, Ryzen 7 3700U veya GeForce MX150 / MX250 ile bir Ultrabook tercih etmeniz gerekir.
| 3DMark 11 | |
| 1280x720 Performance GPU | |
| Dell G3 3590 | |
| Dell Inspiron 15 7000 7577 4K | |
| Dell XPS 15 9570 i7 UHD | |
| Dell Inspiron 15 7000 7577 | |
| Dell XPS 13 7390 2-in-1 Core i7 | |
| Dell Inspiron 15 5000 5585 | |
| Lenovo Yoga 530-14ARR-81H9000VGE | |
| Acer Swift 3 SF314-41-R8HZ | |
| HP ProBook 445 G6 | |
| Dell XPS 13 7390 2-in-1 Core i3 | |
| Dell XPS 13 7390 Core i7-10710U | |
| Dell XPS 13 9370 i7 UHD | |
| Dell XPS 13 9380 i7 4K | |
| Dell Inspiron 15 5000 5584 | |
| Dell XPS 13 9380 2019 | |
| Ortalama Intel UHD Graphics 620 (1144 - 3432, n=244) | |
| Dell XPS 13 i5-8250U | |
| 1280x720 Performance Combined | |
| Dell Inspiron 15 7000 7577 4K | |
| Dell G3 3590 | |
| Dell XPS 15 9570 i7 UHD | |
| Dell Inspiron 15 7000 7577 | |
| Dell XPS 13 7390 2-in-1 Core i7 | |
| Dell Inspiron 15 5000 5585 | |
| Acer Swift 3 SF314-41-R8HZ | |
| Lenovo Yoga 530-14ARR-81H9000VGE | |
| Dell XPS 13 7390 2-in-1 Core i3 | |
| Dell XPS 13 7390 Core i7-10710U | |
| HP ProBook 445 G6 | |
| Dell XPS 13 9380 i7 4K | |
| Dell XPS 13 9380 2019 | |
| Dell XPS 13 9370 i7 UHD | |
| Dell XPS 13 i5-8250U | |
| Ortalama Intel UHD Graphics 620 (927 - 2505, n=244) | |
| Dell Inspiron 15 5000 5584 | |
| 3DMark 06 Standard Score | 14158 puan | |
| 3DMark 11 Performance | 2228 puan | |
| 3DMark Ice Storm Standard Score | 62104 puan | |
| 3DMark Cloud Gate Standard Score | 9916 puan | |
| 3DMark Fire Strike Score | 1237 puan | |
| 3DMark Time Spy Score | 491 puan | |
Yardım | ||
| Shadow of the Tomb Raider - 1280x720 Lowest Preset | |
| Dell G3 3590 | |
| Xiaomi Mi Notebook Pro i7 | |
| Dell Inspiron 15 5000 5585 | |
| Razer Blade Stealth i7-1065G7 Iris Plus | |
| Dell XPS 13 7390 2-in-1 Core i7 | |
| Dell XPS 13 9380 2019 | |
| Dell XPS 13 7390 Core i7-10710U | |
| Ortalama Intel UHD Graphics 620 (12 - 21.7, n=13) | |
| düşük | orta | yüksek | ultra | |
|---|---|---|---|---|
| BioShock Infinite (2013) | 85.3 | 42 | 35.8 | 11.2 |
| The Witcher 3 (2015) | 19.7 | |||
| Rocket League (2017) | 76.2 | 36.6 | 23 | |
| Shadow of the Tomb Raider (2018) | 15 |
Emisyonları
Sistem Gürültüsü
Soğutma çözümü konusunda hiçbir şey değişmedi ve bu nedenle fan davranışı XPS 13 9380'de yaşadıklarımızdan farklı değil. En kötü ihtimalle, fan gürültüsü 28 dB (A) değerinde bir arka plana karşı yaklaşık 31,1 - 33,7 dB (A) arasında sabit olacak video akışı veya yoğun web taraması sırasında. CPU yüzde 100 kullanımdayken, fan gürültüsü 46,5 dB (A) değerine kadar çıkabiliyor. Klavye tuşlarına kulak koyarken hafif bobin sızıntısı veya elektronik gürültü olduğunu görebiliyoruz.
| Dell XPS 13 7390 Core i7-10710U UHD Graphics 620, i7-10710U, SK Hynix PC601 NVMe 512 GB | Dell XPS 13 7390 2-in-1 Core i7 Iris Plus Graphics G7 (Ice Lake 64 EU), i7-1065G7, Toshiba BG4 KBG40ZPZ512G | Dell XPS 13 7390 2-in-1 Core i3 UHD Graphics G1 (Ice Lake 32 EU), i3-1005G1, Toshiba BG4 KBG40ZPZ256G | Dell XPS 13 9380 i7 4K UHD Graphics 620, i7-8565U, Samsung SSD PM981 MZVLB512HAJQ | Dell XPS 13 9380 2019 UHD Graphics 620, i5-8265U, SK hynix PC401 HFS256GD9TNG | Dell XPS 13 9370 i7 UHD UHD Graphics 620, i5-8550U, Toshiba XG5 KXG50ZNV512G | |
|---|---|---|---|---|---|---|
| Noise | 2% | 2% | -3% | -2% | 2% | |
| kapalı / ortam * (dB) | 28 | 28.1 -0% | 28 -0% | 28.4 -1% | 30.4 -9% | 28 -0% |
| Idle Minimum * (dB) | 28 | 28.1 -0% | 28 -0% | 29.4 -5% | 30.4 -9% | 28 -0% |
| Idle Average * (dB) | 28 | 28.1 -0% | 28 -0% | 29.4 -5% | 30.4 -9% | 28 -0% |
| Idle Maximum * (dB) | 28 | 28.1 -0% | 28 -0% | 29.4 -5% | 30.4 -9% | 28 -0% |
| Load Average * (dB) | 33.7 | 31.7 6% | 31.7 6% | 34.6 -3% | 31.7 6% | 32.5 4% |
| Load Maximum * (dB) | 46.5 | 43.4 7% | 43.5 6% | 46.8 -1% | 38.1 18% | 42.2 9% |
| Witcher 3 ultra * (dB) | 43.4 |
* ... daha küçük daha iyidir
Ses yüksekliği
| Boşta |
| 28 / 28 / 28 dB |
| Çalışırken |
| 33.7 / 46.5 dB |
 | ||
30 dB sessiz 40 dB(A) duyulabilirlik 50 dB(A) gürültülü |
||
min: | ||
Sıcaklık
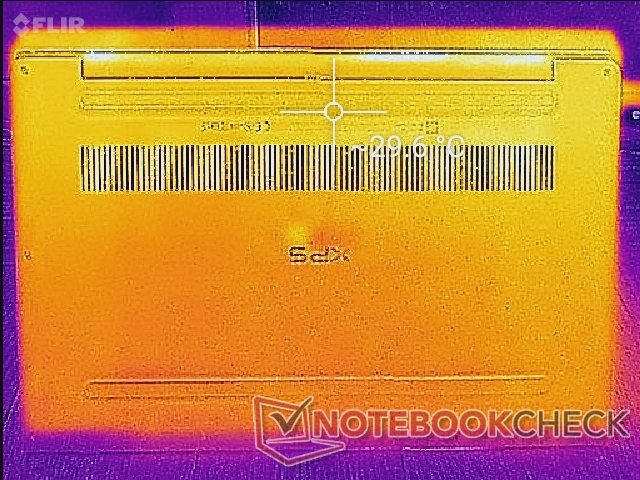
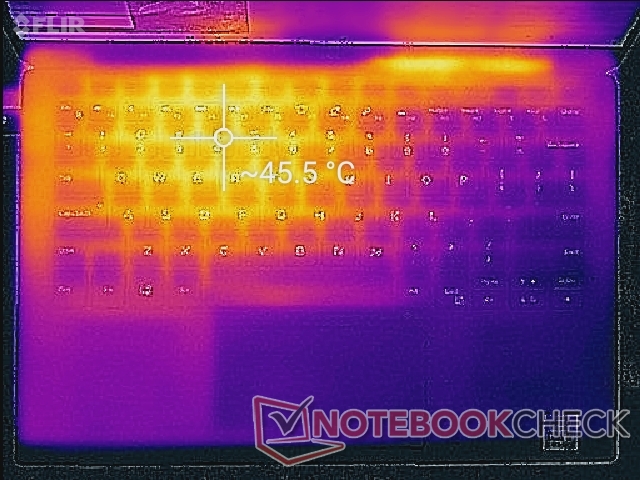
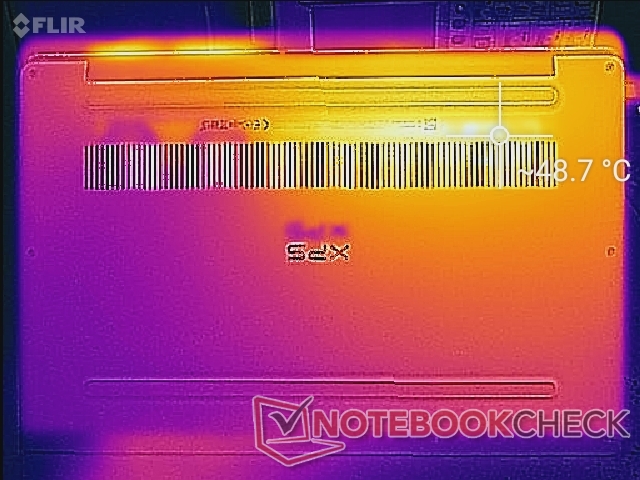
Yüzey sıcaklıkları, dört çekirdekli Whiskey Lake-U CPU ile XPS 13 9380'de keşfettiğimizle neredeyse aynı. Başka bir deyişle, kullanıcılar genellikle performans artışıyla ilişkilendirilen daha yüksek sıcaklıklar olmadan Comet Lake-U CPU'nun avantajlarından yararlanmaktadır.
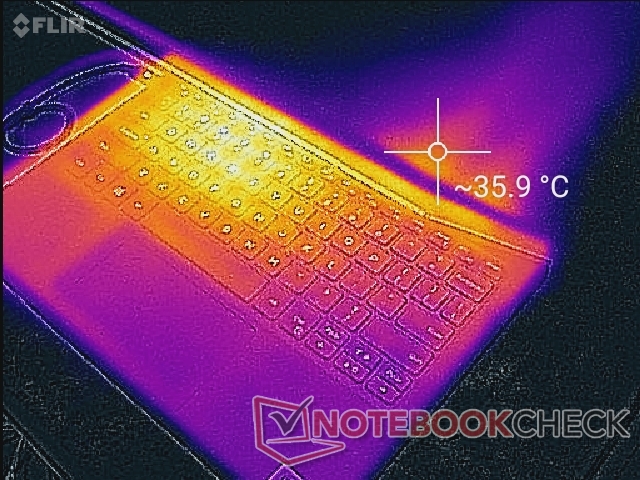
(±) Üst taraftaki maksimum sıcaklık, 35.9 °C / 97 F ortalamasına kıyasla 44.6 °C / 112 F'dir. , Subnotebook sınıfı için 21.4 ile 59 °C arasında değişir.
(-) Alt kısım, 39.2 °C / 103 F ortalamasına kıyasla maksimum 49.2 °C / 121 F'ye kadar ısınır
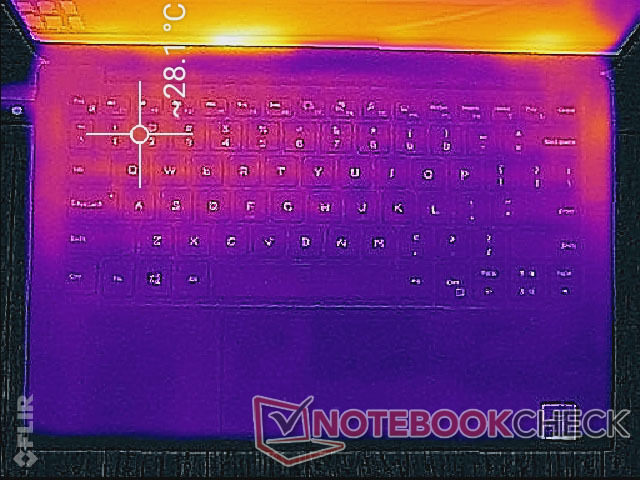
(+) Boşta kullanımda, üst tarafın ortalama sıcaklığı 26.6 °C / 80 F olup, cihazın 30.8 °C / 87 F.
(+) Avuç içi dayanakları ve dokunmatik yüzey, maksimum 31.4 °C / 88.5 F ile cilt sıcaklığından daha soğuktur ve bu nedenle dokunulduğunda soğuktur.
(-) Benzer cihazların avuç içi dayanağı alanının ortalama sıcaklığı 28.2 °C / 82.8 F (-3.2 °C / -5.7 F) idi.
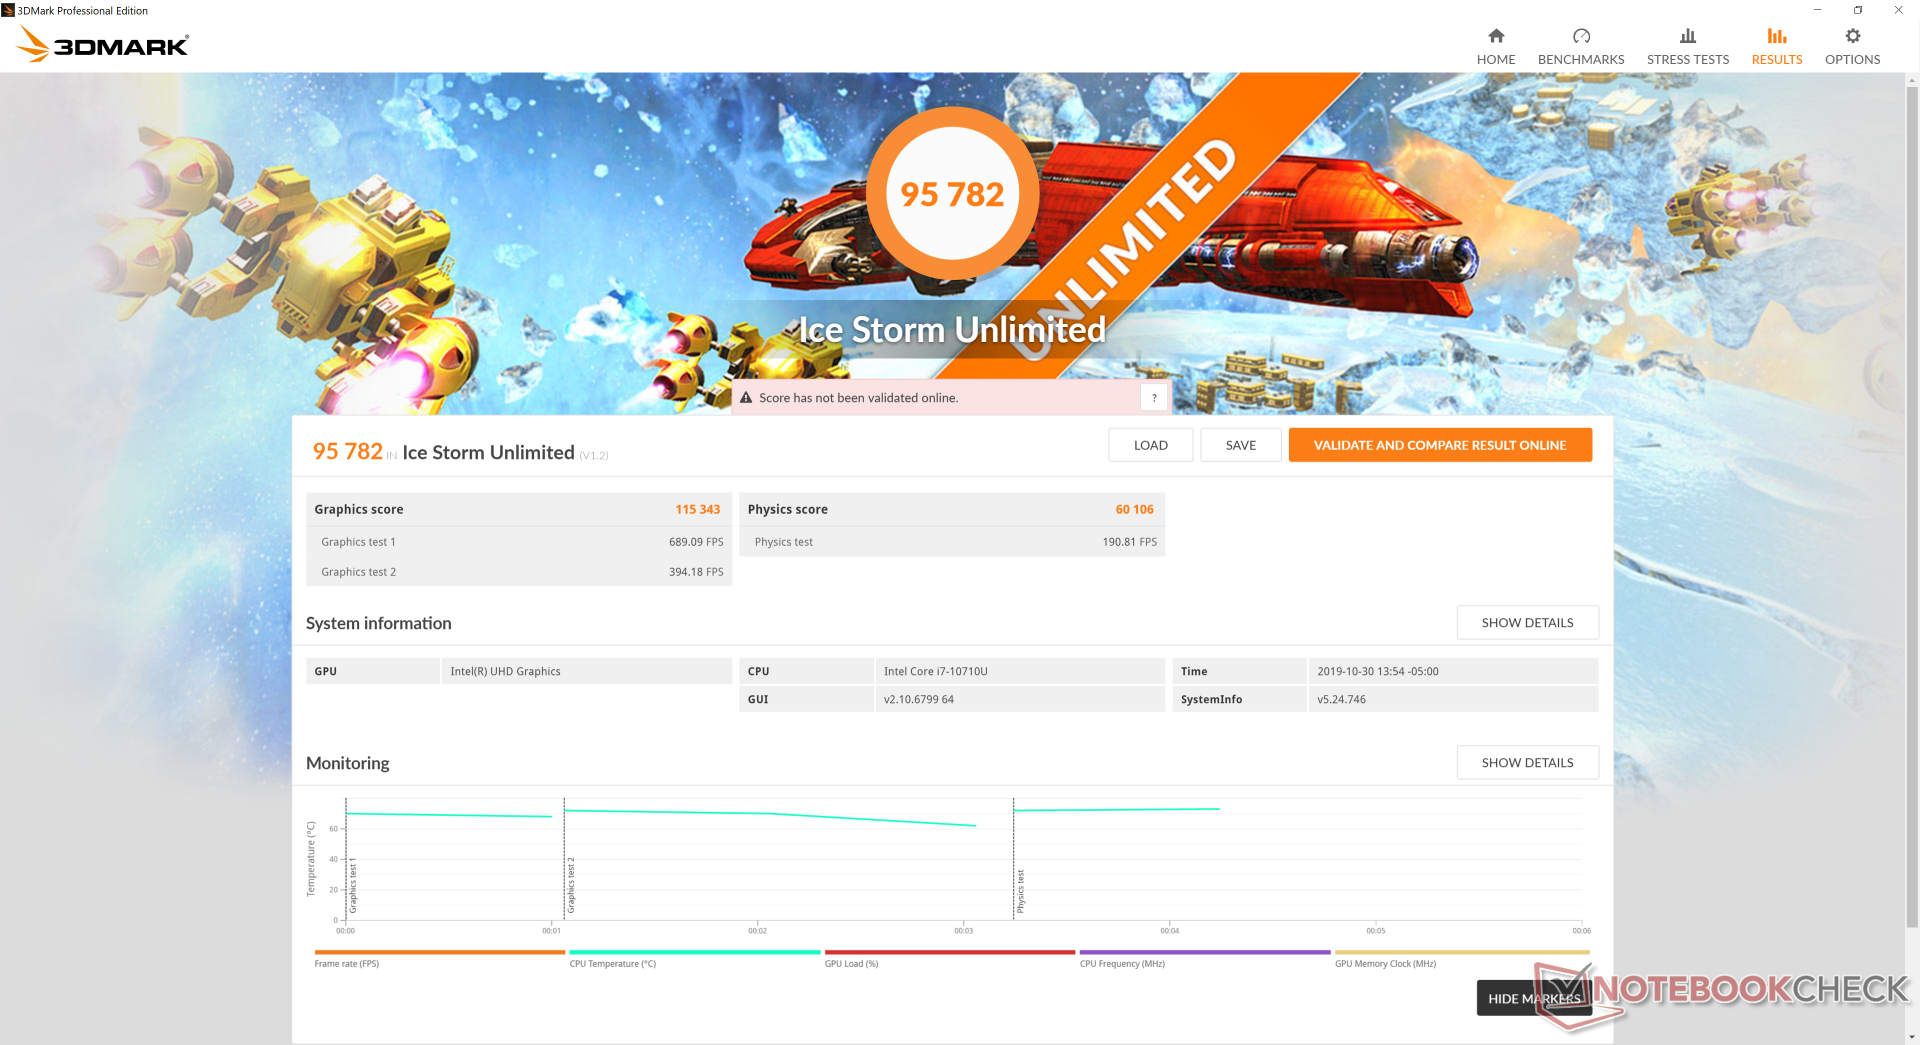
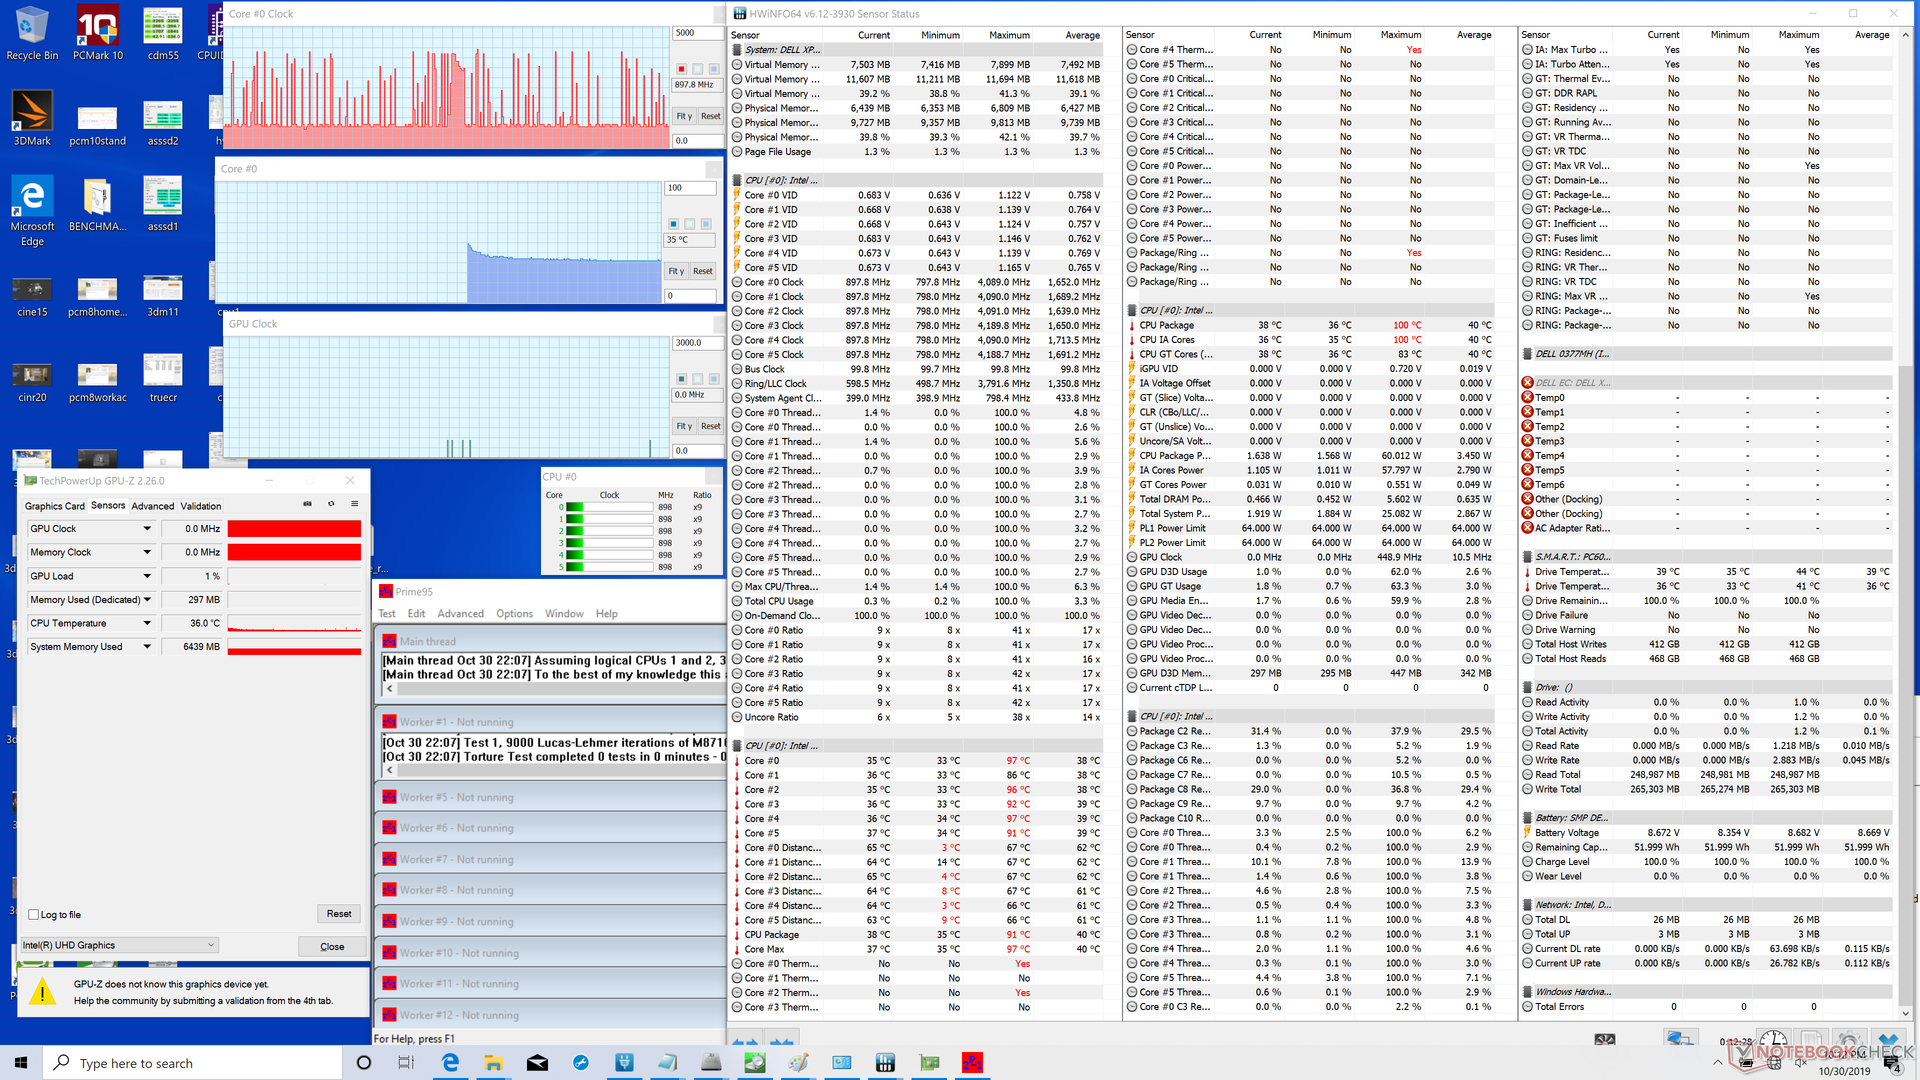
Stres testi
Potansiyel boğulma ya da stabilite sorunlarını belirlemek için sistemi sentetik yüklerle vurguluyoruz. Prime95'i çalıştırırken, CPU'nun düşmeden önce ilk birkaç saniye için 4 GHz'e kadar yükseldiği ve 3.0 ila 3.1 GHz aralığında stabilize olduğu gözlemlenebilir. Çekirdek sıcaklığı da bu süre zarfında yaklaşık 95 ° C'de sabit olacaktır. Yaklaşık 1.5 dakika sonra, saat hızları ve sıcaklık düşüşü sırasıyla 1.7 GHz - 2.5 GHz ve 64 C - 80 C arasında değişmektedir, çünkü CPU CineBench R15 Multi-Thread loop testimizde keşfedildiği gibi tutarlı bir şekilde maksimum Turbo Boost sürdürebilir. . Hem Prime95'i hem de FurMark'ı çalıştırmak, aşağıdaki ekran görüntüleri ve tabloda gösterildiği gibi benzer saat hızı ve sıcaklık döngüsü davranışına neden olur. ULV CPU'lu dizüstü bilgisayarların çoğu, bu XPS 13'te gözlenen geniş kapsamlı bisiklet davranışı aşırı strese maruz kaldığında performans düşüşü yaşar ünite nadirdir. Dell'in eşsiz yaklaşımının avantajları ve dezavantajları vardır; CPU zaman zaman stres altındayken normalden daha yüksek saat hızlarına ulaşabilirken, performans anı bazında da tutarsız hale gelebilir. Batarya gücünde çalışmak CPU performansını sınırlayacaktır. Akülerle yapılan bir Yangın Saldırısı koşusu, şebekedeki 14847 ve 1339 puanlarla karşılaştırıldığında sırasıyla 12325 ve 1333 puanlık Fizik ve Grafik puanlarını döndürür.
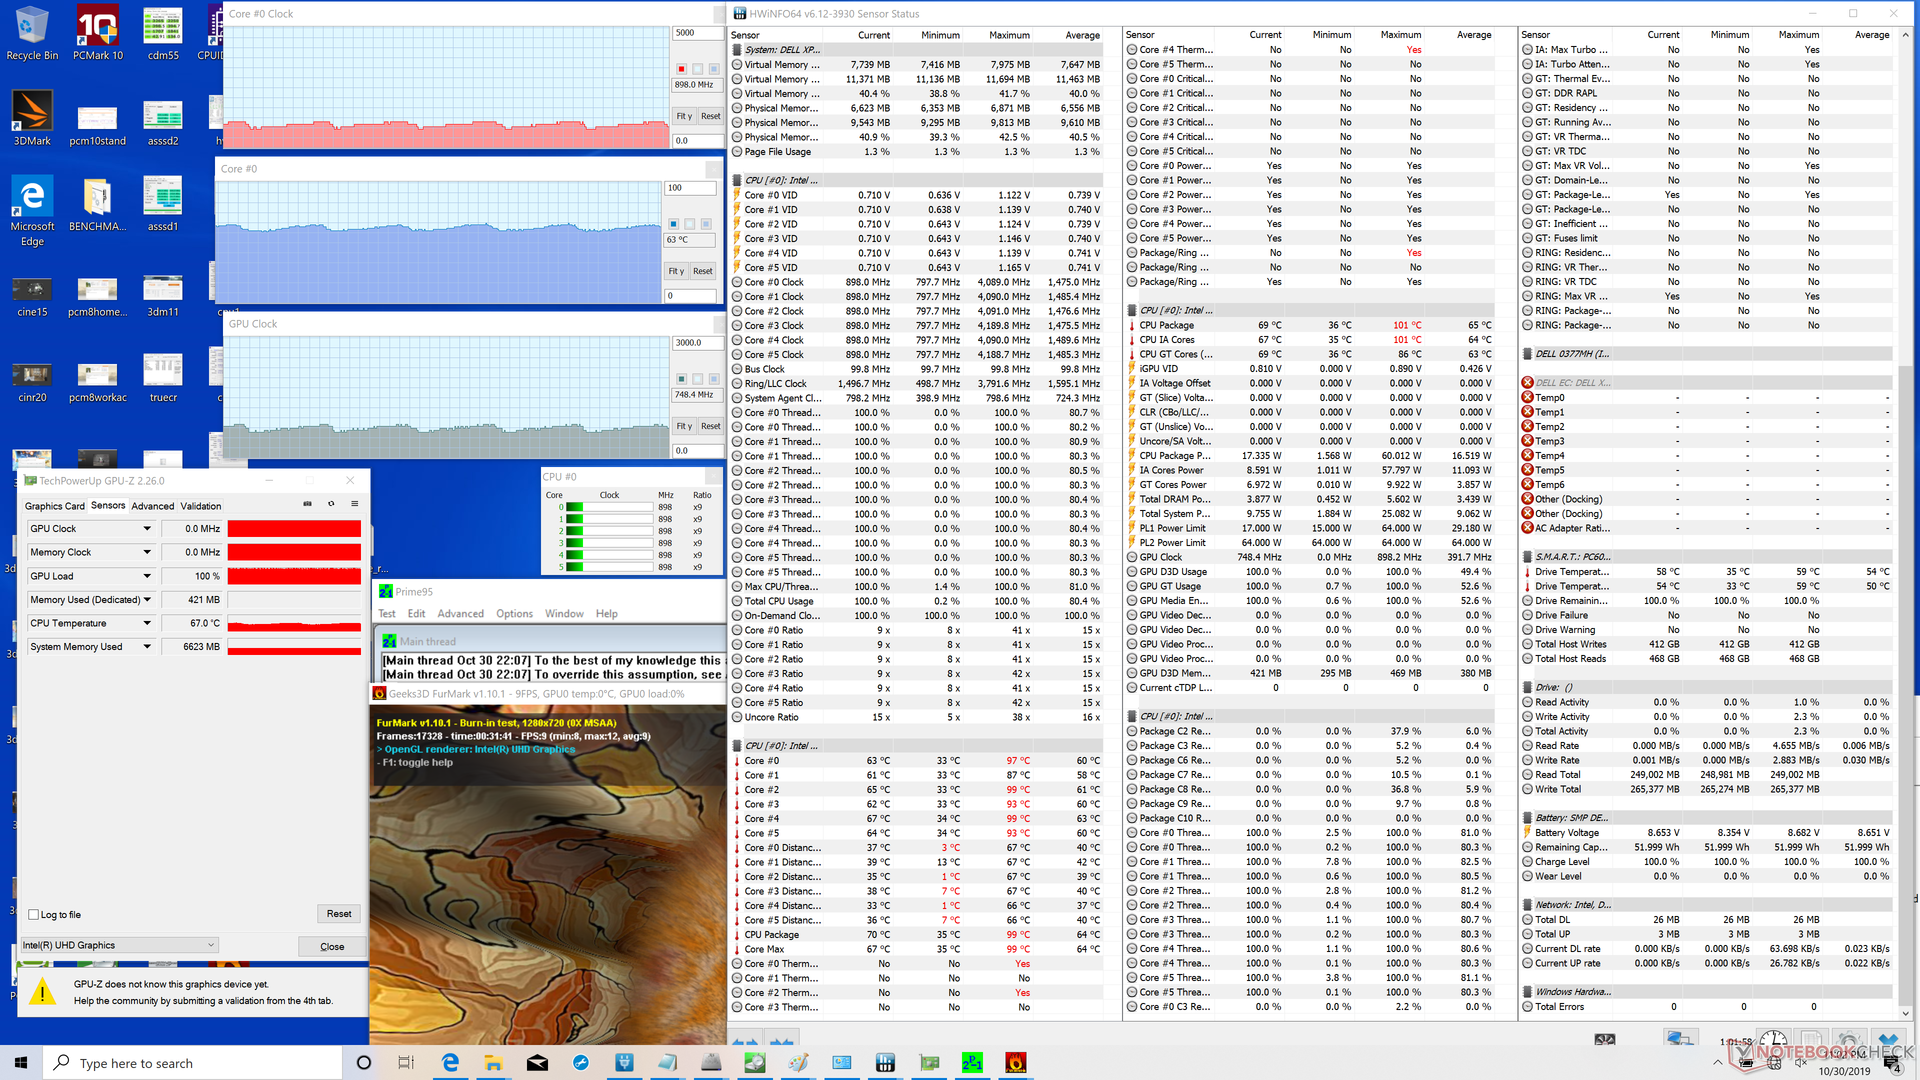

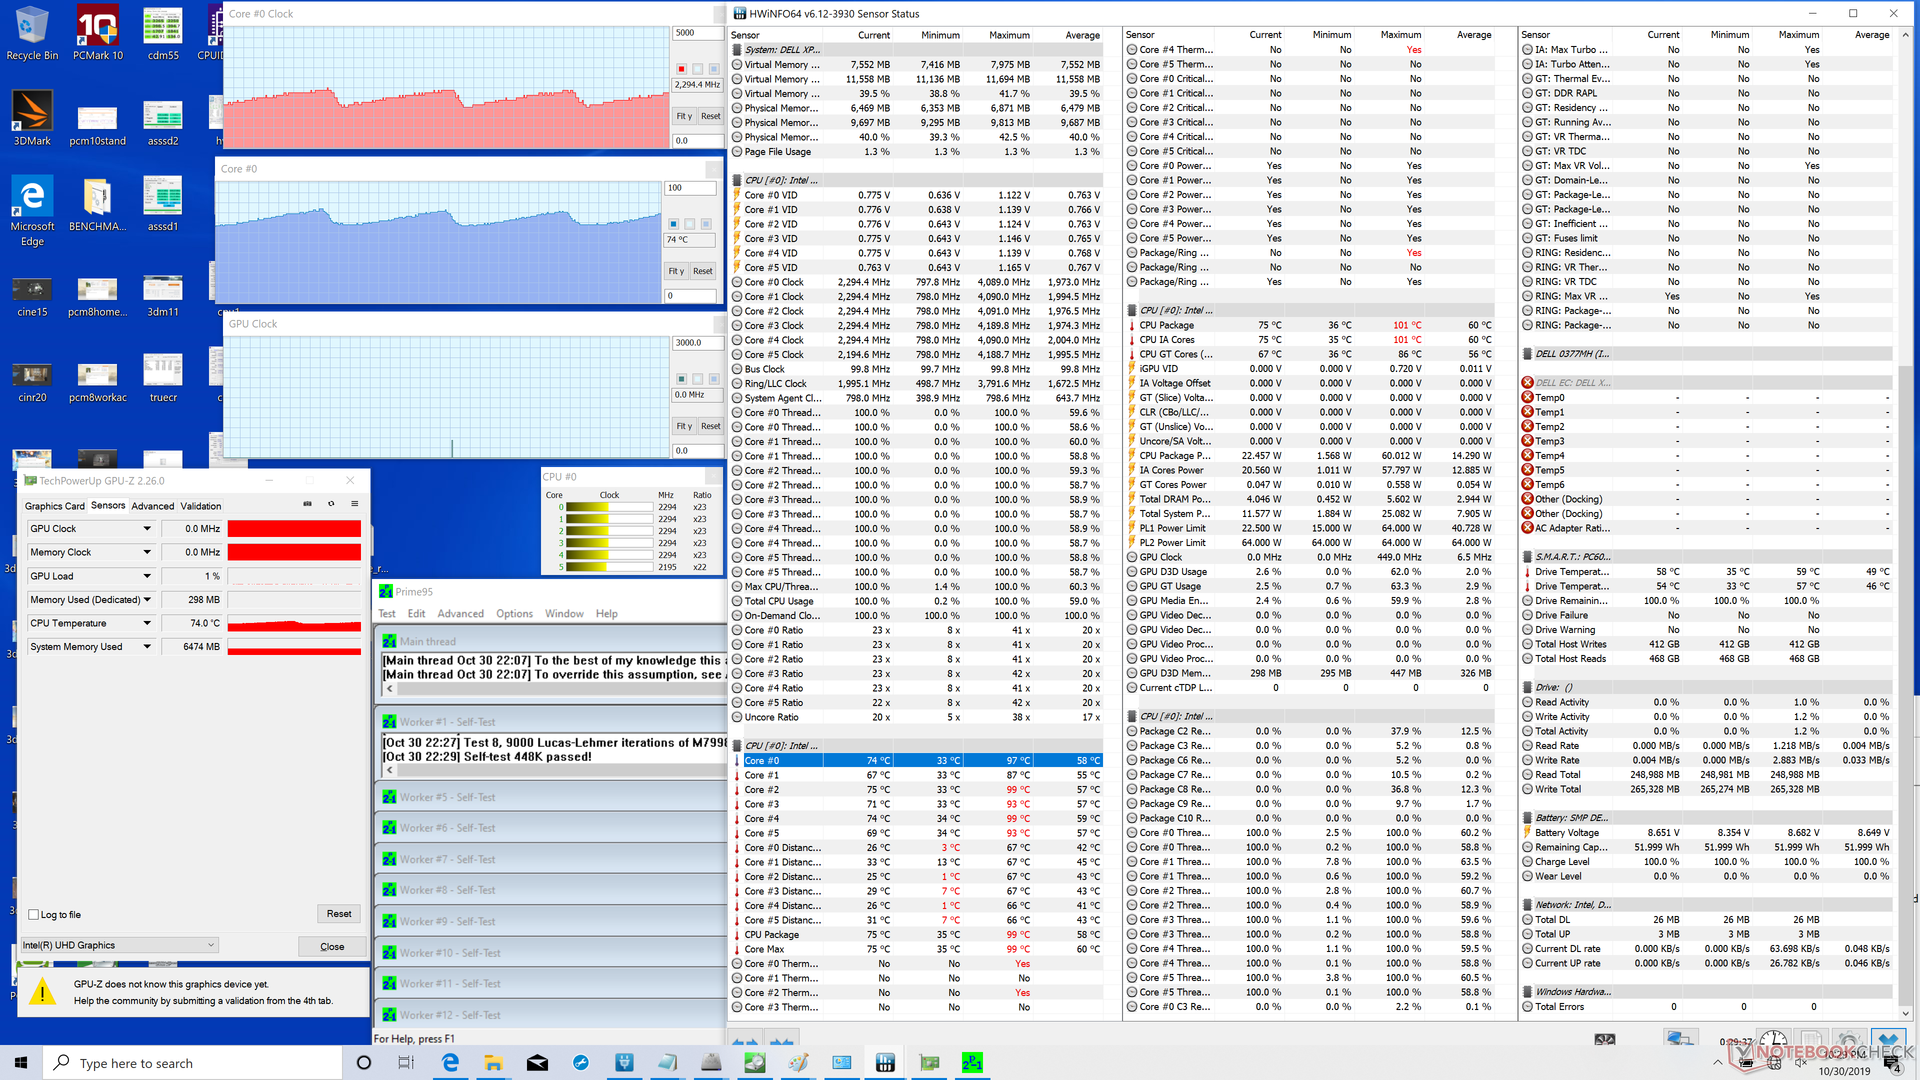
| CPU Clock (GHz) | GPU Clock (MHz) | CPU Temperature (°C) | |
| System Idle | -- | -- | 35 |
| Prime95 Stress | 1.8 - 2.5 | -- | 64 - 80 |
| Prime95 + FurMark Stress | 0.8 - 1.1 | 650 - 850 | 60 - 66 |
Energy Management
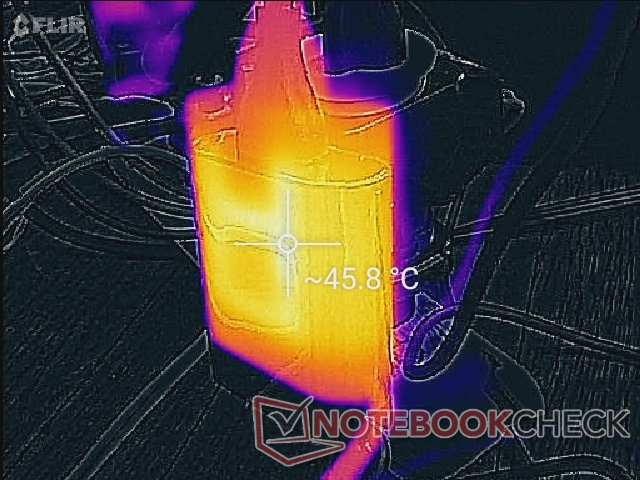
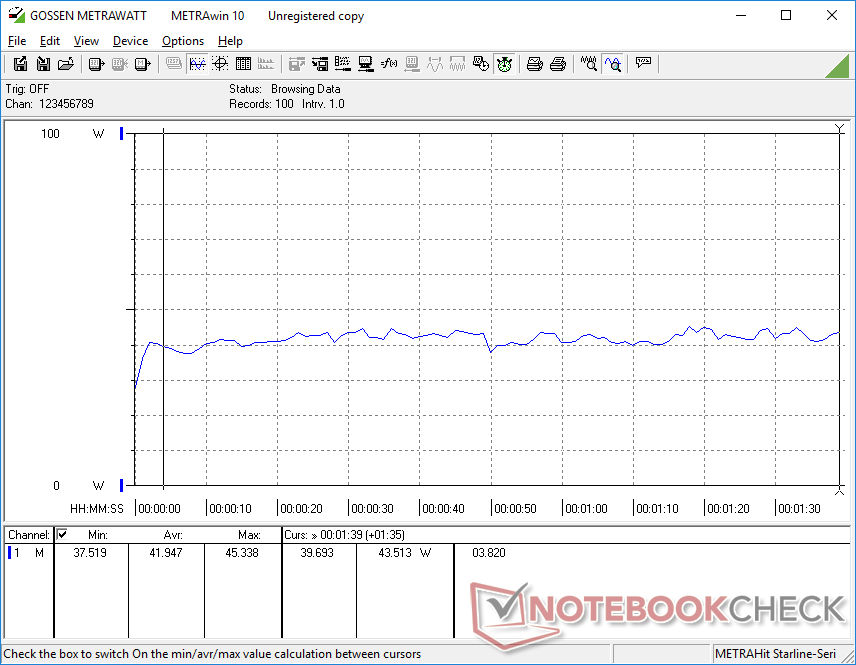
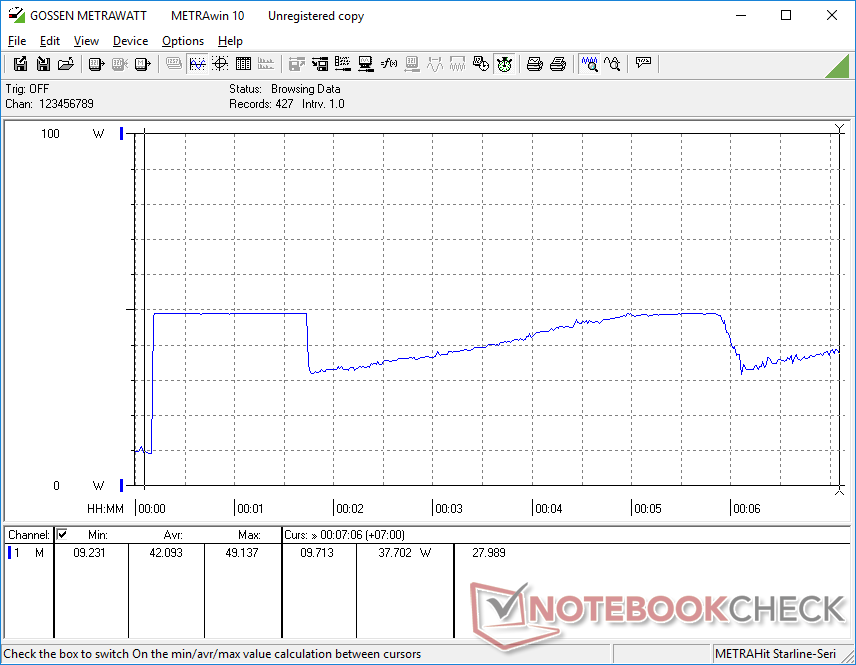
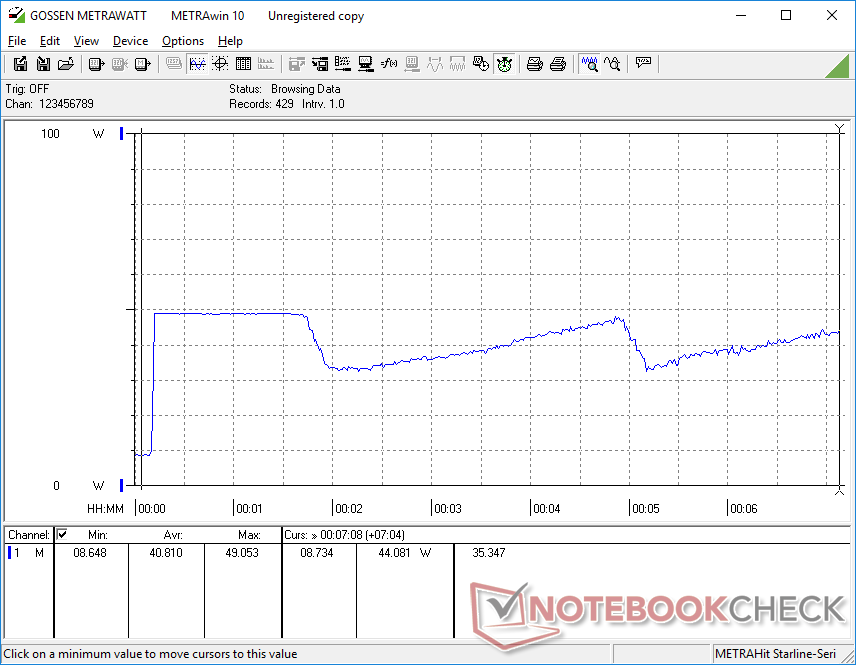
Power Consumption
Average power consumption is very close to what we observed on both the last generation XPS 13 9380 and XPS 13 9370 each with 4K UHD panels. After all, they each ship with the same small (~6.0 x 5.5 x 2.3 cm) 45 W USB Type-C AC adapter that can also be used to recharge USB Type-C devices and compatible laptops with USB Type-C PD. Nonetheless, power consumption will cycle when under extreme processing stress as shown by our graphs below.
| Kapalı / Bekleme modu | |
| Boşta | |
| Çalışırken |
|
Key:
min: | |
| Dell XPS 13 7390 Core i7-10710U i7-10710U, UHD Graphics 620, SK Hynix PC601 NVMe 512 GB, IPS, 3840x2160, 13.3" | Dell XPS 13 7390 2-in-1 Core i7 i7-1065G7, Iris Plus Graphics G7 (Ice Lake 64 EU), Toshiba BG4 KBG40ZPZ512G, IPS, 1920x1200, 13.4" | Dell XPS 13 7390 2-in-1 Core i3 i3-1005G1, UHD Graphics G1 (Ice Lake 32 EU), Toshiba BG4 KBG40ZPZ256G, IPS, 1920x1200, 13.4" | Dell XPS 13 9380 i7 4K i7-8565U, UHD Graphics 620, Samsung SSD PM981 MZVLB512HAJQ, IPS, 3840x2160, 13.3" | Dell XPS 13 9380 2019 i5-8265U, UHD Graphics 620, SK hynix PC401 HFS256GD9TNG, IPS, 3840x2160, 13.3" | Dell XPS 13 9370 i7 UHD i5-8550U, UHD Graphics 620, Toshiba XG5 KXG50ZNV512G, IPS, 3840x2160, 13.3" | |
|---|---|---|---|---|---|---|
| Power Consumption | 20% | 22% | -7% | -2% | -3% | |
| Idle Minimum * (Watt) | 4.7 | 2.6 45% | 3 36% | 5.2 -11% | 4.8 -2% | 5 -6% |
| Idle Average * (Watt) | 8.3 | 5.3 36% | 5.4 35% | 8.6 -4% | 8.6 -4% | 8.3 -0% |
| Idle Maximum * (Watt) | 9 | 7 22% | 7.3 19% | 10.5 -17% | 10.4 -16% | 8.8 2% |
| Load Average * (Watt) | 42 | 43.1 -3% | 33.4 20% | 44.2 -5% | 37.9 10% | 46.4 -10% |
| Load Maximum * (Watt) | 49 | 49 -0% | 48.3 1% | 47.5 3% | 48.5 1% | 48.6 1% |
| Witcher 3 ultra * (Watt) | 43.1 |
* ... daha küçük daha iyidir
Battery Life
Perhaps as a direct consequence of having similar power consumption behavior as the older XPS 13 9380 and 9370 series, battery life on the new Comet Lake-U option is about the same as its older siblings. Users can expect just over 8 hours of real-world WLAN use before needing to recharge.
| Dell XPS 13 7390 Core i7-10710U i7-10710U, UHD Graphics 620, 52 Wh | Dell XPS 13 7390 2-in-1 Core i7 i7-1065G7, Iris Plus Graphics G7 (Ice Lake 64 EU), 51 Wh | Dell XPS 13 7390 2-in-1 Core i3 i3-1005G1, UHD Graphics G1 (Ice Lake 32 EU), 51 Wh | Dell XPS 13 9380 i7 4K i7-8565U, UHD Graphics 620, 52 Wh | Dell XPS 13 9380 2019 i5-8265U, UHD Graphics 620, 52 Wh | Dell XPS 13 9370 i7 UHD i5-8550U, UHD Graphics 620, 52 Wh | |
|---|---|---|---|---|---|---|
| Pil Çalışma Süresi | 7% | 6% | -8% | -1% | -7% | |
| WiFi v1.3 (h) | 8.4 | 9 7% | 8.9 6% | 7.7 -8% | 8.3 -1% | 7.8 -7% |
| Reader / Idle (h) | 35.7 | 17.2 | 13.7 | |||
| Load (h) | 2.2 | 2.4 | 1.8 |
Artılar
Eksiler
Verdict
Do you really need a hexa-core processor for a subnotebook? If your intention is to use for the XPS 13 mostly for web browsing, video streaming, word processing, or other light office tasks that the series was initially designed for, then the older quad-core Core i7-8565U will be enough. PCMark 10 scores are so close between the XPS 13 7390 and XPS 13 9380 that it becomes hard to justify the price premium for owning a hexa-core XPS 13 especially since most users won't feel the difference during day-to-day loads.
On the other hand, power users who want to exploit the two additional cores of Comet Lake-U will be happy to find that the raw multi-thread performance boost over Whiskey Lake-U is quite significant even after accounting for the unsteady cycling clock rates and limited maximum Turbo Boost sustainability. If you frequently run programs that can benefit from additional threads or want to connect eGPU docking stations to your XPS 13, then the hexa-core Core i7-10710U SKU would be worthwhile.
The hexa-core XPS 13 7390 is for power users who want the performance of a baseline Core i5 XPS 15 in a smaller 13.3-inch package. The system is able to offer increased performance without any noticeable drawbacks to battery life, surface temperatures, power consumption, or fan noise.
Dell XPS 13 7390 Core i7-10710U
- 05/15/2020 v7 (old)
Allen Ngo
Price comparison
