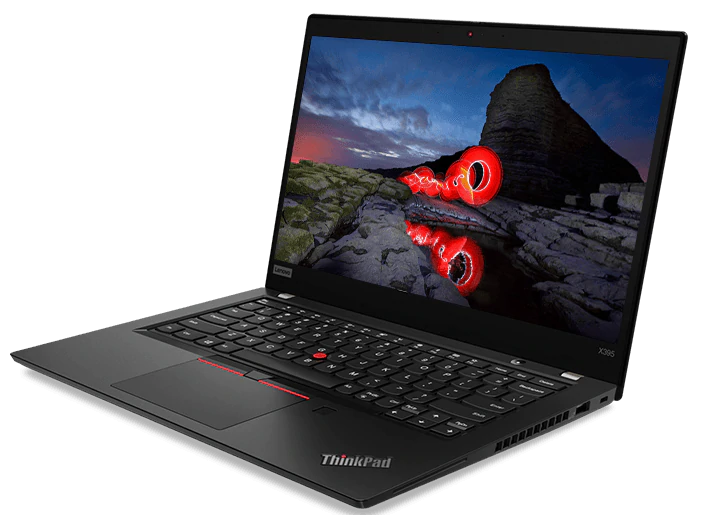
İnceleme: Lenovo ThinkPad X395 Laptop
Bir Intel Core i5-8265U ve bir Intel UHD Graphics 620 GPU ile test ettiğimiz ThinkPad X390, Nisan ayında yaptığımız incelemede etkileyici bir şekilde% 90'a ulaştı. Lenovo, bu yıl başlarında test ettiğimiz cihazın AMD sürümü olan X395'i piyasaya sürdü, bu da Radeon RX Vega 6 GPU'yu birleştiren bir Ryzen 3 PRO 3300U işlemcisi ile geliyor. Lenovo'dan satın alınmış olmasına rağmen, lütfen bu yapılandırmanın entegre LTE'ye sahip olmadığını unutmayın. X395'i yalnızca ThinkPad X390 ve ThinkPad X390 Yoga ile değil aynı zamanda Dell Latitude 5300 ve Latitude 3400 kardeşleriyle de Huawei MateBook 13 ve HP EliteBook x360 1030 G3 ile karşılaştırmalıyız. Latitude 3400'ü referans için bir Core i3-8145U işlemci ile test ettik, muhtemelen Ryzen 3 PRO 3300U işlemci ile Core i5 destekli karşılaştırma cihazlarımıza göre daha adil bir karşılaştırma sağlayabildik. X395 kasa, bağlantı, giriş cihazları, ve X390 ile bakım seçenekleri. Lütfen bu bölümlerdeki düşüncelerimiz için ThinkPad X390 incelememize bakın.
#compare_competitor
Derecelendirme | Tarih | Modeli | Ağırlık | Yükseklik | Boyut | Çözünürlük | Fiyat |
|---|---|---|---|---|---|---|---|
| 88.8 % v7 (old) | 10/2019 | Lenovo ThinkPad X395 R3 PRO 3300U, Vega 6 | 1.3 kg | 16.9 mm | 13.30" | 1920x1080 | |
| 90.3 % v6 (old) | 05/2019 | Lenovo ThinkPad X390-20Q1S02M00 i5-8265U, UHD Graphics 620 | 1.3 kg | 16.9 mm | 13.30" | 1920x1080 | |
| 87.4 % v6 (old) | 06/2019 | Lenovo ThinkPad X390 Yoga-20NQS05R00 i7-8565U, UHD Graphics 620 | 1.3 kg | 15.95 mm | 13.30" | 1920x1080 | |
| 84.2 % v7 (old) | 03/2019 | Huawei Matebook 13-53010FYW i7-8565U, UHD Graphics 620 | 1.3 kg | 15 mm | 13.00" | 2160x1440 | |
| 89.5 % v7 (old) | 08/2018 | HP EliteBook x360 1030 G3 i5-8250U, UHD Graphics 620 | 1.3 kg | 15.8 mm | 13.30" | 1920x1080 | |
| 84.9 % v7 (old) | Dell Latitude 5300 i5-8365U, UHD Graphics 620 | 1.4 kg | 19 mm | 13.30" | 1920x1080 |
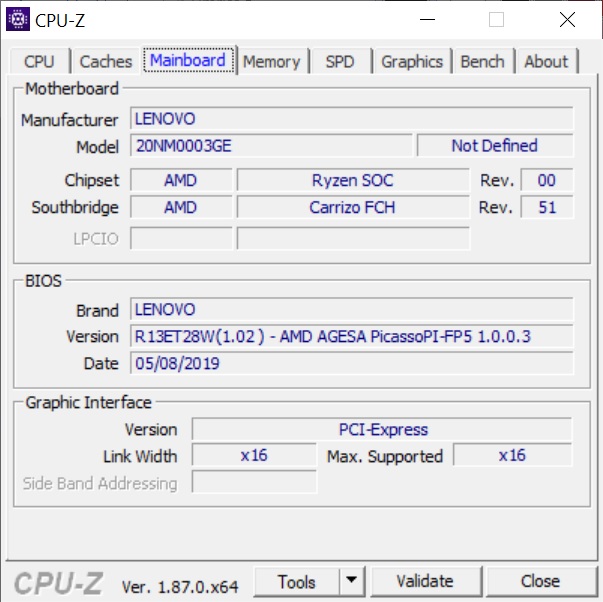
Bağlantı - ThinkPad X390 ile karşılaştırıldığında bazı farklılıklar
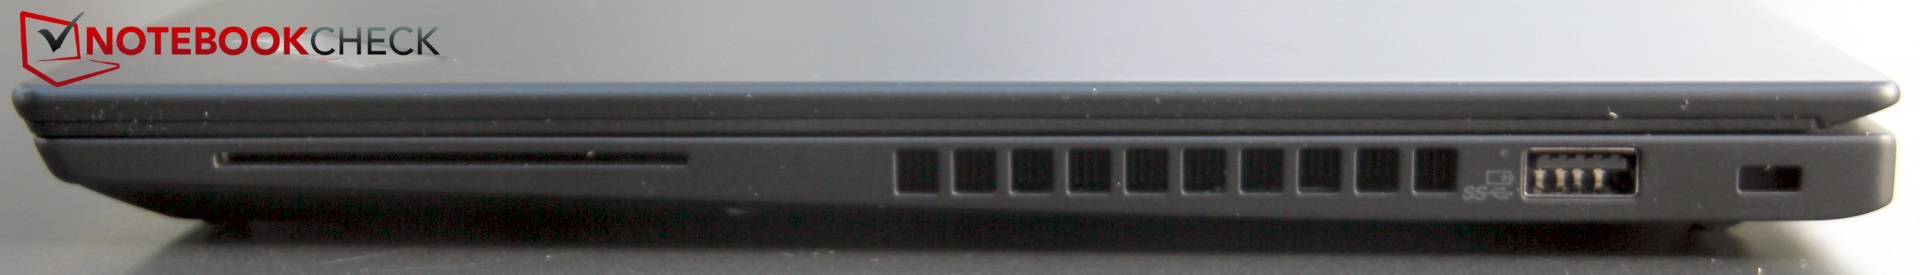
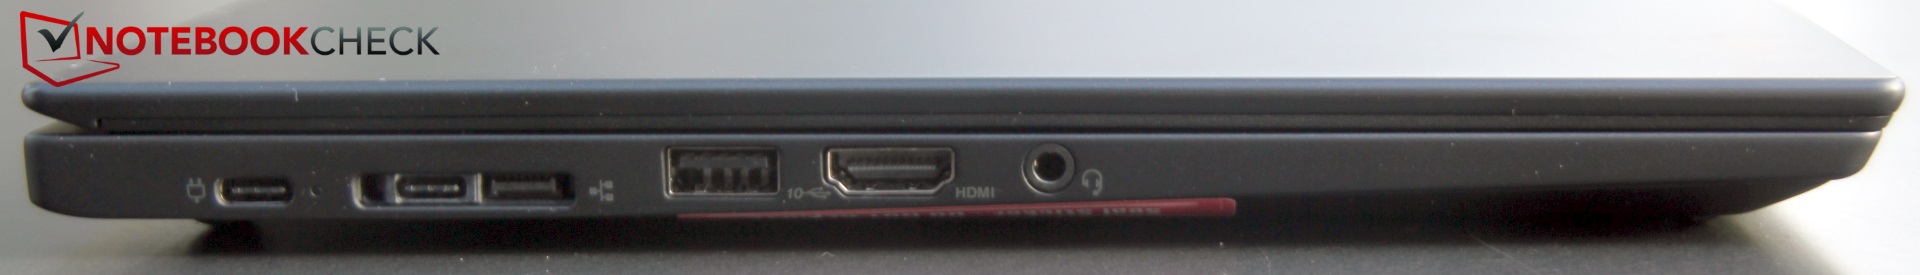
X395'in burada X390'a göre birkaç farklılığı var. Öncelikle, iki USB Tip-C bağlantı noktası Thunderbolt 3'ü desteklemiyor, ancak standardın şu anda bir Intel tescilli arabirimi olarak kaldığını düşünmek şaşırtıcı değil. Bununla birlikte, C Tipi bağlantı noktaları USB Güç Teslimatı (PD) ve DisplayPort'u destekler; X395'i şarj etmenizi veya C Tipi Her iki bağlantı noktasıyla DisplayPort monitörlerine bağlamanızı sağlar. X395 ayrıca, Lenovo'nun X390'a dahil ettiği 1.4 bağlantı noktasından bir yükseltme olan bir HDMI 2.0 bağlantı noktasına sahiptir. Ek olarak, X395, AMD FreeSync'i desteklemektedir, ancak Radeon RX Vega 6, bu işlevsellikten yararlanmak için yeterince güçlü değildir.
| SD Card Reader | |
| average JPG Copy Test (av. of 3 runs) | |
| Dell Latitude 5300 (Toshiba Exceria Pro M501 64 GB UHS-II) | |
| Lenovo ThinkPad X390 Yoga-20NQS05R00 (Toshiba Exceria Pro M501) | |
| Lenovo ThinkPad X390-20Q1S02M00 (Toshiba Exceria Pro M501) | |
| Sınıf ortalaması Subnotebook (23.7 - 188, n=9, son 2 yıl) | |
| Lenovo ThinkPad X395 | |
| maximum AS SSD Seq Read Test (1GB) | |
| Dell Latitude 5300 (Toshiba Exceria Pro M501 64 GB UHS-II) | |
| Sınıf ortalaması Subnotebook (24.9 - 195, n=8, son 2 yıl) | |
| Lenovo ThinkPad X390-20Q1S02M00 (Toshiba Exceria Pro M501) | |
| Lenovo ThinkPad X395 | |
| Lenovo ThinkPad X390 Yoga-20NQS05R00 (Toshiba Exceria Pro M501) | |
| Networking | |
| iperf3 transmit AX12 | |
| Lenovo ThinkPad X390-20Q1S02M00 | |
| Lenovo ThinkPad X395 | |
| HP EliteBook x360 1030 G3 | |
| iperf3 receive AX12 | |
| Lenovo ThinkPad X395 | |
| Lenovo ThinkPad X390-20Q1S02M00 | |
| HP EliteBook x360 1030 G3 | |
Güvenlik
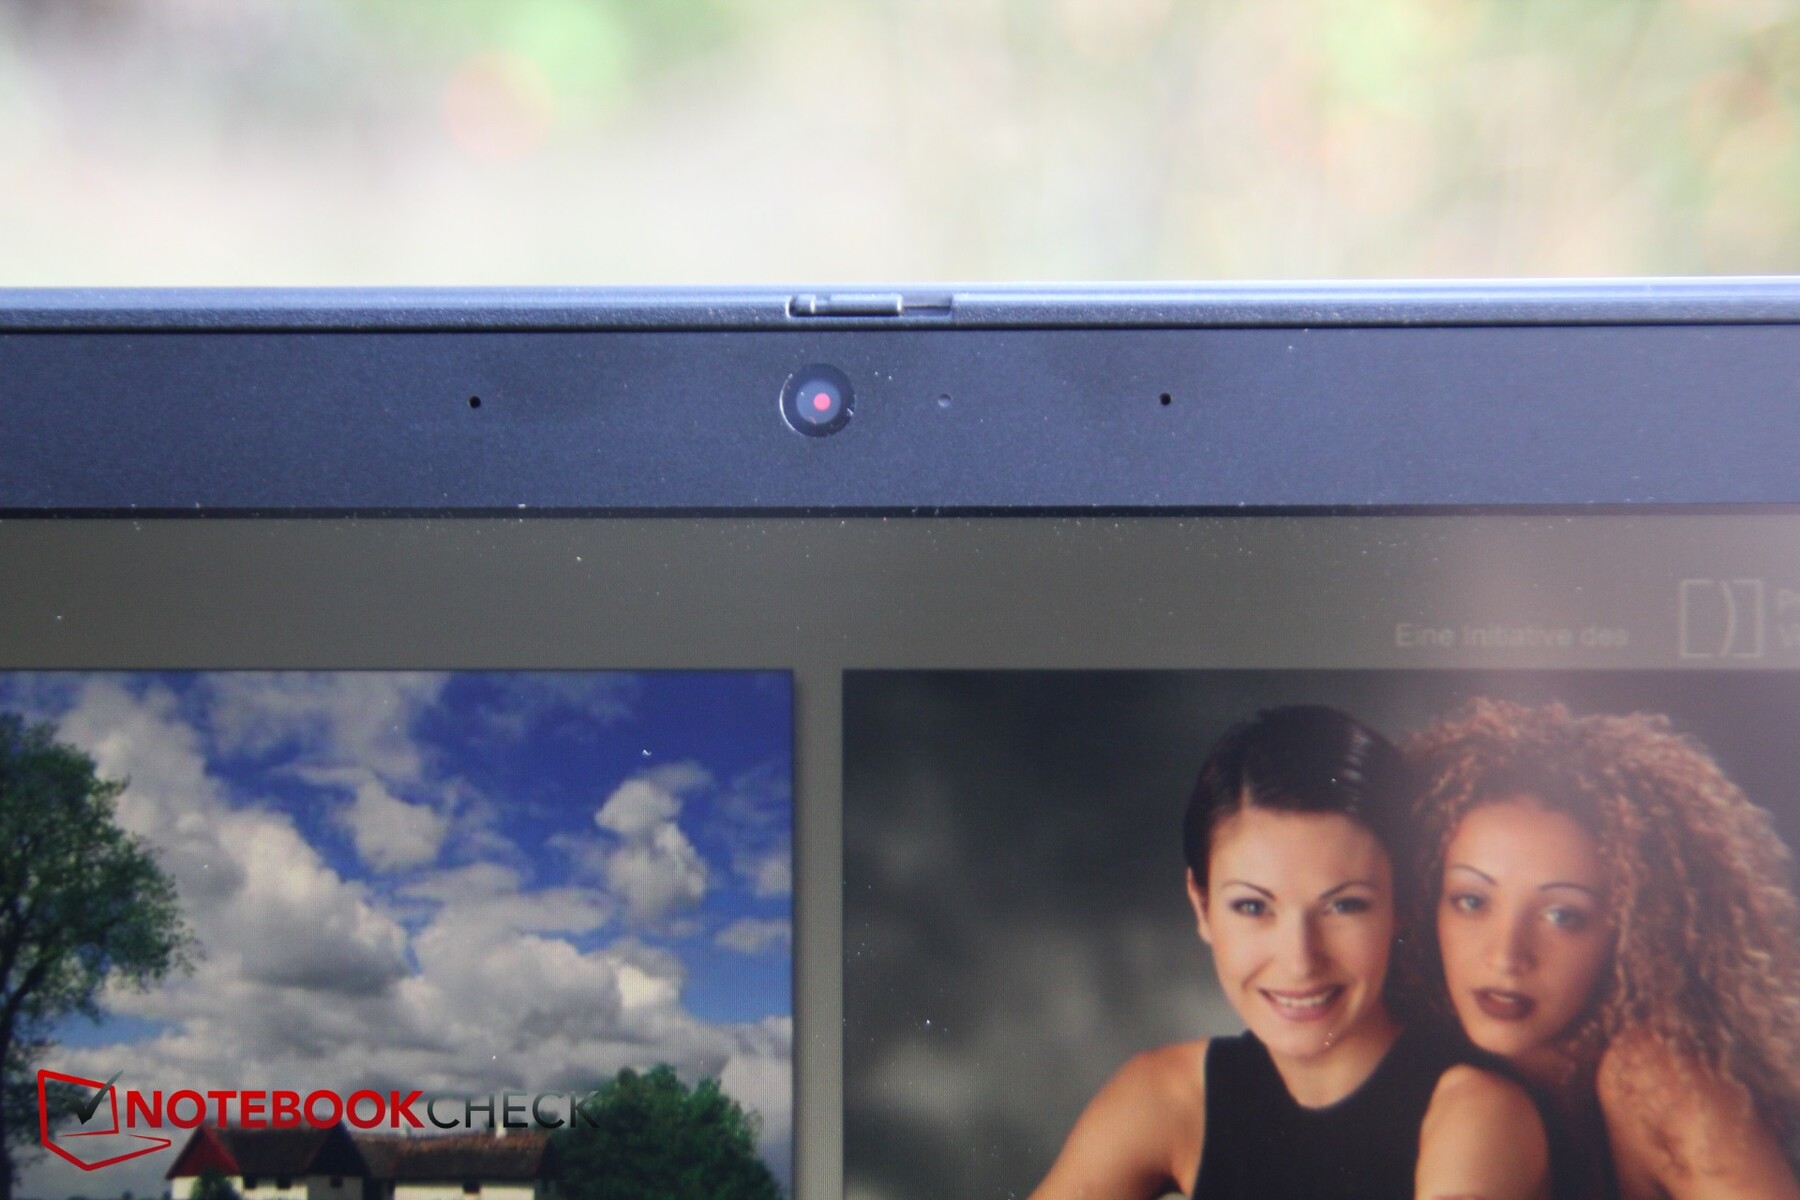
Ryzen 3 PRO 3300U, işletmeler için kullanışlı olabilecek yanlısı olmayan Ryzen işlemcilere göre ek güvenlik özellikleri sunar. X395, örneğin X390'ı bir Intel vPro işlemci ile donatırsanız alacağınız eşdeğerleri alacağınız RAM (AMD Bellek Koruması) ve Güvenli Önyükleme'yi şifreli. Lütfen vPro işlemcilerin geleneksel emsallerinden daha pahalı olduğunu unutmayın. Lenovo kullanışlı olan ThinkShutter web kamerası kapak çözümünü entegre etti. Dizüstü bilgisayarınızın çalınma riskini en aza indirgemek için bir Kensington kilidi yuvası da vardır.
Aksesuarlar
İnceleme birimimiz, kutuda RJ-45 dongle'a küçük bir Ethernet ile geldi. Lenovo, normal garanti belgelerini de içeriyordu.
Garanti
ThinkPad X395, varsayılan olarak üç yıl garantilidir. Garanti kapsamı teslim alma ve iade hizmetini içerir ve cihazı yapılandırırken uzatılabilir. Lütfen Garanti, İade Koşulları bölümüne bakınız.
Ekran - Parlak

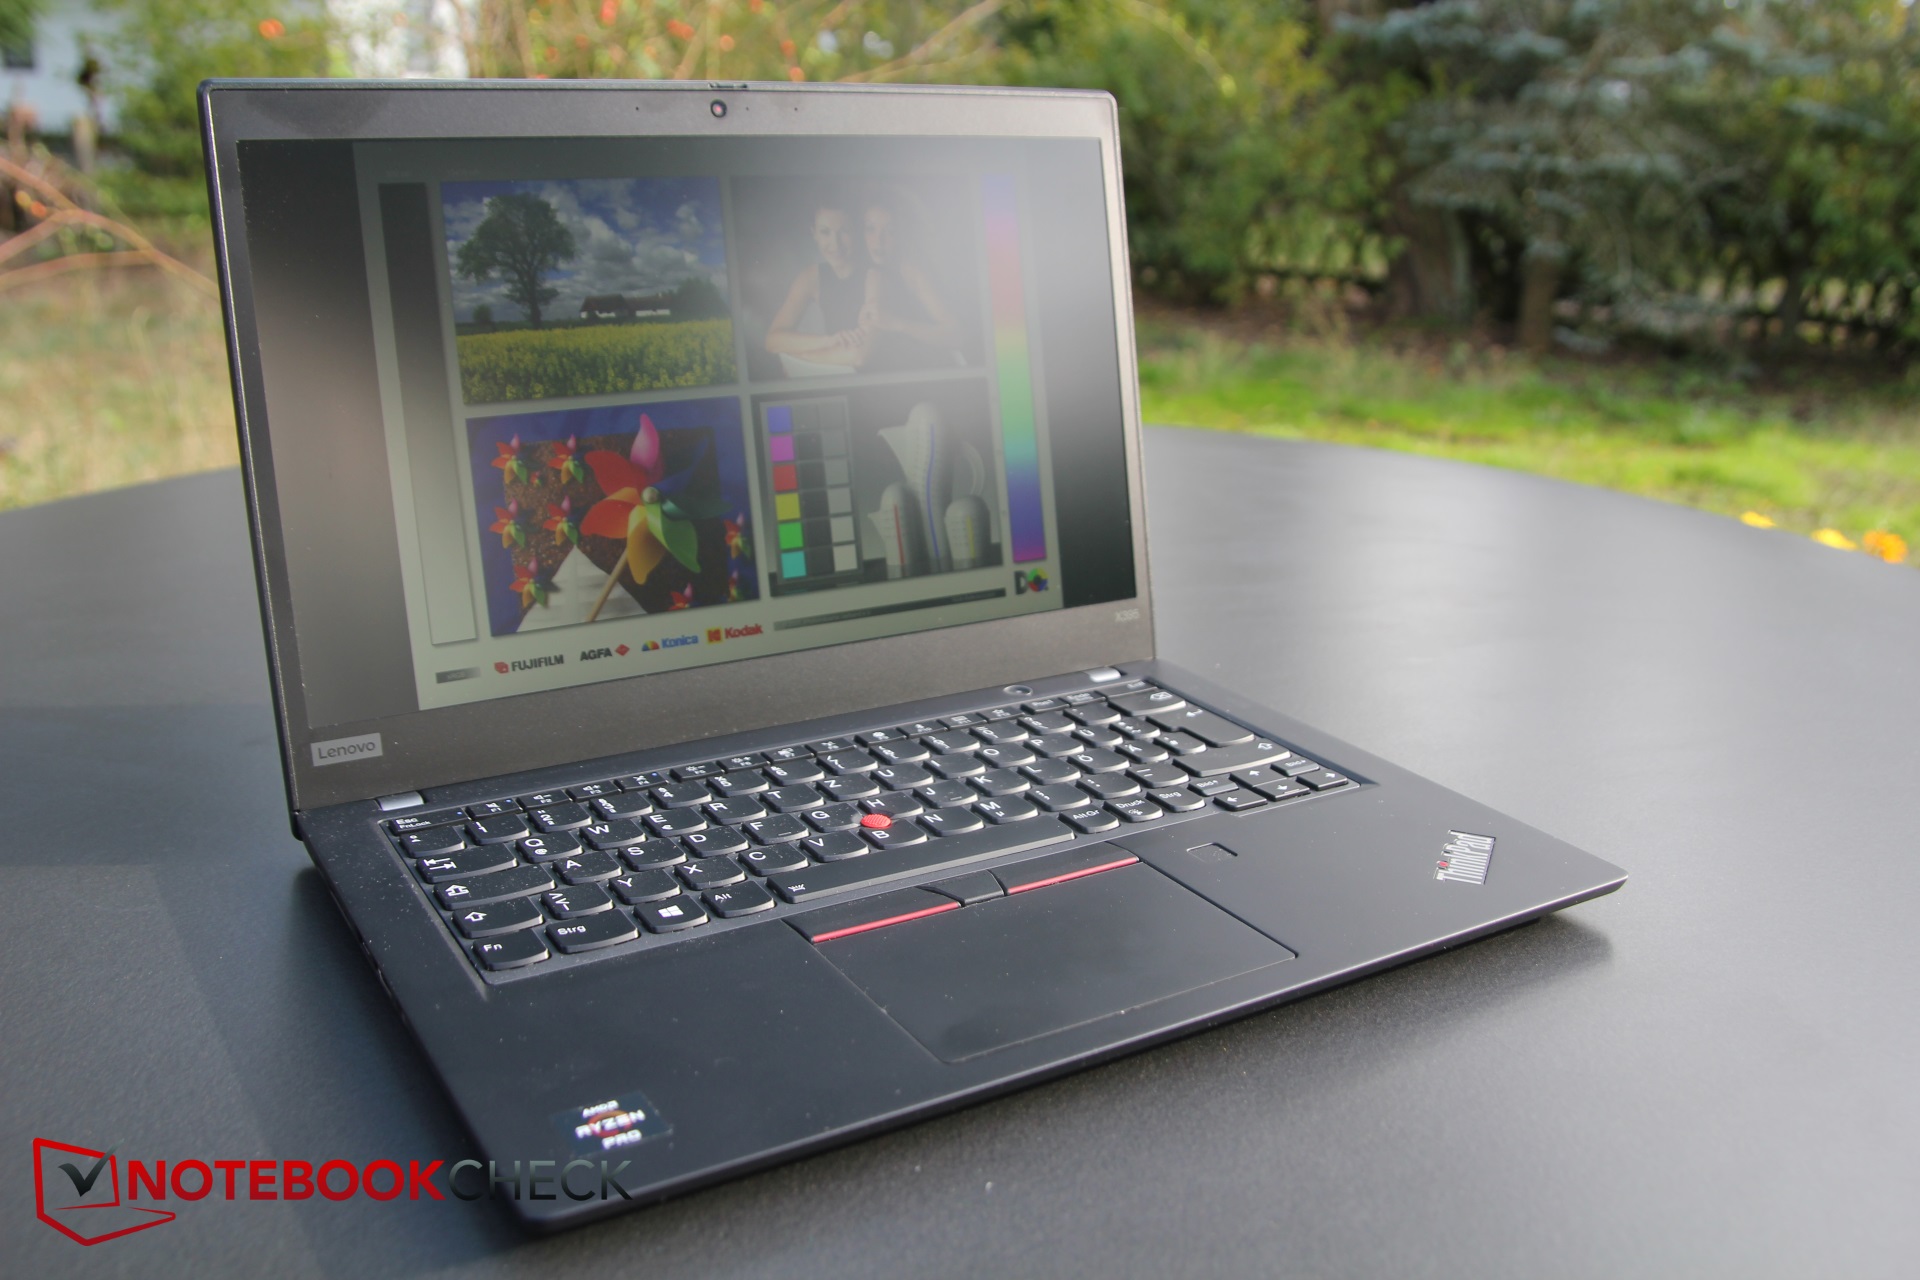
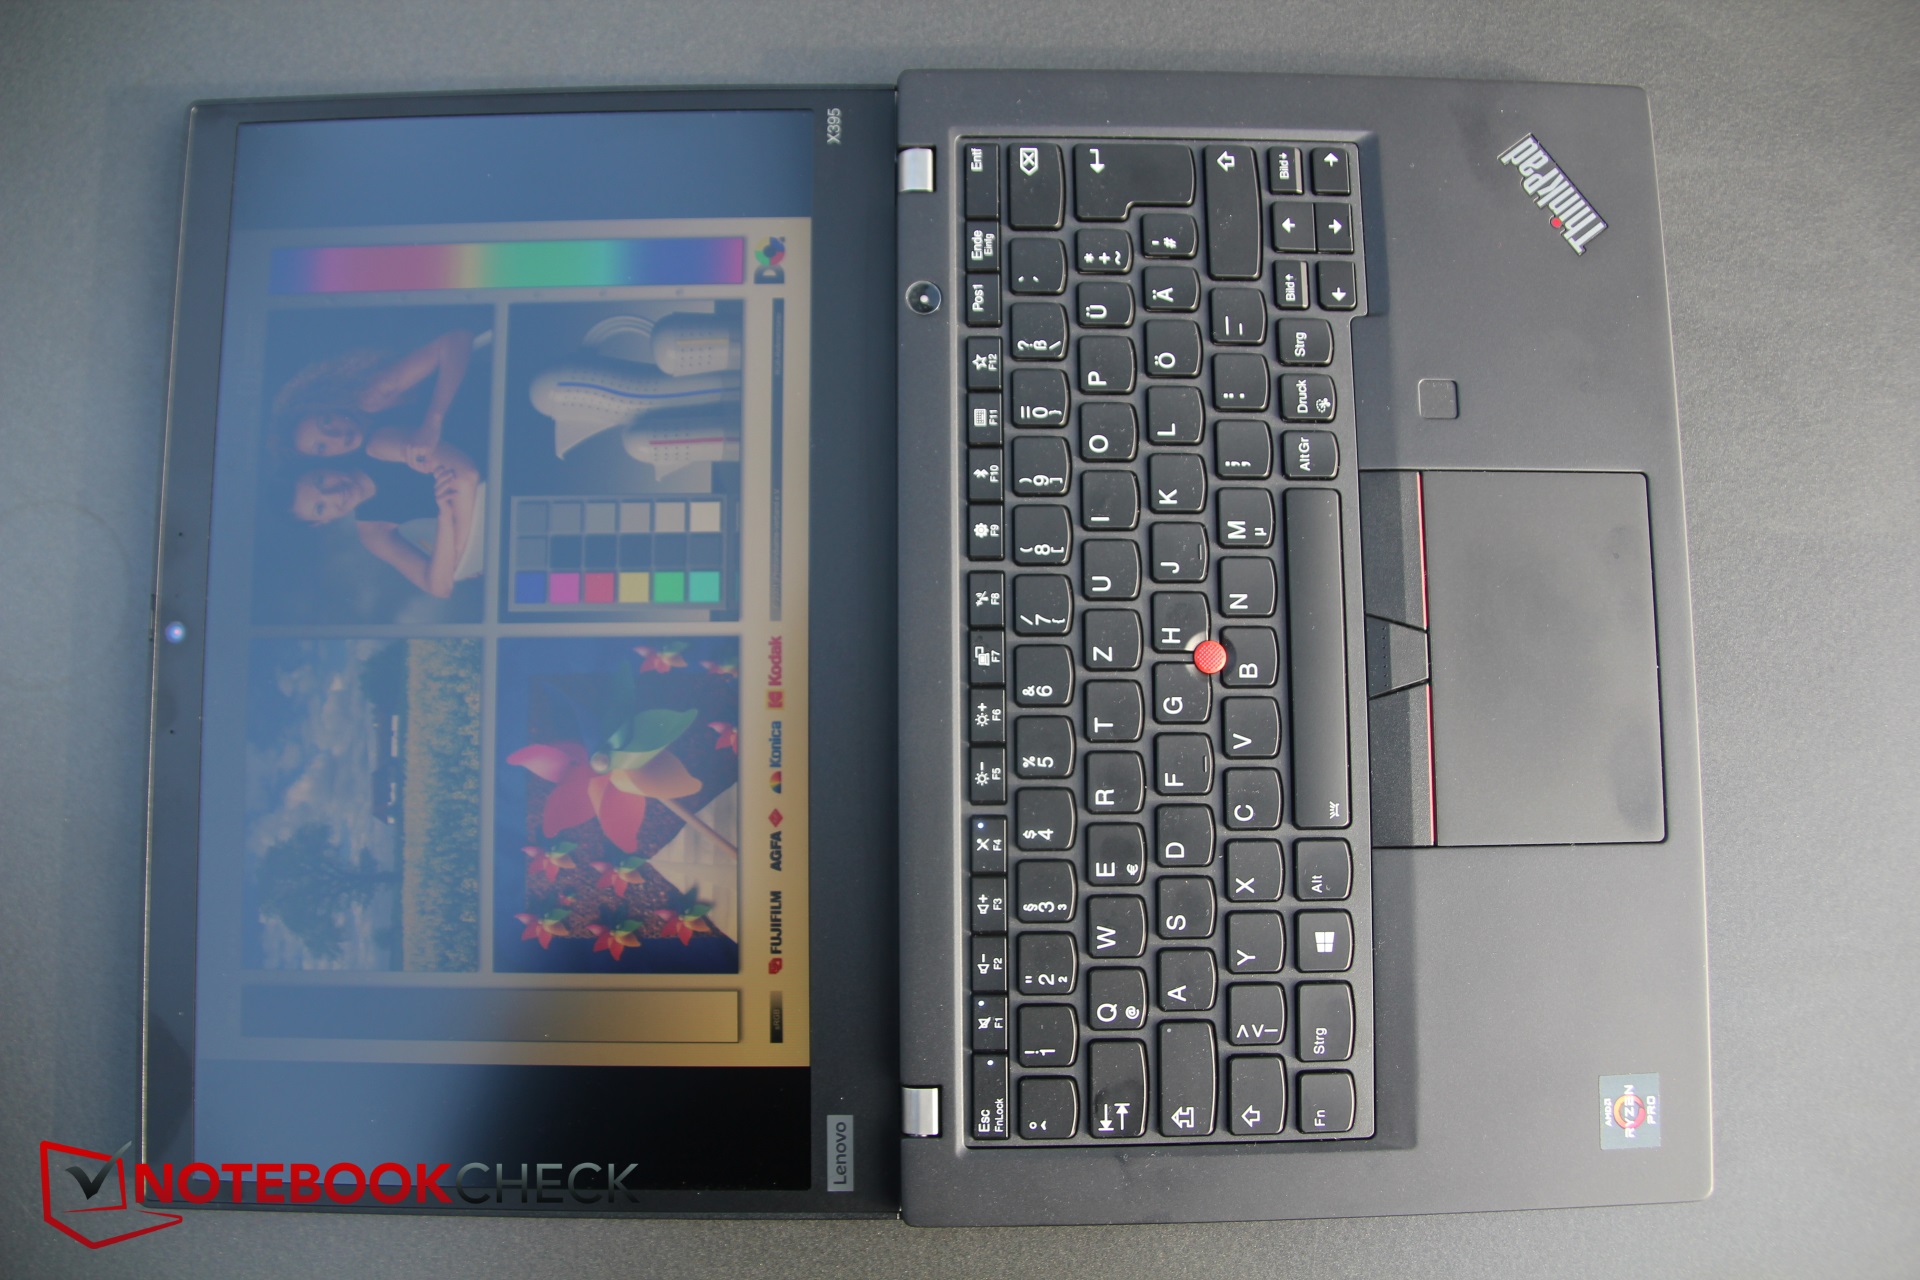
Lenovo, X395'i üç ekran seçeneğiyle sunar. 1366x768 TN ekran giriş seviyesi bir paneldir; inceleme birimimizdeki mat Full HD IPS panel ise orta seviye bir seçimdir. Lenovo, IPS panelinin dokunmatik özellikli bir versiyonunu da satmaktadır. İnceleme birimimizdeki ekran, Lenovo'nun X390 inceleme birimimizle donattığımız ile aynı. X395'teki ekran, hepsinden daha parlak olan X-Rite i1Pro 2'ye göre ortalama 336 cd / m² maksimum parlaklığa ulaştı ama bizim Karşılaştırma cihazlarımızın EliteBook x360 1030 G3'ü. EliteBook x360 1030 G3 aynı testlerde 443 cd / m² seviyesine ulaştı, ancak 336 cd / m² hala iyi bir değer. X395'teki ekran aynı zamanda% 88 düzenli olarak yanıyor ve karşılaştırma cihazlarımızla aynı seviyede. İnceleme birimimiz, arka ışık kanamasından muzdarip değil, en azından bir gözümüz olan gözlerimizde.
| |||||||||||||||||||||||||
Aydınlatma: 88 %
Batarya modunda parlaklık: 300 cd/m²
Kontrast: 2225:1 (Siyah: 0.16 cd/m²)
ΔE ColorChecker Calman: 3.6 | ∀{0.5-29.43 Ø4.71}
calibrated: 1.11
ΔE Greyscale Calman: 4.7 | ∀{0.09-98 Ø4.96}
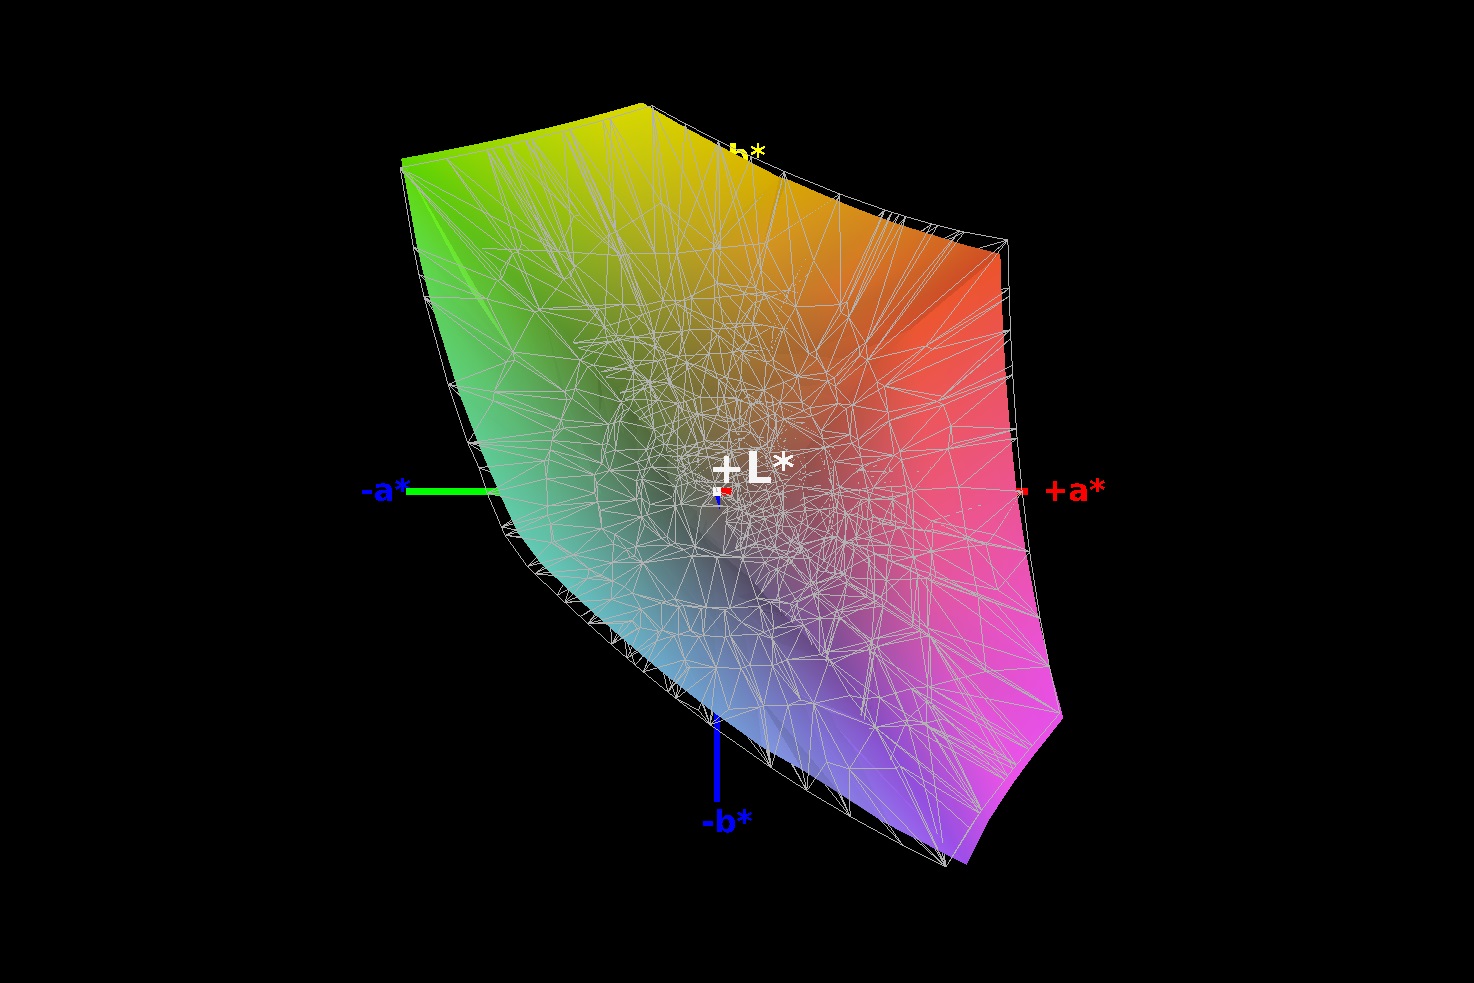
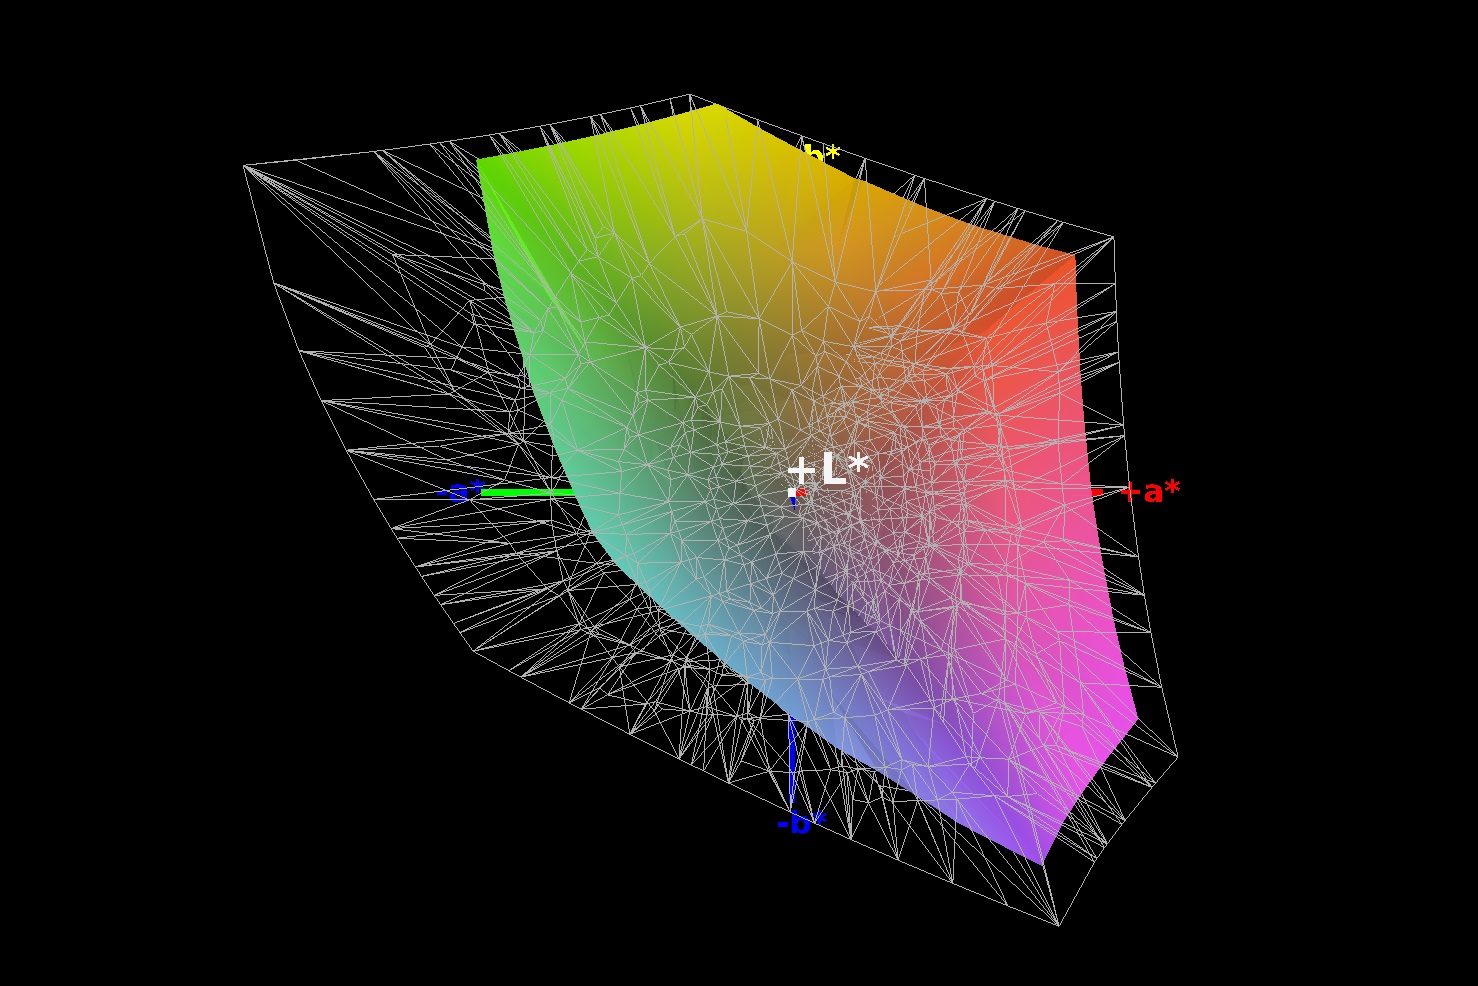
96% sRGB (Argyll 1.6.3 3D)
61% AdobeRGB 1998 (Argyll 1.6.3 3D)
65.8% AdobeRGB 1998 (Argyll 3D)
95.2% sRGB (Argyll 3D)
64.1% Display P3 (Argyll 3D)
Gamma: 2.92
CCT: 6222 K
| Lenovo ThinkPad X395 LP133WF7-SPB1, , 1920x1080, 13.3" | Lenovo ThinkPad X390-20Q1S02M00 LP133WF7-SPB1, , 1920x1080, 13.3" | HP EliteBook x360 1030 G3 Chi Mei CMN1380, , 1920x1080, 13.3" | Lenovo ThinkPad X390 Yoga-20NQS05R00 LP133WF7-SPA1, , 1920x1080, 13.3" | Huawei Matebook 13-53010FYW Chi Mei CMN8201, , 2160x1440, 13" | Dell Latitude 5300 LGD05ED-133WF6, , 1920x1080, 13.3" | |
|---|---|---|---|---|---|---|
| Display | 1% | 3% | 2% | 5% | 3% | |
| Display P3 Coverage (%) | 64.1 | 65.3 2% | 66.1 3% | 65.2 2% | 68.1 6% | 68.2 6% |
| sRGB Coverage (%) | 95.2 | 95.9 1% | 97.8 3% | 97 2% | 99.3 4% | 94.4 -1% |
| AdobeRGB 1998 Coverage (%) | 65.8 | 66.6 1% | 67.8 3% | 67.3 2% | 69.7 6% | 68.7 4% |
| Response Times | -6% | 25% | -2% | 13% | 23% | |
| Response Time Grey 50% / Grey 80% * (ms) | 55 ? | 57.6 ? -5% | 39.2 ? 29% | 59.2 ? -8% | 43.2 ? 21% | 38 ? 31% |
| Response Time Black / White * (ms) | 32 ? | 34 ? -6% | 25.6 ? 20% | 30.8 ? 4% | 30.4 ? 5% | 27.2 ? 15% |
| PWM Frequency (Hz) | 26040 ? | 60240 ? | ||||
| Screen | 0% | -9% | -21% | -21% | -14% | |
| Brightness middle (cd/m²) | 356 | 356 0% | 470.1 32% | 319 -10% | 356 0% | 326 -8% |
| Brightness (cd/m²) | 336 | 336 0% | 443 32% | 306 -9% | 346 3% | 313 -7% |
| Brightness Distribution (%) | 88 | 88 0% | 88 0% | 90 2% | 86 -2% | 87 -1% |
| Black Level * (cd/m²) | 0.16 | 0.16 -0% | 0.38 -138% | 0.15 6% | 0.35 -119% | 0.27 -69% |
| Contrast (:1) | 2225 | 2225 0% | 1237 -44% | 2127 -4% | 1017 -54% | 1207 -46% |
| Colorchecker dE 2000 * | 3.6 | 3.6 -0% | 2.47 31% | 6.1 -69% | 3.3 8% | 3.2 11% |
| Colorchecker dE 2000 max. * | 5.5 | 5.5 -0% | 5.73 -4% | 9.7 -76% | 8.7 -58% | 6.3 -15% |
| Colorchecker dE 2000 calibrated * | 1.11 | 1.1 1% | 1.52 -37% | 1 10% | 1.1 1% | 1.6 -44% |
| Greyscale dE 2000 * | 4.7 | 4.7 -0% | 3.7 21% | 8.6 -83% | 5.8 -23% | 3.8 19% |
| Gamma | 2.92 75% | 2.48 89% | 2.35 94% | 2.62 84% | 2.21 100% | 2.14 103% |
| CCT | 6222 104% | 6374 102% | 7373 88% | 6613 98% | 6670 97% | 6900 94% |
| Color Space (Percent of AdobeRGB 1998) (%) | 61 | 61.3 0% | 62 2% | 61.9 1% | 64.1 5% | 63.8 5% |
| Color Space (Percent of sRGB) (%) | 96 | 95.7 0% | 98.2 2% | 96.8 1% | 99.4 4% | 94.8 -1% |
| Toplam Ortalama (Program / Ayarlar) | -2% /
-0% | 6% /
-3% | -7% /
-14% | -1% /
-12% | 4% /
-6% |
* ... daha küçük daha iyidir
İnceleme biriminin siyah seviyesi ve kontrast oranı, her ikisi de genel olarak rekabeti geride bırakarak X390'ın elde ettiği oranlar kadar iyi. X395 ayrıca kutudan düşük renk sapmalarına sahipti, ancak bunlar ekranı kalibre ederek daha da azaltılabilirdi. Karşılaştırma tablomuzun yukarısındaki kutuda bulunan ilgili ICC dosyasını indirerek kalibre edilmiş profilimizi deneyebilirsiniz. X395, sRGB renk alanının% 96'sını ve AdobeRGB'ın da% 61'ini kapsıyor, bu da karşılaştırma cihazlarımızın bölgesi. Ekranın tepki süreleri zevklerimiz için biraz yavaş, ancak yine de bir iş dizüstü bilgisayarı için yeterince dayanıklı. Ancak bizce çok yüksek bir dokunuş var.
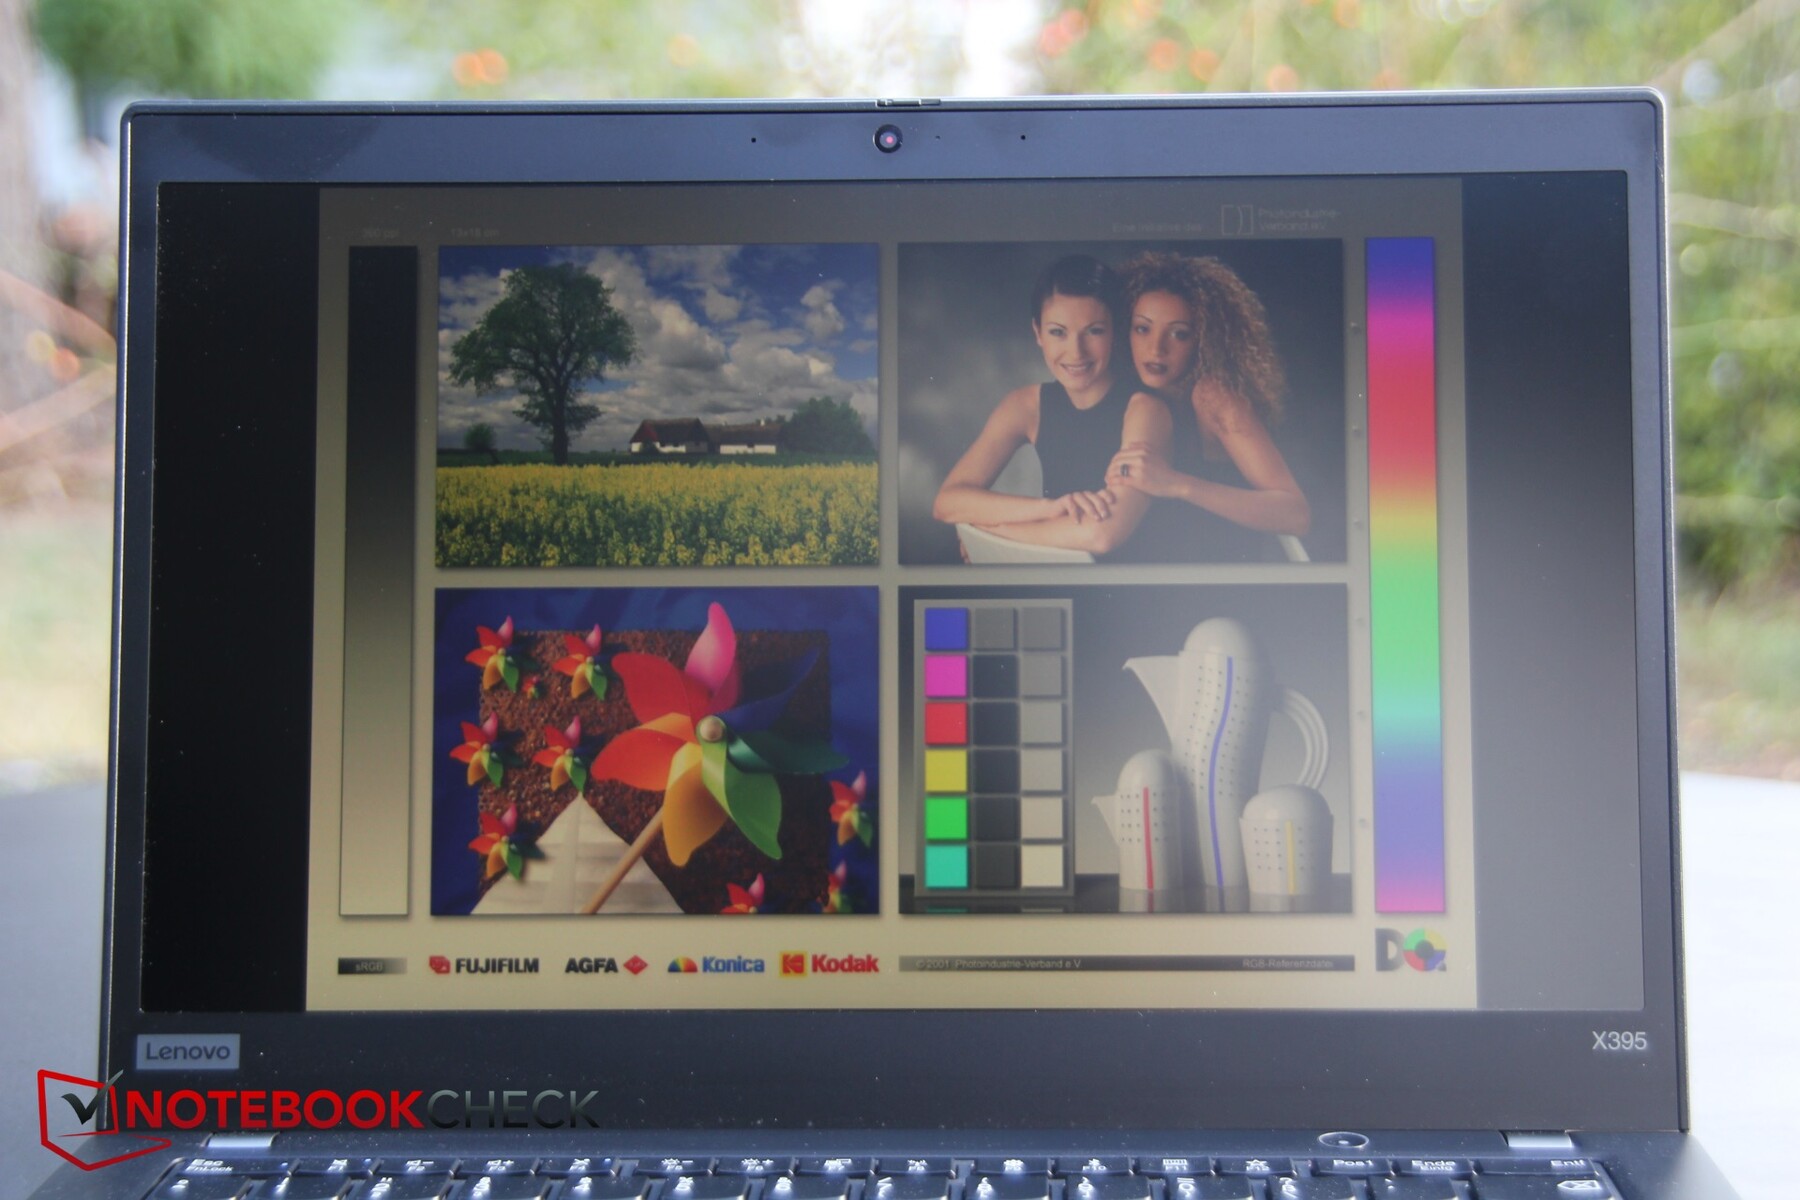
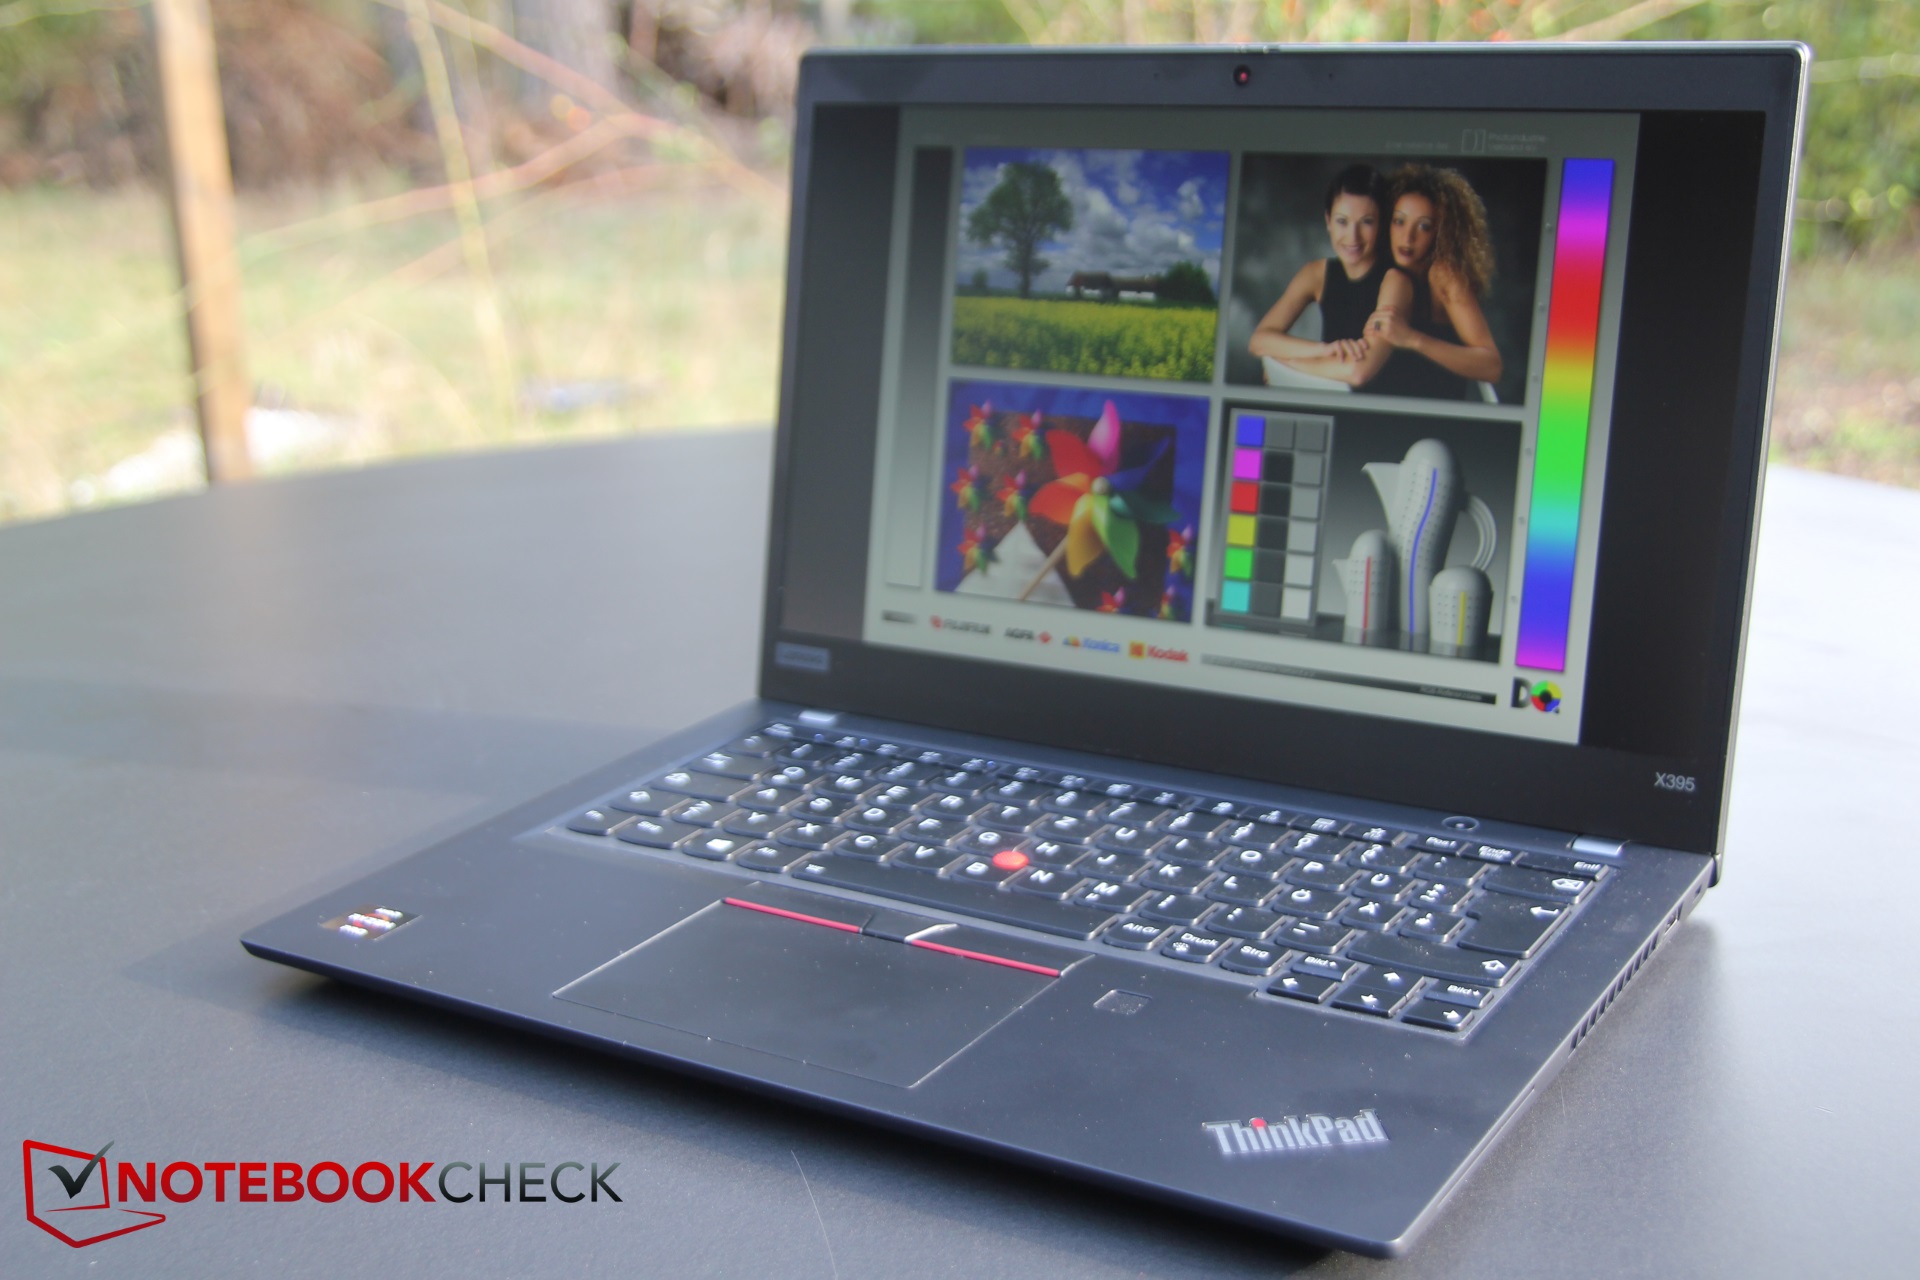
X395'i dış mekanlarda kullanmakta sorun yaşamadık, parlak ekranı güneşli günlerde bile okunabilir durumda kaldı. Mat kaplaması da yansımaları iyi dağıtır, yüksek kontrast oranı ve düşük siyah seviyesi içeriğin solgun görünmemesini sağlar.
Yanıt Sürelerini Görüntüle
| ↔ Tepki Süresi Siyahtan Beyaza | ||
|---|---|---|
| 32 ms ... yükseliş ↗ ve sonbahar↘ birleşimi | ↗ 18 ms yükseliş | 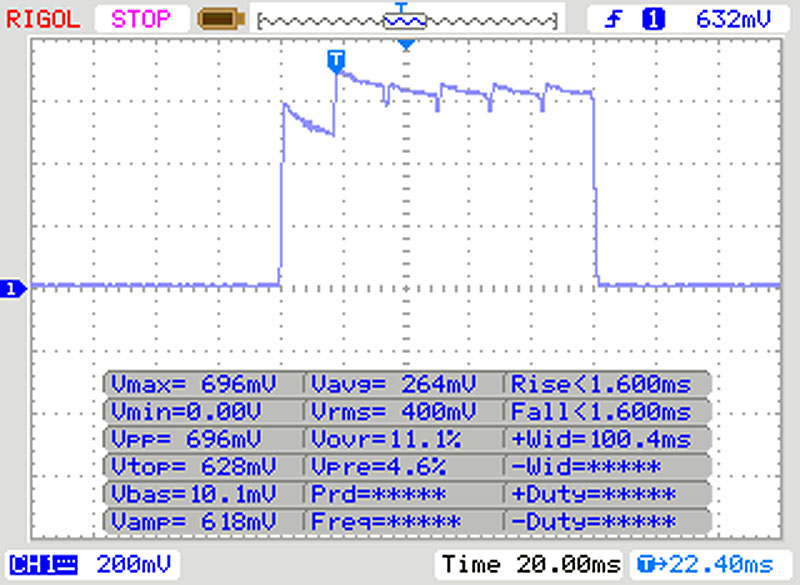 |
| ↘ 14 ms sonbahar | ||
| Ekran, testlerimizde yavaş yanıt oranları gösteriyor ve oyuncular için yetersiz olacaktır. Karşılaştırıldığında, test edilen tüm cihazlar 0.1 (minimum) ile 240 (maksimum) ms arasında değişir. » Tüm cihazların 86 %'si daha iyi. Bu, ölçülen yanıt süresinin test edilen tüm cihazların ortalamasından (19.8 ms) daha kötü olduğu anlamına gelir. | ||
| ↔ Tepki Süresi %50 Griden %80 Griye | ||
| 55 ms ... yükseliş ↗ ve sonbahar↘ birleşimi | ↗ 26 ms yükseliş | 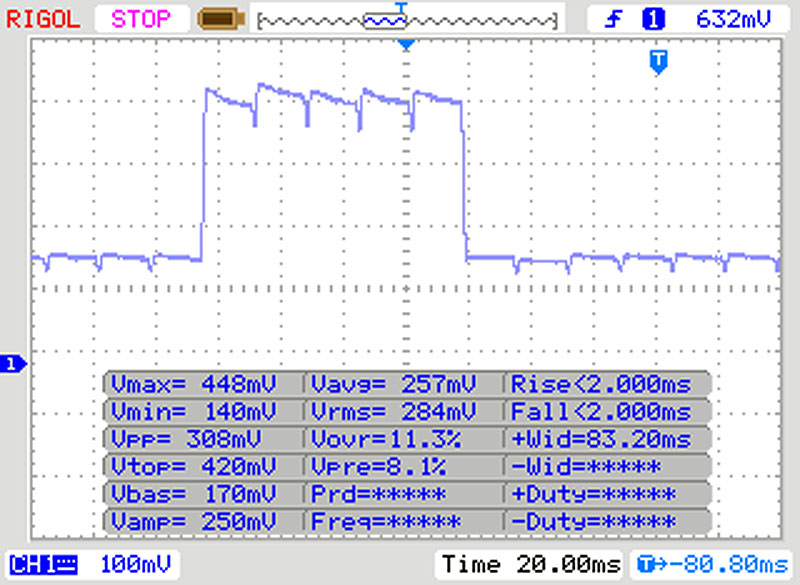 |
| ↘ 29 ms sonbahar | ||
| Ekran, testlerimizde yavaş yanıt oranları gösteriyor ve oyuncular için yetersiz olacaktır. Karşılaştırıldığında, test edilen tüm cihazlar 0.165 (minimum) ile 636 (maksimum) ms arasında değişir. » Tüm cihazların 92 %'si daha iyi. Bu, ölçülen yanıt süresinin test edilen tüm cihazların ortalamasından (30.9 ms) daha kötü olduğu anlamına gelir. | ||
Ekran Titremesi / PWM (Darbe Genişliği Modülasyonu)
| Ekran titriyor / PWM algılanmadı | 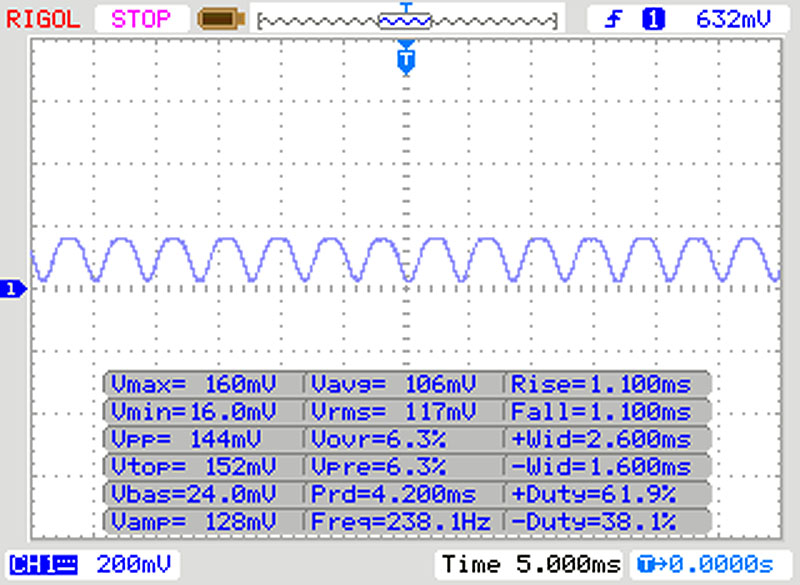 | ||
Karşılaştırıldığında: Test edilen tüm cihazların %52 %'si ekranı karartmak için PWM kullanmıyor. PWM tespit edilirse, ortalama 7741 (minimum: 5 - maksimum: 343500) Hz ölçüldü. | |||
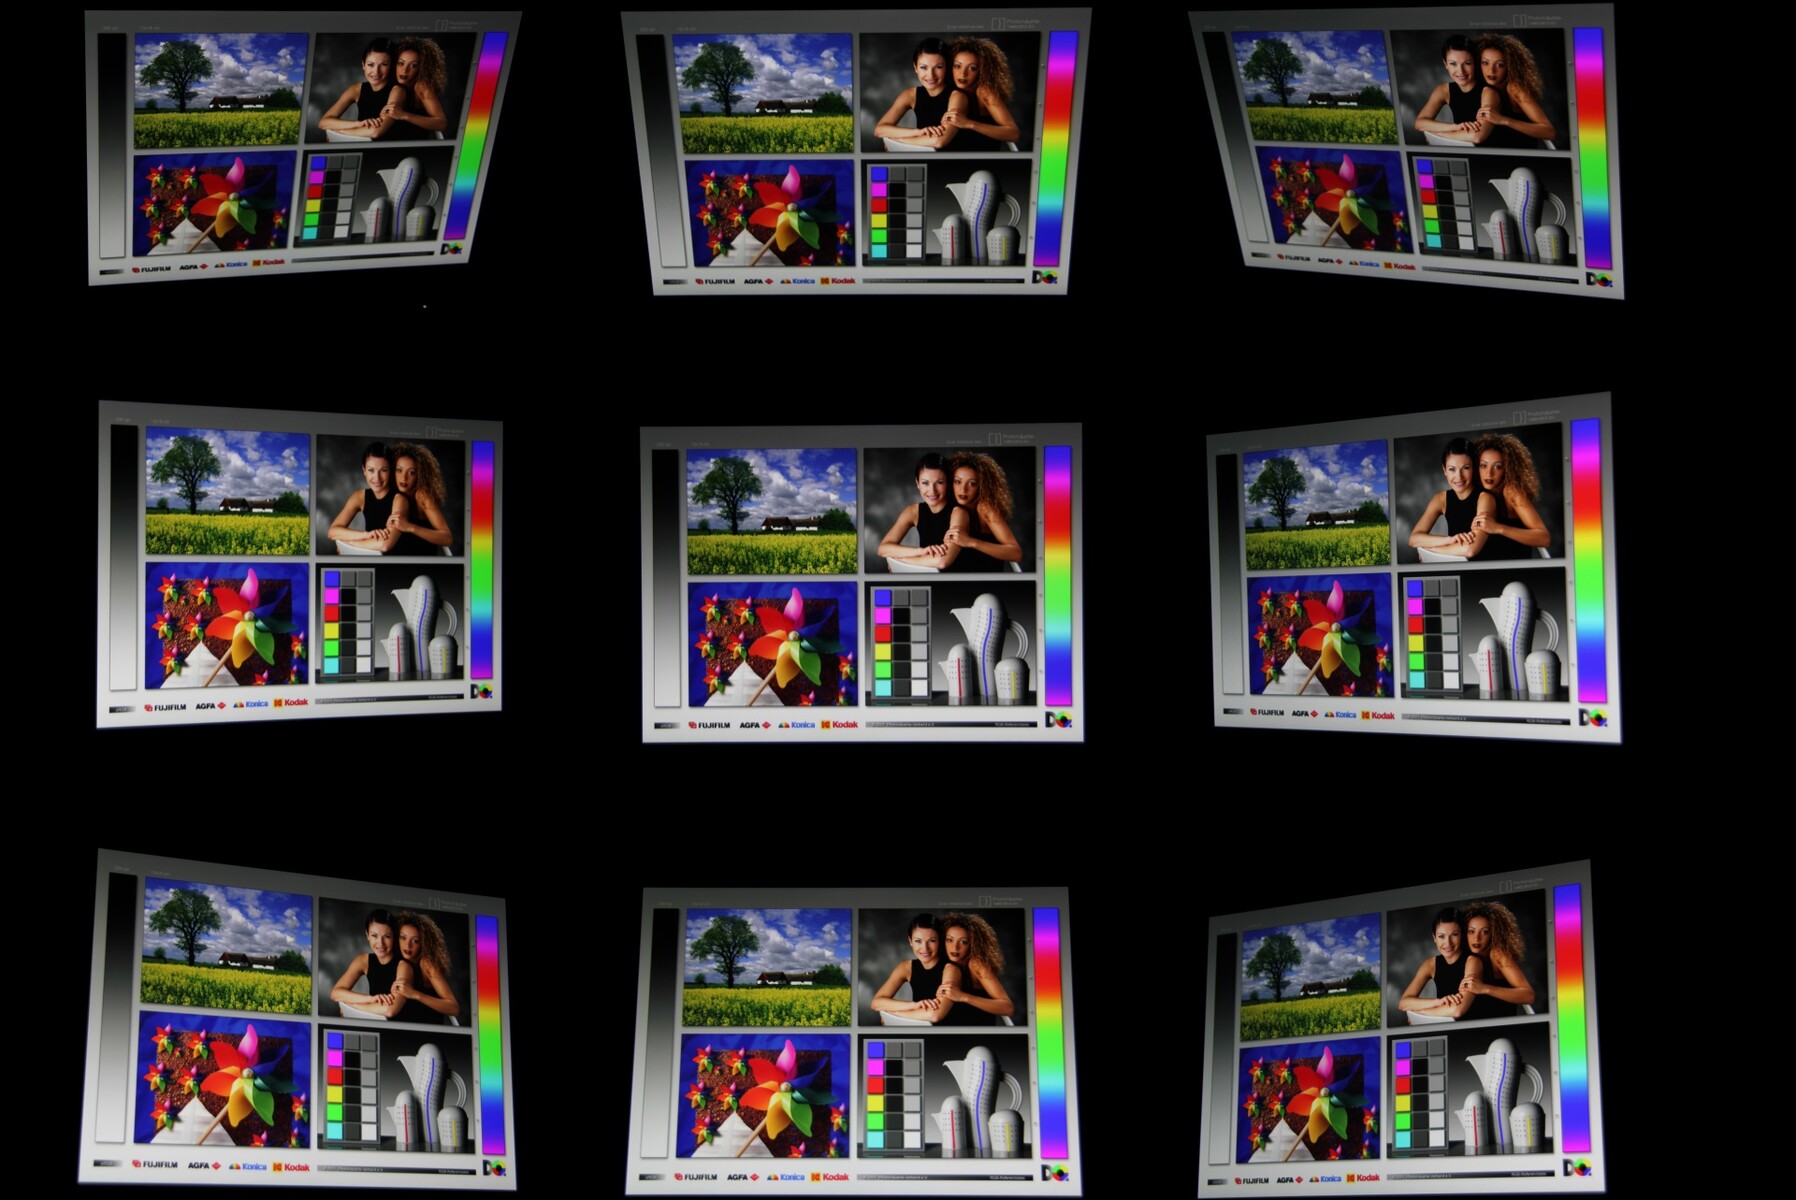
X395 ayrıca IPS ekranı sayesinde sabit görüş açılarına sahiptir. Bakış açıları mükemmel olmasa da, meydana gelen hafif bozulmalar günlük kullanımda okunabilirliği etkilememelidir.
Performansı - El freni olan bir ThinkPad
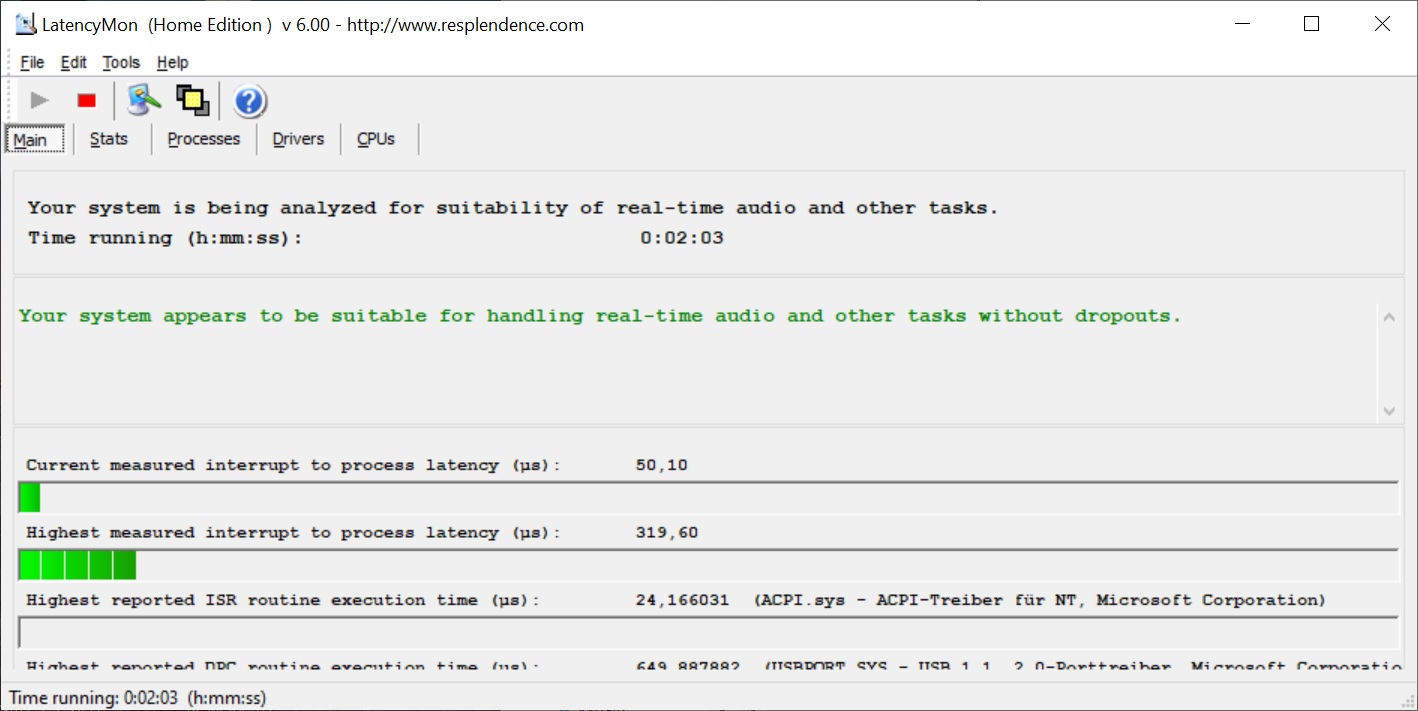
X395, Lenovo'nun yalnızca birkaç güvenlik özelliği değil, aynı zamanda bir akıllı kart okuyucusu da dahil olmak üzere, iş hedeflerini gizlemiyor. Ryzen 3 PRO 3300U, performans ve gürültü arasında da iyi bir denge kurarak X395'i bir ofis dizüstü bilgisayarı olarak kullanmak için yeterince sessiz kılar. LatencyMon'ı referans için iki dakika çalıştırdık.
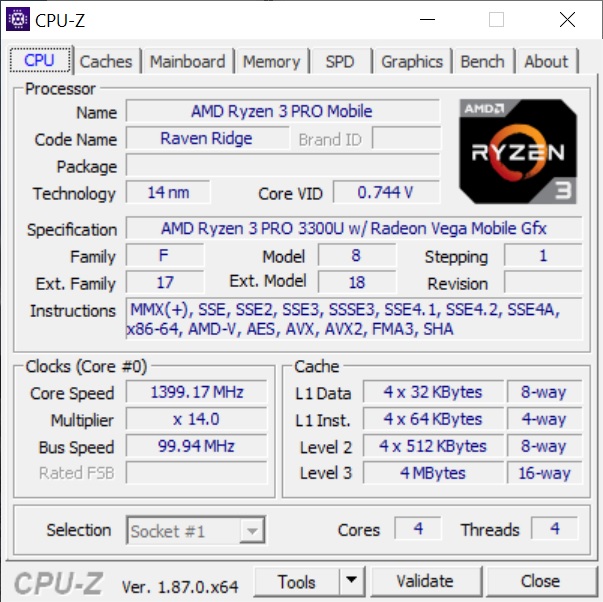
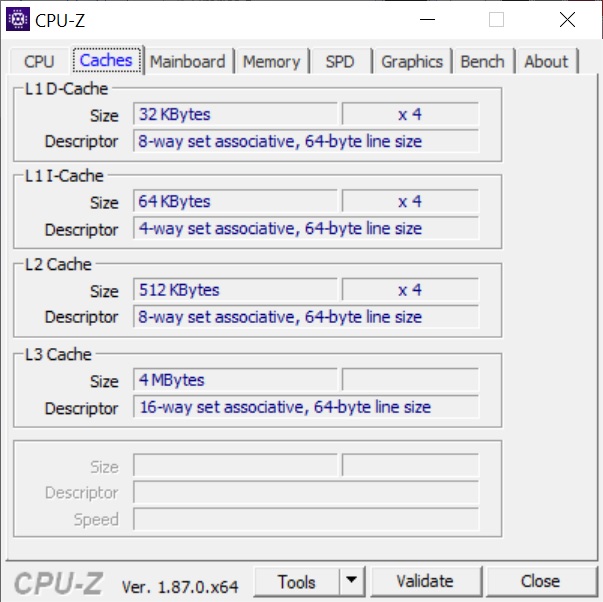
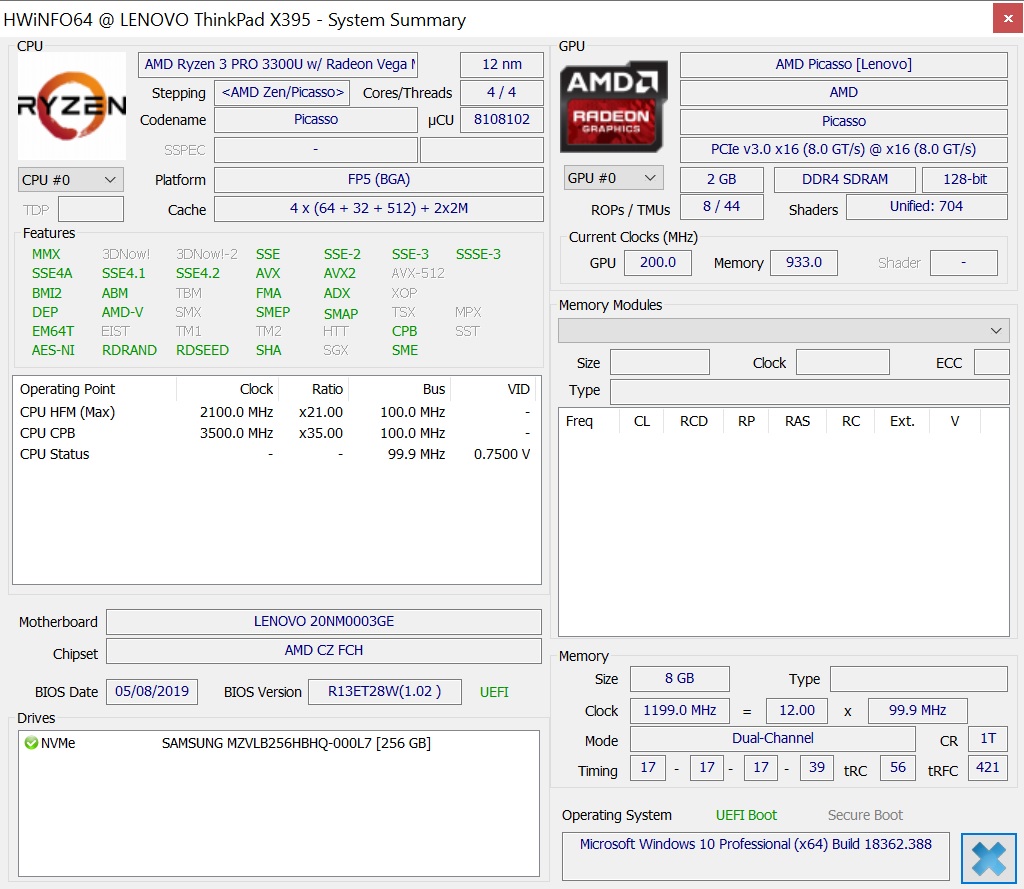
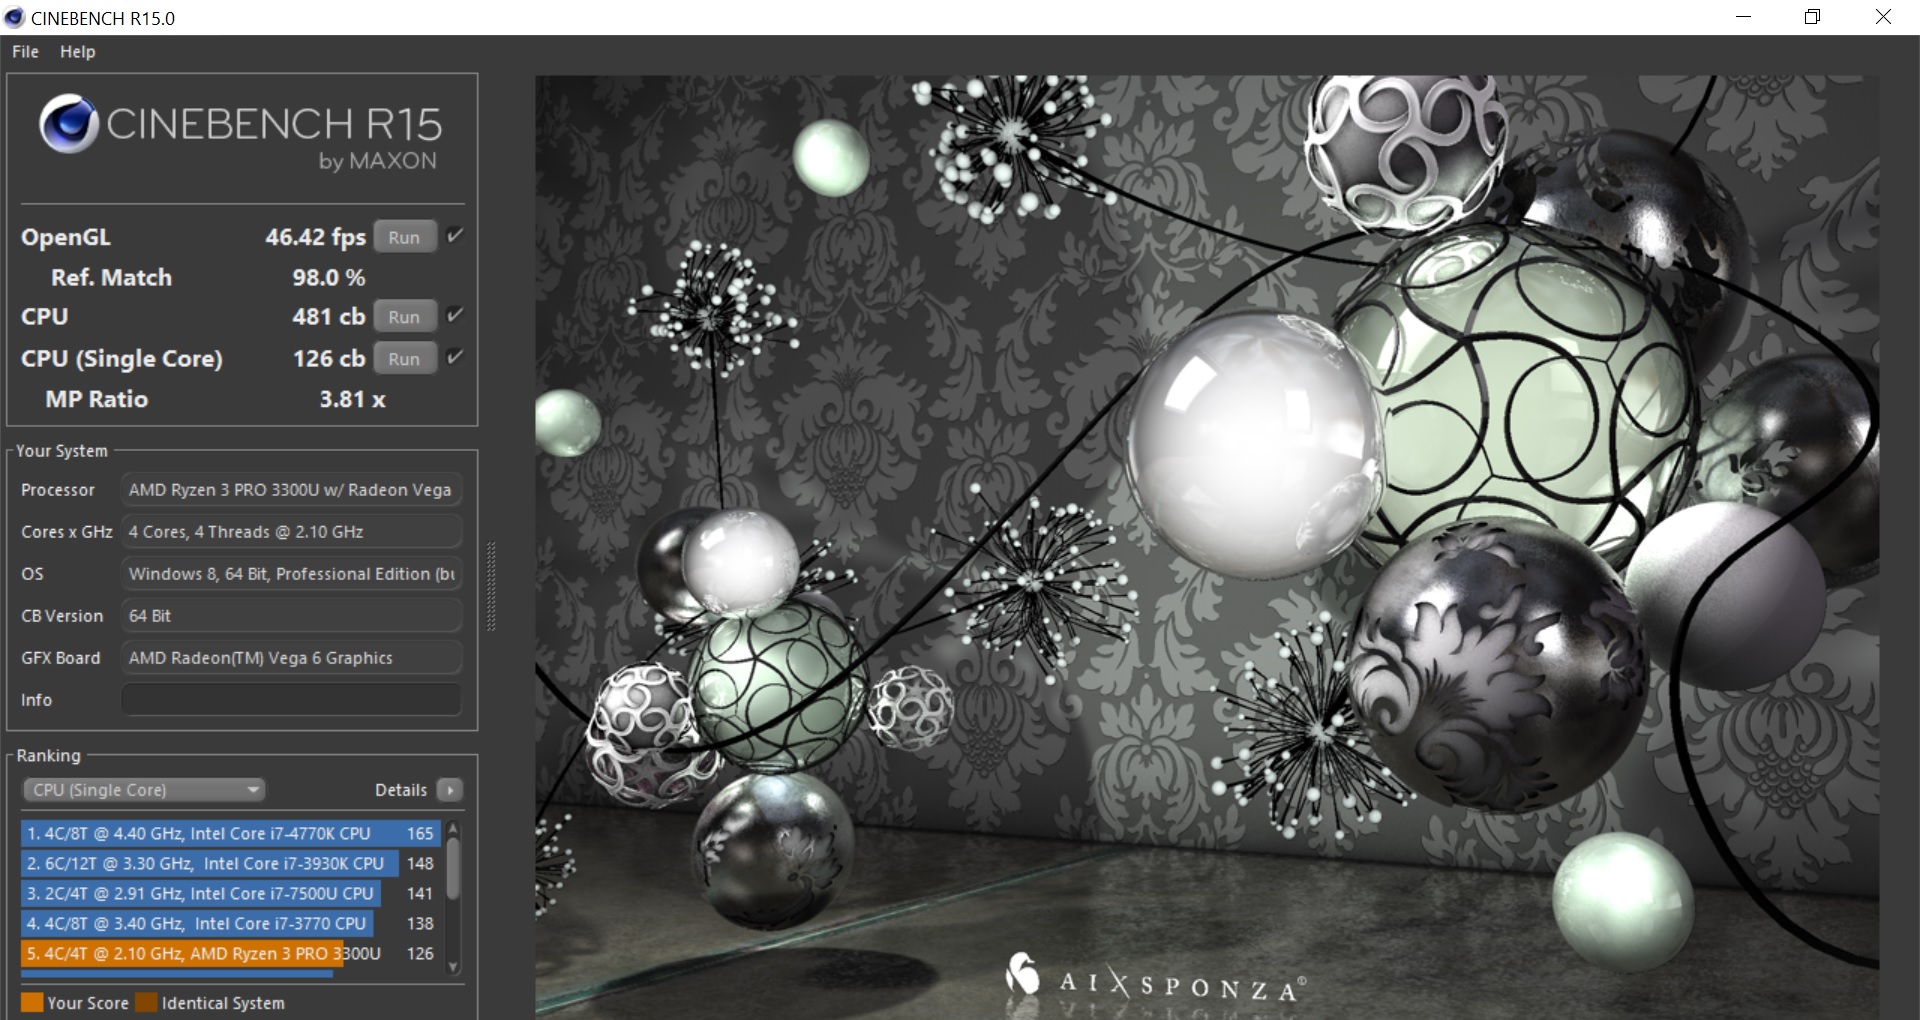
İşlemci
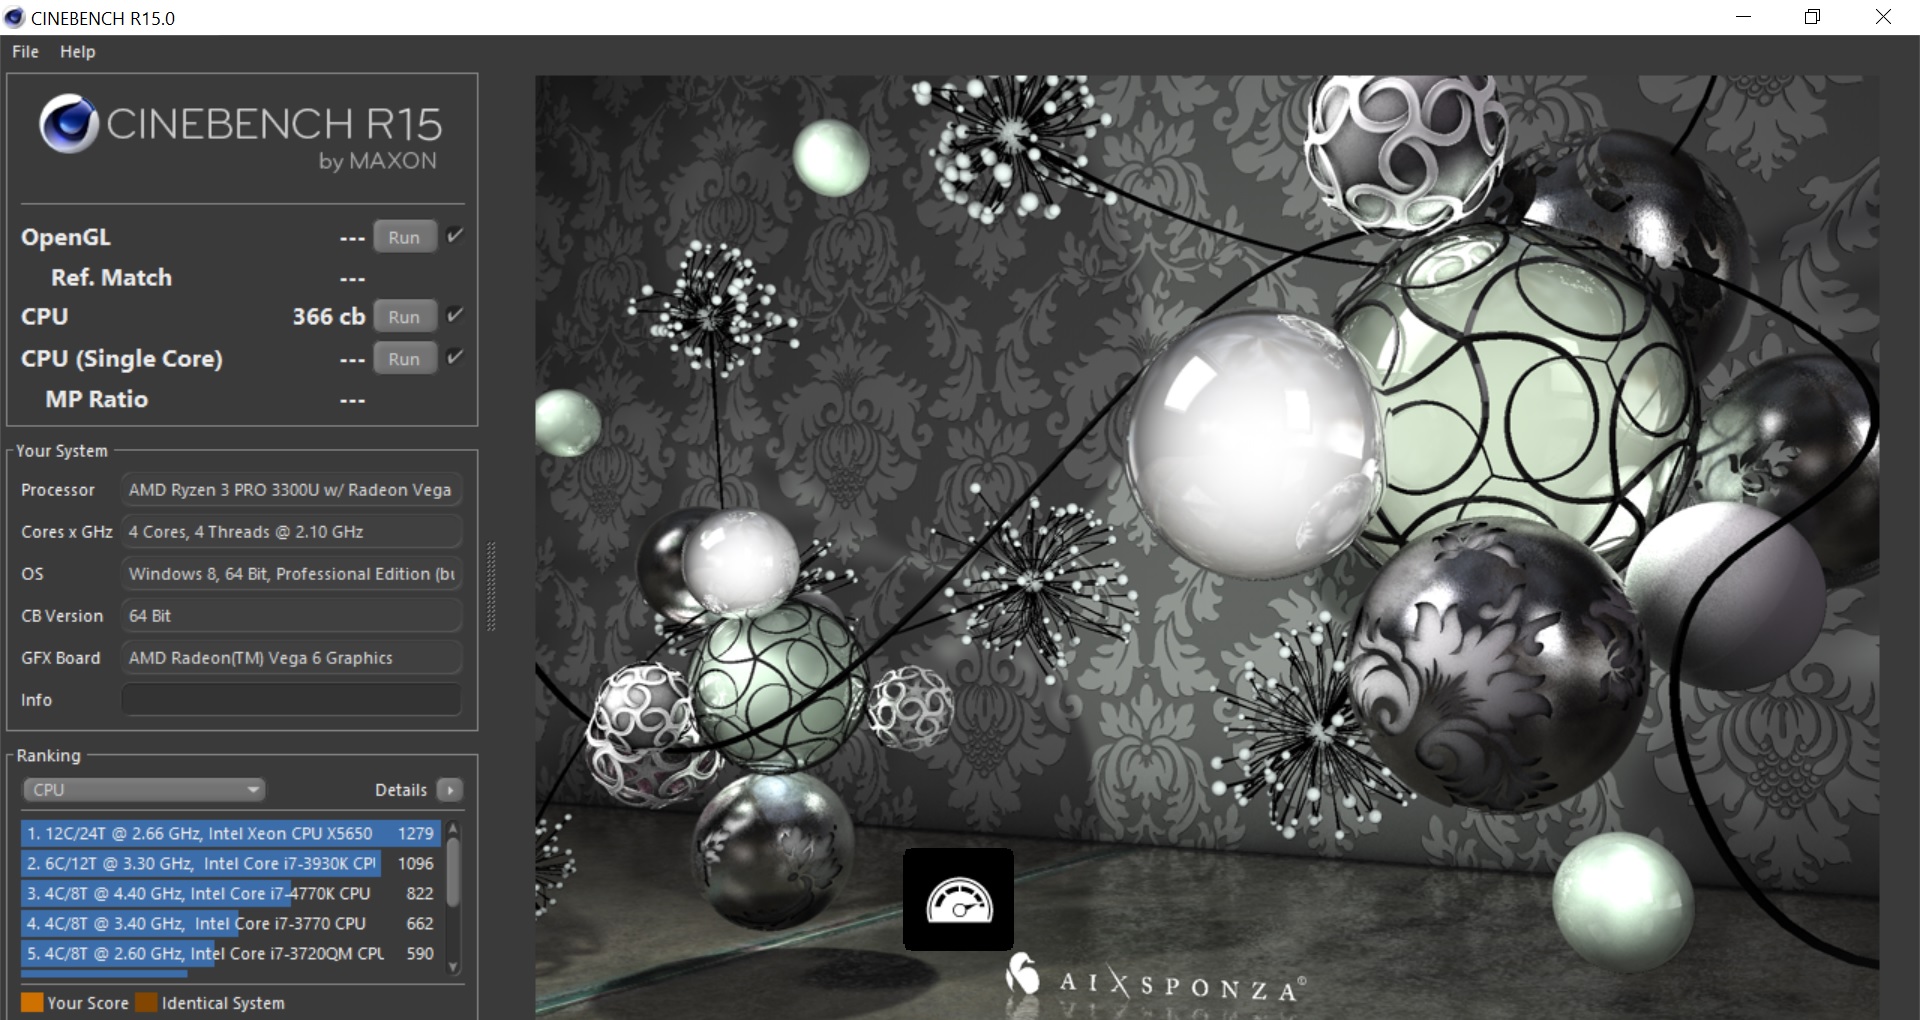
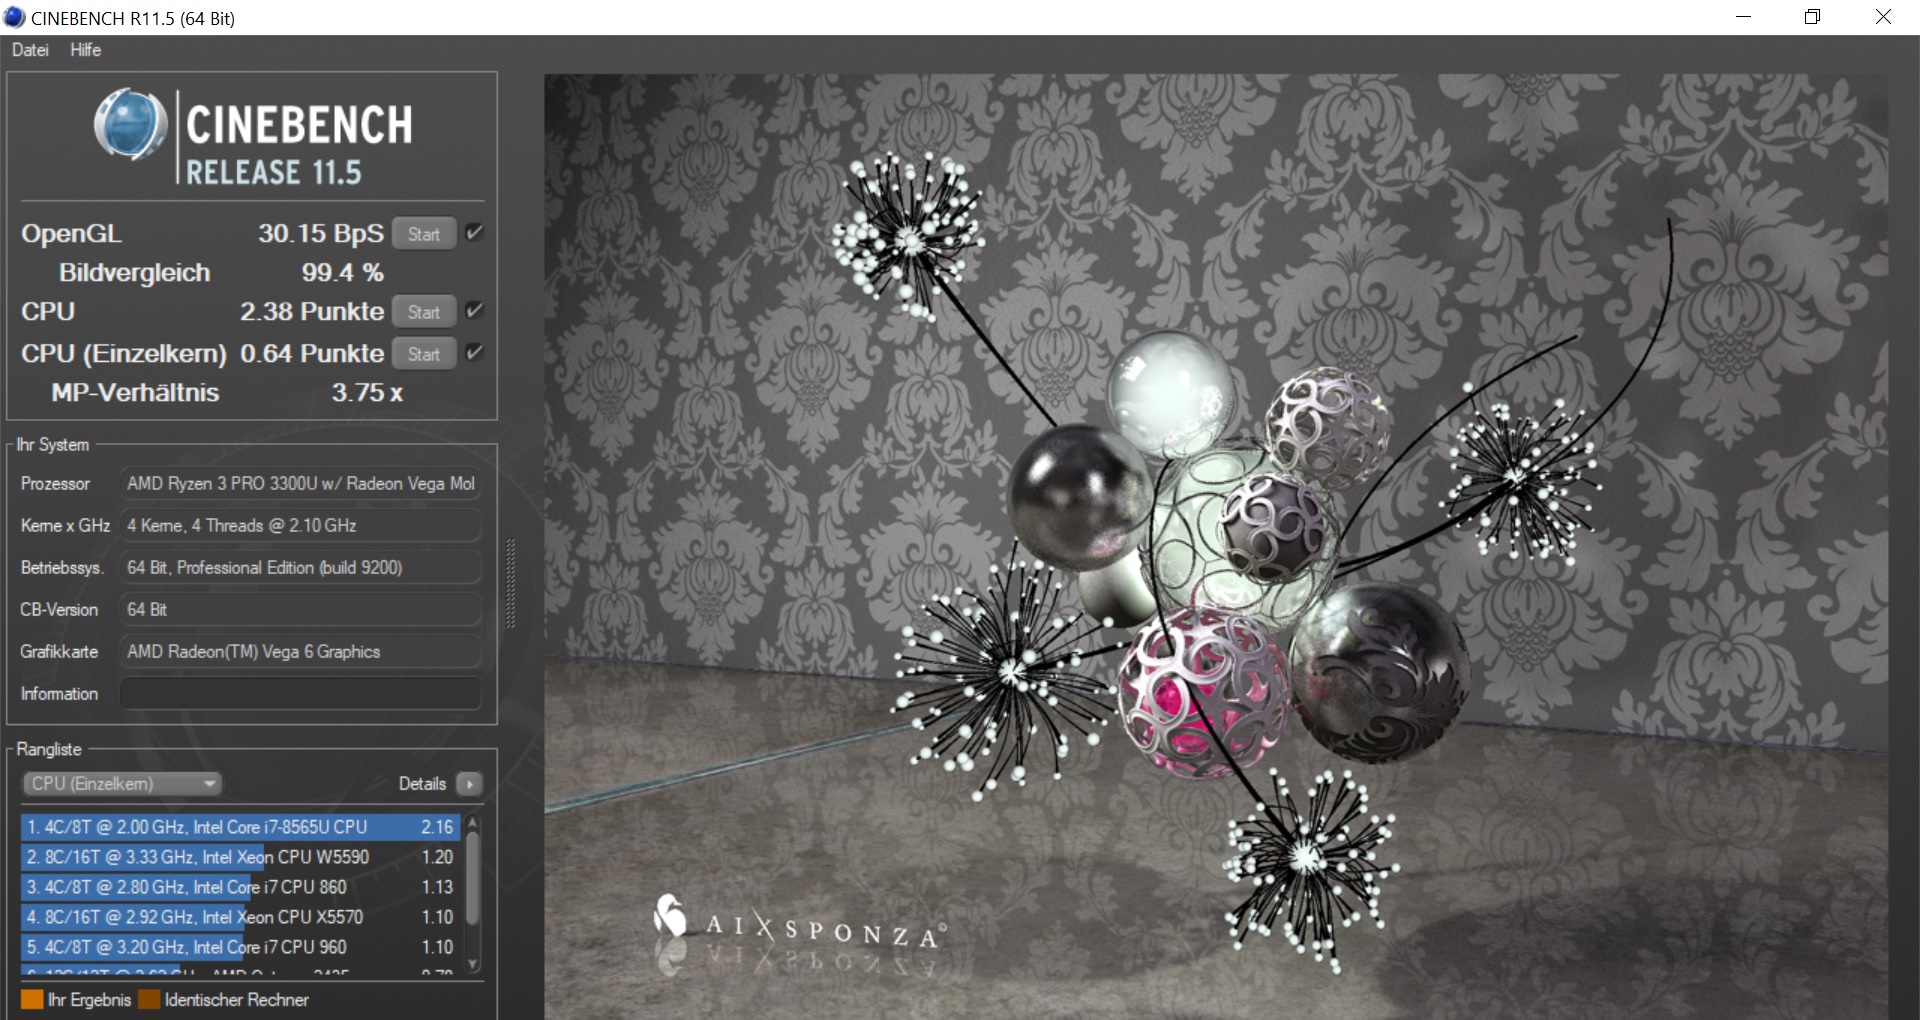
İnceleme birimimiz bir Ryzen 3 PRO 3300U işlemci ile gelirken, X395'i daha fazla performansa ihtiyacınız olursa Ryzen 5 PRO 3500U veya AMD Ryzen 7 PRO 3700U ile yapılandırabilirsiniz. Ryzen 3 PRO 3300U, X390'ı yapılandırabileceğiniz Core i3-8145U ile en iyi şekilde karşılaştırır. Ancak, X390 inceleme ünitemizin Core i3-8145U yerine Core i5-8265U ile birlikte geldiğinden, Latitude 3400, karşılaştırma cihazlarımızın X395 modelininki ile en karşılaştırılabilir CPU performansına sahip. Ryzen 3 PRO 3300U çekirdek işlemci ve eşzamanlı çoklu okuma (SMT) özelliğini desteklemediği için çekirdek başına yalnızca bir iş parçacığı çalıştırabilir. Entegre Radeon RX Vega 6 GPU, Intel UHD Graphics 630 ile geniş anlamda en iyisidir ve mobil GPU'ların giriş seviyesi segmentinde tutulur. Birini gösterdiğiniz sürekli yük altında yaklaşık% 14 oranında düşürülen inceleme birimimiz Aşağıdaki Cinebench R15 Multi 64Bit döngülü benchmark grafikte görebilirsiniz. X395, kıyaslama cihazlarımızın çoğaldığı davranış olan ikinci ve üçüncü benchmark geçişleri sırasında engeller. X395, CB R15 Multi 64Bit'te Latitude 3400'den% 37 daha fazla puan alırken, EliteBook x360 1030 G3'te% 2 oranında ve X390'dan% 18 daha az puan alıyor. X395, tüm kıyaslama cihazlarımızdan da daha kötü tek çekirdekli performansa sahip. X395, pille de çalışırken CPU'sunu ağır şekilde düşürüyor. İnceleme ünitemiz, bataryadaki CB R15 Multi 64Bit'te şebeke elektriğinde çalıştığını test ettiğimizden% 24 daha az puan aldı.
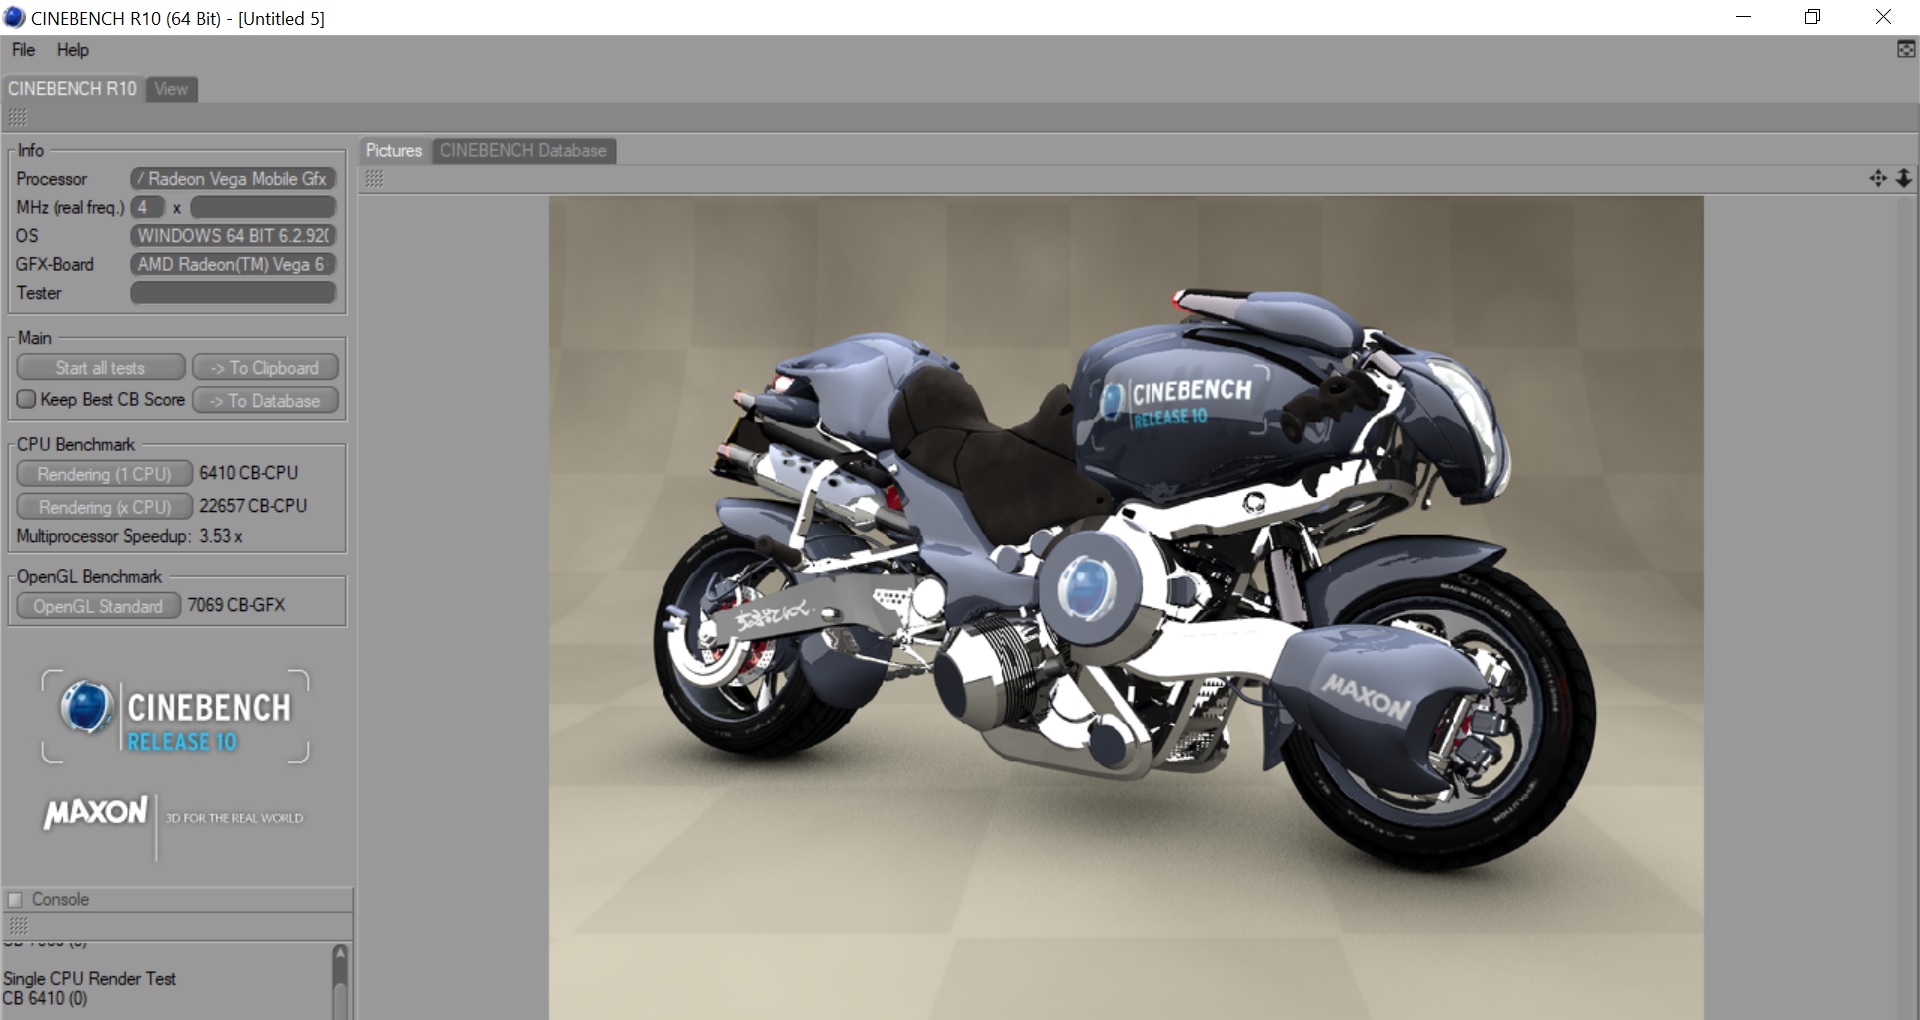
| Cinebench R10 | |
| Rendering Single CPUs 64Bit | |
| Sınıf ortalaması Subnotebook (11450 - 15516, n=4, son 2 yıl) | |
| Lenovo ThinkPad X395 | |
| Ortalama AMD Ryzen 3 PRO 3300U (n=1) | |
| Rendering Multiple CPUs 64Bit | |
| Sınıf ortalaması Subnotebook (53207 - 66113, n=4, son 2 yıl) | |
| Lenovo ThinkPad X395 | |
| Ortalama AMD Ryzen 3 PRO 3300U (n=1) | |
Sistem performansı
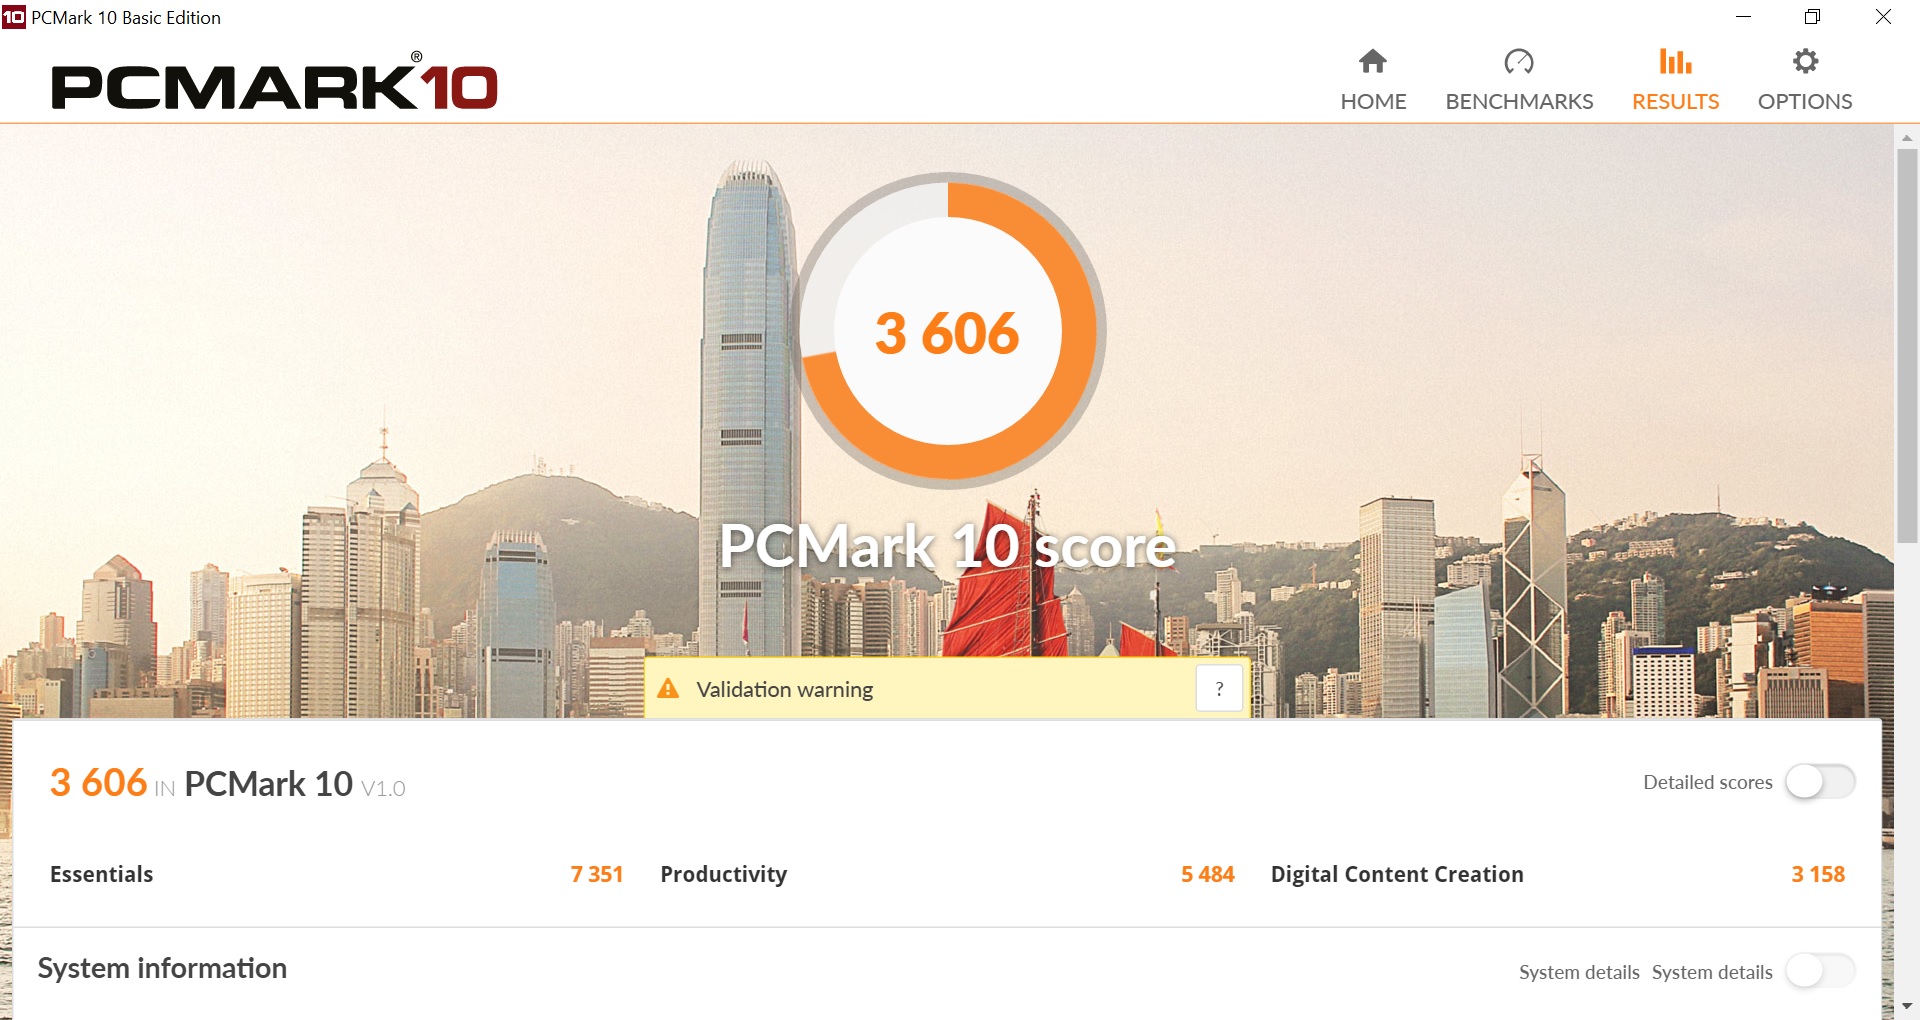
X395, PCMark testlerinde iyi bir performans sergiledi ve sınıf ortalamasını tutarlı bir şekilde aştı. Ancak, X395'i diğer karşılaştırma cihazlarımızla karşılaştırdığımızda genişleyen bir eksiklik olan X390'ın genellikle% 6 ila 12'sinin altına düşüyor. Her şey günlük iş hayatında sorunsuz çalışıyor; videolar bile her zaman sorunsuz bir şekilde oynatılıyordu.
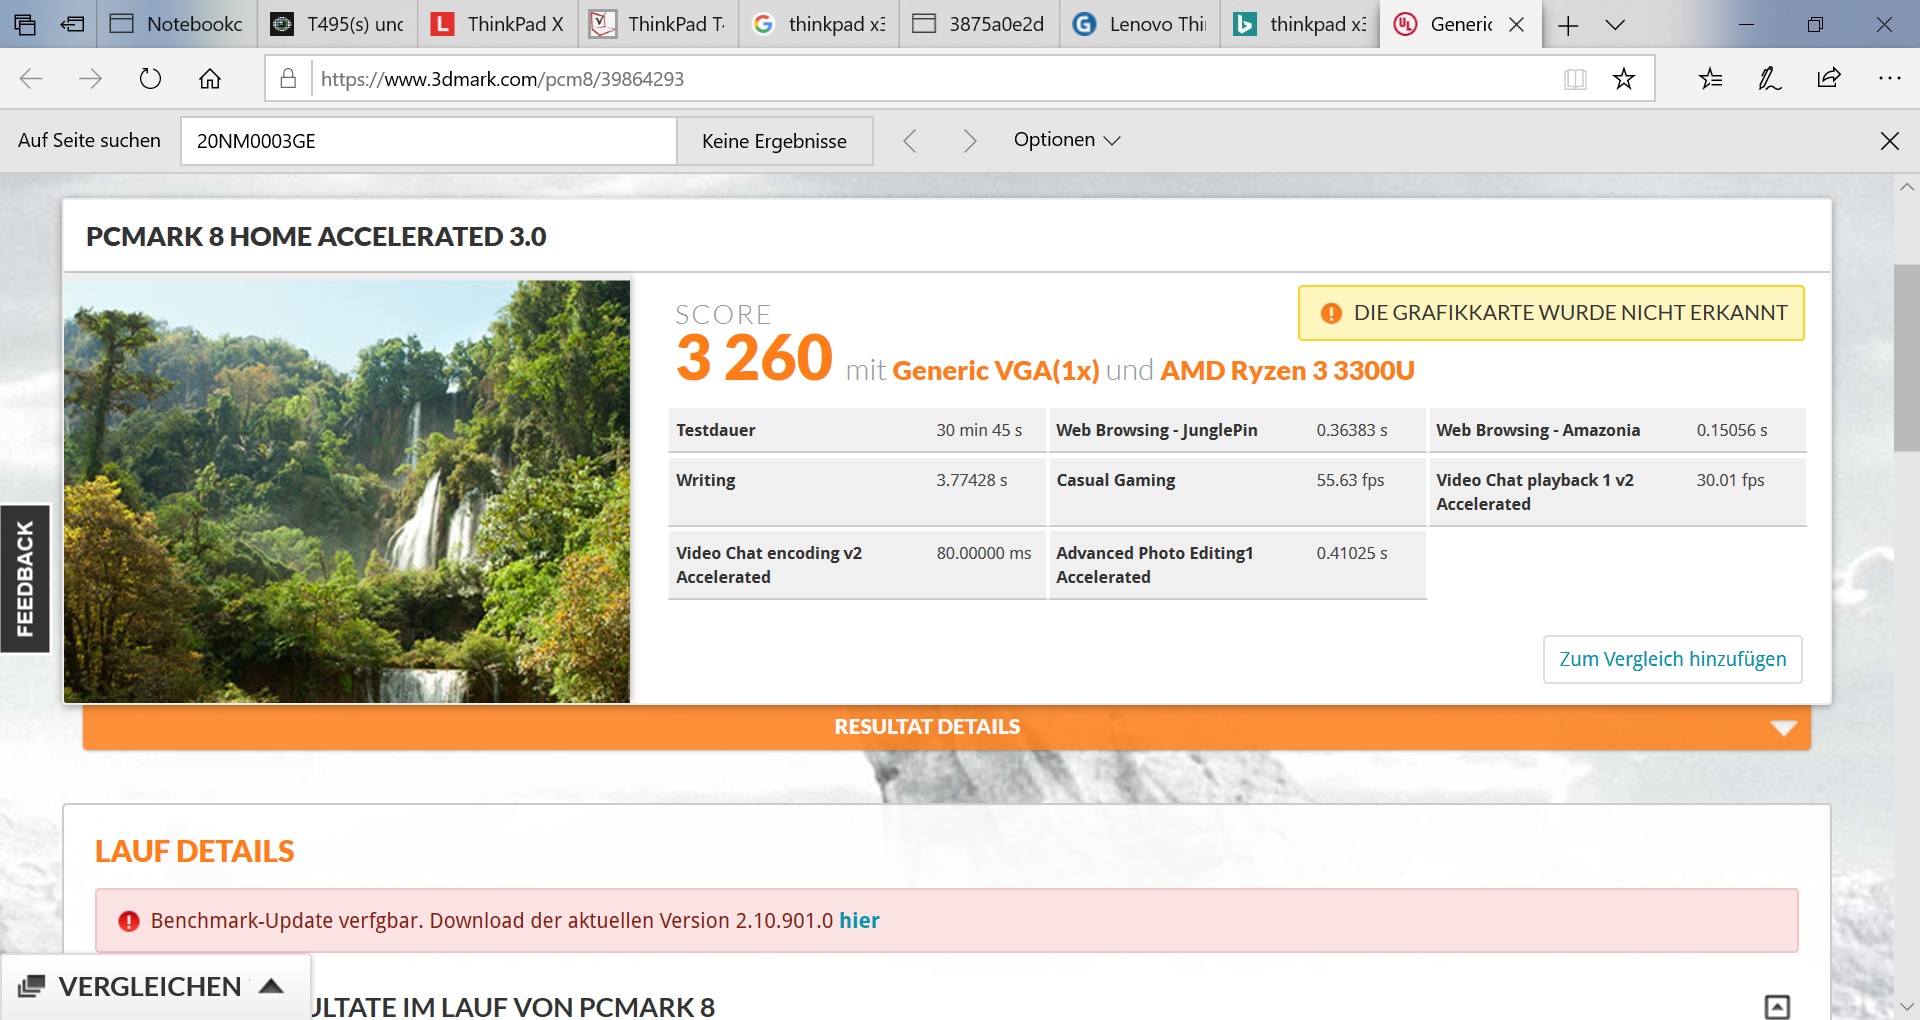
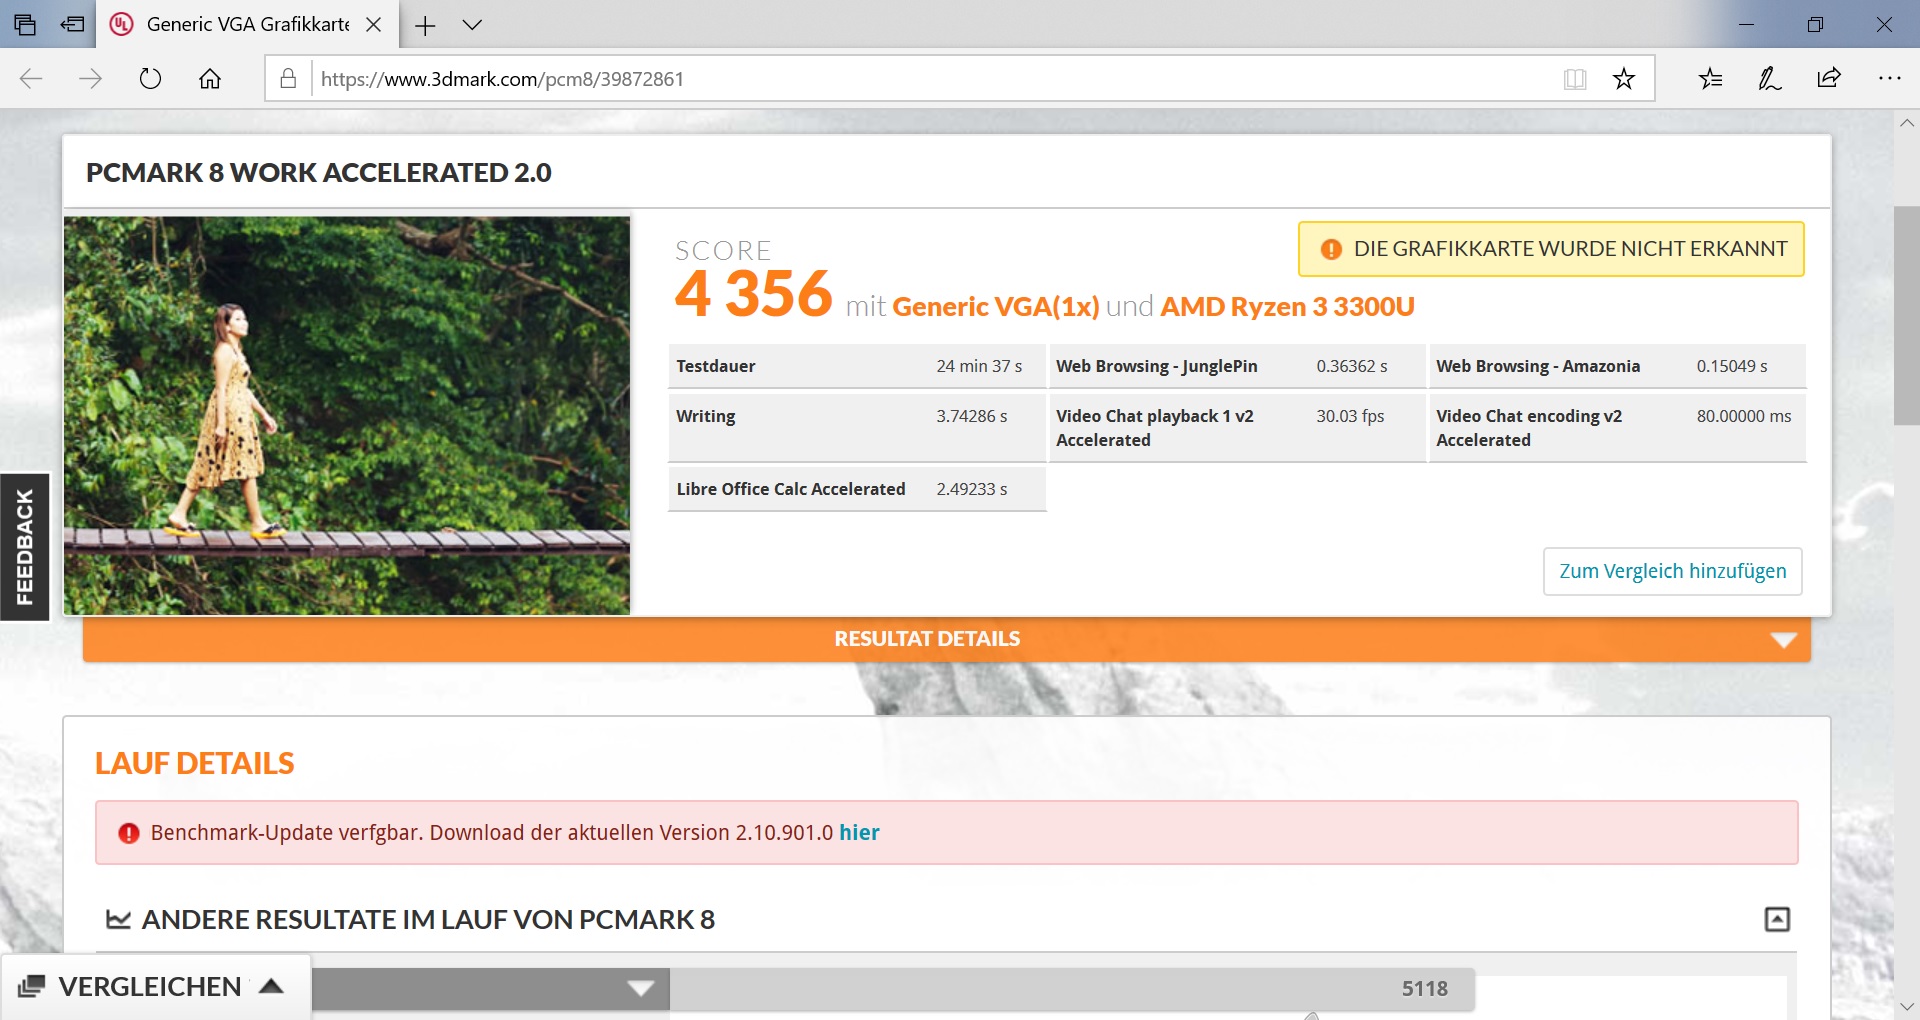
| PCMark 8 Home Score Accelerated v2 | 3260 puan | |
| PCMark 8 Work Score Accelerated v2 | 4356 puan | |
| PCMark 10 Score | 3606 puan | |
Yardım | ||
Depolama aygıtları
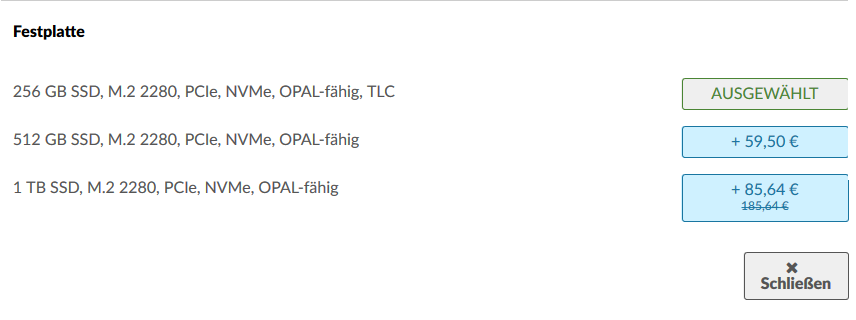
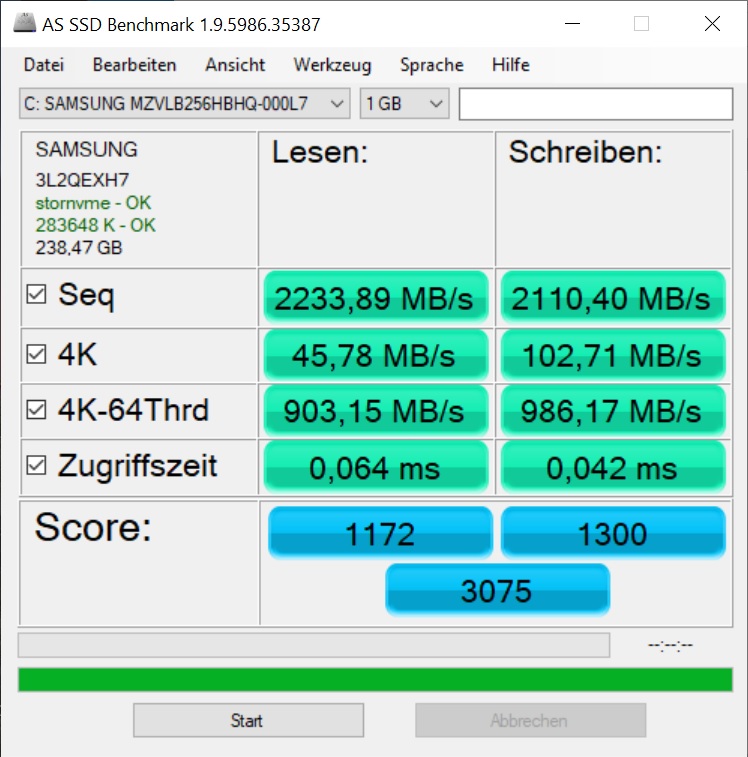
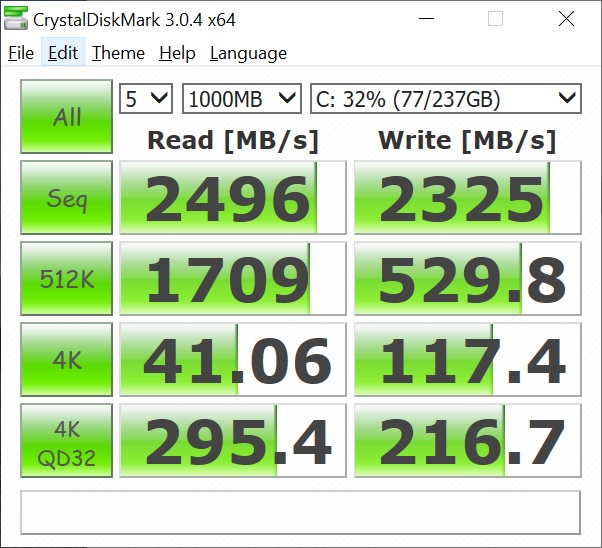
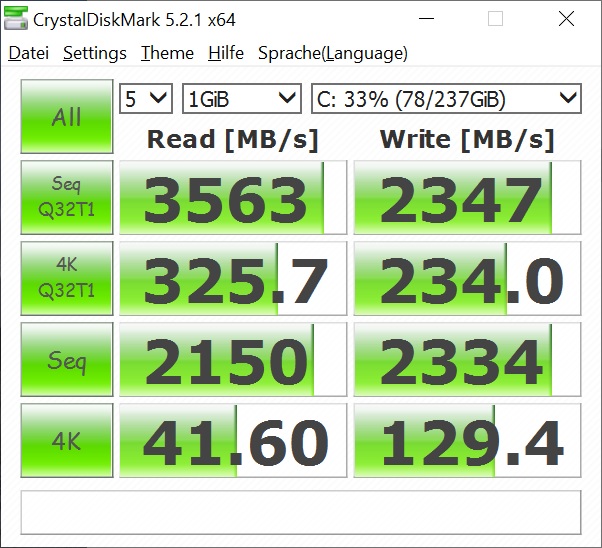
Lenovo, X395'i 256 GB Samsung PM981a ile donatıyor, ancak şirket daha fazla depolama alanına ihtiyaç duymanız durumunda cihazı 512 GB veya 1 TB sürücülerle yapılandırmanıza izin veriyor. PM981a, test ettiğimiz en hızlı SSD'lerden biri. İnceleme ünitemiz, ThinkPad X390 Yoga'dan ve CrystalDiskMark'taki karşılaştırma cihazlarımızın Intel SSD 760p Pro'sundan yalnızca daha düşük aktarım hızlarının ortalaması alıyor. Aktarım hızları AS SSD'de hafifçe sallandı, ancak X395 genellikle diğer karşılaştırma cihazlarımızdan daha hızlı bir sürüşe sahip.

| Lenovo ThinkPad X395 Samsung SSD PM981a MZVLB256HBHQ | Lenovo ThinkPad X390-20Q1S02M00 Intel SSD Pro 7600p SSDPEKKF512G8L | HP EliteBook x360 1030 G3 Samsung PM871b MZNLN128HAHQ | Dell Latitude 5300 SK Hynix PC401 512GB M.2 (HFS512GD9TNG) | Lenovo ThinkPad X390 Yoga-20NQS05R00 Intel SSD Pro 7600p SSDPEKKF512G8L | Huawei Matebook 13-53010FYW WDC PC SN520 SDAPNUW-512G | Ortalama Samsung SSD PM981a MZVLB256HBHQ | |
|---|---|---|---|---|---|---|---|
| CrystalDiskMark 5.2 / 6 | -2% | -57% | -9% | 13% | 35% | 8% | |
| Write 4K (MB/s) | 129.4 | 120.7 -7% | 64.3 -50% | 119.2 -8% | 144.1 11% | 191.2 48% | 135.2 ? 4% |
| Read 4K (MB/s) | 41.6 | 58.5 41% | 34.13 -18% | 41.43 0% | 63.5 53% | 53.1 28% | 44.6 ? 7% |
| Write Seq (MB/s) | 2334 | 1491 -36% | 466.4 -80% | 1240 -47% | 1496 -36% | 1768 -24% | 2091 ? -10% |
| Read Seq (MB/s) | 2151 | 2760 28% | 498.3 -77% | 1668 -22% | 2677 24% | 1710 -21% | 2097 ? -3% |
| Write 4K Q32T1 (MB/s) | 234 | 237.5 1% | 193.3 -17% | 381.7 63% | 357.4 53% | 575 146% | 370 ? 58% |
| Read 4K Q32T1 (MB/s) | 325.7 | 336.1 3% | 179.7 -45% | 371.5 14% | 482.3 48% | 654 101% | 372 ? 14% |
| Write Seq Q32T1 (MB/s) | 2348 | 1512 -36% | 396.8 -83% | 1369 -42% | 1558 -34% | 2544 8% | 2308 ? -2% |
| Read Seq Q32T1 (MB/s) | 3563 | 3154 -11% | 547 -85% | 2652 -26% | 3021 -15% | 3433 -4% | 3395 ? -5% |
| Write 4K Q8T8 (MB/s) | 1065 | 989 | 208 ? | ||||
| Read 4K Q8T8 (MB/s) | 891 | 883 | 383 ? | ||||
| AS SSD | 26% | -63% | -12% | 21% | 30% | 5% | |
| Seq Read (MB/s) | 2234 | 2689 20% | 488.2 -78% | 2123 -5% | 2742 23% | 2934 31% | 2276 ? 2% |
| Seq Write (MB/s) | 2110 | 1462 -31% | 403.2 -81% | 744 -65% | 1511 -28% | 2407 14% | 1486 ? -30% |
| 4K Read (MB/s) | 45.78 | 63.8 39% | 31.07 -32% | 43.02 -6% | 66.3 45% | 48.31 6% | 49.6 ? 8% |
| 4K Write (MB/s) | 102.7 | 139.8 36% | 70.8 -31% | 117.4 14% | 175.2 71% | 179.7 75% | 129.5 ? 26% |
| 4K-64 Read (MB/s) | 903 | 865 -4% | 255.1 -72% | 680 -25% | 873 -3% | 1296 44% | 683 ? -24% |
| 4K-64 Write (MB/s) | 986 | 1041 6% | 156.5 -84% | 1039 5% | 594 -40% | 1459 48% | 895 ? -9% |
| Access Time Read * (ms) | 0.064 | 0.037 42% | 0.093 -45% | 0.057 11% | 0.035 45% | 0.103 -61% | 0.06433 ? -1% |
| Access Time Write * (ms) | 0.042 | 0.024 43% | 0.048 -14% | 0.051 -21% | 0.021 50% | 0.021 50% | 0.04793 ? -14% |
| Score Read (Points) | 1172 | 1198 2% | 335 -71% | 935 -20% | 1213 3% | 1638 40% | 960 ? -18% |
| Score Write (Points) | 1300 | 1328 2% | 268 -79% | 1230 -5% | 920 -29% | 1879 45% | 1173 ? -10% |
| Score Total (Points) | 3075 | 3095 1% | 781 -75% | 2586 -16% | 2712 -12% | 4334 41% | 2598 ? -16% |
| Copy ISO MB/s (MB/s) | 1008 | 1290 28% | 208.1 -79% | 1725 71% | 1474 ? 46% | ||
| Copy Program MB/s (MB/s) | 237.6 | 436.5 84% | 74.3 -69% | 418.3 76% | 426 ? 79% | ||
| Copy Game MB/s (MB/s) | 572 | 1147 101% | 164.5 -71% | 687 20% | 760 ? 33% | ||
| Toplam Ortalama (Program / Ayarlar) | 12% /
16% | -60% /
-61% | -11% /
-11% | 17% /
18% | 33% /
32% | 7% /
6% |
* ... daha küçük daha iyidir

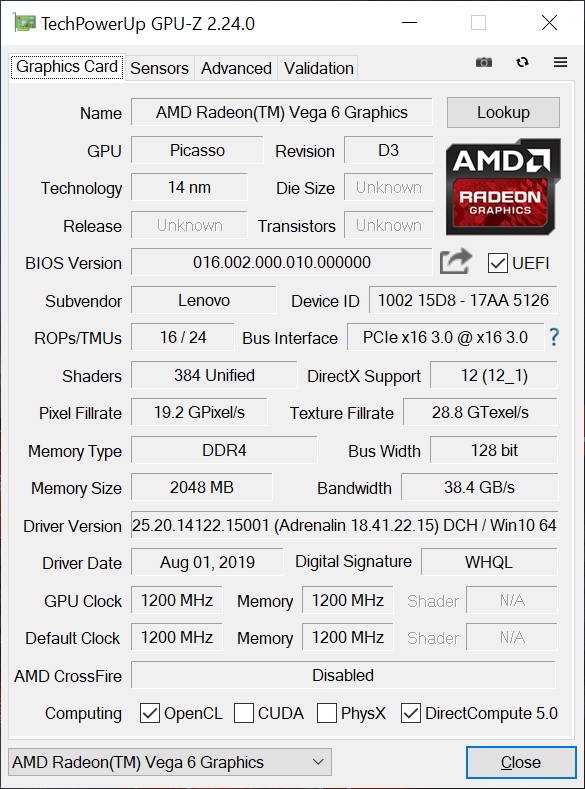
Grafik kartı
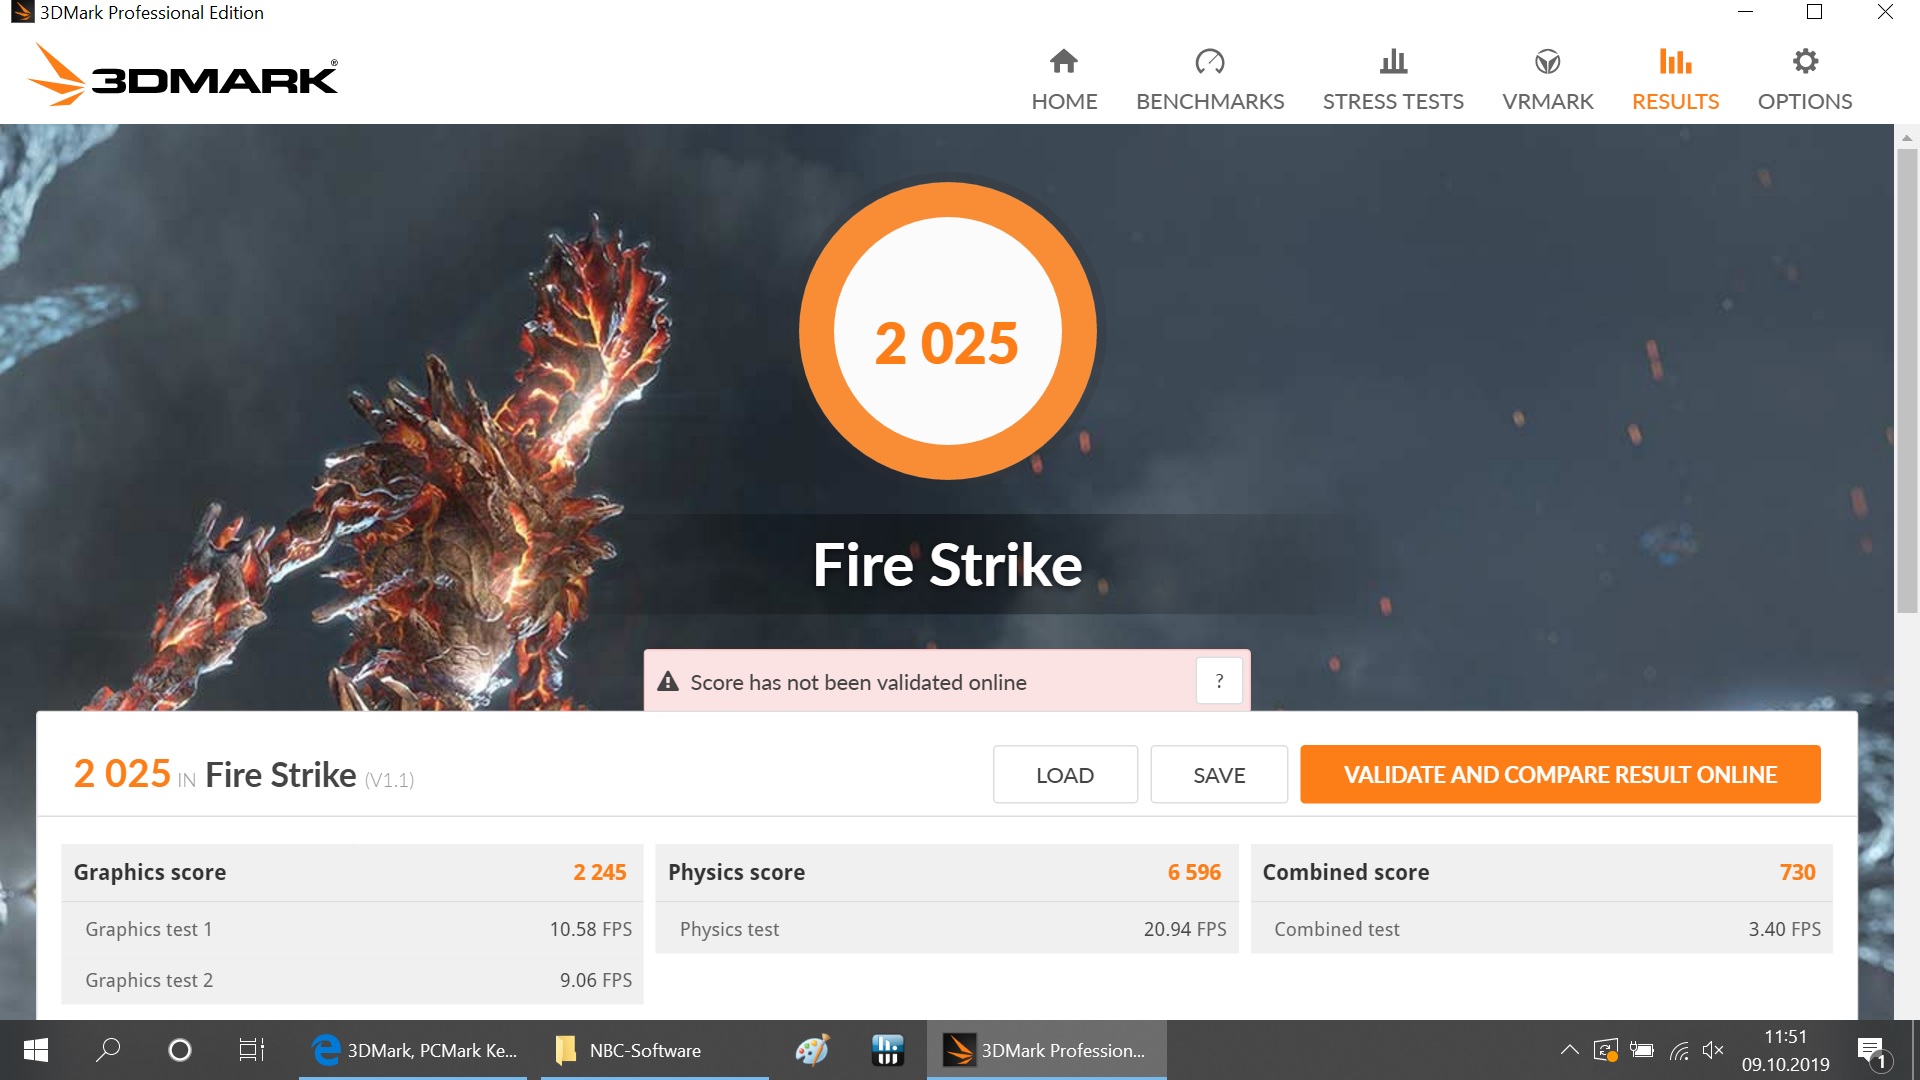
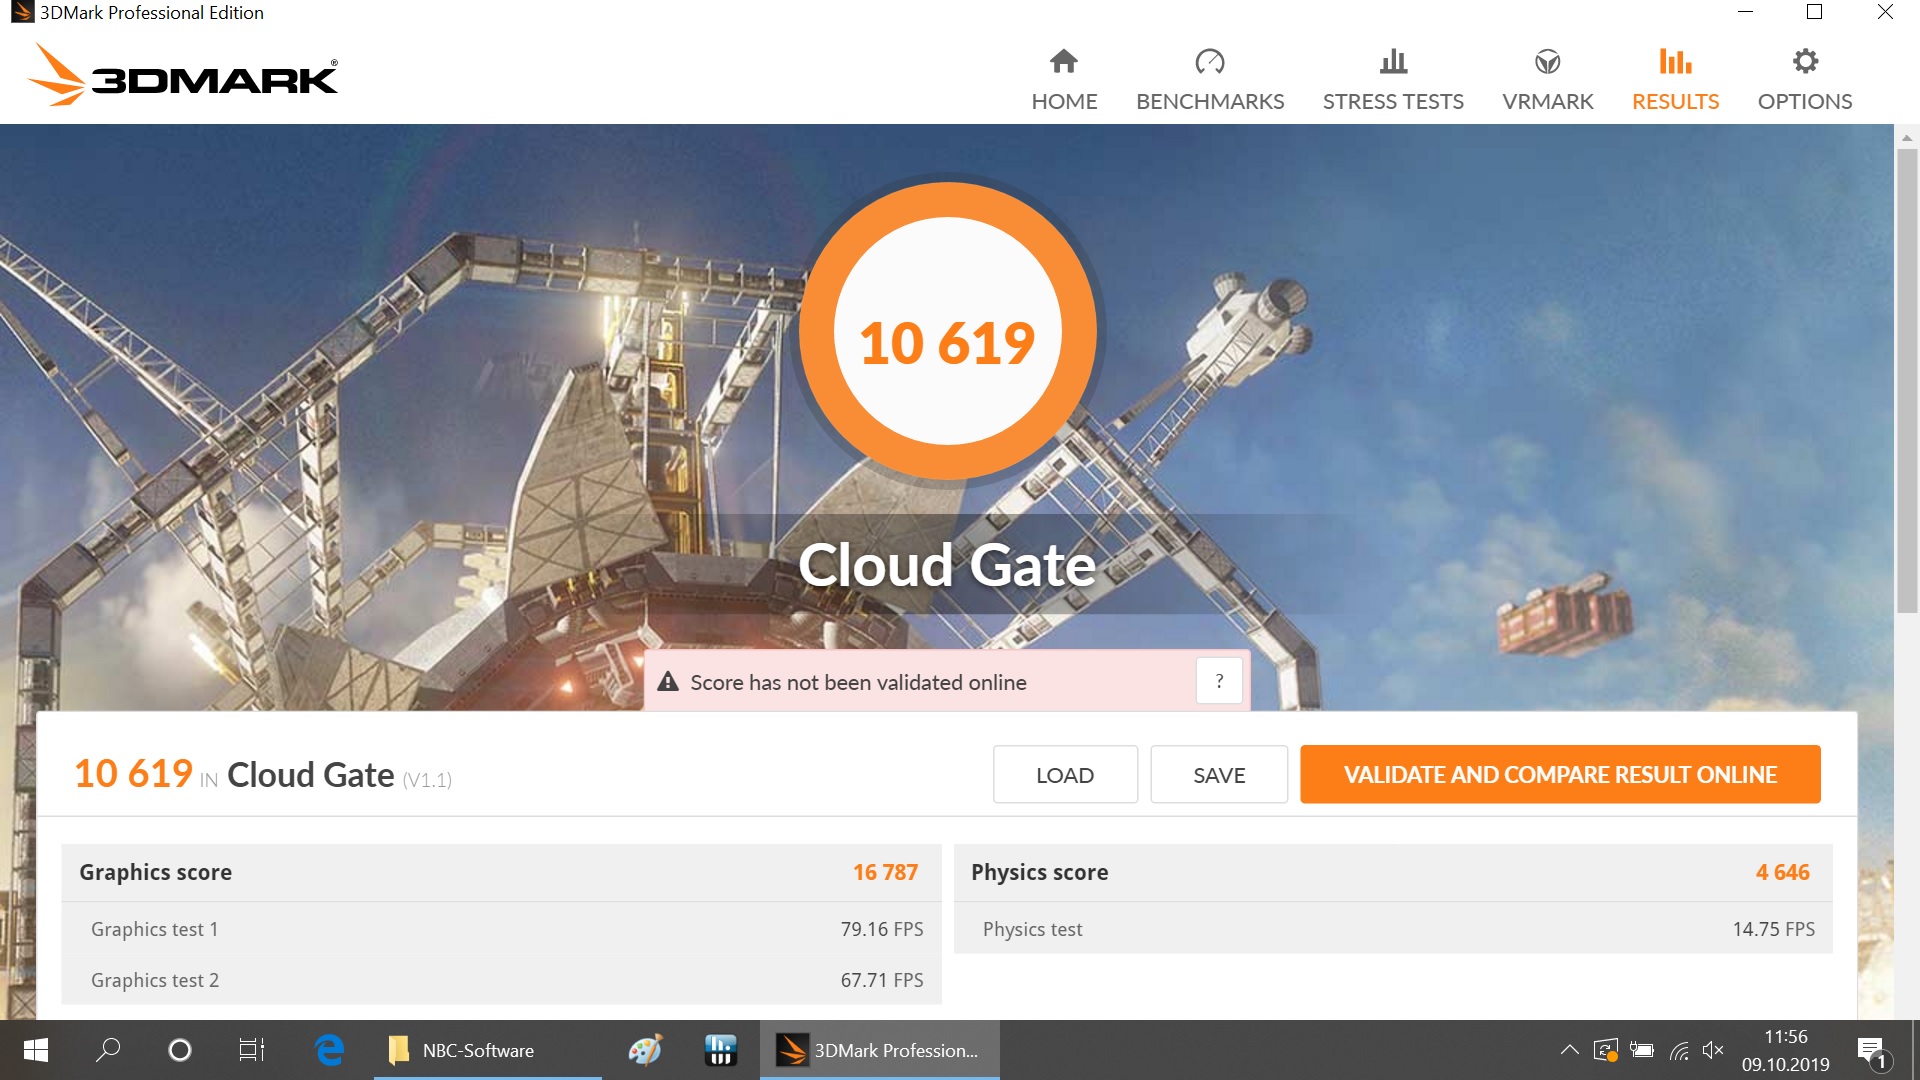
Radeon RX Vega 6, 1080p'de modern üçlü A başlıkları oynatamaz, ancak 3DMark 11'deki Intel UHD Graphics 620'yi kolaylıkla ve kolayca altüst ederek video kod çözme işlemlerini üstlenir. Intel UHD Graphics 620 ile birlikte gelir ve% 73 ile 91 arasında puan alır. 3DMark 2013 de benzer bir tablo çiziyor. Kısacası, X395, Intel destekli rakiplerinden önemli ölçüde daha iyi 3D performansına sahip. X395, pille de çalışırken GPU performansını koruyor. Şebeke gücüne kıyasla batarya ile test ettiğimizde 3DMark 11'de biraz daha az puan alırken, fark bir hata payı içinde.
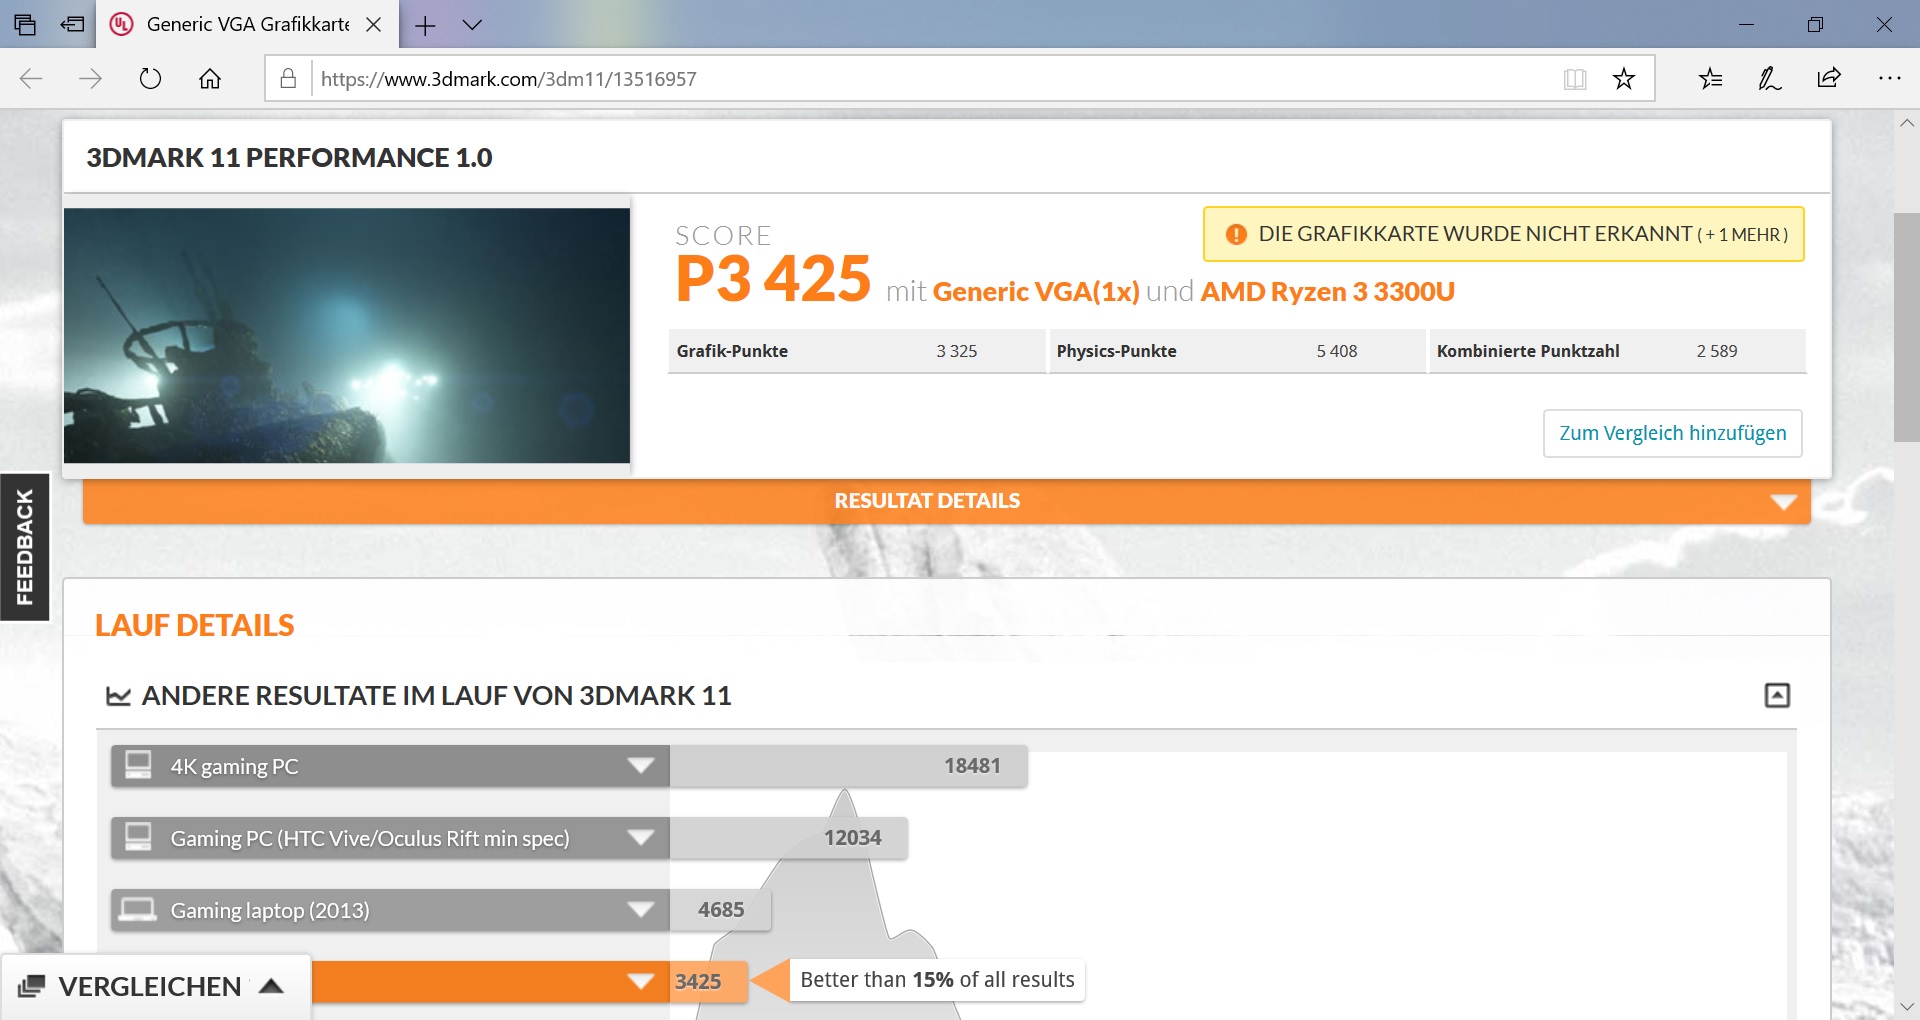
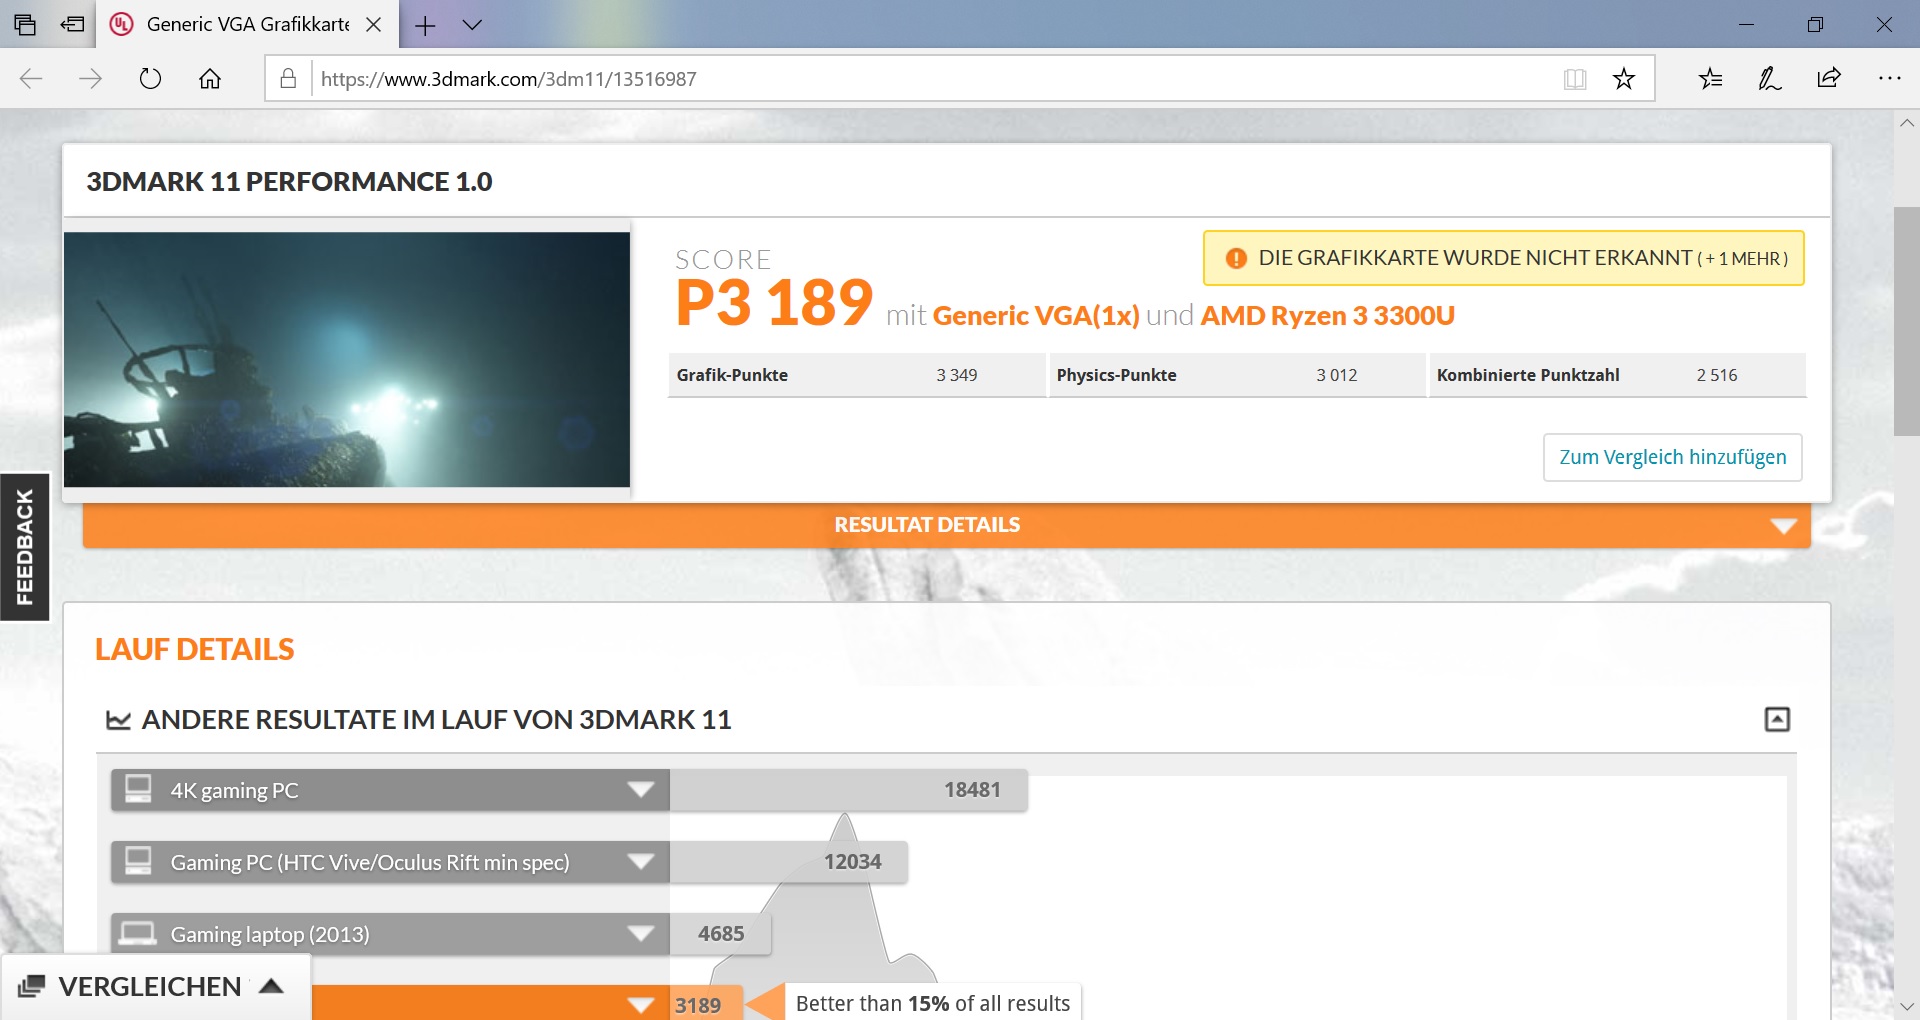
| 3DMark 11 Performance | 3425 puan | |
| 3DMark Cloud Gate Standard Score | 10619 puan | |
| 3DMark Fire Strike Score | 2025 puan | |
Yardım | ||
Oyun Performansı
Radeon RX Vega 6, Intel meslektaşlarından daha güçlü olsa da GPU, 1080p'de üçlü A oyunu oynamak için mücadele edecek. İşin garibi, ne Windows, ne Radeon, ne de Catalyst sürücüler nedense 1366x768 gibi bazı çözünürlükler destekliyorlar. Ancak, X395, düşük grafik ön ayarında 1024x768'de The Witcher 3 gibi eski oyunları oynayabilir. UHD Graphics 620 ile çalışan karşılaştırma cihazlarımızdan hiçbiri bu düşük ayarlarda ortalama 20 FPS bile sunamıyor olsa da, gözden geçirme birimimiz oynanabilir bir 38 FPS yönetti. Kısacası, X395, X390'ın yönetebildiğinden% 125 daha yüksek kare hızı elde ediyor. Benzer şekilde, eski Tomb Raider'in Yükselişinde Rvera’da ortalama% 46 daha yüksek kare hızları elde etti. Genel olarak, X395 çoğu oyunu oynama yeteneğine sahip olmalı, ancak bazı zorlu oyunlarda 768p veya 720p ile oynamalısınız.
| The Witcher 3 | |
| 1024x768 Low Graphics & Postprocessing | |
| Sınıf ortalaması Subnotebook (38.8 - 176, n=11, son 2 yıl) | |
| Ortalama AMD Radeon RX Vega 6 (Ryzen 2000/3000) (38 - 39, n=2) | |
| Lenovo ThinkPad X395 | |
| Lenovo ThinkPad X390 Yoga-20NQS05R00 | |
| HP EliteBook x360 1030 G3 | |
| Lenovo ThinkPad X390-20Q1S02M00 | |
| 1920x1080 High Graphics & Postprocessing (Nvidia HairWorks Off) | |
| Sınıf ortalaması Subnotebook (25.6 - 64, n=11, son 2 yıl) | |
| Lenovo ThinkPad X395 | |
| Ortalama AMD Radeon RX Vega 6 (Ryzen 2000/3000) (7.4 - 9.7, n=2) | |
| HP EliteBook x360 1030 G3 | |
| Rise of the Tomb Raider | |
| 1024x768 Lowest Preset | |
| Lenovo ThinkPad X395 | |
| Ortalama AMD Radeon RX Vega 6 (Ryzen 2000/3000) (29.8 - 37.5, n=2) | |
| Lenovo ThinkPad X390-20Q1S02M00 | |
| Lenovo ThinkPad X390 Yoga-20NQS05R00 | |
| HP EliteBook x360 1030 G3 | |
| 1920x1080 High Preset AA:FX AF:4x | |
| Lenovo ThinkPad X395 | |
| Ortalama AMD Radeon RX Vega 6 (Ryzen 2000/3000) (9.7 - 12.4, n=2) | |
| HP EliteBook x360 1030 G3 | |
| Rocket League | |
| 1280x720 Performance | |
| Lenovo ThinkPad X395 | |
| Ortalama AMD Radeon RX Vega 6 (Ryzen 2000/3000) (52.6 - 138.1, n=2) | |
| 1920x1080 Performance | |
| Lenovo ThinkPad X395 | |
| Ortalama AMD Radeon RX Vega 6 (Ryzen 2000/3000) (42.2 - 78.9, n=2) | |
| 1920x1080 Quality AA:Medium FX | |
| Lenovo ThinkPad X395 | |
| Ortalama AMD Radeon RX Vega 6 (Ryzen 2000/3000) (26.9 - 47.9, n=2) | |
| 1920x1080 High Quality AA:High FX | |
| Lenovo ThinkPad X395 | |
| Ortalama AMD Radeon RX Vega 6 (Ryzen 2000/3000) (17.4 - 27.7, n=2) | |
| düşük | orta | yüksek | ultra | |
|---|---|---|---|---|
| The Witcher 3 (2015) | 38 | 9.7 | ||
| Rise of the Tomb Raider (2016) | 37.5 | 12.4 | ||
| Rocket League (2017) | 138.1 | 47.9 | 27.7 |
Emisyonlar - Serin ve sessiz bir subnotebook
Fan Gürültüsü
X395, çoğu zaman rölantide kapalı kalan ölçülü bir fana sahiptir. Fan bazen rölantide iken 30.2 dB (A) ve yük altında 34.3 dB (A) döner, ancak bu cihazı gürültüye duyarlı ortamlarda bile kullanmak için yeterince sessizdir. Sarmal bobin gibi herhangi bir sinir bozucu elektriksel girişimin de farkına varmadık, bu nedenle X395, zorlu işler sırasında sessiz değilse bile her zaman en az sessizce çalışmalıdır.
| Lenovo ThinkPad X395 Vega 6, R3 PRO 3300U, Samsung SSD PM981a MZVLB256HBHQ | Lenovo ThinkPad X390-20Q1S02M00 UHD Graphics 620, i5-8265U, Intel SSD Pro 7600p SSDPEKKF512G8L | HP EliteBook x360 1030 G3 UHD Graphics 620, i5-8250U, Samsung PM871b MZNLN128HAHQ | Lenovo ThinkPad X390 Yoga-20NQS05R00 UHD Graphics 620, i7-8565U, Intel SSD Pro 7600p SSDPEKKF512G8L | Huawei Matebook 13-53010FYW UHD Graphics 620, i7-8565U, WDC PC SN520 SDAPNUW-512G | Dell Latitude 5300 UHD Graphics 620, i5-8365U, SK Hynix PC401 512GB M.2 (HFS512GD9TNG) | |
|---|---|---|---|---|---|---|
| Noise | 2% | 6% | 1% | 4% | 5% | |
| kapalı / ortam * (dB) | 30.2 | 29.2 3% | 28.5 6% | 29.2 3% | 29.2 3% | 28.8 5% |
| Idle Minimum * (dB) | 30.2 | 29.2 3% | 28.5 6% | 29.2 3% | 29.2 3% | 28.8 5% |
| Idle Average * (dB) | 30.2 | 29.2 3% | 28.5 6% | 29.2 3% | 29.2 3% | 28.8 5% |
| Idle Maximum * (dB) | 30.2 | 29.2 3% | 28.5 6% | 29.2 3% | 29.2 3% | 29.8 1% |
| Load Average * (dB) | 34.3 | 34.8 -1% | 31.3 9% | 35 -2% | 31.7 8% | 31.7 8% |
| Load Maximum * (dB) | 34.3 | 34.8 -1% | 33.5 2% | 35 -2% | 33 4% | 33.2 3% |
* ... daha küçük daha iyidir
Ses yüksekliği
| Boşta |
| 30.2 / 30.2 / 30.2 dB |
| Çalışırken |
| 34.3 / 34.3 dB |
 | ||
30 dB sessiz 40 dB(A) duyulabilirlik 50 dB(A) gürültülü |
||
min: | ||
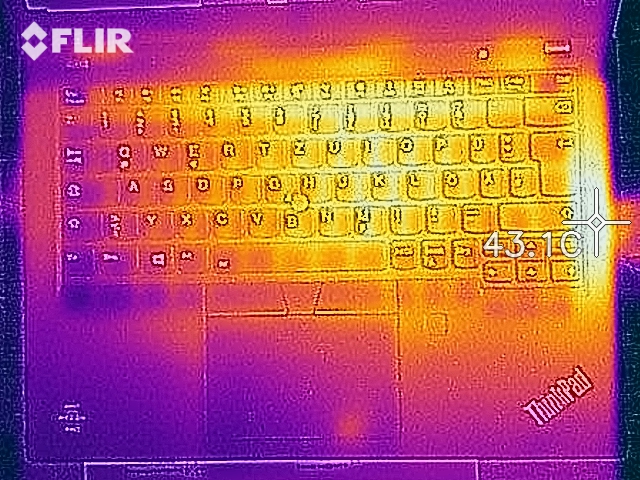
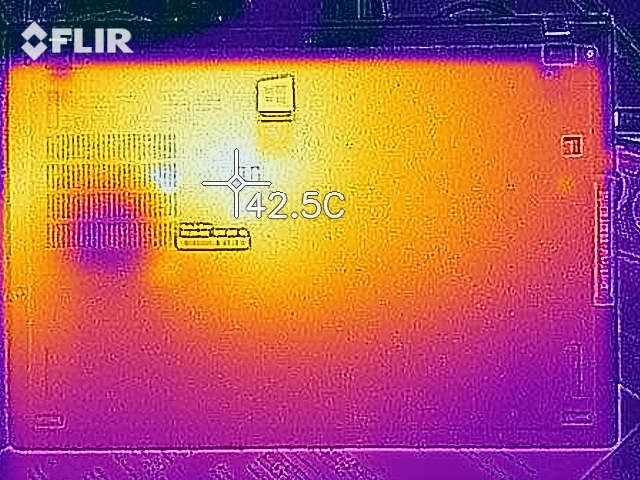
Sıcaklık
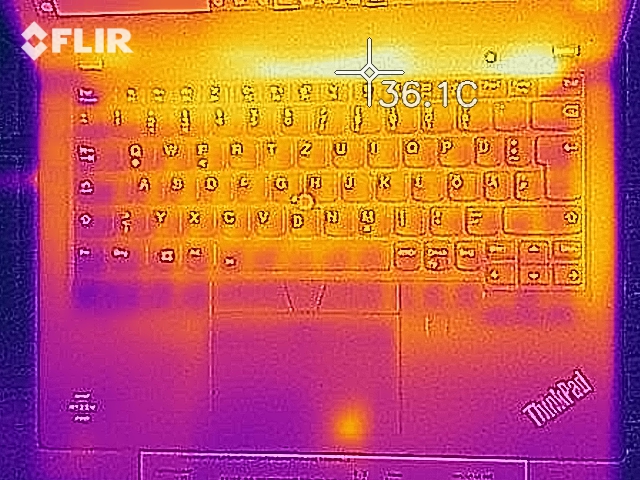
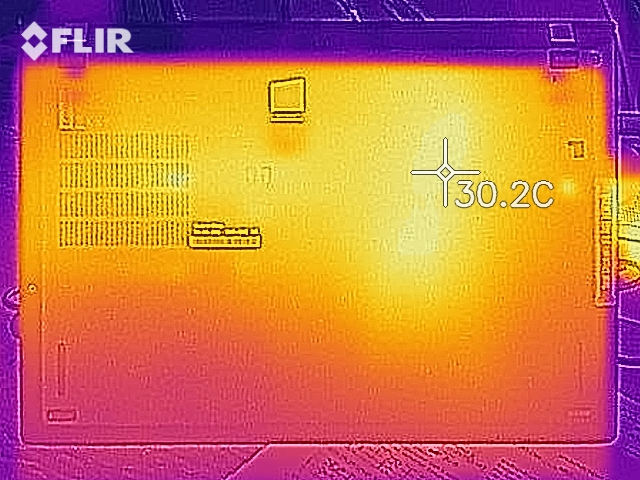
X395 ayrıca yük altında bulunan rakiplerinden, özellikle de X390'dan daha soğuk kalıyor. Avuç içi dayanağı her zaman gözden geçirme ünitemizin en havalı alanları arasındadır ve aşırı ısının şasinin sağ tarafının ortasına yoğunlaşması ile birliktedir. ısı atılıyor. Cihazın solunda veya arkasında bulunan bir havalandırma büyük olasılıkla çoğu insan için daha iyi pozisyonlara sahip olacaktır, çünkü havalandırma bir harici farenin tipik olarak kullanılacağı alanın üzerine ılık havayı boşaltmaktadır. Ancak, cihazınızı bir masadaki harici monitöre bağlarsanız veya harici bir fare kullanmayı planlamıyorsanız, bu bir sorun olmayacaktır.
| Lenovo ThinkPad X395 Vega 6, R3 PRO 3300U, Samsung SSD PM981a MZVLB256HBHQ | Lenovo ThinkPad X390-20Q1S02M00 UHD Graphics 620, i5-8265U, Intel SSD Pro 7600p SSDPEKKF512G8L | HP EliteBook x360 1030 G3 UHD Graphics 620, i5-8250U, Samsung PM871b MZNLN128HAHQ | Lenovo ThinkPad X390 Yoga-20NQS05R00 UHD Graphics 620, i7-8565U, Intel SSD Pro 7600p SSDPEKKF512G8L | Huawei Matebook 13-53010FYW UHD Graphics 620, i7-8565U, WDC PC SN520 SDAPNUW-512G | Dell Latitude 5300 UHD Graphics 620, i5-8365U, SK Hynix PC401 512GB M.2 (HFS512GD9TNG) | |
|---|---|---|---|---|---|---|
| Heat | 4% | -4% | -11% | 2% | -5% | |
| Maximum Upper Side * (°C) | 38.4 | 44.6 -16% | 38 1% | 41.7 -9% | 39.7 -3% | 43 -12% |
| Maximum Bottom * (°C) | 39.7 | 41.1 -4% | 45.4 -14% | 50.1 -26% | 44.4 -12% | 53 -34% |
| Idle Upper Side * (°C) | 28.1 | 23.2 17% | 26.4 6% | 27.8 1% | 24.7 12% | 23.9 15% |
| Idle Bottom * (°C) | 28 | 22.8 19% | 30 -7% | 30.2 -8% | 25.3 10% | 24.7 12% |
* ... daha küçük daha iyidir
(+) Üst taraftaki maksimum sıcaklık, 35.9 °C / 97 F ortalamasına kıyasla 38.4 °C / 101 F'dir. , Subnotebook sınıfı için 21.4 ile 59 °C arasında değişir.
(+) Alt kısım, 39.2 °C / 103 F ortalamasına kıyasla maksimum 39.7 °C / 103 F'ye kadar ısınır
(+) Boşta kullanımda, üst tarafın ortalama sıcaklığı 26.7 °C / 80 F olup, cihazın 30.8 °C / 87 F.
(+) Avuç içi dayanakları ve dokunmatik yüzey, maksimum 31 °C / 87.8 F ile cilt sıcaklığından daha soğuktur ve bu nedenle dokunulduğunda soğuktur.
(-) Benzer cihazların avuç içi dayanağı alanının ortalama sıcaklığı 28.2 °C / 82.8 F (-2.8 °C / -5 F) idi.
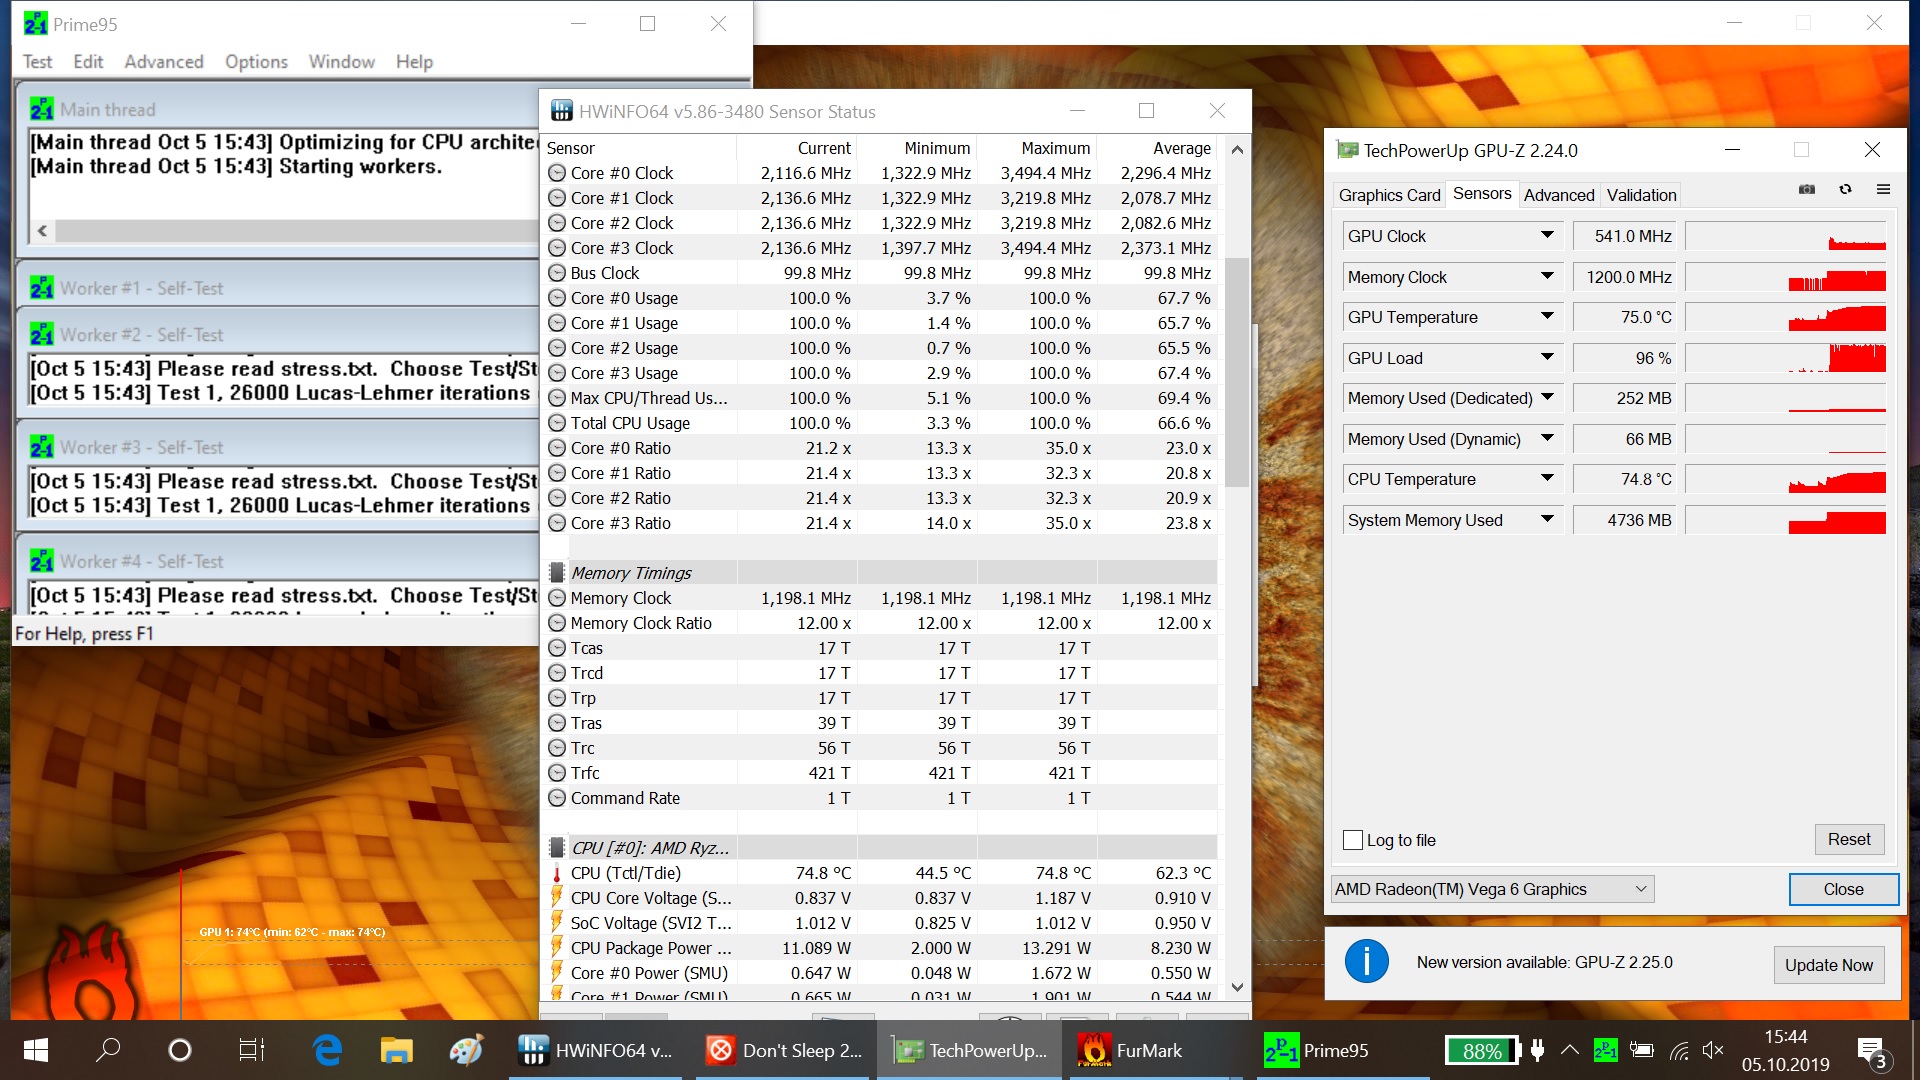
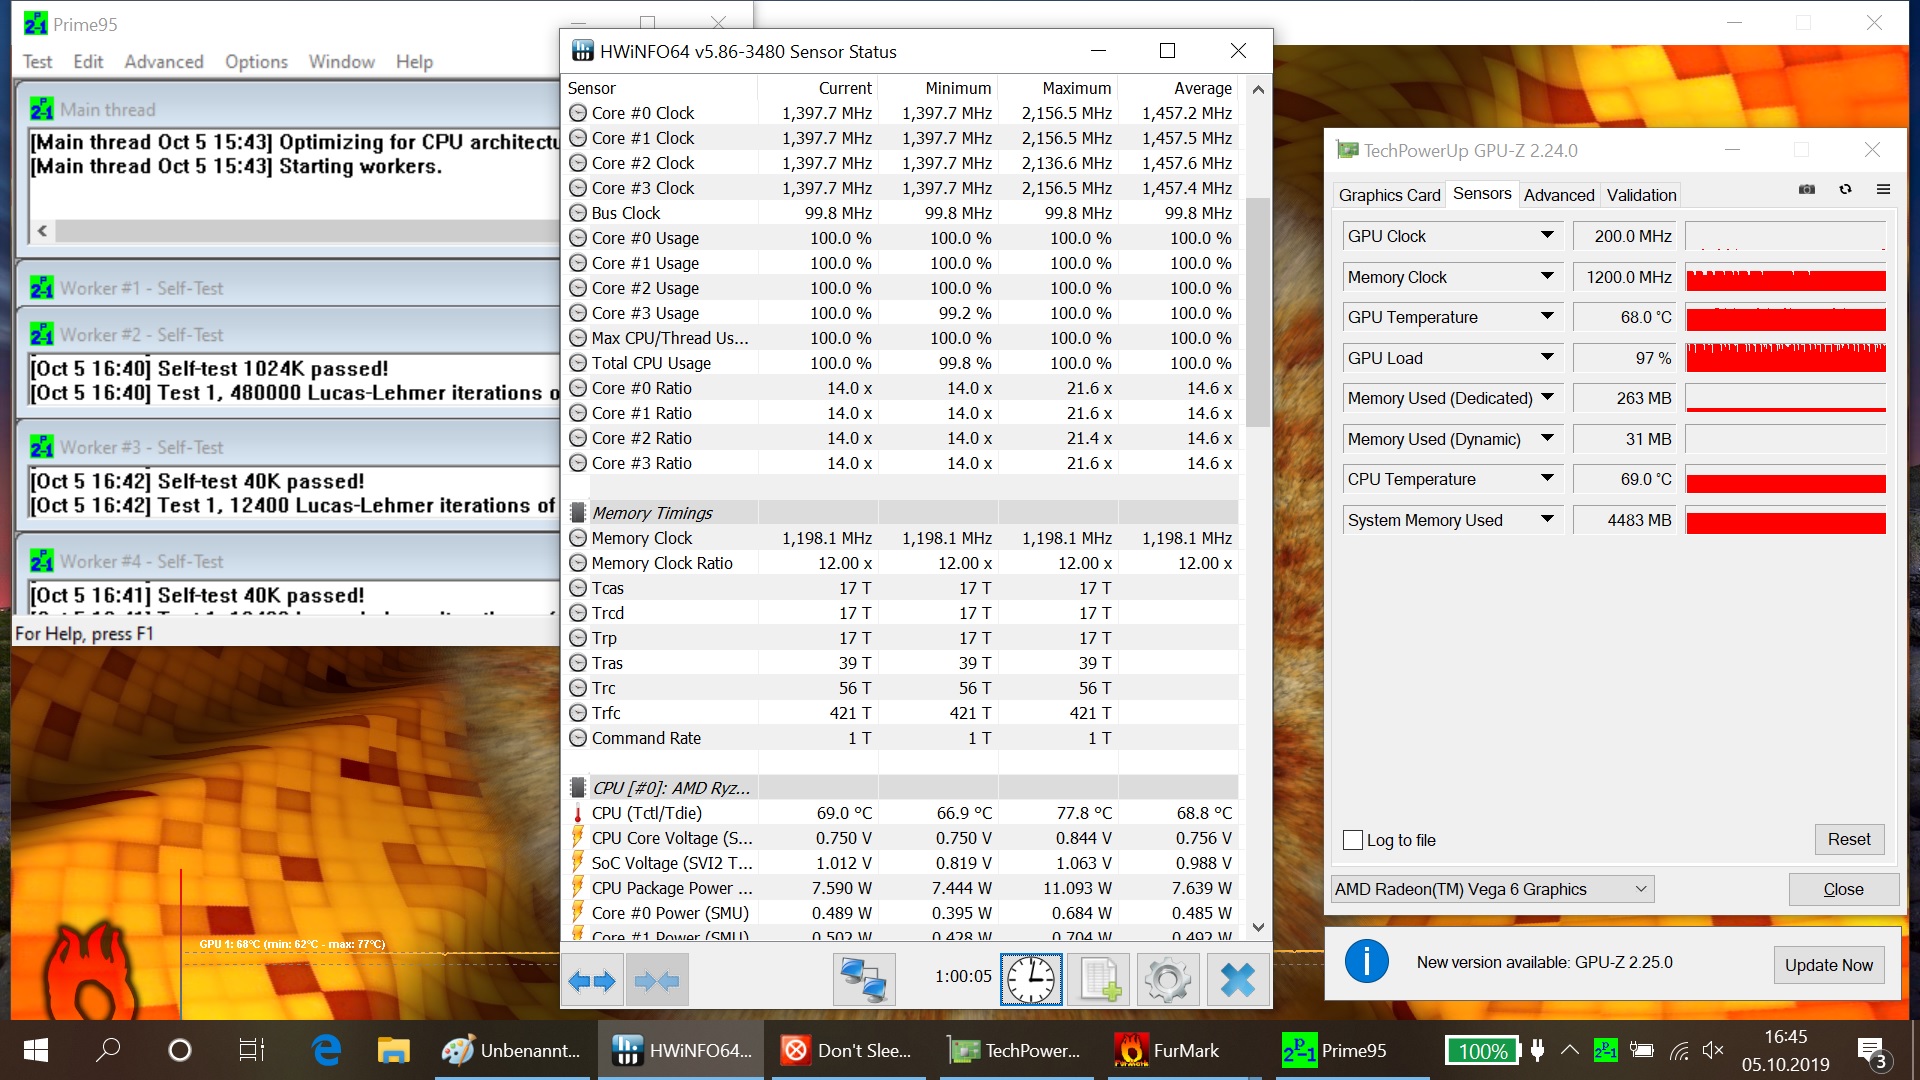
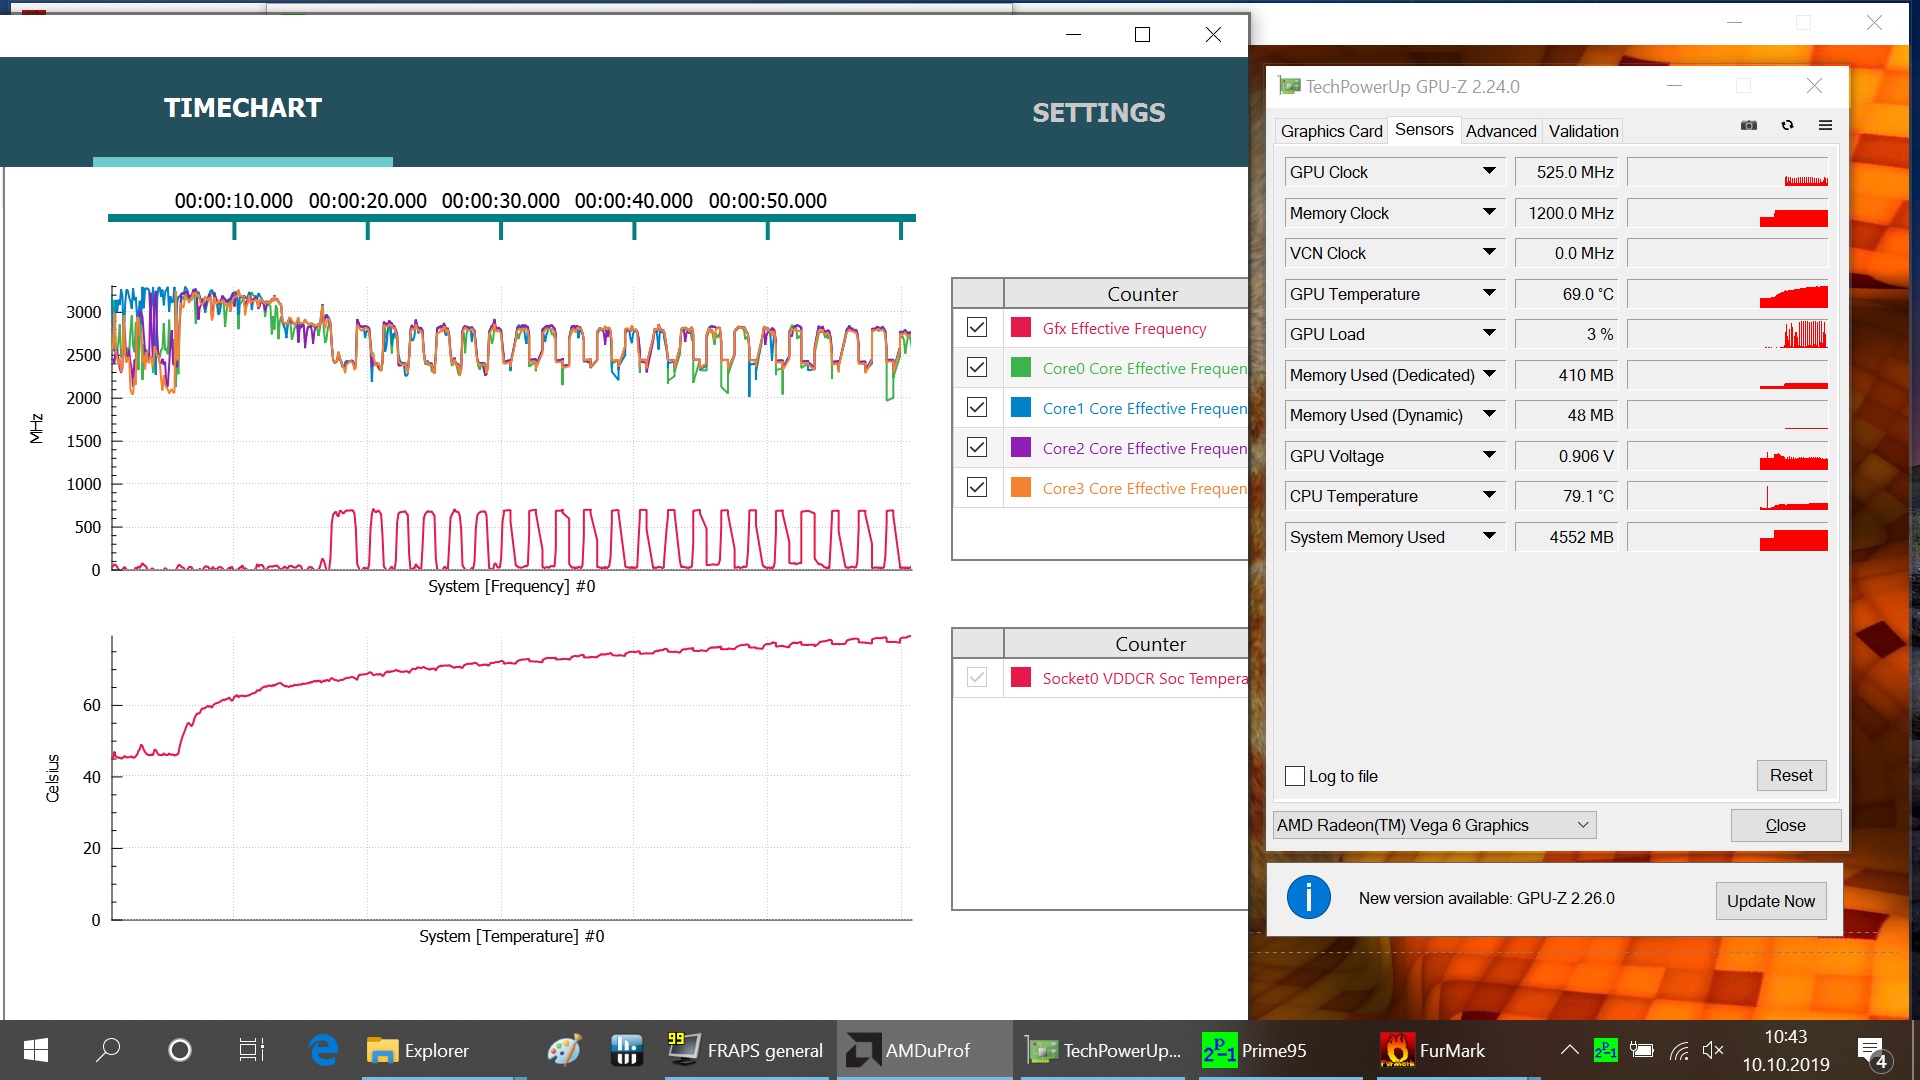
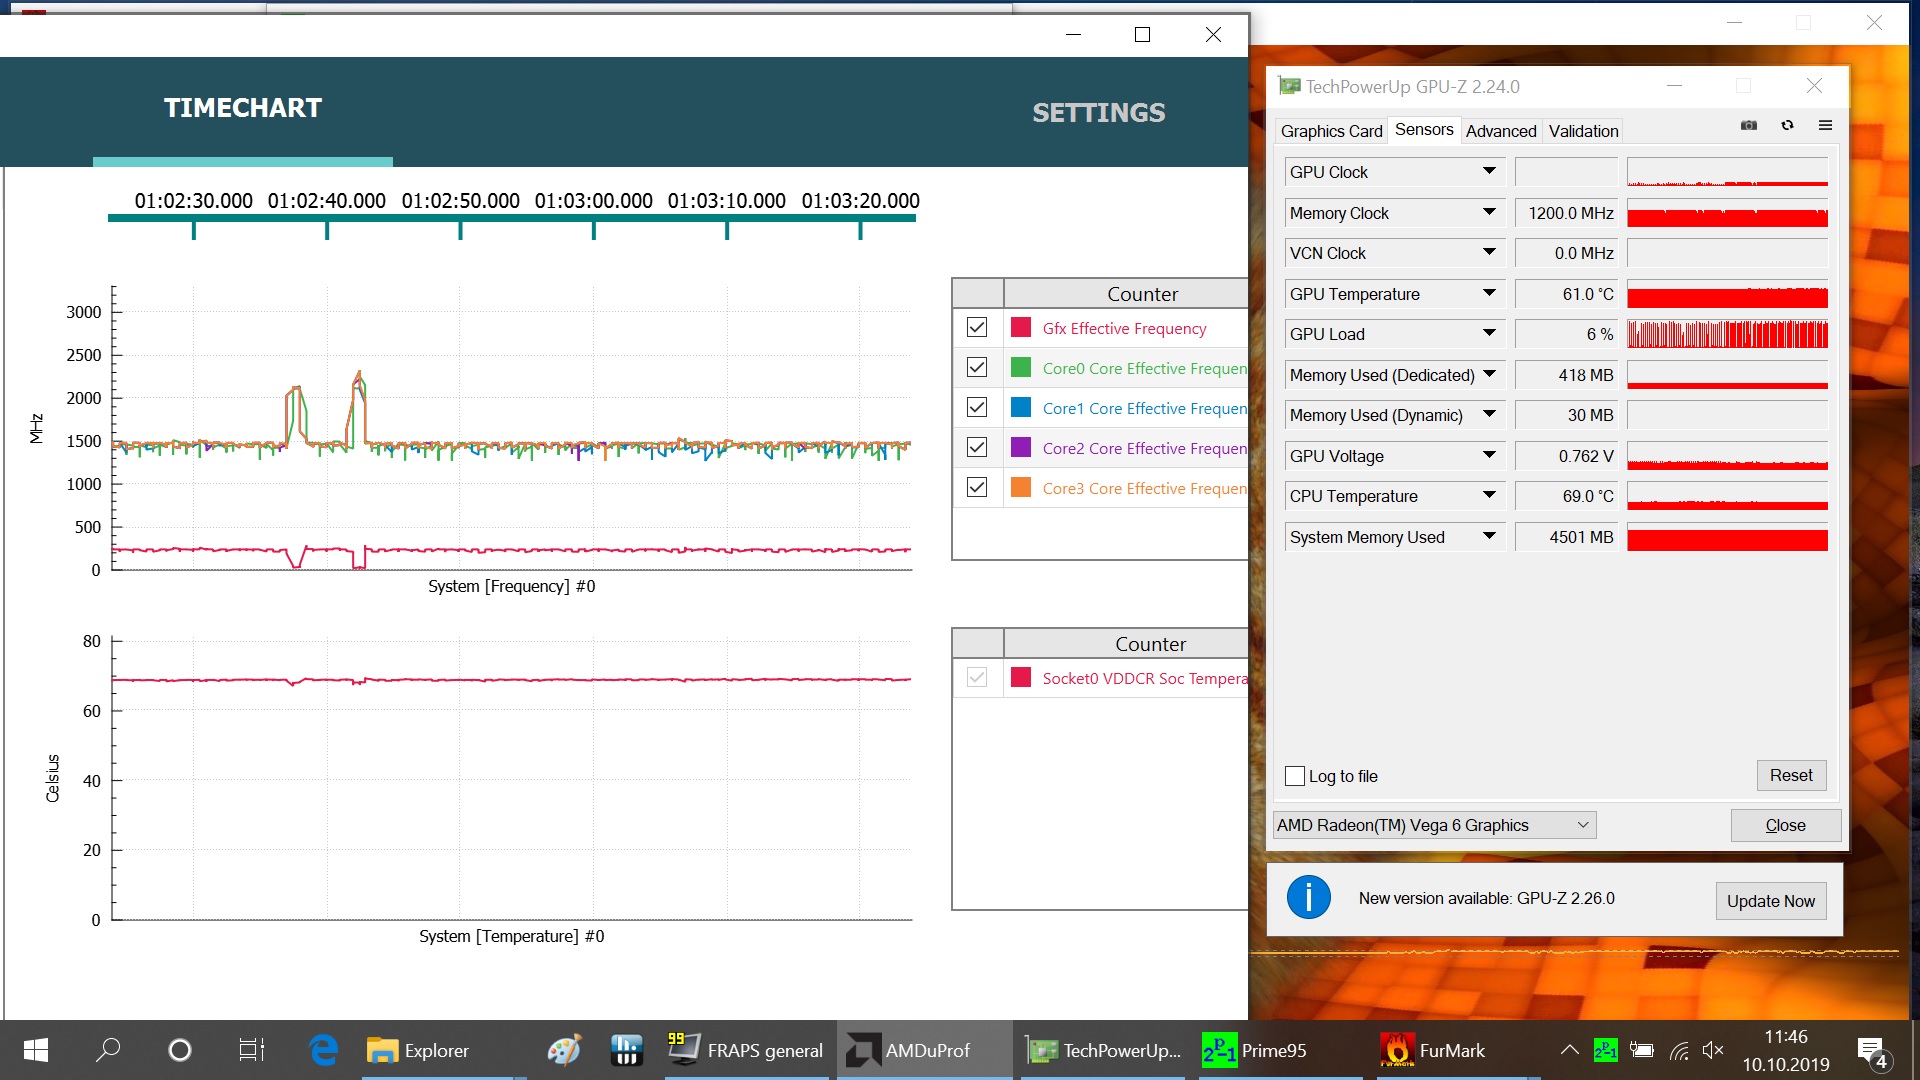
Ayrıca X395'i, birkaç saniye sonra işlemcinin 2.1 GHz'lik tabanının altında kapandığını gösteren bir FurMark ve Prime95 stres testine maruz bıraktık. Saat hızları, bir saatlik stres testinden sonra 1,4 GHz seviyesine inmeden önce giderek daha da azalır. İşlemci çekirdek sıcaklıkları, stres testimizin sonunda kritik çalışma sıcaklığının çok altında, yaklaşık 69 ° C'ydi. Ancak, Radeon RX Vega 6, stres testimizin başlangıcında 541 MHz'den bir saat sonra sadece 200 MHz'e düşürüldü. FurMark ve Prime95’in çalıştırılması. Bu testler, Lenovo’nun X395’in lehine sessizce ve rahatça çalışmasını önlediğini gösteriyor. Bu mutlaka bir ofis dizüstü bilgisayarı veya subnotebook için kötü bir şey olmasa da, inatçı boğulma biraz hayal kırıklığı yaratıyor.
Hoparlörler
Kişi daha küçük hoparlörleri olan kompakt dizüstü bilgisayarların harika bir ses ortamı oluşturmasını beklememelidir. X395'teki hoparlörler, bizim herhangi bir bası beğenmememiz ve çoğaltmamız için biraz sessiz. Hoparlörler ve kulaklık gibi harici ses cihazlarını 3,5 mm jak veya Bluetooth ile bağlayabilirsiniz. Eski referans için, bir mikrofon ve kulaklık jakı birleştirir.
Lenovo ThinkPad X395 ses analizi
(-) | hoparlörler çok yüksek ses çıkarmıyor (71 dB)
Bas 100 - 315Hz
(-) | neredeyse hiç bas yok - ortalama olarak medyandan 18.8% daha düşük
(±) | Bas doğrusallığı ortalamadır (12.6% delta - önceki frekans)
Ortalar 400 - 2000 Hz
(+) | dengeli ortalar - medyandan yalnızca 4.2% uzakta
(±) | Ortaların doğrusallığı ortalamadır (11.9% delta - önceki frekans)
Yüksekler 2 - 16 kHz
(+) | dengeli yüksekler - medyandan yalnızca 2.2% uzakta
(+) | yüksekler doğrusaldır (6.6% deltadan önceki frekansa)
Toplam 100 - 16.000 Hz
(±) | Genel sesin doğrusallığı ortalamadır (20.5% ortancaya göre fark)
Aynı sınıfla karşılaştırıldığında
» Bu sınıftaki tüm test edilen cihazların %66%'si daha iyi, 7% benzer, 26% daha kötüydü
» En iyisinin deltası 5% idi, ortalama 18% idi, en kötüsü 53% idi
Test edilen tüm cihazlarla karşılaştırıldığında
» Test edilen tüm cihazların %54'si daha iyi, 8 benzer, % 38 daha kötüydü
» En iyisinin deltası 4% idi, ortalama 23% idi, en kötüsü 134% idi
Apple MacBook 12 (Early 2016) 1.1 GHz ses analizi
(+) | hoparlörler nispeten yüksek sesle çalabilir (83.6 dB)
Bas 100 - 315Hz
(±) | azaltılmış bas - ortalama olarak medyandan 11.3% daha düşük
(±) | Bas doğrusallığı ortalamadır (14.2% delta - önceki frekans)
Ortalar 400 - 2000 Hz
(+) | dengeli ortalar - medyandan yalnızca 2.4% uzakta
(+) | orta frekanslar doğrusaldır (5.5% deltadan önceki frekansa)
Yüksekler 2 - 16 kHz
(+) | dengeli yüksekler - medyandan yalnızca 2% uzakta
(+) | yüksekler doğrusaldır (4.5% deltadan önceki frekansa)
Toplam 100 - 16.000 Hz
(+) | genel ses doğrusaldır (10.2% ortancaya göre fark)
Aynı sınıfla karşılaştırıldığında
» Bu sınıftaki tüm test edilen cihazların %7%'si daha iyi, 2% benzer, 90% daha kötüydü
» En iyisinin deltası 5% idi, ortalama 18% idi, en kötüsü 53% idi
Test edilen tüm cihazlarla karşılaştırıldığında
» Test edilen tüm cihazların %5'si daha iyi, 1 benzer, % 94 daha kötüydü
» En iyisinin deltası 4% idi, ortalama 23% idi, en kötüsü 134% idi
Güç Yönetimi - Ekonomik ve uzun ömürlü bir Lenovo dizüstü bilgisayar
Güç tüketimi
X395 nispeten düşük güç tüketimine sahip. Gözden geçirme ünitemiz, sürekli yük altında bile ekonomik kalıyor ve kıyaslama cihazlarımızın EliteBook x360 1030 G3'ten çok daha fazlası. Lenovo'nun kutuda içerdiği 65 W güç kaynağı, X395'i tam yük altında bile şarj etmeyi sürdürecek kadar güçlü.
| Kapalı / Bekleme modu | |
| Boşta | |
| Çalışırken |
|
Key:
min: | |
| Lenovo ThinkPad X395 R3 PRO 3300U, Vega 6, Samsung SSD PM981a MZVLB256HBHQ, IPS, 1920x1080, 13.3" | Lenovo ThinkPad X390-20Q1S02M00 i5-8265U, UHD Graphics 620, Intel SSD Pro 7600p SSDPEKKF512G8L, IPS LED, 1920x1080, 13.3" | HP EliteBook x360 1030 G3 i5-8250U, UHD Graphics 620, Samsung PM871b MZNLN128HAHQ, IPS, 1920x1080, 13.3" | Lenovo ThinkPad X390 Yoga-20NQS05R00 i7-8565U, UHD Graphics 620, Intel SSD Pro 7600p SSDPEKKF512G8L, IPS LED, 1920x1080, 13.3" | Huawei Matebook 13-53010FYW i7-8565U, UHD Graphics 620, WDC PC SN520 SDAPNUW-512G, IPS, 2160x1440, 13" | Dell Latitude 5300 i5-8365U, UHD Graphics 620, SK Hynix PC401 512GB M.2 (HFS512GD9TNG), IPS, 1920x1080, 13.3" | Ortalama AMD Radeon RX Vega 6 (Ryzen 2000/3000) | Sınıf ortalaması Subnotebook | |
|---|---|---|---|---|---|---|---|---|
| Power Consumption | -10% | 4% | -14% | -20% | -12% | -13% | -12% | |
| Idle Minimum * (Watt) | 4 | 3.4 15% | 3.8 5% | 3.46 13% | 3.84 4% | 3.8 5% | 5.15 ? -29% | 3.73 ? 7% |
| Idle Average * (Watt) | 6.3 | 5.6 11% | 7.5 -19% | 5.88 7% | 7.68 -22% | 6.9 -10% | 7.75 ? -23% | 6.57 ? -4% |
| Idle Maximum * (Watt) | 9.3 | 8.7 6% | 8.6 8% | 9.12 2% | 9.36 -1% | 7.5 19% | 9.45 ? -2% | 7.93 ? 15% |
| Load Average * (Watt) | 34 | 43.6 -28% | 33.1 3% | 45.6 -34% | 43.2 -27% | 41.4 -22% | 36 ? -6% | 42.1 ? -24% |
| Load Maximum * (Watt) | 42 | 65 -55% | 31.8 24% | 65.9 -57% | 64.8 -54% | 63.1 -50% | 44 ? -5% | 65.1 ? -55% |
* ... daha küçük daha iyidir
Pil ömrü
Daha önce şikayet ettiğimiz performansın azaltılması, batarya ömrü testlerimizde iyi bir şey oldu. İnceleme ünitemiz, yarım saatten daha fazla olan EliteBook x360 1030 G3 daha yüksek kapasiteye sahip olmasına rağmen 48 Wh batarya ile tüm karşılaştırma cihazlarımızdan daha fazla yük altında kaldı. Sonuçta, X395 CPU'sunu EliteBook'unkinden daha fazla etkileyeceğinden, pil ömrünün performans üzerindeki önemini ölçmelisiniz. Ancak, video oynatırken Lenovo'nun "akıllı" güç planı daha az verimli görünüyor. Genellikle, döngüler H.264 video testimizdeki cihazlar pratik Wi-Fi testimizden daha uzun süre dayanır, ancak bunun tersi de X395'teki gibi. Örneğin, X390, öncekilerden neredeyse 4:30 saat, X395'in elde ettiğinden yaklaşık 2:30 saat daha uzun olan bir çalışma zamanı. Ne olursa olsun, inceleme ünitemiz döngülü H.264 video testimizde 10:20 saat sürdü. Buna karşılık, X395, pratik Wi-Fi testimizde 10:55 saatlik çalışma süresiyle X390'dan 2:30 saat daha uzun sürdü. Birincisi, X395'in sergilediği kısma davranışının olumlu etkisinin bir başka örneği, ikincisinin sürekli yük altında yaptığı çalışma süresini iki katına çıkardı.
| Lenovo ThinkPad X395 R3 PRO 3300U, Vega 6, 48 Wh | Lenovo ThinkPad X390-20Q1S02M00 i5-8265U, UHD Graphics 620, 48 Wh | HP EliteBook x360 1030 G3 i5-8250U, UHD Graphics 620, 56.2 Wh | Dell Latitude 5300 i5-8365U, UHD Graphics 620, 60 Wh | Lenovo ThinkPad X390 Yoga-20NQS05R00 i7-8565U, UHD Graphics 620, 50 Wh | Huawei Matebook 13-53010FYW i7-8565U, UHD Graphics 620, 41.7 Wh | Sınıf ortalaması Subnotebook | |
|---|---|---|---|---|---|---|---|
| Pil Çalışma Süresi | -20% | 0% | -24% | -30% | -23% | 19% | |
| Reader / Idle (h) | 18.4 | 23 25% | 23.6 28% | 26.4 ? 43% | |||
| H.264 (h) | 10.3 | 12.7 23% | 10 -3% | 15.3 ? 49% | |||
| WiFi v1.3 (h) | 10.9 | 8.3 -24% | 10 -8% | 8.3 -24% | 8.2 -25% | 7 -36% | 13.9 ? 28% |
| Load (h) | 3.8 | 1.6 -58% | 3.2 -16% | 1.5 -61% | 1.5 -61% | 2.04 ? -46% |
Artılar
Eksiler
Kararı - Kabul edilebilir CPU kısma özelliğine sahip harika bir subnotebook
ThinkPad X390 ve Intel CPU'ları, Nisan ayında incelediğimizde, ThinkPad X395'e göre% 1 daha fazla puan alarak% 90'a ulaştı. Bu, Nisan ayından bu yana yeni bir derecelendirme sistemine geçtiğimiz için eskiyi ikincisinden daha iyi hale getirmiyor. ThinkPad X390 ve X395 birbirlerine yaklaşık olarak iyi, ancak her ikisinin de kendine has özelliklerine sahipler. İki cihaz garip bir şekilde yerleştirilmiş microSD kart yuvasıyla birlikte aynı mükemmel giriş cihazlarını ve mükemmel ekranı paylaşıyor. Lenovo, her ikisi de lehimli RAM ve kasalarının sağ tarafında bir havalandırma deliği ile donatılmıştır; bunlardan ikisi de sağ elinizdeyse fare tutma elinizin üzerinde sıcak hava tahliye eder. Yük altında daha az güç kullanırken, daha iyi grafik performansı ile birlikte X390'dan daha fazla güvenlik özelliği. Bu nedenle, X395 burnunu X390'dan hemen önce doğrudan karşılaştırabilir. Bununla birlikte, X395, X390'dan daha iyi GPU performansı sunarken, CPU'sunu sürekli olarak ağır yük altında bırakıyor. Lenovo, X395'in CPU performansı pahasına olsa bile sessiz, serin ve ekonomik bir şekilde çalışmasını sağlamak için yapmış görünüyor. Bu arada, X395 ayrıca şu anda tescilli bir Intel arabirimi olan Thunderbolt 3 bağlantı noktasından da yoksun, ancak eski 1.4 standardı yerine HDMI 2.0'a sahip. Lenovo ThinkPad X395, testlerimiz sırasında birkaç zayıf noktayı açığa çıkaran harika bir alt ve ofis dizüstü bilgisayarı . AMD ile çalışan makine en azından Intel kardeşine eşittir, ancak daha sessiz, serin ve ekonomik bir şekilde çalışırken. X395, X390'dan daha güçlü GPU performansına sahip, bu da bir bonus. Lenova şu anda yaklaşık 927 Euro (~ 1,022 $) değerinde test yapılandırmamızı satıyor, ancak üçüncü taraf perakendeciler yakında X395'i daha uygun fiyatlarla sunmaya başlayabilir. Genel olarak, X395'e yalnızca işletmelere değil, aynı zamanda 13,3 inçlik güçlü bir subnotebooktan sonra olan özel kişilere de tavsiye ederiz.
Lenovo ThinkPad X395
- 10/14/2019 v7 (old)
Christian Hintze
Price comparison
