İnceleme: MSI Prestige 15 A10SC Laptop

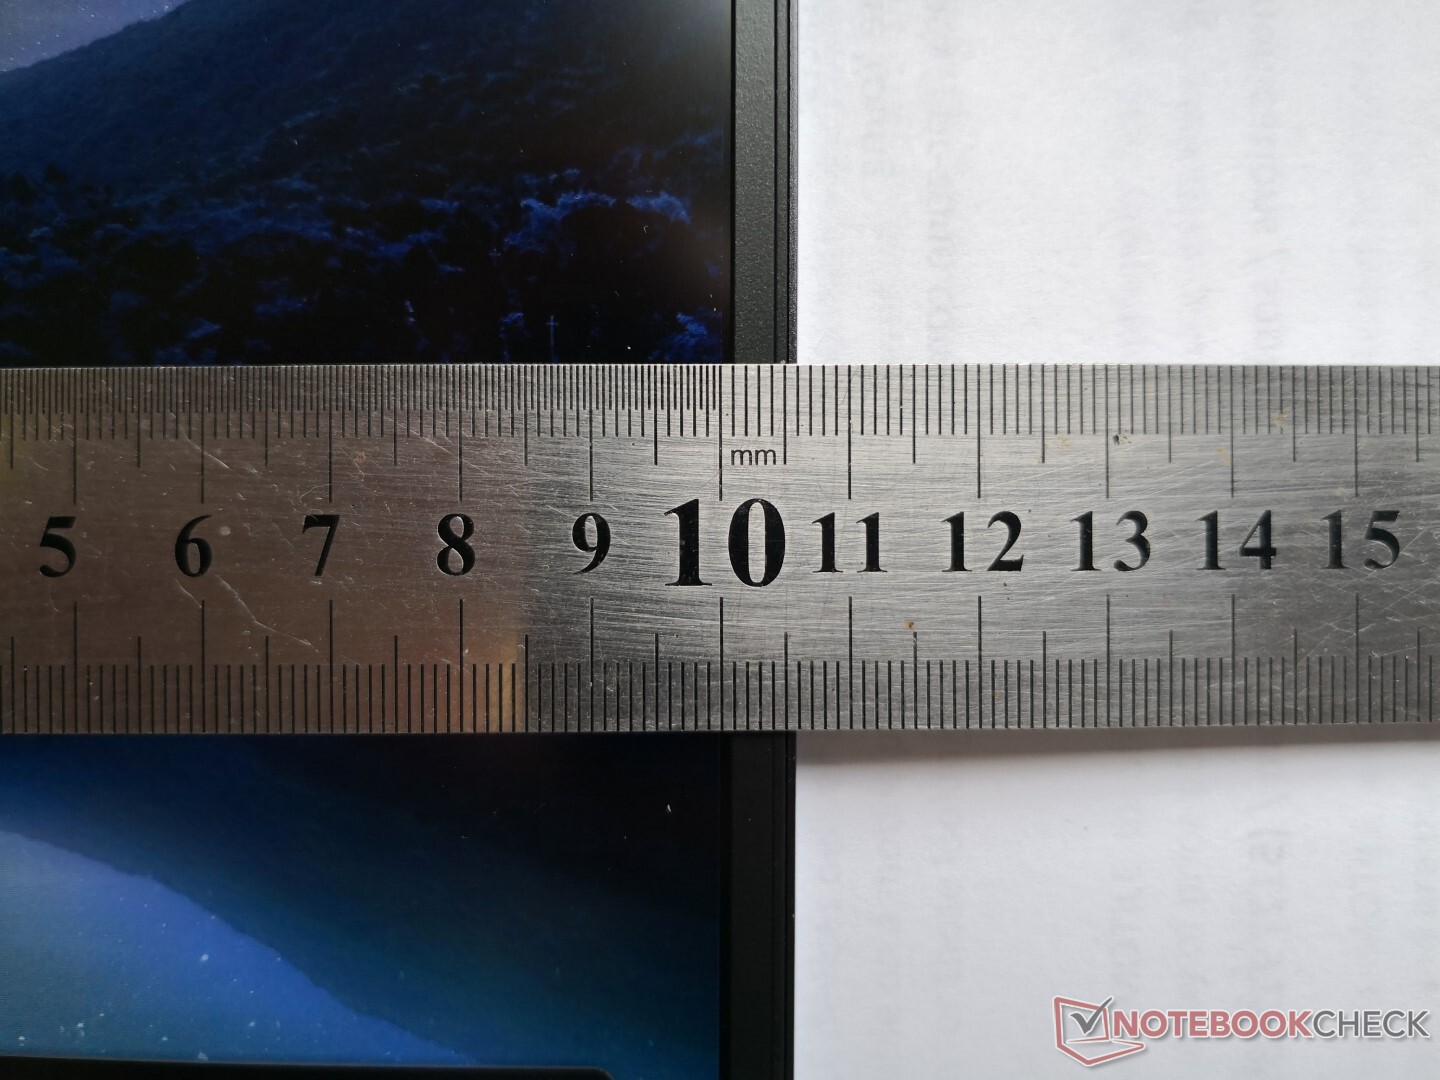
Dell XPS 15, bir Intel H serisi yerine bir Intel U serisi CPU ile birlikte gelirse ne olur? MSI Prestige 15 en iyi GeForce GTX 1650 Max-Q GPU'su ile diğer Ultrabook'lardan daha hızlı grafik seçenekleri sunarken, daha hafif ve daha verimli XPS 15 alternatifi olarak tanımlanabilir. Profesyonel MSI W iş istasyonu serisinden veya daha iyi bilinen MSI oyun G Serisinden farklı olarak, üst seviye MSI Prestige serisi daha hafif bir grafik faktörü ile daha yüksek grafik gücü isteyen geleneksel ofis kullanıcılarını hedefliyor. Bugün sahip olduğumuz Prestige 15 sistemi ilk Intel'in yepyeni hexa çekirdekli Comet Lake-U Çekirdek i7-10710U CPU, sıra dışı GeForce GTX 1650 Max-Q GPU, 4K UHD IPS ekran, 32 GB DDR4 RAM ve perakende satış için 1 TB SSD ile donatılmış 1800 ABD doları. Depolama alanının yarısı, RAM'in yarısı ve FHD ekranı olan daha küçük bir SKU, 1400 ABD doları için de bulunabilir. Küçük 14 inçlik Prestige 14'ün, boyut farklılıklarına rağmen Prestige 15 ile aynı CPU ve GPU seçenekleriyle geldiğini unutmayın. Prestige 15'in rakipleri arasında Asus ZenBook 15 UX534, Dell gibi en gelişmiş 15 inç multimedya dizüstü bilgisayarlar var XPS 15, Lenovo IdeaPad S740, Apple MacBook Pro 15 ve Microsoft Surface Book veya Surface Laptop serisi. Daha fazla MSI incelemesi: MSI Alpha 15MSI GF65MSI WP65MSI Prestige 14MSI P65 Oluşturan
Derecelendirme | Tarih | Modeli | Ağırlık | Yükseklik | Boyut | Çözünürlük | Fiyat |
|---|---|---|---|---|---|---|---|
| 85.2 % v7 (old) | 12/2019 | MSI Prestige 15 A10SC i7-10710U, GeForce GTX 1650 Max-Q | 1.7 kg | 16 mm | 15.60" | 3840x2160 | |
| 82.9 % v7 (old) | 10/2019 | Microsoft Surface Laptop 3 15 Ryzen 5 3580U R5 3580U, Vega 9 | 1.5 kg | 14.7 mm | 15.00" | 2496x1664 | |
| 86.6 % v7 (old) | Lenovo ThinkPad T590-20N4002VGE i7-8565U, GeForce MX250 | 1.9 kg | 19.95 mm | 15.60" | 1920x1080 | ||
| 83.1 % v7 (old) | 10/2019 | Asus ZenBook 15 UX534FT-DB77 i7-8565U, GeForce GTX 1650 Max-Q | 1.7 kg | 18.9 mm | 15.60" | 1920x1080 | |
| 86.3 % v7 (old) | 10/2019 | Dell XPS 15 7590 i5 iGPU FHD i5-9300H, UHD Graphics 630 | 1.9 kg | 17 mm | 15.60" | 1920x1080 |
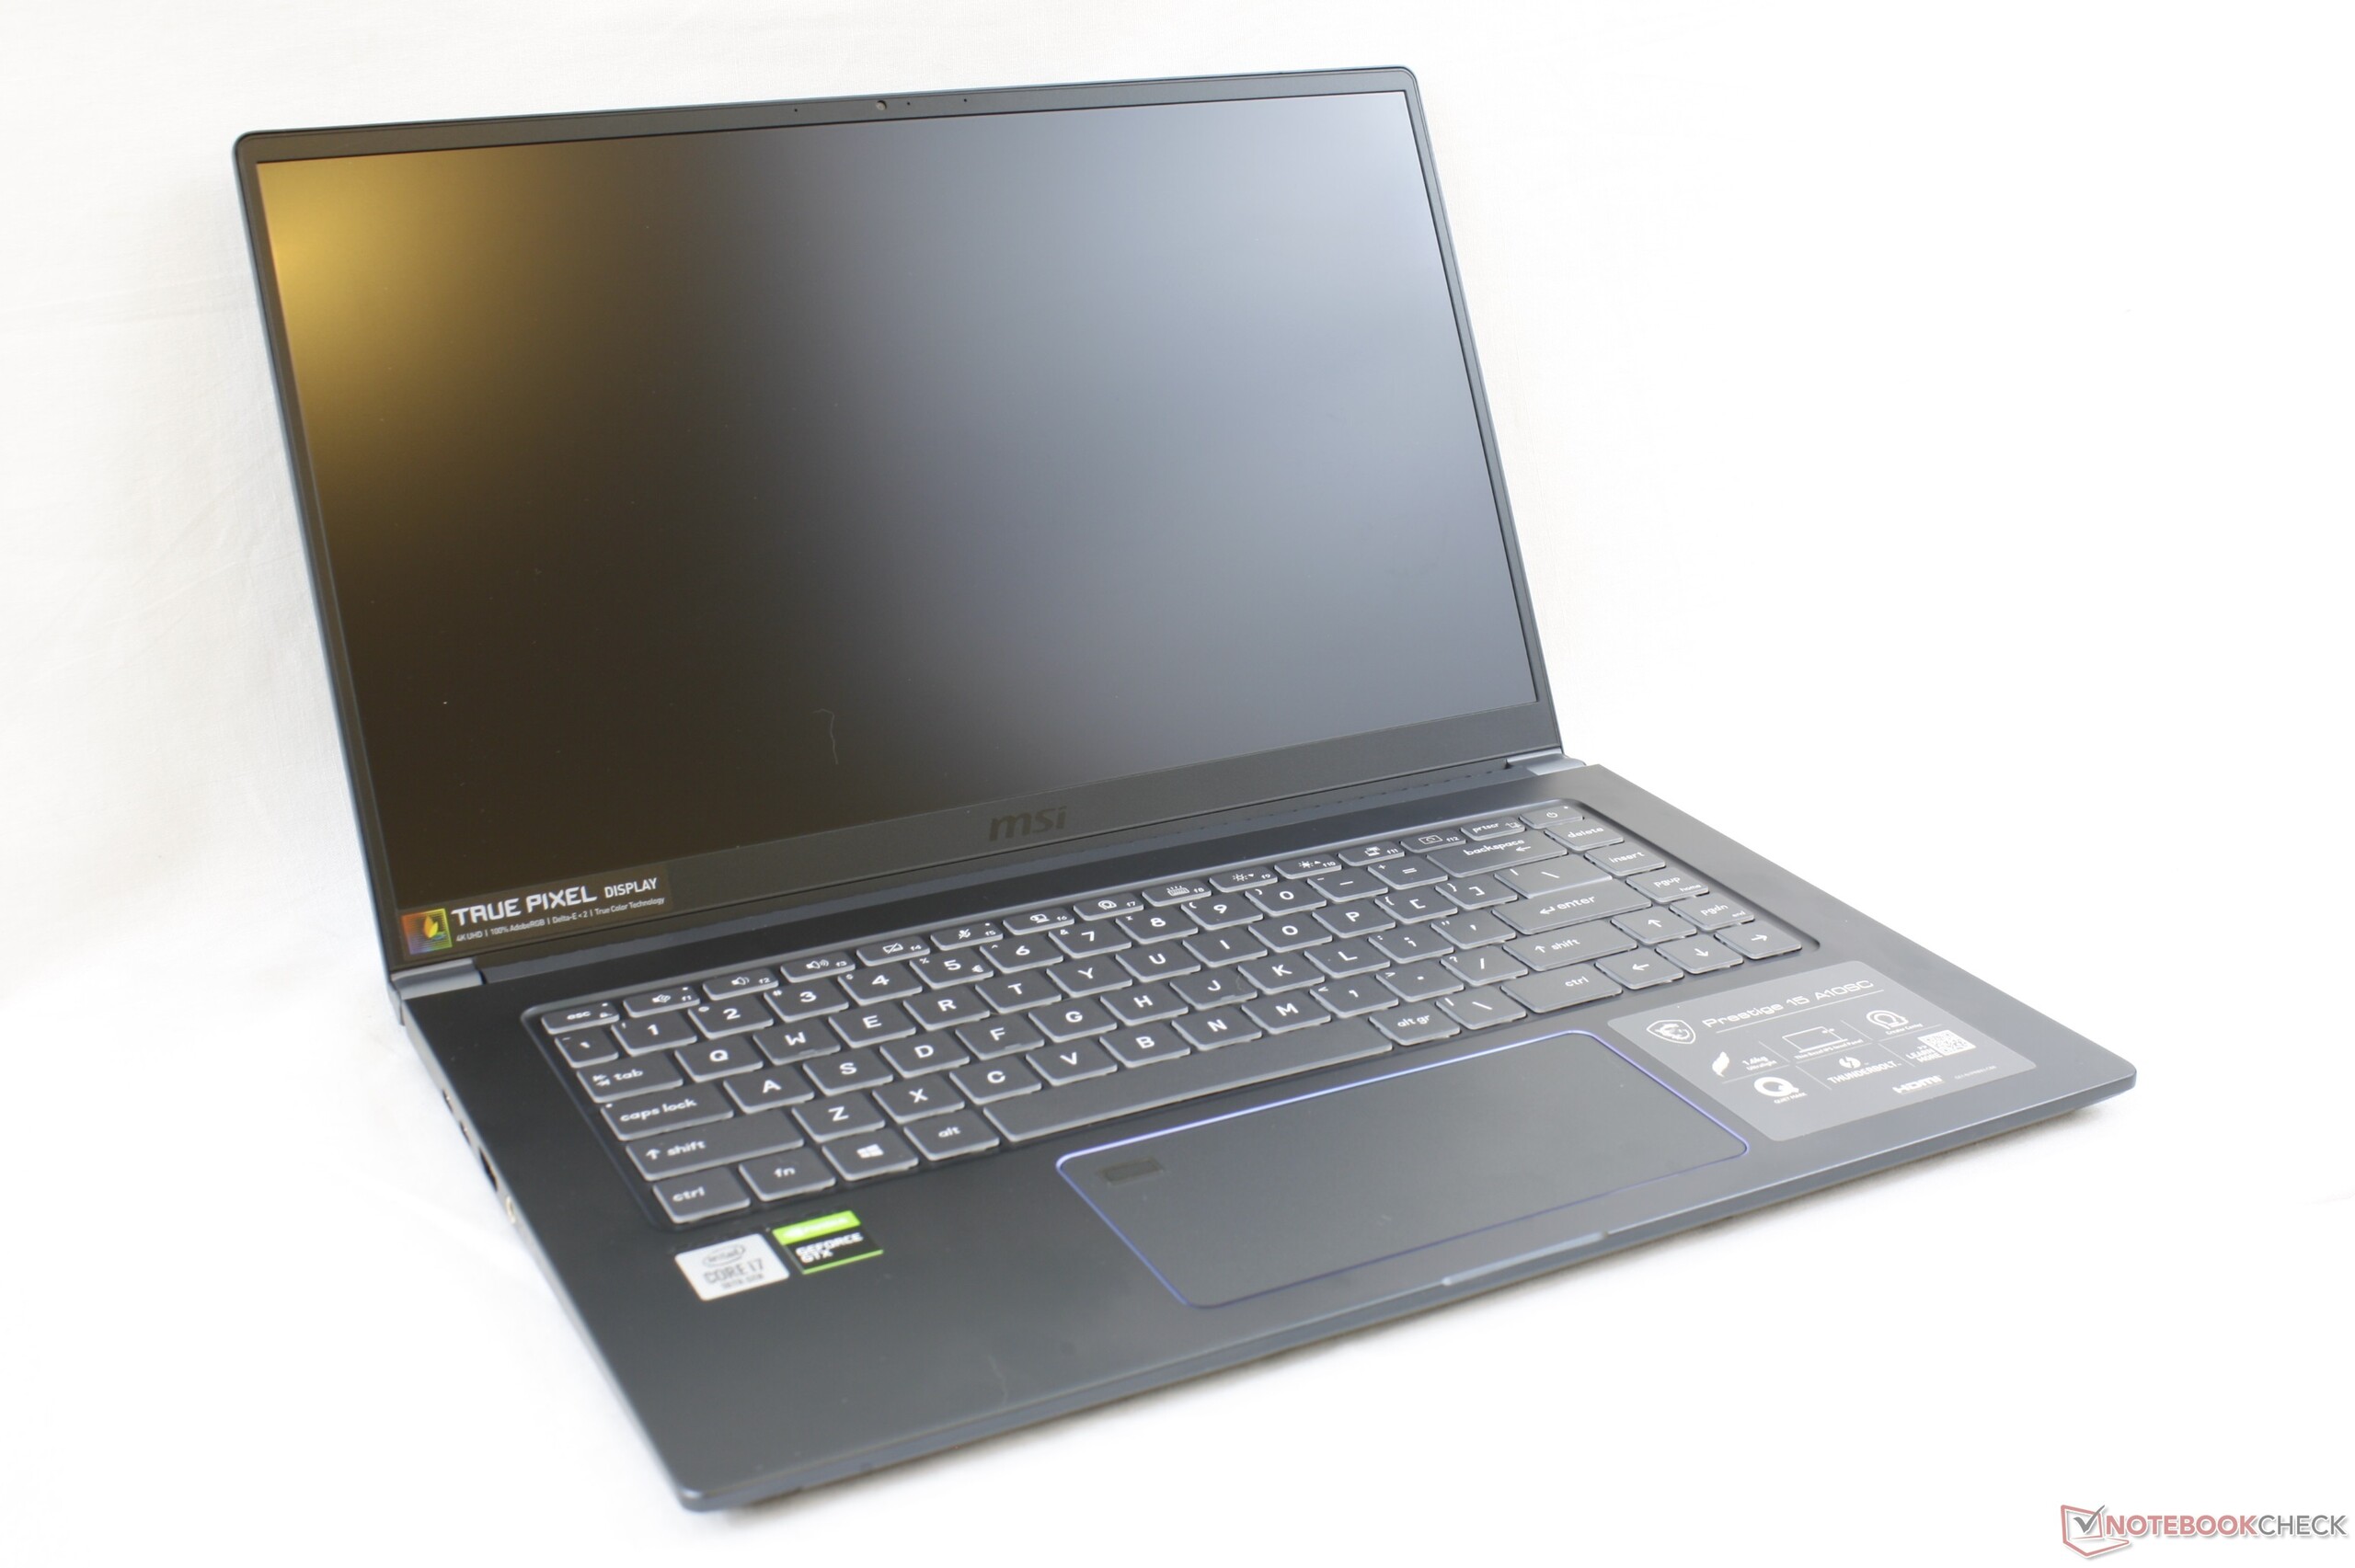
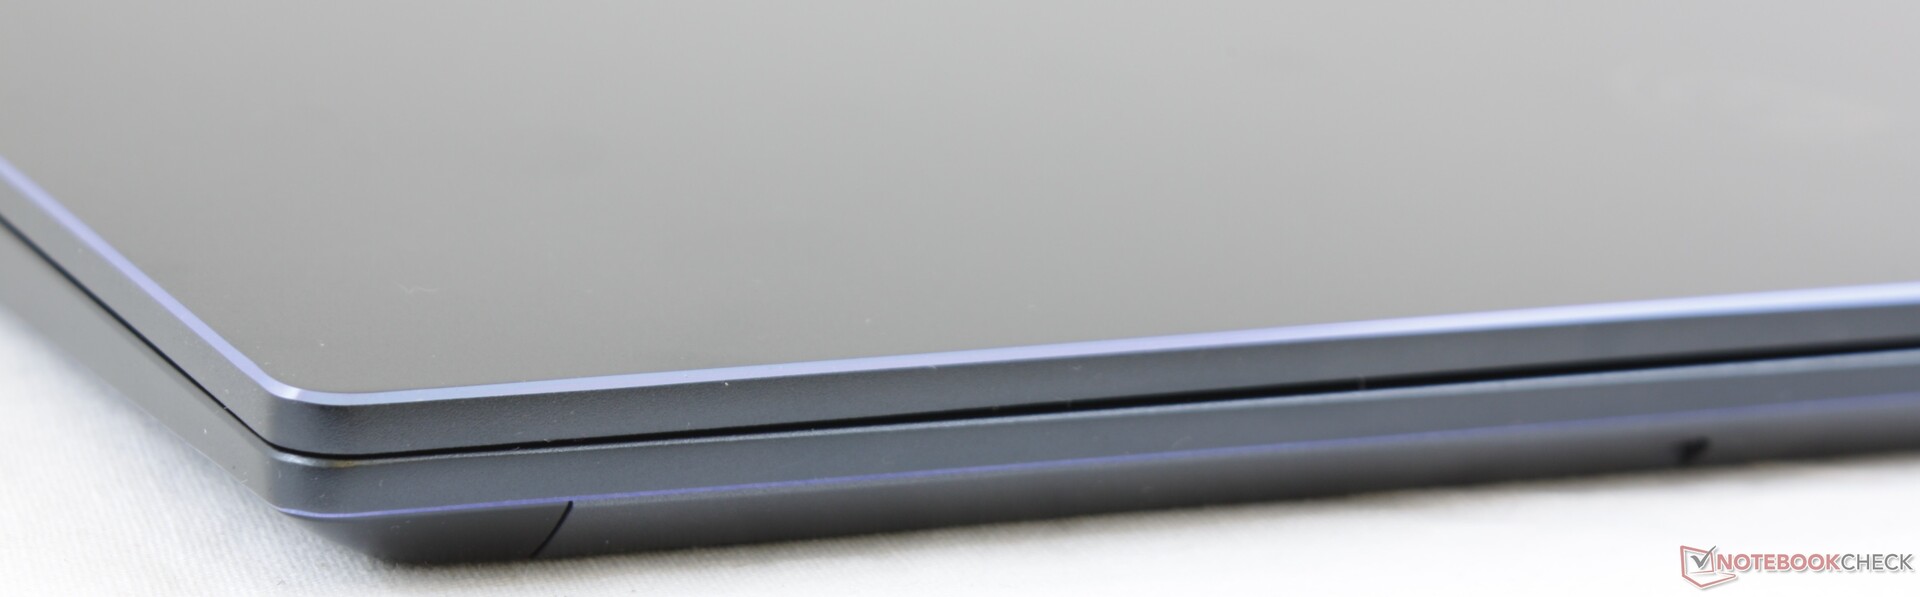
Case - Gaming G Serisinden Daha Düzenli
Esasen beyaz boya katında bir MSI GS65 olan MSI P65 Creator'un aksine, Prestige 15, ofis kullanıcıları ve profesyonellerine daha fazla hitap eden özgün bir kasa tasarımıdır. GS65'in gaudy ve gamer-y özelliklerini, pürüzsüz mat alüminyum yüzeyler ve krom kesimli kenarlar ve köşelerle tamamlanan daha düz ve hoş bir görünümle değiştiriyor. Şık ve seksi görseller, HP Spectre x360 ile aynı seviyede 15, Asus ZenBook 15 veya Dell XPS 15, kasanın sertliği bir kaç adım aşağı. Yüzeyler, yukarıda belirtilen alternatiflerin hiçbiri gibi daha ince ve daha katı değildir. Tabanı veya kapağı kenarlarından bükmeye çalışmak, örneğin daha belirgin bir çarpma ile sonuçlanır. Küçük menteşeler ayrıca, HP veya Dell eşdeğerinin daha sert menteşeleriyle karşılaştırıldığında uzun ömürlülüğü hakkında da biraz endişeli.
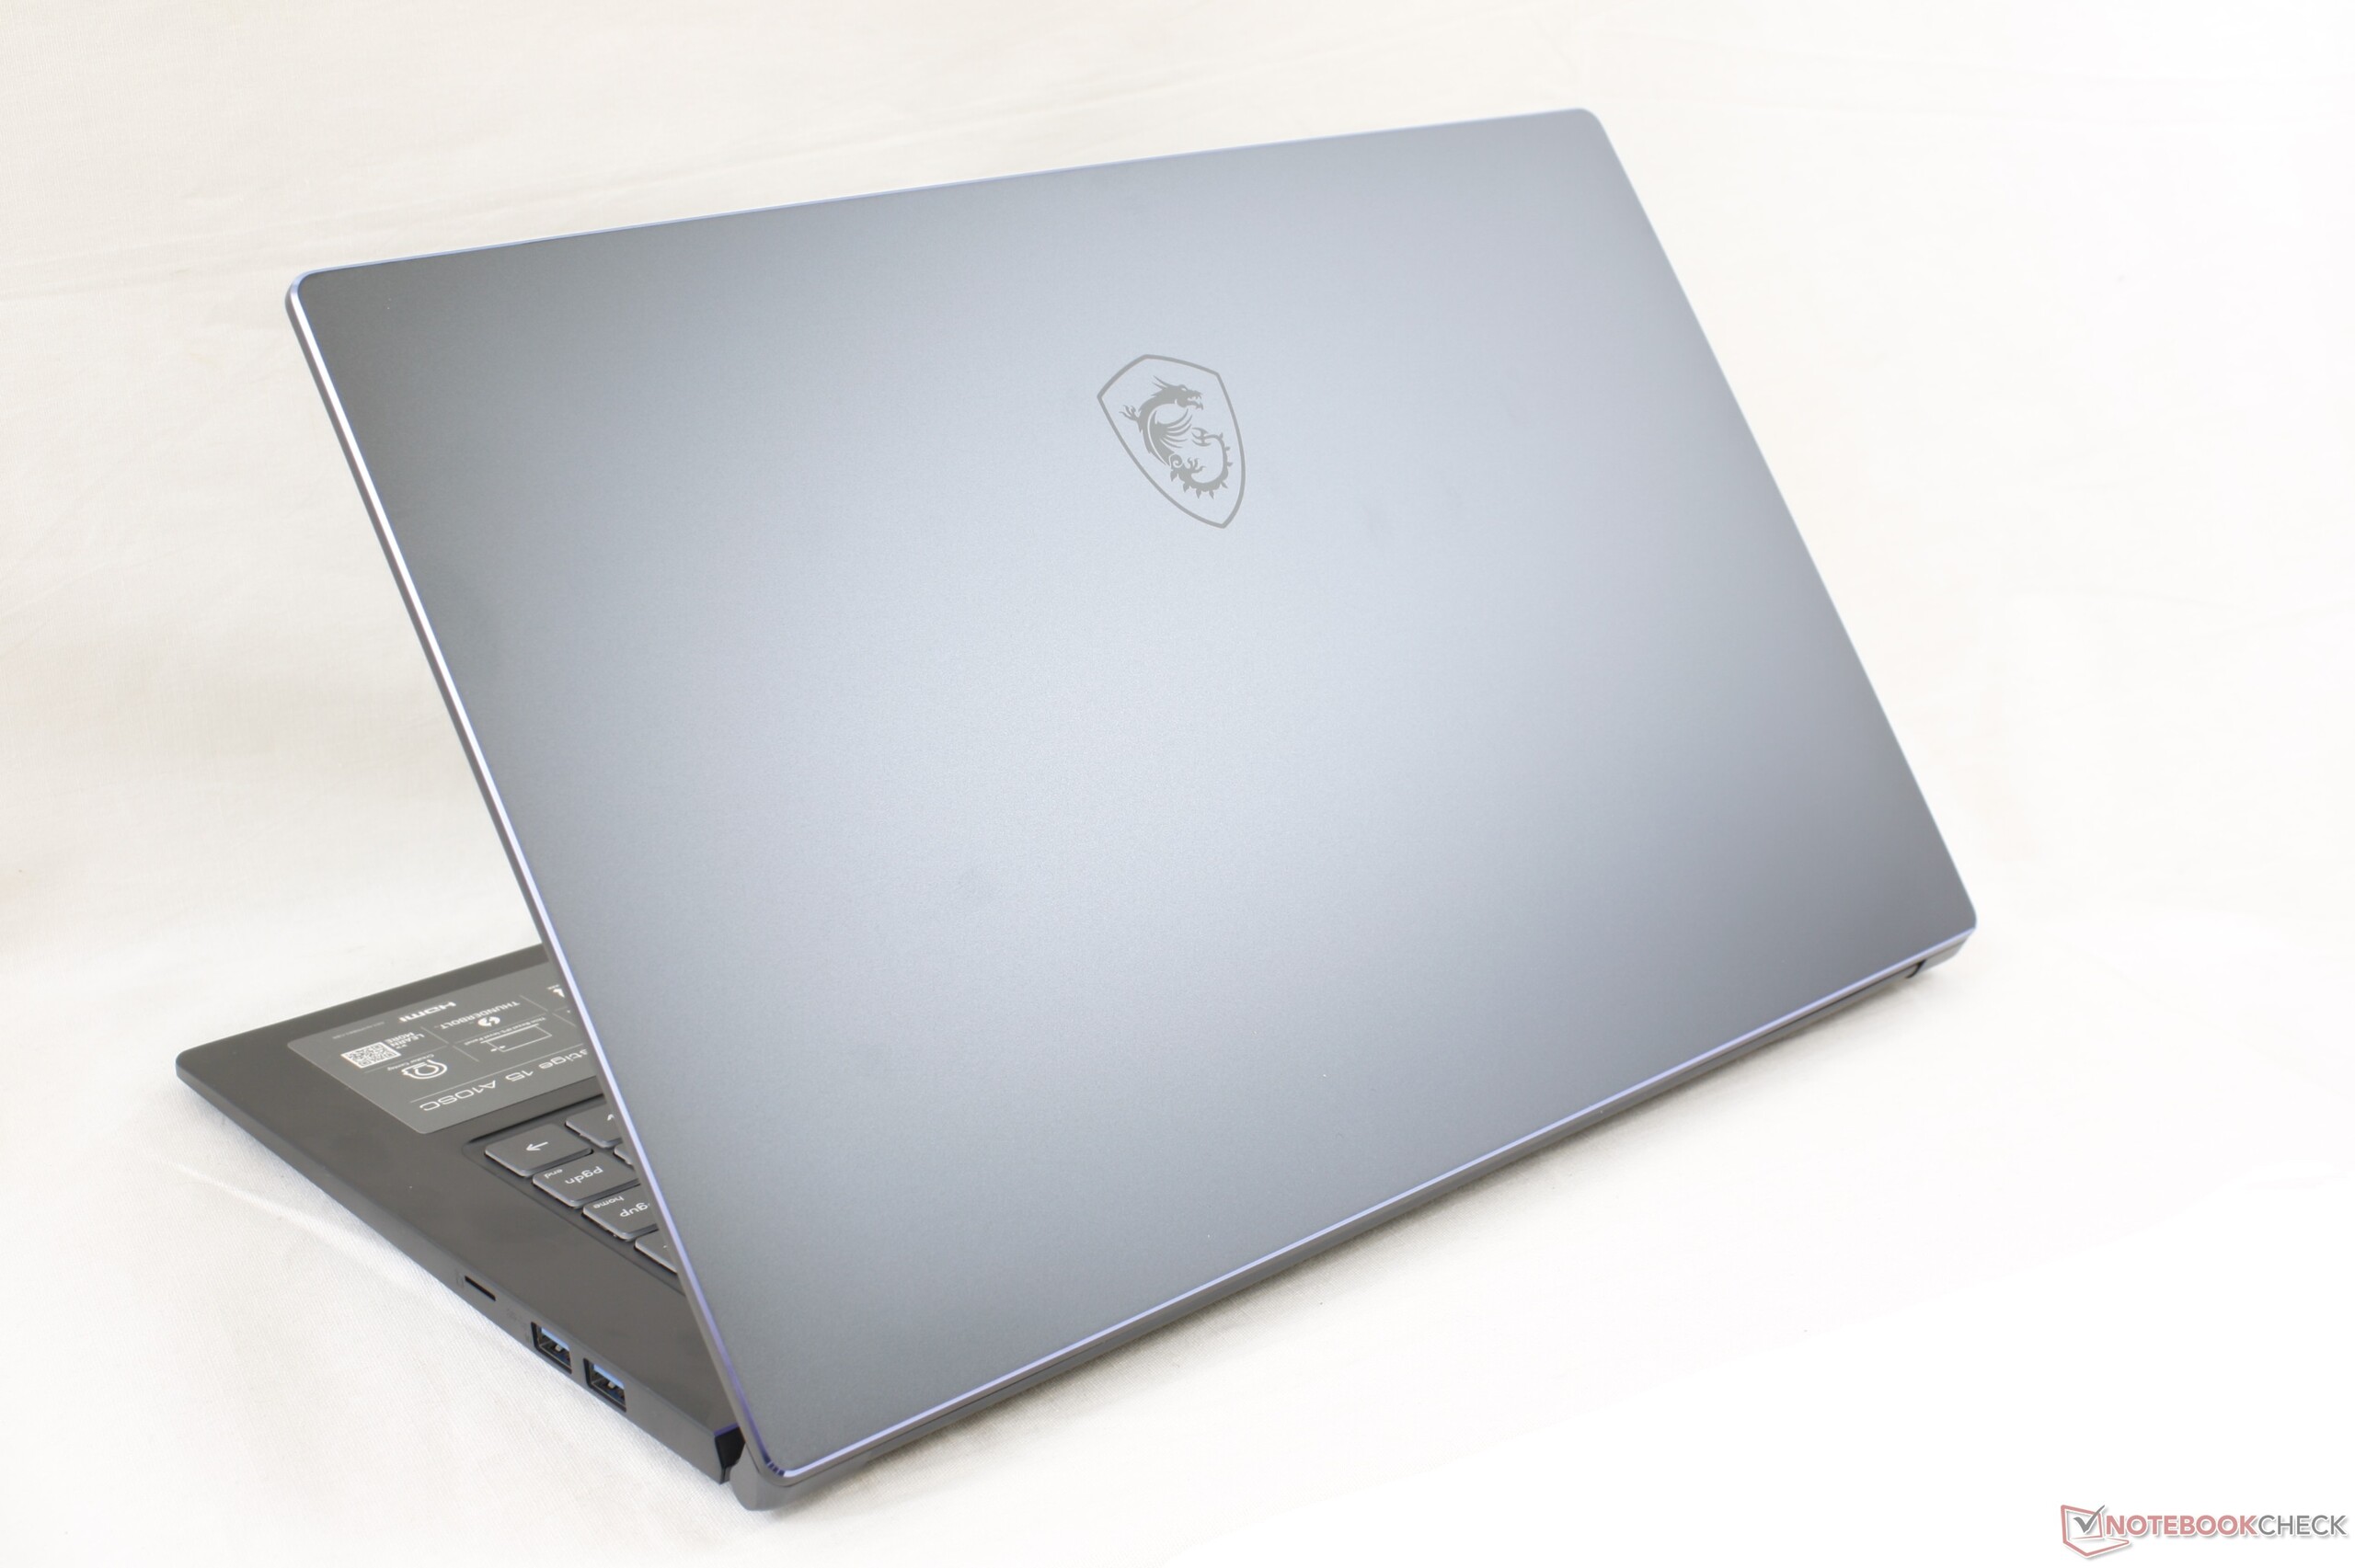
MSI sistemi, popüler XPS 15, MacBook Pro 15, ZenBook 15 ve HP Spectre x360 15 dahil olmak üzere diğer birçok 15 inç multimedya dizüstü bilgisayardan yaklaşık 100 g ila 200 g daha hafiftir. daha önce belirtilen esnek şasi; Prestige 15, rakiplerinden daha çok eğilme ve esneme eğilimindedir.
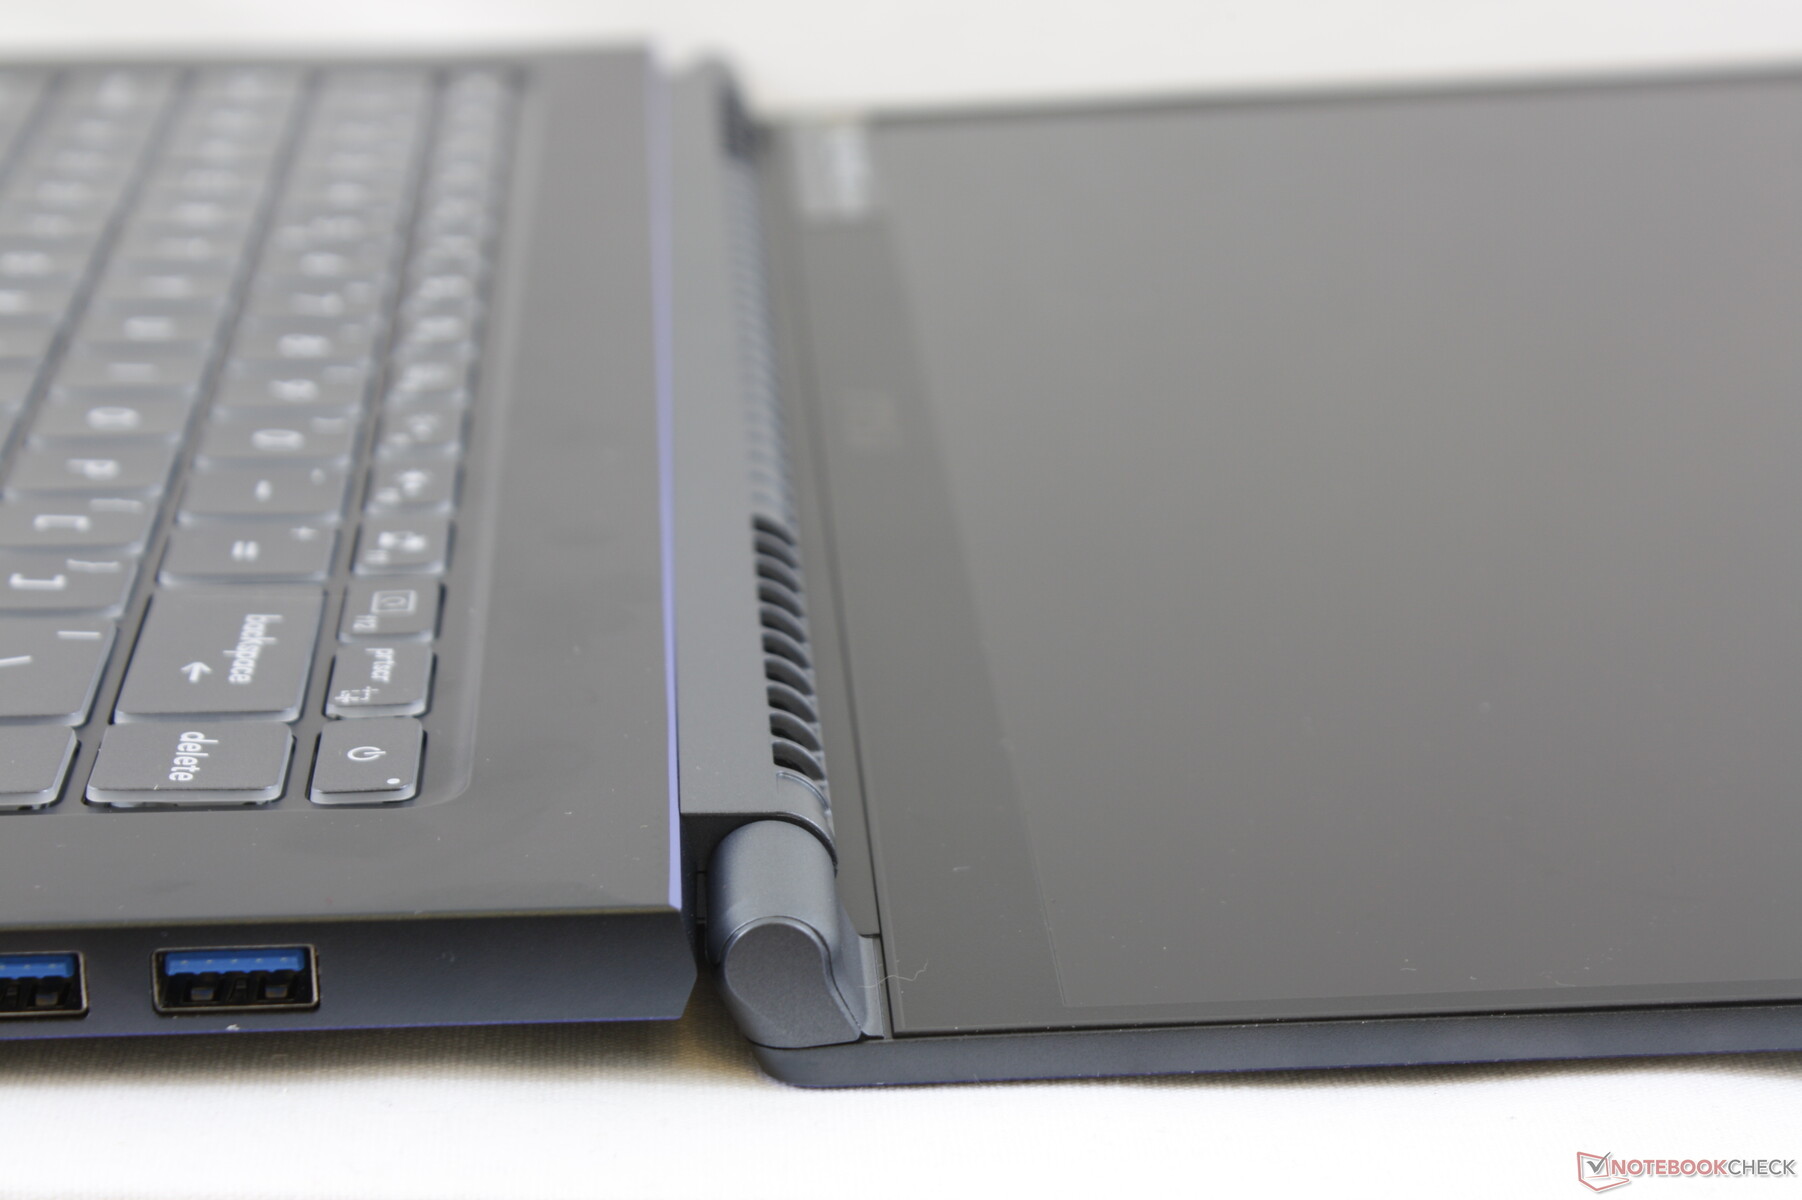
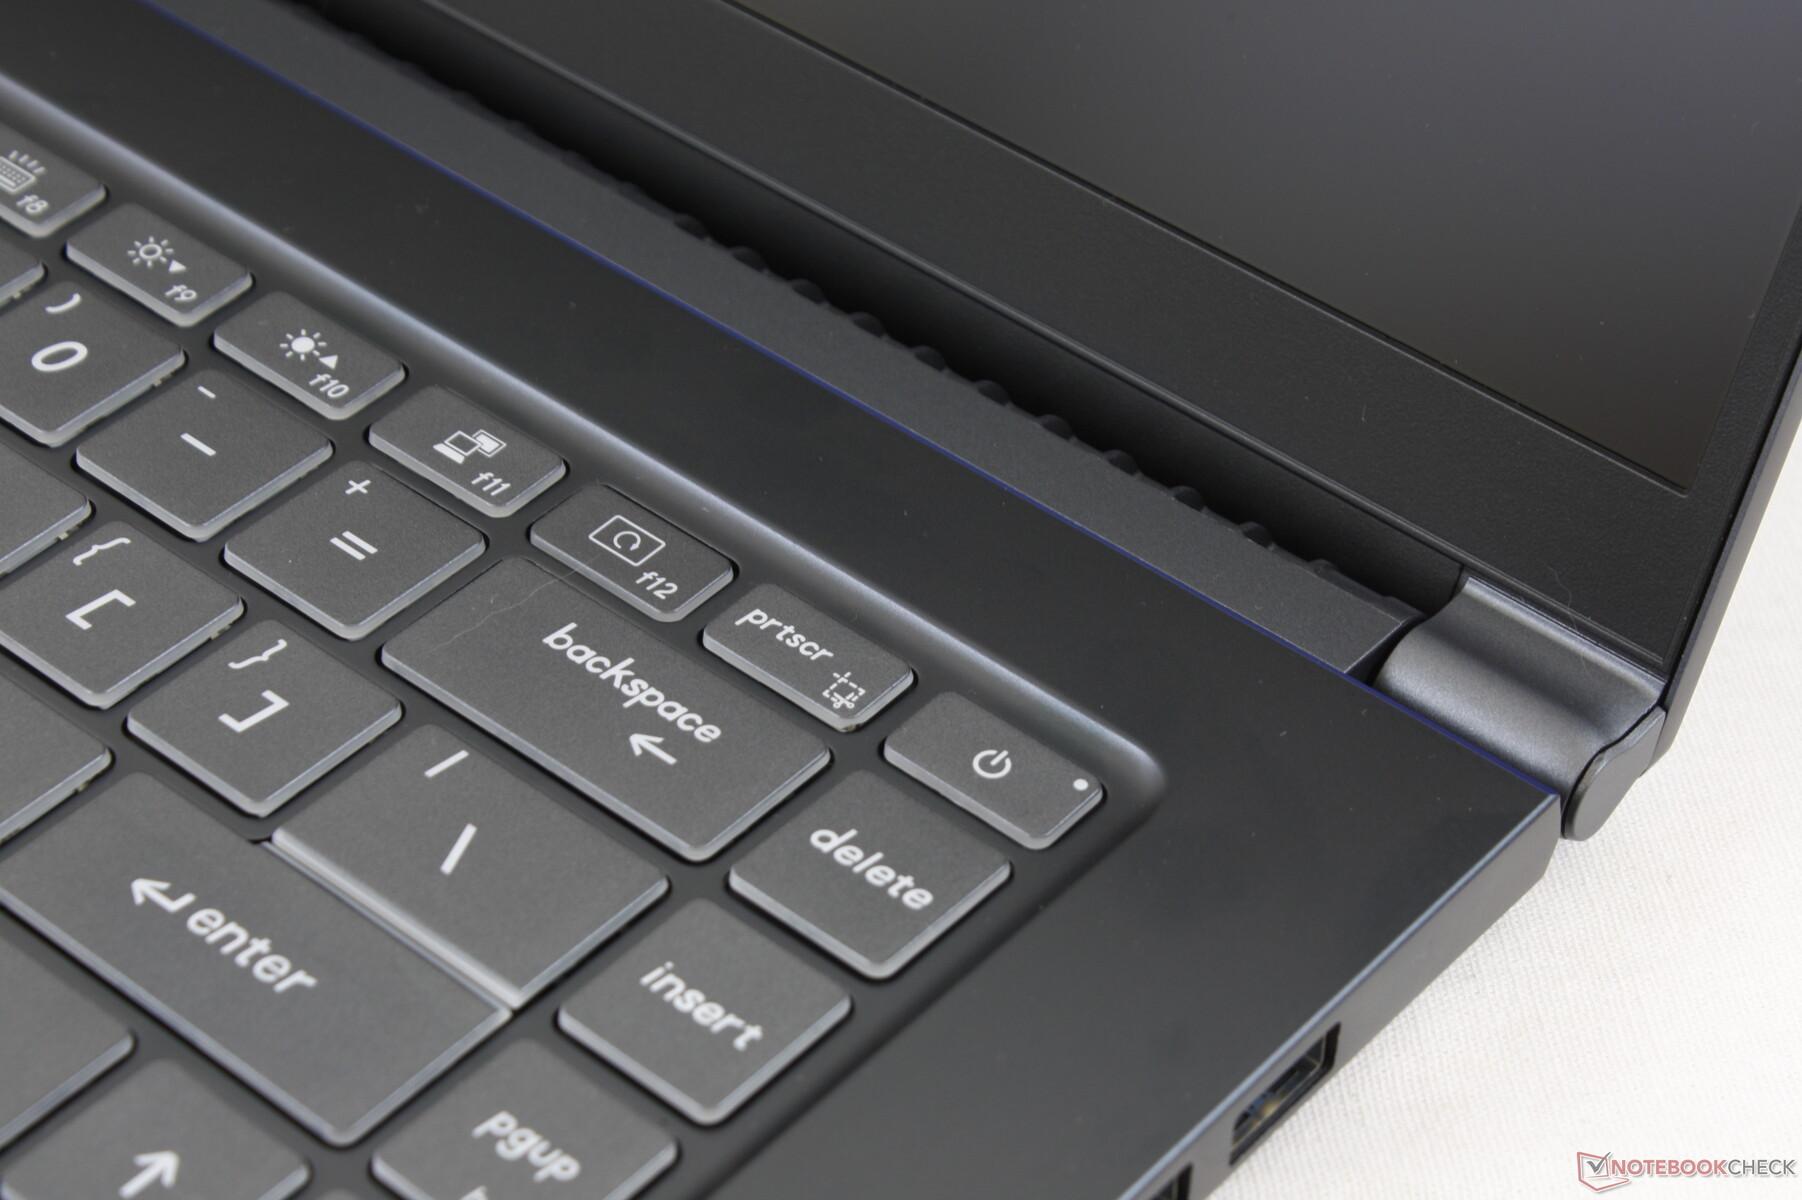
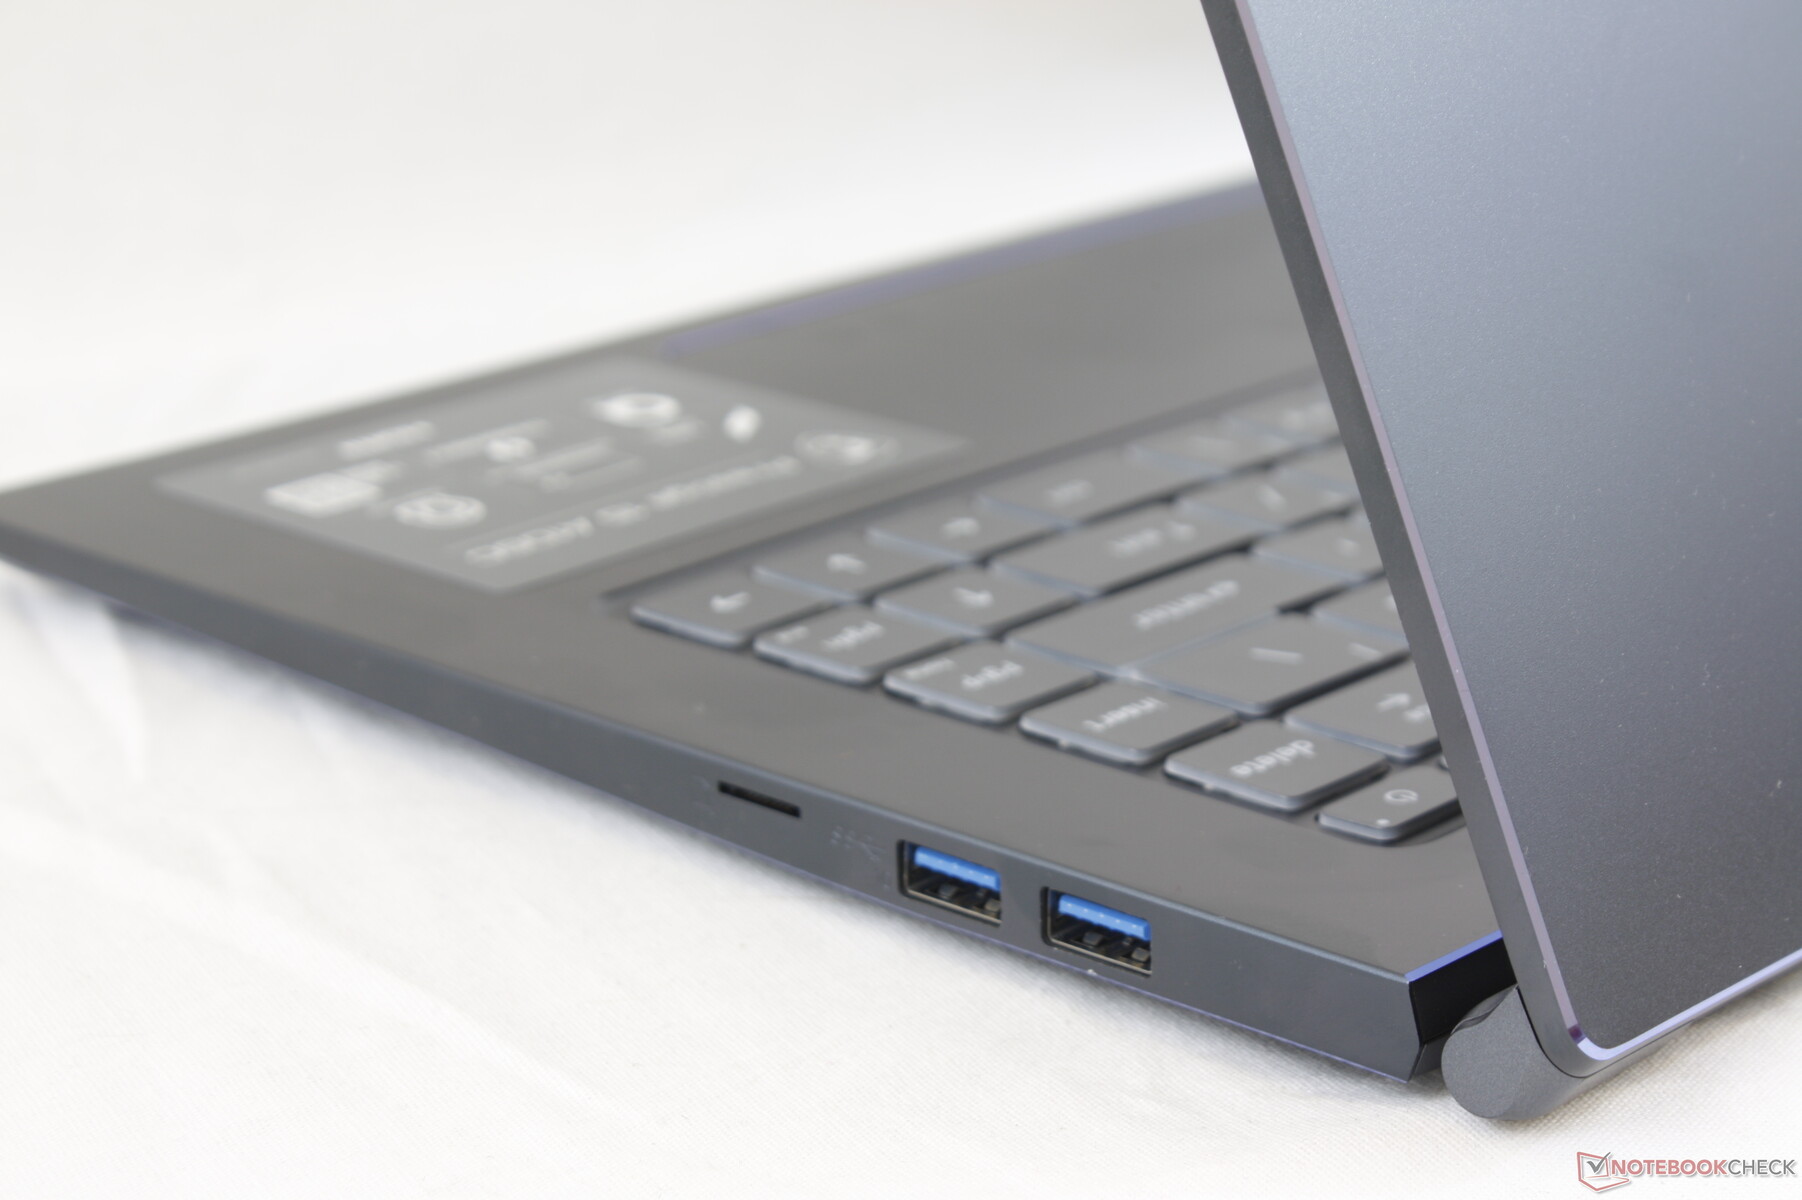
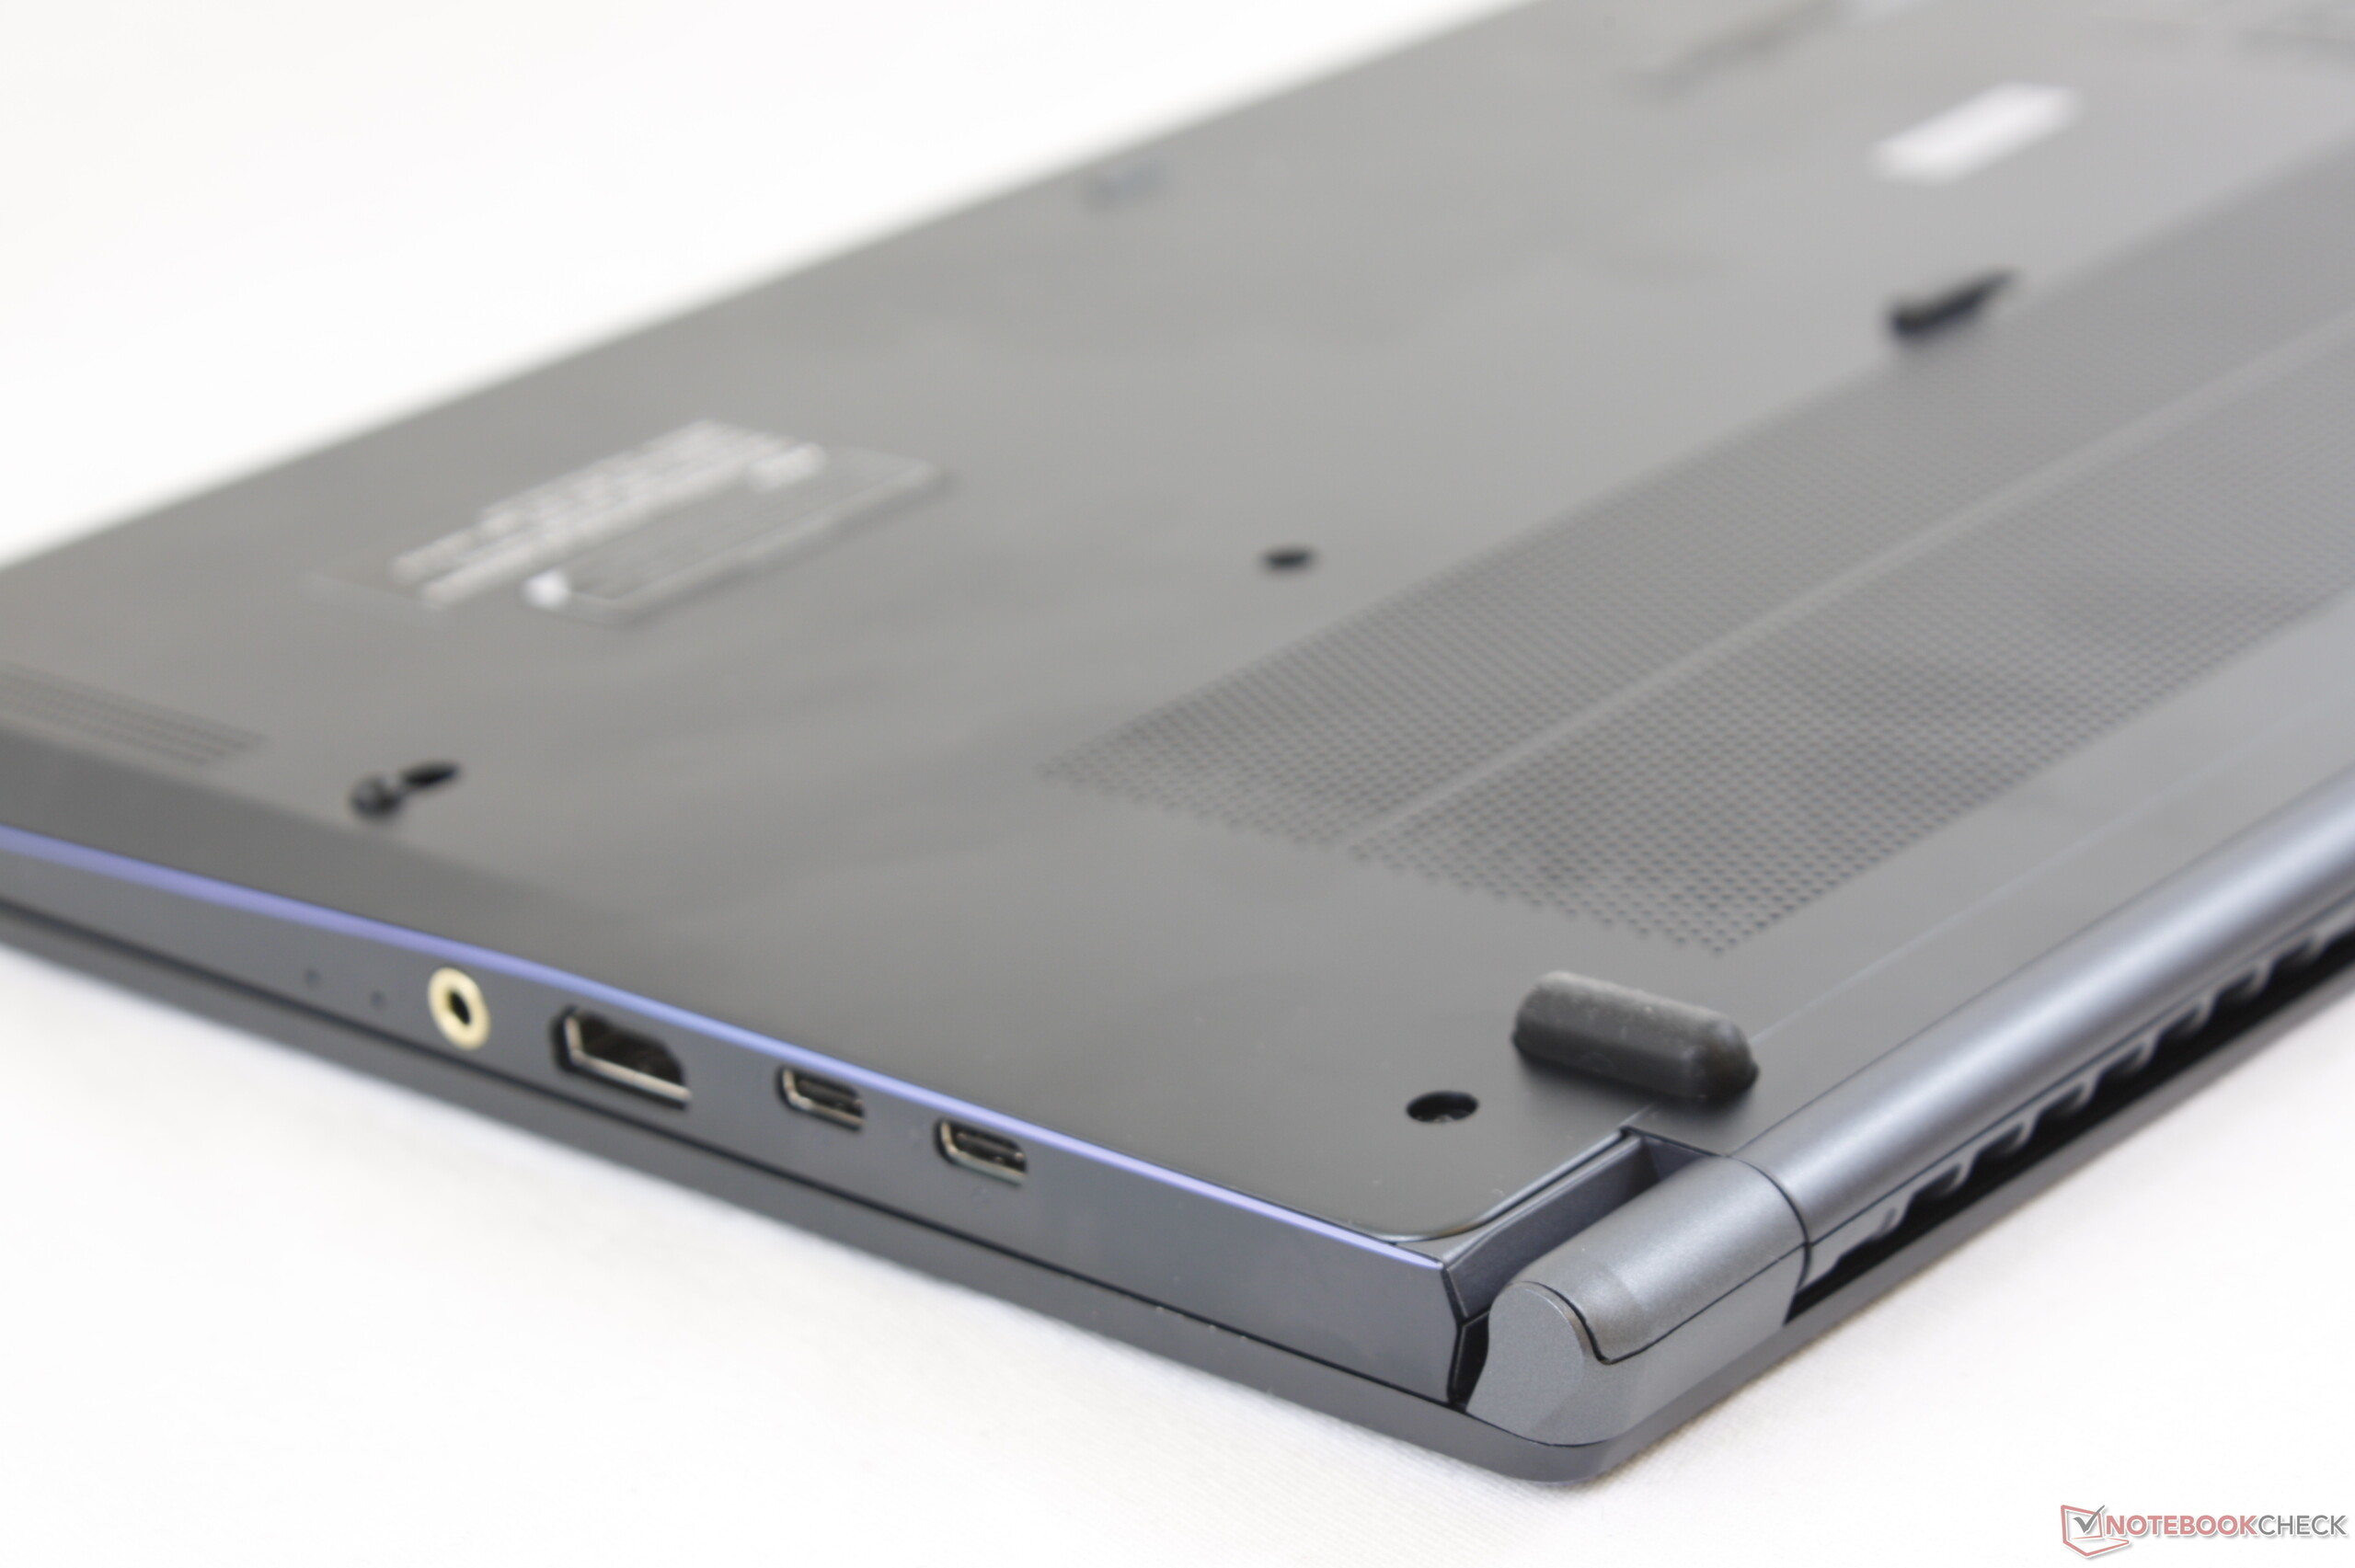
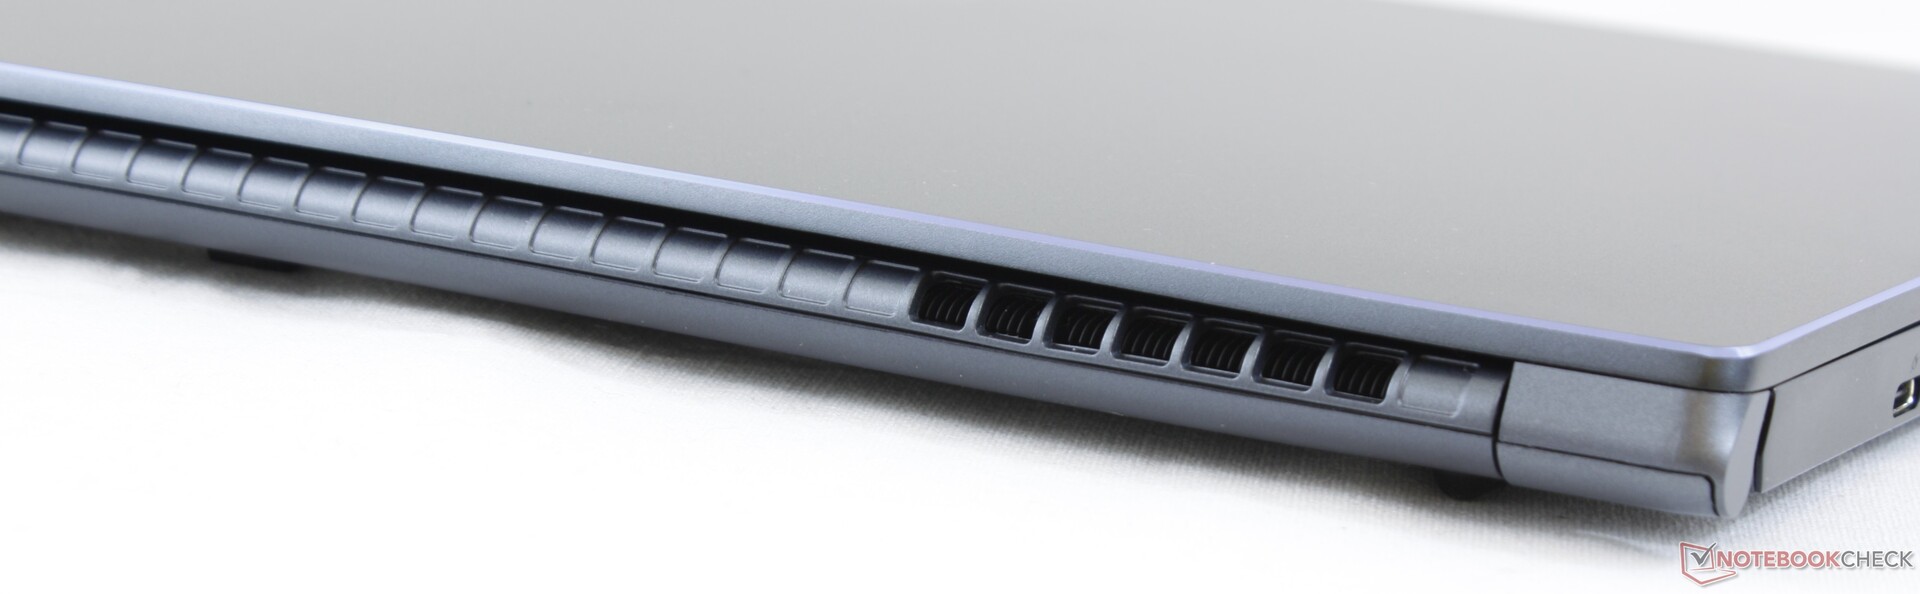
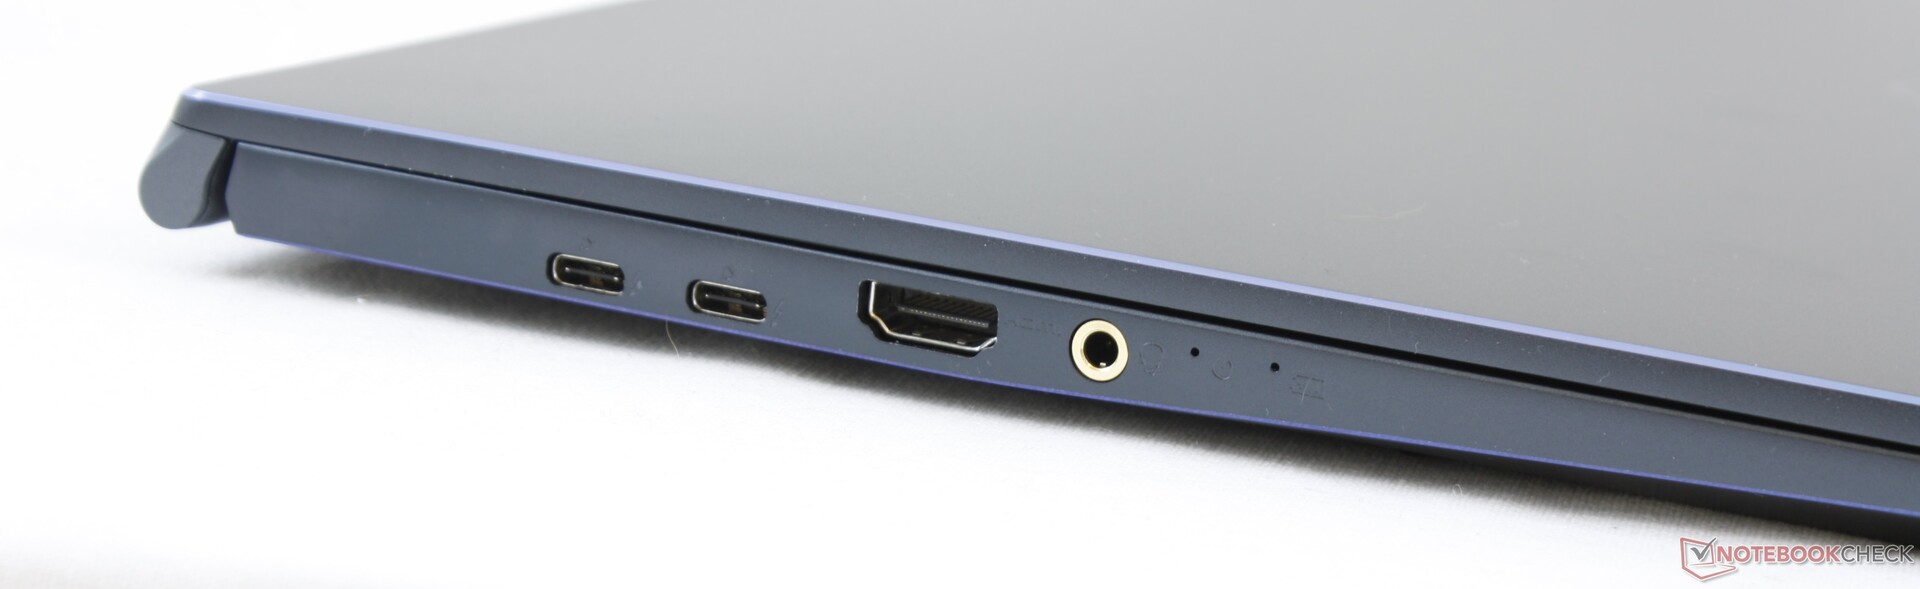
Bağlantı - Port Konumlandırma Daha İyi Olabilir
Prestige 14'teki tüm portlar, Prestige 15'te ancak bir HDMI portu eklenerek bulunabilir. Bağlantı noktası konumlandırma daha iyi olabilirken, sol kenarda USB A Tipi bağlantı noktası olmadığından, Kensington kilidi bulmak biraz hayal kırıklığı yaratıyor.
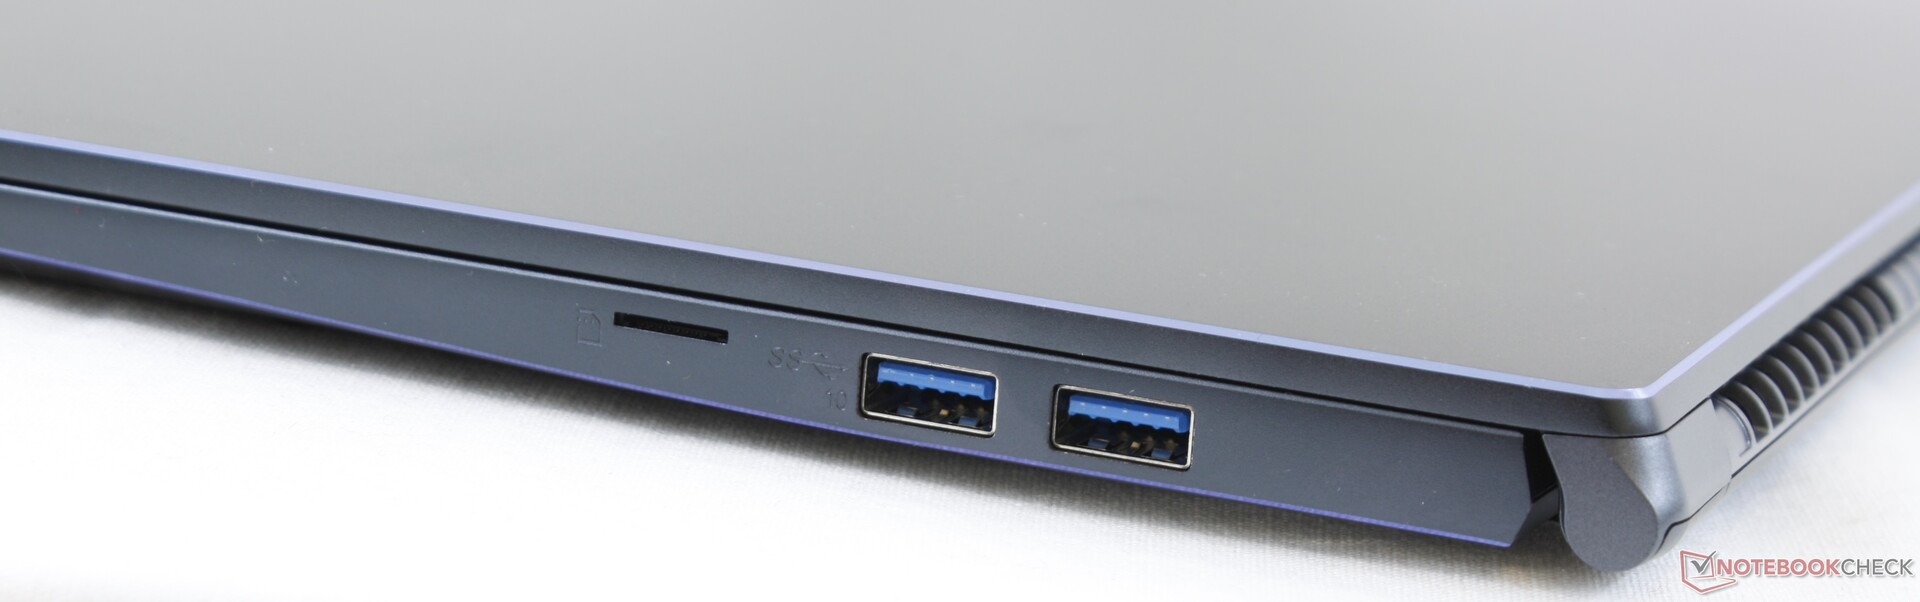
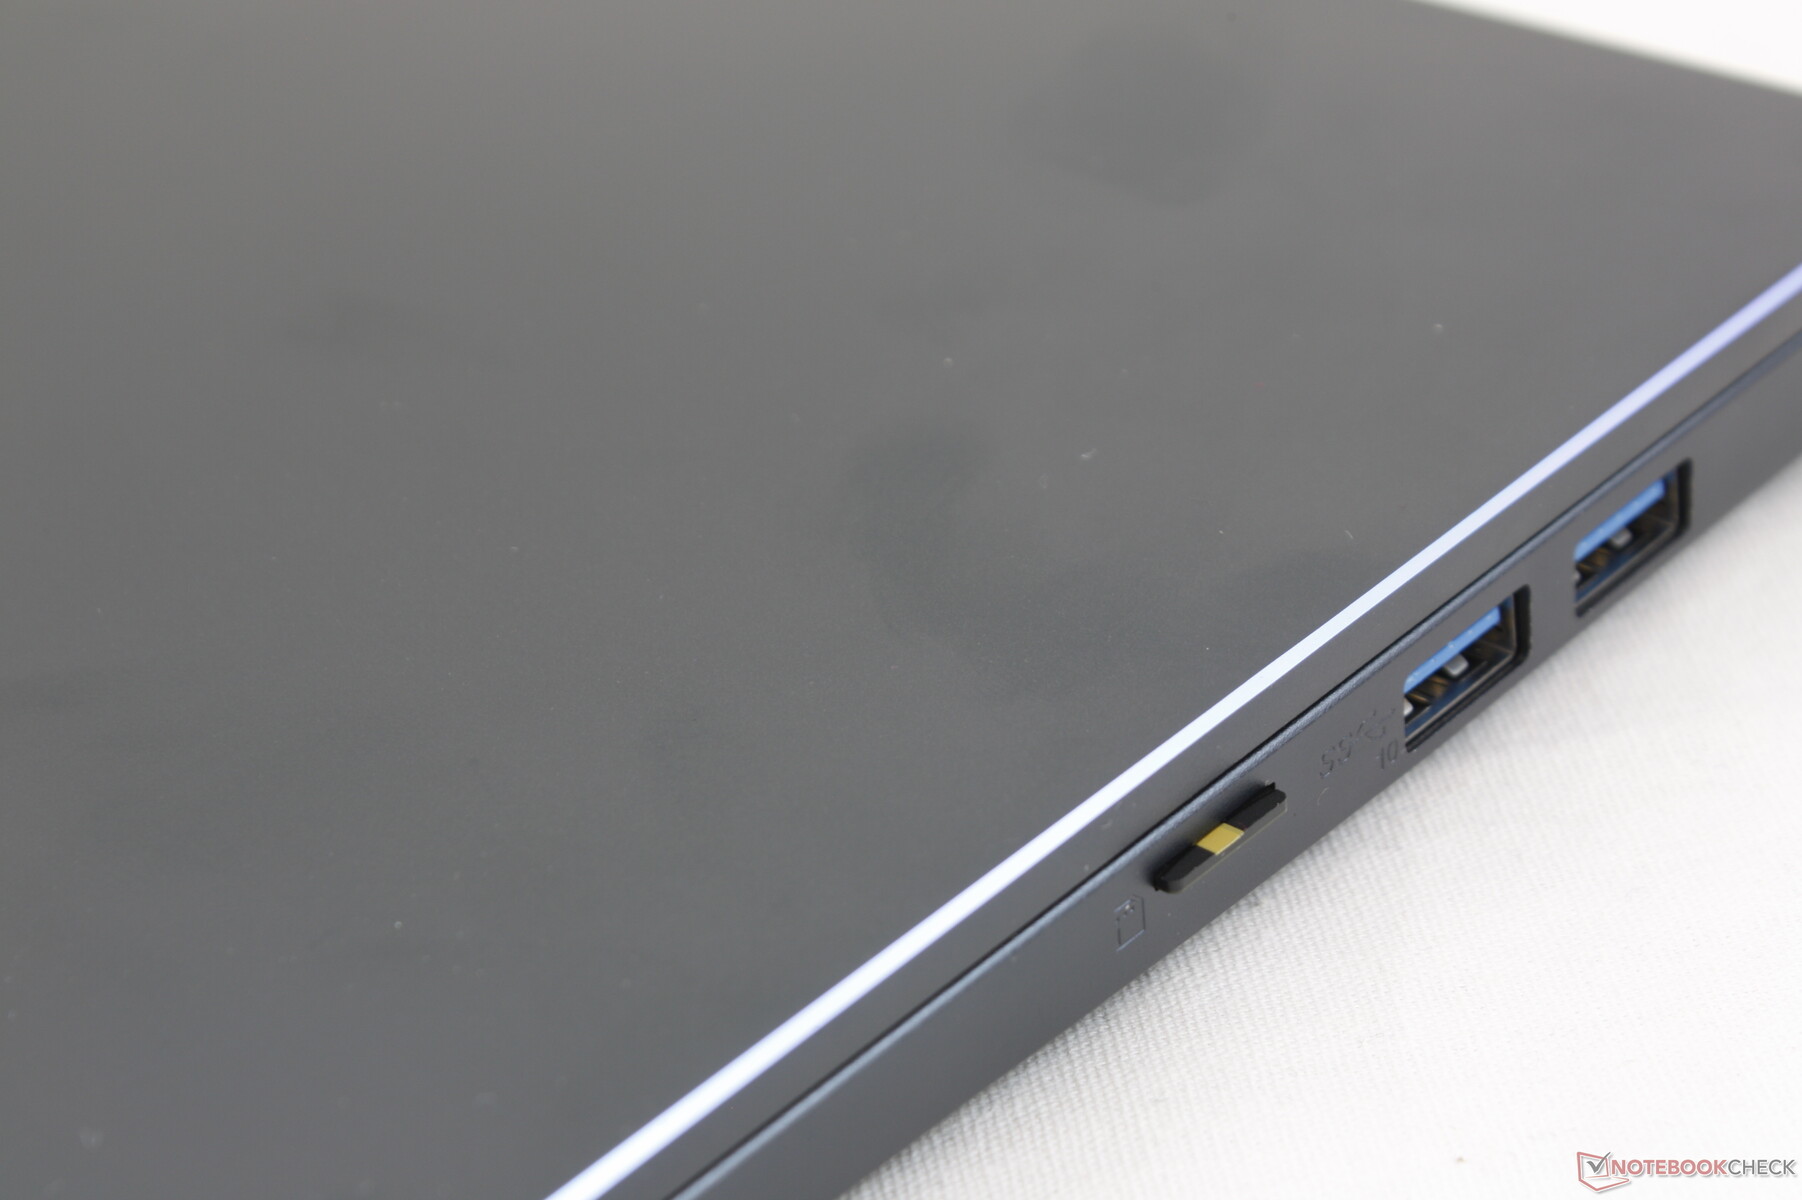
SD Kart Okuyucu
Kullanıcıların, MSI GS serisinde bulunan tam boyutlu SD okuyucular yerine yaylı bir MicroSD okuyucuyla yapılması gerekir. UHS-II test kartımızla transfer oranları hala yaklaşık 200 MB / s.
| SD Card Reader | |
| average JPG Copy Test (av. of 3 runs) | |
| Dell Latitude 5500 (Toshiba Exceria Pro M501 64 GB UHS-II) | |
| Dell Precision 5530 Xeon E-2176M (Toshiba Exceria Pro SDXC 64 GB UHS-II) | |
| MSI Prestige 15 A10SC (Toshiba Exceria Pro M501 UHS-II) | |
| Lenovo ThinkPad T590-20N4002VGE (Toshiba Exceria Pro M501 UHS-II) | |
| maximum AS SSD Seq Read Test (1GB) | |
| Dell Latitude 5500 (Toshiba Exceria Pro M501 64 GB UHS-II) | |
| MSI Prestige 15 A10SC (Toshiba Exceria Pro M501 UHS-II) | |
| Dell Precision 5530 Xeon E-2176M (Toshiba Exceria Pro SDXC 64 GB UHS-II) | |
| Lenovo ThinkPad T590-20N4002VGE (Toshiba Exceria Pro M501 UHS-II) | |
İletişim
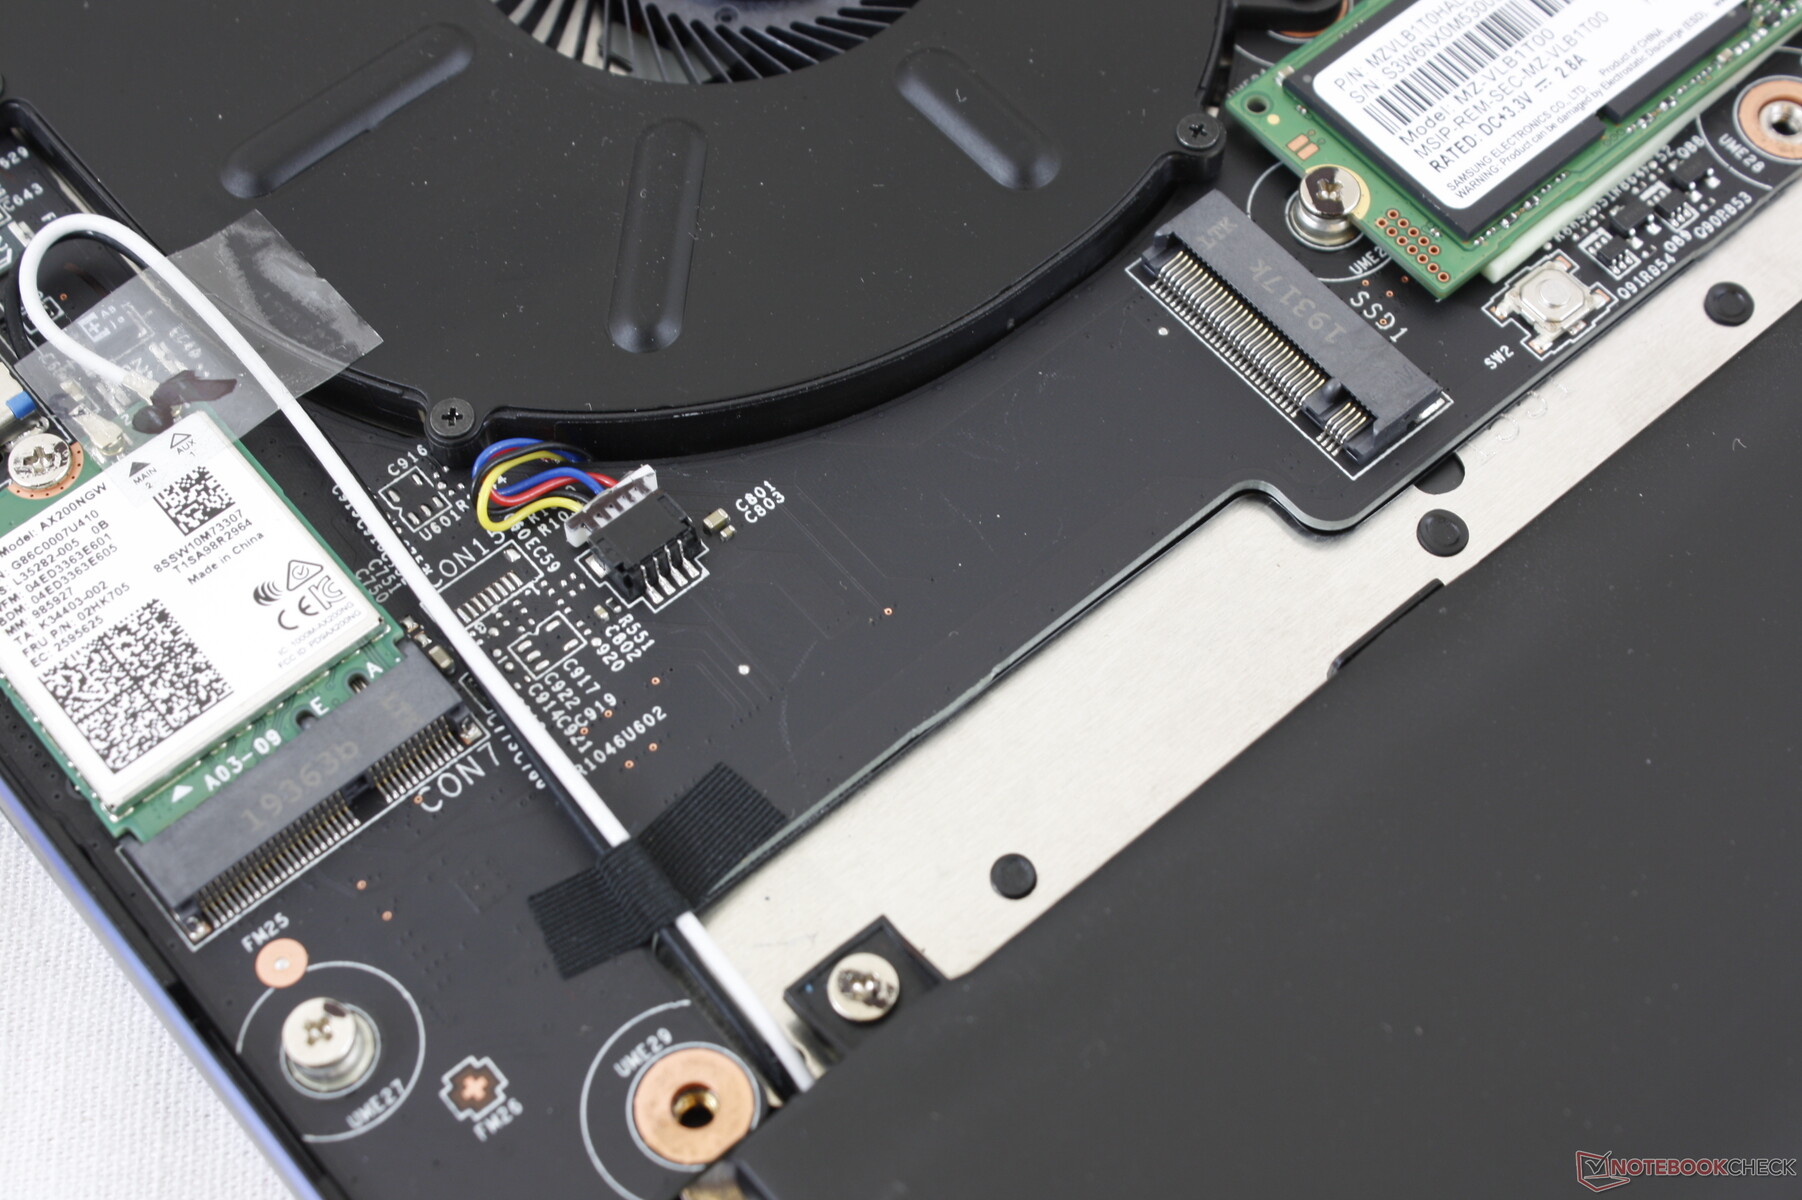
Intel AX200, Wi-Fi 6 ve Bluetooth 5 bağlantısı için standart olarak geliyor. Ünite ile yaptığımız süre boyunca kablosuz sorun yaşamadık.
| Networking | |
| iperf3 transmit AX12 | |
| MSI Prestige 15 A10SC | |
| Lenovo ThinkPad T590-20N4002VGE | |
| MSI P65 Creator 9SF-657 | |
| Dell Latitude 5500 | |
| HP EliteBook 755 G5 3UN79EA | |
| iperf3 receive AX12 | |
| MSI Prestige 15 A10SC | |
| Lenovo ThinkPad T590-20N4002VGE | |
| Dell Latitude 5500 | |
| MSI P65 Creator 9SF-657 | |
| HP EliteBook 755 G5 3UN79EA | |
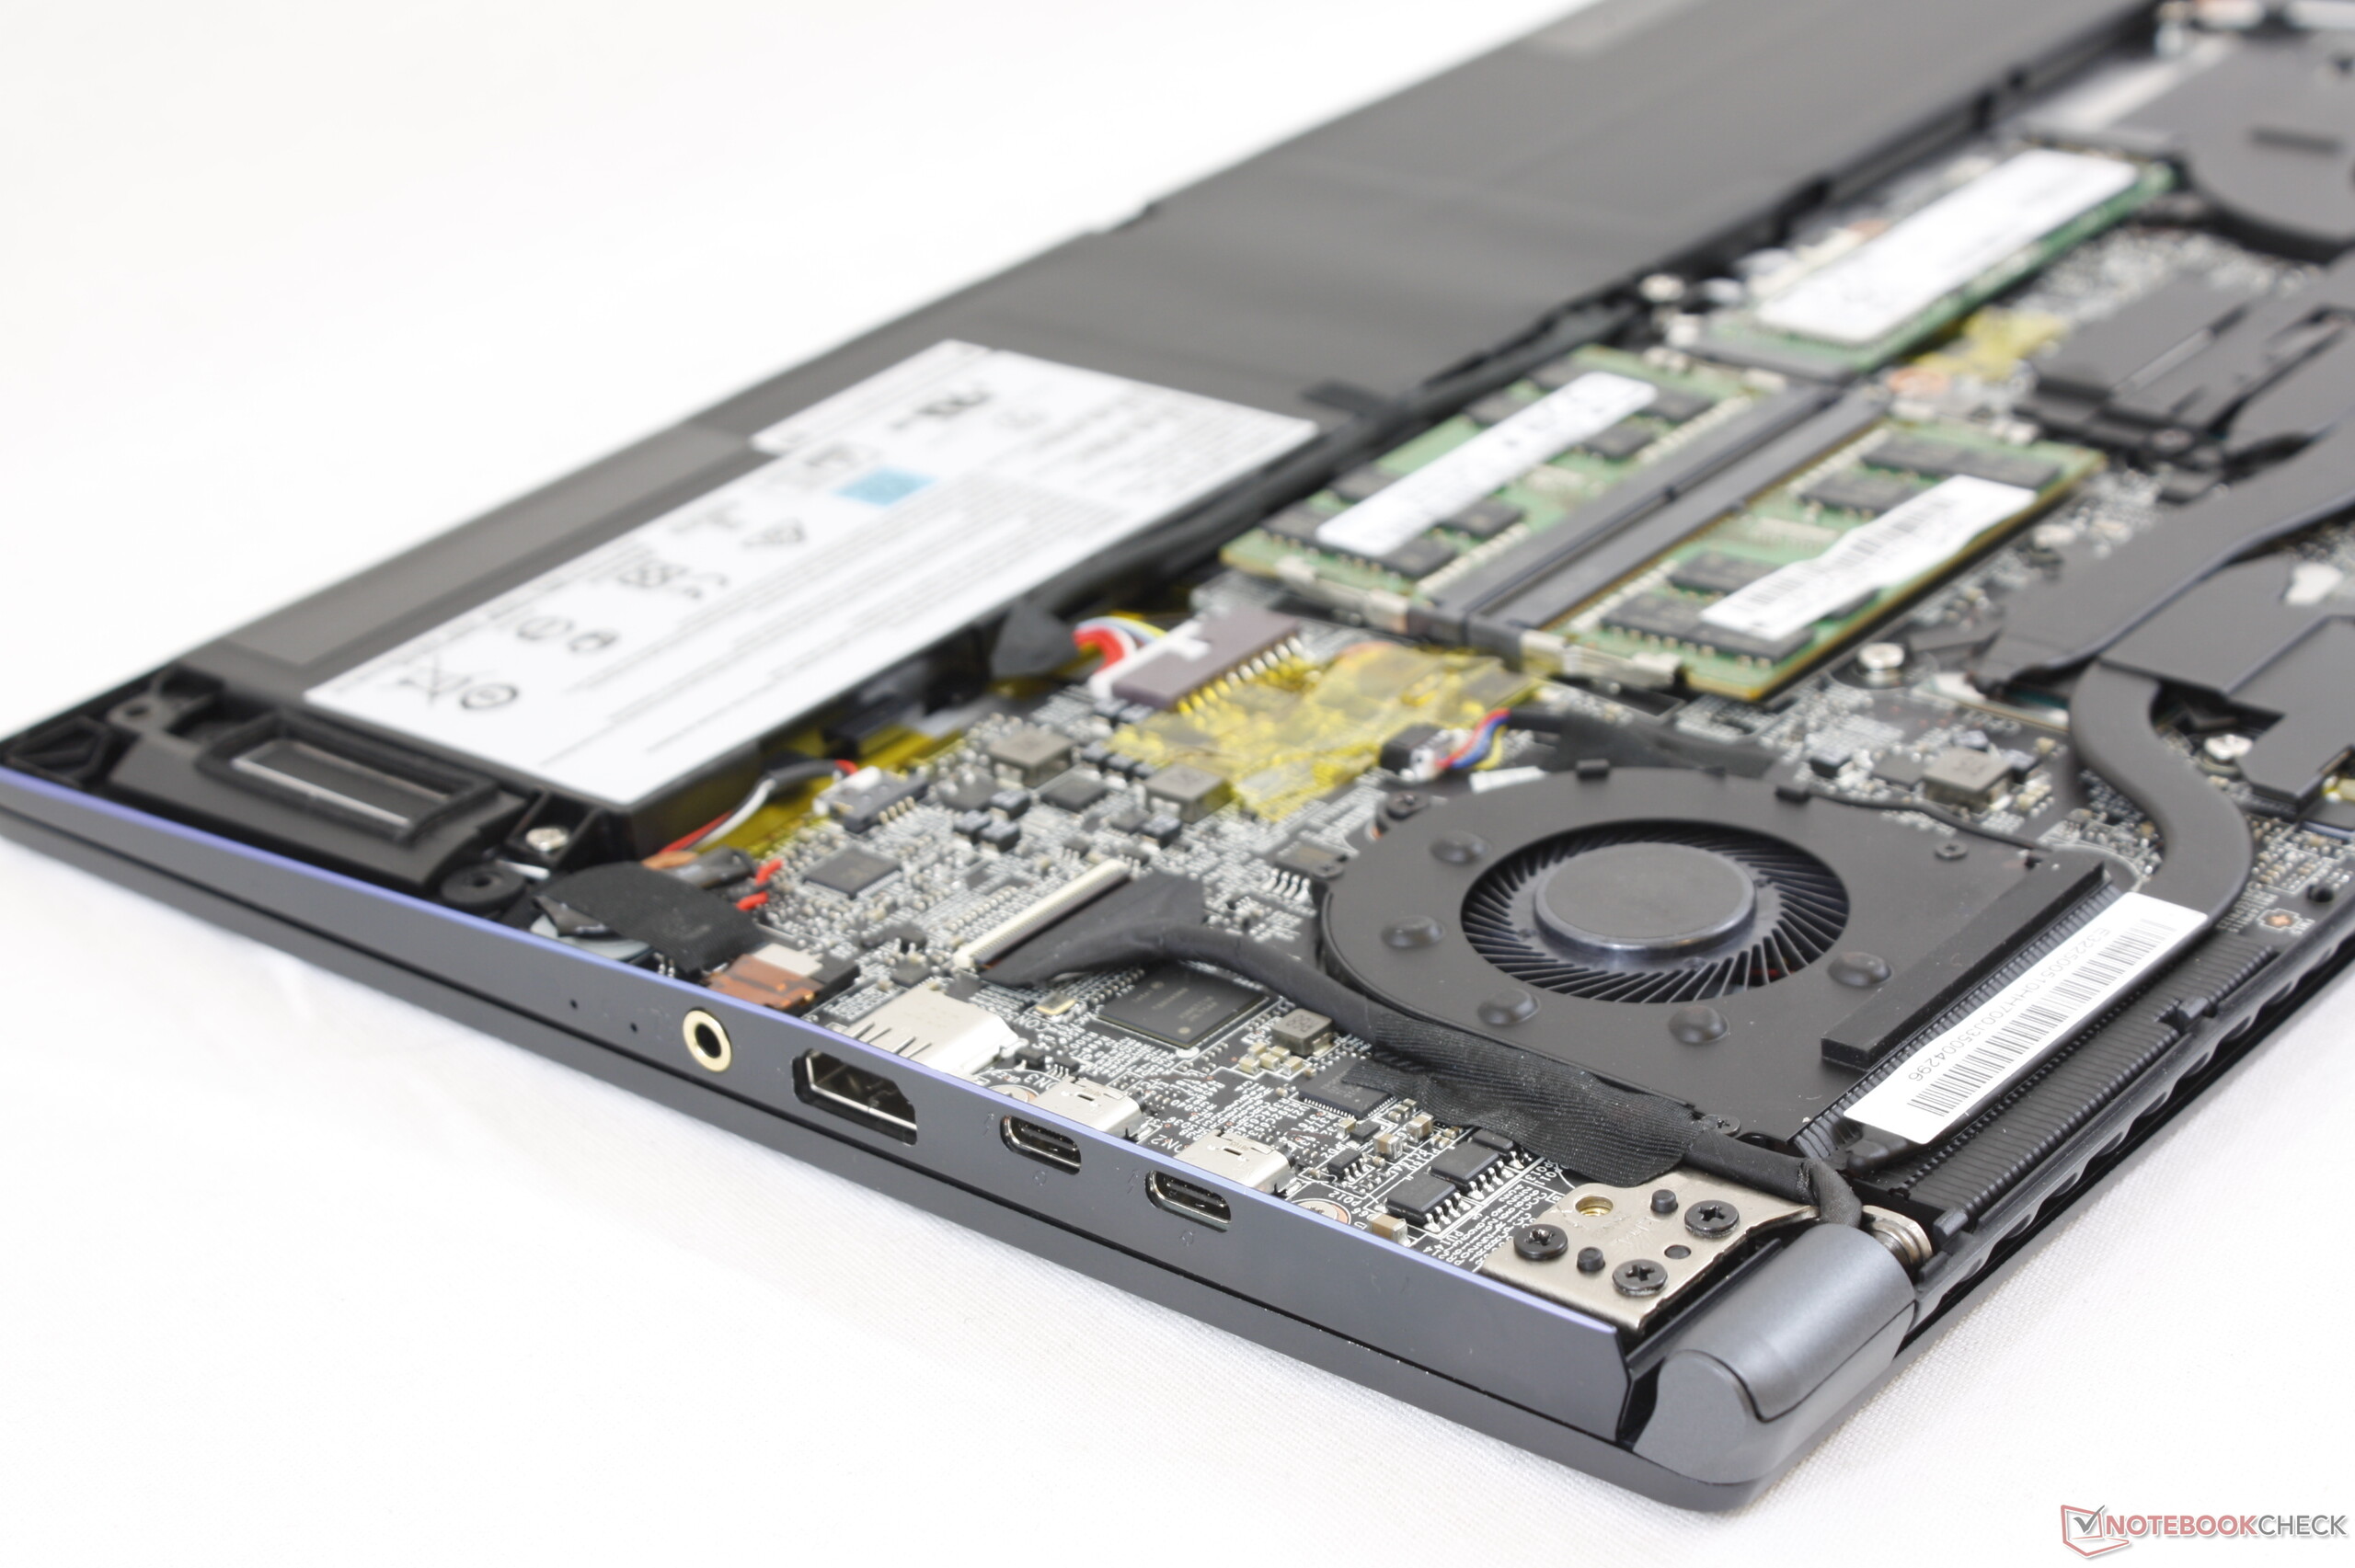
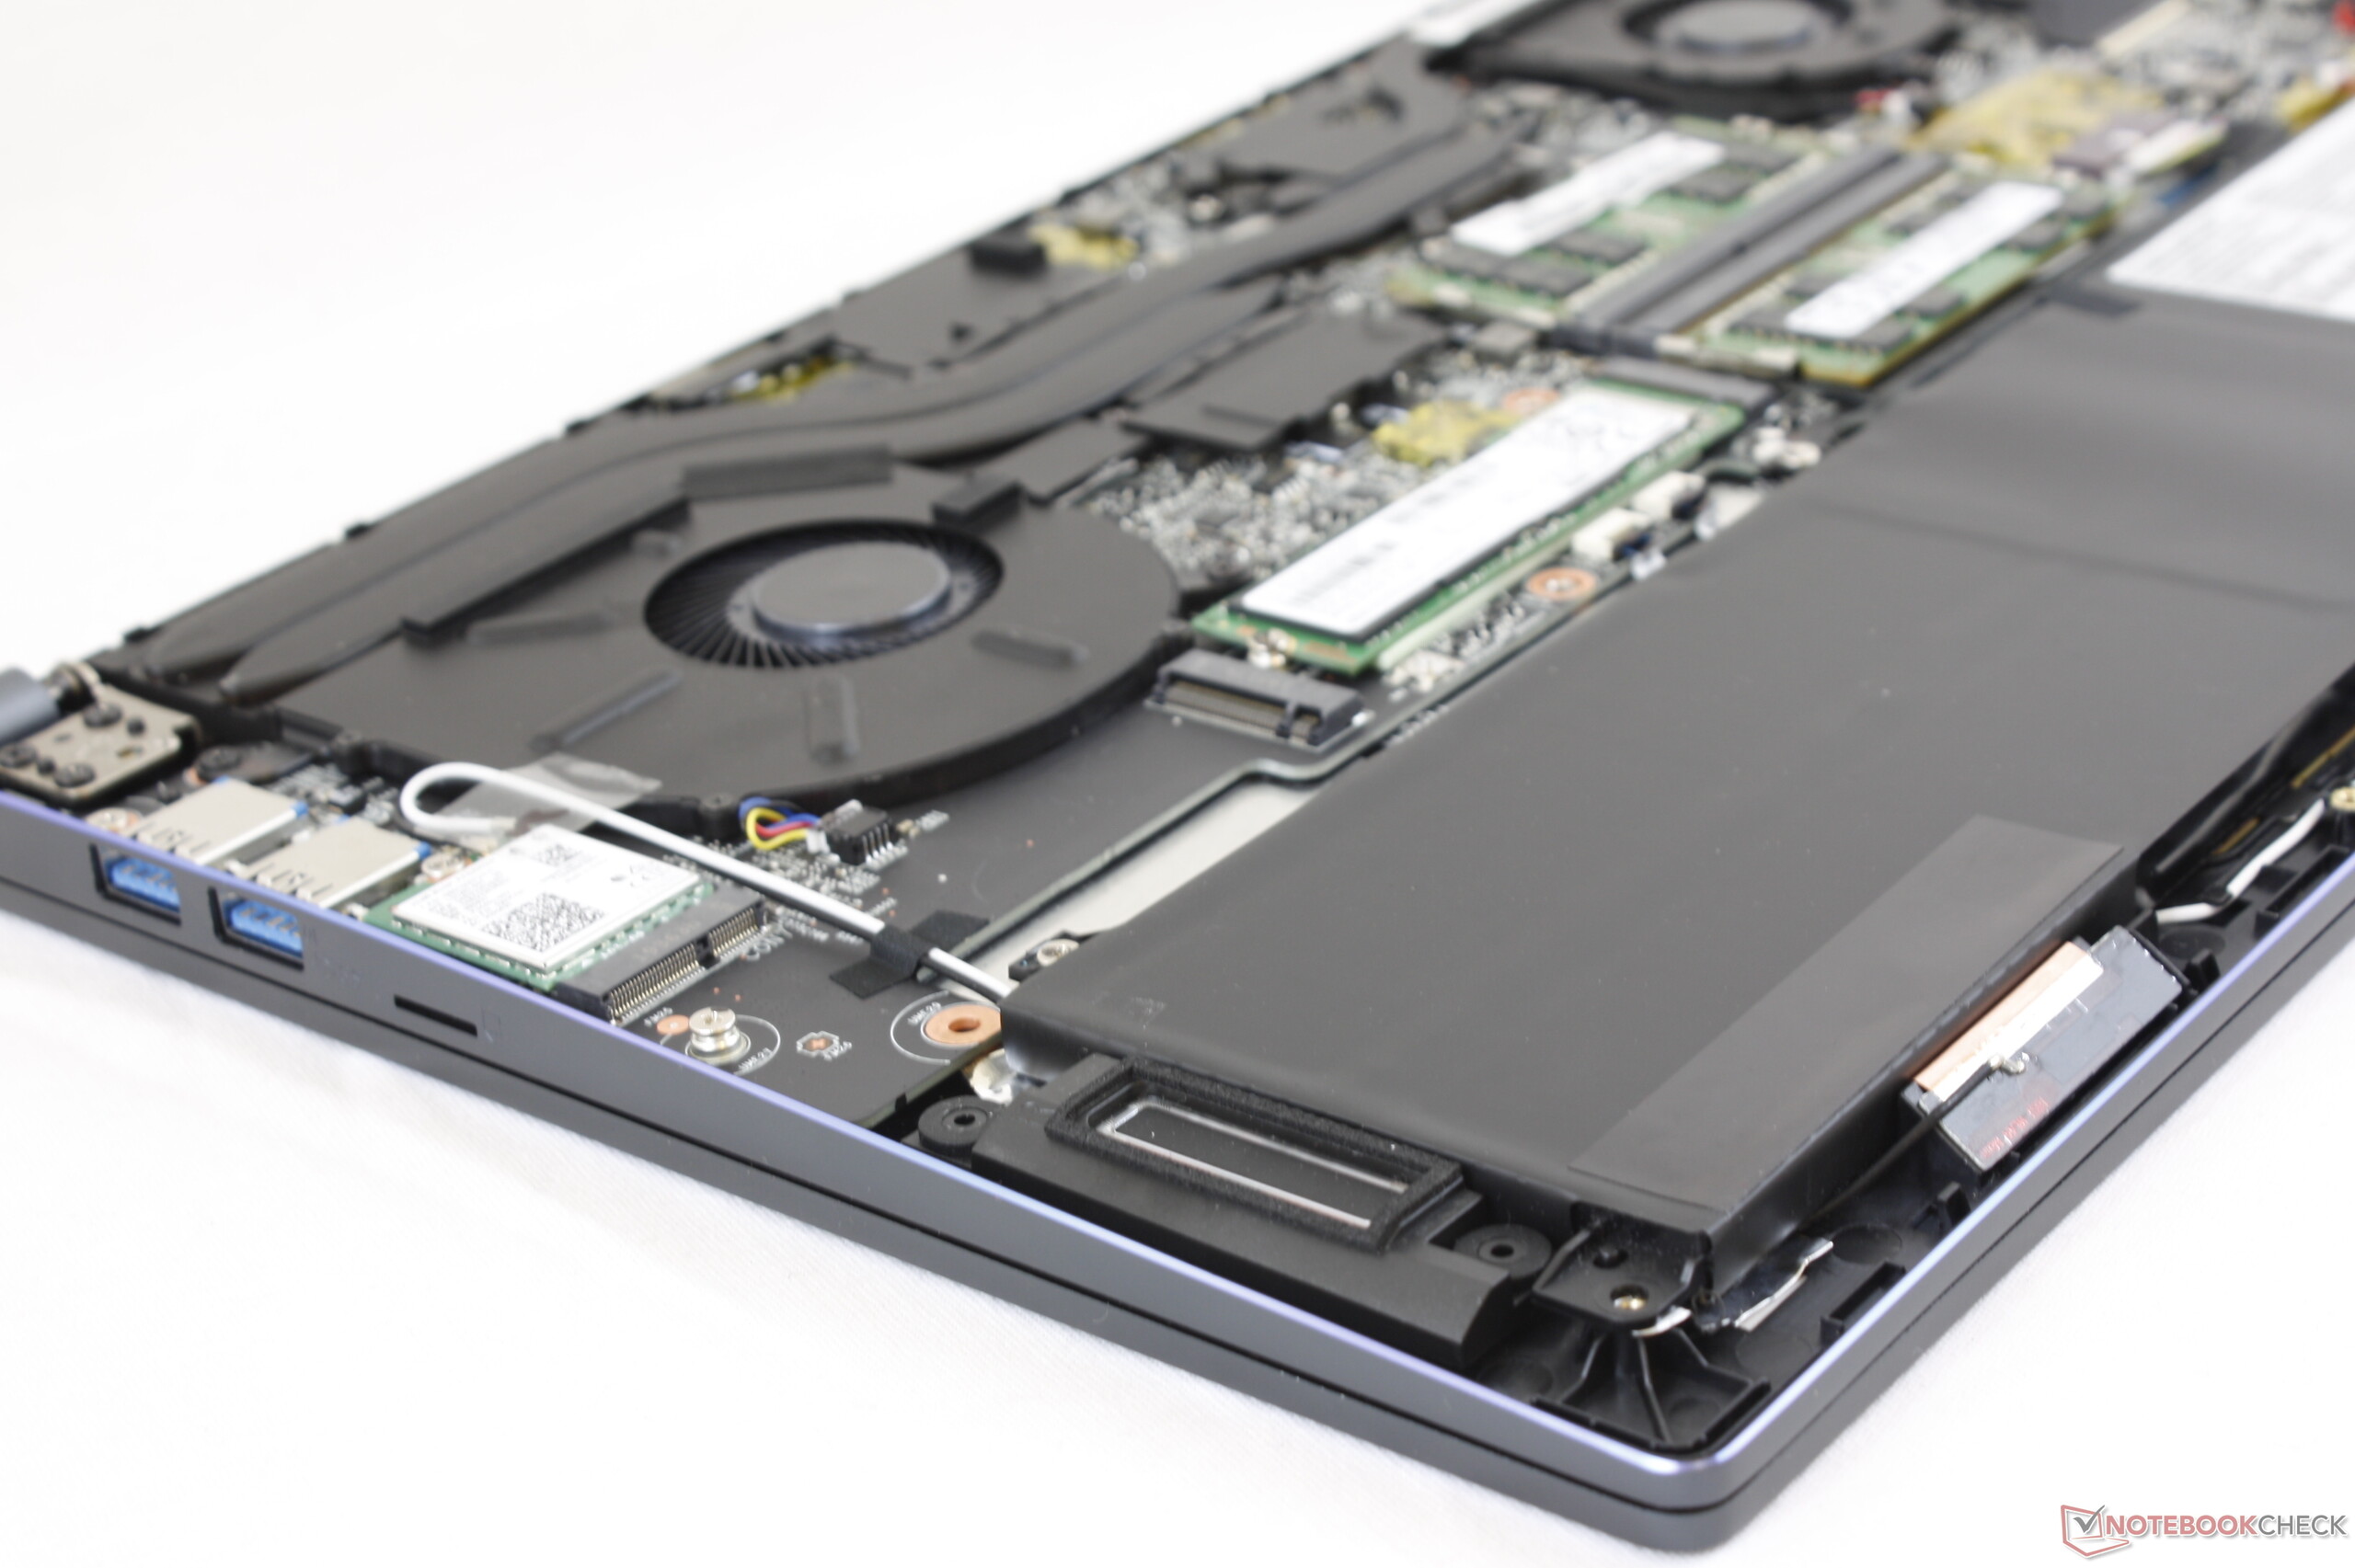
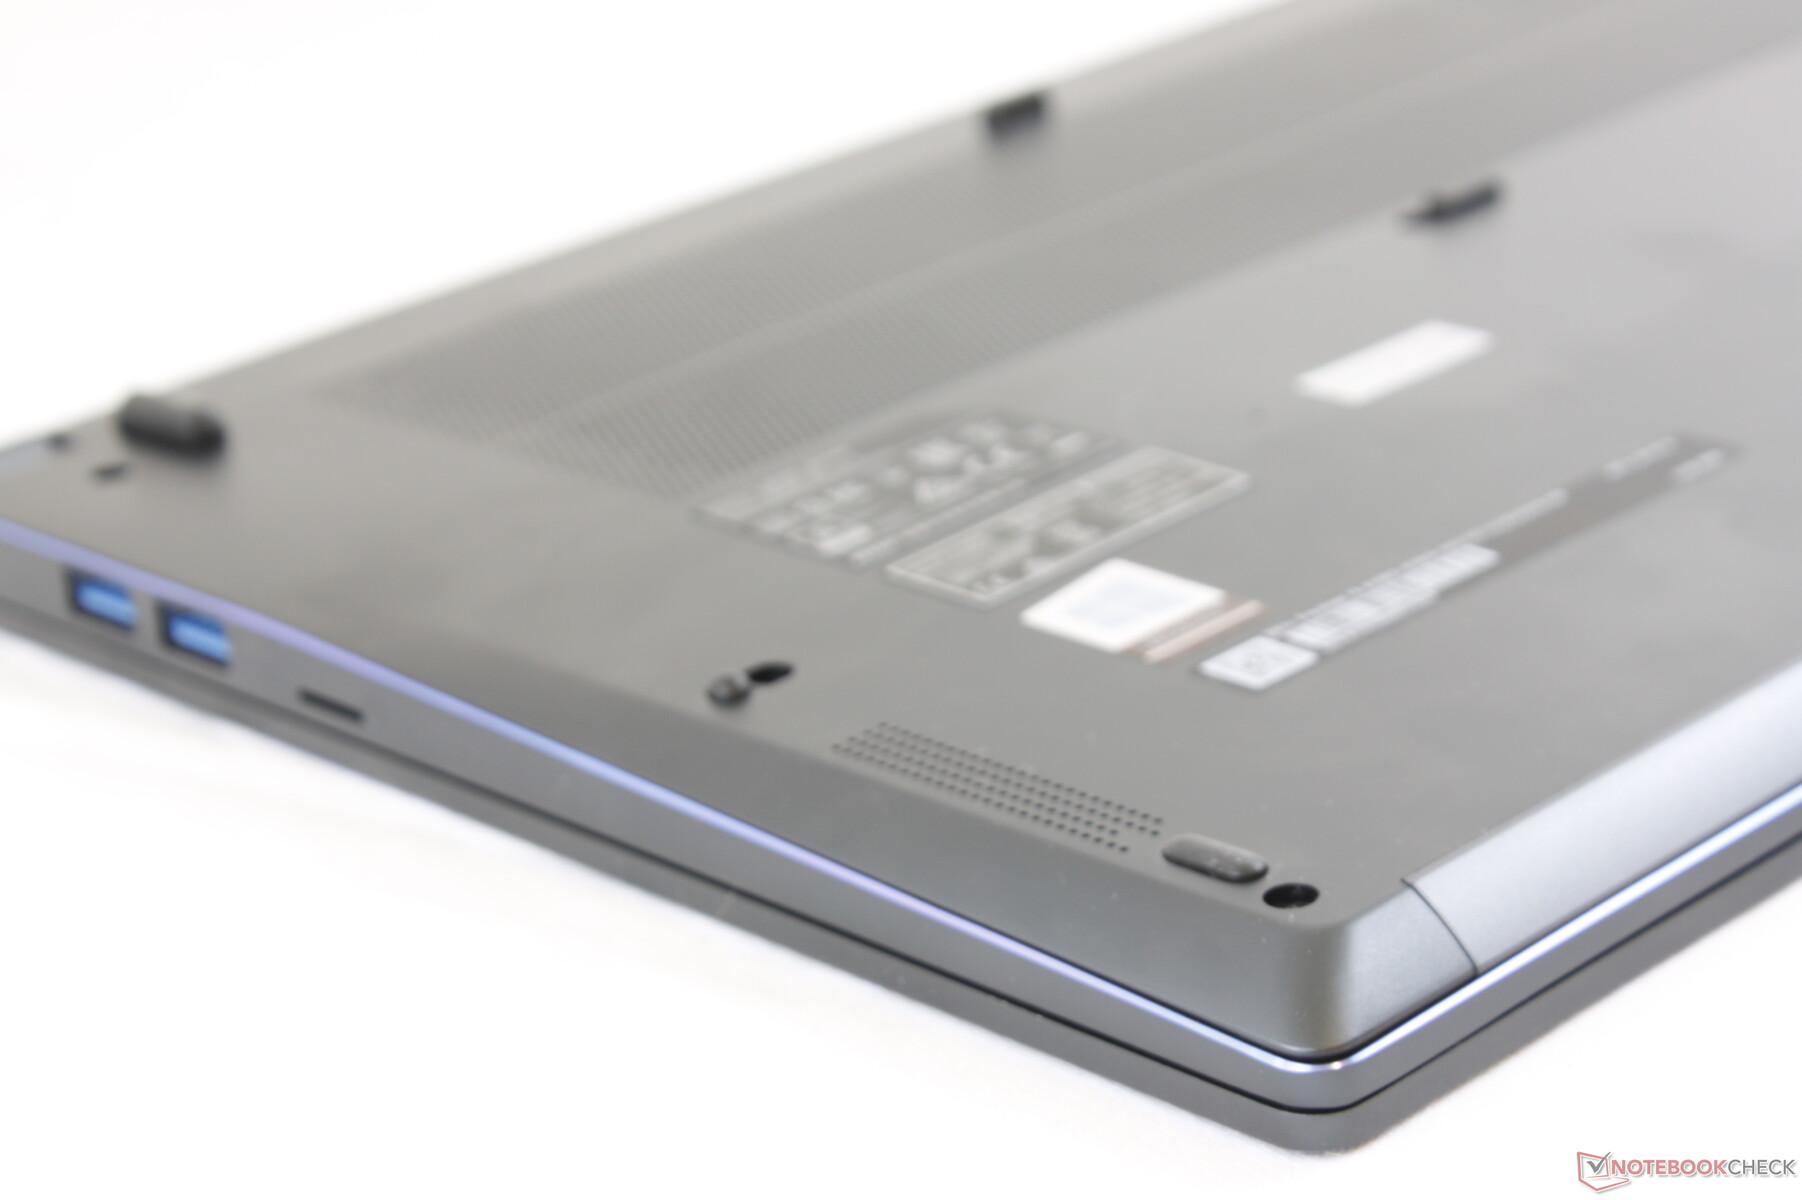
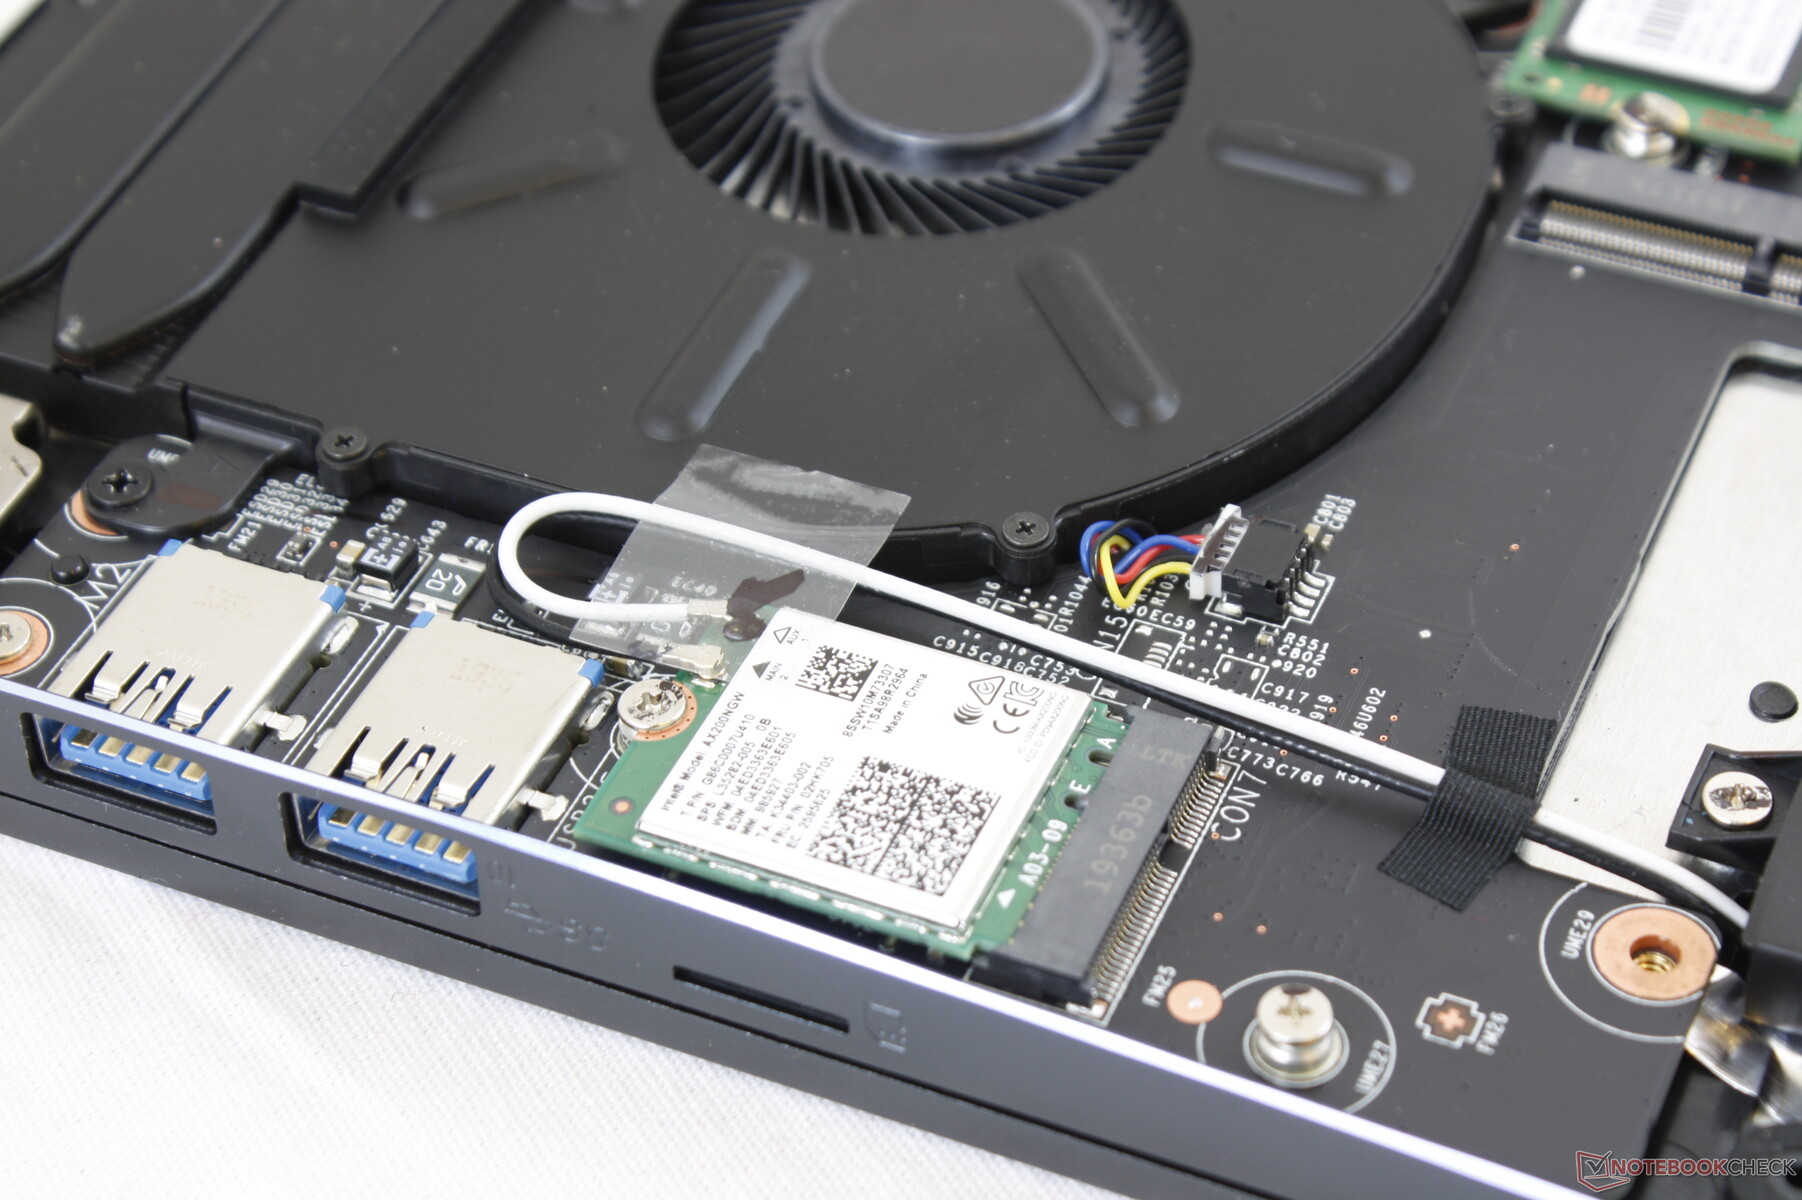
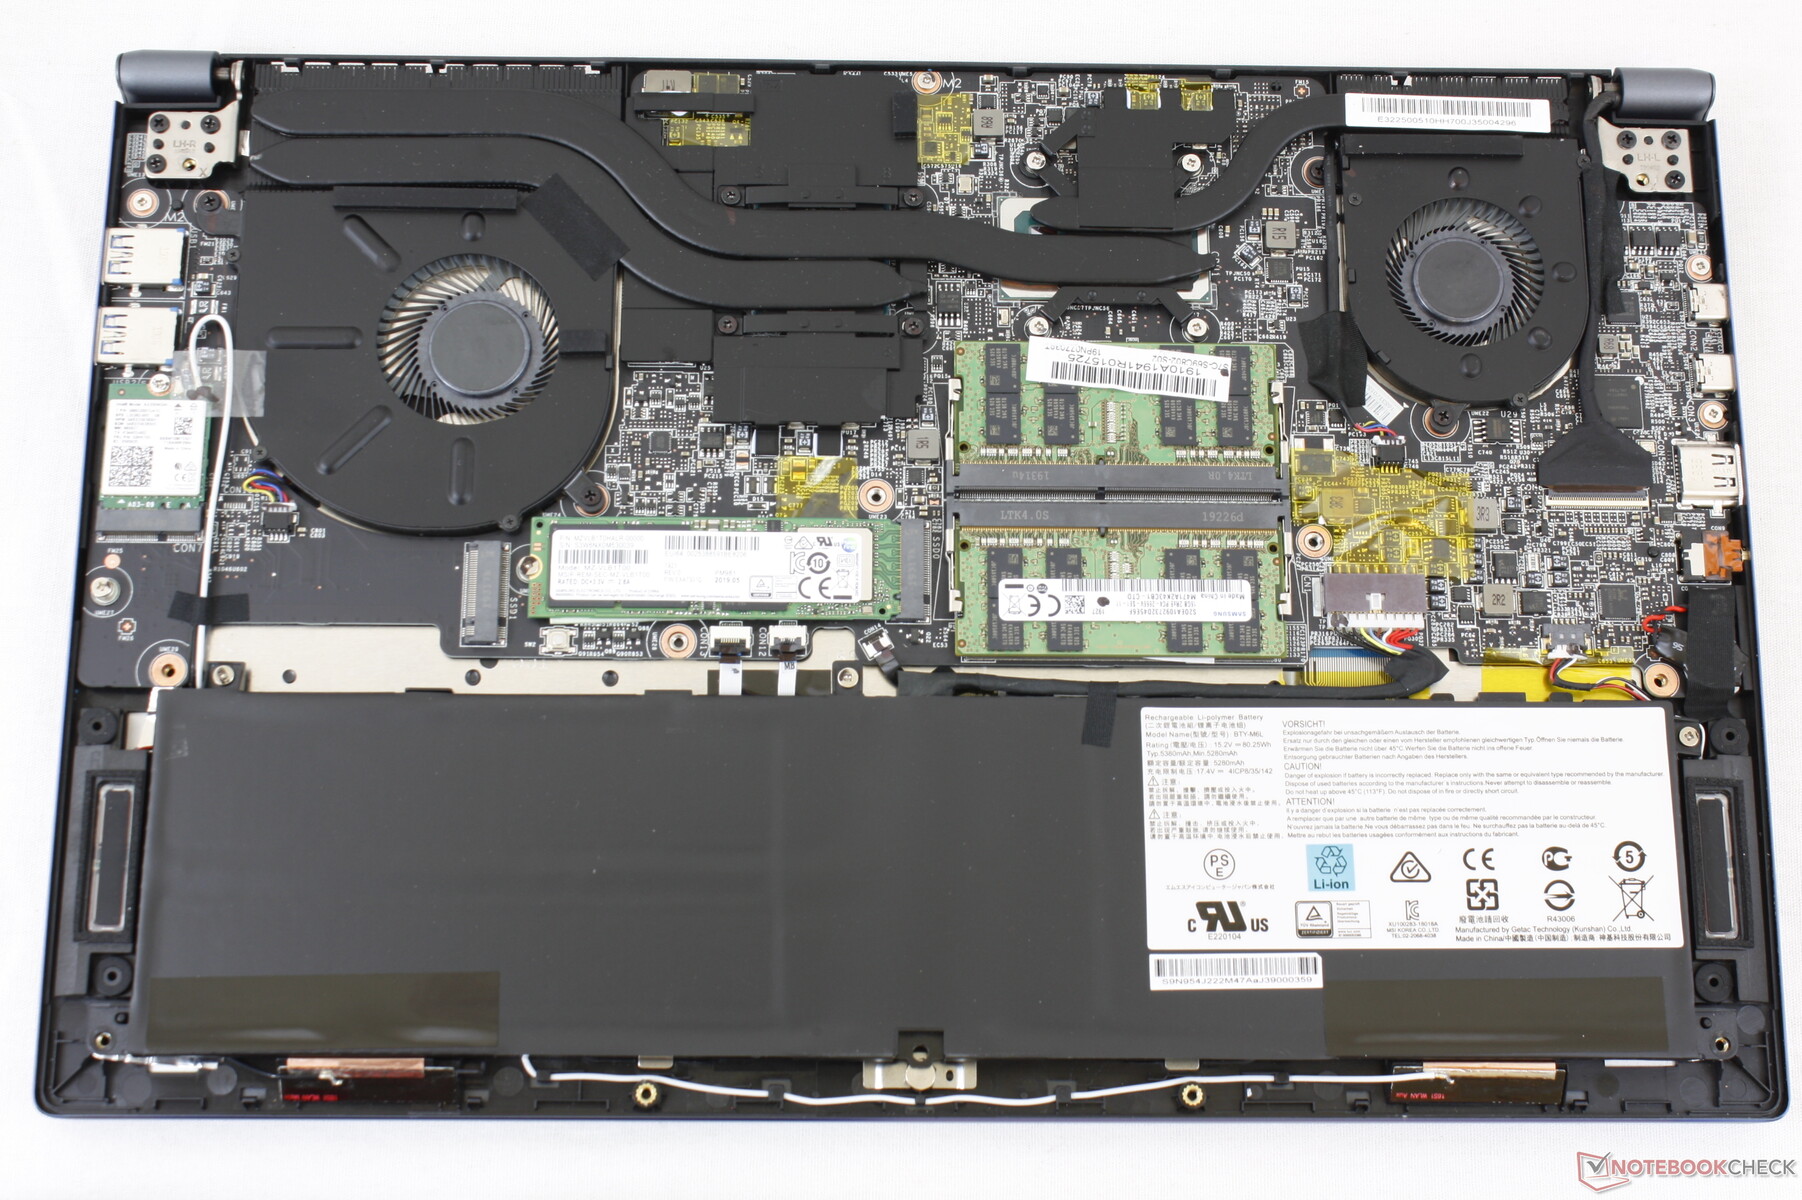
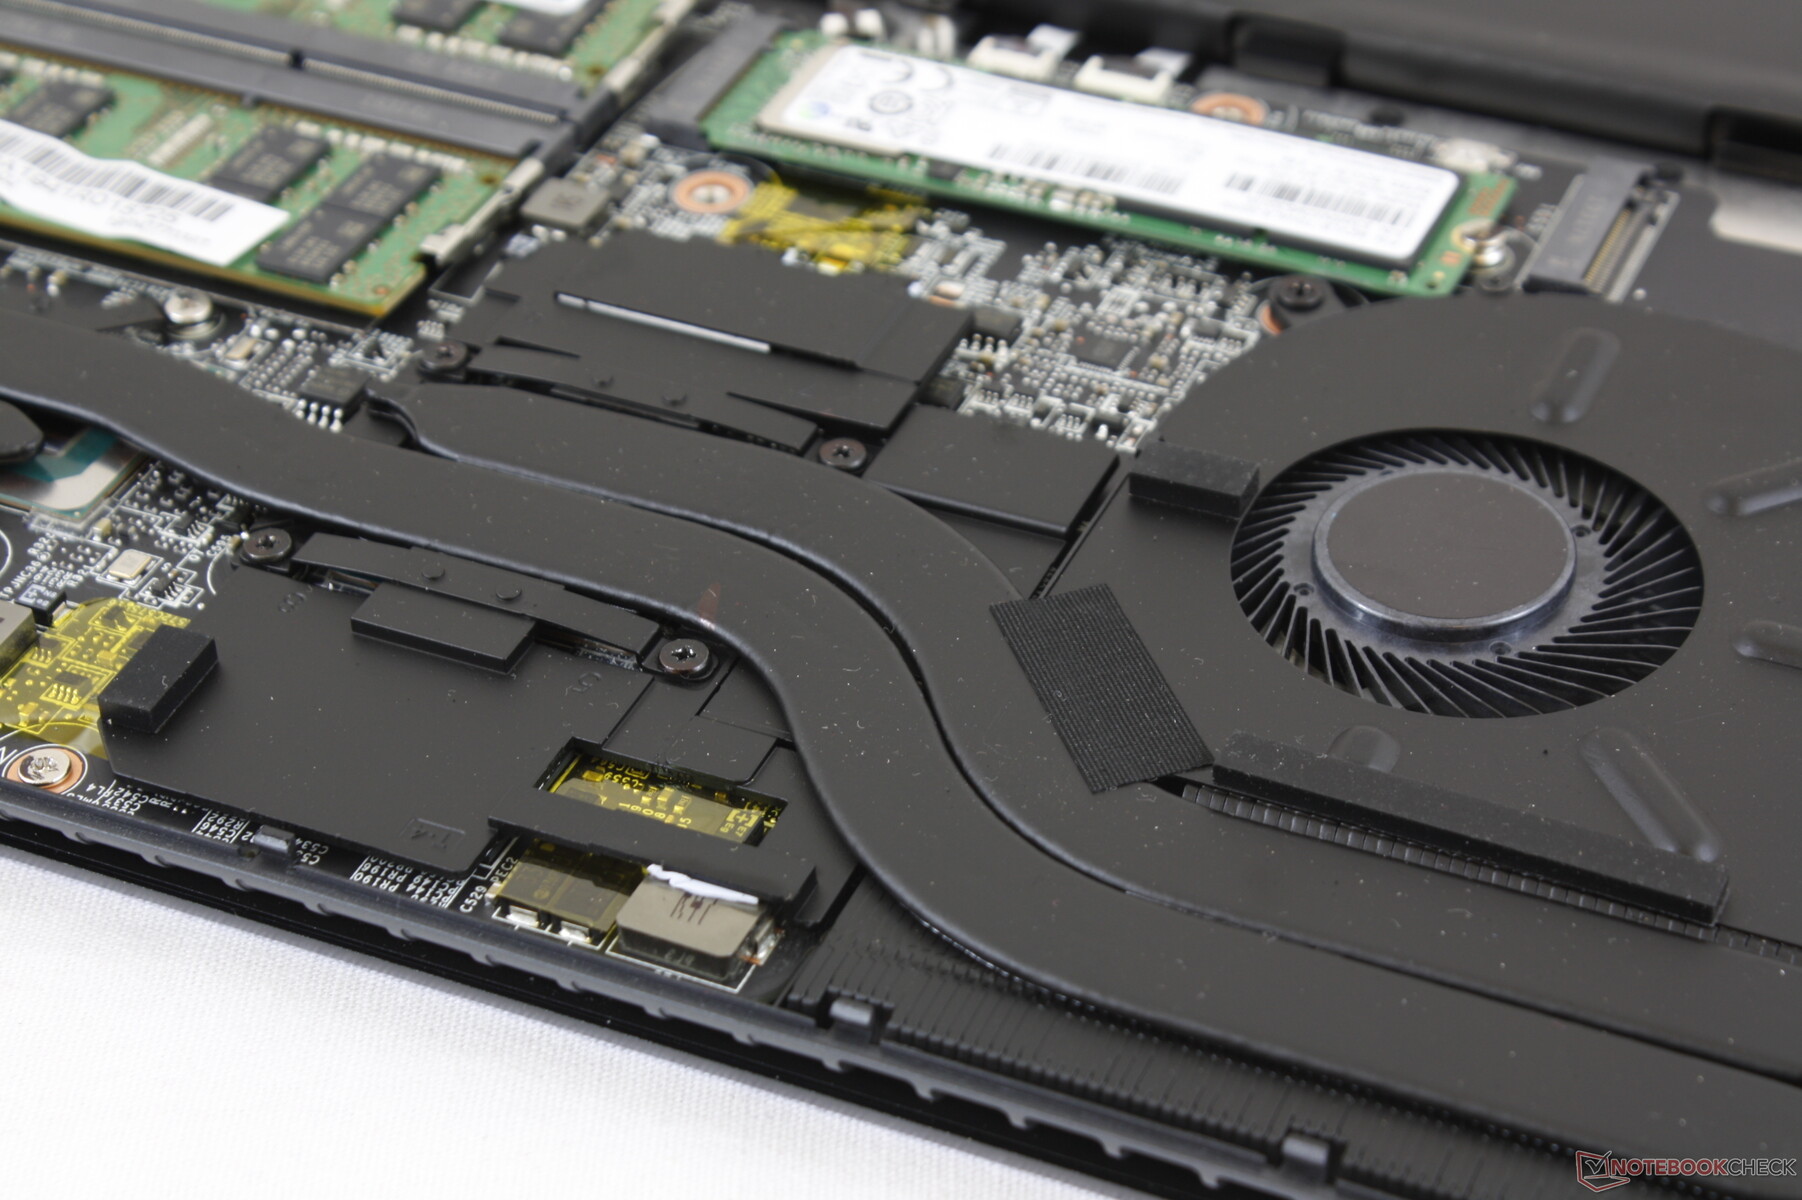
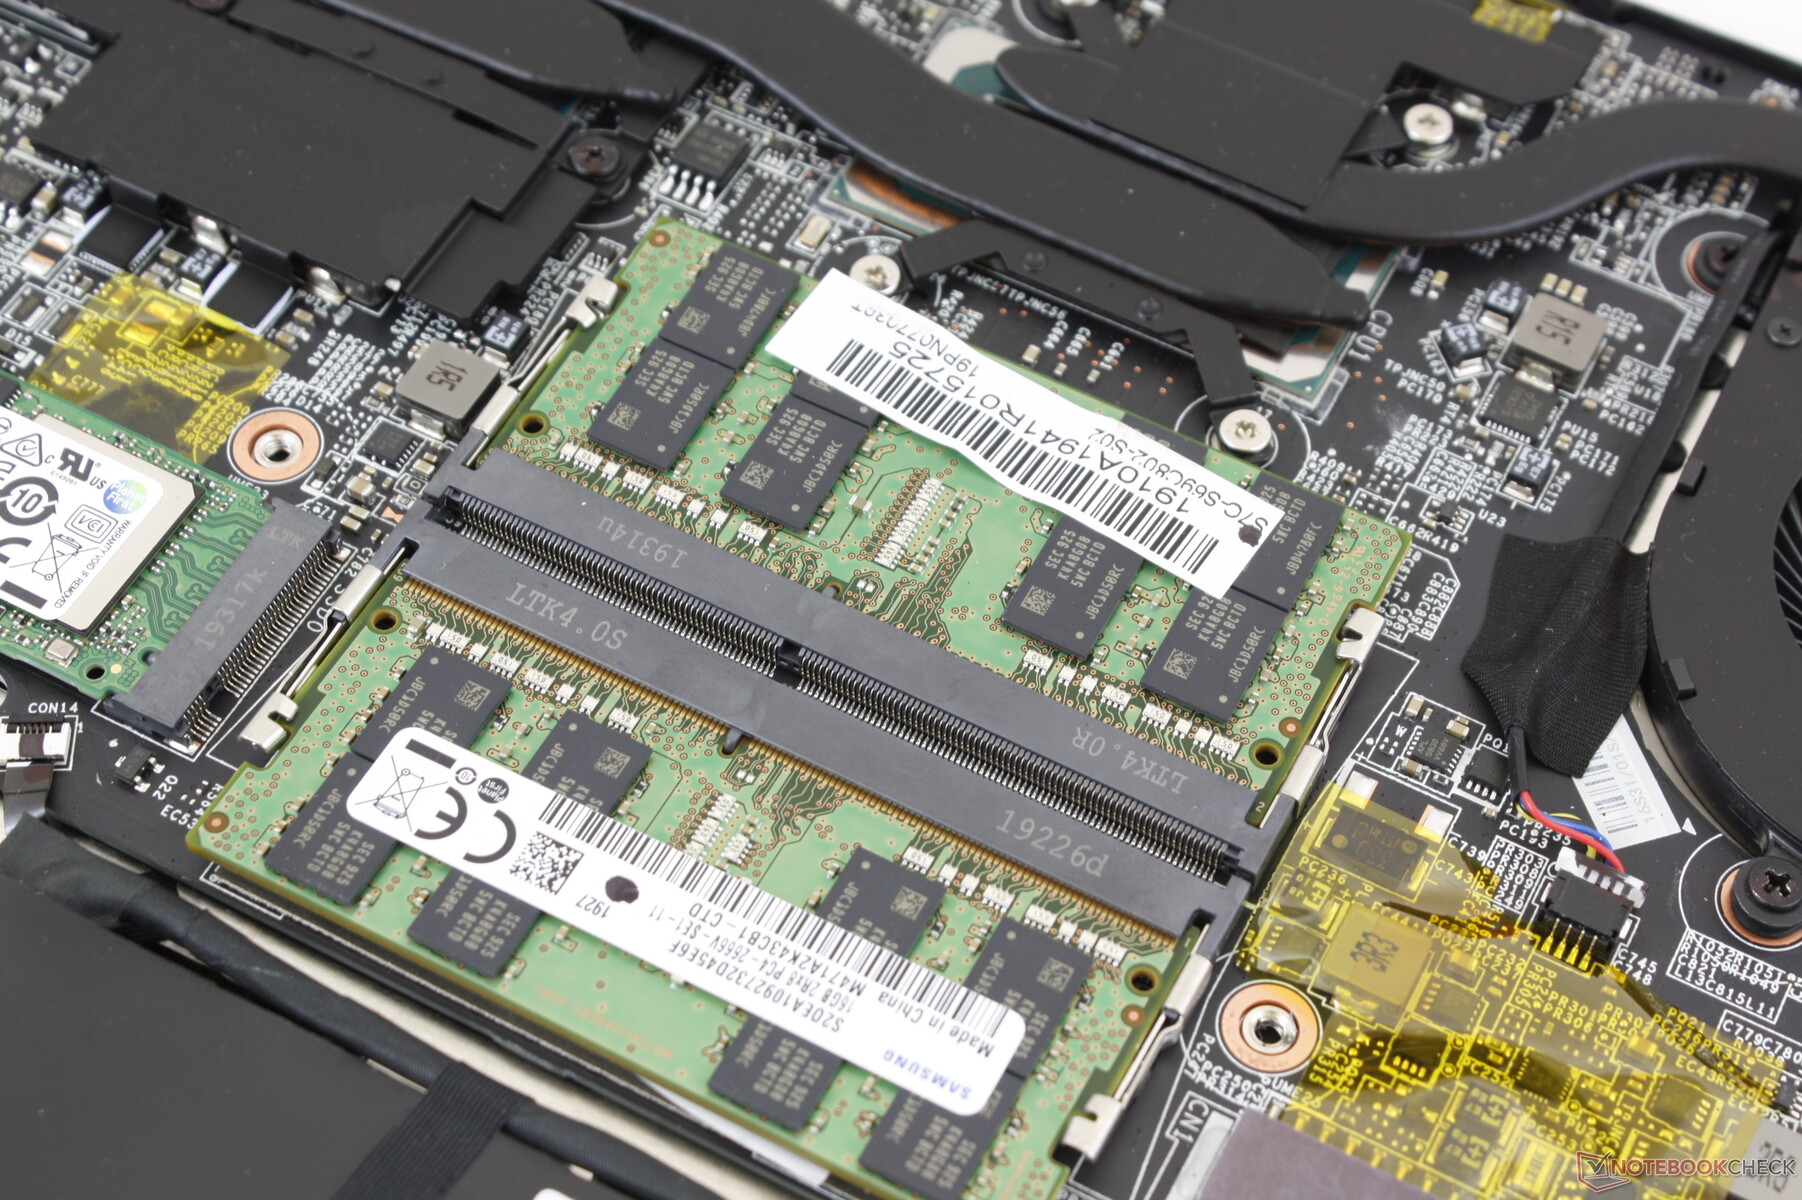
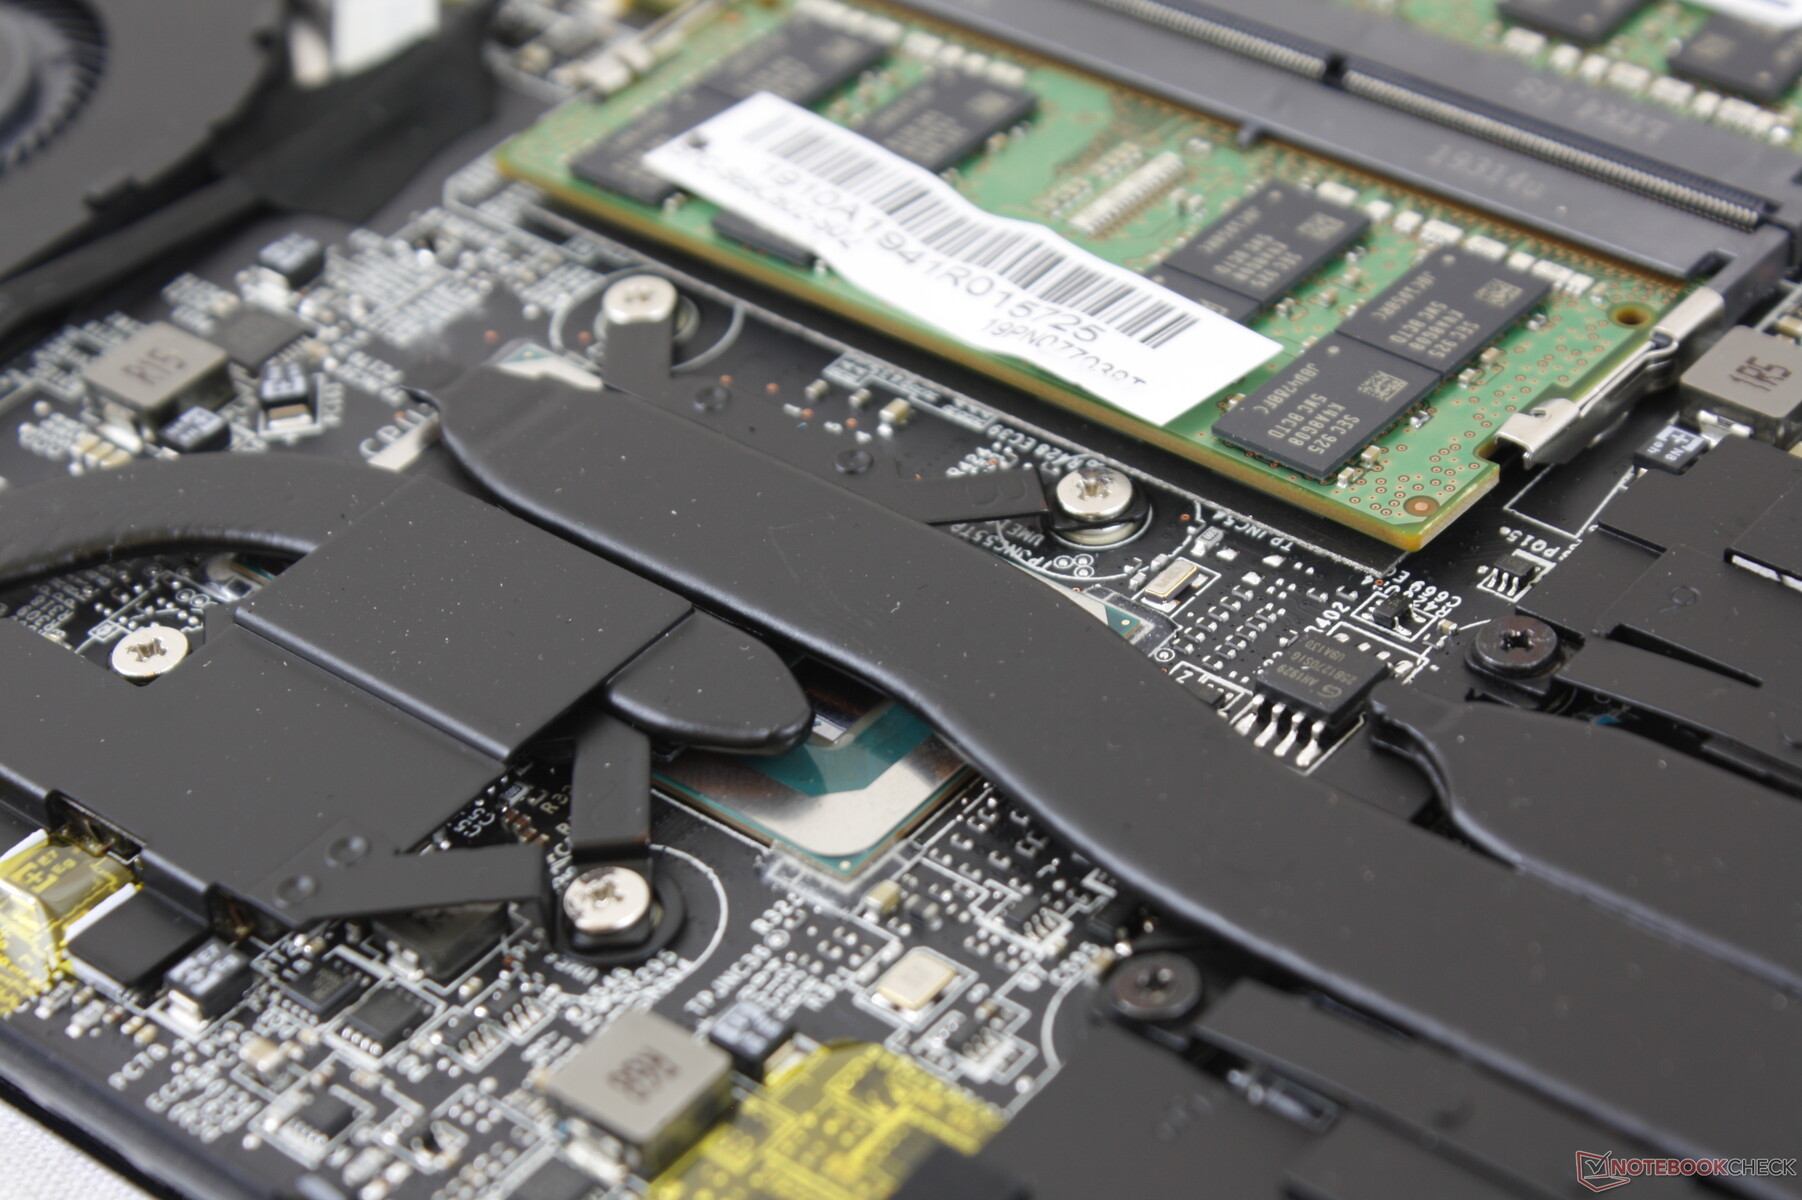
Bakım - Hala Bir Fabrika Mühür Etiketinin Yırtılmasını Gerektirir
Alt panel, bir "Fabrika Mührü" etiketinin altına gizlenmiş 11 adet Philips vida ile sabitlenmiştir. Servis sahipleri, her iki RAM yuvasına, her iki depolama yuvasına, WLAN modülüne ve dahili bataryaya doğrudan erişebileceklerinden servis hizmetleri nispeten kolaydır.
Aksesuarlar ve Garanti
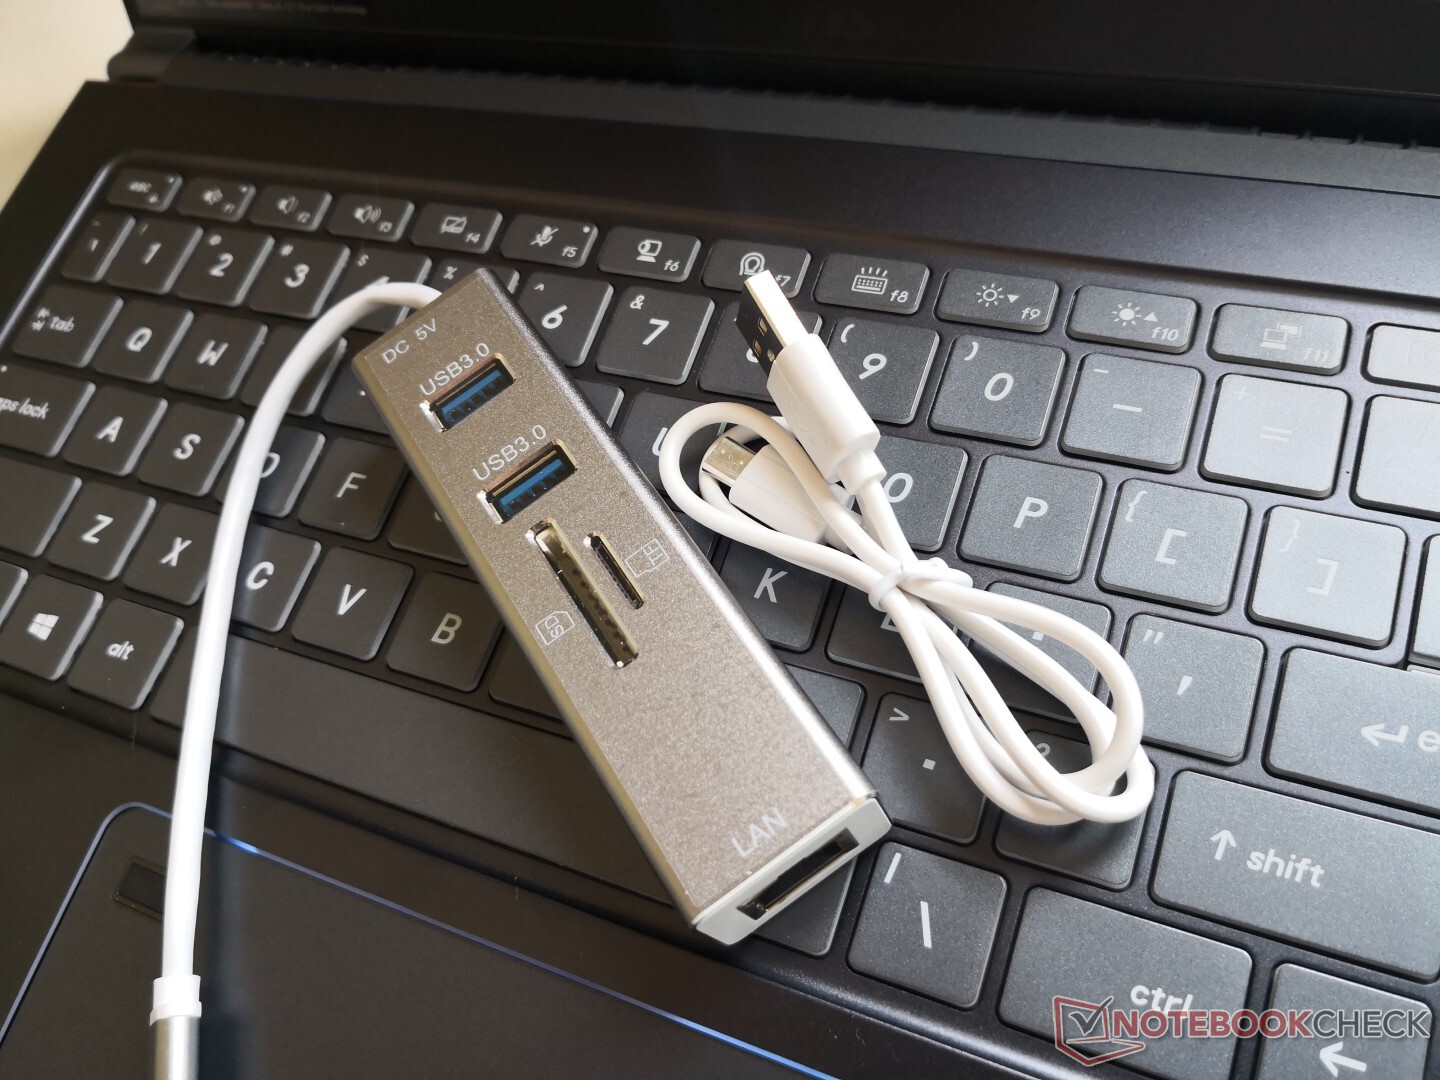
Dahil edilen ekstralar suni deri kılıf ve 2x USB Tip-A portu, tam boyutlu SD okuyucu, MicroSD okuyucu, RJ-45 portu ve bir Micro-USB güç portu bulunan bir USB Tip-C yuvasıdır. Diğer birçok OEM normal AC adaptörünün dışında hiçbir şey içermediğinden, bu aksesuarları perakende kutusunda görmek kesinlikle harika. Standart bir yıllık sınırlı garanti geçerlidir.
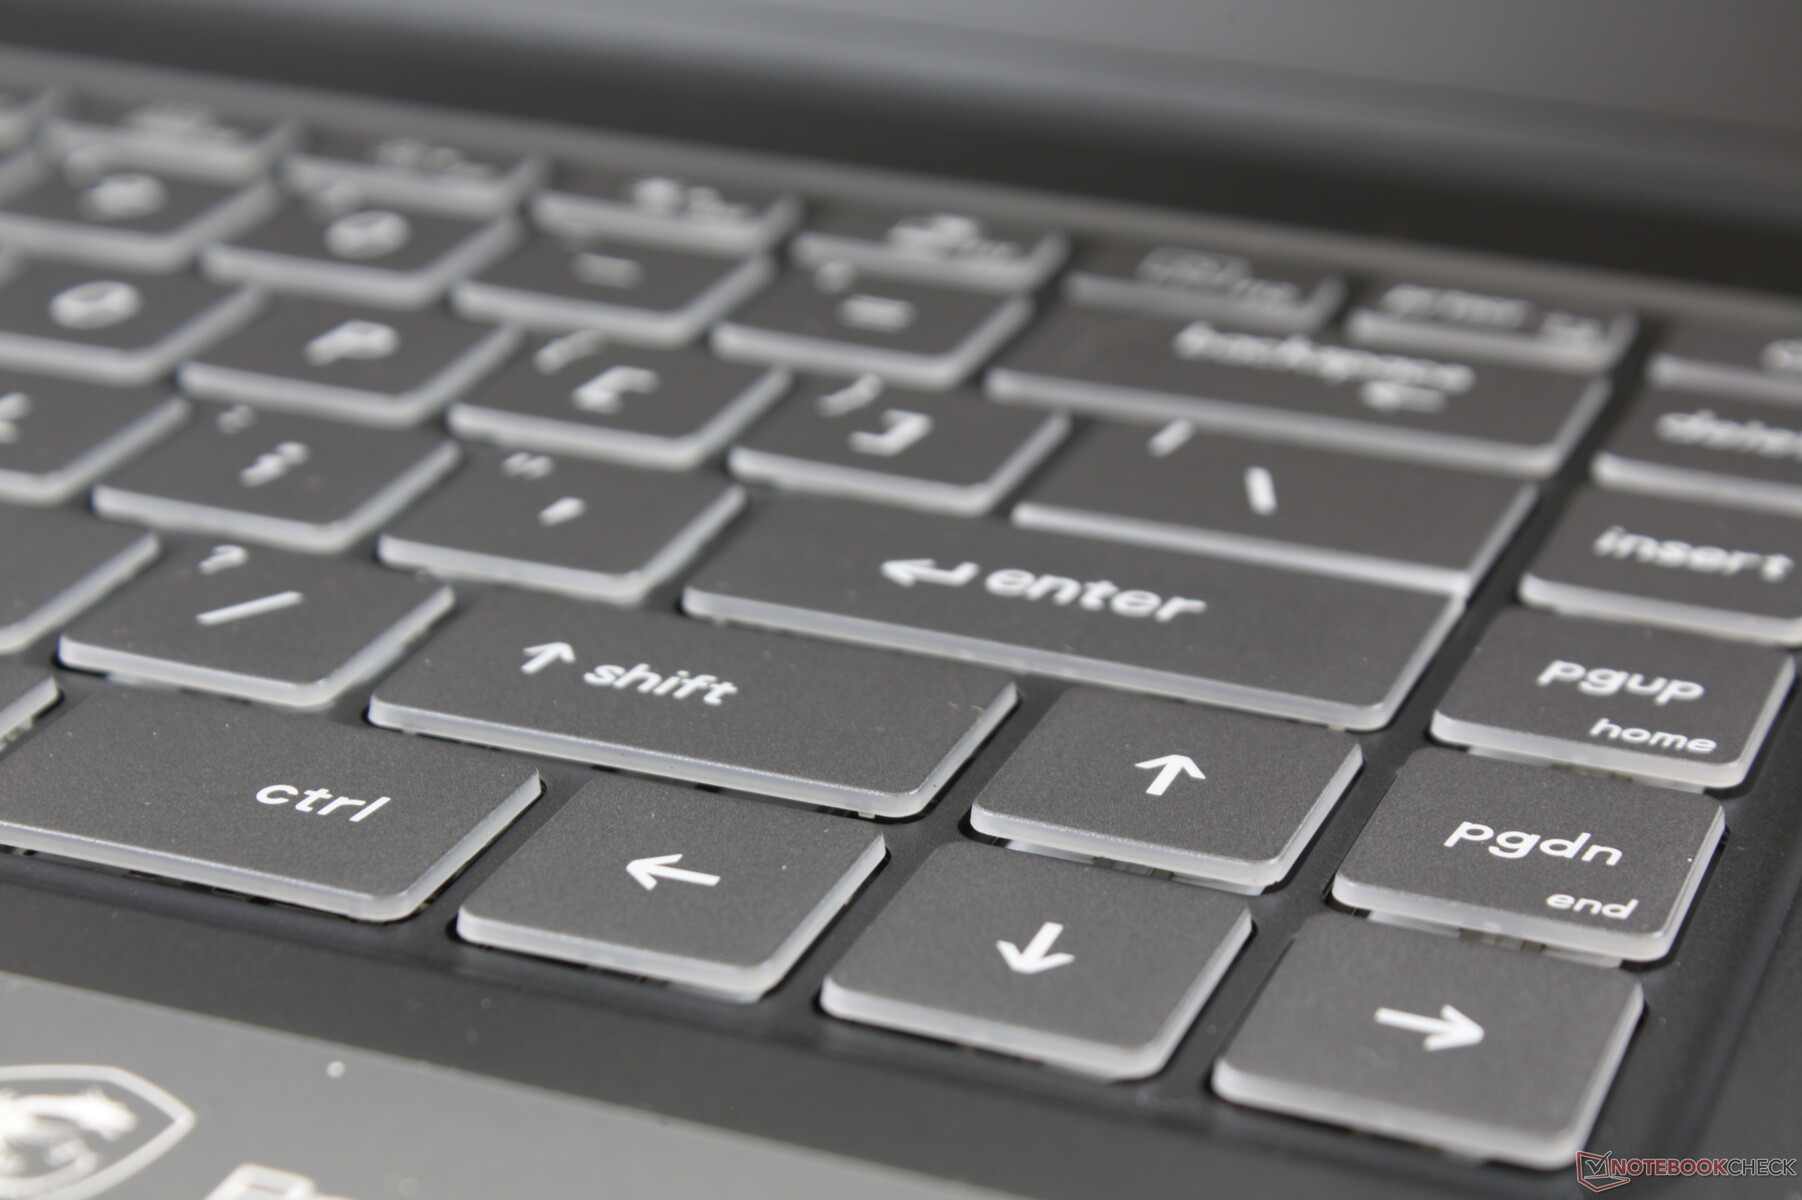
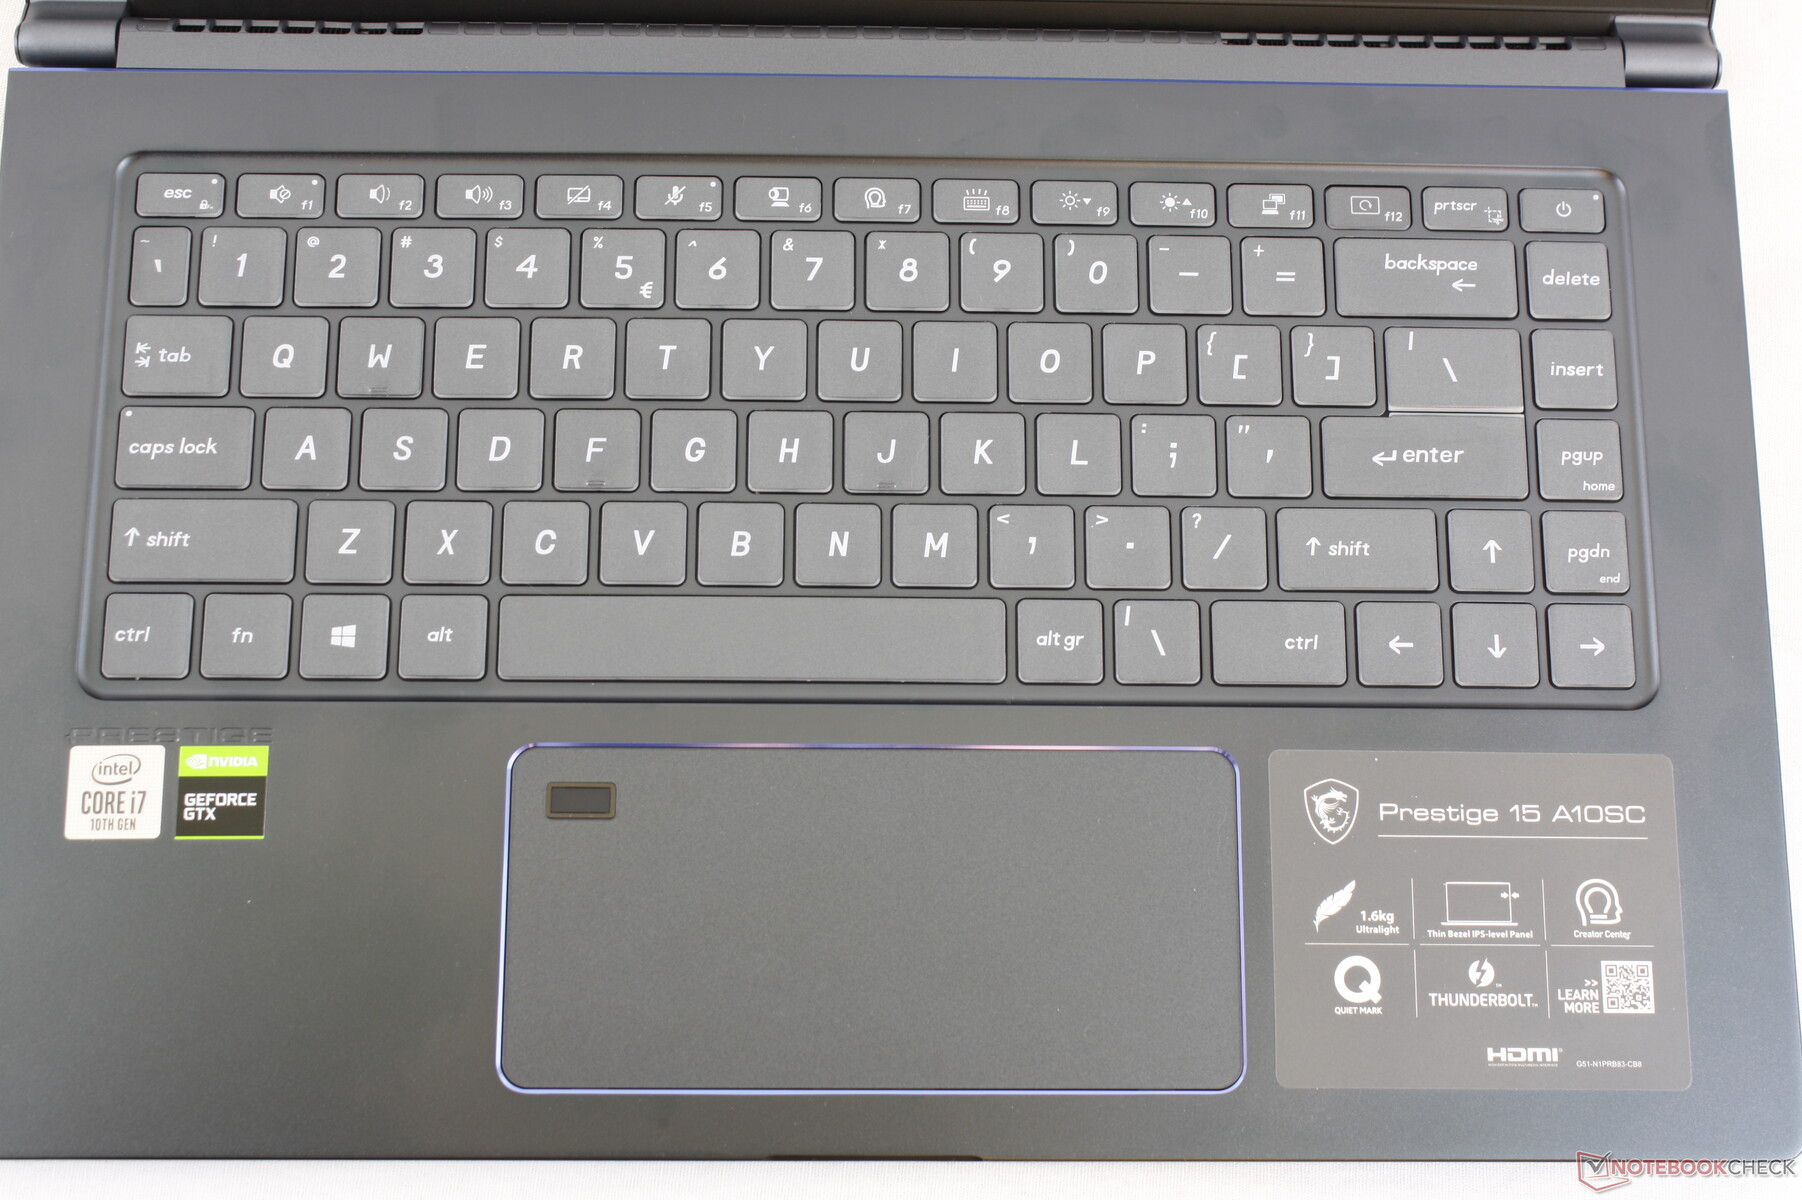
Giriş Aygıtları - Sığ ve Süngerimsi
KeyboardKey boyutu ve düzeni GS65'e benzer, birkaç görsel fark var. Prestige 15 tuşlarındaki yazı tipi biraz farklıyken, Güç düğmesi artık köşede, bazı Asus VivoBook dizüstü bilgisayarlardan farklı olarak değil. Klavyenin yazmakta ferah hissettiğini takdir etmemize rağmen, önemli geribildirim bizim istediğimizden daha hafiftir. XPS 15 veya Spectre x360 15 üzerindeki tuşlar, MSI'dan daha net ve daha tatmin edici geliyor. Çoğu Ultrabook'un genel olarak sığ ve açık tuşlarına alışmış kullanıcılar, Prestige 15 üzerindeki klavyeyle kendilerini evlerinde hissetmelidir.
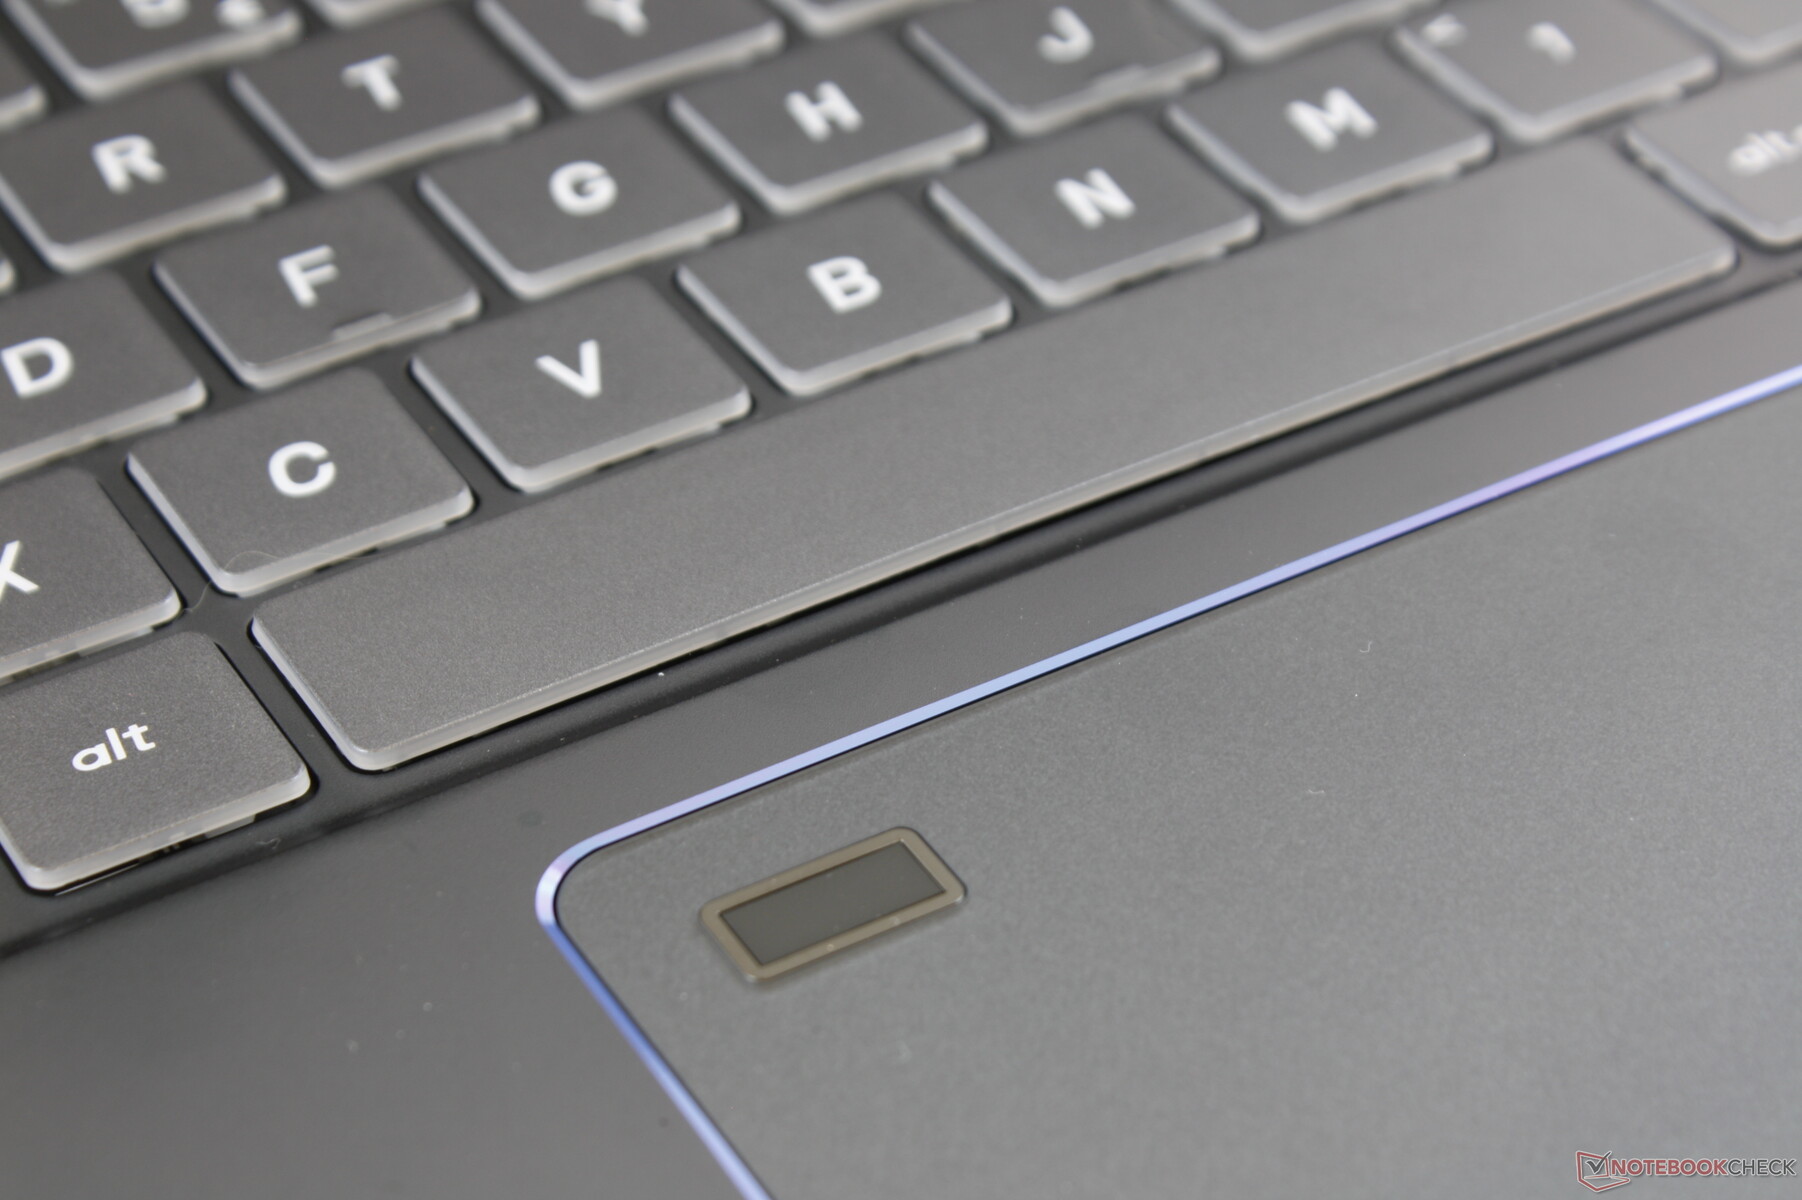
Dokunmatik
Tuş takımı (14 x 6,5 cm) GS65 9SG'de göründüğü ile aynıdır. Geniş yüzey alanı, çoklu dokunmatik girişler için diğer dizüstü bilgisayarlardan daha rahat olmasını sağlar. Ancak o kadar geniş ki, hurma reddi mükemmel olmadığından, arada bir defada yanlışlıkla girdiler olmasını bekleyin. Entegre fare tuşları geri bildirimde yumuşak, seyahat sırasında sığ ve nispeten sessizdir. Özel fare tuşları hem daha iyi doğruluk hem de geribildirim sağlardı.

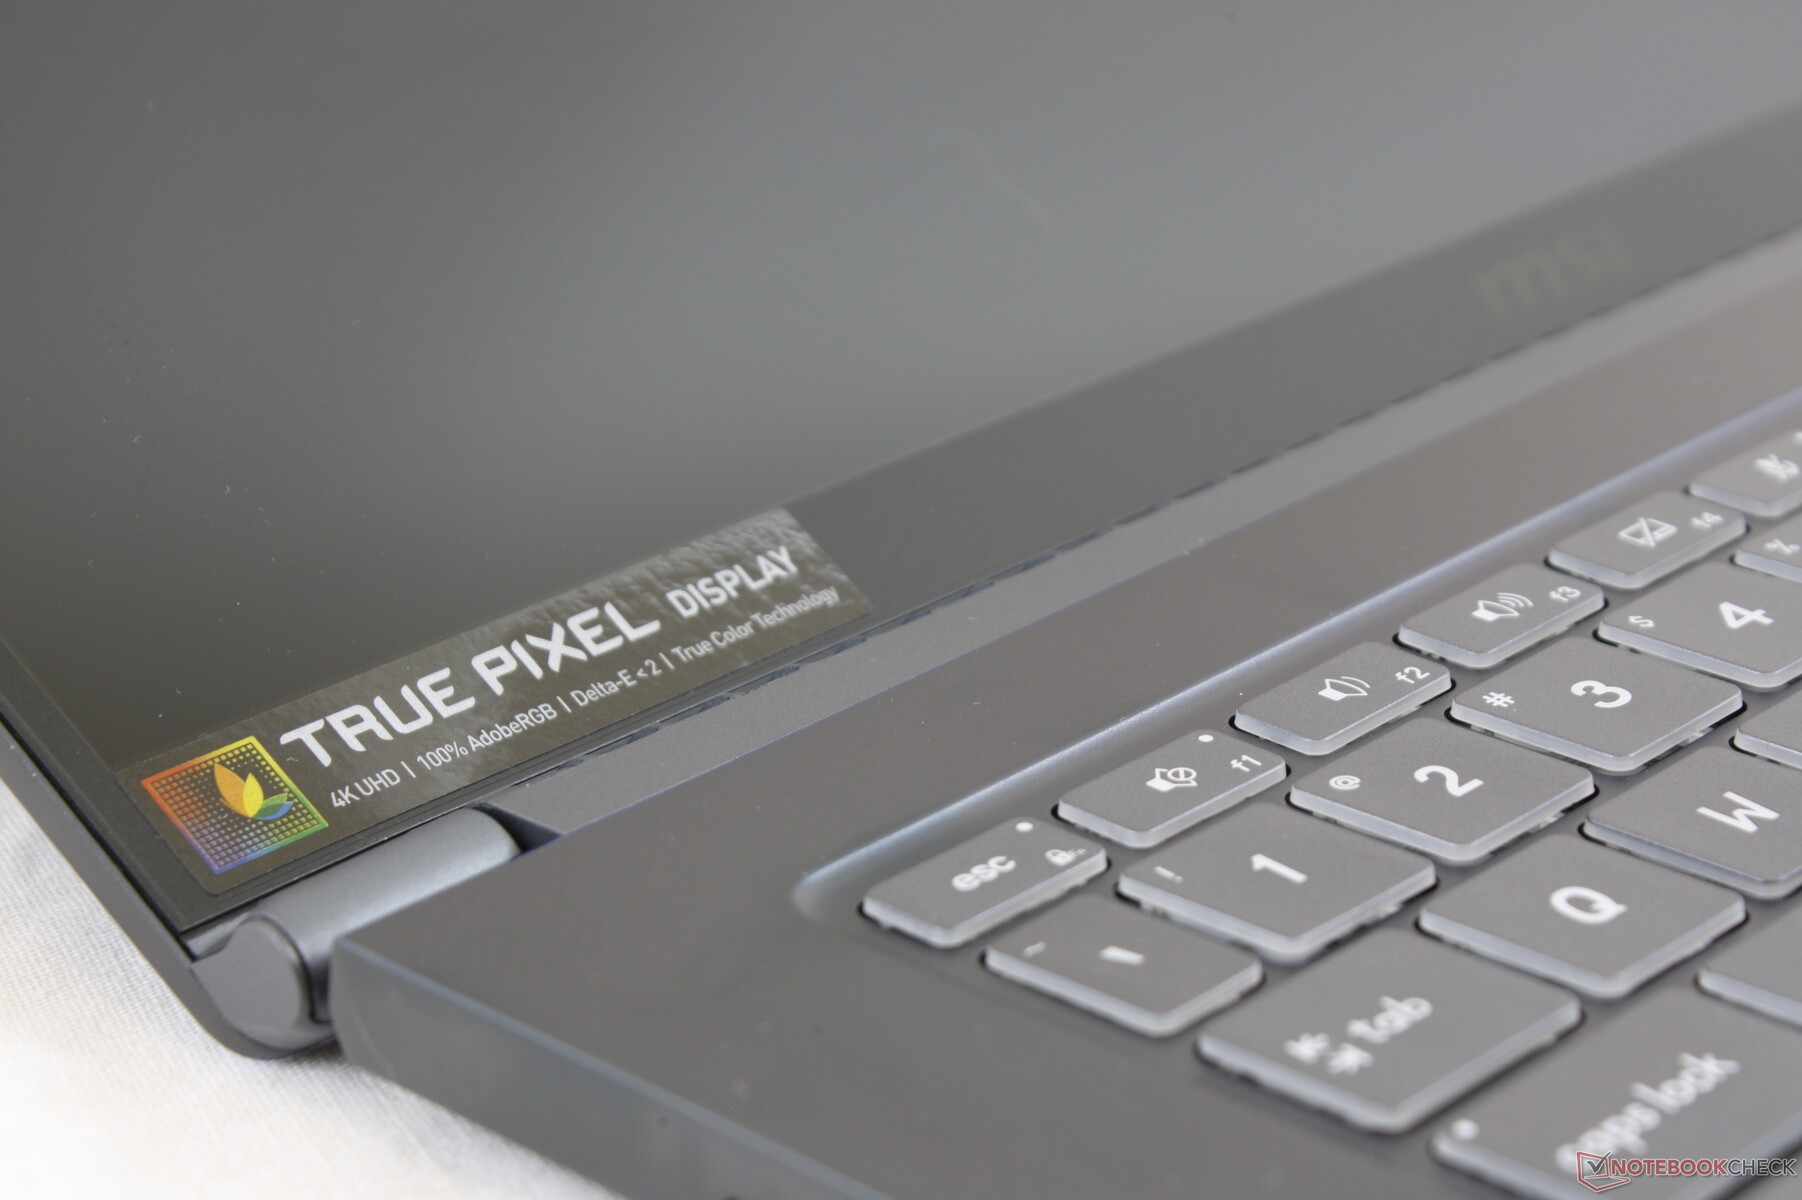
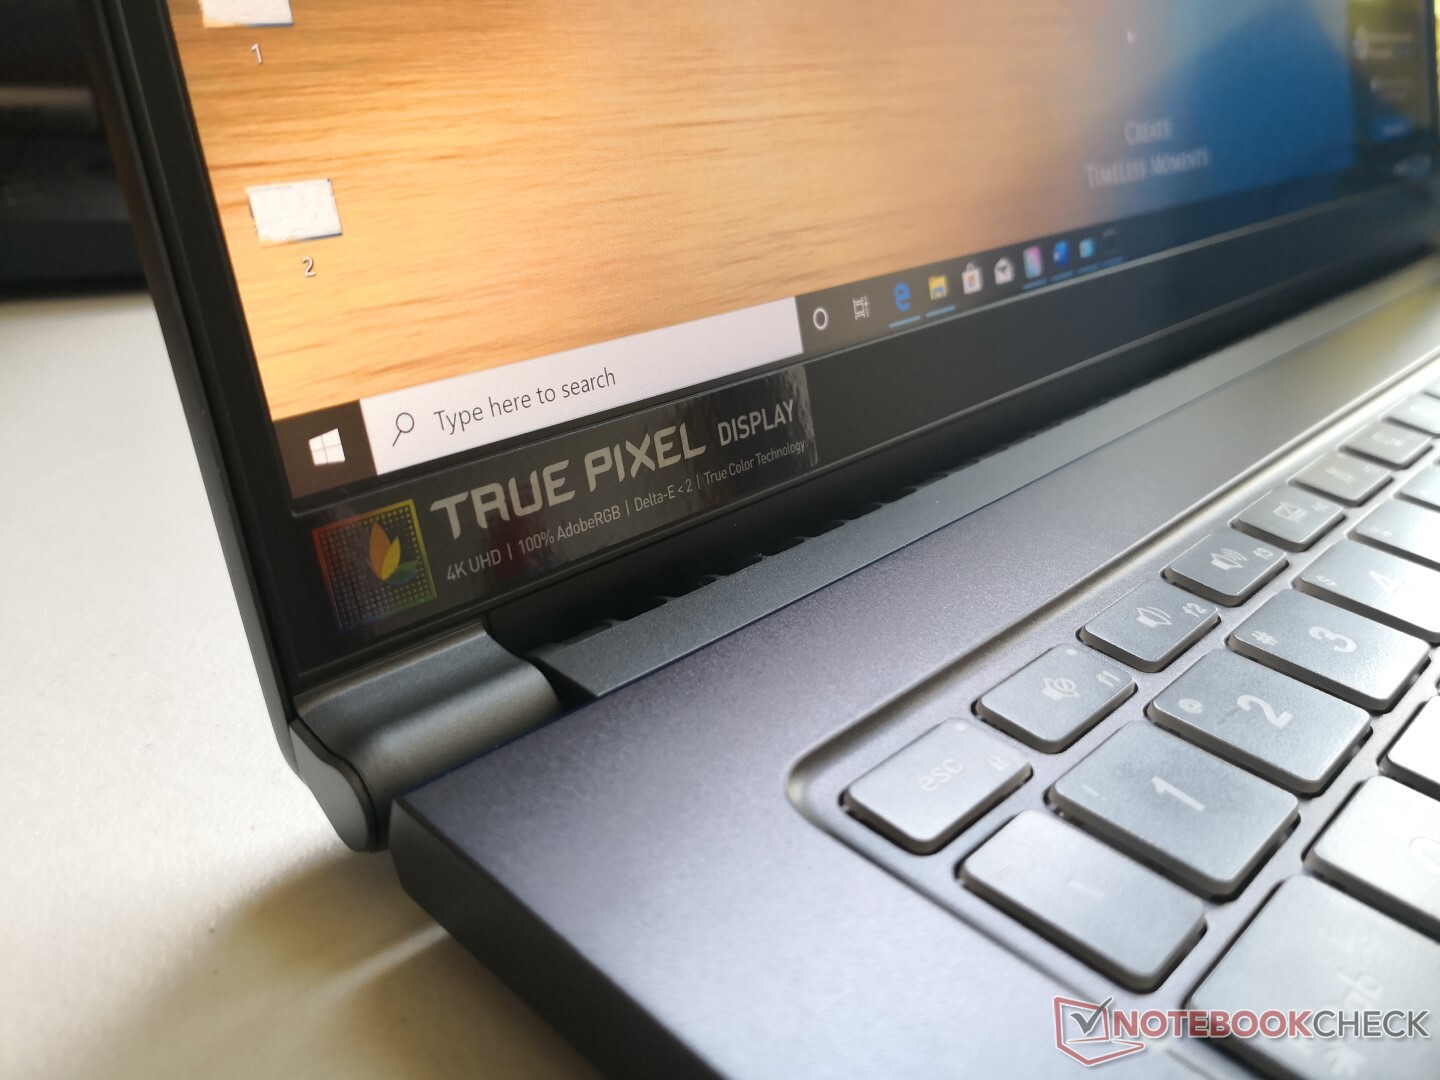
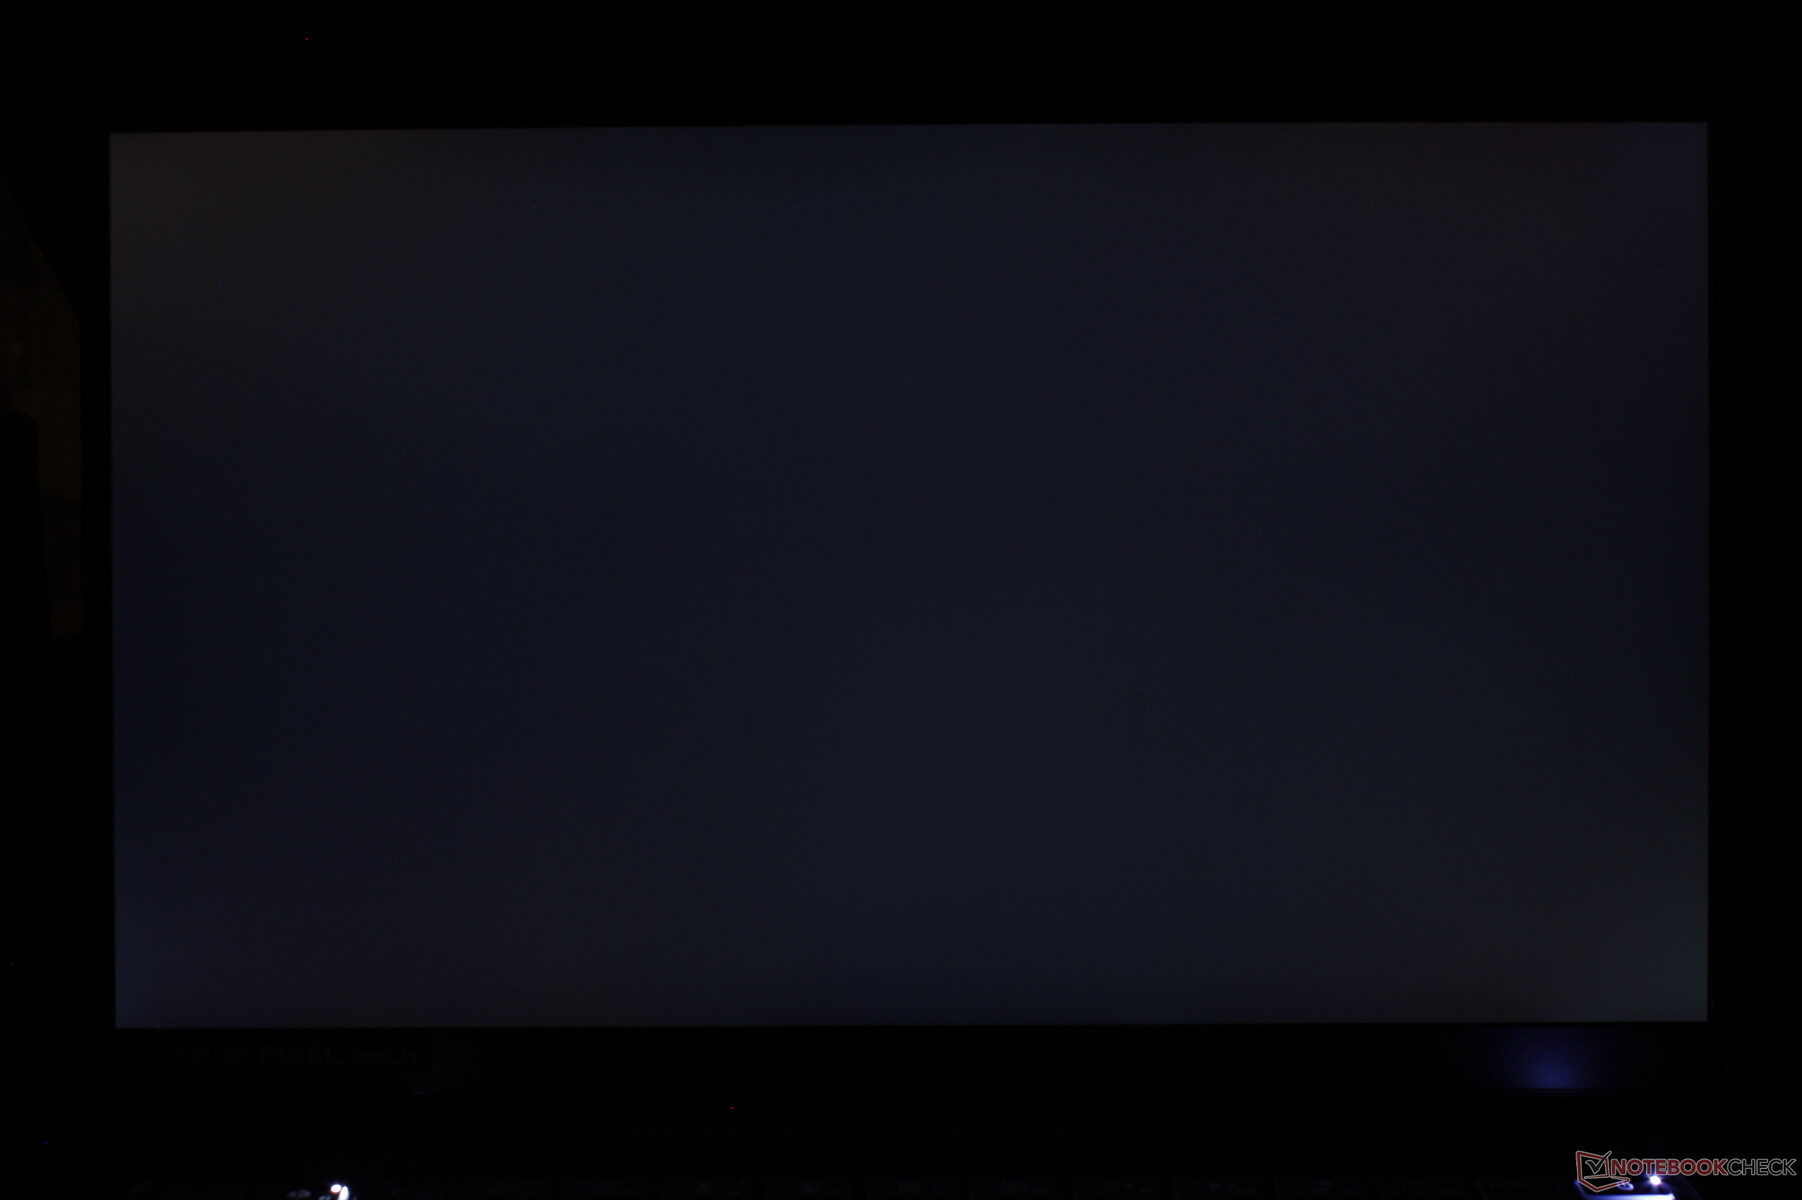
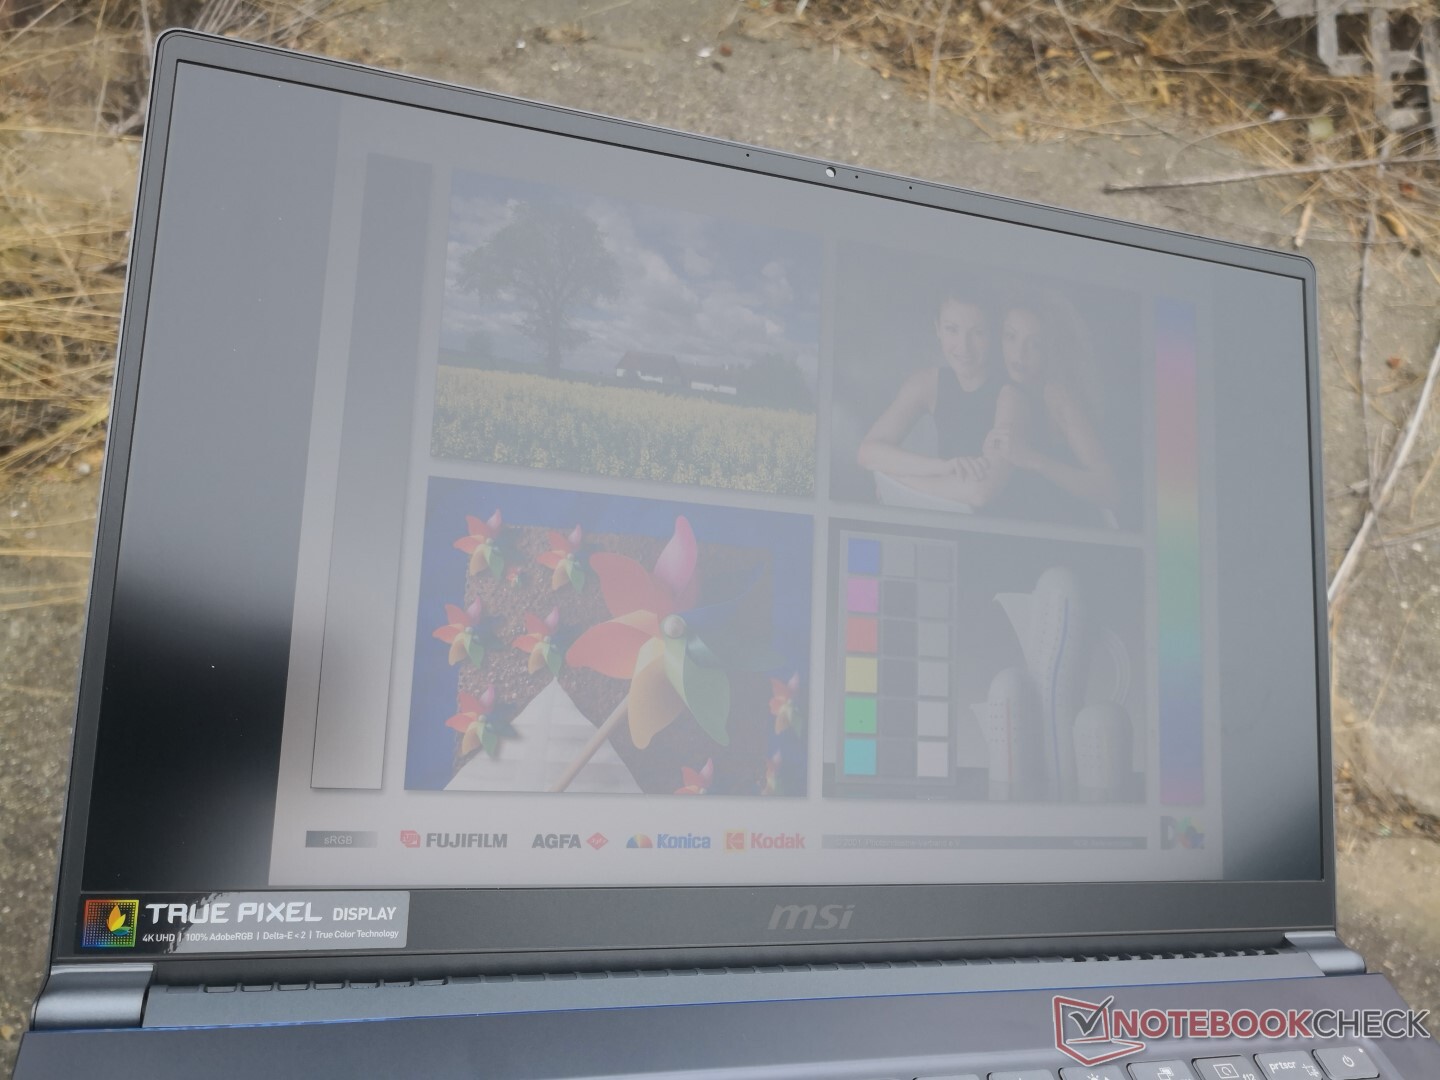
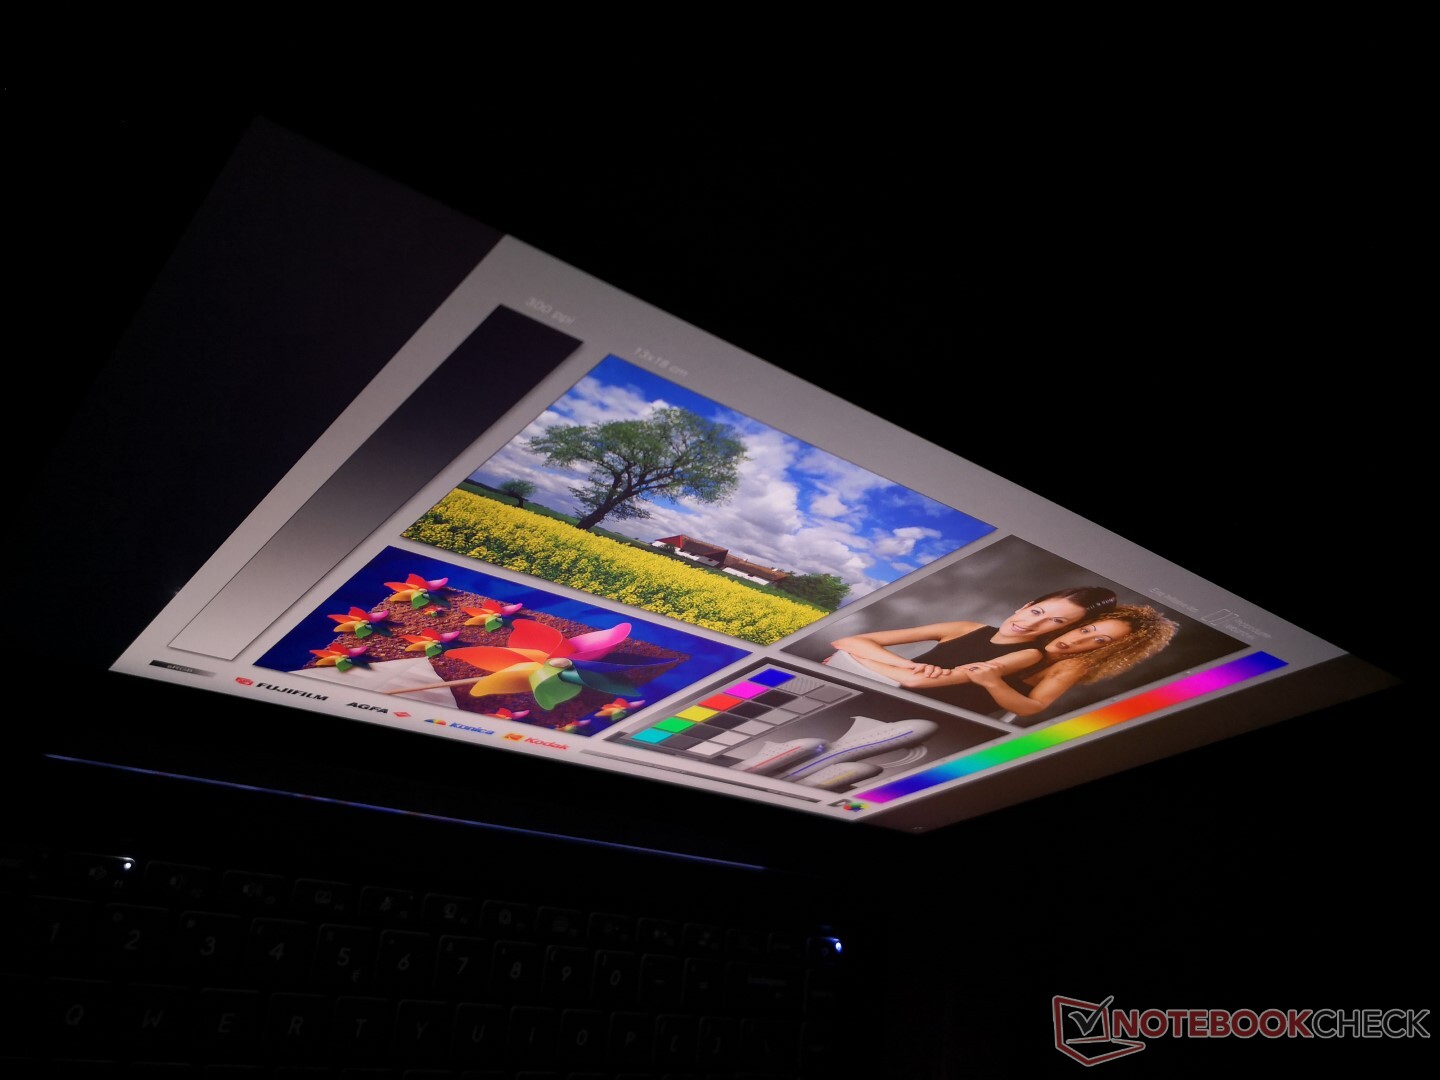
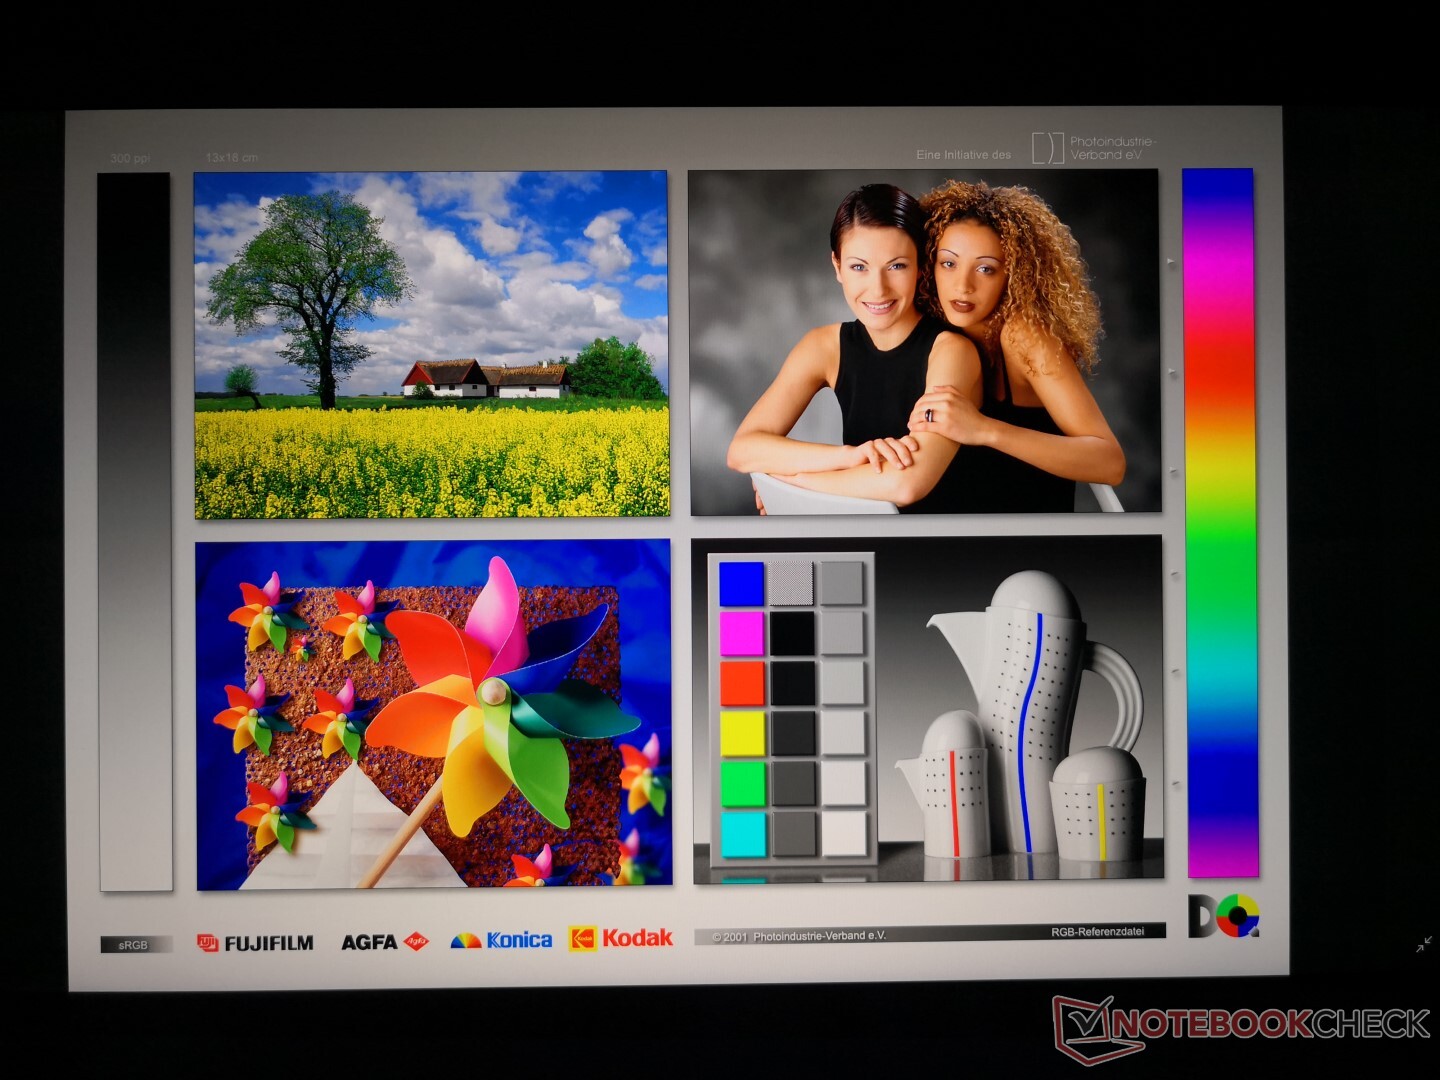
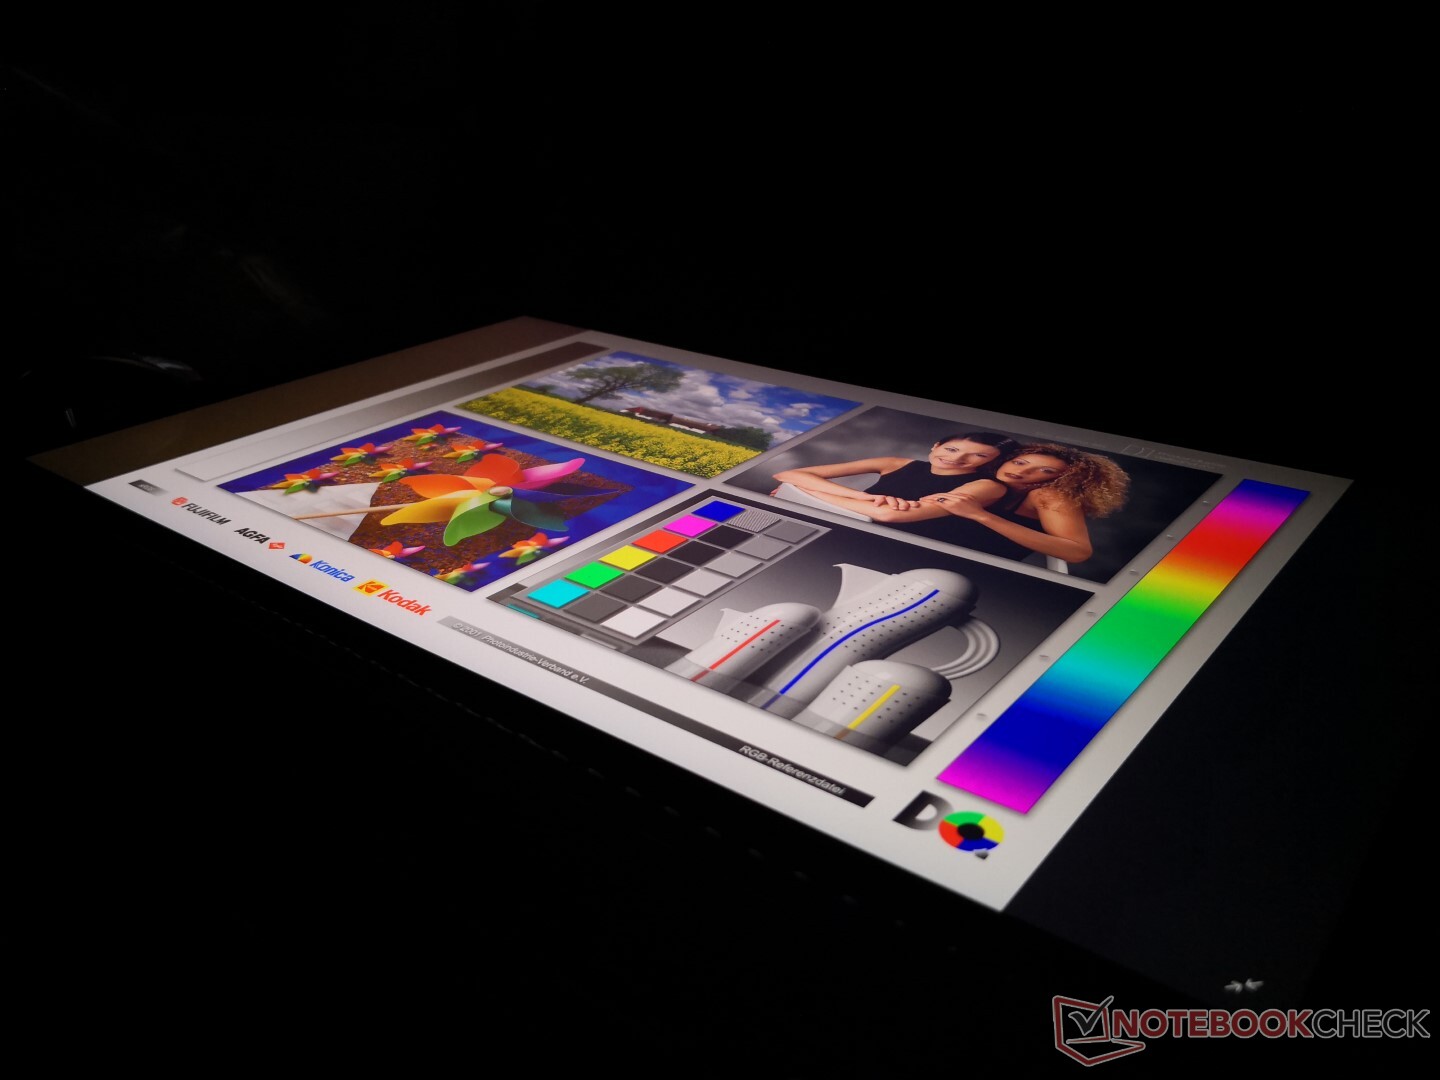
Ekran - Baştan beri iyi ayarlanmış
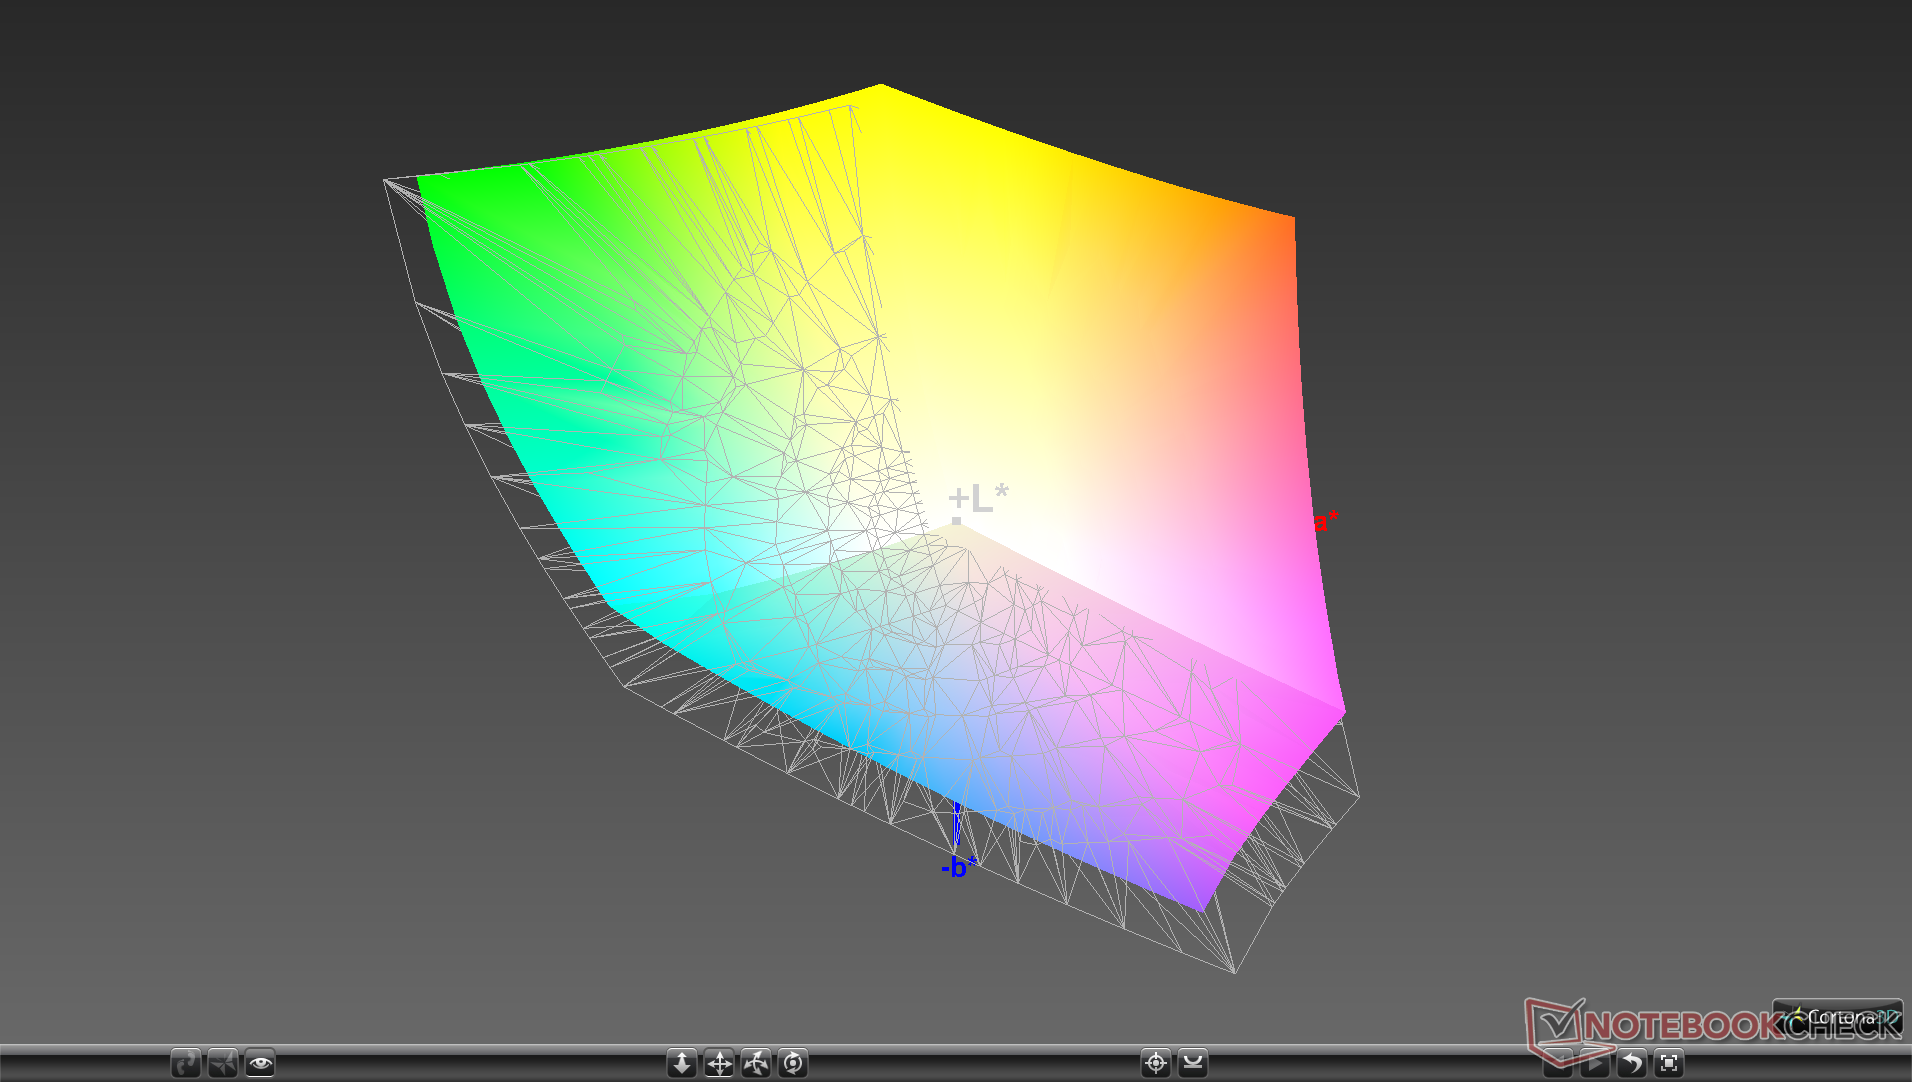
MSI, Prestige 15 için FHD ve 4K UHD seçenekleri sunuyor. Özel test ünitemiz, veritabanımızda başka hiçbir dizüstü bilgisayarda bulunmayan 4K UHD Sharp LQ156D1JW42 IPS paneliyle donatılmıştır. Bununla birlikte, daha genel Sharp LQ156D1, MSI ünitemizle aynı kontrast oranı ve renk alanı özelliklerini gösteren Lenovo ThinkPad P50 ve Dell XPS 15 9570'de bulunabilir. mat kaplamaya rağmen. Özellikle arka ışığı, diğer Ultrabook'lardan daha parlak olan XPS 15'in arka ışığı ile aynı. Ekranın en büyük dezavantajı, daha belirgin gölgelenme için yavaş siyah-beyaz ve gri-gri tepki süreleridir.
| |||||||||||||||||||||||||
Aydınlatma: 92 %
Batarya modunda parlaklık: 464.5 cd/m²
Kontrast: 929:1 (Siyah: 0.5 cd/m²)
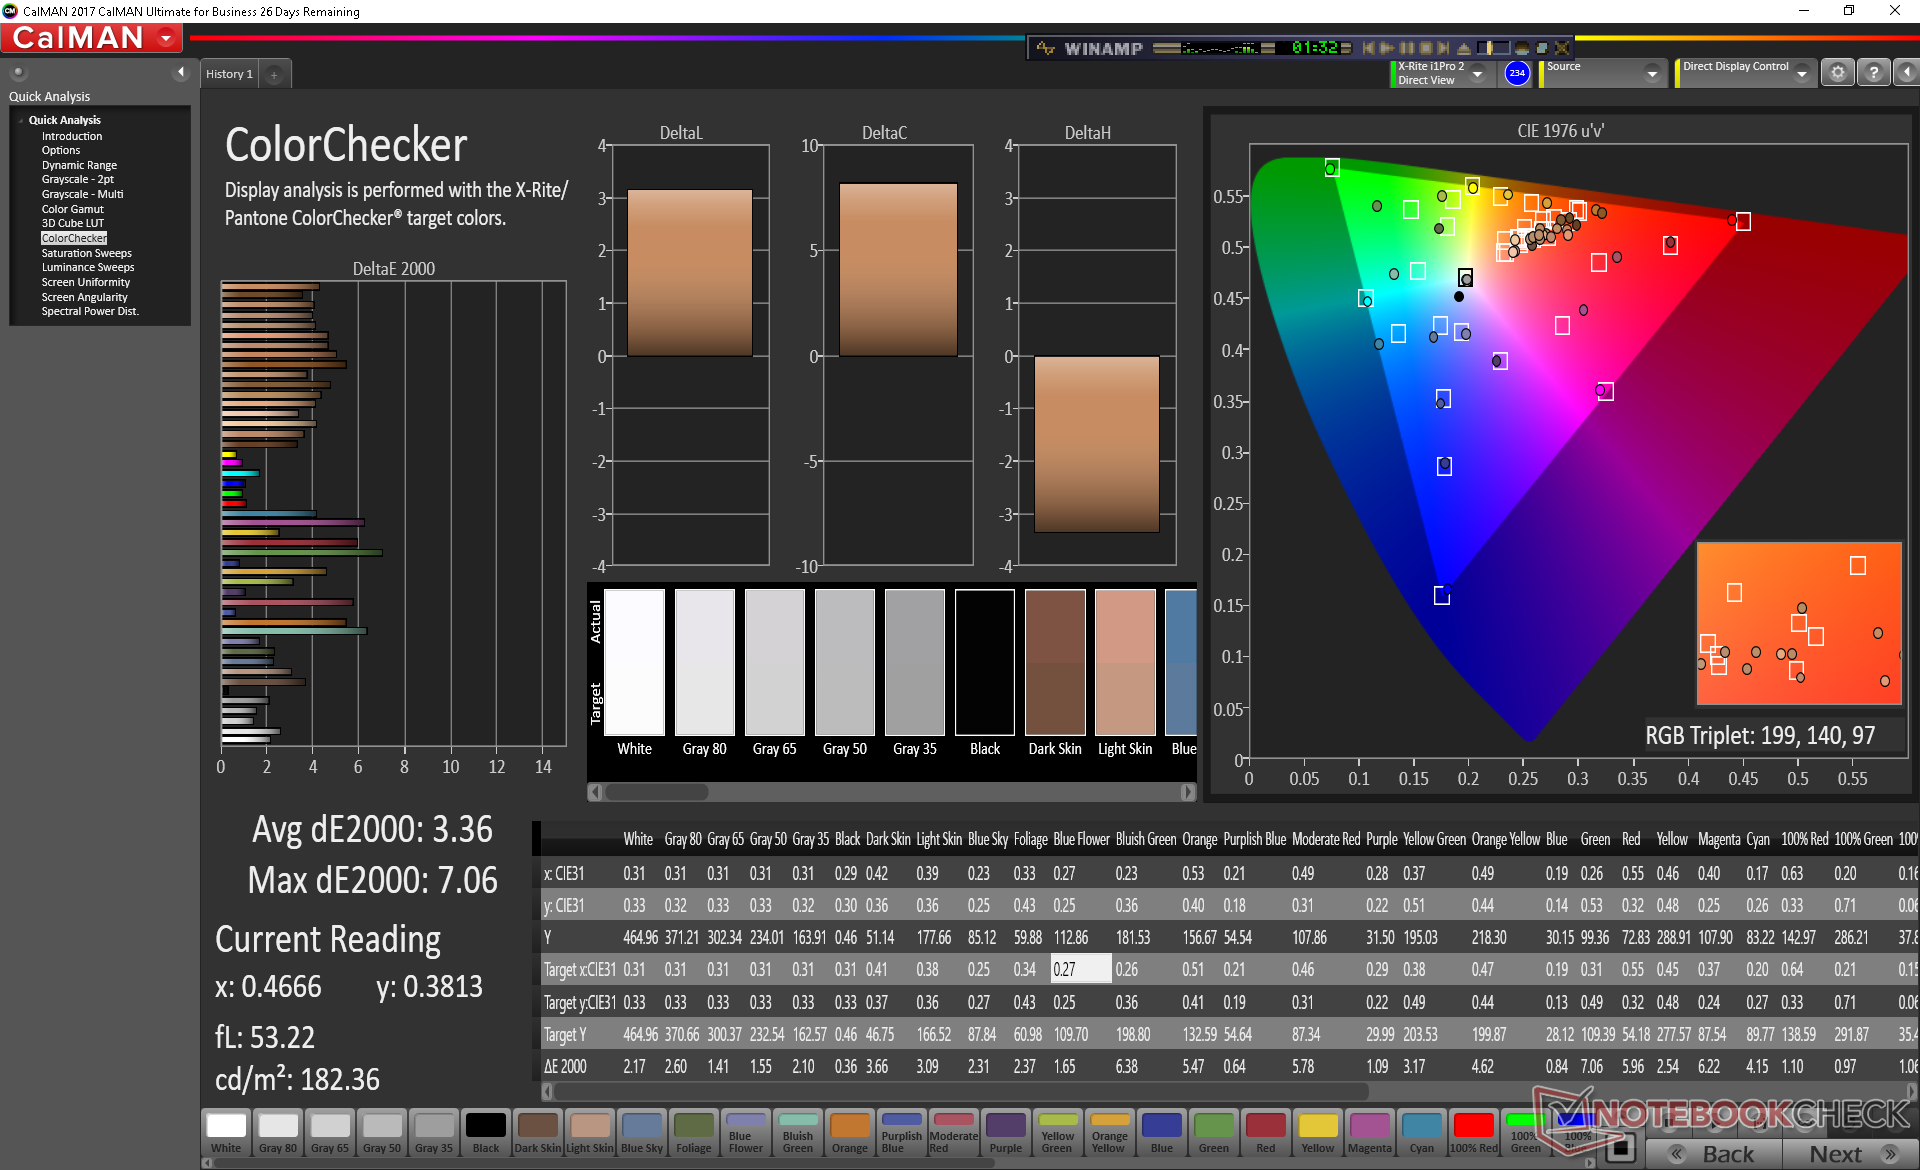
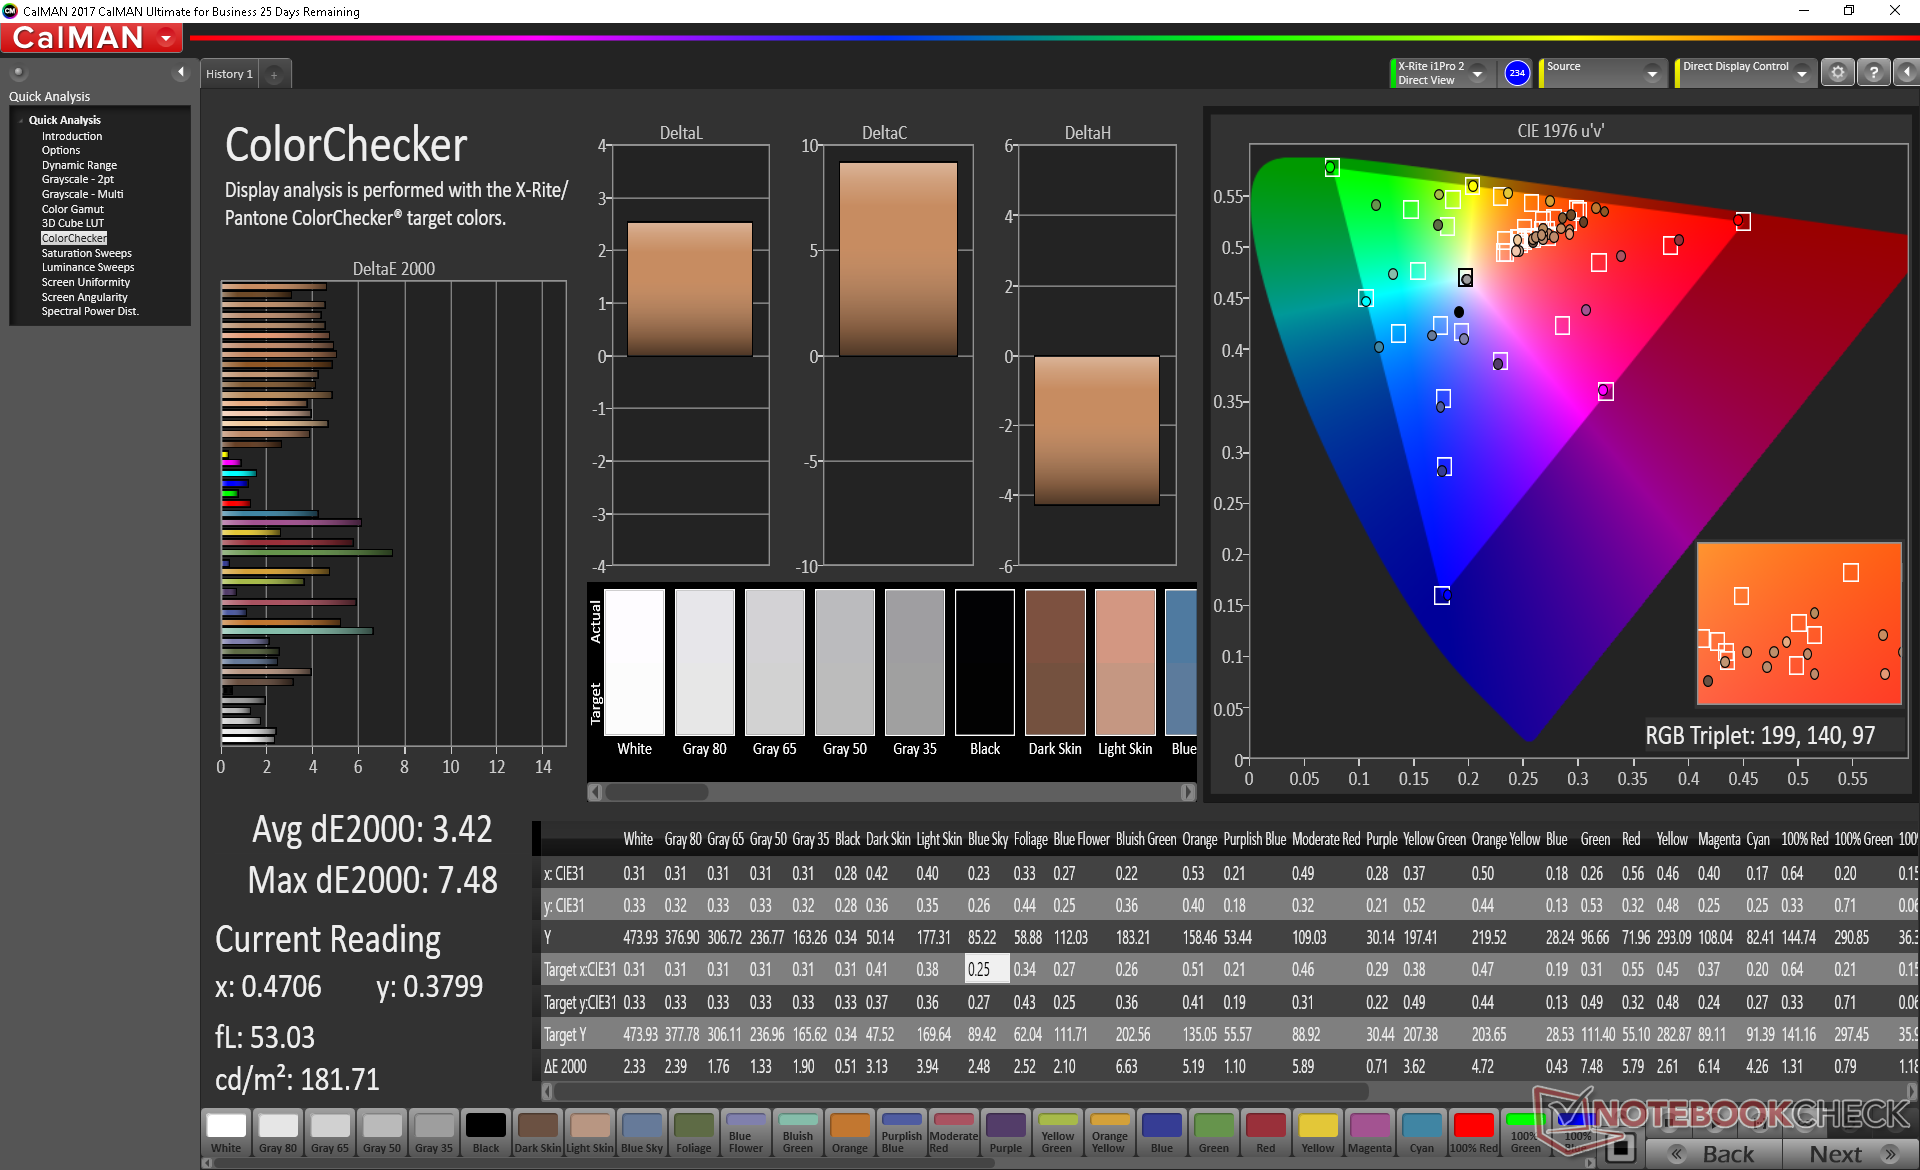
ΔE ColorChecker Calman: 3.36 | ∀{0.5-29.43 Ø4.71}
calibrated: 3.42
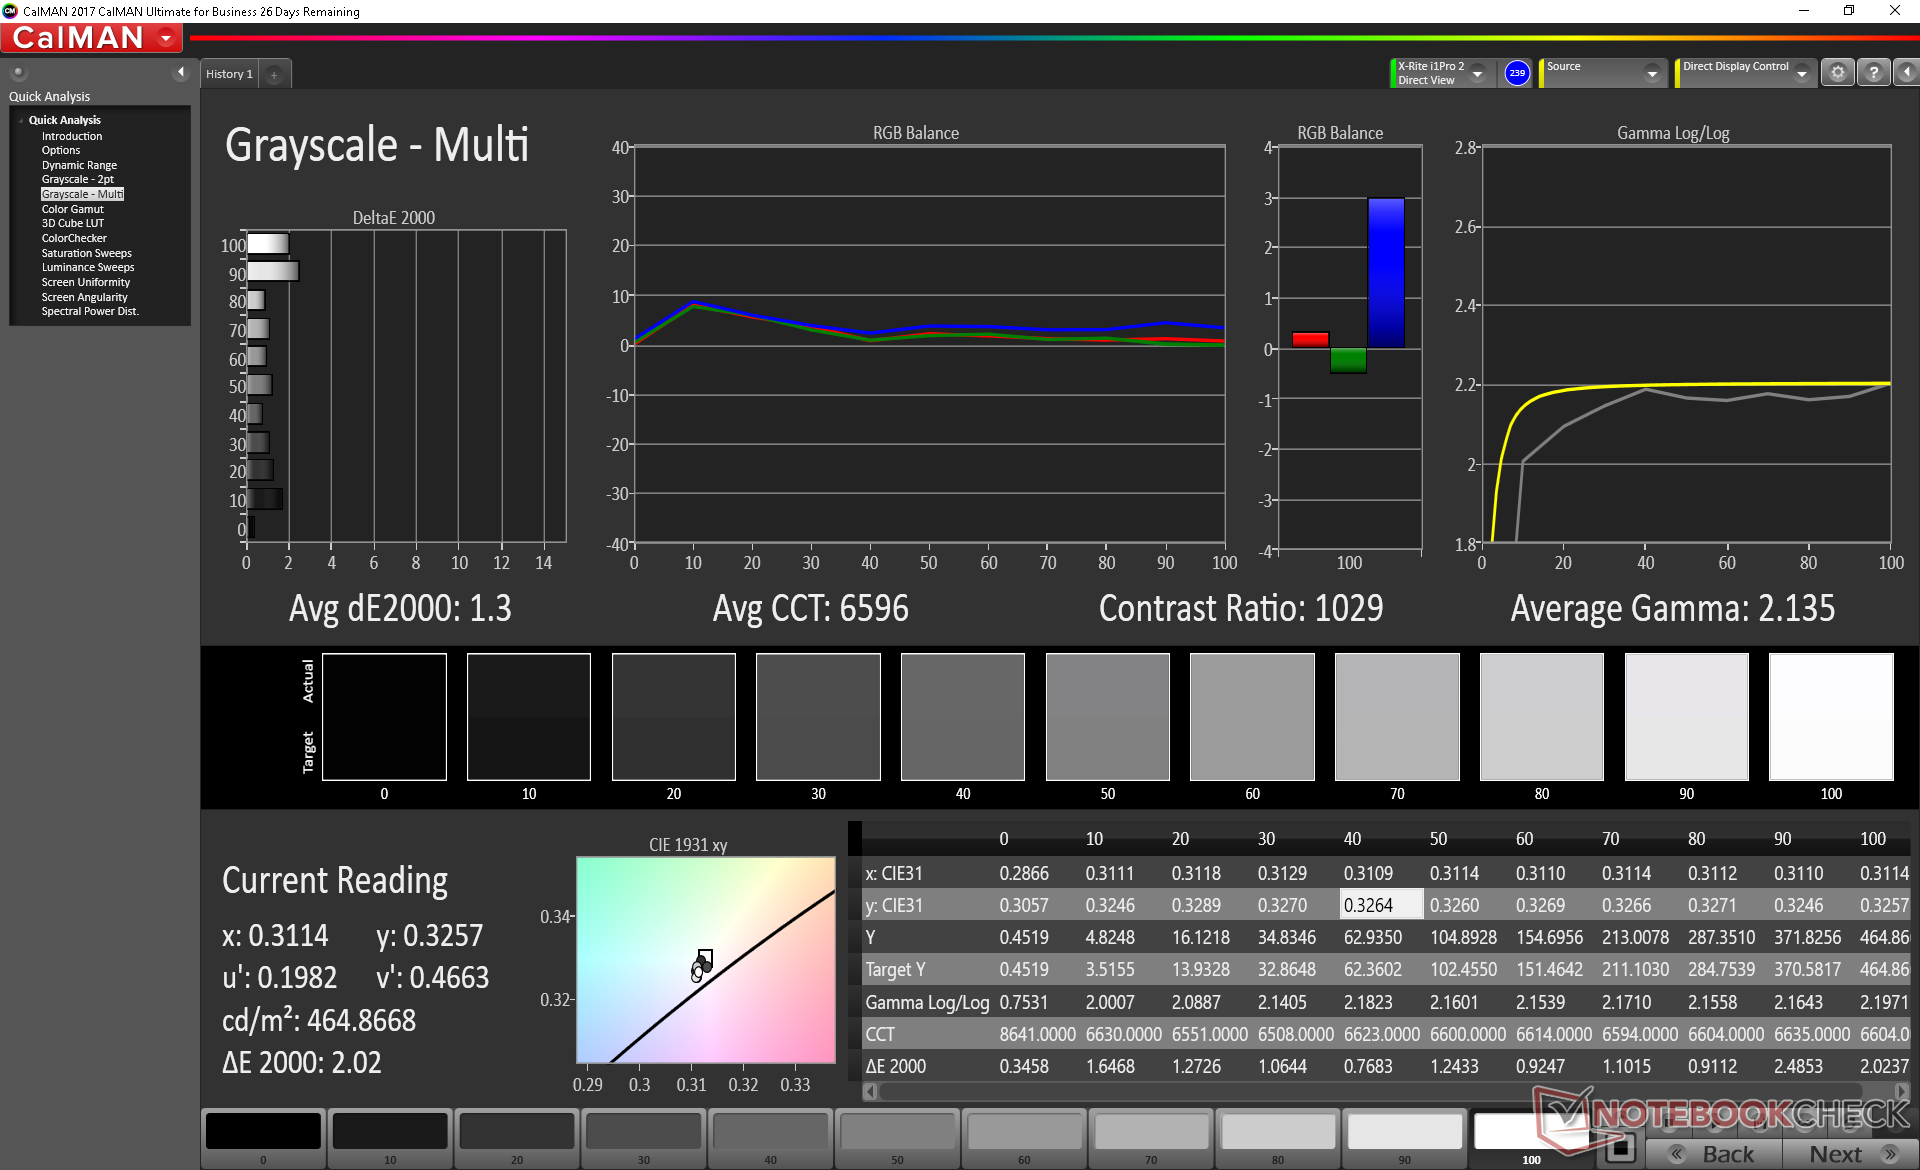
ΔE Greyscale Calman: 1.3 | ∀{0.09-98 Ø4.96}
98.3% sRGB (Argyll 1.6.3 3D)
84.8% AdobeRGB 1998 (Argyll 1.6.3 3D)
96.2% AdobeRGB 1998 (Argyll 3D)
98.3% sRGB (Argyll 3D)
82% Display P3 (Argyll 3D)
Gamma: 2.14
CCT: 6596 K
| MSI Prestige 15 A10SC Sharp LQ156D1JW42, IPS, 15.6", 3840x2160 | Microsoft Surface Laptop 3 15 Ryzen 5 3580U Sharp LQ150P1JX51, IPS, 15", 2496x1664 | MSI P65 Creator 9SF-657 AU Optronics AUO41EB, IPS, 15.6", 3840x2160 | Dell Precision 5530 Xeon E-2176M Sharp SHP148D / LQ156D1, IGZO, 15.6", 3840x2160 | Dell Latitude 5500 LGD05FF 156WFD, IPS, 15.6", 1920x1080 | Lenovo ThinkPad T590-20N4002VGE LP156WFC-SPD1, aSi IPS LED, 15.6", 1920x1080 | |
|---|---|---|---|---|---|---|
| Display | -17% | 2% | -9% | -52% | -51% | |
| Display P3 Coverage (%) | 82 | 66.9 -18% | 84.4 3% | 76.5 -7% | 38.07 -54% | 38.79 -53% |
| sRGB Coverage (%) | 98.3 | 99.3 1% | 100 2% | 98.4 0% | 57.3 -42% | 58.3 -41% |
| AdobeRGB 1998 Coverage (%) | 96.2 | 63.7 -34% | 98.5 2% | 76.4 -21% | 39.33 -59% | 40.11 -58% |
| Response Times | 16% | 20% | 19% | 34% | 36% | |
| Response Time Grey 50% / Grey 80% * (ms) | 60 ? | 47.2 ? 21% | 51 ? 15% | 48 ? 20% | 37.6 ? 37% | 37.2 ? 38% |
| Response Time Black / White * (ms) | 41.2 ? | 36.8 ? 11% | 31 ? 25% | 33.6 ? 18% | 28.4 ? 31% | 27.2 ? 34% |
| PWM Frequency (Hz) | 26040 ? | 21370 ? | 1000 | |||
| Screen | 4% | -31% | -16% | -39% | -43% | |
| Brightness middle (cd/m²) | 464.5 | 416.9 -10% | 445 -4% | 451.7 -3% | 234 -50% | 276 -41% |
| Brightness (cd/m²) | 451 | 389 -14% | 462 2% | 440 -2% | 229 -49% | 262 -42% |
| Brightness Distribution (%) | 92 | 86 -7% | 83 -10% | 90 -2% | 93 1% | 88 -4% |
| Black Level * (cd/m²) | 0.5 | 0.4 20% | 0.5 -0% | 0.4 20% | 0.23 54% | 0.23 54% |
| Contrast (:1) | 929 | 1042 12% | 890 -4% | 1129 22% | 1017 9% | 1200 29% |
| Colorchecker dE 2000 * | 3.36 | 2.75 18% | 4.75 -41% | 3.11 7% | 5.2 -55% | 5.6 -67% |
| Colorchecker dE 2000 max. * | 7.06 | 6.64 6% | 7.79 -10% | 8.62 -22% | 14.7 -108% | 16.4 -132% |
| Colorchecker dE 2000 calibrated * | 3.42 | 0.71 79% | 3.07 10% | 4.6 -35% | 4.7 -37% | |
| Greyscale dE 2000 * | 1.3 | 1.8 -38% | 4.49 -245% | 3.7 -185% | 2.5 -92% | 3 -131% |
| Gamma | 2.14 103% | 2.09 105% | 2.49 88% | 2.11 104% | 2.44 90% | 2.18 101% |
| CCT | 6596 99% | 6646 98% | 7374 88% | 6492 100% | 6649 98% | 7075 92% |
| Color Space (Percent of AdobeRGB 1998) (%) | 84.8 | 63.4 -25% | 87 3% | 69 -19% | 36.2 -57% | 36.9 -56% |
| Color Space (Percent of sRGB) (%) | 98.3 | 99.4 1% | 100 2% | 98 0% | 57 -42% | 58.1 -41% |
| Toplam Ortalama (Program / Ayarlar) | 1% /
1% | -3% /
-17% | -2% /
-10% | -19% /
-32% | -19% /
-34% |
* ... daha küçük daha iyidir
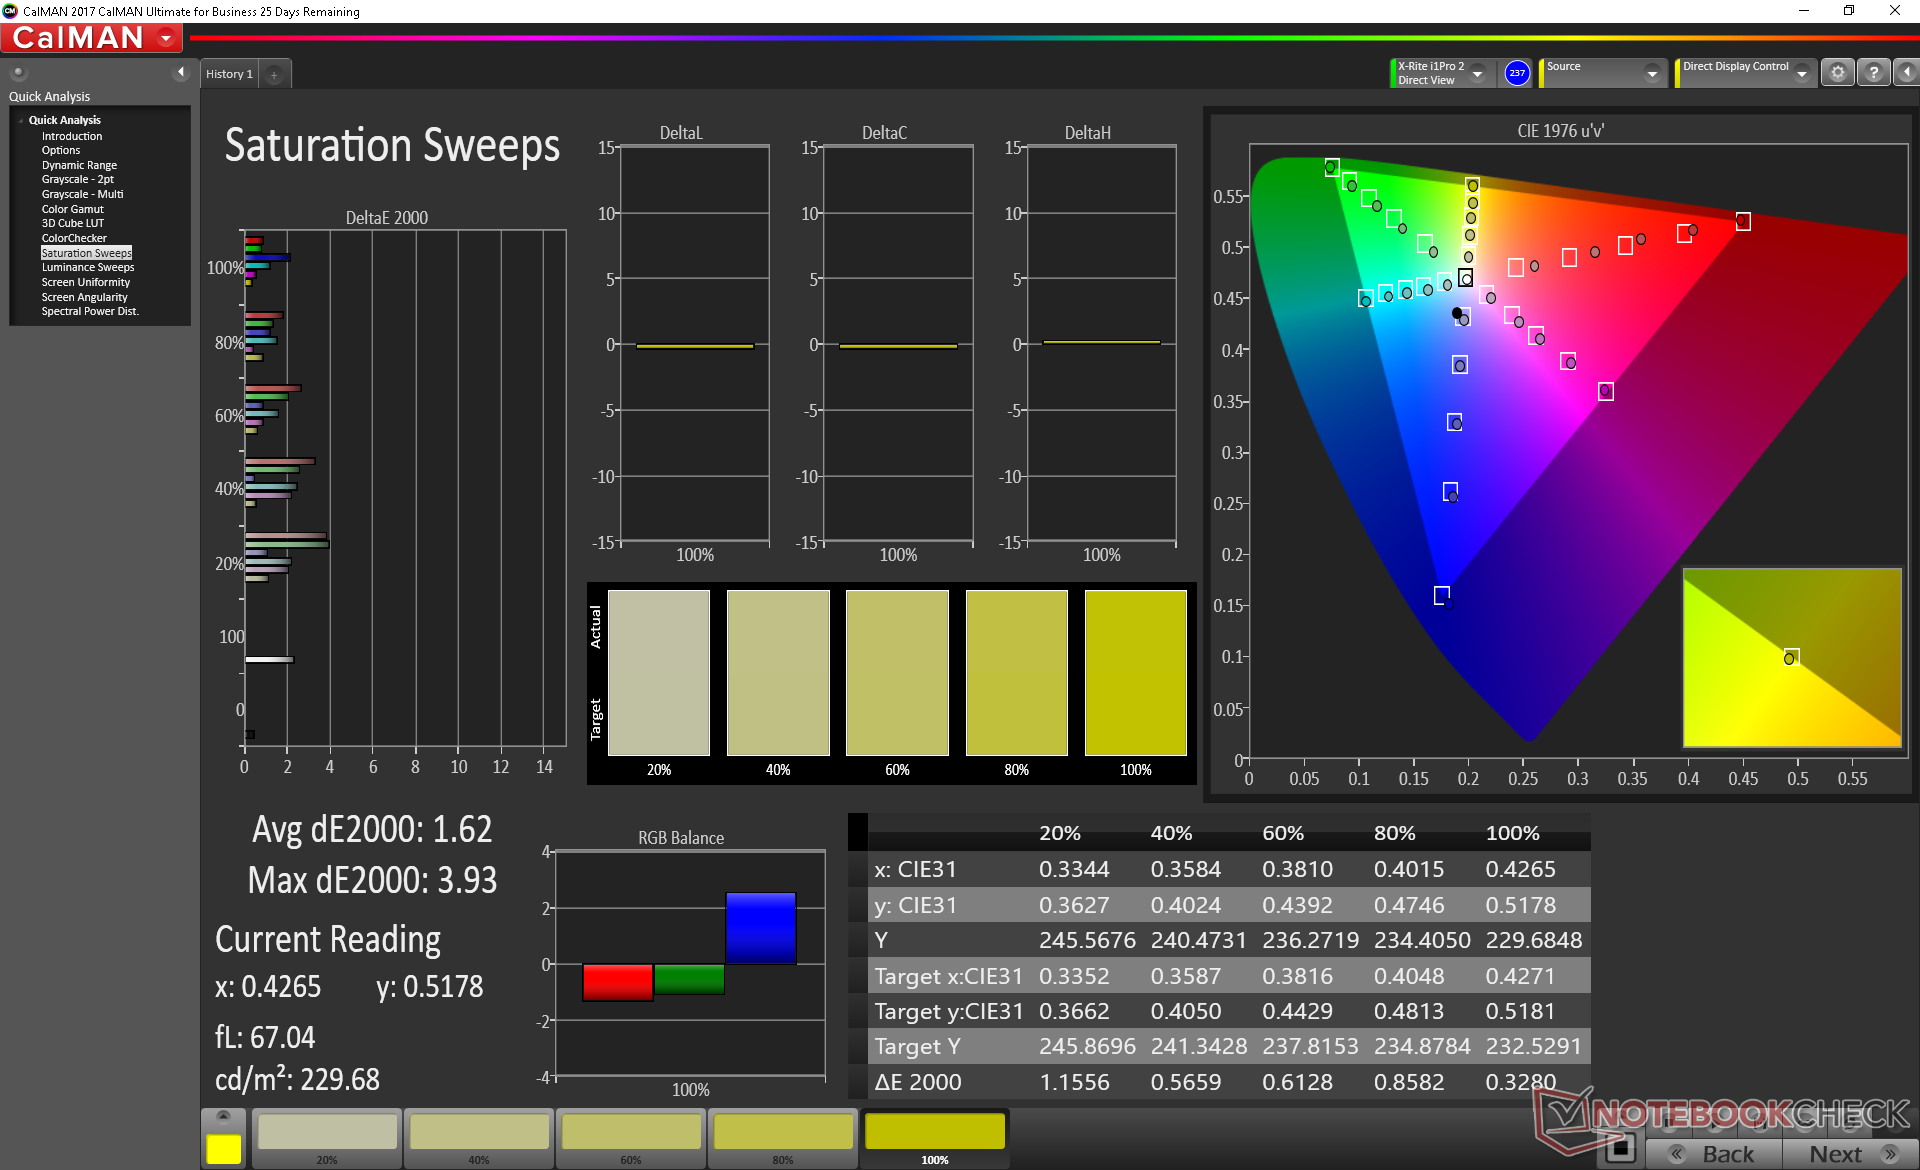
Renk alanı neredeyse P65 Creator ile aynıdır ve Microsoft Surface Laptop 3 15 dahil olmak üzere çoğu alt 4K dizüstü bilgisayarlardan daha geniştir. MSI, bağımsız ölçümlerimizle onaylayabildiğimiz tam AdobeRGB kapsamı talep etmektedir.
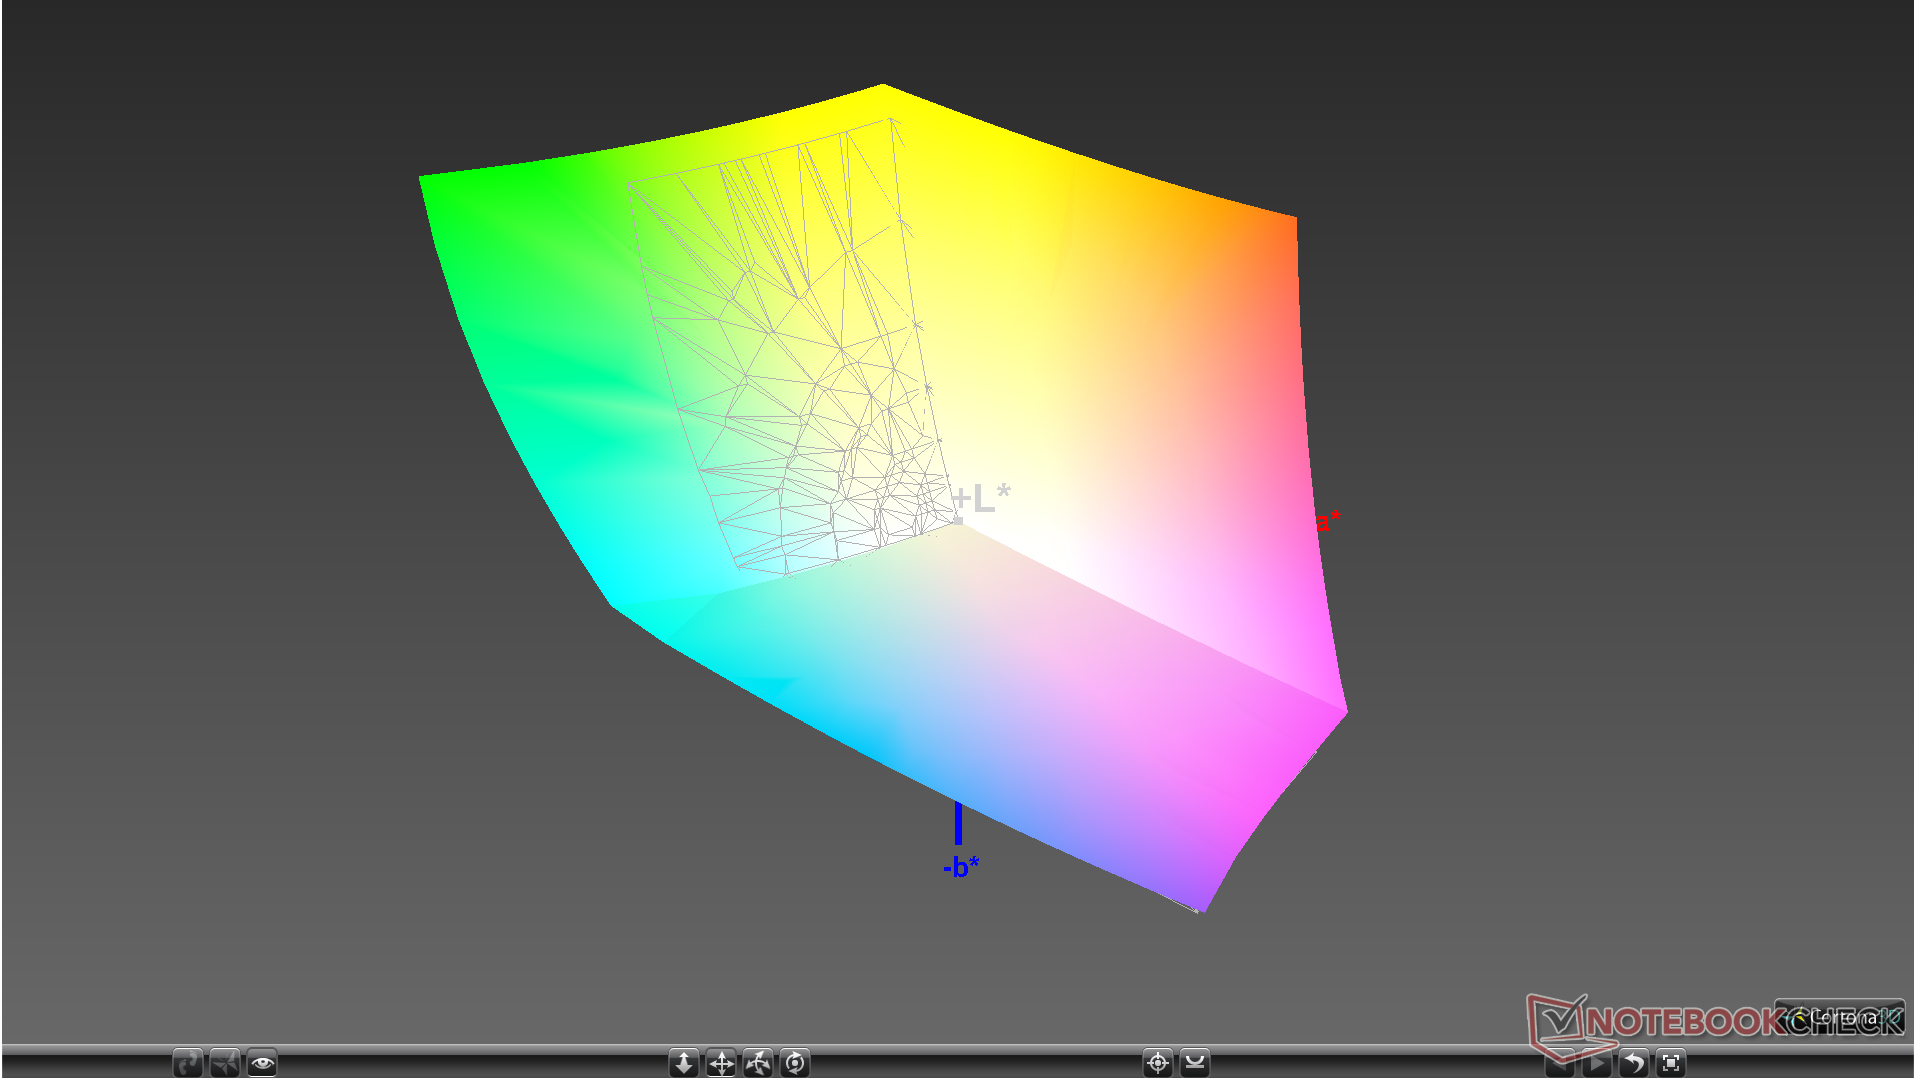
MSI, 2'den düşük bir DeltaE değeri sunar - dizüstü bilgisayarların çoğu kutudan çıktığı için zorlu bir iddiadır. Neyse ki, kendi ölçümlerimiz gerçekten sadece 1.3 ve 1.57 olan gri tonlama ve renk doygunluk deltaE değerlerini doğrulayabilir. Düşük doygunluk seviyelerinde renkler biraz daha doğru olsa bile, son kullanıcı kalibrasyonu gerekli olmayacaktır.

Yanıt Sürelerini Görüntüle
| ↔ Tepki Süresi Siyahtan Beyaza | ||
|---|---|---|
| 41.2 ms ... yükseliş ↗ ve sonbahar↘ birleşimi | ↗ 22.8 ms yükseliş | 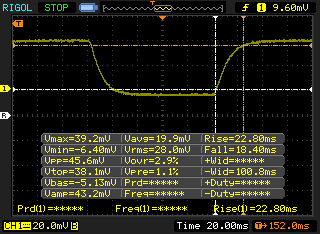 |
| ↘ 18.4 ms sonbahar | ||
| Ekran, testlerimizde yavaş yanıt oranları gösteriyor ve oyuncular için yetersiz olacaktır. Karşılaştırıldığında, test edilen tüm cihazlar 0.1 (minimum) ile 240 (maksimum) ms arasında değişir. » Tüm cihazların 98 %'si daha iyi. Bu, ölçülen yanıt süresinin test edilen tüm cihazların ortalamasından (19.8 ms) daha kötü olduğu anlamına gelir. | ||
| ↔ Tepki Süresi %50 Griden %80 Griye | ||
| 60 ms ... yükseliş ↗ ve sonbahar↘ birleşimi | ↗ 29.2 ms yükseliş | 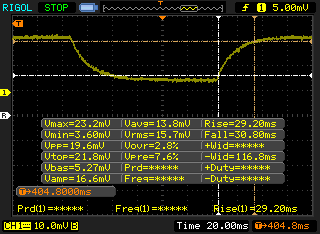 |
| ↘ 30.8 ms sonbahar | ||
| Ekran, testlerimizde yavaş yanıt oranları gösteriyor ve oyuncular için yetersiz olacaktır. Karşılaştırıldığında, test edilen tüm cihazlar 0.165 (minimum) ile 636 (maksimum) ms arasında değişir. » Tüm cihazların 96 %'si daha iyi. Bu, ölçülen yanıt süresinin test edilen tüm cihazların ortalamasından (30.9 ms) daha kötü olduğu anlamına gelir. | ||
Ekran Titremesi / PWM (Darbe Genişliği Modülasyonu)
| Ekran titriyor / PWM algılandı | 26040 Hz | ≤ 24 % parlaklık ayarı | 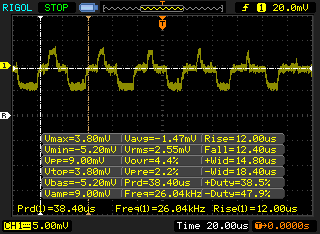 |
Ekran arka ışığı 26040 Hz'de titriyor (en kötü durum, örneğin PWM kullanılması) 24 % ve altındaki parlaklık ayarında titreme algılandı. Bu parlaklık ayarının üzerinde titreme veya PWM olmamalıdır. 26040 Hz frekansı oldukça yüksektir, bu nedenle PWM'ye duyarlı çoğu kullanıcı herhangi bir titremeyi fark etmemelidir. Karşılaştırıldığında: Test edilen tüm cihazların %52 %'si ekranı karartmak için PWM kullanmıyor. PWM tespit edilirse, ortalama 7741 (minimum: 5 - maksimum: 343500) Hz ölçüldü. | |||
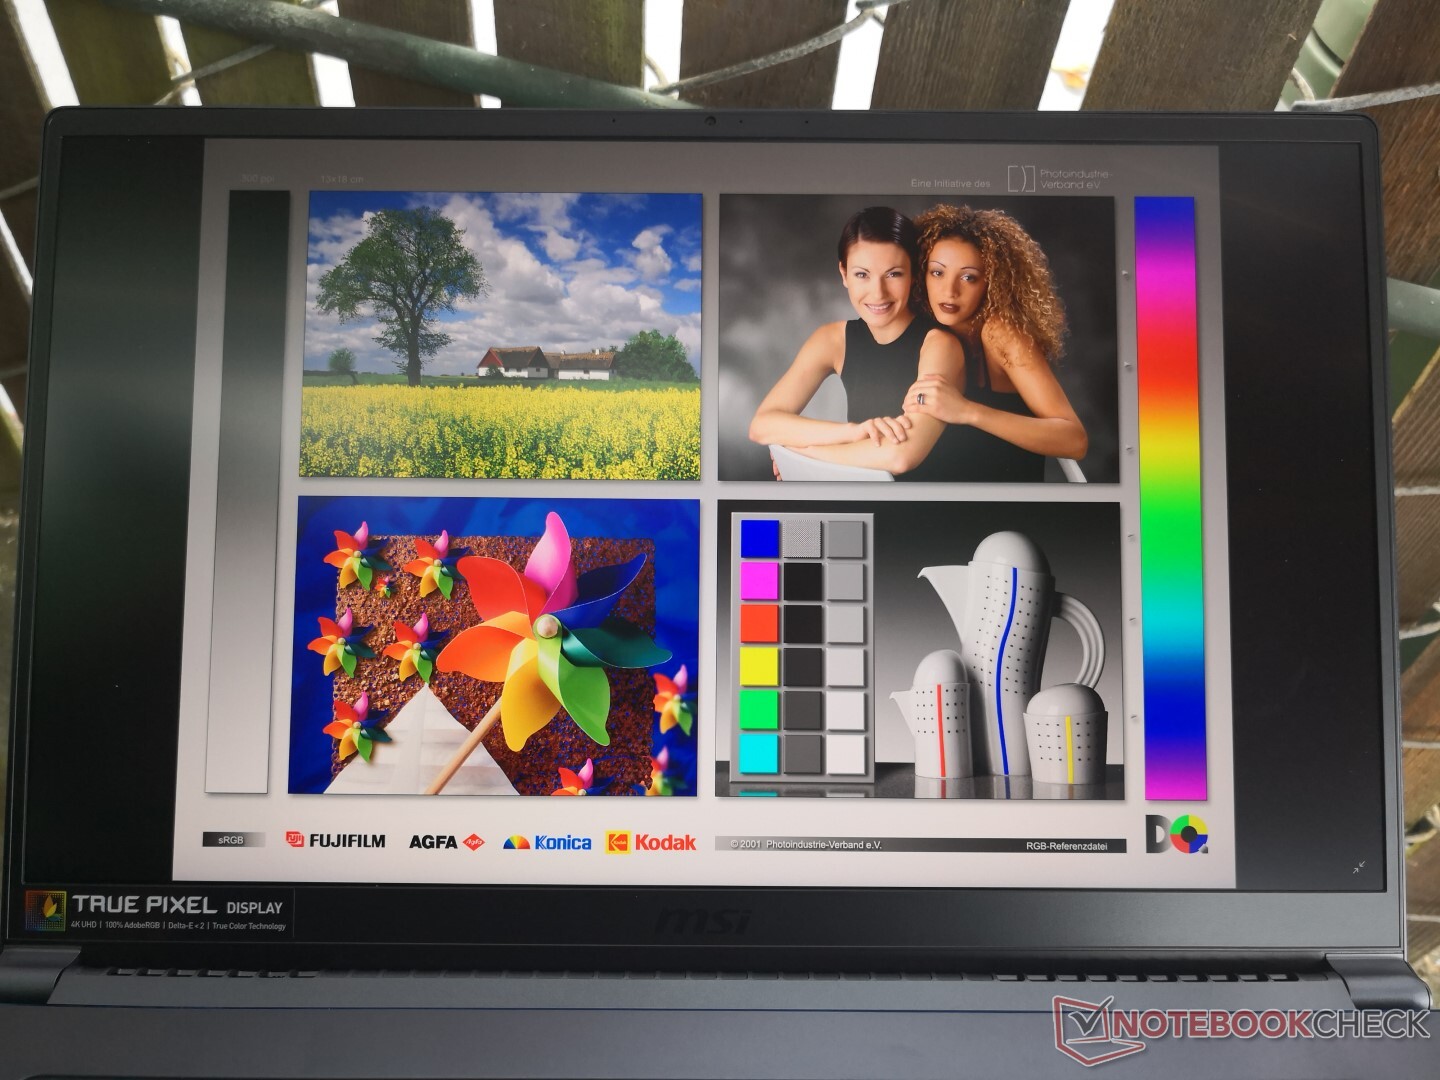
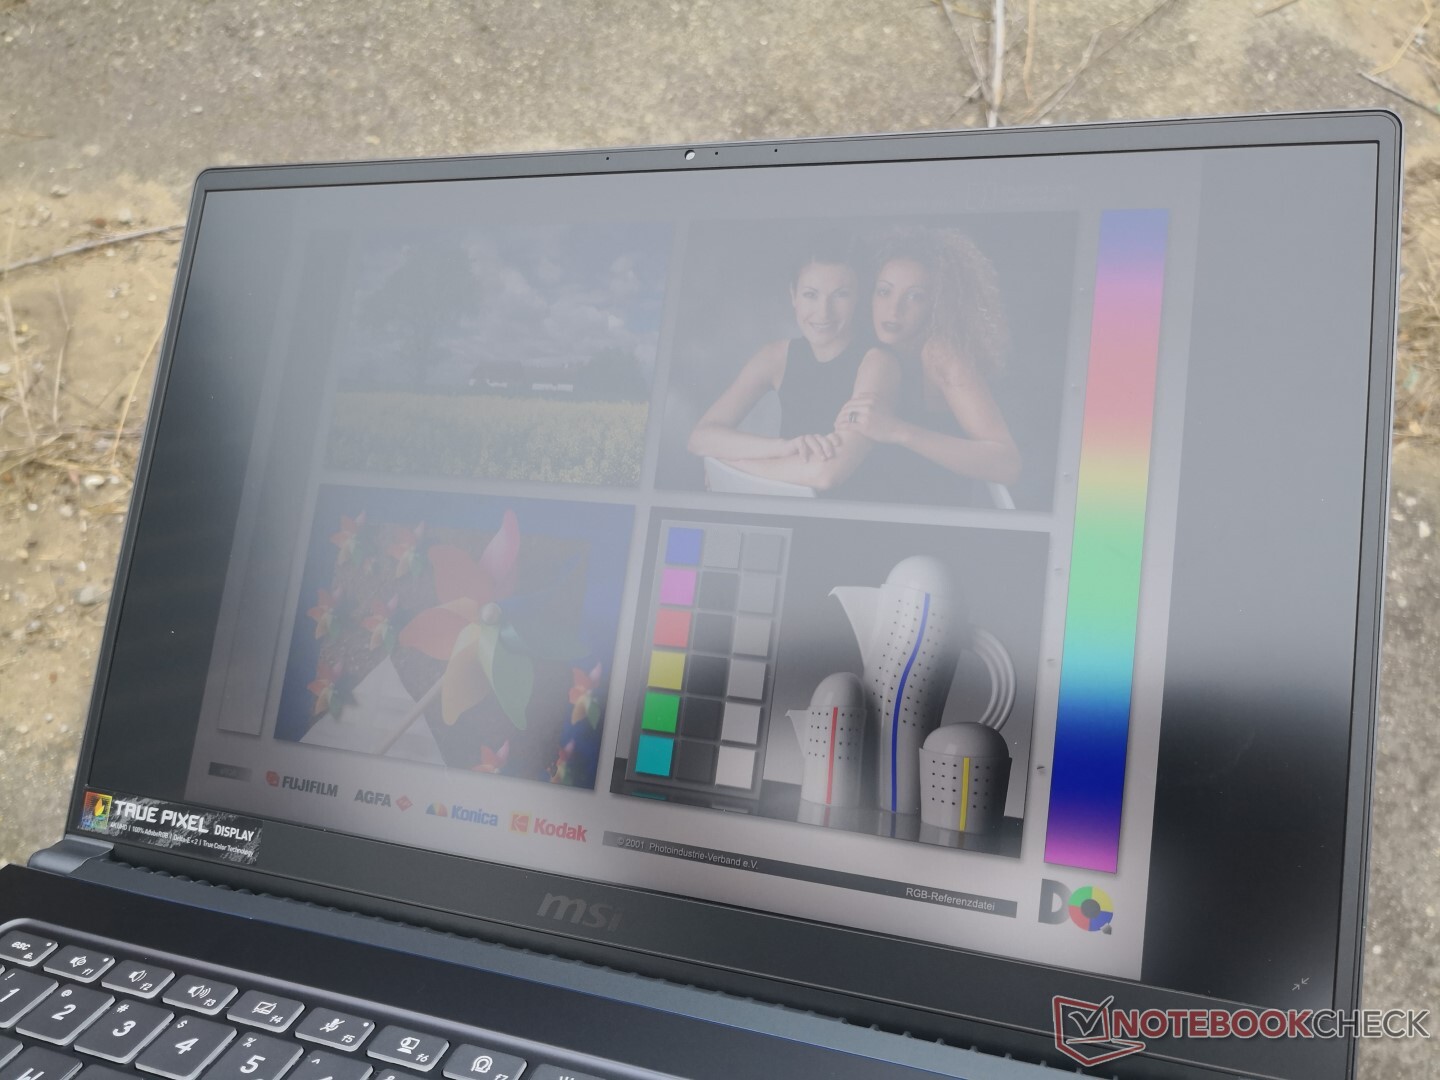
Dış mekan görüşü, P65 Creator'da olduğu kadar iyidir, çünkü parlaklık aralarında neredeyse aynıdır. Ekran, ThinkPad T590 ve daha ucuz Ultrabook'lardaki ekrandan çok daha parlak. Bakış açıları, bir IPS panelinden beklenildiği gibi geniştir.
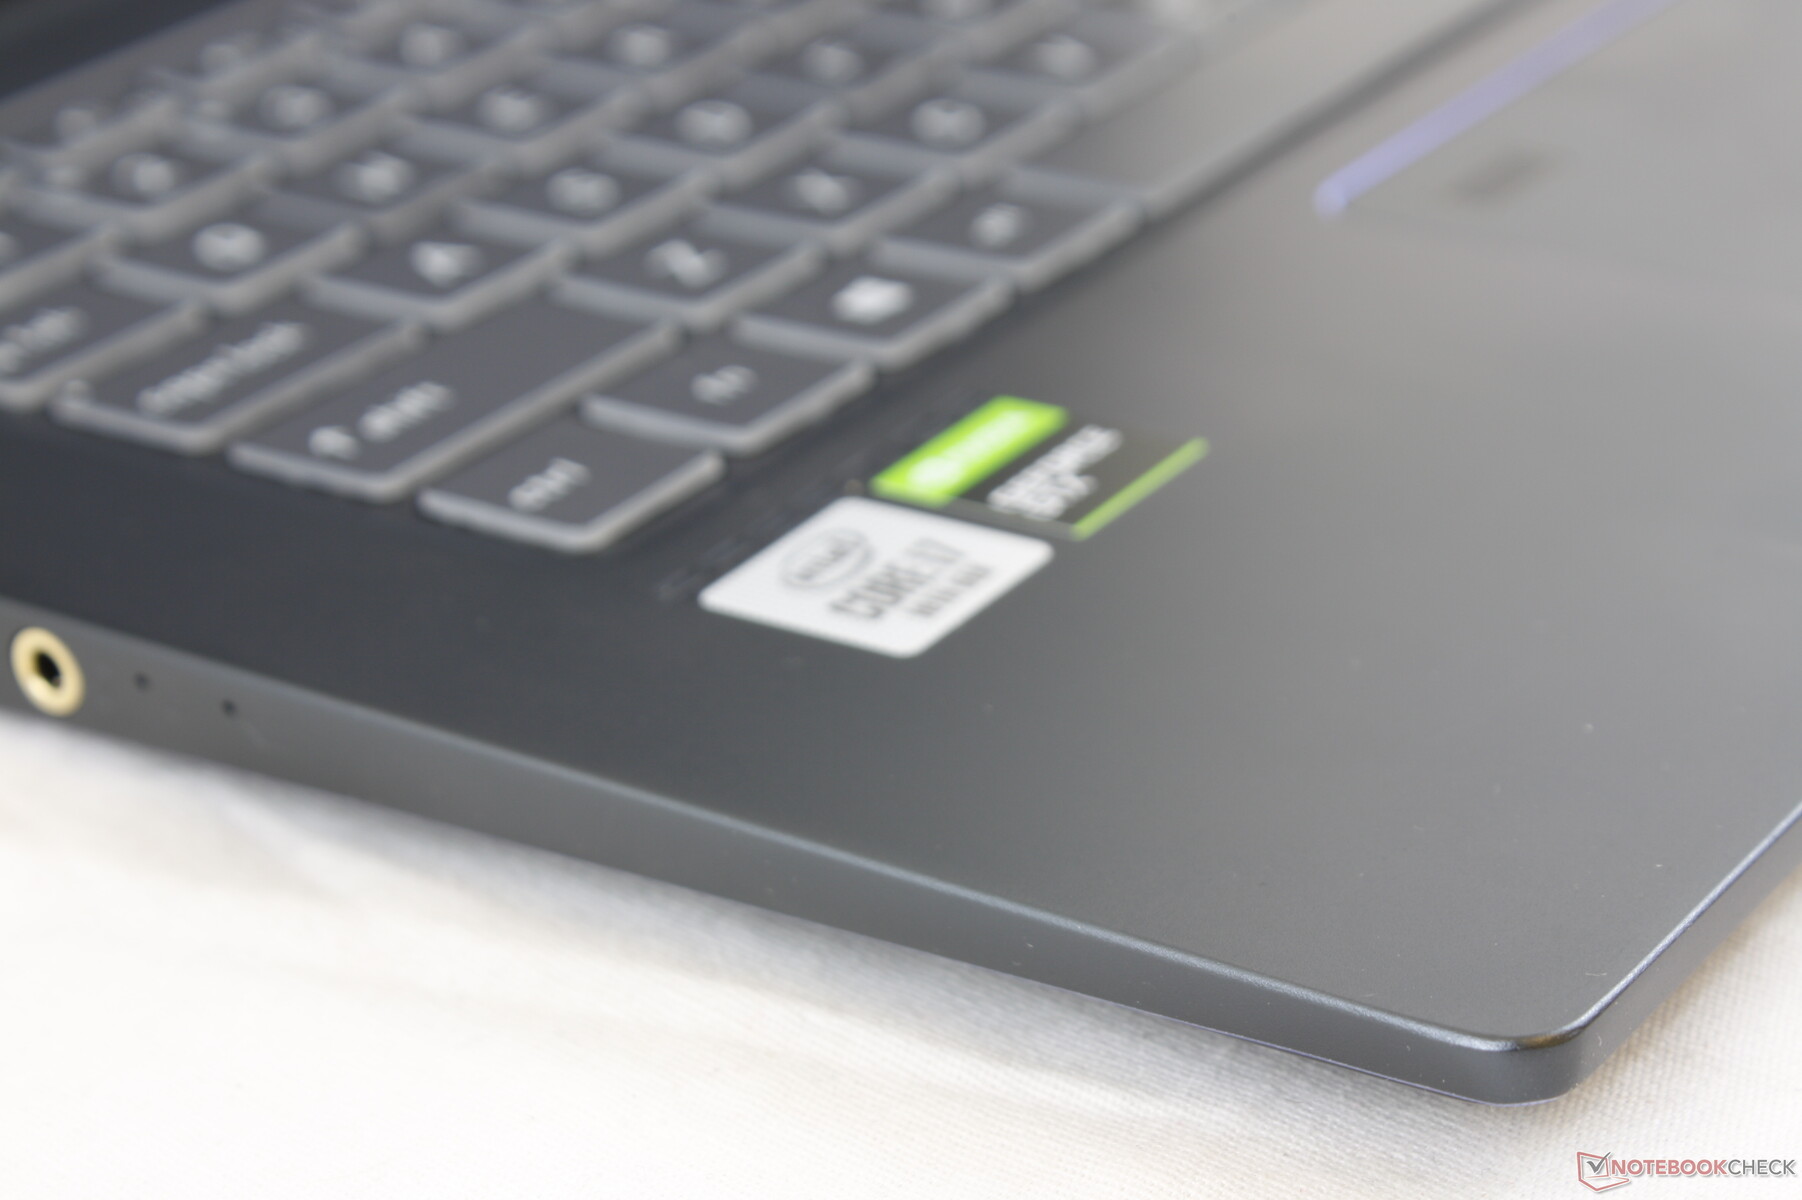
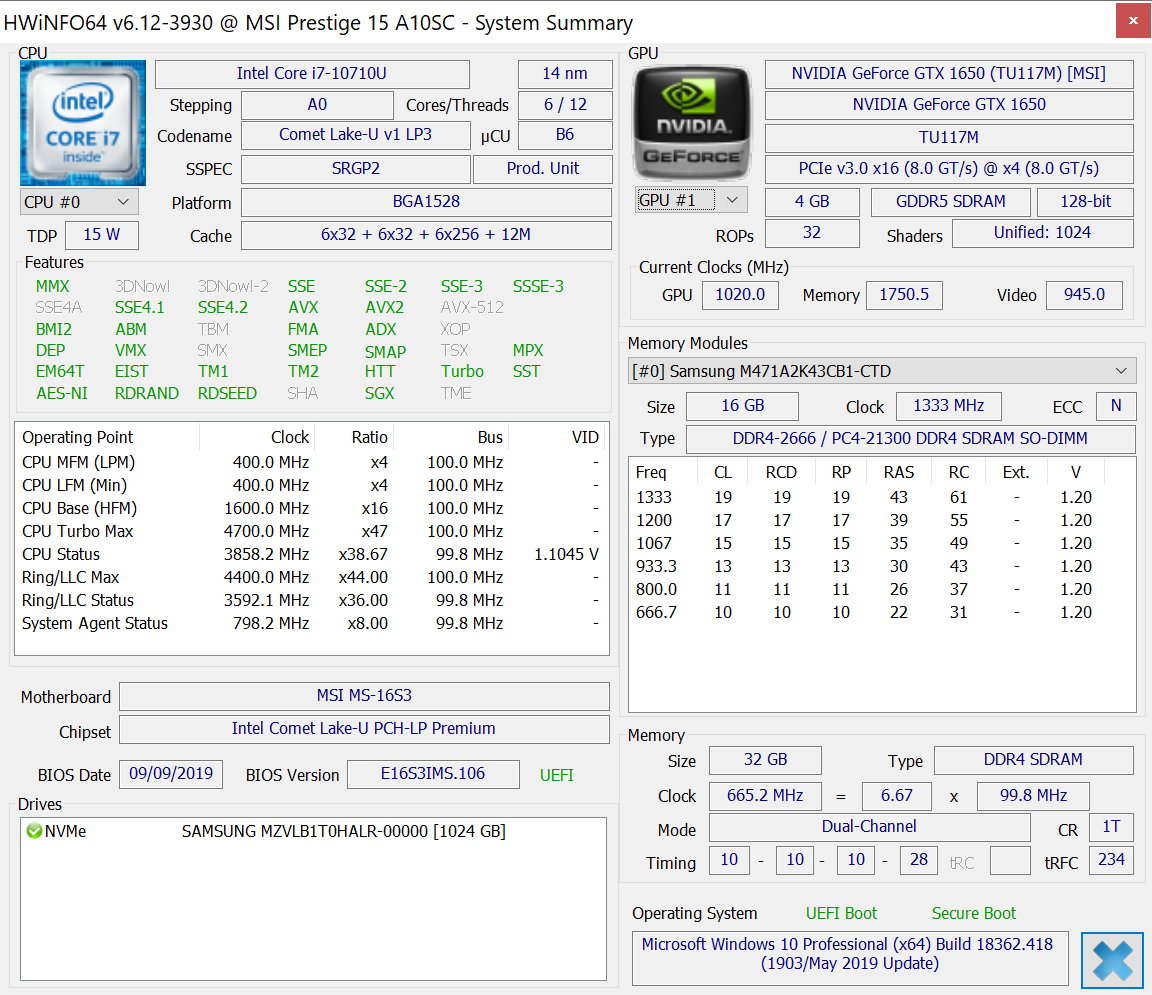
Performans - MSI'nin ilk ULV Hexa-core Laptopu
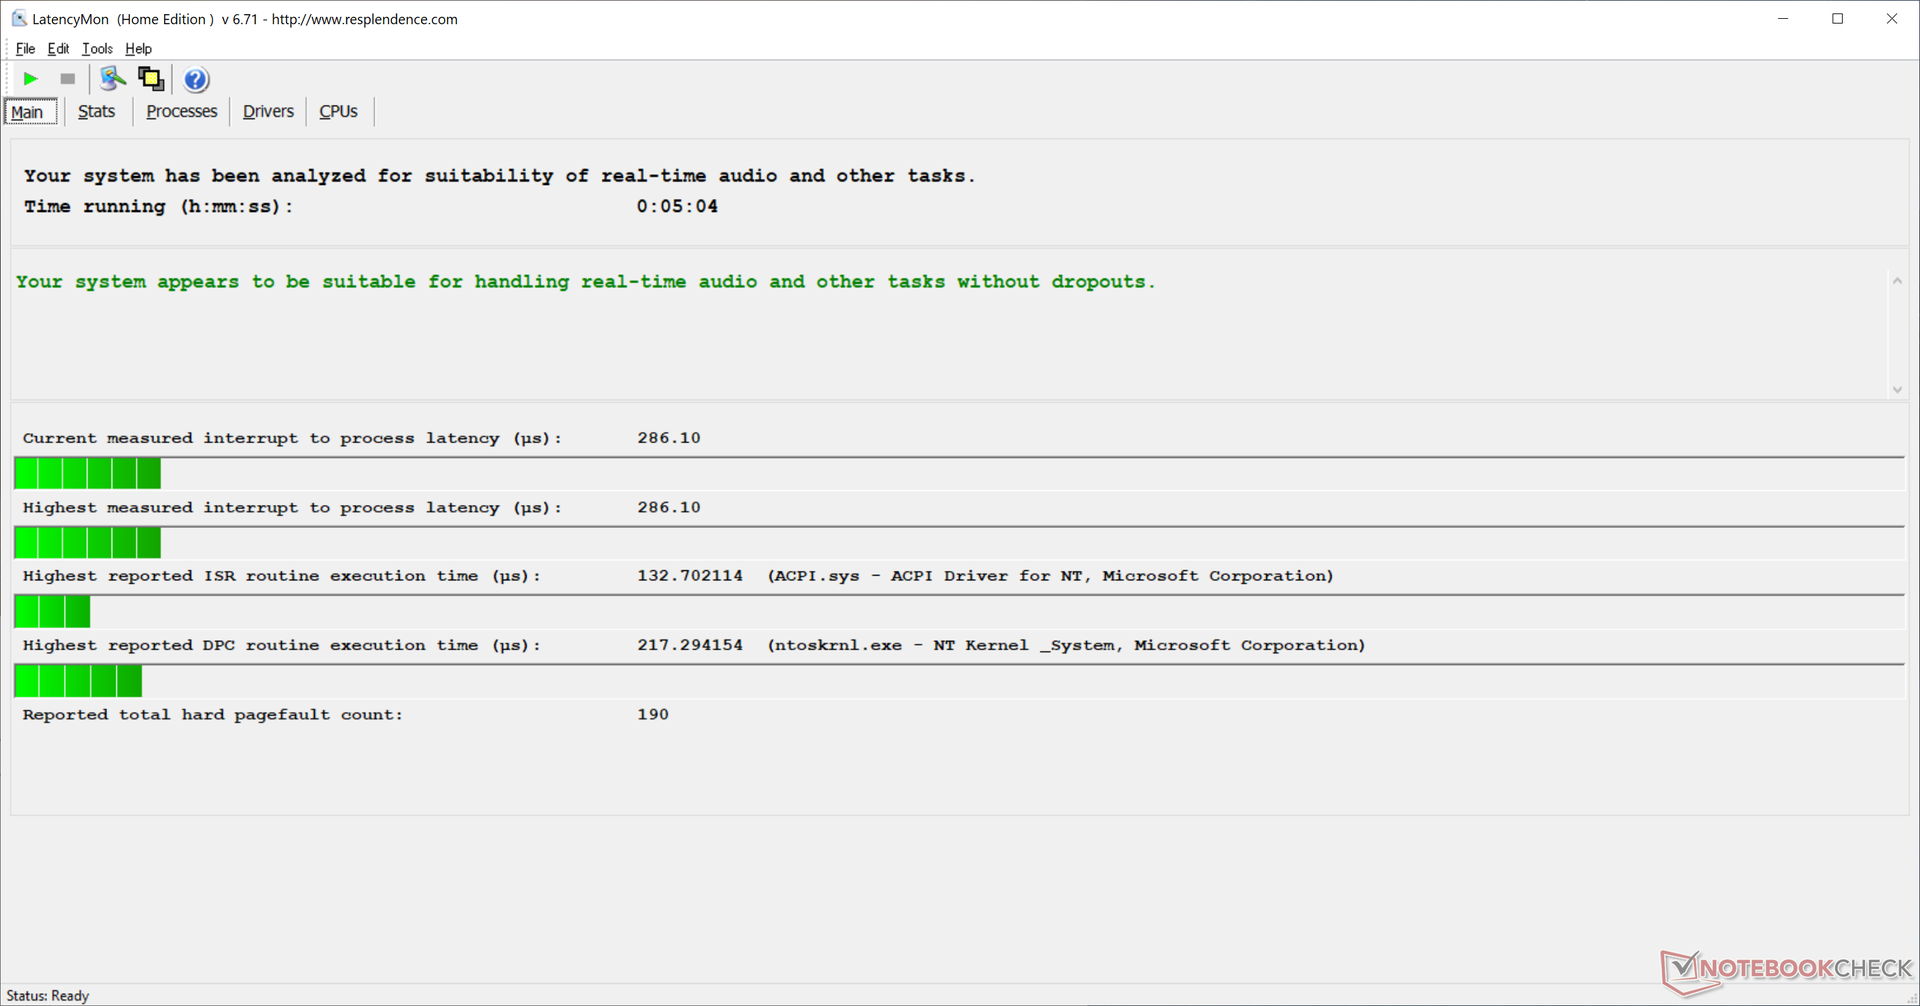
Nispeten ince olmasına ve Intel U serisi bir işlemciye sahip olmasına rağmen, Prestige 15, son nesil dört çekirdekli Core'un yerini alacak altı yüzlü Core i7-10710U CPU ve ayrık GeForce GTX 1650 Max-Q grafikleriyle yüksek performanslı kullanıcıları hedefliyor sırasıyla, i7-8565U ve GeForce GTX 1050. Şimdilik Core i3 / i5 ya da entegre GPU seçenekleri mevcut değil. Nvidia Optimus, UHD Graphics 620'ye otomatik grafik geçişi için standart olarak geliyor. LatencyMon, XPS 15'te kablosuz olarak etkinleştirildiği halde bile DPC gecikme sorunları göstermiyor.
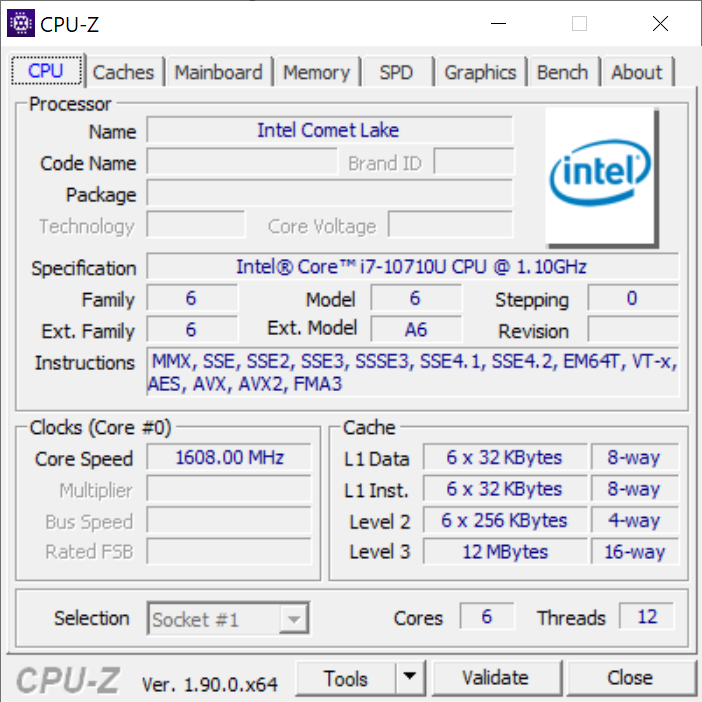
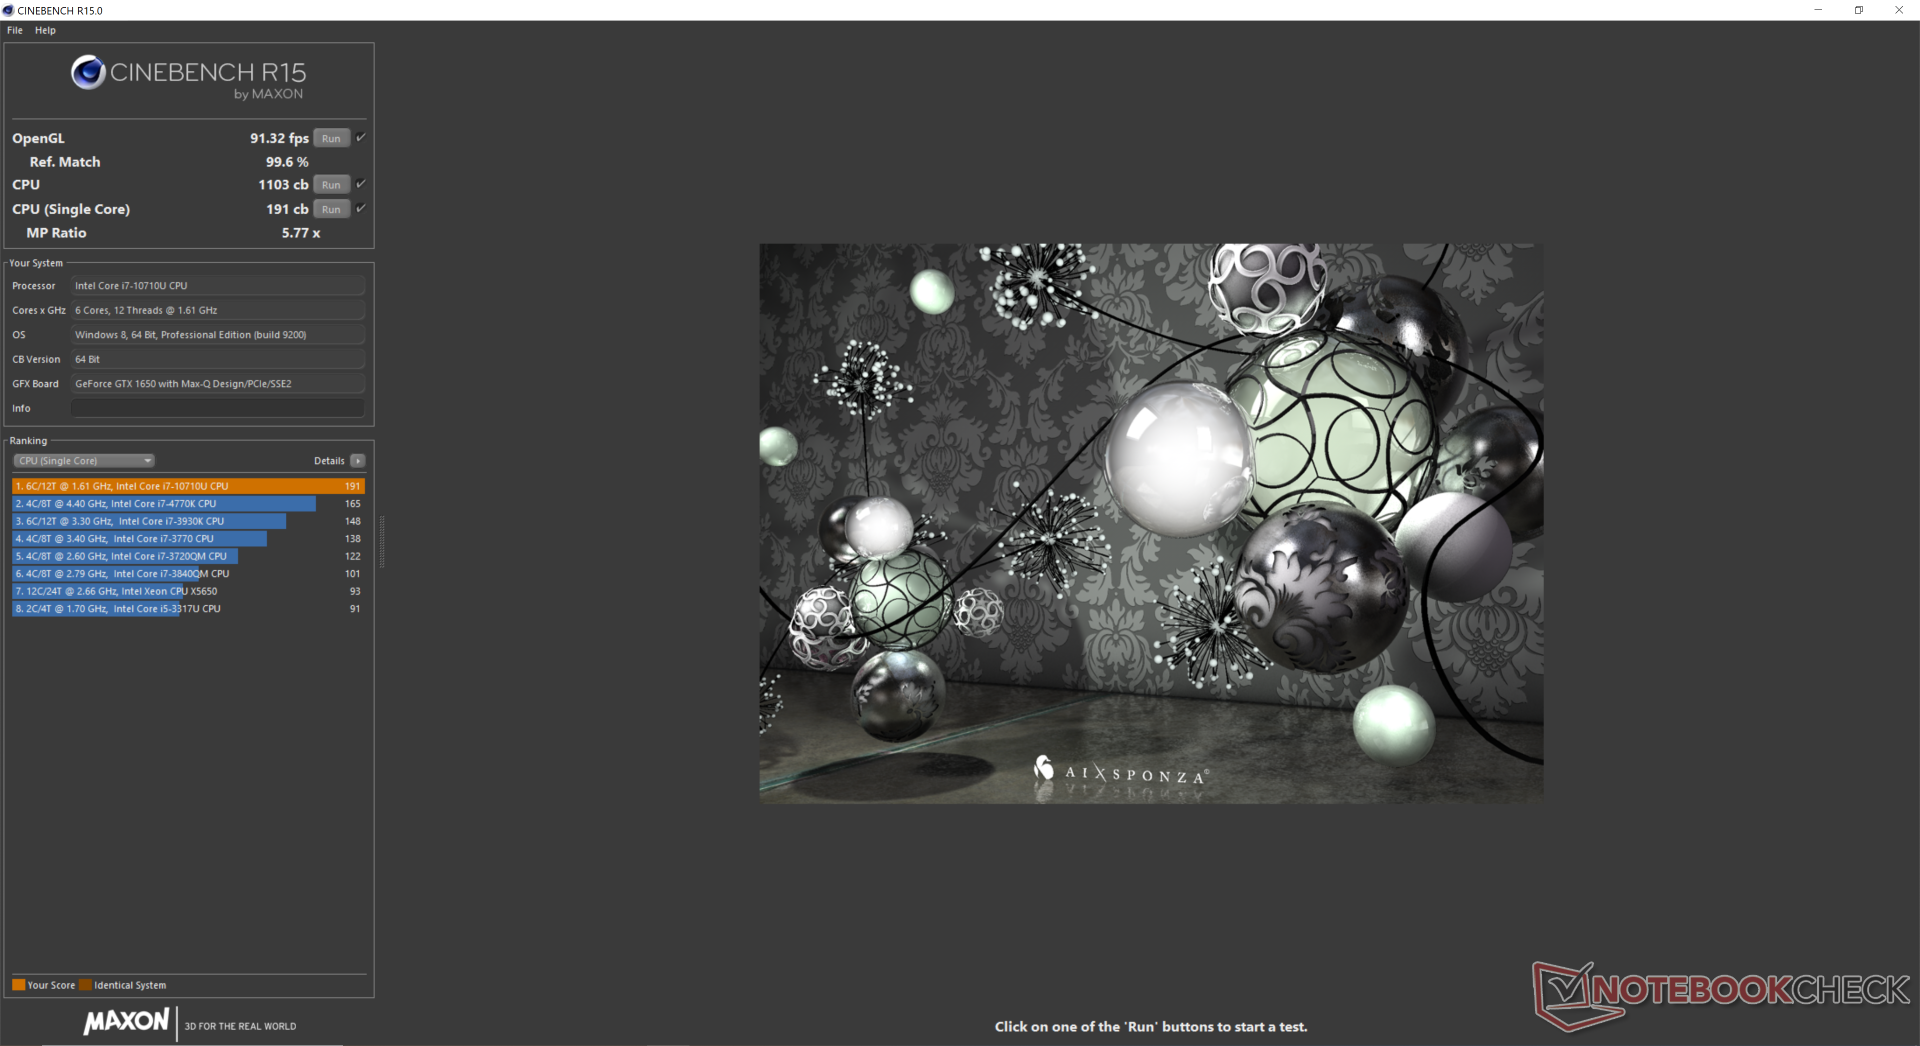
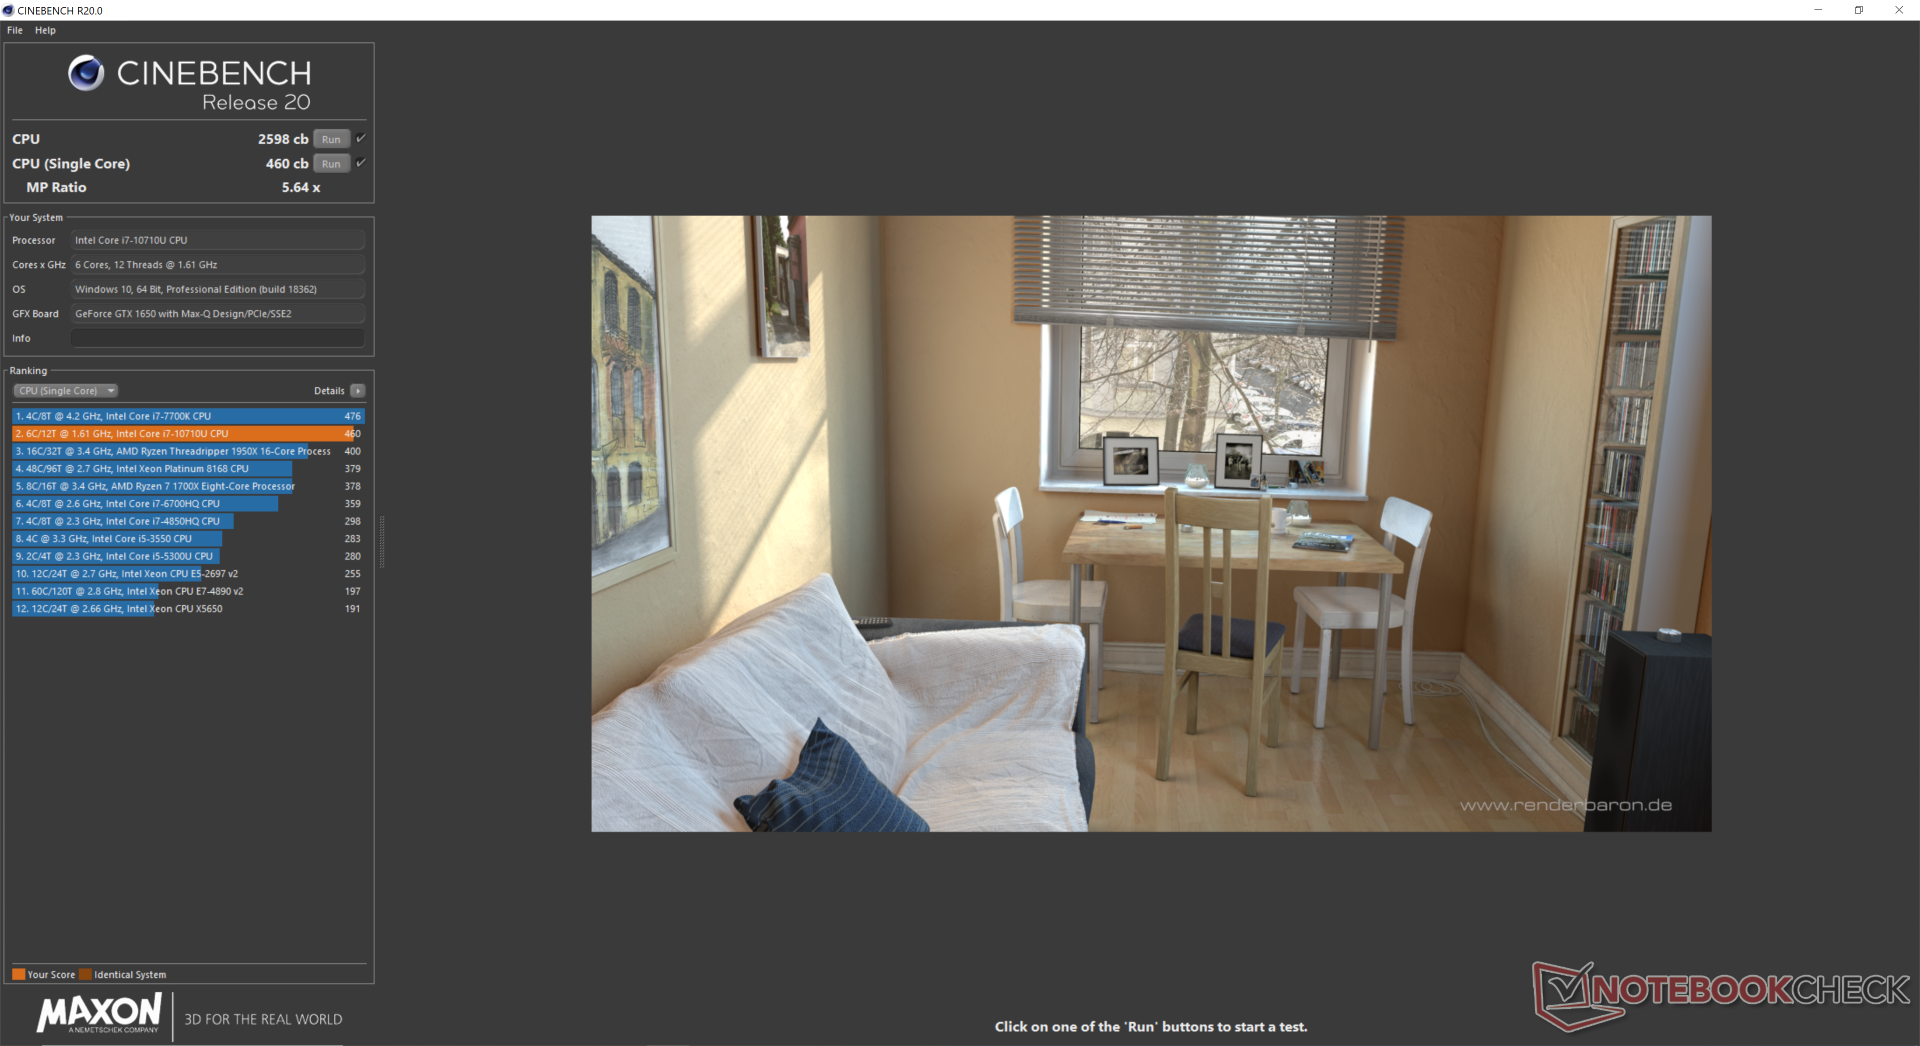
İşlemci
CineBench sonuçları, çok çekirdekli Core i7-8750H ve Core i7-9750H ile ham çoklu iş parçacığı puanlarının boyun boğazı olması nedeniyle etkileyicidir. Performans sürekliliği ayrıca, özellikle aynı heksa çekirdekli CPU ile Dell XPS 13 7390'da gözlemlediklerimizle karşılaştırıldığında, aşağıdaki CineBench R15 Çok İplikli döngü testimizde gösterildiği gibi mükemmel. Kullanıcılar Core i7-1065G7, Core i5-8300H ve Core i5-9300H'den yüzde 30 ila 35 daha hızlı veya Core i7-8565U'dan yüzde 60 daha hızlı performans bekleyebilirler. Ancak, mükemmel CineBench puanları yanıltıcı olabilir. Prime95 Stres Testimiz, CPU kesintisiz yüzde 100 kullanıma maruz kaldığında saat hızlarının çılgınca sıçrayabileceğini ve kısabileceğini gösterecektir. Daha fazla teknik bilgi ve kıyaslama karşılaştırması için Core i7-10710U'daki özel sayfamıza bakın.
| Cinebench R15 | |
| CPU Single 64Bit | |
| Schenker XMG Ultra 15 Turing | |
| Alienware m17 P37E | |
| MSI Prestige 15 A10SC | |
| MSI GE75 9SG | |
| Lenovo ThinkPad P53s-20N6001NGE | |
| Razer Blade Pro 17 4K UHD 120 Hz | |
| Ortalama Intel Core i7-10710U (138 - 194, n=8) | |
| Dell XPS 13 7390 2-in-1 Core i7 | |
| Dell G3 3590 | |
| Lenovo Legion Y730-15ICH i5-8300H | |
| Dell Inspiron 15 5000 5585 | |
| CPU Multi 64Bit | |
| MSI GE75 9SG | |
| Schenker XMG Ultra 15 Turing | |
| Alienware m17 P37E | |
| MSI Prestige 15 A10SC | |
| Razer Blade Pro 17 4K UHD 120 Hz | |
| Ortalama Intel Core i7-10710U (513 - 1113, n=8) | |
| Dell XPS 13 7390 2-in-1 Core i7 | |
| Lenovo Legion Y730-15ICH i5-8300H | |
| Dell G3 3590 | |
| Lenovo ThinkPad P53s-20N6001NGE | |
| Dell Inspiron 15 5000 5585 | |
| Cinebench R11.5 | |
| CPU Single 64Bit | |
| Ortalama Intel Core i7-10710U (2.07 - 2.19, n=3) | |
| Dell XPS 13 7390 2-in-1 Core i7 | |
| Lenovo ThinkPad P53s-20N6001NGE | |
| MSI GE75 9SG | |
| Dell Inspiron 15 5000 5585 | |
| CPU Multi 64Bit | |
| MSI GE75 9SG | |
| Ortalama Intel Core i7-10710U (10.9 - 12.3, n=3) | |
| Dell XPS 13 7390 2-in-1 Core i7 | |
| Dell Inspiron 15 5000 5585 | |
| Lenovo ThinkPad P53s-20N6001NGE | |
| Cinebench R10 | |
| Rendering Multiple CPUs 32Bit | |
| Schenker XMG Ultra 15 Turing | |
| MSI GE75 9SG | |
| Ortalama Intel Core i7-10710U (31463 - 31824, n=2) | |
| Dell XPS 13 7390 2-in-1 Core i7 | |
| Lenovo ThinkPad P53s-20N6001NGE | |
| Rendering Single 32Bit | |
| Lenovo ThinkPad P53s-20N6001NGE | |
| Schenker XMG Ultra 15 Turing | |
| Dell XPS 13 7390 2-in-1 Core i7 | |
| Ortalama Intel Core i7-10710U (6599 - 7345, n=2) | |
| MSI GE75 9SG | |
| wPrime 2.10 - 1024m | |
| Dell XPS 13 7390 2-in-1 Core i7 | |
| Ortalama Intel Core i7-10710U (171.1 - 177.4, n=2) | |
| MSI GE75 9SG | |
* ... daha küçük daha iyidir
Sistem performansı
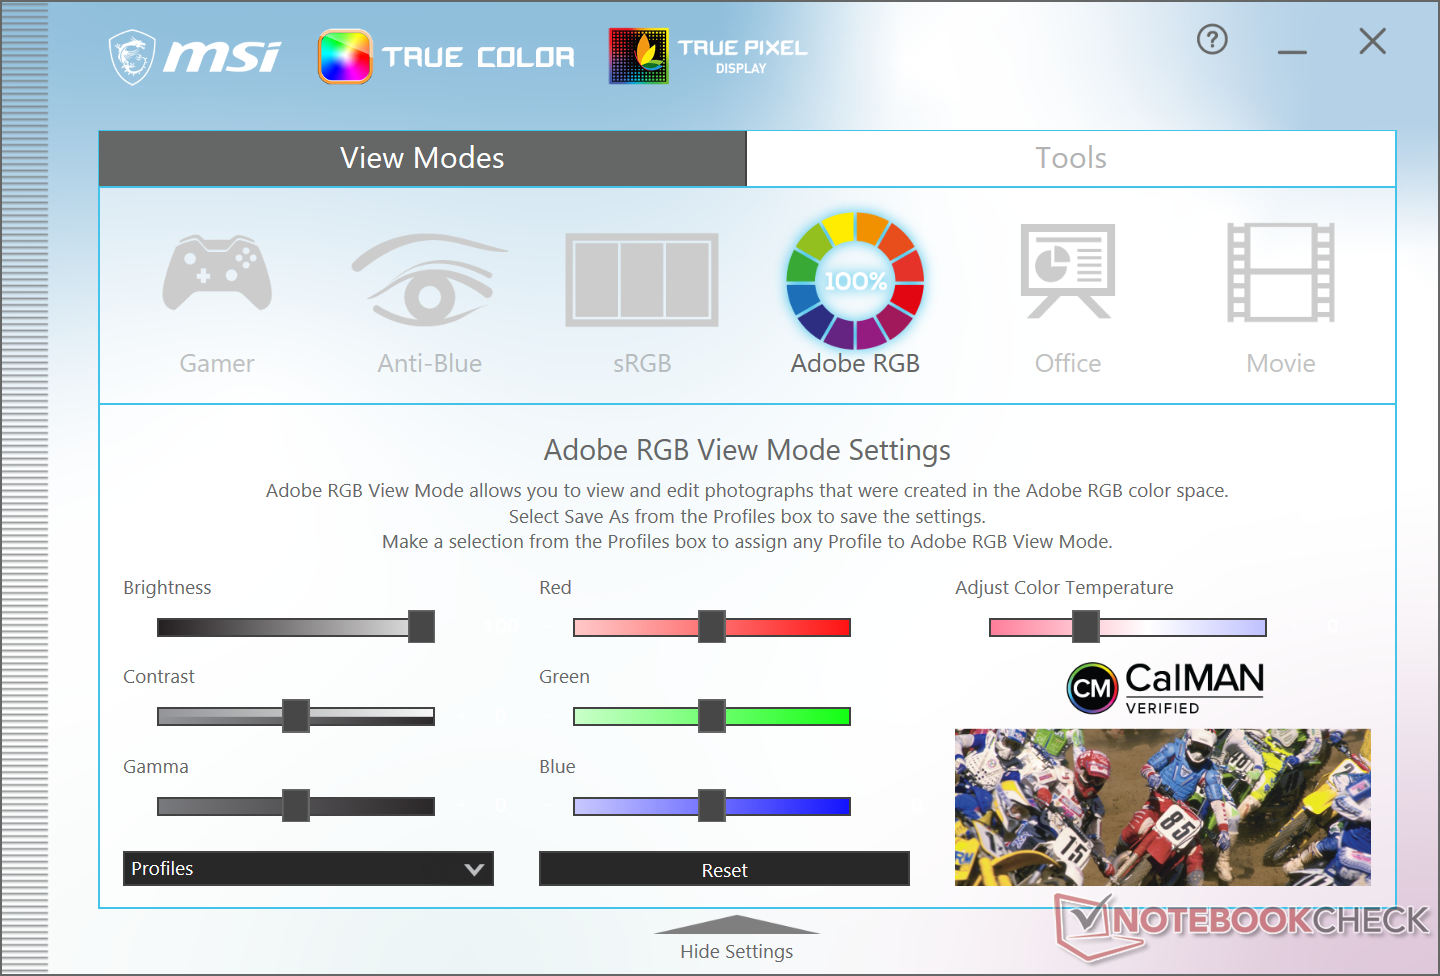
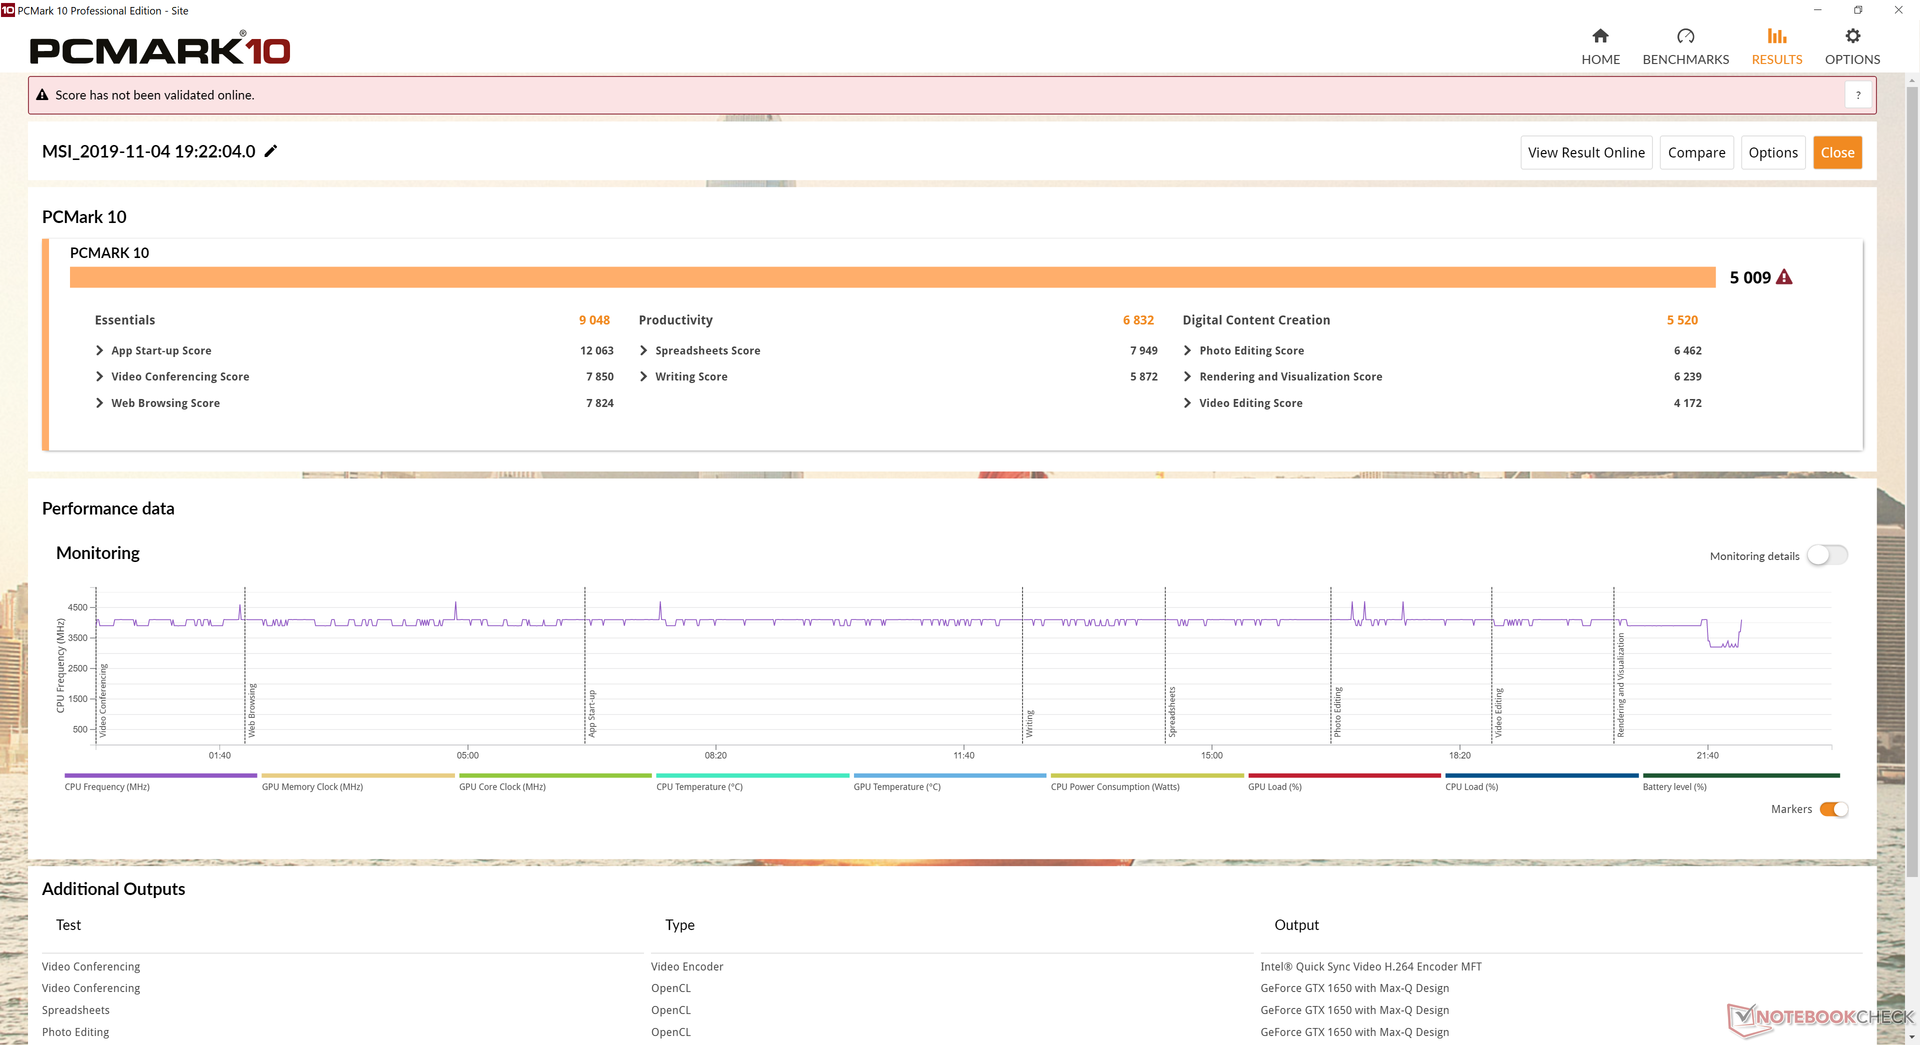
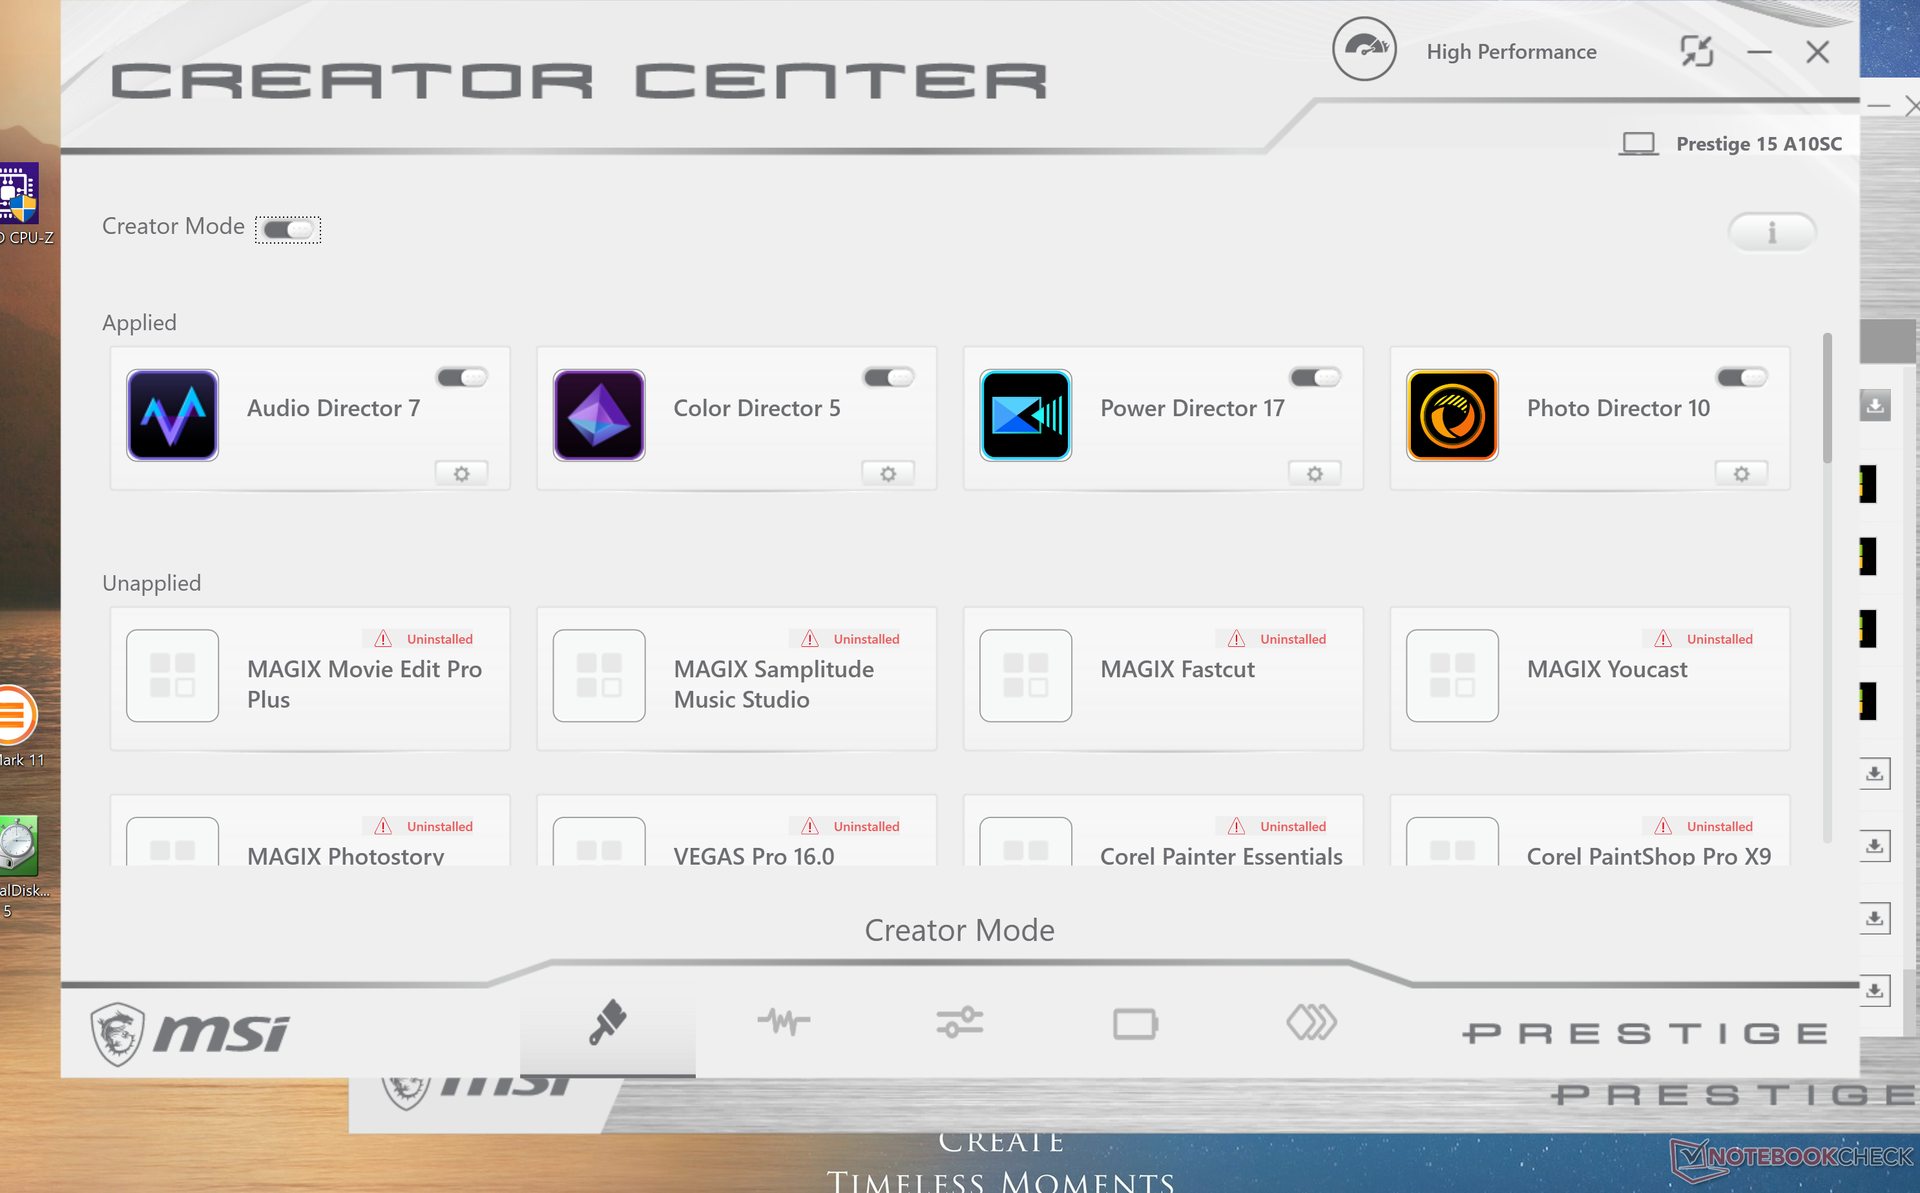
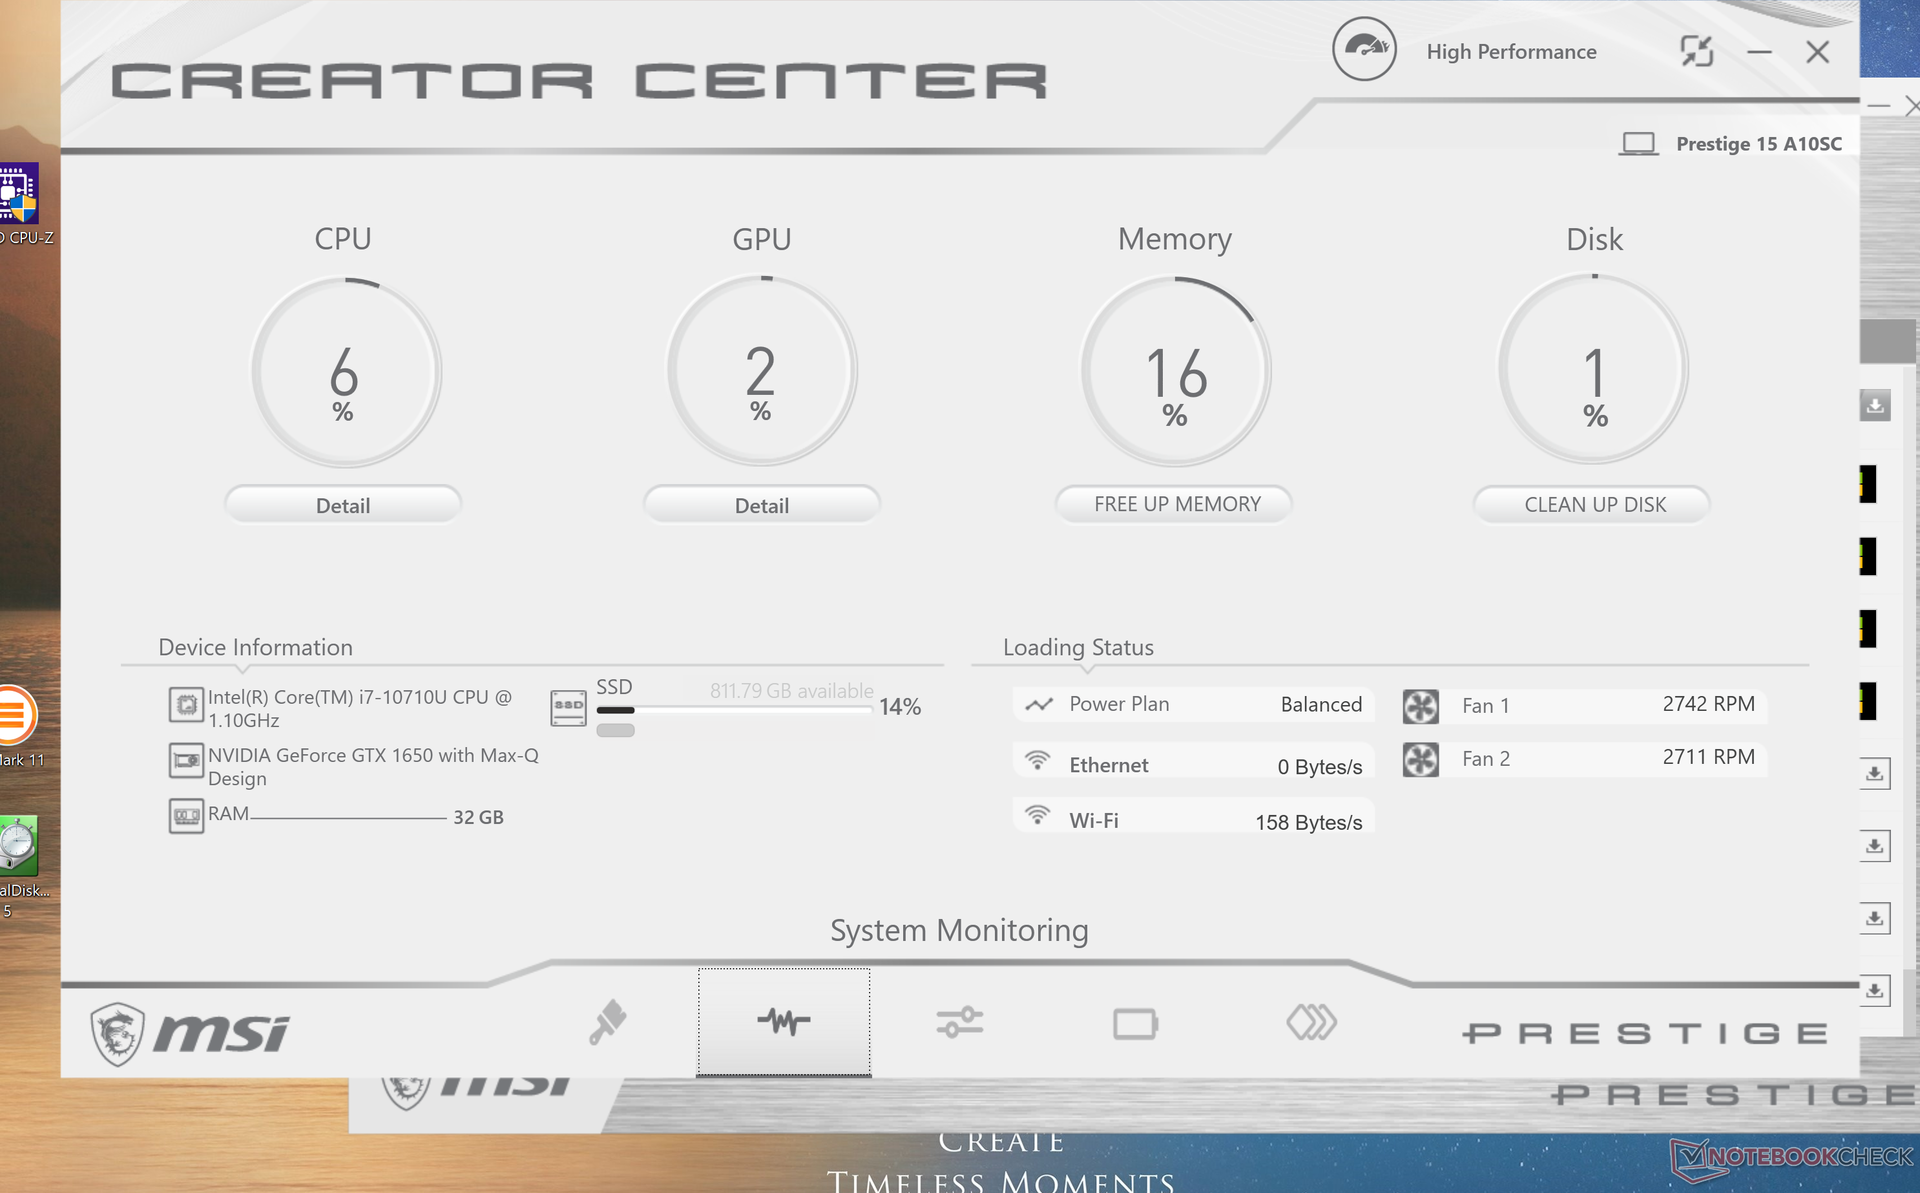
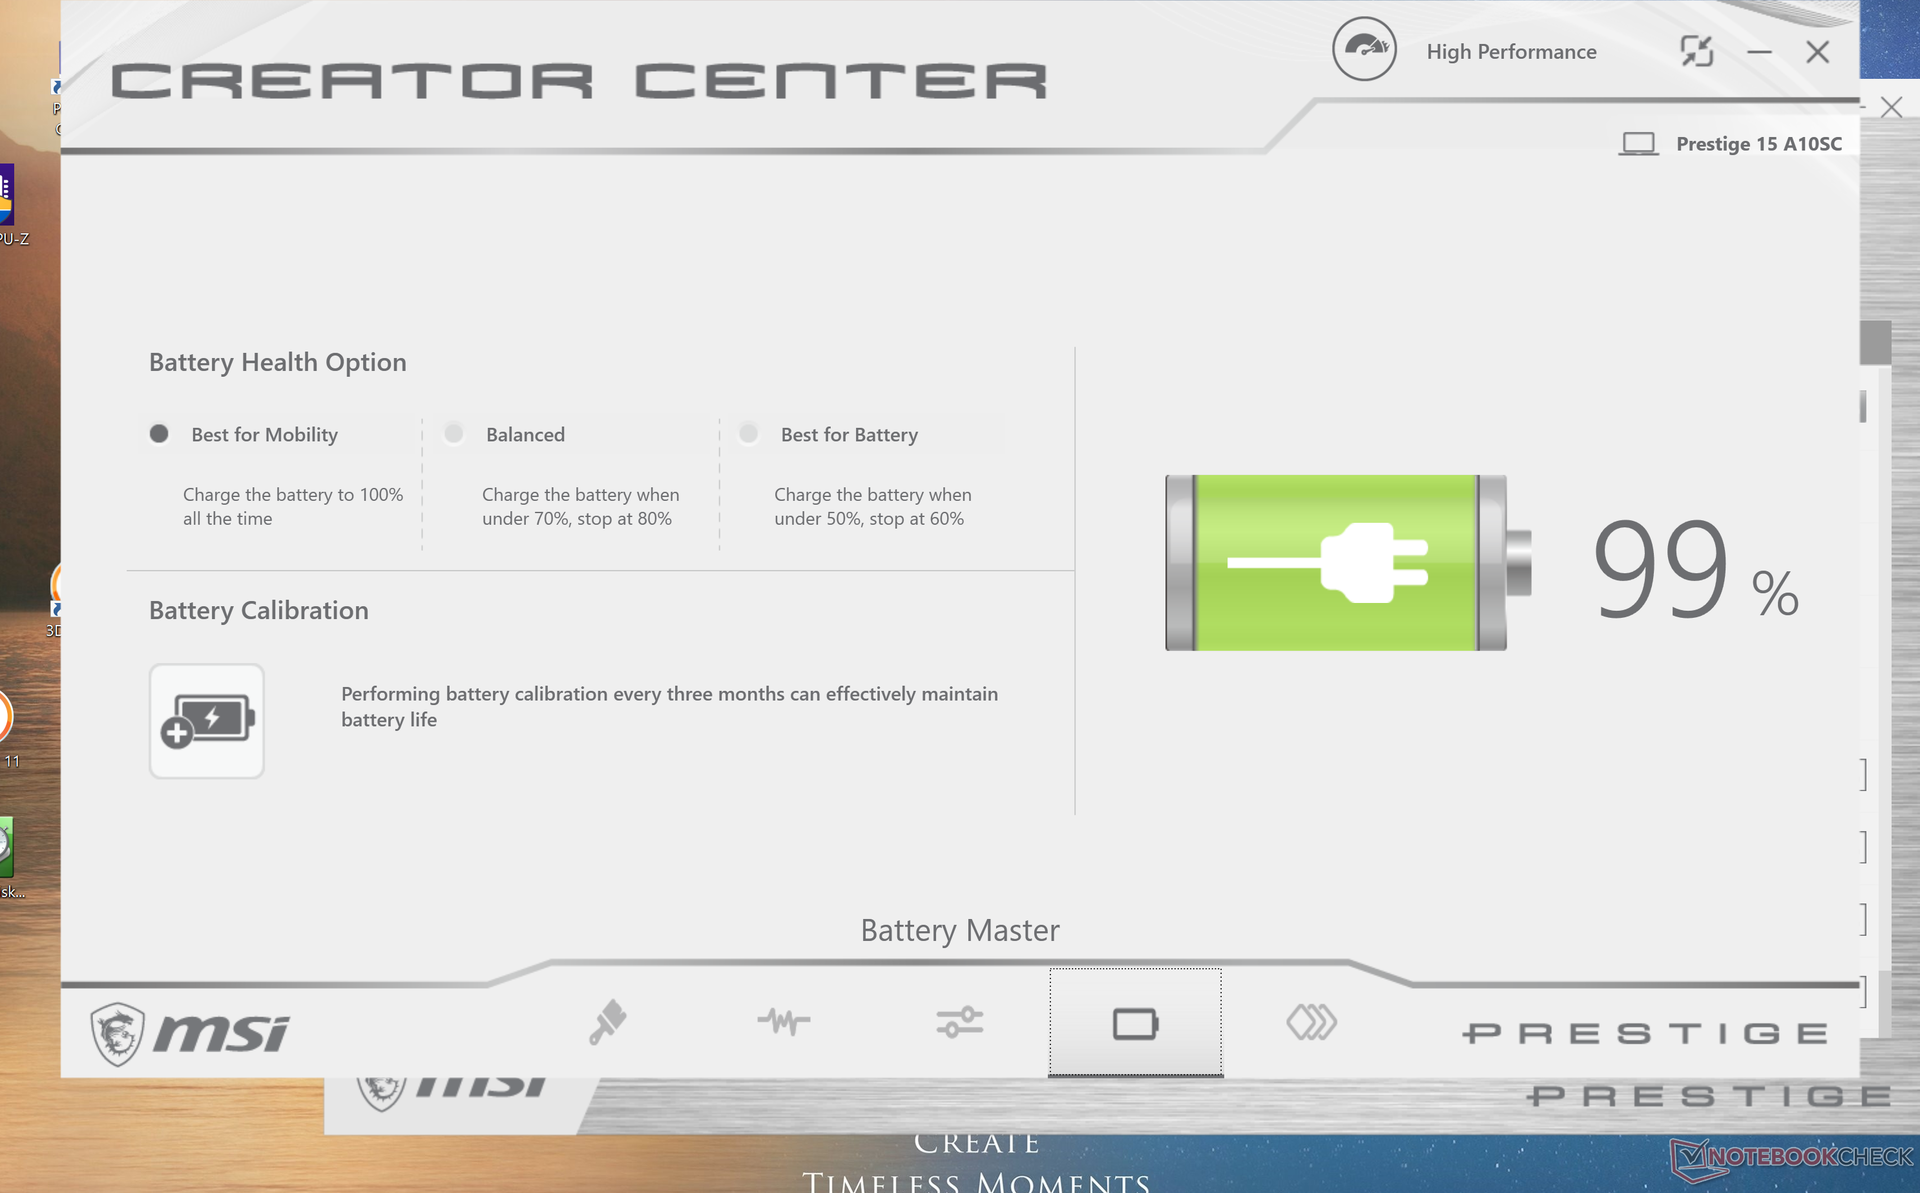
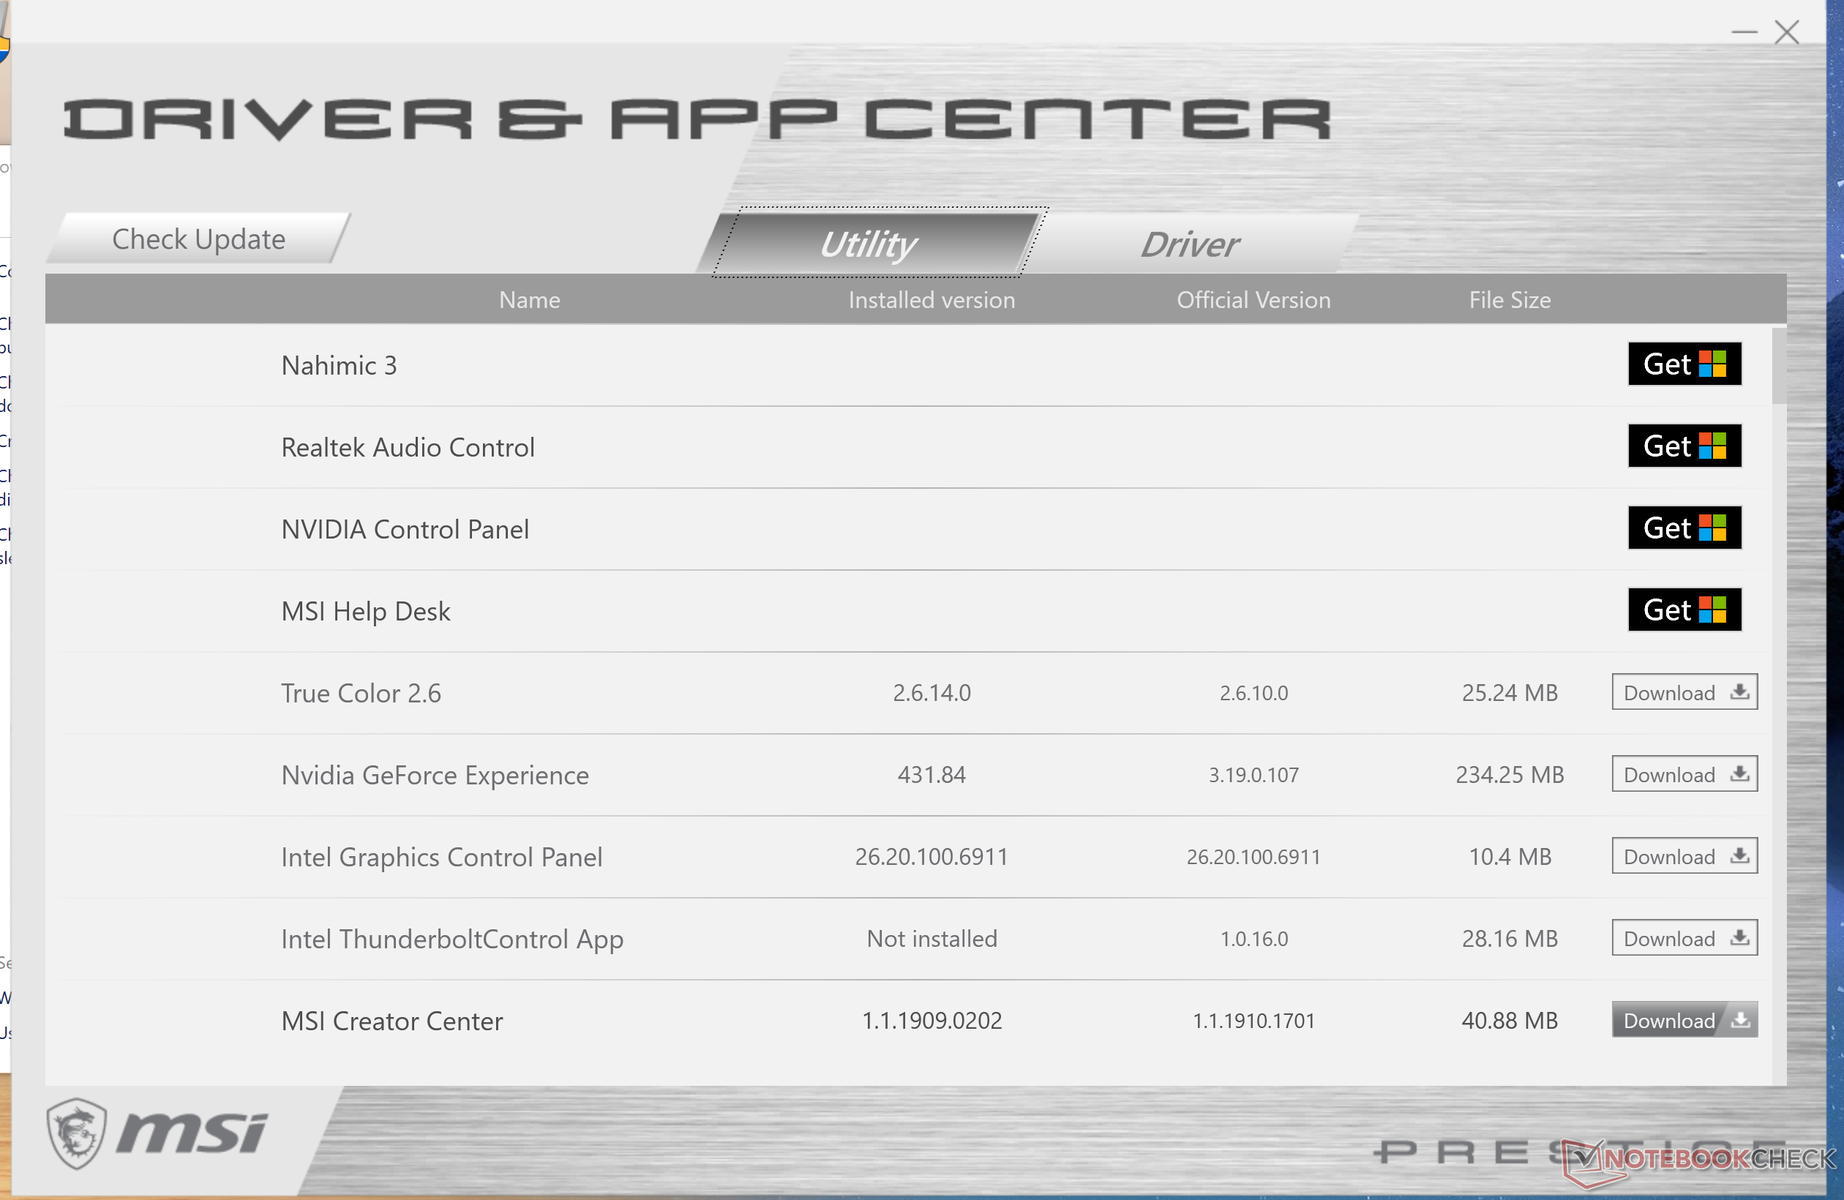
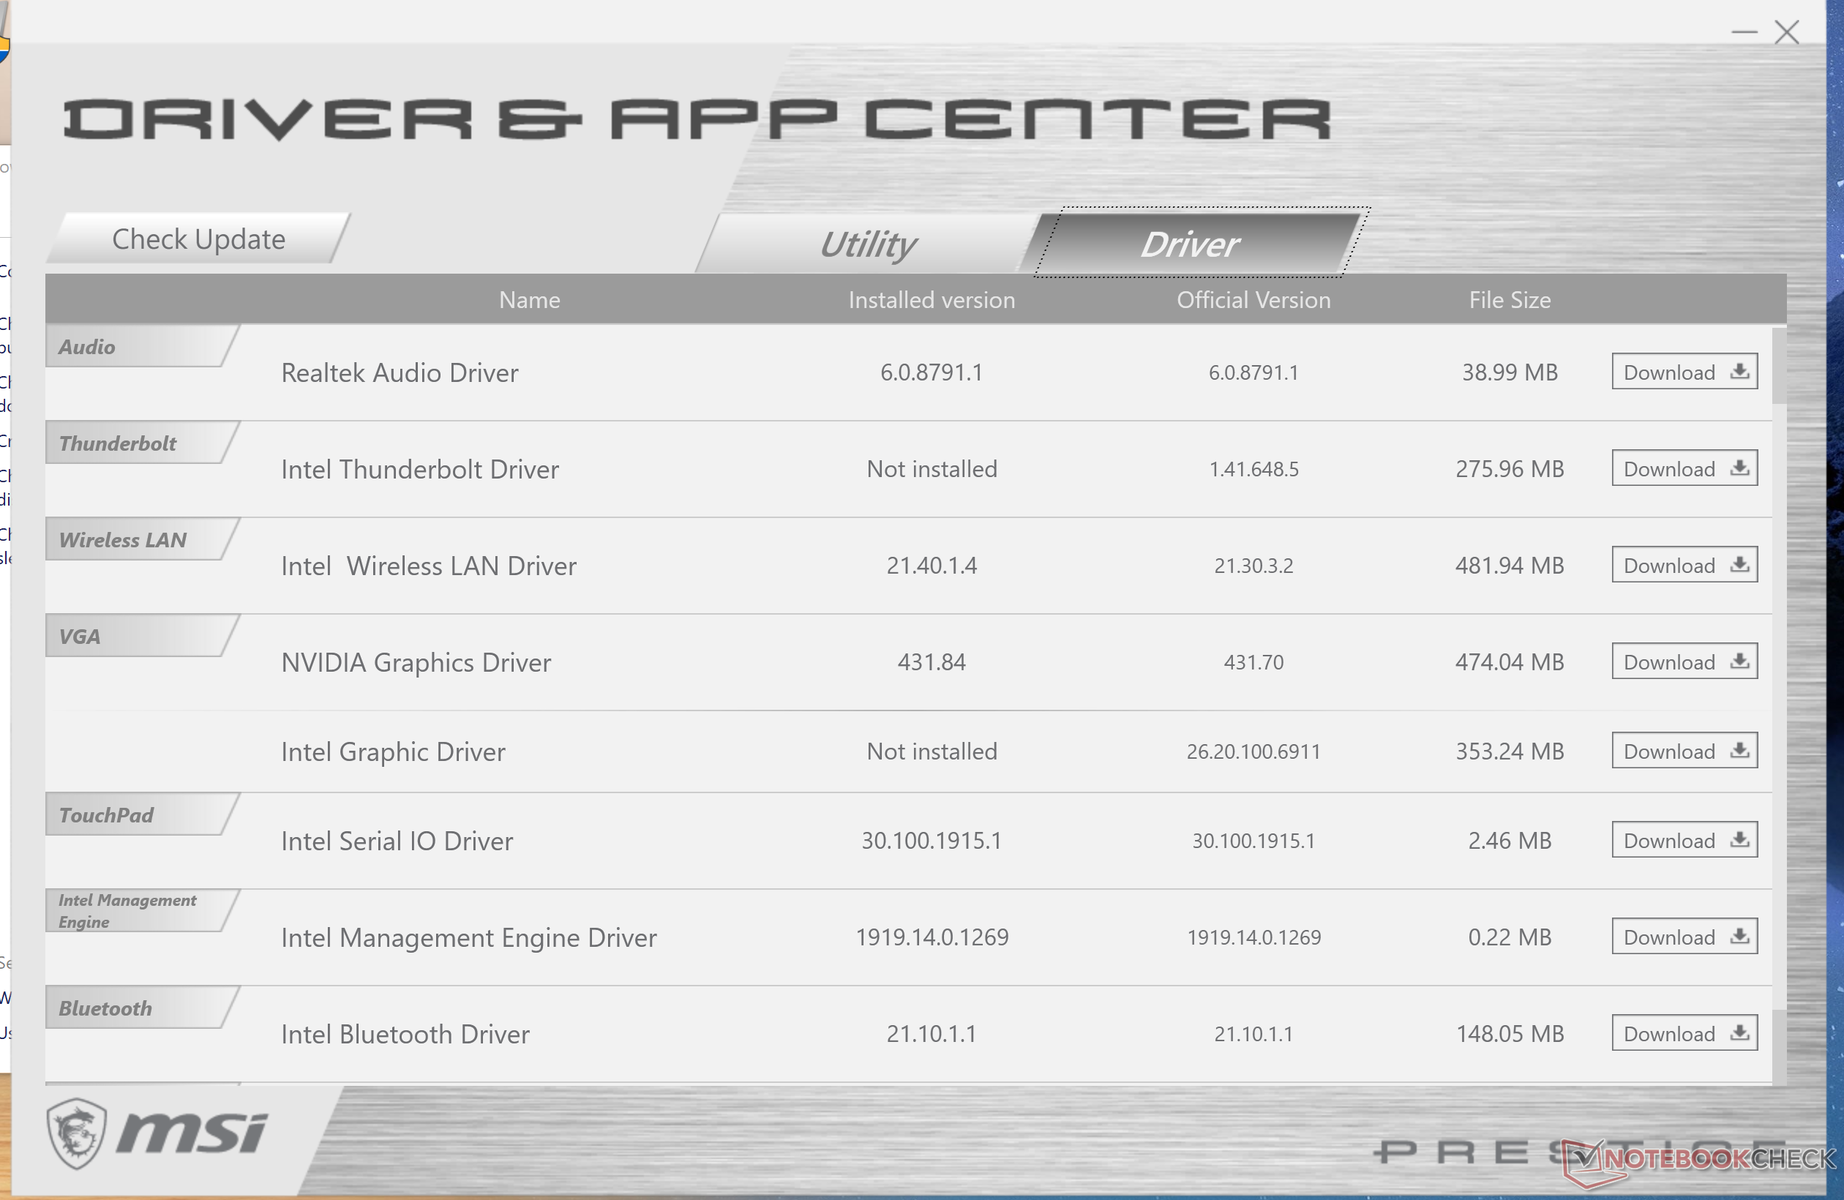
PCMark sonuçları, Lenovo ThinkPad T590 veya Microsoft'un en son Surface Laptop 3'ü içeren tipik dört çekirdekli ULV iş dizüstü bilgisayarınızdan mükemmel ve yüksek. 15. Test ünitesinde bulunduğumuz süre boyunca herhangi bir yazılım veya donanım sorunu yaşamadık. Ancak, sahiplerin, Yaratıcı Merkez, Gerçek Renk ve Prestige 15'e özgü temel özellik ve ayarların bulunabileceği önceden yüklenmiş MSI uygulamalarına aşina olmalarını öneririz.

| PCMark 10 | |
| Score | |
| MSI P65 Creator 9SF-657 | |
| Dell Precision 5530 Xeon E-2176M | |
| MSI Prestige 15 A10SC | |
| Lenovo ThinkPad T590-20N4002VGE | |
| Dell Latitude 5500 | |
| Microsoft Surface Laptop 3 15 Ryzen 5 3580U | |
| Essentials | |
| Dell Latitude 5500 | |
| MSI Prestige 15 A10SC | |
| MSI P65 Creator 9SF-657 | |
| Lenovo ThinkPad T590-20N4002VGE | |
| Dell Precision 5530 Xeon E-2176M | |
| Microsoft Surface Laptop 3 15 Ryzen 5 3580U | |
| Productivity | |
| Lenovo ThinkPad T590-20N4002VGE | |
| Dell Precision 5530 Xeon E-2176M | |
| Dell Latitude 5500 | |
| MSI Prestige 15 A10SC | |
| Microsoft Surface Laptop 3 15 Ryzen 5 3580U | |
| MSI P65 Creator 9SF-657 | |
| Digital Content Creation | |
| MSI P65 Creator 9SF-657 | |
| Dell Precision 5530 Xeon E-2176M | |
| MSI Prestige 15 A10SC | |
| Lenovo ThinkPad T590-20N4002VGE | |
| Microsoft Surface Laptop 3 15 Ryzen 5 3580U | |
| Dell Latitude 5500 | |
| PCMark 8 | |
| Home Score Accelerated v2 | |
| Dell Latitude 5500 | |
| Lenovo ThinkPad T590-20N4002VGE | |
| Dell Precision 5530 Xeon E-2176M | |
| MSI Prestige 15 A10SC | |
| MSI P65 Creator 9SF-657 | |
| Microsoft Surface Laptop 3 15 Ryzen 5 3580U | |
| Work Score Accelerated v2 | |
| Lenovo ThinkPad T590-20N4002VGE | |
| Dell Precision 5530 Xeon E-2176M | |
| MSI Prestige 15 A10SC | |
| MSI P65 Creator 9SF-657 | |
| Microsoft Surface Laptop 3 15 Ryzen 5 3580U | |
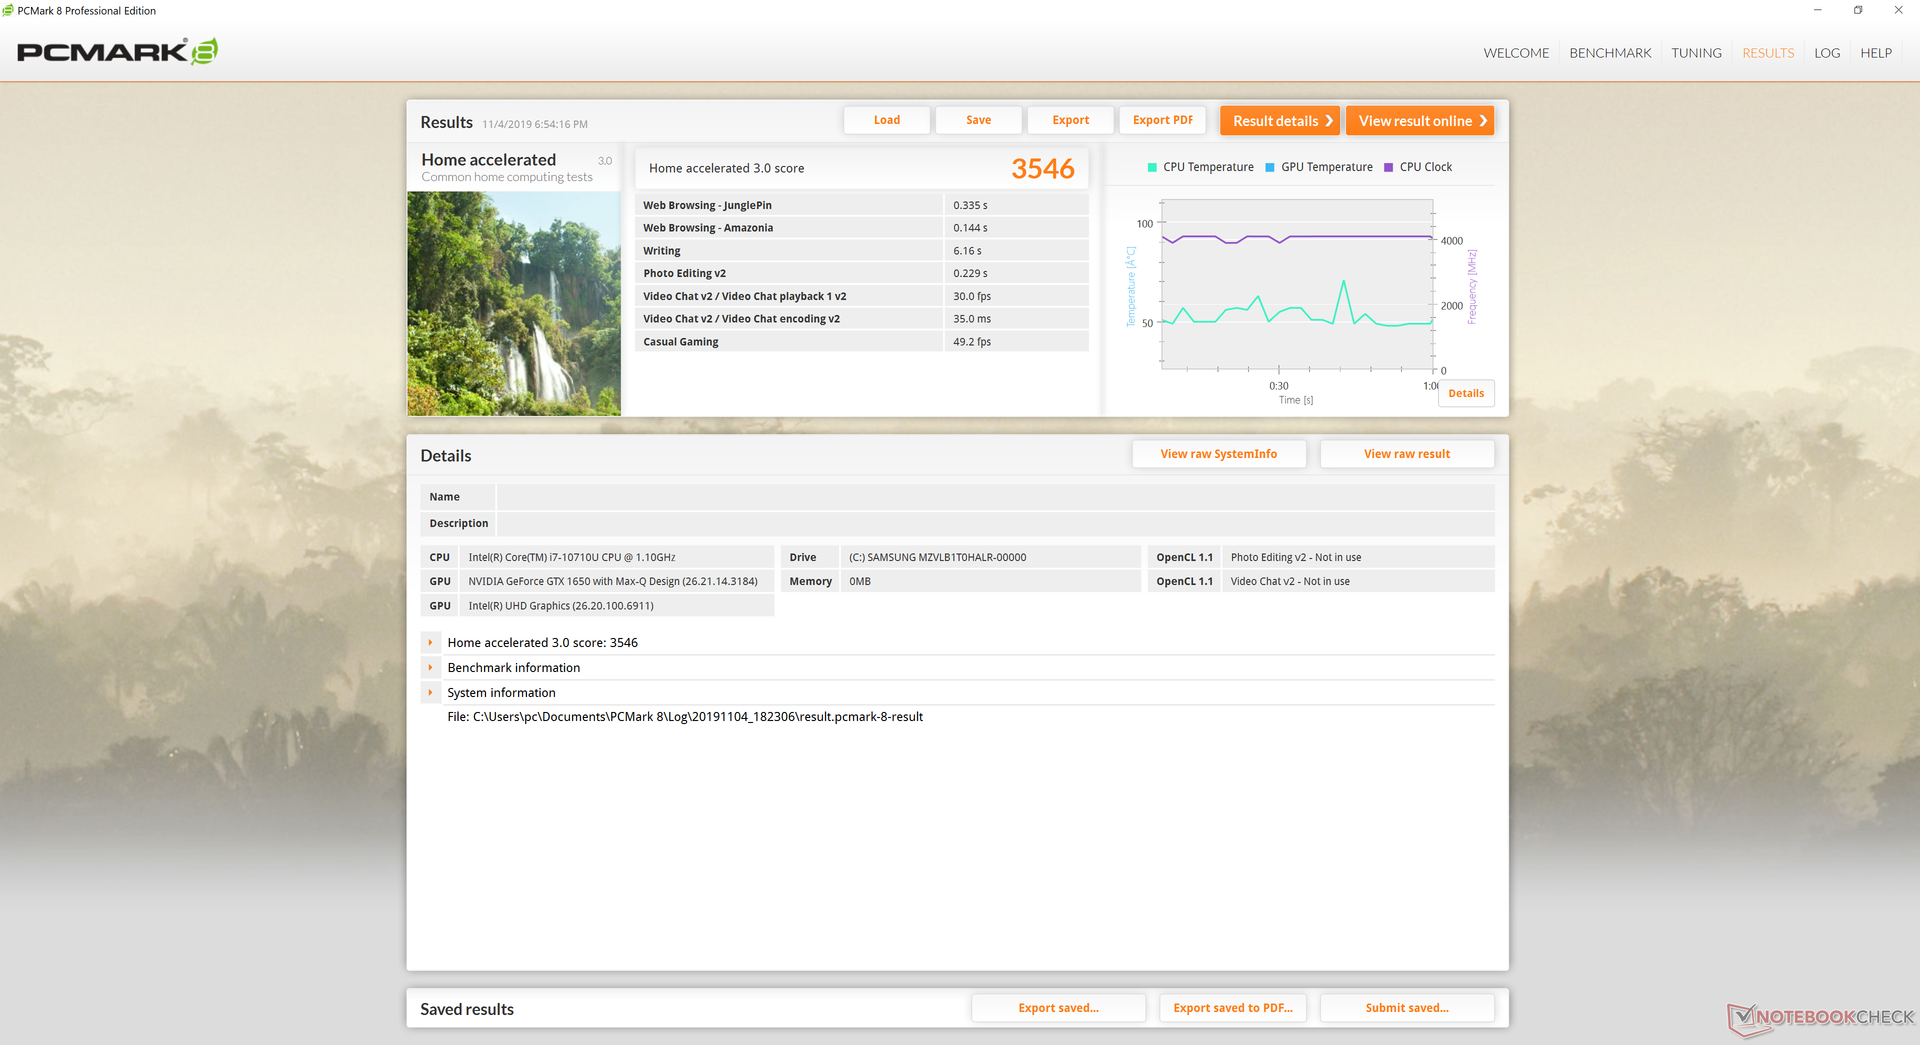
| PCMark 8 Home Score Accelerated v2 | 3546 puan | |
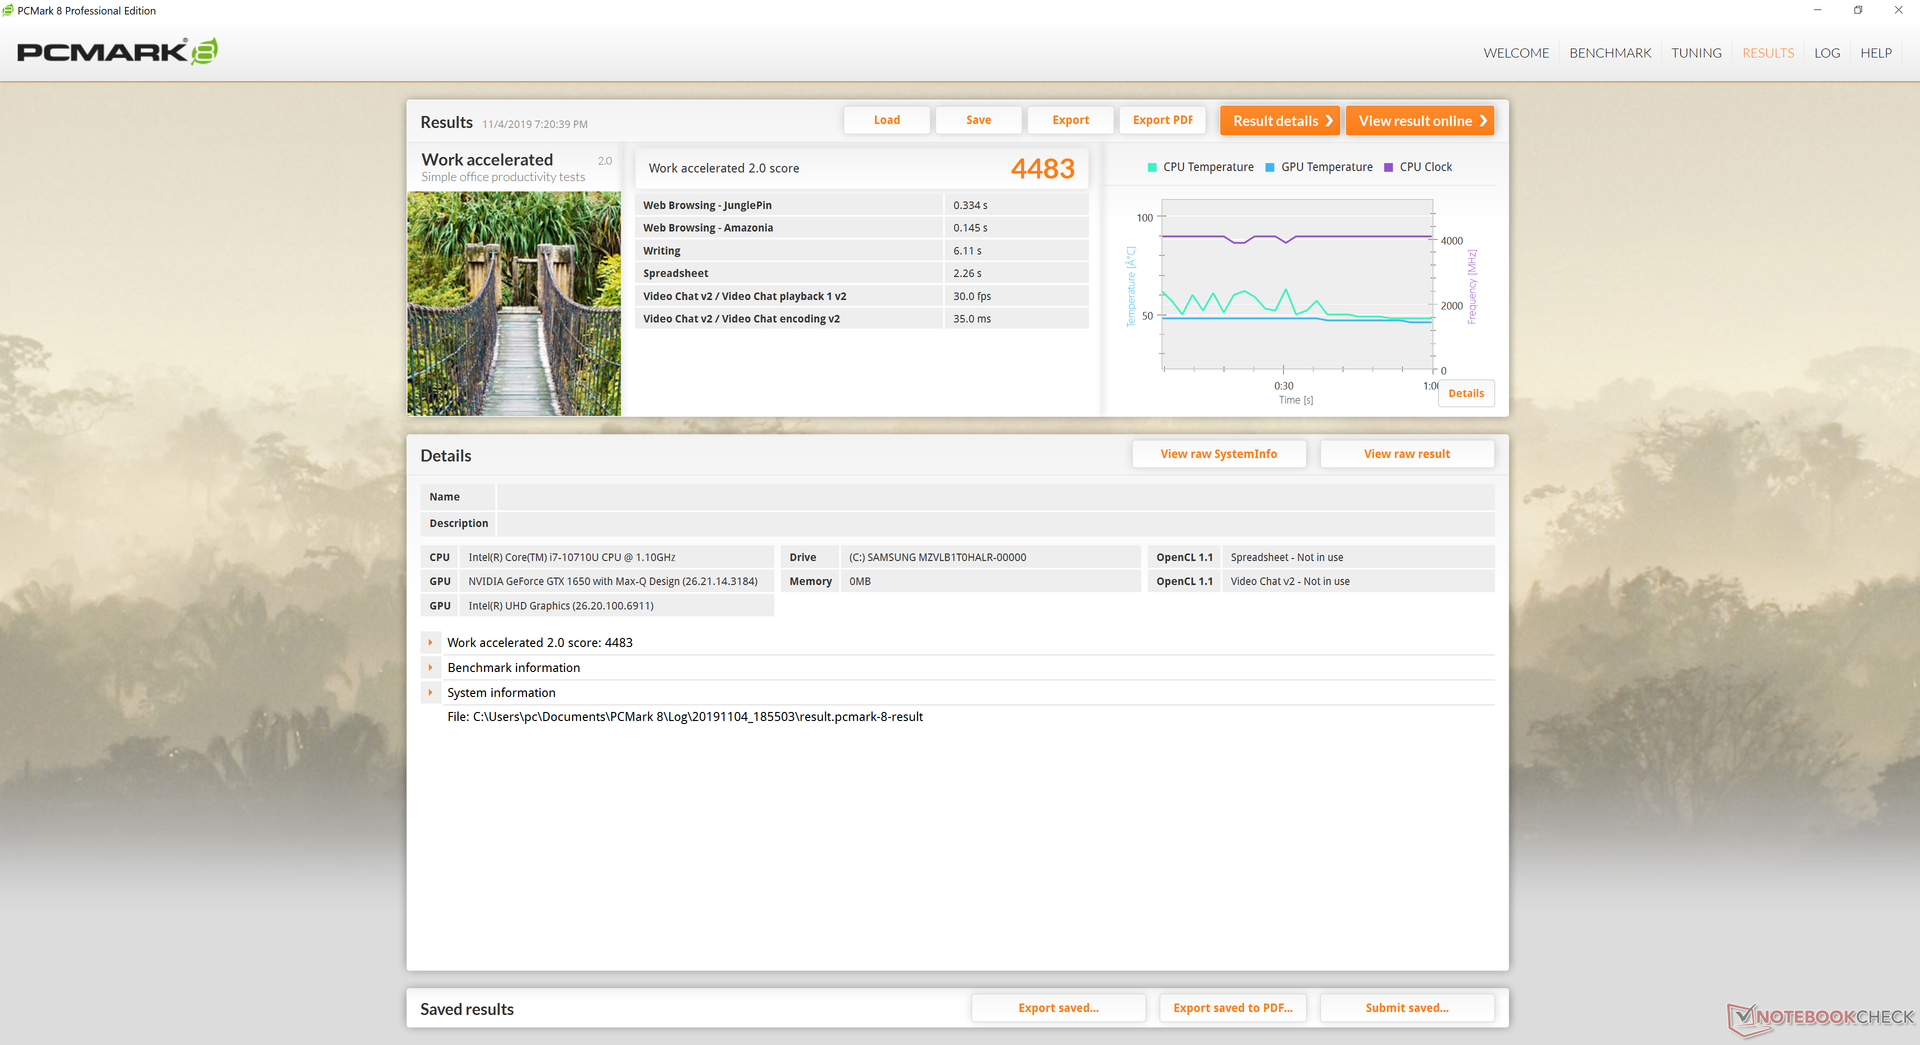
| PCMark 8 Work Score Accelerated v2 | 4483 puan | |
| PCMark 10 Score | 5009 puan | |
Yardım | ||
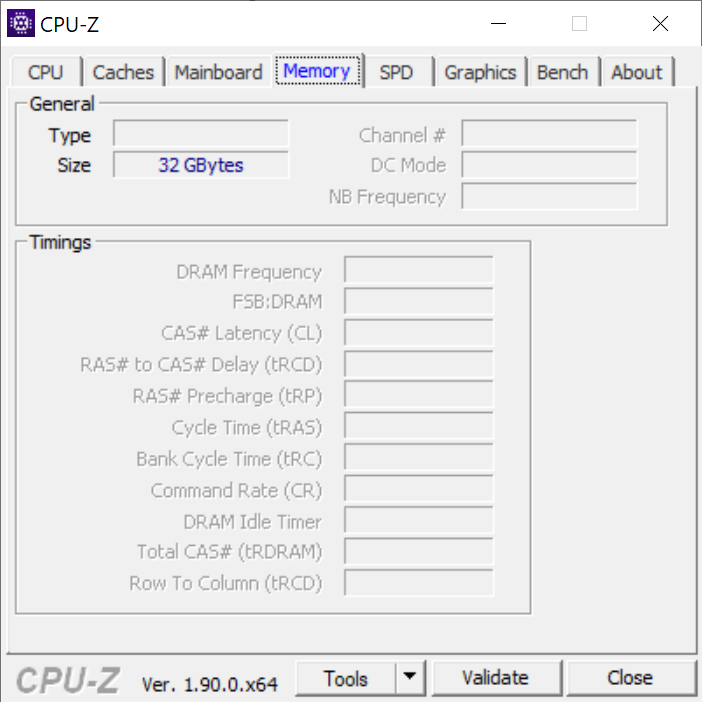
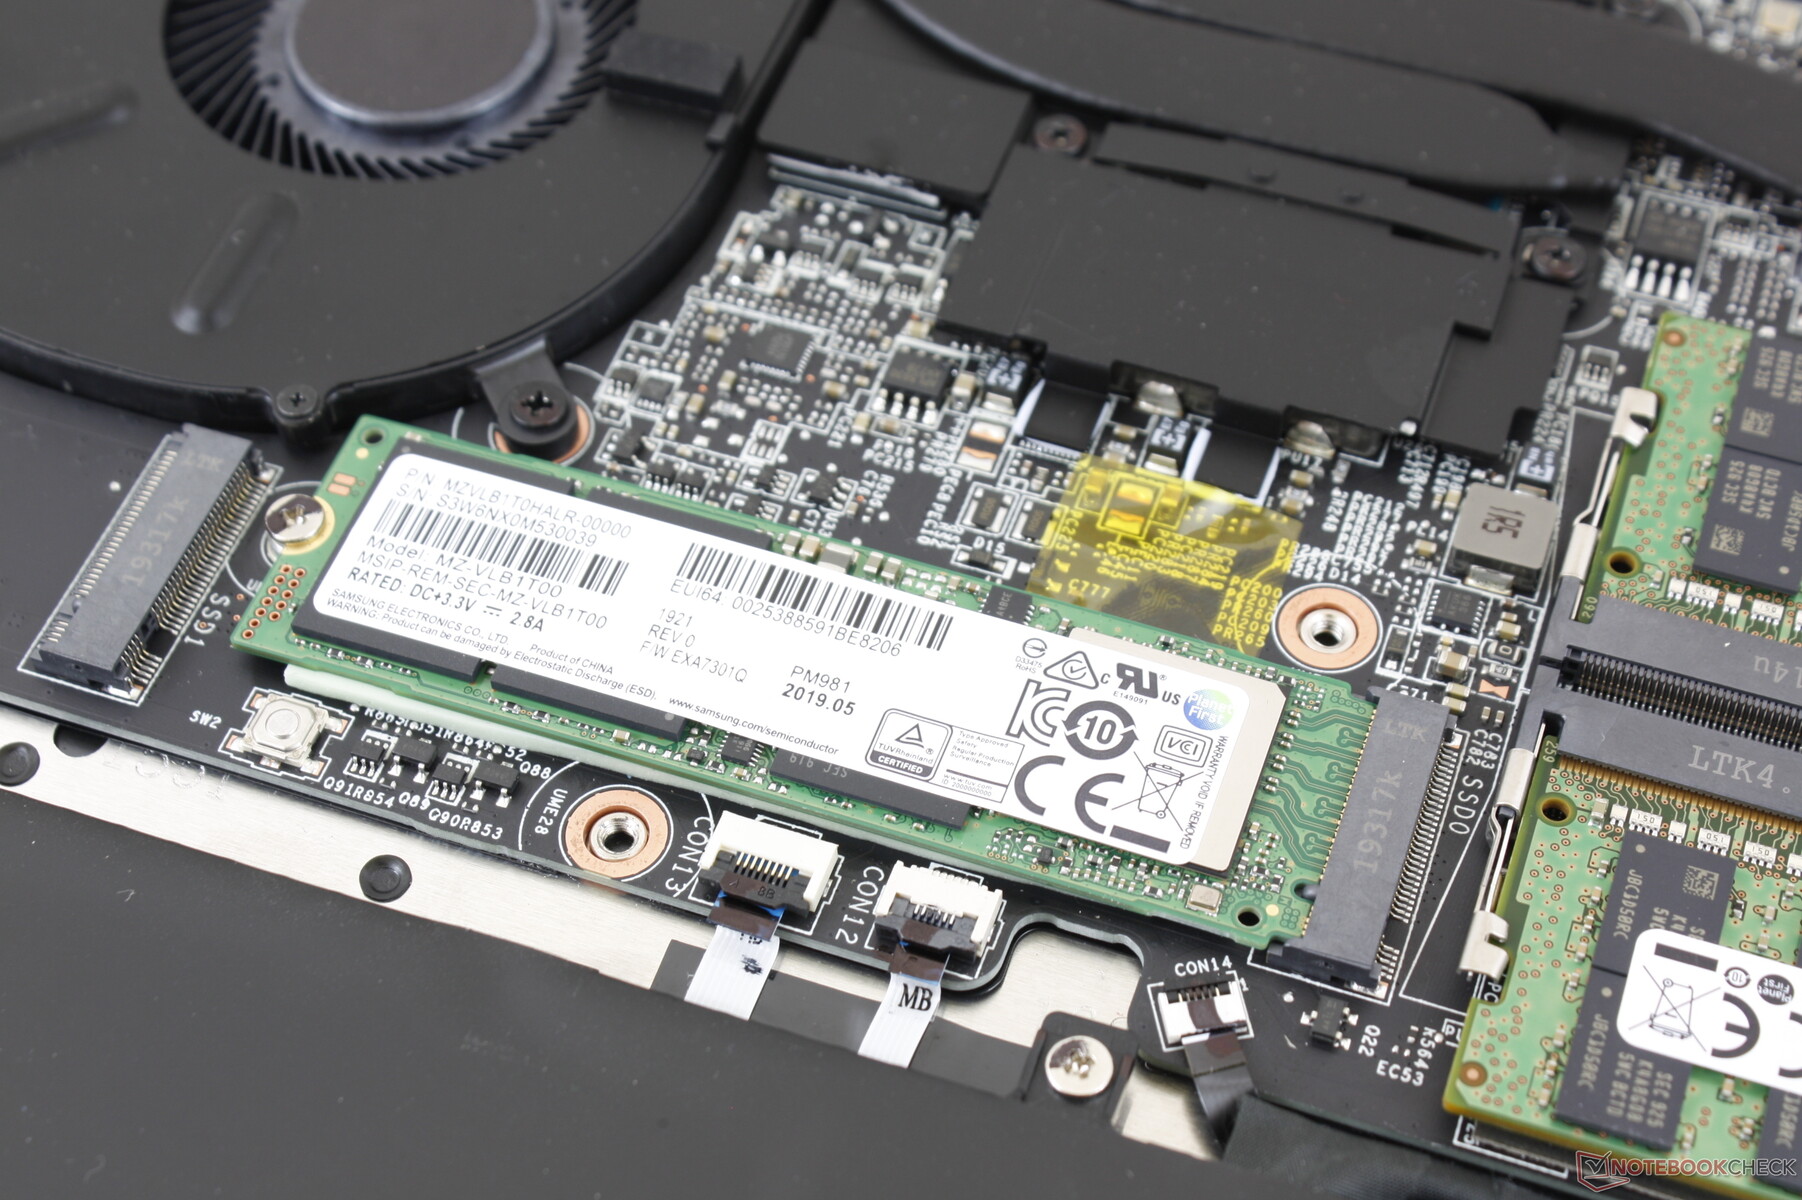
Depolama Aygıtları - İkili M.2 Seçenekleri
İki adet dahili M.2 2280 yuvası vardır. Özel birimimiz 1 TB Samsung SSD PM981 ile birlikte gelirken, satıcıların diğer üreticilerin SSD'lerini içermesi olasıdır. Sıralı okuma ve yazma hızları, AS SSD'ye göre 1300 MB / sn civarında seyreder ve 512 GB Toshiba XG6'dan daha yavaş olur. Daha fazla kıyaslama karşılaştırması için SSD'ler ve HDD'ler masamıza bakın.
| MSI Prestige 15 A10SC Samsung SSD PM981 MZVLB1T0HALR | Microsoft Surface Laptop 3 15 Ryzen 5 3580U SK hynix BC501 HFM256GDGTNG | Lenovo ThinkPad T590-20N4002VGE Toshiba XG6 KXG60ZNV512G | Dell Latitude 5500 Toshiba XG6 KXG60ZNV1T02 | HP EliteBook 755 G5 3UN79EA Toshiba XG5 KXG50ZNV512G | Dell Precision 5530 Xeon E-2176M SK hynix PC400 512 GB | MSI P65 Creator 9SF-657 2x Samsung SSD PM981 MZVLB512HAJQ (RAID 0) | |
|---|---|---|---|---|---|---|---|
| AS SSD | -52% | 13% | 2% | -149% | -18% | 20% | |
| Seq Read (MB/s) | 1274 | 1122 -12% | 2551 100% | 1287 1% | 1810 42% | 2169 70% | 2860 124% |
| Seq Write (MB/s) | 1395 | 514 -63% | 2376 70% | 1280 -8% | 261.4 -81% | 1022 -27% | 2604 87% |
| 4K Read (MB/s) | 50.3 | 34.98 -30% | 52.7 5% | 49.57 -1% | 24.38 -52% | 38.43 -24% | 45.15 -10% |
| 4K Write (MB/s) | 119.8 | 96.8 -19% | 153 28% | 158 32% | 5.77 -95% | 92.8 -23% | 100.2 -16% |
| 4K-64 Read (MB/s) | 1599 | 492 -69% | 1406 -12% | 1043 -35% | 528 -67% | 970 -39% | 1428 -11% |
| 4K-64 Write (MB/s) | 1455 | 339.9 -77% | 1439 -1% | 1415 -3% | 90.7 -94% | 926 -36% | 1401 -4% |
| Access Time Read * (ms) | 0.044 | 0.056 -27% | 0.067 -52% | 0.039 11% | 0.2 -355% | 0.073 -66% | 0.049 -11% |
| Access Time Write * (ms) | 0.092 | 0.11 -20% | 0.027 71% | 0.027 71% | 0.748 -713% | 0.053 42% | 0.037 60% |
| Score Read (Points) | 1777 | 639 -64% | 1714 -4% | 1221 -31% | 733 -59% | 1226 -31% | 1759 -1% |
| Score Write (Points) | 1714 | 488 -72% | 1829 7% | 1701 -1% | 123 -93% | 1121 -35% | 1762 3% |
| Score Total (Points) | 4411 | 1434 -67% | 4418 0% | 3558 -19% | 1157 -74% | 2922 -34% | 4411 0% |
| Copy ISO MB/s (MB/s) | 2830 | 828 -71% | 2625 -7% | ||||
| Copy Program MB/s (MB/s) | 609 | 200.5 -67% | 495.9 -19% | ||||
| Copy Game MB/s (MB/s) | 1424 | 387.4 -73% | 1384 -3% |
* ... daha küçük daha iyidir

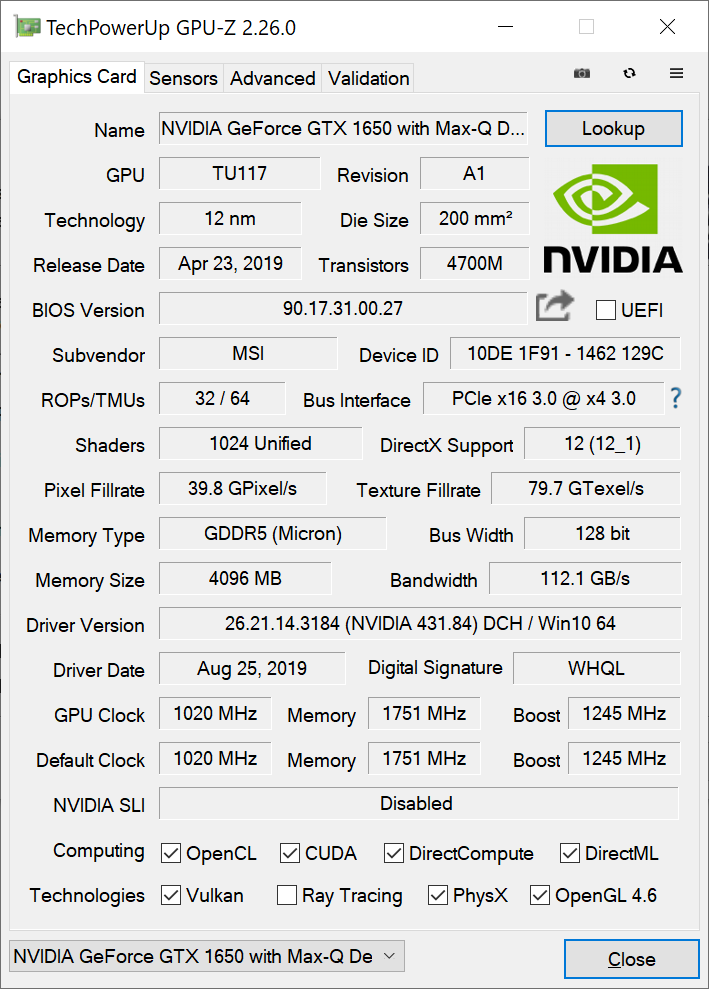
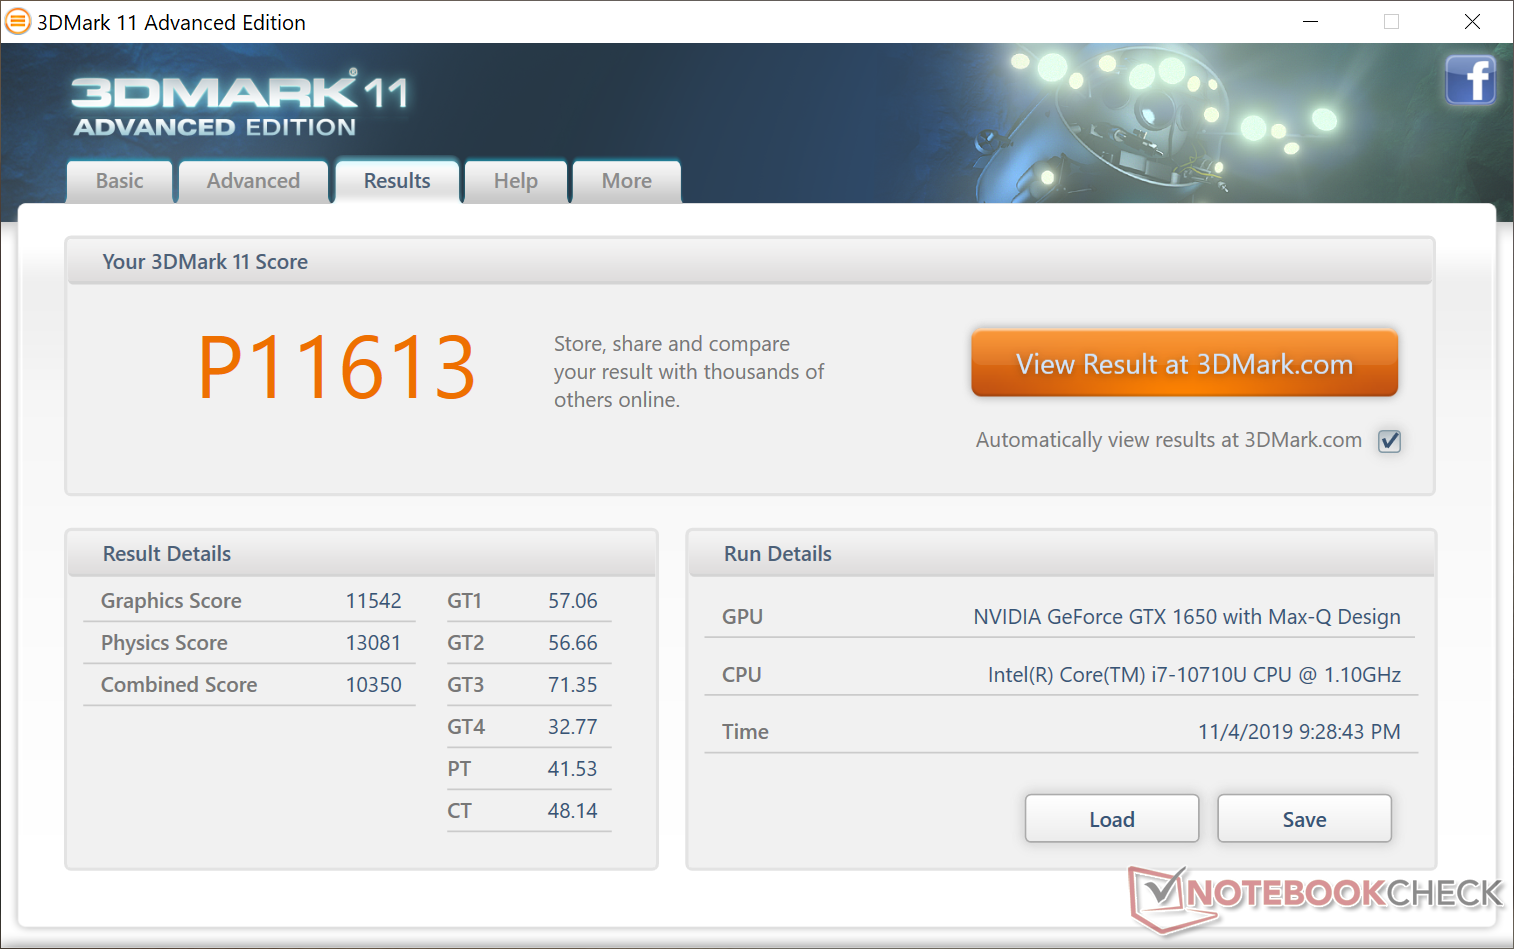
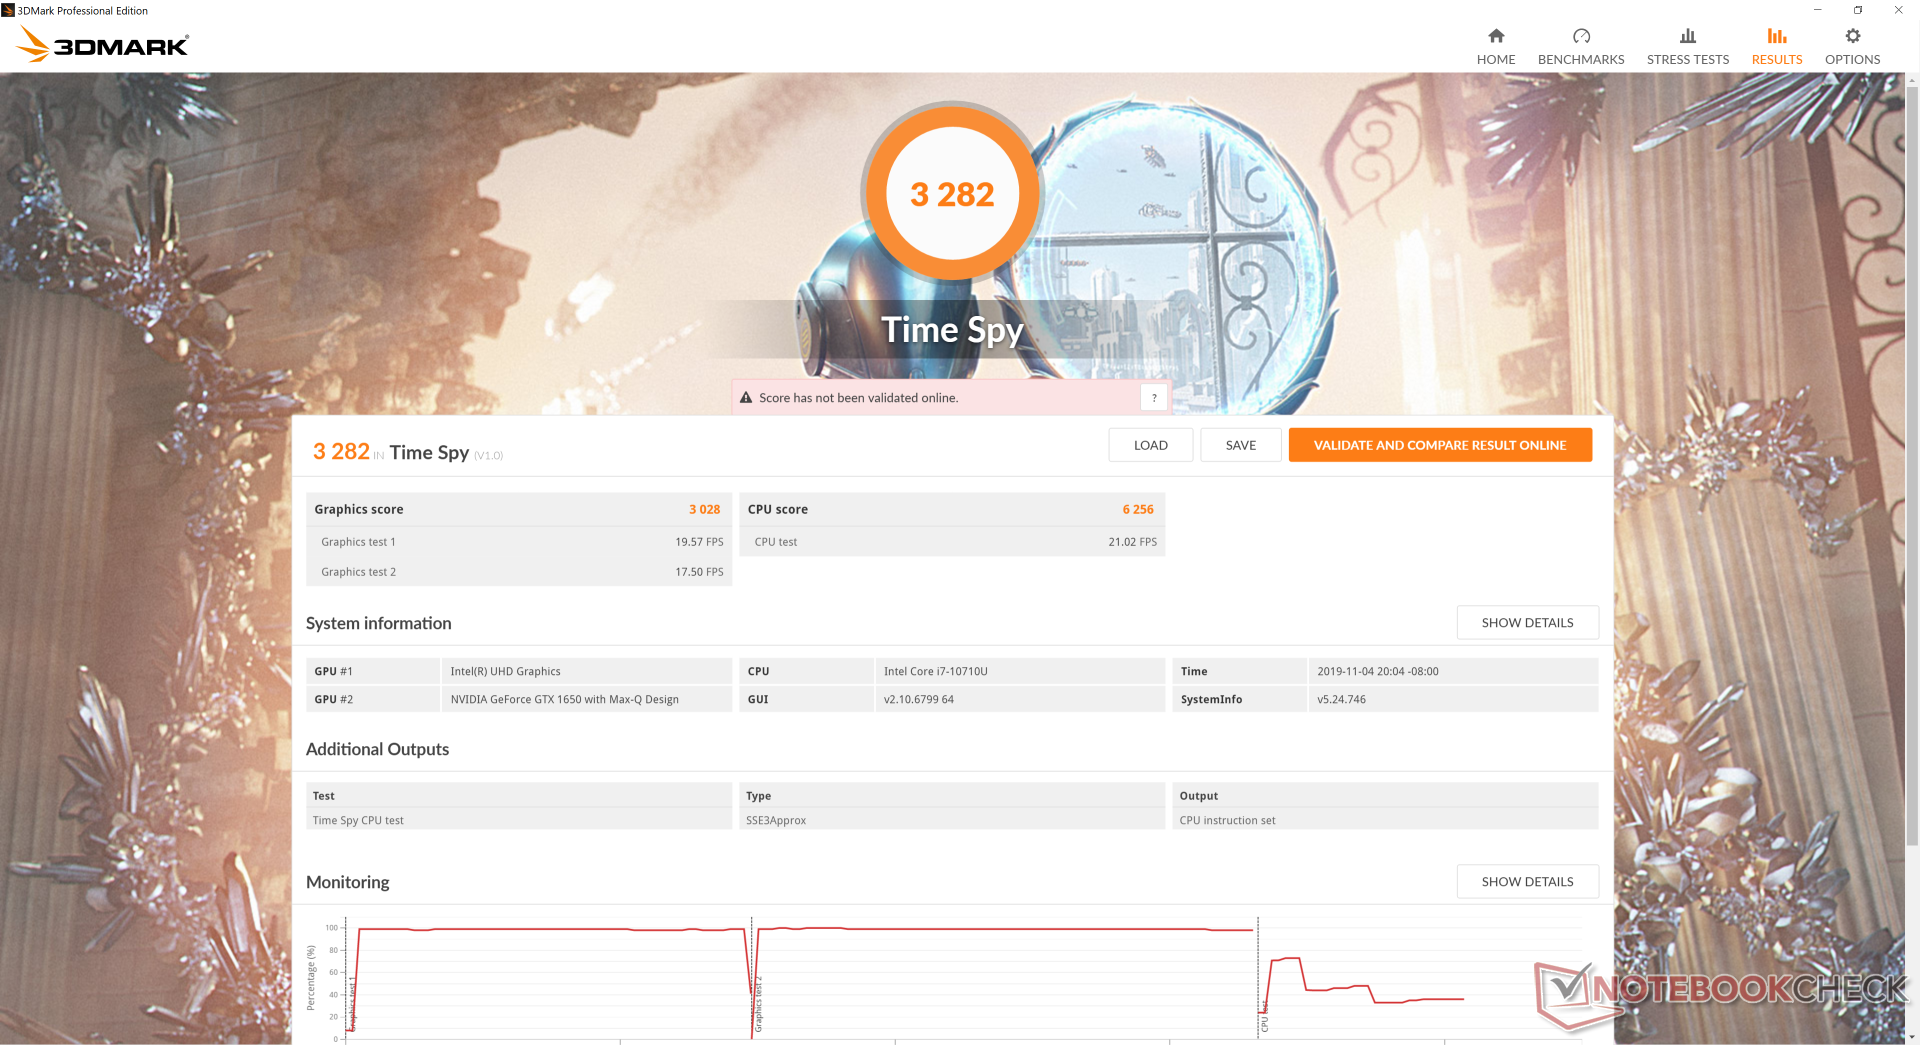
GPU Performansı - Oyun Hazır
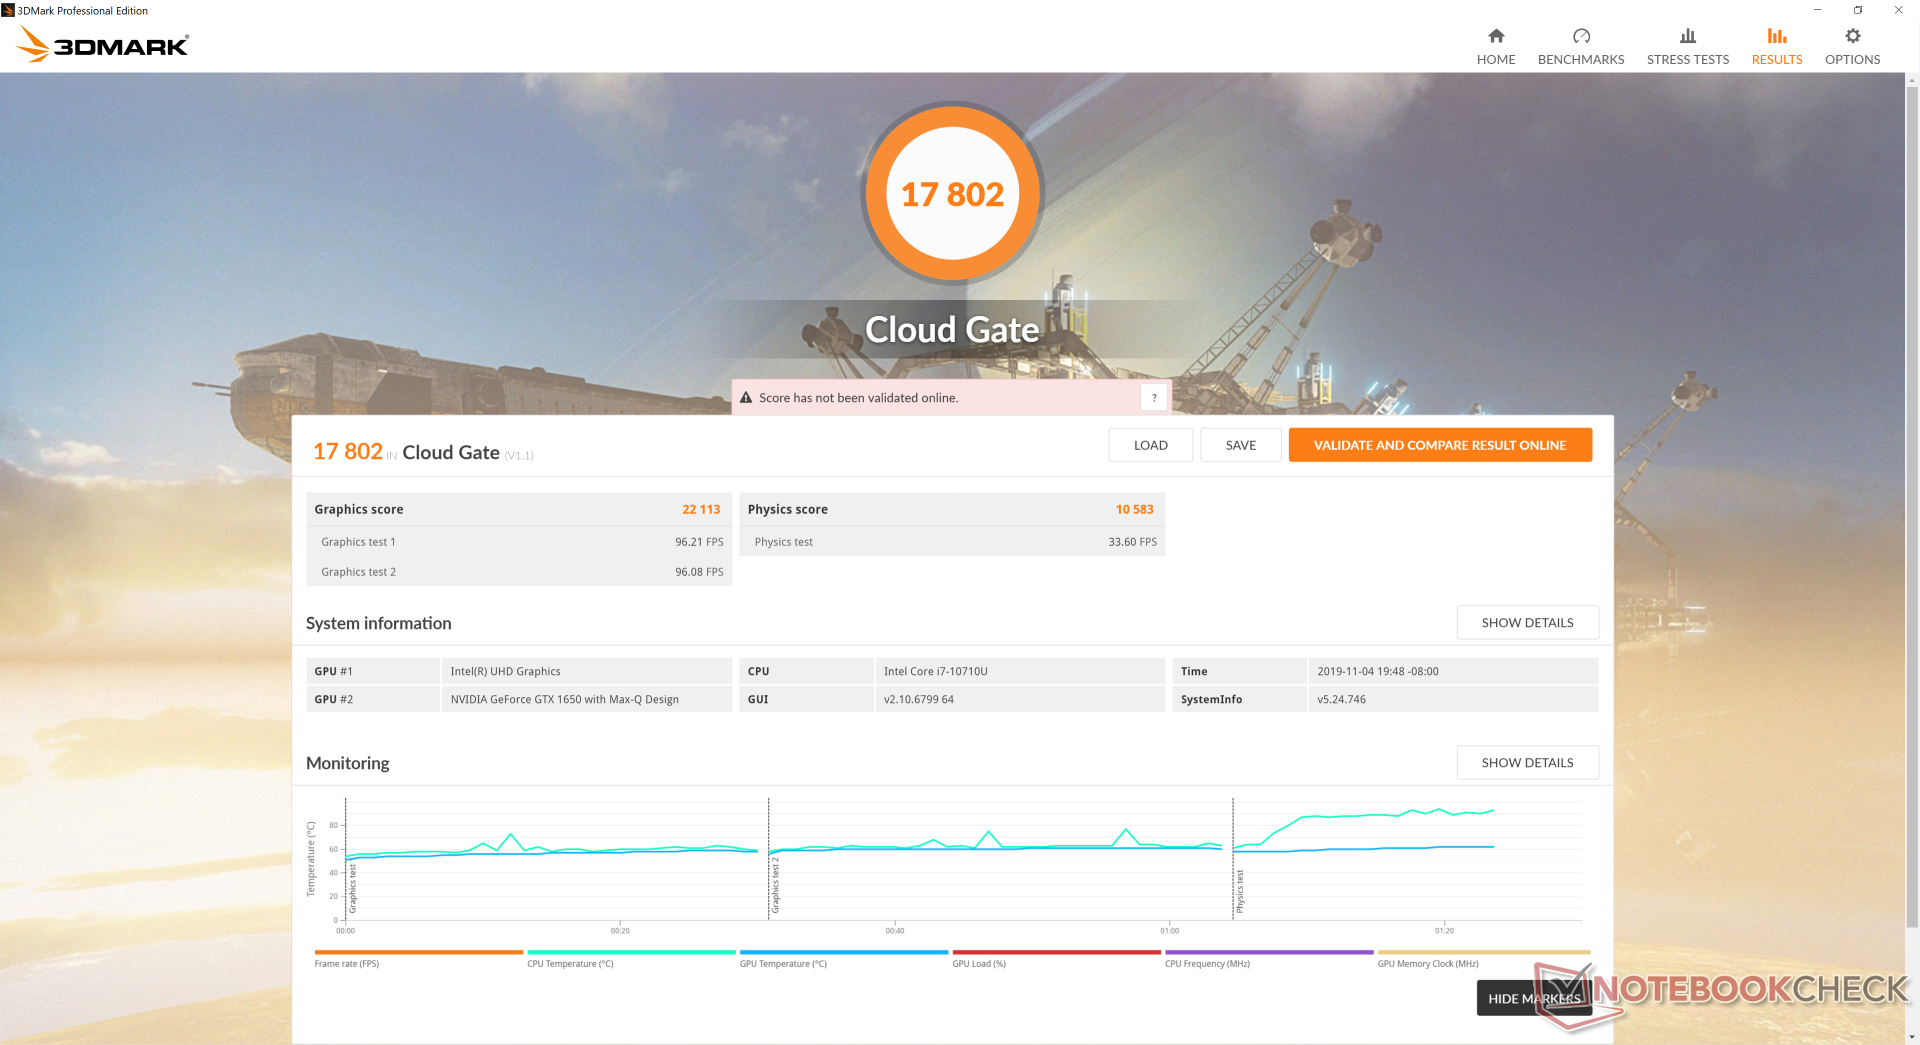
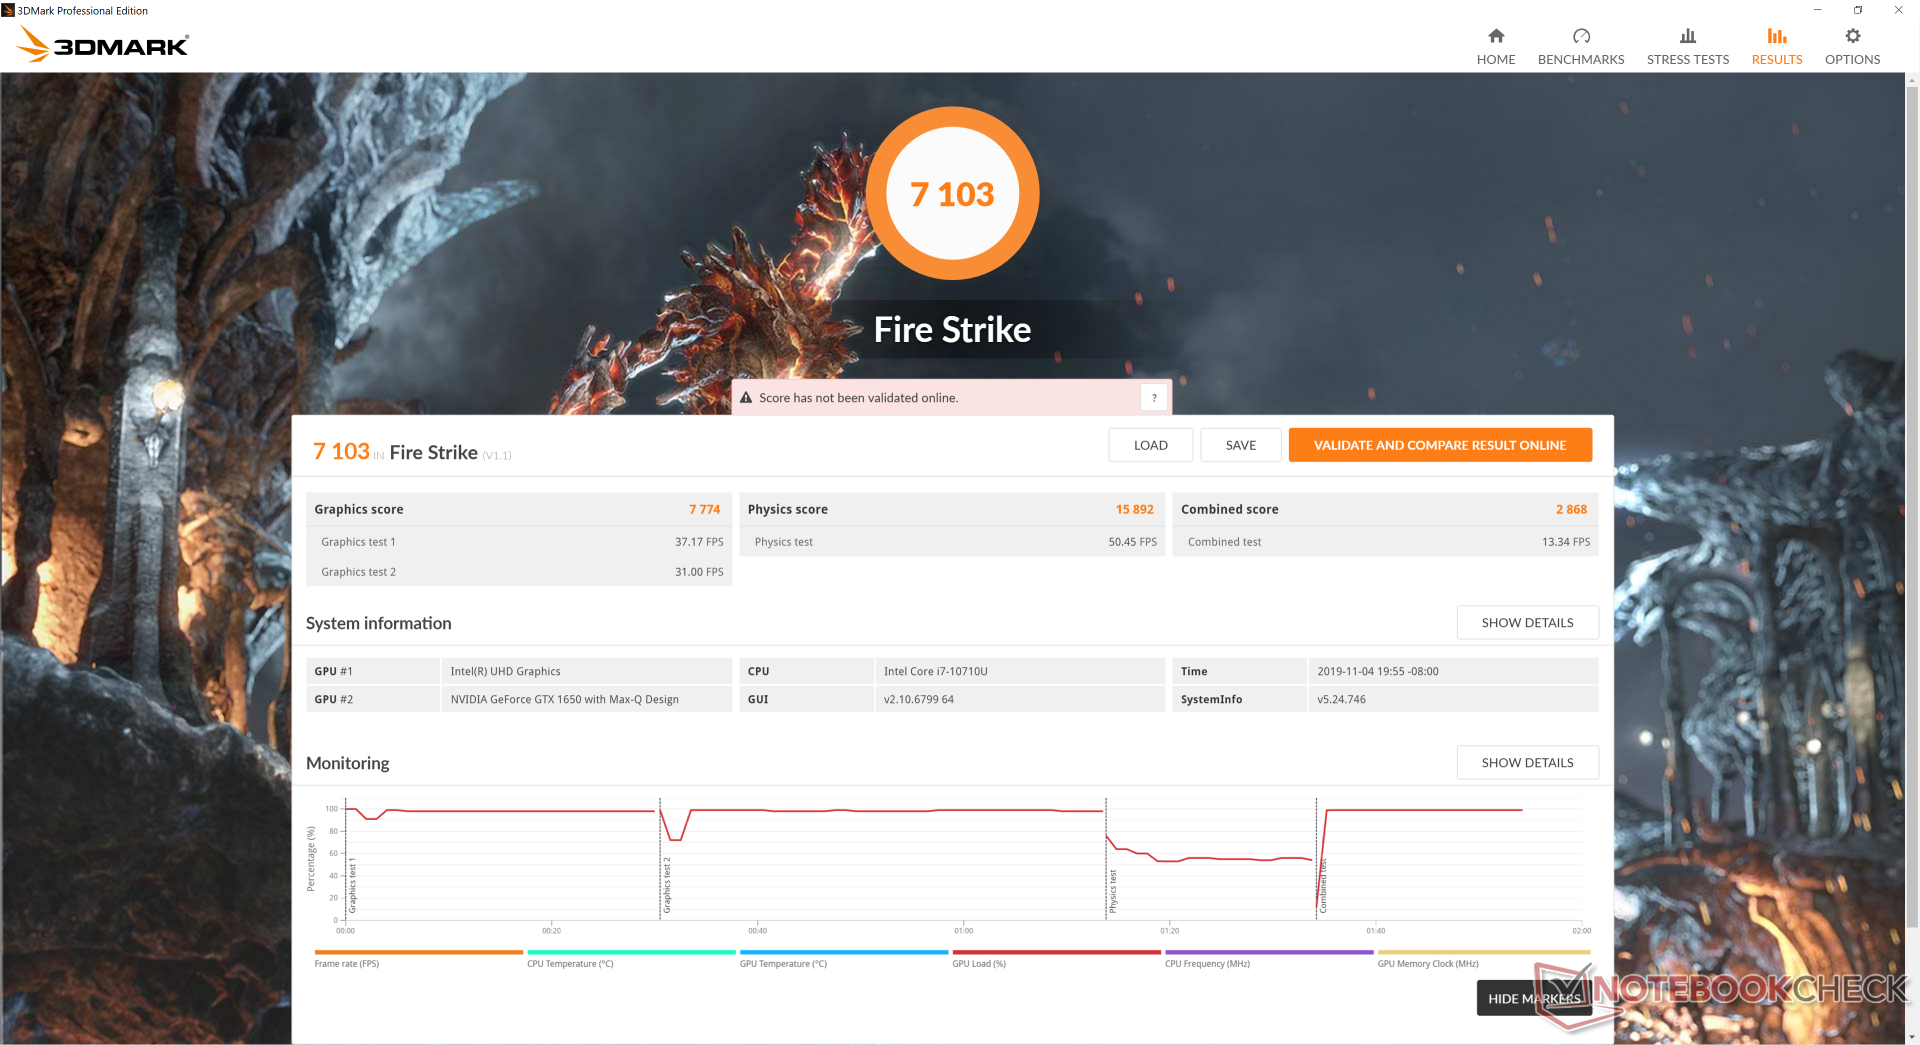
GeForce 1650 Max-Q nadir bir GPU olsa da, daha fazla dizüstü bilgisayarda görmeyi çok isteriz. 3DMark benchmarkları, "uygun" masaüstü GTX 1650'nin arkasına sadece yüzde 15 veya GeForce GTX 1050 Ti'den yüzde 15 ila 50 daha hızlı yerleştiriyor. Nvidia Turing, daha yeni DX12 oyunları çalıştırırken eski GTX 1050 Ti üzerinde daha fazla performans artışı göreceğiniz anlamına gelen DX12 başlıkları için optimize edildi. Bunun son Razer Blade Stealth.Cloud Gate skorlarıyla birlikte gelen GPU olduğunu ve ULV CPU'su nedeniyle düşük olduğunu unutmayın. GeForce GTX veya Max-Q grafiğine sahip diğer çoğu dizüstü bilgisayar, bunun yerine Intel H sınıfı CPU'larla birlikte gelir.
| 3DMark | |
| 1280x720 Cloud Gate Standard Graphics | |
| Lenovo Legion Y740-17IRH | |
| Razer Blade 15 GTX 1660 Ti | |
| Asus FX503VM-EH73 | |
| MSI GT72S-6QEG16SR421BW | |
| Acer Nitro 5 AN515-54-78TL | |
| Gainward GeForce GTX 1650 4 GB | |
| HP Pavilion Gaming 15-cx0003ng | |
| Ortalama NVIDIA GeForce GTX 1650 Max-Q (21759 - 53981, n=12) | |
| Lenovo Yoga 730-15IKB | |
| MSI Prestige 15 A10SC | |
| 1920x1080 Fire Strike Graphics | |
| Lenovo Legion Y740-17IRH | |
| Razer Blade 15 GTX 1660 Ti | |
| Asus FX503VM-EH73 | |
| MSI GT72S-6QEG16SR421BW | |
| Acer Nitro 5 AN515-54-78TL | |
| Gainward GeForce GTX 1650 4 GB | |
| Ortalama NVIDIA GeForce GTX 1650 Max-Q (6985 - 8618, n=12) | |
| MSI Prestige 15 A10SC | |
| HP Pavilion Gaming 15-cx0003ng | |
| Lenovo Yoga 730-15IKB | |
| 2560x1440 Time Spy Graphics | |
| Lenovo Legion Y740-17IRH | |
| Razer Blade 15 GTX 1660 Ti | |
| Asus FX503VM-EH73 | |
| Gainward GeForce GTX 1650 4 GB | |
| Acer Nitro 5 AN515-54-78TL | |
| MSI Prestige 15 A10SC | |
| Ortalama NVIDIA GeForce GTX 1650 Max-Q (2836 - 3238, n=10) | |
| MSI GT72S-6QEG16SR421BW | |
| HP Pavilion Gaming 15-cx0003ng | |
| Lenovo Yoga 730-15IKB | |
| 3DMark 11 | |
| 1280x720 Performance GPU | |
| Lenovo Legion Y740-17IRH | |
| Razer Blade 15 GTX 1660 Ti | |
| Asus FX503VM-EH73 | |
| Gainward GeForce GTX 1650 4 GB | |
| MSI GT72S-6QEG16SR421BW | |
| MSI Prestige 15 A10SC | |
| Ortalama NVIDIA GeForce GTX 1650 Max-Q (10248 - 12259, n=14) | |
| HP Pavilion Gaming 15-cx0003ng | |
| Lenovo Yoga 730-15IKB | |
| 1280x720 Performance Combined | |
| Lenovo Legion Y740-17IRH | |
| Gainward GeForce GTX 1650 4 GB | |
| Razer Blade 15 GTX 1660 Ti | |
| MSI Prestige 15 A10SC | |
| MSI GT72S-6QEG16SR421BW | |
| Ortalama NVIDIA GeForce GTX 1650 Max-Q (6409 - 10846, n=13) | |
| HP Pavilion Gaming 15-cx0003ng | |
| Asus FX503VM-EH73 | |
| Lenovo Yoga 730-15IKB | |
| 3DMark 11 Performance | 11613 puan | |
| 3DMark Cloud Gate Standard Score | 17802 puan | |
| 3DMark Fire Strike Score | 7103 puan | |
| 3DMark Time Spy Score | 3282 puan | |
Yardım | ||
Oyun Performansı
En yeni sürümler yerel 1080p ve 30 FPS değerlerinde yayınlanabilir, çoğu ayarını High to Ultra - ULV CPU ve Max-Q GPU'lu bir dizüstü bilgisayar için fena değildir. Stabil 60 FPS'ye ulaşmak Rocket League, Overwatch, LoL veya Fortnite gibi sıra dışı oyunların dışında da zor olabilir.
| Shadow of the Tomb Raider | |
| 1280x720 Lowest Preset | |
| MSI GE75 9SG | |
| Gainward GeForce GTX 1650 4 GB | |
| Razer Blade Pro 17 4K UHD 120 Hz | |
| Lenovo Legion Y740-17IRH | |
| Alienware m15 P79F | |
| Ortalama NVIDIA GeForce GTX 1650 Max-Q (92 - 151, n=5) | |
| Razer Blade 15 GTX 1660 Ti | |
| MSI Prestige 15 A10SC | |
| Dell G3 3590 | |
| Asus GL753VD | |
| Asus TUF FX705GE-EW096T | |
| Dell Inspiron 15 5000 5585 | |
| Microsoft Surface Laptop 3 15 Ryzen 5 3580U | |
| Dell XPS 13 7390 2-in-1 Core i7 | |
| 1920x1080 Highest Preset AA:T | |
| MSI GE75 9SG | |
| Razer Blade Pro 17 4K UHD 120 Hz | |
| Alienware m15 P79F | |
| Lenovo Legion Y740-17IRH | |
| Razer Blade 15 GTX 1660 Ti | |
| Gainward GeForce GTX 1650 4 GB | |
| Ortalama NVIDIA GeForce GTX 1650 Max-Q (33 - 45, n=6) | |
| MSI Prestige 15 A10SC | |
| Asus TUF FX705GE-EW096T | |
| Asus GL753VD | |
| Rocket League | |
| 1280x720 Performance | |
| Dell Precision 5530 Xeon E-2176M | |
| Dell G3 3590 | |
| Ortalama NVIDIA GeForce GTX 1650 Max-Q (196 - 249, n=4) | |
| Lenovo Yoga 730-15IKB | |
| MSI Prestige 15 A10SC | |
| Dell Inspiron 15 5000 5585 | |
| Dell XPS 13 7390 2-in-1 Core i7 | |
| Microsoft Surface Laptop 3 15 Ryzen 5 3580U | |
| 1920x1080 High Quality AA:High FX | |
| Asus FX503VM-EH73 | |
| Dell G3 3590 | |
| Dell Precision 5530 Xeon E-2176M | |
| Ortalama NVIDIA GeForce GTX 1650 Max-Q (86.5 - 145.6, n=5) | |
| MSI Prestige 15 A10SC | |
| Lenovo Yoga 730-15IKB | |
| Dell Inspiron 15 5000 5585 | |
| Dell XPS 13 7390 2-in-1 Core i7 | |
| Microsoft Surface Laptop 3 15 Ryzen 5 3580U | |
| düşük | orta | yüksek | ultra | |
|---|---|---|---|---|
| BioShock Infinite (2013) | 296.3 | 215.1 | 188.4 | 77 |
| The Witcher 3 (2015) | 155.4 | 94.1 | 54.8 | 30.8 |
| Rocket League (2017) | 196 | 128.2 | 88 | |
| Shadow of the Tomb Raider (2018) | 113 | 51 | 42 | 35 |
Emisyonları
Sistem Gürültüsü - Sesli, Ama Sessiz
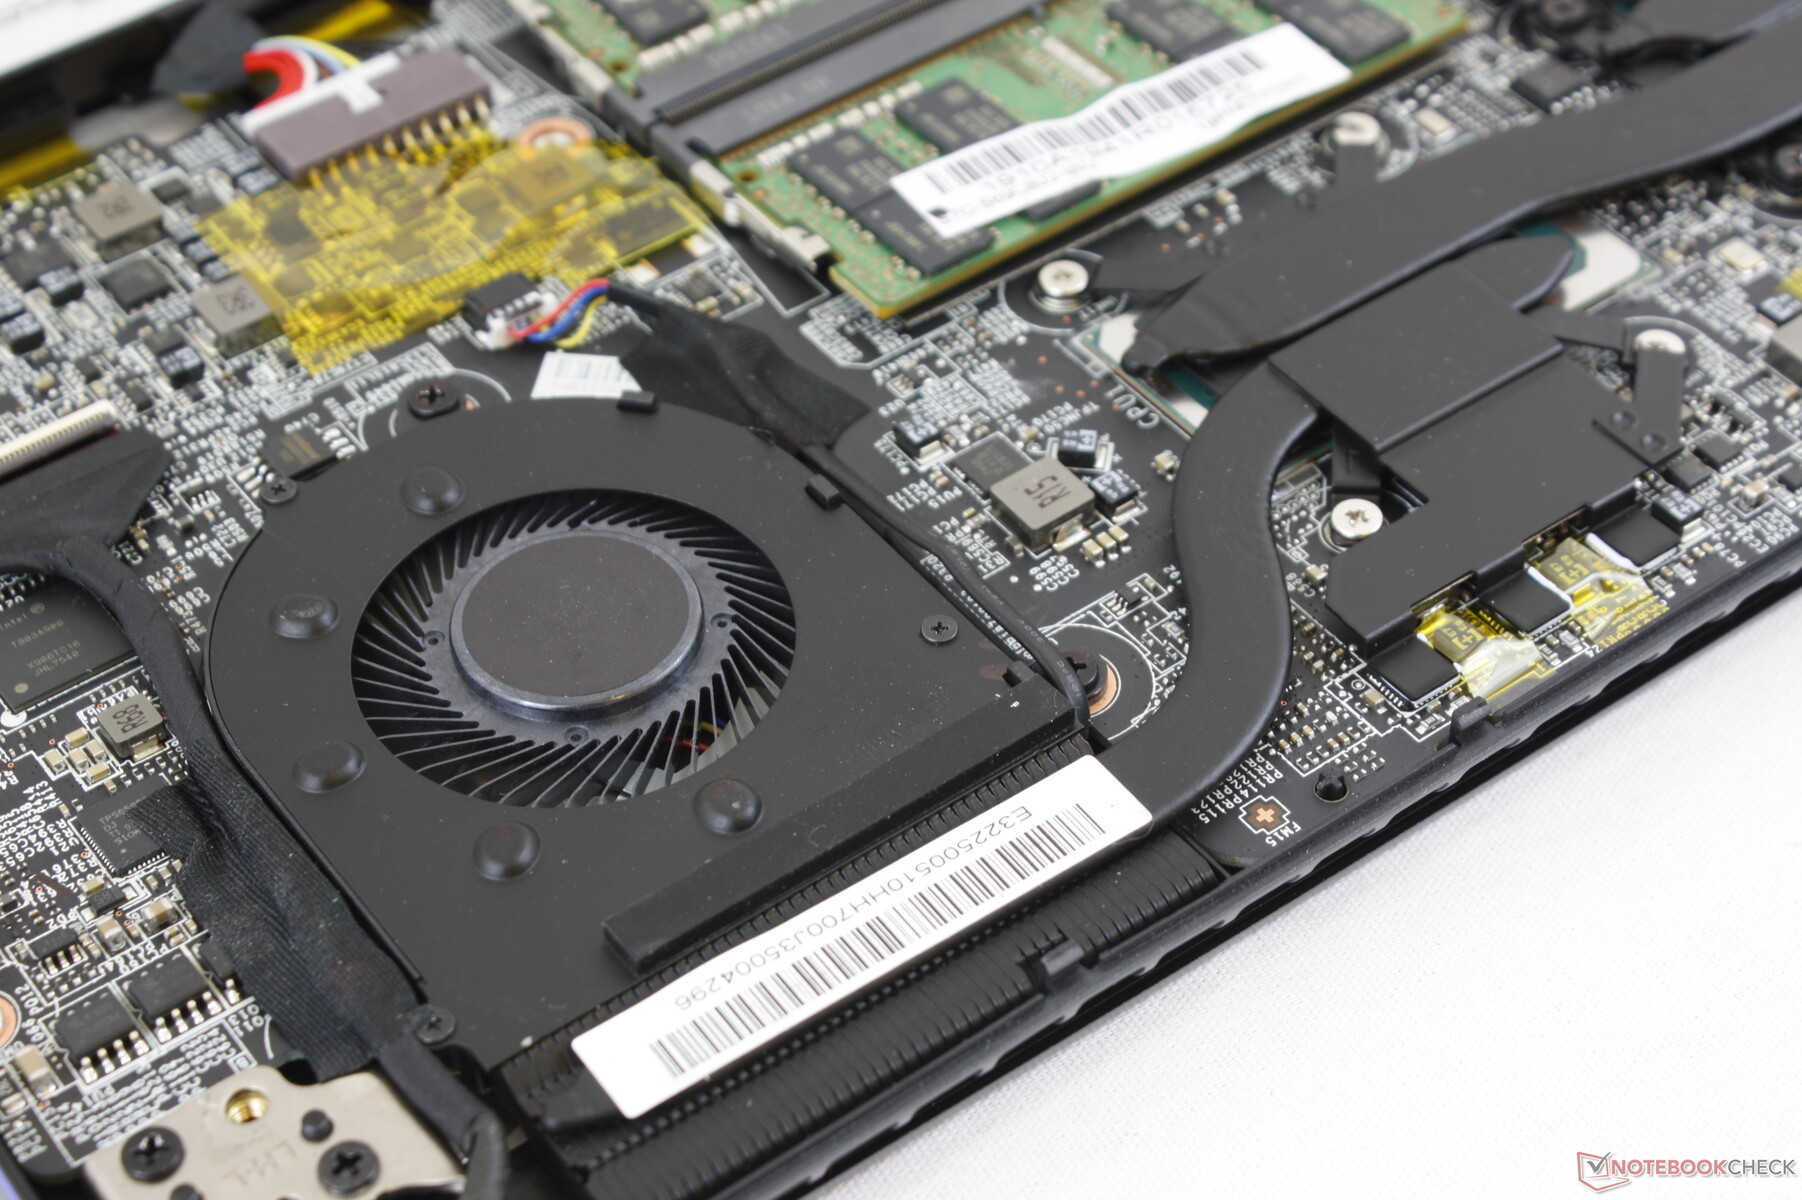
Soğutma çözümü iki asimetrik fandan (~ 40 mm ~ 50 mm) ve üç ısı borusundan oluşur. Sessiz moda ayarlanmış olsalar bile fanlar hiçbir zaman gerçekten rölantide değildir, ancak çoğu ortam koşullarında bile gürültü fark edilmez. Boşta veya masaüstünde veya internette gezinirken 29.3 dB (A) değerinde bir arka plana karşı sadece 30.2 dB (A) ses kaydedebiliyoruz. Örneğin 3DMark 06'nın çalıştırılması, daha güçlü MSI P65'teki 40.9 dB (A) ile karşılaştırıldığında sadece 31,5 dB (A) fan gürültüsüyle sonuçlanır. Oyunların çoğu özel oyun dizüstü bilgisayarından daha sessiz olması durumunda 37 dB (A) sabit bir gürültü seviyesi bekleyin. En kötüsü, Prime95 ve FurMark'ı aynı anda çalıştırırken 47 dB (A) gürültü seviyesini aynı anda kaydedebiliyoruz. Test ünitemizden elektronik gürültü veya bobin sızıntısı olduğunu fark etmiyoruz.
| MSI Prestige 15 A10SC GeForce GTX 1650 Max-Q, i7-10710U, Samsung SSD PM981 MZVLB1T0HALR | Microsoft Surface Laptop 3 15 Ryzen 5 3580U Vega 9, R5 3580U, SK hynix BC501 HFM256GDGTNG | MSI P65 Creator 9SF-657 GeForce RTX 2070 Max-Q, i9-9880H, 2x Samsung SSD PM981 MZVLB512HAJQ (RAID 0) | Lenovo ThinkPad T590-20N4002VGE GeForce MX250, i7-8565U, Toshiba XG6 KXG60ZNV512G | Dell Latitude 5500 UHD Graphics 620, i7-8665U, Toshiba XG6 KXG60ZNV1T02 | HP EliteBook 755 G5 3UN79EA Vega 10, R7 2700U, Toshiba XG5 KXG50ZNV512G | Dell Precision 5530 Xeon E-2176M Quadro P2000, E-2176M, SK hynix PC400 512 GB | |
|---|---|---|---|---|---|---|---|
| Noise | 6% | -9% | 4% | 9% | 0% | -7% | |
| kapalı / ortam * (dB) | 29.3 | 28 4% | 30.2 -3% | 29.4 -0% | 28.8 2% | 30.5 -4% | 28.4 3% |
| Idle Minimum * (dB) | 30.1 | 28 7% | 32.8 -9% | 29.3 3% | 28.8 4% | 30.5 -1% | 28.4 6% |
| Idle Average * (dB) | 30.2 | 28 7% | 32.8 -9% | 29.3 3% | 28.8 5% | 30.5 -1% | 28.4 6% |
| Idle Maximum * (dB) | 30.2 | 28 7% | 33.6 -11% | 31.8 -5% | 28.8 5% | 30.5 -1% | 28.4 6% |
| Load Average * (dB) | 31.5 | 29.2 7% | 40.9 -30% | 33.5 -6% | 30.3 4% | 37.5 -19% | 46.5 -48% |
| Witcher 3 ultra * (dB) | 37 | 39 -5% | 33.5 9% | 46.5 -26% | |||
| Load Maximum * (dB) | 47 | 41.4 12% | 42.7 9% | 35.8 24% | 32.6 31% | 35 26% | 46.5 1% |
* ... daha küçük daha iyidir
Ses yüksekliği
| Boşta |
| 30.1 / 30.2 / 30.2 dB |
| Çalışırken |
| 31.5 / 47 dB |
 | ||
30 dB sessiz 40 dB(A) duyulabilirlik 50 dB(A) gürültülü |
||
min: | ||
Sıcaklık
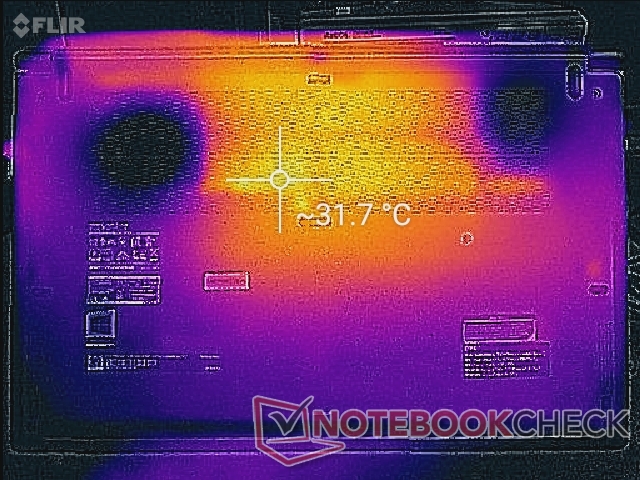
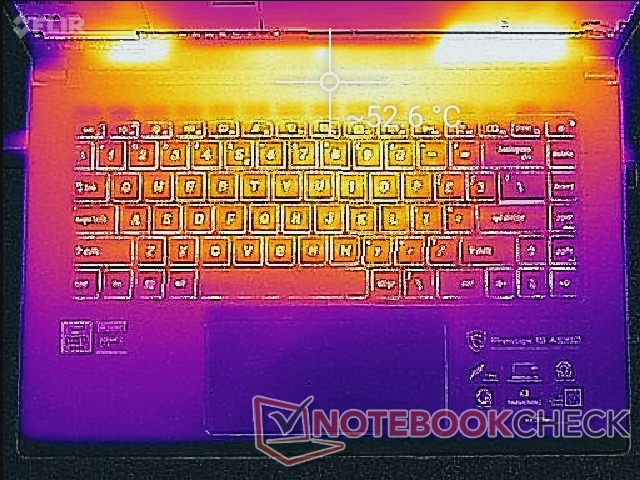
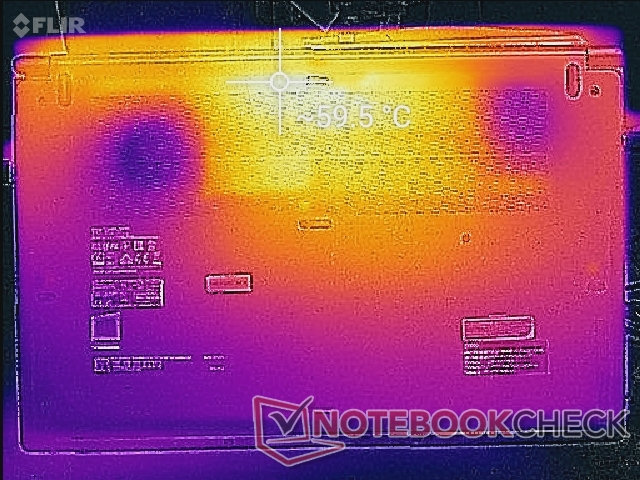
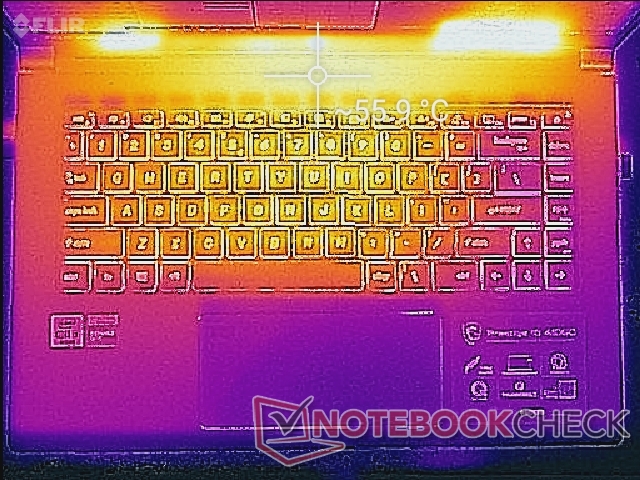
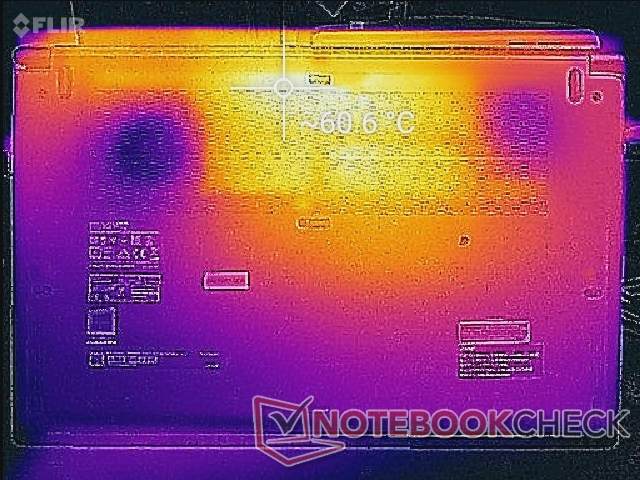
Yüzey sıcaklıkları, düşük veya rölanti yükleri sırasında dizüstü bilgisayarın merkezine doğru yaklaşık 31 ° C'de doruğa ulaşır. Oyun oynarken veya ağır yükler taşırken, yüzeyler aşağıdaki sıcaklık haritalarımızda gösterildiği gibi 55 C - 60 C kadar sıcak olabilir. Bu etkin noktalar, neyse ki kullanıcıların dokunmayacakları ilk klavye tuşları satırının üstünde.
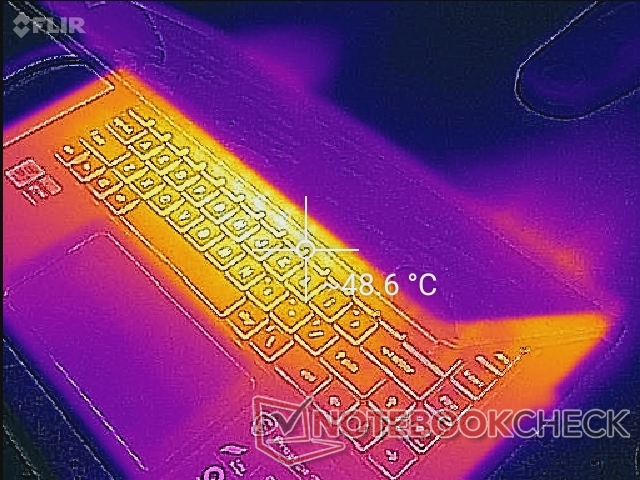
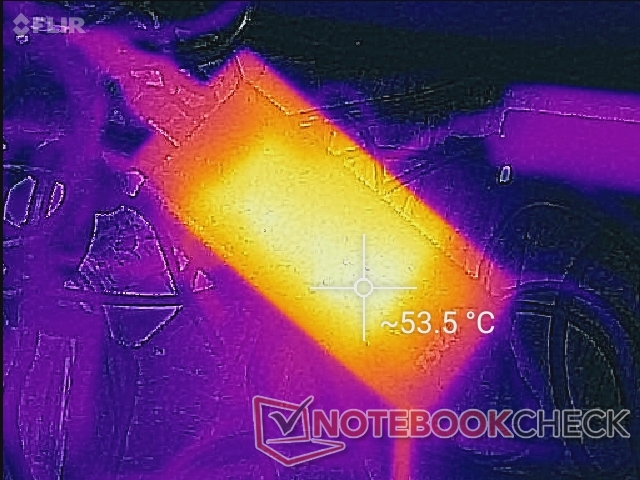
(-) Üst taraftaki maksimum sıcaklık, 36.8 °C / 98 F ortalamasına kıyasla 56 °C / 133 F'dir. , Multimedia sınıfı için 21 ile 71 °C arasında değişir.
(-) Alt kısım, 39.2 °C / 103 F ortalamasına kıyasla maksimum 60.6 °C / 141 F'ye kadar ısınır
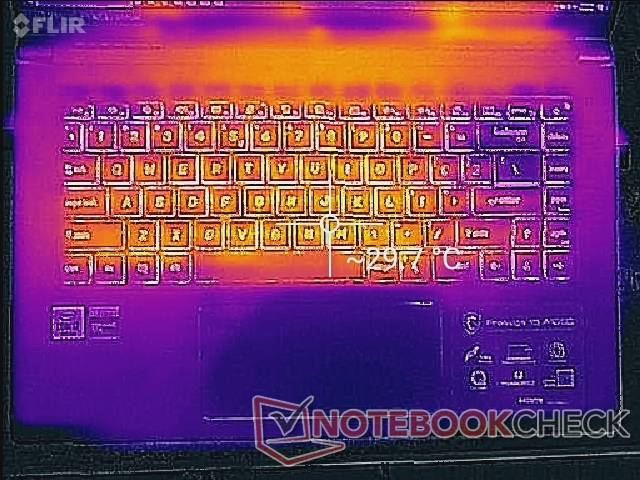
(+) Boşta kullanımda, üst tarafın ortalama sıcaklığı 27.2 °C / 81 F olup, cihazın 31.3 °C / 88 F.
(-) The Witcher 3 oynarken, üst tarafın ortalama sıcaklığı 39.4 °C / 103 F olup, cihazın 31.3 °C / 88 F.
(+) Avuç içi dayanakları ve dokunmatik yüzey maksimum (34.6 °C / 94.3 F) cilt sıcaklığına ulaşıyor ve bu nedenle sıcak değil.
(-) Benzer cihazların avuç içi dayanağı alanının ortalama sıcaklığı 28.7 °C / 83.7 F (-5.9 °C / -10.6 F) idi.
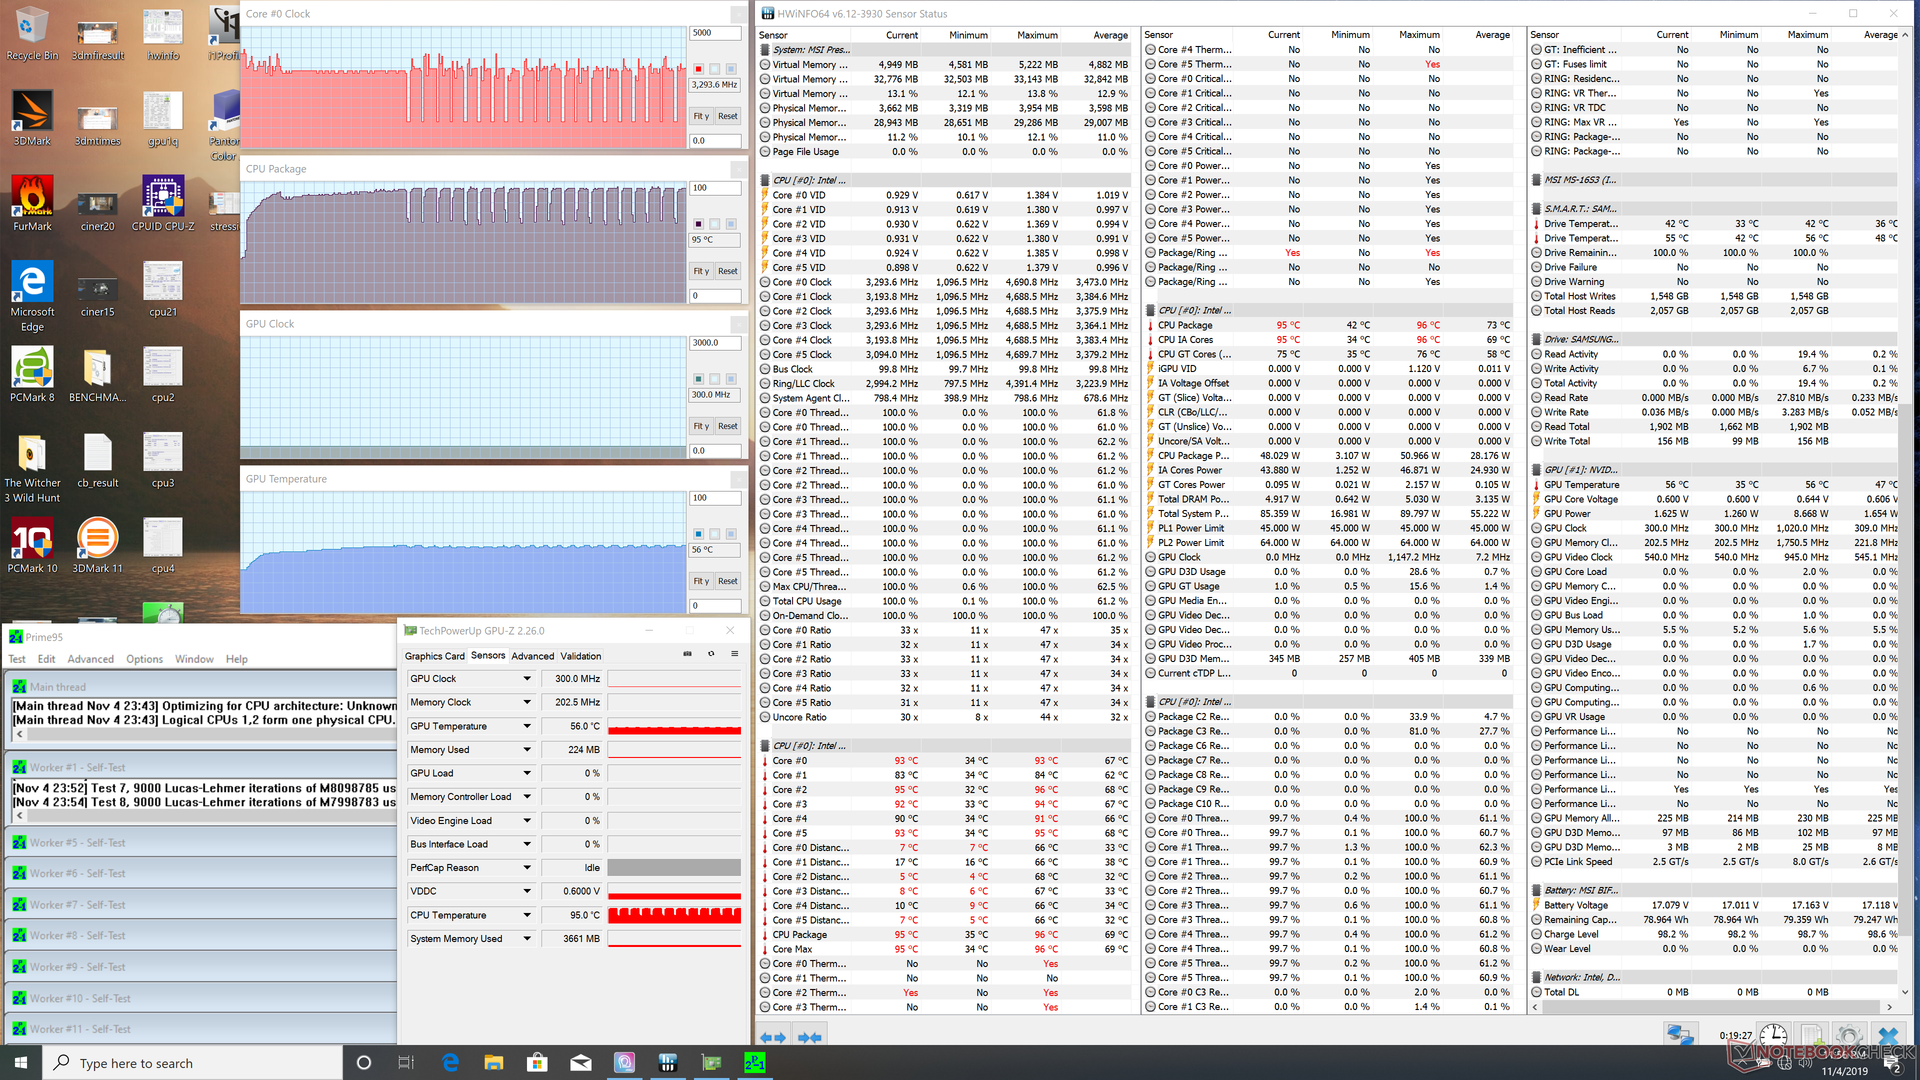
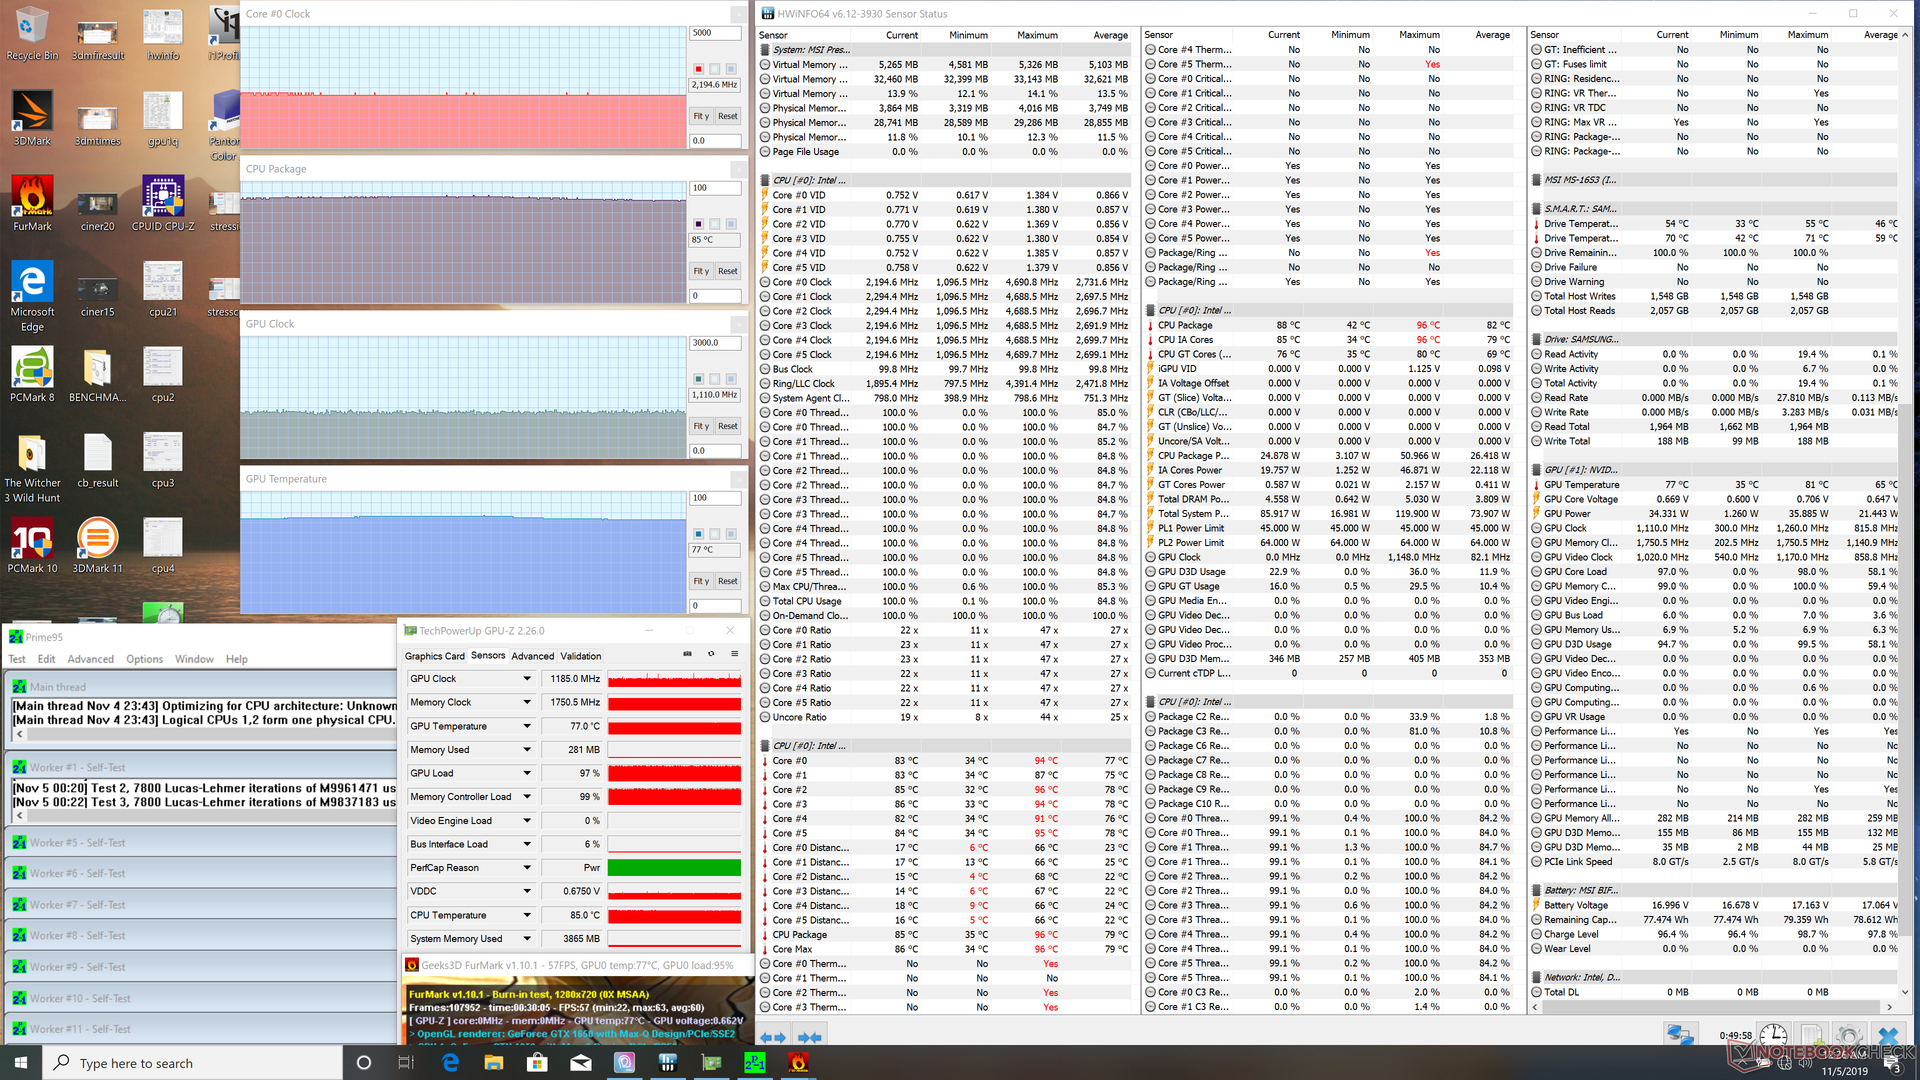
Gerilme Testi - Garip Kısma Davranışı
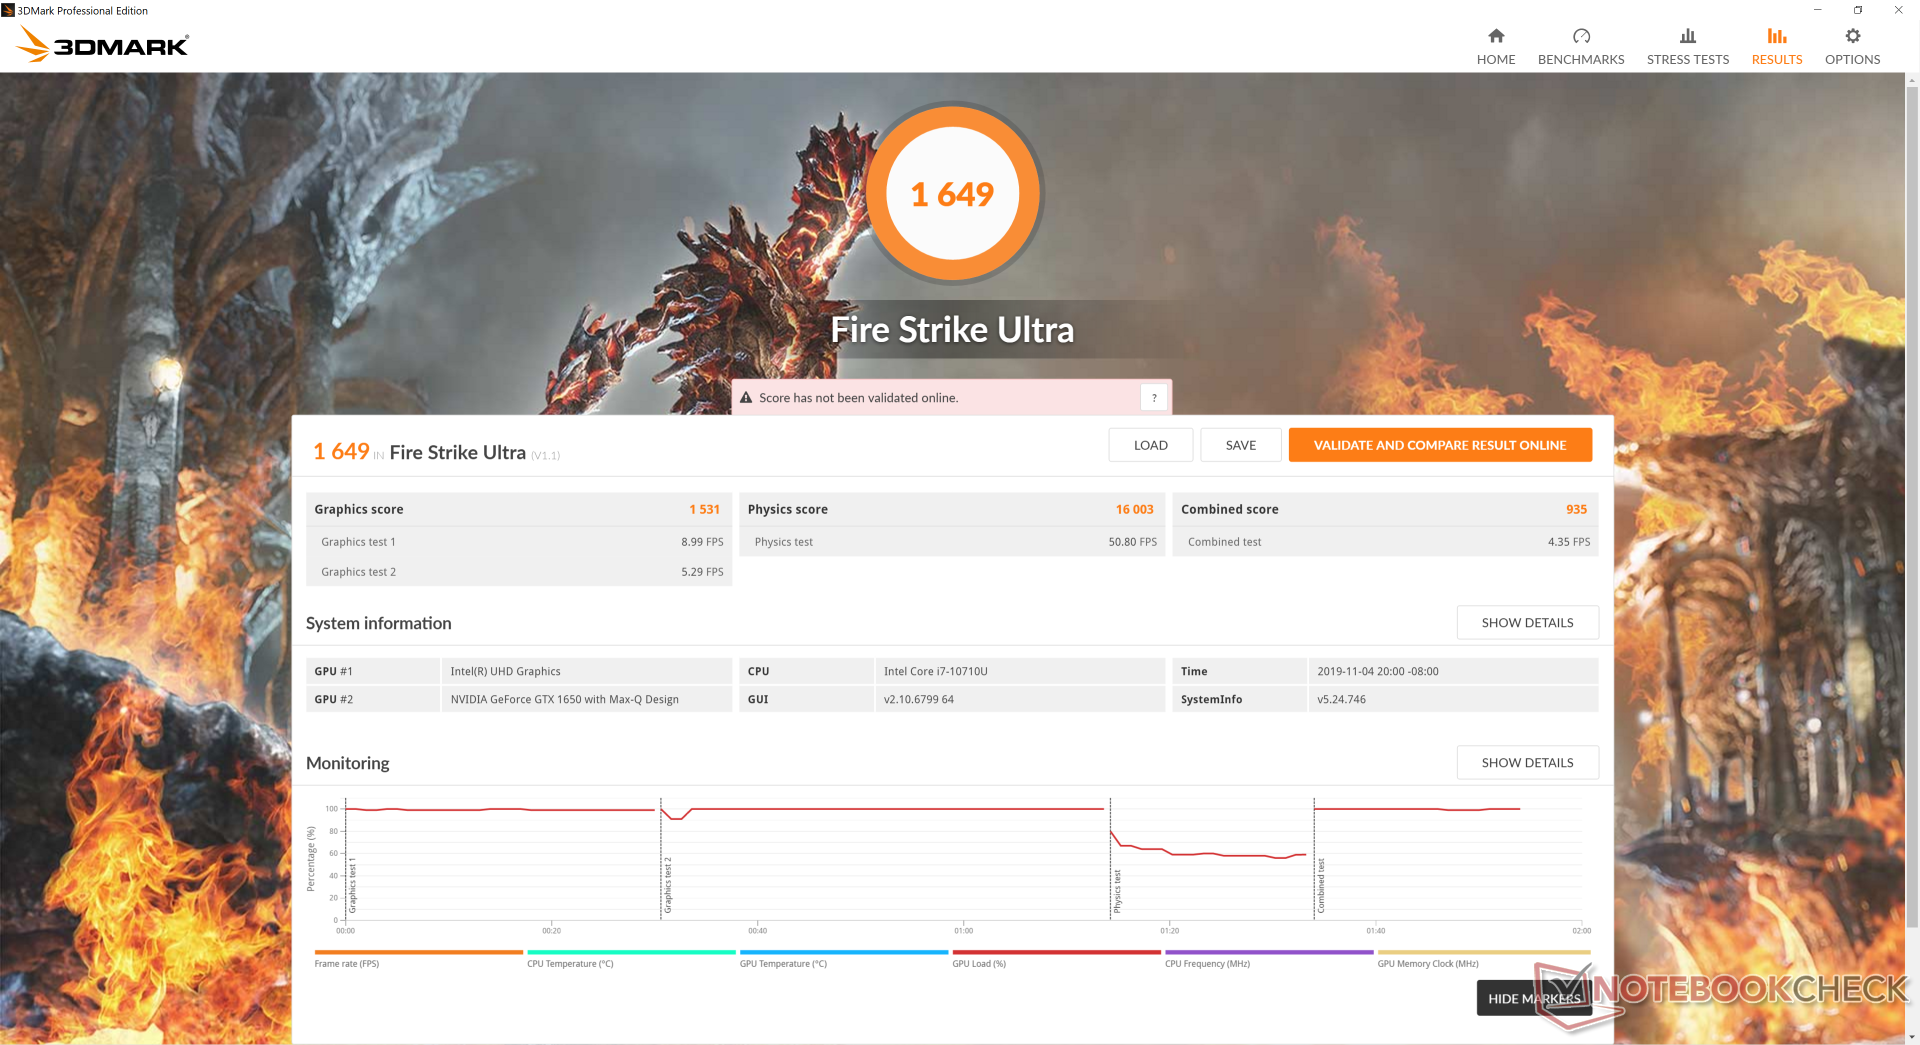
Potansiyel boğulma ya da stabilite sorunları için dizüstü bilgisayarı vurgularız. Prime95'i çalıştırırken, CPU saat hızları, çekirdek sıcaklık 92 C'ye ulaşana kadar ilk birkaç saniye boyunca 3.6 GHz'e kadar gözlenebiliyor. Bundan sonra, saat hızları 90'da bir çekirdek sıcaklığını korumak için 3.0 ila 3.2 GHz aralığına düşüyor C ila 95 C aralığı. Ancak yaklaşık 4.5 dakika sonra, saat hızı ve sıcaklık sırasıyla 0.8 ve 3.3 GHz ve 67 C ve 95 C arasında değişecektir. Bu kısma davranışı gariptir çünkü yukarıdaki CineBench stres testi sırasında oluşmaz ve yine de tekrar tekrar çalıştırıldıktan sonra bile Prime95'te gerçekleşir. Kısıtlayıcı gözlemlerimizi yakında ikinci bir Prestige 15 ünite ile tekrar teyit edeceğiz. Brunning Witcher 3, daha güçlü olan XPS 15 7590'da gözlemlediklerimizden daha sıcak olan sırasıyla 85 C ve 80 C sabit CPU ve GPU sıcaklıklarına neden oluyor benzer koşullar altında olduğunda. CPU ve GPU düşük güç işlemcileri olabilir, ancak çalışma sıcaklıkları başka herhangi bir şey olabilir. Akülerle yapılan bir Yangın Vuruşu, ana şebekedeki 15892 ve 7774 puanlarla karşılaştırıldığında sırasıyla 8865 ve 7323 puanlık Fizik ve Grafik puanları verir.
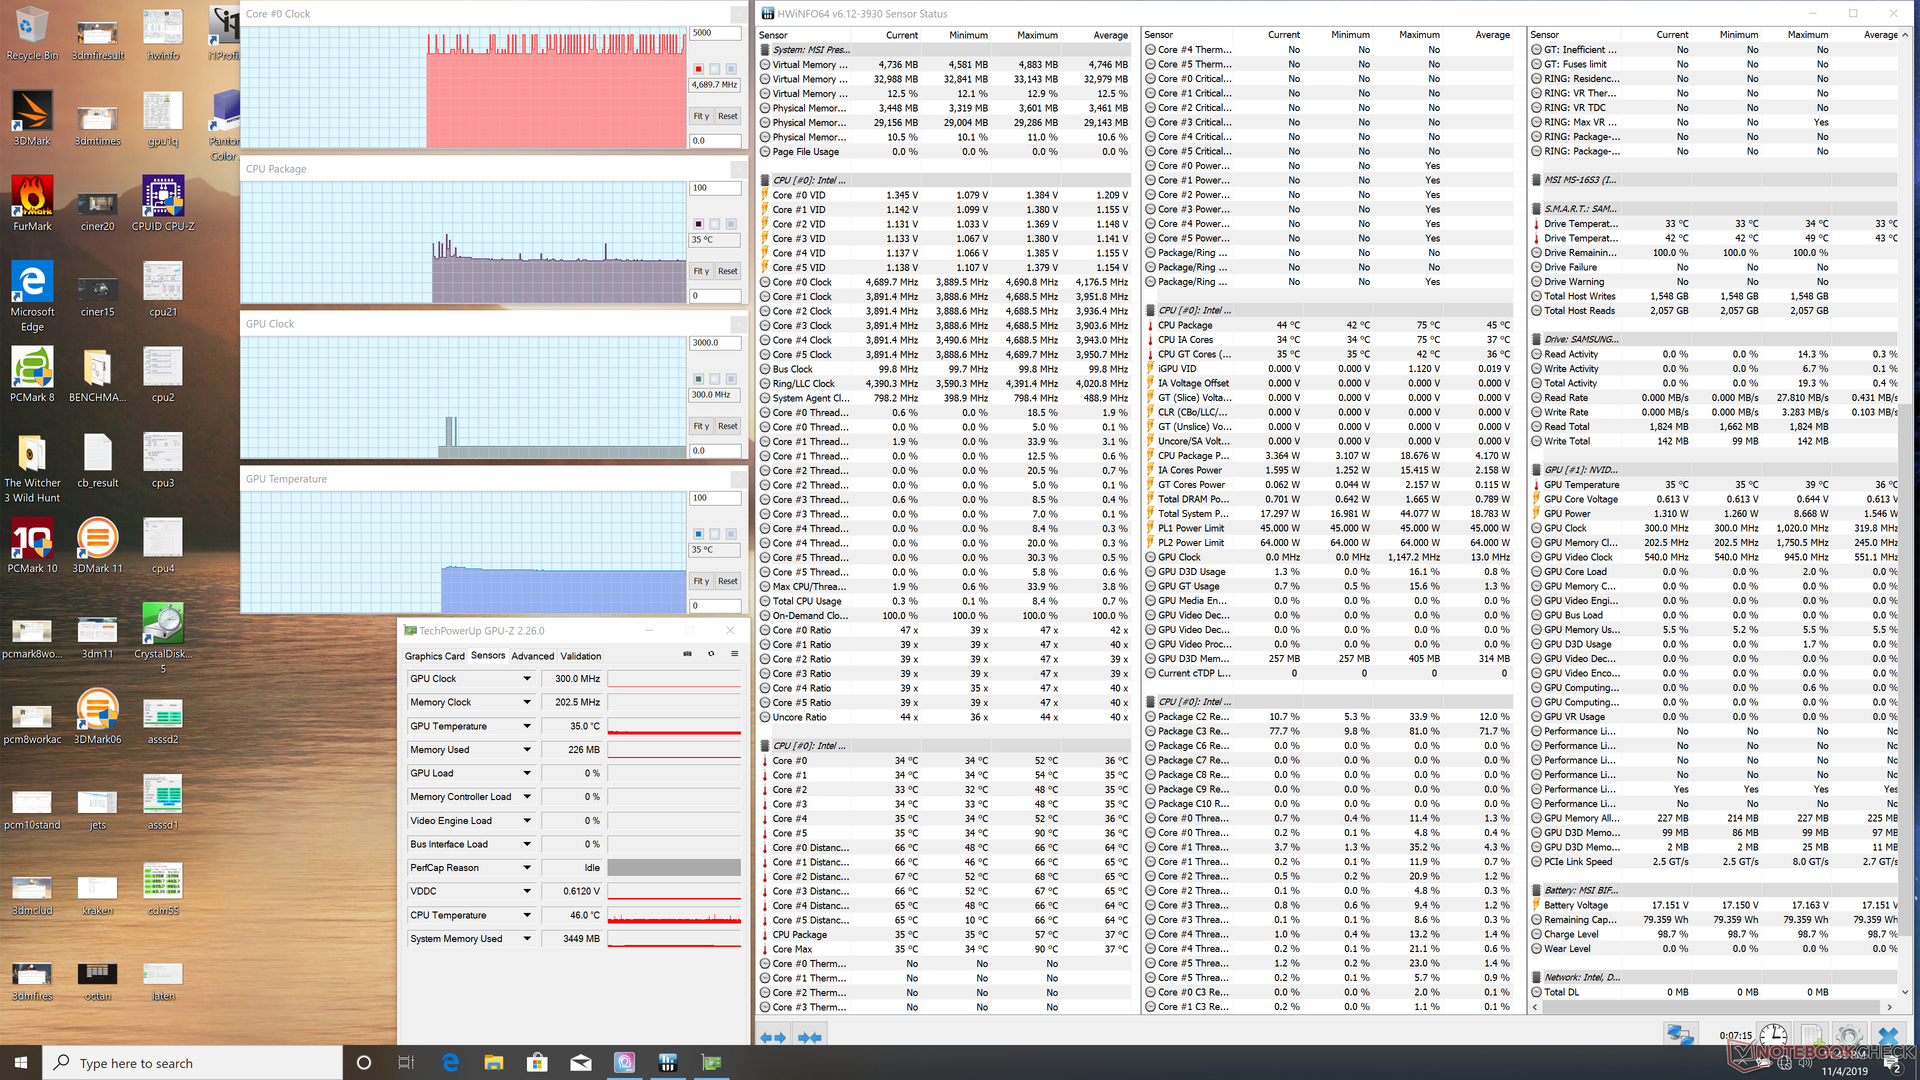
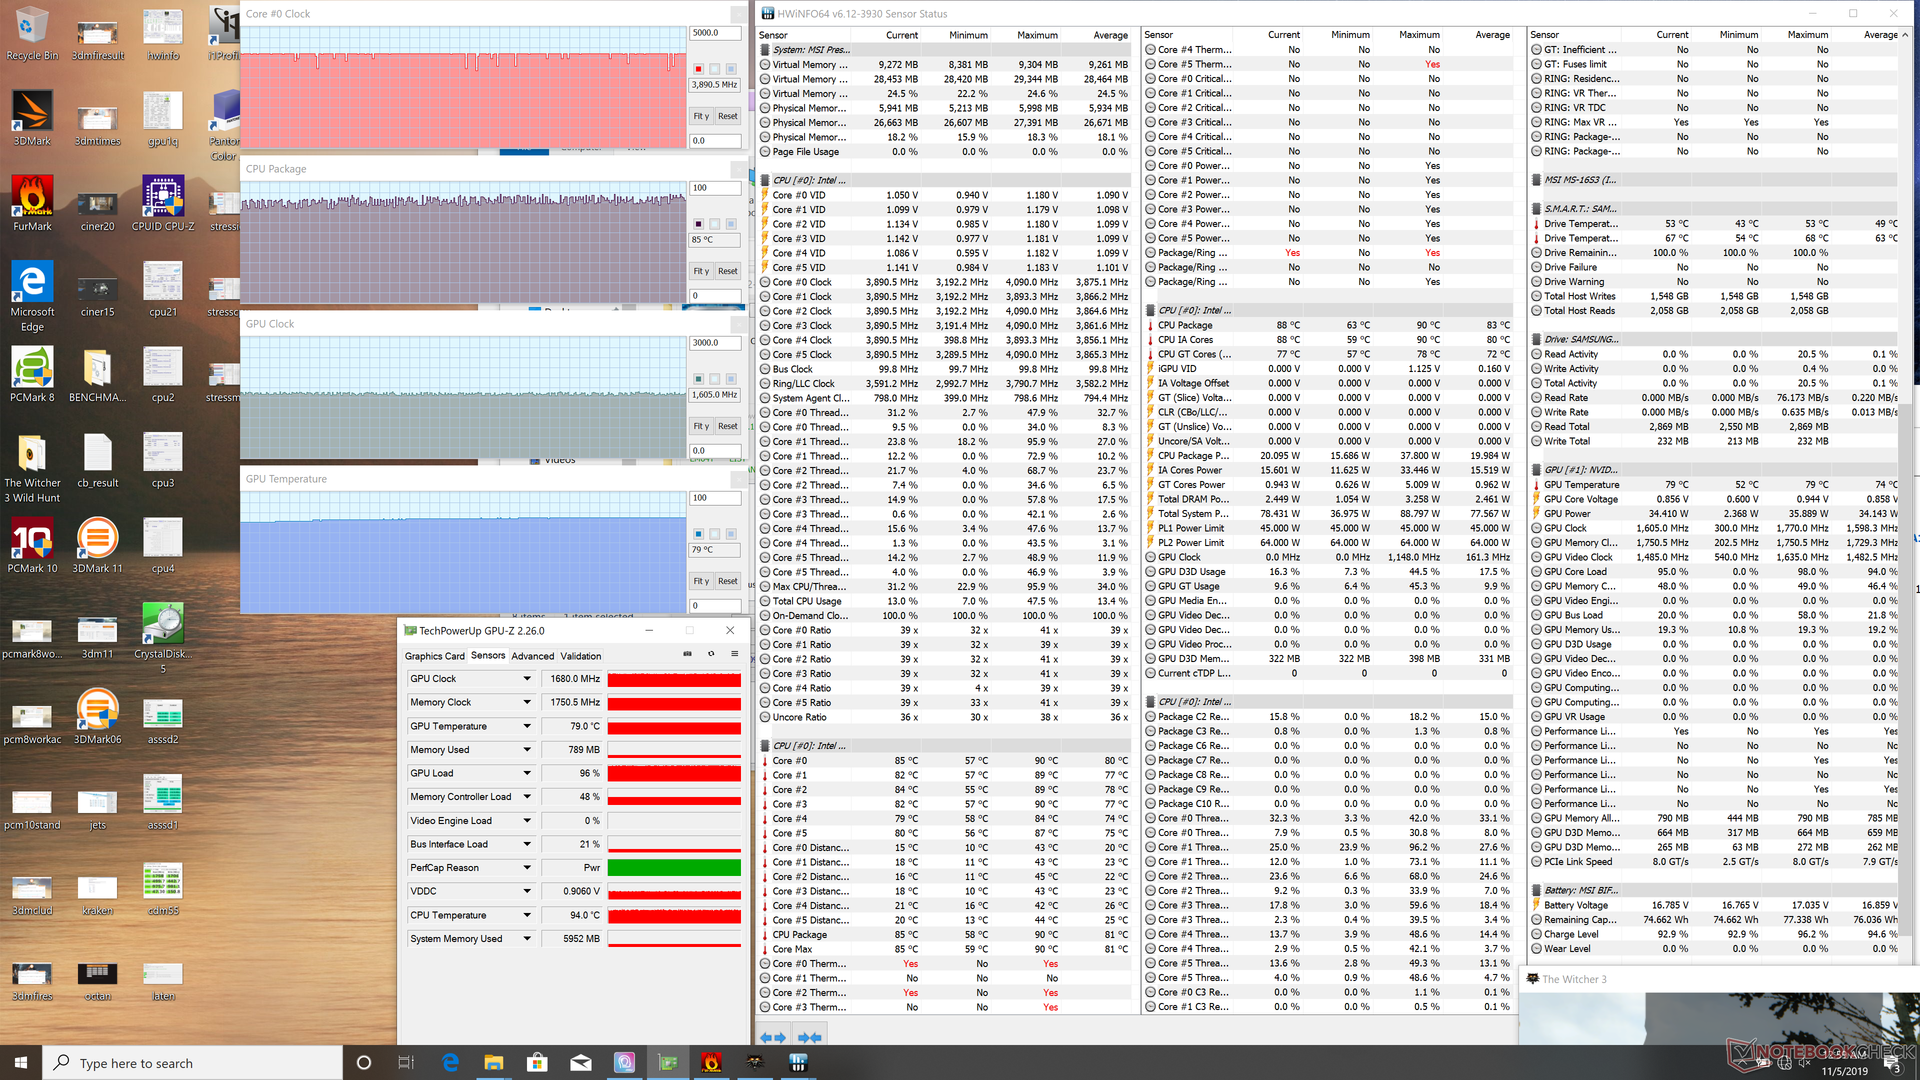
| CPU Clock (GHz) | GPU Clock (MHz) | Average CPU Temperature (°C) | Average GPU Temperature (°C) | |
| System Idle | -- | -- | 35 | 35 |
| Prime95 Stress | 0.8 - 3.3 | 67 - 95 | 56 | |
| Prime95 + FurMark Stress | 2.2 | 1185 | 85 | 77 |
| Witcher 3 Stress | 3.9 | 1680 | 85 | 80 |
Hoparlörler
Ses kalitesi, yalnızca ortalama bas çoğalmasıyla konferans görüşmeleri için yeterince iyi ancak multimedya oynatımı için yeterli olmadığı için iyi. Daha yüksek ses seviyesi ayarları avuç içi dayanağının hafifçe dokunmasına neden olur.


MSI Prestige 15 A10SC ses analizi
(±) | hoparlör ses yüksekliği ortalama ama iyi (80.1 dB)
Bas 100 - 315Hz
(±) | azaltılmış bas - ortalama olarak medyandan 12.8% daha düşük
(+) | bas doğrusaldır (6.4% delta ile önceki frekans)
Ortalar 400 - 2000 Hz
(+) | dengeli ortalar - medyandan yalnızca 4.6% uzakta
(±) | Ortaların doğrusallığı ortalamadır (10% delta - önceki frekans)
Yüksekler 2 - 16 kHz
(+) | dengeli yüksekler - medyandan yalnızca 2.4% uzakta
(+) | yüksekler doğrusaldır (6.4% deltadan önceki frekansa)
Toplam 100 - 16.000 Hz
(±) | Genel sesin doğrusallığı ortalamadır (20.2% ortancaya göre fark)
Aynı sınıfla karşılaştırıldığında
» Bu sınıftaki tüm test edilen cihazların %68%'si daha iyi, 8% benzer, 24% daha kötüydü
» En iyisinin deltası 5% idi, ortalama 17% idi, en kötüsü 45% idi
Test edilen tüm cihazlarla karşılaştırıldığında
» Test edilen tüm cihazların %53'si daha iyi, 8 benzer, % 39 daha kötüydü
» En iyisinin deltası 4% idi, ortalama 23% idi, en kötüsü 134% idi
Apple MacBook 12 (Early 2016) 1.1 GHz ses analizi
(+) | hoparlörler nispeten yüksek sesle çalabilir (83.6 dB)
Bas 100 - 315Hz
(±) | azaltılmış bas - ortalama olarak medyandan 11.3% daha düşük
(±) | Bas doğrusallığı ortalamadır (14.2% delta - önceki frekans)
Ortalar 400 - 2000 Hz
(+) | dengeli ortalar - medyandan yalnızca 2.4% uzakta
(+) | orta frekanslar doğrusaldır (5.5% deltadan önceki frekansa)
Yüksekler 2 - 16 kHz
(+) | dengeli yüksekler - medyandan yalnızca 2% uzakta
(+) | yüksekler doğrusaldır (4.5% deltadan önceki frekansa)
Toplam 100 - 16.000 Hz
(+) | genel ses doğrusaldır (10.2% ortancaya göre fark)
Aynı sınıfla karşılaştırıldığında
» Bu sınıftaki tüm test edilen cihazların %7%'si daha iyi, 2% benzer, 90% daha kötüydü
» En iyisinin deltası 5% idi, ortalama 18% idi, en kötüsü 53% idi
Test edilen tüm cihazlarla karşılaştırıldığında
» Test edilen tüm cihazların %5'si daha iyi, 1 benzer, % 94 daha kötüydü
» En iyisinin deltası 4% idi, ortalama 23% idi, en kötüsü 134% idi
Enerji yönetimi
Power Consumption
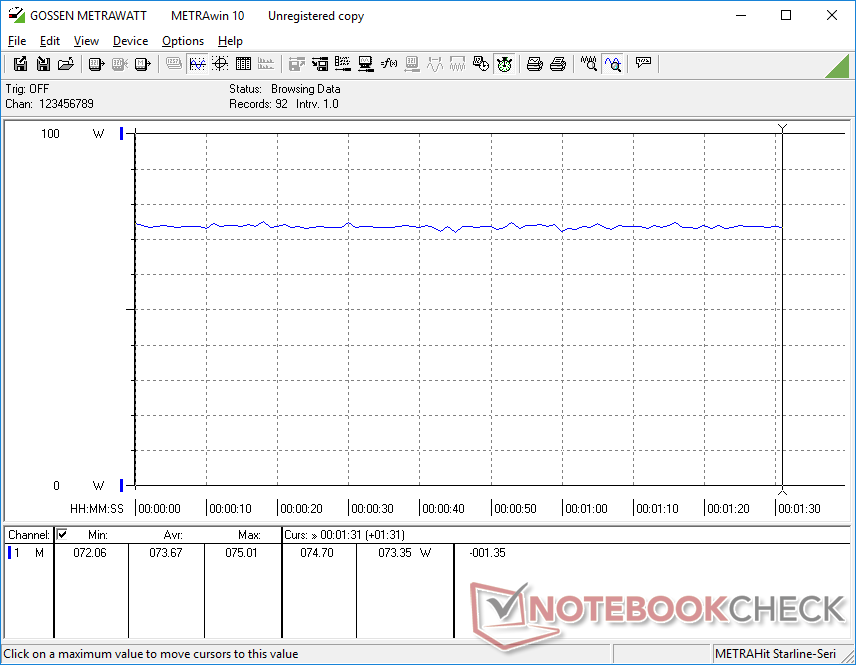
Idling on desktop will demand anywhere between 6 W and 20 W depending on the brightness level and power profile to be not unlike what we discovered on the P65 Creator. The more interesting results come when running higher loads like gaming. Idling on Witcher 3 consumes just 74 W compared to 94 W on the Dell G3 3590 gaming laptop with GTX 1650 graphics or 124 W on the Lenovo Legion Y7000 with GTX 1060 graphics. The performance-per-Watt is impressive for a laptop that pairs an ULV CPU with a Max-Q GPU.
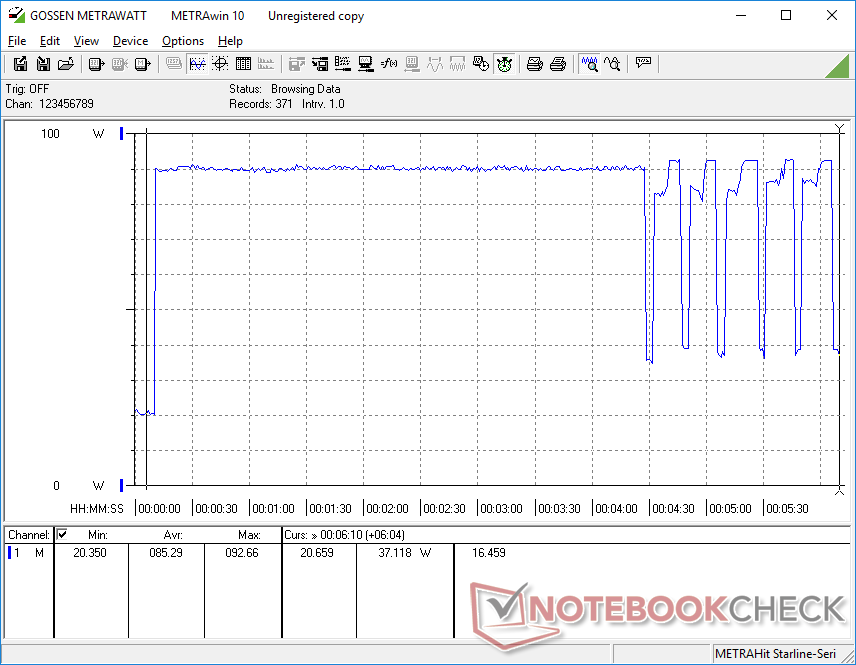
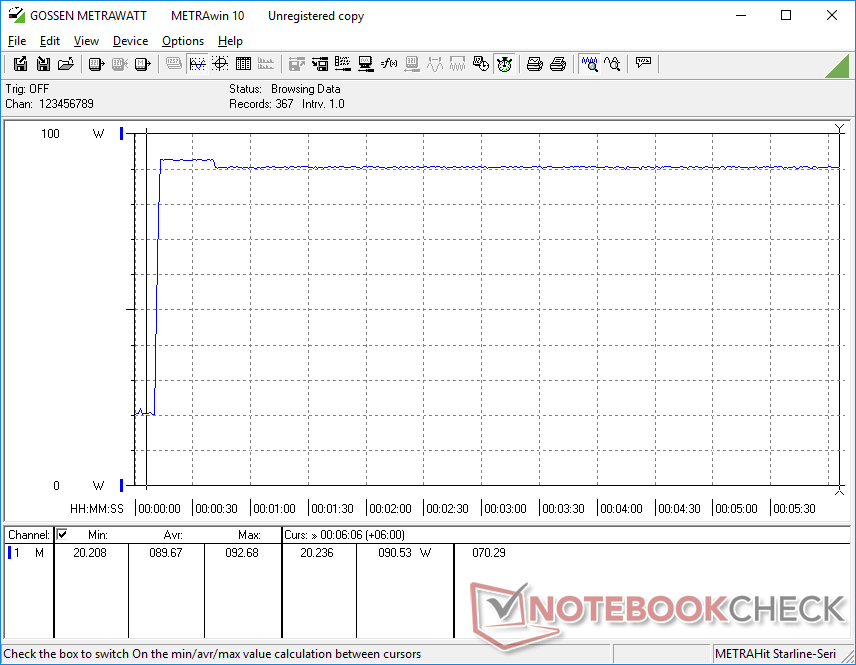
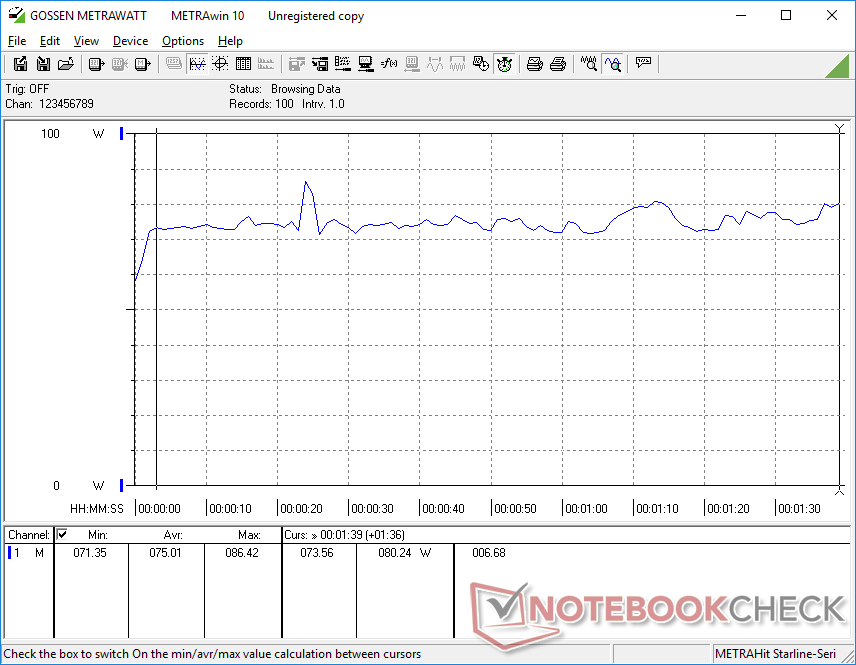
When running Prime95, consumption spikes to 90 W for the first few minutes as shown by our graph below. After a while, however, consumption would cycle between 40 W and 90 W instead of steadily decreasing like on most other laptops. This undesirable behavior matches our Prime95 Stress Test observations above where clock rates would cycle between 1.1 GHz and 3.3 GHz.
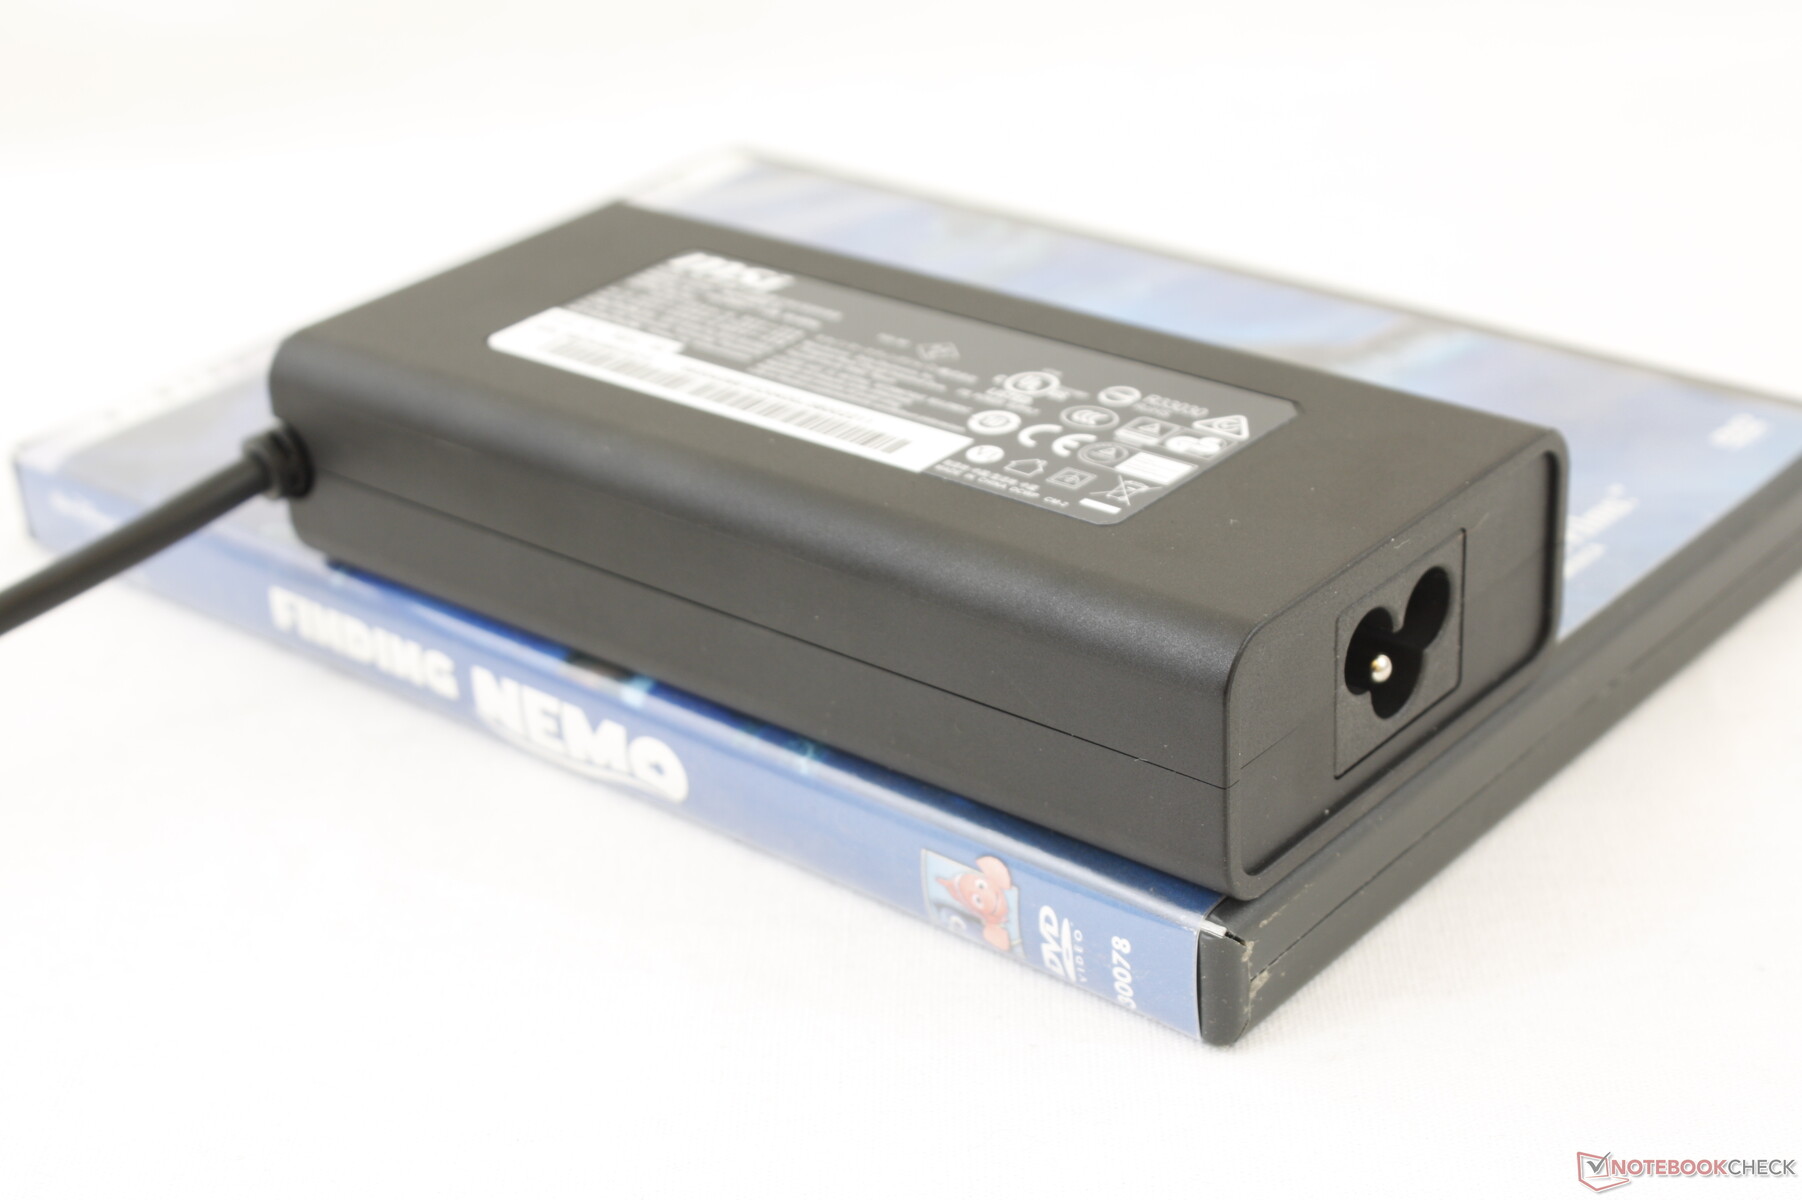
At most, we're able to record a consumption of 92 W when running both Prime95 and FurMark simultaneously from the small-medium (~13 x 6 x 2.8 cm) 90 W AC adapter. Keep in mind that recharging will grind to a halt when running high loads simultaneously.
| Kapalı / Bekleme modu | |
| Boşta | |
| Çalışırken |
|
Key:
min: | |
| MSI Prestige 15 A10SC i7-10710U, GeForce GTX 1650 Max-Q, Samsung SSD PM981 MZVLB1T0HALR, IPS, 3840x2160, 15.6" | Microsoft Surface Laptop 3 15 Ryzen 5 3580U R5 3580U, Vega 9, SK hynix BC501 HFM256GDGTNG, IPS, 2496x1664, 15" | Lenovo ThinkPad T590-20N4002VGE i7-8565U, GeForce MX250, Toshiba XG6 KXG60ZNV512G, aSi IPS LED, 1920x1080, 15.6" | Dell Latitude 5500 i7-8665U, UHD Graphics 620, Toshiba XG6 KXG60ZNV1T02, IPS, 1920x1080, 15.6" | HP EliteBook 755 G5 3UN79EA R7 2700U, Vega 10, Toshiba XG5 KXG50ZNV512G, IPS, 1920x1080, 15.6" | MSI P65 Creator 9SF-657 i9-9880H, GeForce RTX 2070 Max-Q, 2x Samsung SSD PM981 MZVLB512HAJQ (RAID 0), IPS, 3840x2160, 15.6" | Dell Precision 5530 Xeon E-2176M E-2176M, Quadro P2000, SK hynix PC400 512 GB, IGZO, 3840x2160, 15.6" | |
|---|---|---|---|---|---|---|---|
| Power Consumption | 46% | 29% | 40% | 33% | -53% | -24% | |
| Idle Minimum * (Watt) | 6.1 | 3.3 46% | 4.1 33% | 4.4 28% | 5 18% | 9.4 -54% | 9.8 -61% |
| Idle Average * (Watt) | 13.2 | 7.1 46% | 8.3 37% | 6.9 48% | 10.6 20% | 17.4 -32% | 16.8 -27% |
| Idle Maximum * (Watt) | 19.2 | 7.2 62% | 11.8 39% | 7.7 60% | 12.9 33% | 19.6 -2% | 16.9 12% |
| Load Average * (Watt) | 75 | 44.8 40% | 61.6 18% | 43.6 42% | 40.6 46% | 103 -37% | 102.3 -36% |
| Witcher 3 ultra * (Watt) | 74 | 45.1 39% | 54.4 26% | 76.5 -3% | |||
| Load Maximum * (Watt) | 89.7 | 53 41% | 69.4 23% | 69.1 23% | 46.6 48% | 216 -141% | 114.5 -28% |
* ... daha küçük daha iyidir
Battery Life - Versatile USB Type-C Charger
Battery capacity is identical to the P65 Creator at 82 Wh. Runtimes are longer than what we recorded on the P65 since the latter utilizes more powerful components. Users can expect about 7.5 hours of real-world WLAN use when running on battery power.
Recharging from empty to full capacity takes about 1.5 hours when under low or undemanding processing loads.
| MSI Prestige 15 A10SC i7-10710U, GeForce GTX 1650 Max-Q, 82 Wh | Microsoft Surface Laptop 3 15 Ryzen 5 3580U R5 3580U, Vega 9, 45 Wh | Lenovo ThinkPad T590-20N4002VGE i7-8565U, GeForce MX250, 57 Wh | Dell Latitude 5500 i7-8665U, UHD Graphics 620, 68 Wh | HP EliteBook 755 G5 3UN79EA R7 2700U, Vega 10, 56 Wh | MSI P65 Creator 9SF-657 i9-9880H, GeForce RTX 2070 Max-Q, 82 Wh | Dell Precision 5530 Xeon E-2176M E-2176M, Quadro P2000, 97 Wh | |
|---|---|---|---|---|---|---|---|
| Pil Çalışma Süresi | -0% | 53% | 62% | -16% | -40% | -6% | |
| Reader / Idle (h) | 19.1 | 18.7 -2% | 11.9 -38% | 9.6 -50% | 16.5 -14% | ||
| WiFi v1.3 (h) | 7.6 | 9.1 20% | 10.5 38% | 12.3 62% | 8.3 9% | 6 -21% | 8.4 11% |
| Load (h) | 2.1 | 1.7 -19% | 3.5 67% | 1.7 -19% | 1.1 -48% | 1.8 -14% |
Artılar
Eksiler
Verdict - Awesome with a Few Nicks
(November 14, 2019 update: We're unable to reproduce the CPU throttling behavior on a second Prestige 15 unit. Clock rates and core temperature would stabilize at 2.8 GHz and 95 C, respectively, on the second unit. Core temperatures are nonetheless higher than we would like when under such high loads. We recommend keeping your system up to date through the MSI Drivers and App Center and keeping an eye on the CPU temperature if running it at 100 percent utilization.)
The Prestige 15 is proof that MSI can do more than just gaming products. It's arguably just as visually appealing as the XPS 15, ZenBook 15, or Spectre x360 15 while being lighter and generally more versatile for travel because of its USB Type-C charger. The hexa-core Comet Lake-U CPU works very well as an alternative to quad-core Coffee Lake-H provided that the programs you run can fully exploit the six physical cores available. Meanwhile, the 4K UHD display is brighter and more accurate out of the box than what most 15.6-inch Ultrabooks have to offer including the aforementioned Asus and HP. Fan noise is less likely to pulse during higher loads as well when compared to Ultrabooks with more demanding Intel H-series processors.
There's still a lot that MSI can do to make the Prestige 15 even better. The lack of both a Kensington Lock and IR camera, for example, are strange omissions on a high-end office laptop. The case could be made more rigid as it doesn't feel as strong as the flagships from Dell or HP. CPU throttling when under 100 percent utilization could be handled better. Even though the system uses both an ULV Intel CPU and Max-Q Nvidia GPU, core temperatures are still very warm when under load. keyboard and clickpad feedback in particular could be crisper and less spongy.
The MSI Prestige 15 strikes an excellent balance between weight, display quality, CPU performance, GPU performance, and port options. Chassis rigidity, keyboard and clickpad feedback, CPU throttling, and some missing security features could hopefully be addressed on future revisions.
MSI Prestige 15 A10SC
- 11/14/2019 v7 (old)
Allen Ngo
Price comparison
