İnceleme: Xiaomi Mi Gaming Laptop 2019

Daha önce de belirtildiği gibi, Xiaomi'nin Mi Gaming Laptop'unun 2019 baskısının üç farklı modeli mevcut olacak. 8 GB RAM’li bir Core i5-9300H, 16 GB RAM’li Core i7-9750H’ye dayanan bir orta sınıf model ve 16 model RAM’in yerine GeForce RTX 2060’a sahip bir amiral gemisi modeli olan son model bir GeForce GTX 1660 Ti. İkincisi öncekinden daha yavaş olmayabilir, ancak ışın çekme kabiliyetinden yoksun. Tüm birimler 144 Hz IPS FHD ve 512 GB NVMe SSD ile donatılmıştır.
Selefi Xiaomi'nin Mi Gaming Laptop için özel hedef kitlesi Asya pazarlarıdır, bu yüzden size cihazın tam olarak ne kadara mal olacağını söylemek neredeyse imkansızdır. Varsayılan olarak, Windows'un Çince bir sürümüyle birlikte gelir. Bununla birlikte, bazı perakendeciler yüksek kaliteli bir İngiliz Windows 10'u sunmaktadırlar. Ana rakipleri, MSI GL65 9SEK, Lenovo Legion Y540-15IRH, Asus Strix GL531GV veya Çekirdek i7-9750H ve GeForce RTX 2060'lı 15 inçlik diğer notebooklardır. Acer ConceptD 7.
Derecelendirme | Tarih | Modeli | Ağırlık | Yükseklik | Boyut | Çözünürlük | Fiyat |
|---|---|---|---|---|---|---|---|
| 82.3 % v7 (old) | 12/2019 | Xiaomi Mi Gaming Laptop 2019 i7-9750H, GeForce RTX 2060 Mobile | 2.6 kg | 21 mm | 15.60" | 1920x1080 | |
| 80.8 % v7 (old) | MSI GL65 9SEK i7-9750H, GeForce RTX 2060 Mobile | 2.3 kg | 27.5 mm | 15.60" | 1920x1080 | ||
| 85.7 % v6 (old) | 08/2019 | Lenovo Legion Y540-15IRH i7-9750H, GeForce RTX 2060 Mobile | 2.3 kg | 26 mm | 15.60" | 1920x1080 | |
| 84.4 % v7 (old) | Asus Strix GL531GV-PB74 i7-9750H, GeForce RTX 2060 Mobile | 2.4 kg | 25.9 mm | 15.60" | 1920x1080 | ||
| 87.3 % v7 (old) | 08/2019 | Acer ConceptD 7 CN715-71-743N i7-9750H, GeForce RTX 2060 Mobile | 2.2 kg | 17.9 mm | 15.60" | 3840x2160 |
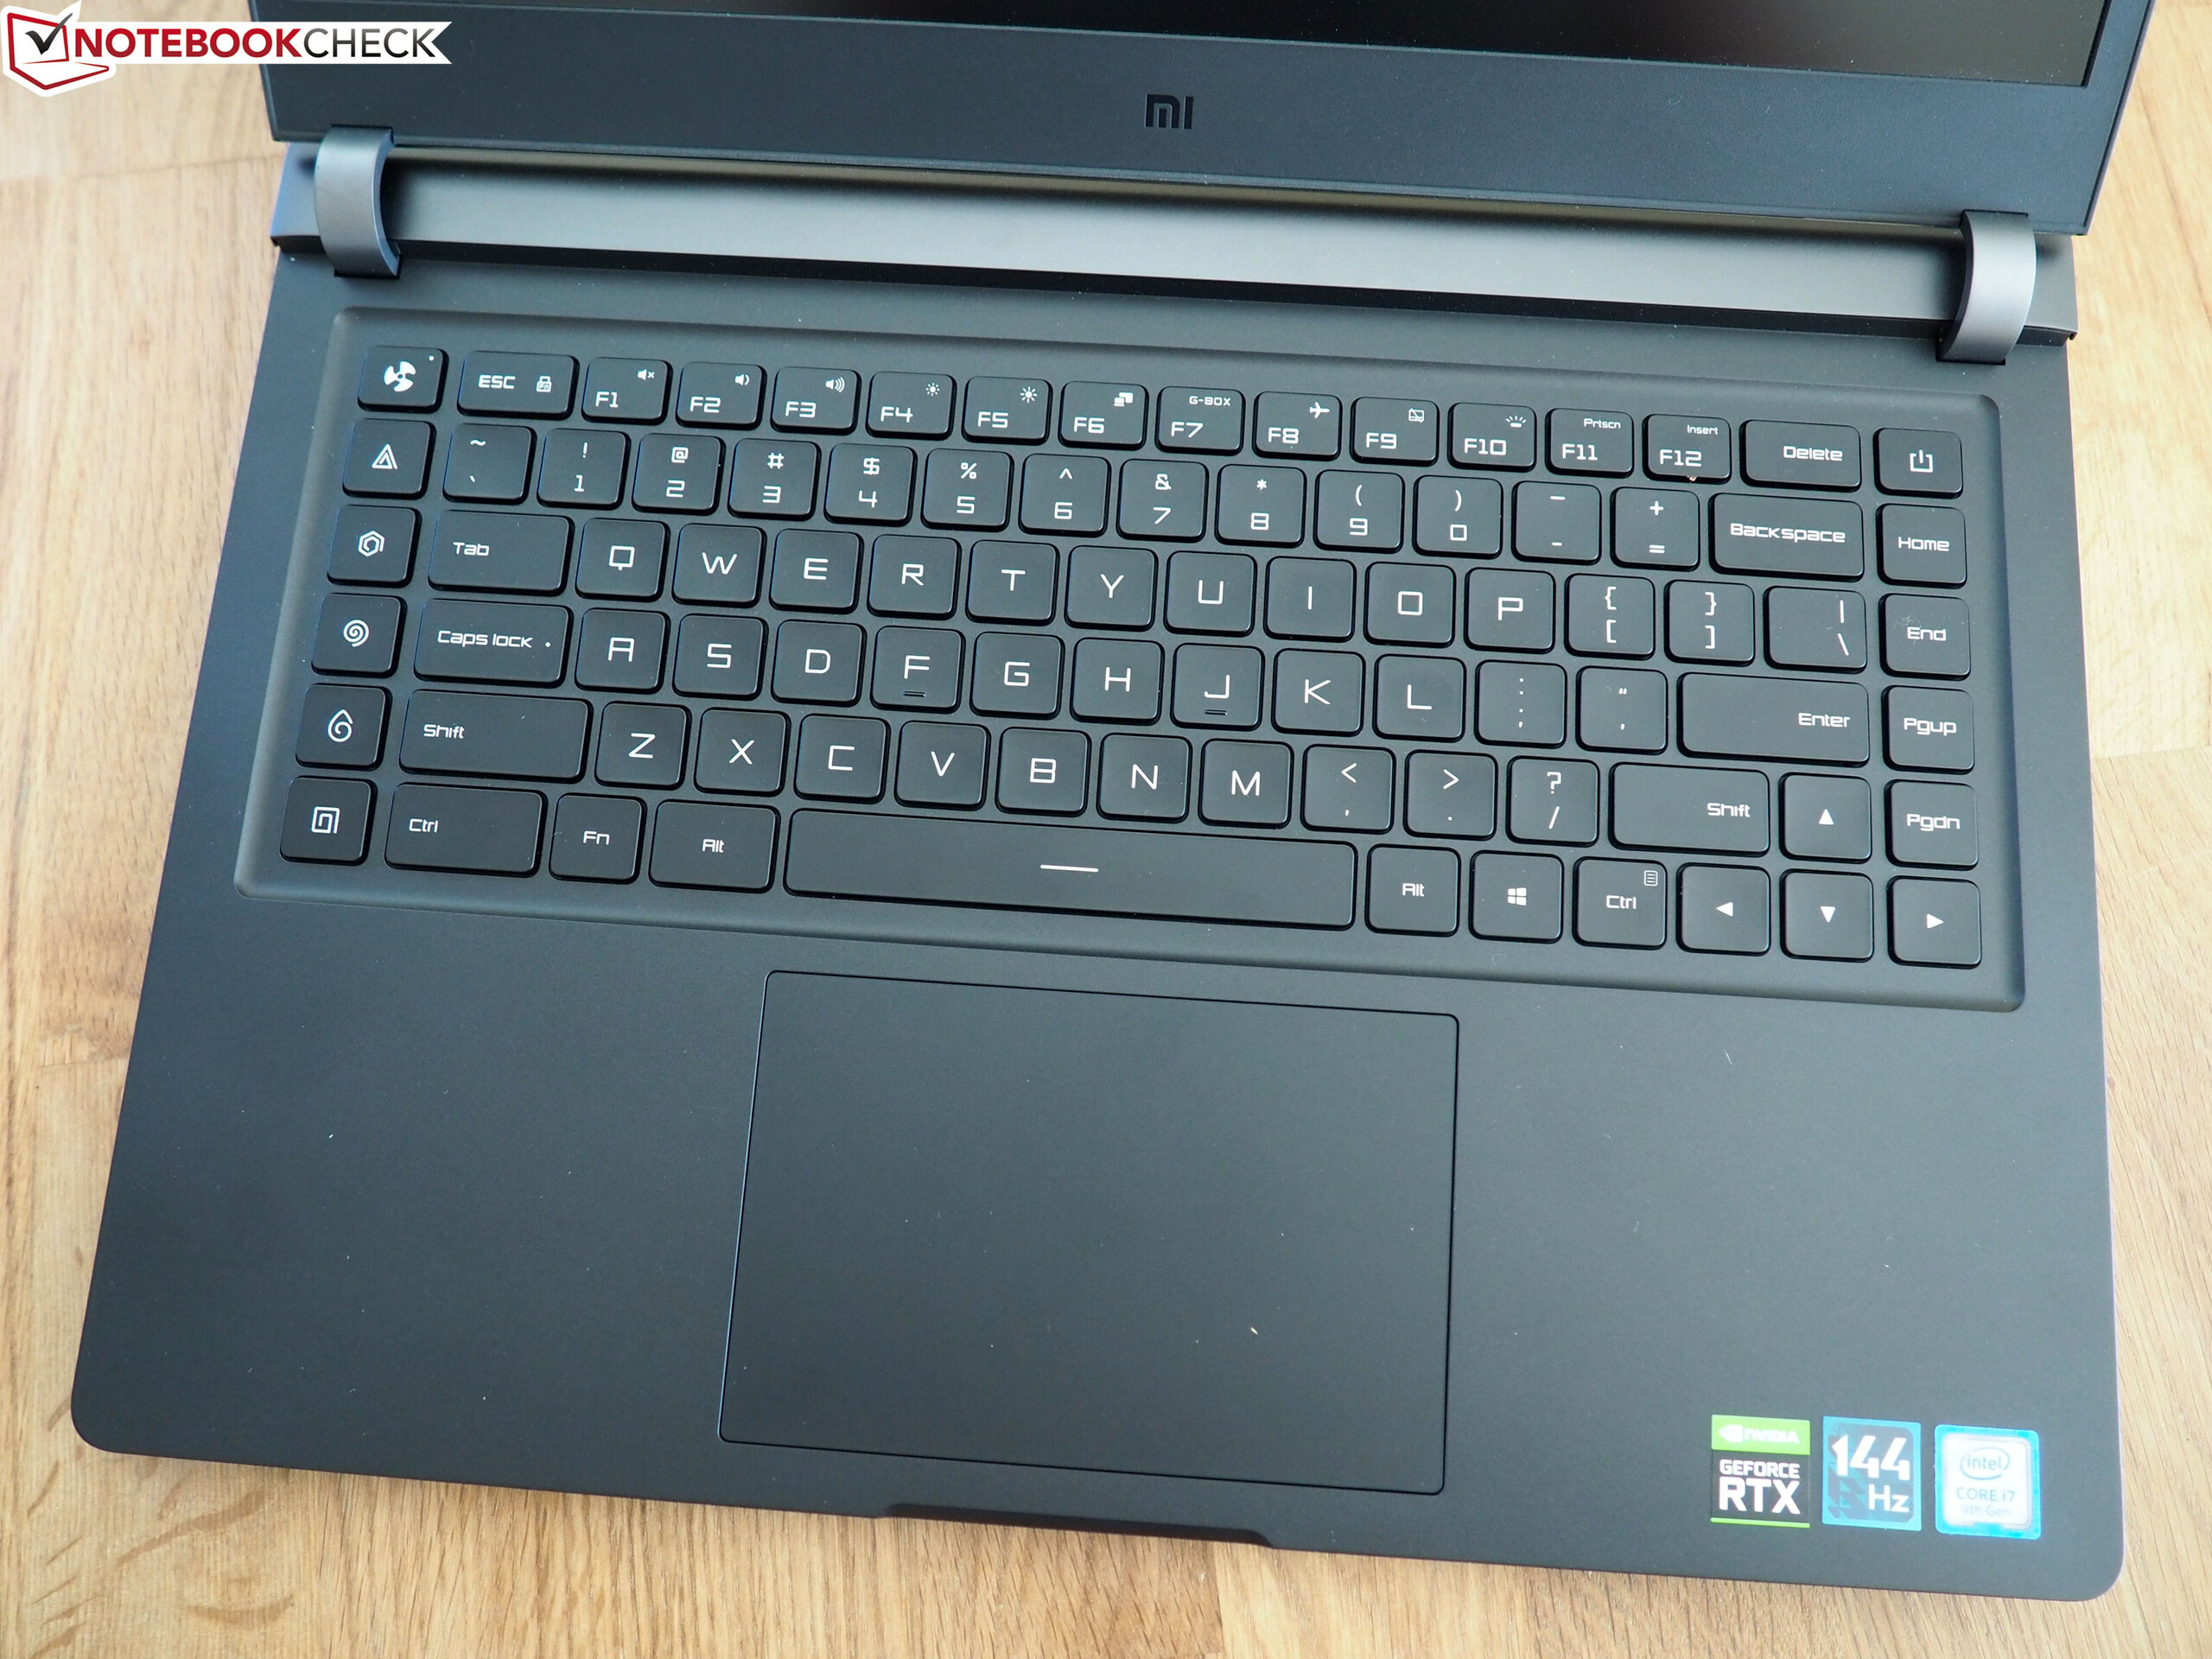
Xiaomi, daha önce mevcut olan bir USB-C portunun talihsiz ihmali haricinde, durumu büyük ölçüde değiştirmeden bıraktığından, bu incelemenin bir parçası olarak dava, bağlantı ve giriş cihazlarını çok derinlemesine ele almayacağız. Bunun yerine, sizi 2018 modelini incelememize yönlendirmek istiyoruz.
| SD Card Reader | |
| average JPG Copy Test (av. of 3 runs) | |
| Sınıf ortalaması Gaming (20.9 - 210, n=54, son 2 yıl) | |
| Xiaomi Mi Gaming Laptop 2019 (Toshiba Exceria Pro SDXC 64 GB UHS-II) | |
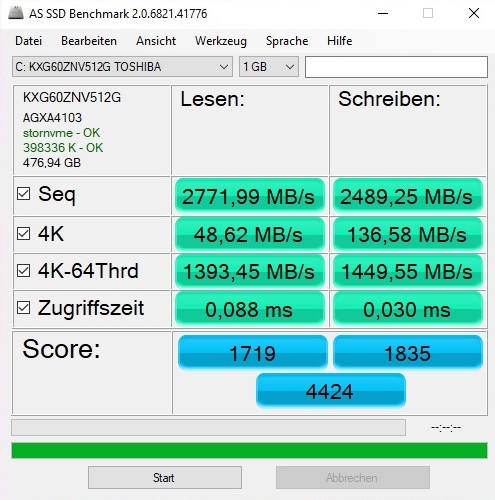
| maximum AS SSD Seq Read Test (1GB) | |
| Sınıf ortalaması Gaming (25.5 - 261, n=51, son 2 yıl) | |
| Xiaomi Mi Gaming Laptop 2019 (Toshiba Exceria Pro SDXC 64 GB UHS-II) | |
| Networking | |
| iperf3 transmit AX12 | |
| Xiaomi Mi Gaming Laptop 2019 | |
| iperf3 receive AX12 | |
| Xiaomi Mi Gaming Laptop 2019 | |
Görüntüle
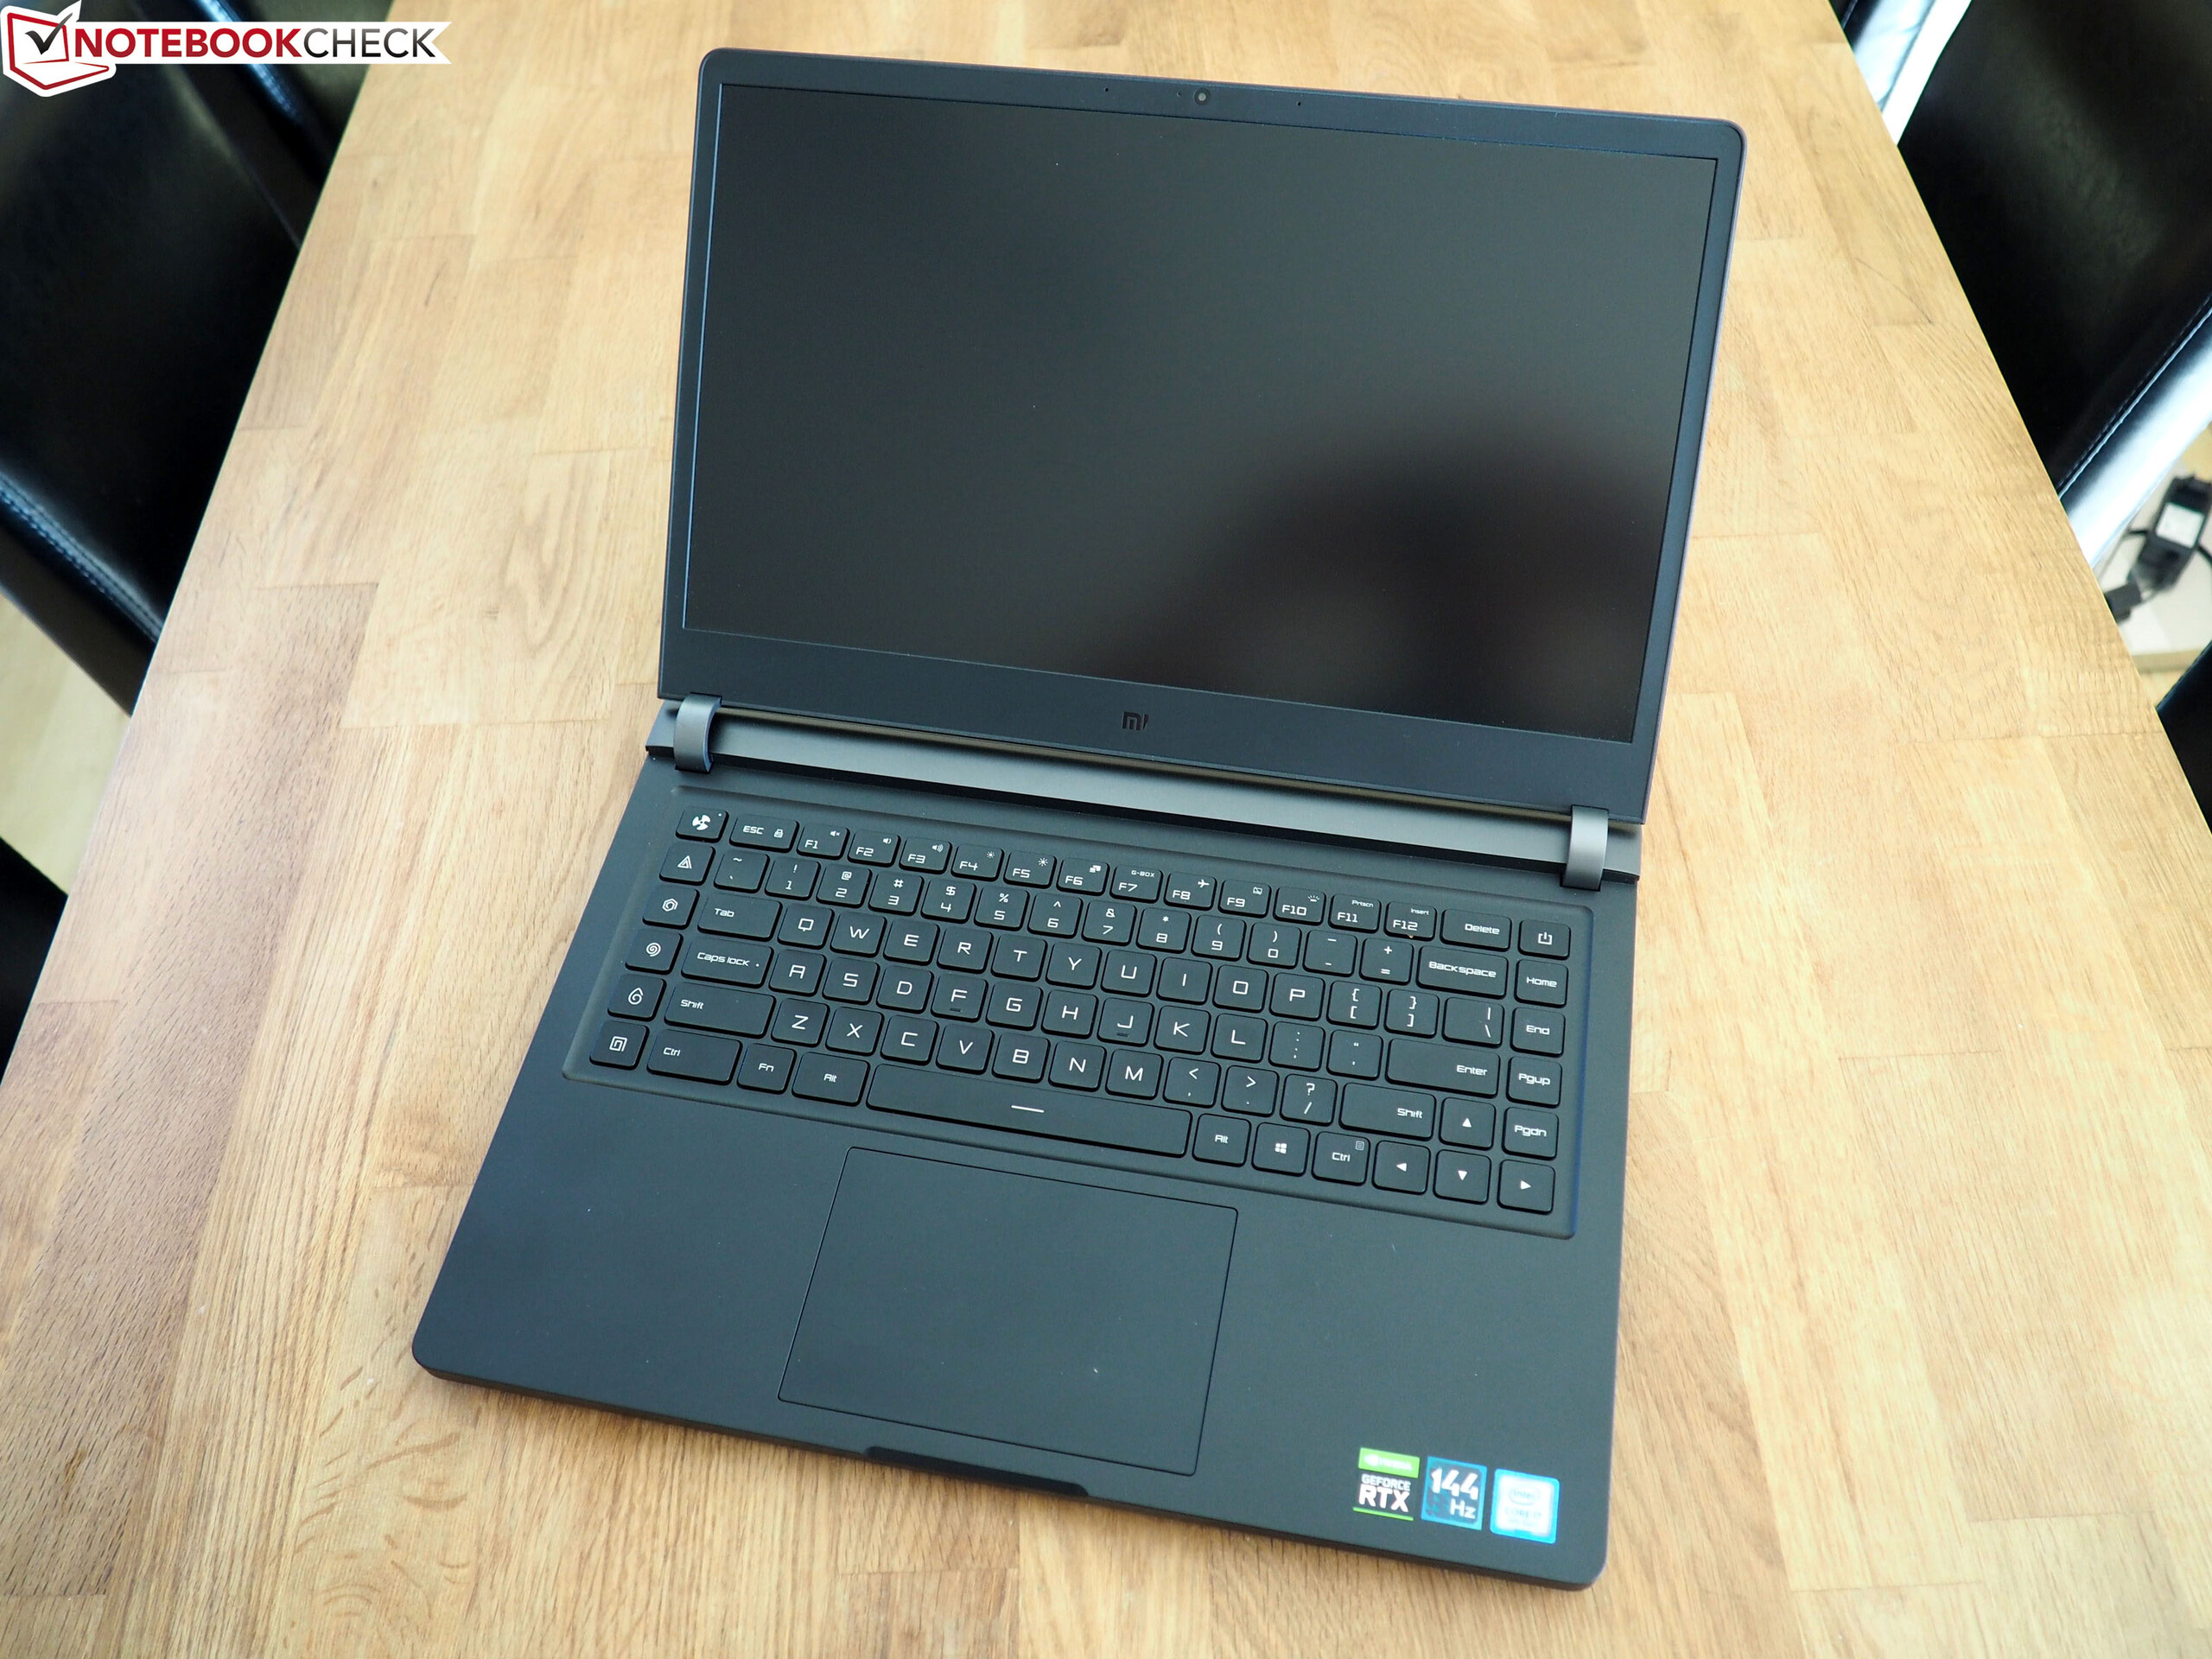
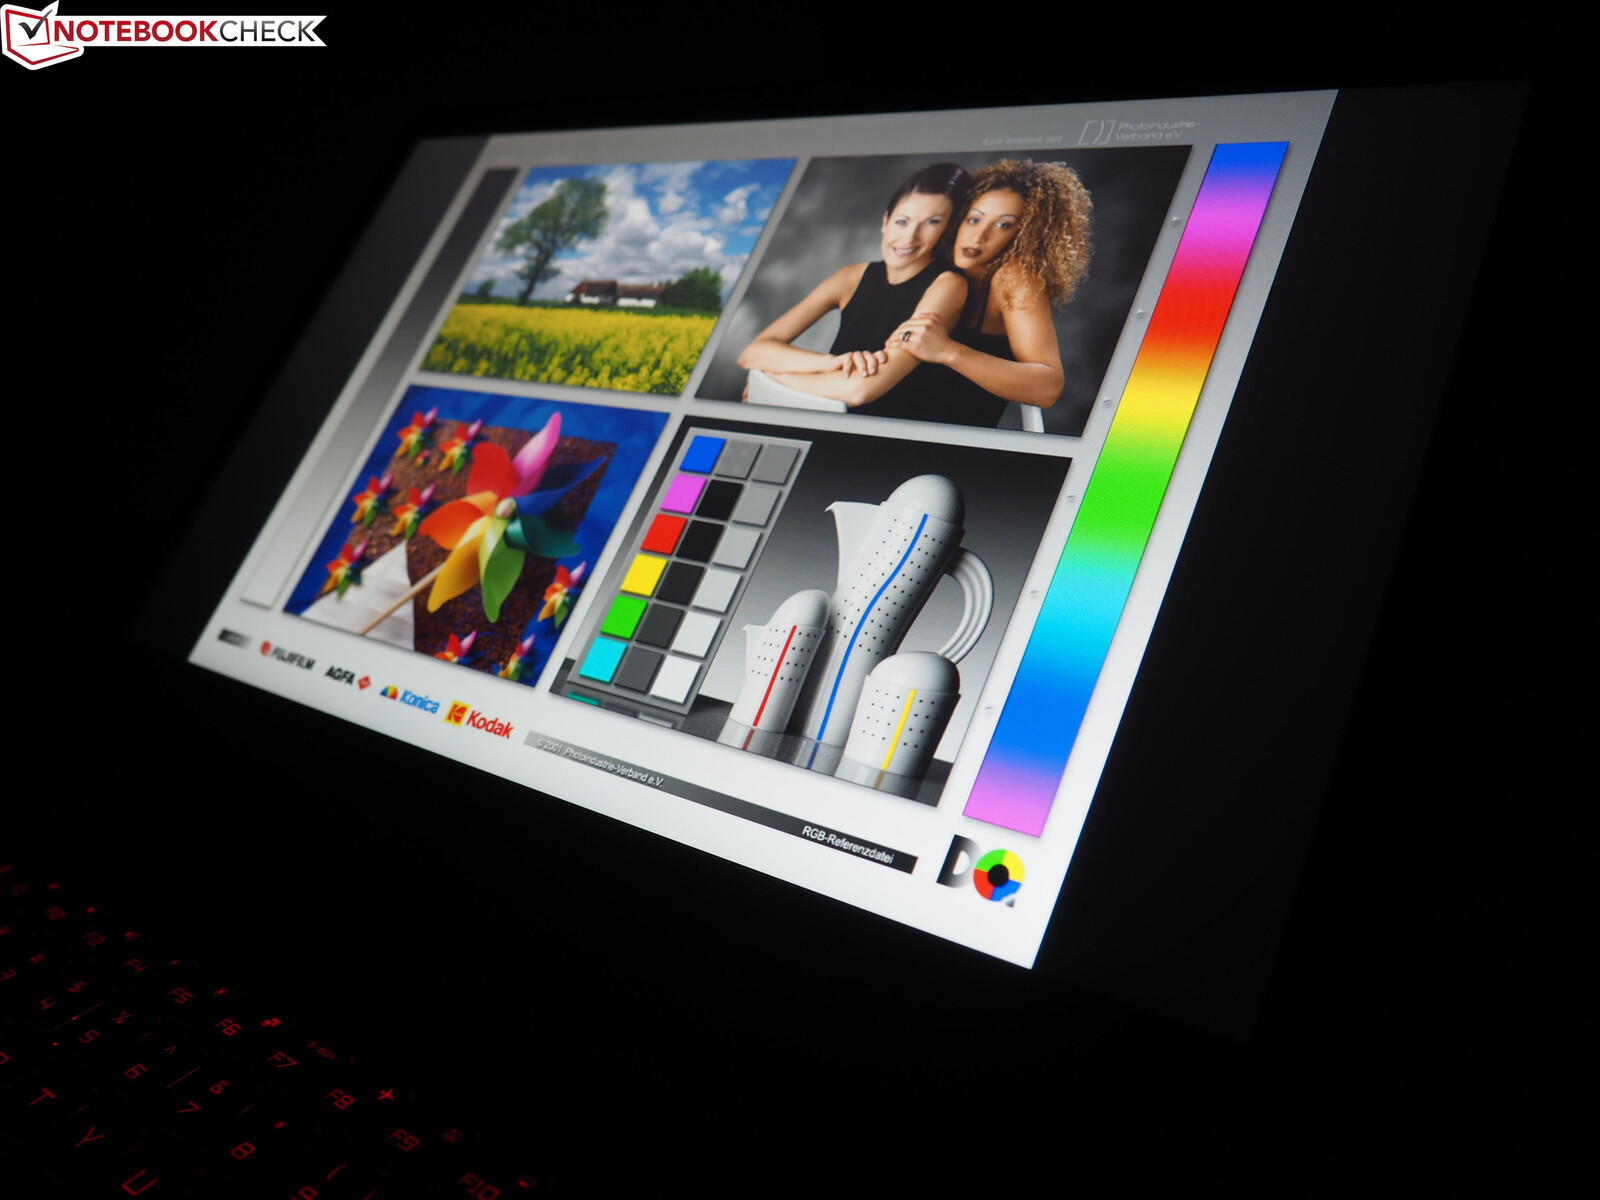
FHD ekranı önemli ölçüde yükseltildi. Gone önceden kurulmuş 60 Hz paneldir. Bunun yerine, 2019 modeli cayır cayır yanan hızlı 144 Hz ekrana sahip.
| |||||||||||||||||||||||||
Aydınlatma: 87 %
Batarya modunda parlaklık: 279 cd/m²
Kontrast: 1374:1 (Siyah: 0.23 cd/m²)
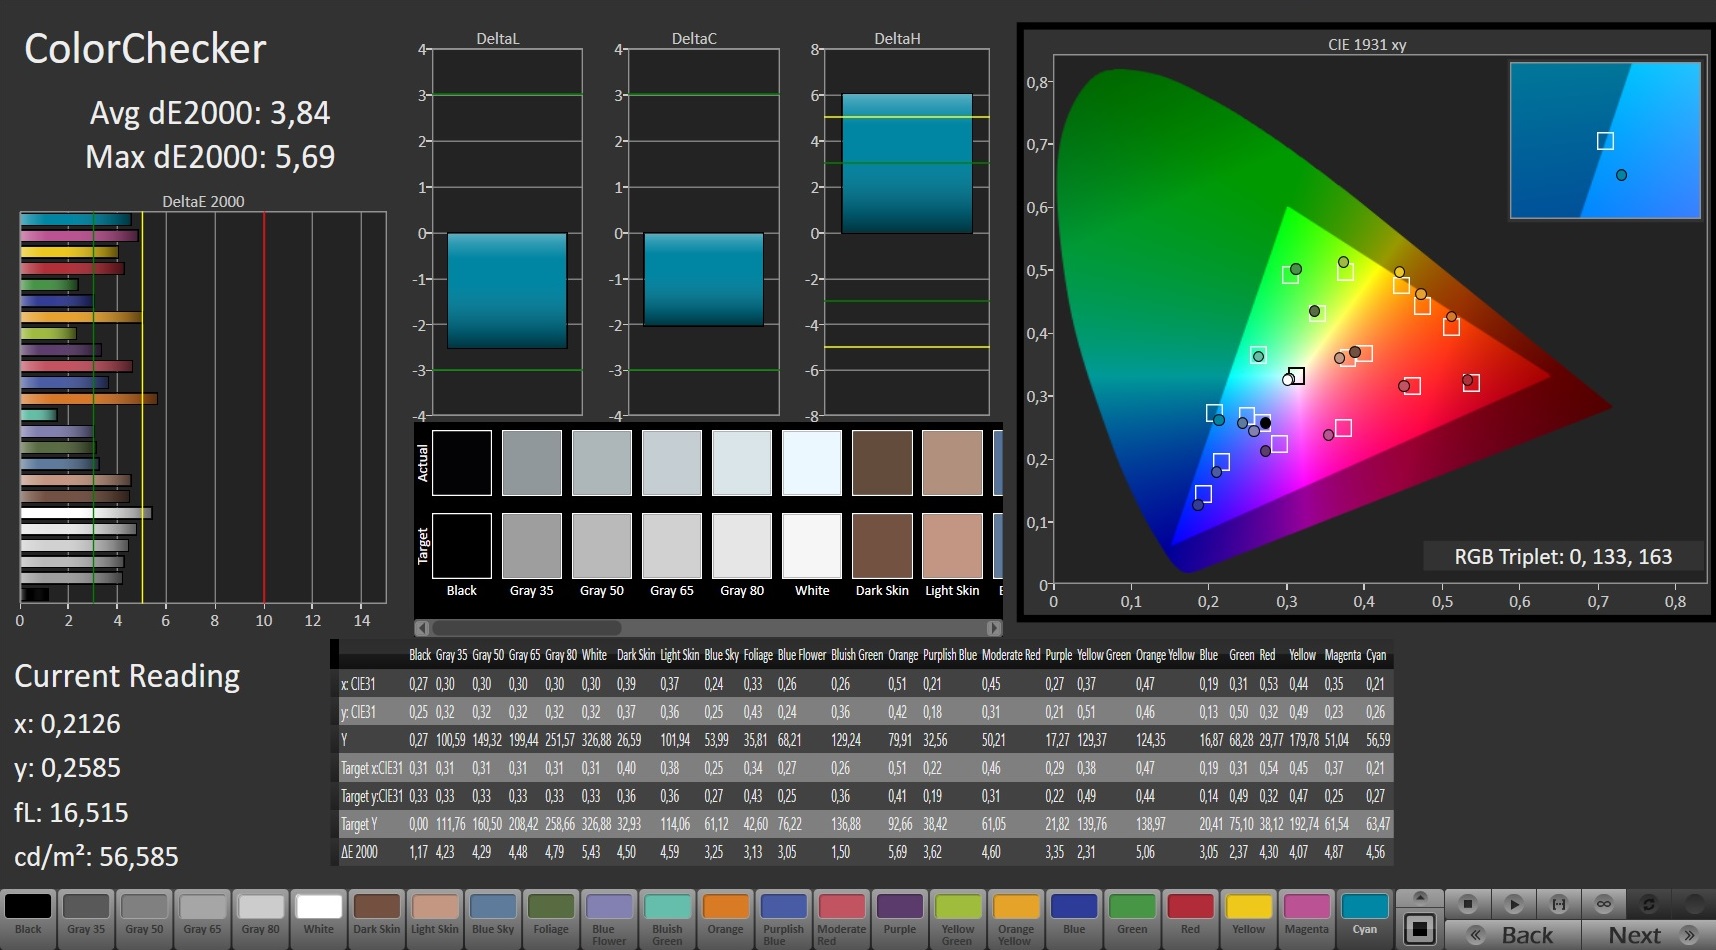
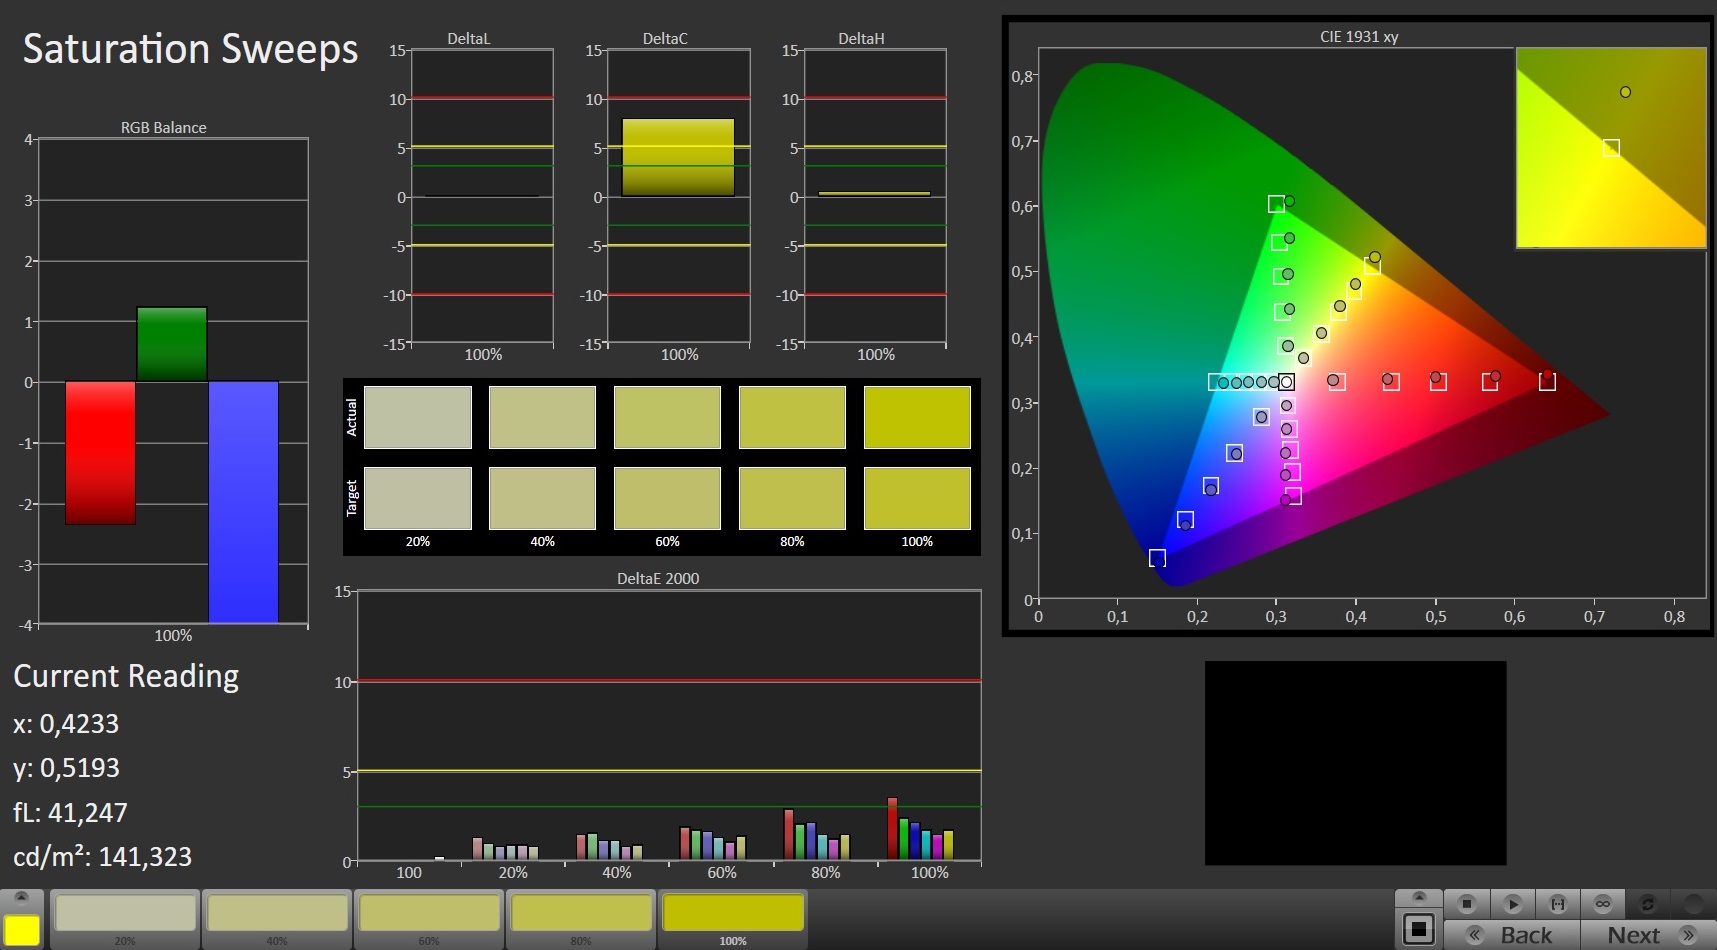
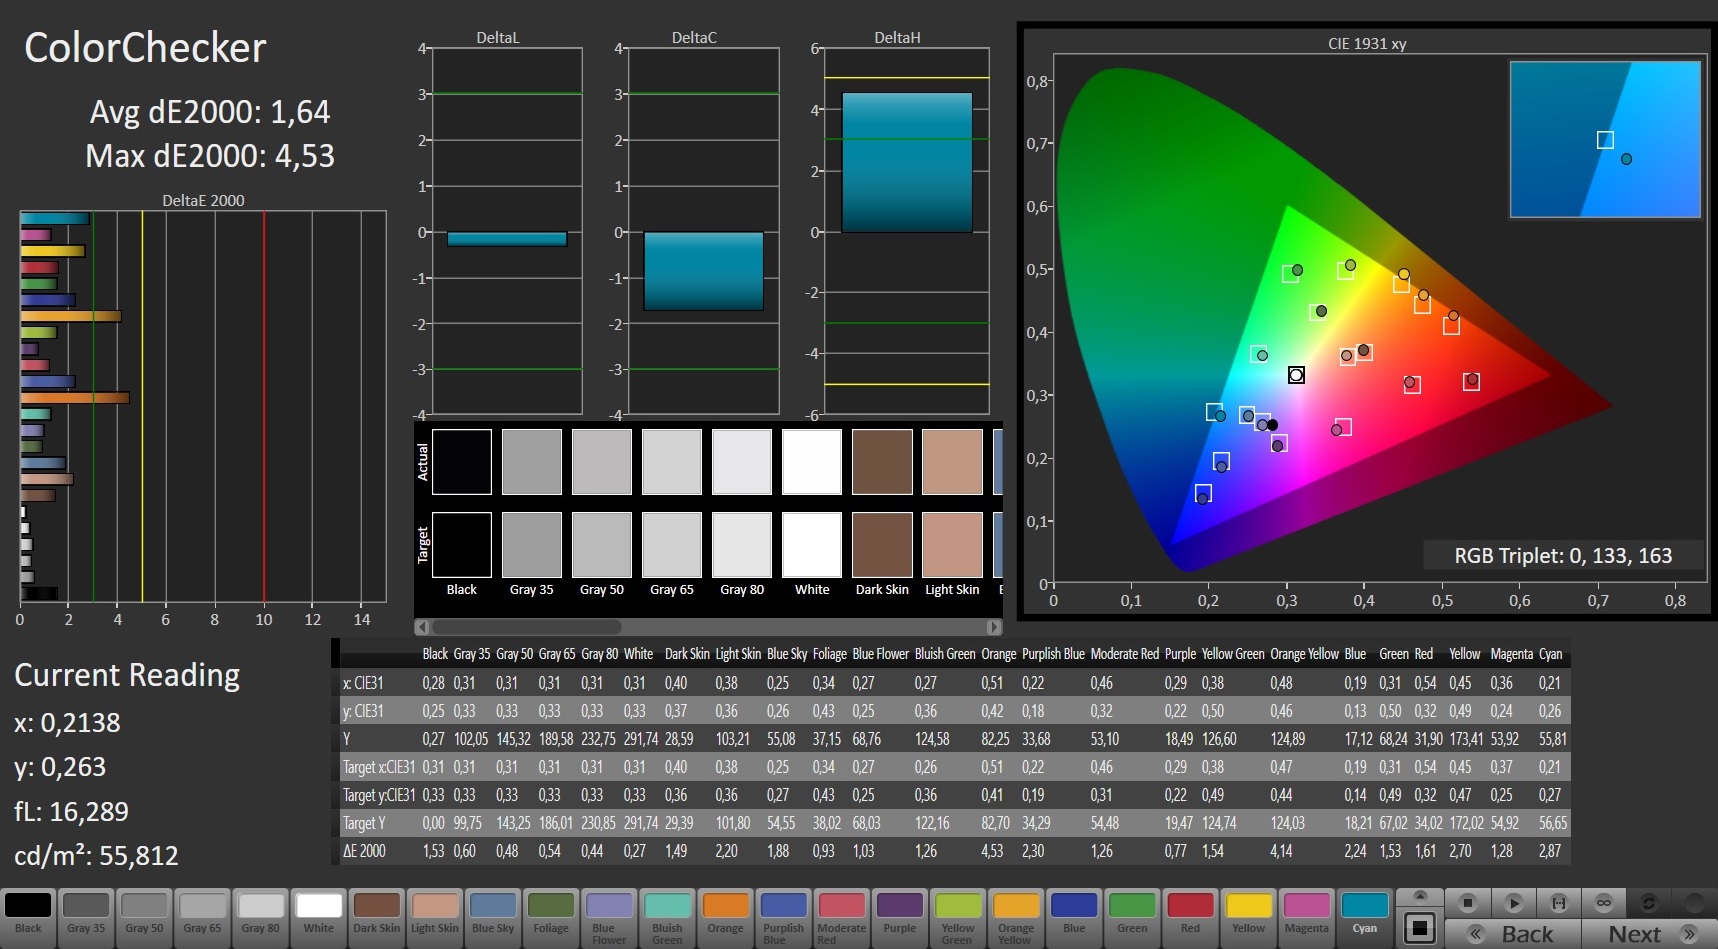
ΔE ColorChecker Calman: 3.84 | ∀{0.5-29.43 Ø4.72}
calibrated: 1.64
ΔE Greyscale Calman: 3.66 | ∀{0.09-98 Ø4.97}
92% sRGB (Argyll 1.6.3 3D)
60% AdobeRGB 1998 (Argyll 1.6.3 3D)
66.4% AdobeRGB 1998 (Argyll 3D)
92.1% sRGB (Argyll 3D)
65.2% Display P3 (Argyll 3D)
Gamma: 2.62
CCT: 7165 K
| Xiaomi Mi Gaming Laptop 2019 NV156FHM-N4G (BOE0867), IPS, 1920x1080, 15.6" | MSI GL65 9SEK AU Optronics B156HAN13.0, IPS, 1920x1080, 15.6" | Lenovo Legion Y540-15IRH BOE NV156FHM-N4G (BOE084D), IPS, 1920x1080, 15.6" | Asus Strix GL531GV-PB74 Panda LM156LF-GL02, IPS, 1920x1080, 15.6" | Acer ConceptD 7 CN715-71-743N AU Optronics AUO31EB, IPS, 3840x2160, 15.6" | |
|---|---|---|---|---|---|
| Display | -42% | -1% | -37% | 30% | |
| Display P3 Coverage (%) | 65.2 | 36.63 -44% | 64.5 -1% | 40.13 -38% | 85.7 31% |
| sRGB Coverage (%) | 92.1 | 55 -40% | 91.6 -1% | 60.3 -35% | 100 9% |
| AdobeRGB 1998 Coverage (%) | 66.4 | 37.85 -43% | 65.9 -1% | 41.48 -38% | 99 49% |
| Response Times | -175% | 9% | -154% | -304% | |
| Response Time Grey 50% / Grey 80% * (ms) | 8.8 ? | 26.4 ? -200% | 8.8 ? -0% | 26 ? -195% | 49 ? -457% |
| Response Time Black / White * (ms) | 12 ? | 30 ? -150% | 10 ? 17% | 25.6 ? -113% | 30 ? -150% |
| PWM Frequency (Hz) | |||||
| Screen | -49% | -8% | -65% | 28% | |
| Brightness middle (cd/m²) | 316 | 277.3 -12% | 284 -10% | 290.1 -8% | 365 16% |
| Brightness (cd/m²) | 295 | 256 -13% | 277 -6% | 274 -7% | 357 21% |
| Brightness Distribution (%) | 87 | 86 -1% | 87 0% | 86 -1% | 84 -3% |
| Black Level * (cd/m²) | 0.23 | 0.2 13% | 0.3 -30% | 0.54 -135% | 0.275 -20% |
| Contrast (:1) | 1374 | 1387 1% | 947 -31% | 537 -61% | 1327 -3% |
| Colorchecker dE 2000 * | 3.84 | 5.25 -37% | 3.53 8% | 5.16 -34% | 0.99 74% |
| Colorchecker dE 2000 max. * | 5.69 | 19.43 -241% | 6.11 -7% | 18.09 -218% | 1.89 67% |
| Colorchecker dE 2000 calibrated * | 1.64 | 4.39 -168% | 1.81 -10% | 4.35 -165% | 1.01 38% |
| Greyscale dE 2000 * | 3.66 | 3.5 4% | 3.56 3% | 4.4 -20% | 1.29 65% |
| Gamma | 2.62 84% | 2.1 105% | 2.47 89% | 2.1 105% | 2.2 100% |
| CCT | 7165 91% | 6895 94% | 7257 90% | 7362 88% | 6548 99% |
| Color Space (Percent of AdobeRGB 1998) (%) | 60 | 35 -42% | 59 -2% | 38.1 -36% | 88 47% |
| Color Space (Percent of sRGB) (%) | 92 | 55 -40% | 91 -1% | 60 -35% | 100 9% |
| Toplam Ortalama (Program / Ayarlar) | -89% /
-63% | 0% /
-5% | -85% /
-71% | -82% /
-13% |
* ... daha küçük daha iyidir
Ölçümlerimiz 41.6-53.2 ms'den yalnızca 8.8-12 ms'ye düşmüş olan tepki sürelerinde önemli ölçüde azaldığını göstermektedir. Bu, hızlı tempolu atıcıları oynatırken bile gölgelenme ve artefakt içermeyen bir görüntü oluşturmalıdır. Maalesef, Xiaomi, büyük olasılıkla maliyet düşürücü bir önlem olan G-Sync için destek içermemeyi tercih etti (yeniden lisans maliyetleri). Bunun yerine, Mi Gaming Laptop, pil ömrünü en üst düzeye çıkarmak için Optimus'u destekliyor.
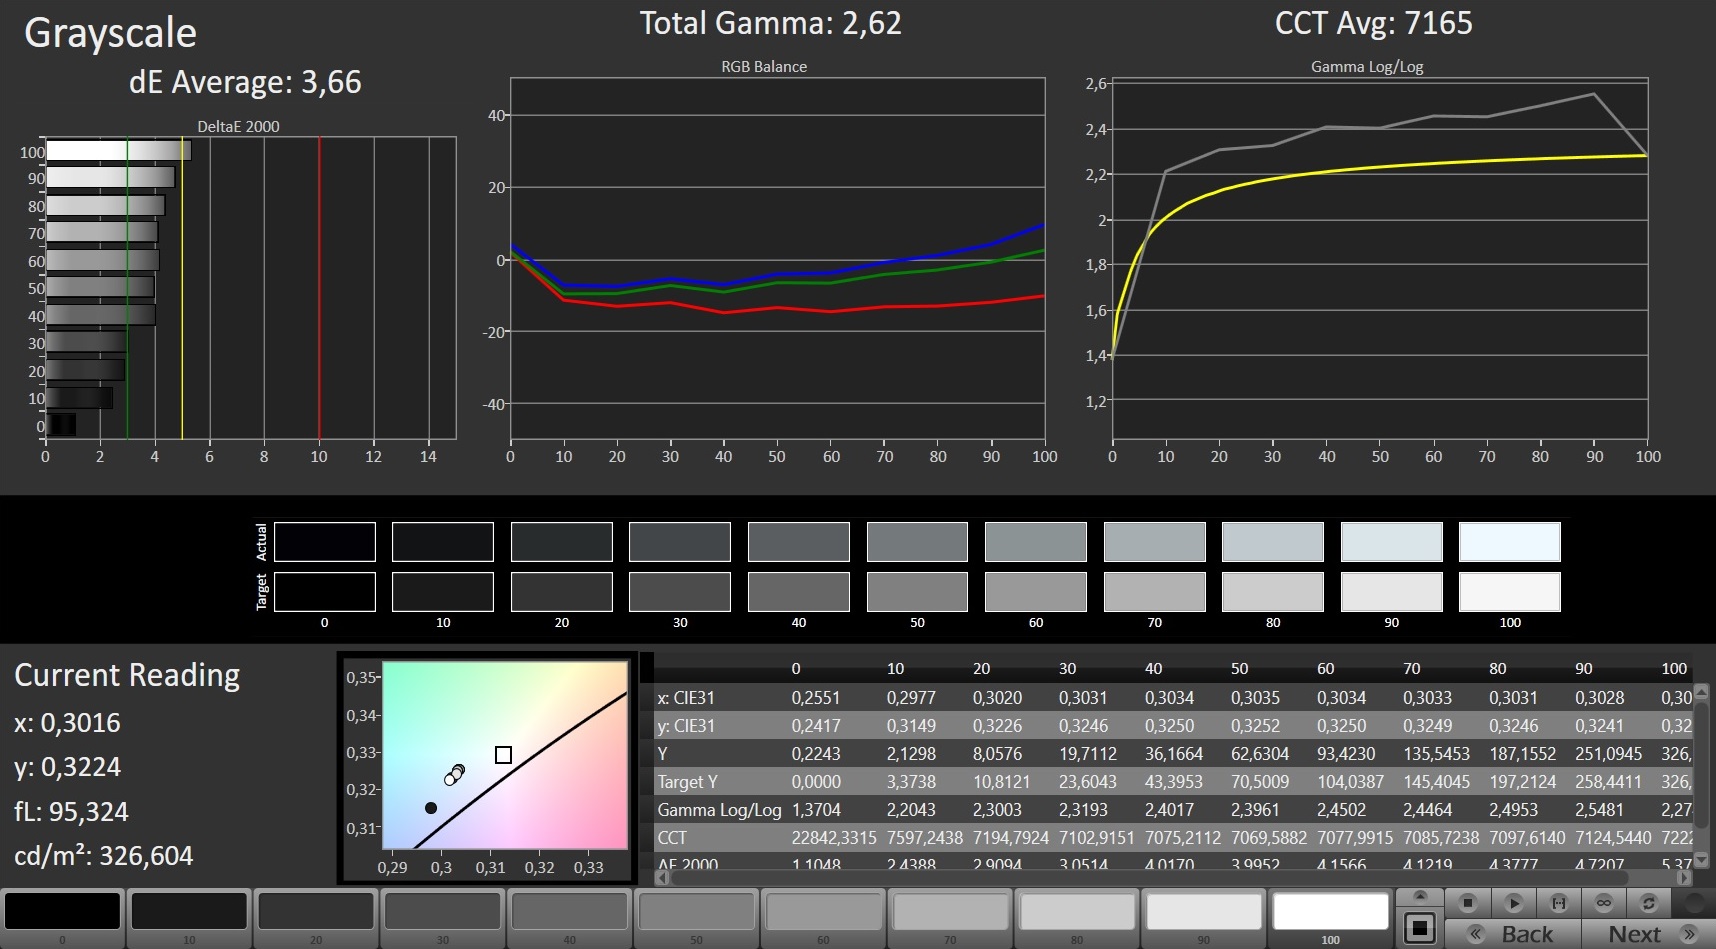
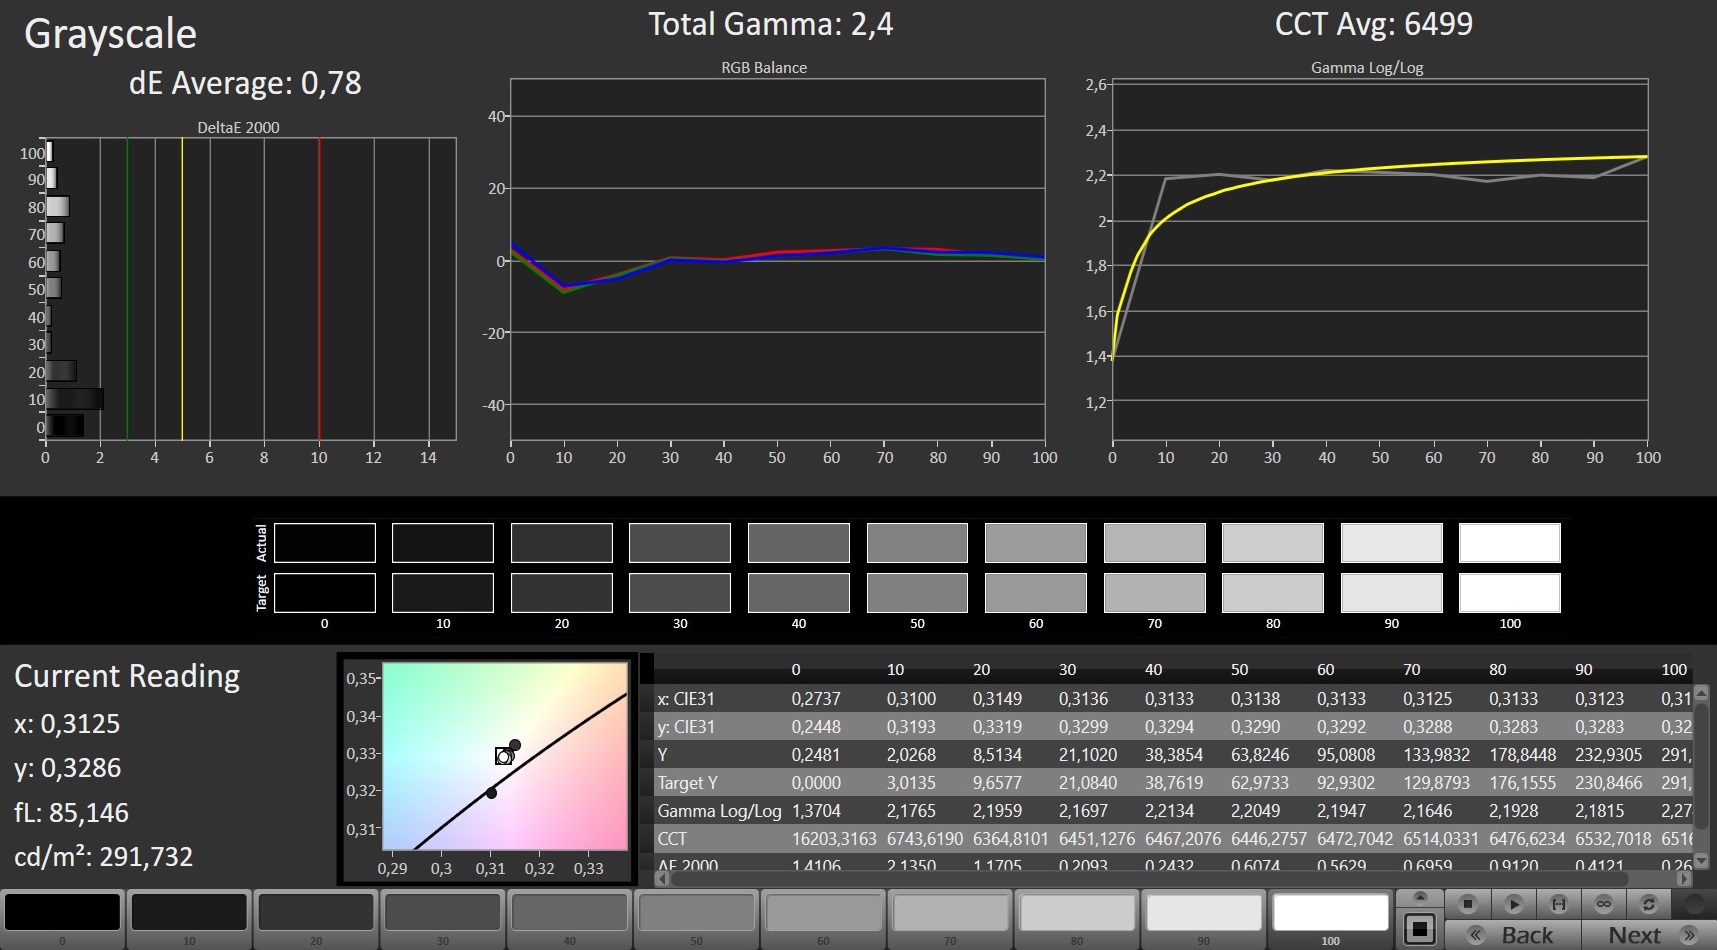
IPS paneli, harika tepki sürelerinden çok daha fazlasını sunar. Sadece 0.23 nit'lik nispeten düşük bir siyah seviyesi ve 295 nit'lik iyi bir maksimum parlaklık sayesinde ortaya çıkan kontrast oranı 1.300: 1'dir.
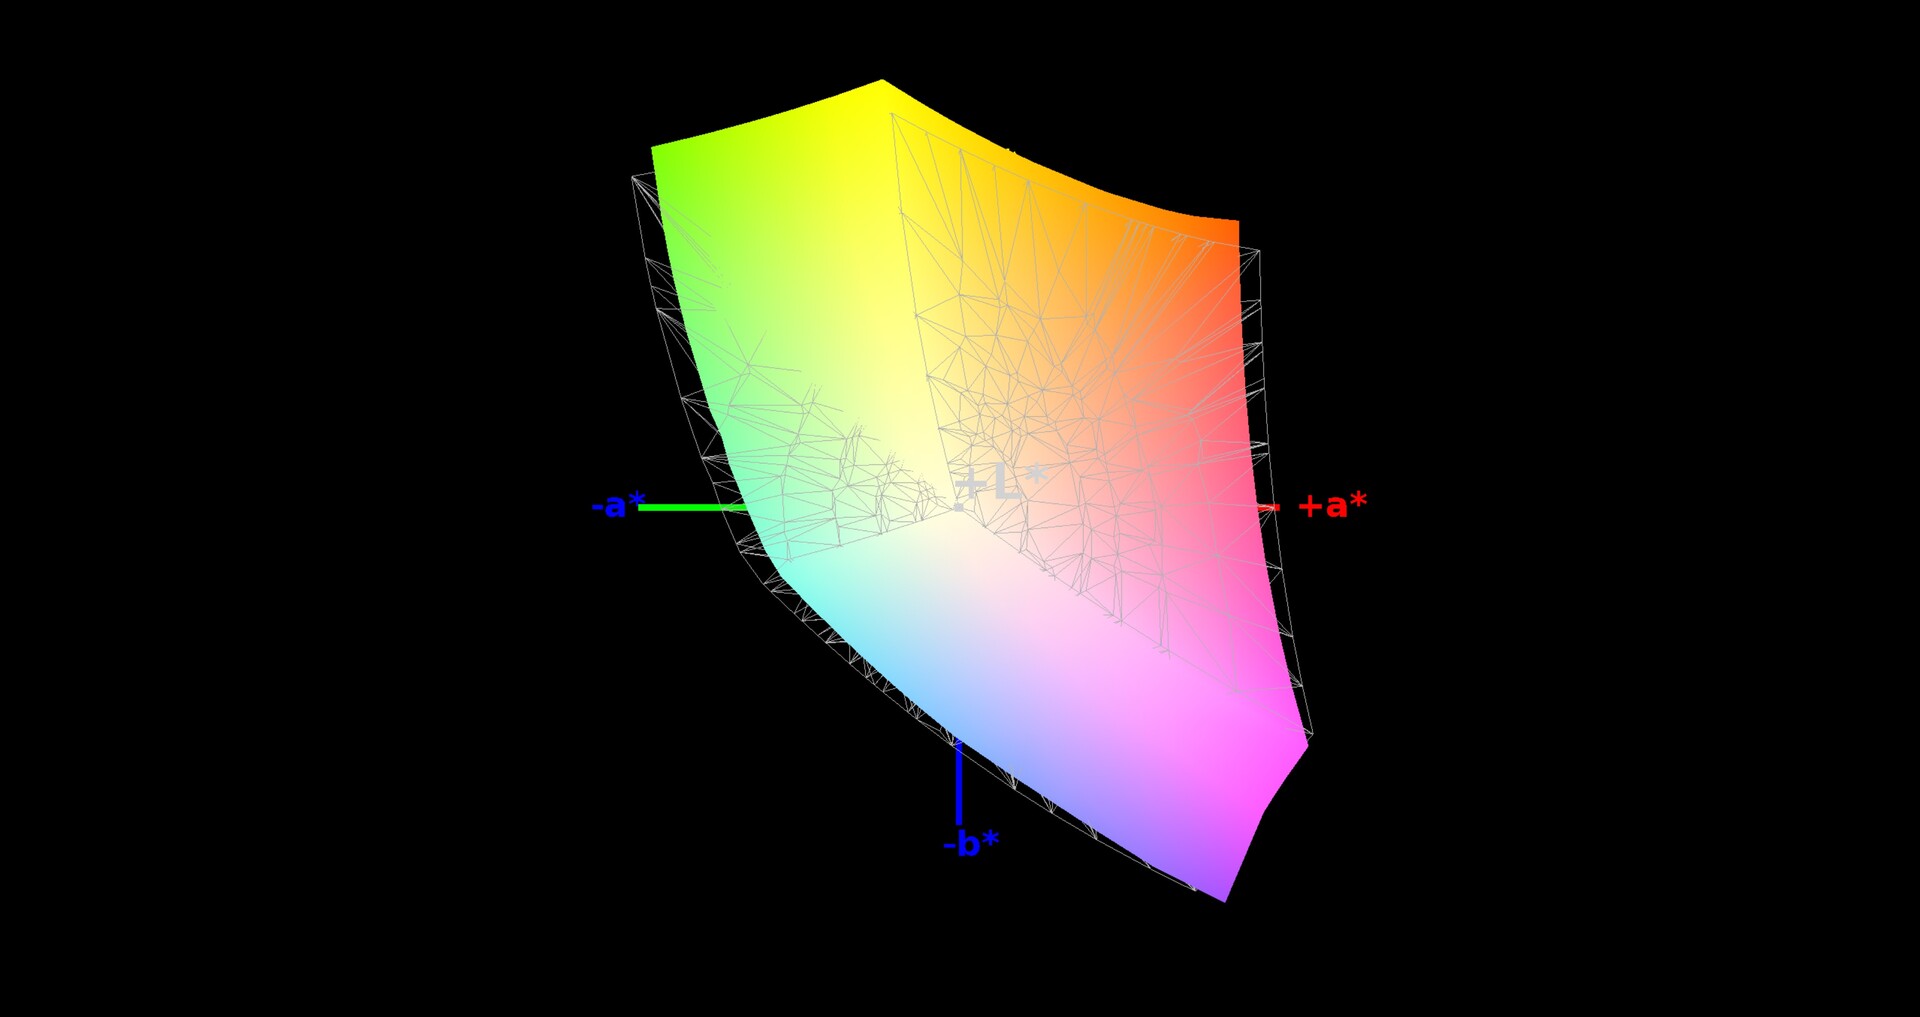
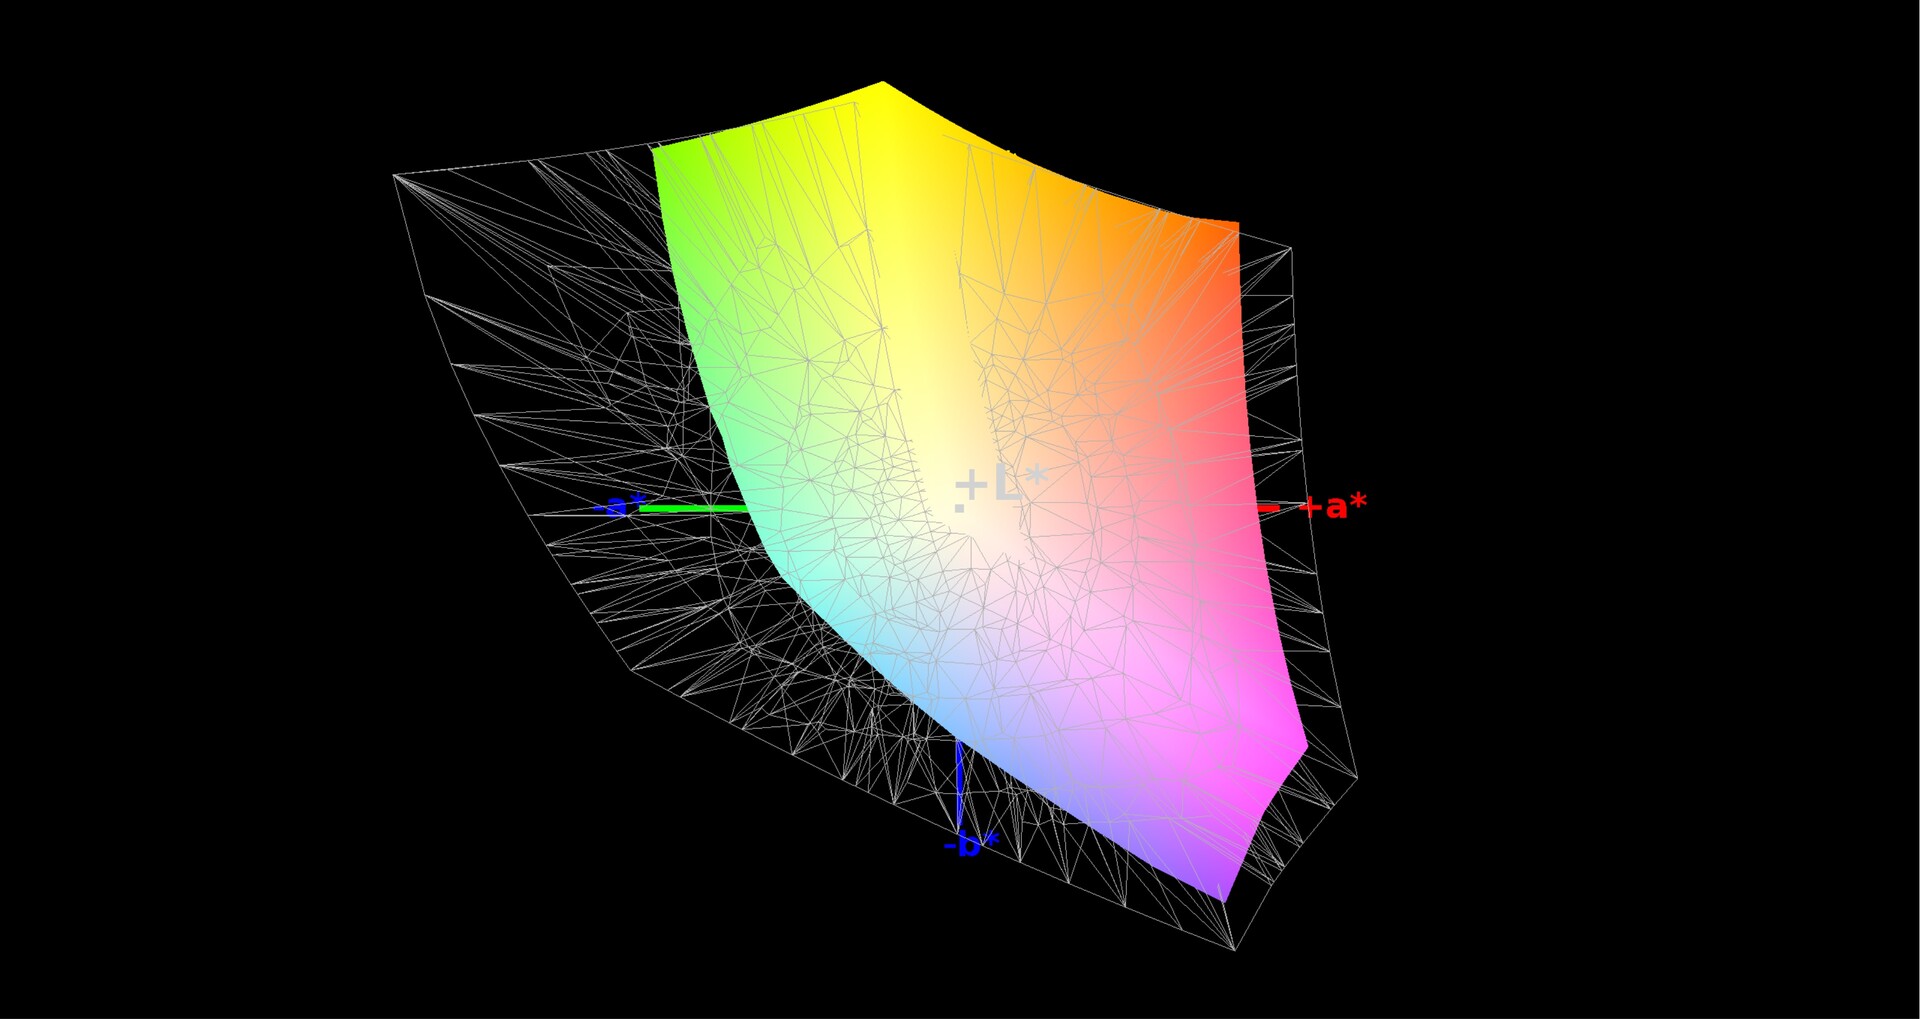
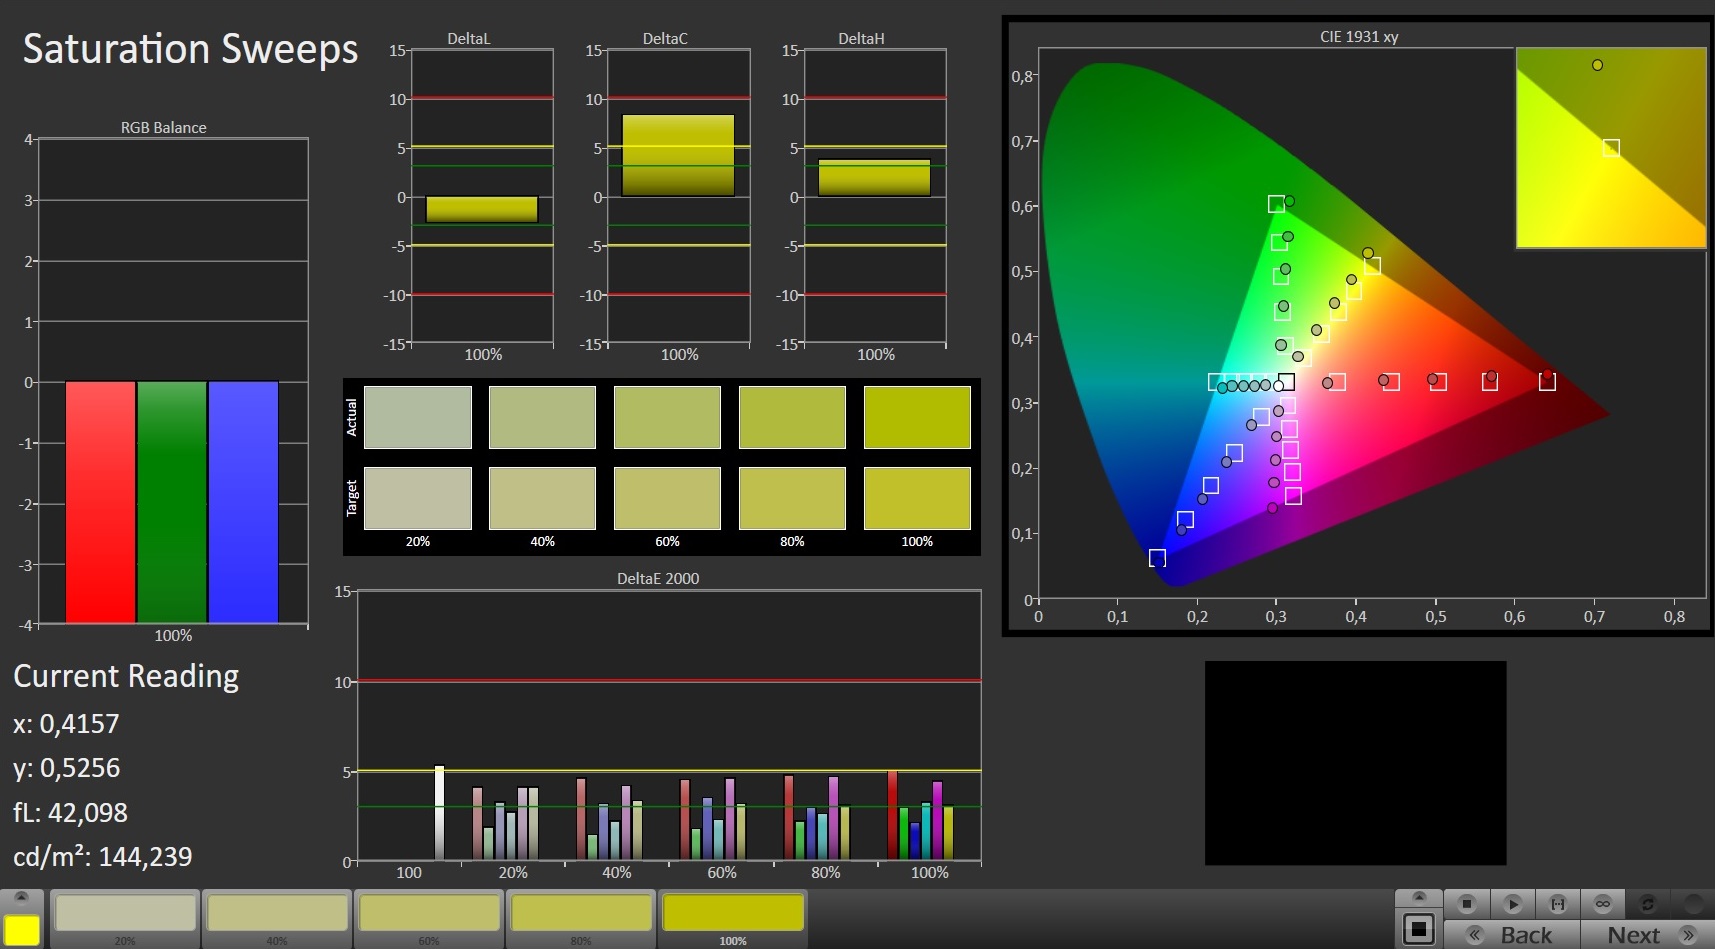
Renk alanı kapsamı (% 92 sRGB,% 60 AdobeRGB) rekabet ile aynı düzeyde ve görüntüleme açıları da aynı.
Yanıt Sürelerini Görüntüle
| ↔ Tepki Süresi Siyahtan Beyaza | ||
|---|---|---|
| 12 ms ... yükseliş ↗ ve sonbahar↘ birleşimi | ↗ 6.8 ms yükseliş | 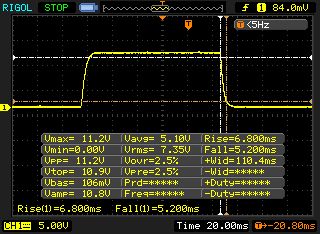 |
| ↘ 5.2 ms sonbahar | ||
| Ekran, testlerimizde iyi yanıt oranları gösteriyor ancak rekabetçi oyuncular için çok yavaş olabilir. Karşılaştırıldığında, test edilen tüm cihazlar 0.1 (minimum) ile 240 (maksimum) ms arasında değişir. » Tüm cihazların 31 %'si daha iyi. Bu, ölçülen yanıt süresinin test edilen tüm cihazların ortalamasından (19.9 ms) daha iyi olduğu anlamına gelir. | ||
| ↔ Tepki Süresi %50 Griden %80 Griye | ||
| 8.8 ms ... yükseliş ↗ ve sonbahar↘ birleşimi | ↗ 4.4 ms yükseliş | 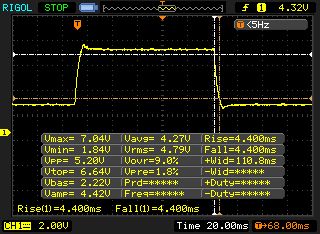 |
| ↘ 4.4 ms sonbahar | ||
| Ekran, testlerimizde hızlı yanıt oranları gösteriyor ve oyun oynamaya uygun olmalı. Karşılaştırıldığında, test edilen tüm cihazlar 0.165 (minimum) ile 636 (maksimum) ms arasında değişir. » Tüm cihazların 22 %'si daha iyi. Bu, ölçülen yanıt süresinin test edilen tüm cihazların ortalamasından (31.1 ms) daha iyi olduğu anlamına gelir. | ||
Ekran Titremesi / PWM (Darbe Genişliği Modülasyonu)
| Ekran titriyor / PWM algılanmadı |  | ||
Karşılaştırıldığında: Test edilen tüm cihazların %52 %'si ekranı karartmak için PWM kullanmıyor. PWM tespit edilirse, ortalama 7784 (minimum: 5 - maksimum: 343500) Hz ölçüldü. | |||
performans
Amiral gemisi SKU kesinlikle bir üst düzey oyun not defteri olarak kabul edilebilir. GeForce RTX 2060, 512 GB SSD ve 16 GB RAM ile birleştirilen hexa-core bir işlemcinin uzun yıllar boyunca yeterince oyun ve işleme sunması gerekiyor.
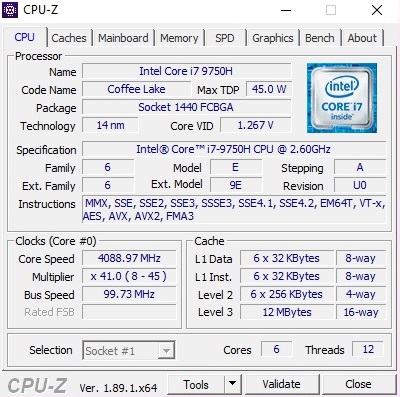
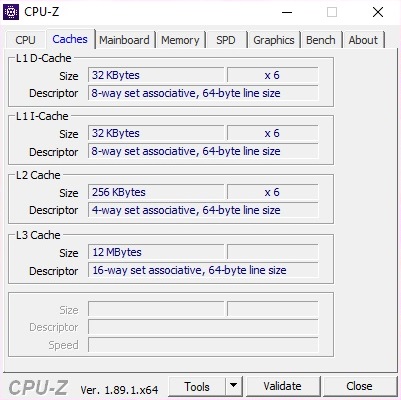
İşlemci
Intel'in Core i7-9750H en başarılı mobil işlemcilerden biridir. TDP değeri 45 W olan 14 nm Coffee Lake tabanlı işlemci Hyper Threading'i destekliyor ve böylece aynı anda 12 dişe kadar.
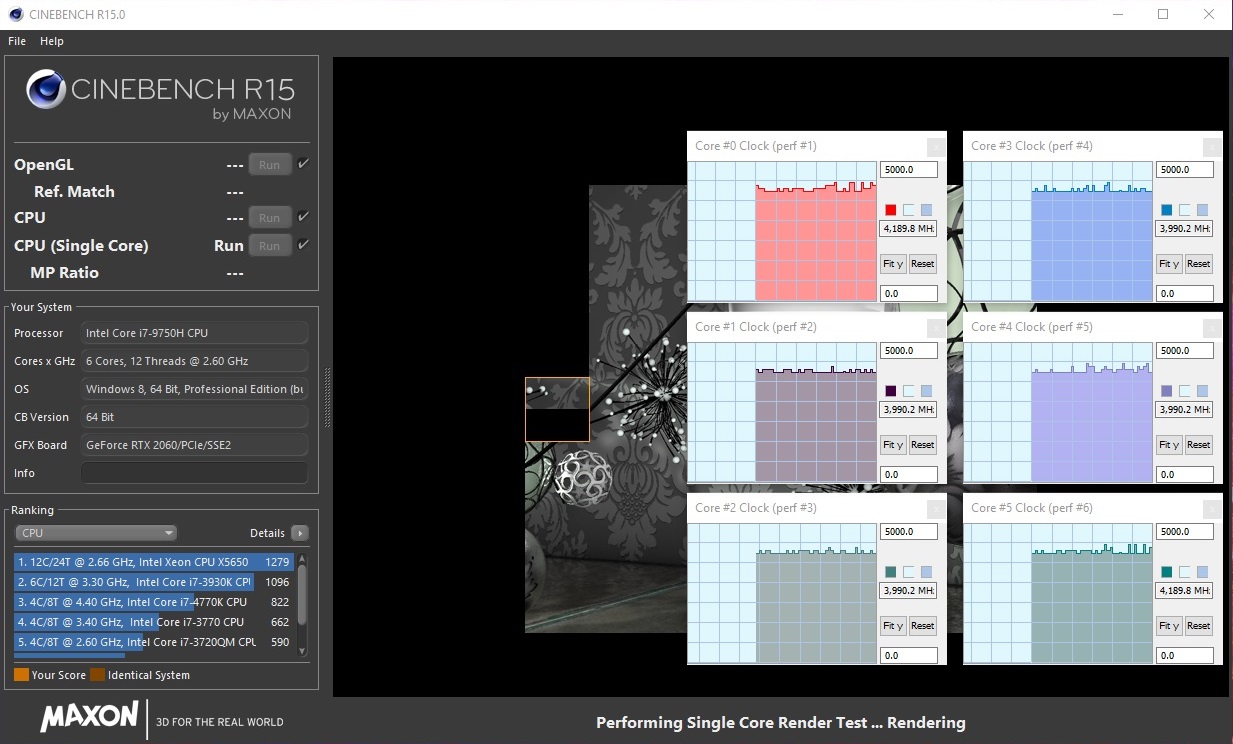
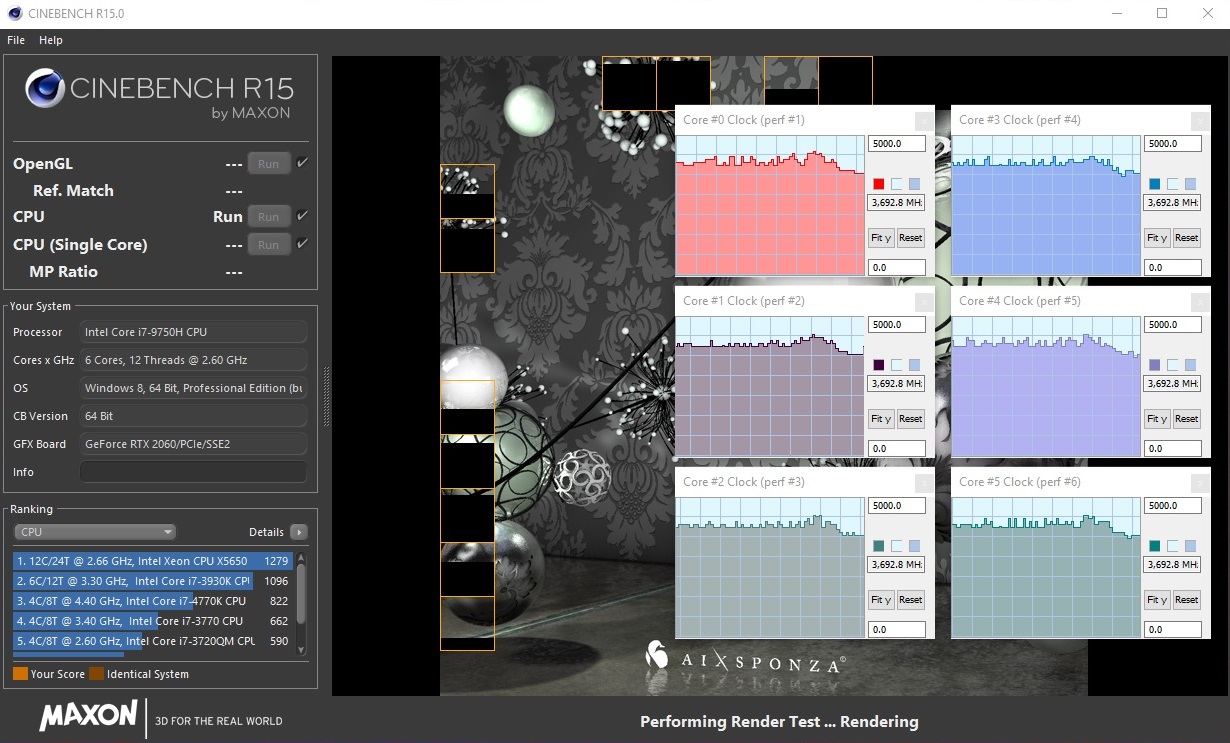
2,6 GHz'lik baz saat hızında çalışır ve 4,5 GHz'e kadar turbo güçlendirebilir. Ne yazık ki, Mi Gaming Laptop, CPU'nun turbo yükseltme potansiyelinden tam olarak yararlanamıyor. Tek dişli yükte, CPU 4.0 ila 4.3 GHz hızında çalışırken, çok çekirdekli turbo yükseltme yalnızca 3.3 ila 3.8 GHz ile sınırlıdır.
Diğer birçok oyun dizüstü bilgisayarında olduğu gibi, ilk yinelemeden sonra CineBench döngümüzde performans yaklaşık% 10 düşüyor. Genel olarak, Core i7-9750H beklendiği gibi yapıldı.
| Cinebench R15 | |
| CPU Single 64Bit | |
| Sınıf ortalaması Gaming (188.8 - 343, n=109, son 2 yıl) | |
| Acer ConceptD 7 CN715-71-743N | |
| Acer ConceptD 7 CN715-71-743N | |
| Xiaomi Mi Gaming Laptop 2019 | |
| Lenovo Legion Y540-15IRH | |
| MSI GL65 9SEK | |
| Asus Strix GL531GV-PB74 | |
| CPU Multi 64Bit | |
| Sınıf ortalaması Gaming (1578 - 6271, n=109, son 2 yıl) | |
| MSI GL65 9SEK | |
| Lenovo Legion Y540-15IRH | |
| Xiaomi Mi Gaming Laptop 2019 | |
| Asus Strix GL531GV-PB74 | |
| Acer ConceptD 7 CN715-71-743N | |
| Acer ConceptD 7 CN715-71-743N | |
| Cinebench R20 | |
| CPU (Single Core) | |
| Sınıf ortalaması Gaming (442 - 895, n=109, son 2 yıl) | |
| Acer ConceptD 7 CN715-71-743N | |
| MSI GL65 9SEK | |
| Xiaomi Mi Gaming Laptop 2019 | |
| CPU (Multi Core) | |
| Sınıf ortalaması Gaming (4029 - 16108, n=109, son 2 yıl) | |
| MSI GL65 9SEK | |
| Xiaomi Mi Gaming Laptop 2019 | |
| Acer ConceptD 7 CN715-71-743N | |
Sistem performansı
Sistem performansı da bu sistemden beklenen düzeyde oldu. 5.681'lik bir puanla Mi Gaming Laptop, rakipleri arasında, farklar marjinal olsa da tam karşısına oturuyor. Öznel olarak, cihaz çok hızlı bir şekilde açıldı ve hızlı ve çabuk geldi.
| PCMark 10 - Score | |
| Sınıf ortalaması Gaming (5828 - 11574, n=94, son 2 yıl) | |
| Lenovo Legion Y540-15IRH | |
| MSI GL65 9SEK | |
| Xiaomi Mi Gaming Laptop 2019 | |
| Asus Strix GL531GV-PB74 | |
| Acer ConceptD 7 CN715-71-743N | |
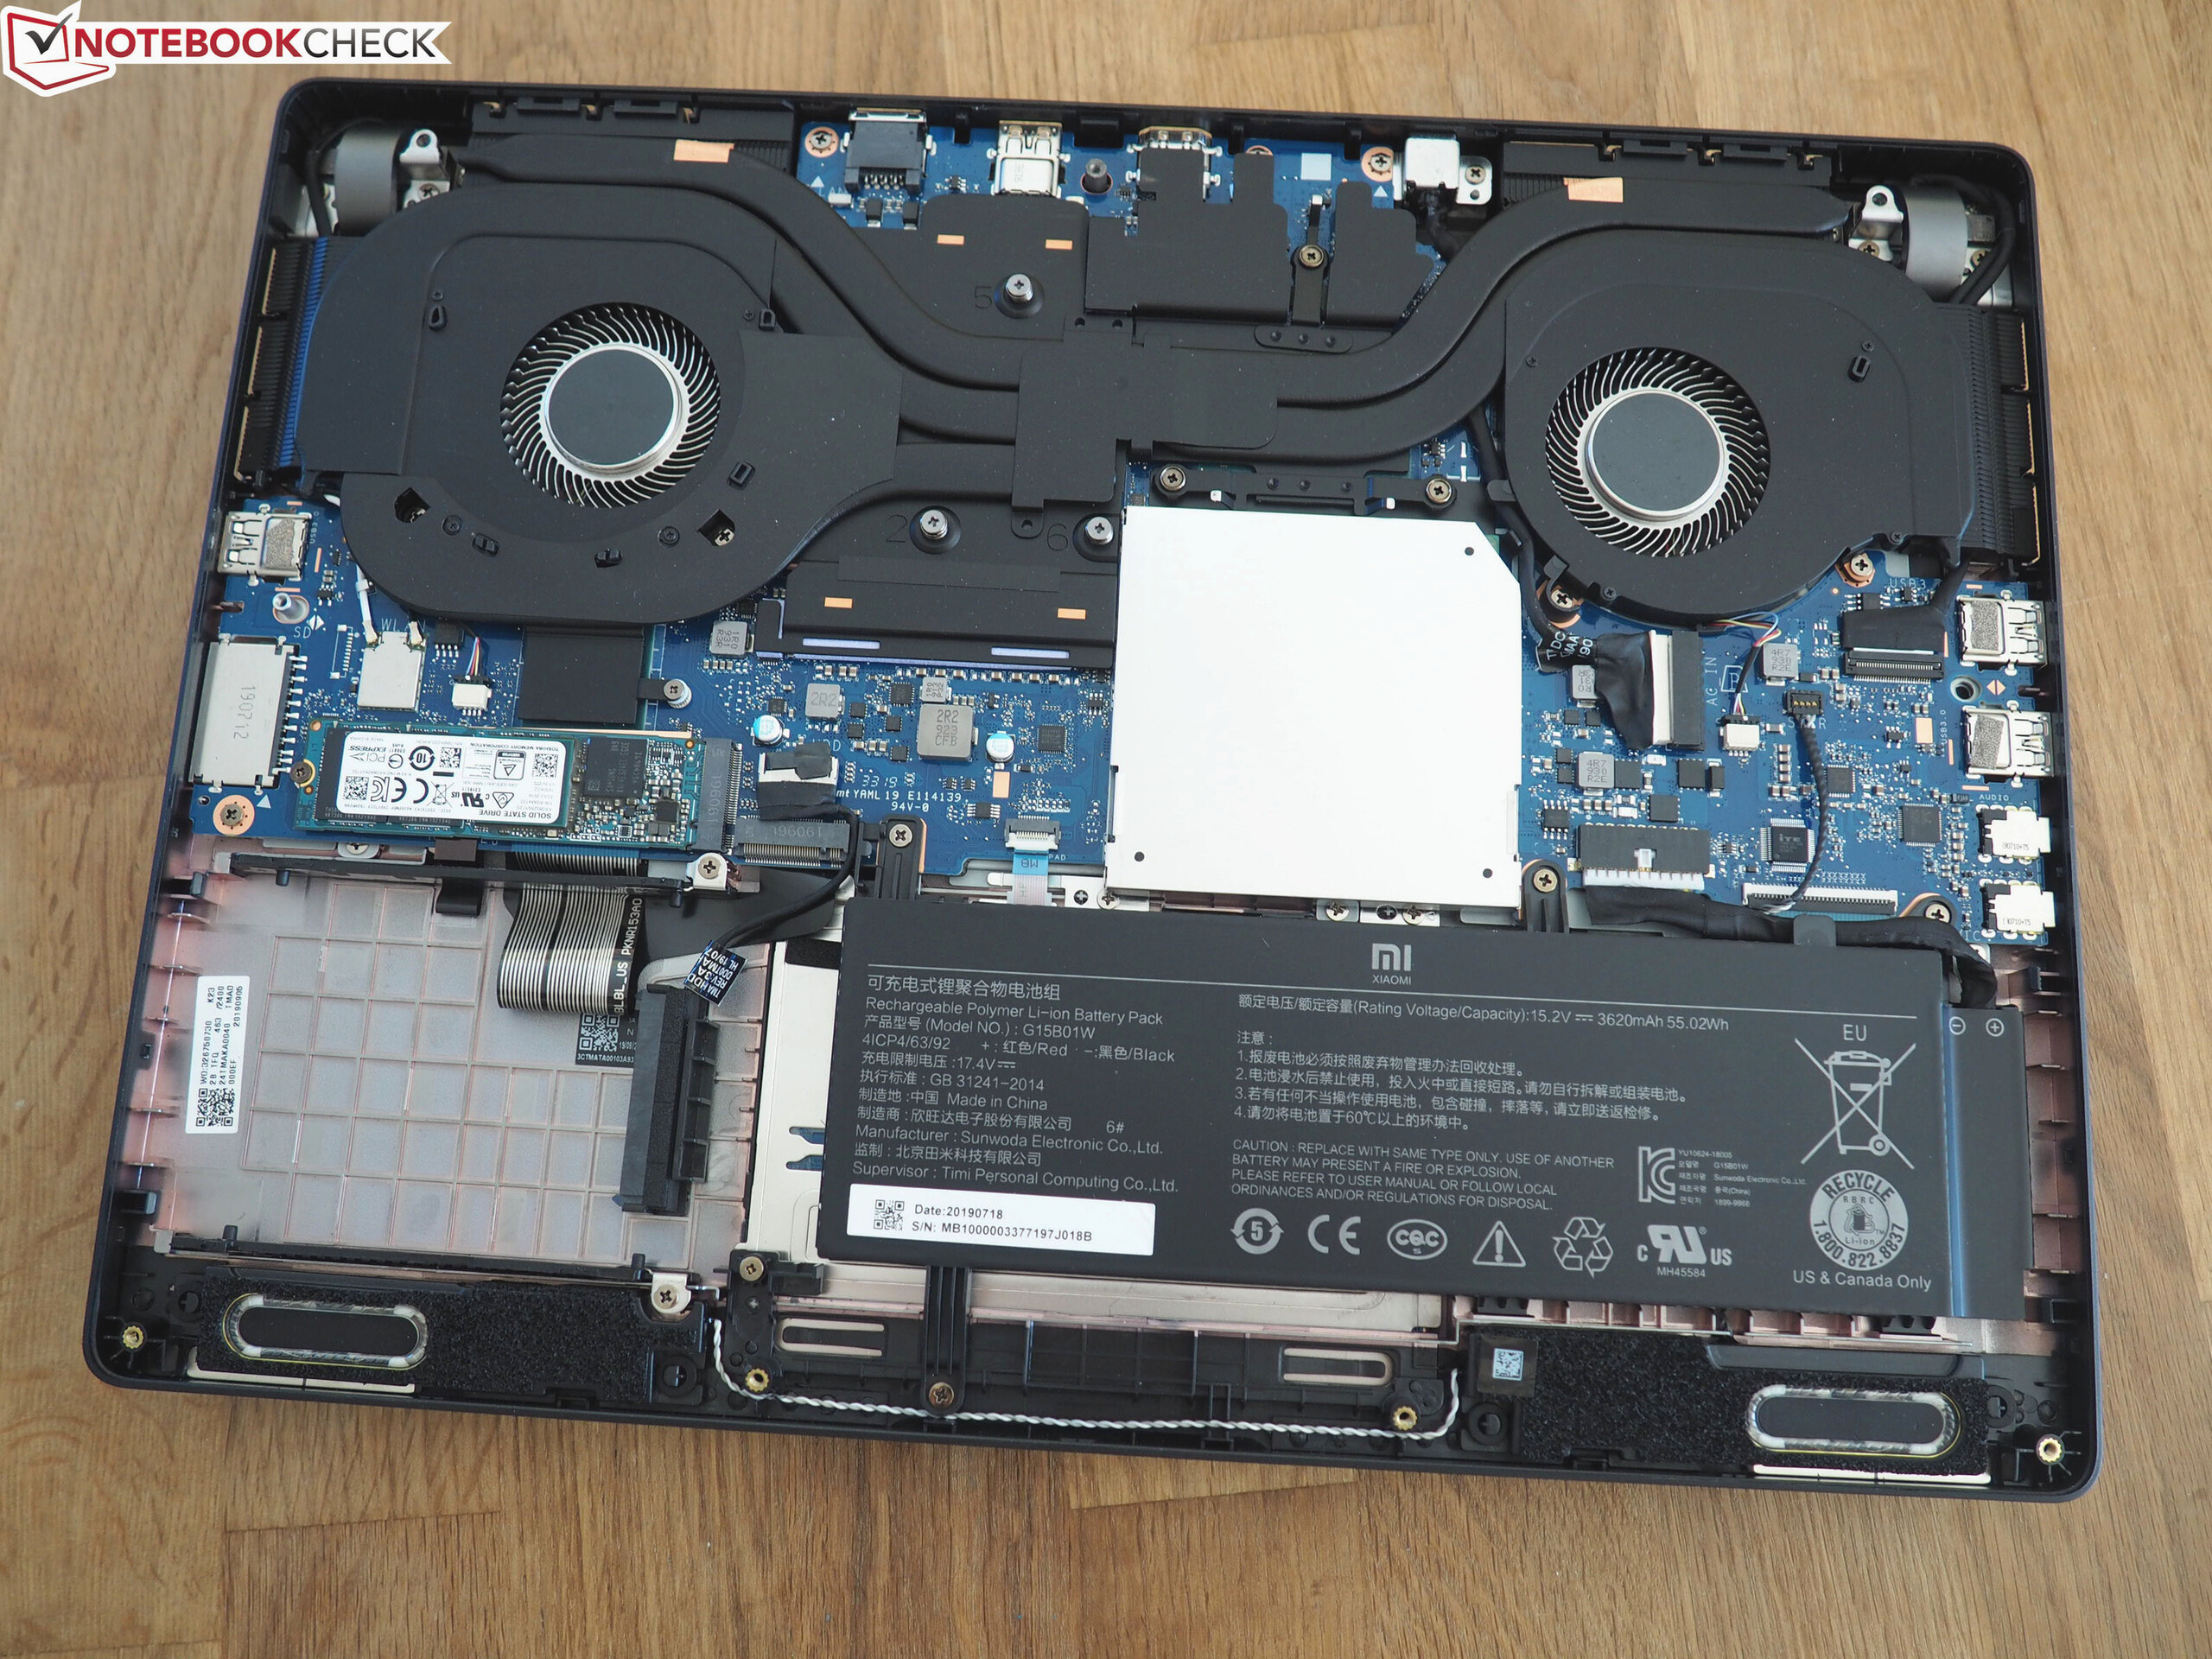
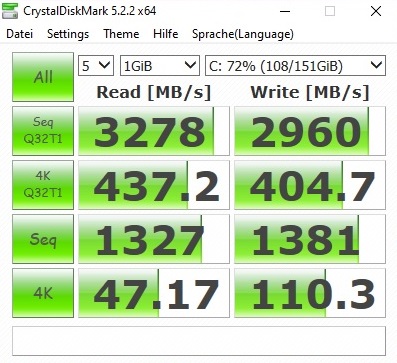
Depolama aygıtları
NVMe SSD, 2019 yüksek son dizüstü bilgisayarların hemen hepsinin temelini oluşturuyor ve Xiaomi Toshiba tarafından 512 GB NVMe SSD'yi tercih ediyordu. Sıralı okuma ve yazma hızları, Crystal Disk Mark'da 3.000 MB / s'de yükseliyor ve M.2 SSD de rastgele erişim senaryolarında çok hızlıydı. Mi Gaming Laptop'un ücretsiz ikincil M.2 yuvası ve ücretsiz 2,5 inç yuvası olduğu göz önüne alındığında, yükseltme seçenekleri bol miktarda bulunur.
| Xiaomi Mi Gaming Laptop 2019 Toshiba XG6 KXG60ZNV512G | MSI GL65 9SEK WDC PC SN520 SDAPNUW-512G | Lenovo Legion Y540-15IRH Samsung PM981a MZVLB1T0HBLR | Asus Strix GL531GV-PB74 Intel SSD 660p SSDPEKNW512G8 | Acer ConceptD 7 CN715-71-743N WDC PC SN720 SDAPNTW-512G | |
|---|---|---|---|---|---|
| CrystalDiskMark 5.2 / 6 | -3% | 10% | -16% | 14% | |
| Write 4K (MB/s) | 110.3 | 150.2 36% | 131.7 19% | 121.9 11% | 109 -1% |
| Read 4K (MB/s) | 47.17 | 43.46 -8% | 48.06 2% | 53.6 14% | 41.33 -12% |
| Write Seq (MB/s) | 1381 | 1412 2% | 1234 -11% | 967 -30% | 2535 84% |
| Read Seq (MB/s) | 1327 | 1340 1% | 973 -27% | 1461 10% | 1538 16% |
| Write 4K Q32T1 (MB/s) | 404.7 | 482.2 19% | 576 42% | 431.4 7% | 396.6 -2% |
| Read 4K Q32T1 (MB/s) | 437.2 | 535 22% | 655 50% | 337.3 -23% | 603 38% |
| Write Seq Q32T1 (MB/s) | 2960 | 1454 -51% | 3012 2% | 972 -67% | 2542 -14% |
| Read Seq Q32T1 (MB/s) | 3278 | 1744 -47% | 3481 6% | 1727 -47% | 3324 1% |

GPU Performansı
GeForce RTX 2060, Nvidia'nın en uygun ışın alma yetenekli dizüstü bilgisayarı GPU'sudur. Bu özel DirectX 12 yongası, Turing mimarisine dayanıyor ve 6 GB GDDR6 video RAM'e erişimi olan 1.920 gölgelendirici birime sahip.
| 3DMark 11 Performance | 18262 puan | |
| 3DMark Cloud Gate Standard Score | 35196 puan | |
| 3DMark Fire Strike Score | 15004 puan | |
| 3DMark Time Spy Score | 6209 puan | |
Yardım | ||
Mi Gaming Laptop, GPU testlerimizde çok iyi bir performans sergiledi. Test grubumuzda 3DMark 11 ve 3DMark 13'te birinciliği kazanarak, turbo-boost kullanımının iyi olduğunu kanıtladı.
| 3DMark | |
| 1920x1080 Fire Strike Graphics | |
| Sınıf ortalaması Gaming (12242 - 62849, n=118, son 2 yıl) | |
| Xiaomi Mi Gaming Laptop 2019 | |
| MSI GL65 9SEK | |
| Asus Strix GL531GV-PB74 | |
| Acer ConceptD 7 CN715-71-743N | |
| Lenovo Legion Y540-15IRH | |
| 2560x1440 Time Spy Graphics | |
| Sınıf ortalaması Gaming (5012 - 26212, n=117, son 2 yıl) | |
| MSI GL65 9SEK | |
| Xiaomi Mi Gaming Laptop 2019 | |
| Asus Strix GL531GV-PB74 | |
| 2560x1440 Port Royal Graphics | |
| Sınıf ortalaması Gaming (4395 - 17286, n=70, son 2 yıl) | |
| Xiaomi Mi Gaming Laptop 2019 | |
| Asus Strix GL531GV-PB74 | |
| MSI GL65 9SEK | |
| 3DMark 11 - 1280x720 Performance GPU | |
| Sınıf ortalaması Gaming (21841 - 80022, n=106, son 2 yıl) | |
| Xiaomi Mi Gaming Laptop 2019 | |
| MSI GL65 9SEK | |
| Asus Strix GL531GV-PB74 | |
| Acer ConceptD 7 CN715-71-743N | |
| Lenovo Legion Y540-15IRH | |
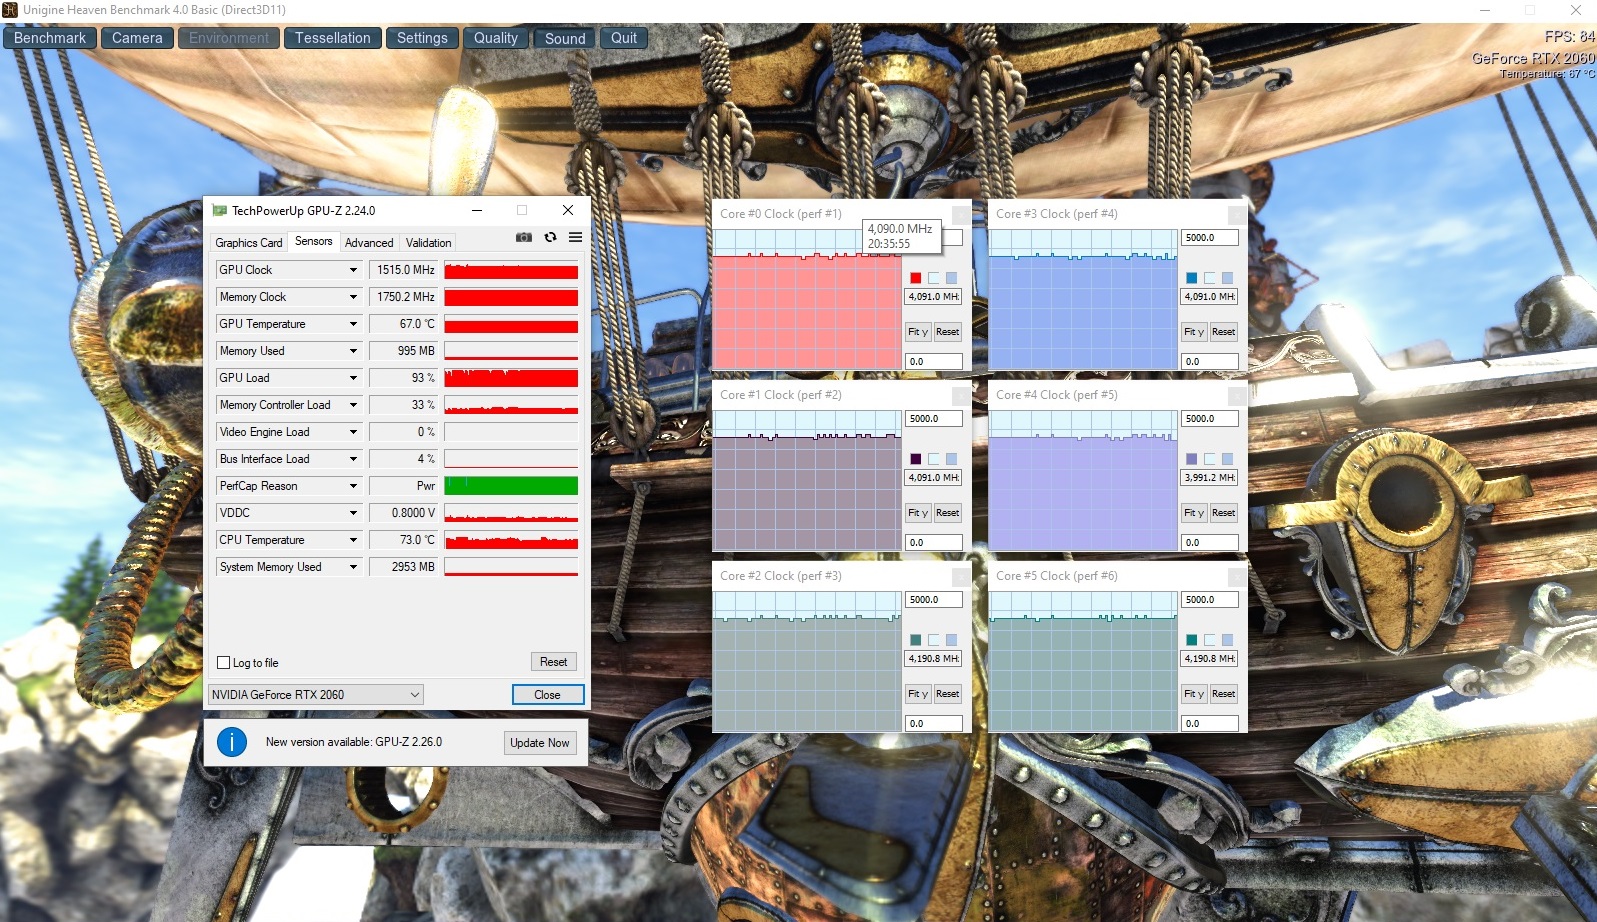
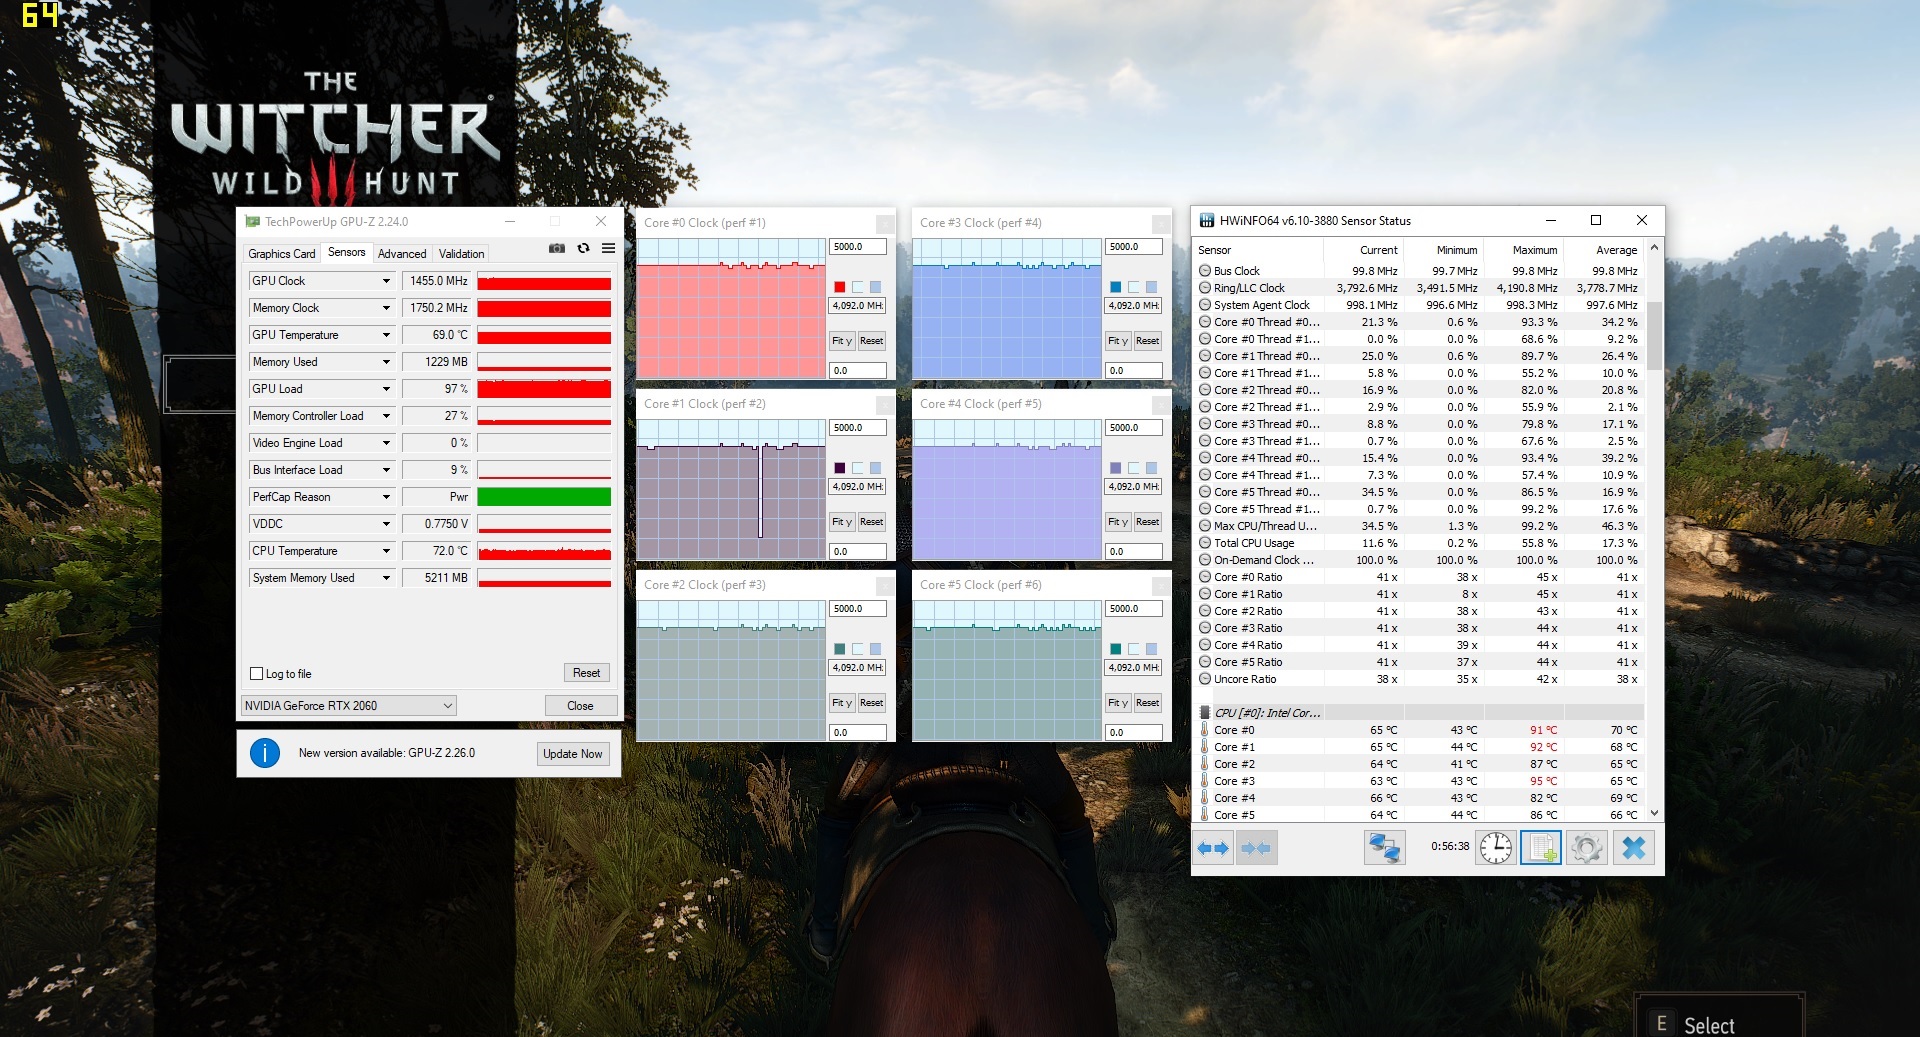
Sonuncuyu 60 dakikalık uzun "Witcher 3" döngüsümüz (1920x1080, Ultra) sırasında doğrulayabildik ve sonuçta 1.500 MHz'lik çekirdek frekansı GPU'nun 1.110 MHz'lik temel frekansından çok daha yüksek. Performansta herhangi bir ani düşüş fark etmedik.
Oyun Performansı
Kendinizi FHD'de oyun oynamaya sınırladığınız sürece, GeForce RTX 2060 mevcut tüm oyunları maksimum detayda sorunsuzca yürütebildiğinden daha fazlasıdır. Yalnızca Anno1800 veya Odyssey gibi aşırı vergi oyunları ortalamada 60 FPS'nin altına düşebilir.
| The Witcher 3 | |
| 1920x1080 High Graphics & Postprocessing (Nvidia HairWorks Off) | |
| Sınıf ortalaması Gaming (181 - 341, n=3, son 2 yıl) | |
| MSI GL65 9SEK | |
| Asus Strix GL531GV-PB74 | |
| Xiaomi Mi Gaming Laptop 2019 | |
| Acer ConceptD 7 CN715-71-743N | |
| 1920x1080 Ultra Graphics & Postprocessing (HBAO+) | |
| Sınıf ortalaması Gaming (95 - 240, n=8, son 2 yıl) | |
| Asus Strix GL531GV-PB74 | |
| Xiaomi Mi Gaming Laptop 2019 | |
| MSI GL65 9SEK | |
| Acer ConceptD 7 CN715-71-743N | |
| Lenovo Legion Y540-15IRH | |
Çoğu durumda, 2560x1440’da oyunların yürütülmesinde de iyi olmalısınız. Bununla birlikte, 3820x2160'da 4K oynanışı büyük olasılıkla bu RTX 2060 için çok zorlayıcı olacak.
| düşük | orta | yüksek | ultra | QHD | 4K | |
|---|---|---|---|---|---|---|
| The Witcher 3 (2015) | 113 | 60.6 | ||||
| Fortnite (2018) | 130 | 107 | ||||
| Kingdom Come: Deliverance (2018) | 87.4 | 62.3 | ||||
| Assassin´s Creed Odyssey (2018) | 68 | 50 | ||||
| Battlefield V (2018) | 106 | 103 | ||||
| Darksiders III (2018) | 106 | 93.4 | ||||
| Just Cause 4 (2018) | 89.2 | 82.1 | ||||
| Dirt Rally 2.0 (2019) | 127 | 74 | ||||
| Anno 1800 (2019) | 67.1 | 37.3 | ||||
| Need for Speed Heat (2019) | 99.6 | 93.2 | 87.7 | 74.9 | 54.4 | 29.6 |
| Star Wars Jedi Fallen Order (2019) | 99.6 | 93.8 | 87.6 | 61.9 | 30.1 |
Emisyonları
Sistem Gürültüsü
Sistem gürültüsü bugüne kadar Mi Gaming Laptop'un en büyük yetersizliği. Kendinden öncekiler gibi 2019 modelinin de aşırı yük altında olduğu ortaya çıktı. "The Witcher 3" çalışırken ortalama 59 dB (A) sinir bozucu bir durumdur ve kullanıcıları kulaklık takmaya zorlar. Ortalama 44-51 dB (A) ortalamada rakipleri çok daha sessizdi.
Ayrıca ofis görevleri, video ve web'de gezinme gibi düşük yük senaryolarında bazı iyileştirmeler görmek istiyoruz. Fanlar çoğu zaman 31-32 dB (A) 'da göze çarpmayan kalır ancak rastgele olarak 40 dB (A)' ya kadar yükselme eğilimindedir. Bu büyük olasılıkla birçok kullanıcı için büyük bir sıkıntı olacak.
Ses yüksekliği
| Boşta |
| 31 / 32 / 42 dB |
| Çalışırken |
| 52 / 59 dB |
 | ||
30 dB sessiz 40 dB(A) duyulabilirlik 50 dB(A) gürültülü |
||
min: | ||
| Xiaomi Mi Gaming Laptop 2019 i7-9750H, GeForce RTX 2060 Mobile | MSI GL65 9SEK i7-9750H, GeForce RTX 2060 Mobile | Lenovo Legion Y540-15IRH i7-9750H, GeForce RTX 2060 Mobile | Asus Strix GL531GV-PB74 i7-9750H, GeForce RTX 2060 Mobile | Acer ConceptD 7 CN715-71-743N i7-9750H, GeForce RTX 2060 Mobile | Sınıf ortalaması Gaming | |
|---|---|---|---|---|---|---|
| Noise | 7% | 10% | 11% | 14% | 18% | |
| kapalı / ortam * (dB) | 30 | 28.1 6% | 30 -0% | 28.2 6% | 30.4 -1% | 24.1 ? 20% |
| Idle Minimum * (dB) | 31 | 31.4 -1% | 30 3% | 28.8 7% | 30.6 1% | 25.8 ? 17% |
| Idle Average * (dB) | 32 | 31.5 2% | 32 -0% | 31.4 2% | 30.6 4% | 27.4 ? 14% |
| Idle Maximum * (dB) | 42 | 33.5 20% | 34 19% | 33.3 21% | 30.6 27% | 29.9 ? 29% |
| Load Average * (dB) | 52 | 49.3 5% | 44 15% | 46.2 11% | 44 15% | 43 ? 17% |
| Witcher 3 ultra * (dB) | 59 | 51.3 13% | 48 19% | 50.5 14% | 43.9 26% | |
| Load Maximum * (dB) | 59 | 58 2% | 52 12% | 51.3 13% | 44.2 25% | 54 ? 8% |
* ... daha küçük daha iyidir
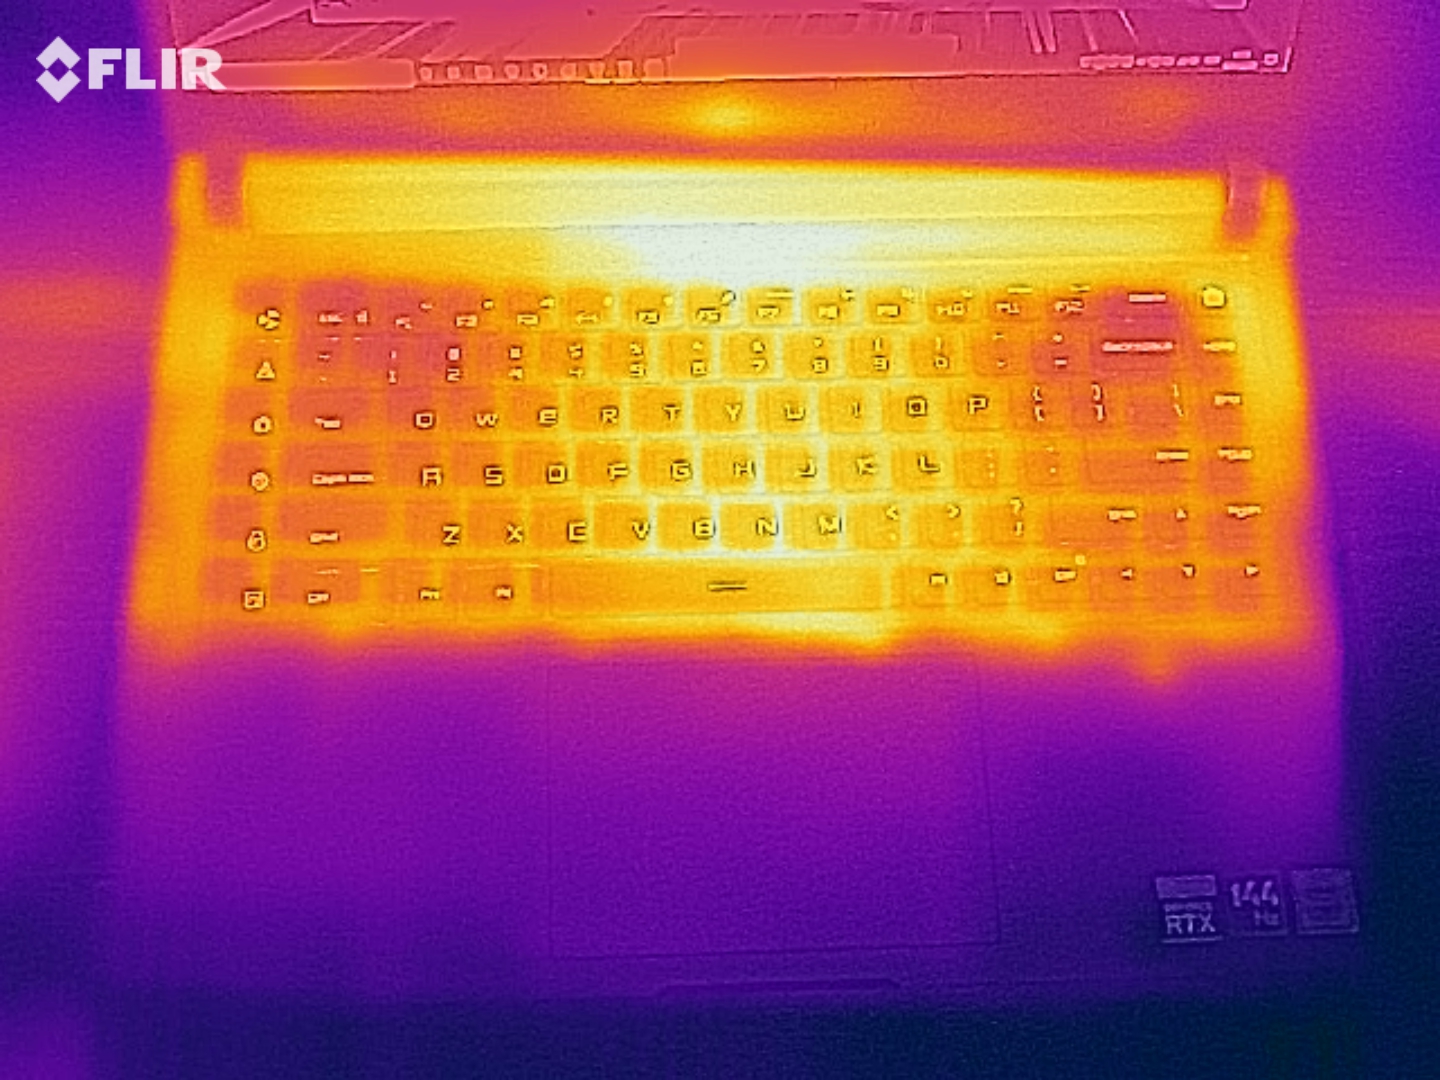
Sıcaklık
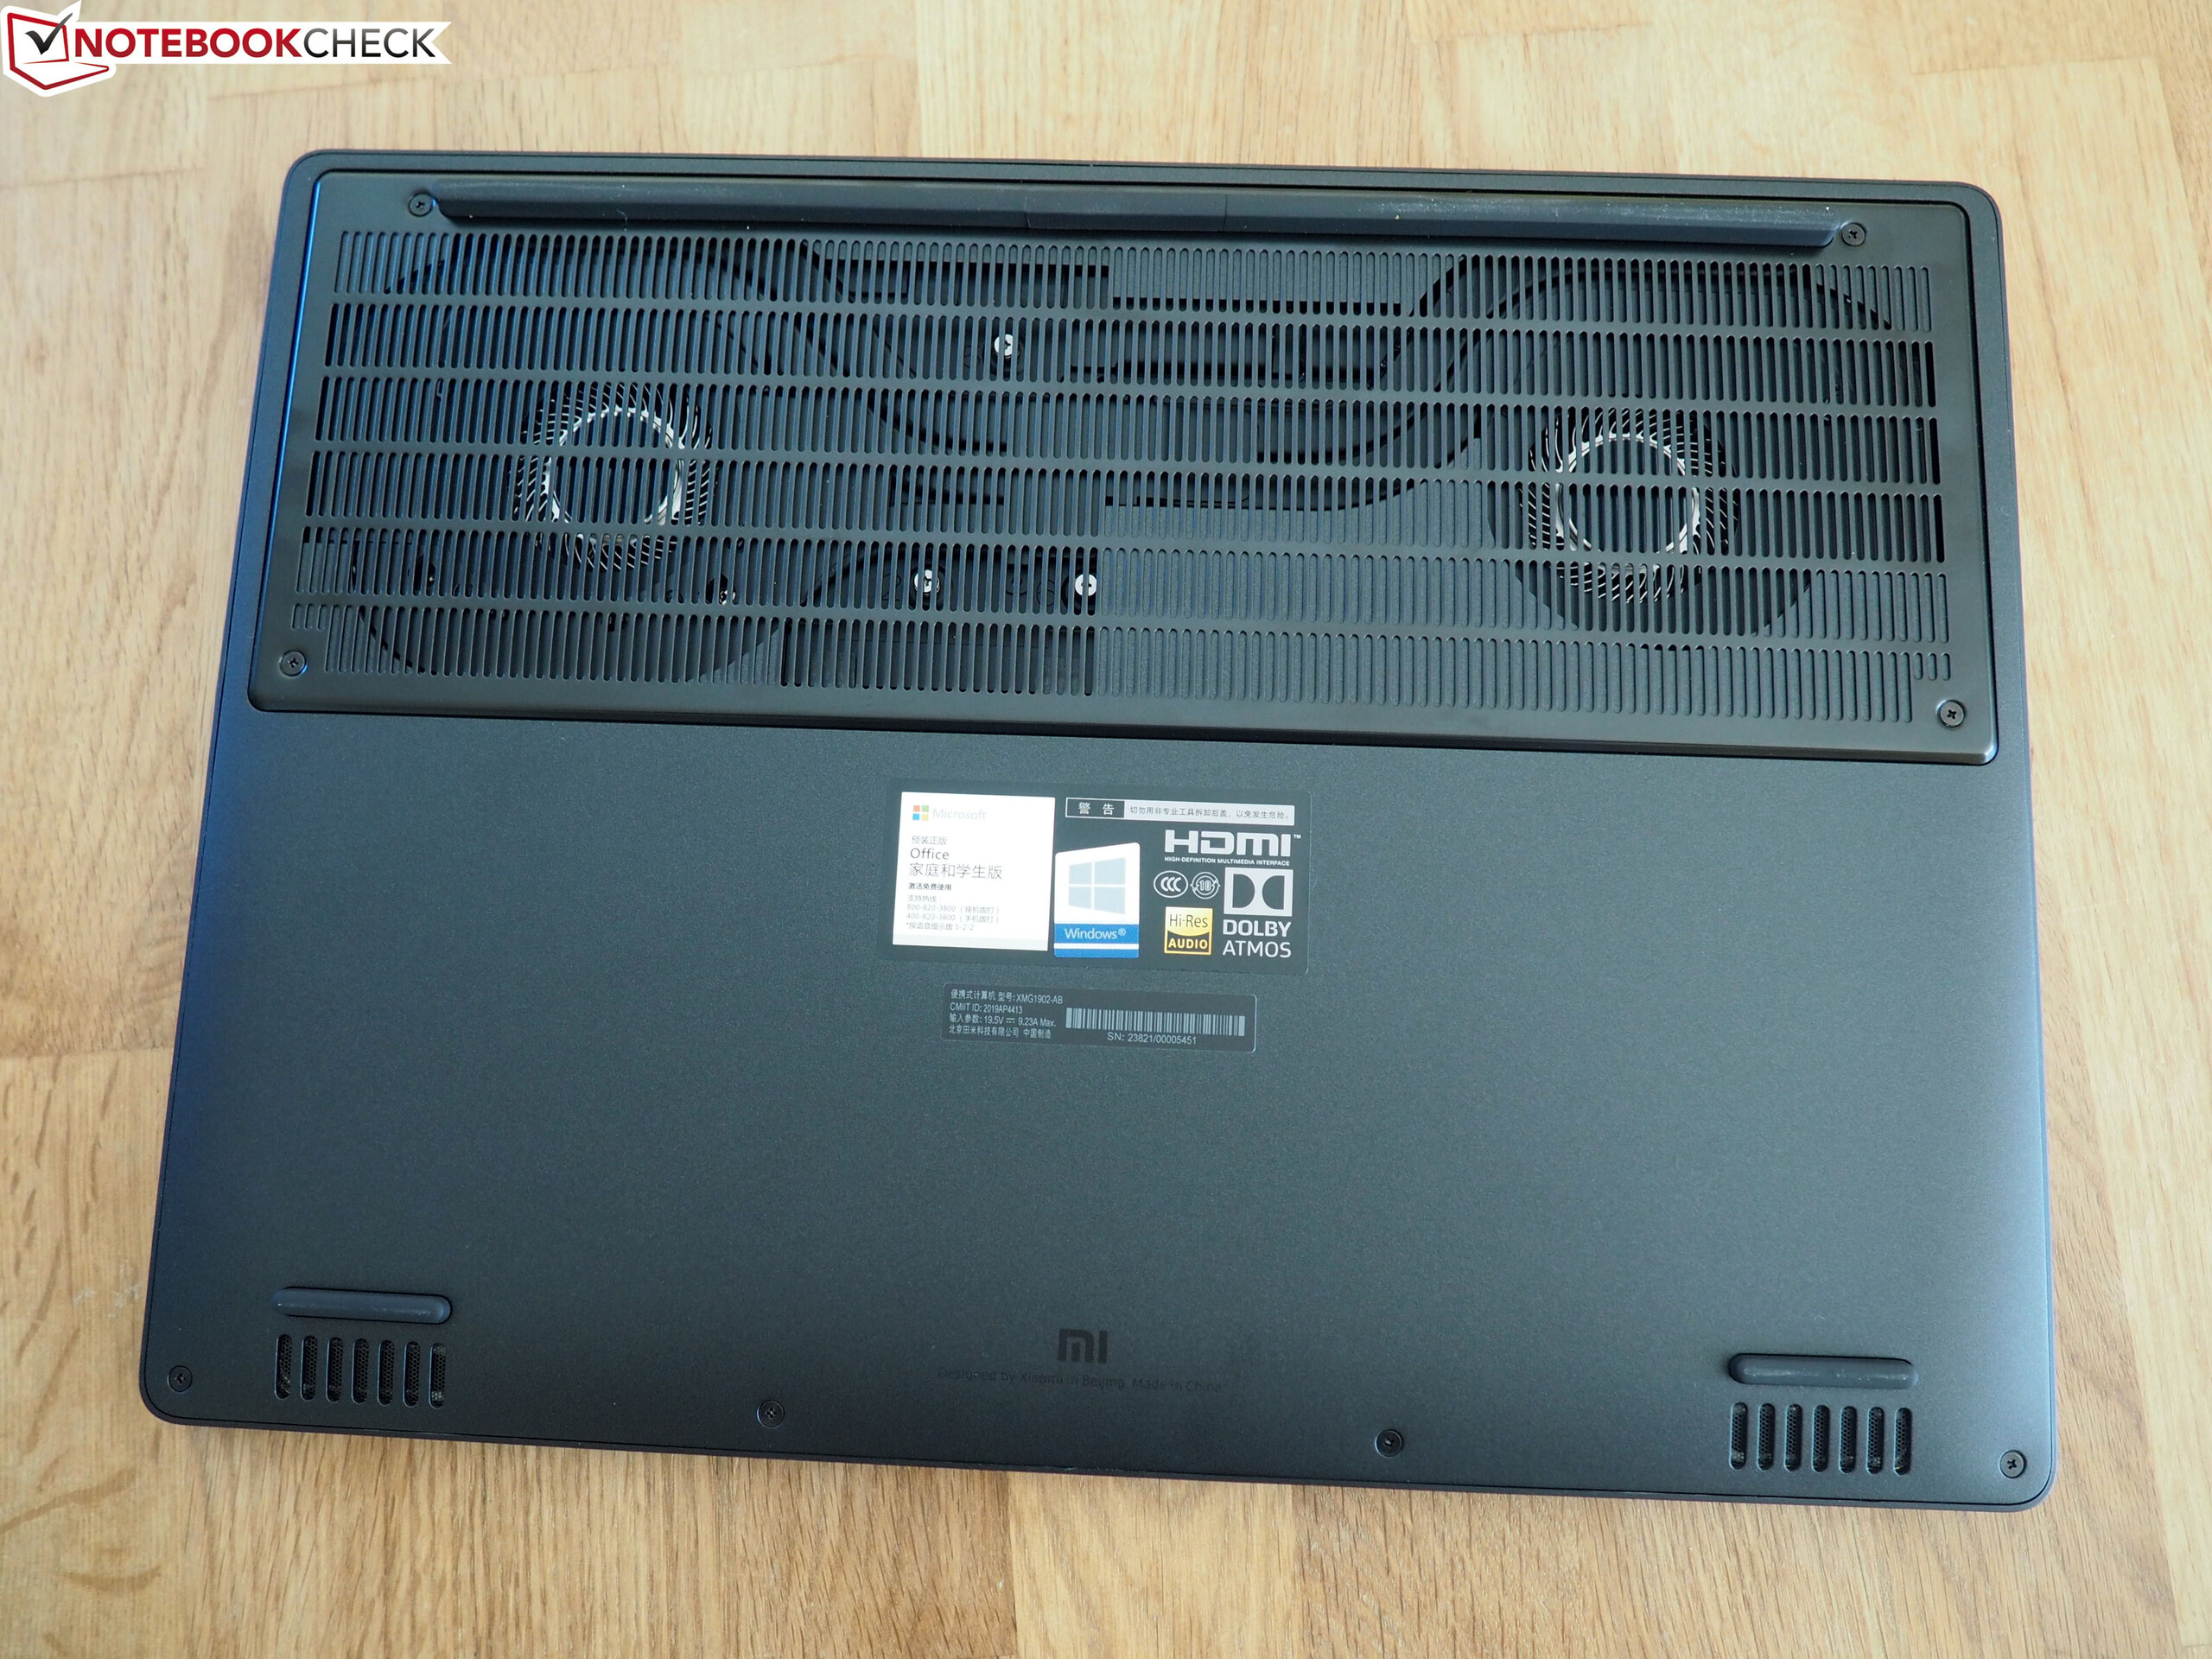
Gürültü emisyonları düşünüldüğünde, dizüstü bilgisayarların yüzey sıcaklıkları ne burada ne de oradaydı. Tepede maksimum 51 ° C (~ 124 ° F) ve alt kısımda 57 ° C (~ 135 ° F), cihazı paketin ortasına bir yere yerleştirin. Sadece 23 ila 27 ° C'de (~ 73 ila 81 ° F) rölanti sıcaklıkları ortalamadan düşüktü.
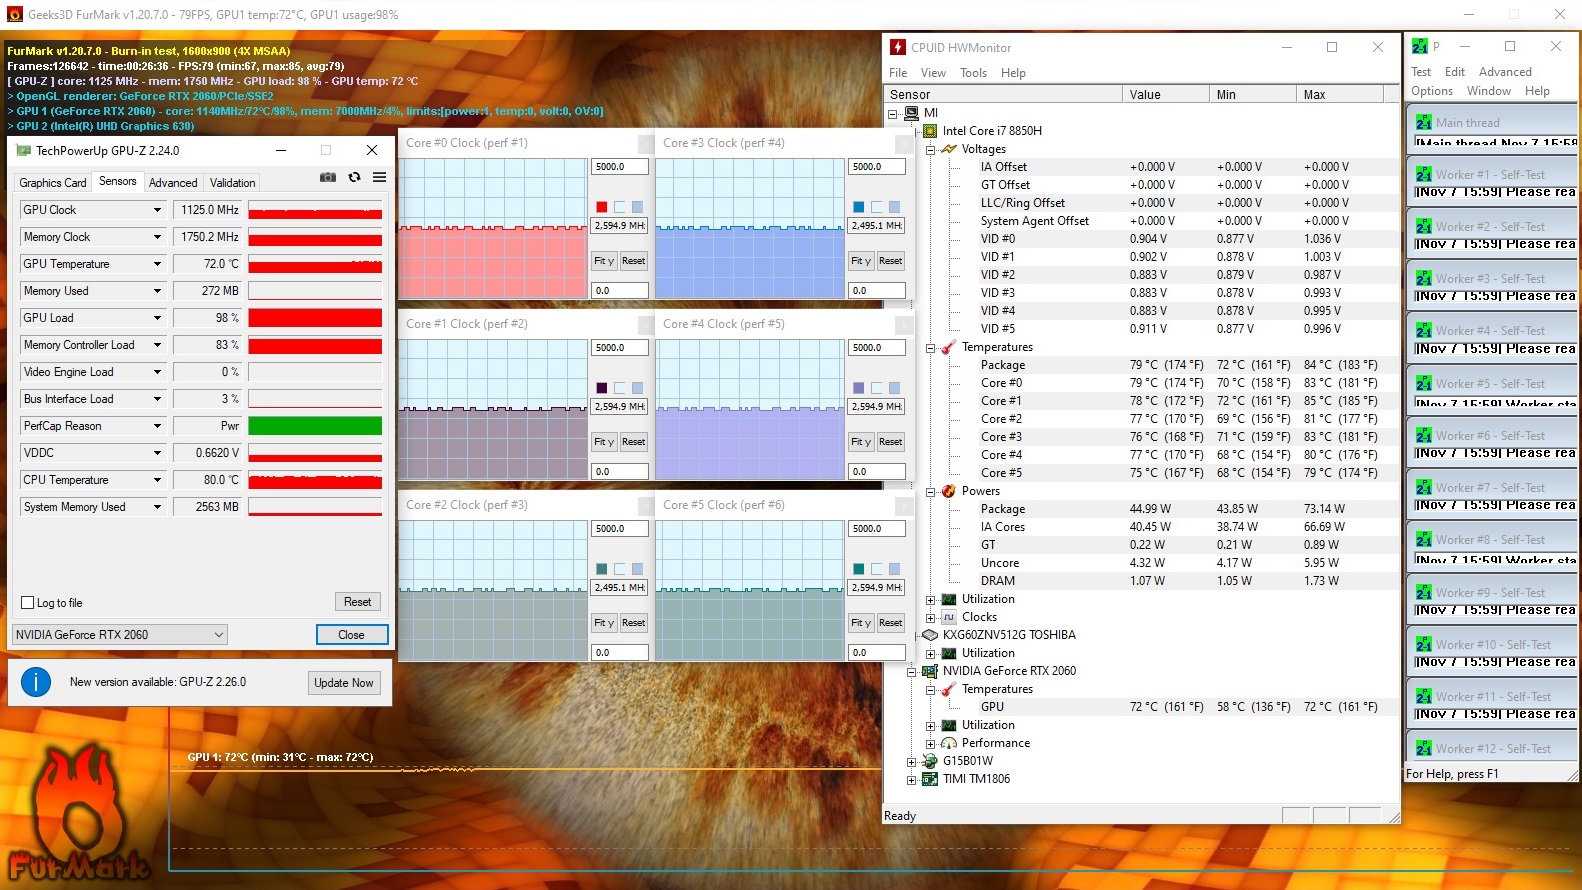
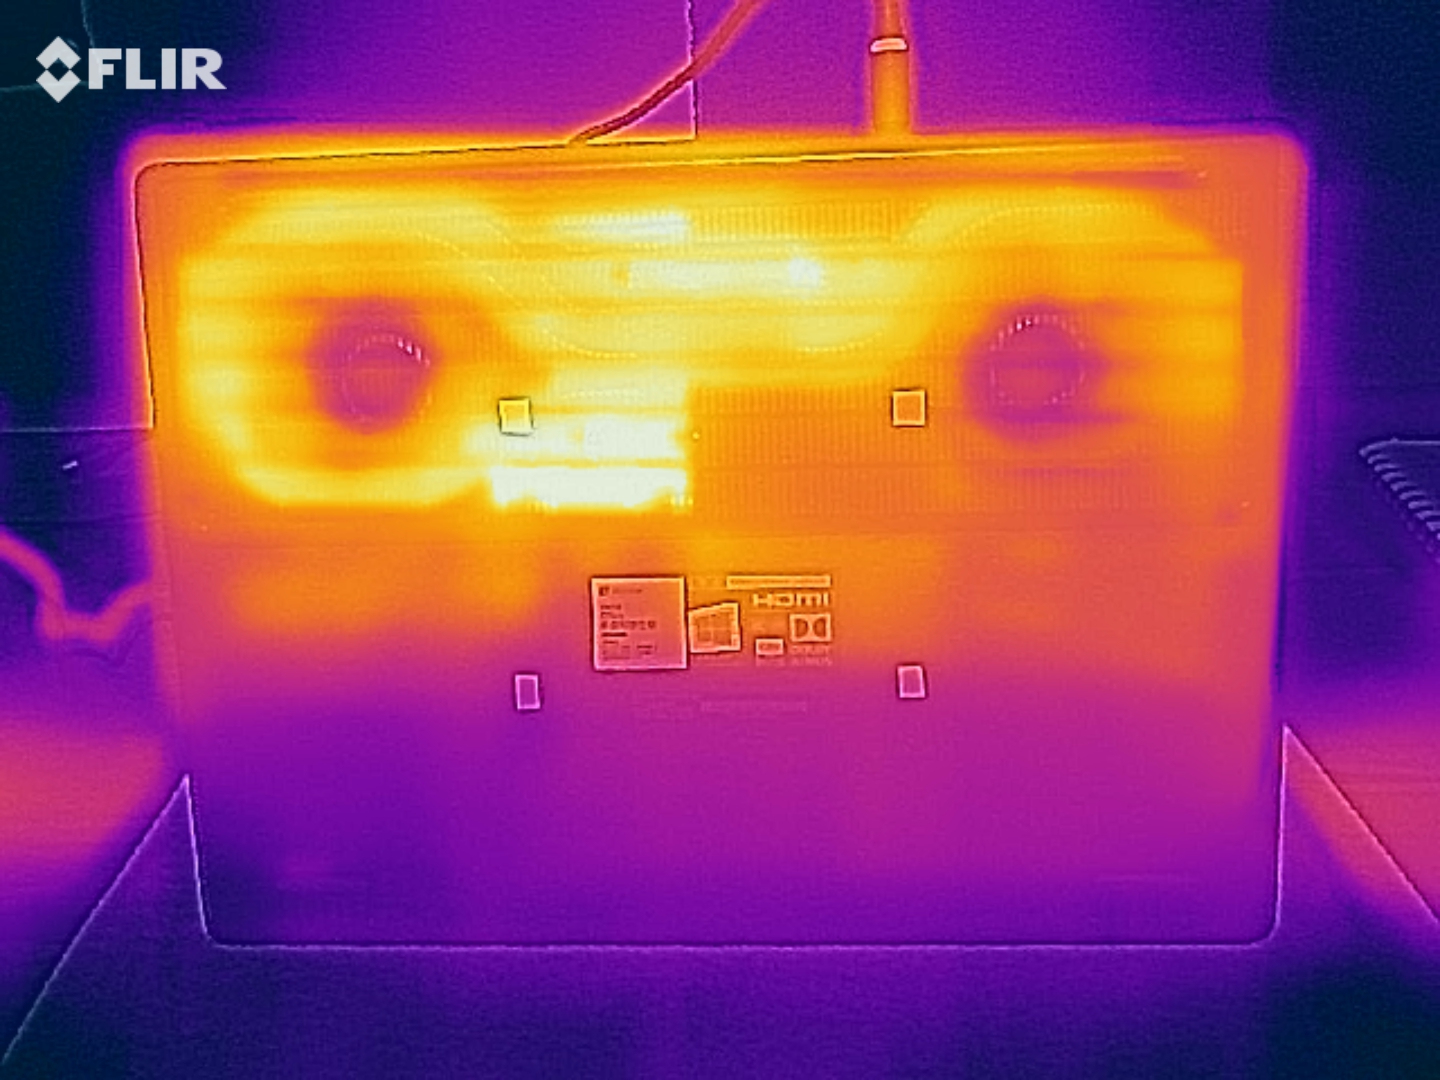
Hızlı dönen fanlar, iç sıcaklıklar üzerinde de olumlu bir etki yaptı. Örneğin, GeForce RTX 2060, yük altında sadece 70 ° C'de (~ 158 ° F) maksimuma çıkarıldı ve Intel'in Core i7-9750H, stresimizde biraz daha yüksek fakat yine de kabul edilebilir 80 ° C'den (~ 176 ° F) biraz daha yükseğe çıktı. Prime95 ve FurMark'ı aynı anda çalıştıran test. Stres testimizi çalıştırmanın geçici olarak devre dışı olan bir CPU turbo artışıyla sonuçlandığını not etmeliyiz.
(-) Üst taraftaki maksimum sıcaklık, 40.4 °C / 105 F ortalamasına kıyasla 51 °C / 124 F'dir. , Gaming sınıfı için 21.2 ile 68.8 °C arasında değişir.
(-) Alt kısım, 43.2 °C / 110 F ortalamasına kıyasla maksimum 57 °C / 135 F'ye kadar ısınır
(+) Boşta kullanımda, üst tarafın ortalama sıcaklığı 24.7 °C / 76 F olup, cihazın 33.9 °C / 93 F.
(-) The Witcher 3 oynarken, üst tarafın ortalama sıcaklığı 40.7 °C / 105 F olup, cihazın 33.9 °C / 93 F.
(+) Avuç içi dayanakları ve dokunmatik yüzey, maksimum 30 °C / 86 F ile cilt sıcaklığından daha soğuktur ve bu nedenle dokunulduğunda soğuktur.
(±) Benzer cihazların avuç içi dayanağı alanının ortalama sıcaklığı 28.8 °C / 83.8 F (-1.2 °C / -2.2 F) idi.
| Xiaomi Mi Gaming Laptop 2019 i7-9750H, GeForce RTX 2060 Mobile | MSI GL65 9SEK i7-9750H, GeForce RTX 2060 Mobile | Lenovo Legion Y540-15IRH i7-9750H, GeForce RTX 2060 Mobile | Asus Strix GL531GV-PB74 i7-9750H, GeForce RTX 2060 Mobile | Acer ConceptD 7 CN715-71-743N i7-9750H, GeForce RTX 2060 Mobile | Sınıf ortalaması Gaming | |
|---|---|---|---|---|---|---|
| Heat | -25% | -25% | -5% | 1% | -6% | |
| Maximum Upper Side * (°C) | 51 | 49 4% | 47 8% | 43.4 15% | 44.6 13% | 45.2 ? 11% |
| Maximum Bottom * (°C) | 57 | 54.2 5% | 60 -5% | 49.2 14% | 57.2 -0% | 47.9 ? 16% |
| Idle Upper Side * (°C) | 27 | 40.4 -50% | 37 -37% | 30.8 -14% | 27.4 -1% | 31.1 ? -15% |
| Idle Bottom * (°C) | 25 | 40 -60% | 41 -64% | 34 -36% | 27.6 -10% | 34.2 ? -37% |
* ... daha küçük daha iyidir
Hoparlörler
Xiaomi Mi Gaming Laptop 2019 ses analizi
(+) | hoparlörler nispeten yüksek sesle çalabilir (89 dB)
Bas 100 - 315Hz
(-) | neredeyse hiç bas yok - ortalama olarak medyandan 16.9% daha düşük
(±) | Bas doğrusallığı ortalamadır (7.7% delta - önceki frekans)
Ortalar 400 - 2000 Hz
(+) | dengeli ortalar - medyandan yalnızca 3.6% uzakta
(+) | orta frekanslar doğrusaldır (6.9% deltadan önceki frekansa)
Yüksekler 2 - 16 kHz
(+) | dengeli yüksekler - medyandan yalnızca 3.9% uzakta
(+) | yüksekler doğrusaldır (4.8% deltadan önceki frekansa)
Toplam 100 - 16.000 Hz
(±) | Genel sesin doğrusallığı ortalamadır (15% ortancaya göre fark)
Aynı sınıfla karşılaştırıldığında
» Bu sınıftaki tüm test edilen cihazların %32%'si daha iyi, 6% benzer, 62% daha kötüydü
» En iyisinin deltası 6% idi, ortalama 18% idi, en kötüsü 132% idi
Test edilen tüm cihazlarla karşılaştırıldığında
» Test edilen tüm cihazların %21'si daha iyi, 4 benzer, % 75 daha kötüydü
» En iyisinin deltası 4% idi, ortalama 24% idi, en kötüsü 134% idi
Lenovo Legion Y540-15IRH ses analizi
(+) | hoparlörler nispeten yüksek sesle çalabilir (82 dB)
Bas 100 - 315Hz
(±) | azaltılmış bas - ortalama olarak medyandan 14.6% daha düşük
(±) | Bas doğrusallığı ortalamadır (14.5% delta - önceki frekans)
Ortalar 400 - 2000 Hz
(+) | dengeli ortalar - medyandan yalnızca 3.9% uzakta
(+) | orta frekanslar doğrusaldır (3.8% deltadan önceki frekansa)
Yüksekler 2 - 16 kHz
(+) | dengeli yüksekler - medyandan yalnızca 3% uzakta
(+) | yüksekler doğrusaldır (6.5% deltadan önceki frekansa)
Toplam 100 - 16.000 Hz
(+) | genel ses doğrusaldır (14.3% ortancaya göre fark)
Aynı sınıfla karşılaştırıldığında
» Bu sınıftaki tüm test edilen cihazların %26%'si daha iyi, 7% benzer, 67% daha kötüydü
» En iyisinin deltası 6% idi, ortalama 18% idi, en kötüsü 132% idi
Test edilen tüm cihazlarla karşılaştırıldığında
» Test edilen tüm cihazların %17'si daha iyi, 4 benzer, % 79 daha kötüydü
» En iyisinin deltası 4% idi, ortalama 24% idi, en kötüsü 134% idi
Enerji yönetimi
Güç tüketimi
İsteğe bağlı grafik değiştirme sayesinde, 15 inçlik dizüstü bilgisayar boştayken yalnızca 10 ila 20 W, 3D'de yaklaşık 100 W (3DMark 06) ve maksimum yük altında 196 W tüketiyordu. Tipik oyun yükünü temsil etmek için "The Witcher 3" kullanarak, yaklaşık 160 W'lık bir ortalama oyun gücü tüketimini belirleyebildik. Güç kaynağı 180 W olarak değerlendirildi.
| Kapalı / Bekleme modu | |
| Boşta | |
| Çalışırken |
|
Key:
min: | |
| Xiaomi Mi Gaming Laptop 2019 i7-9750H, GeForce RTX 2060 Mobile | MSI GL65 9SEK i7-9750H, GeForce RTX 2060 Mobile | Lenovo Legion Y540-15IRH i7-9750H, GeForce RTX 2060 Mobile | Asus Strix GL531GV-PB74 i7-9750H, GeForce RTX 2060 Mobile | Acer ConceptD 7 CN715-71-743N i7-9750H, GeForce RTX 2060 Mobile | Sınıf ortalaması Gaming | |
|---|---|---|---|---|---|---|
| Power Consumption | -115% | -25% | -17% | 7% | -27% | |
| Idle Minimum * (Watt) | 10 | 41 -310% | 15 -50% | 10.9 -9% | 7.6 24% | 13.2 ? -32% |
| Idle Average * (Watt) | 13 | 45.3 -248% | 20 -54% | 14.7 -13% | 13.6 -5% | 18.9 ? -45% |
| Idle Maximum * (Watt) | 20 | 47.1 -136% | 33 -65% | 32.4 -62% | 18.2 9% | 24.3 ? -22% |
| Load Average * (Watt) | 100 | 94.9 5% | 88 12% | 121.9 -22% | 102 -2% | 108.3 ? -8% |
| Witcher 3 ultra * (Watt) | 159 | 149.4 6% | 128 19% | 143.5 10% | 144 9% | |
| Load Maximum * (Watt) | 196 | 214.2 -9% | 213 -9% | 209.6 -7% | 183 7% | 254 ? -30% |
* ... daha küçük daha iyidir
Pil ömrü
Nvidia Optimus'un desteğine rağmen, Mi Gaming Laptop, nispeten küçük 55 Wh'lik pili nedeniyle hiçbir rekoru kırmayacak. Beklendiği gibi, Wi-Fi testimizde (orta parlaklık) 4.5 saat civarında ve yüksek kaliteli bir cihaz için ne özellikle iyi ne de özellikle kötü olan rölanti testimizde (minimum parlaklık) 6 saate ulaştı. Bunu, spektrumun bir ucunda çok daha erken biten Asus Strix GL531GV ile diğer ucunda neredeyse iki kez çalışan Acer ConceptD 7 ile karşılaştırın. Tüm batarya testleri Mi Gaming Laptop'un MSI GL65 9SEK ve Lenovo Legion Y540-15IRH ile kabaca aynı olduğunu düşünüyor.
| Xiaomi Mi Gaming Laptop 2019 i7-9750H, GeForce RTX 2060 Mobile, 55 Wh | MSI GL65 9SEK i7-9750H, GeForce RTX 2060 Mobile, 51 Wh | Lenovo Legion Y540-15IRH i7-9750H, GeForce RTX 2060 Mobile, 57 Wh | Asus Strix GL531GV-PB74 i7-9750H, GeForce RTX 2060 Mobile, 66 Wh | Acer ConceptD 7 CN715-71-743N i7-9750H, GeForce RTX 2060 Mobile, 84 Wh | Sınıf ortalaması Gaming | |
|---|---|---|---|---|---|---|
| Pil Çalışma Süresi | -6% | -9% | -57% | 105% | 61% | |
| Reader / Idle (h) | 6.2 | 4.4 -29% | 3.9 -37% | 13.7 121% | 8.71 ? 40% | |
| WiFi v1.3 (h) | 4.4 | 3.8 -14% | 3.2 -27% | 1.9 -57% | 8.6 95% | 7.04 ? 60% |
| Load (h) | 0.8 | 1 25% | 1.1 38% | 1.6 100% | 1.47 ? 84% | |
| H.264 (h) | 6.5 | 8.26 ? |
Artılar
Eksiler
Karar
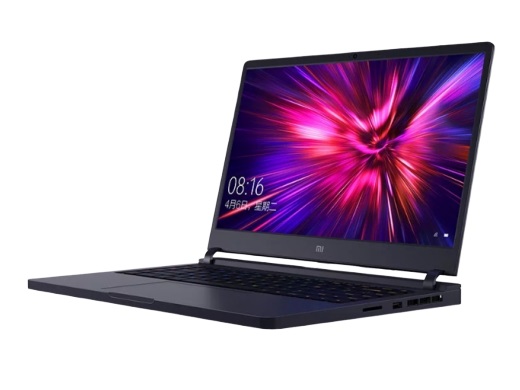
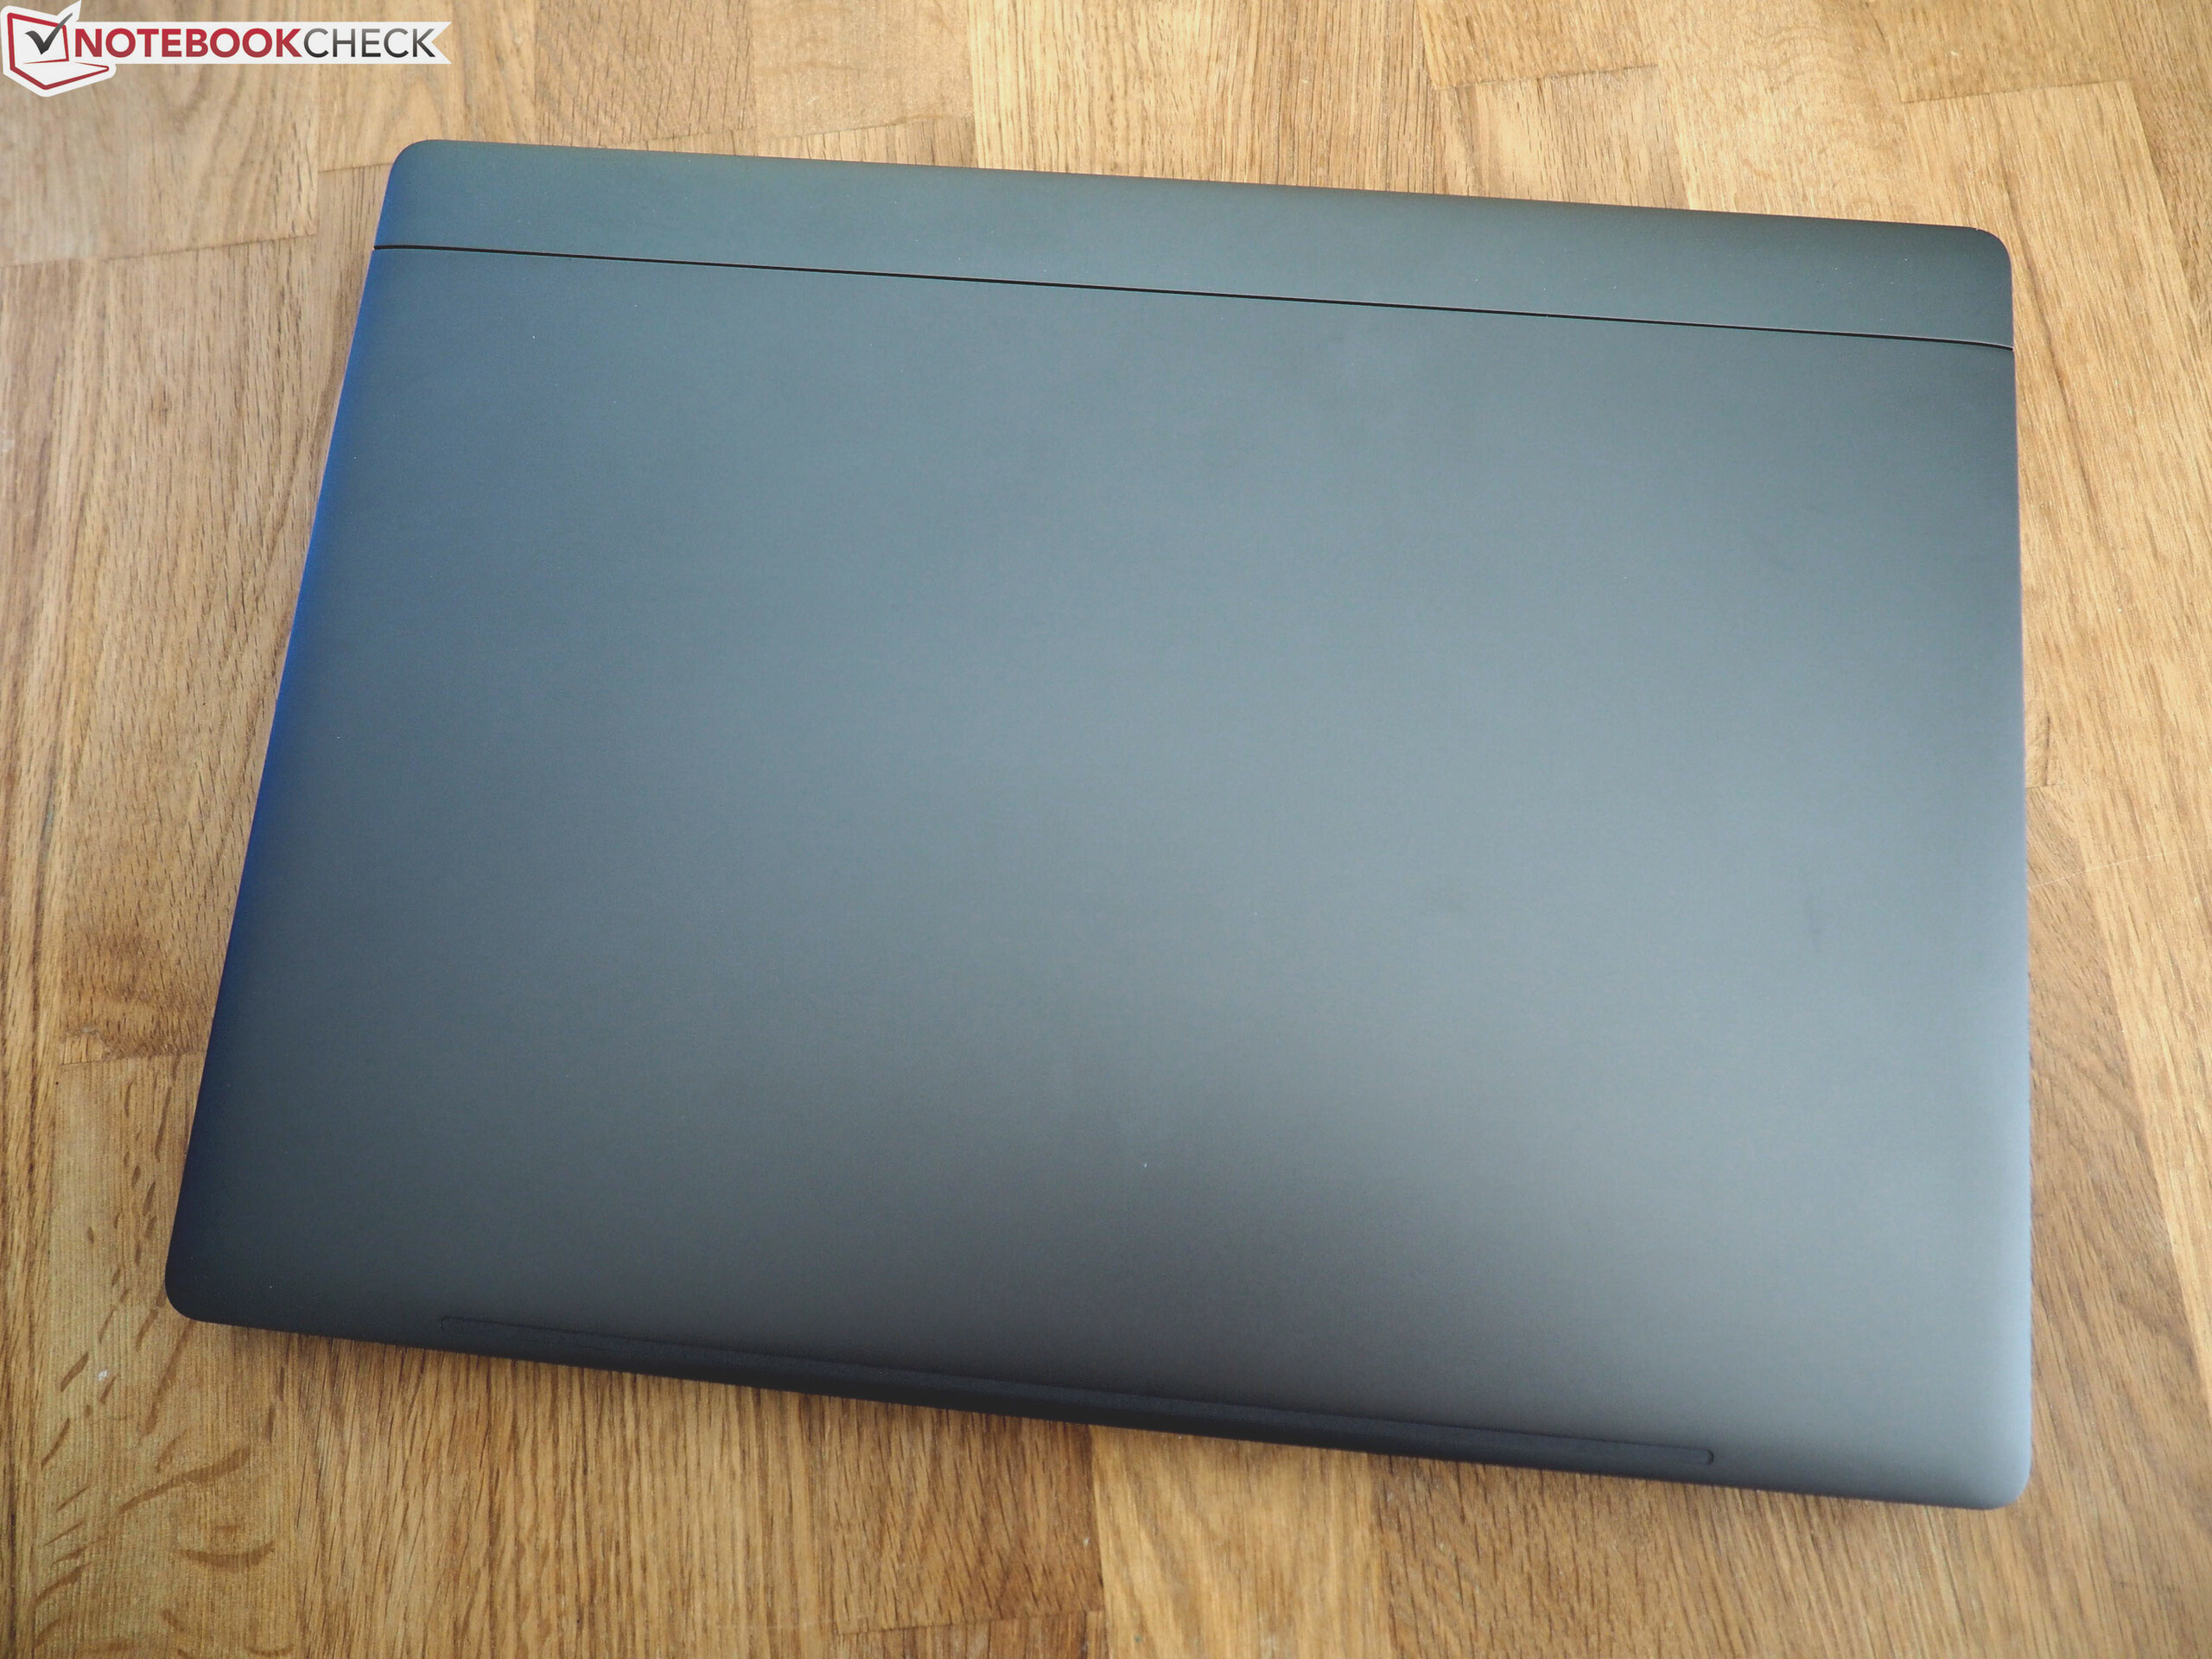
Xiaomi’nin Mi Gaming Laptop’un 2019 sayısının artıları ve eksileri, öncekilerle hemen hemen aynı. Artı tarafta, hemen hemen her yere sığacak basit tasarımıyla şaşırtıcı derecede sağlam, yüksek kaliteli bir kasaya sahibiz. Hem ofis hem de oyun için uygun oldukları için giriş cihazlarını da beğendik. Thunderbolt 3'ün eksikliği, 144 Hz'lik hızlı ekran ve daha hızlı bir kart okuyucusu ile telafi edilir. Basitçe söylemek gerekirse, 15 inçlik dizüstü bilgisayar oldukça yüksek, yüksek fiyat-performans oranının bile telafi edemeyeceği bir şey.
Xiaomi Mi Gaming Laptop 2019
- 05/14/2020 v7 (old)
Florian Glaser
Price comparison
