İncelemede: Core i9 ve RTX 2070 ile Intel NUC 9 Extreme
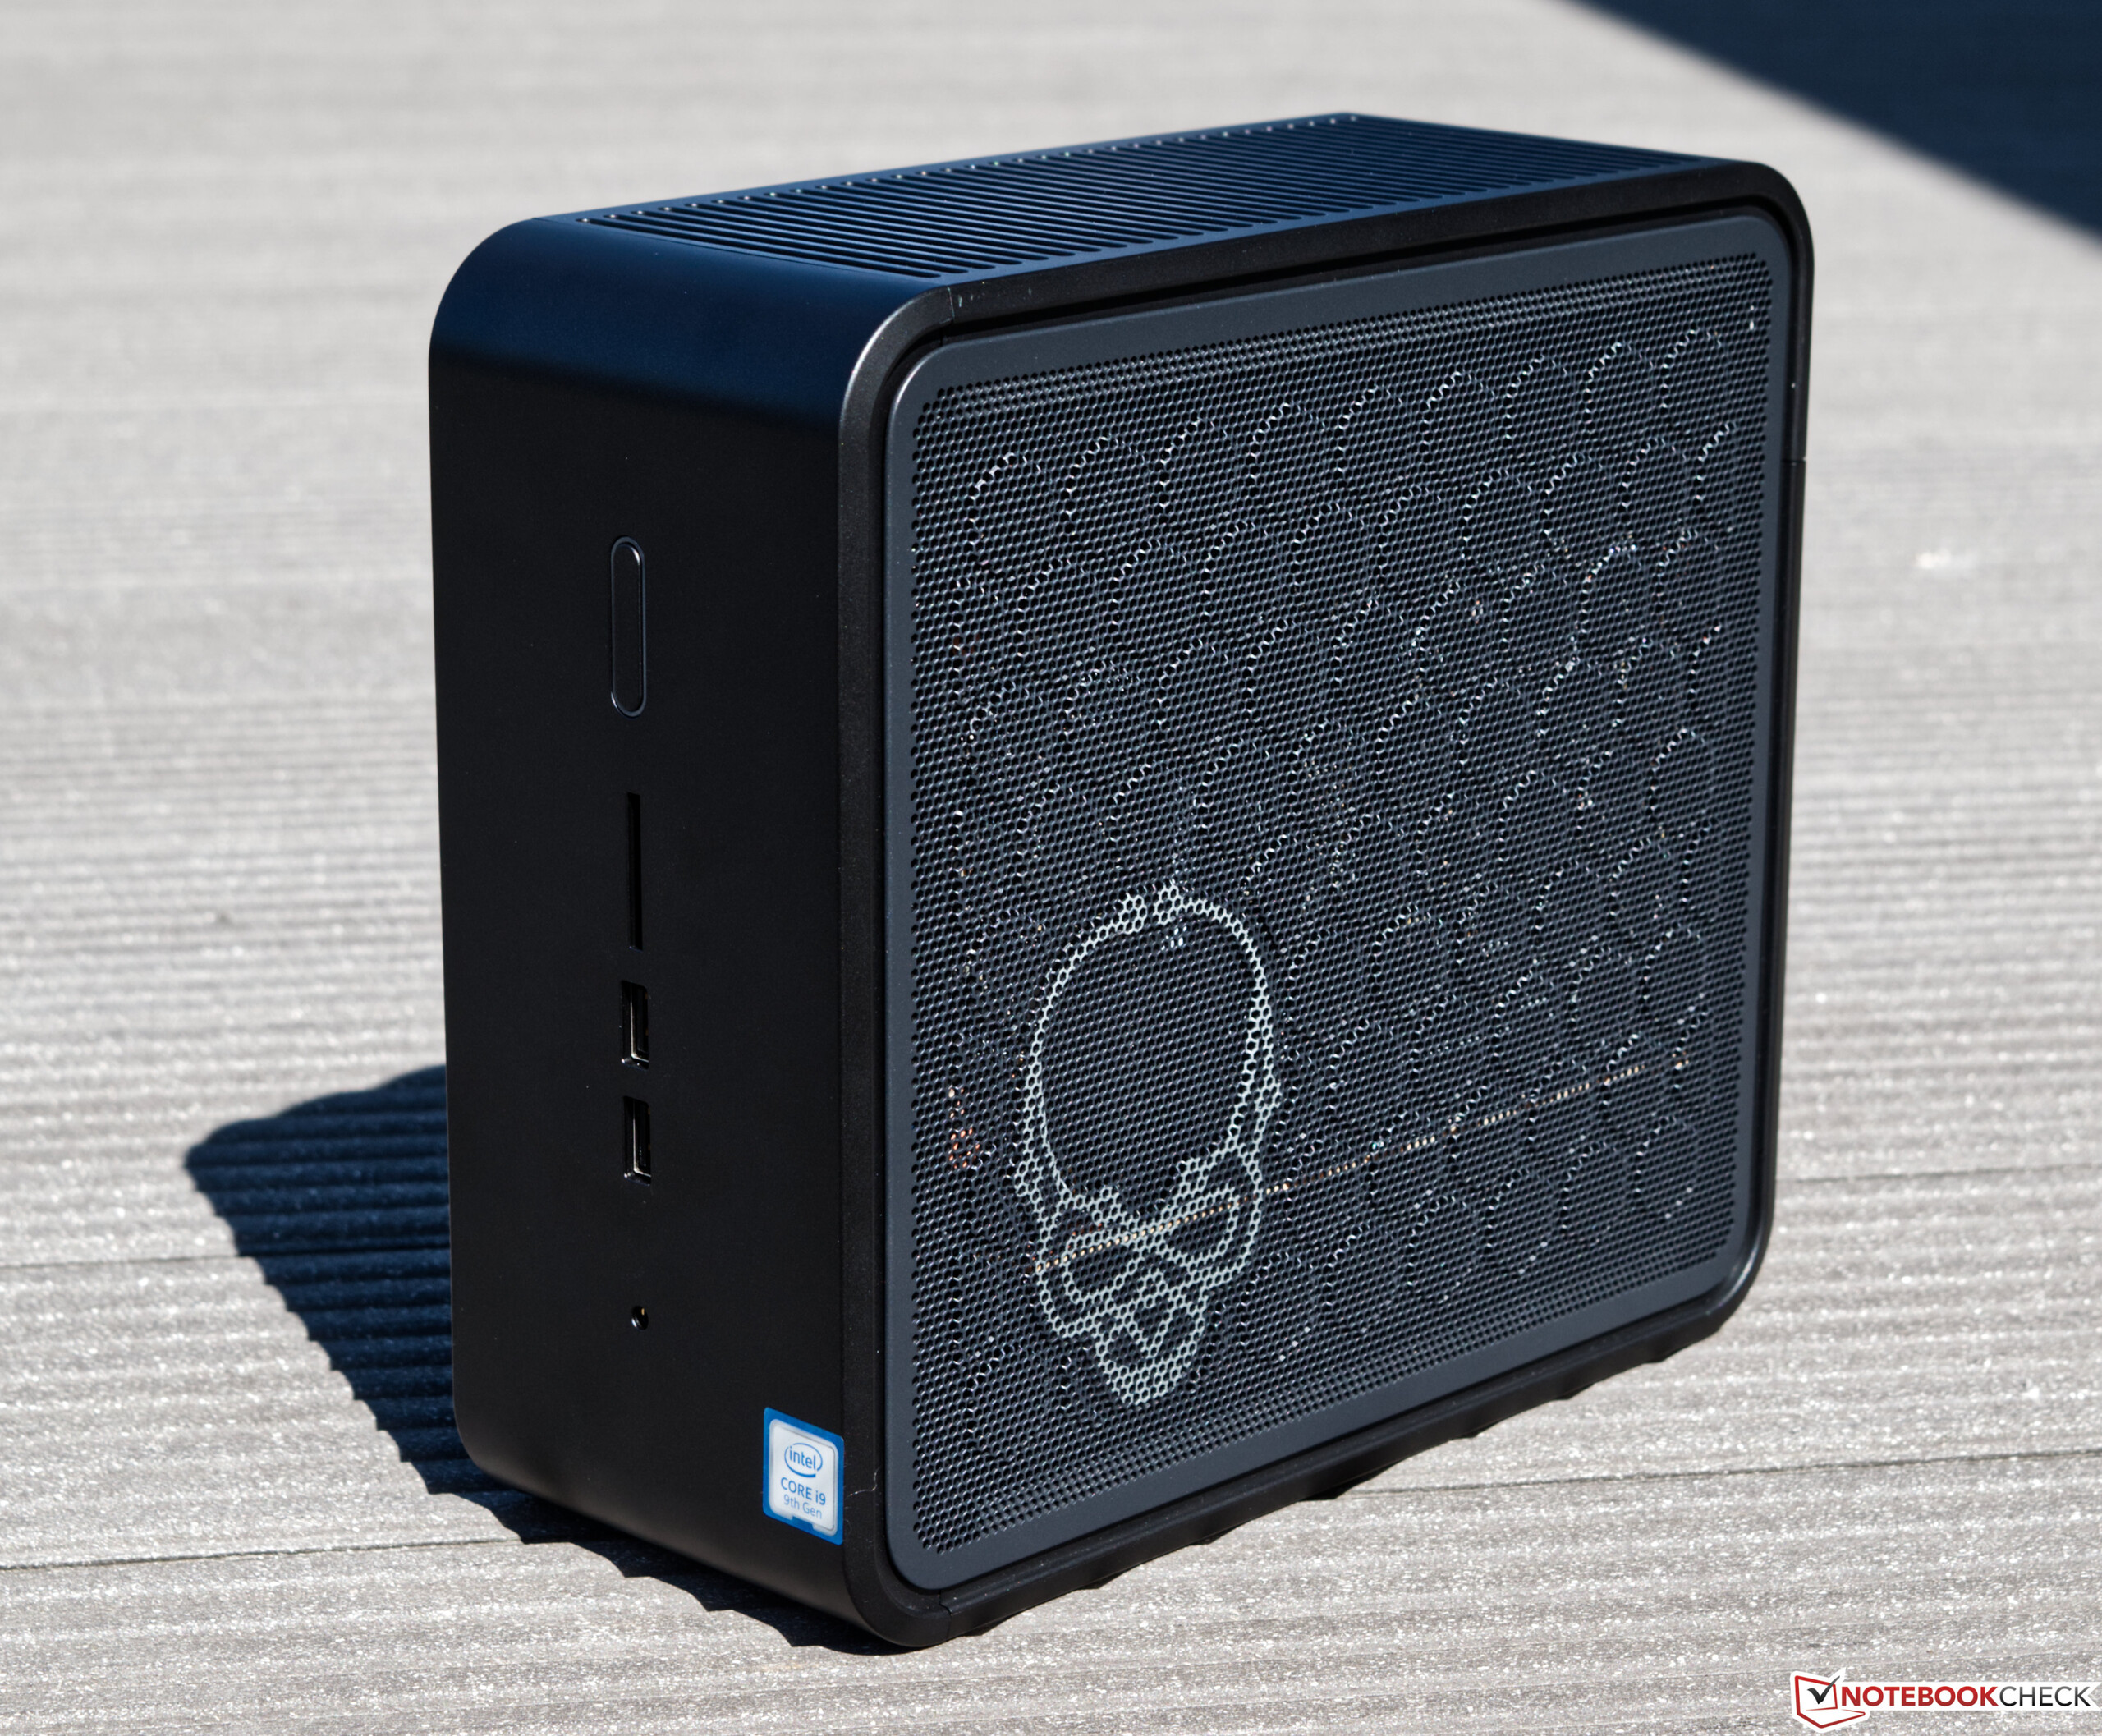
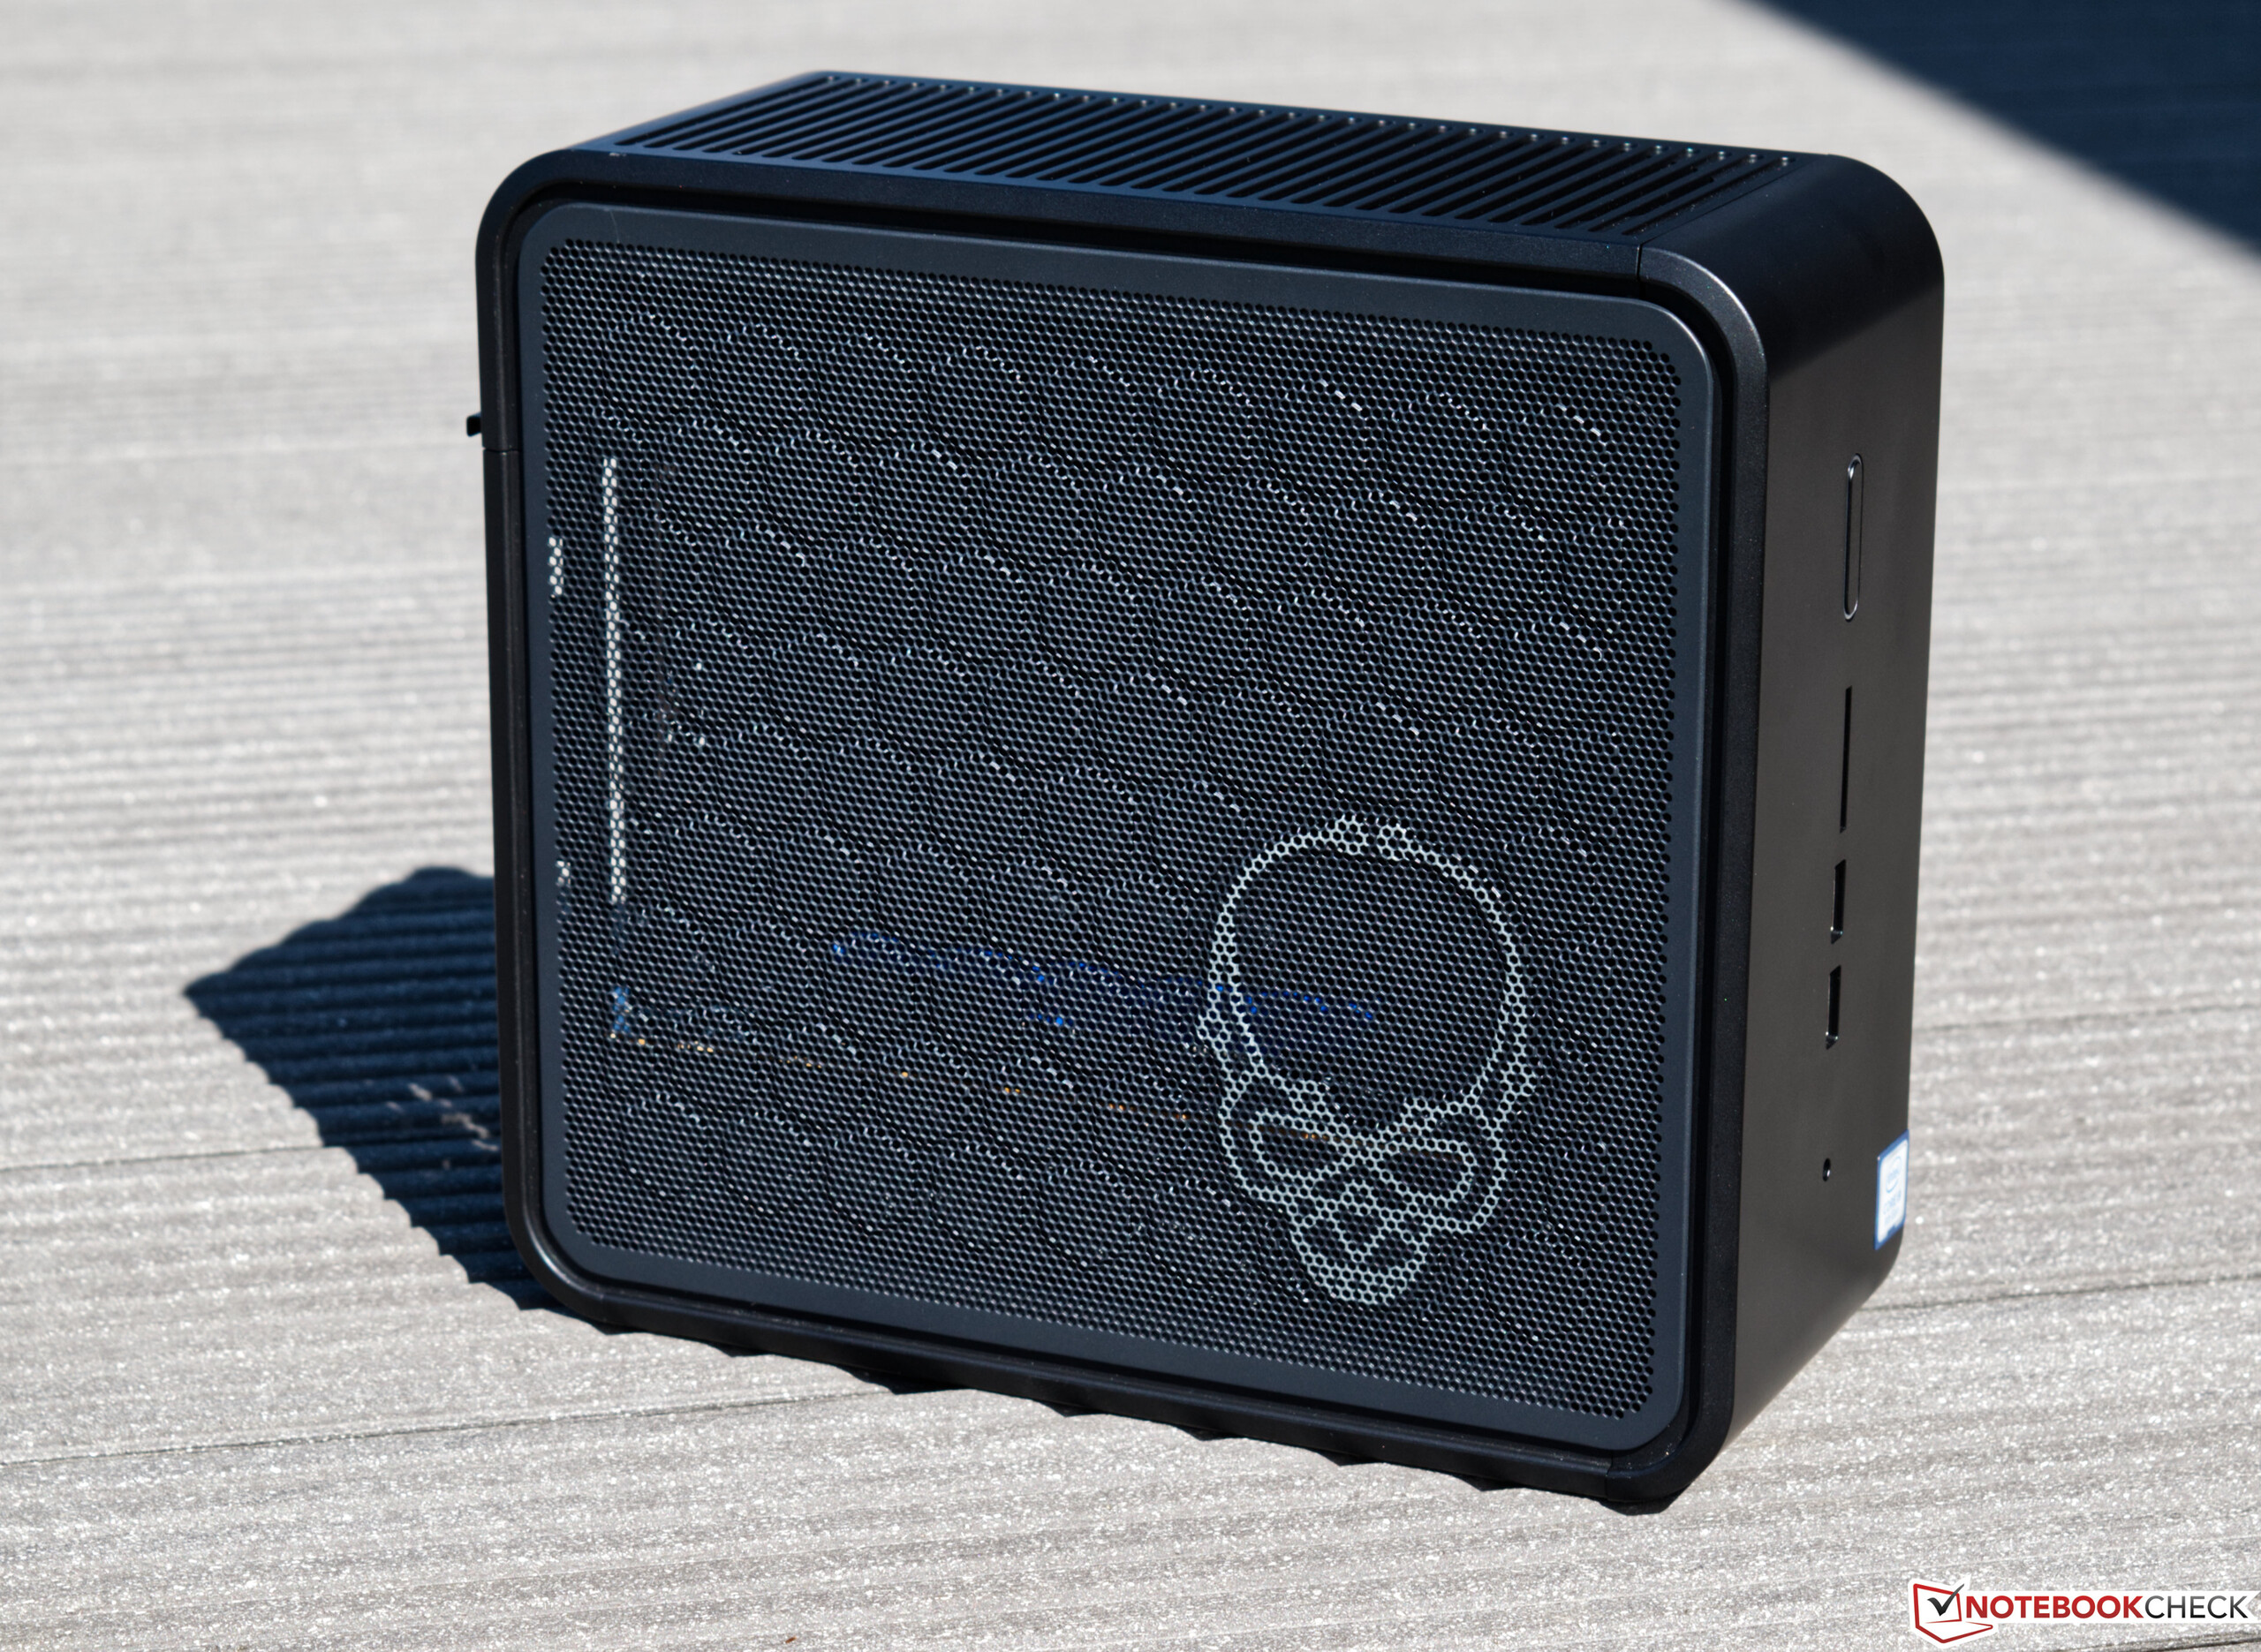
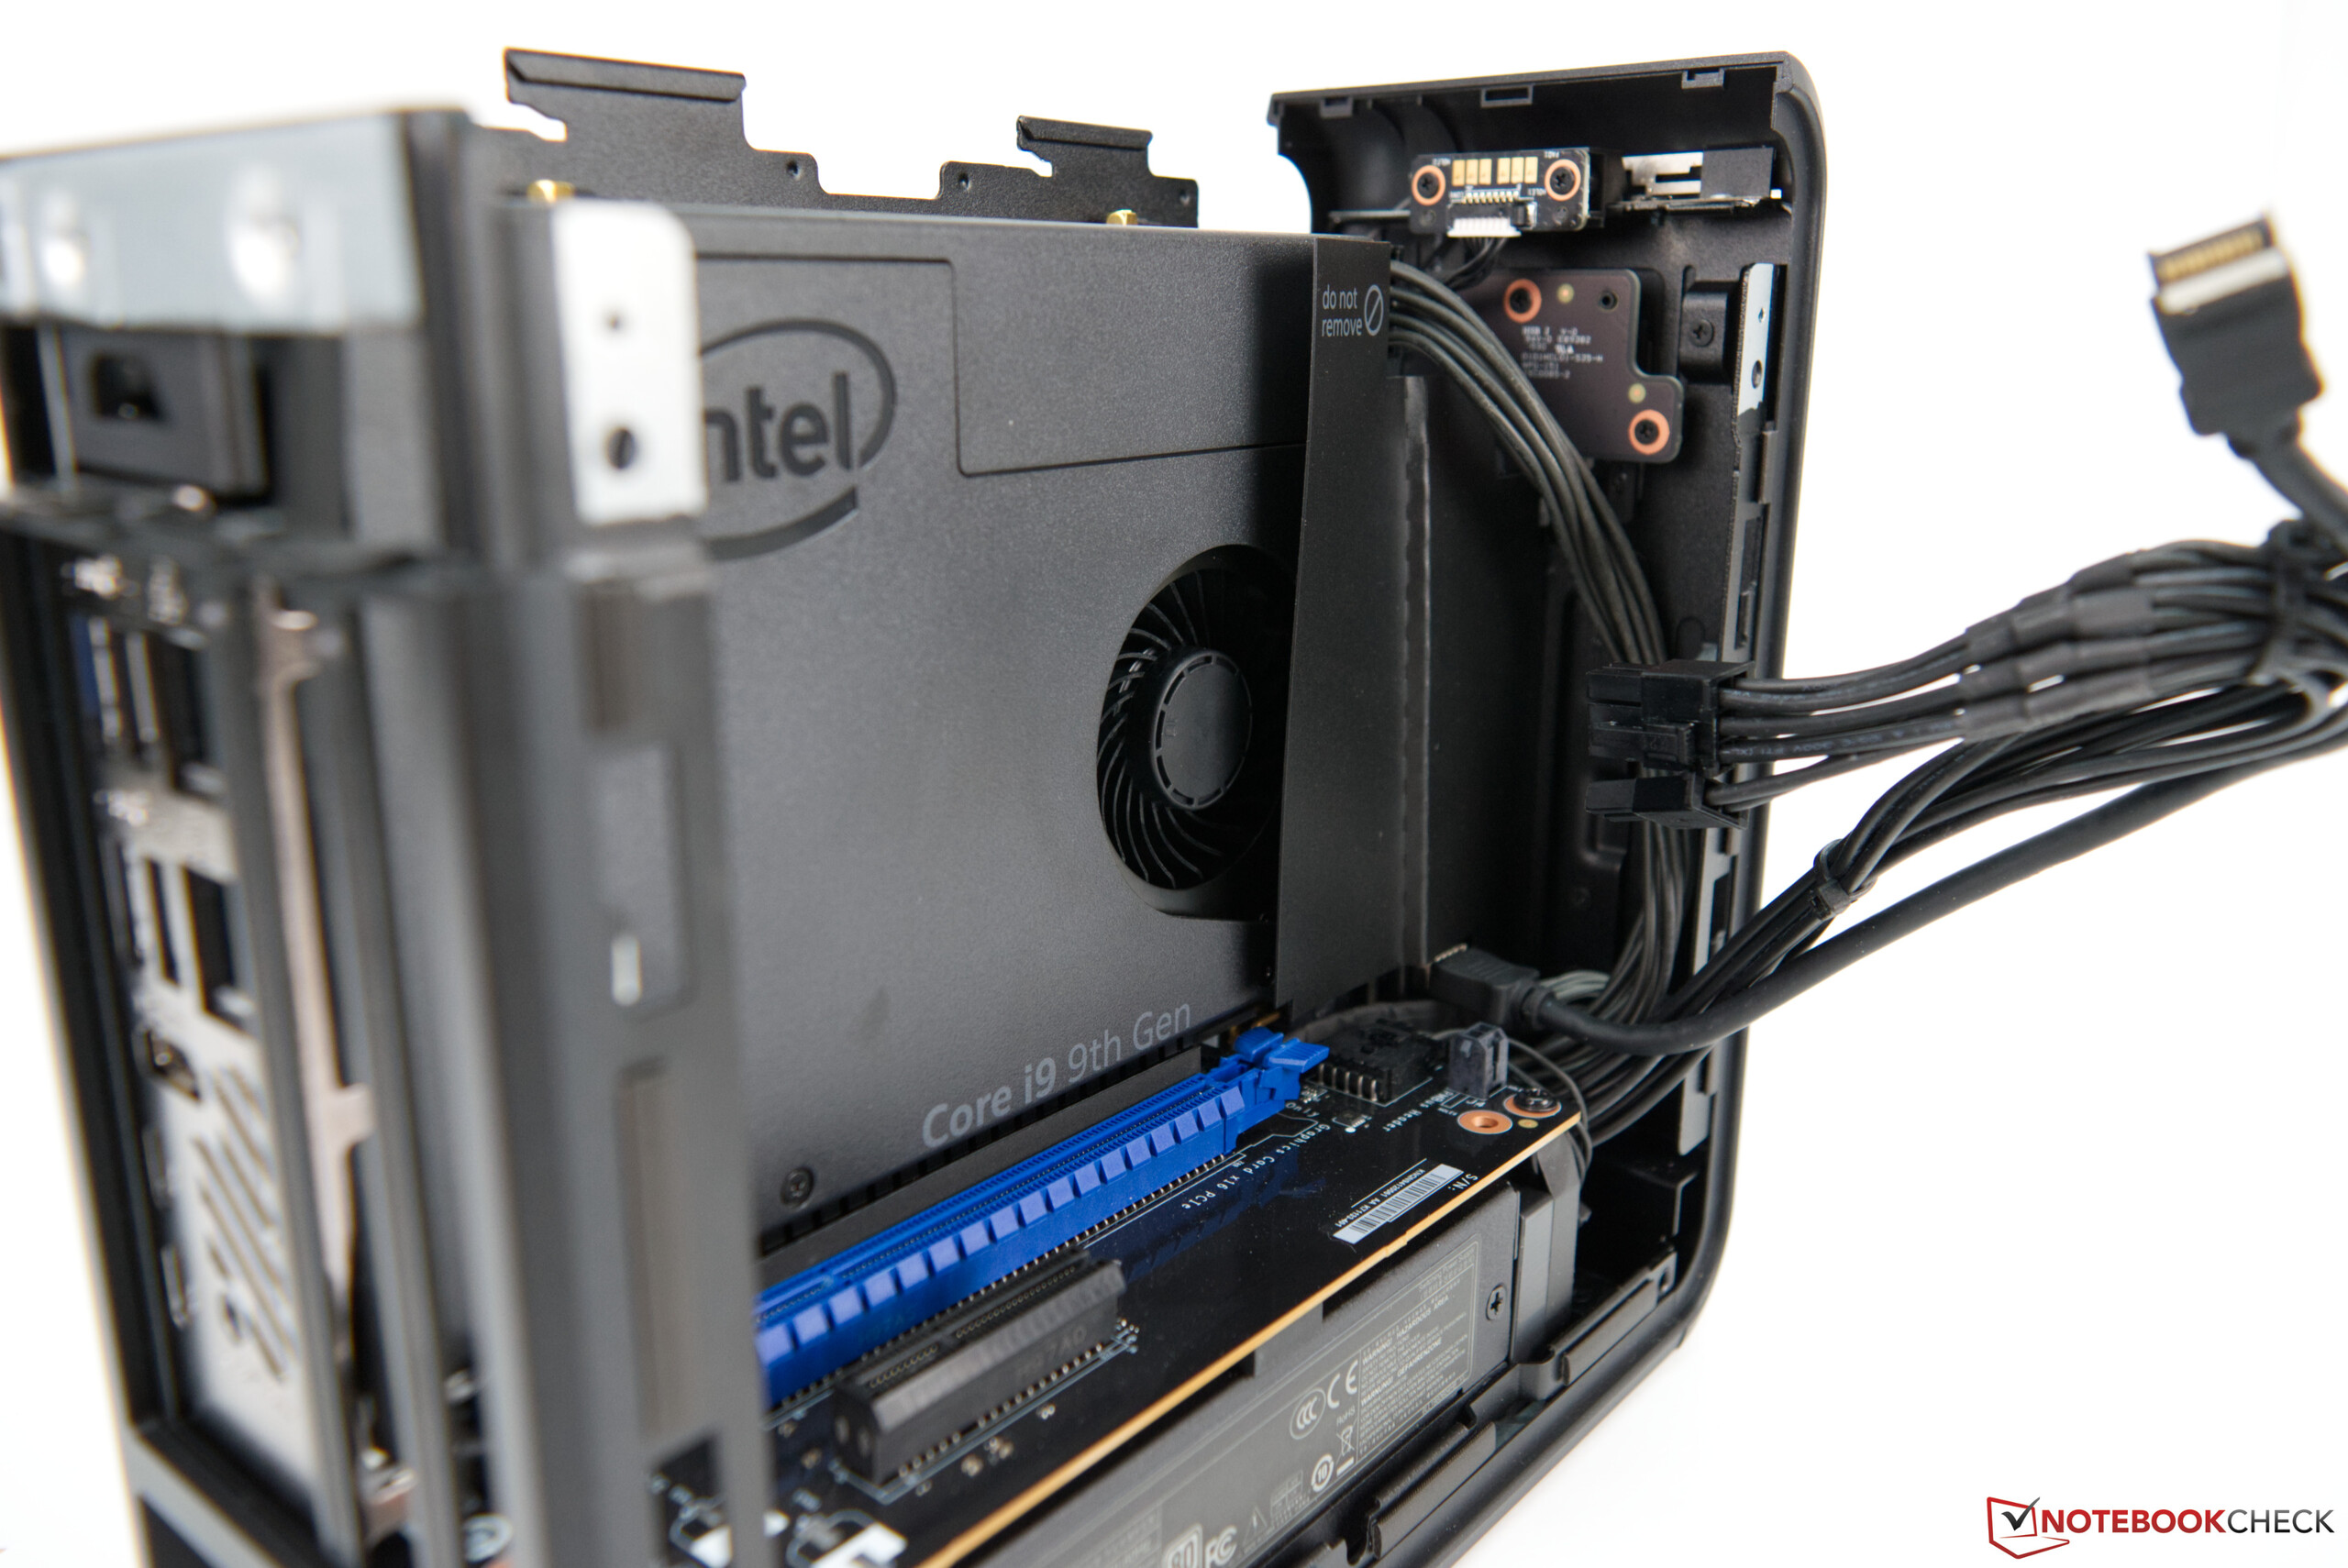
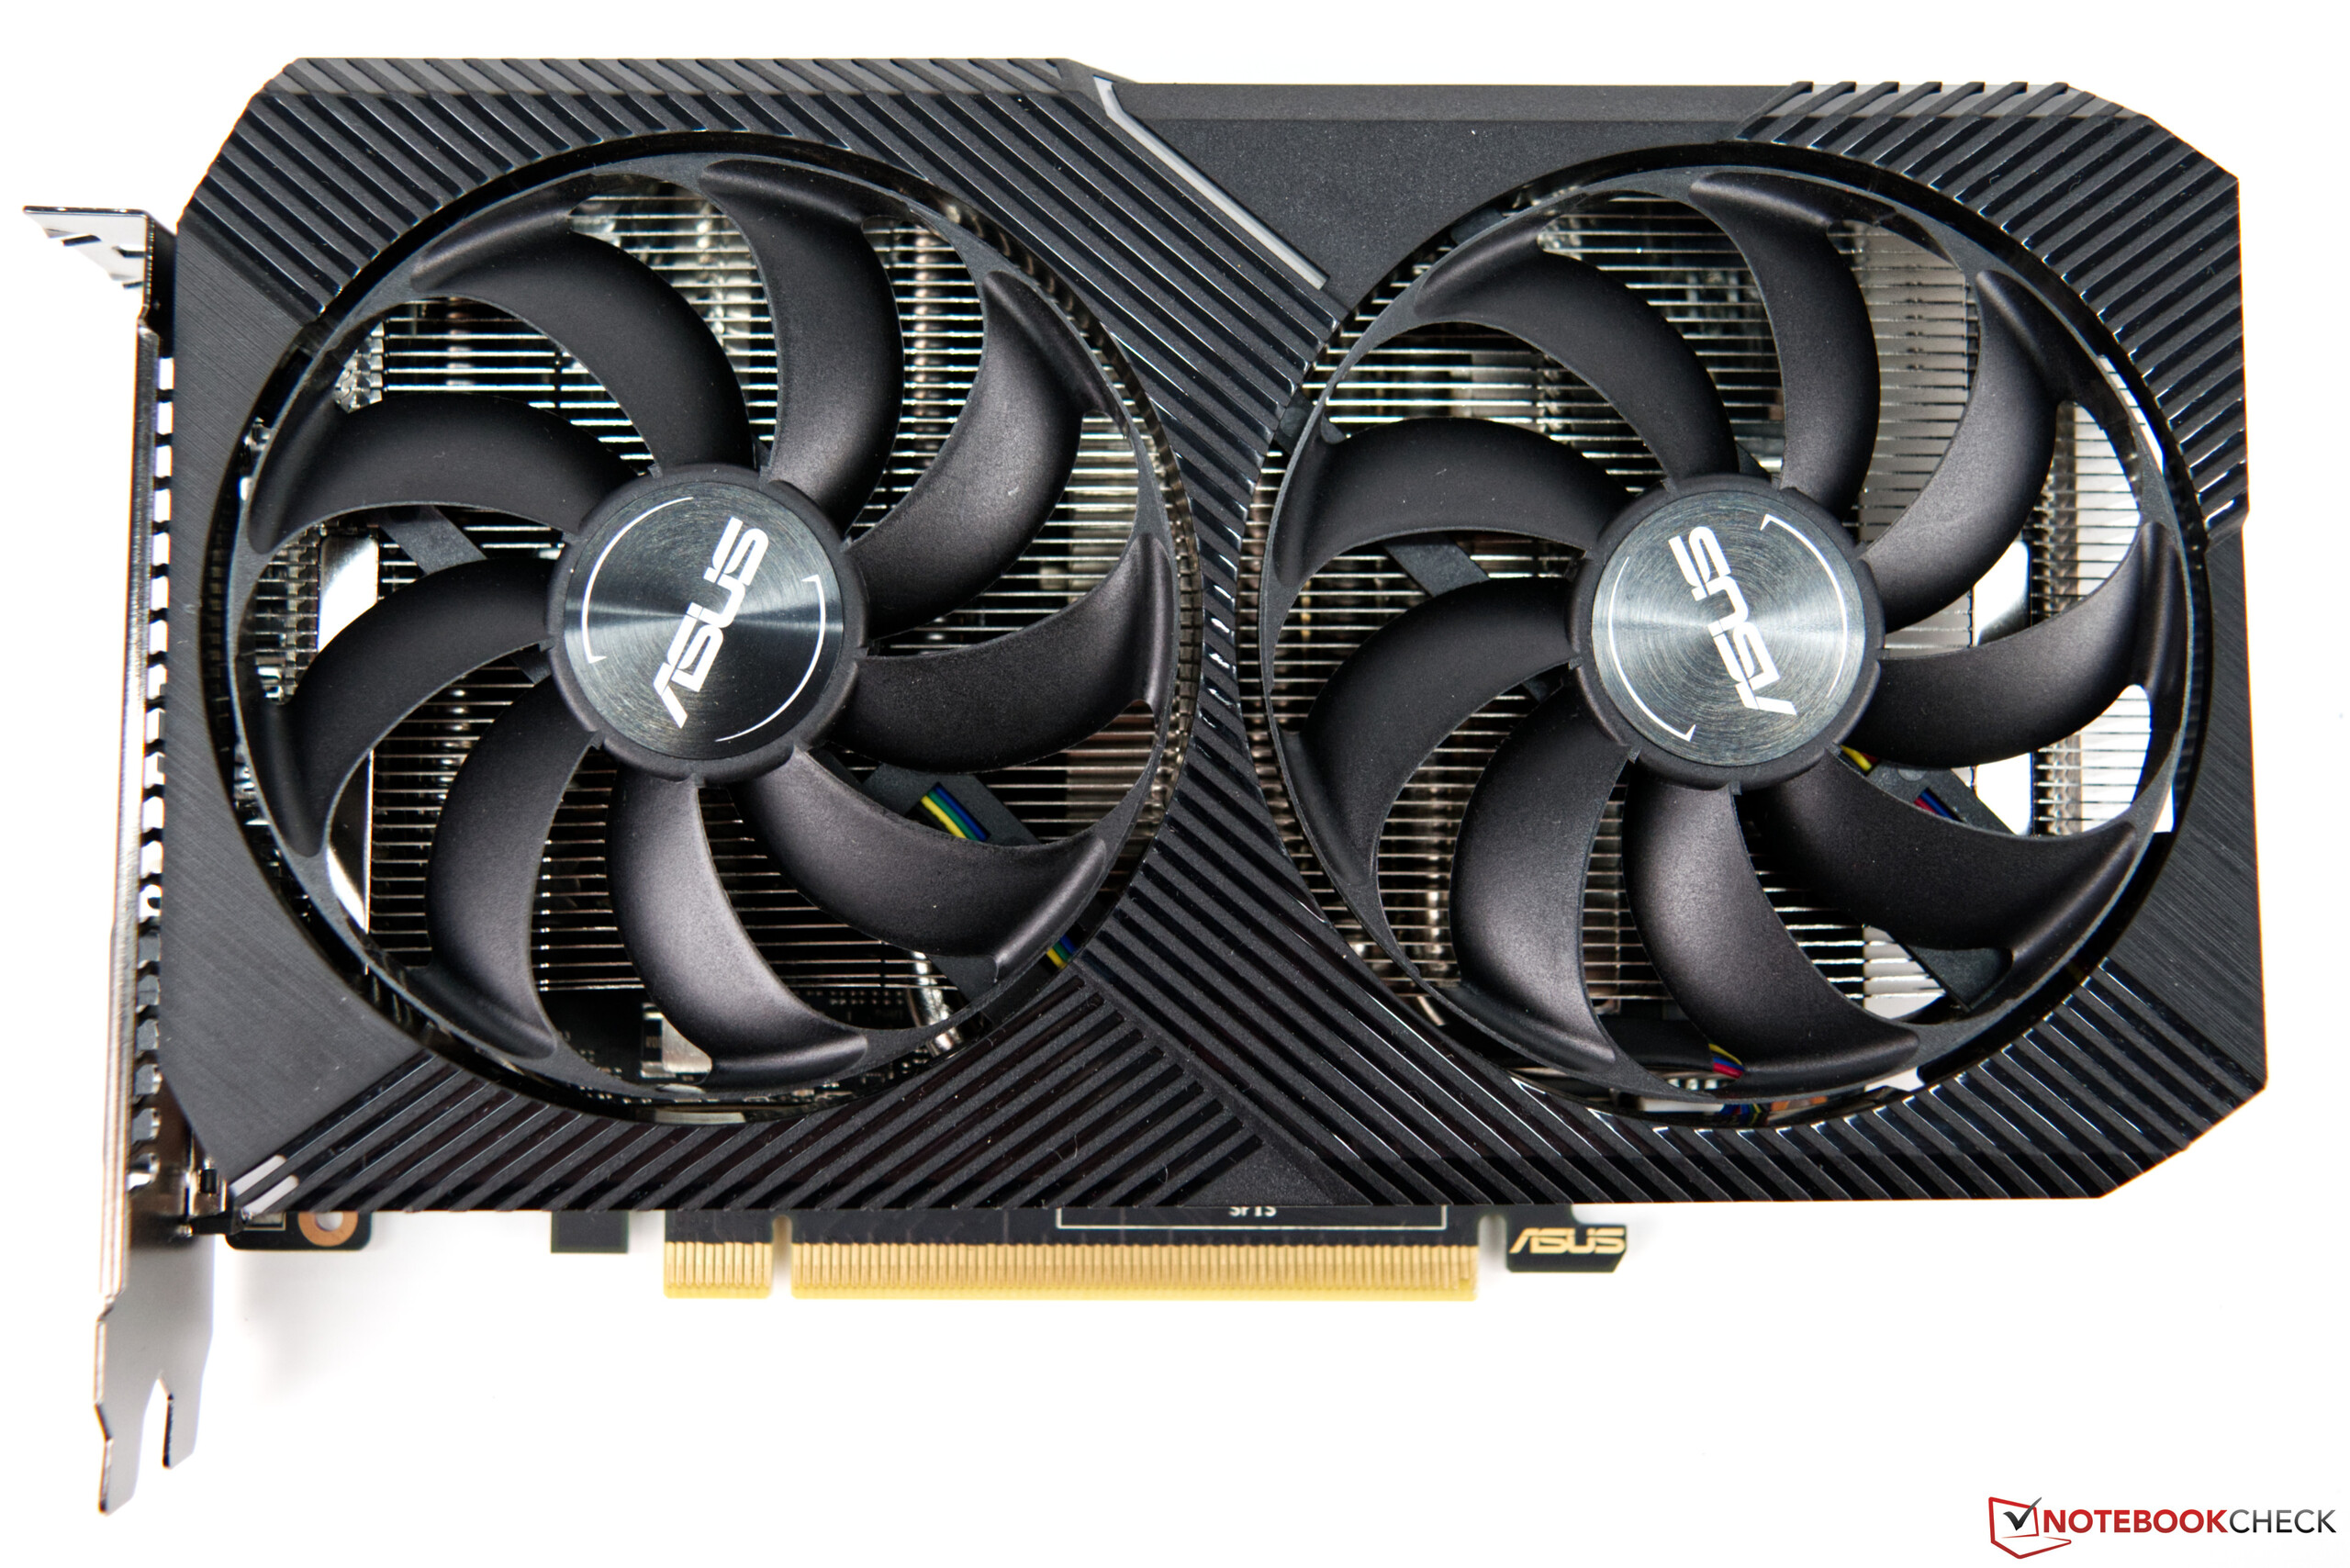
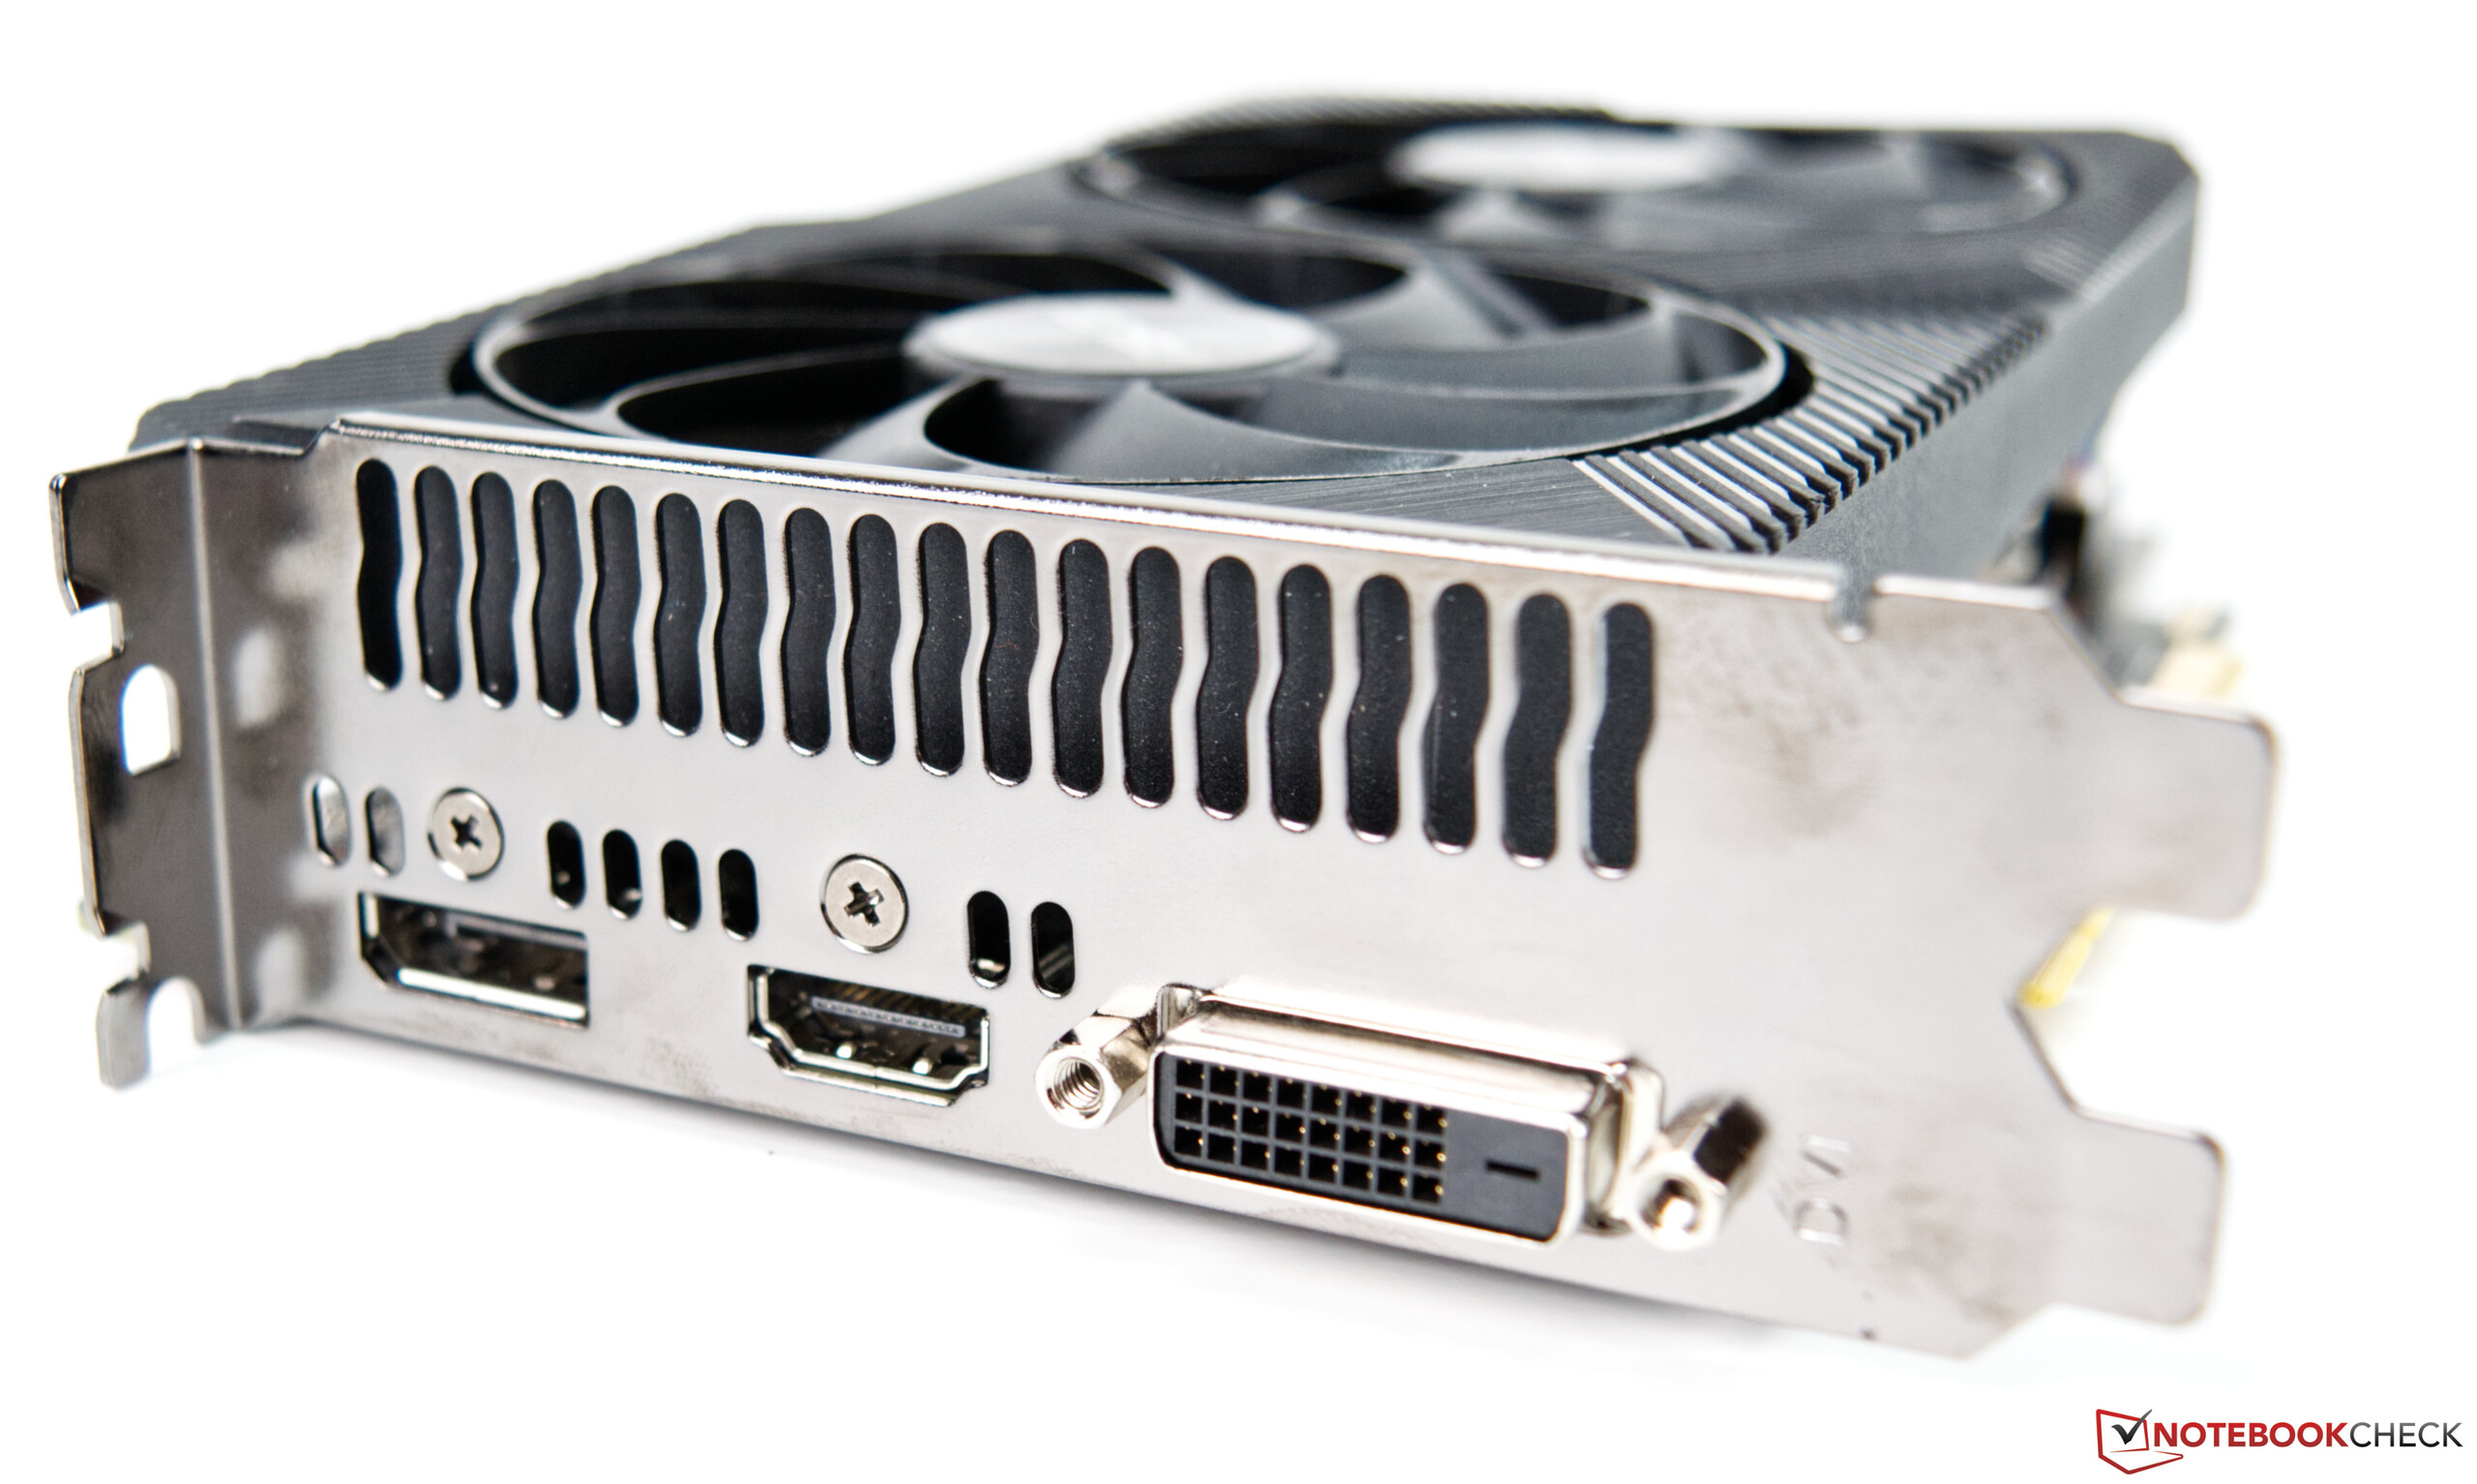
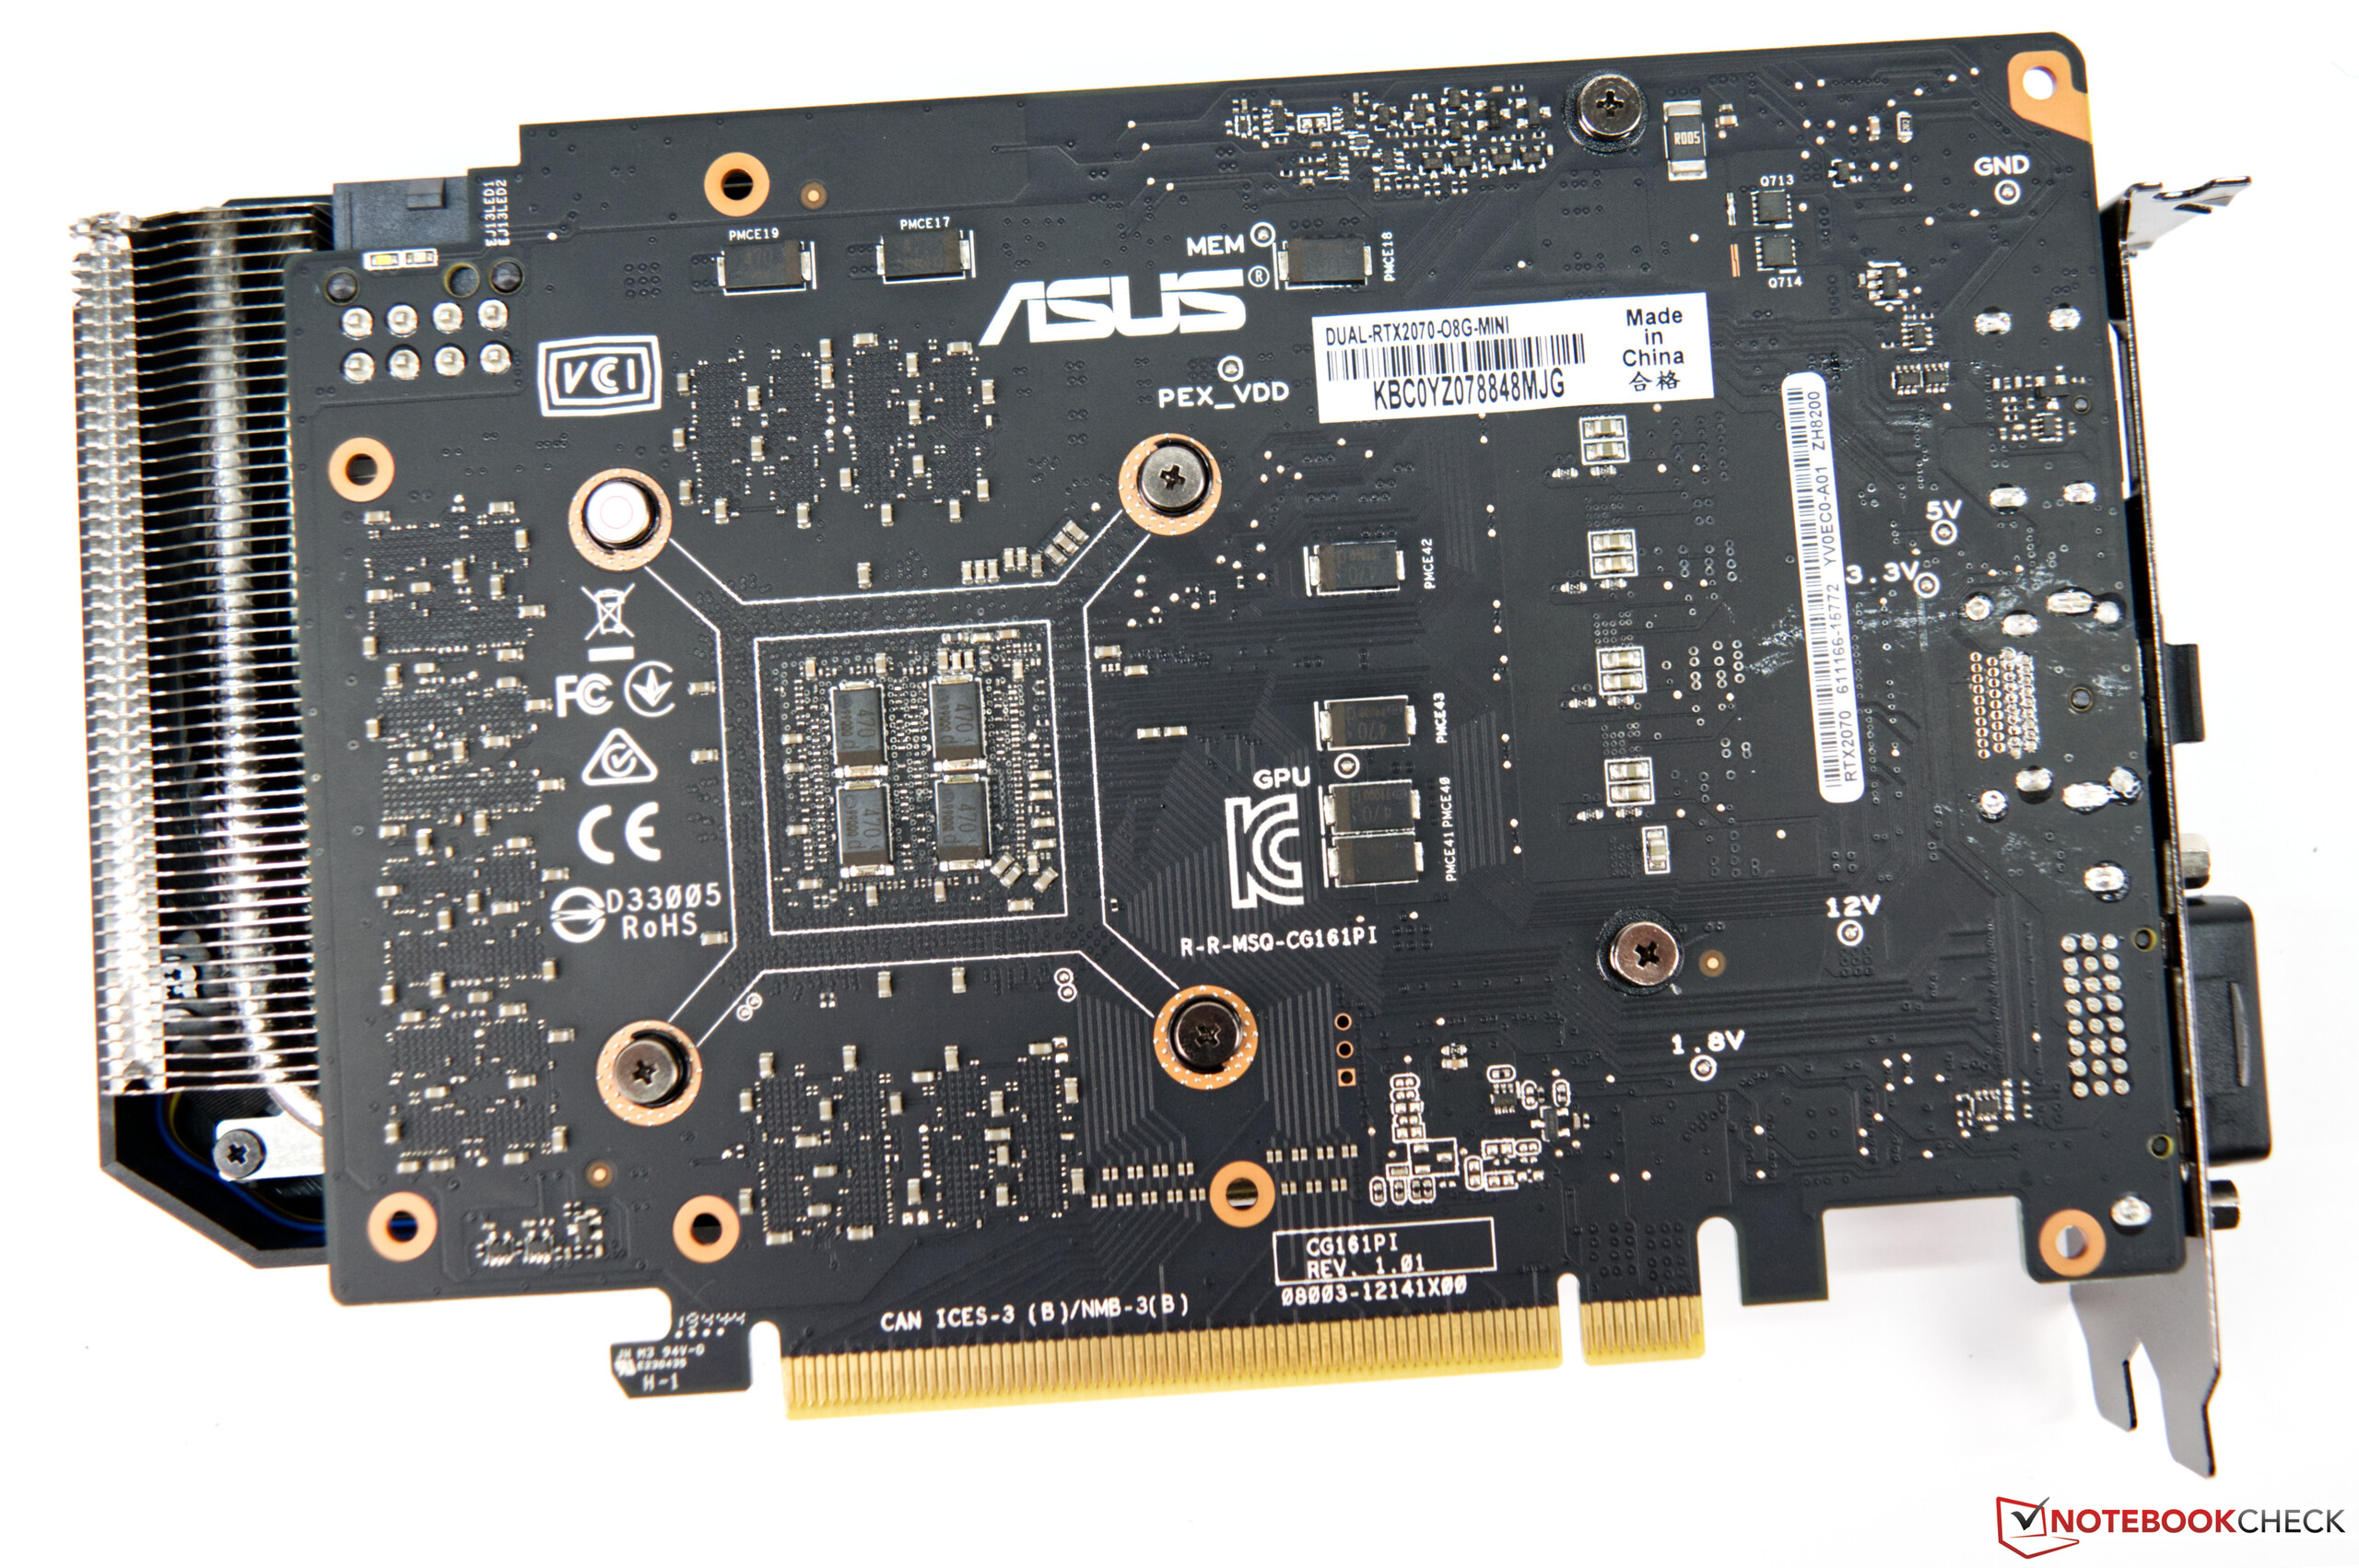
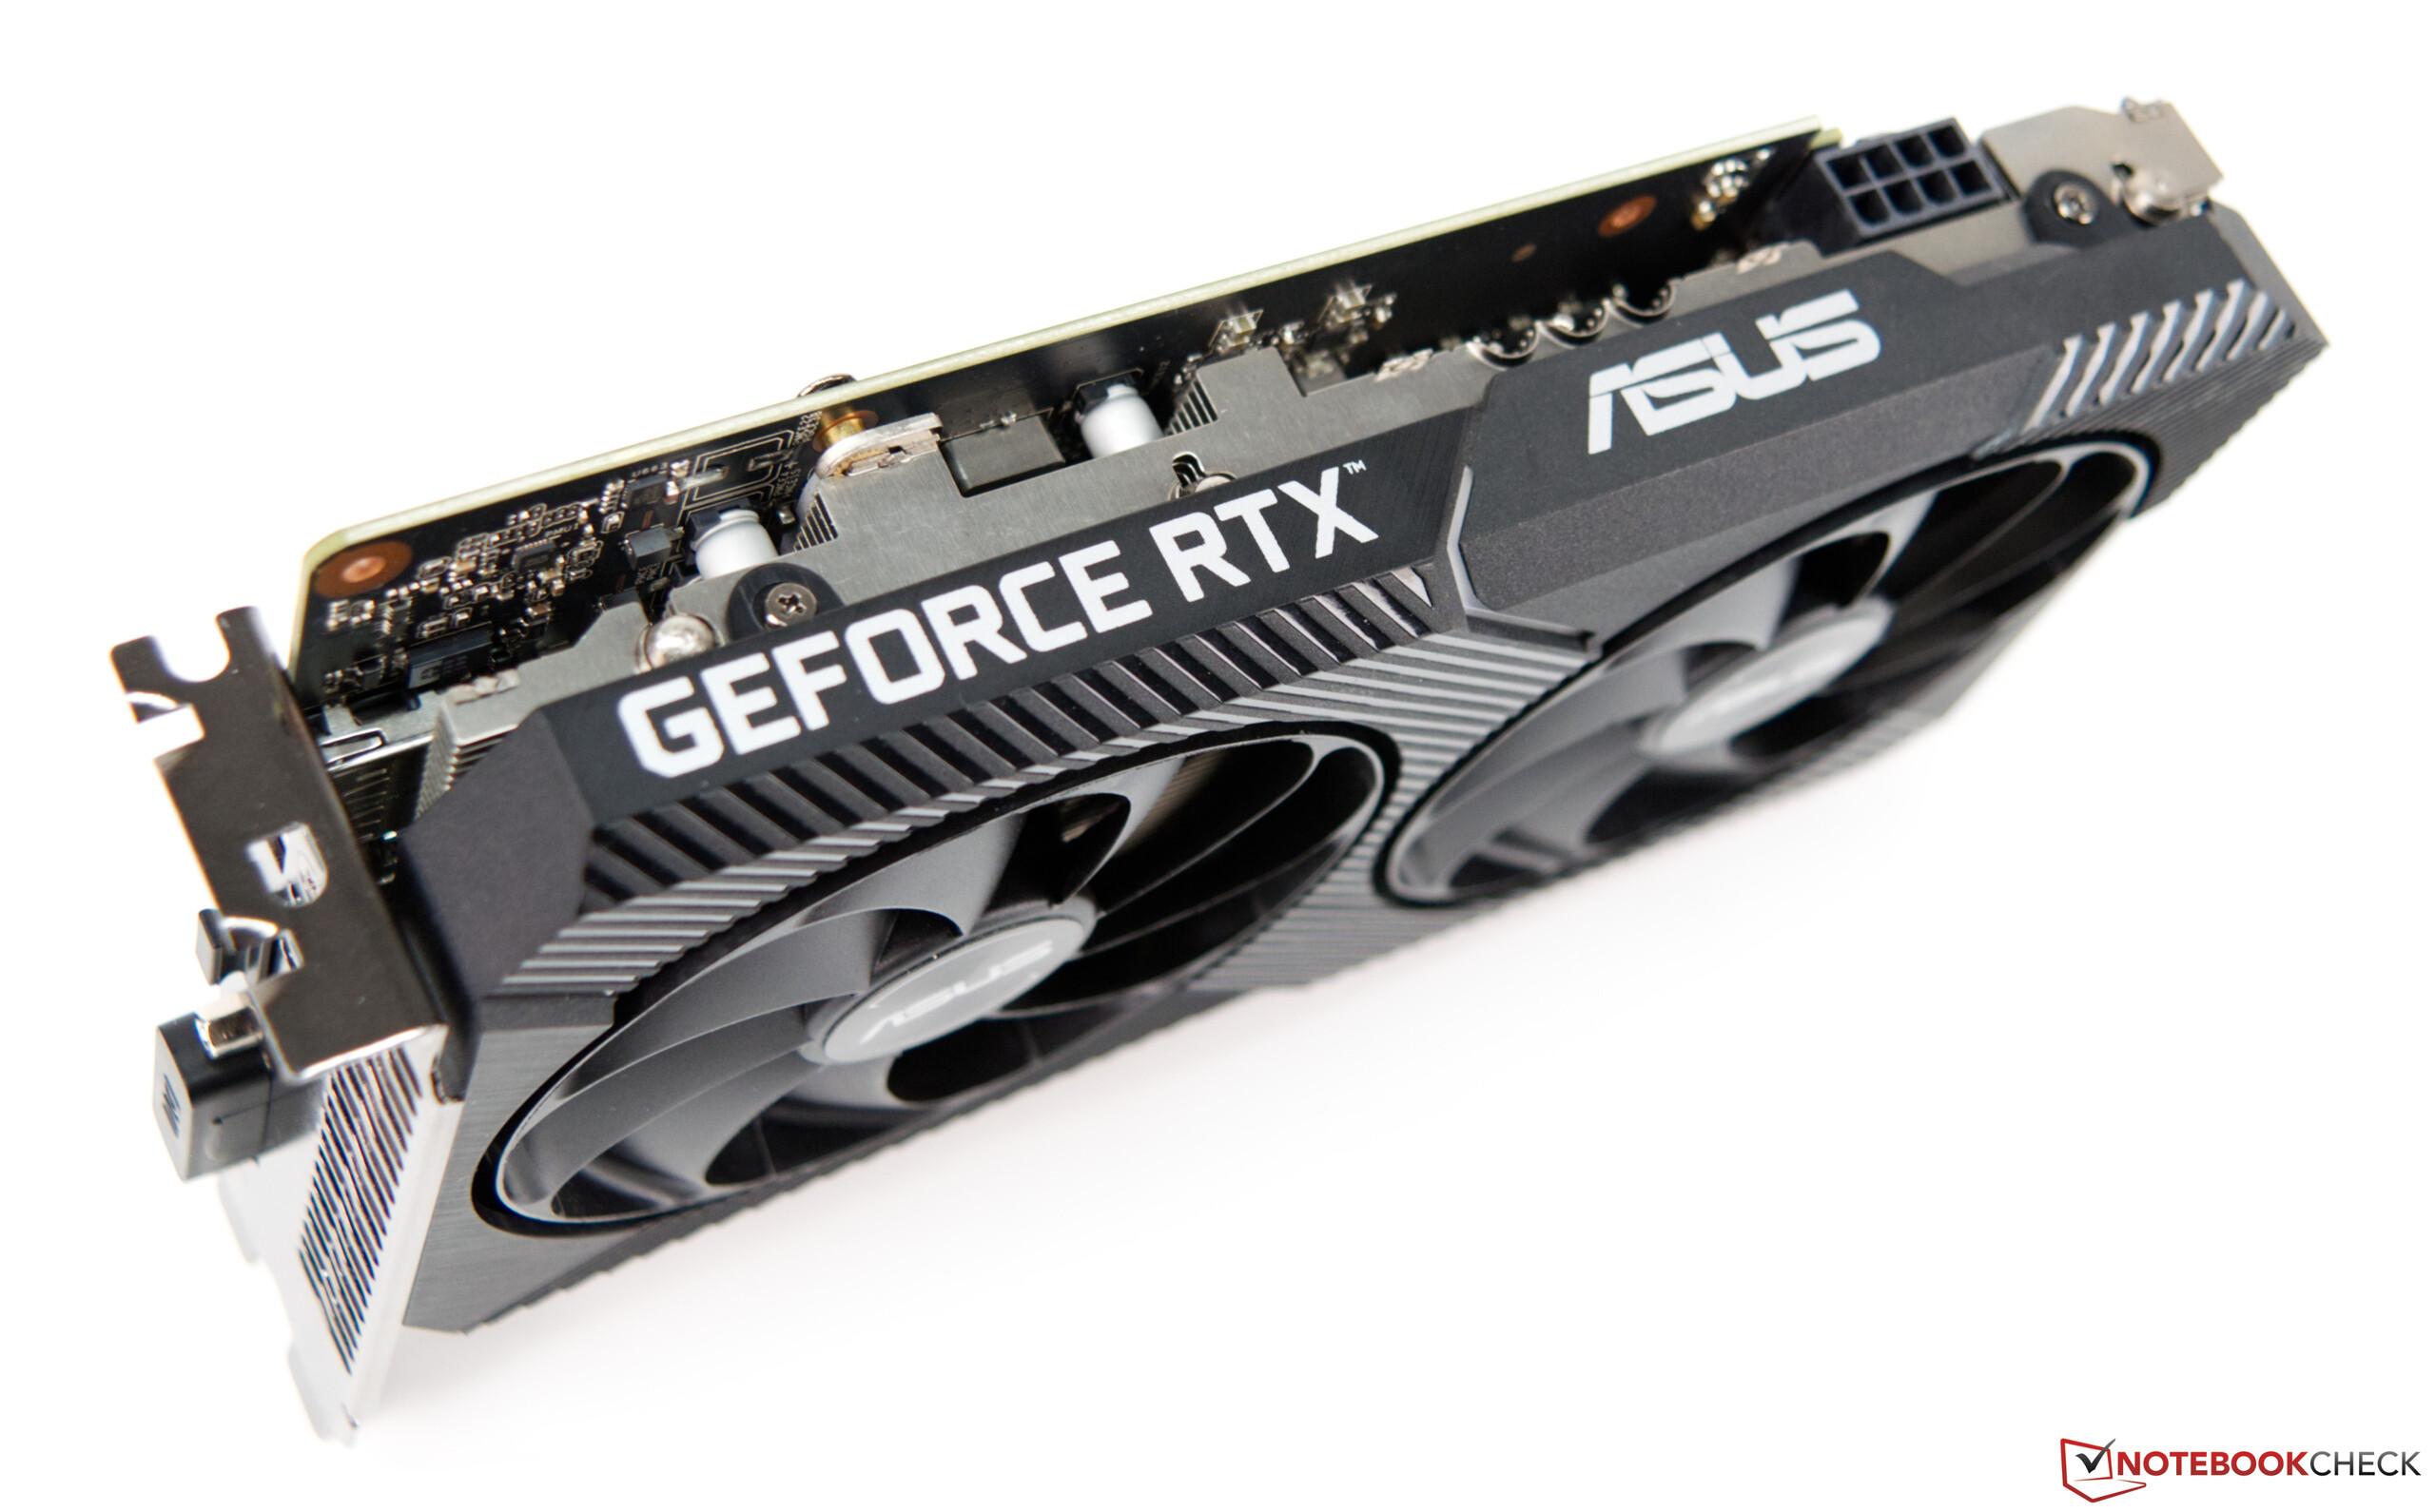
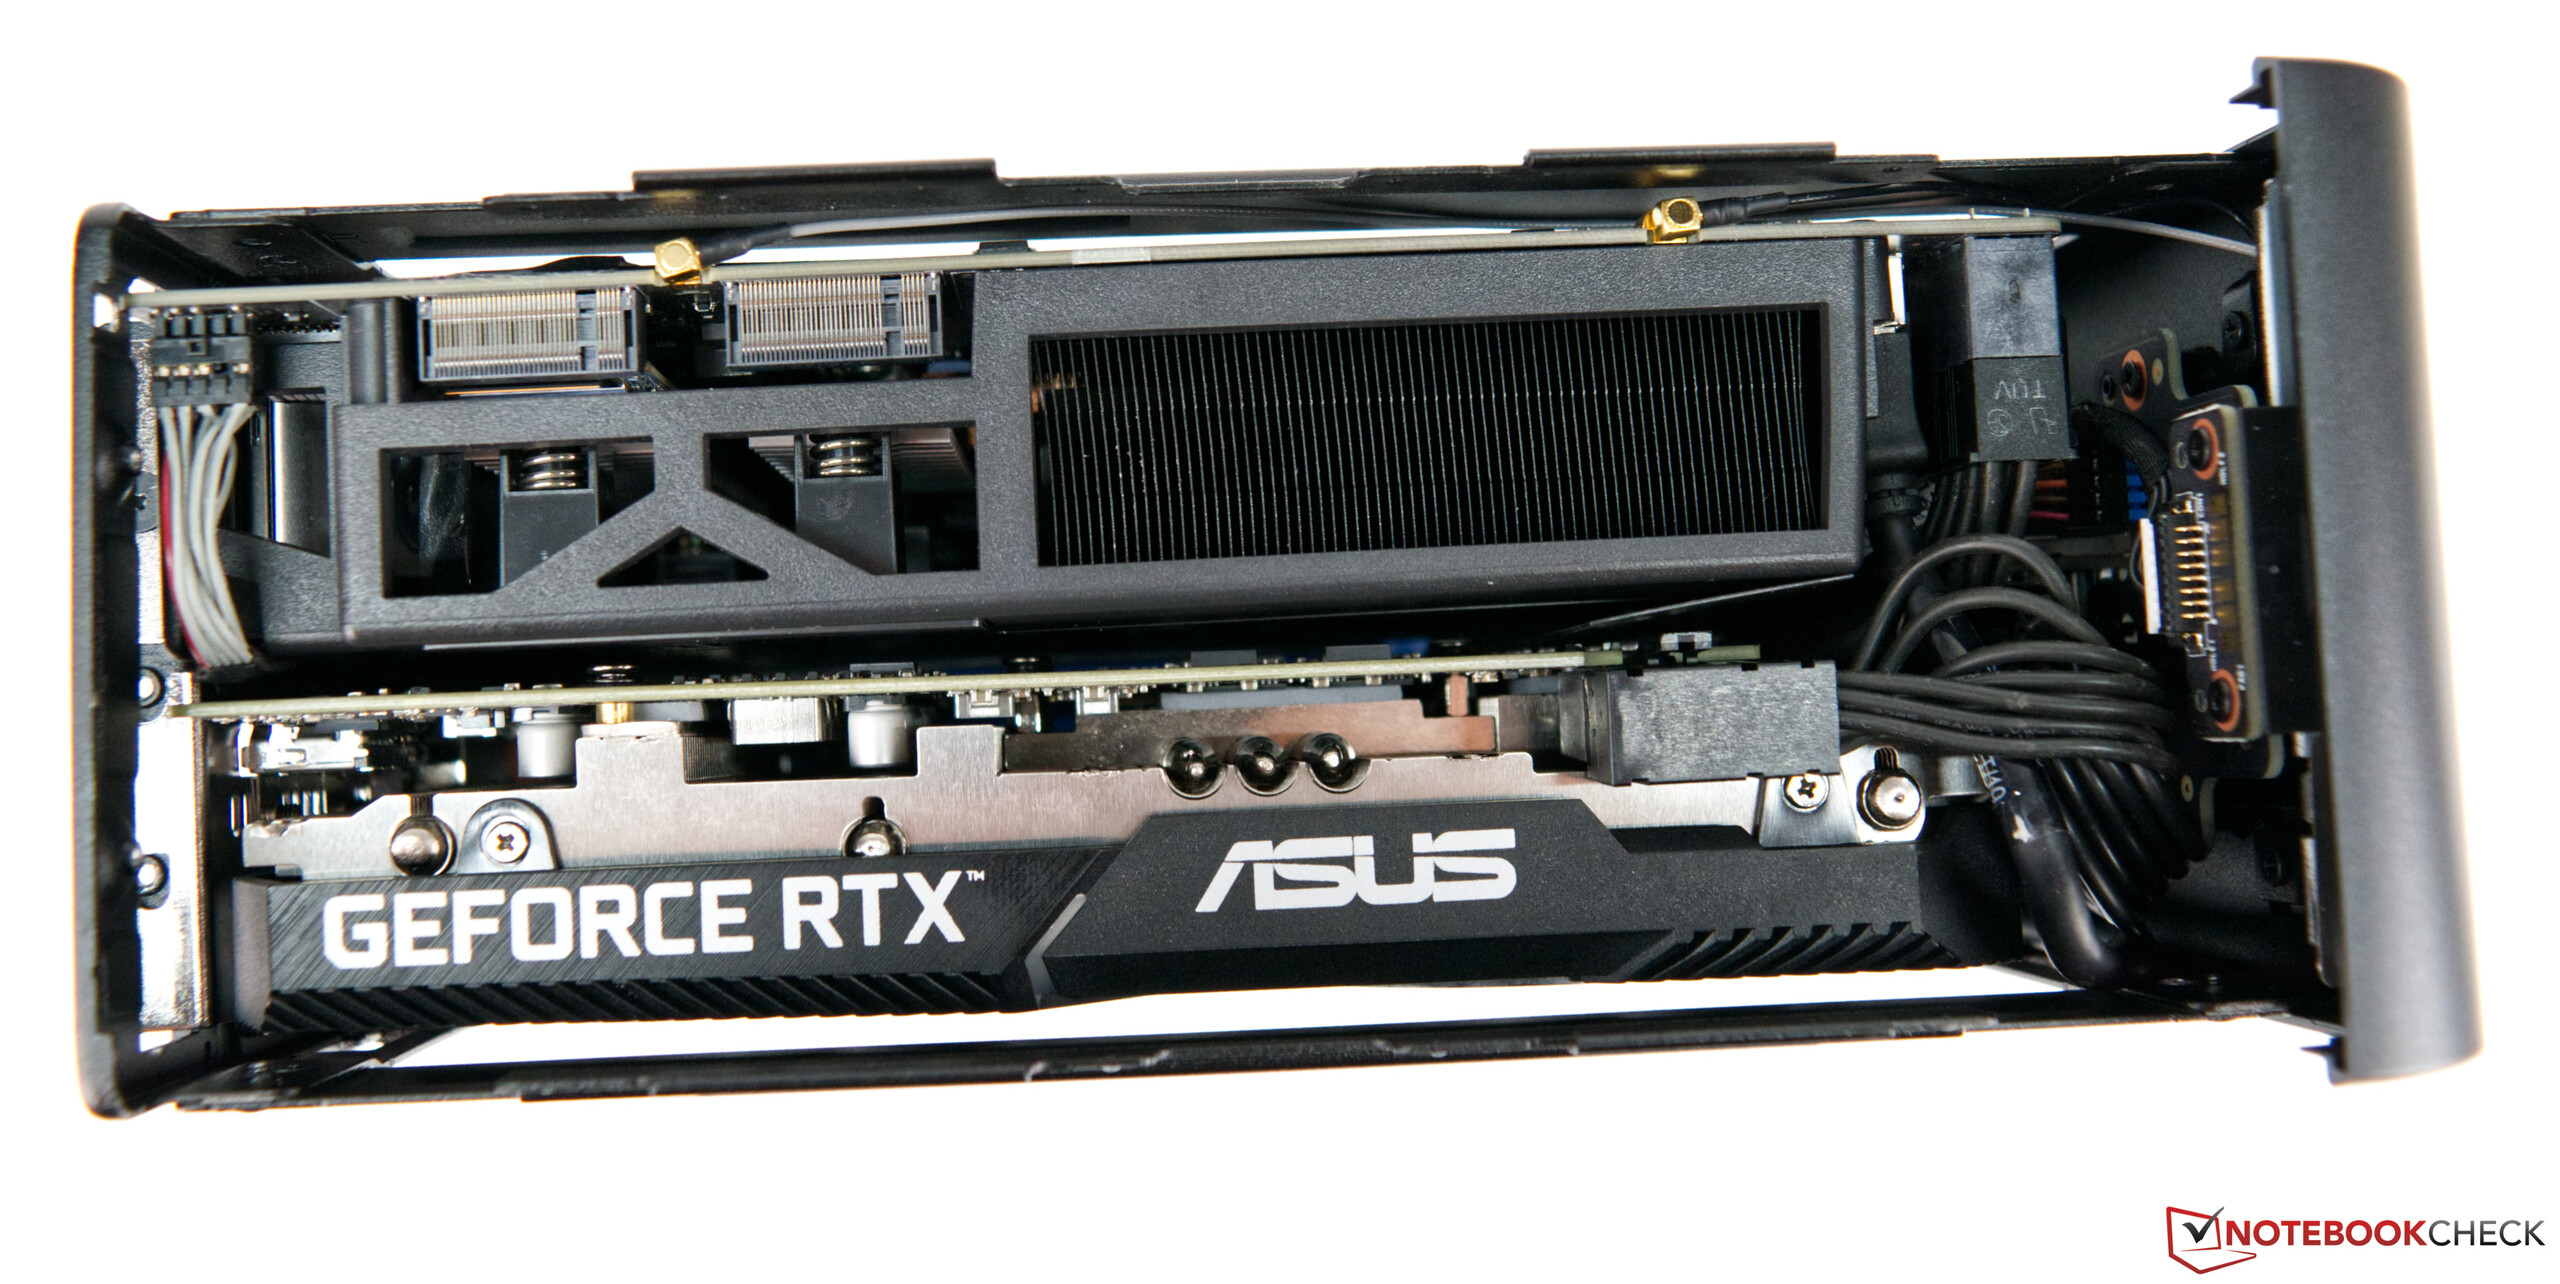
Intel NUC bilgisayarlar bir süredir piyasada ve bu minyatür bilgisayarlar küçük ofis bilgisayarları olarak kullanılıyor. Dikkat çeken bir örnek, AMD ile işbirliği içinde oluşturulan ve kompakt bir makine arayan oyuncuları hedefleyen Intel NUC Hades Kanyonu idi. Performanstan ödün vermeden 5 litreden (1,3 galon) daha küçük bir kasa sunduğu için tam olarak yeni Hayalet Kanyon arenaya giriyor. Tarafımızca incelenen modelde Intel Core i9-9980HK, 16 GB RAM ve 1,38 TB birleşik depolama kapasitesine sahip iki SSD bulunuyor. 3D hızlandırma bir Nvidia GeForce RTX 2070 tarafından sağlanır. Bu kombinasyon, mevcut oyunları bile sorunsuz ve sorunsuz bir şekilde çalıştırmak için yeterince güçlü olmalıdır.Bu cihazı satın almayı düşünüyorsanız, RAM, depolama ve özel grafik kartının isteğe bağlıdır ve NUC'ye dahil değildir. Ne olursa olsun, Core i9-9980HK donanımlı SKU sizi yaklaşık 1.700 $ geri alacak. Alternatif olarak, Ghost Canyon NUC, yaklaşık 1,000 $ için bir Intel Core i5-9300H veya yaklaşık 1,300 $ için bir Intel Core i7-9750H ile donatılabilir. Her durumda RAM ve en az bir depolama aygıtı eklemeniz gerekir. Hesaplama öğesinin kendisi de ayrılacak kadar karmaşık değildir.Ayrıca, özel bir grafik kartı eklemek isterseniz, boyuta özel dikkat etmeniz gerekir. İnceleme birimimiz, Asus tarafından üretilen minyatür bir GeForce RTX 2070 ile donatılmıştır. Intel bir Ghost Canyon NUC uyumluluk listesi tutar.
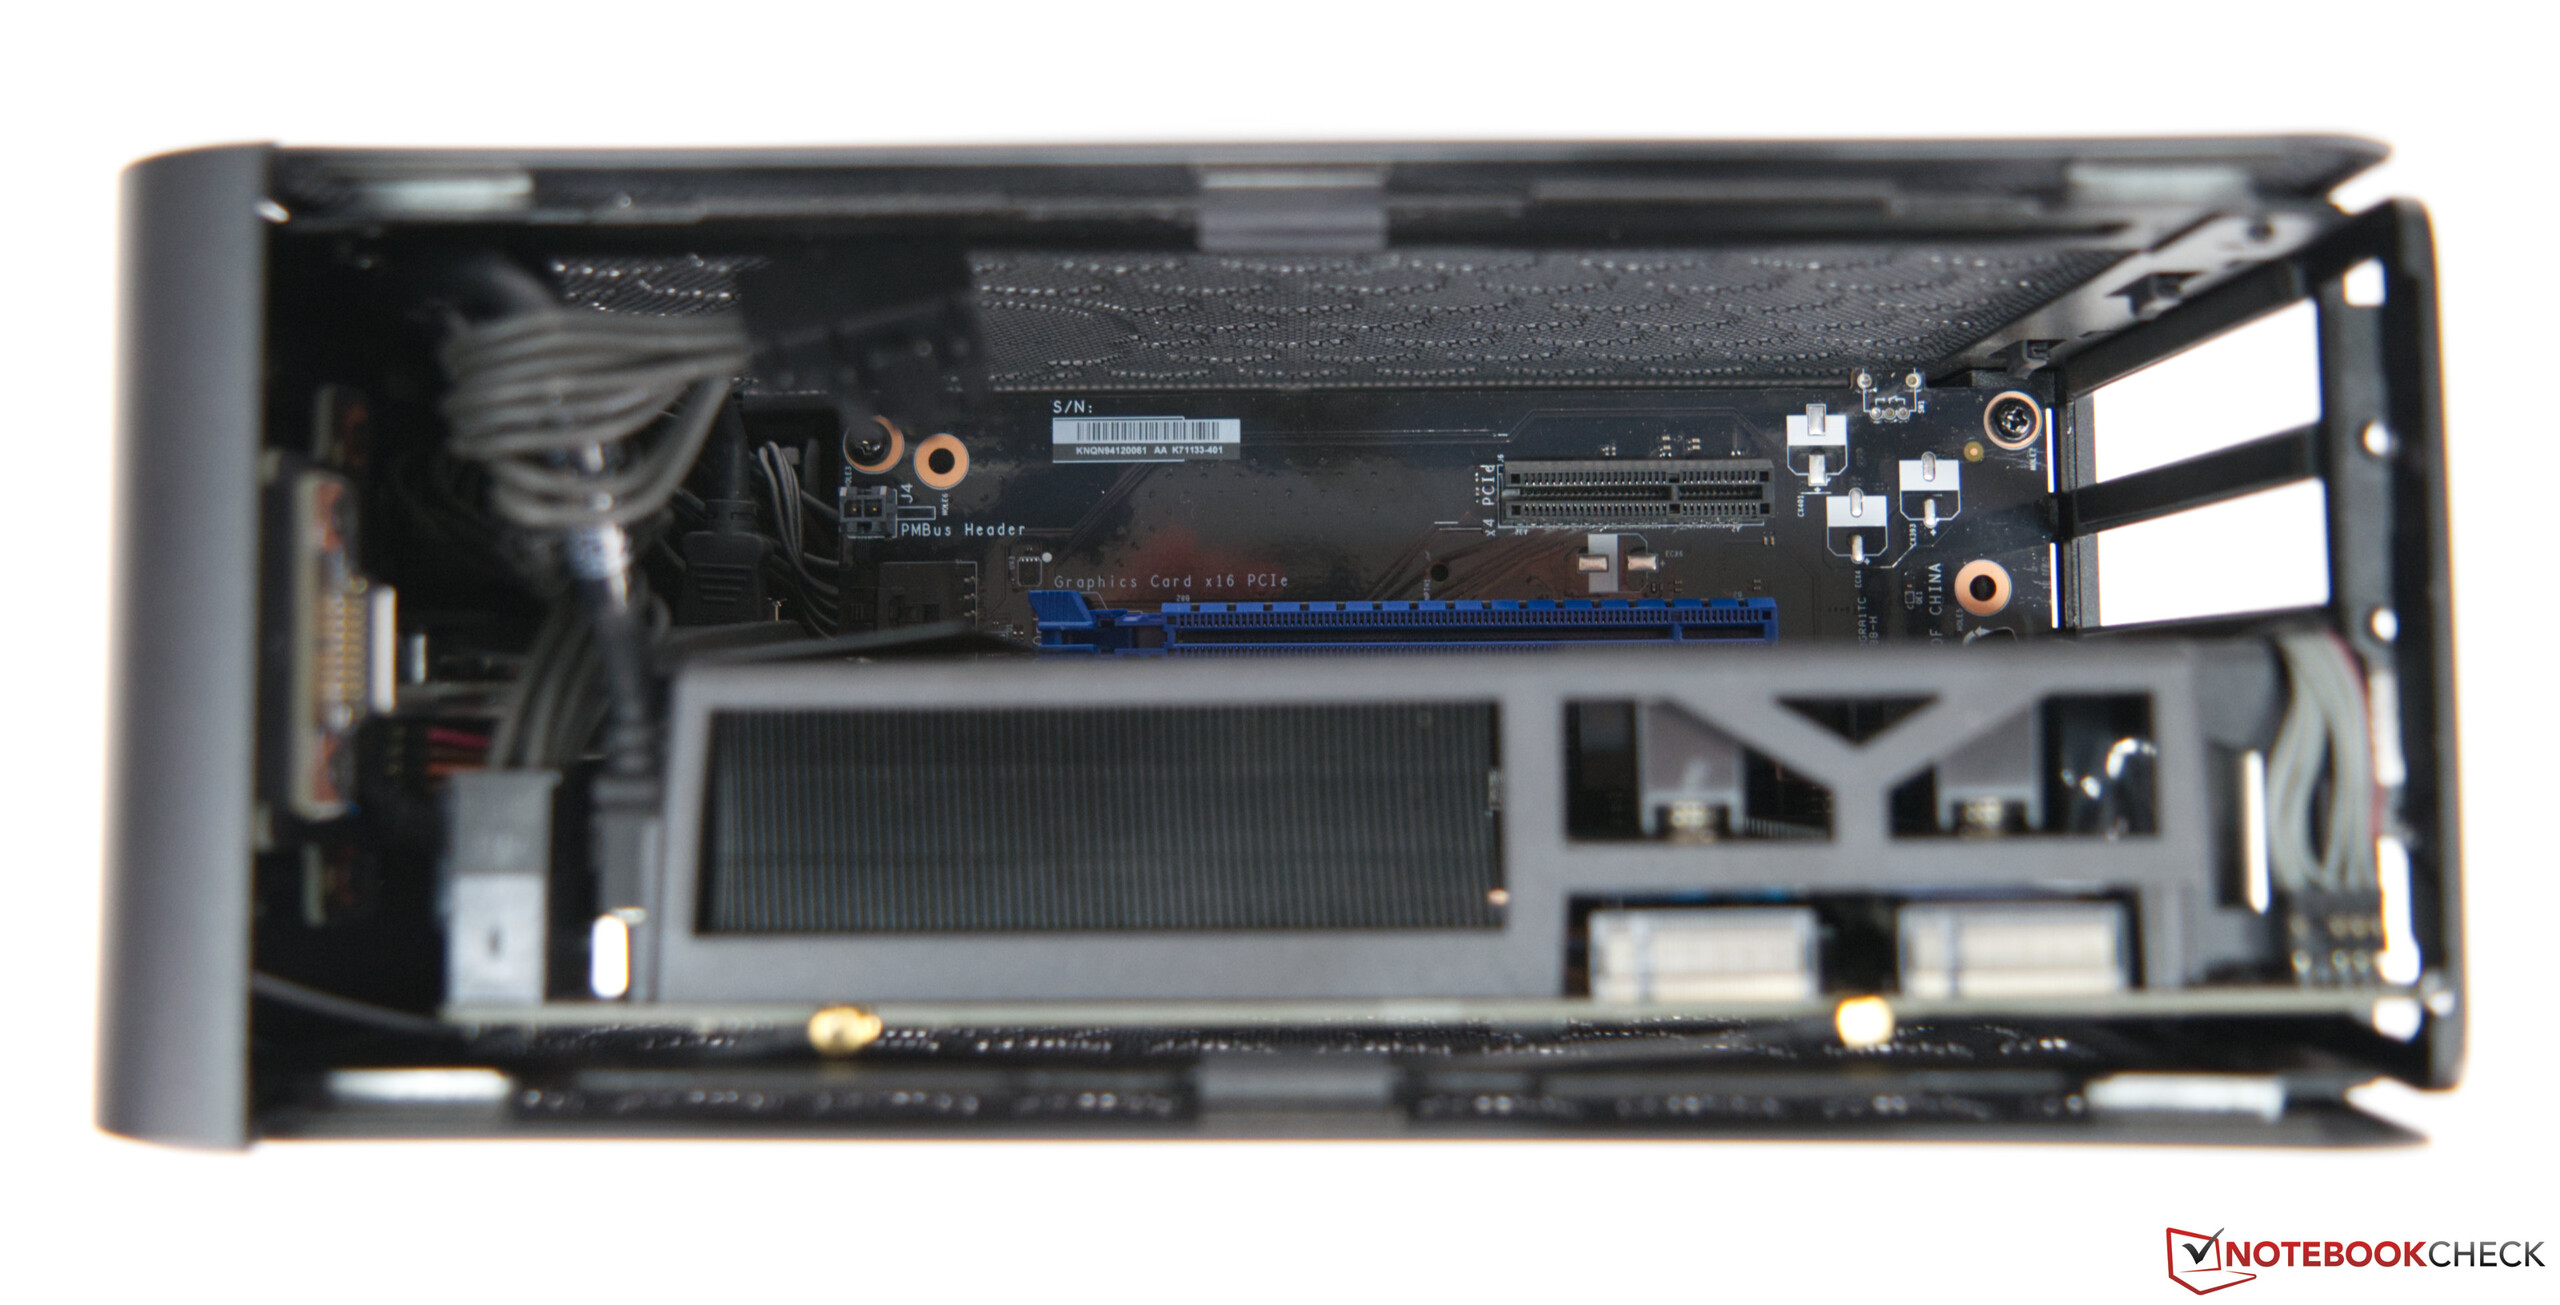
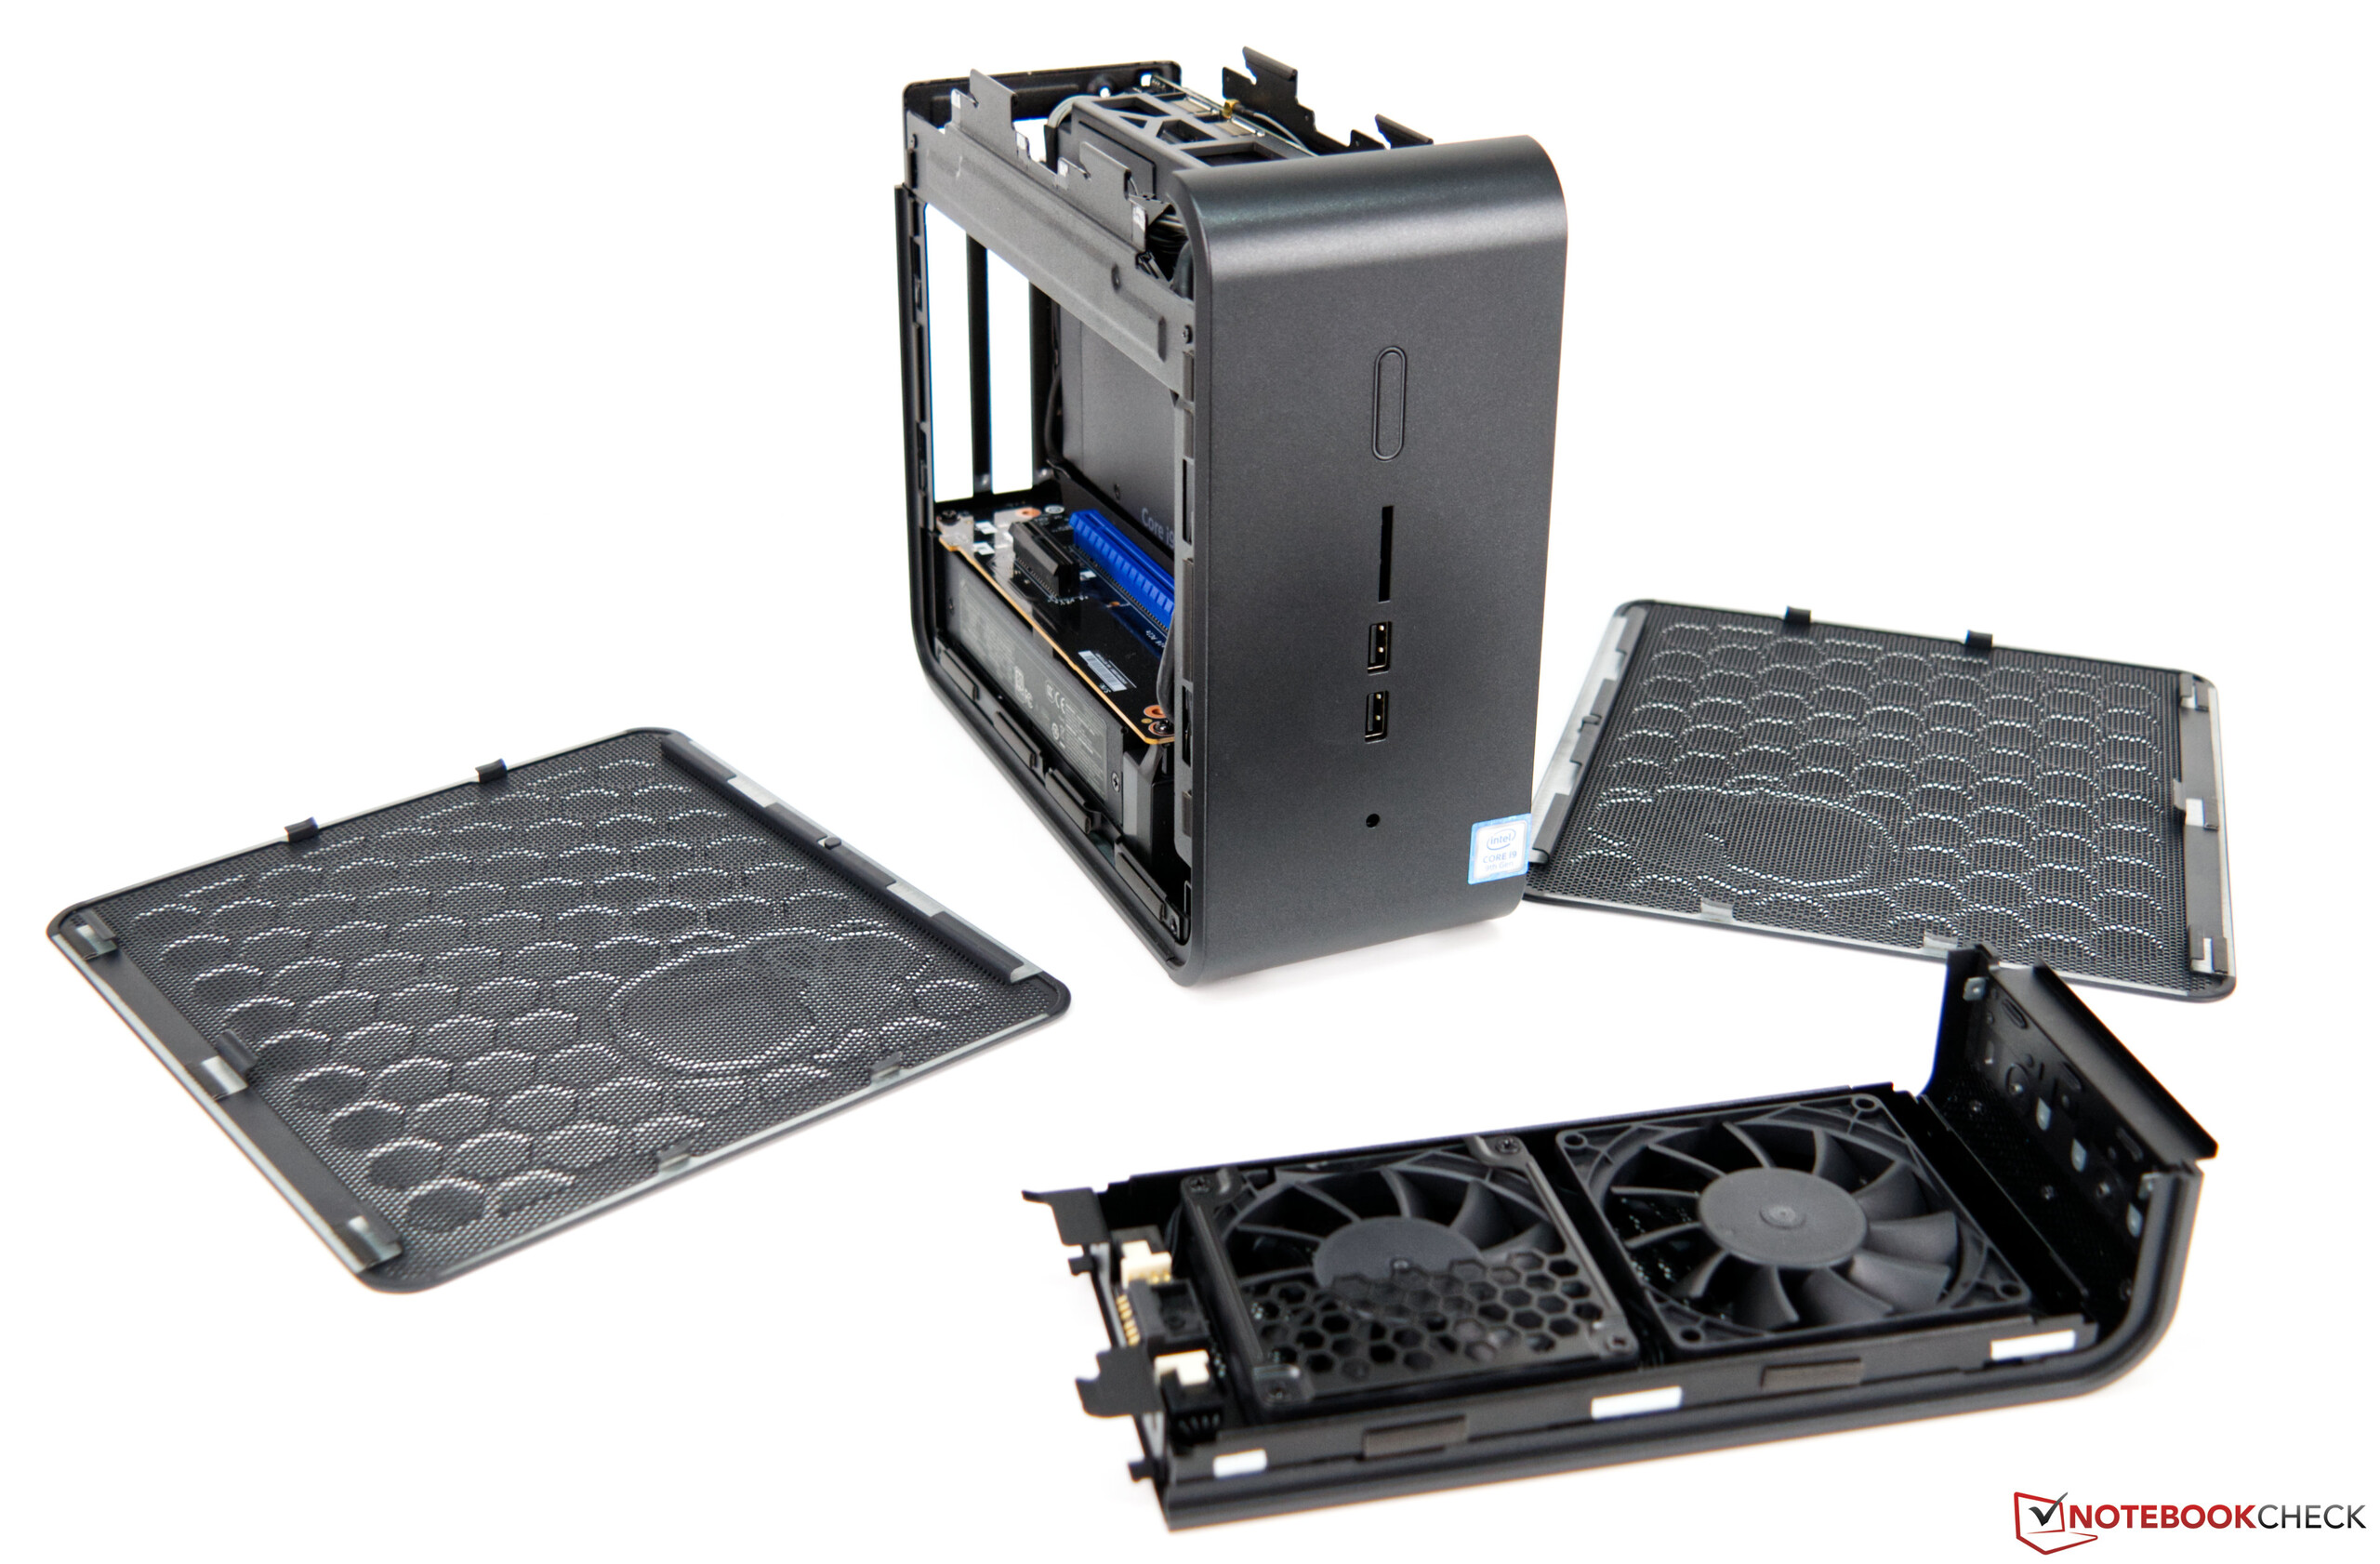

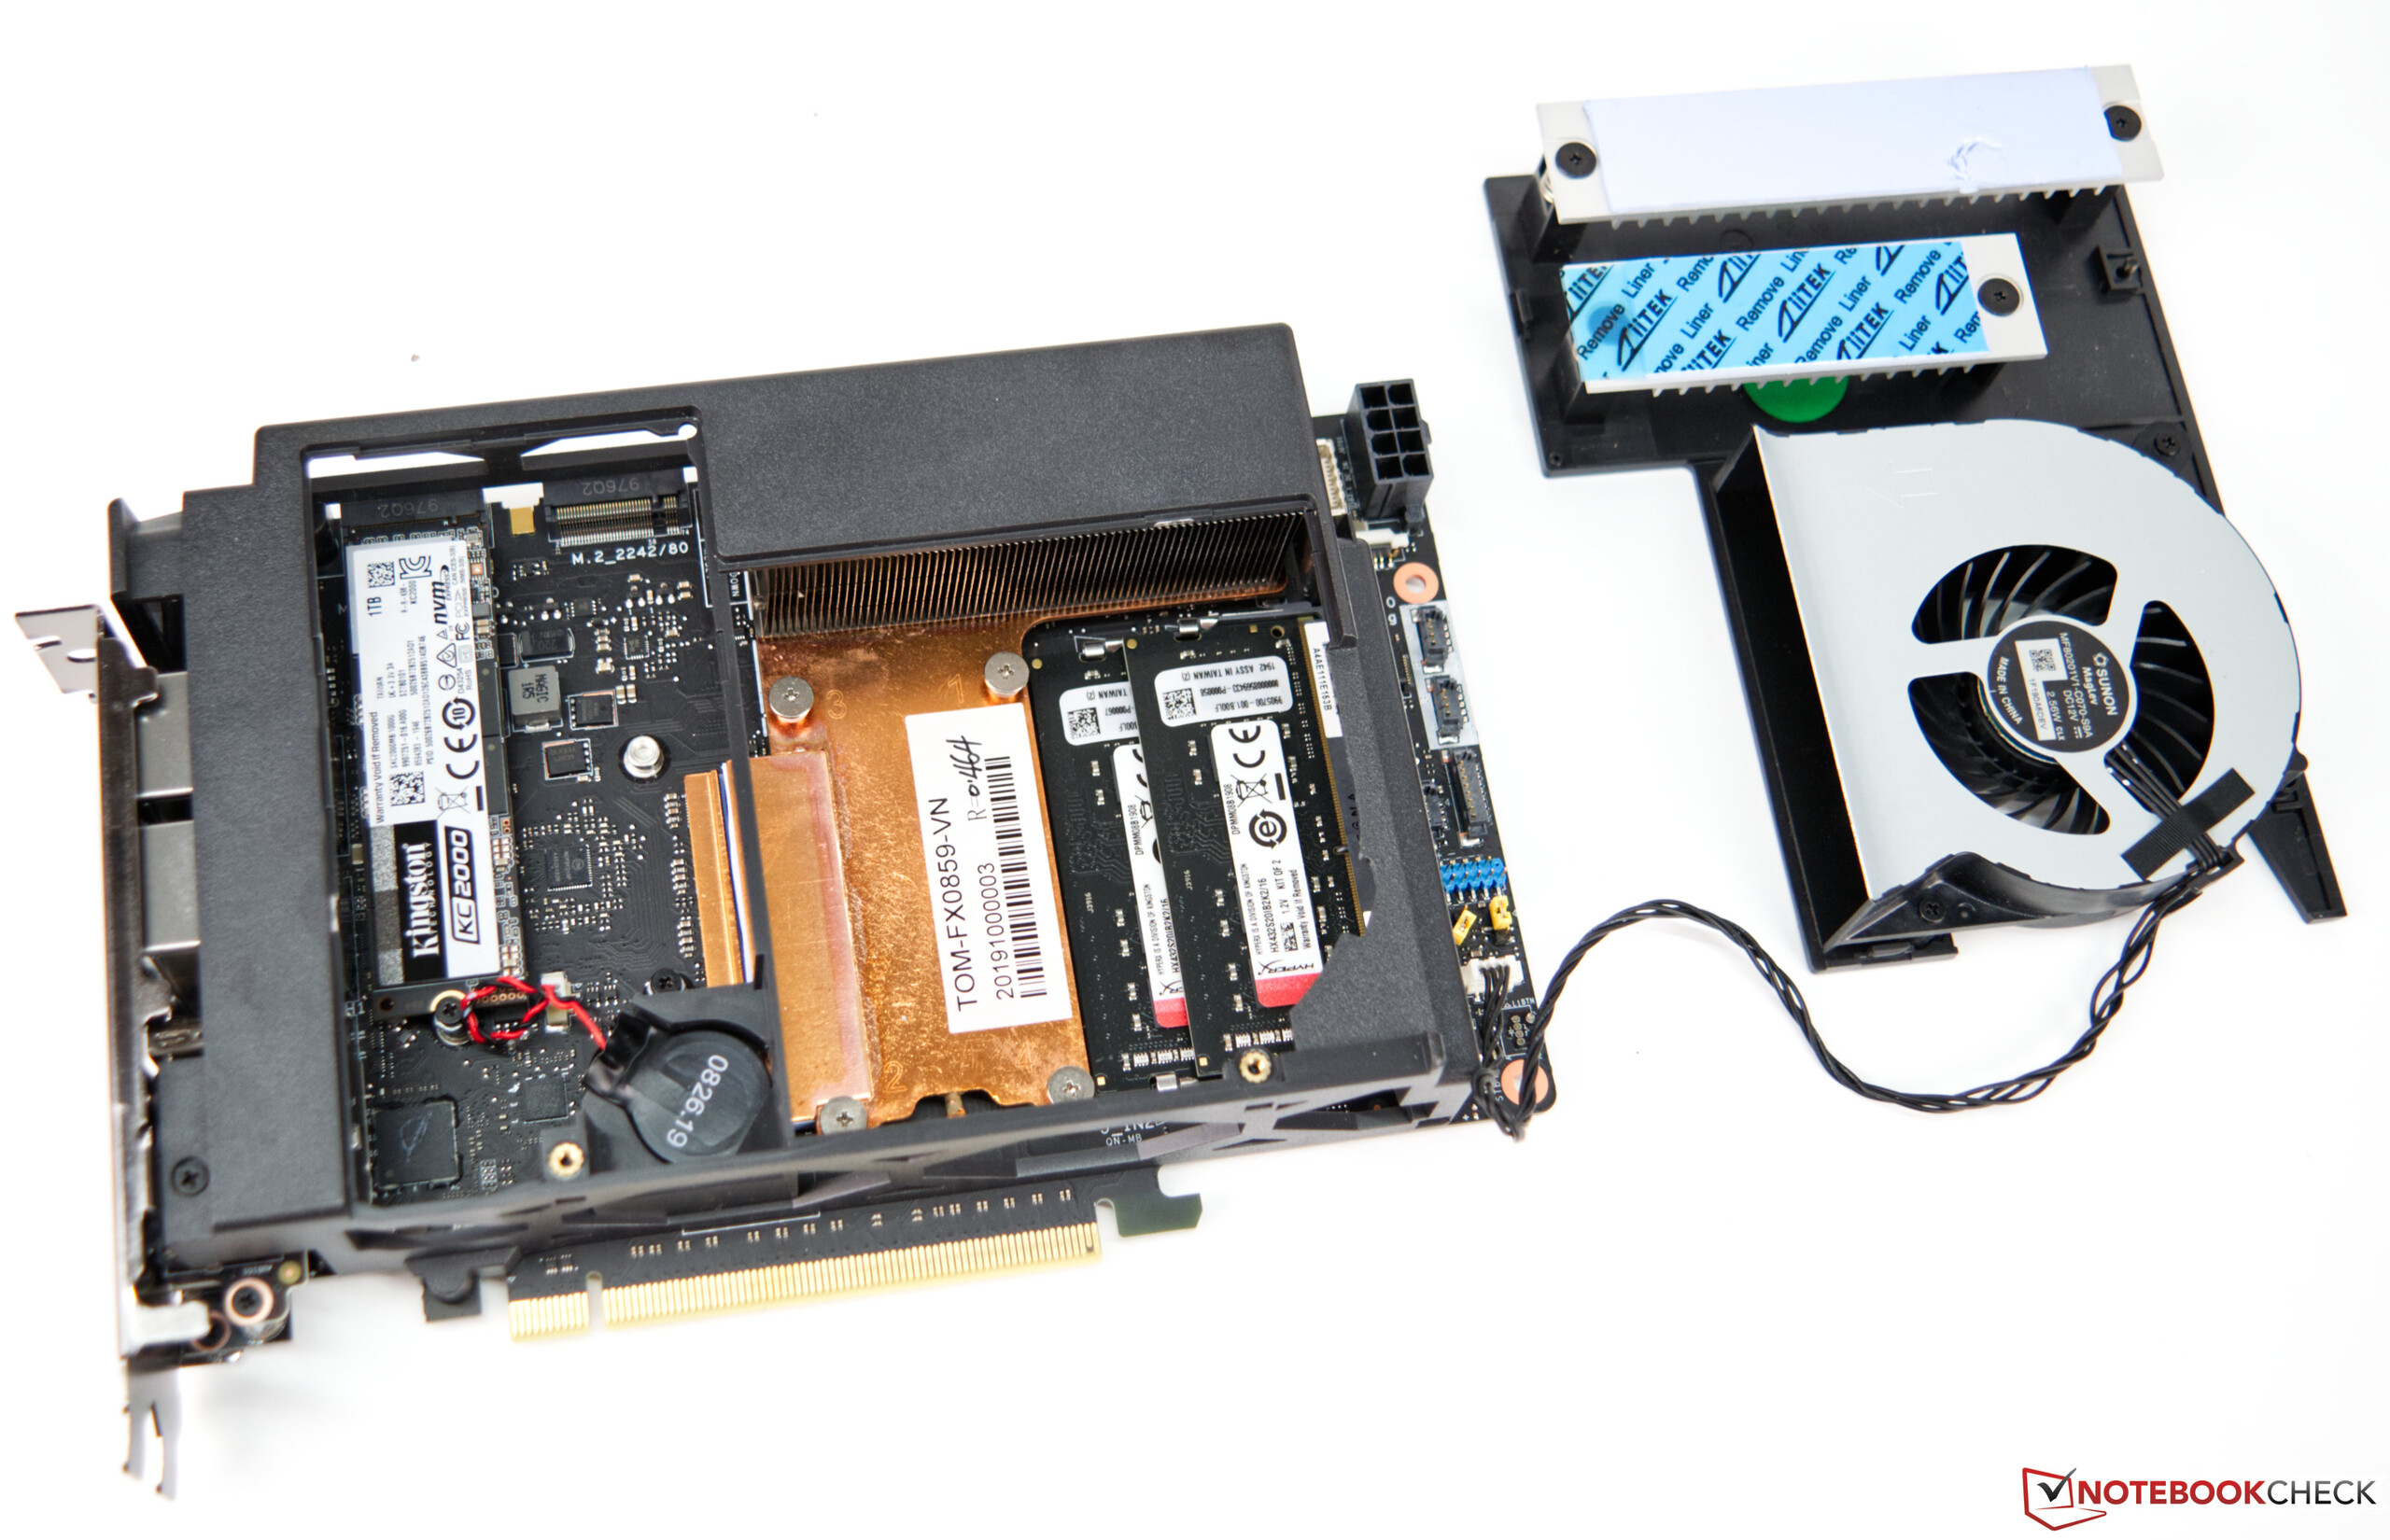
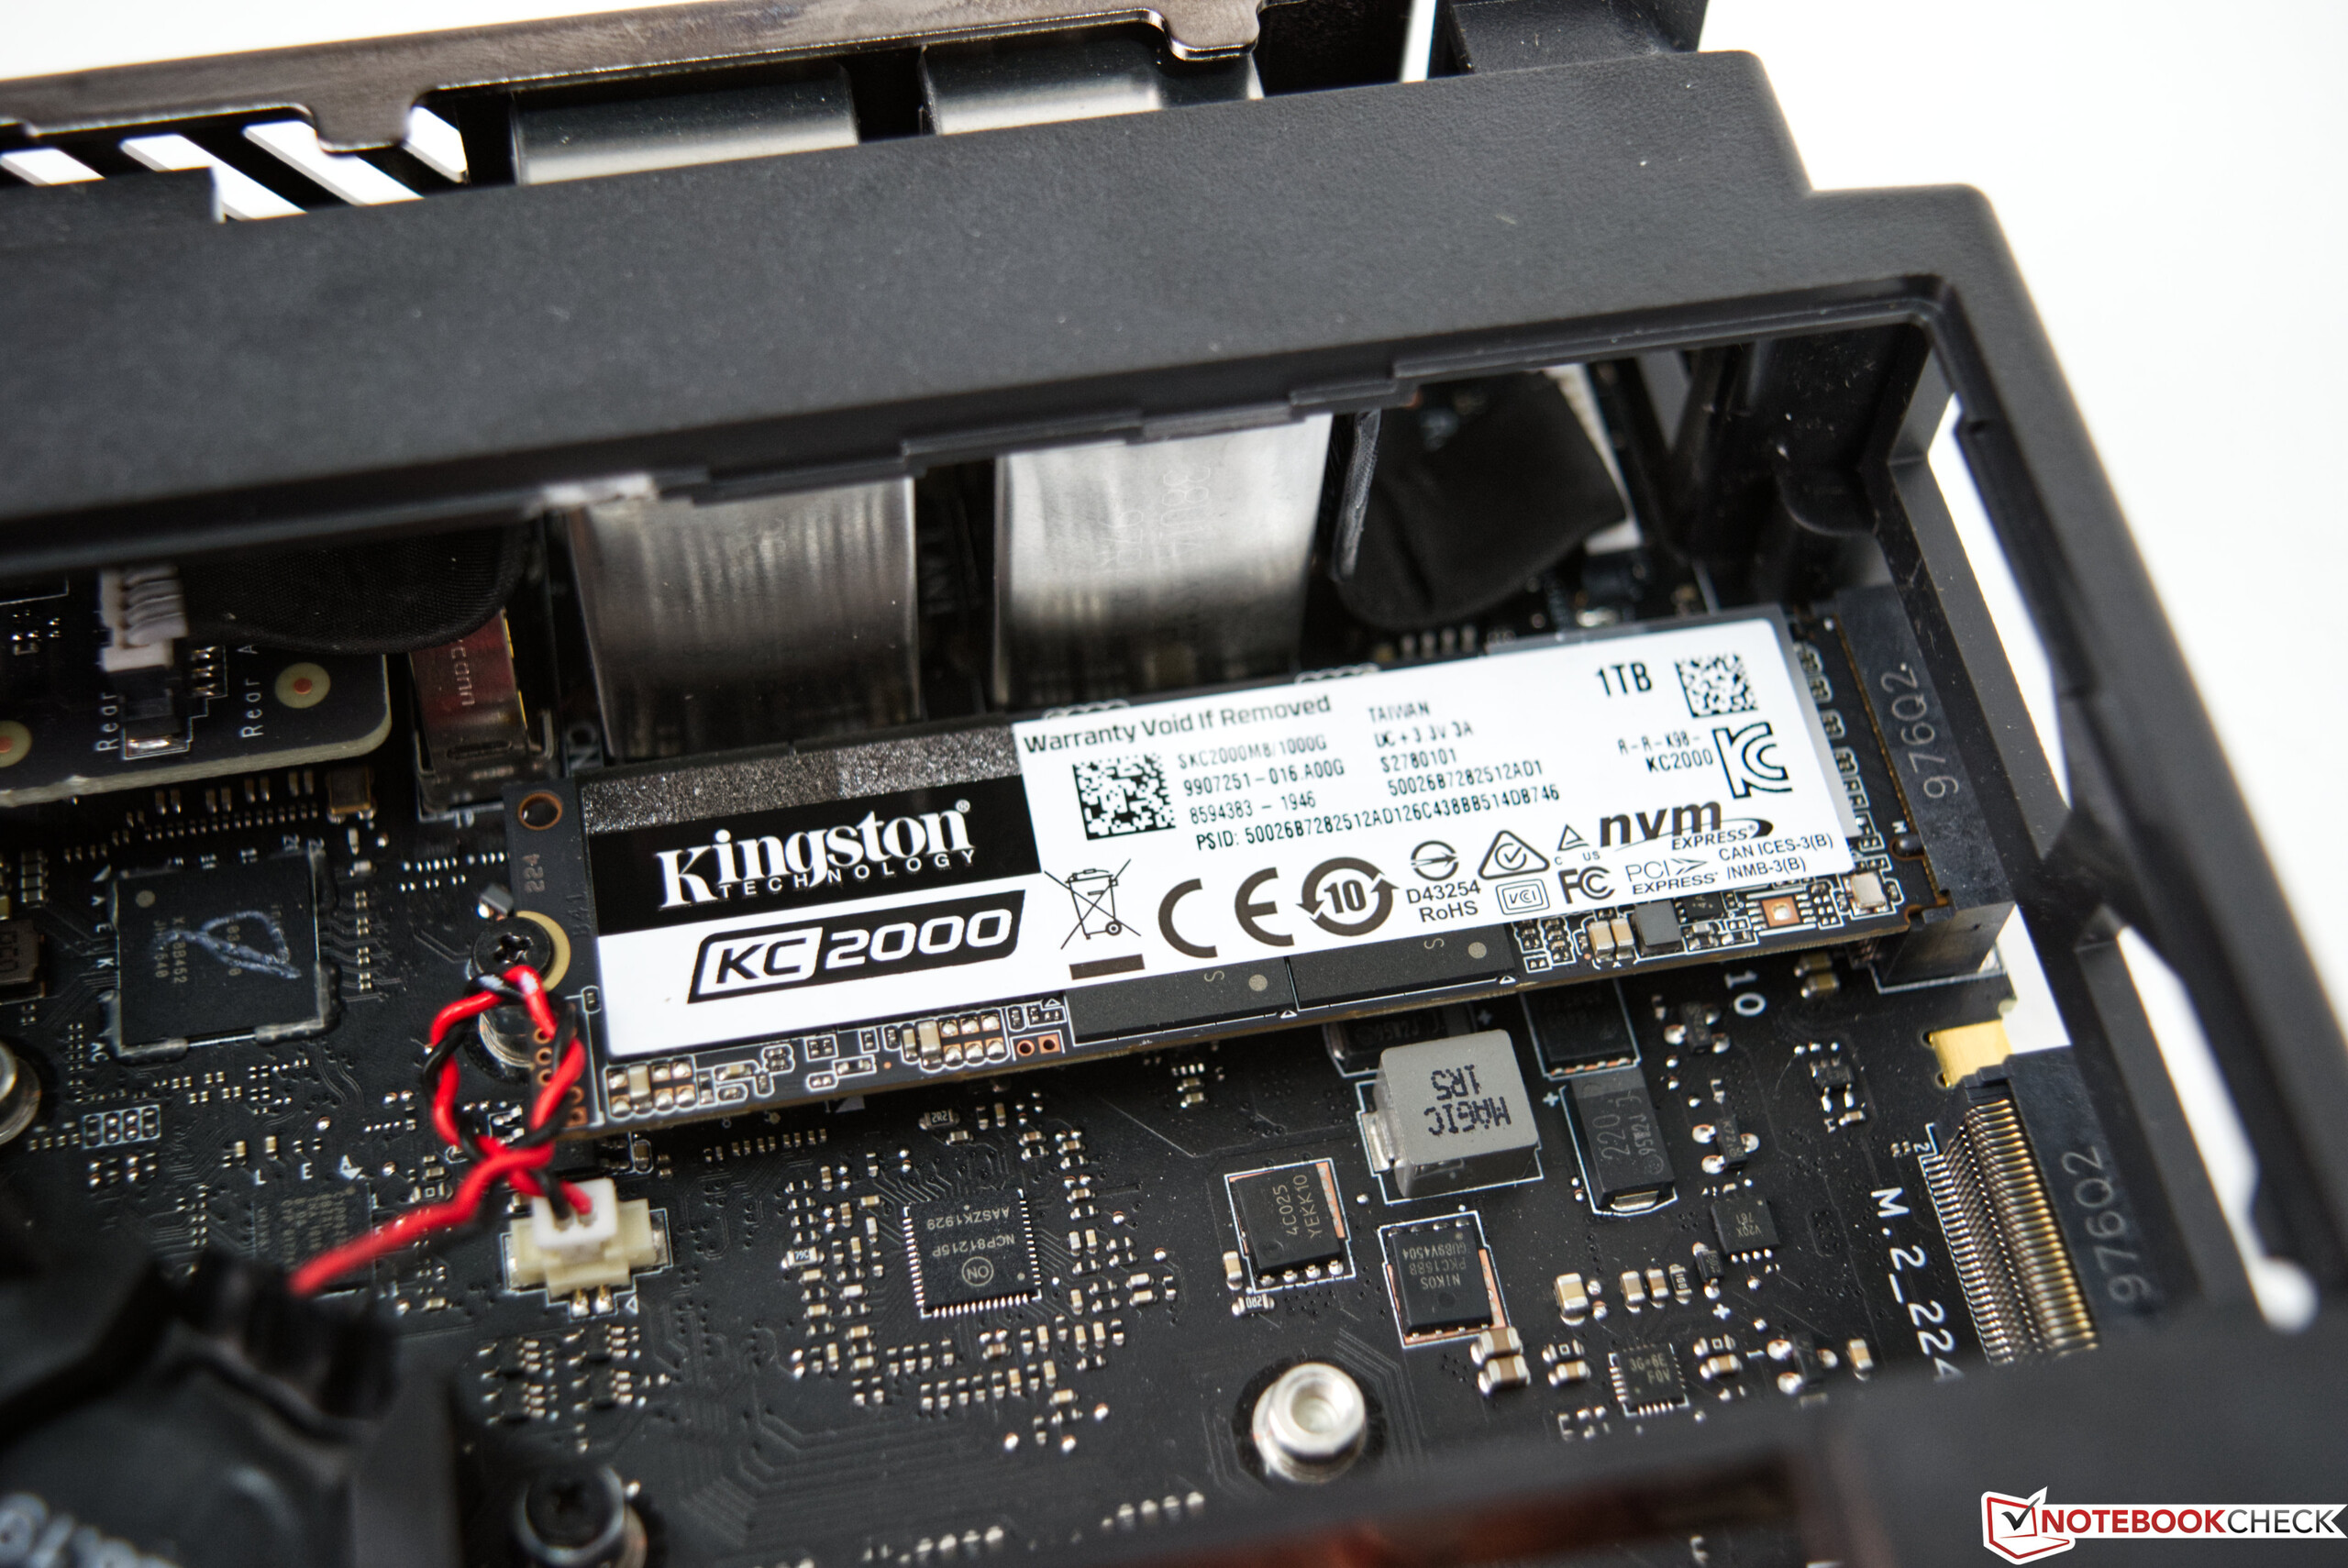
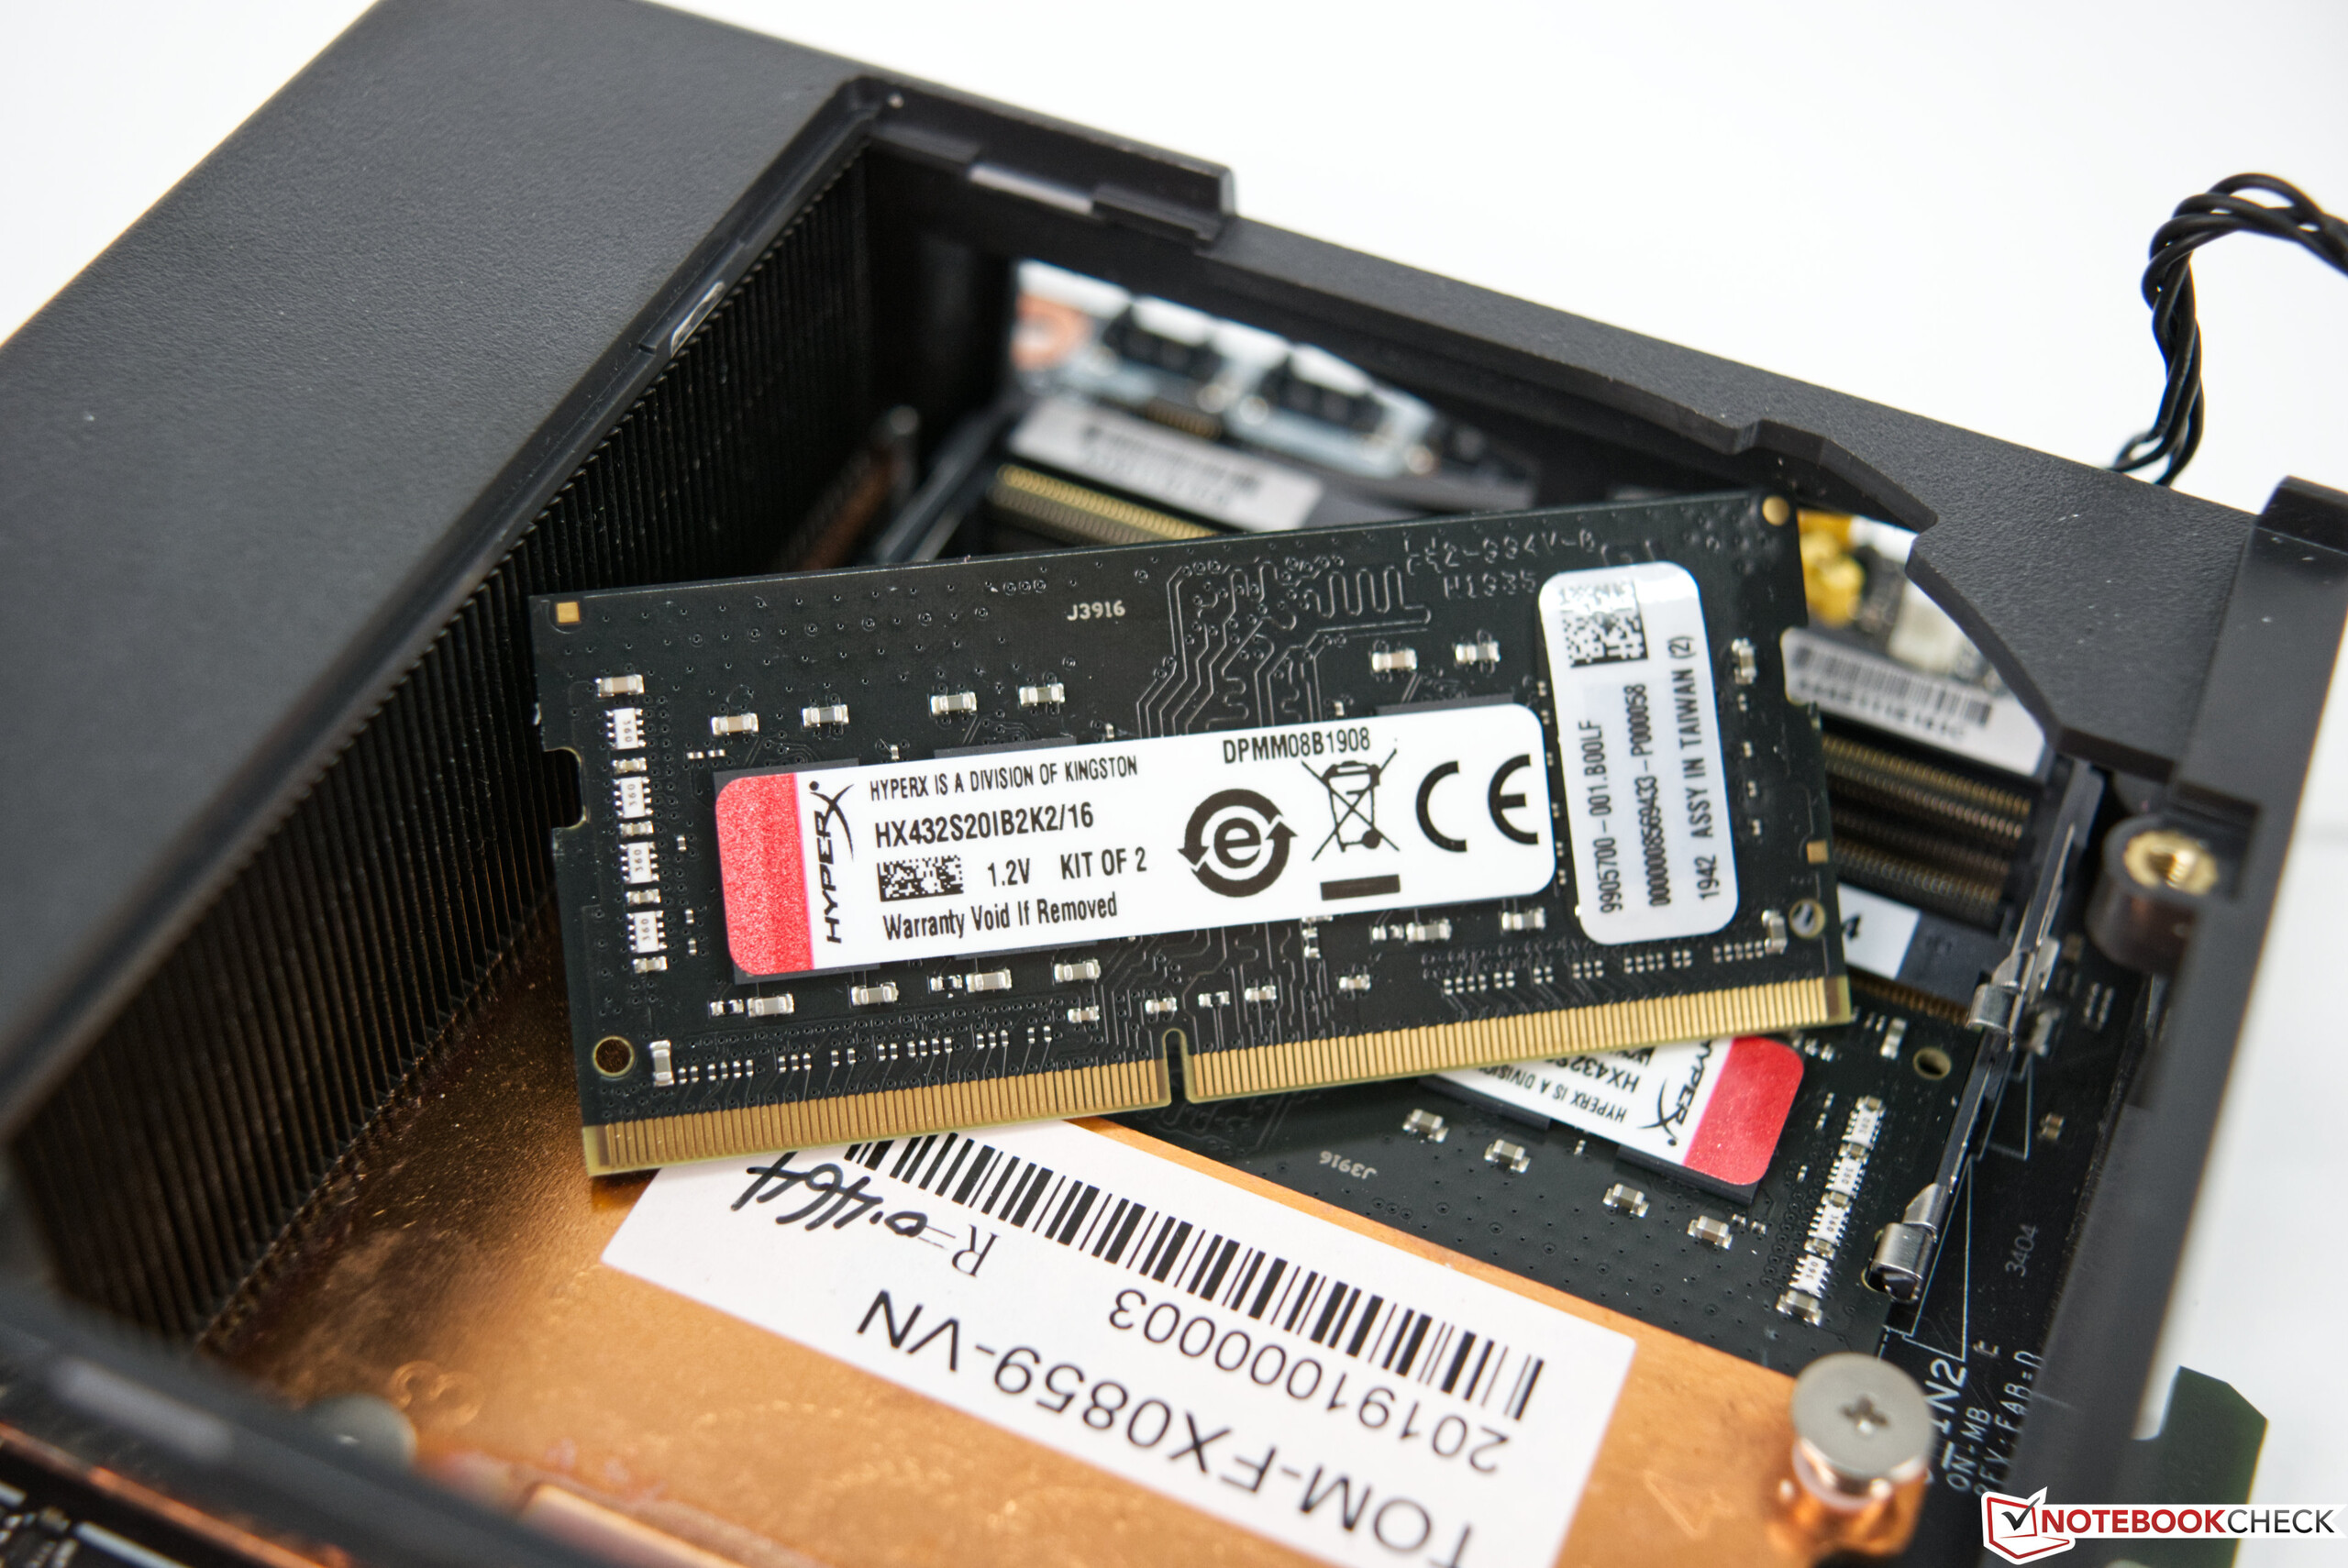
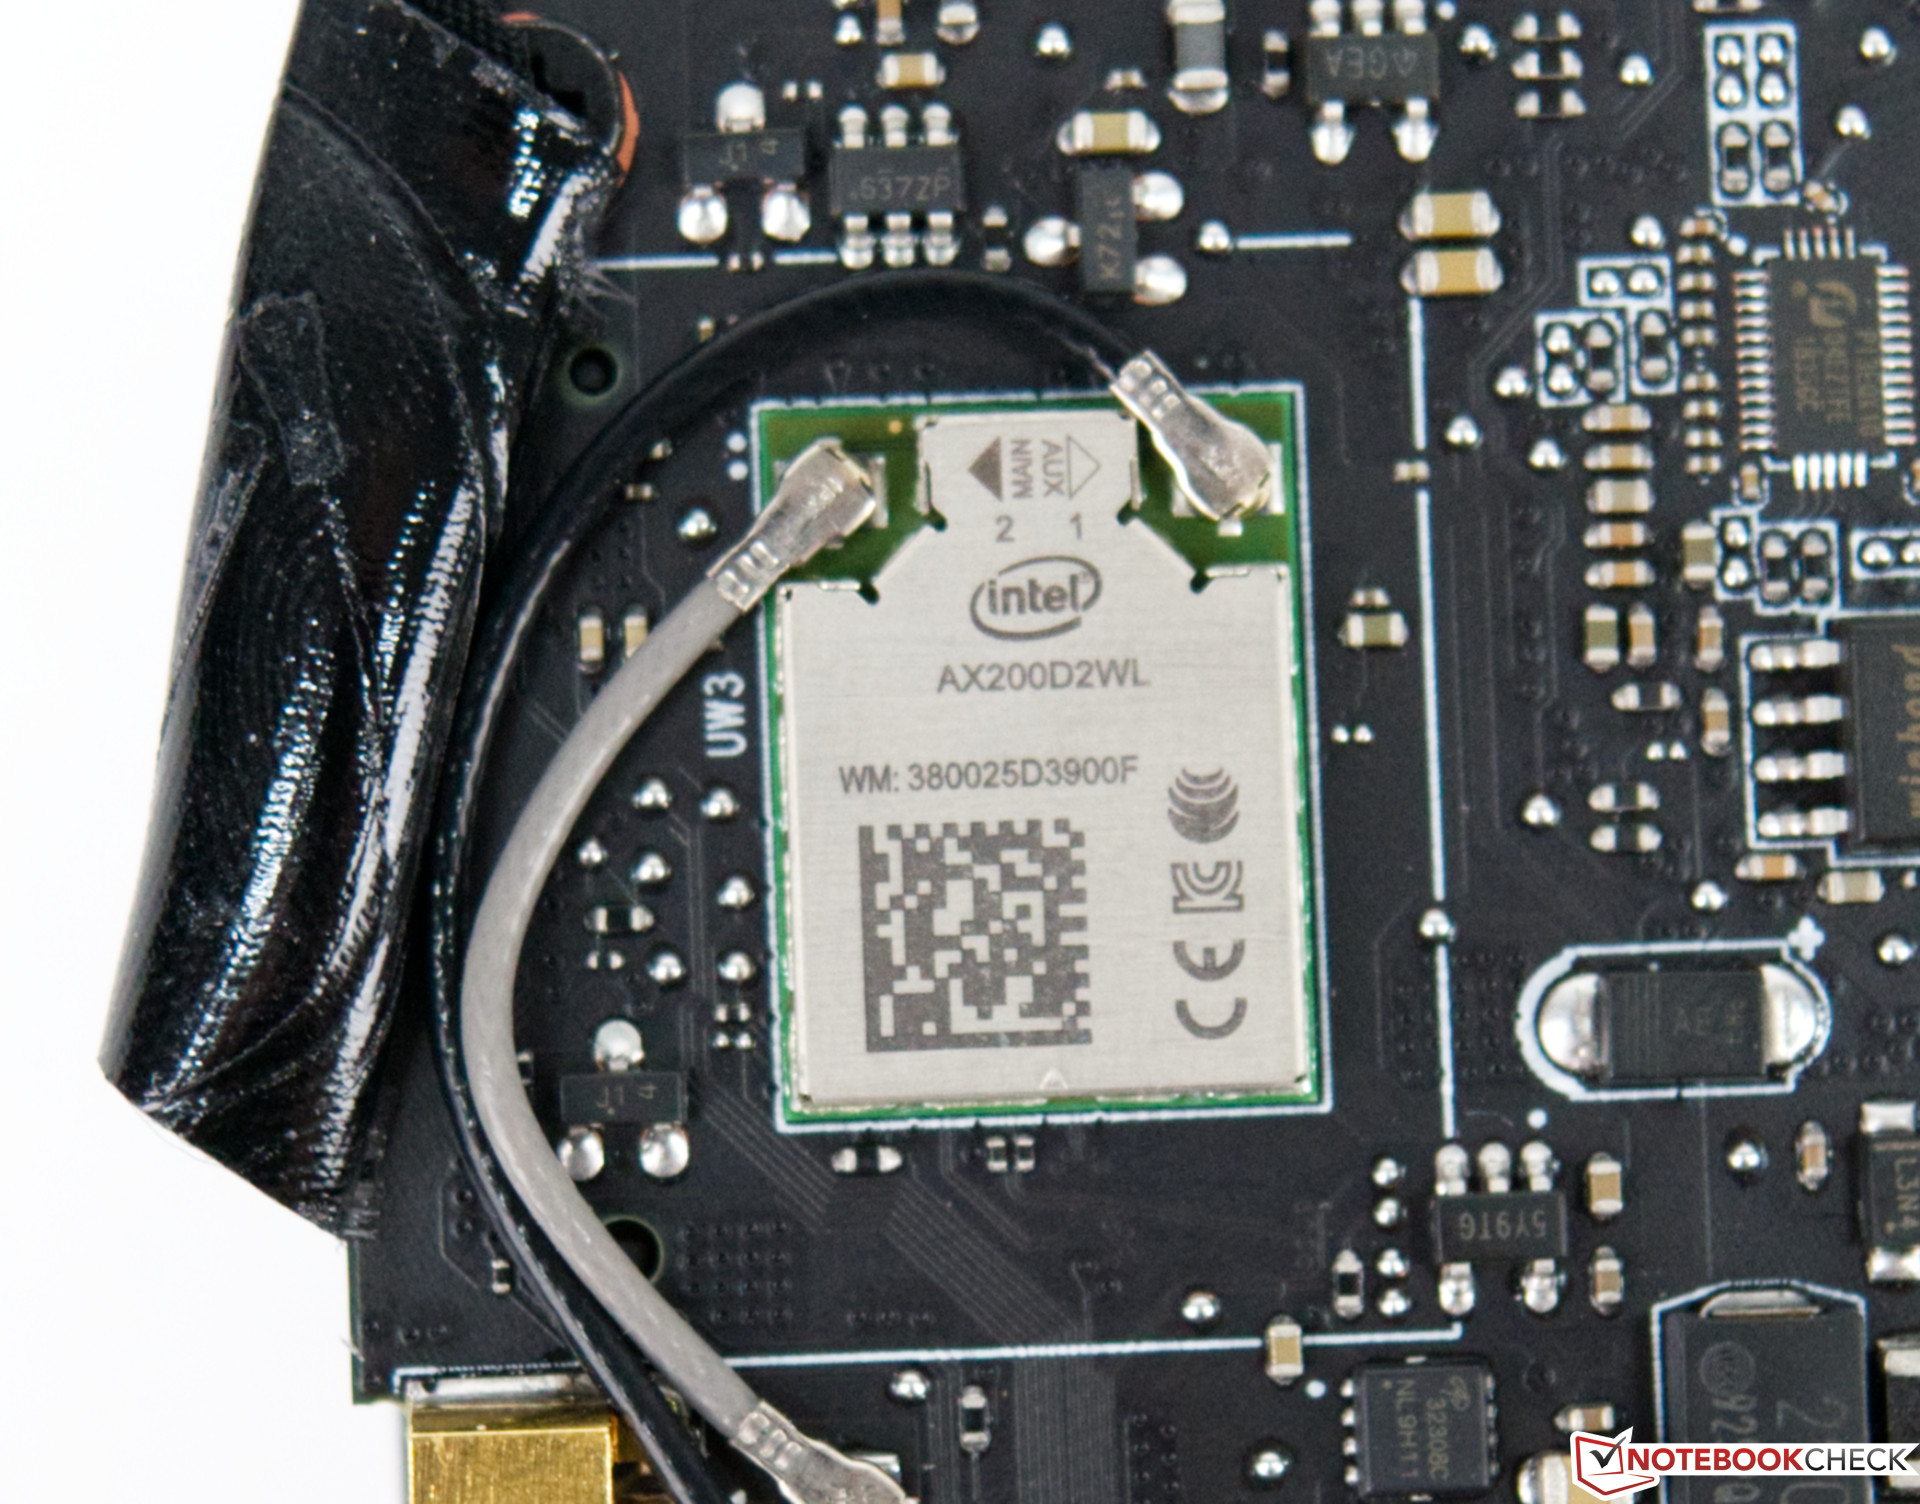

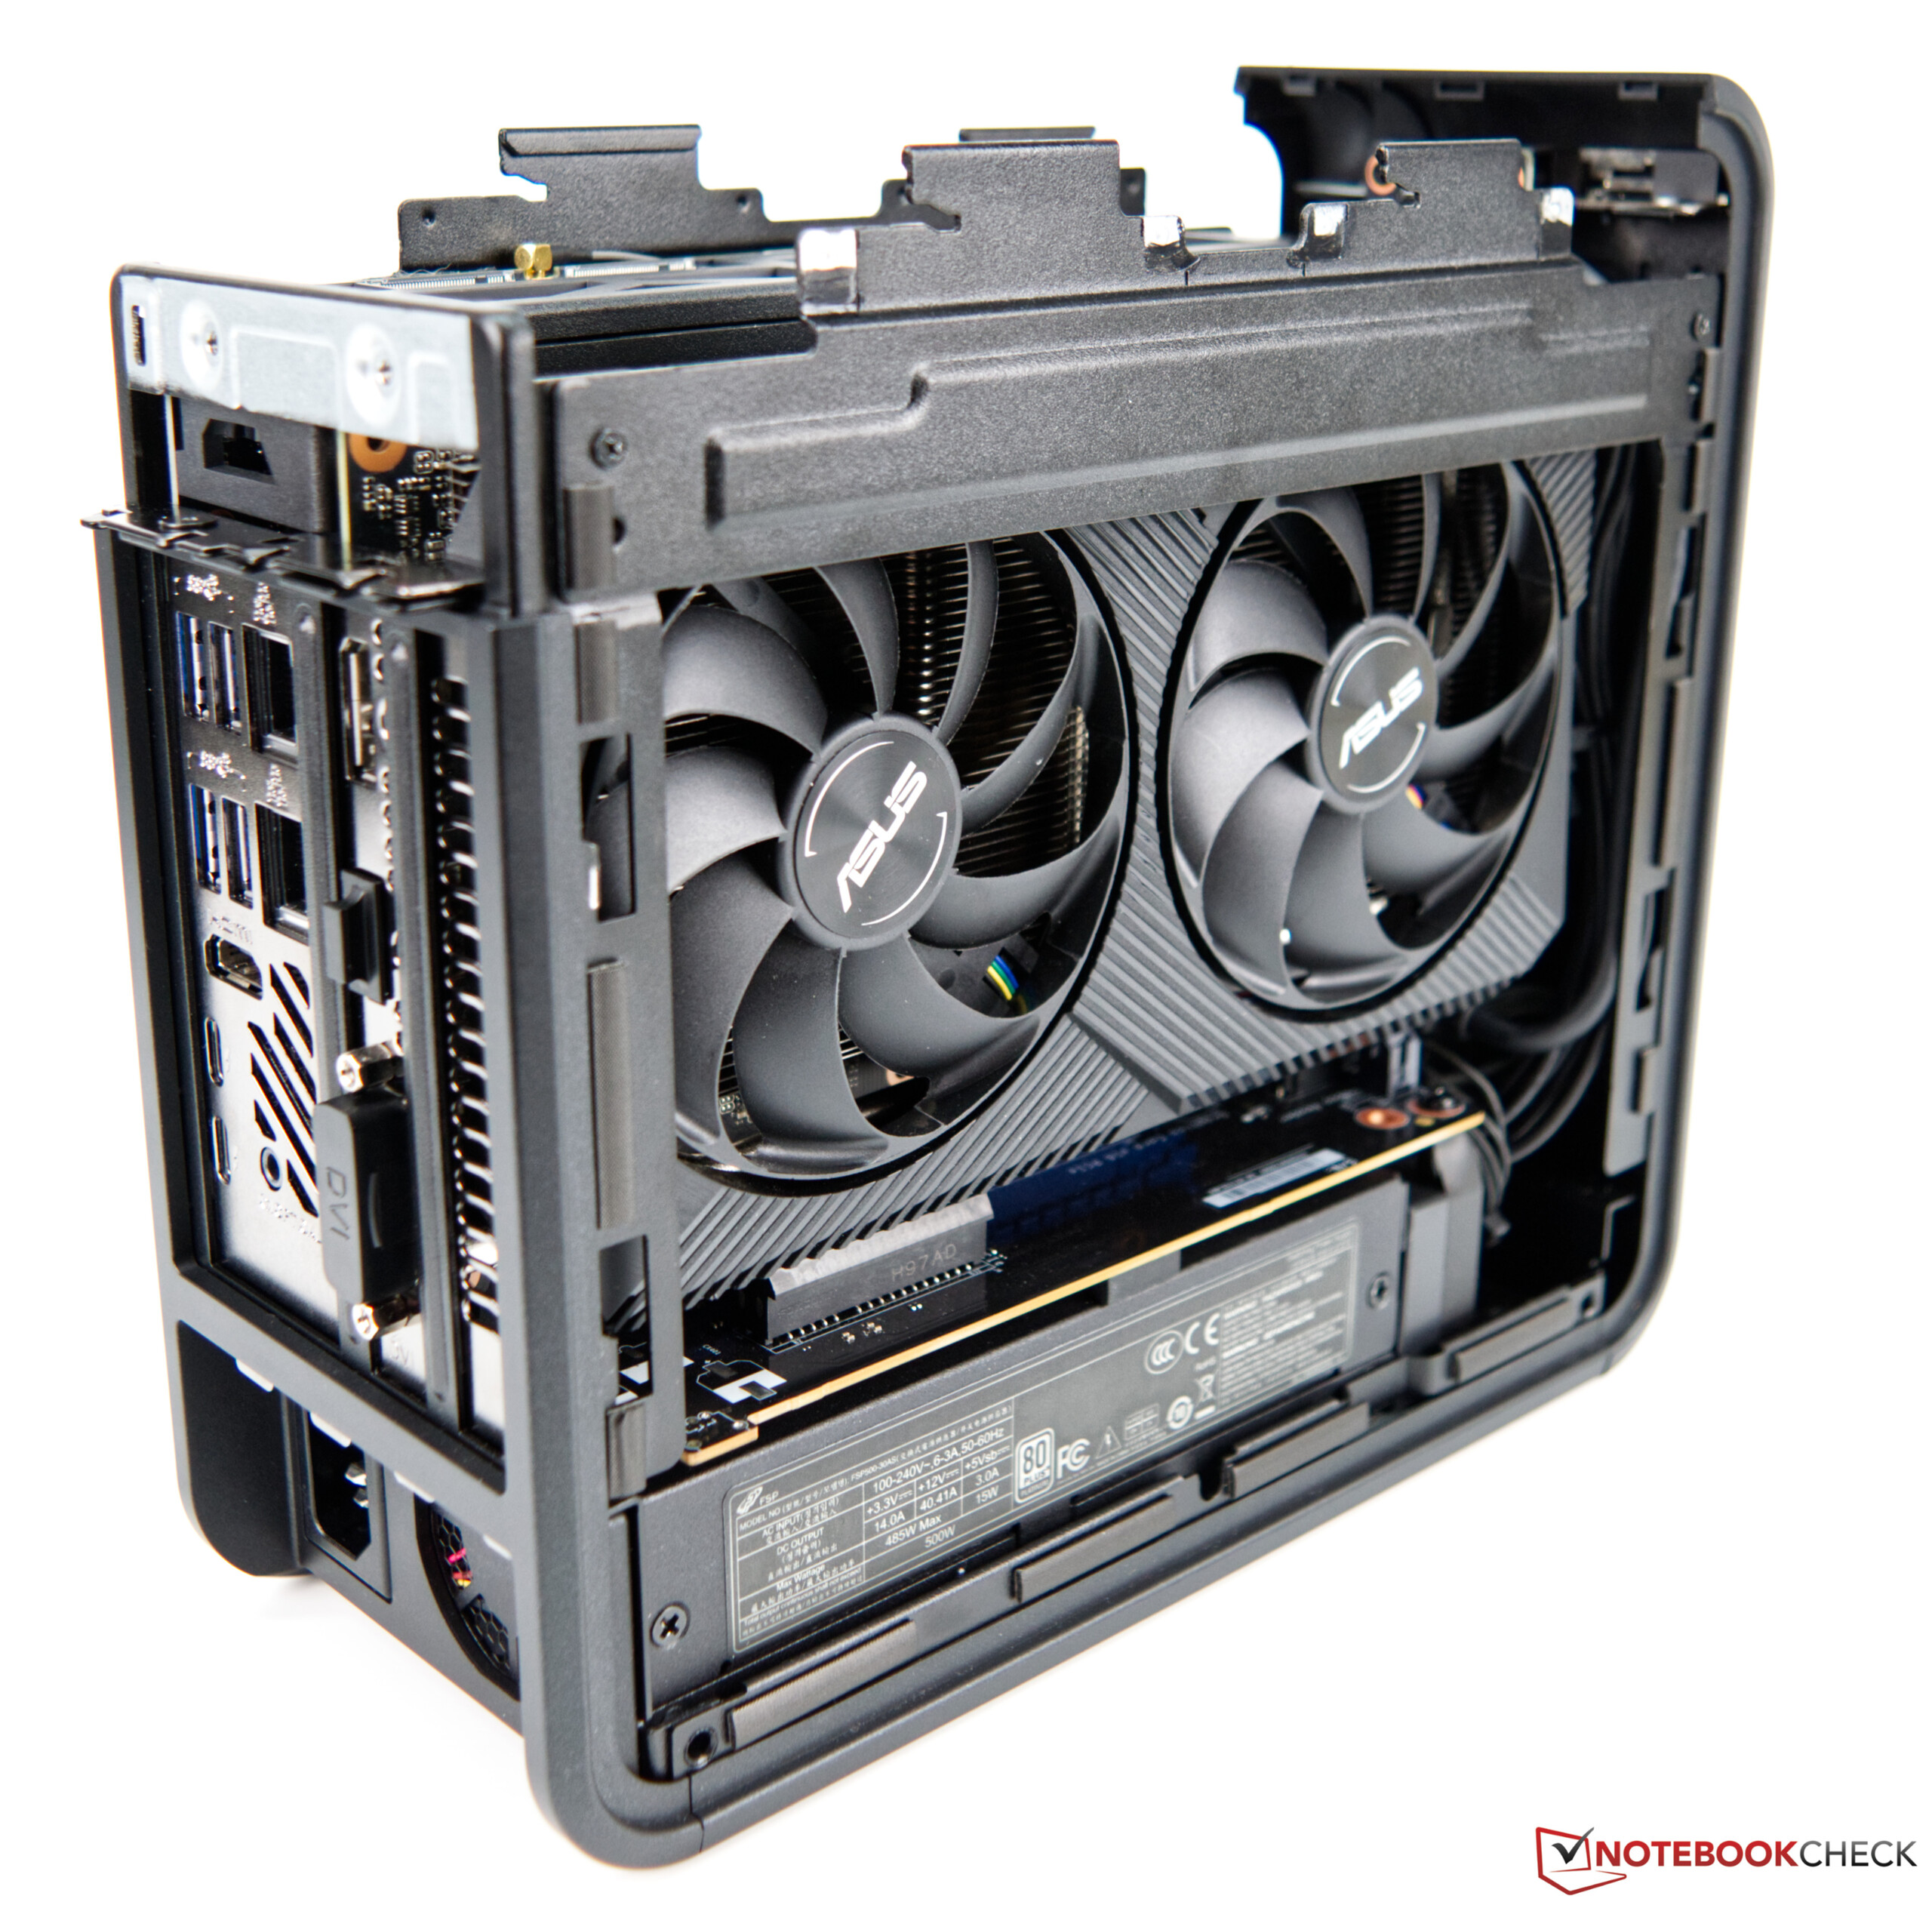
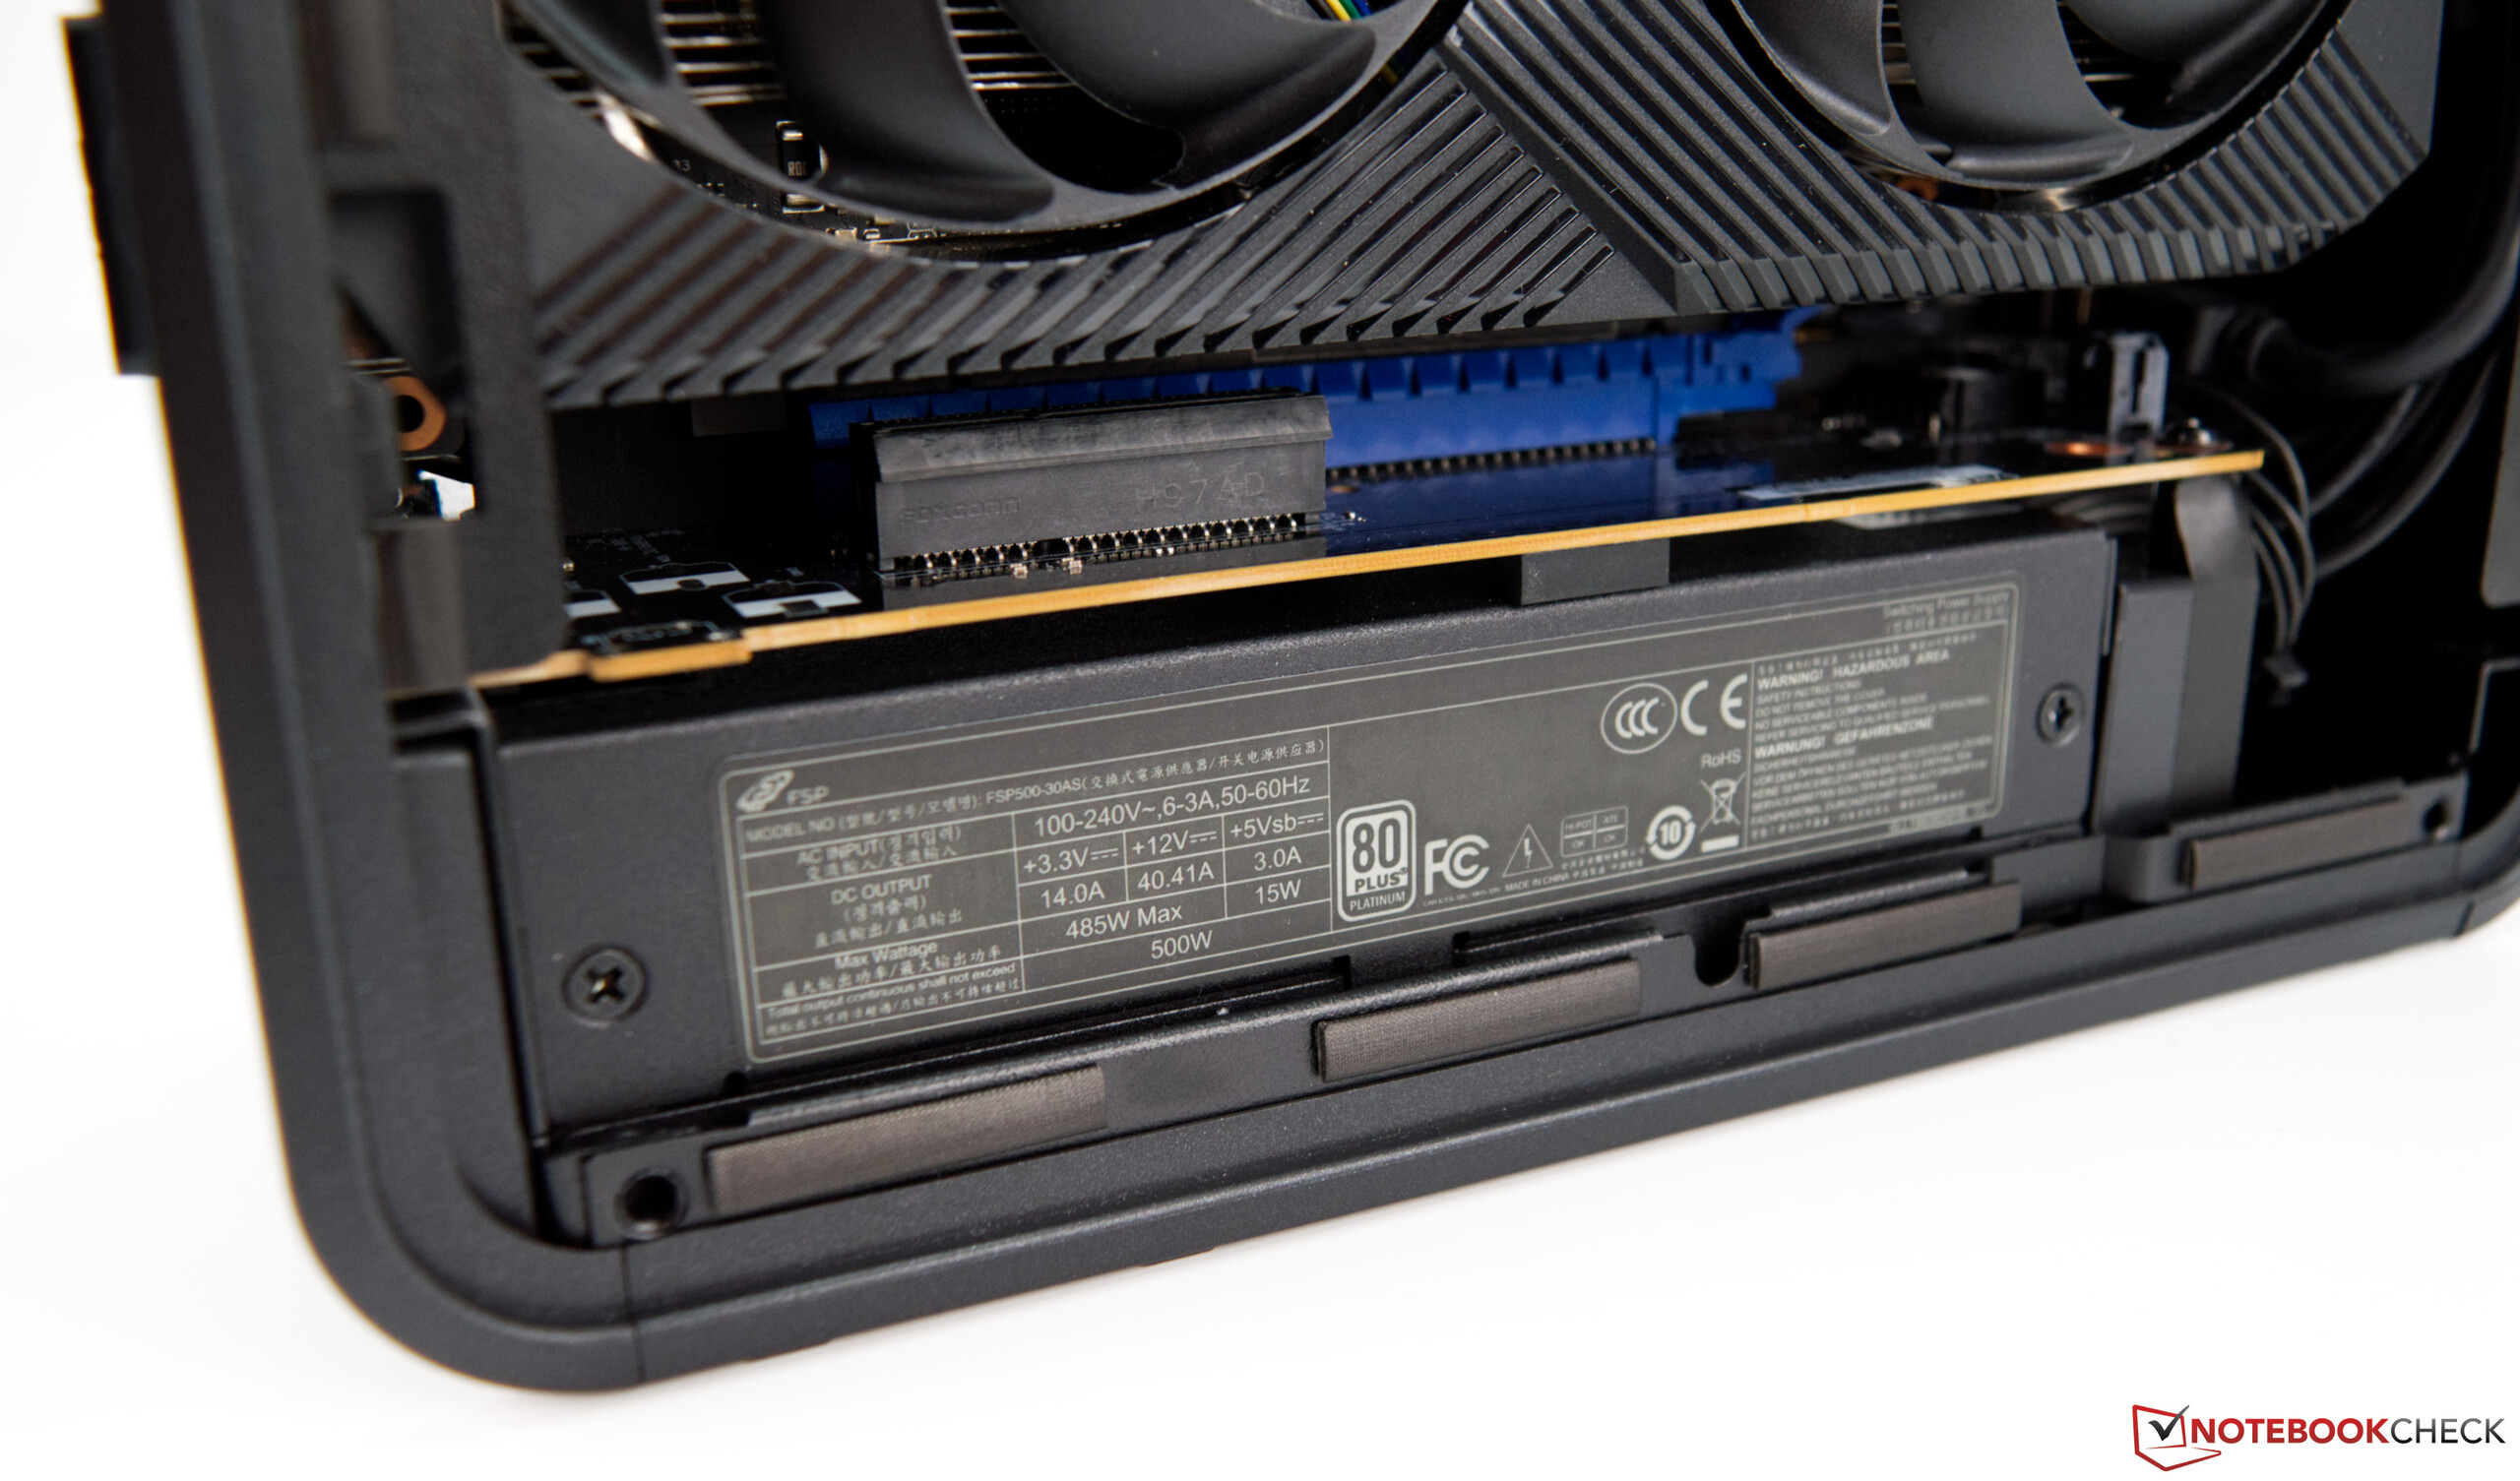
Intel NUC 9 Extreme Ayrıntıda
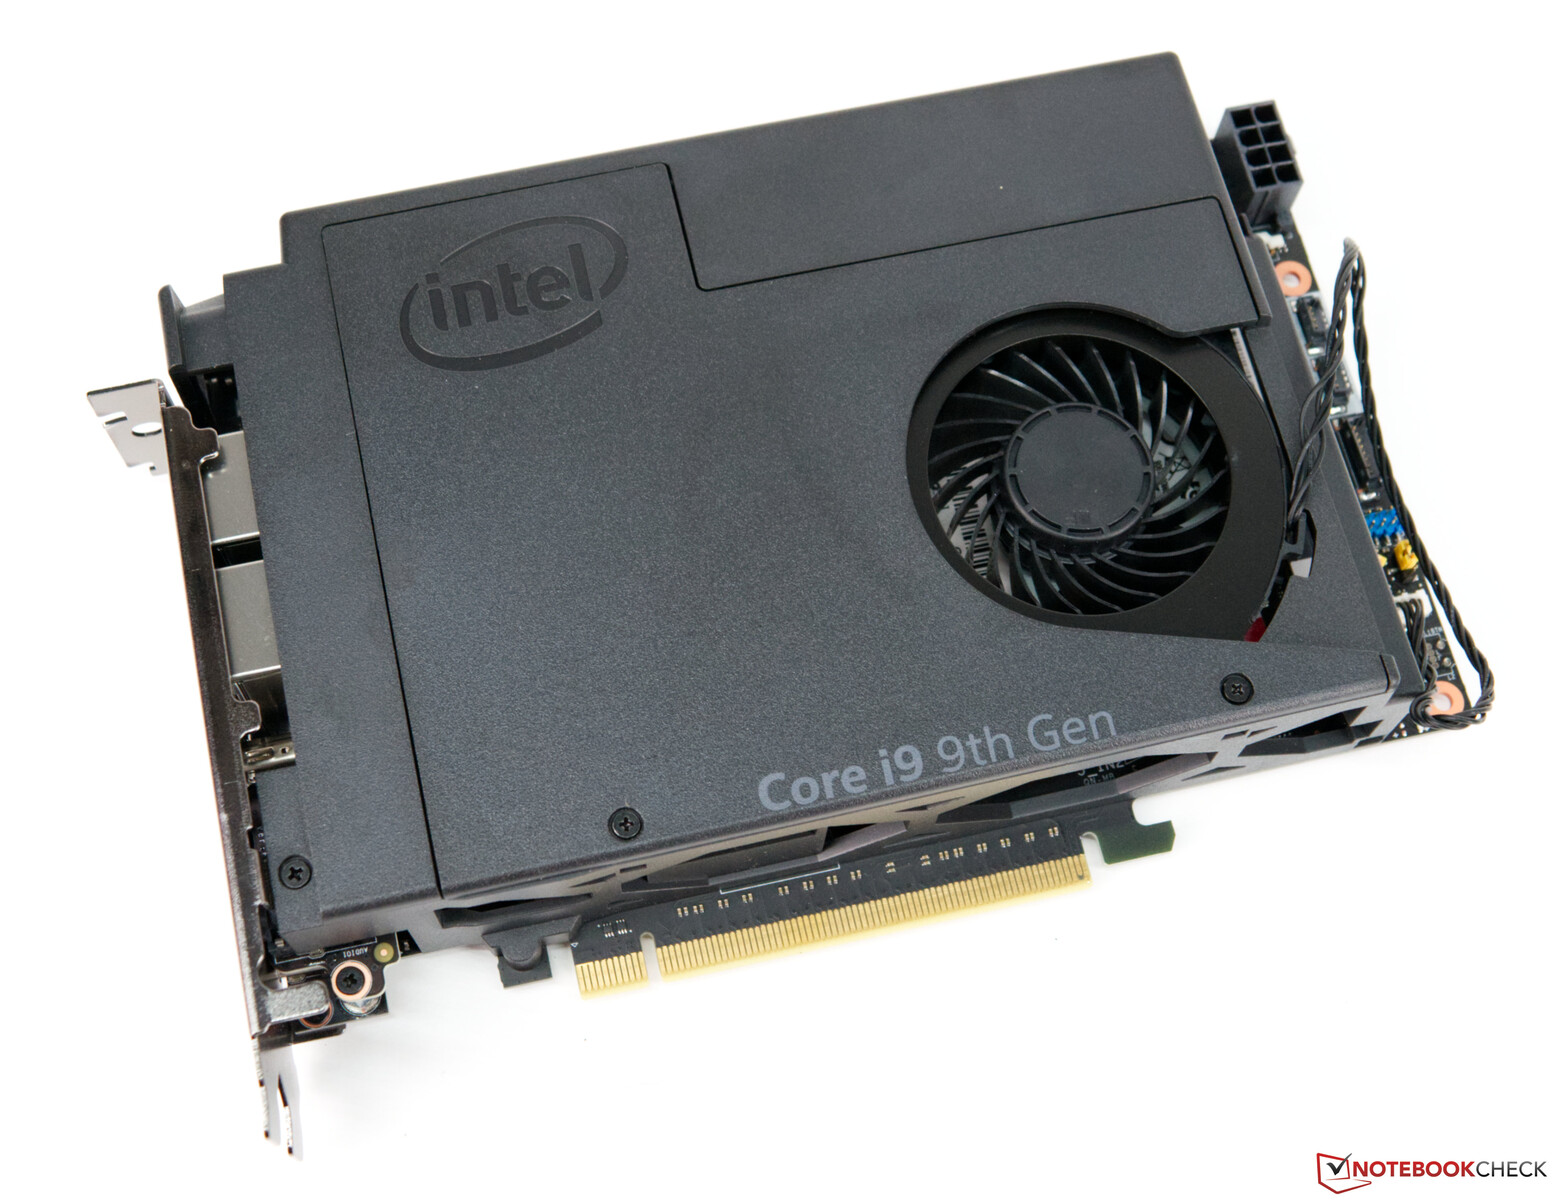
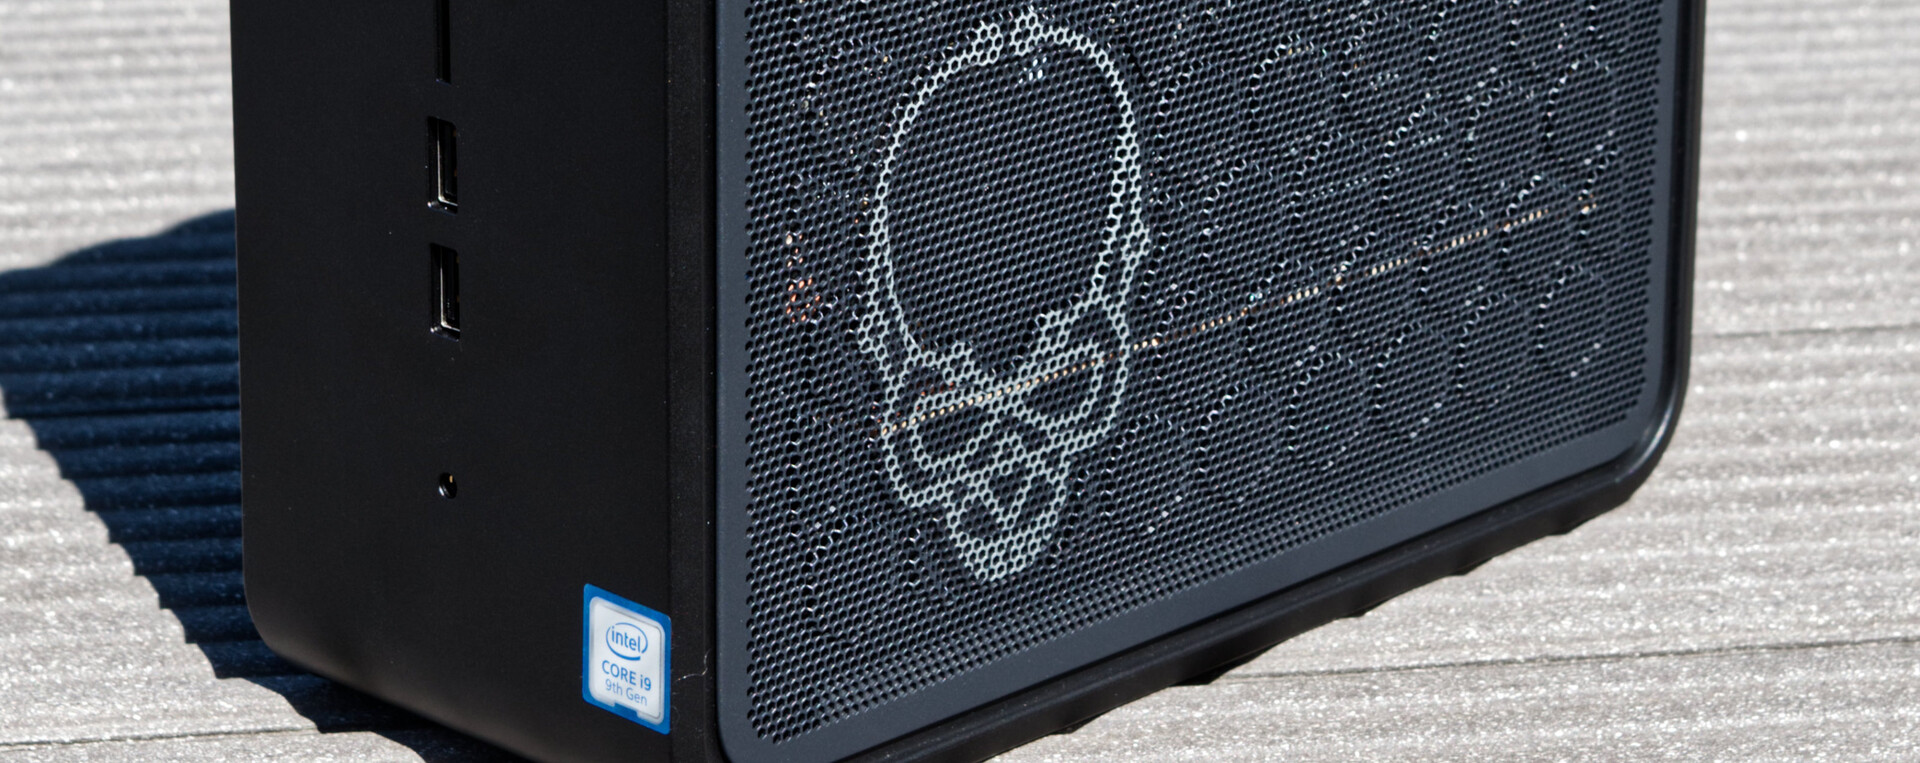
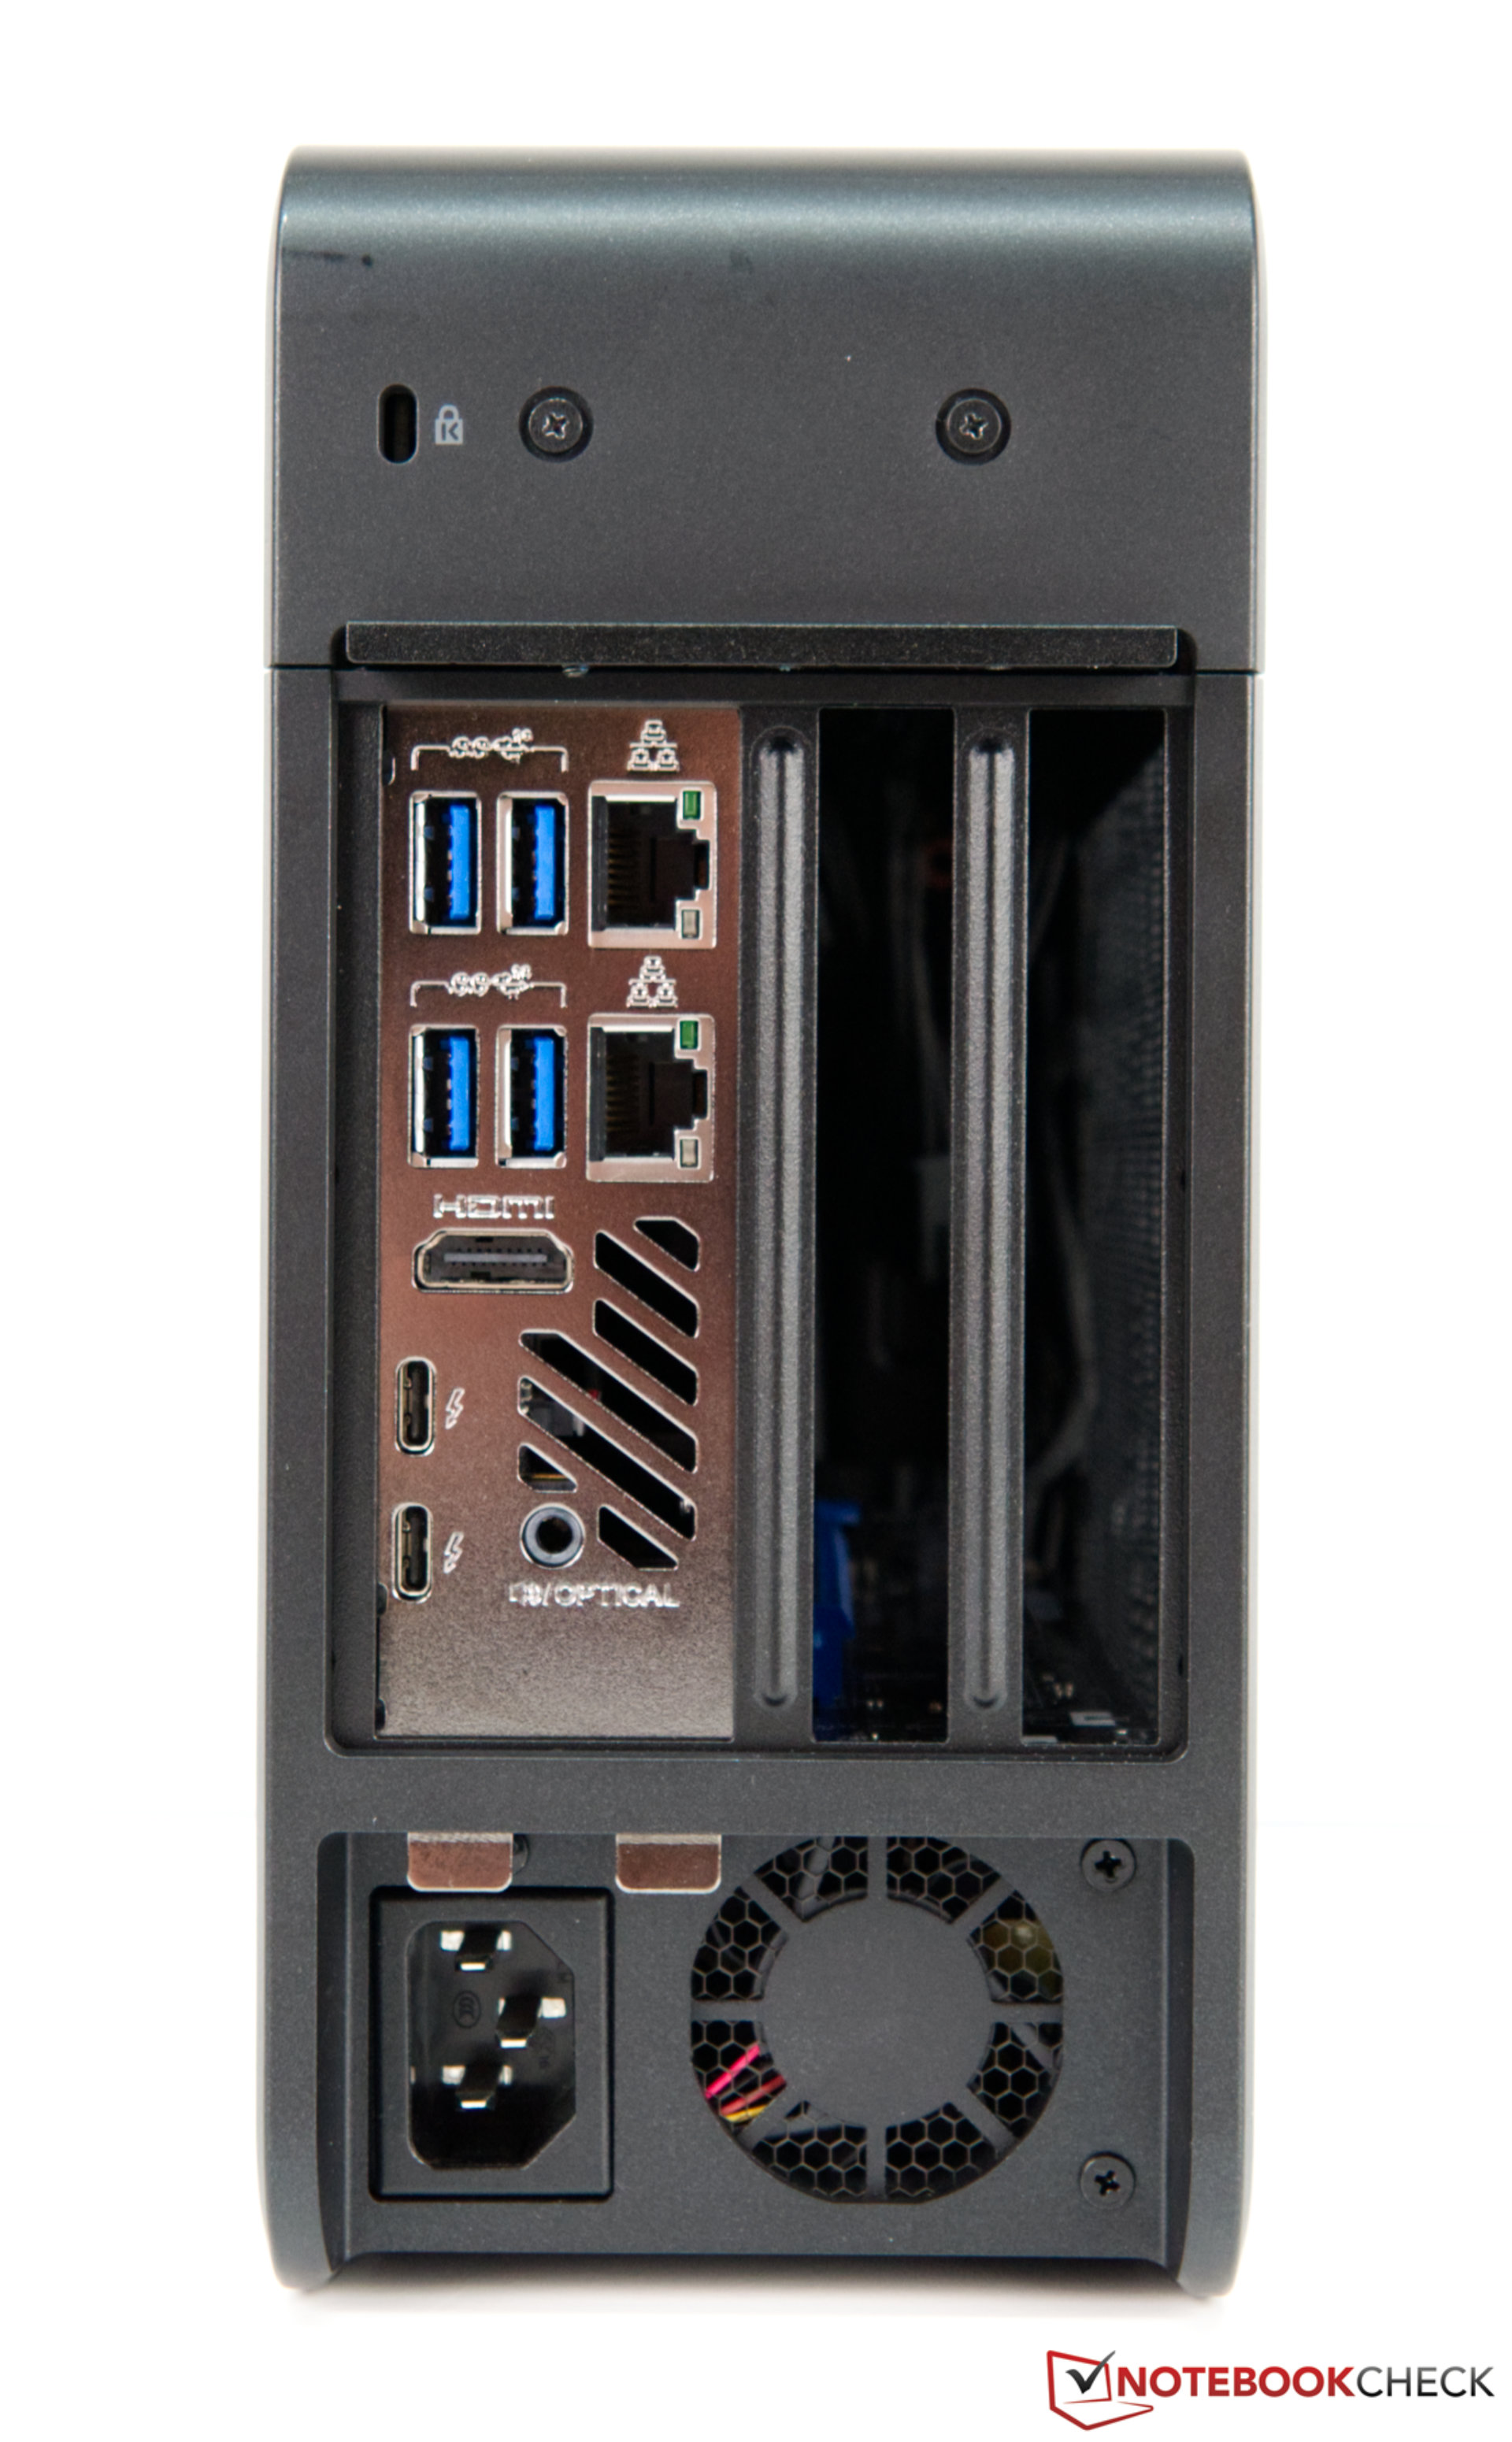
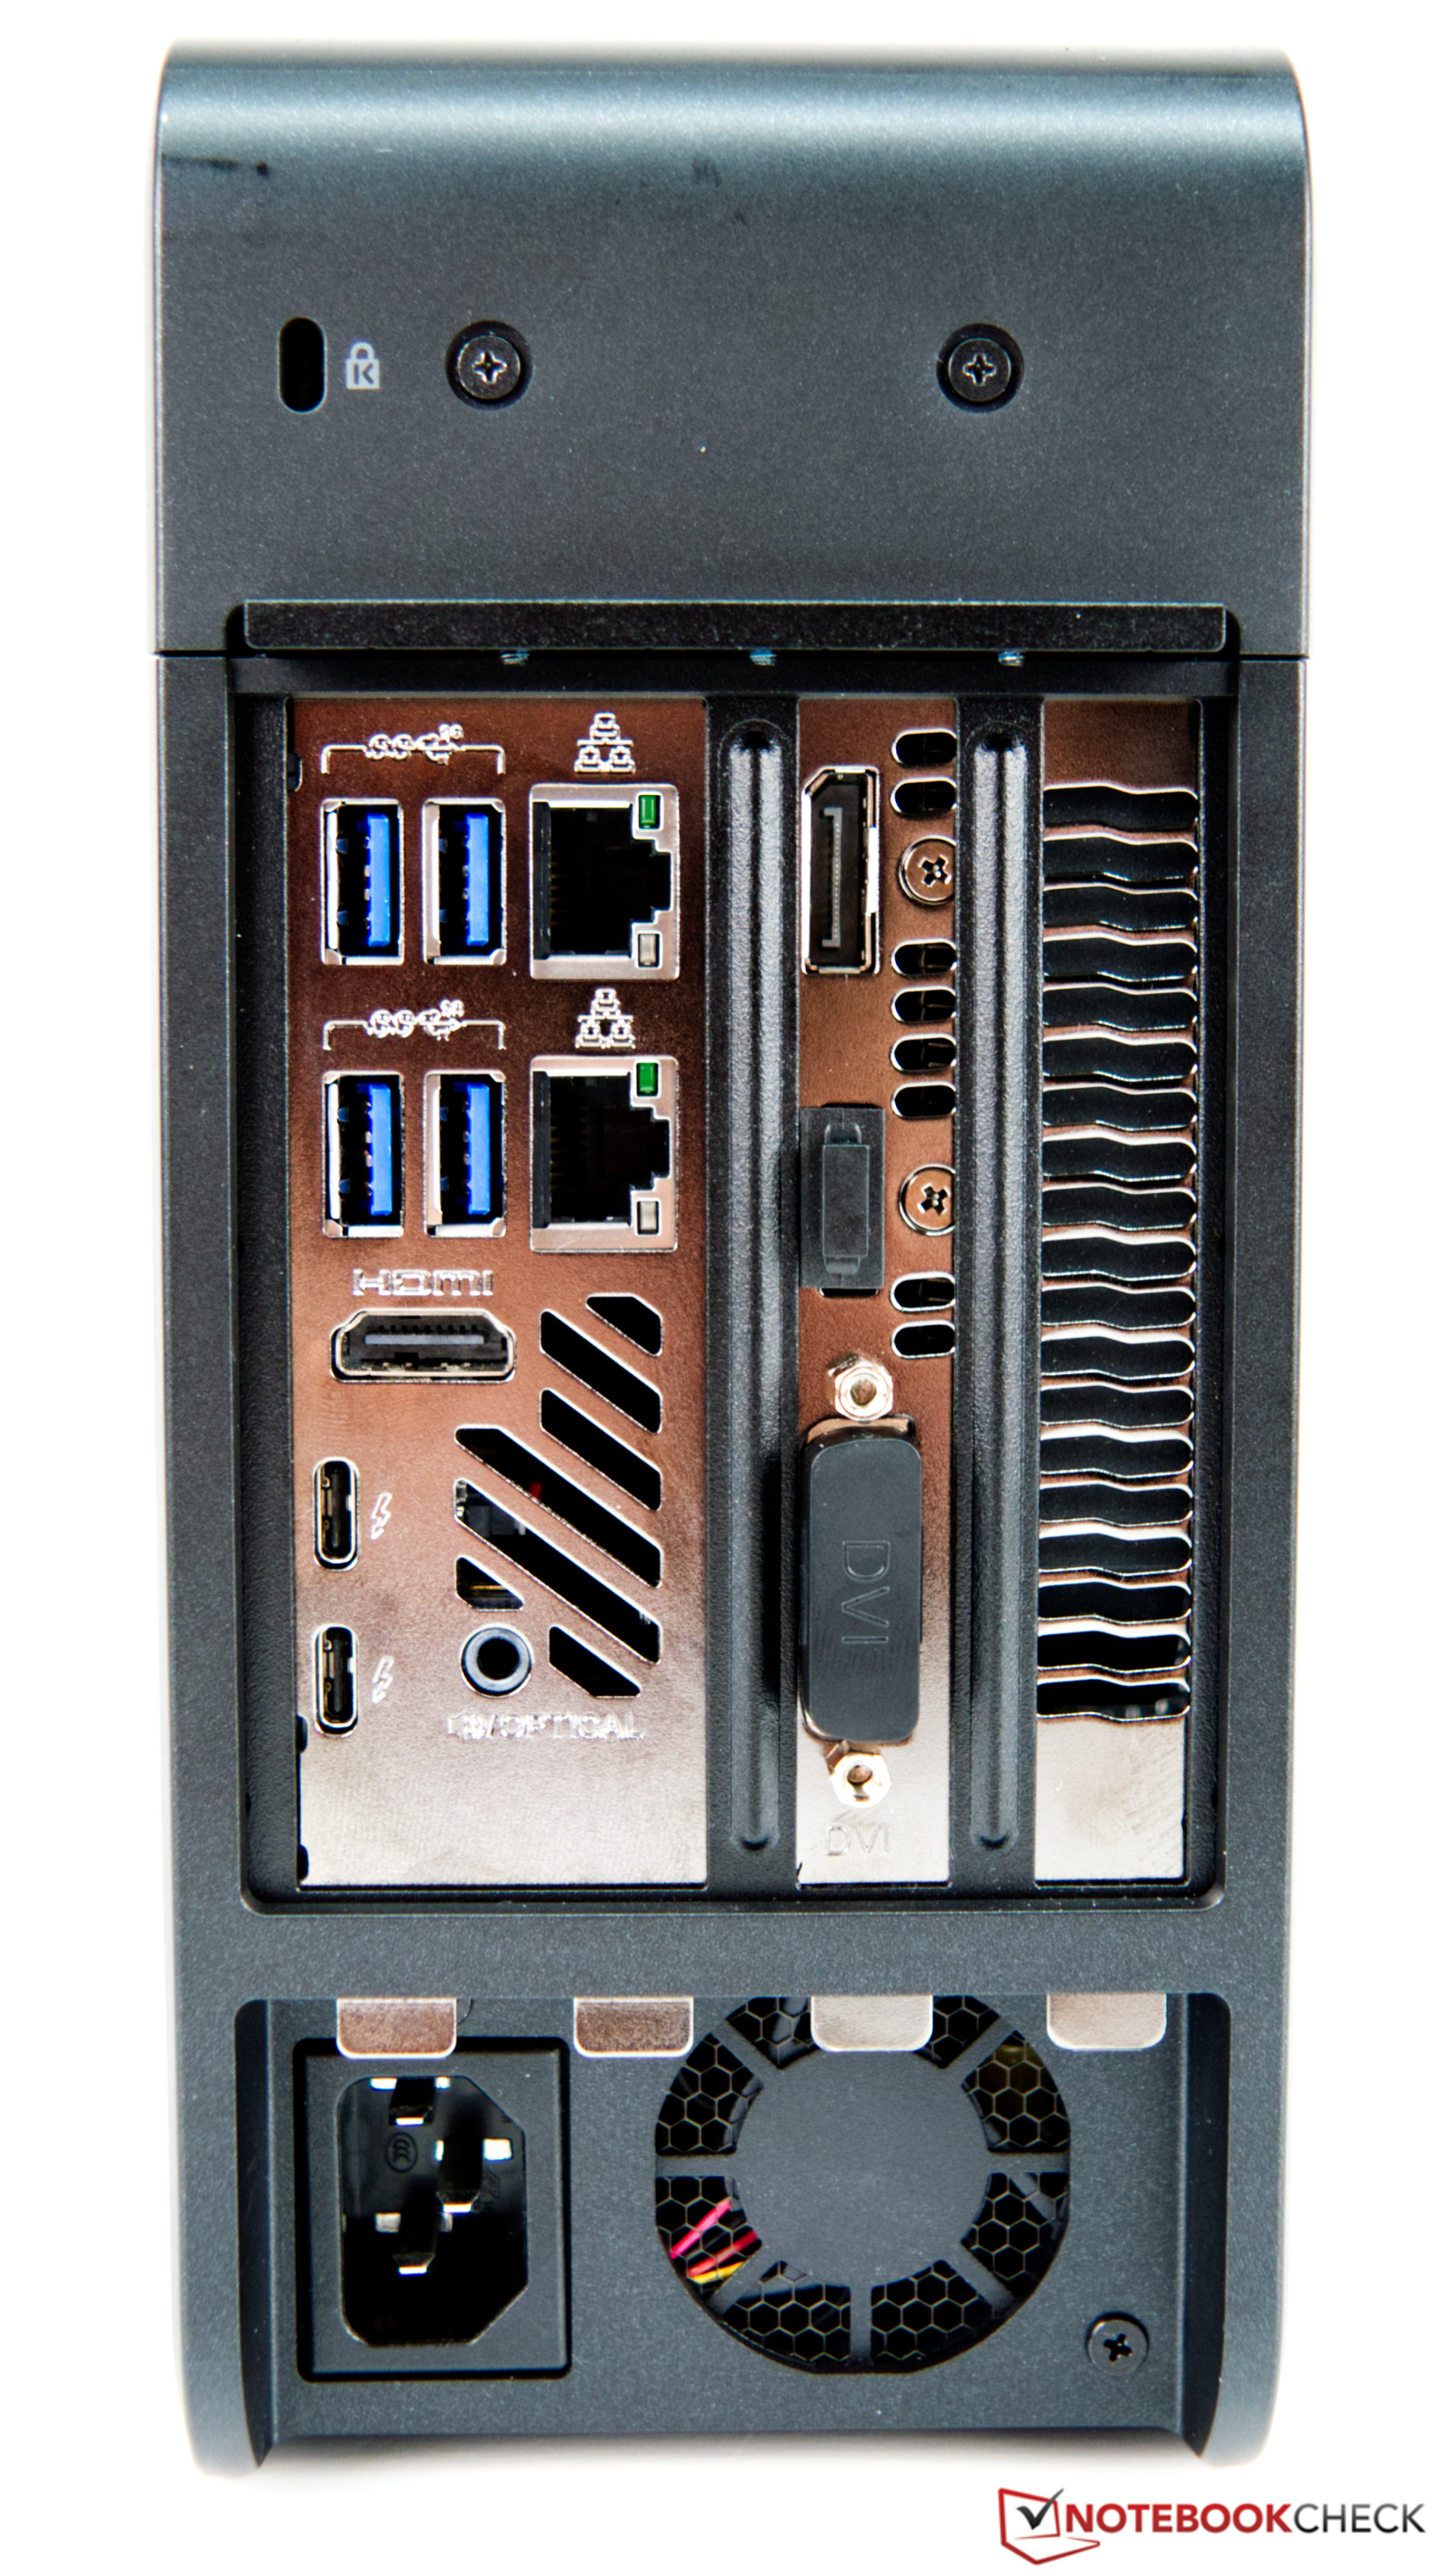
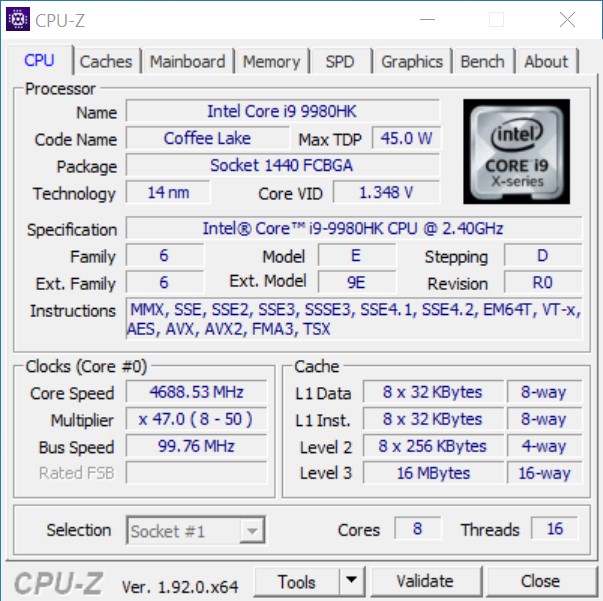
NUC 9 Extreme, 8 çekirdekli / 16 iş parçacıklı bir Intel Core i9-9980HK işlemci sunuyor. Mobil CPU, USB, LAN ve HDMI gibi tüm harici bağlantı noktalarını da içeren hesaplama öğesinin ana kartına lehimlenmiştir. Öndeki iki USB bağlantı noktasıyla birlikte NUC, ikisi de DisplayPort sinyali taşıyan Thunderbolt desteğine sahip USB-C bağlantı noktaları olmak üzere toplam sekiz USB bağlantı noktasına sahiptir. Böylece, ikisi USB-C ve diğeri HDMI 2.0b üzerinden olmak üzere SoC'nin iGPU'suna toplam üç ekran bağlayabilirsiniz. Ayrıca, iki SO-DIMM ve iki M.2 yuvası mevcuttur. Ağ bağlantısı, iki Ethernet bağlantı noktasından biri veya Wi-Fi 6 modülü üzerinden sağlanabilir. Bahsedilen Ethernet bağlantı noktalarından biri 2,5 Gbps'ye kadar hızları bile destekler.
İşlemci Deneyleri
Intel Core i9-9980HK, aynı işlemci ile donatılmış ortalama dizüstü bilgisayardan daha hızlı olmamakla birlikte, takdire değer bir performans sergiledi. İşleri renklendirmek ve size daha geniş bir resim sunmak için karışıma üç masaüstü CPU da ekledik: Intel Core i5-10600K, Intel Core i9-10900K ve AMD Ryzen 9 3950X. Bunlarla karşılaştırıldığında Core i9-9980HK, Core i5-10600K'ya benzer bir performans sergiledi ve 10 hatta 16 çekirdekli işlemciye yetişemedi. Tek çekirdekli performans ise Core i9-9980HK'nın güçlü kıyafeti idi ve Core i9-10900K'nın sadece birkaç yüzde altında performans gösterdi. Çok iş parçacıklı kıyaslamalarda CPU, masaüstü CPU'lara kıyasla eksik çekirdeklerini telafi edemedi. Ghost Canyon NUC'un ayrıca bir Intel Core i5-9300H ve Intel Core i7-9750H ile donatılabileceği göz önüne alındığında, bu ikisini de karşılaştırma grubumuza ekledik. Bu şekilde, bu iki SoC'den ne beklendiğine dair daha büyük ve daha eksiksiz bir resim elde edersiniz.
| Cinebench R15 | |
| CPU Single 64Bit | |
| Intel Core i9-10900K, NVIDIA Titan RTX | |
| Intel Core i9-9980HK, NVIDIA GeForce RTX 2070 (Desktop) | |
| AMD Ryzen 9 3950X, NVIDIA Titan RTX | |
| Intel Core i5-10600K, NVIDIA Titan RTX | |
| Ortalama Intel Core i9-9980HK (181 - 215, n=13) | |
| Ortalama Intel Core i7-9750H (170 - 194, n=82) | |
| Ortalama Intel Core i5-9300H (169 - 176, n=11) | |
| CPU Multi 64Bit | |
| AMD Ryzen 9 3950X, NVIDIA Titan RTX | |
| Intel Core i9-10900K, NVIDIA Titan RTX | |
| Ortalama Intel Core i9-9980HK (1327 - 1930, n=14) | |
| Intel Core i9-9980HK, NVIDIA GeForce RTX 2070 (Desktop) | |
| Intel Core i5-10600K, NVIDIA Titan RTX | |
| Ortalama Intel Core i7-9750H (952 - 1306, n=85) | |
| Ortalama Intel Core i5-9300H (717 - 850, n=11) | |
| Cinebench R20 | |
| CPU (Single Core) | |
| Intel Core i9-10900K, NVIDIA Titan RTX | |
| AMD Ryzen 9 3950X, NVIDIA Titan RTX | |
| Intel Core i9-9980HK, NVIDIA GeForce RTX 2070 (Desktop) | |
| Ortalama Intel Core i9-9980HK (431 - 505, n=10) | |
| Intel Core i5-10600K, NVIDIA Titan RTX | |
| Ortalama Intel Core i7-9750H (416 - 486, n=55) | |
| Ortalama Intel Core i5-9300H (398 - 427, n=9) | |
| CPU (Multi Core) | |
| AMD Ryzen 9 3950X, NVIDIA Titan RTX | |
| Intel Core i9-10900K, NVIDIA Titan RTX | |
| Ortalama Intel Core i9-9980HK (2974 - 4150, n=10) | |
| Intel Core i5-10600K, NVIDIA Titan RTX | |
| Intel Core i9-9980HK, NVIDIA GeForce RTX 2070 (Desktop) | |
| Ortalama Intel Core i7-9750H (2017 - 3133, n=55) | |
| Ortalama Intel Core i5-9300H (1530 - 1877, n=9) | |
| Cinebench R11.5 | |
| CPU Single 64Bit | |
| Intel Core i9-10900K, NVIDIA Titan RTX | |
| Intel Core i9-9980HK, NVIDIA GeForce RTX 2070 (Desktop) | |
| AMD Ryzen 9 3950X, NVIDIA Titan RTX | |
| Ortalama Intel Core i9-9980HK (2.25 - 2.4, n=3) | |
| Intel Core i5-10600K, NVIDIA Titan RTX | |
| Ortalama Intel Core i7-9750H (1.96 - 2.19, n=10) | |
| CPU Multi 64Bit | |
| AMD Ryzen 9 3950X, NVIDIA Titan RTX | |
| Intel Core i9-10900K, NVIDIA Titan RTX | |
| Intel Core i9-9980HK, NVIDIA GeForce RTX 2070 (Desktop) | |
| Ortalama Intel Core i9-9980HK (14.8 - 18, n=3) | |
| Intel Core i5-10600K, NVIDIA Titan RTX | |
| Ortalama Intel Core i7-9750H (11.3 - 14.1, n=10) | |
| Cinebench R10 | |
| Rendering Single CPUs 64Bit | |
| Intel Core i9-10900K, NVIDIA Titan RTX | |
| AMD Ryzen 9 3950X, NVIDIA Titan RTX | |
| Intel Core i9-9980HK, NVIDIA GeForce RTX 2070 (Desktop) | |
| Ortalama Intel Core i9-9980HK (n=1) | |
| Intel Core i5-10600K, NVIDIA Titan RTX | |
| Ortalama Intel Core i7-9750H (9069 - 9346, n=3) | |
| Rendering Multiple CPUs 64Bit | |
| AMD Ryzen 9 3950X, NVIDIA Titan RTX | |
| Intel Core i9-10900K, NVIDIA Titan RTX | |
| Intel Core i9-9980HK, NVIDIA GeForce RTX 2070 (Desktop) | |
| Ortalama Intel Core i9-9980HK (n=1) | |
| Intel Core i5-10600K, NVIDIA Titan RTX | |
| Ortalama Intel Core i7-9750H (37188 - 44238, n=3) | |
| Blender - v2.79 BMW27 CPU | |
| Ortalama Intel Core i5-9300H (588 - 643, n=3) | |
| Ortalama Intel Core i7-9750H (342 - 495, n=21) | |
| Ortalama Intel Core i9-9980HK (317 - 527, n=3) | |
| Intel Core i9-9980HK, NVIDIA GeForce RTX 2070 (Desktop) | |
| Intel Core i5-10600K, NVIDIA Titan RTX | |
| Intel Core i9-10900K, NVIDIA Titan RTX | |
| AMD Ryzen 9 3950X, NVIDIA Titan RTX | |
| wPrime 2.10 | |
| 32m | |
| Ortalama Intel Core i7-9750H (n=1) | |
| Intel Core i5-10600K, NVIDIA Titan RTX | |
| Ortalama Intel Core i9-9980HK (3.79 - 4.94, n=2) | |
| AMD Ryzen 9 3950X, NVIDIA Titan RTX | |
| Intel Core i9-9980HK, NVIDIA GeForce RTX 2070 (Desktop) | |
| Intel Core i9-10900K, NVIDIA Titan RTX | |
| 1024m | |
| Ortalama Intel Core i7-9750H (n=1) | |
| Intel Core i9-9980HK, NVIDIA GeForce RTX 2070 (Desktop) | |
| Ortalama Intel Core i9-9980HK (110.4 - 120.2, n=2) | |
| Intel Core i5-10600K, NVIDIA Titan RTX | |
| Intel Core i9-10900K, NVIDIA Titan RTX | |
| AMD Ryzen 9 3950X, NVIDIA Titan RTX | |
| X264 HD Benchmark 4.0 | |
| Pass 1 | |
| Intel Core i9-10900K, NVIDIA Titan RTX | |
| AMD Ryzen 9 3950X, NVIDIA Titan RTX | |
| Intel Core i5-10600K, NVIDIA Titan RTX | |
| Ortalama Intel Core i9-9980HK (238 - 239, n=2) | |
| Intel Core i9-9980HK, NVIDIA GeForce RTX 2070 (Desktop) | |
| Ortalama Intel Core i7-9750H (211 - 219, n=2) | |
| Ortalama Intel Core i5-9300H (n=1) | |
| Pass 2 | |
| AMD Ryzen 9 3950X, NVIDIA Titan RTX | |
| Intel Core i9-10900K, NVIDIA Titan RTX | |
| Ortalama Intel Core i9-9980HK (92.8 - 94.8, n=2) | |
| Intel Core i9-9980HK, NVIDIA GeForce RTX 2070 (Desktop) | |
| Intel Core i5-10600K, NVIDIA Titan RTX | |
| Ortalama Intel Core i7-9750H (69.6 - 70.9, n=2) | |
| Ortalama Intel Core i5-9300H (n=1) | |
| WinRAR - Result | |
| Intel Core i9-10900K, NVIDIA Titan RTX | |
| AMD Ryzen 9 3950X, NVIDIA Titan RTX | |
| Ortalama Intel Core i9-9980HK (7266 - 7436, n=2) | |
| Intel Core i9-9980HK, NVIDIA GeForce RTX 2070 (Desktop) | |
| Intel Core i5-10600K, NVIDIA Titan RTX | |
| Ortalama Intel Core i7-9750H (6160 - 6631, n=2) | |
| Ortalama Intel Core i5-9300H (n=1) | |
| TrueCrypt | |
| AES Mean 100MB | |
| Intel Core i9-10900K, NVIDIA Titan RTX | |
| AMD Ryzen 9 3950X, NVIDIA Titan RTX | |
| Ortalama Intel Core i9-9980HK (10.1 - 10.3, n=2) | |
| Intel Core i9-9980HK, NVIDIA GeForce RTX 2070 (Desktop) | |
| Intel Core i5-10600K, NVIDIA Titan RTX | |
| Ortalama Intel Core i7-9750H (7.3 - 7.4, n=2) | |
| Ortalama Intel Core i5-9300H (n=1) | |
| Twofish Mean 100MB | |
| AMD Ryzen 9 3950X, NVIDIA Titan RTX | |
| Intel Core i9-10900K, NVIDIA Titan RTX | |
| Intel Core i9-9980HK, NVIDIA GeForce RTX 2070 (Desktop) | |
| Ortalama Intel Core i9-9980HK (1.7 - 1.7, n=2) | |
| Intel Core i5-10600K, NVIDIA Titan RTX | |
| Ortalama Intel Core i7-9750H (1.2 - 1.3, n=2) | |
| Ortalama Intel Core i5-9300H (n=1) | |
| Serpent Mean 100MB | |
| AMD Ryzen 9 3950X, NVIDIA Titan RTX | |
| Intel Core i9-10900K, NVIDIA Titan RTX | |
| Intel Core i9-9980HK, NVIDIA GeForce RTX 2070 (Desktop) | |
| Ortalama Intel Core i9-9980HK (1 - 1, n=2) | |
| Intel Core i5-10600K, NVIDIA Titan RTX | |
| Ortalama Intel Core i7-9750H (0.7 - 0.75, n=2) | |
| Ortalama Intel Core i5-9300H (n=1) | |
| Geekbench 5.5 | |
| Multi-Core | |
| AMD Ryzen 9 3950X, NVIDIA Titan RTX | |
| Intel Core i9-10900K, NVIDIA Titan RTX | |
| Intel Core i9-9980HK, NVIDIA GeForce RTX 2070 (Desktop) | |
| Ortalama Intel Core i9-9980HK (6945 - 7703, n=3) | |
| Intel Core i5-10600K, NVIDIA Titan RTX | |
| Ortalama Intel Core i7-9750H (4859 - 6262, n=13) | |
| Single-Core | |
| Intel Core i9-10900K, NVIDIA Titan RTX | |
| Intel Core i9-9980HK, NVIDIA GeForce RTX 2070 (Desktop) | |
| Ortalama Intel Core i9-9980HK (1314 - 1378, n=2) | |
| AMD Ryzen 9 3950X, NVIDIA Titan RTX | |
| Intel Core i5-10600K, NVIDIA Titan RTX | |
| Ortalama Intel Core i7-9750H (1117 - 1251, n=13) | |
| Geekbench 5.0 | |
| 5.0 Multi-Core | |
| AMD Ryzen 9 3950X, NVIDIA Titan RTX | |
| Intel Core i9-10900K, NVIDIA Titan RTX | |
| Intel Core i9-9980HK, NVIDIA GeForce RTX 2070 (Desktop) | |
| Ortalama Intel Core i9-9980HK (7072 - 7805, n=4) | |
| Intel Core i5-10600K, NVIDIA Titan RTX | |
| Ortalama Intel Core i7-9750H (4812 - 6230, n=15) | |
| Ortalama Intel Core i5-9300H (3697 - 4200, n=3) | |
| 5.0 Single-Core | |
| Intel Core i9-10900K, NVIDIA Titan RTX | |
| Intel Core i9-9980HK, NVIDIA GeForce RTX 2070 (Desktop) | |
| AMD Ryzen 9 3950X, NVIDIA Titan RTX | |
| Intel Core i5-10600K, NVIDIA Titan RTX | |
| Ortalama Intel Core i9-9980HK (1171 - 1355, n=4) | |
| Ortalama Intel Core i7-9750H (1105 - 1248, n=15) | |
| Ortalama Intel Core i5-9300H (1095 - 1137, n=3) | |
| Geekbench 4.4 | |
| 64 Bit Single-Core Score | |
| Intel Core i9-10900K, NVIDIA Titan RTX | |
| Intel Core i9-9980HK, NVIDIA GeForce RTX 2070 (Desktop) | |
| Ortalama Intel Core i9-9980HK (5617 - 5972, n=3) | |
| Intel Core i5-10600K, NVIDIA Titan RTX | |
| AMD Ryzen 9 3950X, NVIDIA Titan RTX | |
| Ortalama Intel Core i7-9750H (4440 - 5511, n=27) | |
| Ortalama Intel Core i5-9300H (4704 - 5089, n=7) | |
| 64 Bit Multi-Core Score | |
| AMD Ryzen 9 3950X, NVIDIA Titan RTX | |
| Intel Core i9-10900K, NVIDIA Titan RTX | |
| Ortalama Intel Core i9-9980HK (28625 - 30849, n=3) | |
| Intel Core i9-9980HK, NVIDIA GeForce RTX 2070 (Desktop) | |
| Intel Core i5-10600K, NVIDIA Titan RTX | |
| Ortalama Intel Core i7-9750H (17054 - 25043, n=27) | |
| Ortalama Intel Core i5-9300H (14853 - 17684, n=7) | |
| 3DMark 11 - 1280x720 Performance Physics | |
| Intel Core i9-10900K, NVIDIA Titan RTX | |
| AMD Ryzen 9 3950X, NVIDIA Titan RTX | |
| Intel Core i9-9980HK, NVIDIA GeForce RTX 2070 (Desktop) | |
| Intel Core i5-10600K, NVIDIA Titan RTX | |
| Ortalama Intel Core i9-9980HK (9056 - 18260, n=12) | |
| Ortalama Intel Core i7-9750H (9704 - 14337, n=80) | |
| Intel Core i9-9980HK, Intel UHD Graphics 630 | |
| Ortalama Intel Core i5-9300H (7499 - 10557, n=12) | |
| 7-Zip 18.03 | |
| 7z b 4 | |
| AMD Ryzen 9 3950X, NVIDIA Titan RTX | |
| Intel Core i9-10900K, NVIDIA Titan RTX | |
| Intel Core i9-9980HK, NVIDIA GeForce RTX 2070 (Desktop) | |
| Ortalama Intel Core i9-9980HK (39566 - 44081, n=4) | |
| Intel Core i5-10600K, NVIDIA Titan RTX | |
| Ortalama Intel Core i7-9750H (28512 - 35174, n=21) | |
| Ortalama Intel Core i5-9300H (20736 - 23155, n=3) | |
| 7z b 4 -mmt1 | |
| Intel Core i9-10900K, NVIDIA Titan RTX | |
| Intel Core i9-9980HK, NVIDIA GeForce RTX 2070 (Desktop) | |
| Ortalama Intel Core i9-9980HK (5283 - 5642, n=4) | |
| AMD Ryzen 9 3950X, NVIDIA Titan RTX | |
| Intel Core i5-10600K, NVIDIA Titan RTX | |
| Ortalama Intel Core i7-9750H (4580 - 5090, n=21) | |
| Ortalama Intel Core i5-9300H (4542 - 4626, n=3) | |
| HWBOT x265 Benchmark v2.2 - 4k Preset | |
| Intel Core i9-10900K, NVIDIA Titan RTX | |
| AMD Ryzen 9 3950X, NVIDIA Titan RTX | |
| Intel Core i5-10600K, NVIDIA Titan RTX | |
| Ortalama Intel Core i9-9980HK (10.8 - 12.4, n=3) | |
| Intel Core i9-9980HK, NVIDIA GeForce RTX 2070 (Desktop) | |
| Ortalama Intel Core i7-9750H (7.1 - 10.7, n=21) | |
| Ortalama Intel Core i5-9300H (5.7 - 6.5, n=3) | |
| R Benchmark 2.5 - Overall mean | |
| Ortalama Intel Core i7-9750H (0.608 - 0.695, n=14) | |
| Intel Core i5-10600K, NVIDIA Titan RTX | |
| Intel Core i9-9980HK, NVIDIA GeForce RTX 2070 (Desktop) | |
| Ortalama Intel Core i9-9980HK (n=1) | |
| Intel Core i9-10900K, NVIDIA Titan RTX | |
| AMD Ryzen 9 3950X, NVIDIA Titan RTX | |
| LibreOffice - 20 Documents To PDF | |
| Intel Core i9-10900K, NVIDIA Titan RTX | |
| Ortalama Intel Core i7-9750H (54.5 - 64.7, n=9) | |
| AMD Ryzen 9 3950X, NVIDIA Titan RTX | |
| Ortalama Intel Core i9-9980HK (45.2 - 57.5, n=2) | |
| Intel Core i5-10600K, NVIDIA Titan RTX | |
| Intel Core i9-9980HK, NVIDIA GeForce RTX 2070 (Desktop) | |
| WebXPRT 3 - Overall | |
| Intel Core i9-10900K, NVIDIA Titan RTX | |
| AMD Ryzen 9 3950X, NVIDIA Titan RTX | |
| Intel Core i5-10600K, NVIDIA Titan RTX | |
| Intel Core i9-9980HK, NVIDIA GeForce RTX 2070 (Desktop) | |
| Ortalama Intel Core i9-9980HK (n=1) | |
| Ortalama Intel Core i5-9300H (n=1) | |
| Ortalama Intel Core i7-9750H (199 - 231, n=10) | |
| Mozilla Kraken 1.1 - Total | |
| Ortalama Intel Core i5-9300H (1079 - 1349, n=8) | |
| Ortalama Intel Core i7-9750H (845 - 1713, n=54) | |
| Ortalama Intel Core i9-9980HK (705 - 999, n=9) | |
| Intel Core i5-10600K, NVIDIA Titan RTX | |
| Intel Core i9-9980HK, NVIDIA GeForce RTX 2070 (Desktop) | |
| Intel Core i9-10900K, NVIDIA Titan RTX | |
| AMD Ryzen 9 3950X, NVIDIA Titan RTX | |
* ... daha küçük daha iyidir
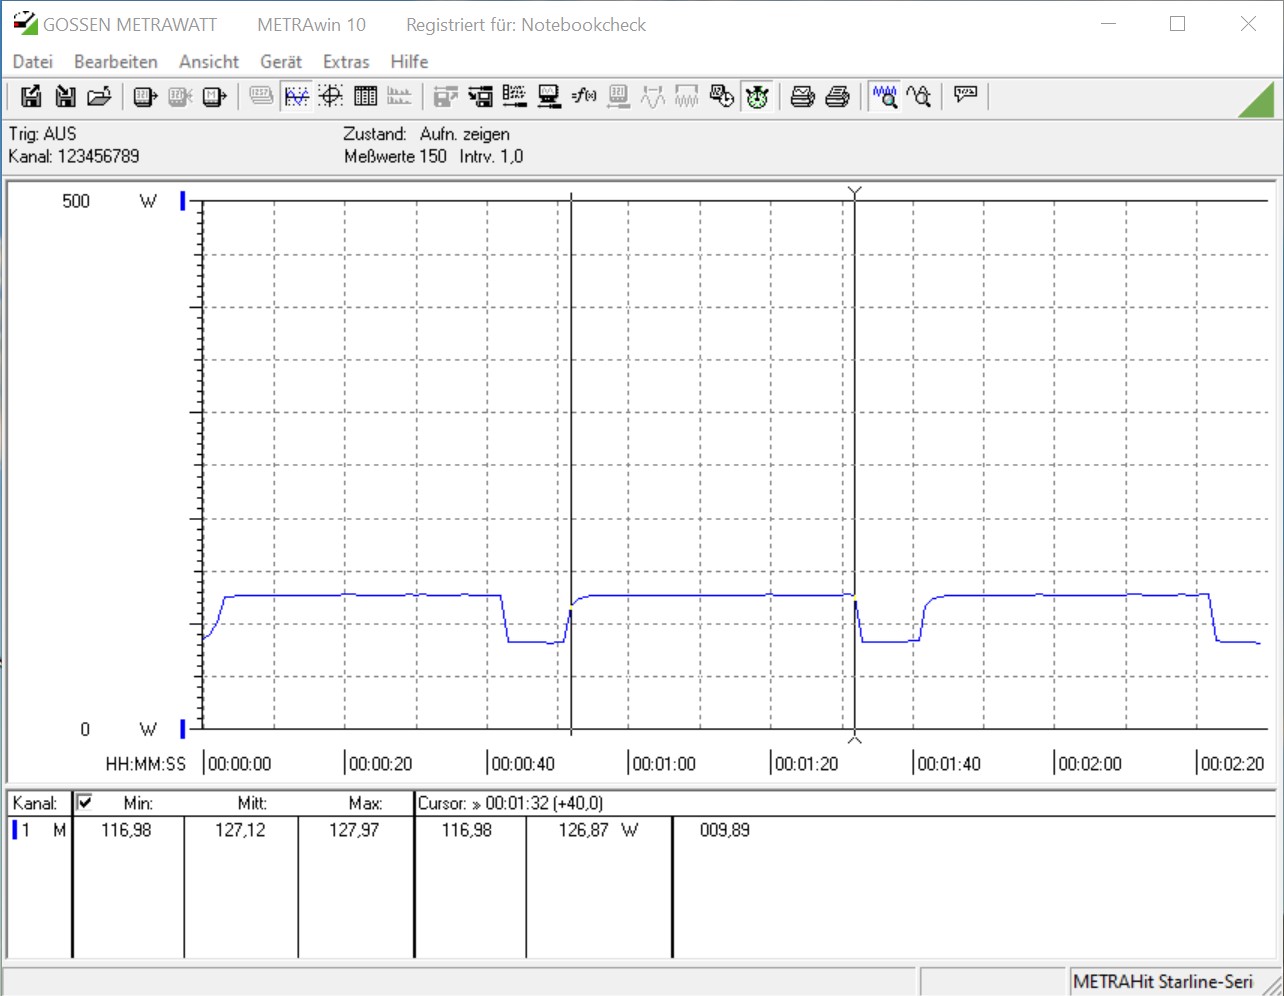
Cinebench R15 Döngüsünde Intel NUC 9 Extreme Kiti
Kompakt yapısına rağmen soğutma çözümü çok iyi çalıştı ve Cinebench R15 çok iş parçacıklı döngümüzde sürekli yüksek puanlar elde etmek için CPU'yu yeterince soğutmayı başardı. İlk iĢten sonra skorlar yaklaşık 150 puan düştü ve bu esnada Core i9-9980HK yüksek turbo güçlendirme özelliklerinden tam olarak yararlanabildi ve daha sonra sabit kaldı. Test örneğimiz ortalama olarak 1.463 puan almıştır. Aynı testi, GeForce RTX 2070 kaldırıldığında, durumdaki hava akışını bloke edip etmediğini belirlemek için yaptık ve durumun böyle olmadığını bildirmekten mutluluk duyuyoruz. Sonuçlar bir yana küçük sapmalar aynıydı.
Uygulama Performansı
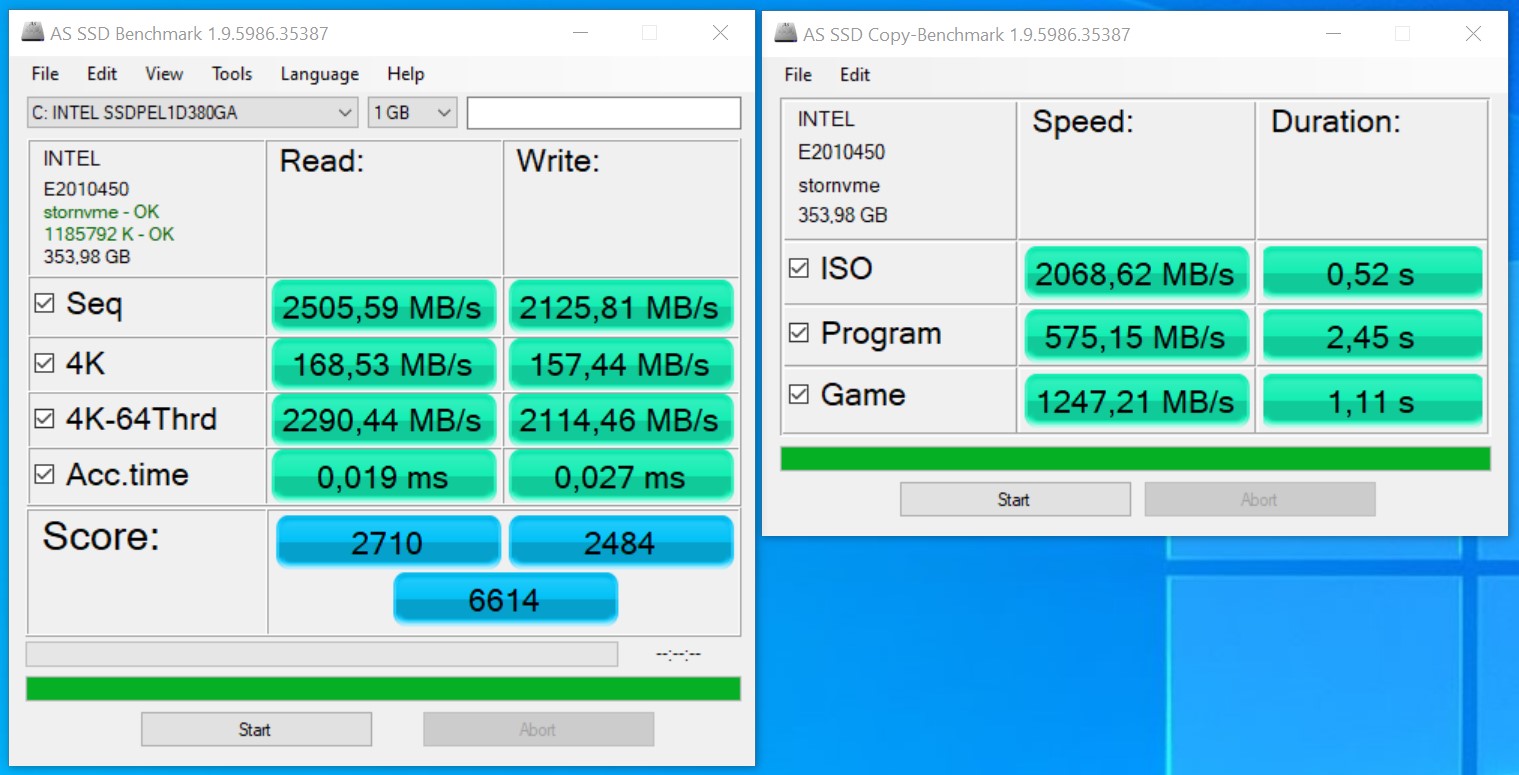
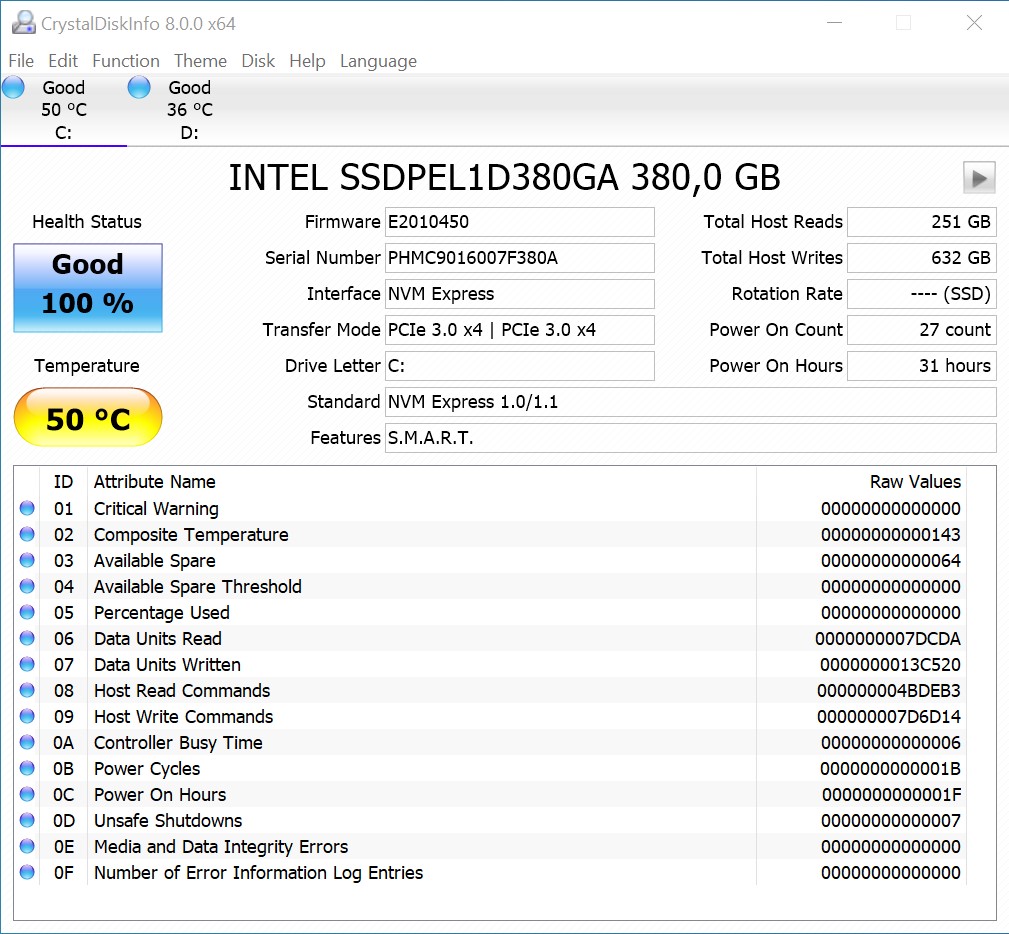
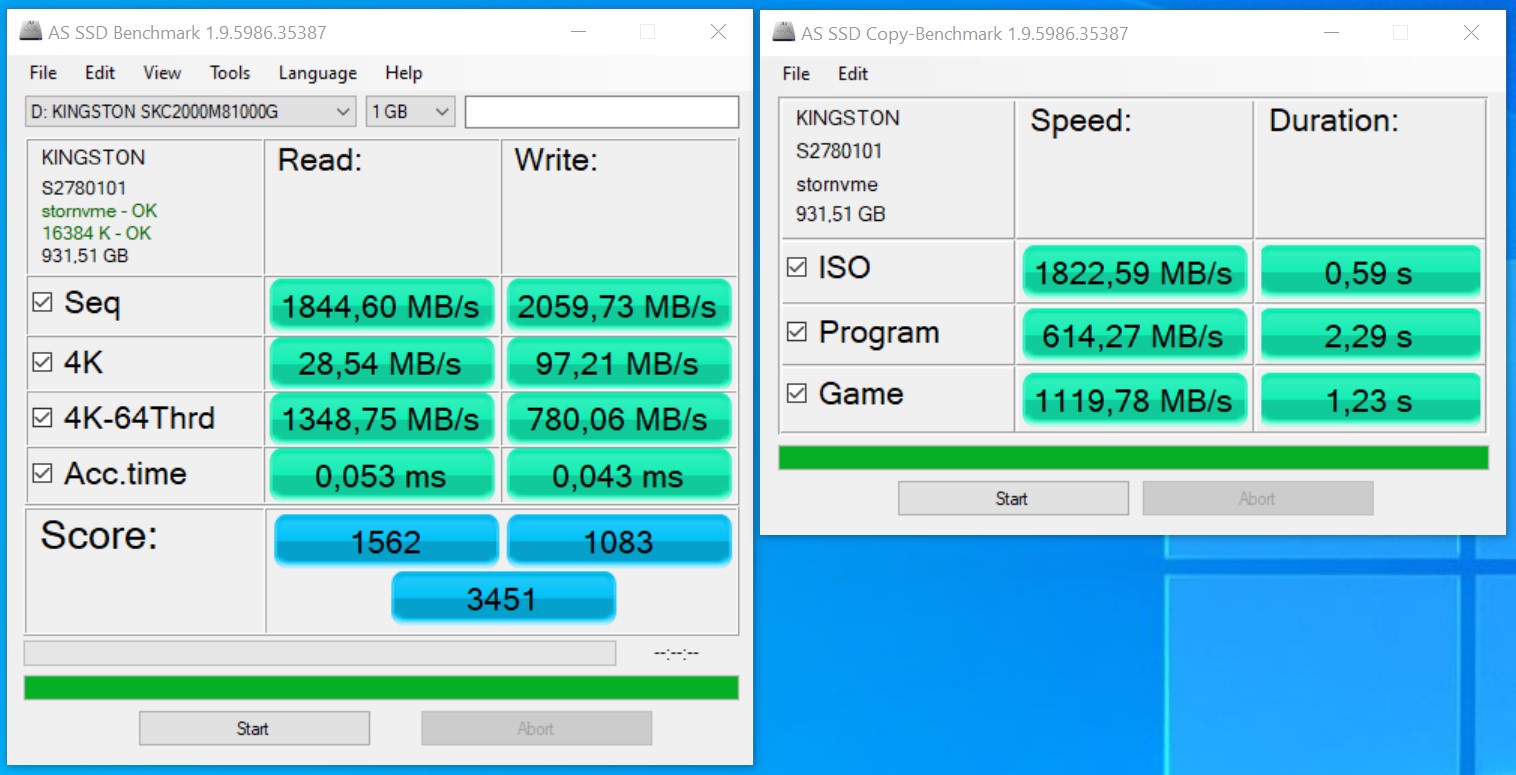
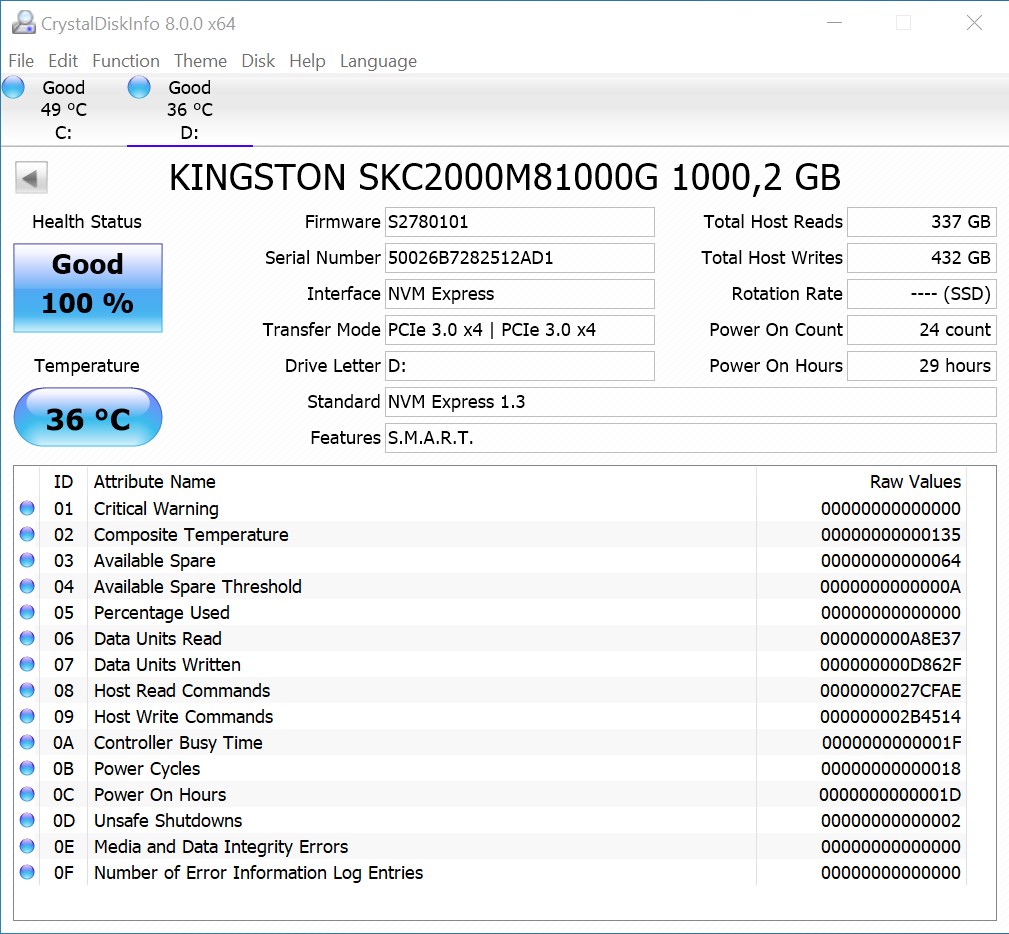
Test örneğimiz, uygulama performansı ölçütlerimizde üç masaüstü işlemciden utangaç bir performans gösterdi. Bir kez daha, özel GPU kaldırılmışken aynı testleri yaptık ve sonuçlar grafik testleri için aynı kaydedildi. Hiç kimsenin şaşırmaması için RTX2070'in 630'dan çok daha güçlü olduğu ortaya çıktı. Sonuç olarak, Intel NUC 9 günlük işler için harika bir cihaz. Takılan SSD'ler çok iyi performans gösterdi, bu da bekleme sürelerini en aza indirdi. Oyun testleri de cihaz için büyük bir zorluk değildi. Tam flaşlı bir NUC oluşturmak için Intel'e Kudos.
| PCMark 10 - Score | |
| AMD Ryzen 9 3950X, AMD Ryzen 9 3950X | |
| Intel Core i9-10900K, Intel Core i9-10900K | |
| Corsair One i160, Intel Core i9-9900K | |
| Intel Core i5-10600K, Intel Core i5-10600K | |
| Intel Ghost Canyon NUC (RTX 2070), Intel Core i9-9980HK | |
| Intel Ghost Canyon NUC, Intel Core i9-9980HK | |
| PCMark 8 | |
| Work Score Accelerated v2 | |
| AMD Ryzen 9 3950X, AMD Ryzen 9 3950X | |
| Corsair One i160, Intel Core i9-9900K | |
| Intel Core i5-10600K, Intel Core i5-10600K | |
| Intel Core i9-10900K, Intel Core i9-10900K | |
| Intel Ghost Canyon NUC (RTX 2070), Intel Core i9-9980HK | |
| Intel Ghost Canyon NUC, Intel Core i9-9980HK | |
| Creative Score Accelerated v2 | |
| Corsair One i160, Intel Core i9-9900K | |
| AMD Ryzen 9 3950X, AMD Ryzen 9 3950X | |
| Intel Core i5-10600K, Intel Core i5-10600K | |
| Intel Core i9-10900K, Intel Core i9-10900K | |
| Intel Ghost Canyon NUC (RTX 2070), Intel Core i9-9980HK | |
| Intel Ghost Canyon NUC, Intel Core i9-9980HK | |
| Home Score Accelerated v2 | |
| Corsair One i160, Intel Core i9-9900K | |
| AMD Ryzen 9 3950X, AMD Ryzen 9 3950X | |
| Intel Ghost Canyon NUC (RTX 2070), Intel Core i9-9980HK | |
| Intel Core i5-10600K, Intel Core i5-10600K | |
| Intel Core i9-10900K, Intel Core i9-10900K | |
| Intel Ghost Canyon NUC, Intel Core i9-9980HK | |
| SPECviewperf 12 | |
| 1900x1060 Solidworks (sw-03) | |
| Intel Core i9-10900K, Intel Core i9-10900K | |
| Intel Core i5-10600K, Intel Core i5-10600K | |
| AMD Ryzen 9 3950X, AMD Ryzen 9 3950X | |
| Corsair One i160, Intel Core i9-9900K | |
| Intel Ghost Canyon NUC (RTX 2070), Intel Core i9-9980HK | |
| Intel Ghost Canyon NUC, Intel Core i9-9980HK | |
| 1900x1060 Siemens NX (snx-02) | |
| Intel Core i9-10900K, Intel Core i9-10900K | |
| Intel Core i5-10600K, Intel Core i5-10600K | |
| AMD Ryzen 9 3950X, AMD Ryzen 9 3950X | |
| Corsair One i160, Intel Core i9-9900K | |
| Intel Ghost Canyon NUC (RTX 2070), Intel Core i9-9980HK | |
| Intel Ghost Canyon NUC, Intel Core i9-9980HK | |
| 1900x1060 Showcase (showcase-01) | |
| Intel Core i5-10600K, Intel Core i5-10600K | |
| Intel Core i9-10900K, Intel Core i9-10900K | |
| AMD Ryzen 9 3950X, AMD Ryzen 9 3950X | |
| Corsair One i160, Intel Core i9-9900K | |
| Intel Ghost Canyon NUC (RTX 2070), Intel Core i9-9980HK | |
| Intel Ghost Canyon NUC, Intel Core i9-9980HK | |
| 1900x1060 Medical (medical-01) | |
| Intel Core i5-10600K, Intel Core i5-10600K | |
| Intel Core i9-10900K, Intel Core i9-10900K | |
| AMD Ryzen 9 3950X, AMD Ryzen 9 3950X | |
| Corsair One i160, Intel Core i9-9900K | |
| Intel Ghost Canyon NUC (RTX 2070), Intel Core i9-9980HK | |
| Intel Ghost Canyon NUC, Intel Core i9-9980HK | |
| 1900x1060 Maya (maya-04) | |
| Corsair One i160, Intel Core i9-9900K | |
| Intel Core i9-10900K, Intel Core i9-10900K | |
| AMD Ryzen 9 3950X, AMD Ryzen 9 3950X | |
| Intel Ghost Canyon NUC (RTX 2070), Intel Core i9-9980HK | |
| Intel Core i5-10600K, Intel Core i5-10600K | |
| Intel Ghost Canyon NUC, Intel Core i9-9980HK | |
| 1900x1060 Energy (energy-01) | |
| Intel Core i5-10600K, Intel Core i5-10600K | |
| Intel Core i9-10900K, Intel Core i9-10900K | |
| AMD Ryzen 9 3950X, AMD Ryzen 9 3950X | |
| Corsair One i160, Intel Core i9-9900K | |
| Intel Ghost Canyon NUC (RTX 2070), Intel Core i9-9980HK | |
| Intel Ghost Canyon NUC, Intel Core i9-9980HK | |
| 1900x1060 Creo (creo-01) | |
| Intel Core i9-10900K, Intel Core i9-10900K | |
| Intel Core i5-10600K, Intel Core i5-10600K | |
| AMD Ryzen 9 3950X, AMD Ryzen 9 3950X | |
| Corsair One i160, Intel Core i9-9900K | |
| Intel Ghost Canyon NUC (RTX 2070), Intel Core i9-9980HK | |
| Intel Ghost Canyon NUC, Intel Core i9-9980HK | |
| 1900x1060 Catia (catia-04) | |
| Intel Core i9-10900K, Intel Core i9-10900K | |
| AMD Ryzen 9 3950X, AMD Ryzen 9 3950X | |
| Intel Core i5-10600K, Intel Core i5-10600K | |
| Corsair One i160, Intel Core i9-9900K | |
| Intel Ghost Canyon NUC (RTX 2070), Intel Core i9-9980HK | |
| Intel Ghost Canyon NUC, Intel Core i9-9980HK | |
| 1900x1060 3ds Max (3dsmax-05) | |
| Intel Core i9-10900K, Intel Core i9-10900K | |
| Intel Core i5-10600K, Intel Core i5-10600K | |
| AMD Ryzen 9 3950X, AMD Ryzen 9 3950X | |
| Corsair One i160, Intel Core i9-9900K | |
| Intel Ghost Canyon NUC (RTX 2070), Intel Core i9-9980HK | |
| Intel Ghost Canyon NUC, Intel Core i9-9980HK | |
| SPECviewperf 13 | |
| Solidworks (sw-04) | |
| Intel Core i9-10900K, Intel Core i9-10900K | |
| Intel Core i5-10600K, Intel Core i5-10600K | |
| AMD Ryzen 9 3950X, AMD Ryzen 9 3950X | |
| Corsair One i160, Intel Core i9-9900K | |
| Intel Ghost Canyon NUC (RTX 2070), Intel Core i9-9980HK | |
| Intel Ghost Canyon NUC, Intel Core i9-9980HK | |
| Siemens NX (snx-03) | |
| Intel Core i9-10900K, Intel Core i9-10900K | |
| Intel Core i5-10600K, Intel Core i5-10600K | |
| AMD Ryzen 9 3950X, AMD Ryzen 9 3950X | |
| Corsair One i160, Intel Core i9-9900K | |
| Intel Ghost Canyon NUC (RTX 2070), Intel Core i9-9980HK | |
| Intel Ghost Canyon NUC, Intel Core i9-9980HK | |
| Showcase (showcase-02) | |
| Intel Core i5-10600K, Intel Core i5-10600K | |
| Intel Core i9-10900K, Intel Core i9-10900K | |
| AMD Ryzen 9 3950X, AMD Ryzen 9 3950X | |
| Corsair One i160, Intel Core i9-9900K | |
| Intel Ghost Canyon NUC (RTX 2070), Intel Core i9-9980HK | |
| Intel Ghost Canyon NUC, Intel Core i9-9980HK | |
| Medical (medical-02) | |
| AMD Ryzen 9 3950X, AMD Ryzen 9 3950X | |
| Intel Core i5-10600K, Intel Core i5-10600K | |
| Intel Core i9-10900K, Intel Core i9-10900K | |
| Corsair One i160, Intel Core i9-9900K | |
| Intel Ghost Canyon NUC (RTX 2070), Intel Core i9-9980HK | |
| Intel Ghost Canyon NUC, Intel Core i9-9980HK | |
| Maya (maya-05) | |
| Intel Core i9-10900K, Intel Core i9-10900K | |
| Corsair One i160, Intel Core i9-9900K | |
| AMD Ryzen 9 3950X, AMD Ryzen 9 3950X | |
| Intel Core i5-10600K, Intel Core i5-10600K | |
| Intel Ghost Canyon NUC (RTX 2070), Intel Core i9-9980HK | |
| Intel Ghost Canyon NUC, Intel Core i9-9980HK | |
| Energy (energy-02) | |
| Intel Core i5-10600K, Intel Core i5-10600K | |
| Intel Core i9-10900K, Intel Core i9-10900K | |
| AMD Ryzen 9 3950X, AMD Ryzen 9 3950X | |
| Corsair One i160, Intel Core i9-9900K | |
| Intel Ghost Canyon NUC (RTX 2070), Intel Core i9-9980HK | |
| Intel Ghost Canyon NUC, Intel Core i9-9980HK | |
| Creo (creo-02) | |
| Intel Core i9-10900K, Intel Core i9-10900K | |
| Intel Core i5-10600K, Intel Core i5-10600K | |
| AMD Ryzen 9 3950X, AMD Ryzen 9 3950X | |
| Corsair One i160, Intel Core i9-9900K | |
| Intel Ghost Canyon NUC (RTX 2070), Intel Core i9-9980HK | |
| Intel Ghost Canyon NUC, Intel Core i9-9980HK | |
| Catia (catia-05) | |
| Intel Core i9-10900K, Intel Core i9-10900K | |
| AMD Ryzen 9 3950X, AMD Ryzen 9 3950X | |
| Intel Core i5-10600K, Intel Core i5-10600K | |
| Corsair One i160, Intel Core i9-9900K | |
| Intel Ghost Canyon NUC (RTX 2070), Intel Core i9-9980HK | |
| Intel Ghost Canyon NUC, Intel Core i9-9980HK | |
| 3ds Max (3dsmax-06) | |
| Intel Core i5-10600K, Intel Core i5-10600K | |
| Intel Core i9-10900K, Intel Core i9-10900K | |
| AMD Ryzen 9 3950X, AMD Ryzen 9 3950X | |
| Corsair One i160, Intel Core i9-9900K | |
| Intel Ghost Canyon NUC (RTX 2070), Intel Core i9-9980HK | |
| Intel Ghost Canyon NUC, Intel Core i9-9980HK | |
3D ve Oyun Performansı
3D performansı, sistemin hangi GPU'ya sahip olduğuna bağlıdır. NUC'un varsayılan olarak özel bir GPU olmadan geldiği göz önüne alındığında, Core i9-9980HK'nın entegre GPU'sundaki tüm kriterleri tekrarladık. İnceleme birimimiz ortalama Intel UHD Graphics 630'dan çok daha iyi performans gösterdi. Bununla birlikte, zorlu oyunlar için çok yavaş kaldı. Asus GeForce RTX 2070 Mini kullanarak QHD'de mükemmel bir şekilde çalıştı. Daha güçlü GPU'ların NUC'nin 500 W güç kaynağı için çok fazla olabileceğini unutmayın.
| Borderlands 3 | |
| 1280x720 Very Low Overall Quality (DX11) | |
| Intel Ghost Canyon NUC (RTX 2070) | |
| Ortalama NVIDIA GeForce RTX 2070 (Desktop) (138 - 152, n=2) | |
| Ortalama NVIDIA GeForce RTX 2070 Mobile (94 - 125, n=2) | |
| Ortalama Intel UHD Graphics 630 (n=1) | |
| 1920x1080 Badass Overall Quality (DX11) | |
| Ortalama NVIDIA GeForce RTX 2070 (Desktop) (70.9 - 74.4, n=2) | |
| Intel Ghost Canyon NUC (RTX 2070) | |
| Ortalama NVIDIA GeForce RTX 2070 Mobile (61 - 64.5, n=3) | |
| Metro Exodus | |
| 1280x720 Low Quality AF:4x | |
| Intel Ghost Canyon NUC (RTX 2070) | |
| Ortalama NVIDIA GeForce RTX 2070 (Desktop) (82.7 - 181, n=4) | |
| Ortalama NVIDIA GeForce RTX 2070 Mobile (91.1 - 98, n=2) | |
| Ortalama Intel UHD Graphics 630 (n=1) | |
| 1920x1080 Ultra Quality AF:16x | |
| Intel Ghost Canyon NUC (RTX 2070) | |
| Ortalama NVIDIA GeForce RTX 2070 (Desktop) (33.4 - 62.8, n=4) | |
| Ortalama NVIDIA GeForce RTX 2070 Mobile (53.3 - 54.6, n=5) | |
| Far Cry New Dawn | |
| 1280x720 Low Preset | |
| Intel Ghost Canyon NUC (RTX 2070) | |
| Ortalama NVIDIA GeForce RTX 2070 (Desktop) (117 - 128, n=3) | |
| Ortalama Intel UHD Graphics 630 (n=1) | |
| 1920x1080 Ultra Preset | |
| Ortalama NVIDIA GeForce RTX 2070 (Desktop) (79 - 94, n=3) | |
| Ortalama NVIDIA GeForce RTX 2070 Mobile (82 - 83, n=2) | |
| Intel Ghost Canyon NUC (RTX 2070) | |
| Forza Horizon 4 | |
| 1280x720 Very Low Preset | |
| Intel Ghost Canyon NUC (RTX 2070) | |
| Ortalama NVIDIA GeForce RTX 2070 (Desktop) (169 - 198, n=4) | |
| Ortalama NVIDIA GeForce RTX 2070 Mobile (n=1) | |
| 1920x1080 Ultra Preset AA:2xMS | |
| Ortalama NVIDIA GeForce RTX 2070 (Desktop) (106 - 118, n=4) | |
| Intel Ghost Canyon NUC (RTX 2070) | |
| Ortalama NVIDIA GeForce RTX 2070 Mobile (n=1) | |
| Final Fantasy XV Benchmark | |
| 1280x720 Lite Quality | |
| Intel Ghost Canyon NUC (RTX 2070) | |
| Ortalama NVIDIA GeForce RTX 2070 Mobile (151 - 158, n=2) | |
| Ortalama NVIDIA GeForce RTX 2070 (Desktop) (106.5 - 193, n=5) | |
| Ortalama Intel UHD Graphics 630 (9.5 - 14, n=3) | |
| 1920x1080 High Quality | |
| Intel Ghost Canyon NUC (RTX 2070) | |
| Ortalama NVIDIA GeForce RTX 2070 (Desktop) (60.8 - 90.6, n=5) | |
| Ortalama NVIDIA GeForce RTX 2070 Mobile (77 - 80.6, n=3) | |
| Dota 2 Reborn | |
| 1280x720 min (0/3) fastest | |
| Intel Ghost Canyon NUC (RTX 2070) | |
| Ortalama NVIDIA GeForce RTX 2070 (Desktop) (n=1) | |
| Ortalama NVIDIA GeForce RTX 2070 Mobile (129.7 - 153, n=9) | |
| Ortalama Intel UHD Graphics 630 (70.4 - 99.1, n=11) | |
| 1920x1080 ultra (3/3) best looking | |
| Intel Ghost Canyon NUC (RTX 2070) | |
| Ortalama NVIDIA GeForce RTX 2070 (Desktop) (n=1) | |
| Ortalama NVIDIA GeForce RTX 2070 Mobile (98.4 - 124, n=9) | |
| Ortalama Intel UHD Graphics 630 (6.8 - 21, n=11) | |
| The Witcher 3 | |
| 1024x768 Low Graphics & Postprocessing | |
| Ortalama NVIDIA GeForce RTX 2070 Mobile (193.9 - 357, n=12) | |
| Intel Ghost Canyon NUC (RTX 2070) | |
| Ortalama NVIDIA GeForce RTX 2070 (Desktop) (151.4 - 315, n=5) | |
| Ortalama Intel UHD Graphics 630 (15.2 - 17.3, n=3) | |
| 1920x1080 Ultra Graphics & Postprocessing (HBAO+) | |
| Intel Ghost Canyon NUC (RTX 2070) | |
| Ortalama NVIDIA GeForce RTX 2070 (Desktop) (40.9 - 95, n=5) | |
| Ortalama NVIDIA GeForce RTX 2070 Mobile (64 - 82.1, n=21) | |
| düşük | orta | yüksek | ultra | QHD DLSS | QHD | 4K | |
|---|---|---|---|---|---|---|---|
| The Witcher 3 (2015) | 286 | 216 | 142 | 83.1 | 55.9 | ||
| Dota 2 Reborn (2015) | 155.6 | 141.8 | 137.6 | 130.3 | 116.1 | ||
| Final Fantasy XV Benchmark (2018) | 193 | 122 | 90.6 | 37.1 | |||
| X-Plane 11.11 (2018) | 127 | 115 | 92.7 | 82.2 | |||
| Far Cry 5 (2018) | 147 | 106 | 82 | 86 | 71 | 46 | |
| Strange Brigade (2018) | 431 | 233 | 184.1 | 158.6 | 114.8 | 65.1 | |
| Forza Horizon 4 (2018) | 198 | 141 | 132 | 106 | 88 | 61 | |
| Far Cry New Dawn (2019) | 128 | 92 | 87 | 79 | 63 | 49 | |
| Metro Exodus (2019) | 181 | 104 | 77 | 60.9 | 48.4 | 30.5 | |
| Borderlands 3 (2019) | 152 | 126 | 91.7 | 70.9 | 49.8 | 26.7 | |
| Baldur's Gate 3 (2023) | 80.4 | 81.6 | 52.3 | 29.8 | |||
| Cyberpunk 2077 (2023) | 109.3 | 87.5 | 75.6 | 66.5 | 40.6 | ||
| Space Marine 2 (2024) | 58 | ||||||
| Stalker 2 (2024) | 35.5 | 29.5 | |||||
| Indiana Jones and the Great Circle (2024) | 75.4 | 49.4 | |||||
| Kingdom Come Deliverance 2 (2025) | 101.4 | 78.1 | 63.4 | 45.6 | |||
| Civilization 7 (2025) | 106.2 | 71.5 | 37.3 | ||||
| The Elder Scrolls IV Oblivion Remastered (2025) | 62.1 | 42.7 | 35 | 23.9 | 11.8 | ||
| Doom: The Dark Ages (2025) | 52.7 | 44.6 | 40.5 | 38.7 | |||
| F1 25 (2025) | 175.9 | 156.8 | 120.8 | ||||
| Borderlands 4 (2025) | 33.6 | 30.1 | 22.8 | 14.8 | |||
| ARC Raiders (2025) | 138.7 | 83.4 | 68.2 | 33.3 | |||
| Forza Horizon 6 (2026) | 63 | 34 | 13 |
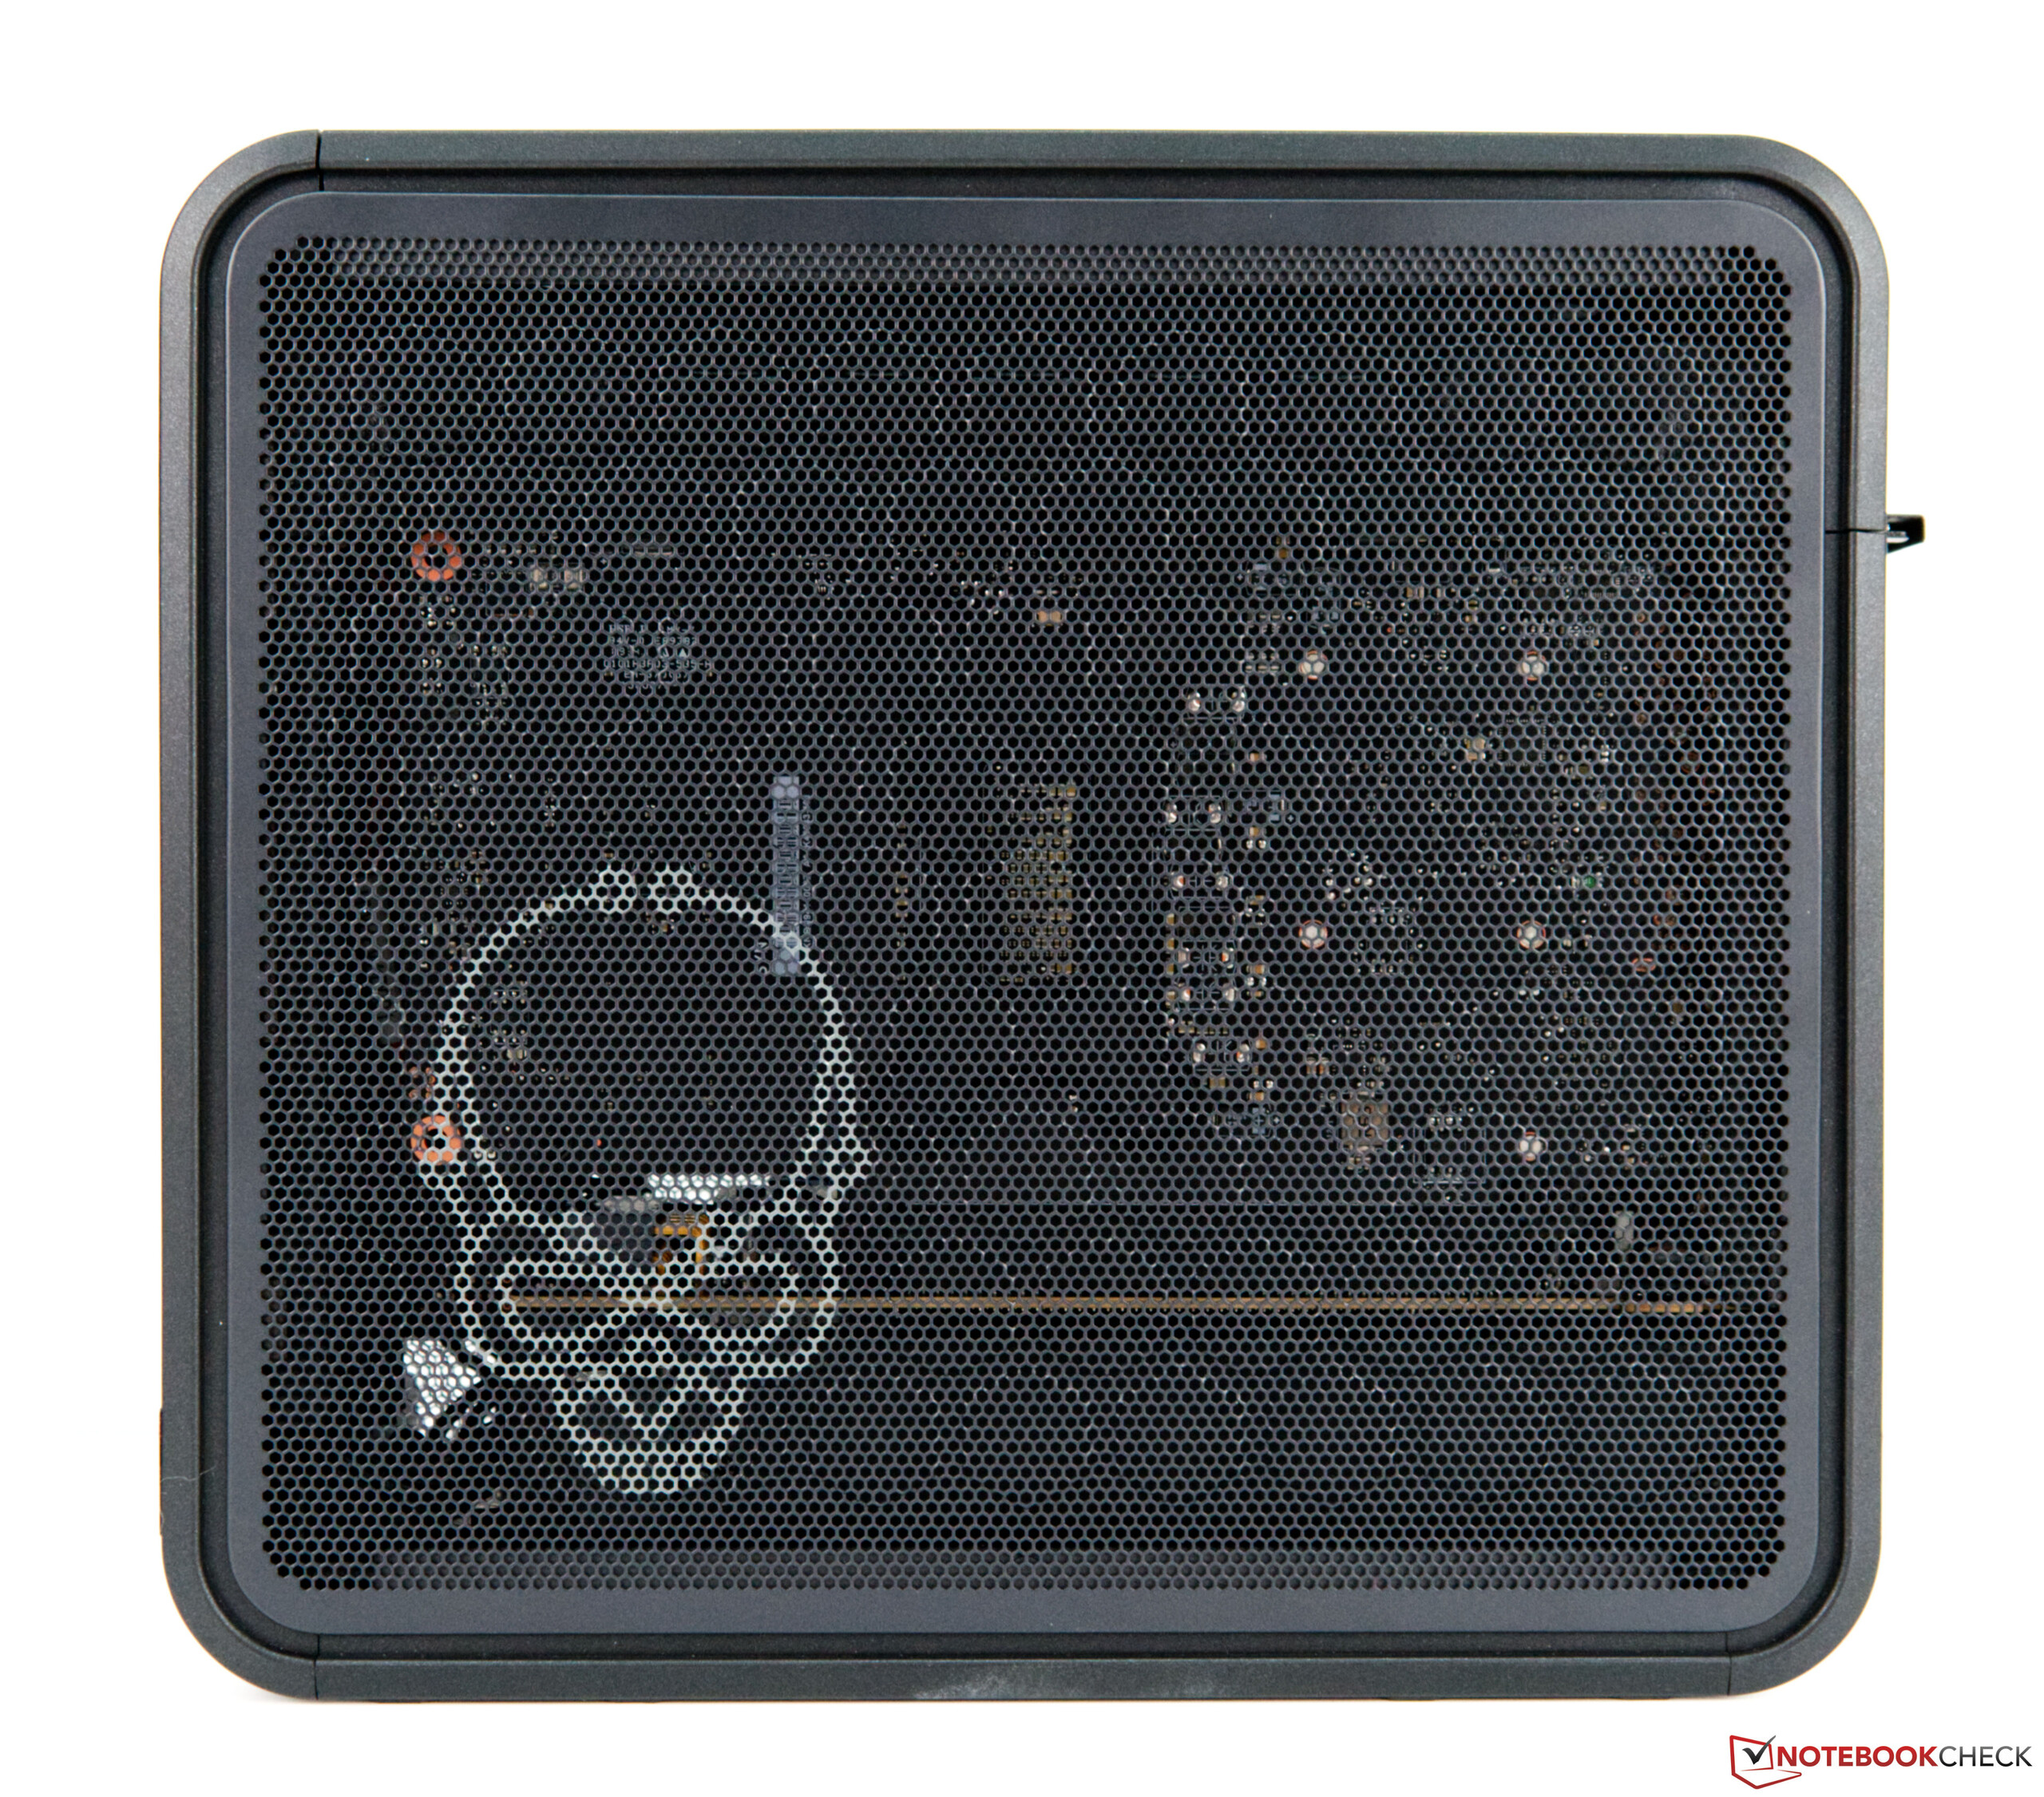
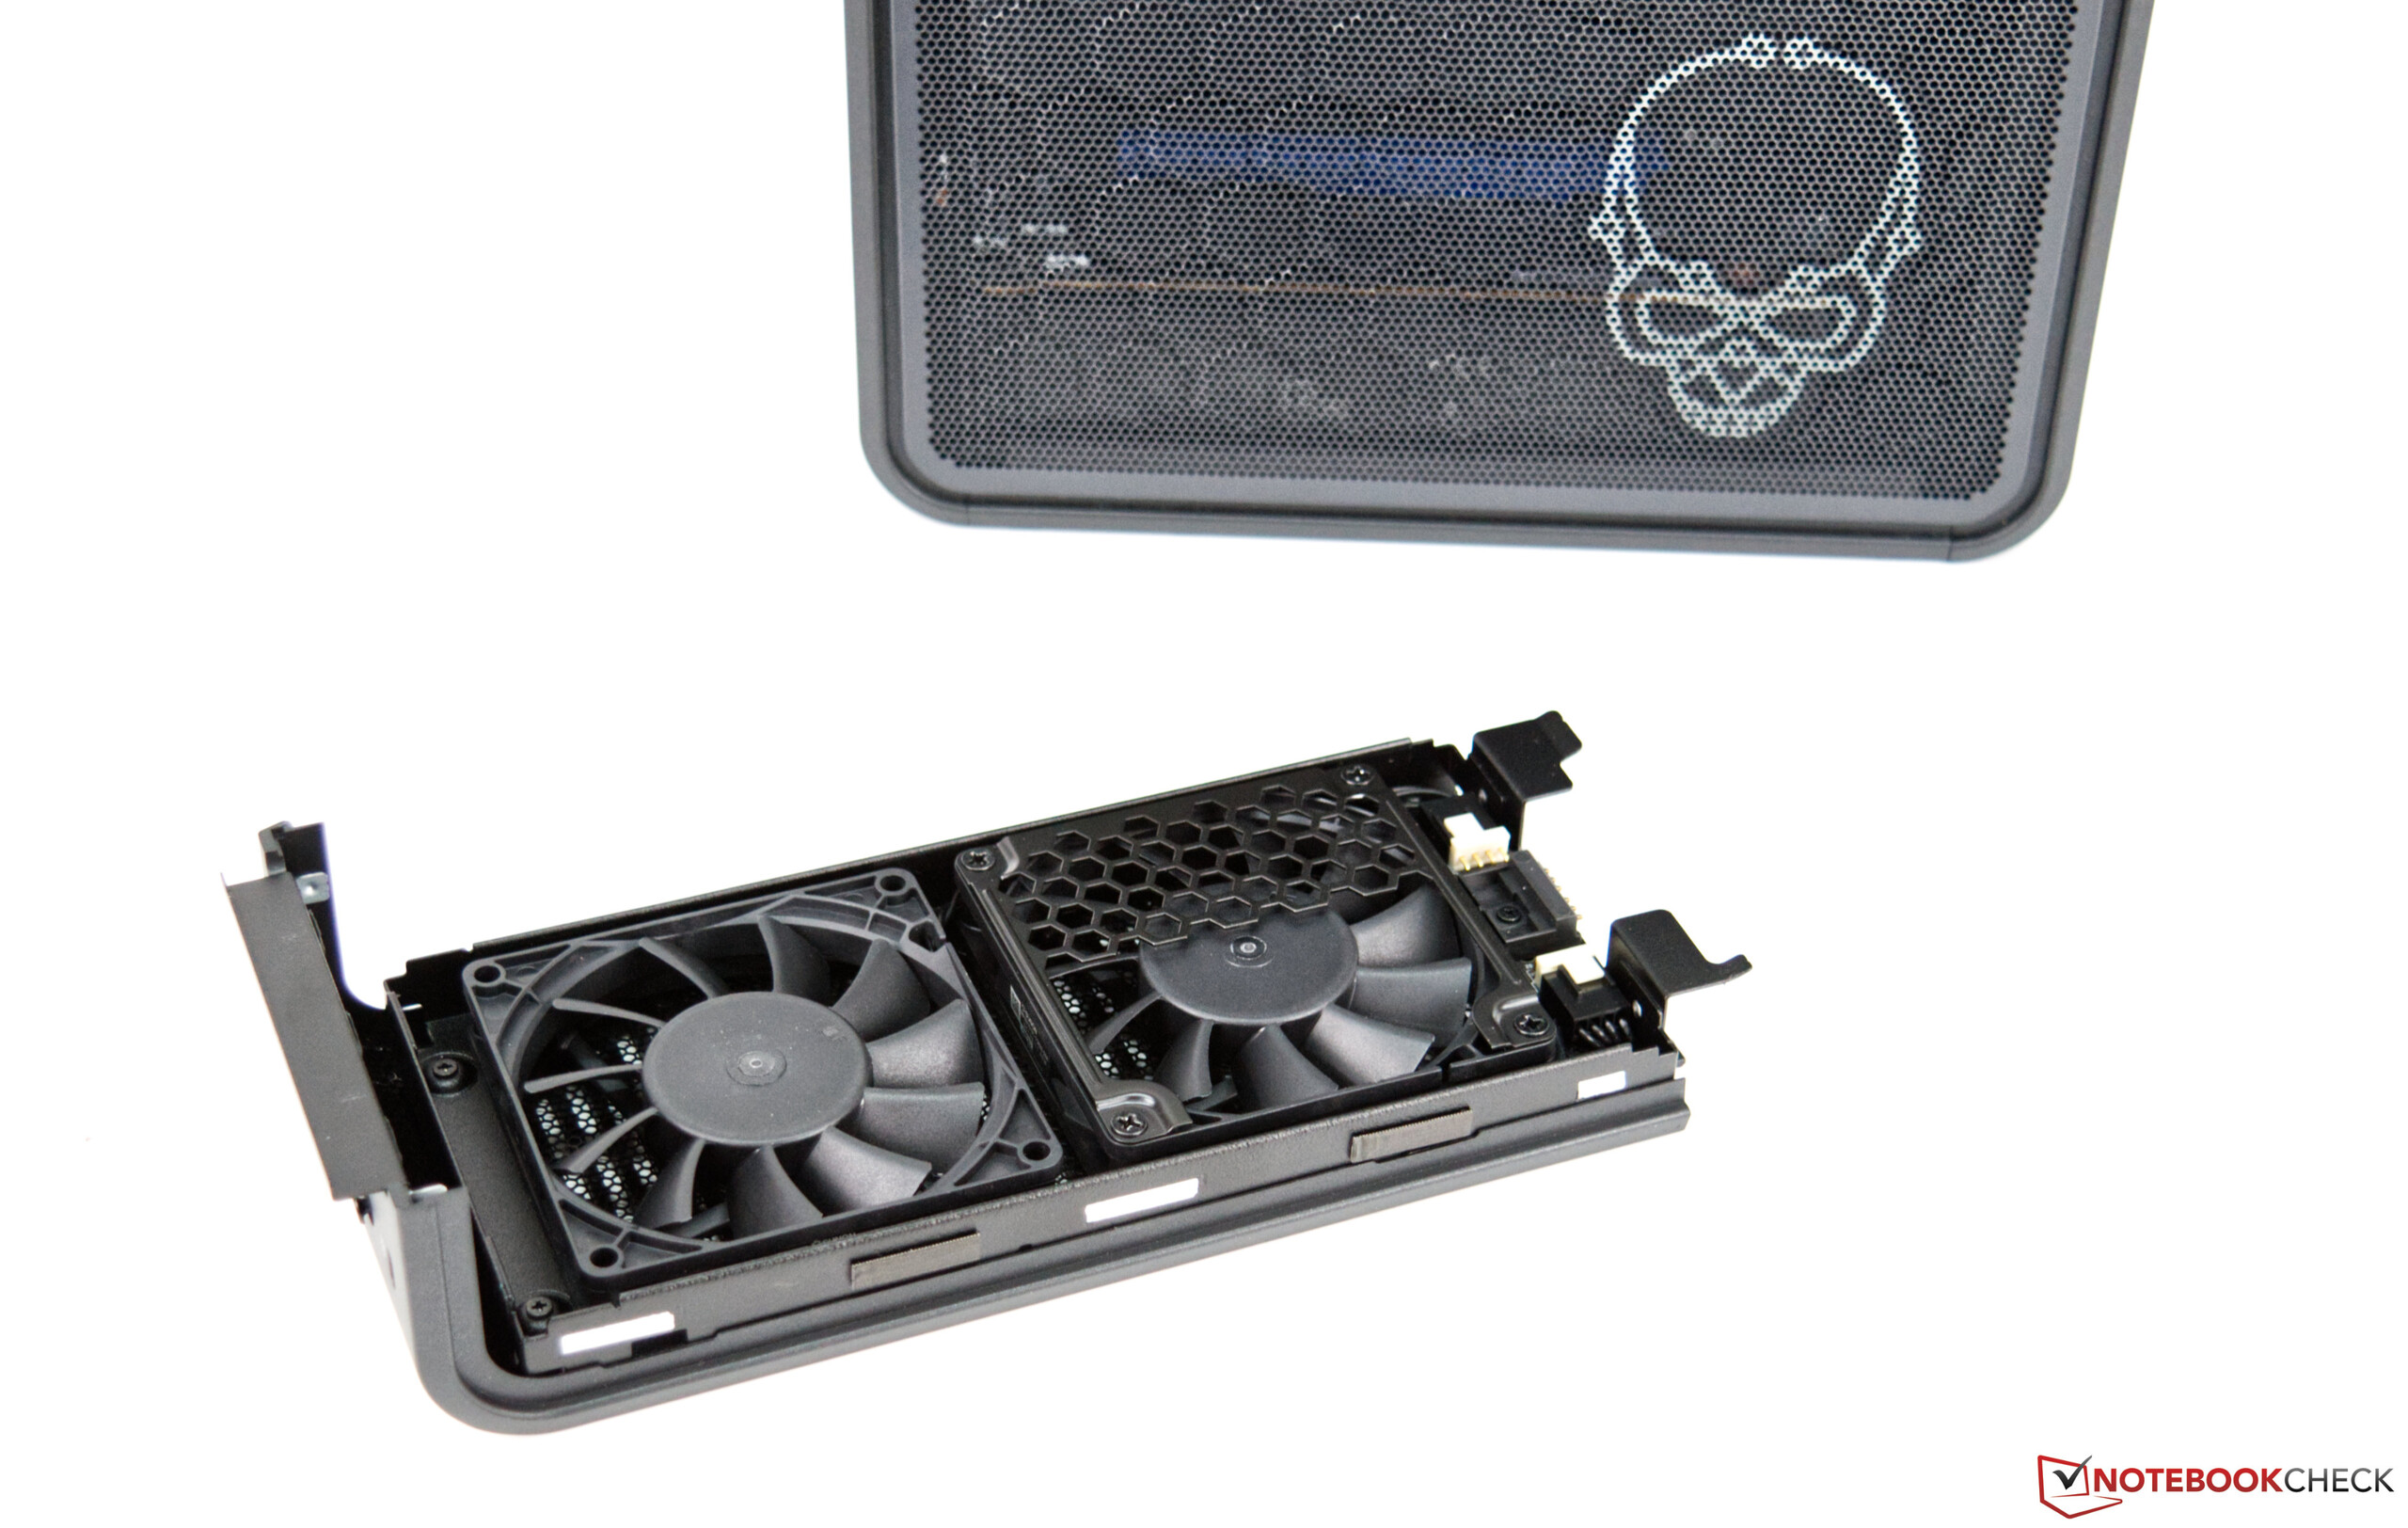
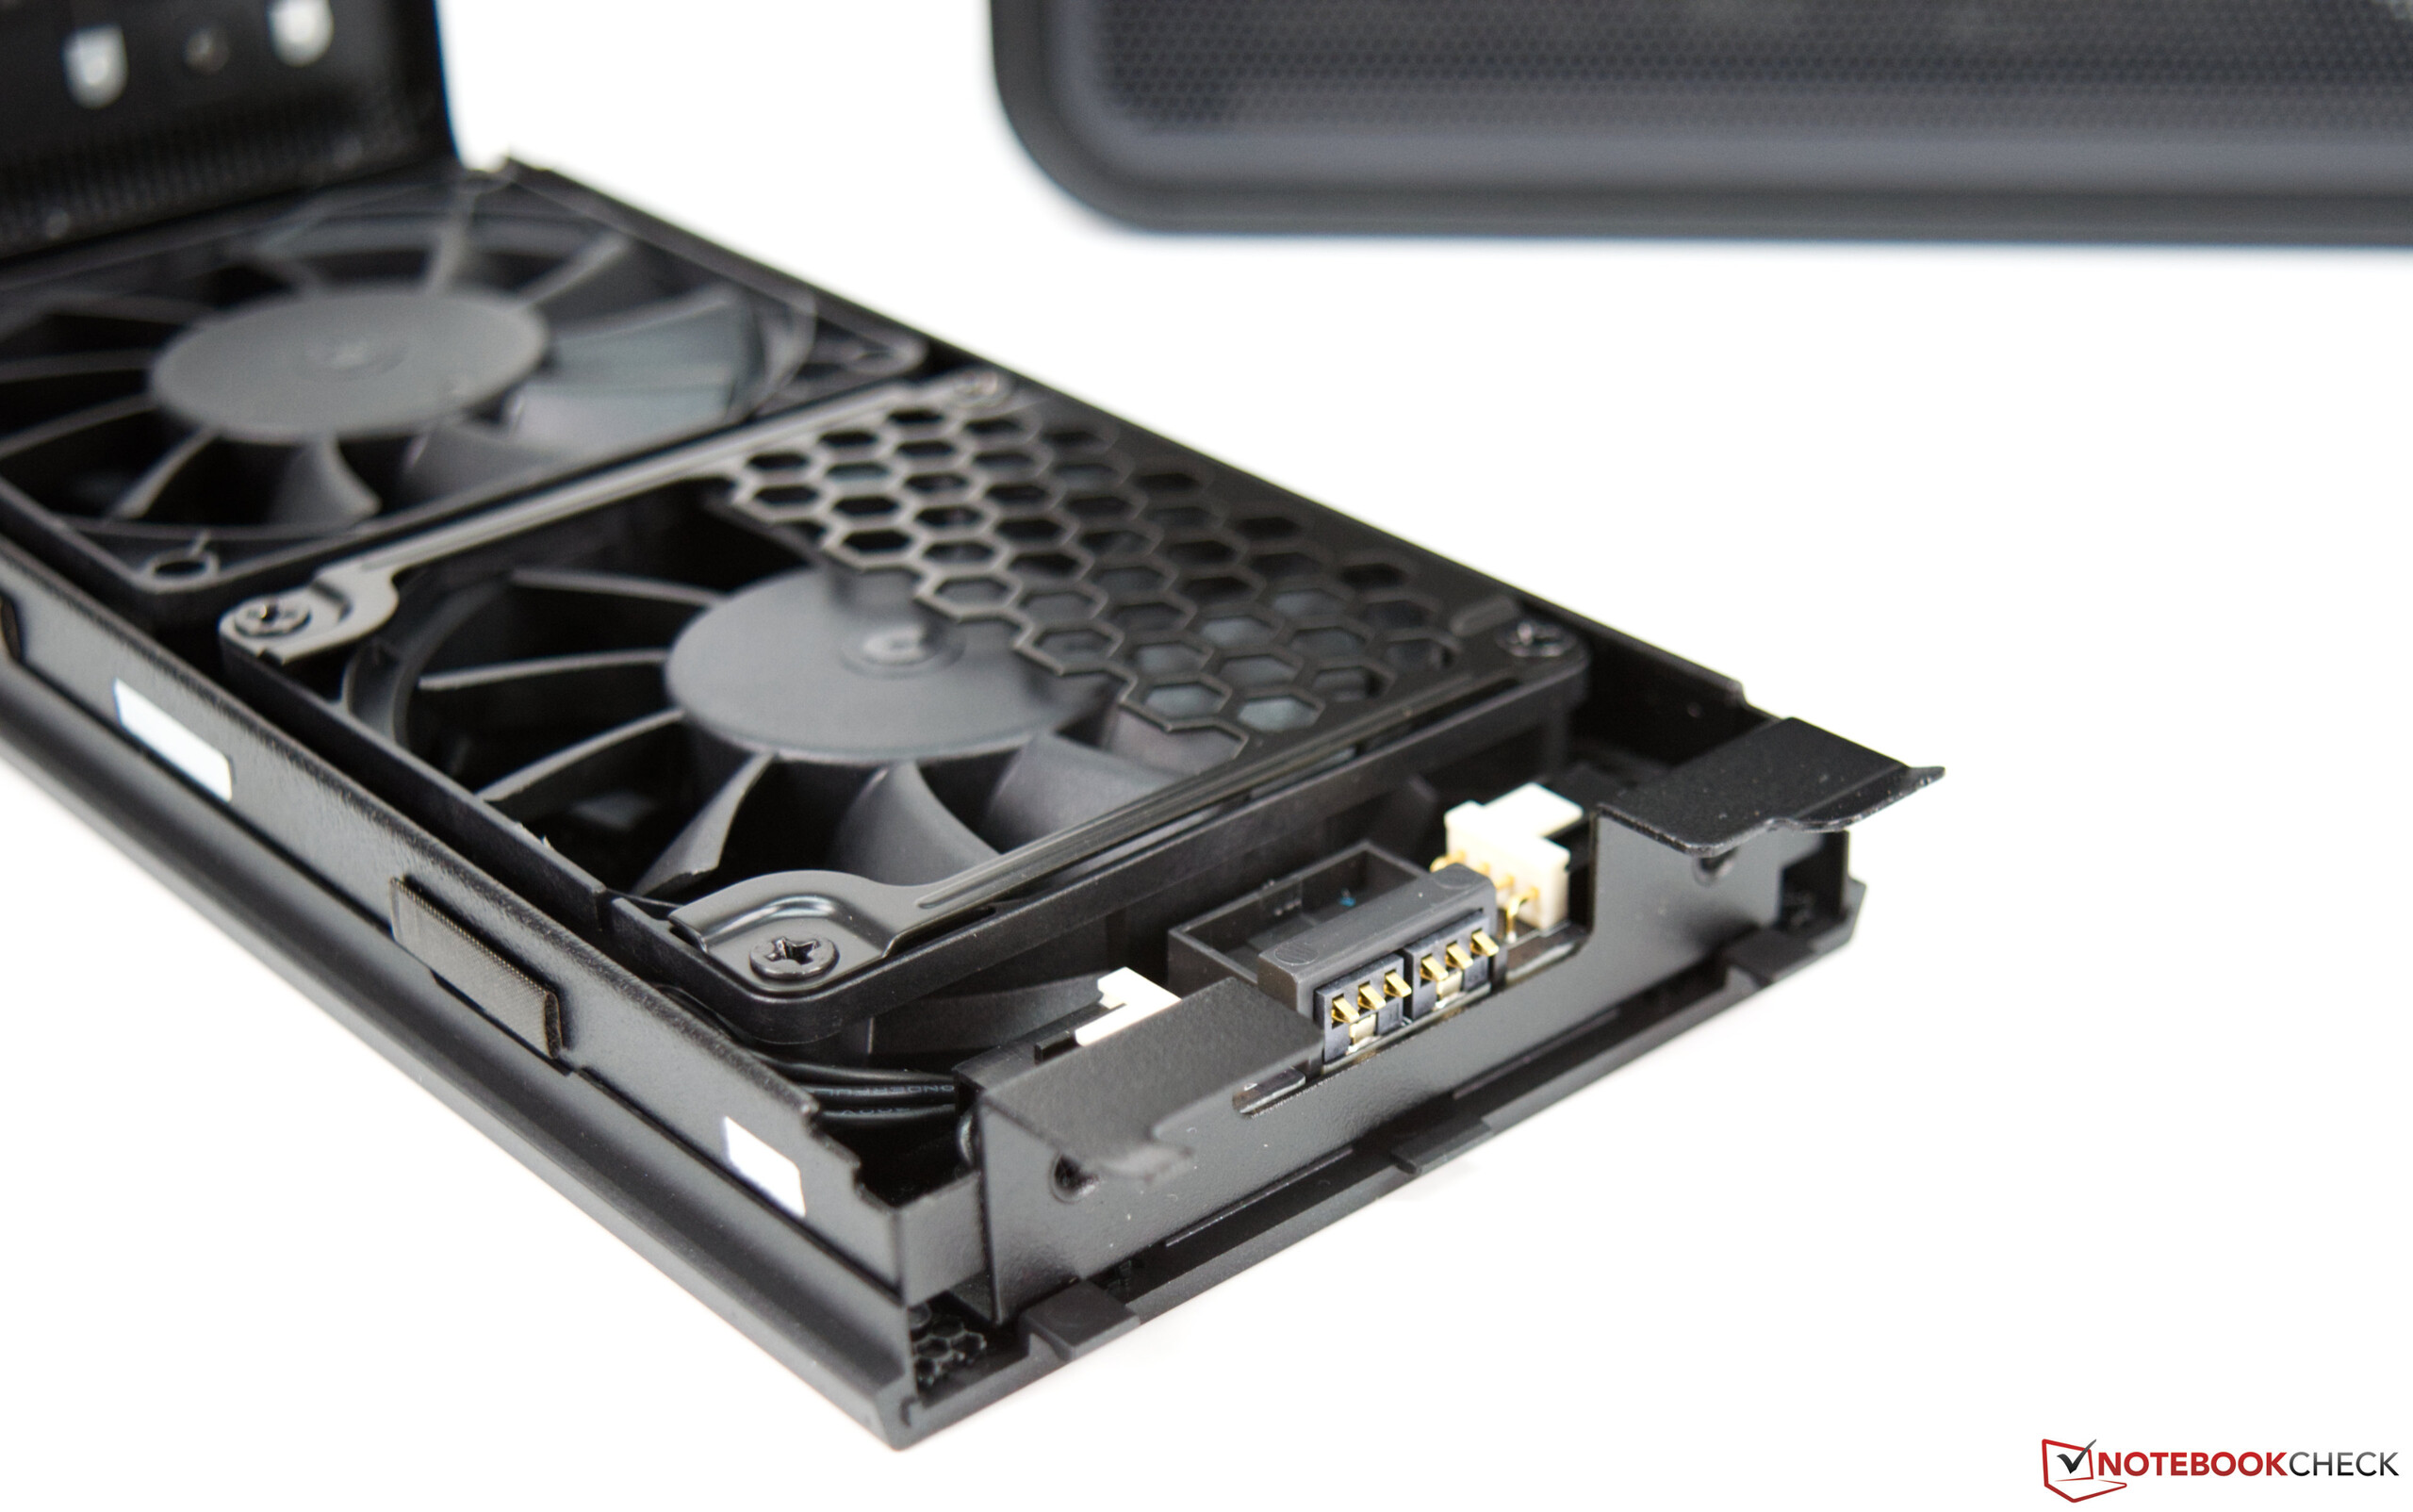
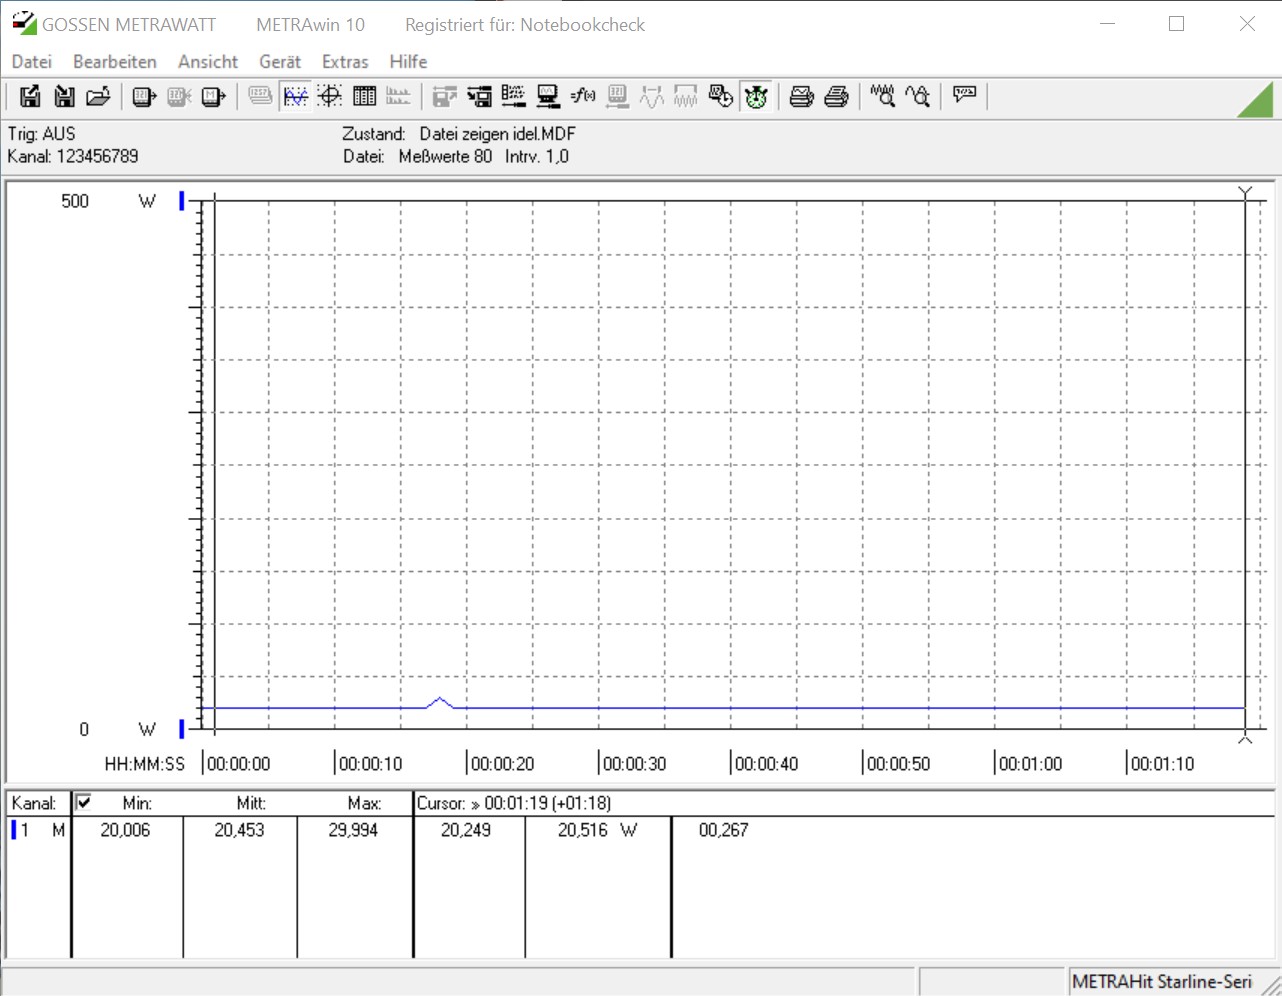
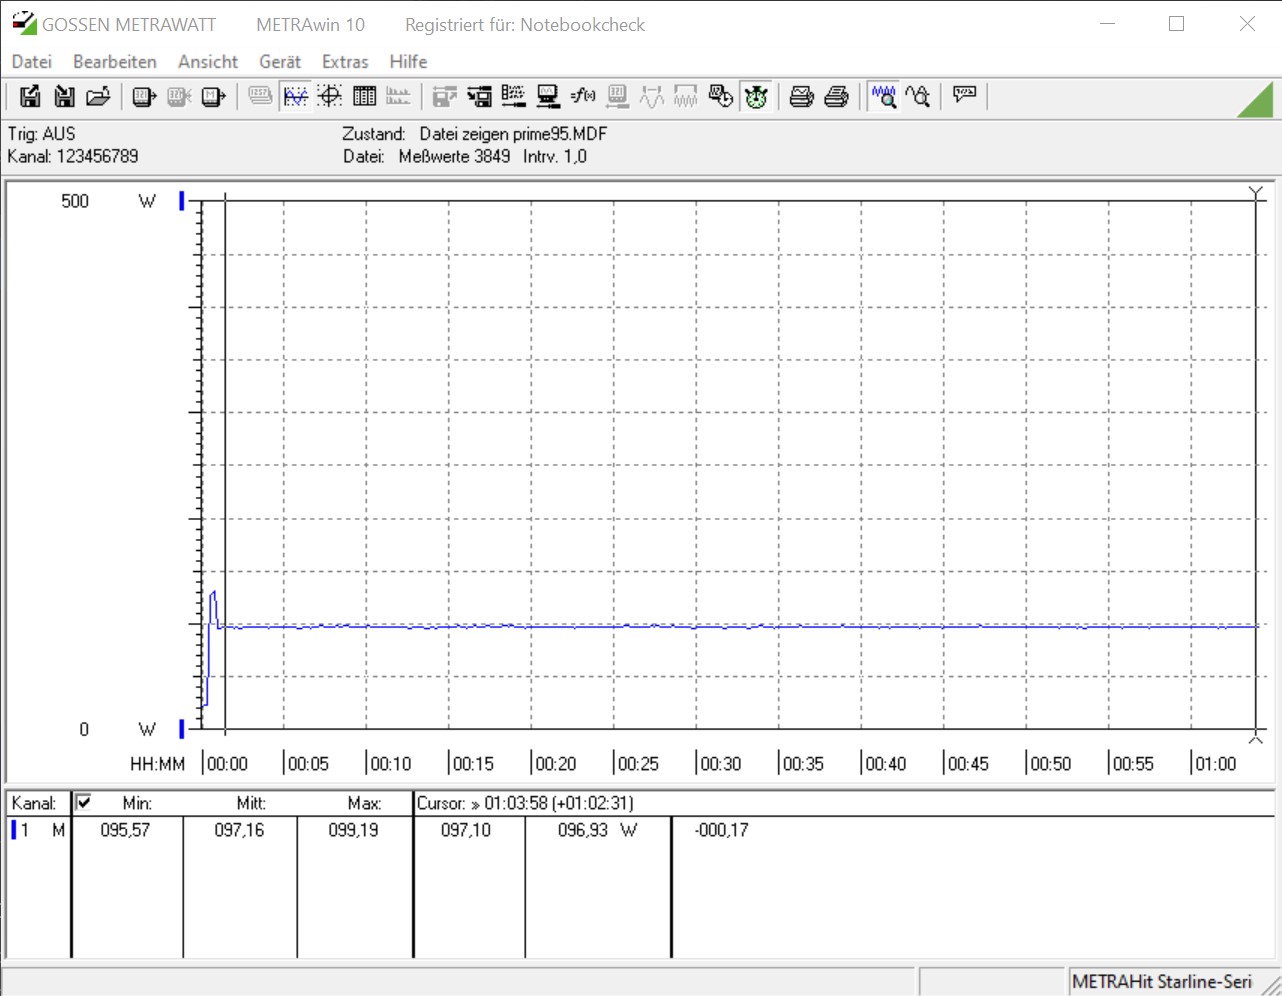
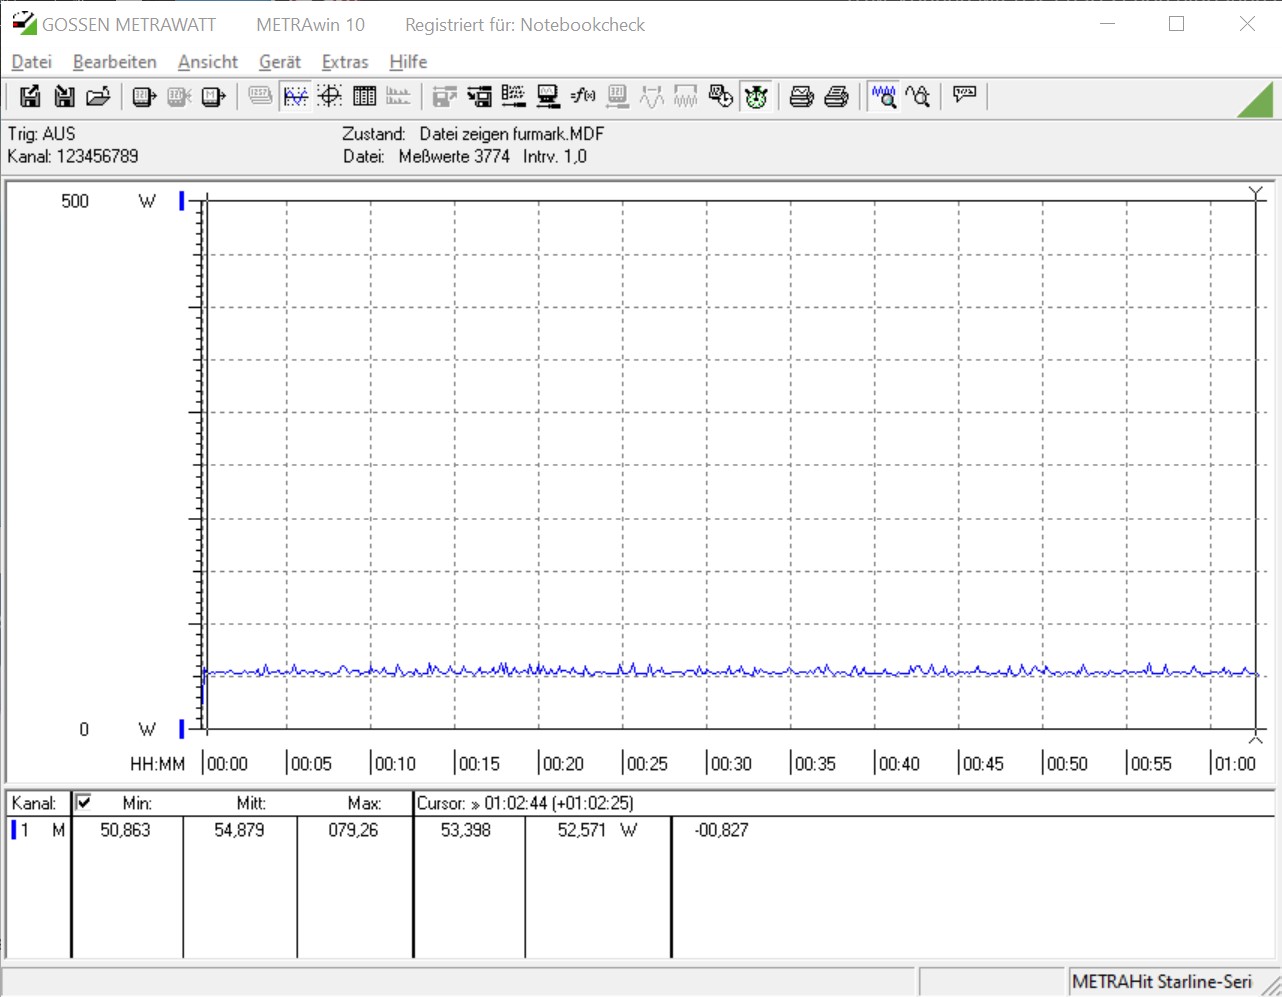
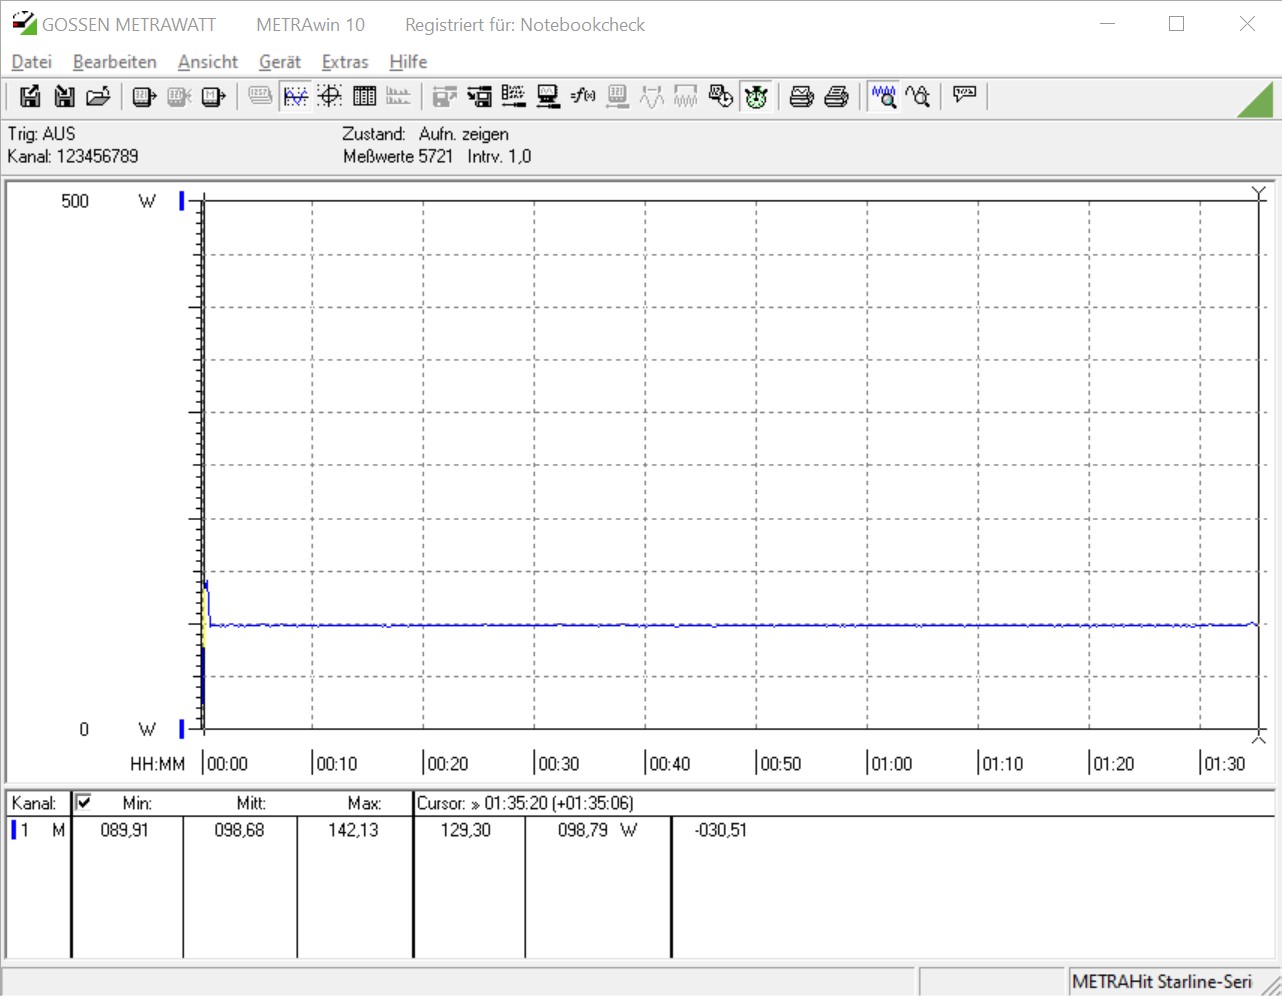
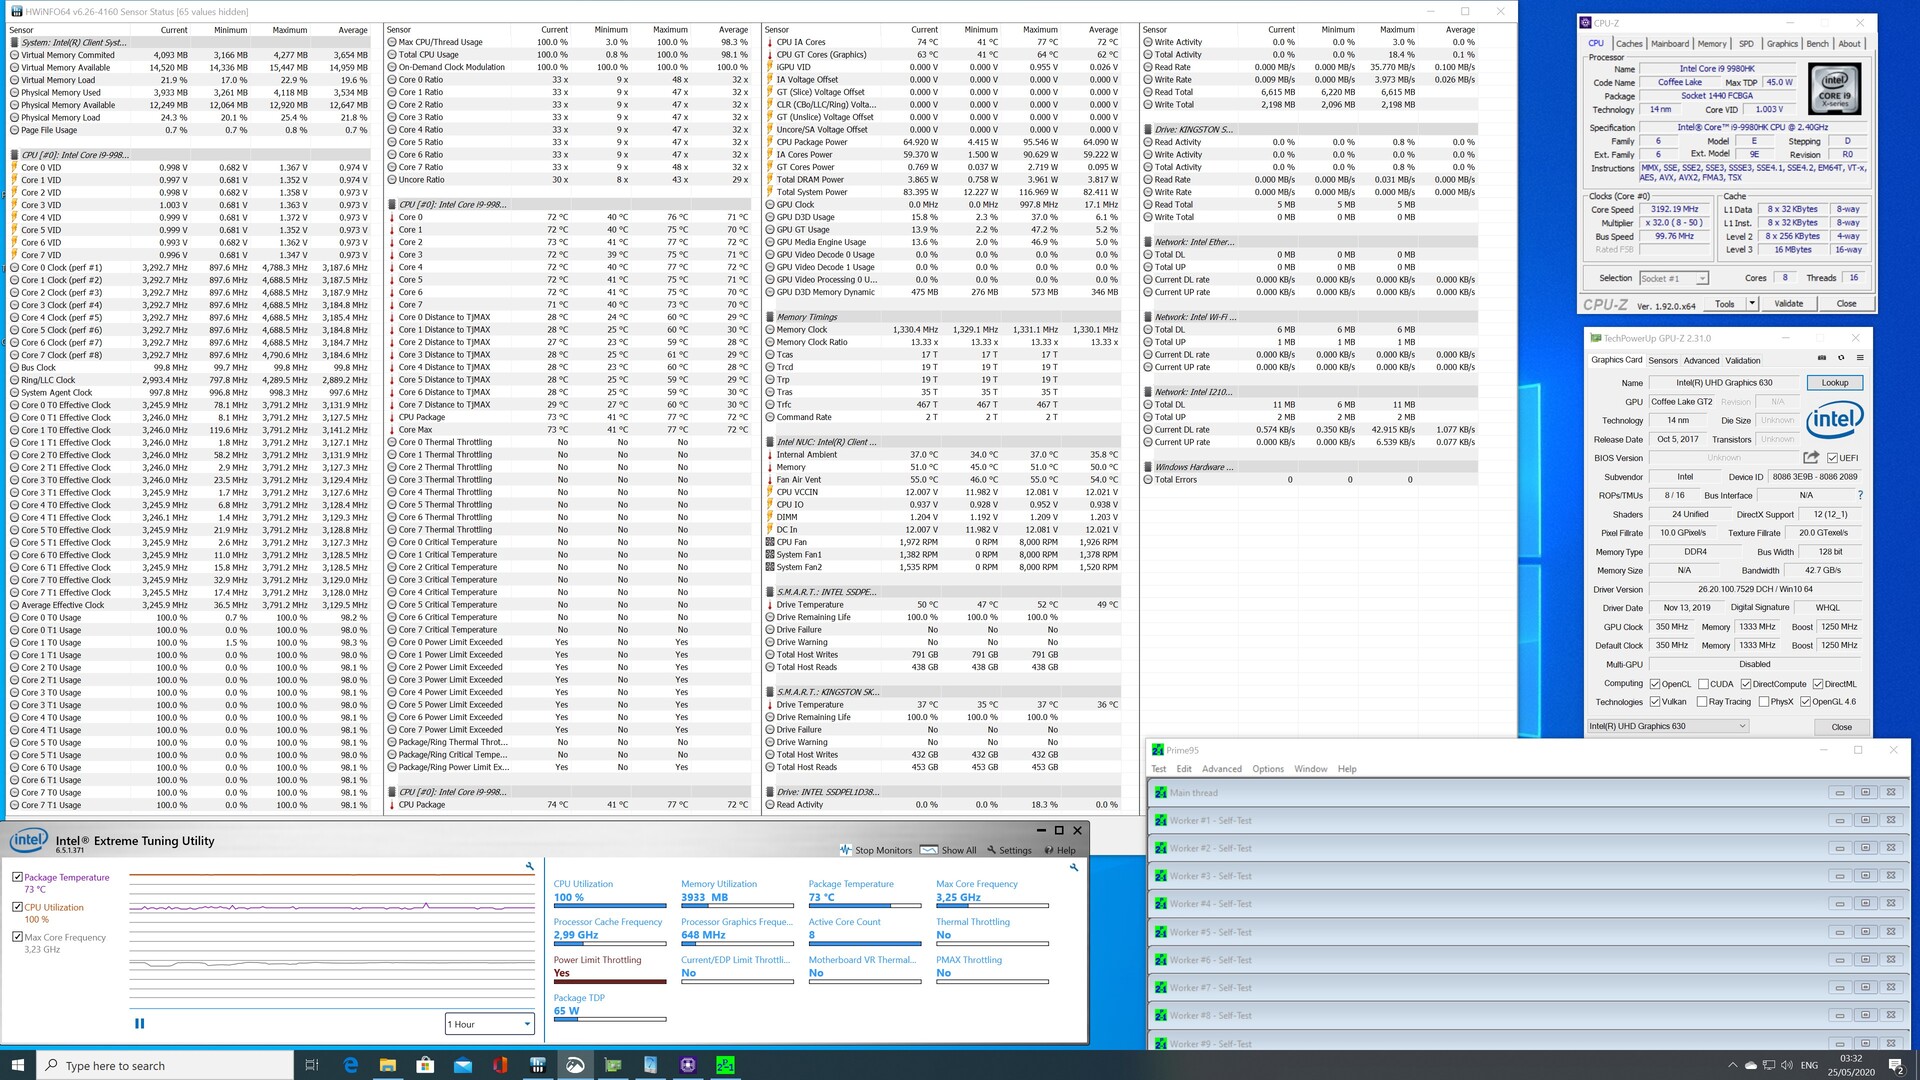
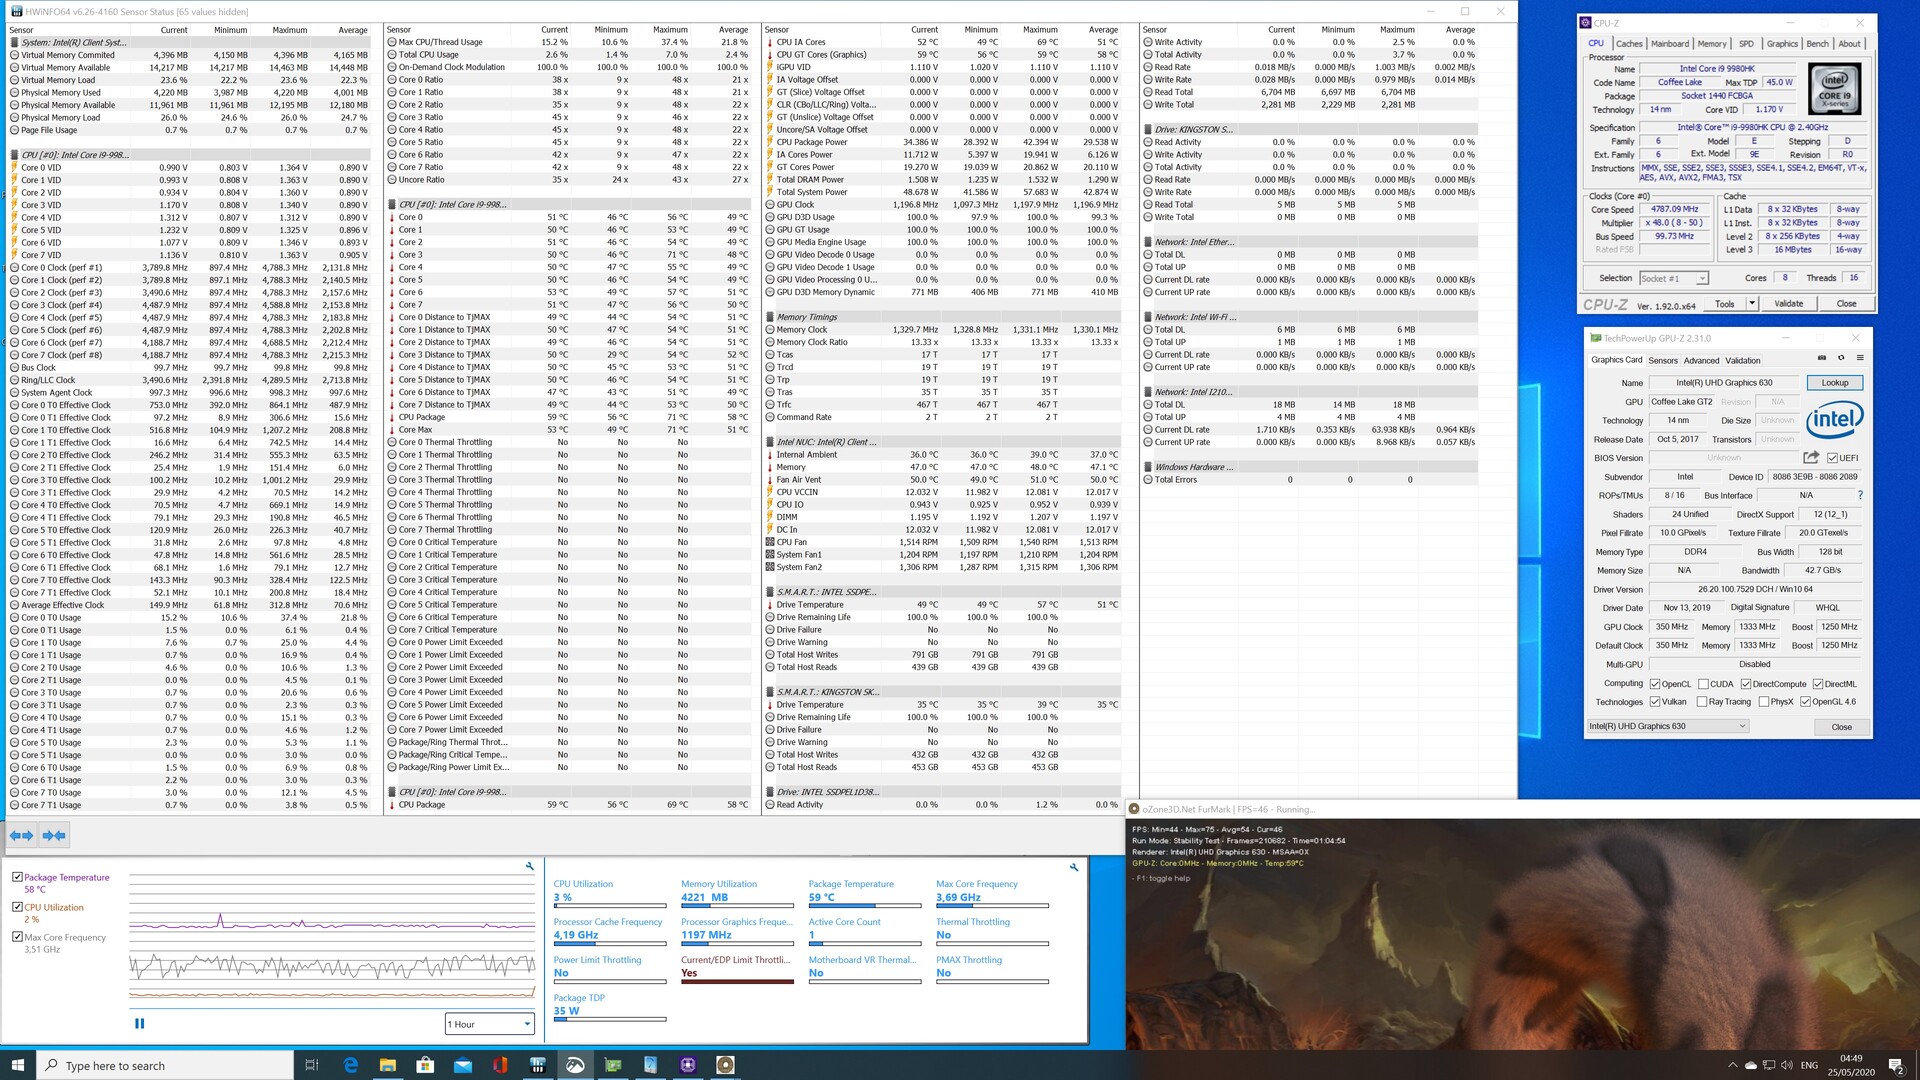
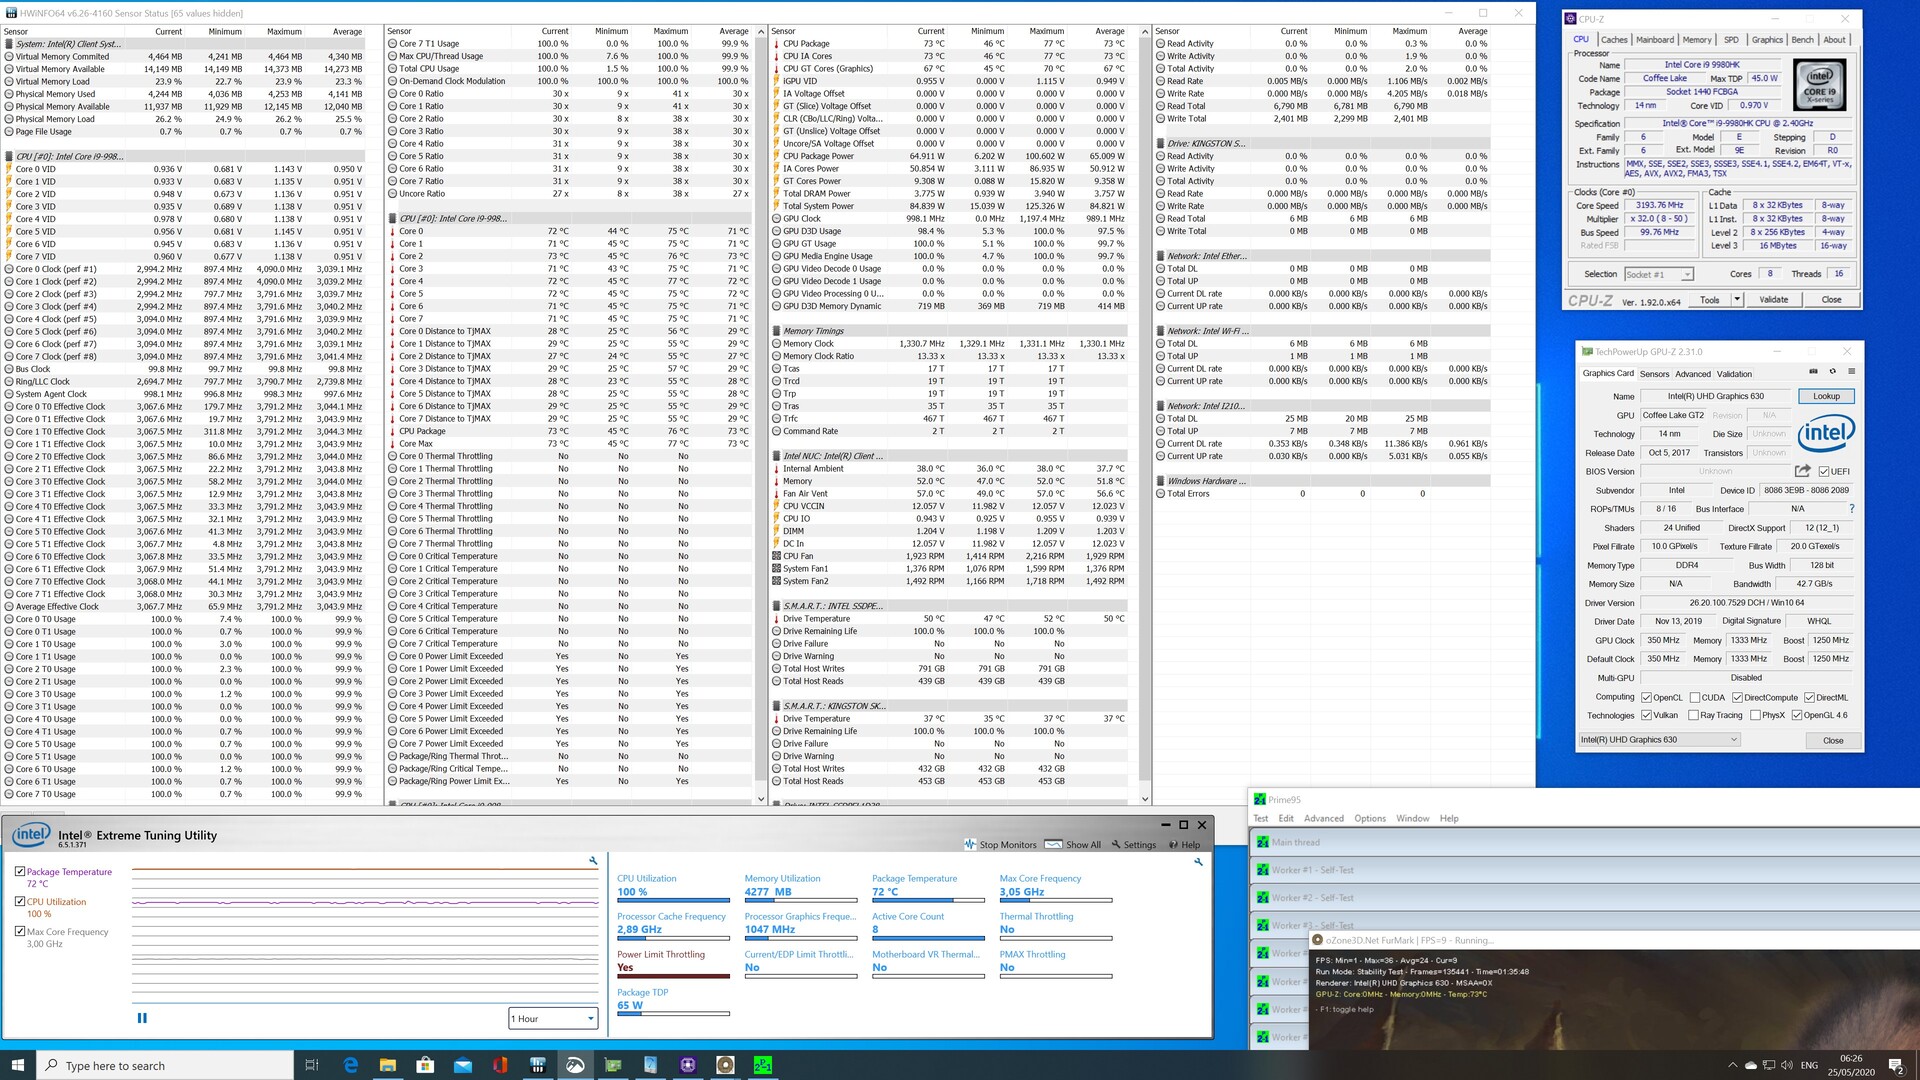
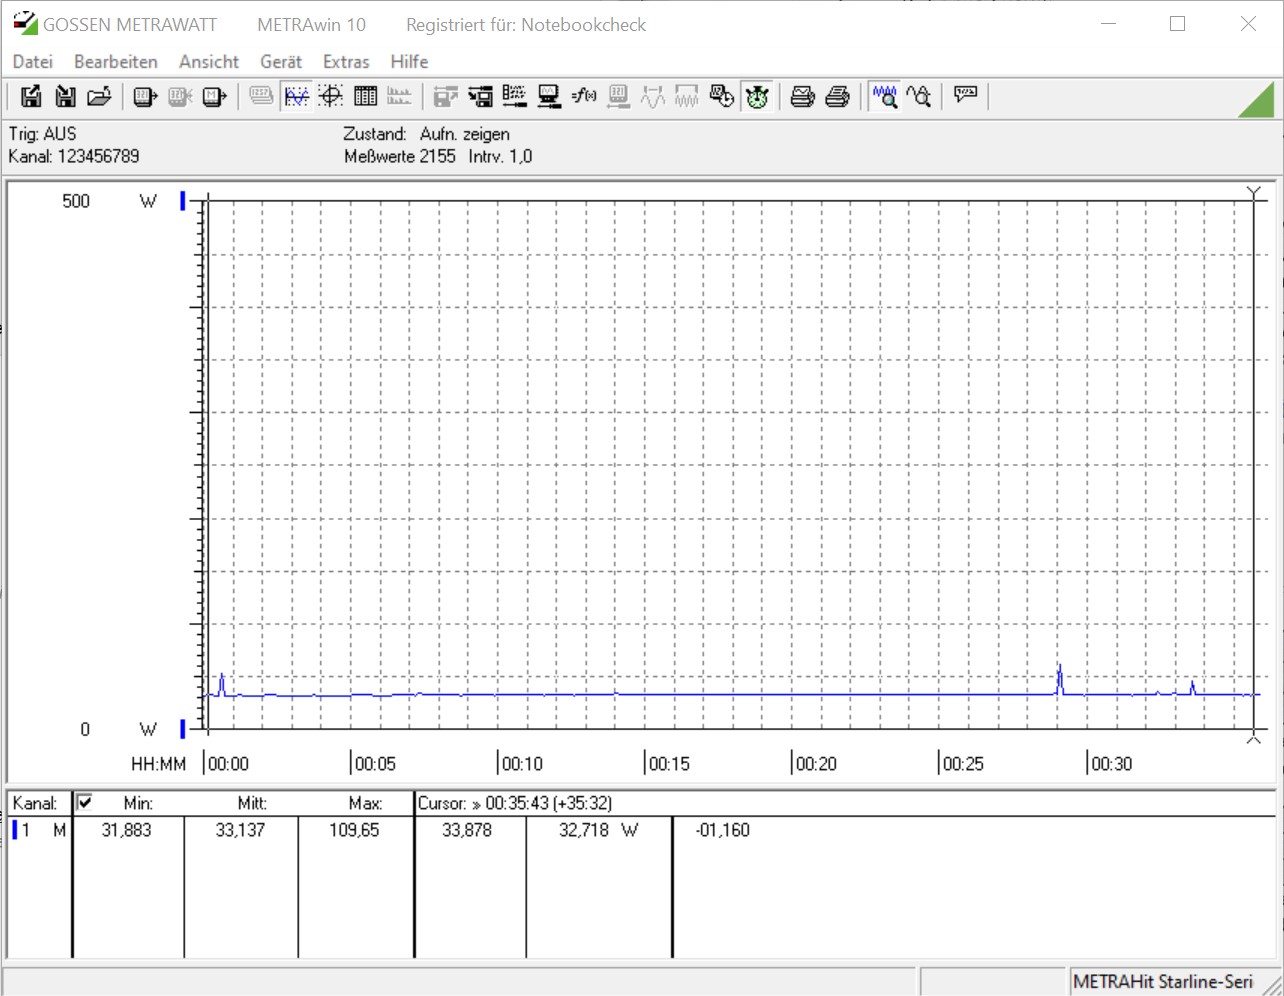
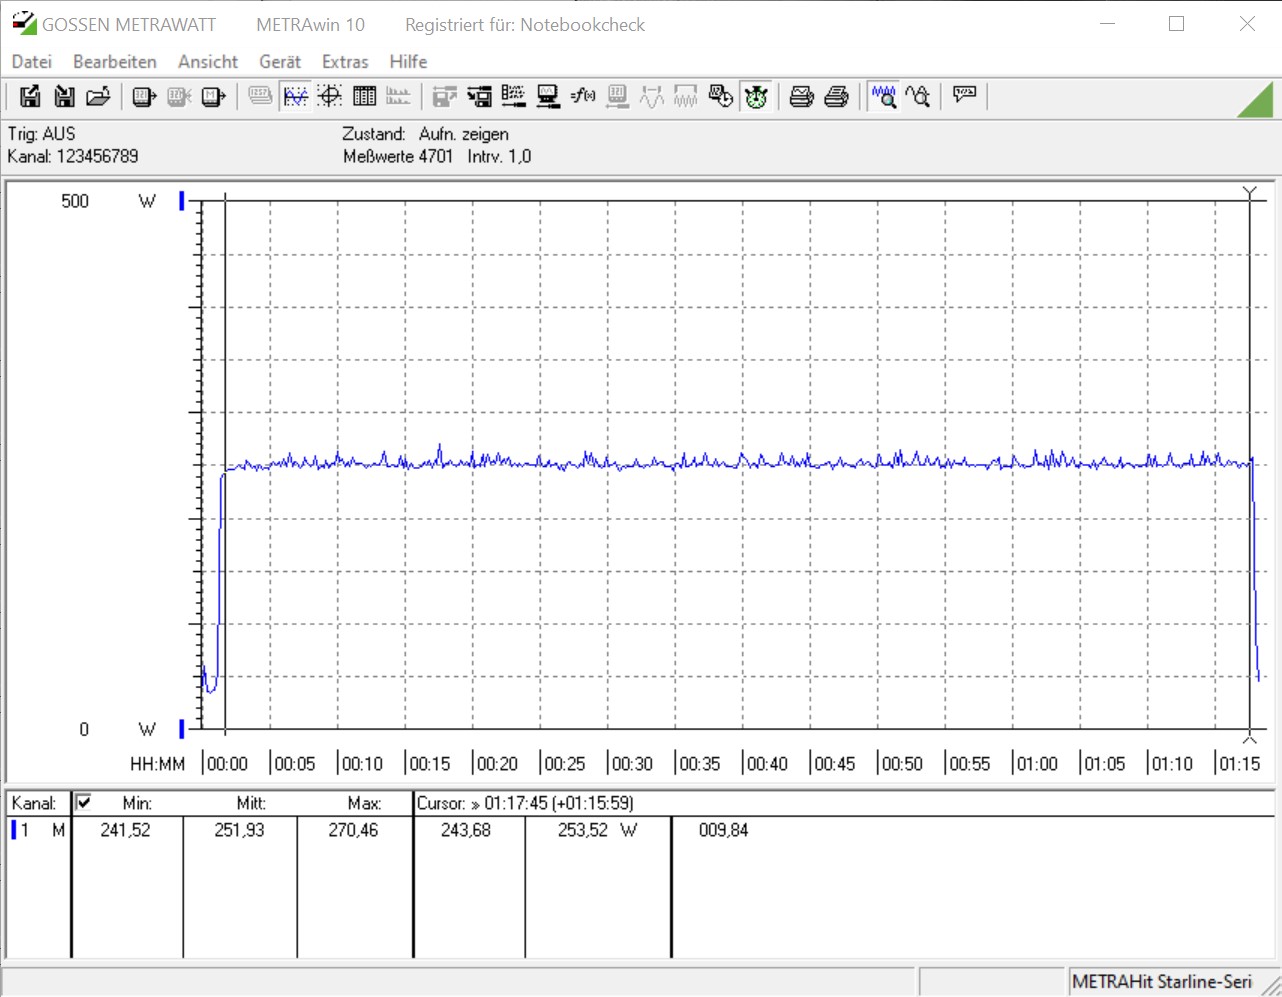
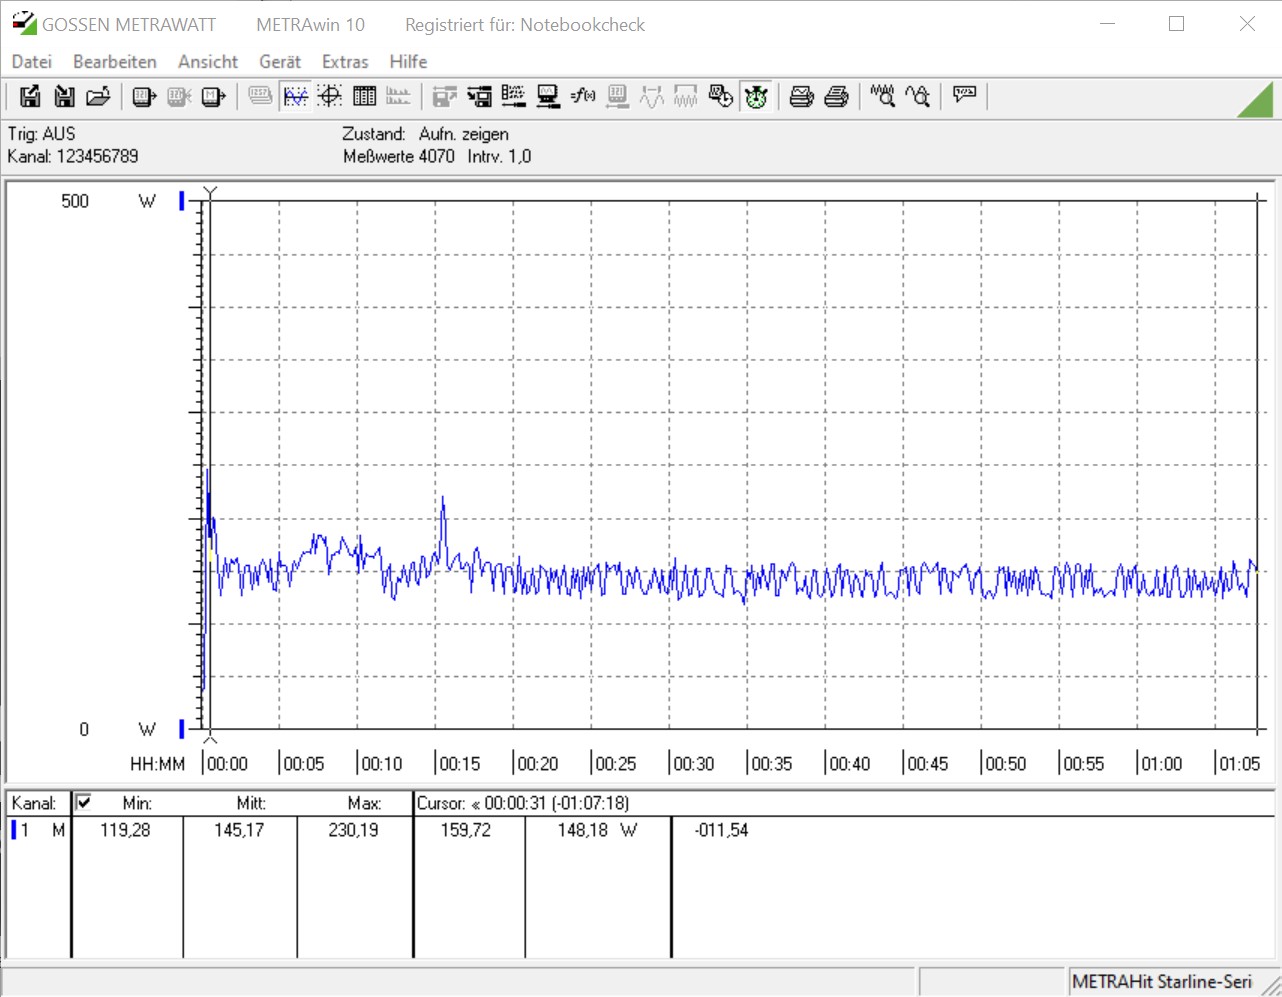
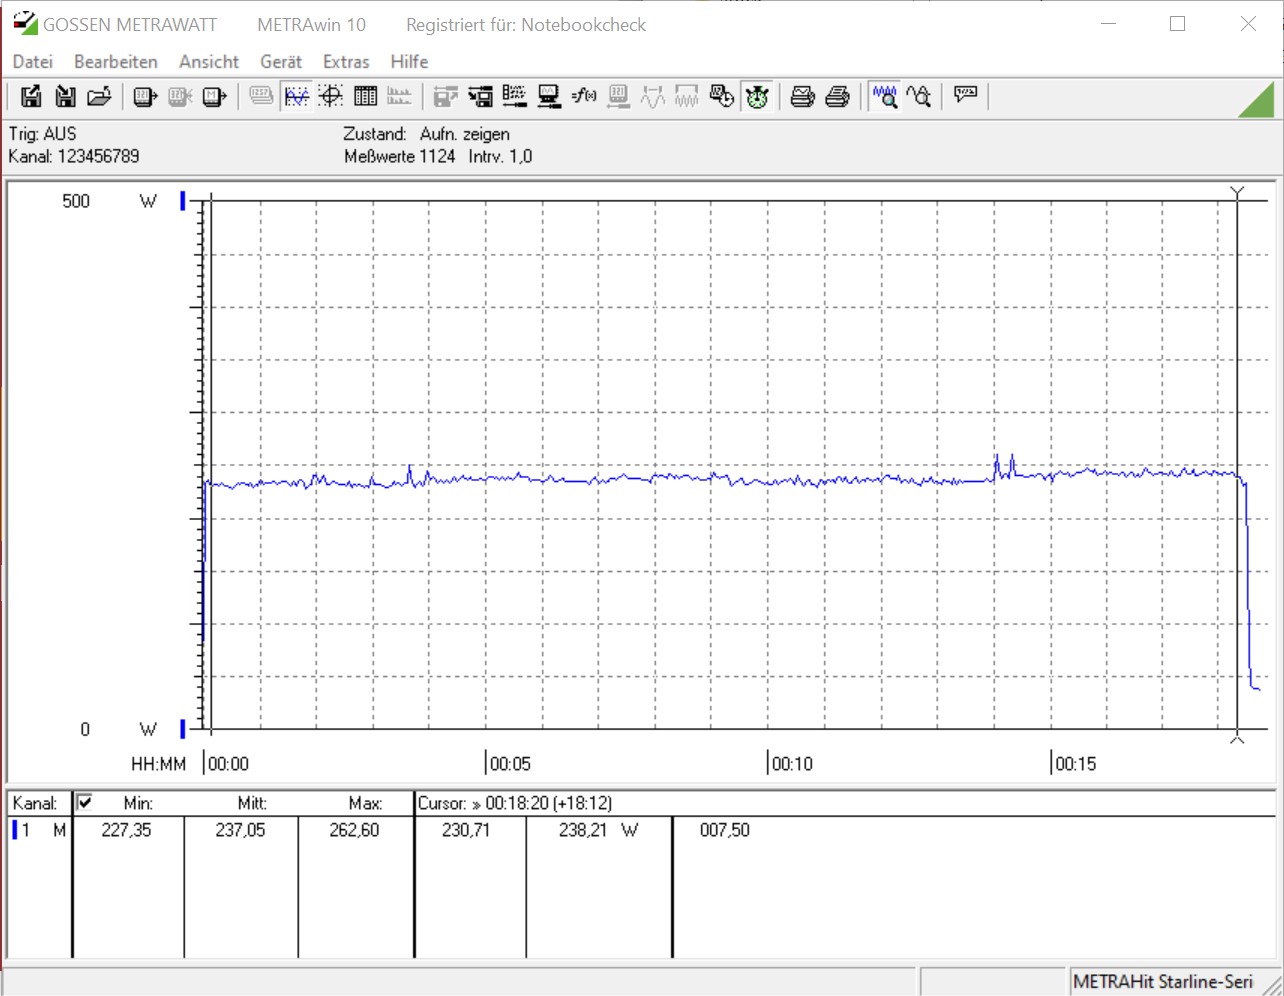
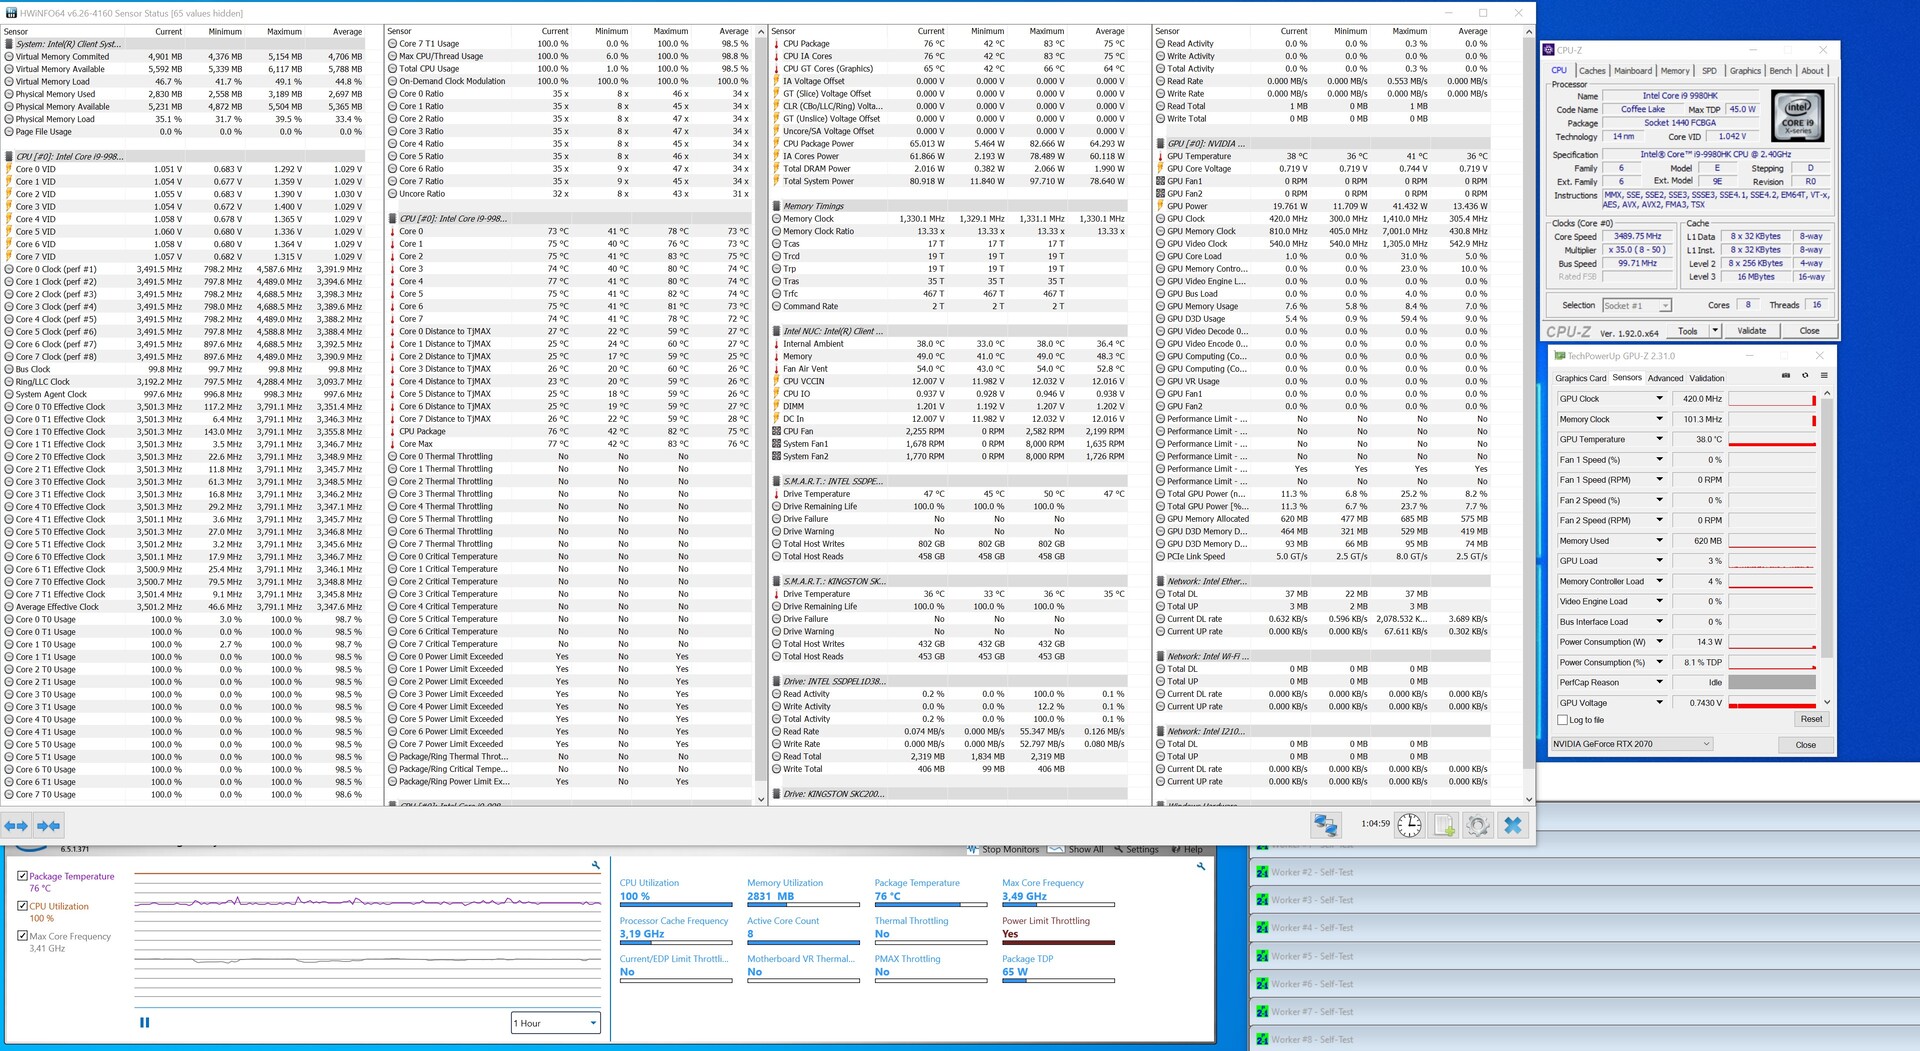
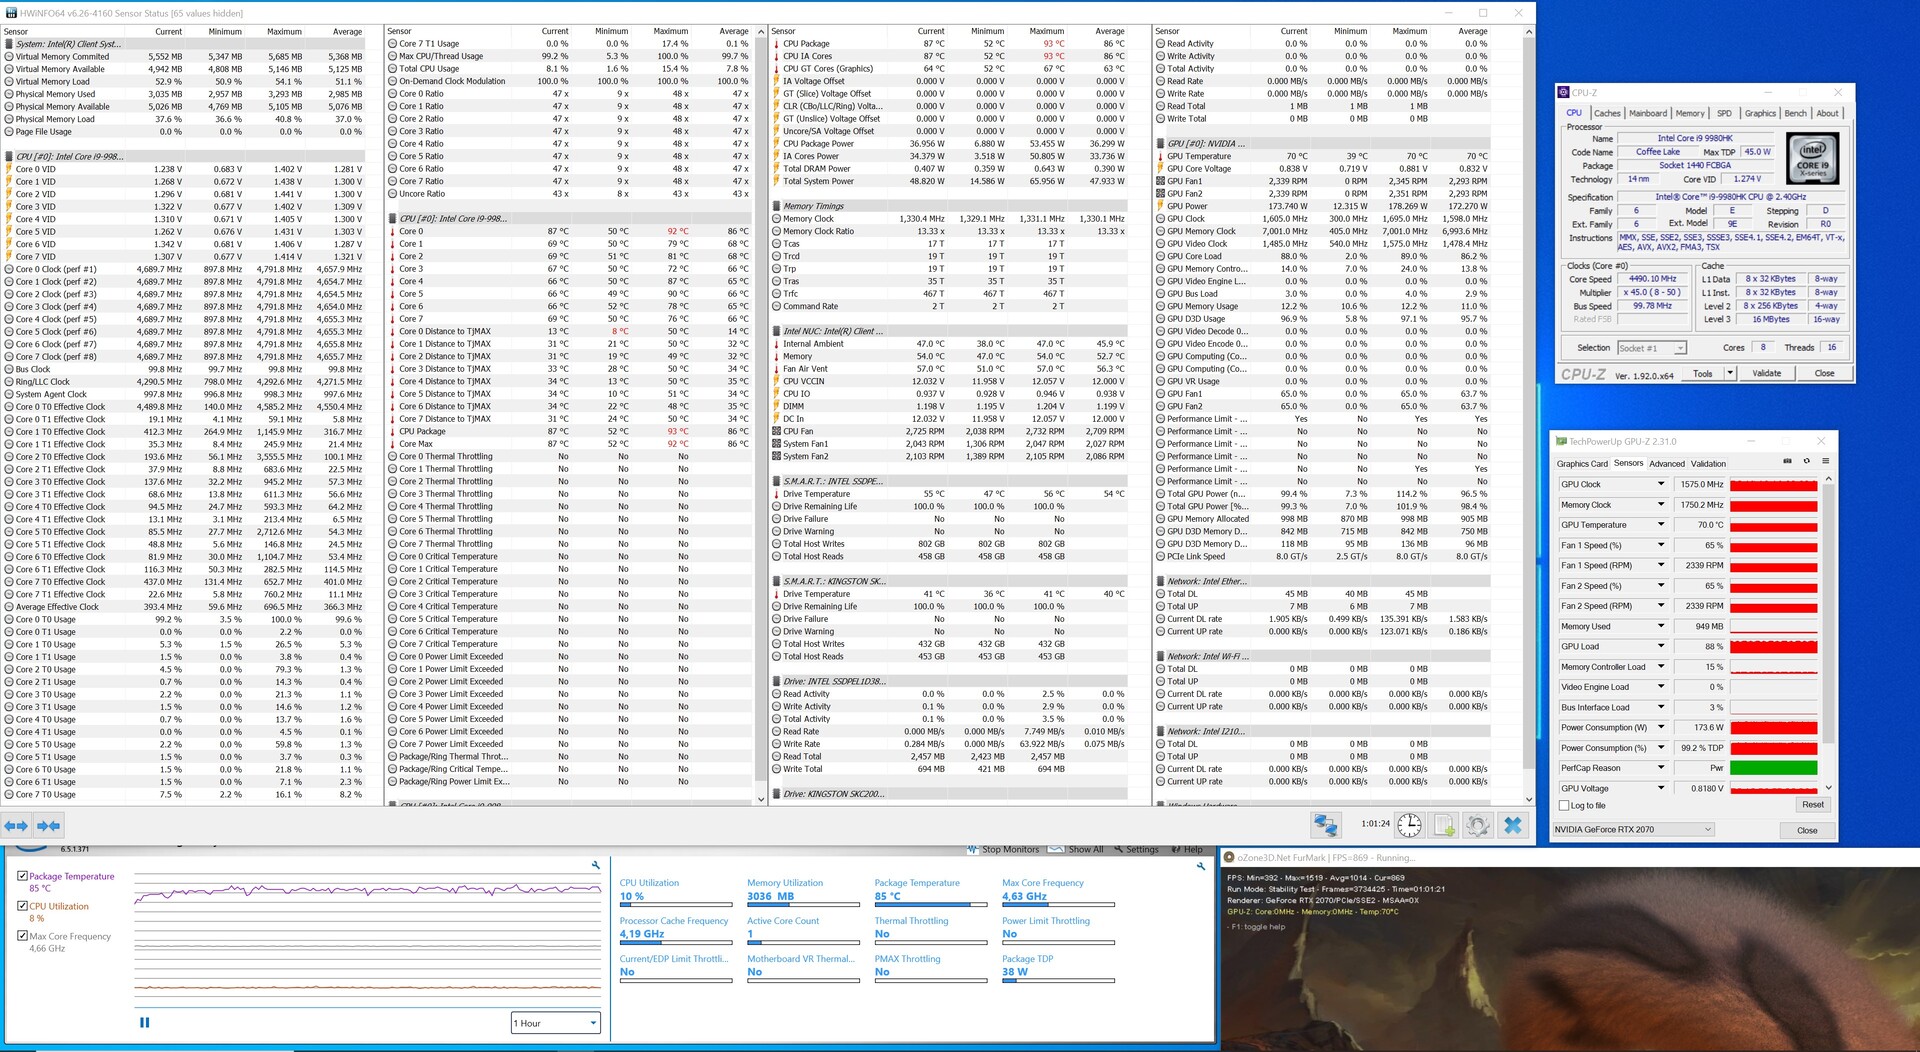
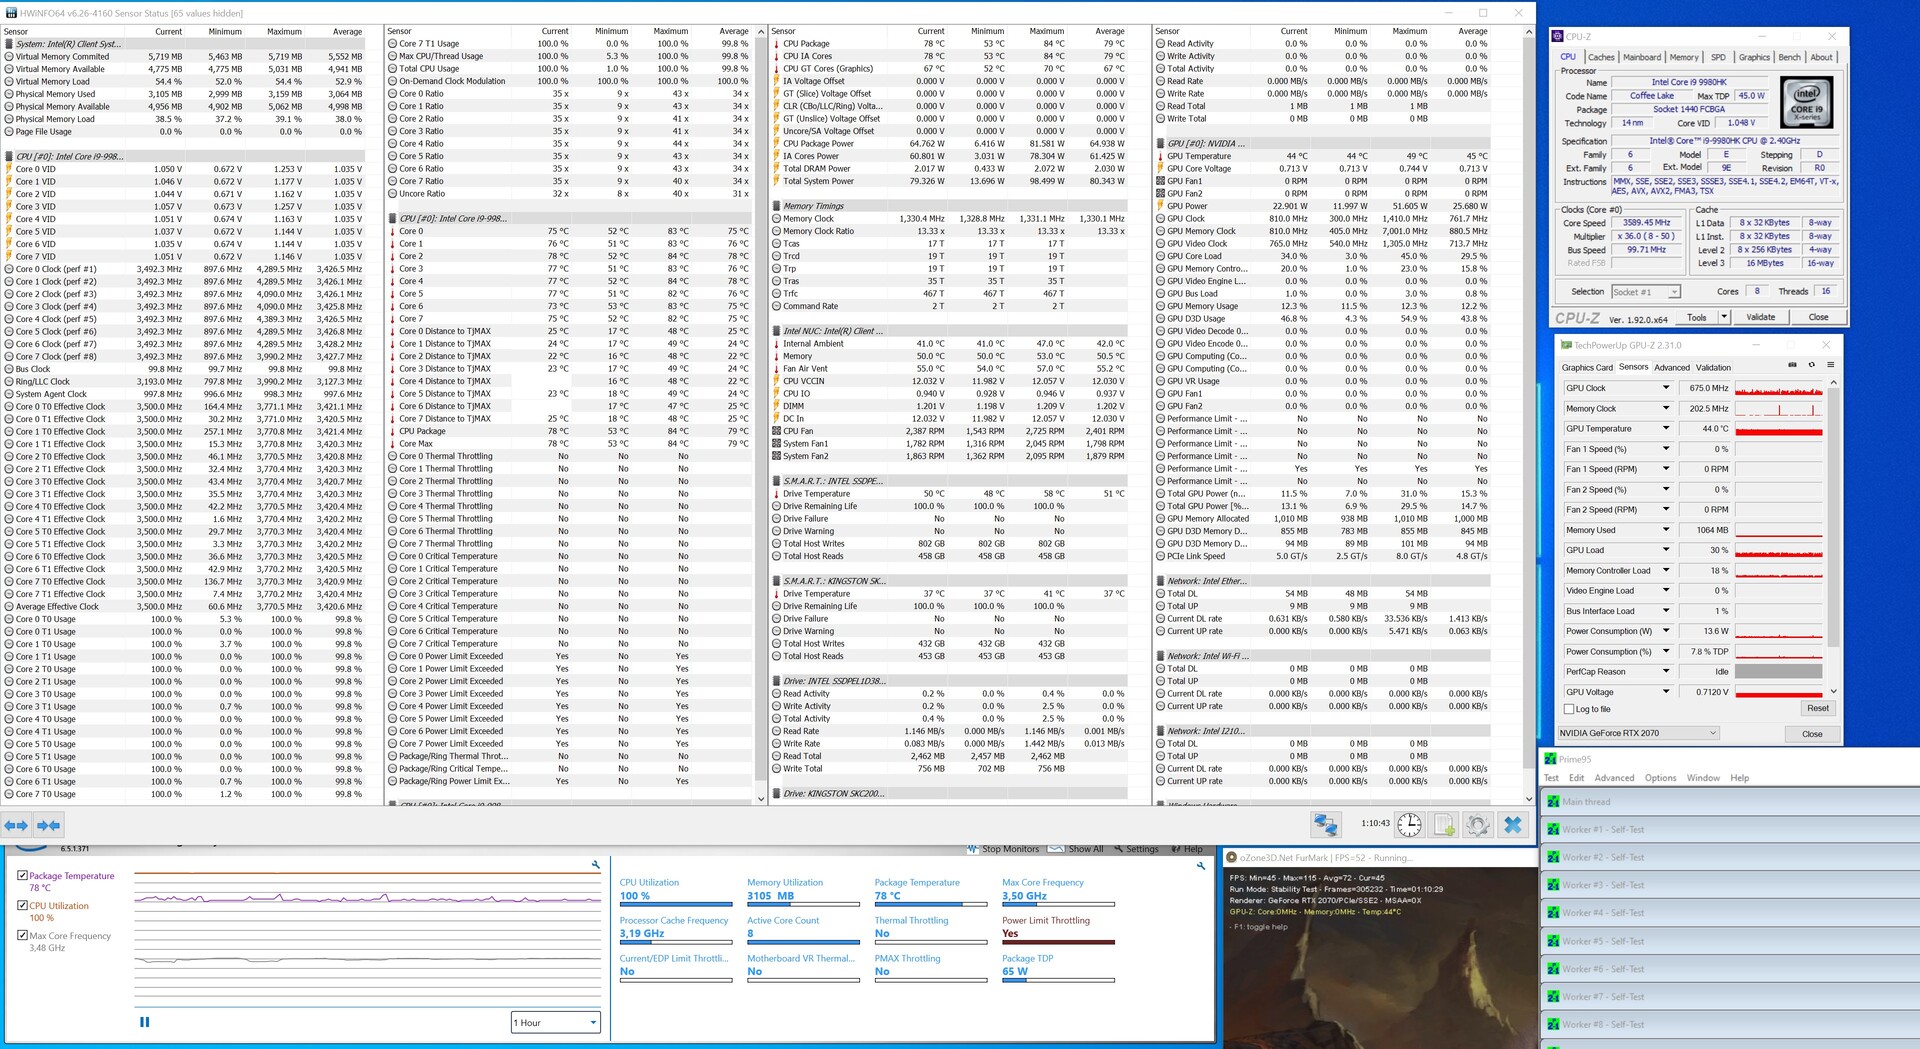
NUC 9 Aşırı Güç Tüketimi ve Isı Emisyonları
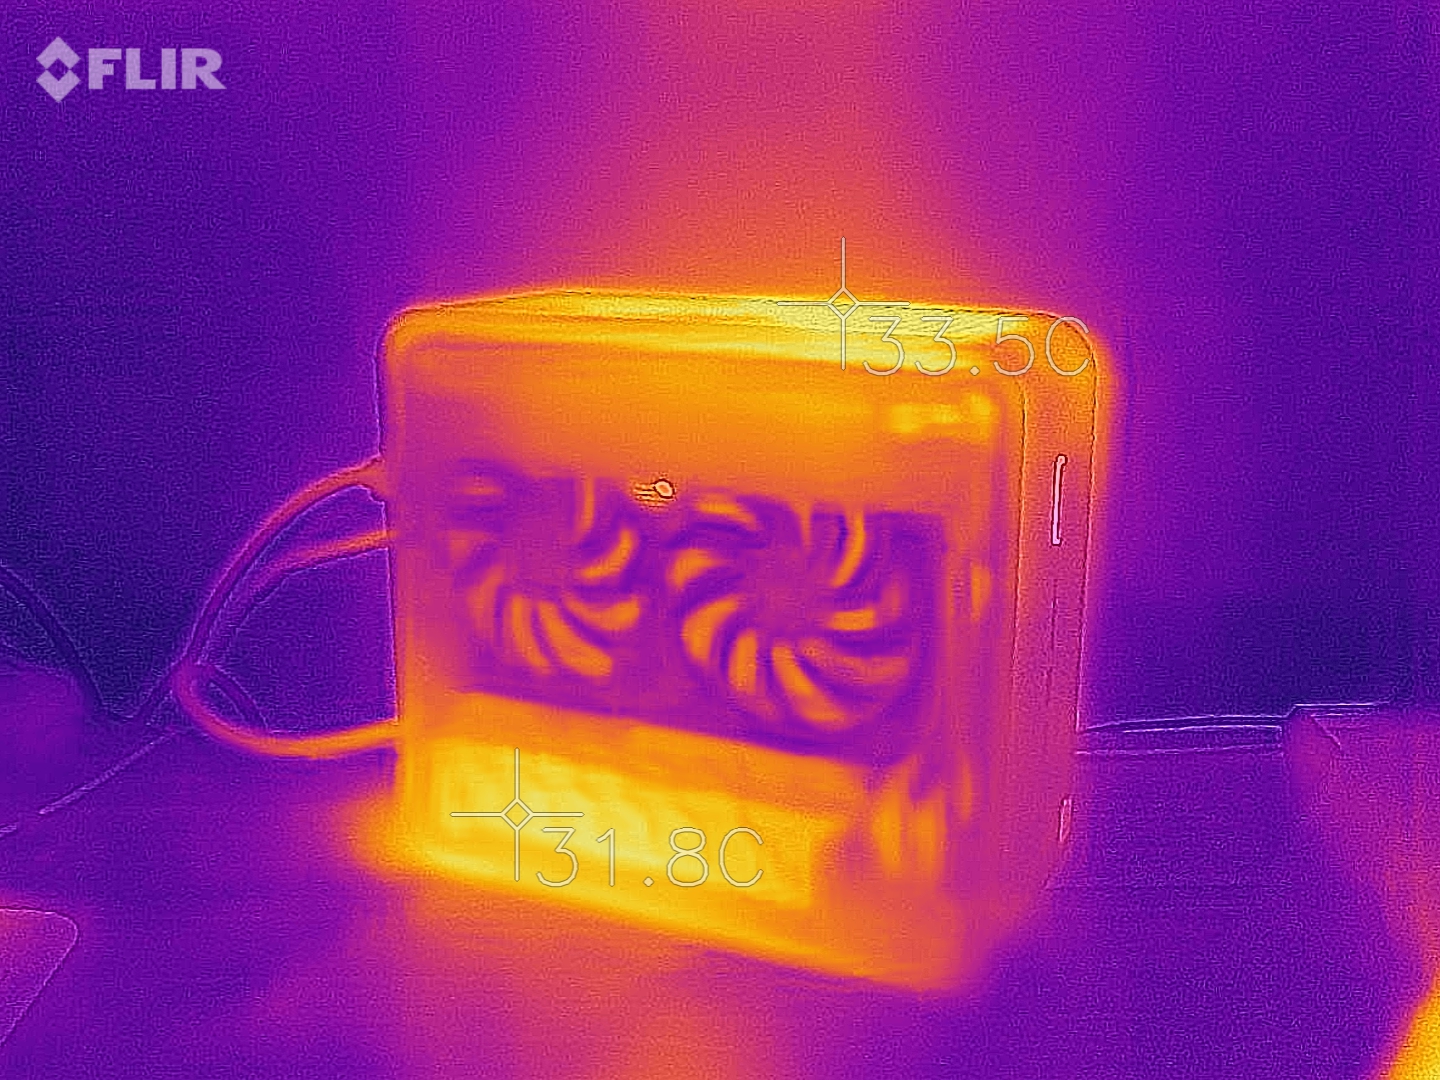
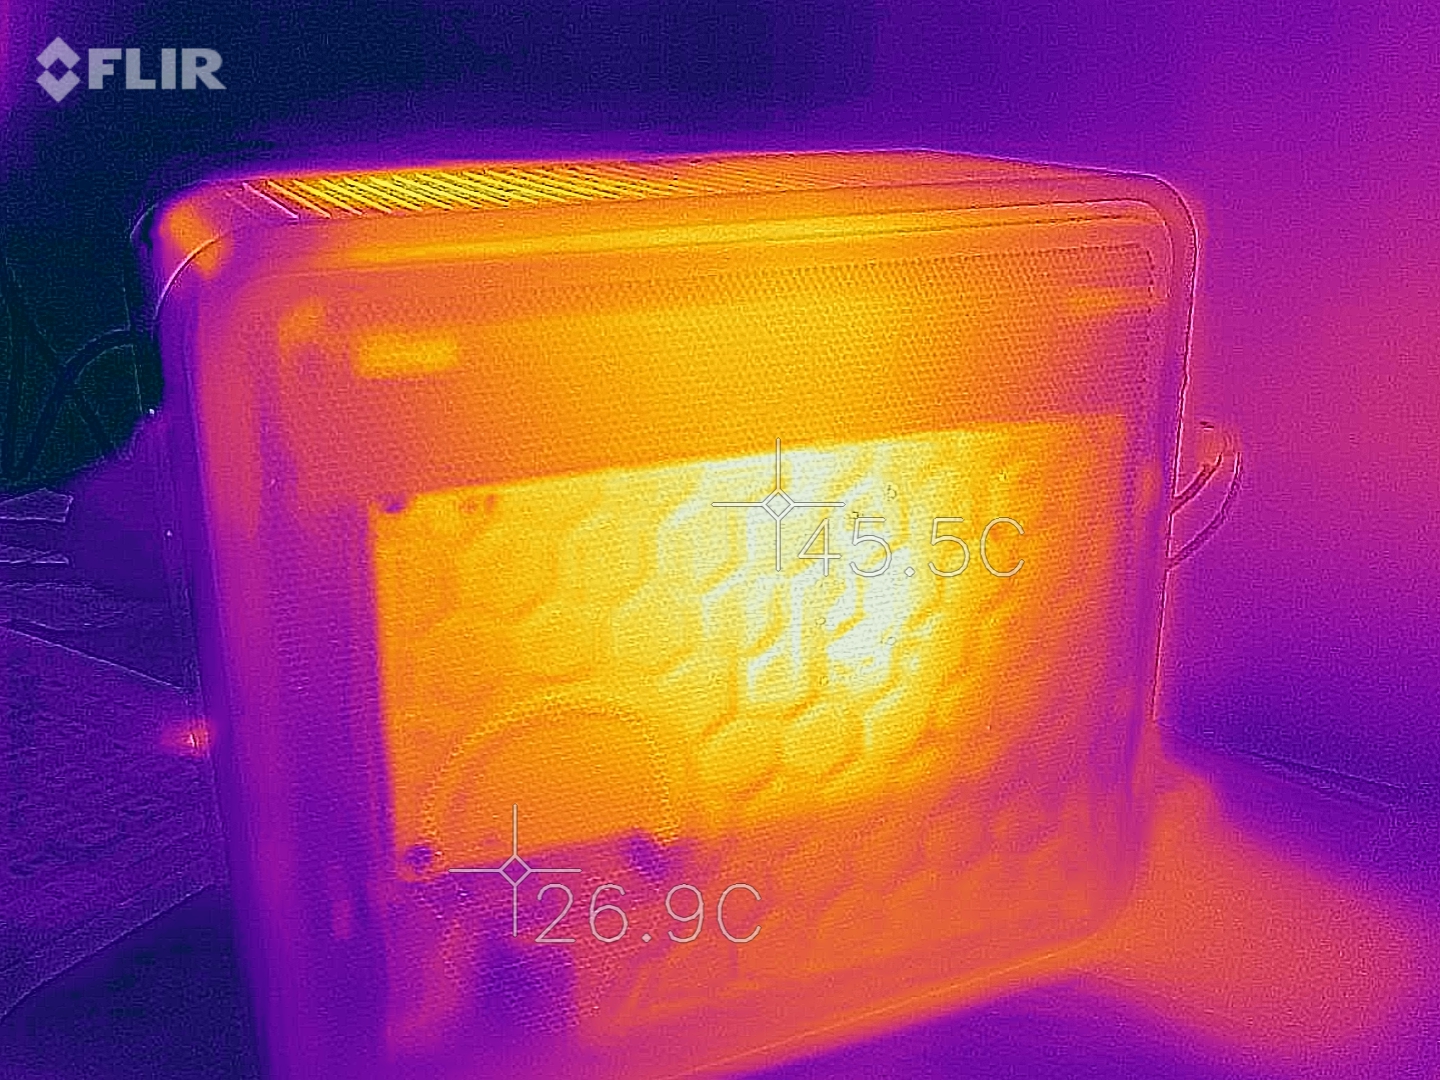
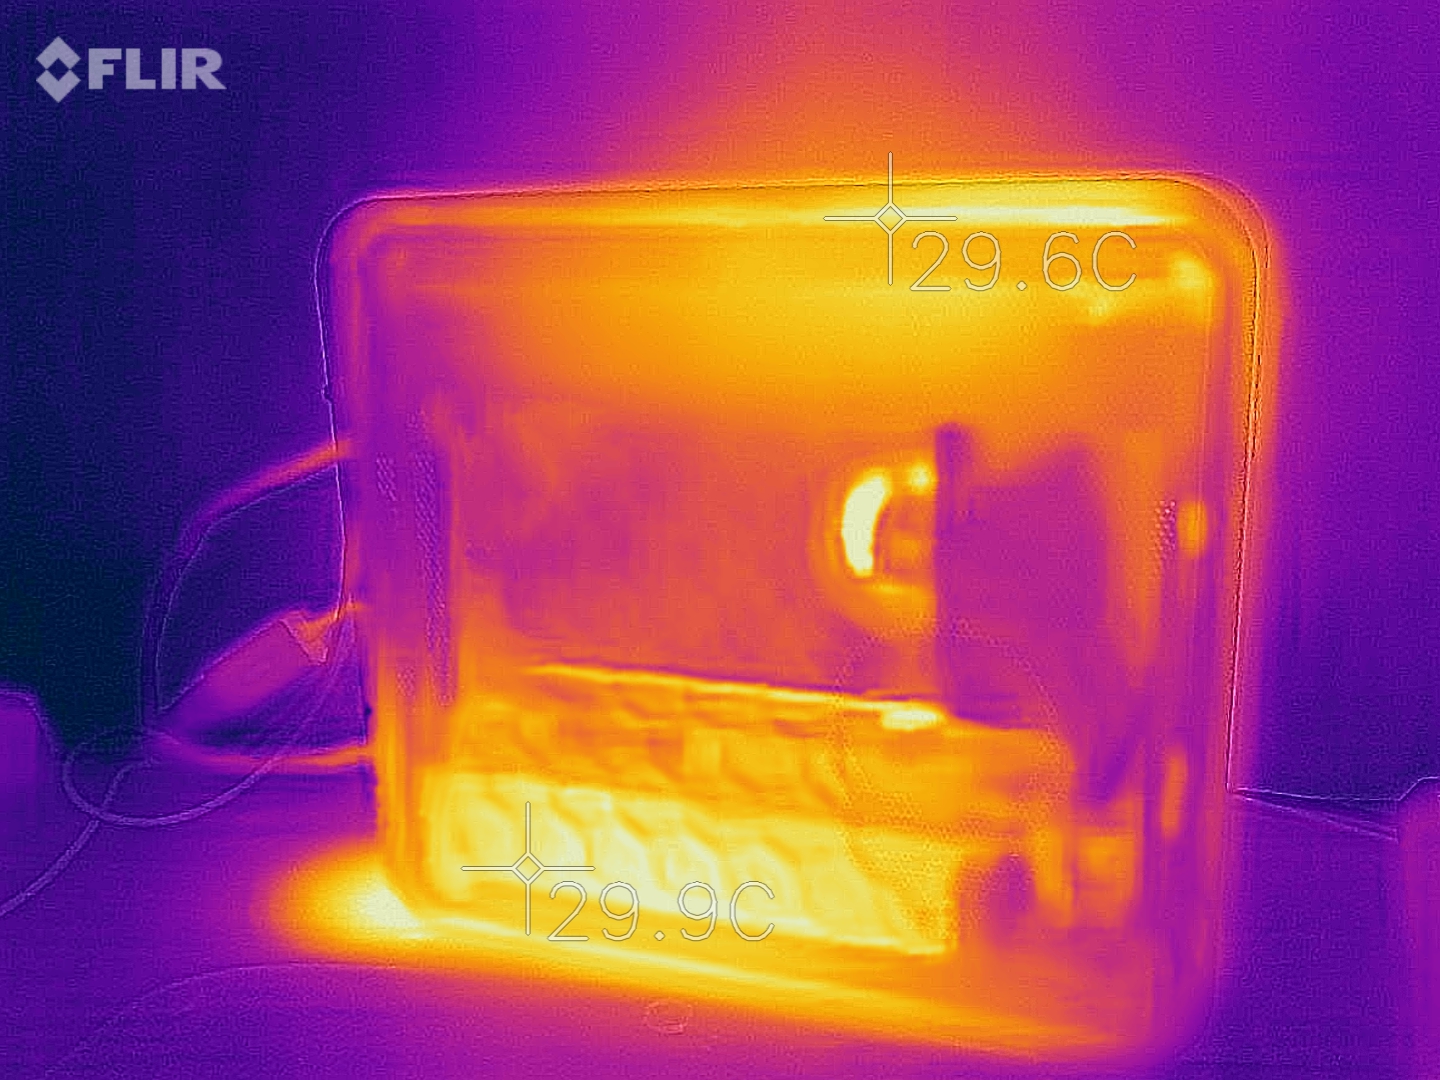
Intel, sıcaklıkları kontrol altında tutmak için yığın efektine büyük ölçüde güvenir. Bu, soğuk havanın yanlara emildiği ve kasanın içinden ve dışından yukarı doğru hareket ettiği anlamına gelir. Tüm bunlar GPU engelleme hava akışı olmadığı sürece oldukça iyi çalışır. Stres testimiz sırasında performansın azaltılmış soğutma etkilerinden muzdarip olmadığını belirledik, ancak GPU takılıyken gürültü emisyonları önemli ölçüde arttı. Prime95'te 38,8 dB (A) 'dan 39,8 dB (A)' ya yükseldiler. Intel'in neden fanı diğer tarafa taşımaması bizim için bir sır olarak kalıyor. Ağ örtüleri uygun havalandırmayı sağlayacaktır. GPU stres testini (FurMark) çalıştırmak, en azından kısmen RTX 2070'in fanlarından kaynaklanan 48.5 dB (A) ile sonuçlandı. GPU yaklaşık 70 ° C (158 ° F) sıcaklığa ulaştı ve her iki fanı maksimum hızlarının yaklaşık% 58'inde dönüyordu. Ayrıca, GPU'ların bilindiği, ancak depolama cihazlarına eriştiğimizde ve arada sırada kendini farkedilen tipik bobin şaraplarına benzemeyen çok net bir şekilde duyulabilir elektrik gürültüsü fark ettik. Boşta kaldığında, cihaz 20 W kadar az tüketir. Özel GPU olmadan kaydedilen en yüksek güç tüketimi 127 W'da Cinebench R15 çok iş parçacıklı döngümüzde meydana geldi. GeForce RTX 2070'i takmak boşta güç tüketimini 33 W'a ve 251'e kadar artırdı. FurMark stres testimiz sırasında W. Bu şekilde donatılmış bir NUC'nin temelde tam teşekküllü bir oyun bilgisayarı olduğu düşünüldüğünde kabul edilebilir bir güç tüketimi. 500 W güç kaynağının kısa bir süre için sağlaması gereken maksimum 270 W idi. Oyun güç tüketimi önemli ölçüde düşüktü ve ortalama 237 W civarındaydı.
| Power Consumption | |
| 1920x1080 The Witcher 3 ultra (external Monitor) | |
| AMD Ryzen 9 3950X (Idle: 95 W) | |
| Intel Core i9-10900K (Idle: 52.3 W) | |
| Intel Core i5-10600K (Idle: 52.2 W) | |
| Intel Ghost Canyon NUC (RTX 2070) (Idle: 33.1 W) | |
| Prime95 V2810 Stress (external Monitor) | |
| Intel Core i9-10900K (Idle: 52.3 W) | |
| Intel Core i5-10600K (Idle: 52.2 W) | |
| AMD Ryzen 9 3950X (Idle: 95 W) | |
| Intel Ghost Canyon NUC (RTX 2070) (Idle: 33.1 W) | |
| Intel Ghost Canyon NUC (Idle: 20.45 W) | |
| Cinebench R15 Multi (external Monitor) | |
| Intel Core i9-10900K (Idle: 52.3 W) | |
| AMD Ryzen 9 3950X (Idle: 95 W) | |
| Intel Core i5-10600K (Idle: 52.2 W) | |
| Intel Ghost Canyon NUC (Idle: 20.45 W) | |
| Temperatures - CPU Temperature Prime95 | |
| Intel Core i9-10900K | |
| AMD Ryzen 9 3950X | |
| Intel Ghost Canyon NUC | |
| Intel Core i5-10600K | |
* ... daha küçük daha iyidir
RTX 2070 olmadan Intel NUC 9 Extreme Kiti
RTX 2070 ile Intel NUC 9 Extreme Kiti

Artılar
Eksiler
Karar - Yüksek Fiyata Minik Santral
Intel'in NUC 9 Extreme kiti küçük ama çok güçlü bir sistemdir. 1.700 dolarlık mevcut fiyatıyla, büyük bir şeyden başka bir şey değildir ve RAM, depolama ve istenirse ayrı bir GPU sağlamanız gerektiğini aklınızda bulundurmanız gerekir. Buna karşılık, çok iyi donanımlı ve modern bir cihaz alırsınız. Yüksek performanslı bir GPU ile donatılmış minyatür PC, en yeni ve en büyük oyunları bile sorunsuz bir şekilde çalıştırabilen tam teşekküllü bir oyun PC'sine dönüşür. Intel Core i9-9980HK'nın 8 çekirdekli performansına ihtiyacınız yoksa SKU'lar da satın alabilirsiniz daha yavaş i7-9750H veya i5-9300H işlemcilerle. Her ikisi de oyun dizüstü bilgisayarlarında sıklıkla bulunabilir ve geçmişte çok sağlam ve yeterli bir performansla kendilerini kanıtlayabilir. Bununla birlikte, Core i9-9980HK, bu NUC için nihai krallık olmaya devam ediyor. , özellikle takılı bir grafik kartıyla gürültü emisyonları ile ilgili. Kompakt yapısı nedeniyle fan bu durumda neredeyse tamamen kaplıdır ve fanın grafik kartına yakınlığı nedeniyle SoC'nin ısı borusuna üflenen hava sıcaktır. Bu da gürültü emisyonlarını önemli ölçüde artırır. Kasanın dış tarafındaki fan ile biraz farklı bir tasarım büyük olasılıkla daha iyi bir alternatif olurdu. Intel'in NUC 9 Extreme'i, GeForce RTX 2070'i alabilen 1.3 galonun altındaki en küçük PC'dir. bileşenleri ve mükemmel bir yapı kalitesi. Corsair, benzer şekilde fiyatlandırılmasıyla (tam donanımlı bir Intel Hayalet Kanyon NUC 9 Extreme ile karşılaştırılabilir) çok benzer bir yaklaşım benimsedi Daha önce gözden geçirdiğimiz bir seri (bkz. One i160). Zotac'ın MEK Mini'si RTX 2070 ile donatılabilen bir başka minyatür PC.

