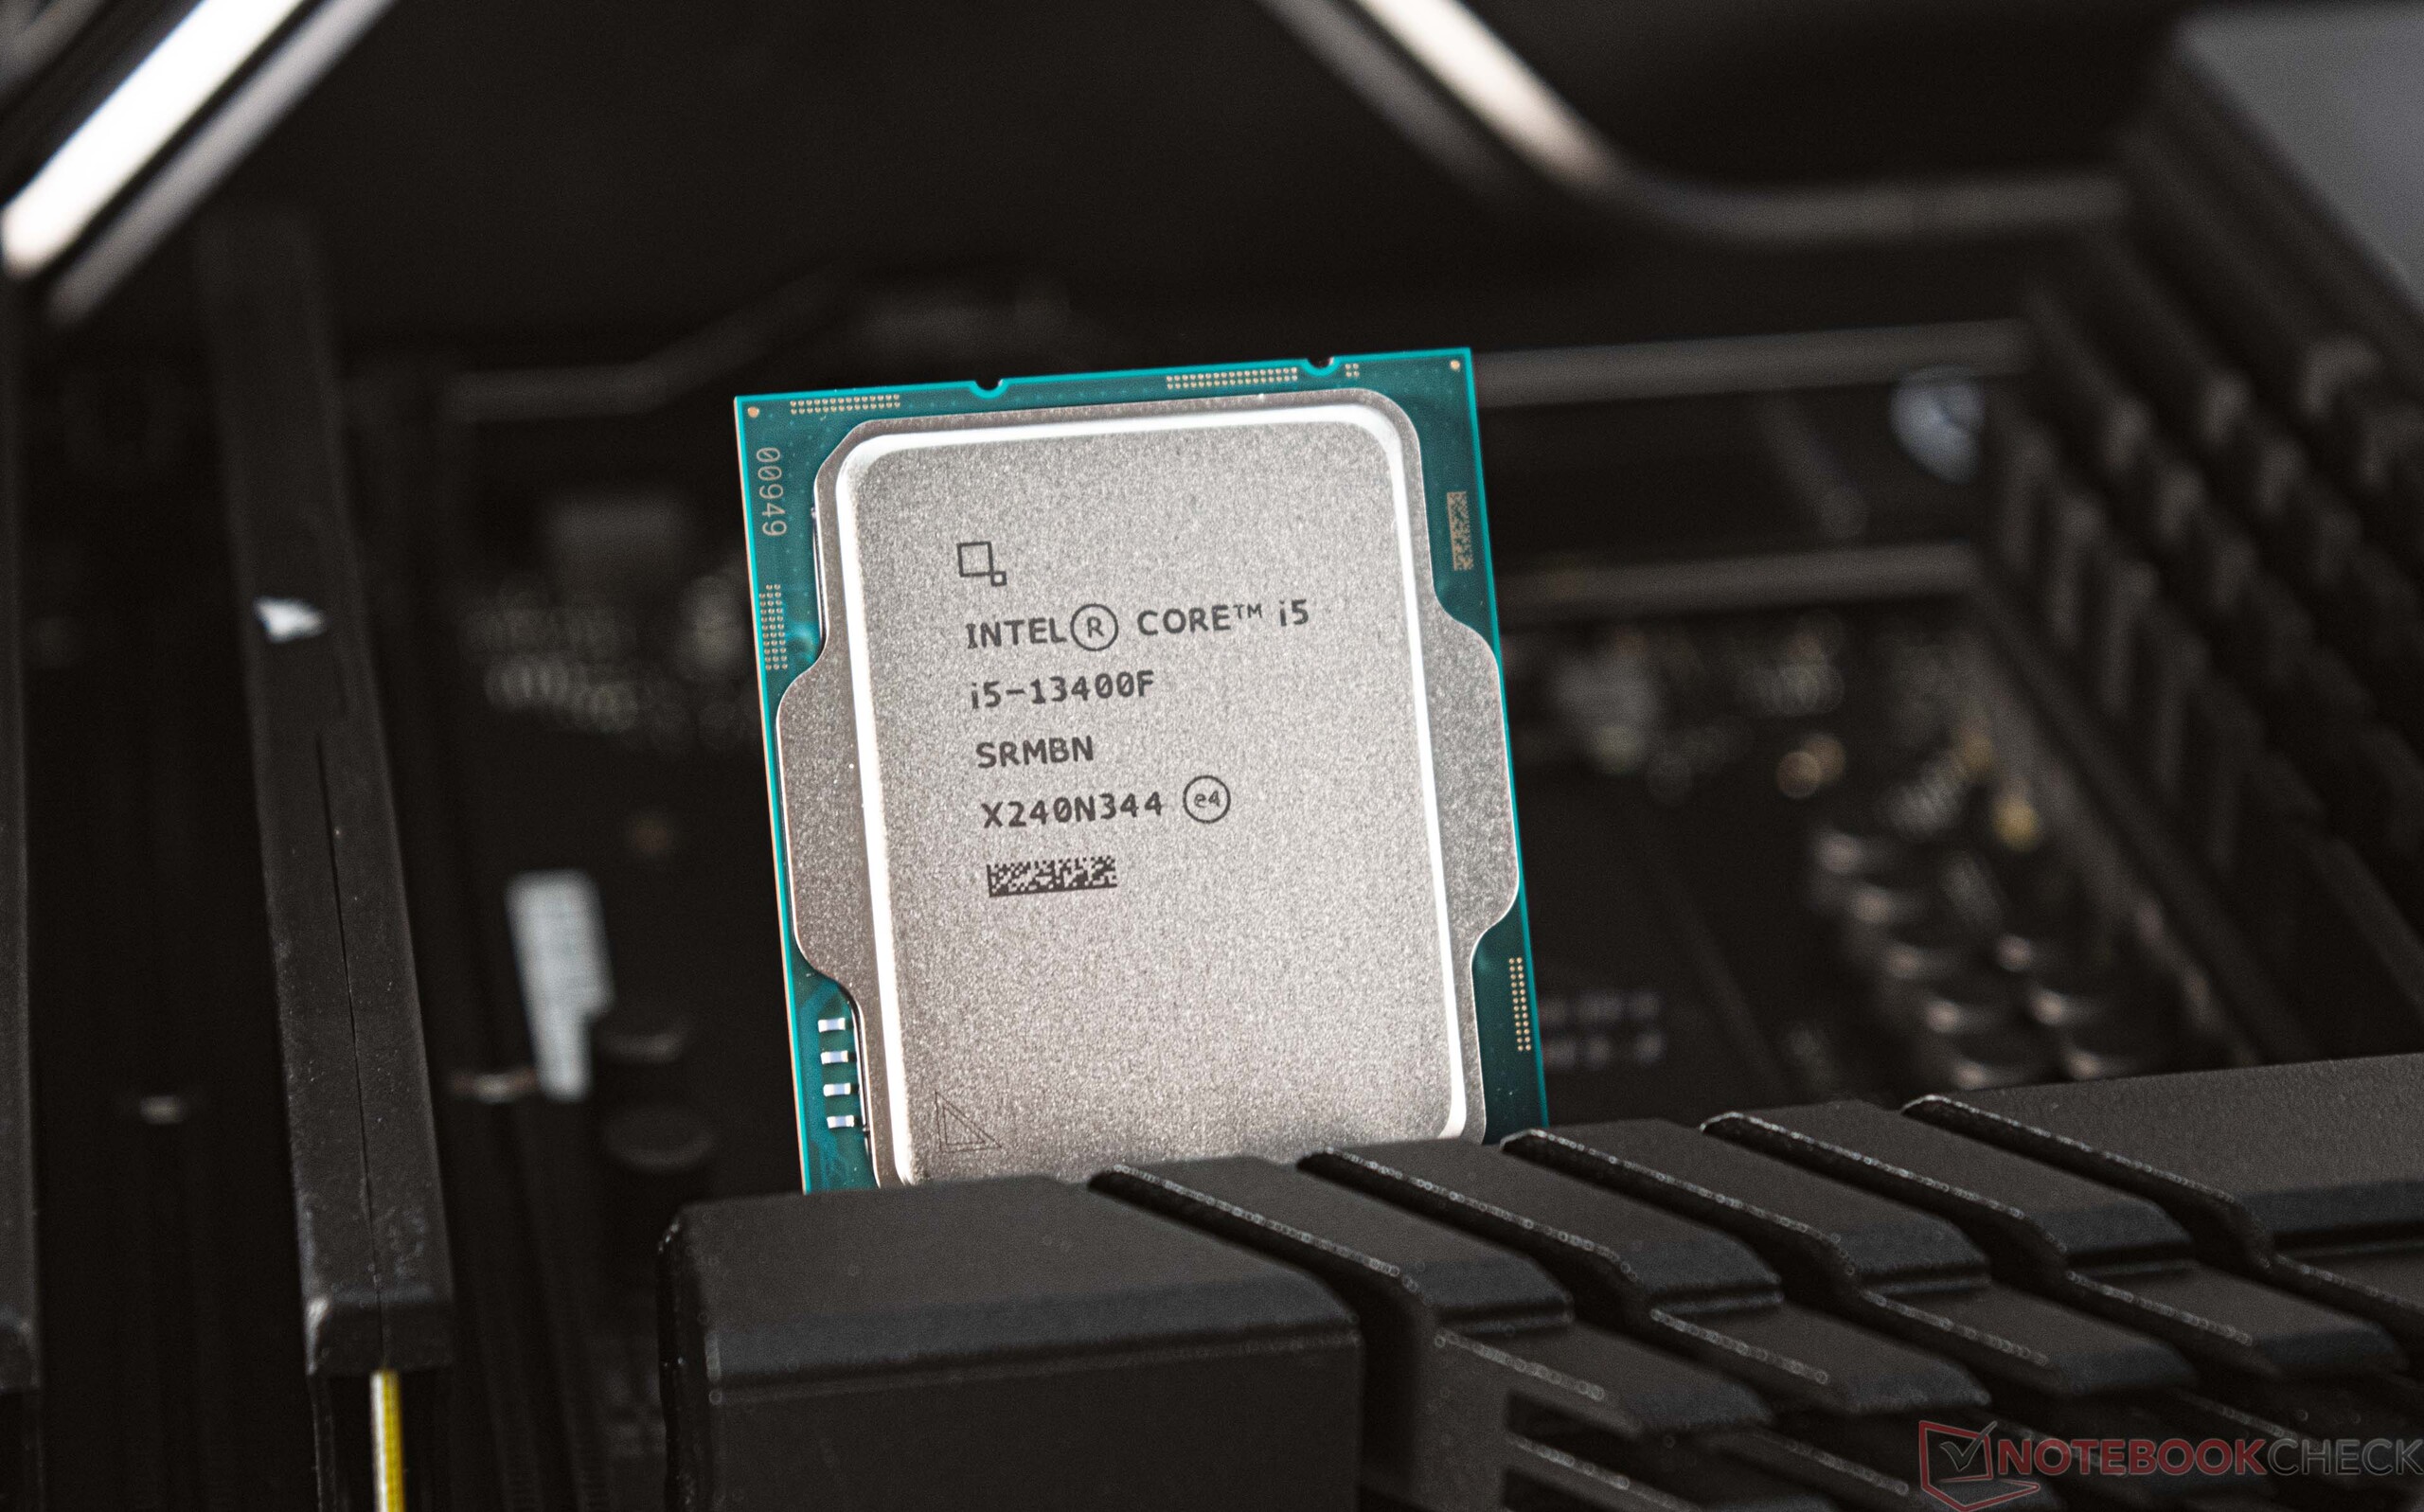
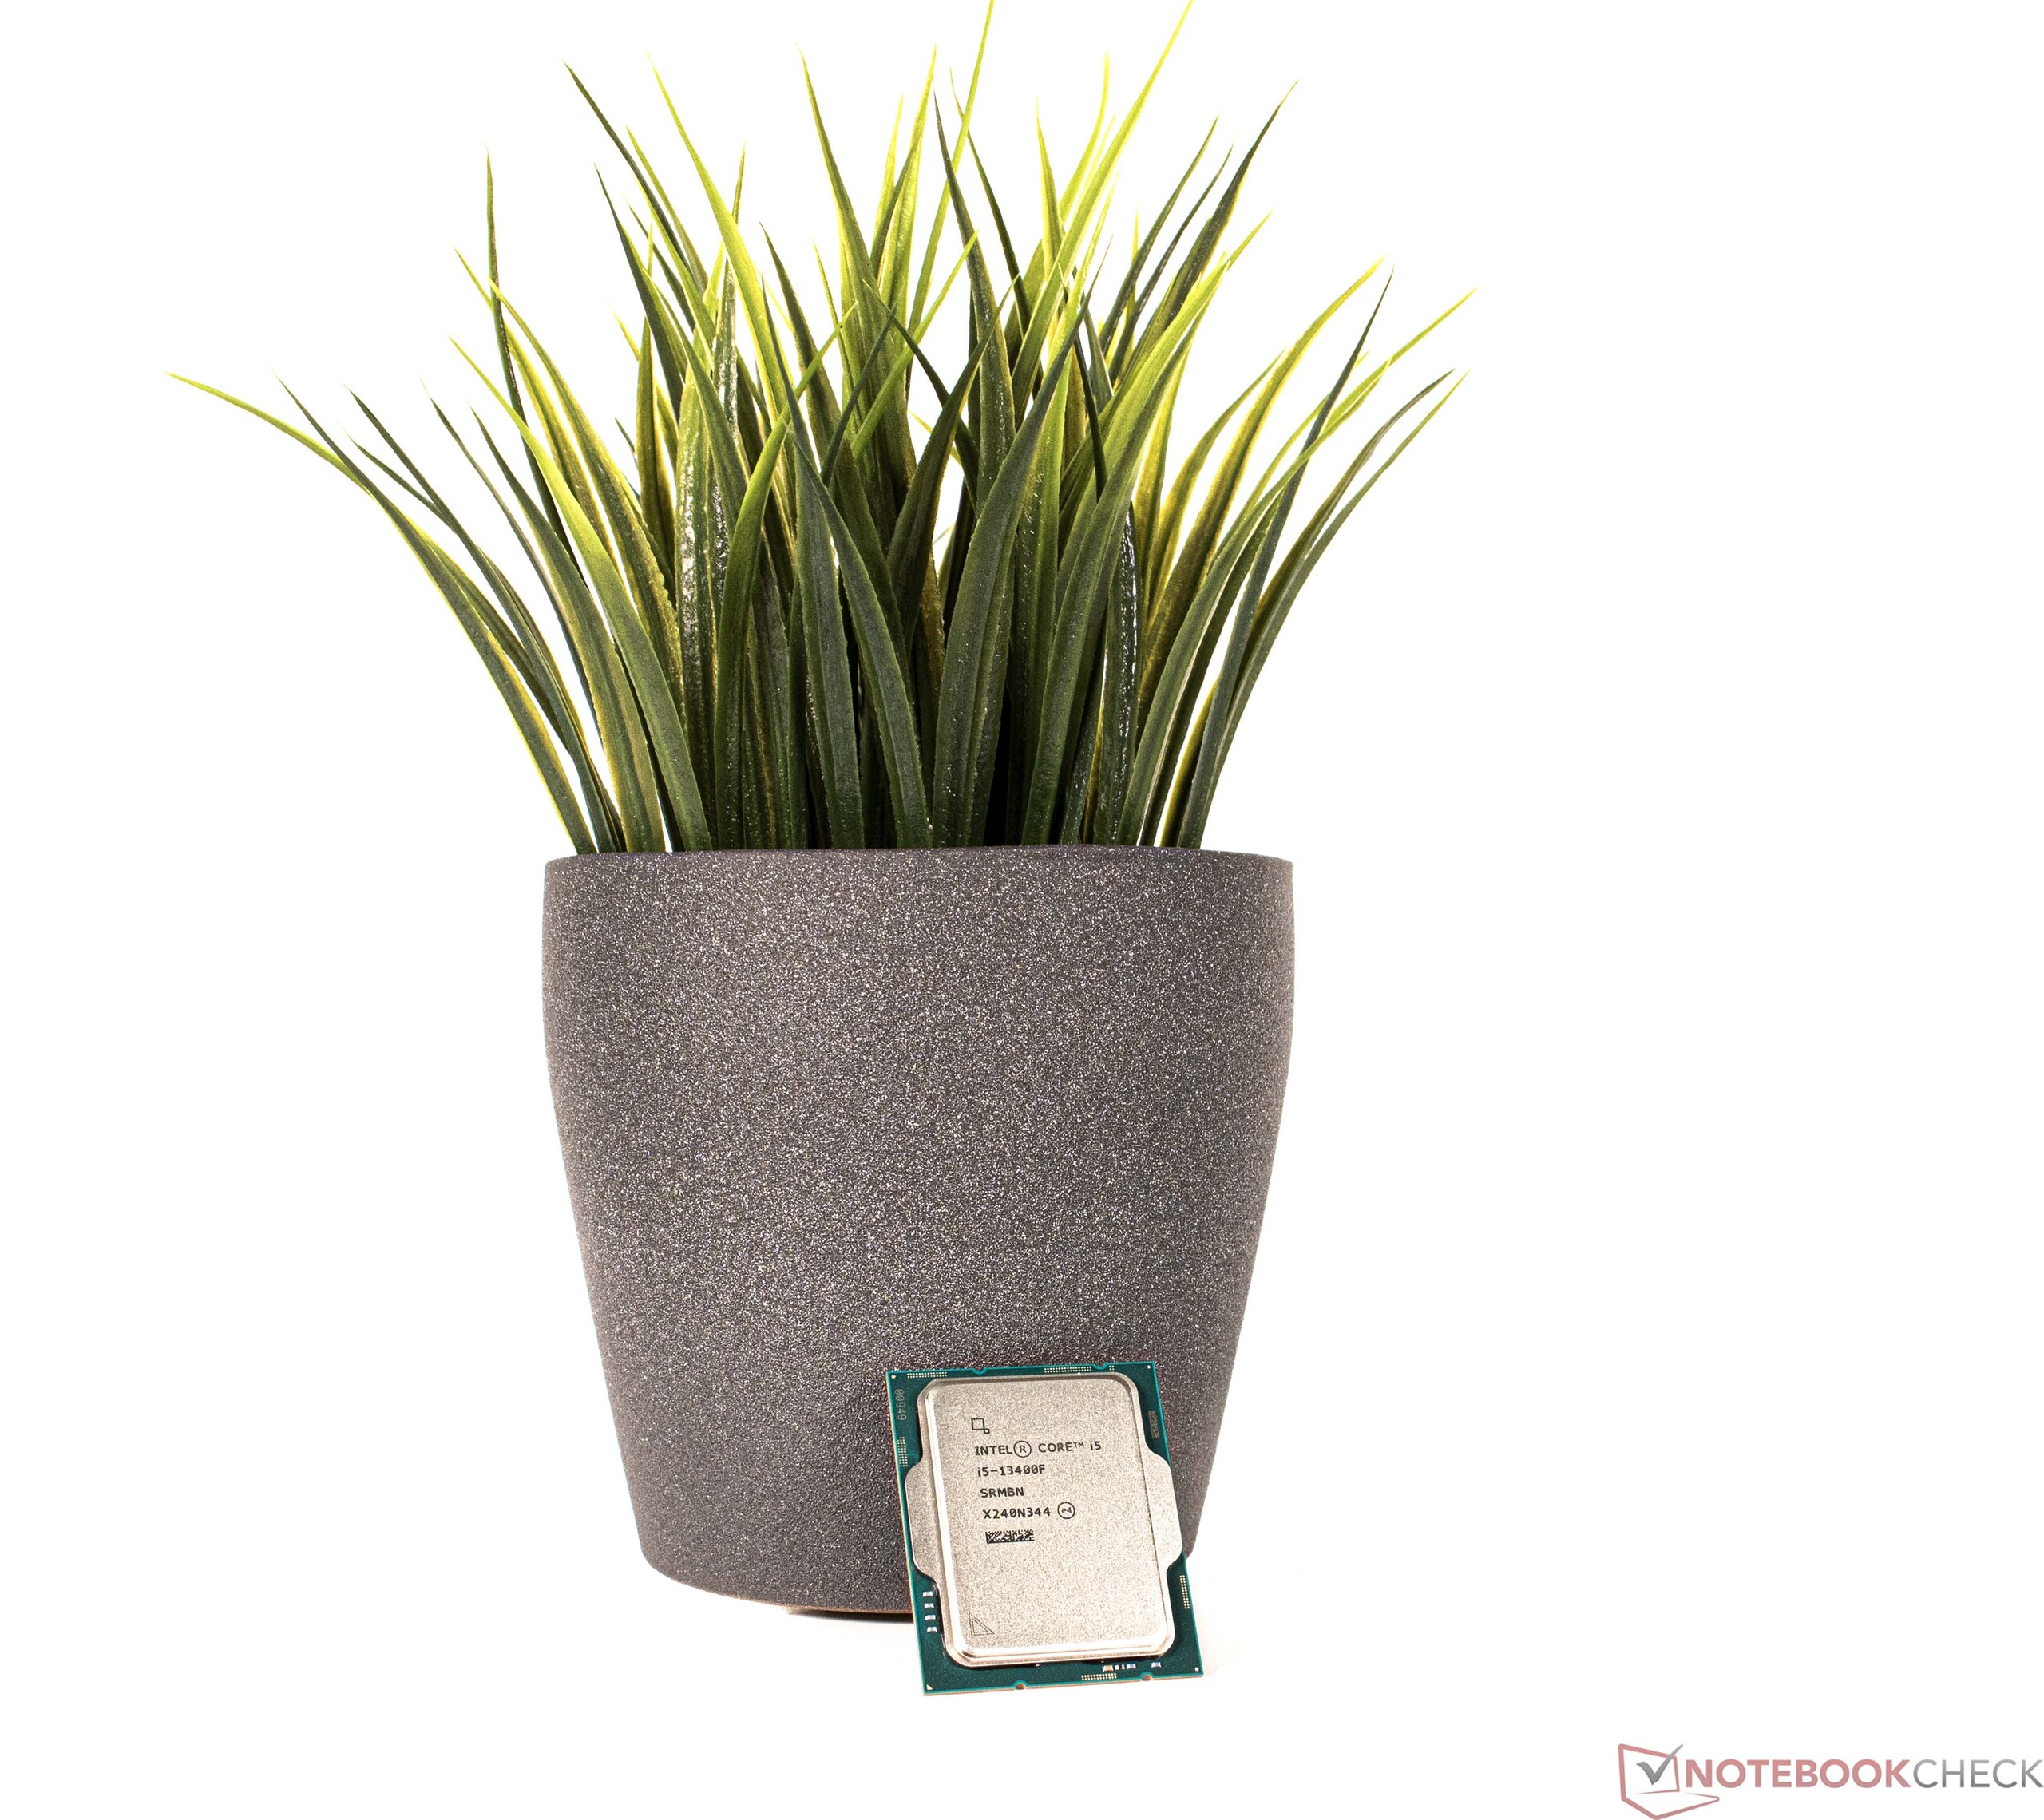
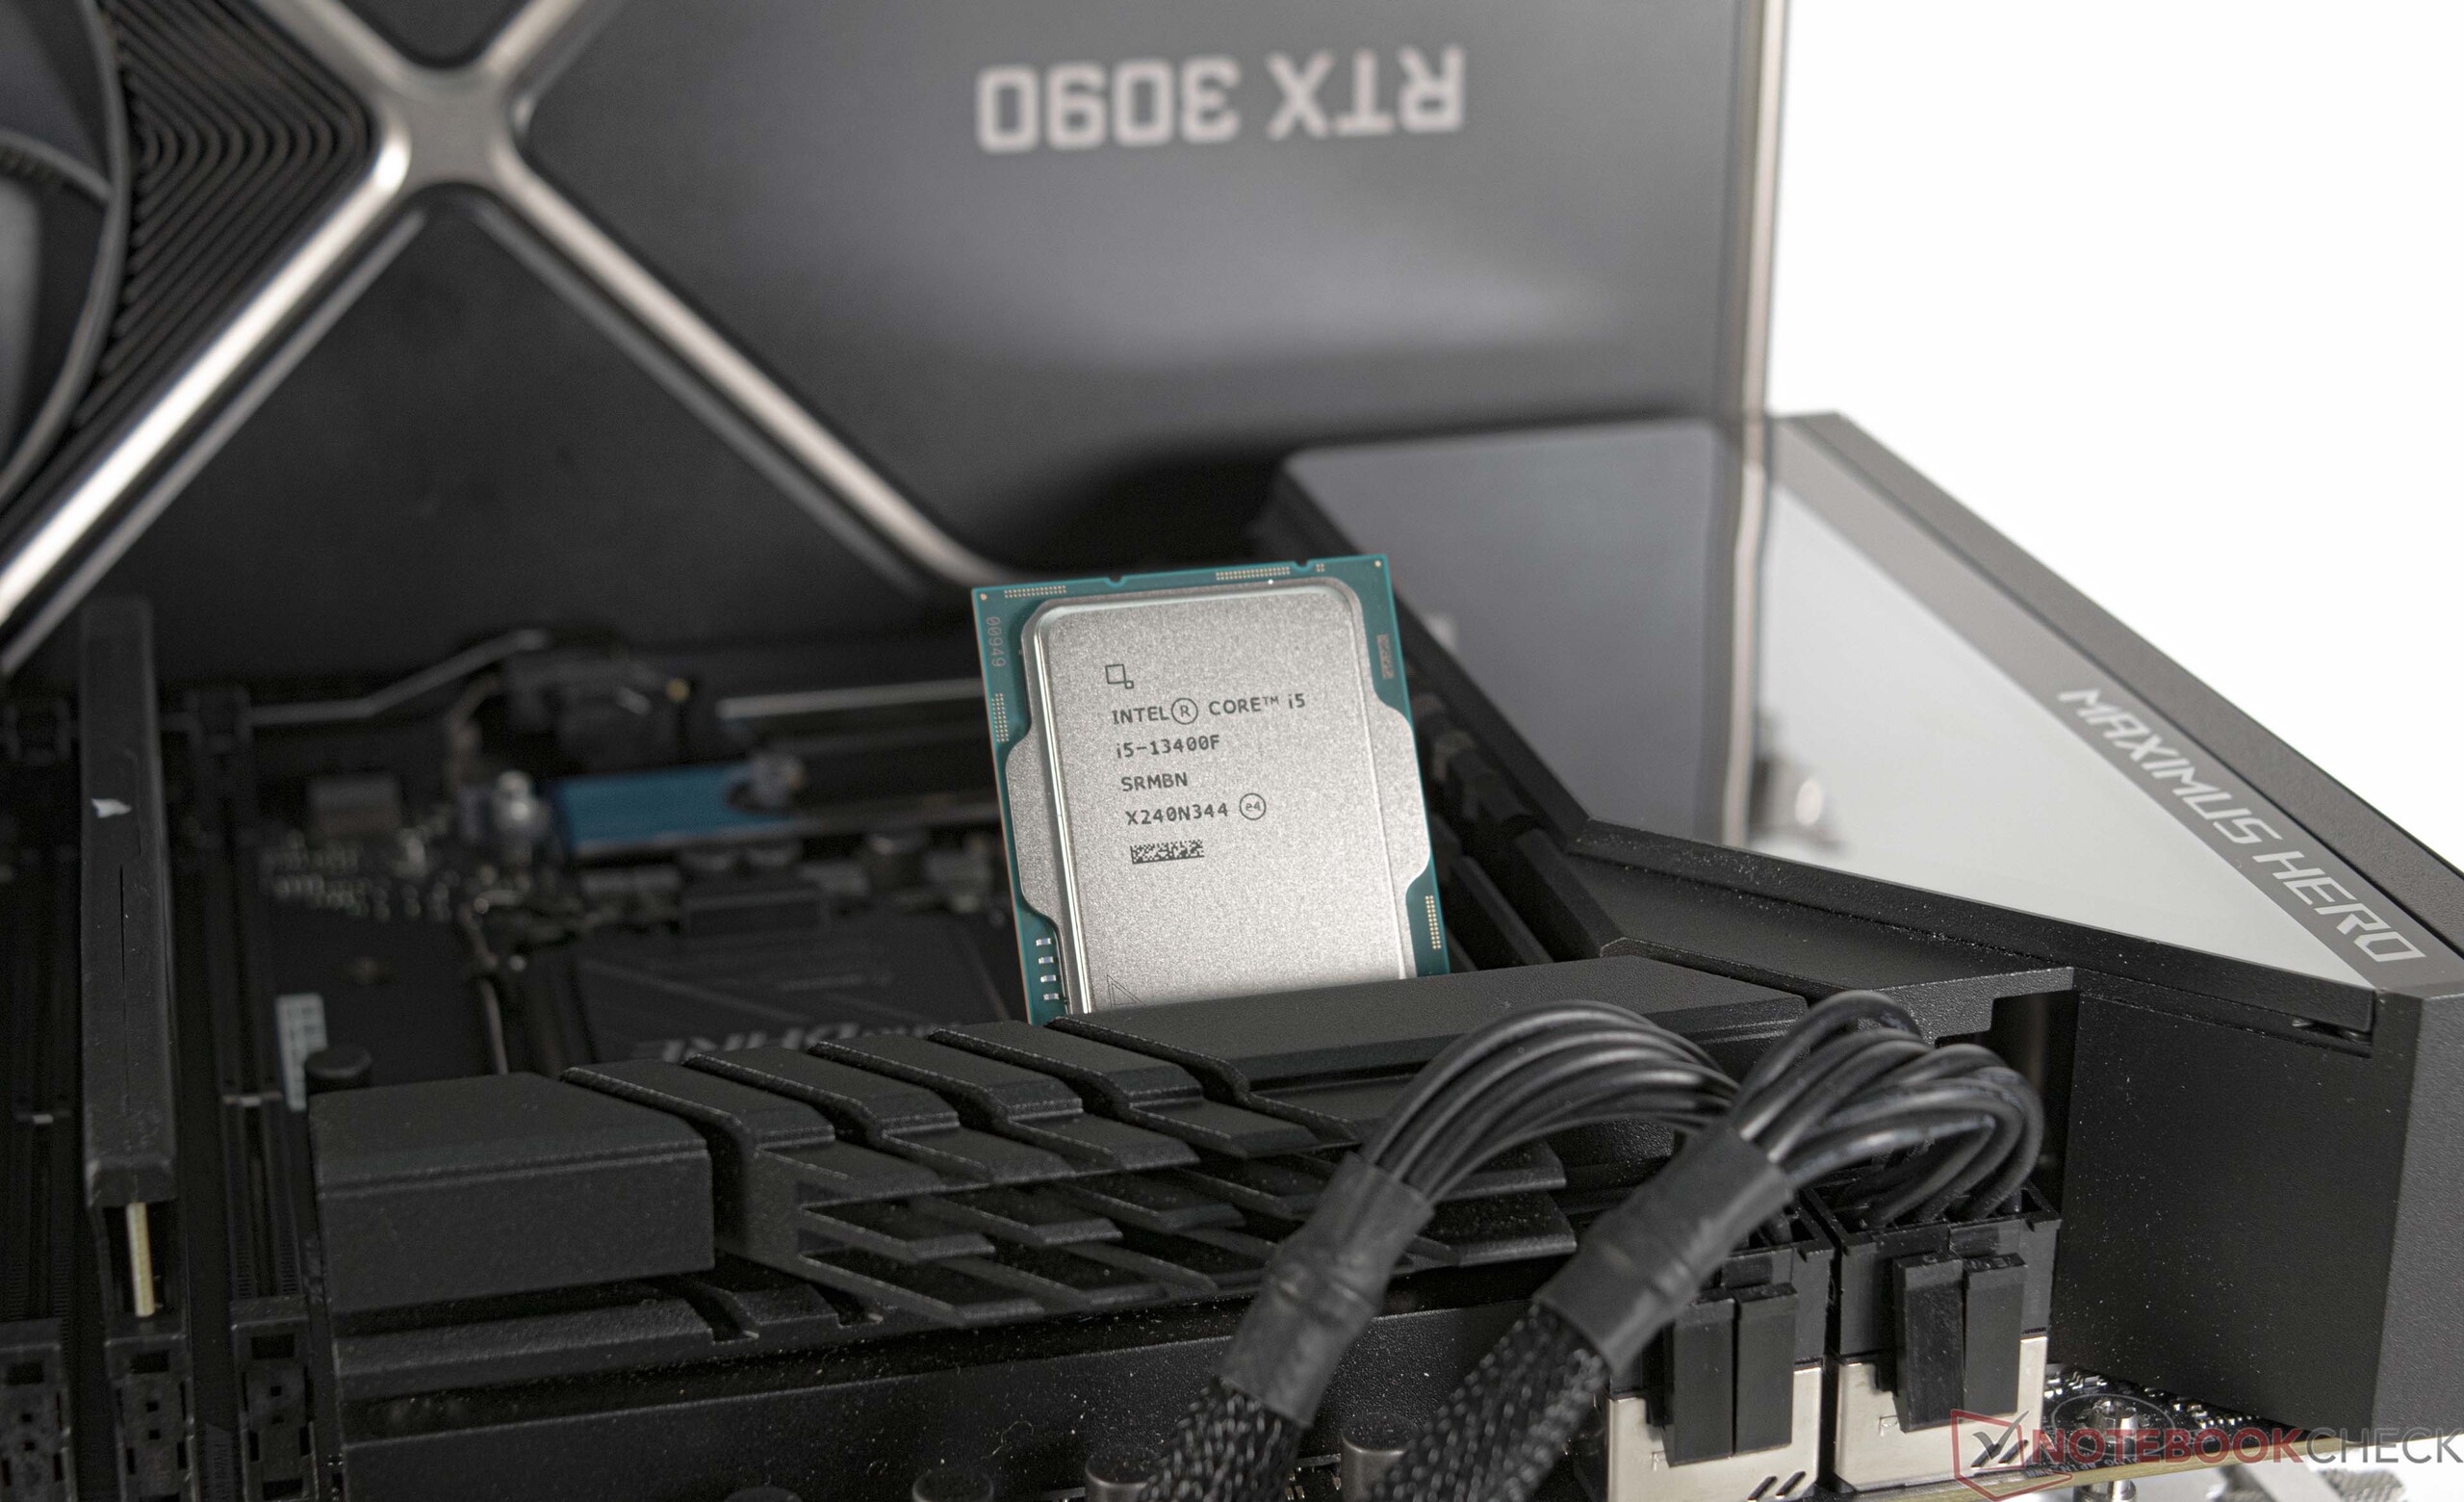
Intel Core i5-13400F masaüstü işlemcisi incelemede: Oyun ve iş için ekonomik ve ucuz 10 çekirdekli işlemci

Intel, sözde P ve E çekirdeklerini tek bir ısı yayıcı altında birleştiren Alder Lake serisi ile hibrit işlemci mimarisini başlattı. E-çekirdekleri, şimdiye kadar giriş seviyesi işlemcilerden çıkarıldı ve bu da esas olarak çoklu iş parçacıklı performansı etkiledi. 13. Çekirdek nesli ile Intel nihayet Core i5-13400F'ye 6 P çekirdeğine ek olarak 4 E çekirdeği daha verdi. Bu nedenle, artık Alder Lake serisi Intel Core i5-12600K ile aynı seviyede. Bununla birlikte, bu iki model güç tüketiminde büyük ölçüde farklılık gösterir. Ancak iki modeli performans açısından ayıran sadece birkaç yüzdelik puan var ki bunu bu noktada ortaya koyabiliriz.
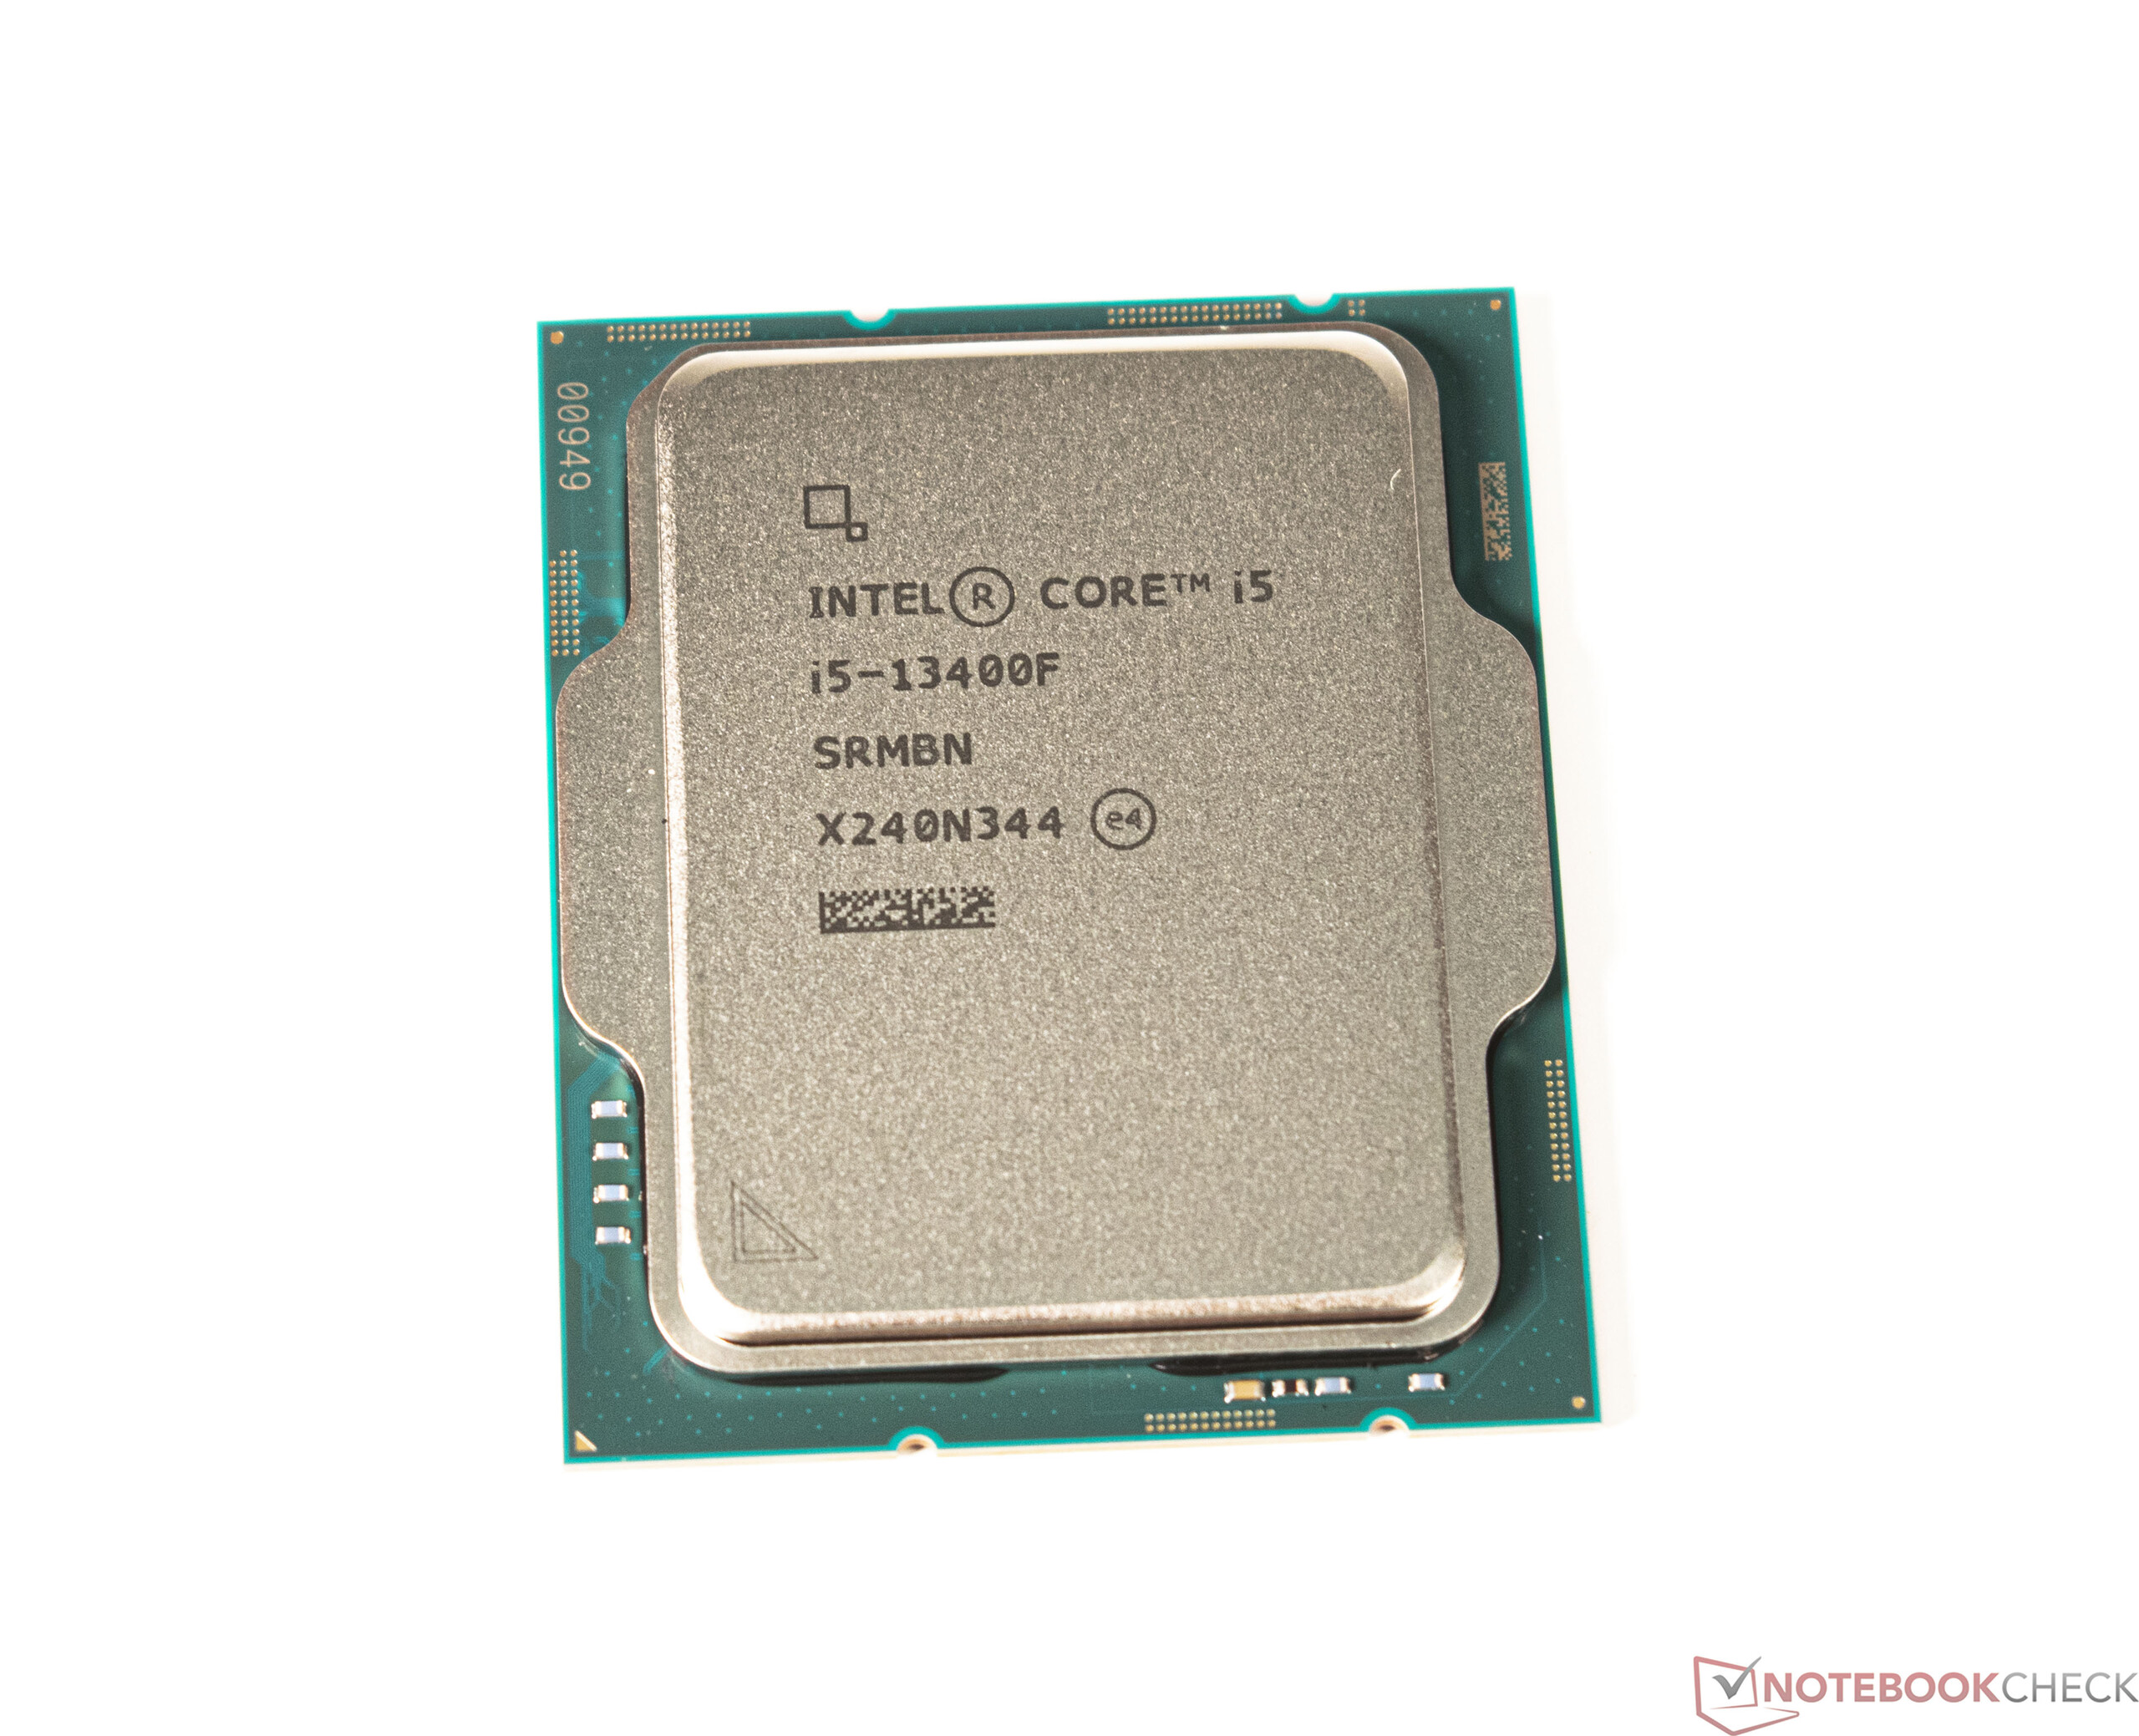
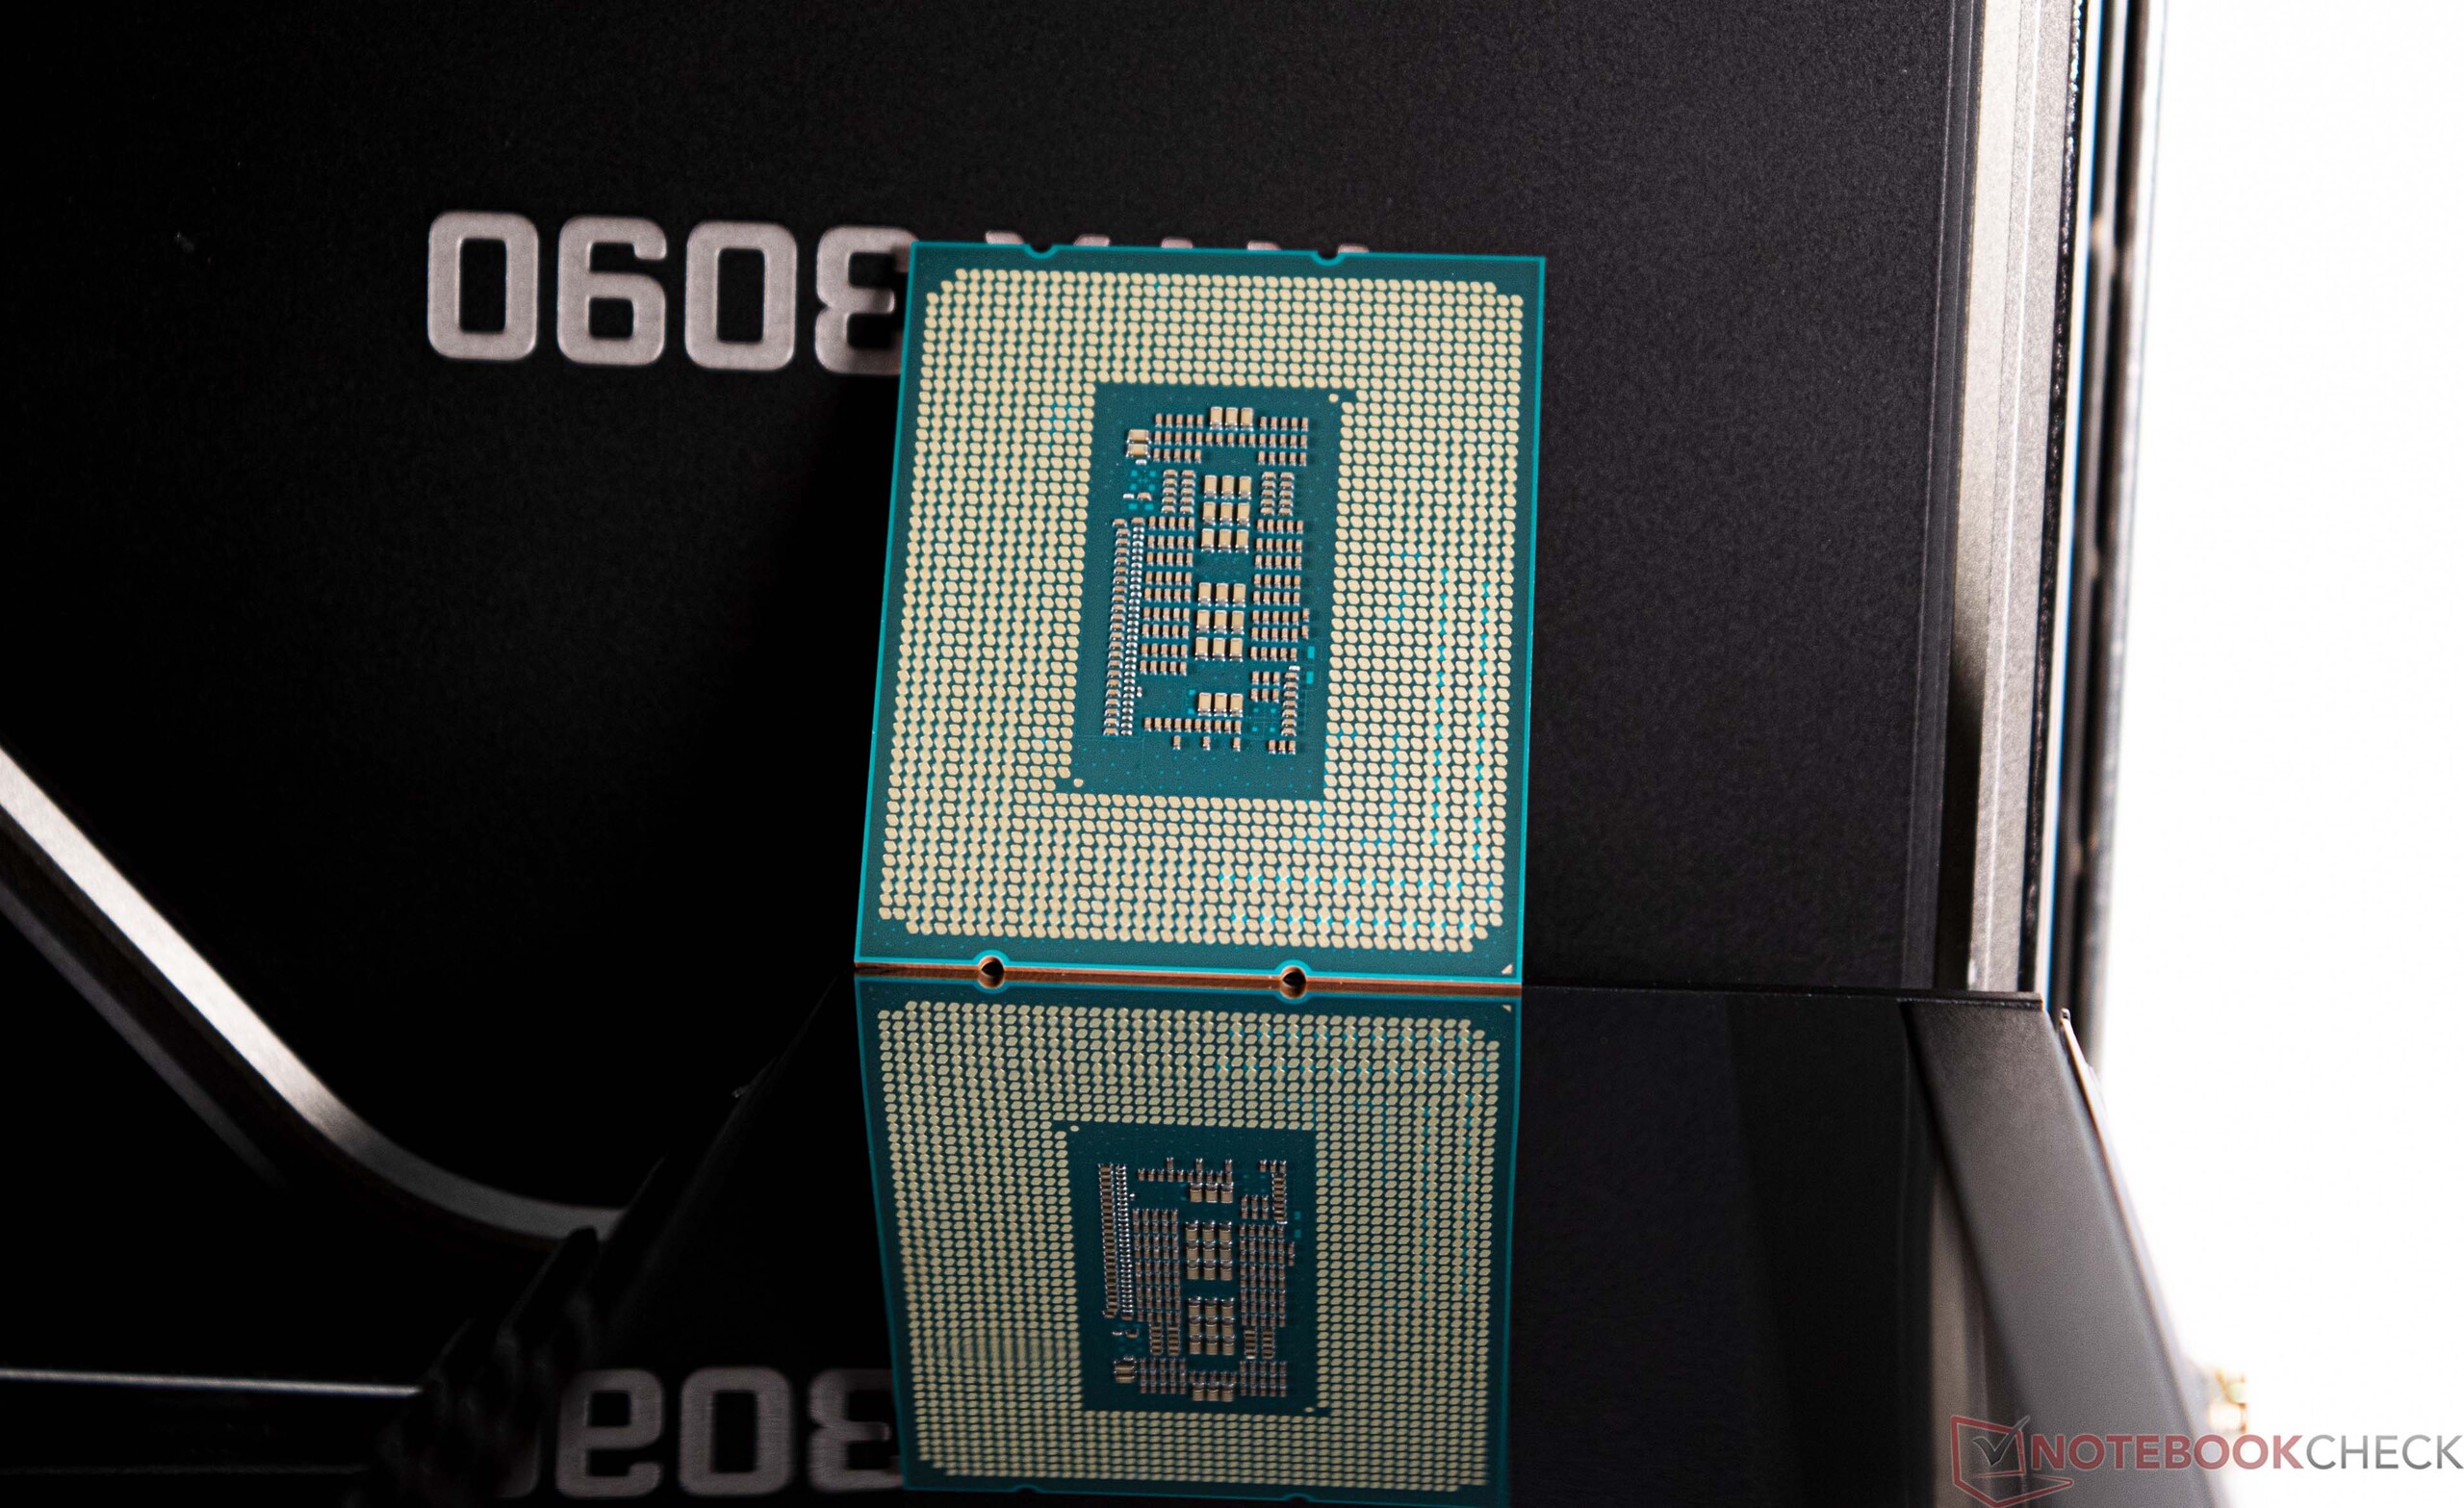
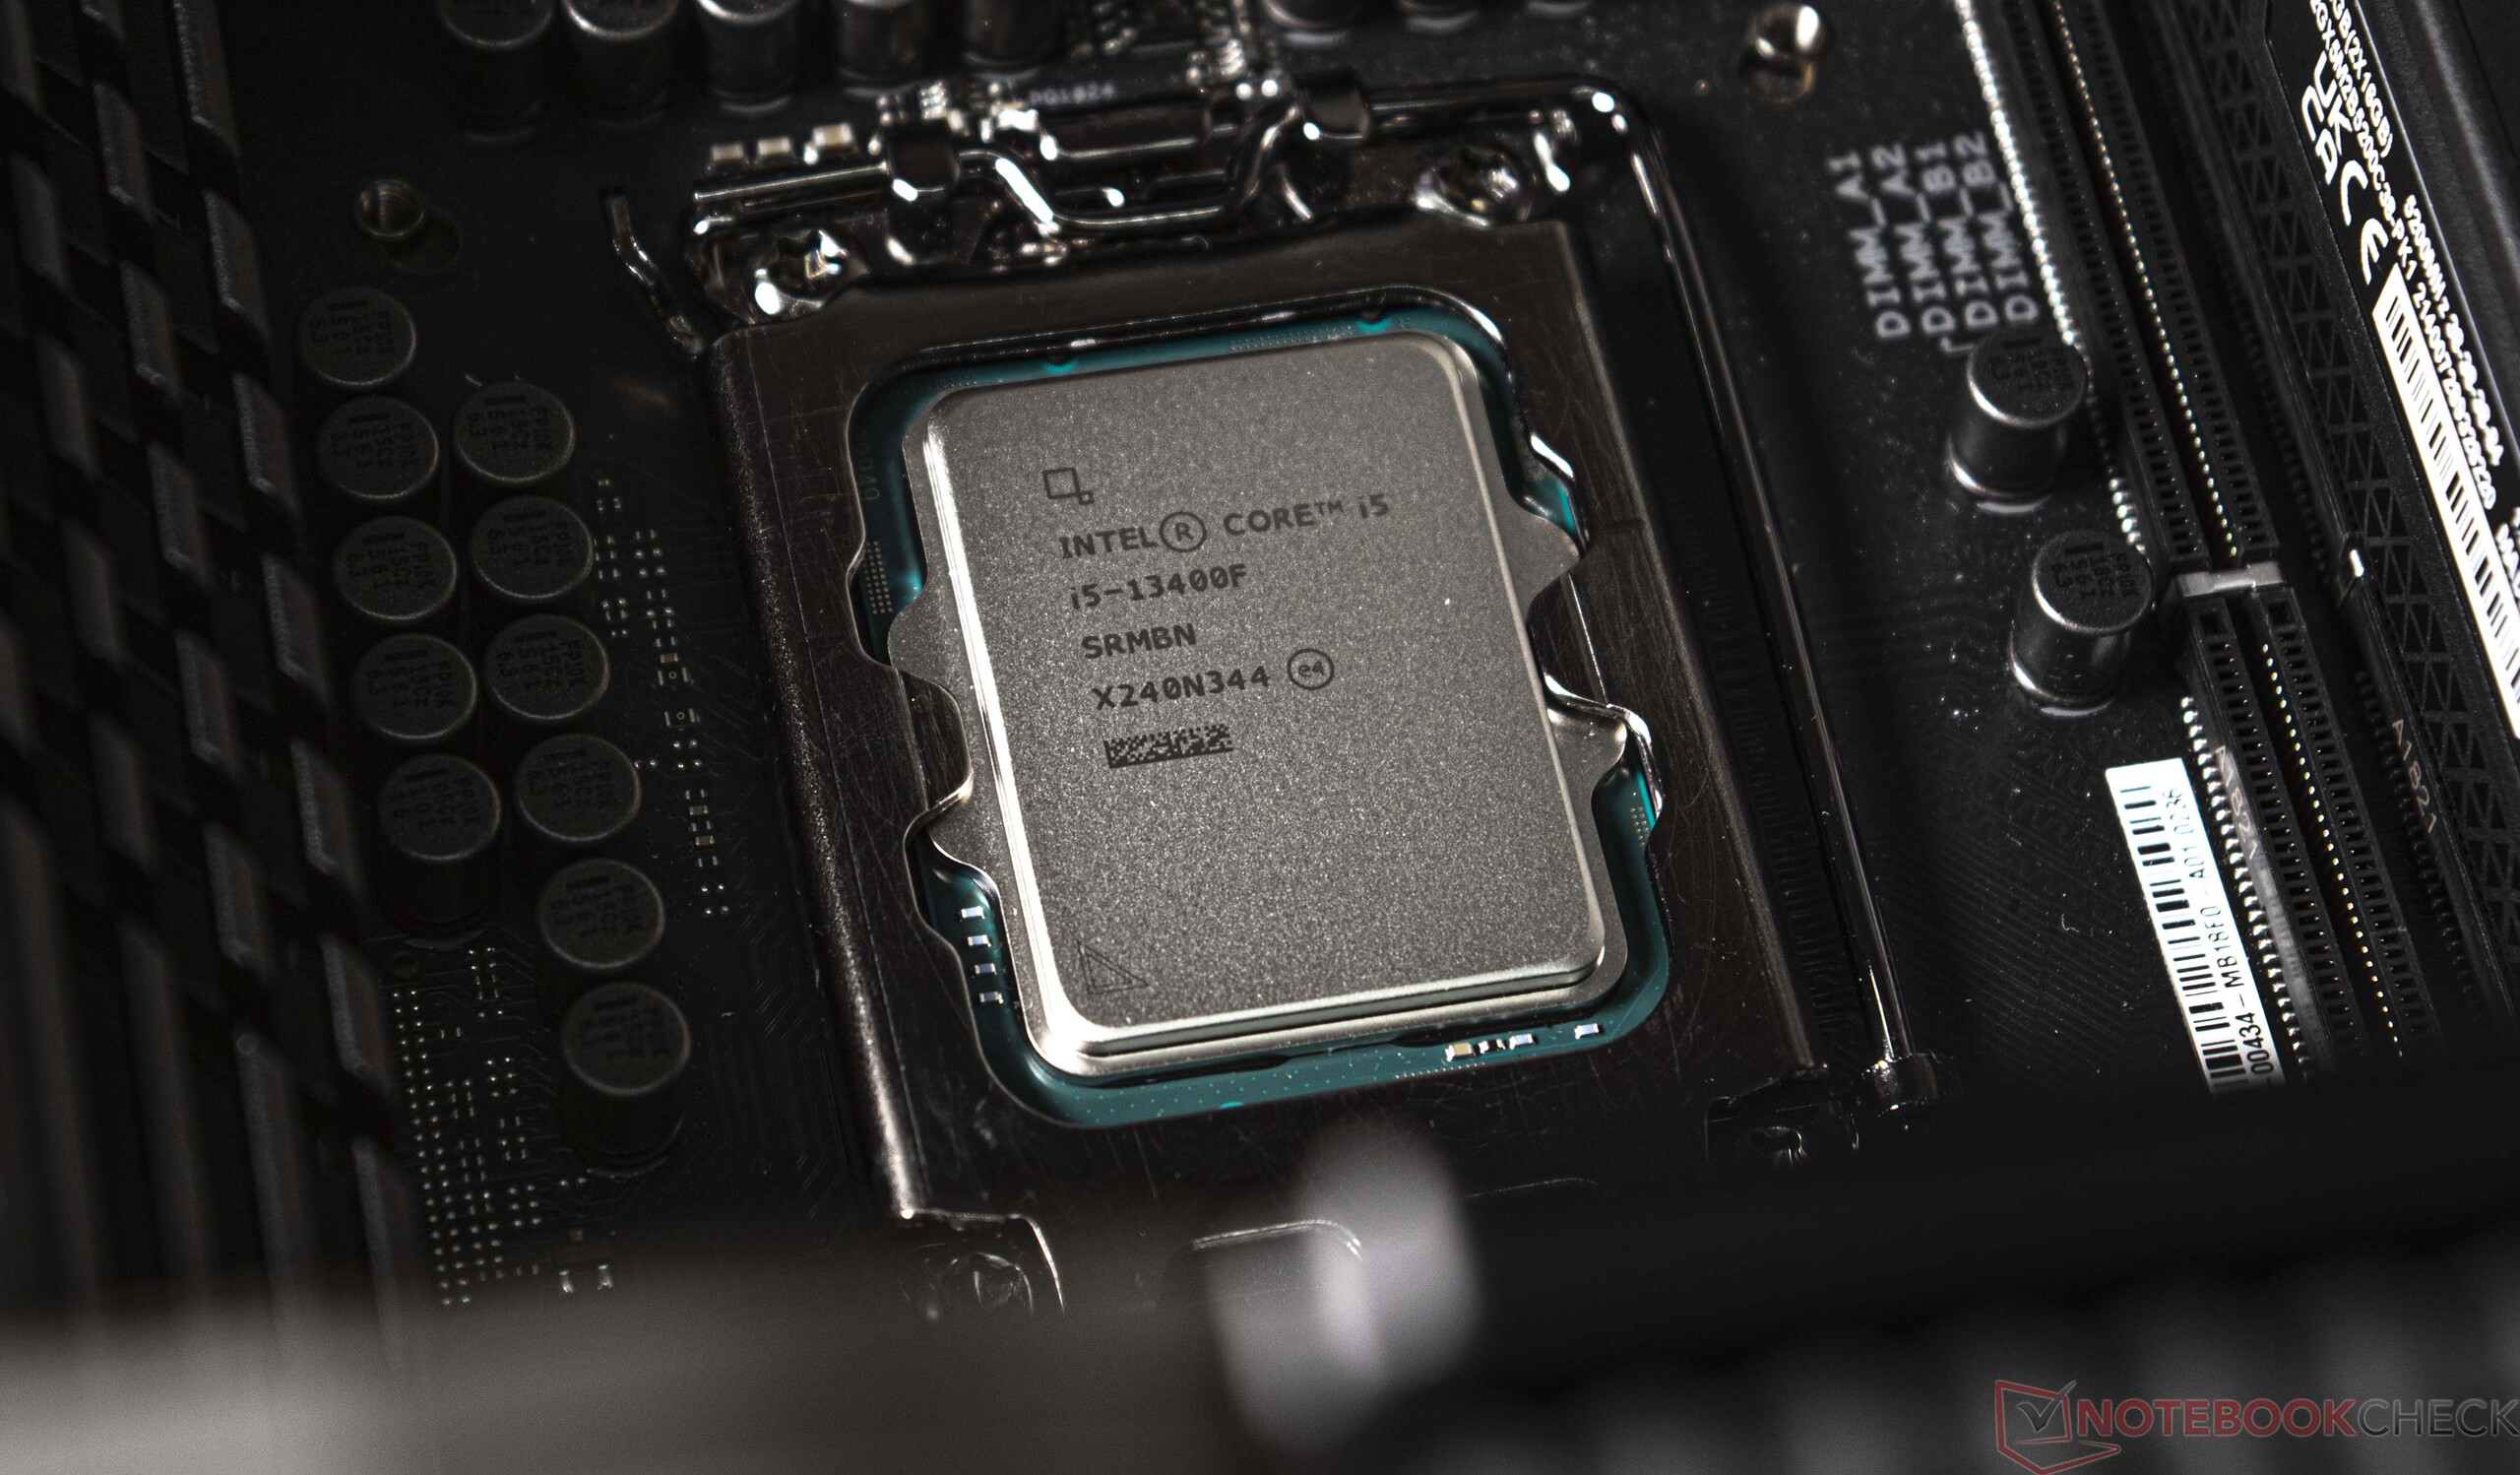
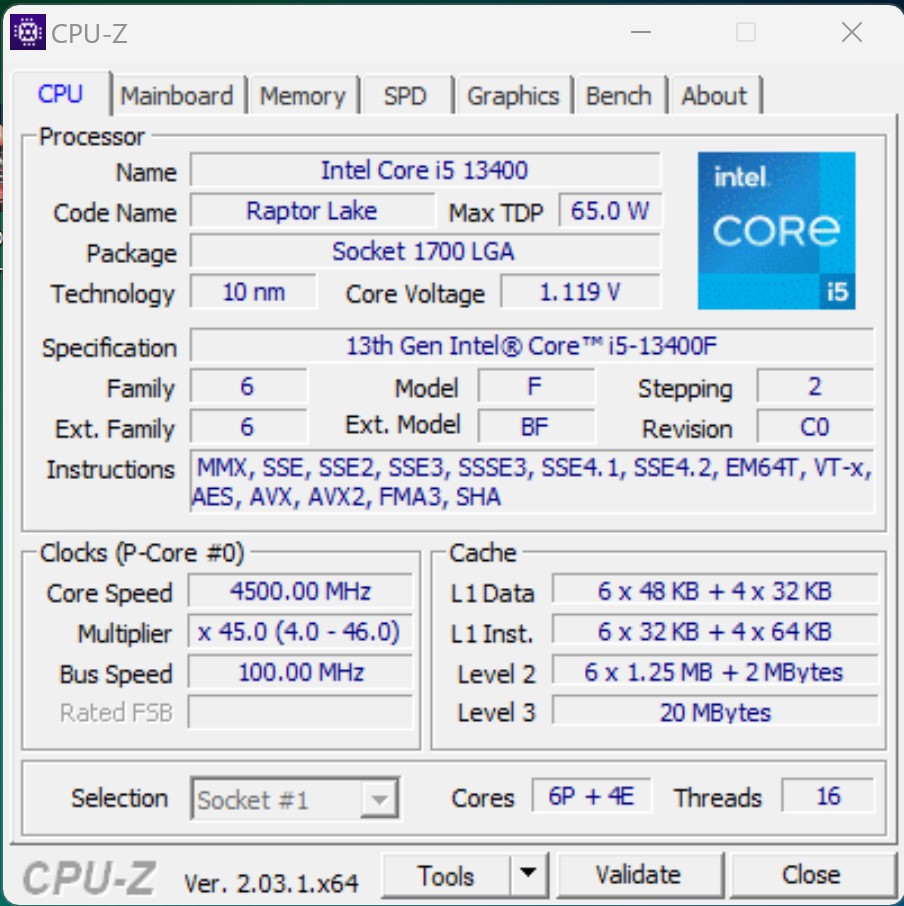
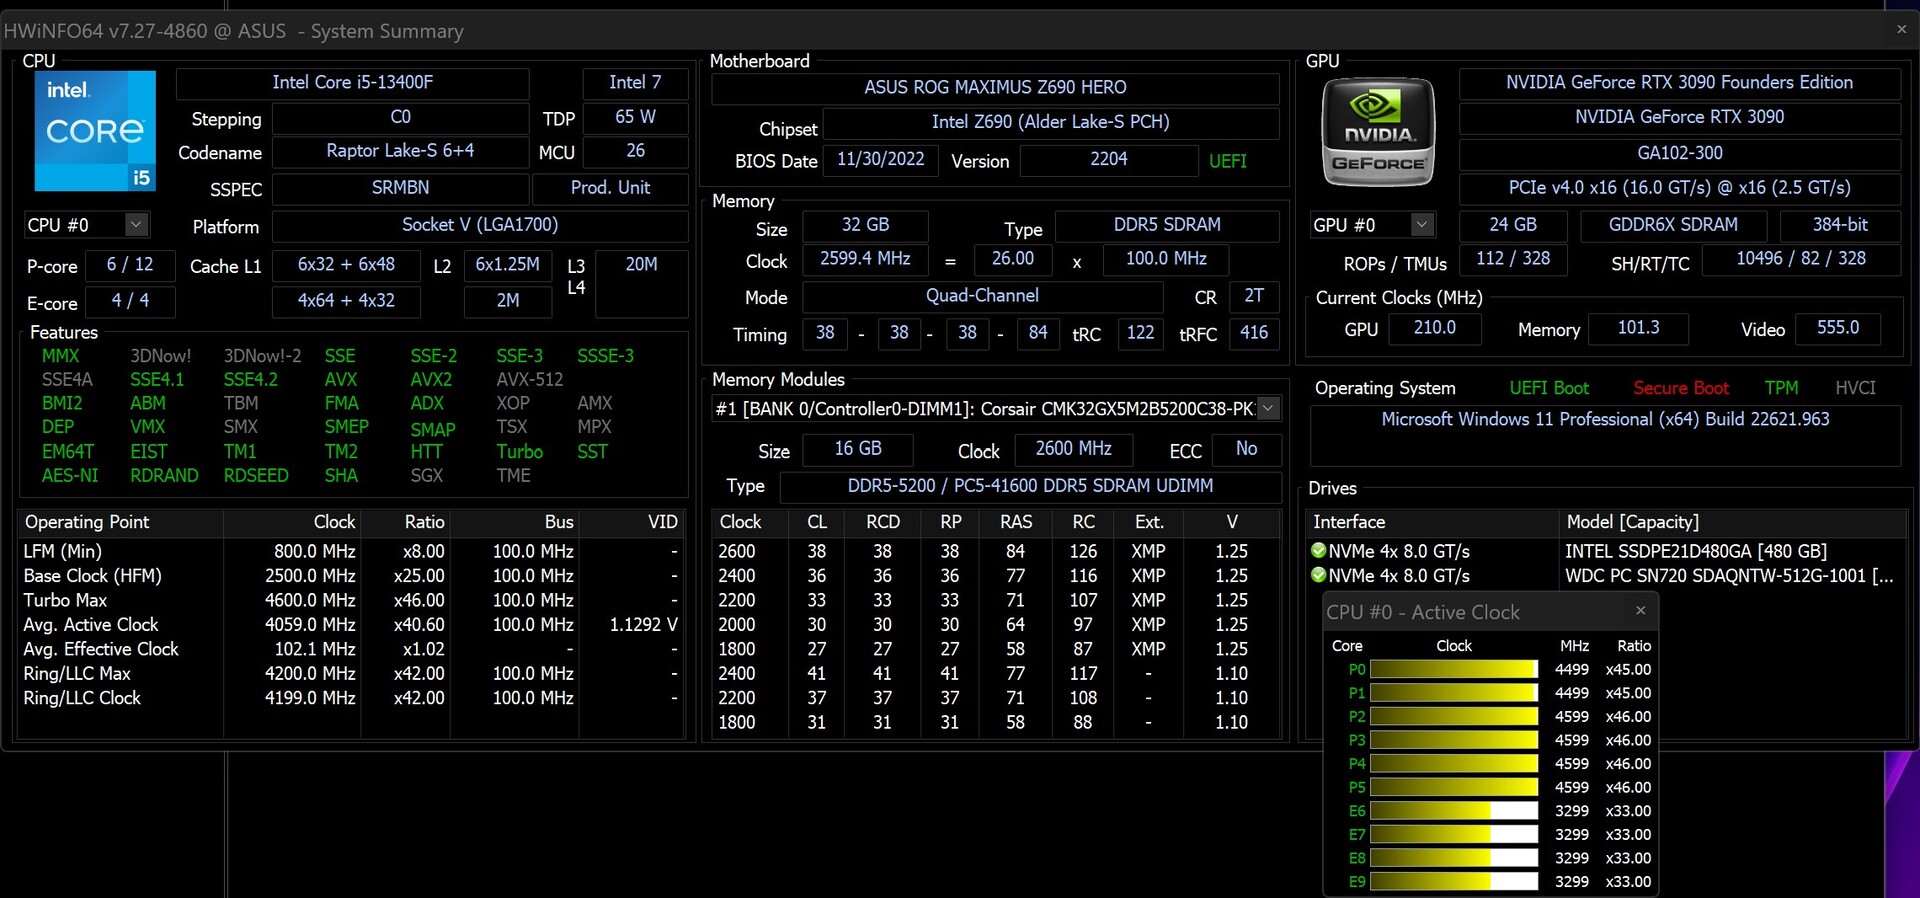
Intel Alder-Lake ve Intel Raptor-Lake, altyapı olarak 1700 soketini paylaşır. Böylece, tüm yeni işlemciler eski 600 yonga seti üzerinde de çalıştırılabilir. Bununla birlikte, en yeni işlemcilerin tanınması ve uygun şekilde desteklenmesi için önceden bir BIOS güncellemesi yapılmalıdır. Alder-Lake ve Raptor-Lake'ten bahsetmişken: Intel Core i5-13400F, isteğe bağlı olarak B0 veya C0 adımında bulunabilir. B0 adımı, Raptor-Lake DIE'yi ifade ederken, Alder-Lake DIE, C0 adımında ısı yayıcının altındadır.
Aşağıdaki tabloda sizler için yeni Raptor Lake S ailesinin en önemli temsilcilerini derledik. Intel Core i5-13400F hakkında daha fazla ayrıntıyı burada bulabilirsiniz.
Intel's Core processors in comparison
| Model | Cores / Çekirdekler/İş Parçacığı P-Çekirdeği Saati/ Turbo E-Çekirdeği Saati/ Turbo |
Önbellek L2 + L3 | Grafik | PBP | MTB | Lansman Fiyatı |
| Core i9-13900K | 24 (8P + 16E) /32 | 3.0 GHz / 5.8 GHz | 2.2 GHz / 4.3 GHz | 32 + 36 MB | UHD 770 | 125 Watt |
| Core i9-13900KF | 16 (8P + 16E) /32 | 3.0 GHz / 5.8 GHz | 2.2 GHz / 4.3 GHz | 32 + 36 MB | - | 125 Watt |
| Core i9-12900K | 16 (8P + 8E) /24 | 3.2 GHz / 5.1 GHz | 2.4 GHz / 3.9 GHz | 14 + 30 MB | UHD 770 | 125 Watt |
| Core i9-12900KF | 16 (8P + 8E) /24 | 3.2 GHz / 5.1 GHz | 2.4 GHz / 3.9 GHz | 14 + 30 MB | - | 125 Watt |
| Core i7-13700K | 16 (8P + 8E) /24 | 3.4 GHz / 5.4 GHz | 2.5 GHz / 4.2 GHz | 24 + 30 MB | UHD 770 | 125 Watt |
| Core i7-13700KF | 16 (8P + 8E) /24 | 3.4 GHz / 5.4 GHz | 2.5 GHz / 4.2 GHz | 24 + 30 MB | - | 125 Watt |
| Core i7-12700K | 12 (8P + 4E) /20 | 3.6 GHz / 4.9 GHz | 2.7 GHz / 3.8 GHz | 12 + 25 MB | UHD 770 | 125 Watt |
| Core i7-12700KF | 12 (8P + 4E) /20 | 3.6 GHz / 4.9 GHz | 2.7 GHz / 3.8 GHz | 12 + 25 MB | - | 125 Watt |
| Core i5-13600K | 14 (6P + 8E) /20 | 3.5 GHz / 5.1 GHz | 2.6 GHz / 3.9 GHz | 20 + 24 MB | UHD 770 | 125 Watt |
| Core i5-13600KF | 14 (6P + 8E) /20 | 3.5 GHz / 5.1 GHz | 2.6 GHz / 3.9 GHz | 20 + 24 MB | - | 125 Wat |
| Core i5-12600K | 10 (6P + 4E) /16 | 3.7 GHz / 4.9 GHz | 2.8 GHz / 3.6 GHz | 9.5 + 20 MB | UHD 770 | 125 Watts |
| Core i5-12600KF | 10 (6P + 4E) /16 | 3.7 GHz / 4.9 GHz | 2.8 GHz / 3.6 GHz | 9.5 + 20 MB | - | 125 Watt |
| Core i5-13400F | 10 (6P + 4E) /16 | 2.5 GHz / 4.6 GHz | 1.8 GHz / 3.3 GHz | 9.5 + 20 MB | - | 65 Watt |
| Core i5-12400F | 6 (6P + 0E) /12 | 2.5 GHz / 4.4 GHz | - | 7.5 + 18 MB | - | 65 Watt |
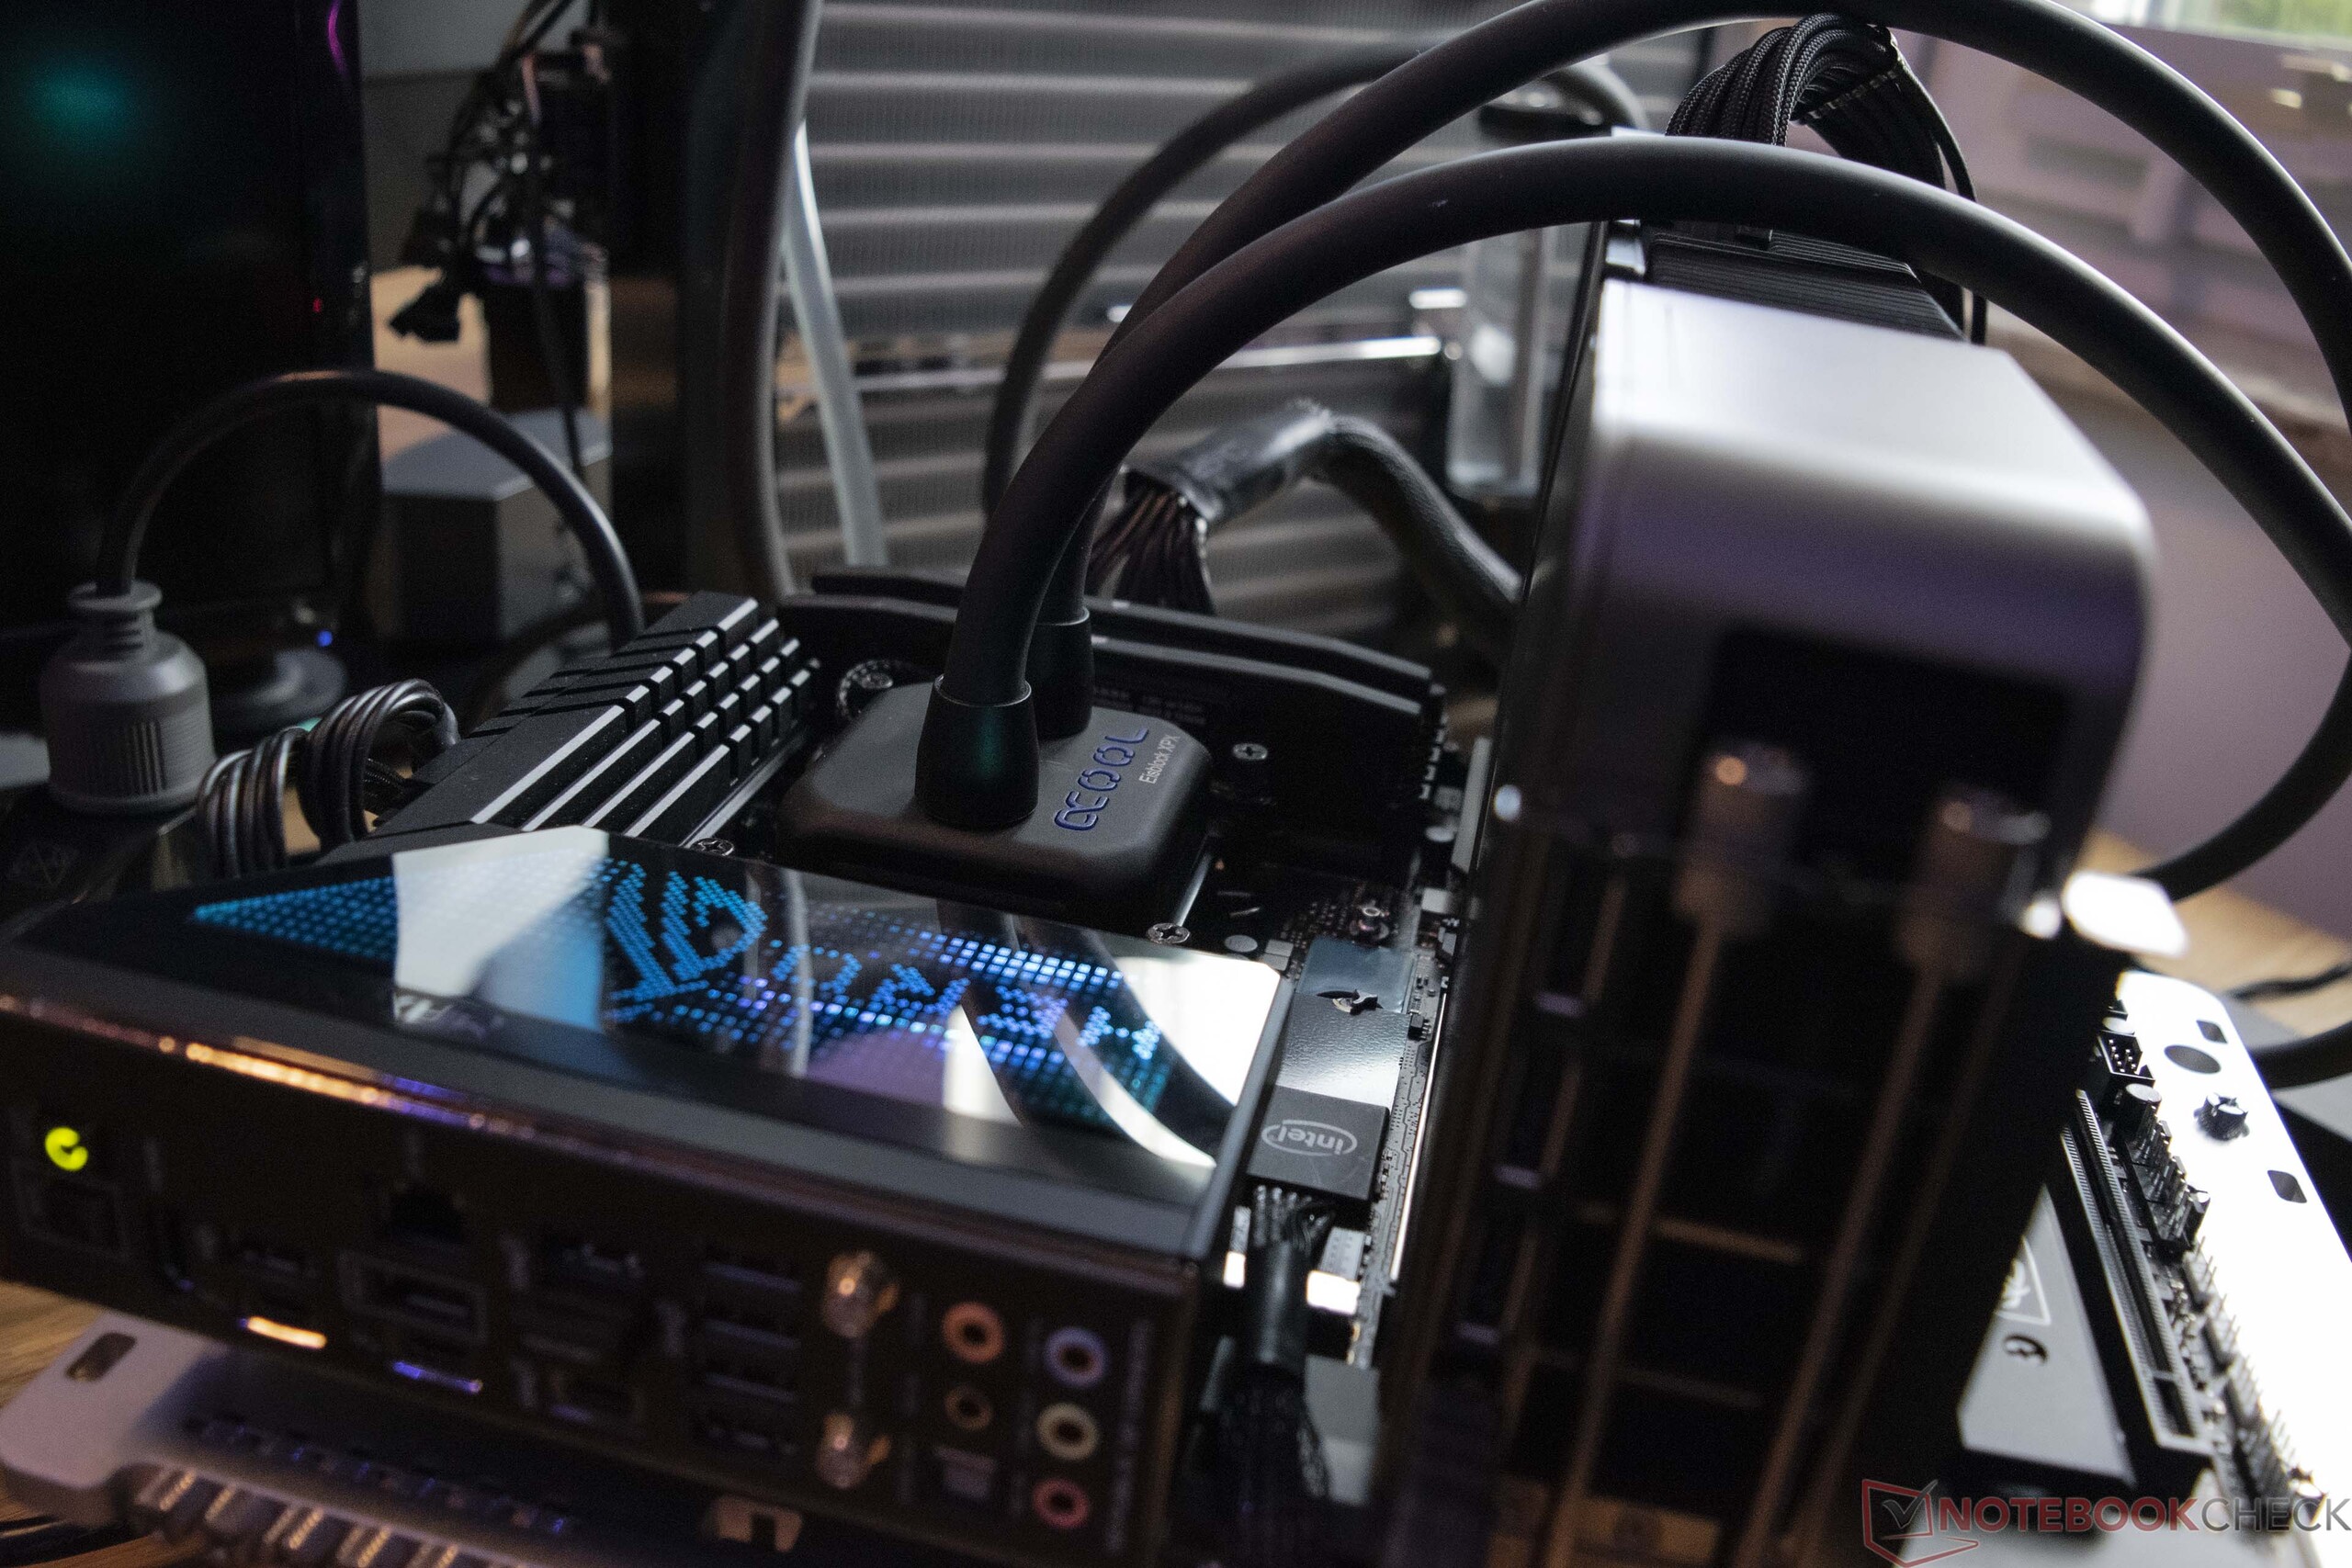
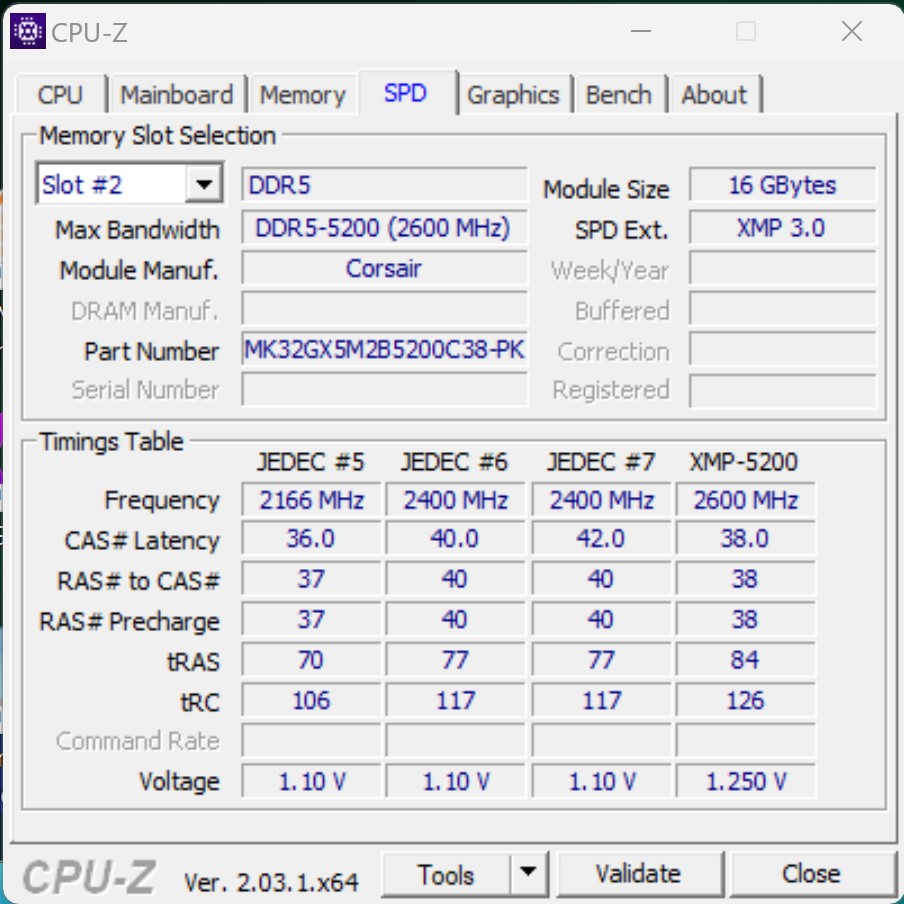
Test sistemimiz hakkında bilgiler
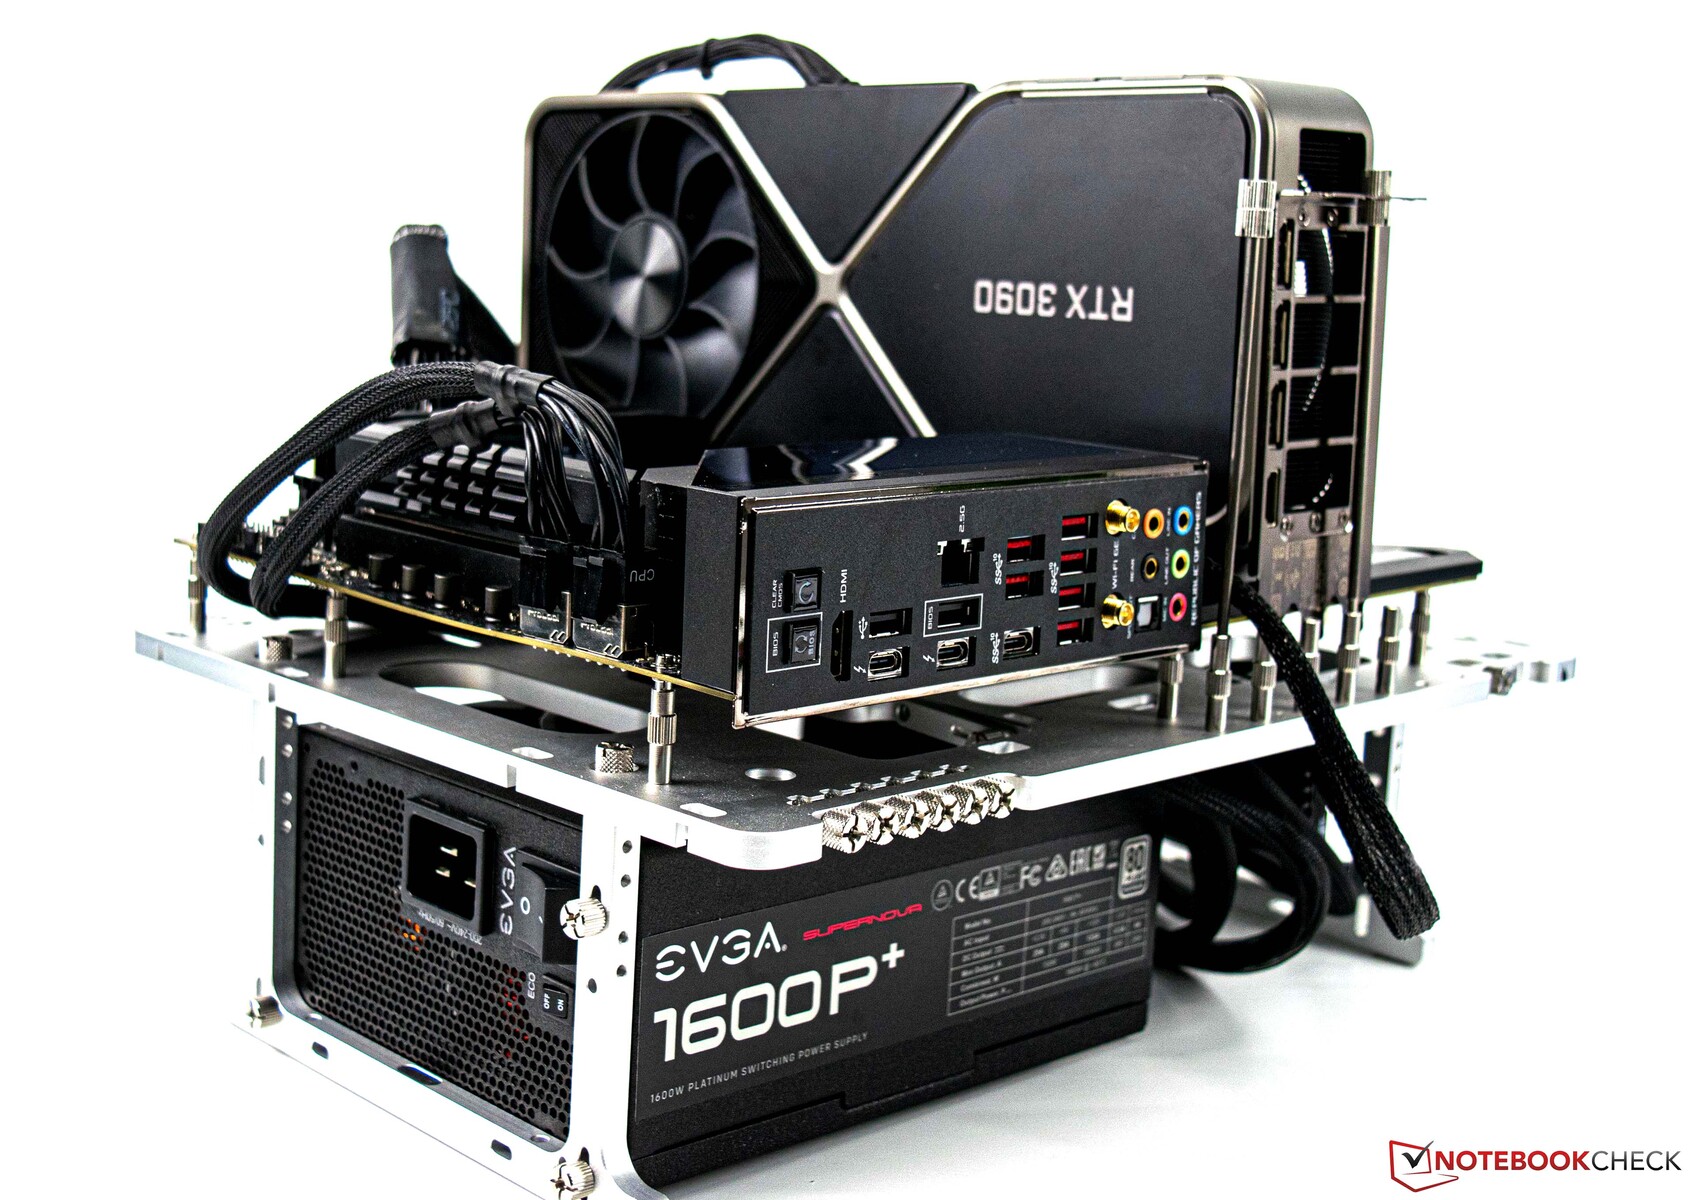
- Streacom BC1 V2 Açık Test Ünitesi
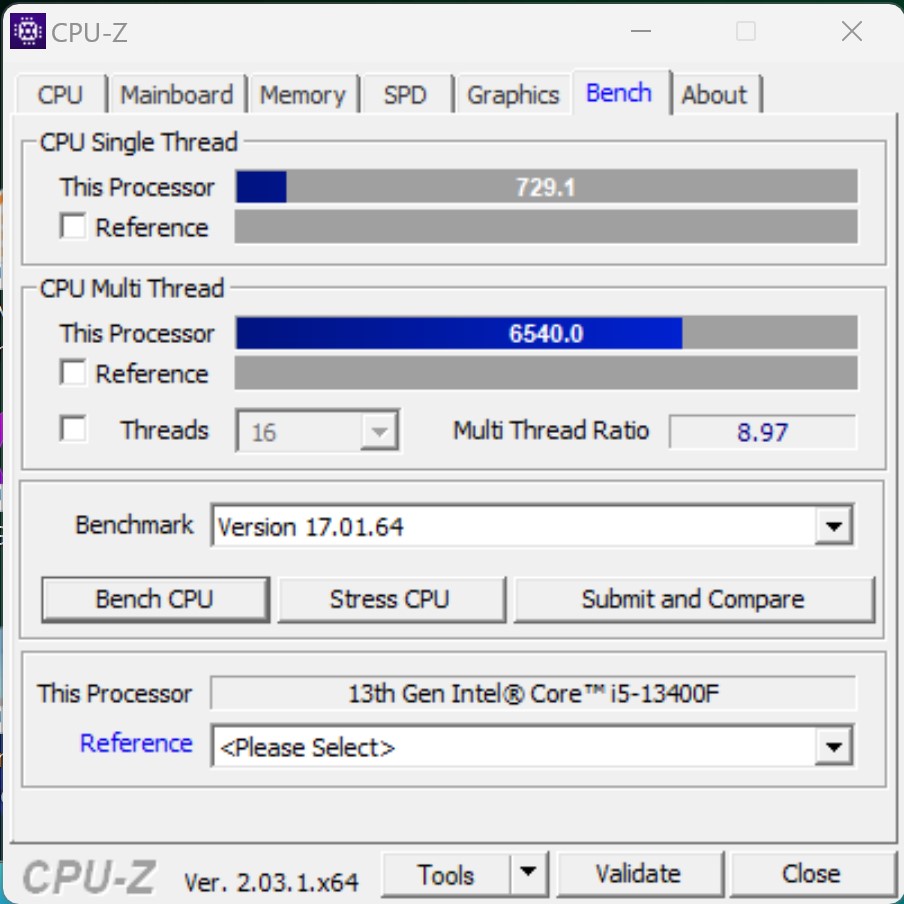
- Intel Core i5-13400F
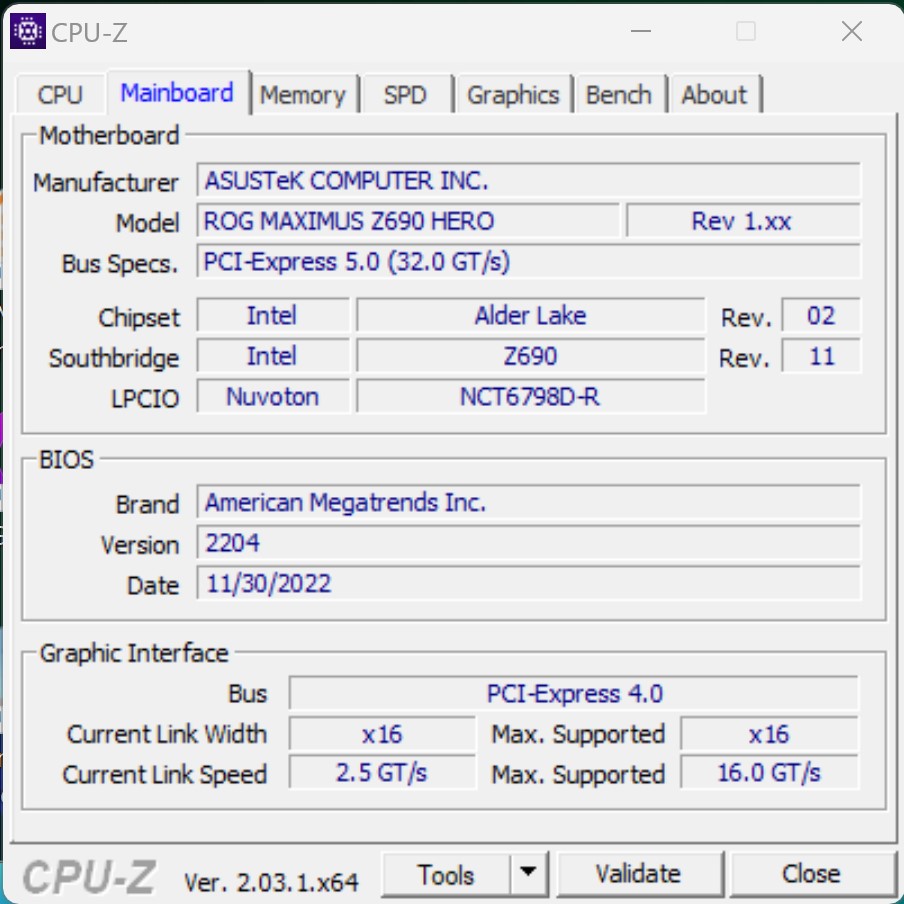
- Asus ROG Maximus Z690 Hero (BIOS v2204)
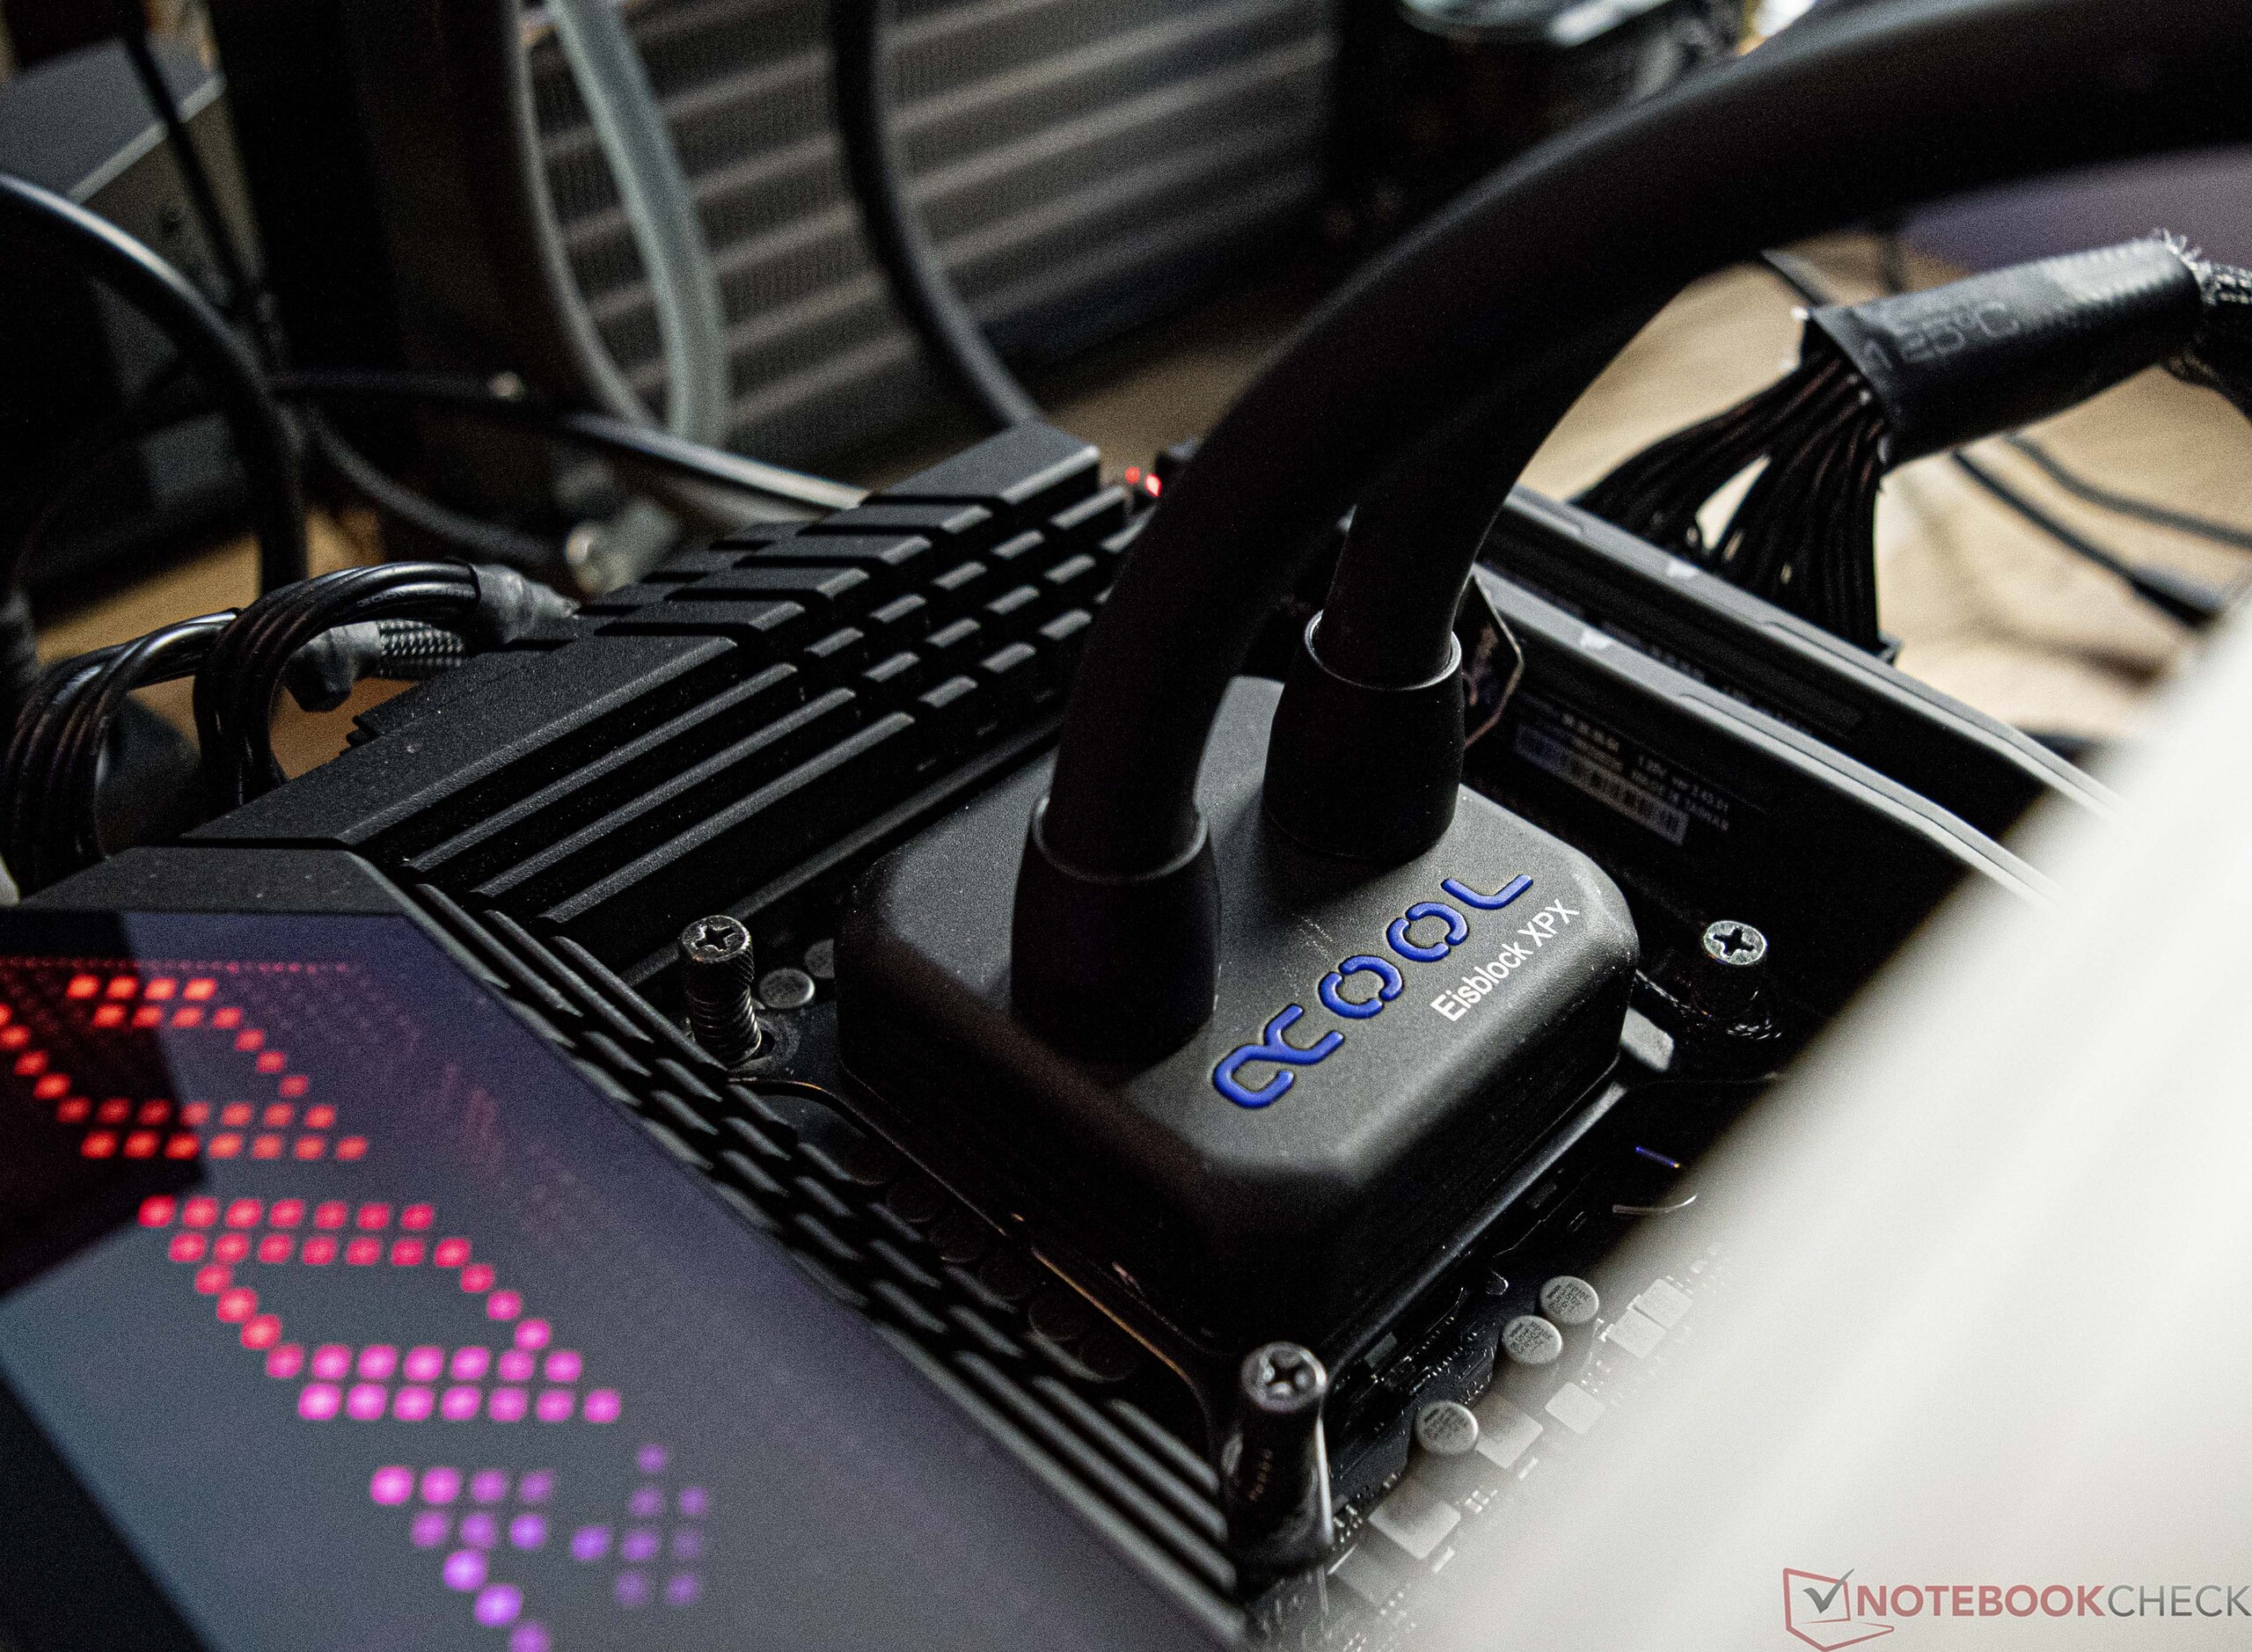
- Özel Döngülü Su Soğutma (Pompa: Alphacool Aquastream XT Ultra, Radyatör: EK MO-RA3 420 LT SİYAH)
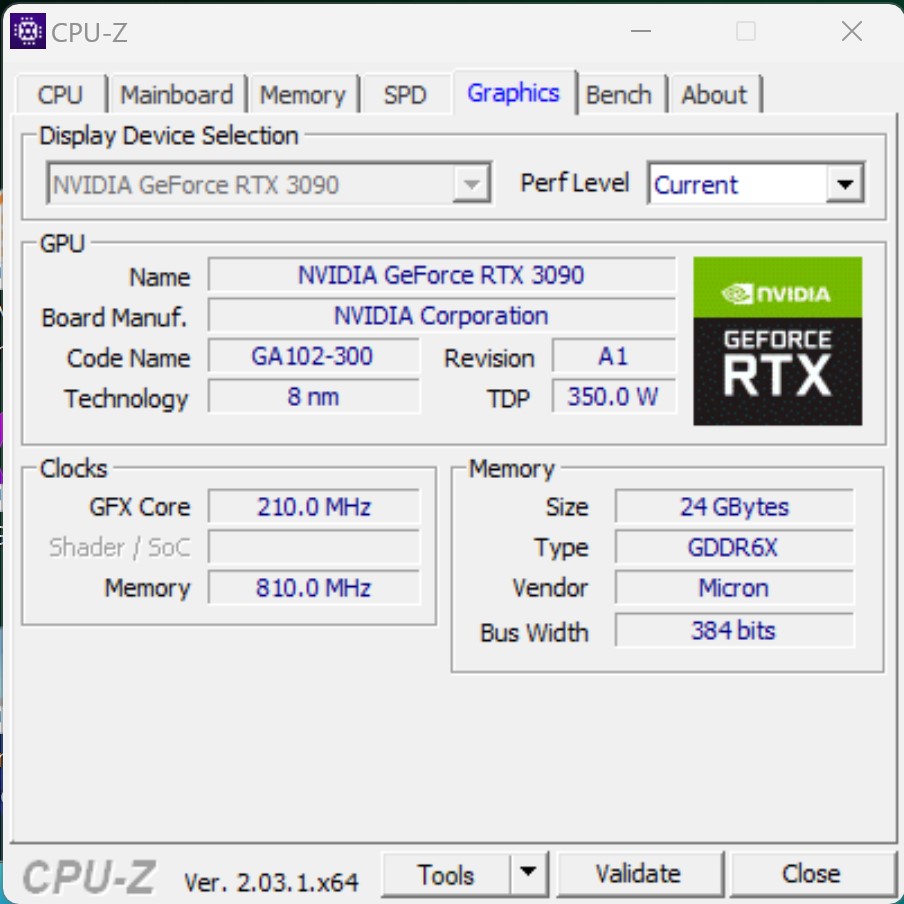
- Nvidia GeForce RTX 3090 Founders Edition (sürücü: 528.02)
- EVGA SüperNOVA P+ 1600W
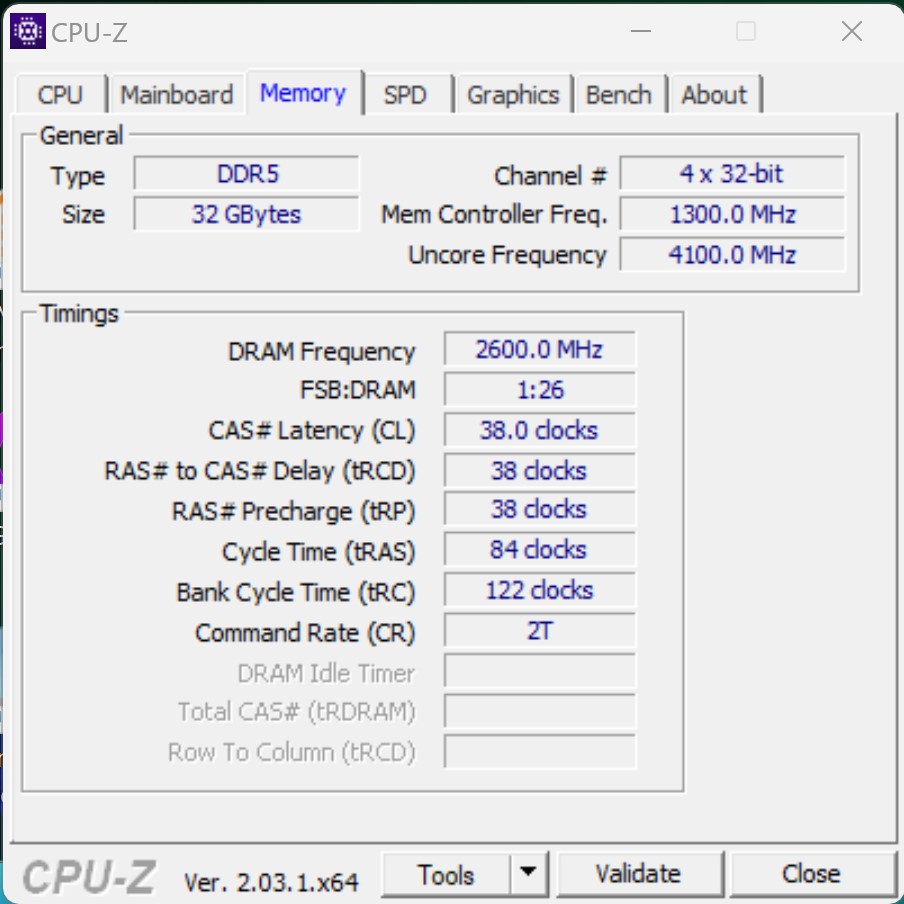
- G.Skill Ripjaws S5 (2x 16 GB - DDR5-5200 MT/sn)
- Intel Optane 905p (480 GB sistem + testler)
- Western Digital SN720 (Oyunlar)
- Microsoft Windows 11 Professional 64-bit (sürüm 22H2)


Test koşulları - Z690, BIOS güncellemesinden sonra hala kullanılabilir
Alder-Lake işlemcilerin piyasaya sürülmesinden bu yana zaten tercihimiz olan bu test için Asus ROG Maximus Z690 Hero'yu temel olarak kullanmaya devam ediyoruz. Intel Core i9-13900K ile testimiz sırasında yaşadığımız bazı sorunların ardından Intel Core i5-13400F ile herhangi bir sorun yaşamadık. Intel Core i5-13400F'yi başlatmak için en son BIOS v2204 kuruldu. Neyse ki Asus ROG Maximus Z690 Hero, BIOS'u işlemci ve bellek olmadan güncelleme imkanı sunuyor.
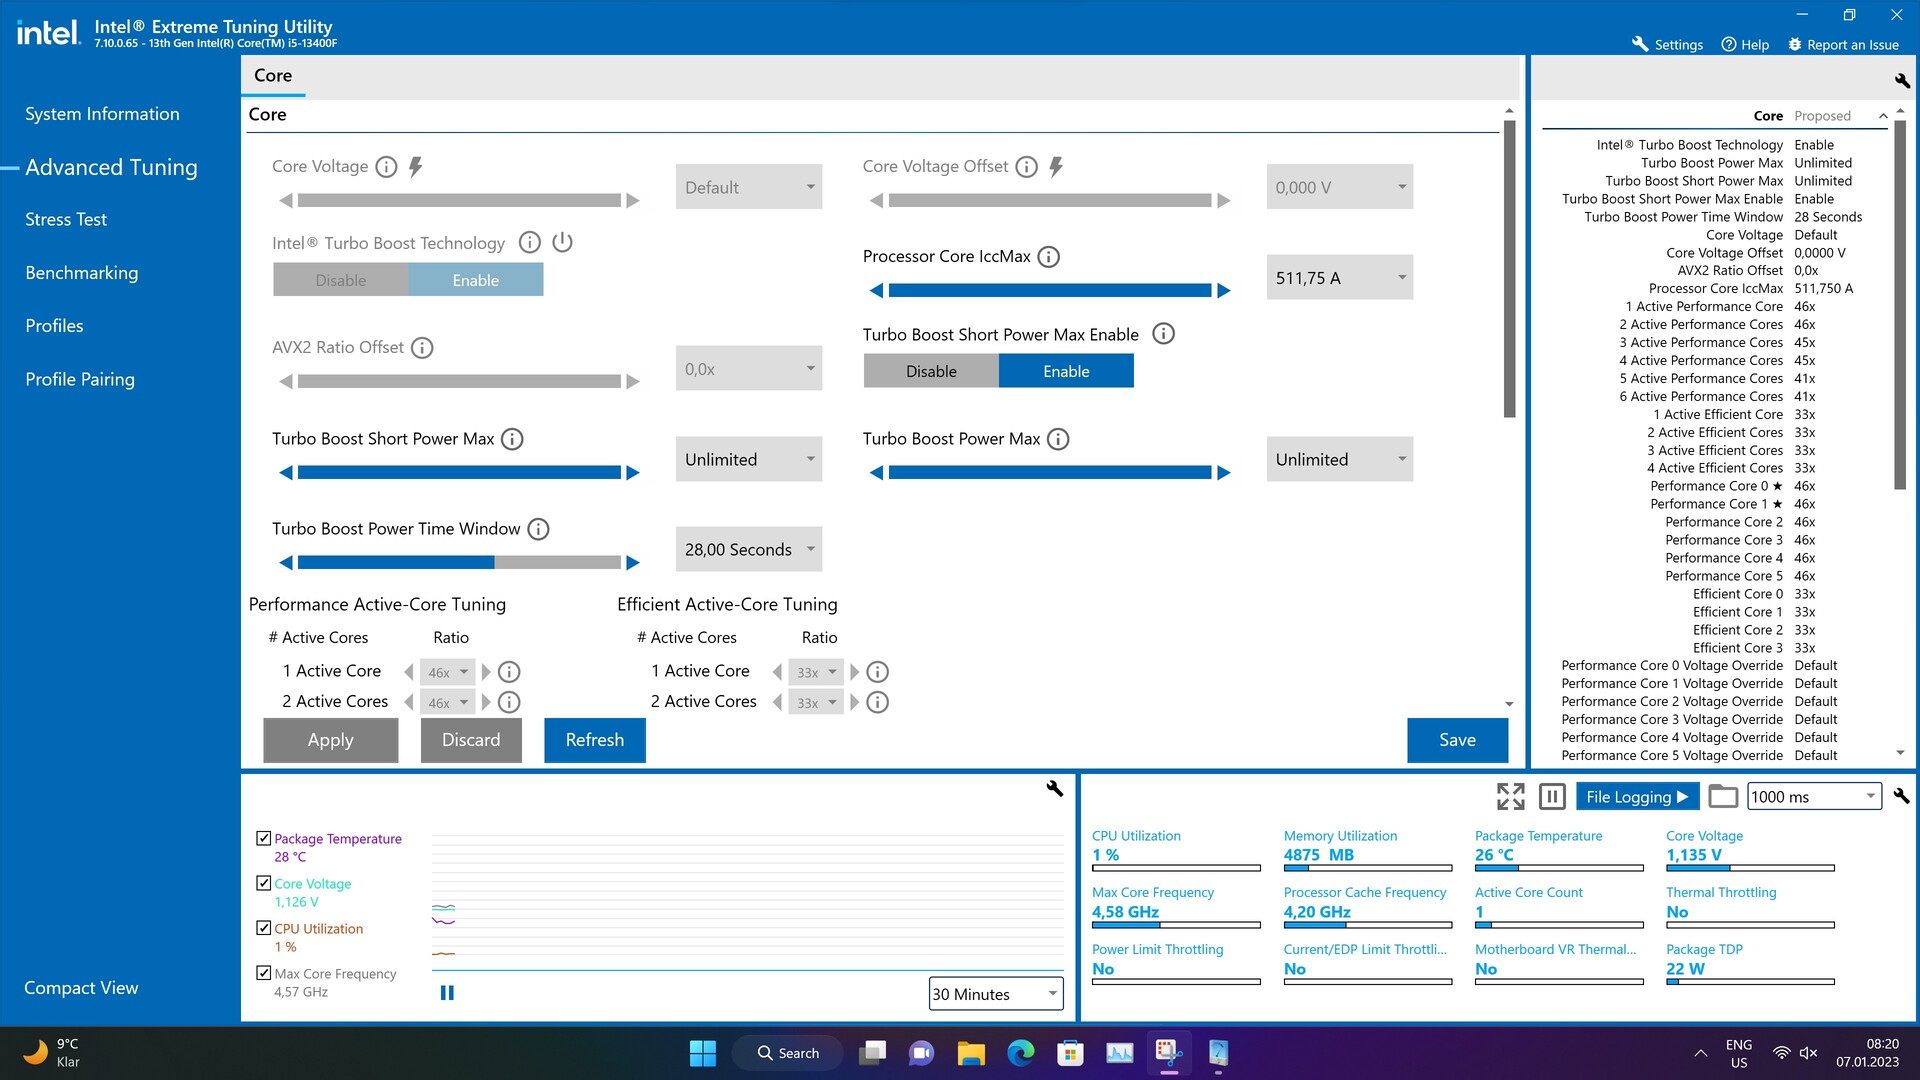
Tüm testler en son BIOS ve etkinleştirilmiş XMP1 profili ile gerçekleştirildi. Ek olarak, işlemcilerin tam performansına erişmek için tüm güç sınırı kısıtlamaları devre dışı bırakıldı.
İşlemci performans ölçümleri
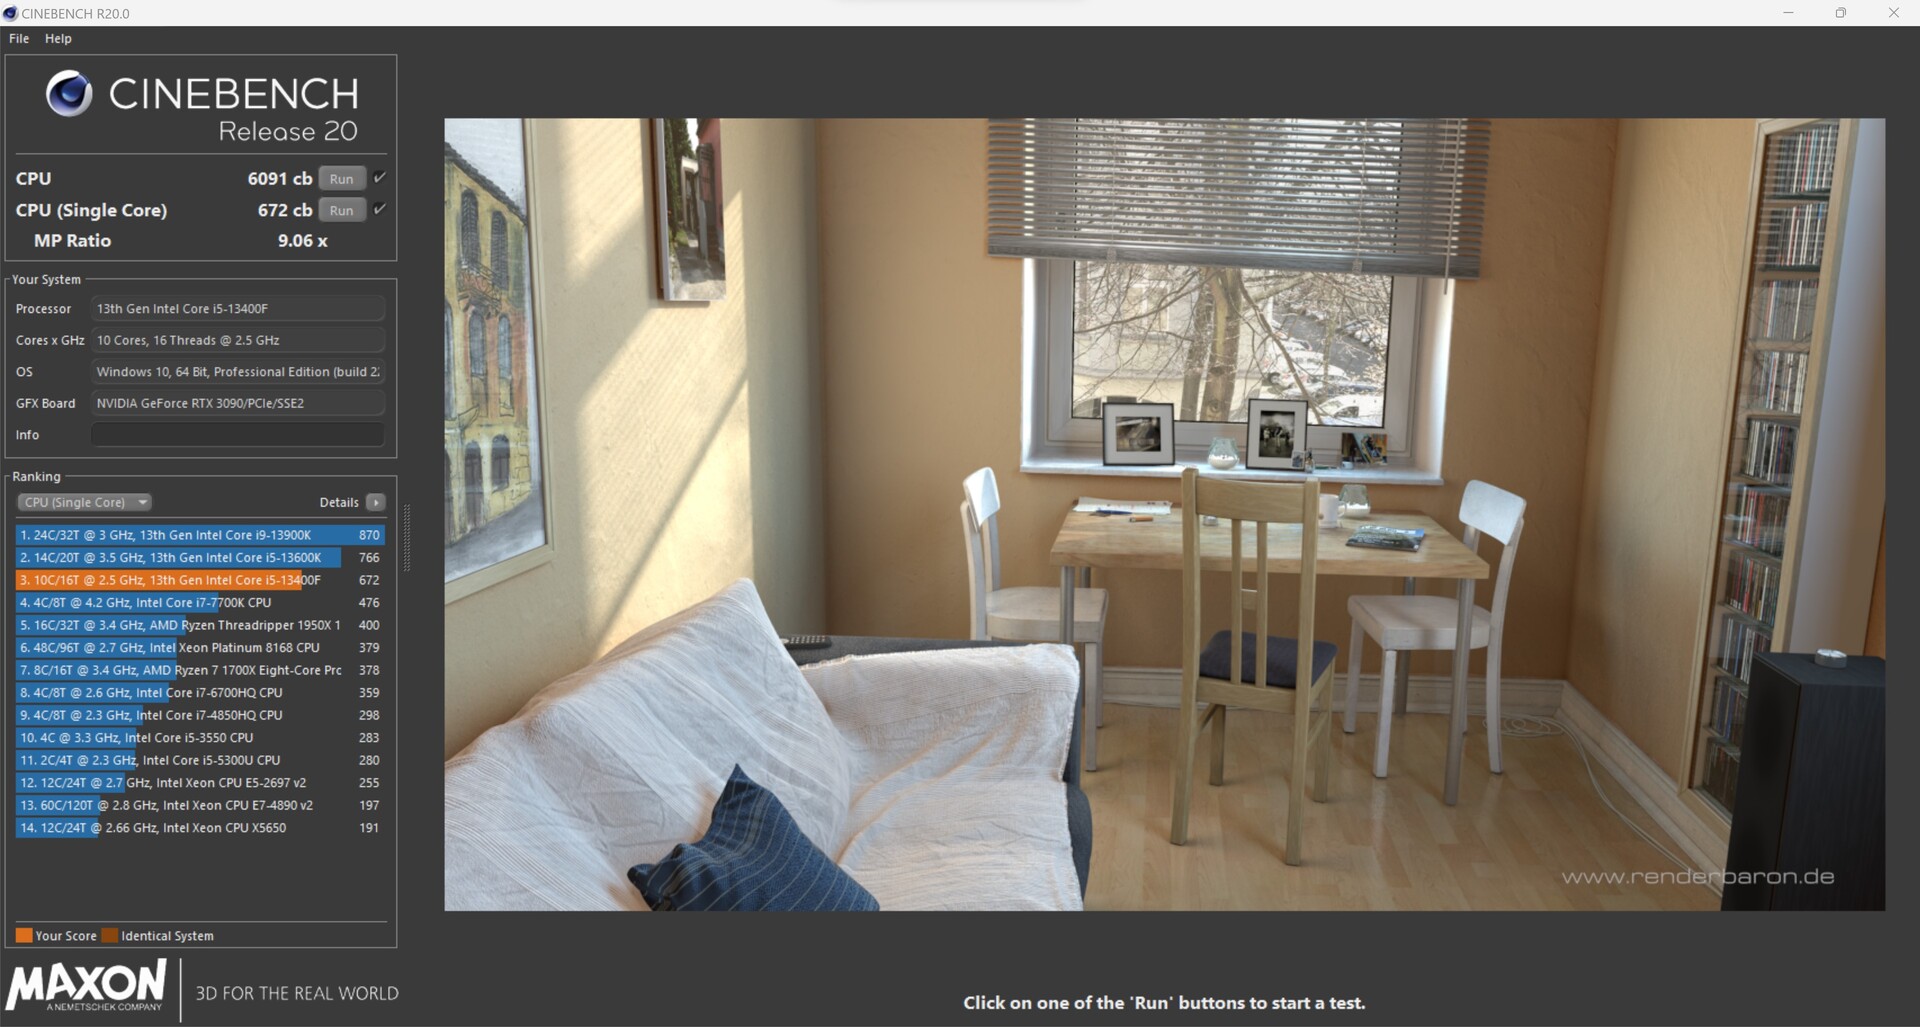
Maalesef bu noktada Intel Core i5-12400F ile doğrudan bir performans karşılaştırması yapamıyoruz. Ancak, veritabanımızda referans olarak kullanılabilecek birçok başka işlemcimiz var. Bu nedenle, Intel Core i7-12700F ile karşılaştırıldığında Intel Core i5-13400F için minimum bir avantaj görüyoruz. Ortalama olarak, Intel Core i5-13400F daha iyi bir sonuç elde edebilir, ancak eksik iş parçacıkları bireysel testlerde kesinlikle daha kötü bir puana yol açar. AMD Ryzen 7 5800X ile yaptığımız direkt karşılaştırmada neredeyse aynı tabloyu görüyoruz . Intel Core i5-13400F gibi, ikincisi 16 iş parçacığı sunar, ancak saf çok iş parçacıklı kıyaslamalarda daha iyi puan alabilir.
Daha fazla performansa ihtiyacınız varsa Intel Core i5-13600K tercih edebilirsiniz. Burada yaklaşık yüzde 20 daha fazla performans var. Aynı performans artışı bir AMD Ryzen 7 7700X ile de elde edilebilir.
İşlemciler hakkında daha fazla kıyaslama burada bulunabilir.
| Performance rating - Percent | |
| Intel Core i9-13900K | |
| Intel Core i5-13600K | |
| AMD Ryzen 7 7700X | |
| Intel Core i5-12600K | |
| AMD Ryzen 7 5800X | |
| Intel Core i7-12700F | |
| Intel Core i5-13400F | |
| AMD Ryzen 5 5600X | |
| Intel Core i5-11400F | |
| Cinebench R15 | |
| CPU Single 64Bit | |
| Intel Core i9-13900K | |
| AMD Ryzen 7 7700X | |
| Intel Core i5-13600K | |
| Intel Core i5-12600K | |
| Intel Core i7-12700F | |
| AMD Ryzen 7 5800X | |
| AMD Ryzen 5 5600X | |
| Intel Core i5-13400F | |
| Intel Core i5-11400F | |
| CPU Multi 64Bit | |
| Intel Core i9-13900K | |
| Intel Core i5-13600K | |
| AMD Ryzen 7 7700X | |
| AMD Ryzen 7 5800X | |
| Intel Core i7-12700F | |
| Intel Core i5-12600K | |
| Intel Core i5-13400F | |
| AMD Ryzen 5 5600X | |
| Intel Core i5-11400F | |
| Cinebench R20 | |
| CPU (Single Core) | |
| Intel Core i9-13900K | |
| Intel Core i5-13600K | |
| AMD Ryzen 7 7700X | |
| Intel Core i5-12600K | |
| Intel Core i7-12700F | |
| Intel Core i5-13400F | |
| AMD Ryzen 7 5800X | |
| AMD Ryzen 5 5600X | |
| Intel Core i5-11400F | |
| CPU (Multi Core) | |
| Intel Core i9-13900K | |
| Intel Core i5-13600K | |
| AMD Ryzen 7 7700X | |
| Intel Core i5-12600K | |
| Intel Core i5-13400F | |
| AMD Ryzen 7 5800X | |
| Intel Core i7-12700F | |
| AMD Ryzen 5 5600X | |
| Intel Core i5-11400F | |
| Cinebench R23 | |
| Single Core | |
| Intel Core i9-13900K | |
| Intel Core i5-13600K | |
| AMD Ryzen 7 7700X | |
| Intel Core i5-12600K | |
| Intel Core i7-12700F | |
| Intel Core i5-13400F | |
| AMD Ryzen 7 5800X | |
| AMD Ryzen 5 5600X | |
| Intel Core i5-11400F | |
| Multi Core | |
| Intel Core i9-13900K | |
| Intel Core i5-13600K | |
| AMD Ryzen 7 7700X | |
| Intel Core i5-12600K | |
| Intel Core i5-13400F | |
| Intel Core i7-12700F | |
| AMD Ryzen 7 5800X | |
| AMD Ryzen 5 5600X | |
| Intel Core i5-11400F | |
| Cinebench R11.5 | |
| CPU Single 64Bit | |
| Intel Core i9-13900K | |
| AMD Ryzen 7 7700X | |
| Intel Core i5-13600K | |
| Intel Core i5-12600K | |
| Intel Core i7-12700F | |
| AMD Ryzen 7 5800X | |
| Intel Core i5-13400F | |
| AMD Ryzen 5 5600X | |
| Intel Core i5-11400F | |
| CPU Multi 64Bit | |
| Intel Core i9-13900K | |
| Intel Core i5-13600K | |
| AMD Ryzen 7 7700X | |
| Intel Core i7-12700F | |
| Intel Core i5-12600K | |
| AMD Ryzen 7 5800X | |
| Intel Core i5-13400F | |
| AMD Ryzen 5 5600X | |
| Intel Core i5-11400F | |
| Blender - v2.79 BMW27 CPU | |
| Intel Core i5-11400F | |
| AMD Ryzen 5 5600X | |
| Intel Core i7-12700F | |
| Intel Core i5-13400F | |
| AMD Ryzen 7 5800X | |
| Intel Core i5-12600K | |
| AMD Ryzen 7 7700X | |
| Intel Core i5-13600K | |
| Intel Core i9-13900K | |
| wPrime 2.10 | |
| 32m | |
| Intel Core i5-12600K | |
| Intel Core i5-11400F | |
| AMD Ryzen 5 5600X | |
| Intel Core i5-13400F | |
| AMD Ryzen 7 5800X | |
| Intel Core i7-12700F | |
| Intel Core i5-13600K | |
| AMD Ryzen 7 7700X | |
| Intel Core i9-13900K | |
| 1024m | |
| Intel Core i5-13400F | |
| Intel Core i5-12600K | |
| Intel Core i5-13600K | |
| Intel Core i7-12700F | |
| Intel Core i5-11400F | |
| AMD Ryzen 5 5600X | |
| AMD Ryzen 7 5800X | |
| Intel Core i9-13900K | |
| AMD Ryzen 7 7700X | |
| X264 HD Benchmark 4.0 | |
| Pass 1 | |
| Intel Core i9-13900K | |
| Intel Core i5-13600K | |
| AMD Ryzen 7 7700X | |
| AMD Ryzen 7 5800X | |
| Intel Core i5-12600K | |
| AMD Ryzen 5 5600X | |
| Intel Core i5-13400F | |
| Intel Core i7-12700F | |
| Intel Core i5-11400F | |
| Pass 2 | |
| Intel Core i9-13900K | |
| Intel Core i5-13600K | |
| AMD Ryzen 7 7700X | |
| AMD Ryzen 7 5800X | |
| Intel Core i5-12600K | |
| Intel Core i5-13400F | |
| Intel Core i7-12700F | |
| AMD Ryzen 5 5600X | |
| Intel Core i5-11400F | |
| WinRAR - Result | |
| AMD Ryzen 7 5800X | |
| AMD Ryzen 7 7700X | |
| Intel Core i9-13900K | |
| AMD Ryzen 5 5600X | |
| Intel Core i5-13600K | |
| Intel Core i7-12700F | |
| Intel Core i5-13400F | |
| Intel Core i5-11400F | |
| Intel Core i5-12600K | |
| TrueCrypt | |
| AES Mean 100MB | |
| Intel Core i9-13900K | |
| Intel Core i5-13600K | |
| AMD Ryzen 7 7700X | |
| AMD Ryzen 7 5800X | |
| Intel Core i5-12600K | |
| Intel Core i5-13400F | |
| AMD Ryzen 5 5600X | |
| Intel Core i5-11400F | |
| Intel Core i7-12700F | |
| Twofish Mean 100MB | |
| Intel Core i9-13900K | |
| Intel Core i5-13600K | |
| Intel Core i7-12700F | |
| AMD Ryzen 7 7700X | |
| Intel Core i5-12600K | |
| AMD Ryzen 7 5800X | |
| Intel Core i5-13400F | |
| AMD Ryzen 5 5600X | |
| Intel Core i5-11400F | |
| Serpent Mean 100MB | |
| Intel Core i9-13900K | |
| Intel Core i5-13600K | |
| Intel Core i7-12700F | |
| AMD Ryzen 7 7700X | |
| AMD Ryzen 7 5800X | |
| Intel Core i5-12600K | |
| Intel Core i5-13400F | |
| AMD Ryzen 5 5600X | |
| Intel Core i5-11400F | |
| Geekbench 5.5 | |
| Multi-Core | |
| Intel Core i9-13900K | |
| Intel Core i5-13600K | |
| AMD Ryzen 7 7700X | |
| Intel Core i5-12600K | |
| Intel Core i5-13400F | |
| AMD Ryzen 7 5800X | |
| Intel Core i7-12700F | |
| AMD Ryzen 5 5600X | |
| Intel Core i5-11400F | |
| Single-Core | |
| Intel Core i9-13900K | |
| AMD Ryzen 7 7700X | |
| Intel Core i5-13600K | |
| Intel Core i5-12600K | |
| Intel Core i5-13400F | |
| AMD Ryzen 7 5800X | |
| AMD Ryzen 5 5600X | |
| Intel Core i7-12700F | |
| Intel Core i5-11400F | |
| Geekbench 5.0 | |
| 5.0 Multi-Core | |
| Intel Core i9-13900K | |
| Intel Core i5-13600K | |
| AMD Ryzen 7 7700X | |
| Intel Core i5-12600K | |
| Intel Core i5-13400F | |
| AMD Ryzen 7 5800X | |
| Intel Core i7-12700F | |
| AMD Ryzen 5 5600X | |
| Intel Core i5-11400F | |
| 5.0 Single-Core | |
| Intel Core i9-13900K | |
| AMD Ryzen 7 7700X | |
| Intel Core i5-13600K | |
| Intel Core i5-12600K | |
| Intel Core i5-13400F | |
| AMD Ryzen 7 5800X | |
| AMD Ryzen 5 5600X | |
| Intel Core i7-12700F | |
| Intel Core i5-11400F | |
| Geekbench 4.4 | |
| 64 Bit Single-Core Score | |
| Intel Core i9-13900K | |
| AMD Ryzen 7 7700X | |
| Intel Core i5-13600K | |
| Intel Core i5-12600K | |
| Intel Core i5-13400F | |
| AMD Ryzen 7 5800X | |
| AMD Ryzen 5 5600X | |
| Intel Core i5-11400F | |
| Intel Core i7-12700F | |
| 64 Bit Multi-Core Score | |
| Intel Core i9-13900K | |
| Intel Core i5-13600K | |
| AMD Ryzen 7 7700X | |
| Intel Core i5-12600K | |
| AMD Ryzen 7 5800X | |
| Intel Core i5-13400F | |
| Intel Core i7-12700F | |
| AMD Ryzen 5 5600X | |
| Intel Core i5-11400F | |
| 3DMark 11 - 1280x720 Performance Physics | |
| Intel Core i9-13900K | |
| AMD Ryzen 7 7700X | |
| Intel Core i5-13600K | |
| Intel Core i5-12600K | |
| Intel Core i5-13400F | |
| Intel Core i7-12700F | |
| AMD Ryzen 7 5800X | |
| AMD Ryzen 5 5600X | |
| Intel Core i5-11400F | |
| 7-Zip 18.03 | |
| 7z b 4 | |
| Intel Core i9-13900K | |
| Intel Core i5-13600K | |
| AMD Ryzen 7 7700X | |
| AMD Ryzen 7 5800X | |
| Intel Core i5-12600K | |
| Intel Core i7-12700F | |
| Intel Core i5-13400F | |
| AMD Ryzen 5 5600X | |
| Intel Core i5-11400F | |
| 7z b 4 -mmt1 | |
| AMD Ryzen 7 7700X | |
| Intel Core i9-13900K | |
| AMD Ryzen 7 5800X | |
| AMD Ryzen 5 5600X | |
| Intel Core i5-13600K | |
| Intel Core i7-12700F | |
| Intel Core i5-12600K | |
| Intel Core i5-13400F | |
| Intel Core i5-11400F | |
| HWBOT x265 Benchmark v2.2 - 4k Preset | |
| Intel Core i9-13900K | |
| Intel Core i5-12600K | |
| Intel Core i5-13600K | |
| AMD Ryzen 7 7700X | |
| AMD Ryzen 7 5800X | |
| Intel Core i5-13400F | |
| Intel Core i7-12700F | |
| AMD Ryzen 5 5600X | |
| Intel Core i5-11400F | |
| R Benchmark 2.5 - Overall mean | |
| Intel Core i5-11400F | |
| AMD Ryzen 5 5600X | |
| Intel Core i5-13400F | |
| AMD Ryzen 7 5800X | |
| Intel Core i5-12600K | |
| Intel Core i7-12700F | |
| Intel Core i5-13600K | |
| AMD Ryzen 7 7700X | |
| Intel Core i9-13900K | |
| LibreOffice - 20 Documents To PDF | |
| Intel Core i5-12600K | |
| Intel Core i7-12700F | |
| Intel Core i5-11400F | |
| AMD Ryzen 5 5600X | |
| AMD Ryzen 7 5800X | |
| Intel Core i5-13400F | |
| Intel Core i9-13900K | |
| Intel Core i5-13600K | |
| AMD Ryzen 7 7700X | |
| WebXPRT 3 - Overall | |
| Intel Core i9-13900K | |
| AMD Ryzen 7 7700X | |
| Intel Core i5-13600K | |
| AMD Ryzen 7 5800X | |
| Intel Core i5-13400F | |
| Intel Core i5-12600K | |
| AMD Ryzen 5 5600X | |
| Intel Core i7-12700F | |
| Intel Core i5-11400F | |
| Mozilla Kraken 1.1 - Total | |
| Intel Core i5-11400F | |
| AMD Ryzen 5 5600X | |
| AMD Ryzen 7 5800X | |
| Intel Core i5-13400F | |
| Intel Core i7-12700F | |
| Intel Core i5-12600K | |
| Intel Core i5-13600K | |
| AMD Ryzen 7 7700X | |
| Intel Core i9-13900K | |
| 3DMark | |
| 1920x1080 Fire Strike Physics | |
| Intel Core i9-13900K | |
| Intel Core i5-13600K | |
| AMD Ryzen 7 7700X | |
| Intel Core i7-12700F | |
| AMD Ryzen 7 5800X | |
| Intel Core i5-12600K | |
| Intel Core i5-13400F | |
| AMD Ryzen 5 5600X | |
| Intel Core i5-11400F | |
| 2560x1440 Time Spy CPU | |
| Intel Core i9-13900K | |
| Intel Core i5-13600K | |
| AMD Ryzen 7 7700X | |
| Intel Core i5-12600K | |
| Intel Core i5-13400F | |
| AMD Ryzen 7 5800X | |
| Intel Core i7-12700F | |
| AMD Ryzen 5 5600X | |
| Intel Core i5-11400F | |
* ... daha küçük daha iyidir
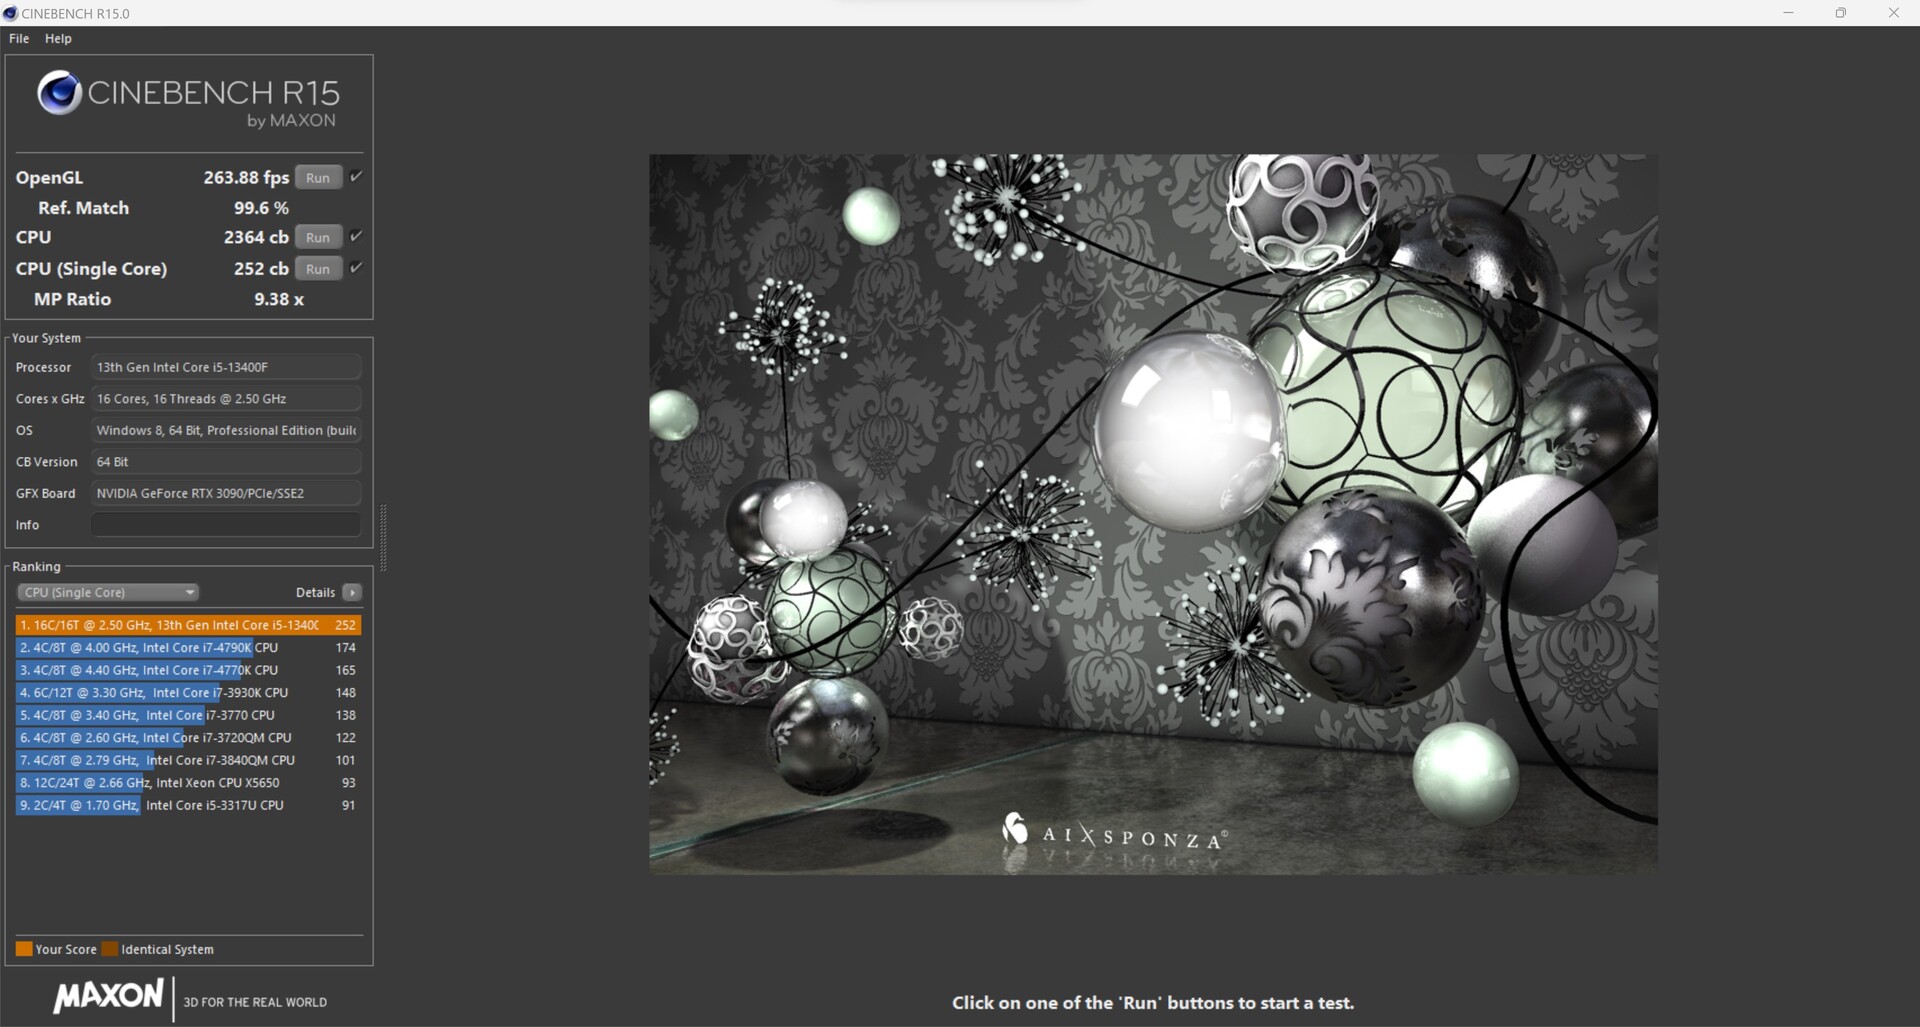
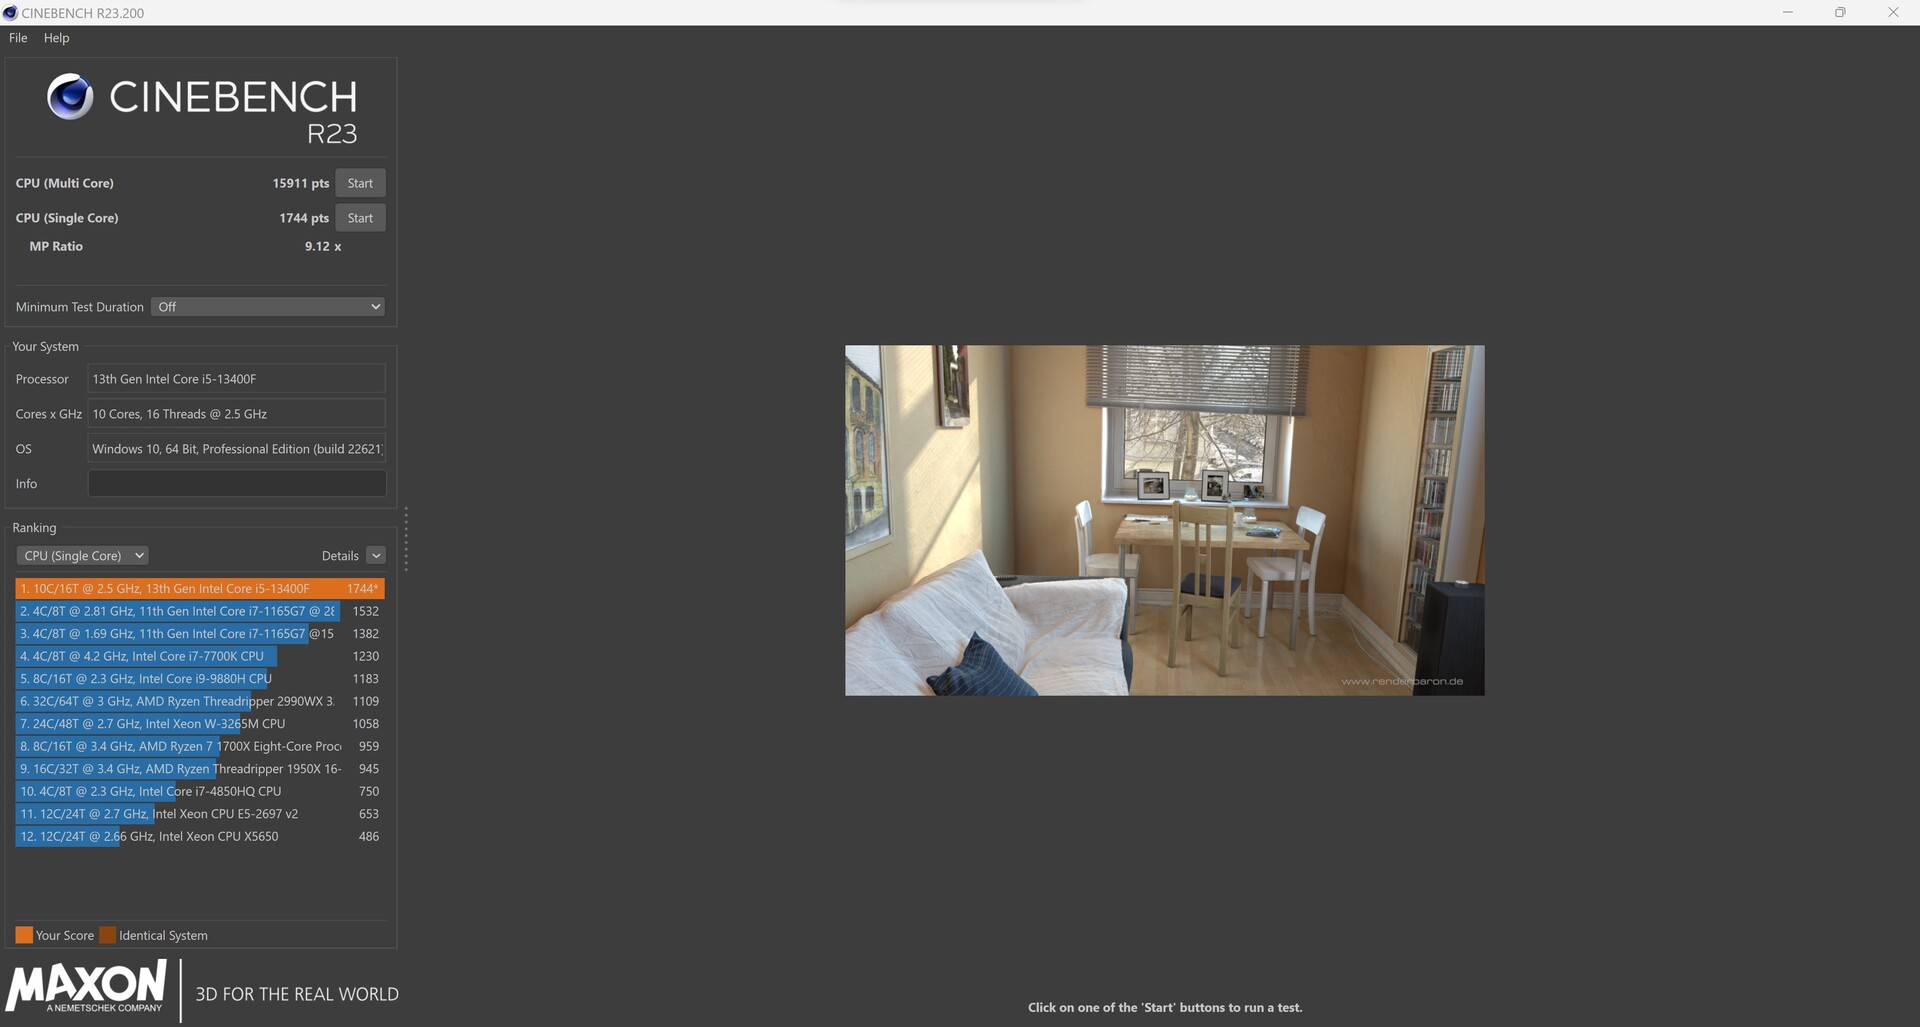
Intel Core i5-13400F Cinebench R15 çoklu döngü testinde
açısından herhangi bir sorun yaşanmıyor. Intel'in Core i5-13400F'ye izin verdiği maksimum 148 watt ile soğutma sistemi özellikle zorlanmaz. Intel Core i5-13400F, Intel Core i5-12600K'nın tüm 50 çalıştırmasında ortalama 2.338 puanla (2.545 puan) Intel Core i5-12600K'dan yalnızca marjinal olarak daha yavaştır.
Sentetik performans ölçümleri ve uygulama performansı
Intel Core i5-13400F, uygulama kıyaslamalarında da iyi puanlar alabilir ve performans açısından Intel Core i5-12600K'ye eşittir. Burada listelenen Raptor-Lake işlemcilerin K-modelleri ile karşılaştırıldığında, inceleme örneğimiz yine de açık bir eksikliği kabul etmelidir. Yine de Intel Core i5-13400F, günlük kullanımda çoğu uygulama için tamamen yeterli olan sağlam bir performans sunar.
| PCMark 10 - Score | |
| Intel Core i9-13900K | |
| AMD Ryzen 5 7600X | |
| Intel Core i5-13600K | |
| AMD Ryzen 9 5950X | |
| Intel Core i9-12900K | |
| Intel Core i5-13400F | |
| AMD Ryzen 5 5600X | |
| Intel Core i5-12600K | |
| Intel Core i7-12700F | |
| Intel Core i5-11400F | |
| AMD Ryzen 9 5900X | |
| 3DMark | |
| 1920x1080 Fire Strike Physics | |
| Intel Core i9-13900K | |
| AMD Ryzen 9 5950X | |
| Intel Core i9-12900K | |
| Intel Core i5-13600K | |
| AMD Ryzen 9 5900X | |
| Intel Core i7-12700F | |
| AMD Ryzen 5 7600X | |
| Intel Core i5-12600K | |
| Intel Core i5-13400F | |
| AMD Ryzen 5 5600X | |
| Intel Core i5-11400F | |
| 2560x1440 Time Spy CPU | |
| Intel Core i9-13900K | |
| Intel Core i9-12900K | |
| Intel Core i5-13600K | |
| Intel Core i5-12600K | |
| AMD Ryzen 9 5950X | |
| Intel Core i5-13400F | |
| AMD Ryzen 9 5900X | |
| Intel Core i7-12700F | |
| AMD Ryzen 5 7600X | |
| AMD Ryzen 5 5600X | |
| Intel Core i5-11400F | |
| 3DMark 11 - 1280x720 Performance Physics | |
| Intel Core i9-13900K | |
| Intel Core i5-13600K | |
| Intel Core i9-12900K | |
| AMD Ryzen 5 7600X | |
| AMD Ryzen 9 5950X | |
| Intel Core i5-12600K | |
| Intel Core i5-13400F | |
| Intel Core i7-12700F | |
| Intel Core i9-12900K | |
| AMD Ryzen 9 5900X | |
| AMD Ryzen 5 5600X | |
| Intel Core i5-11400F | |
| CrossMark - Overall | |
| Intel Core i9-13900K | |
| Intel Core i5-13600K | |
| AMD Ryzen 5 7600X | |
| Intel Core i5-13400F | |
| Intel Core i7-12700F | |
| Intel Core i5-12600K | |
| AMD Ryzen 9 5900X | |
| AMD Ryzen 9 5950X | |
| AMD Ryzen 5 5600X | |
| AIDA64 / Memory Copy | |
| Intel Core i9-13900K | |
| Intel Core i5-13600K | |
| Intel Core i5-13400F | |
| Intel Core i5-12600K | |
| AMD Ryzen 9 5900X | |
| AMD Ryzen 5 7600X | |
| AMD Ryzen 9 5950X | |
| AMD Ryzen 5 5600X | |
| Sınıf ortalaması (4514 - 234662, n=2198) | |
| AIDA64 / Memory Read | |
| Intel Core i9-13900K | |
| Intel Core i5-13400F | |
| Intel Core i5-12600K | |
| Intel Core i5-13600K | |
| AMD Ryzen 9 5900X | |
| AMD Ryzen 9 5950X | |
| AMD Ryzen 5 5600X | |
| AMD Ryzen 5 7600X | |
| Sınıf ortalaması (4031 - 271066, n=2160) | |
| AIDA64 / Memory Write | |
| AMD Ryzen 5 7600X | |
| Intel Core i9-13900K | |
| Intel Core i5-12600K | |
| Intel Core i5-13600K | |
| Intel Core i5-13400F | |
| Sınıf ortalaması (3506 - 242868, n=2165) | |
| AMD Ryzen 9 5900X | |
| AMD Ryzen 9 5950X | |
| AMD Ryzen 5 5600X | |
| AIDA64 / Memory Latency | |
| Sınıf ortalaması (6.1 - 536, n=2227) | |
| Intel Core i5-12600K | |
| Intel Core i5-13600K | |
| Intel Core i5-13400F | |
| Intel Core i9-13900K | |
| AMD Ryzen 9 5950X | |
| AMD Ryzen 5 5600X | |
| AMD Ryzen 5 7600X | |
| AMD Ryzen 9 5900X | |
* ... daha küçük daha iyidir
Oyun testleri
Daha önce olduğu gibi, inceleme örneğimiz oyun testlerinde öncelikle Intel Core i5-12600K ile düello yapıyor. Yüksek çözünürlüklerde ve yüksek ön ayarda, rakipler birbirine daha da yaklaşır. Tamamen oyunla ilgiliyse, Intel Core i5-13400F ile kesinlikle yanlış yapmayacaksınız. 16 iş parçacığı ile, tüm oyunlar şu anda ilgili grafik kartıyla sorunsuz bir şekilde oynanabilir. Test örneğimizin performansını karşılaştırma cihazlarınınkiyle karşılaştırmak için bir Nvidia GeForce RTX 3090 Founder Edition kullandık. Oyun oynarken aynı zamanda akış yapmak istiyorsanız, şu anda bir Intel Core i9-13900K veya birAMD Ryzen 9 7950X almanızı öneririz.
Gaming Performance
| Performance rating - Percent | |
| Intel Core i9-13900K | |
| AMD Ryzen 9 7900X | |
| AMD Ryzen 5 7600X | |
| Intel Core i9-12900K | |
| Intel Core i5-13600K | |
| Intel Core i5-13400F | |
| Intel Core i5-12600K | |
| F1 22 | |
| 1920x1080 Low Preset AA:T AF:16x | |
| AMD Ryzen 9 7900X | |
| AMD Ryzen 5 7600X | |
| Intel Core i5-13600K | |
| Intel Core i9-13900K | |
| Intel Core i9-12900K | |
| Intel Core i5-13400F | |
| Intel Core i5-12600K | |
| 1920x1080 Ultra High Preset AA:T AF:16x | |
| Intel Core i9-12900K | |
| Intel Core i5-12600K | |
| Intel Core i5-13600K | |
| Intel Core i5-13400F | |
| AMD Ryzen 5 7600X | |
| AMD Ryzen 9 7900X | |
| Intel Core i9-13900K | |
| Far Cry 5 | |
| 1920x1080 Ultra Preset AA:T | |
| Intel Core i9-13900K | |
| Intel Core i5-13600K | |
| Intel Core i9-12900K | |
| AMD Ryzen 9 7900X | |
| AMD Ryzen 5 7600X | |
| Intel Core i5-12600K | |
| Intel Core i5-13400F | |
| 1280x720 Low Preset AA:T | |
| Intel Core i9-13900K | |
| AMD Ryzen 9 7900X | |
| Intel Core i5-13600K | |
| AMD Ryzen 5 7600X | |
| Intel Core i9-12900K | |
| Intel Core i5-12600K | |
| Intel Core i5-13400F | |
| X-Plane 11.11 | |
| 1920x1080 high (fps_test=3) | |
| AMD Ryzen 9 7900X | |
| AMD Ryzen 5 7600X | |
| Intel Core i9-13900K | |
| Intel Core i9-12900K | |
| Intel Core i5-13600K | |
| Intel Core i5-13400F | |
| Intel Core i5-12600K | |
| 1280x720 low (fps_test=1) | |
| Intel Core i9-13900K | |
| AMD Ryzen 5 7600X | |
| AMD Ryzen 9 7900X | |
| Intel Core i9-12900K | |
| Intel Core i5-13600K | |
| Intel Core i5-13400F | |
| Intel Core i5-12600K | |
| Final Fantasy XV Benchmark | |
| 1920x1080 High Quality | |
| AMD Ryzen 9 7900X | |
| Intel Core i5-13600K | |
| Intel Core i9-13900K | |
| AMD Ryzen 5 7600X | |
| Intel Core i9-12900K | |
| Intel Core i5-13400F | |
| Intel Core i5-12600K | |
| 1280x720 Lite Quality | |
| AMD Ryzen 9 7900X | |
| Intel Core i5-13600K | |
| Intel Core i9-13900K | |
| Intel Core i9-12900K | |
| AMD Ryzen 5 7600X | |
| Intel Core i5-13400F | |
| Intel Core i5-12600K | |
| Dota 2 Reborn | |
| 1920x1080 ultra (3/3) best looking | |
| AMD Ryzen 9 7900X | |
| Intel Core i9-13900K | |
| AMD Ryzen 5 7600X | |
| Intel Core i5-13600K | |
| Intel Core i9-12900K | |
| Intel Core i5-12600K | |
| Intel Core i5-13400F | |
| 1280x720 min (0/3) fastest | |
| AMD Ryzen 5 7600X | |
| AMD Ryzen 9 7900X | |
| Intel Core i9-13900K | |
| Intel Core i5-13600K | |
| Intel Core i9-12900K | |
| Intel Core i5-12600K | |
| Intel Core i5-13400F | |
| GTA V | |
| 1920x1080 Highest AA:4xMSAA + FX AF:16x | |
| Intel Core i9-13900K | |
| AMD Ryzen 9 7900X | |
| AMD Ryzen 5 7600X | |
| Intel Core i5-13600K | |
| Intel Core i9-12900K | |
| Intel Core i5-12600K | |
| Intel Core i5-13400F | |
| 1024x768 Lowest Settings possible | |
| Intel Core i9-13900K | |
| AMD Ryzen 9 7900X | |
| AMD Ryzen 5 7600X | |
| Intel Core i5-13600K | |
| Intel Core i9-12900K | |
| Intel Core i5-13400F | |
| Intel Core i5-12600K | |
| düşük | orta | yüksek | ultra | QHD | 4K | |
|---|---|---|---|---|---|---|
| GTA V (2015) | 187.5 | 187.5 | 187.1 | 161.4 | 151.8 | 182.2 |
| The Witcher 3 (2015) | 773 | 586 | 384 | 188.1 | 156.9 | |
| Dota 2 Reborn (2015) | 293.1 | 257 | 250.4 | 231.65 | 216.7 | |
| Final Fantasy XV Benchmark (2018) | 236 | 231 | 190.8 | 146.6 | 88.8 | |
| X-Plane 11.11 (2018) | 225 | 199.2 | 160.9 | 133.5 | ||
| Far Cry 5 (2018) | 244 | 211 | 203 | 186 | 176 | 110 |
| Strange Brigade (2018) | 741 | 479 | 380 | 329 | 249 | 153.1 |
| Shadow of the Tomb Raider (2018) | 314 | 261 | 251 | 234 | 172.2 | 99.6 |
| Far Cry New Dawn (2019) | 200 | 176 | 169 | 151 | 143 | 109 |
| Metro Exodus (2019) | 311 | 223 | 175.2 | 140.1 | 115.8 | 76.6 |
| Borderlands 3 (2019) | 244 | 213 | 190.8 | 164.1 | 131.6 | 75.3 |
| F1 2020 (2020) | 487 | 403 | 374 | 270 | 218 | 138.8 |
| F1 2021 (2021) | 648 | 548 | 441 | 224 | 175.4 | 105.3 |
| Cyberpunk 2077 1.6 (2022) | 214 | 213 | 174 | 173 | 88 | 46 |
| Tiny Tina's Wonderlands (2022) | 364 | 294 | 212 | 168.5 | 124 | 70.8 |
| F1 22 (2022) | 344 | 361 | 321 | 125.1 | 83.8 | 42.4 |
| The Quarry (2022) | 282 | 216 | 177.7 | 144.4 | 103.6 | 58.9 |
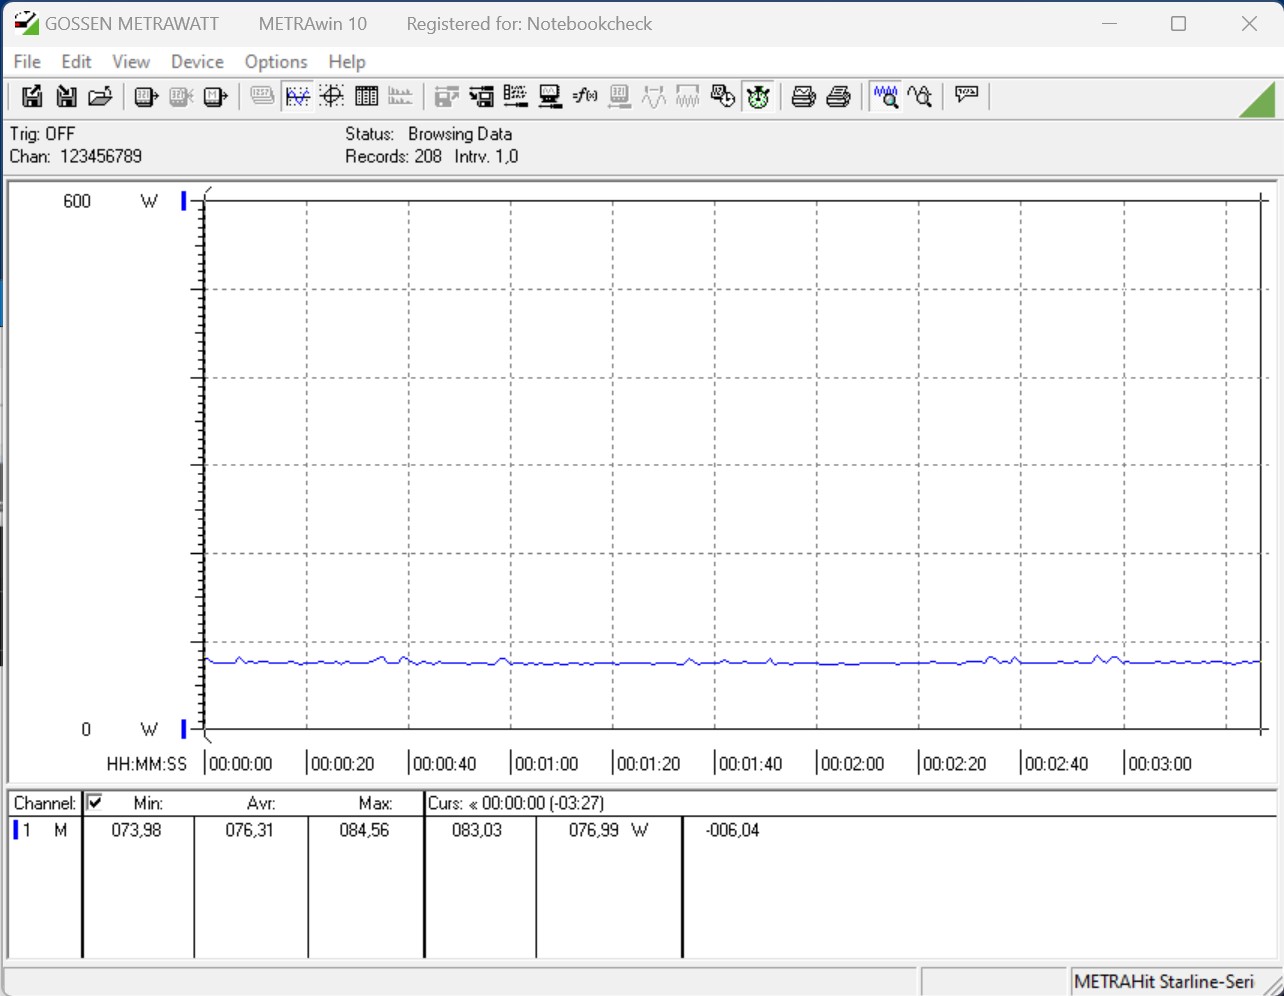
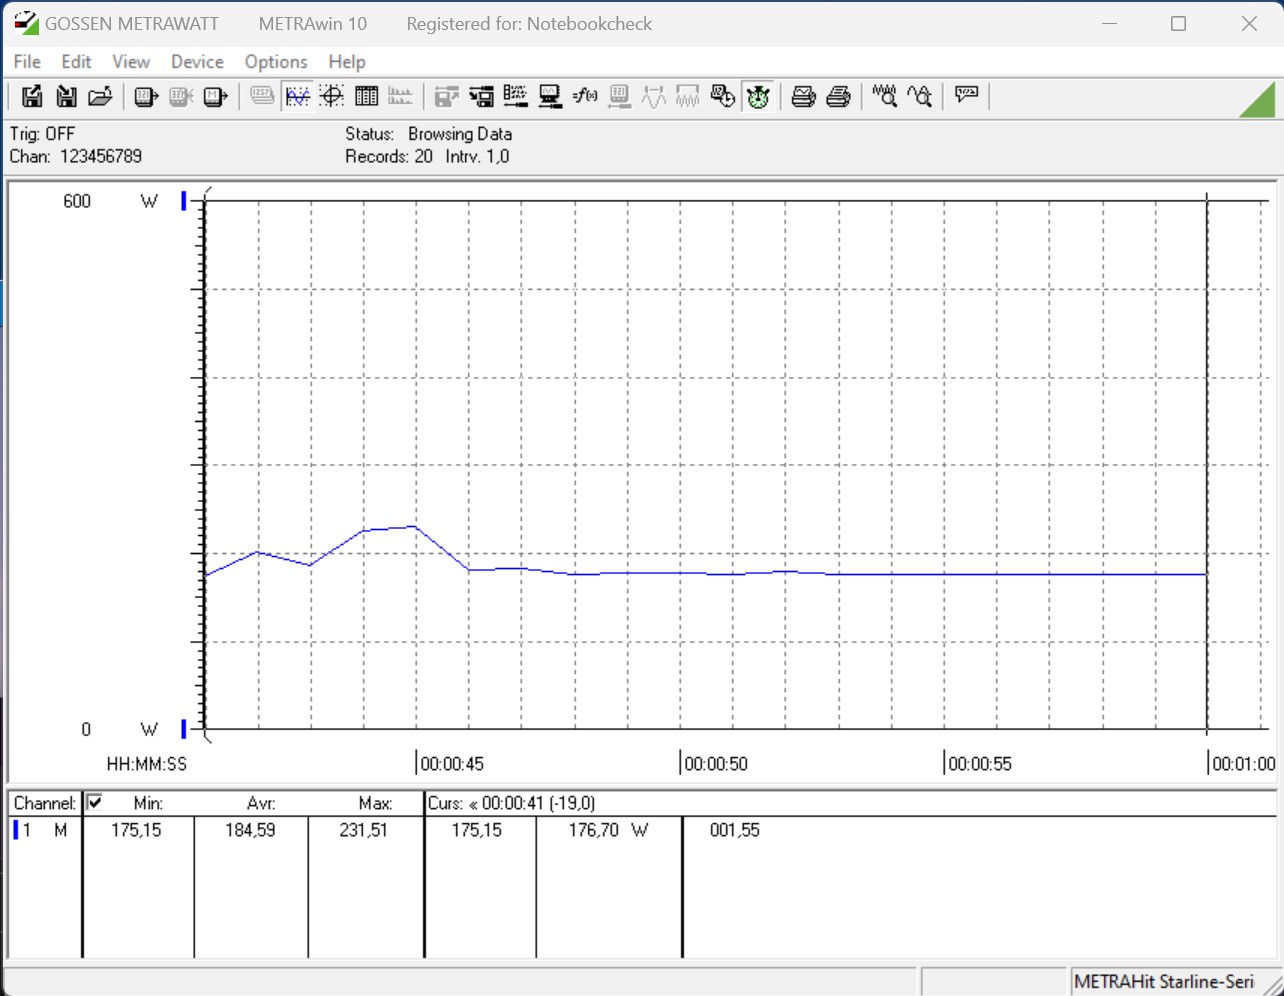
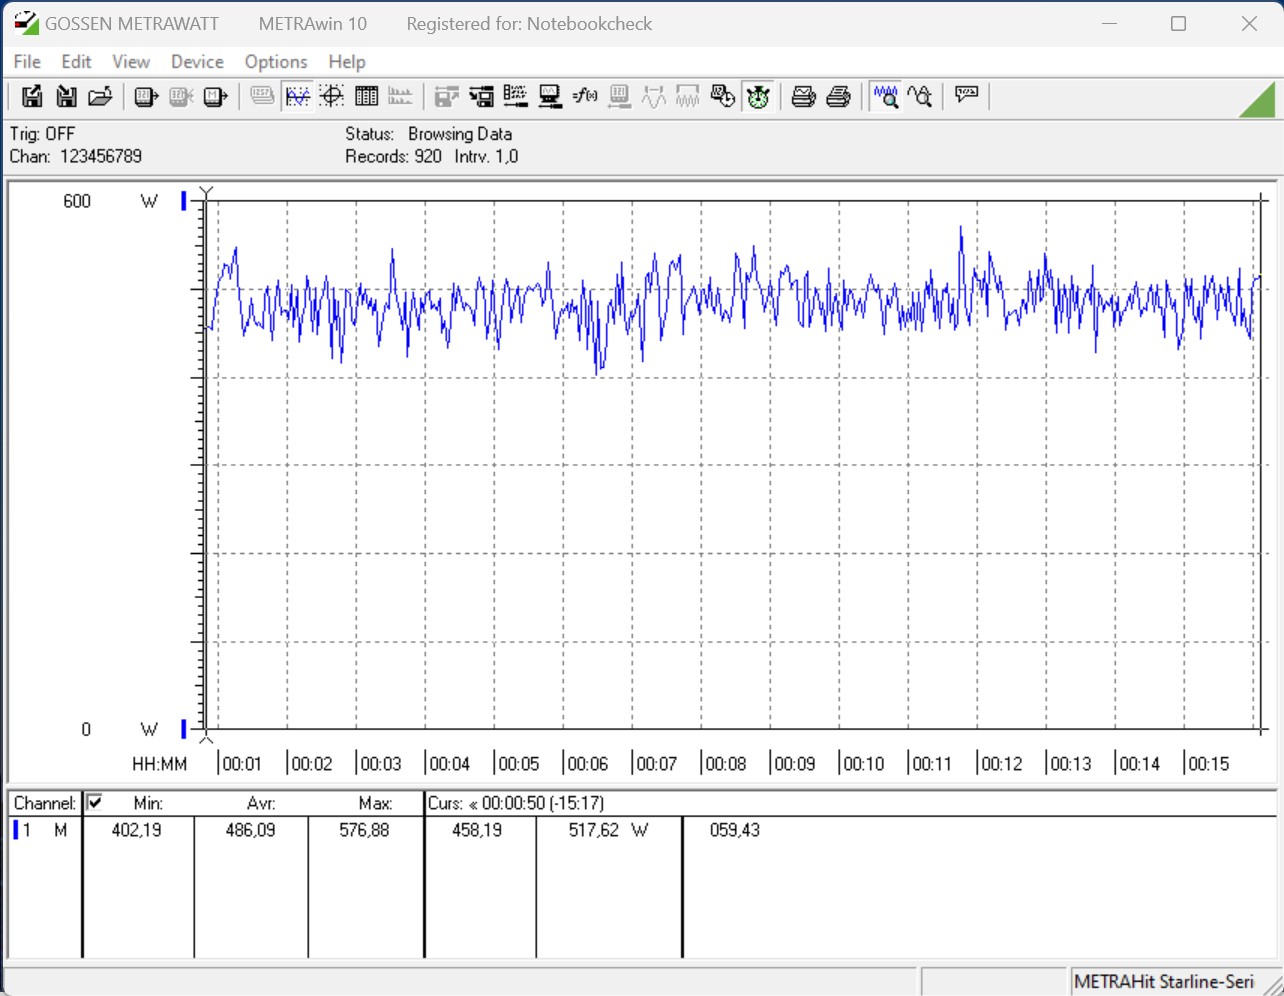
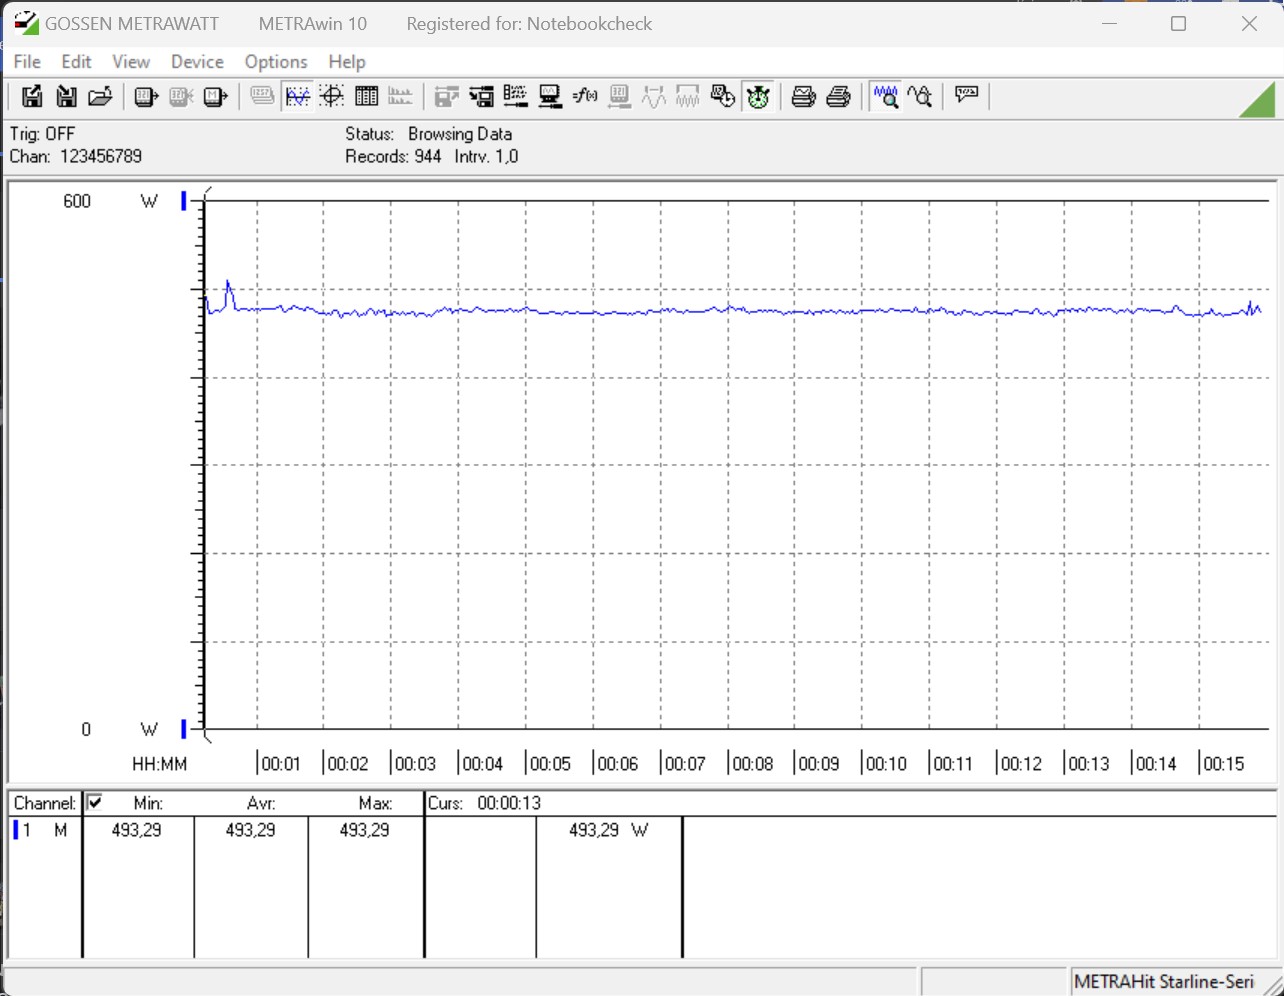
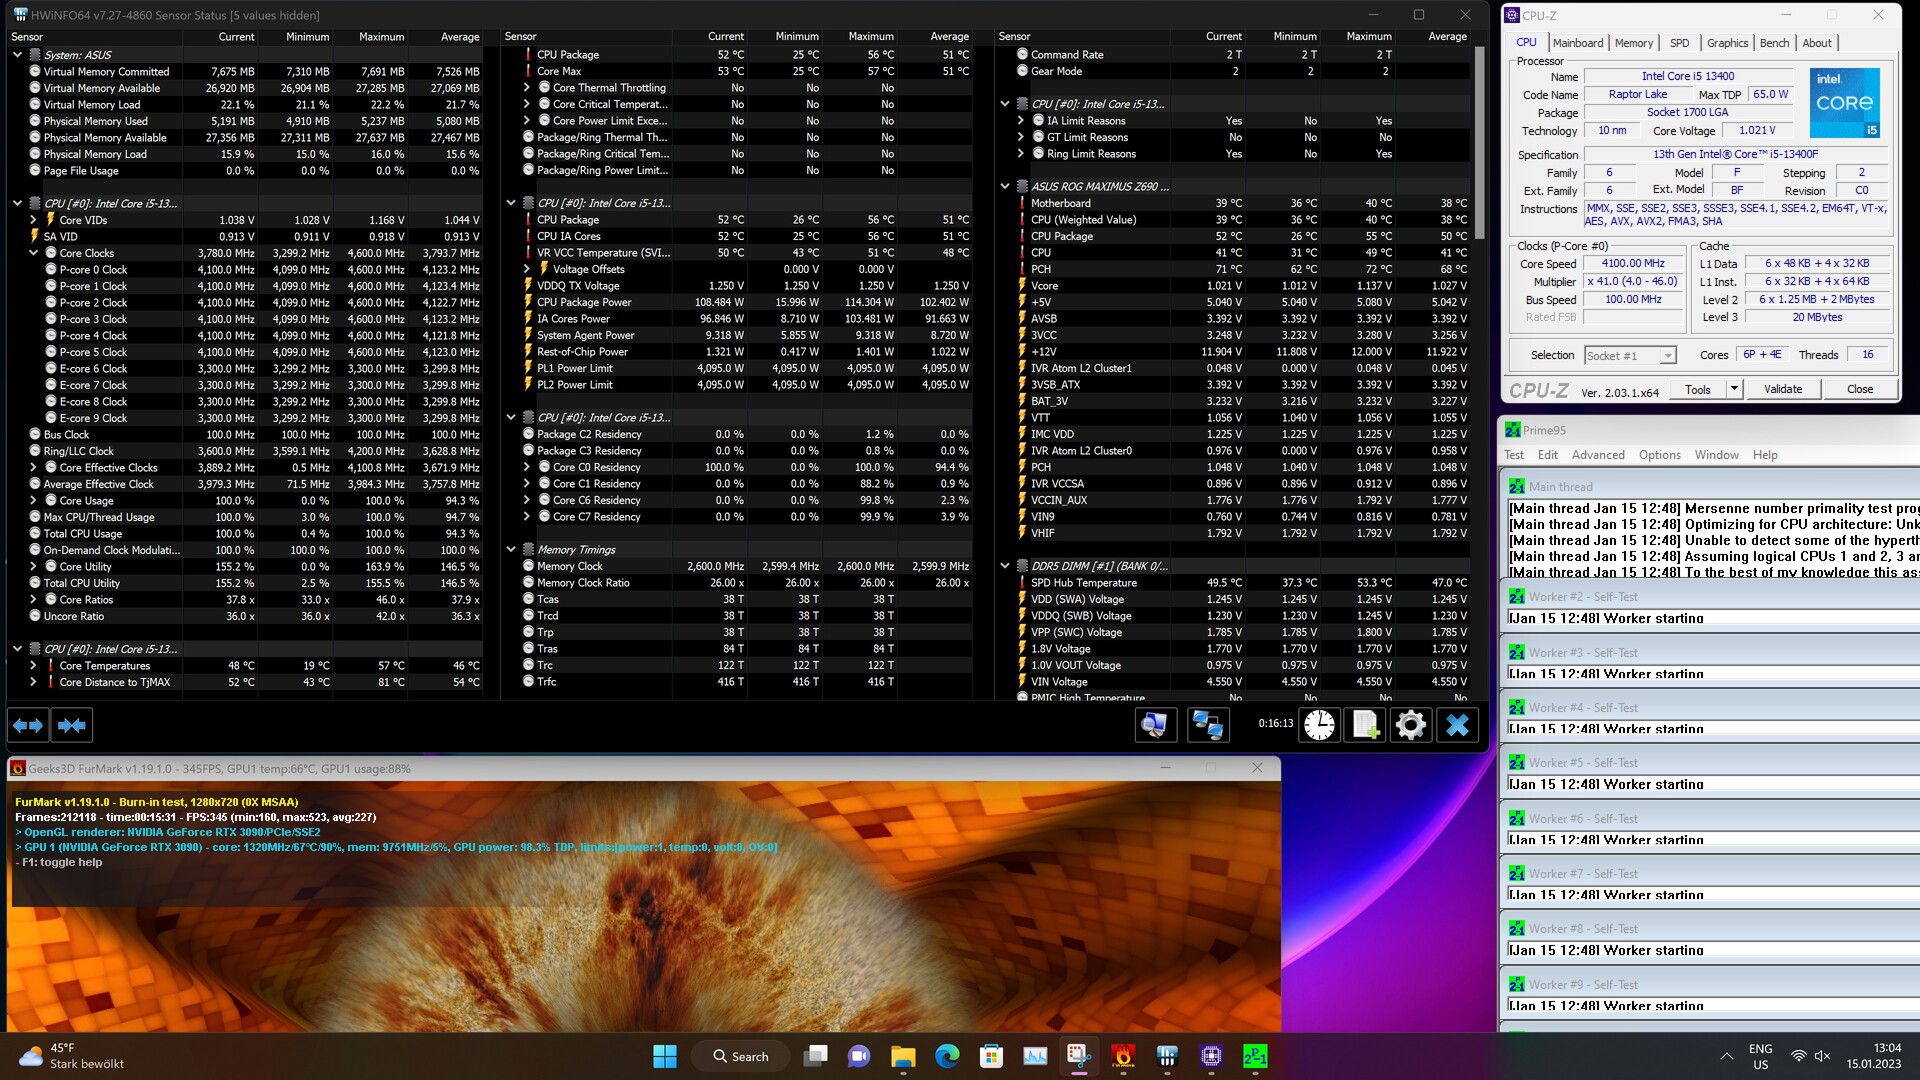
Enerji tüketimi
Intel Core i5-13400F'nin teknik özelliklerine göre güç tüketimi 65 watt ve yük altında 148 watt'a kadar çıkabiliyor. İşlemci için güç tüketimi kısıtlamaları BIOS'ta sınırlandırılmamışsa, 148 watt sürekli olarak açıktır ve çiy değeriyle geçici olarak sınırlandırılmaz. İşlemci ile yaptığımız tüm testler herhangi bir kısıtlama olmaksızın gerçekleştirildi. Cinebench R15 çoklu testinde test sisteminin güç tüketimini yalnızca 184 watt ile kaydediyoruz. Bu nedenle Intel Core i5-13400F, testimizde 206 watt'ın biraz altında güç gerektiren Intel Core i5-12600K'dan çok daha tutumlu. Stres testinde 214 watt ile biraz daha dikkat çekiyoruz. Bununla birlikte, enerji tüketimi sevindirici derecede düşüktür.
Düşük güç tüketimi nedeniyle Intel Core i5-13400F fazla soğutmaya ihtiyaç duymaz. Böylece, bir AiO olmadan güvenle yapabilirsiniz ve bu işlemci için yüksek kaliteli bir hava soğutucusu tamamen yeterlidir.
| Power Consumption / Cinebench R15 Multi (external Monitor) | |
| Intel Core i9-13900K | |
| Intel Core i9-12900K (Idle: 70.5 W) | |
| AMD Ryzen 9 7900X | |
| Intel Core i5-13600K | |
| AMD Ryzen 9 5900X (Idle: 78.1 W) | |
| AMD Ryzen 9 5950X (Idle: 78 W) | |
| AMD Ryzen 5 7600X | |
| Intel Core i5-12600K (Idle: 70.45 W) | |
| Intel Core i5-13400F | |
| AMD Ryzen 5 5600X (Idle: 79.23 W) | |
| Power Consumption / Prime95 V2810 Stress (external Monitor) | |
| Intel Core i9-13900K | |
| Intel Core i5-13600K | |
| AMD Ryzen 9 7900X | |
| Intel Core i9-12900K (Idle: 70.5 W) | |
| Intel Core i5-12600K (Idle: 70.45 W) | |
| AMD Ryzen 9 5950X (Idle: 78 W) | |
| AMD Ryzen 9 5900X (Idle: 78.1 W) | |
| AMD Ryzen 5 7600X | |
| Intel Core i5-13400F | |
| AMD Ryzen 5 5600X (Idle: 79.23 W) | |
| Power Consumption / The Witcher 3 ultra (external Monitor) | |
| AMD Ryzen 9 7900X | |
| Intel Core i9-13900K | |
| AMD Ryzen 5 7600X | |
| Intel Core i5-13600K | |
| Intel Core i5-13400F | |
| Nvidia GeForce RTX 3090 Founders Edition (Idle: 91.1 W) | |
| Intel Core i9-12900K (Idle: 70.5 W) | |
| AMD Ryzen 9 5950X (Idle: 78 W) | |
| AMD Ryzen 9 5900X (Idle: 78.1 W) | |
| AMD Ryzen 5 5600X (Idle: 79.23 W) | |
| Intel Core i5-12600K (Idle: 70.45 W) | |
* ... daha küçük daha iyidir
Power Consumption With External Monitor
Artılar
Eksiler
Son Görüş - Ekonomik, hızlı ve soğutması kolay
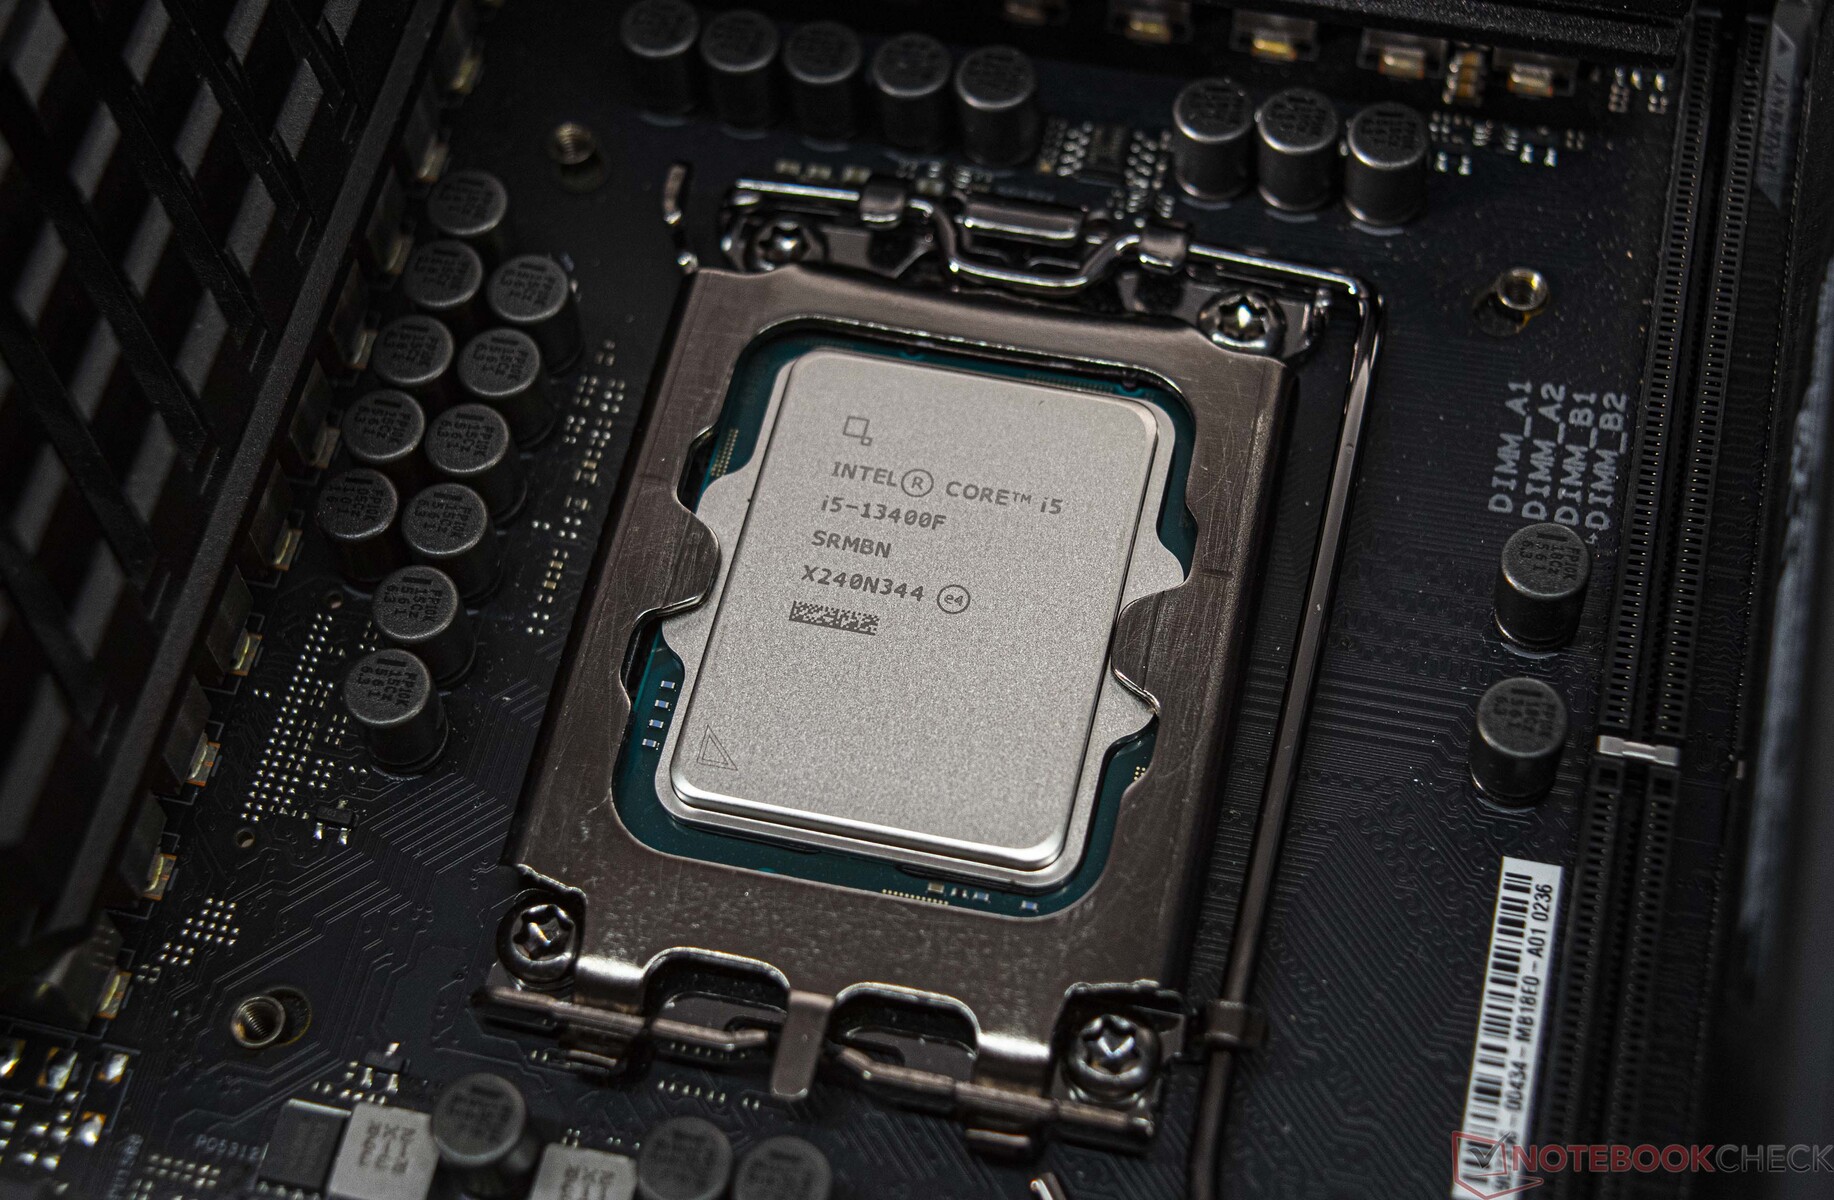
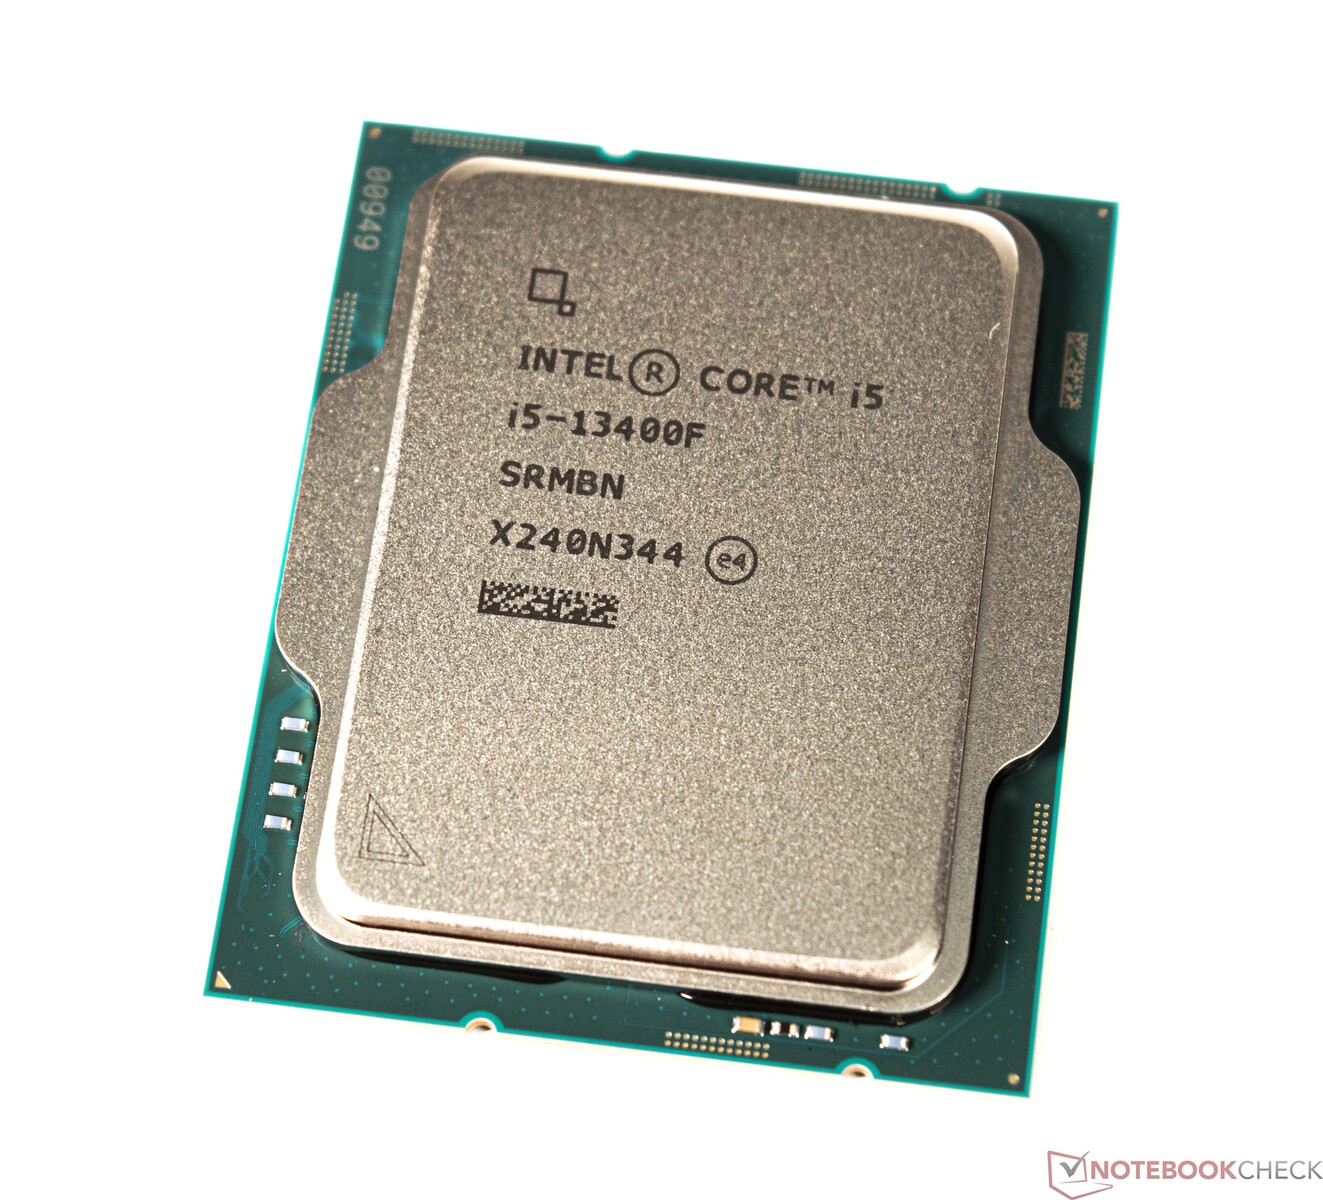
Intel, Alder Lake kuşağının saygıdeğer bir torununu Raptor Lake yarışına gönderdi bile. Aynı temelde orta sınıf ve giriş seviyesi modeller artık yavaş yavaş geliyor. Yine de, daha yakından bakmalı ve işlemci adımına dikkat etmelisiniz çünkü bu her zaman bir Raptor Lake işlemci değildir. Bizim durumumuzda, çekirdekte bir Alder Lake işlemci olduğunu gösteren C0 adımında Intel Core i5-13400F'ye sahibiz. Yalnızca B0 adımı, yerel bir Raptor-Lake işlemcisini gösterir. Her iki sürümün de mevcut olması gerekiyor ve eşit derecede iyi performans gösterdiklerini varsayıyoruz.
Bu arada Intel, P-çekirdeklerinin yanı sıra 4 E-çekirdeğe de sahip olan Intel Core i5-13400F ile tutumlu bir 10-çekirdek sunuyor. 148 watt'a kadar olan model, tam yük altında nispeten tutumludur. Ayrıca, sıcaklıkların yönetimi kolaydır ve karmaşık ve pahalı soğutma gerektirmez. Testte, Intel Core i5-13400F, Intel Core i5-12600K ile çok iyi bir uyum sergiliyor, enerji verimliliği açısından eşleşme açıkça daha tutumlu modelin lehine. AMD'nin Zen 4 işlemcilerine ayak uydurulamaz. Burada, testimizin yerel 10 çekirdeği, yine toplam 16 iş parçacığına sahip bir AMD Ryzen 7 5800X ile aynı sırada yer alıyor.
Intel Core i5-13400F, günlük kullanım için sağlam performans sunar ve aynı zamanda en yeni oyunlarda ustalaşır. Düşük TDP sayesinde tutumlu işlemci küçük kasalarda da sorunsuz bir şekilde soğutulabiliyor.
Ana birim için 600 serisi yonga setine sahip bir anakart kullanılabilir. Bu, yükseltme sırasında cüzdanı çok fazla zorlamaz. Yine de artık soket 1700 için yeni bir Intel nesli olmayacağını da göz önünde bulundurmak gerekiyor. Mevcut söylenti değirmeni, soket 1851'in Meteor Lake ile birlikte tanıtılacağını söylüyor. Bu, yeni bir anakartın tekrar zorunlu olacağı anlamına gelir.
Fiyat ve Stok Durumu
Intel Core i5-13400F şu anda Notebooksbilliger.de'de 227 Euros (~$247) satılıyor. 260 Euro'ya ( ~283$) tümleşik grafik birimiyle birlikte Notebooksbilliger.de adresinden satın alabilirsiniz.
