Intel NUC X15 LAPAC71H incelemesi: Intel Arc A730M ile 1.050 ABD dolarından başlayan fiyatlarla multimedya dizüstü bilgisayar
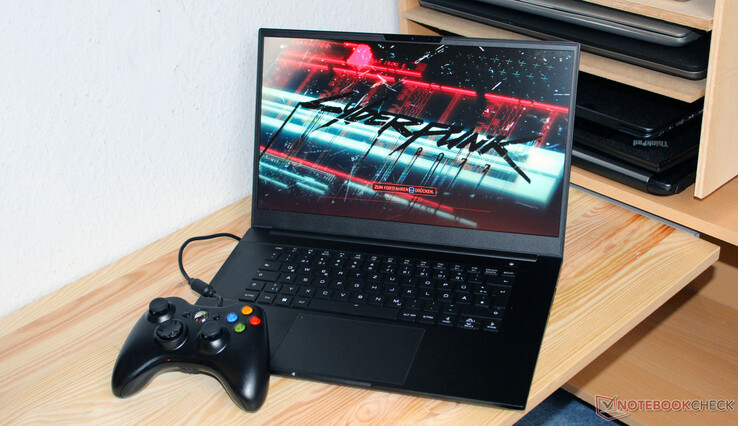
Oyunculara ve yaratıcılara yönelik bir dizüstü bilgisayar olan Intel NUC X15, 2022 sonbaharı için duyurulduktan bir yıl sonra nihayet gün ışığına çıkıyor. Bu çoğunlukla bir maldan kurtulma durumu olmalı: X15 ve bir bütün olarak NUC serisi Intel tarafından çoktan üretimden kaldırıldı. Schenker tarafından dağıtılan dizüstü bilgisayarın Core i7-12700H, Arc A730Mve FHD panel ayarlanırken, RAM ve SSD(ler) seçilebilir.
Rakipleri arasında Asus TUF A15 FA507, Gigabyte G5 KE, MSI Cyborg 15 A12VF, Dell Inspiron 16 Plus 7630 ve Asus VivoBook Pro 16 gibi cihazlar bulunmaktadır.
Karşılaştırmalı olarak olası rakipler
Derecelendirme | Tarih | Modeli | Ağırlık | Yükseklik | Boyut | Çözünürlük | Fiyat |
|---|---|---|---|---|---|---|---|
| 84.4 % v7 (old) | 10/2023 | Intel NUC X15 LAPAC71H i7-12700H, A730M | 2.2 kg | 26.7 mm | 15.60" | 1920x1080 | |
| 86.3 % v7 (old) | Asus TUF A15 FA507 R7 7735HS, GeForce RTX 4050 Laptop GPU | 2.2 kg | 24.9 mm | 15.60" | 1920x1080 | ||
| 81.8 % v7 (old) | Gigabyte G5 KE i5-12500H, GeForce RTX 3060 Laptop GPU | 2 kg | 23.9 mm | 15.60" | 1920x1080 | ||
| 87.1 % v7 (old) | 09/2023 | Dell Inspiron 16 Plus 7630 i7-13700H, GeForce RTX 4060 Laptop GPU | 2.2 kg | 19.95 mm | 16.00" | 2560x1600 | |
| 86.3 % v7 (old) | 05/2023 | Asus VivoBook Pro 16 i7-12700H, GeForce RTX 3050 Ti Laptop GPU | 1.9 kg | 20 mm | 16.00" | 2560x1600 | |
| 82.4 % v7 (old) | 06/2023 | MSI Cyborg 15 A12VF i7-12650H, GeForce RTX 4060 Laptop GPU | 2 kg | 22.9 mm | 15.60" | 1920x1080 |
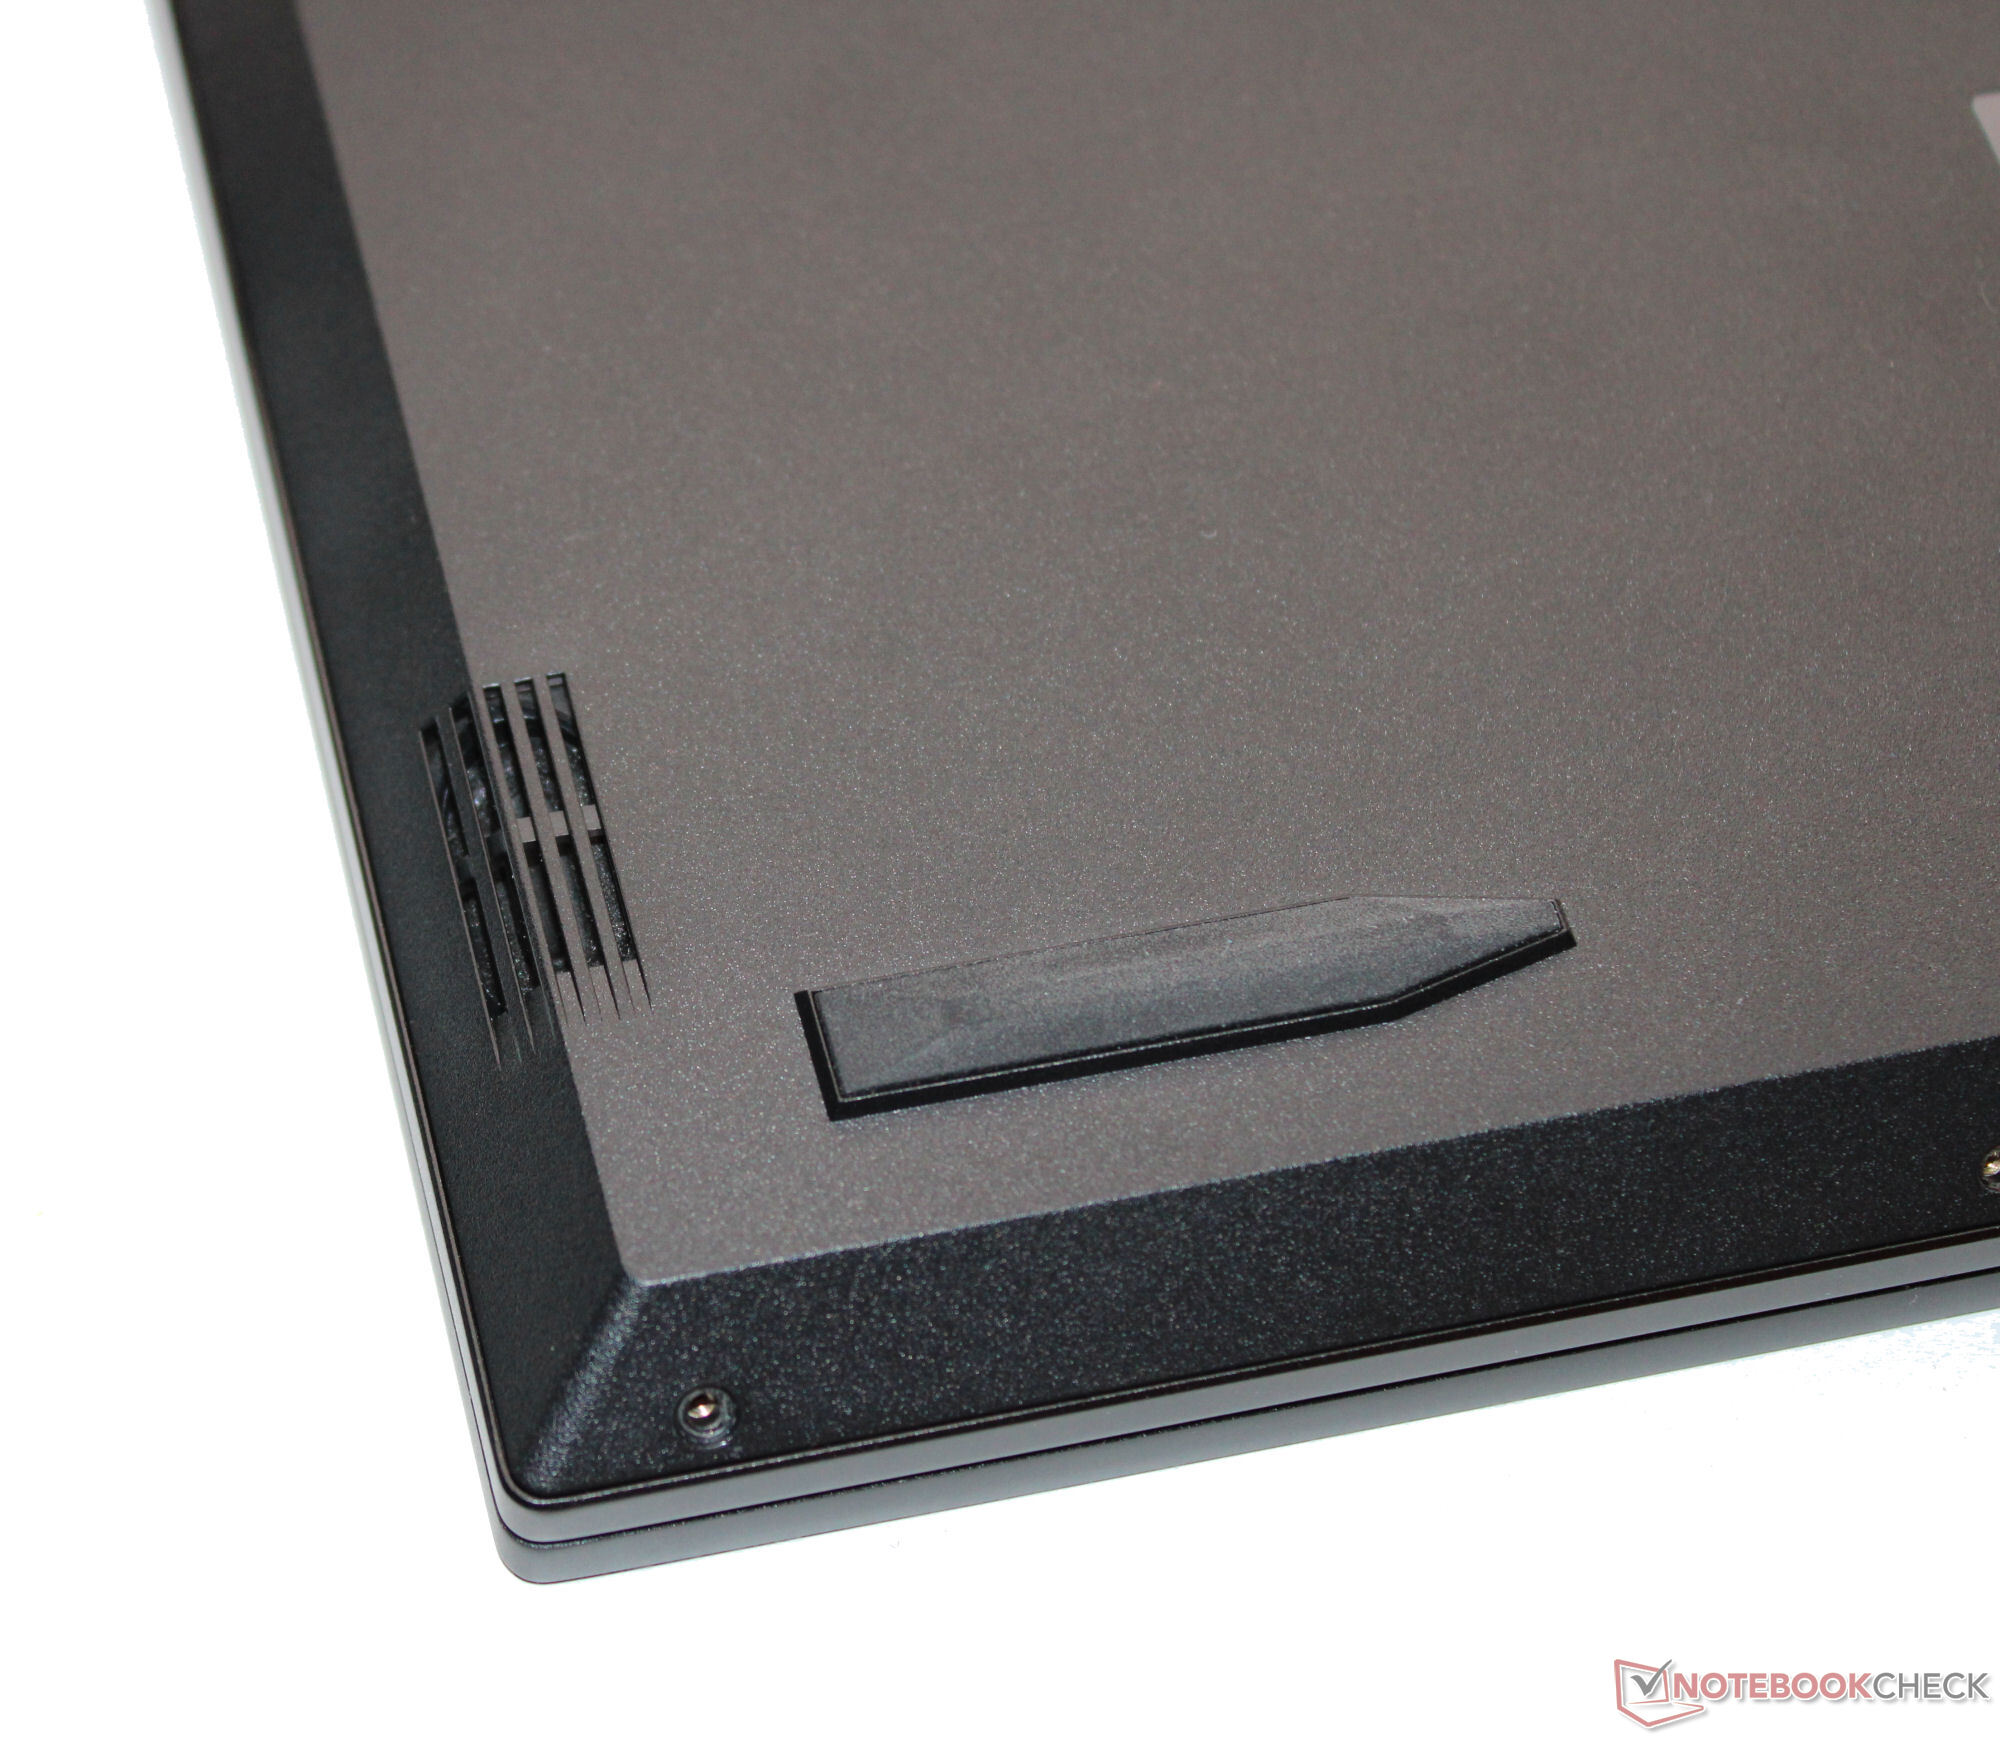
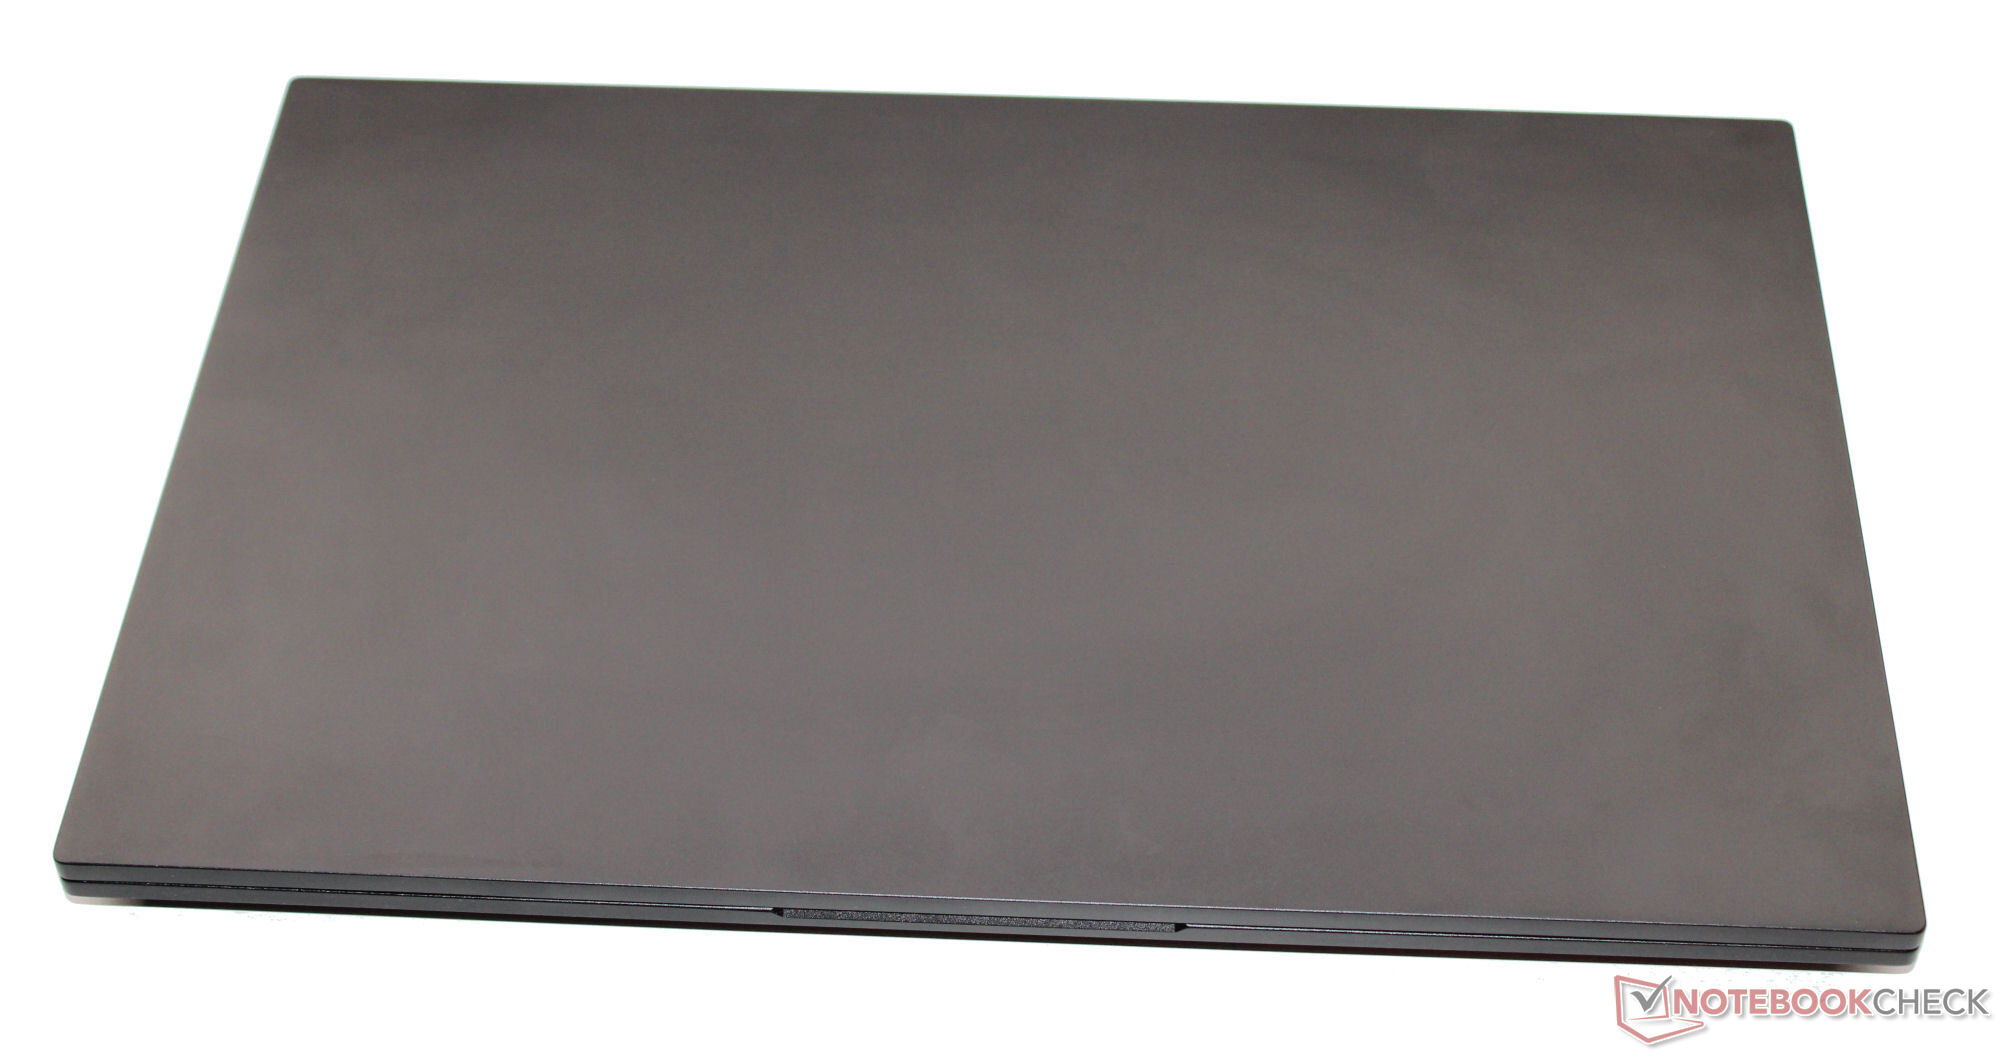
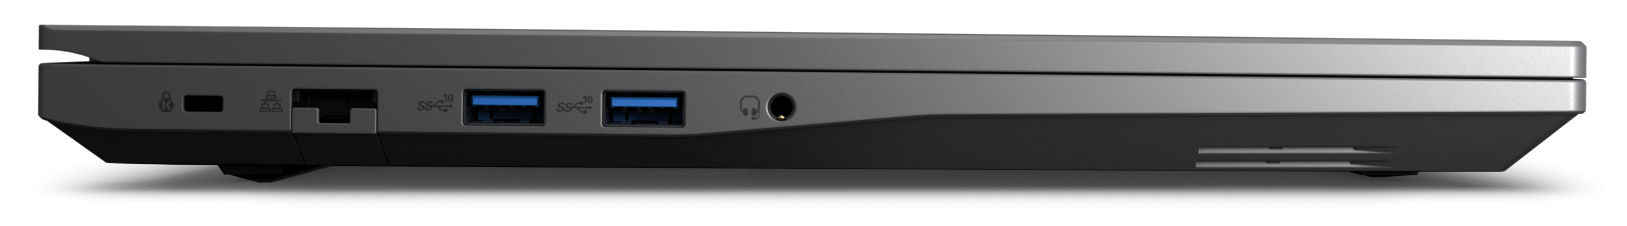
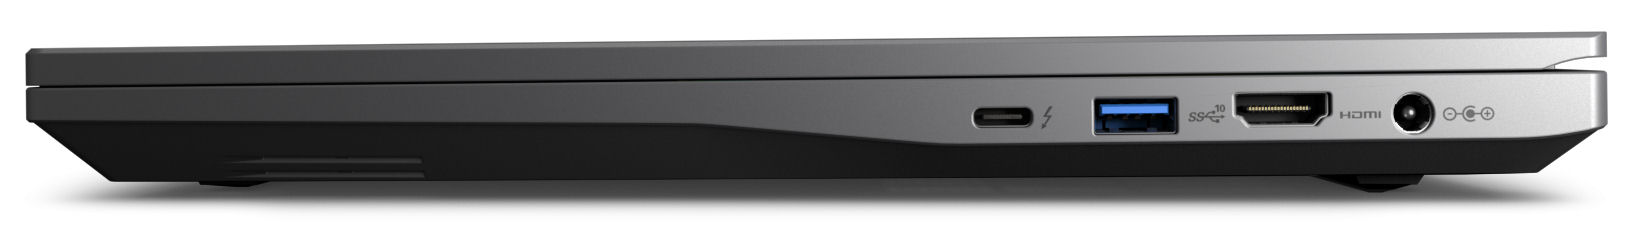
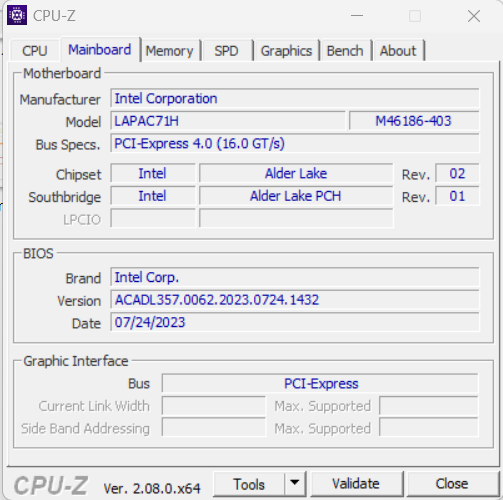
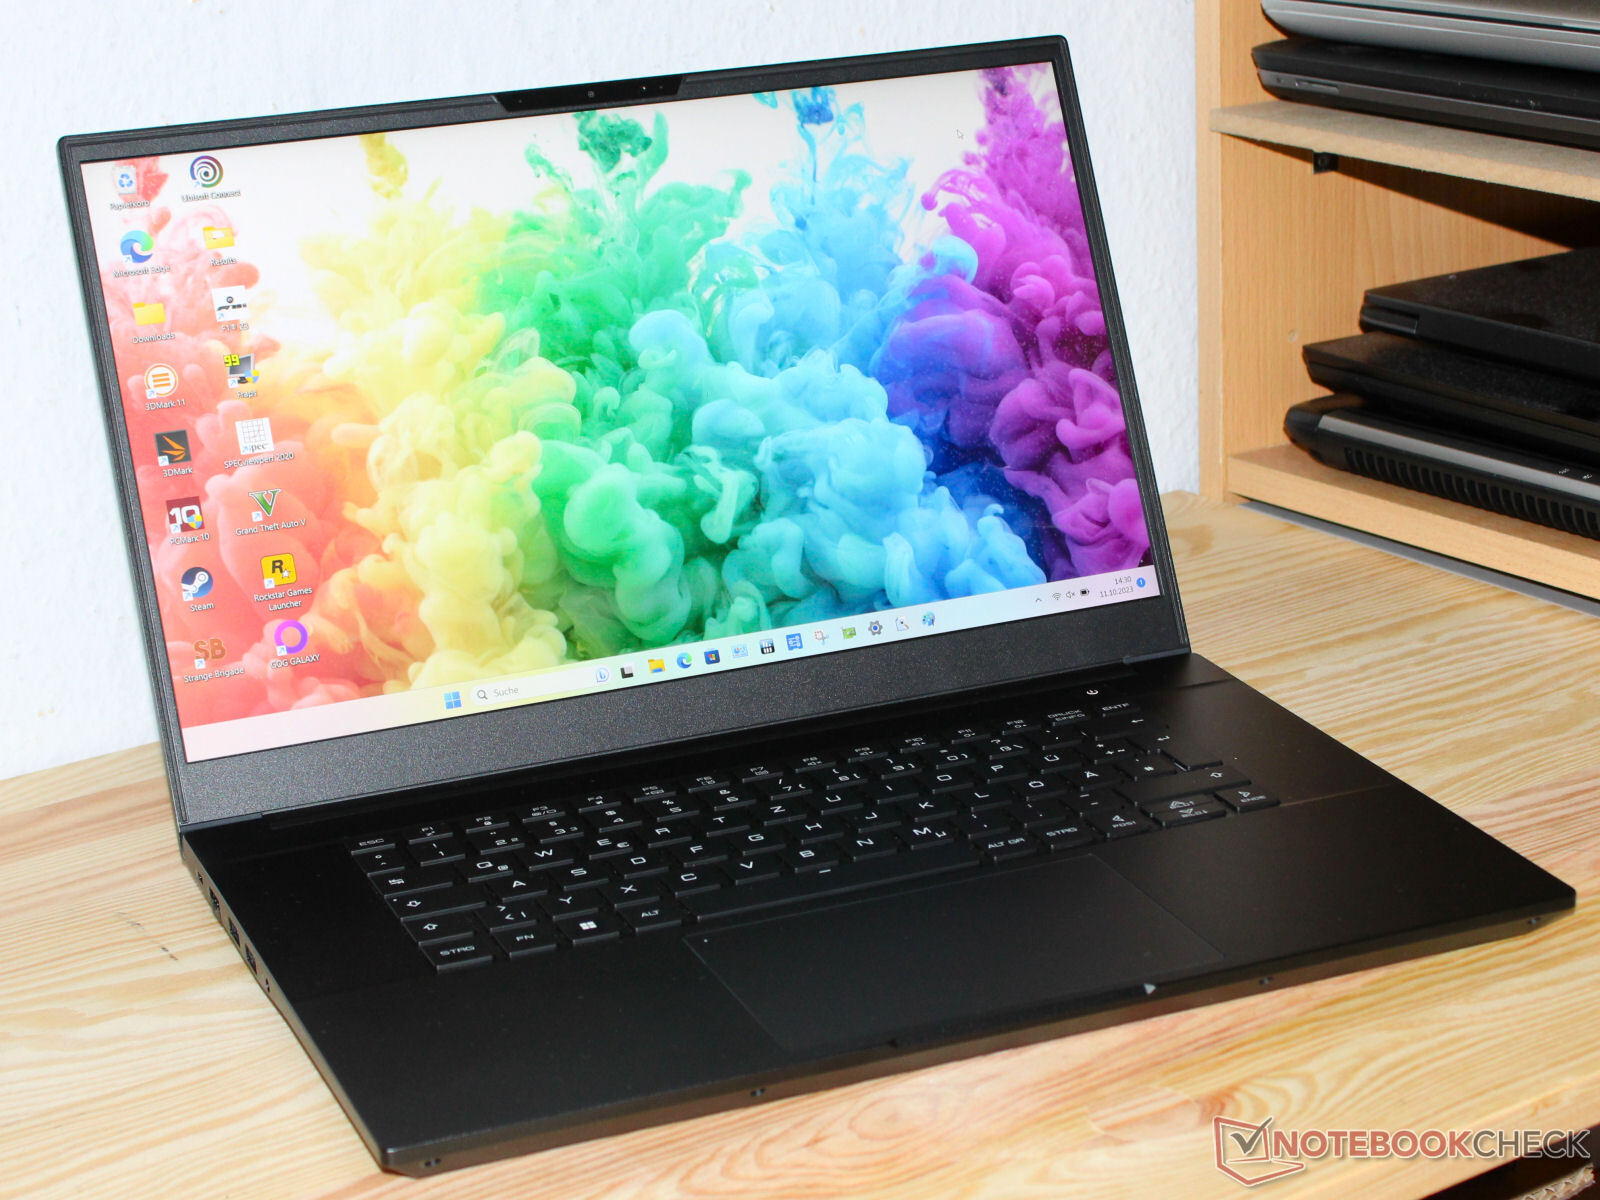
Kasa ve bağlantı - Intel NUC, Thunderbolt 4 özelliğine sahiptir
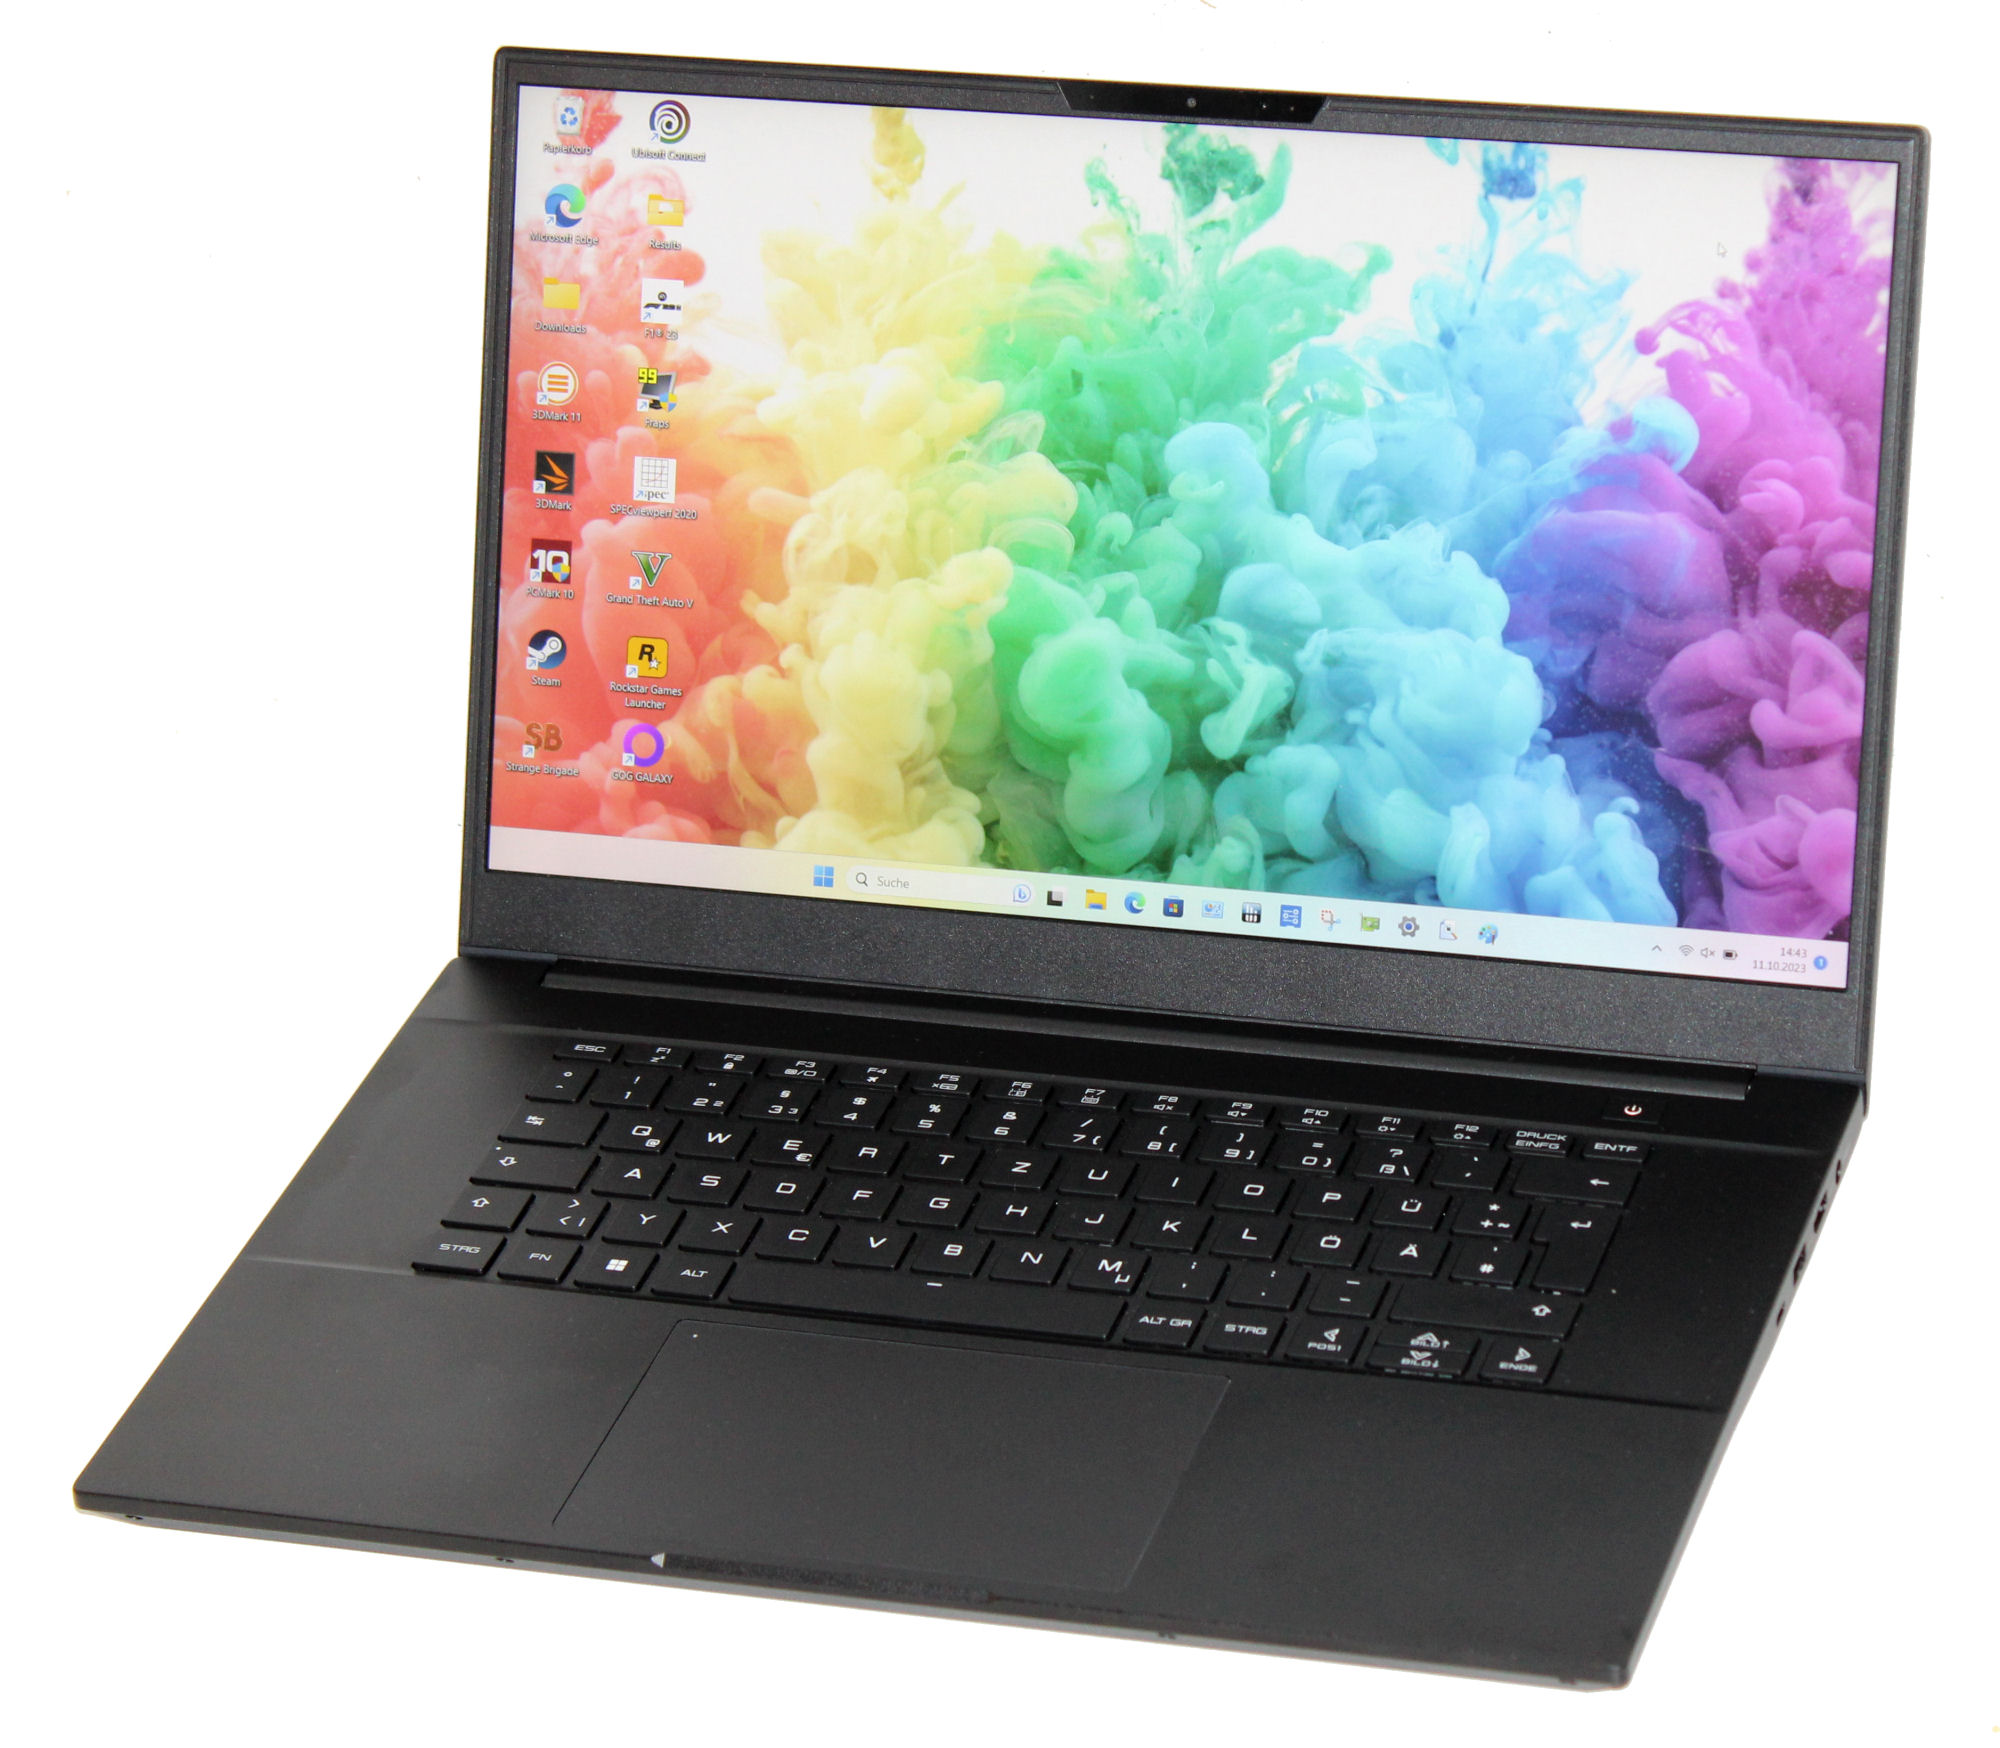
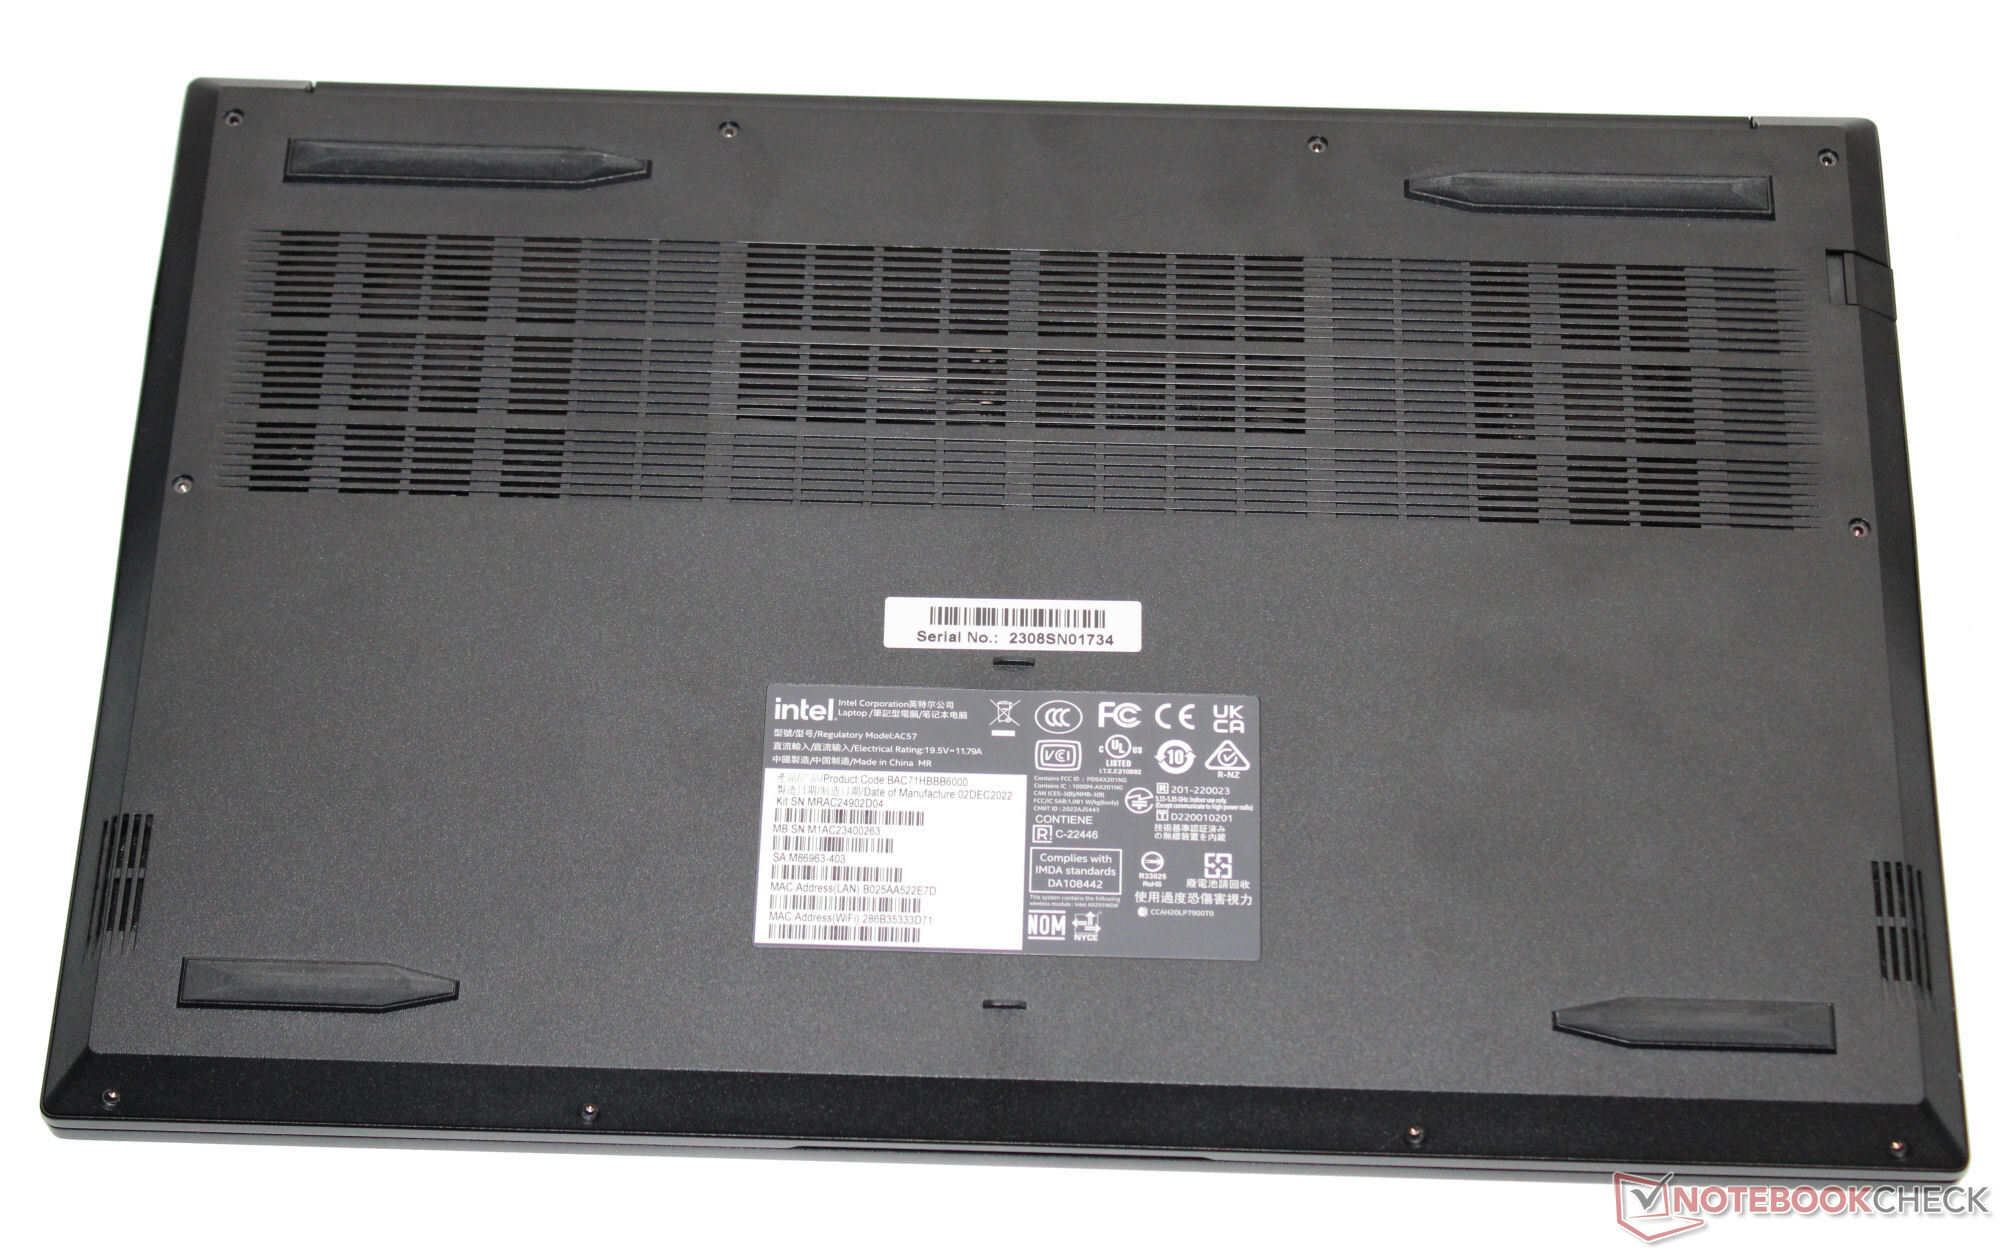
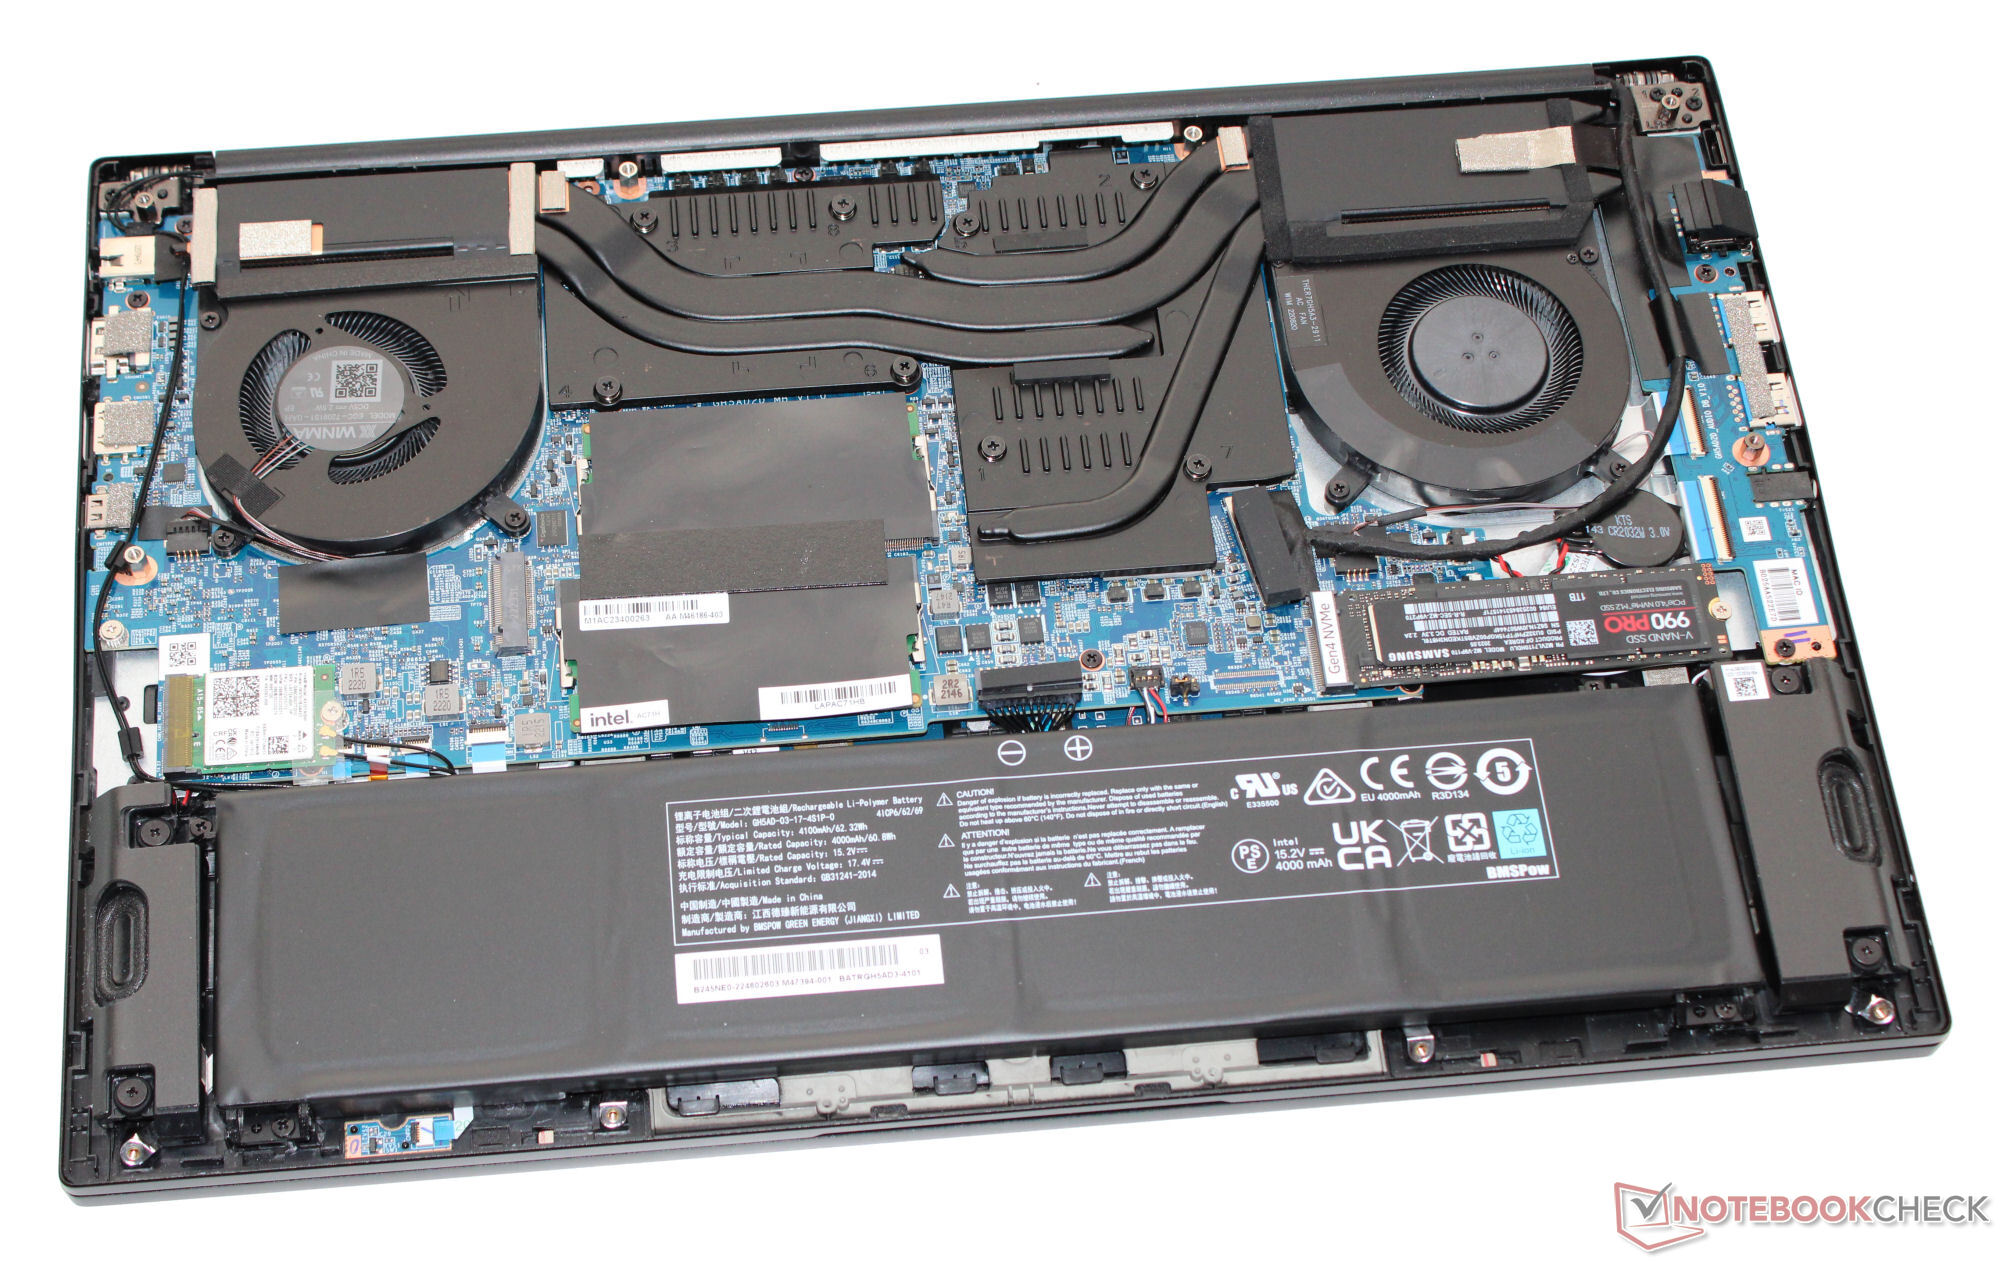
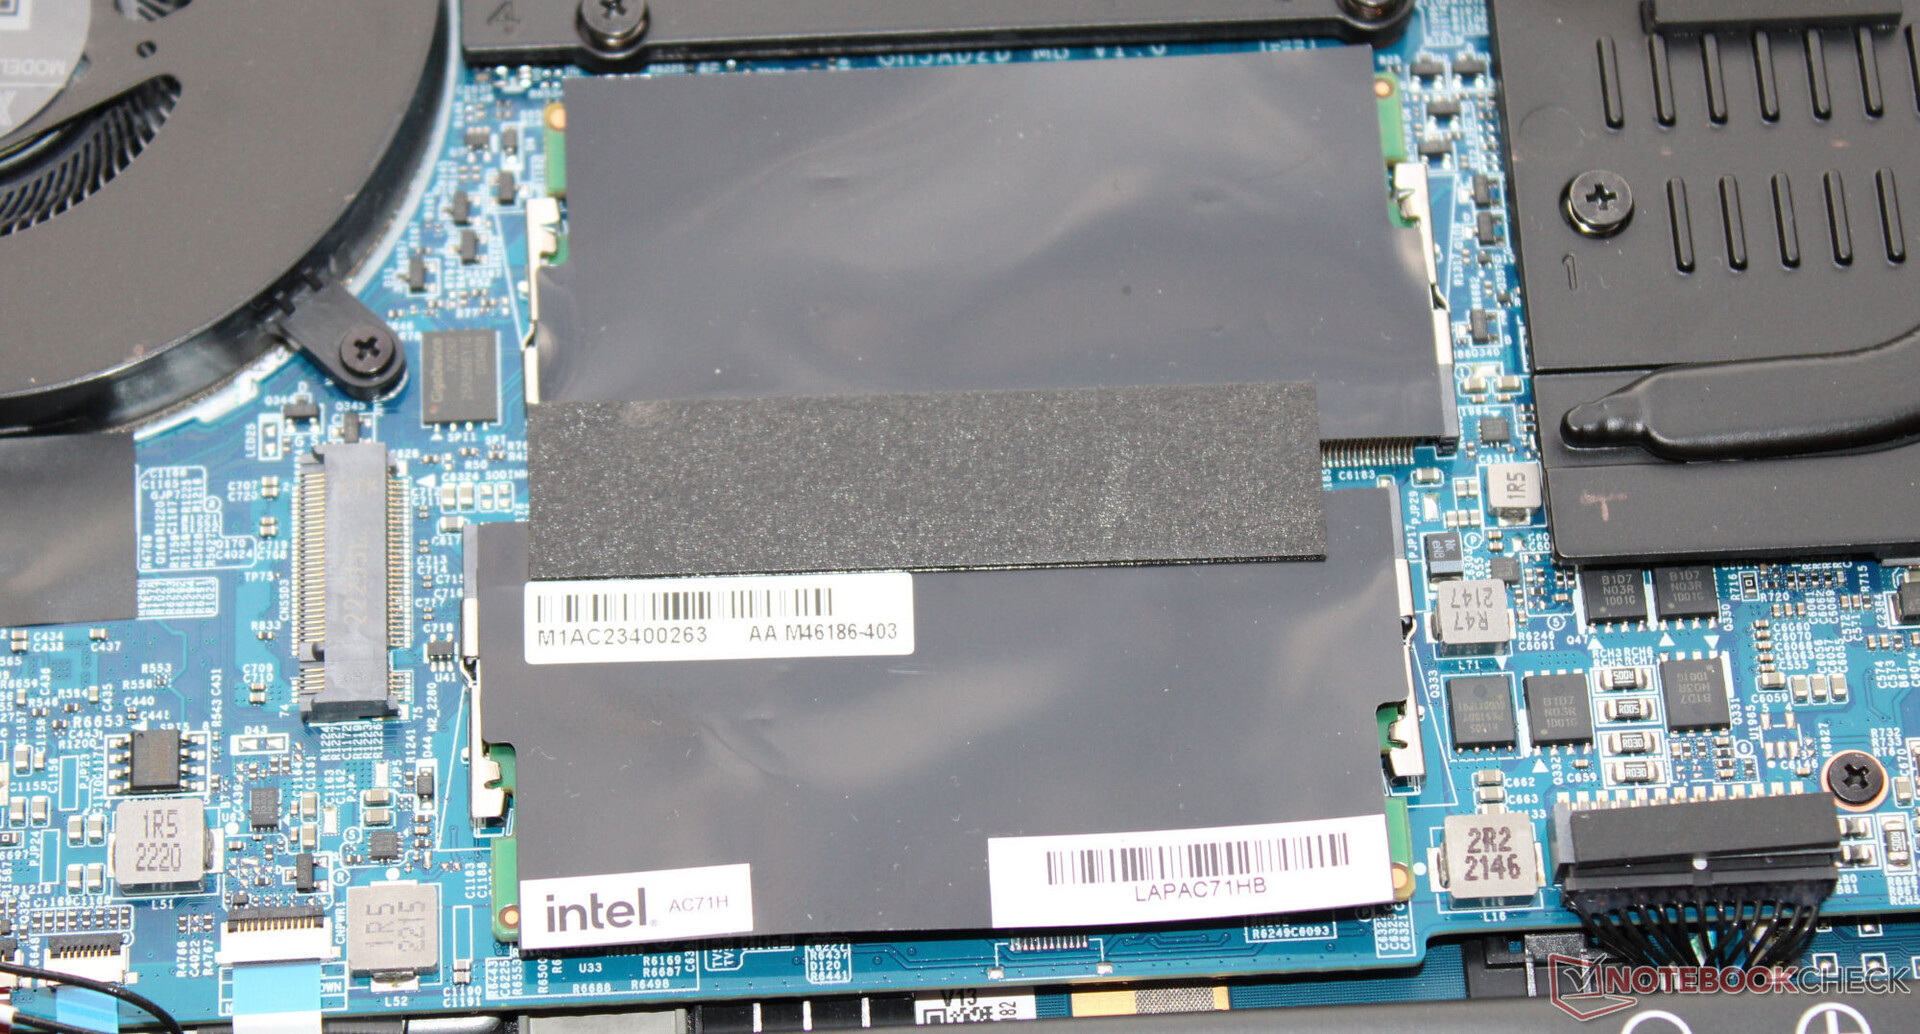
Kapağın arkası ve mat siyah kasanın üst kısmı alüminyumdan, ekran çerçevesinin alt kısmı ise plastikten yapılmıştır. Herhangi bir yapı sorunu fark etmedik. Intel, profesyonel ortamlarda çok fazla dikkat çekmemesi gereken şık, sade bir kasaya güveniyor. Kasanın alt kısmını söktükten sonra pile (vidalanmış, yapıştırılmamış) ve dizüstü bilgisayarın diğer iç parçalarına erişebilirsiniz.
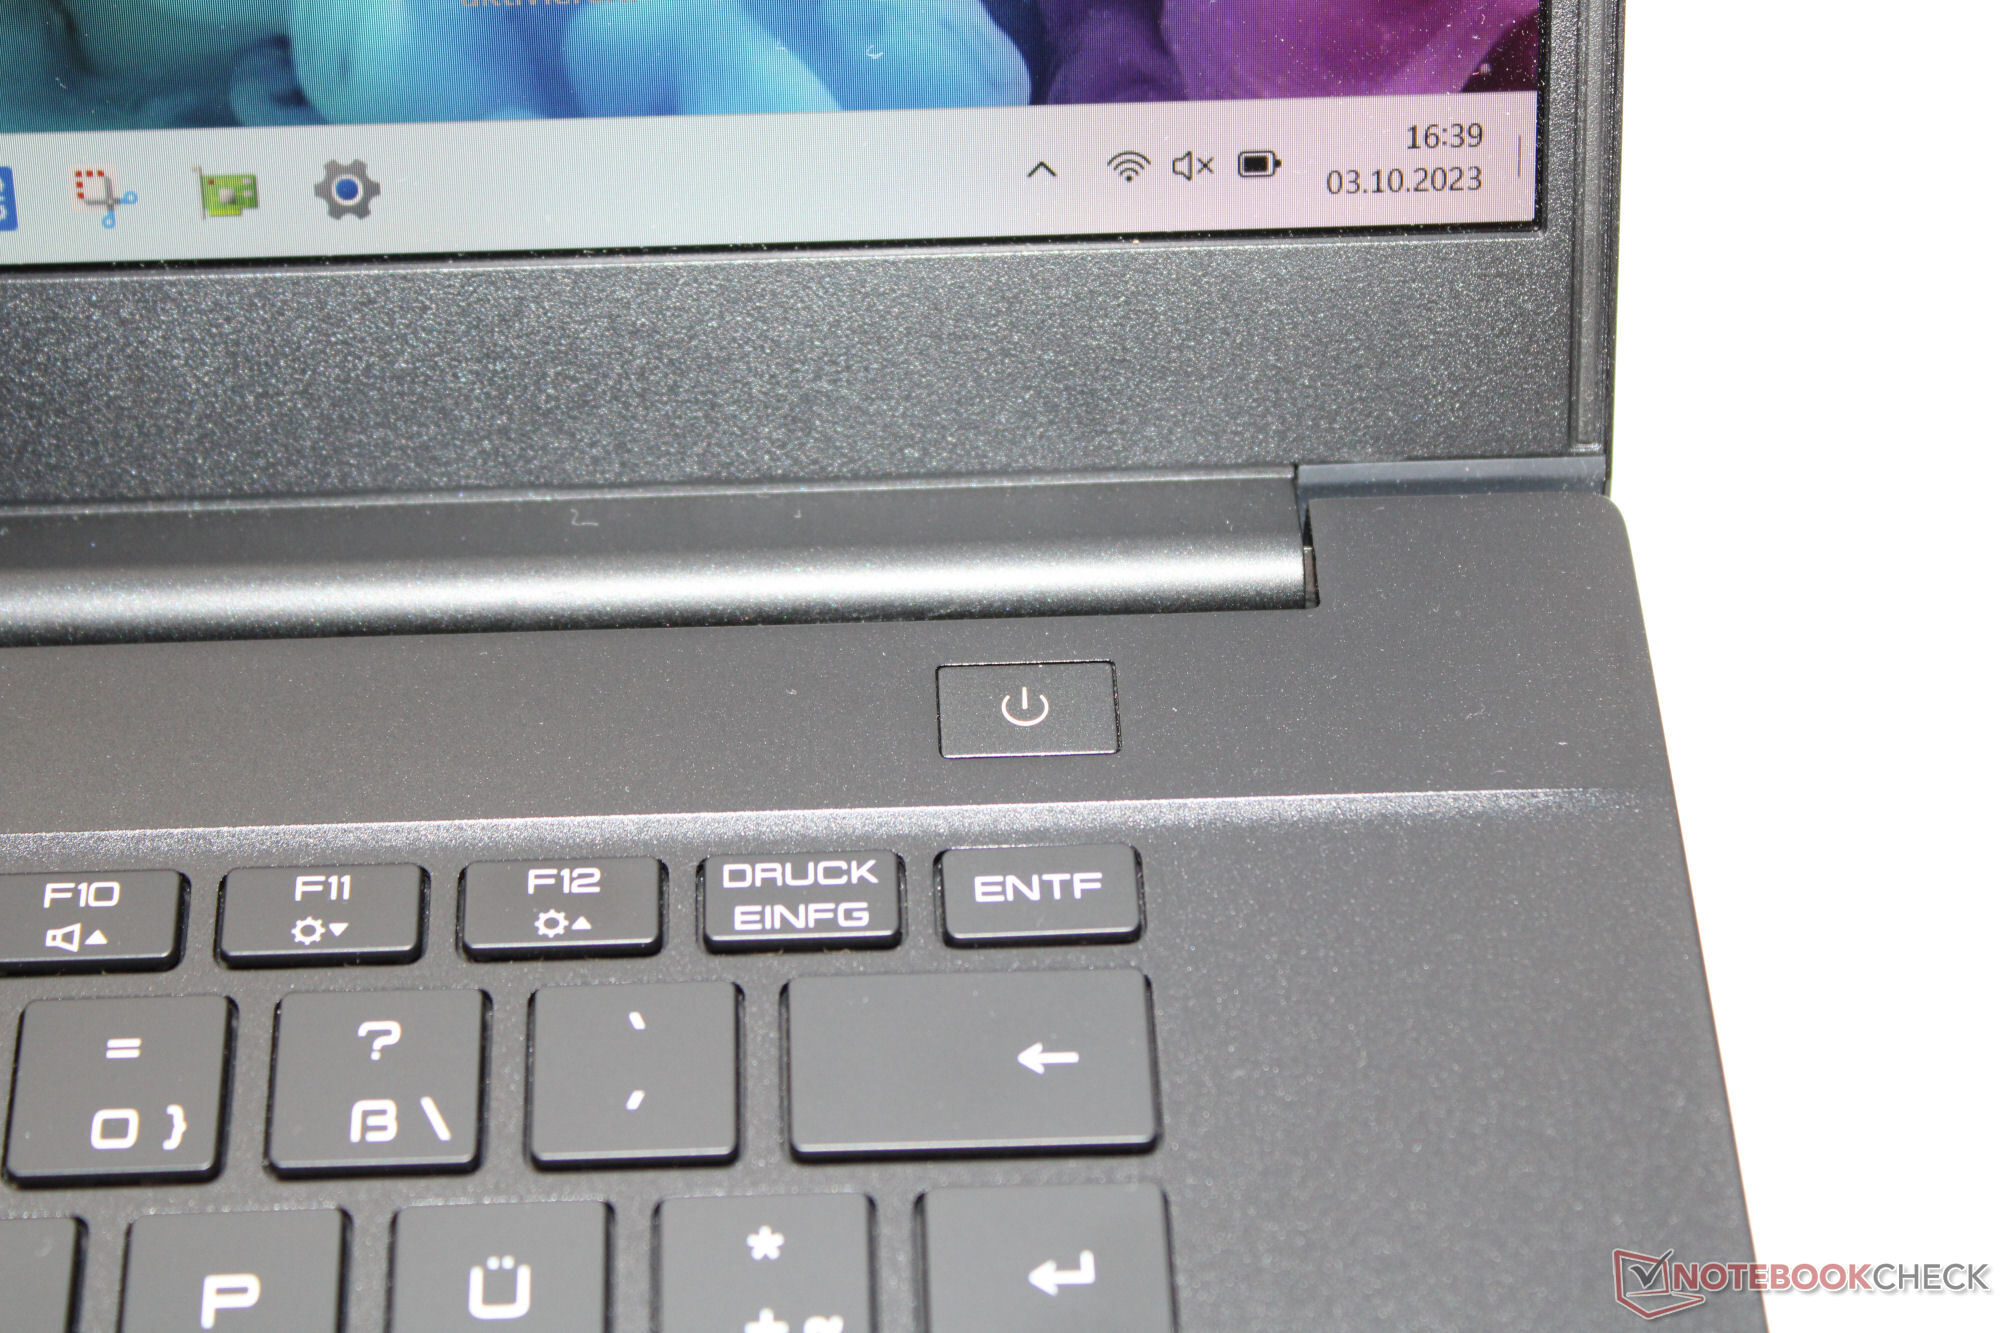
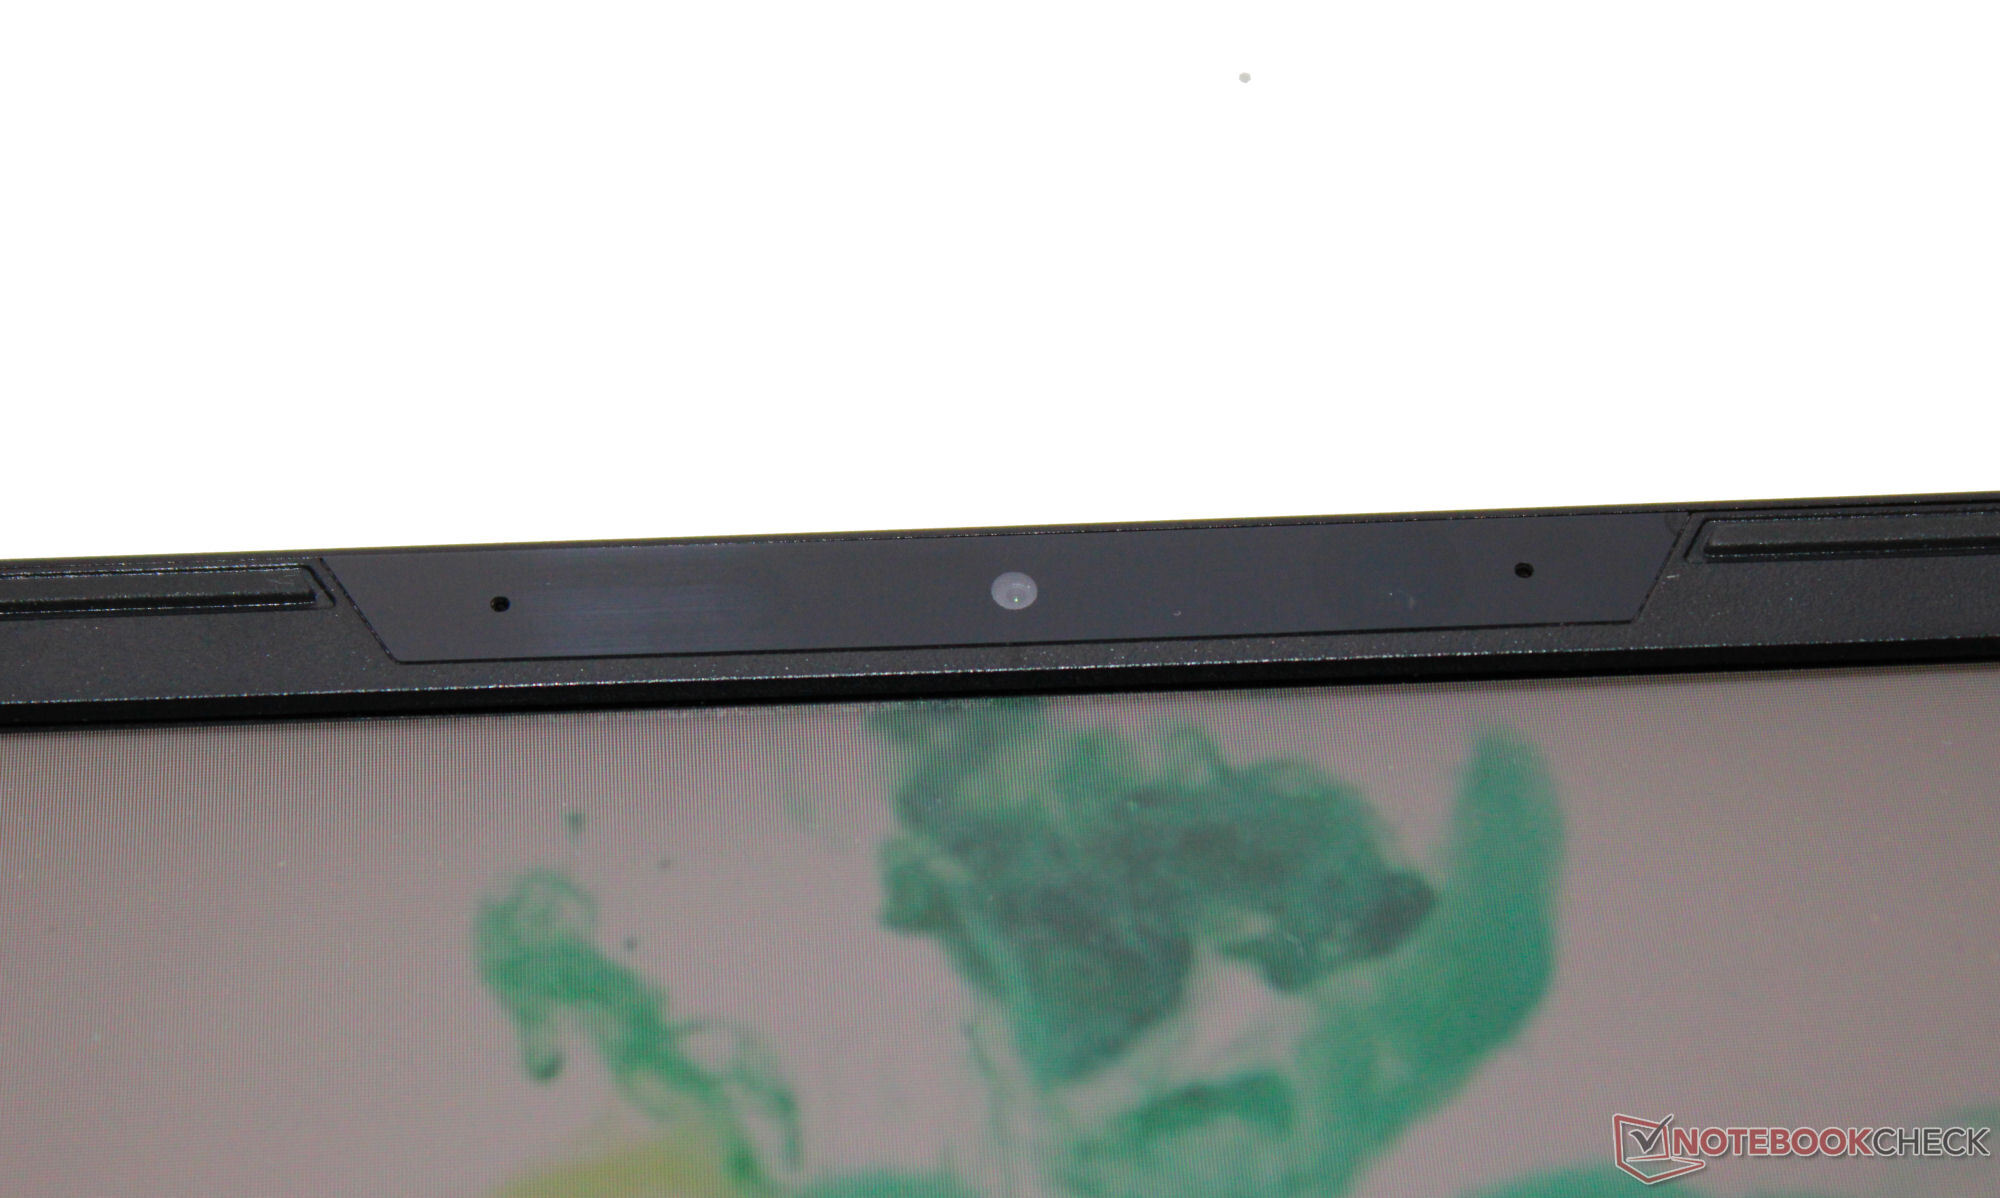
LAPAC71H'de üç adet USB-A (USB 3.2 Gen 1) ve bir adet USB-C (Thunderbolt 4/USB 4) portu bulunuyor. İkincisi Güç Dağıtımı'nı desteklemiyor ancak bir DisplayPort sinyali çıkışı sağlayabiliyor. Dizüstü bilgisayarın toplamda iki video çıkışı (1x HDMI, 1x DP) bulunuyor. Intel cihaza bir SD kart okuyucu vermemiş. Web kamerası (0,9 MP, maks. 1.280 x 720 piksel, kapaksız) oldukça standart sonuçlar veriyor.
Optimum koşullar altında (yakın çevrede WiFi cihazı yok, dizüstü bilgisayar ile sunucu bilgisayar arasında kısa mesafe), mükemmel WiFi veri hızlarına ulaşabilir. Dizüstü bilgisayar bir WiFi 6E yongası (Intel AX201) kullanıyor. Kablolu bağlantılar da bir Intel denetleyici (I225-V; 2,5 GBit/s) tarafından gerçekleştiriliyor.
| Networking | |
| iperf3 transmit AXE11000 | |
| Gigabyte G5 KE | |
| MSI Cyborg 15 A12VF | |
| Intel NUC X15 LAPAC71H | |
| Asus VivoBook Pro 16 | |
| Sınıf ortalaması Multimedia (606 - 1978, n=53, son 2 yıl) | |
| Ortalama Intel Wi-Fi 6 AX201 (438 - 1715, n=74) | |
| Dell Inspiron 16 Plus 7630 | |
| Asus TUF A15 FA507 | |
| iperf3 receive AXE11000 | |
| Gigabyte G5 KE | |
| MSI Cyborg 15 A12VF | |
| Intel NUC X15 LAPAC71H | |
| Ortalama Intel Wi-Fi 6 AX201 (390 - 1734, n=79) | |
| Sınıf ortalaması Multimedia (682 - 1818, n=53, son 2 yıl) | |
| Dell Inspiron 16 Plus 7630 | |
| Asus TUF A15 FA507 | |
| iperf3 transmit AXE11000 6GHz | |
| Dell Inspiron 16 Plus 7630 | |
| Sınıf ortalaması Multimedia (869 - 2373, n=23, son 2 yıl) | |
| Ortalama Intel Wi-Fi 6 AX201 (745 - 1252, n=3) | |
| iperf3 receive AXE11000 6GHz | |
| Asus VivoBook Pro 16 | |
| Sınıf ortalaması Multimedia (1212 - 2361, n=23, son 2 yıl) | |
| Dell Inspiron 16 Plus 7630 | |
| Ortalama Intel Wi-Fi 6 AX201 (390 - 1670, n=3) | |


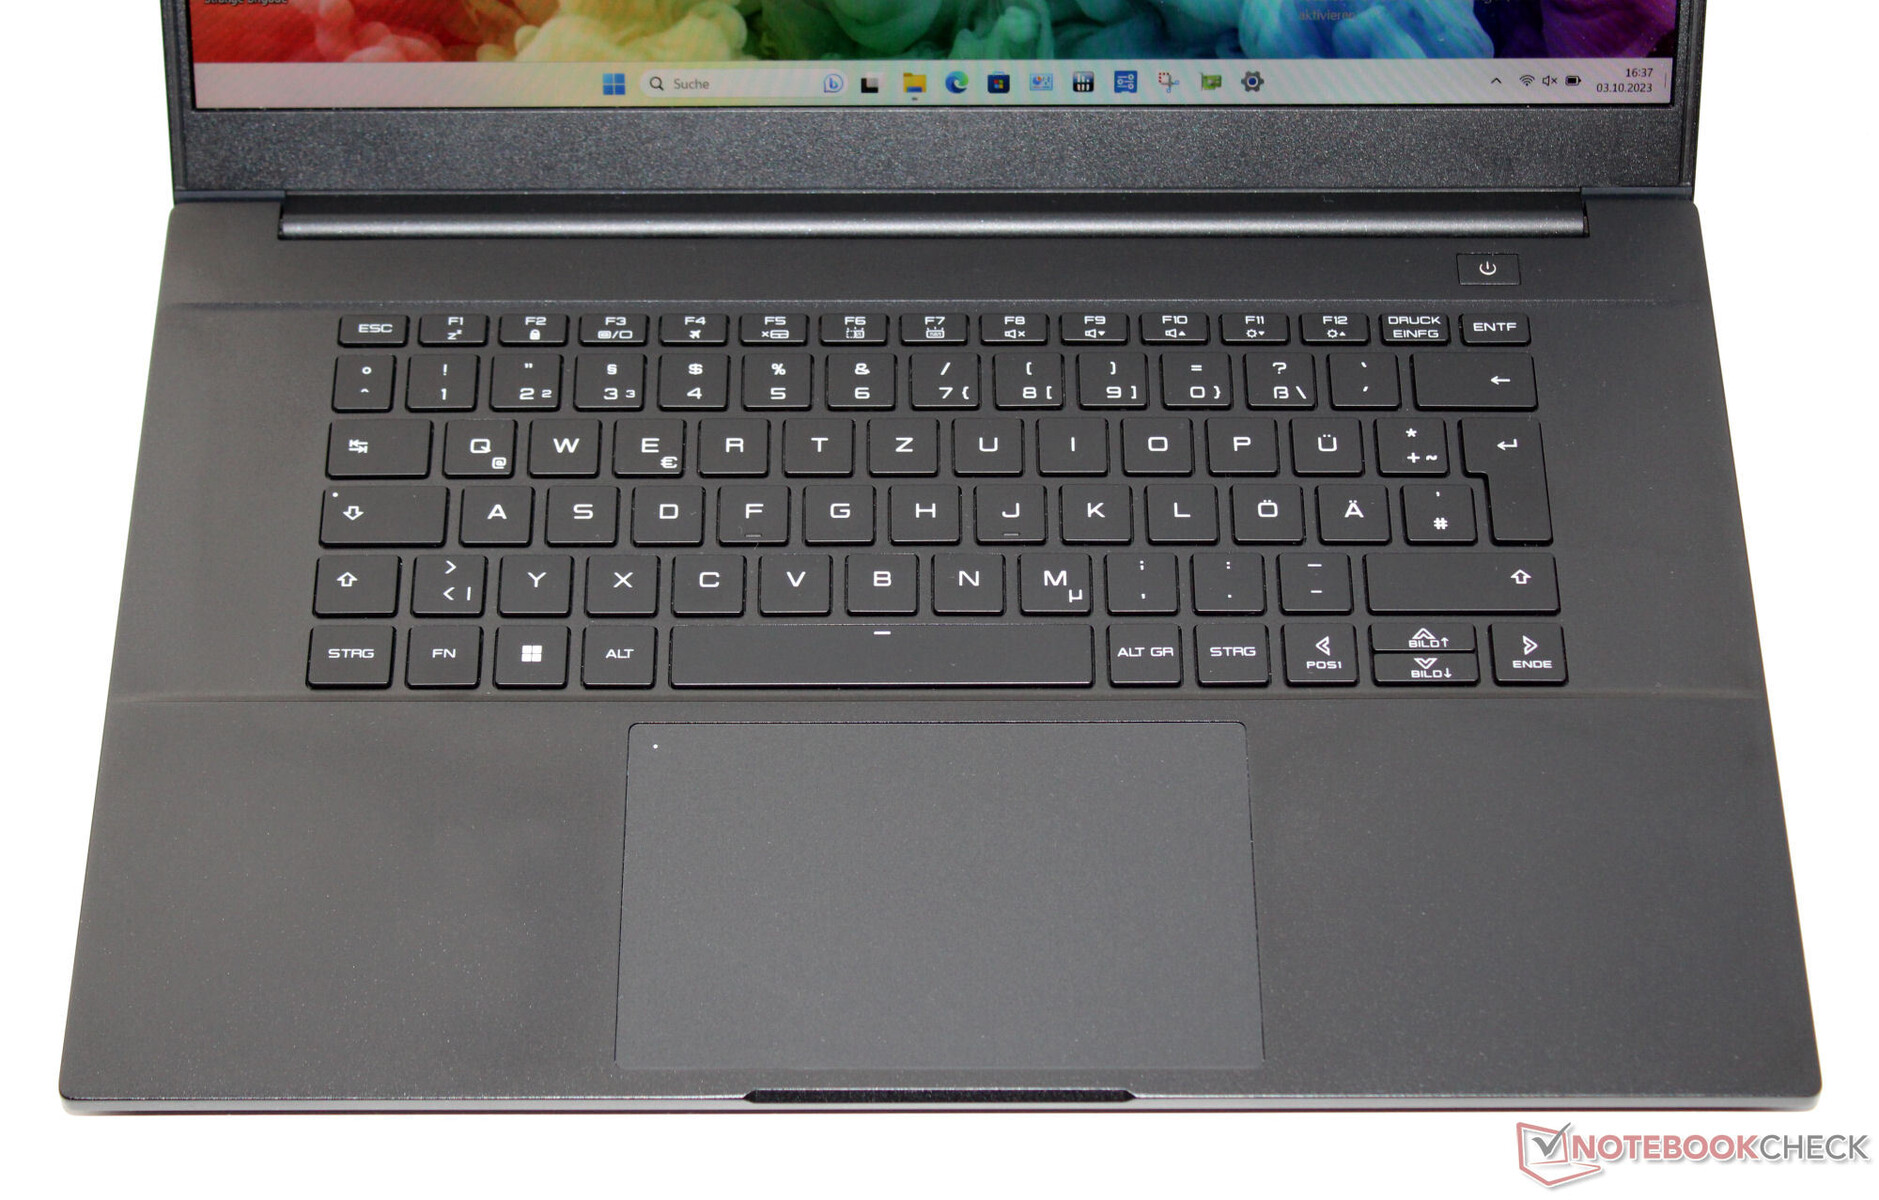
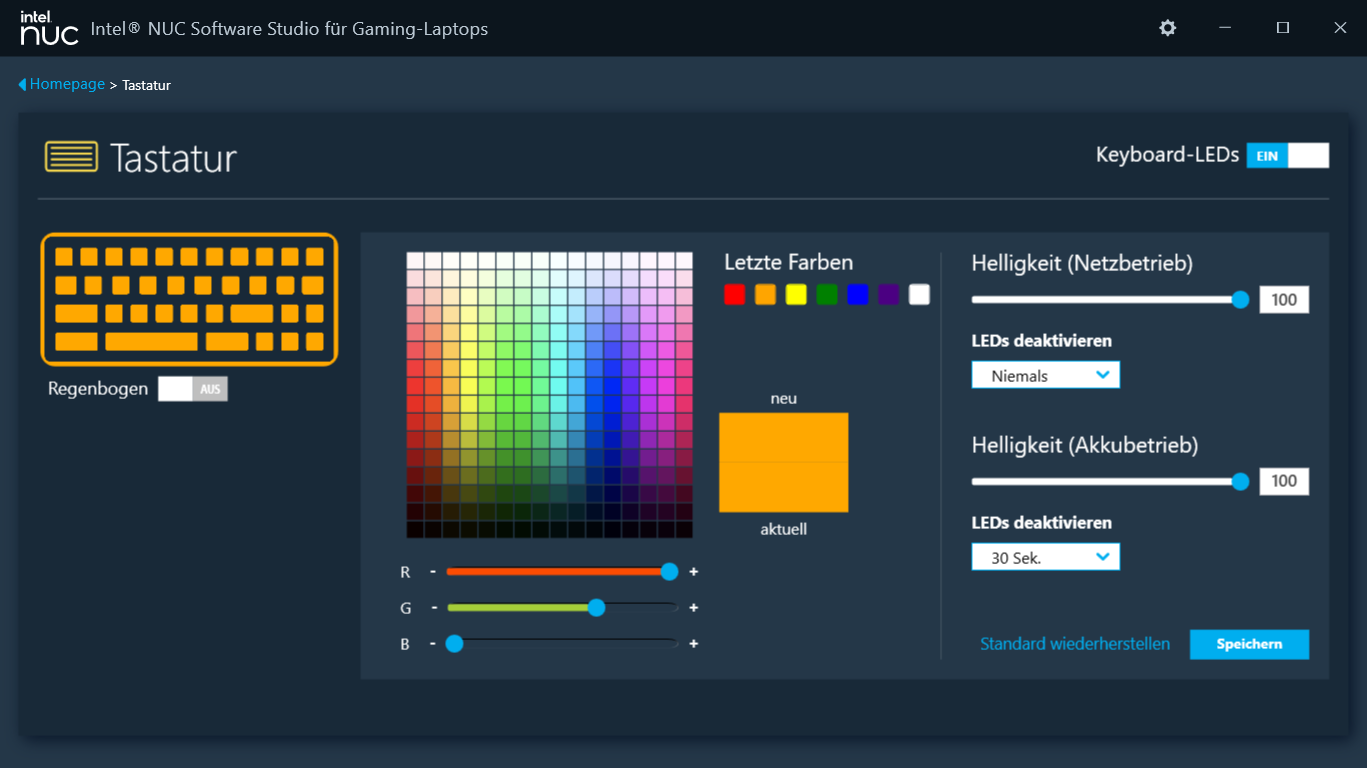
Giriş cihazları - RGB aydınlatmalı bir klavye
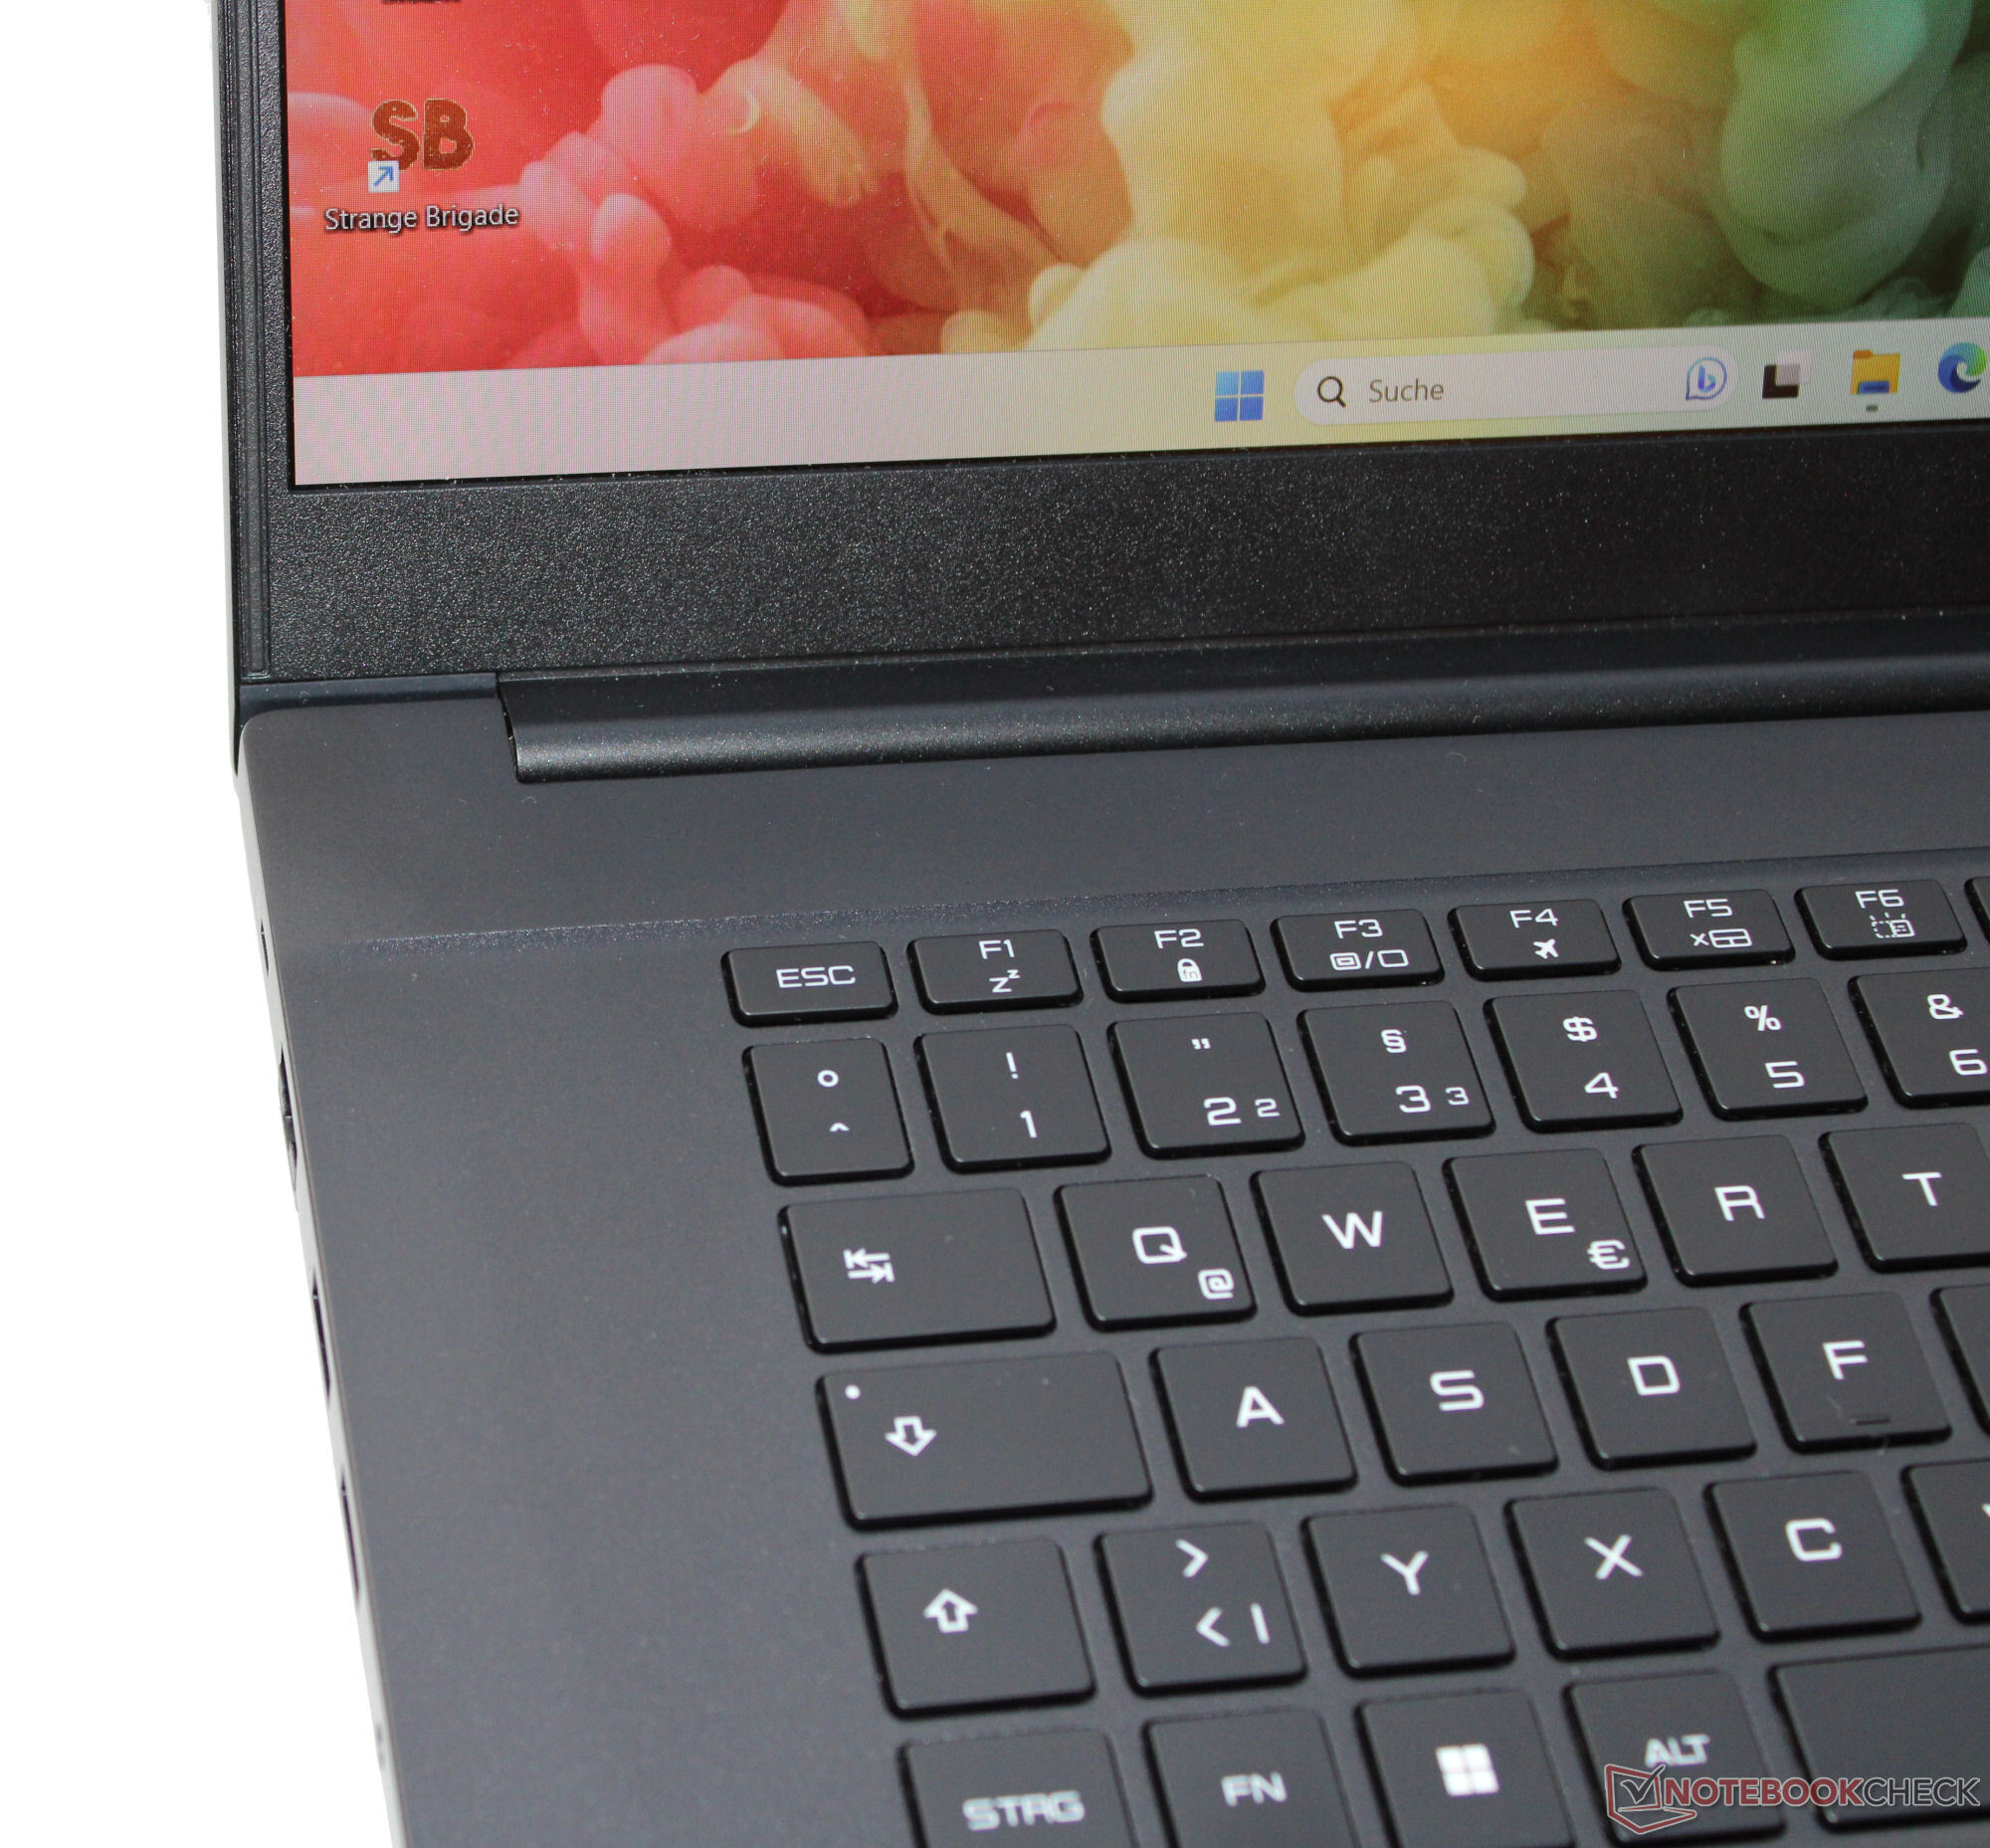
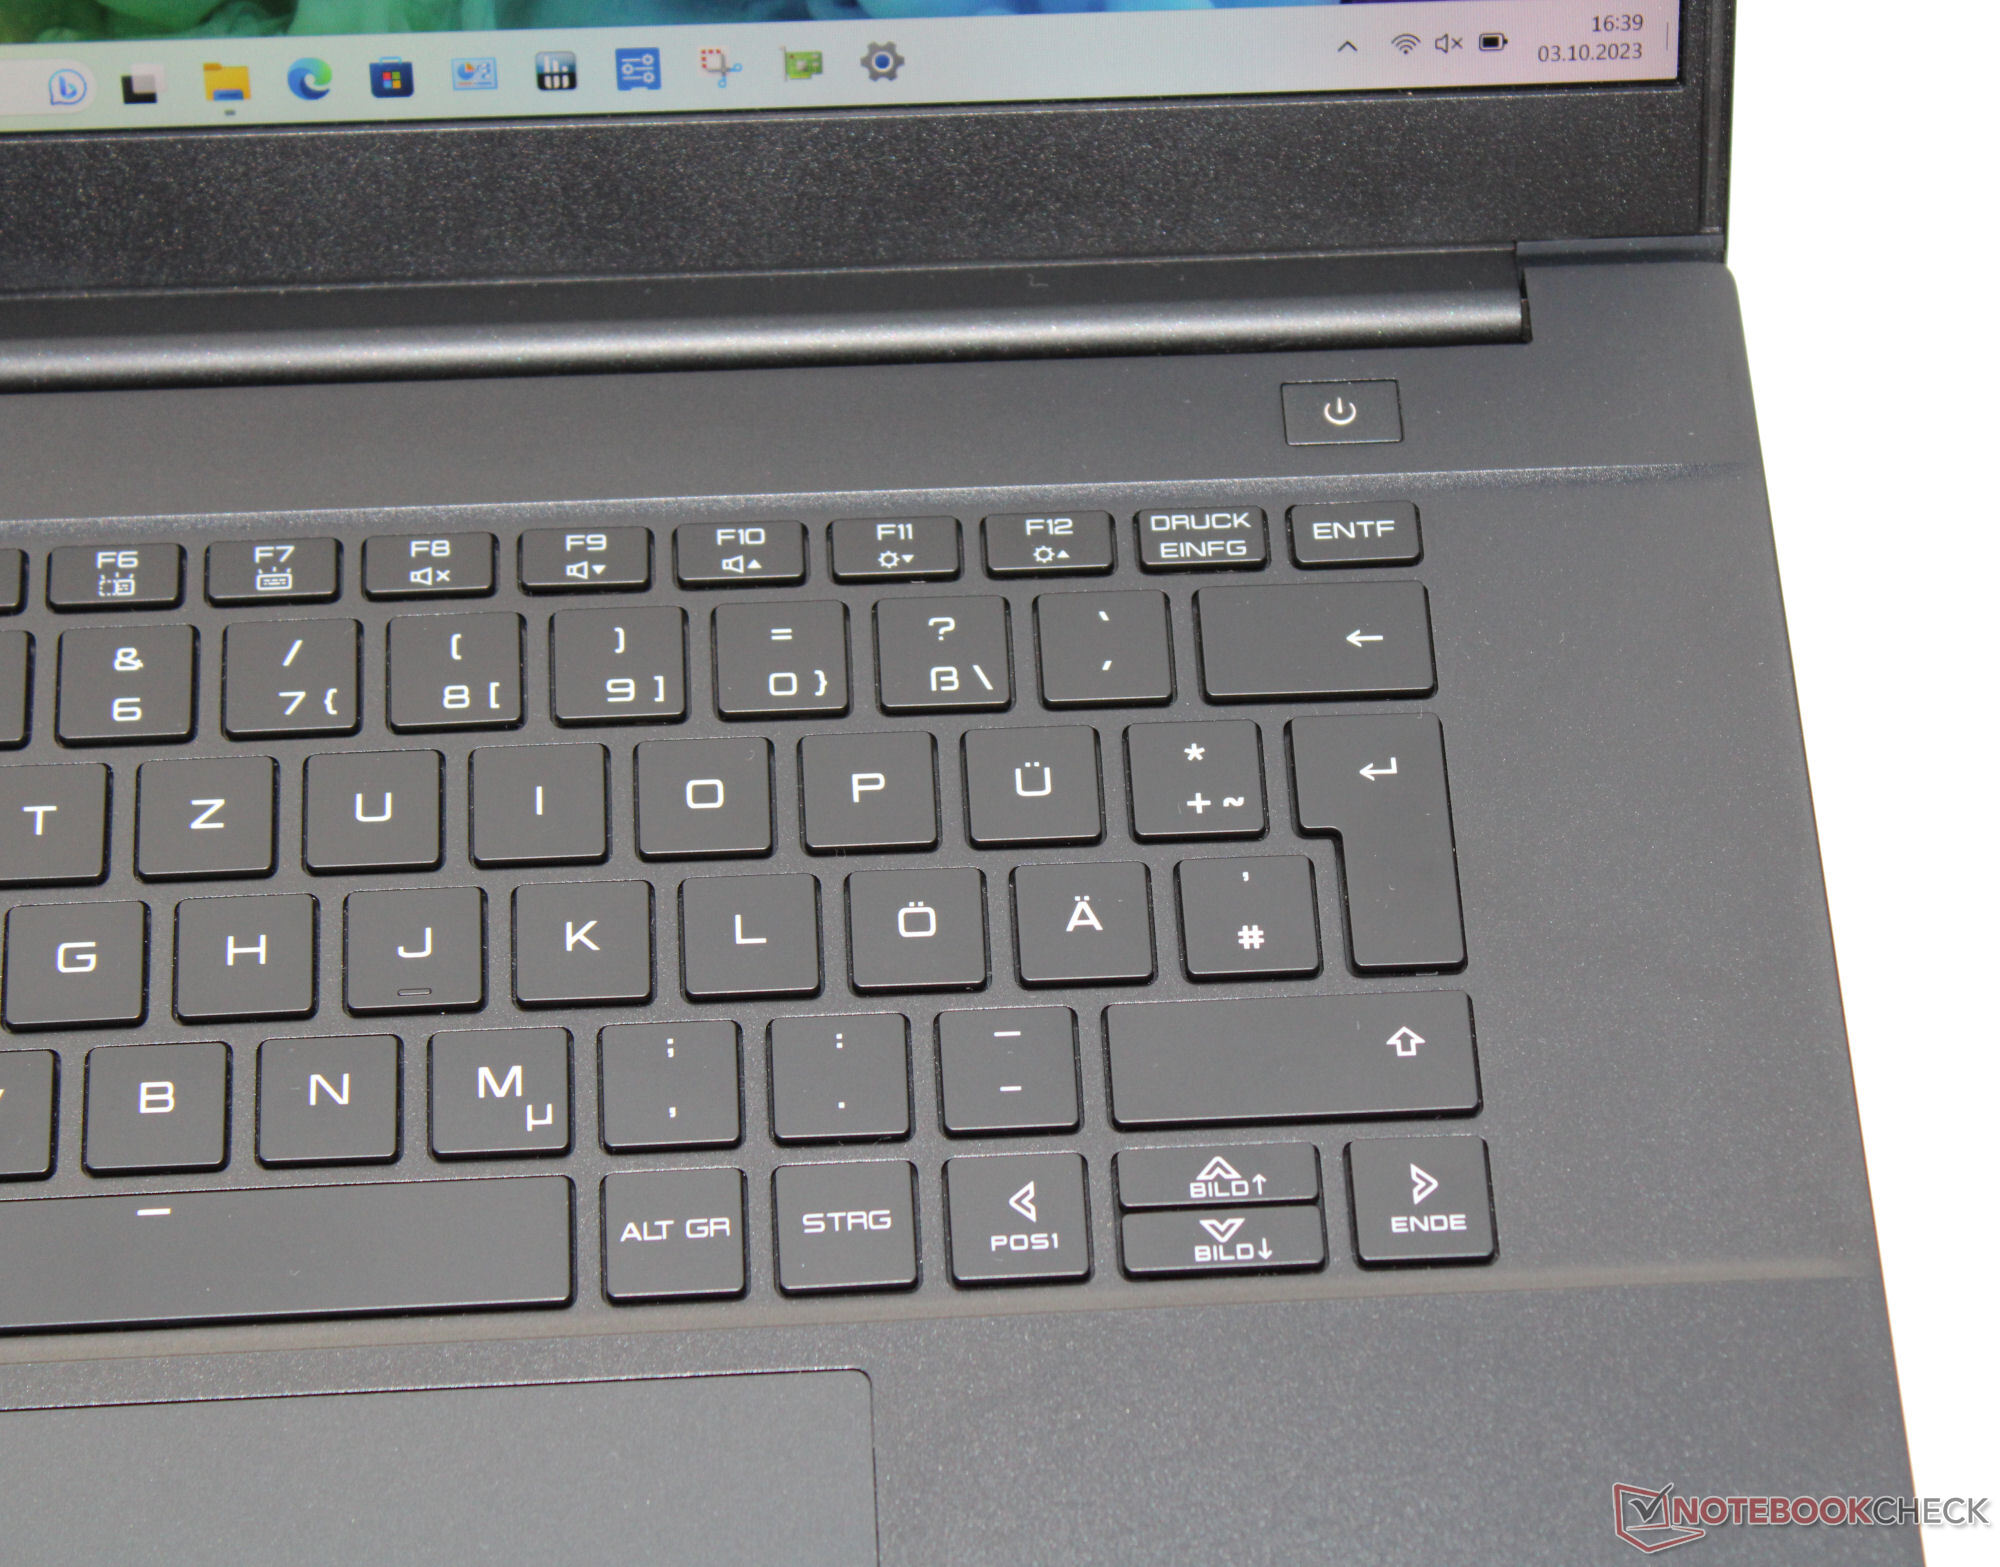
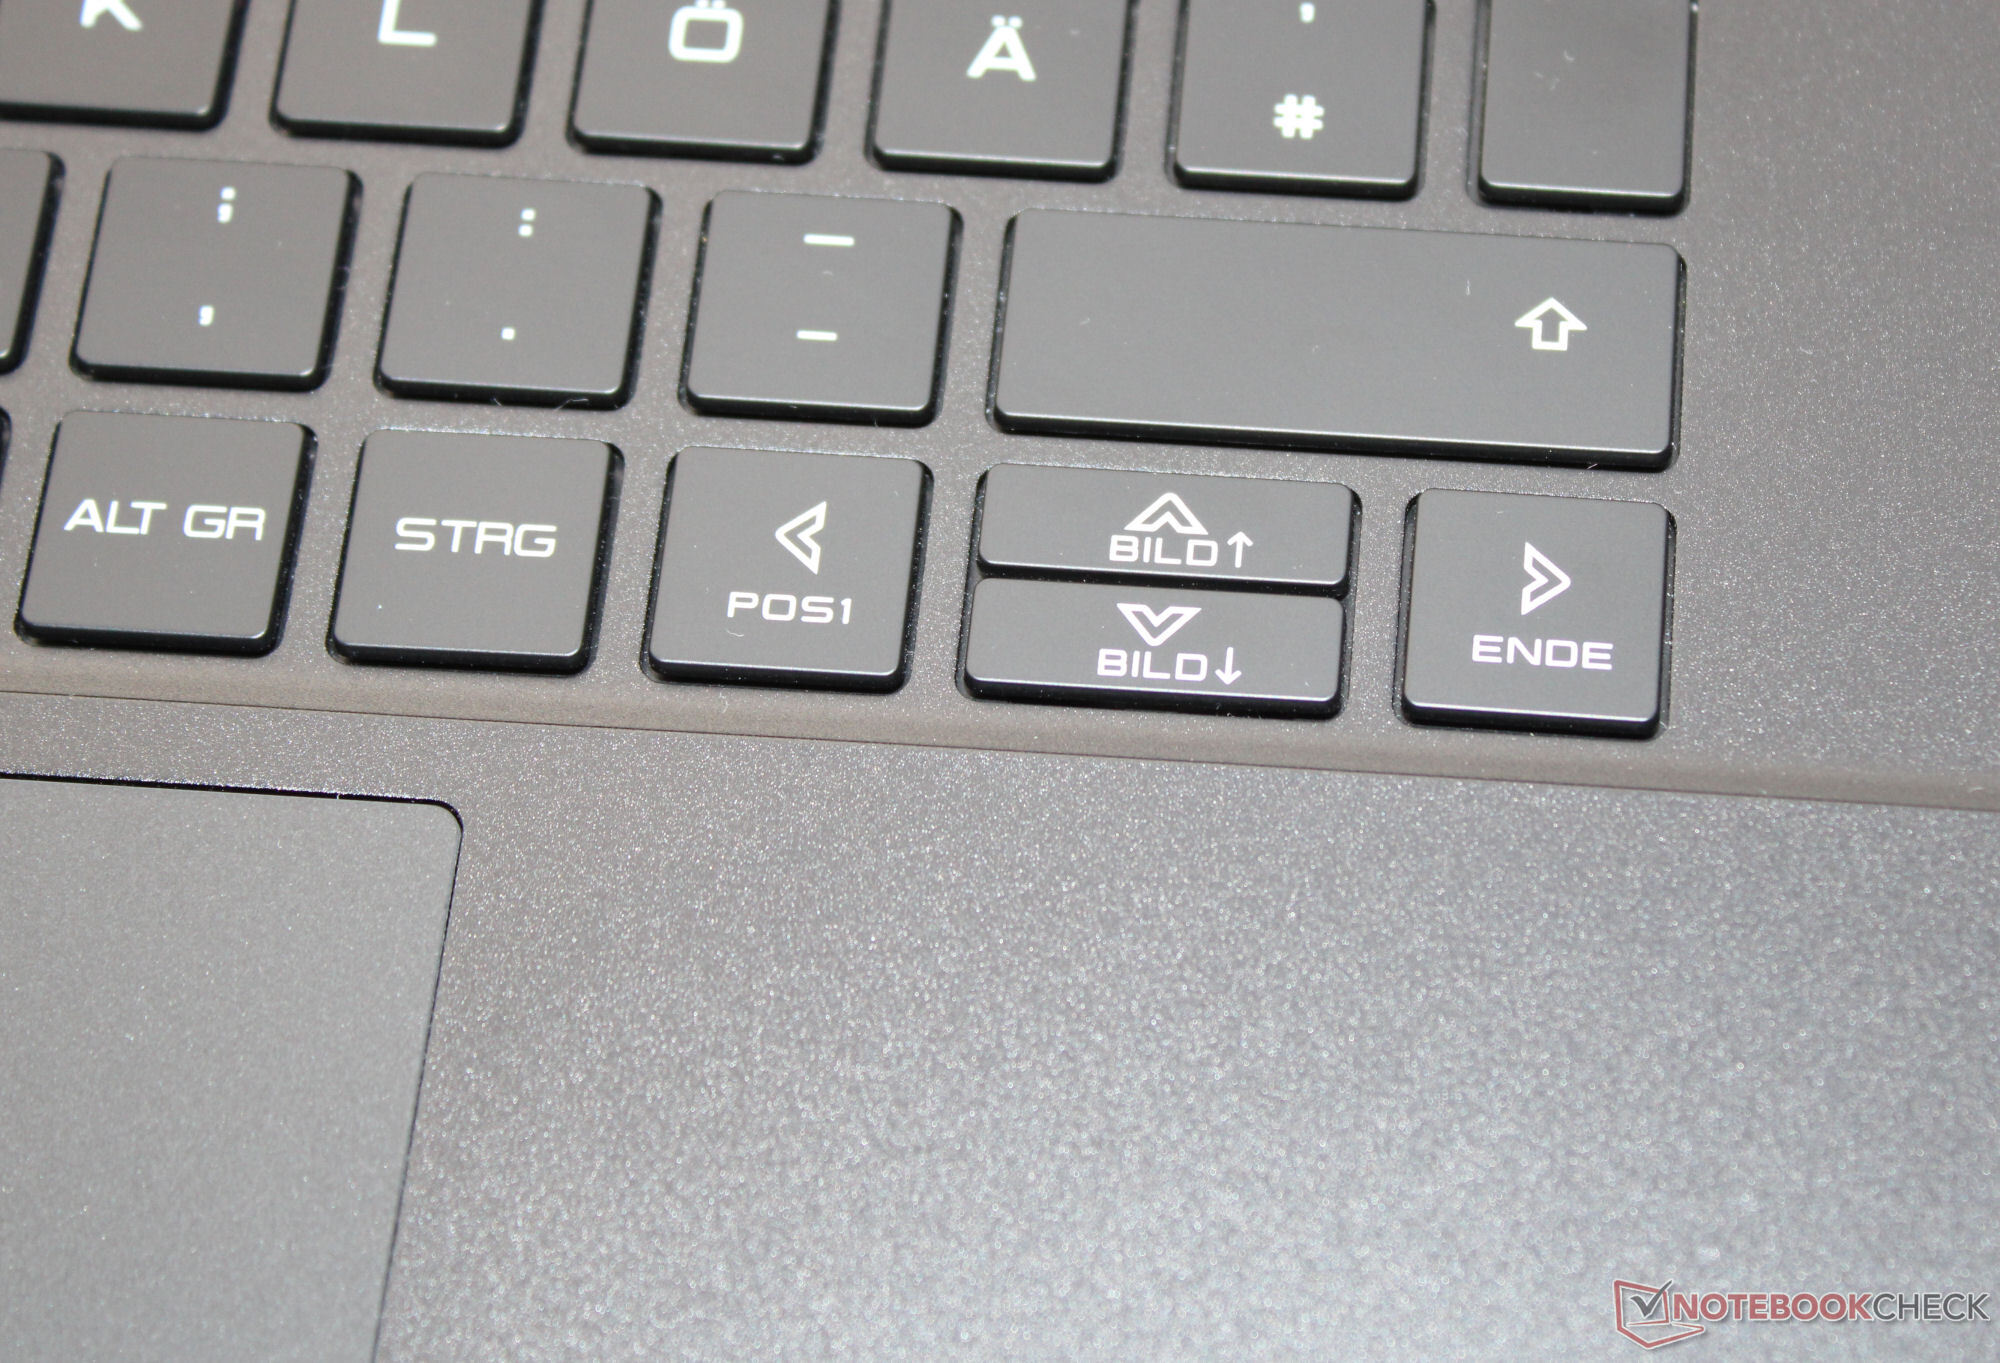
Dizüstü bilgisayarın chiclet klavyesinde (RGB aydınlatmalı), yeterli alan olmasına rağmen sayısal tuş takımı bulunmuyor. Düzgün, pürüzsüz tuşları orta bir kaldırma ve net bir basınç noktasına sahiptir. Tuş direnci biraz daha net olabilirdi. Klavye üzerinde yazarken eğilme yapmıyor. Toplamda Intel, günlük kullanıma uygun bir klavye sunmuştur. Fare yerine bir clickpad (yaklaşık 13,3 x 8,3 cm) takılmıştır ve kısa bir kaldırma ve net bir basınç noktasına sahiptir.
Ekran - LAPAC71H yüksek kontrastlı bir FHD panele sahiptir
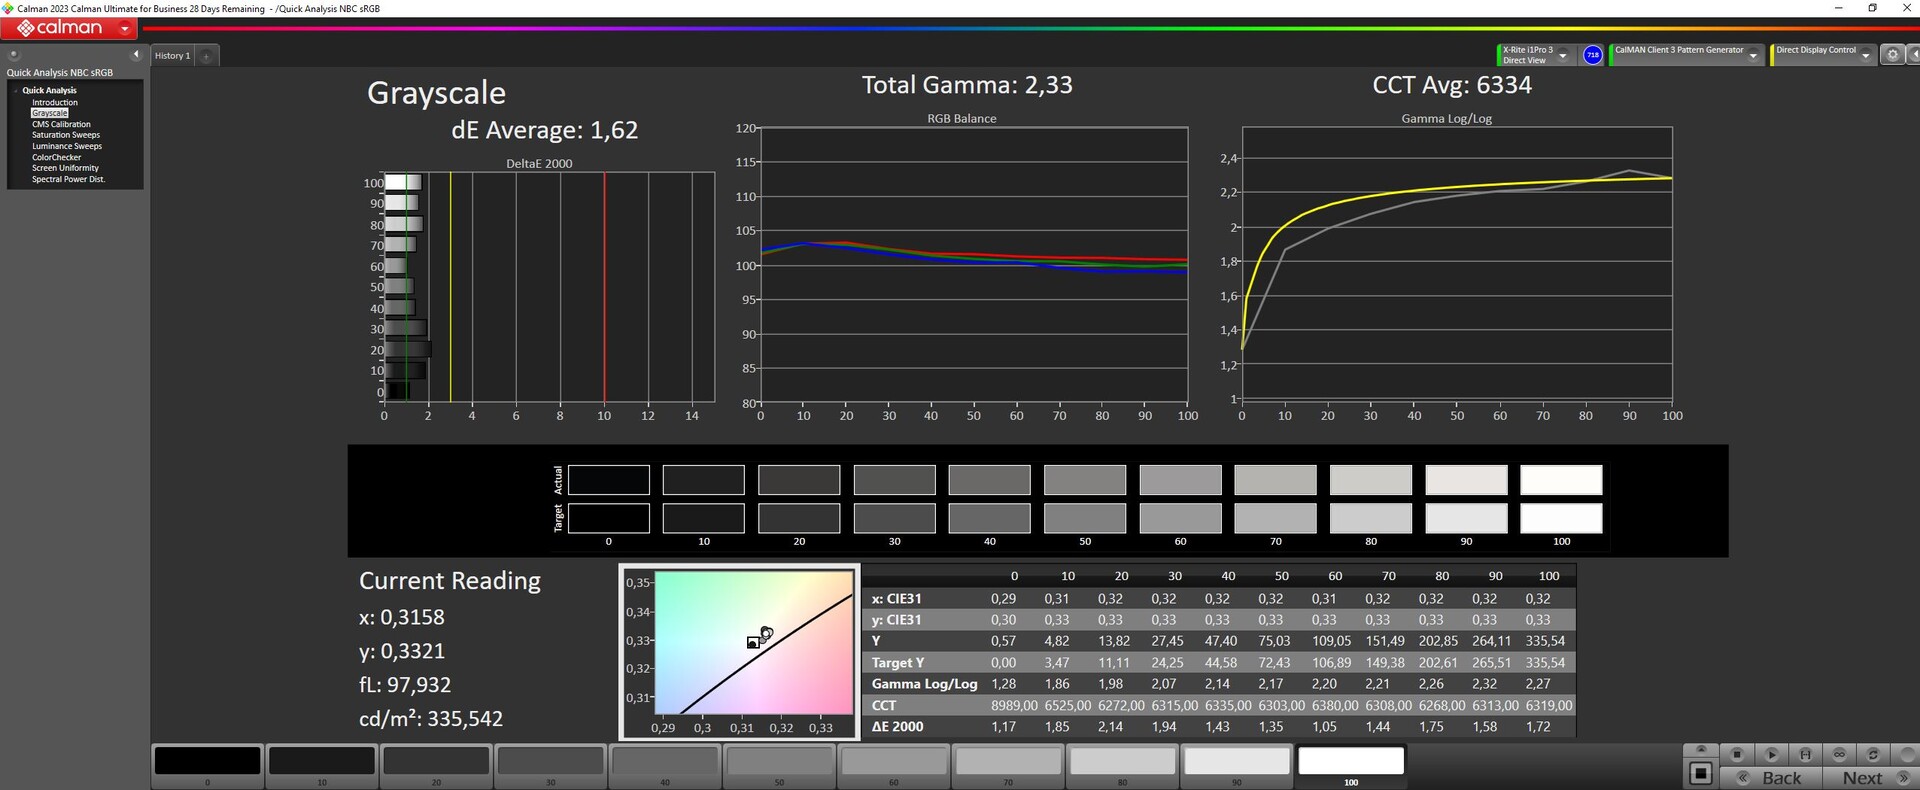
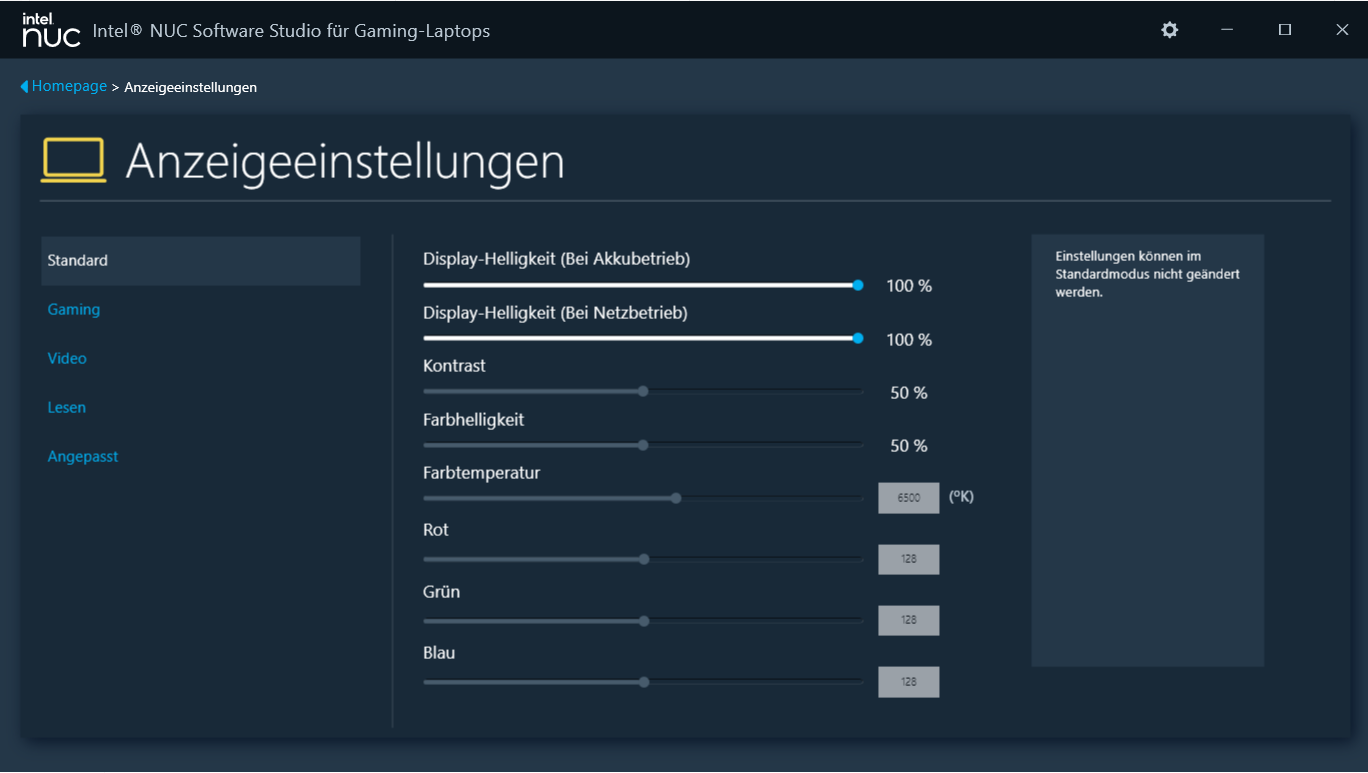
16:9 en boy oranına sahip hızlı tepki veren 144 Hz panel, hiçbir parlaklık seviyesinde PWM titremesi göstermez. 15,6 inç ekranın (1.920 x 1.080 piksel) parlaklık ve kontrast hedefleri tutturulmuştur (> 300 cd/m² ve 1.000:1). Nispeten yüksek kontrast değeri de belirtilmeyi hak ediyor. Diğer ekran seçenekleri mevcut değil.
| |||||||||||||||||||||||||
Aydınlatma: 86 %
Batarya modunda parlaklık: 366 cd/m²
Kontrast: 2147:1 (Siyah: 0.17 cd/m²)
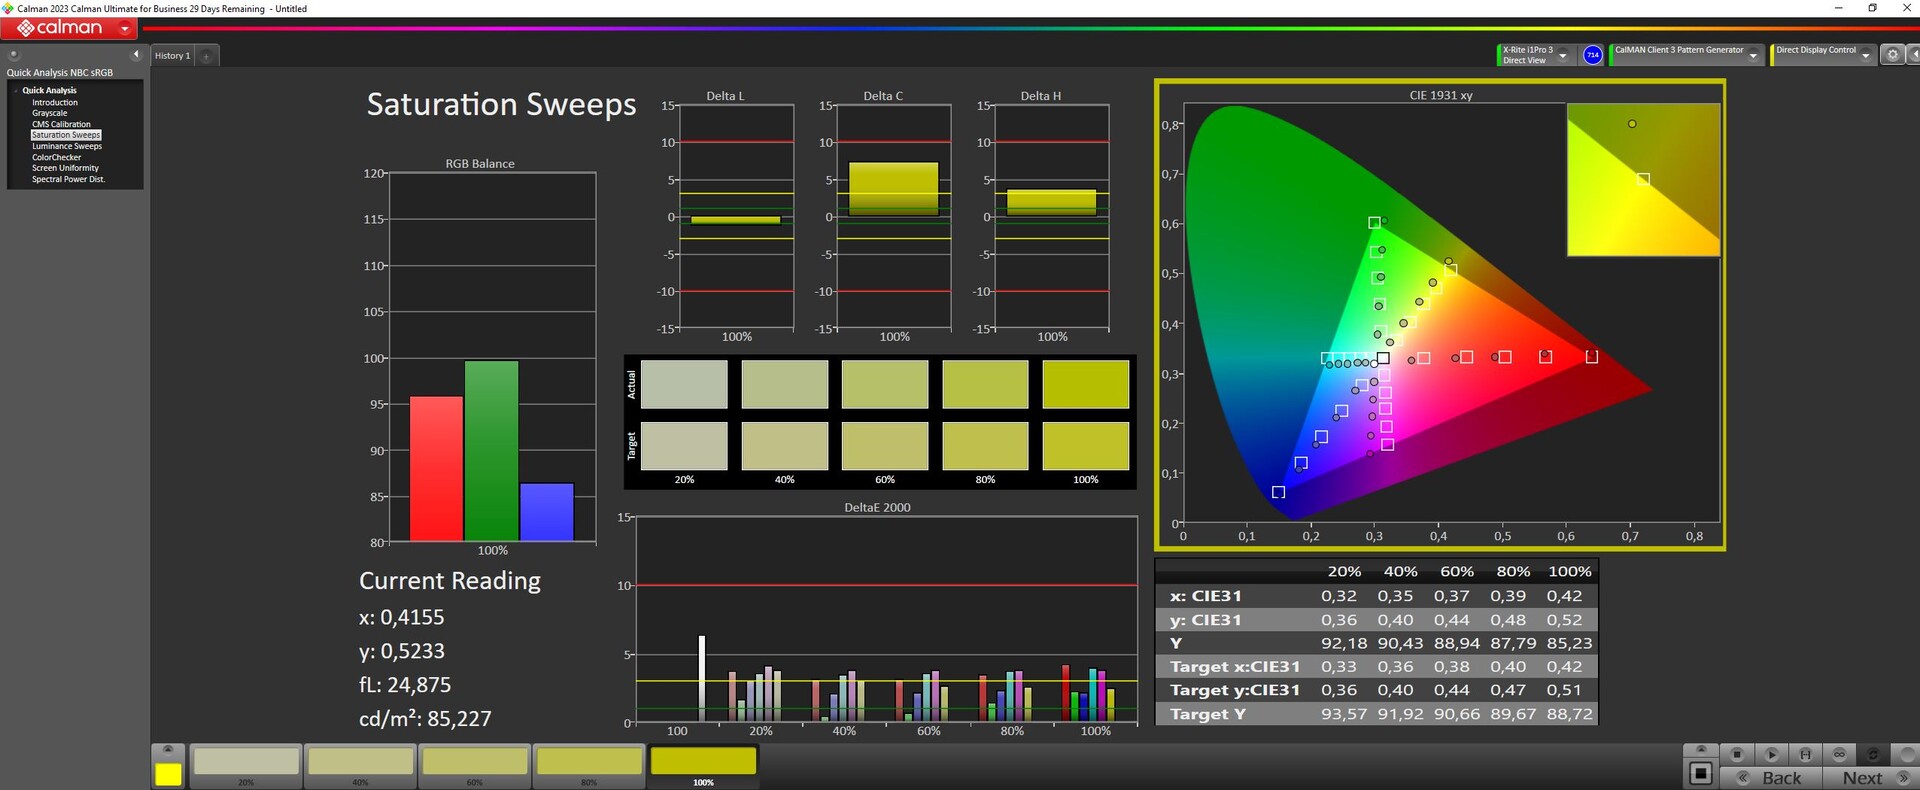
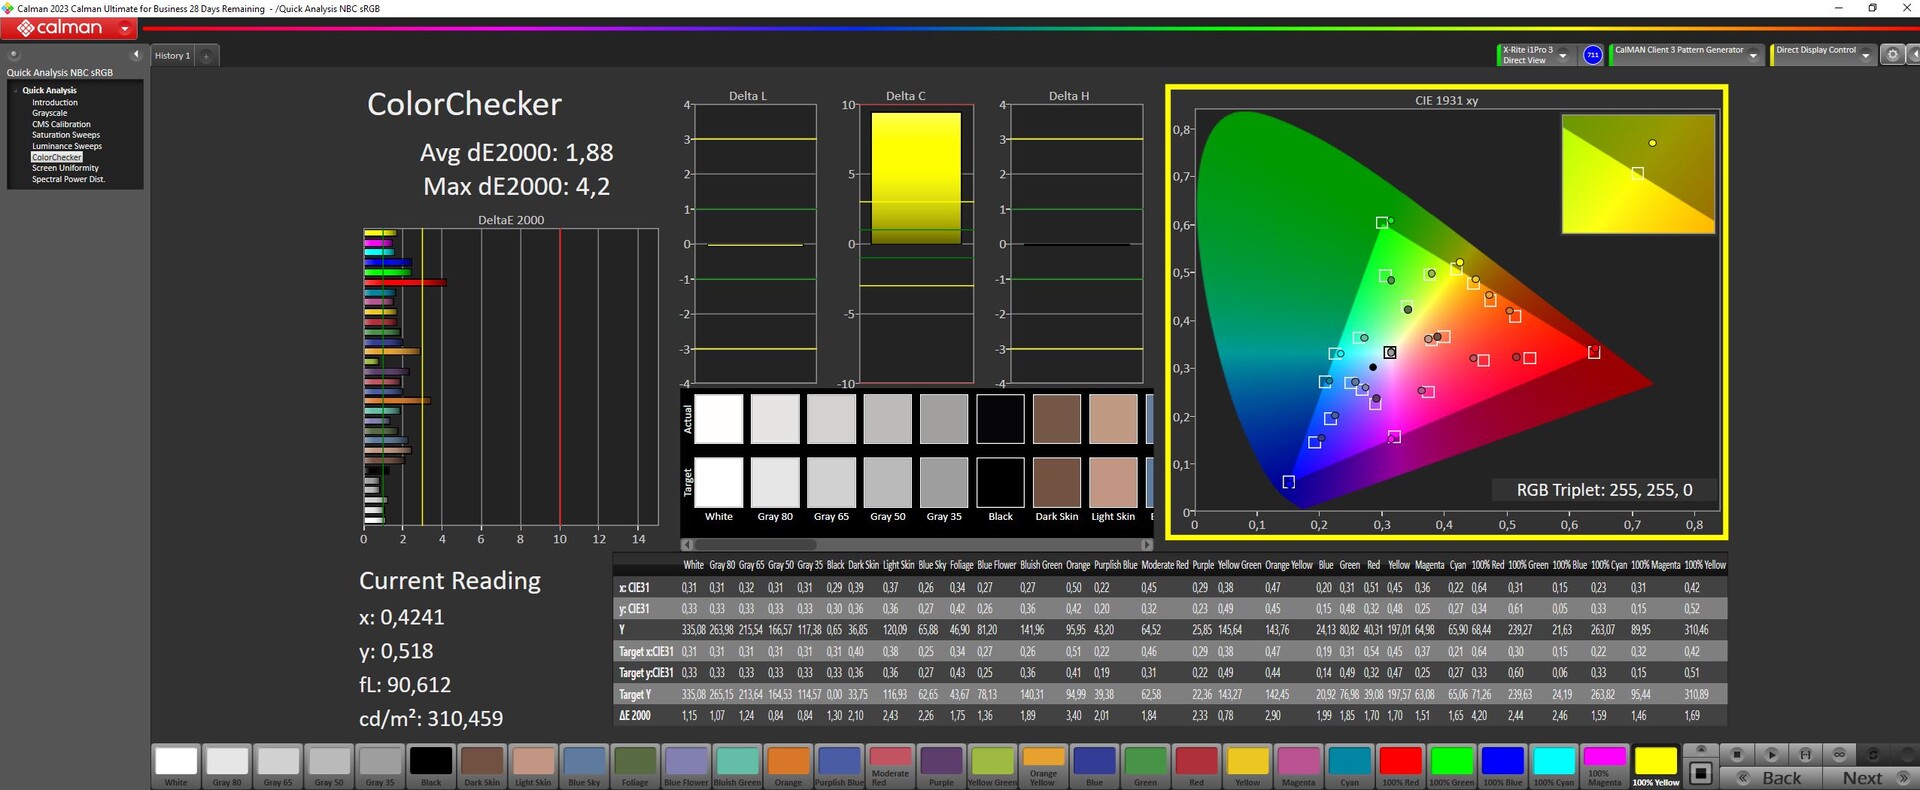
ΔE ColorChecker Calman: 3.51 | ∀{0.5-29.43 Ø4.71}
calibrated: 1.88
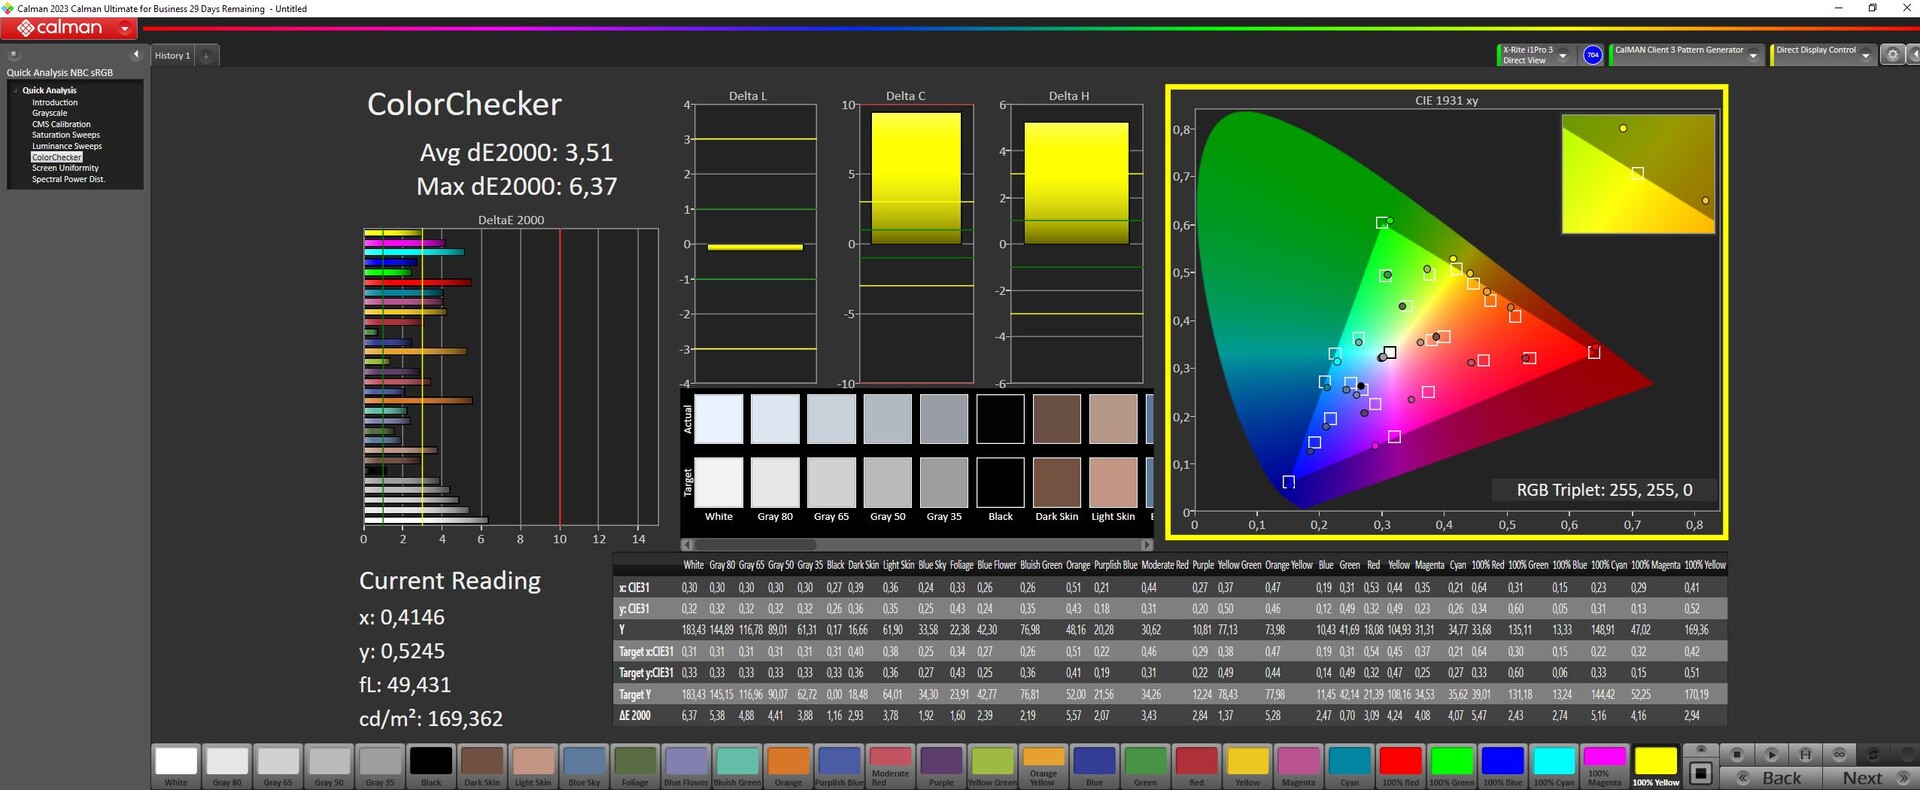
ΔE Greyscale Calman: 3.83 | ∀{0.09-98 Ø4.96}
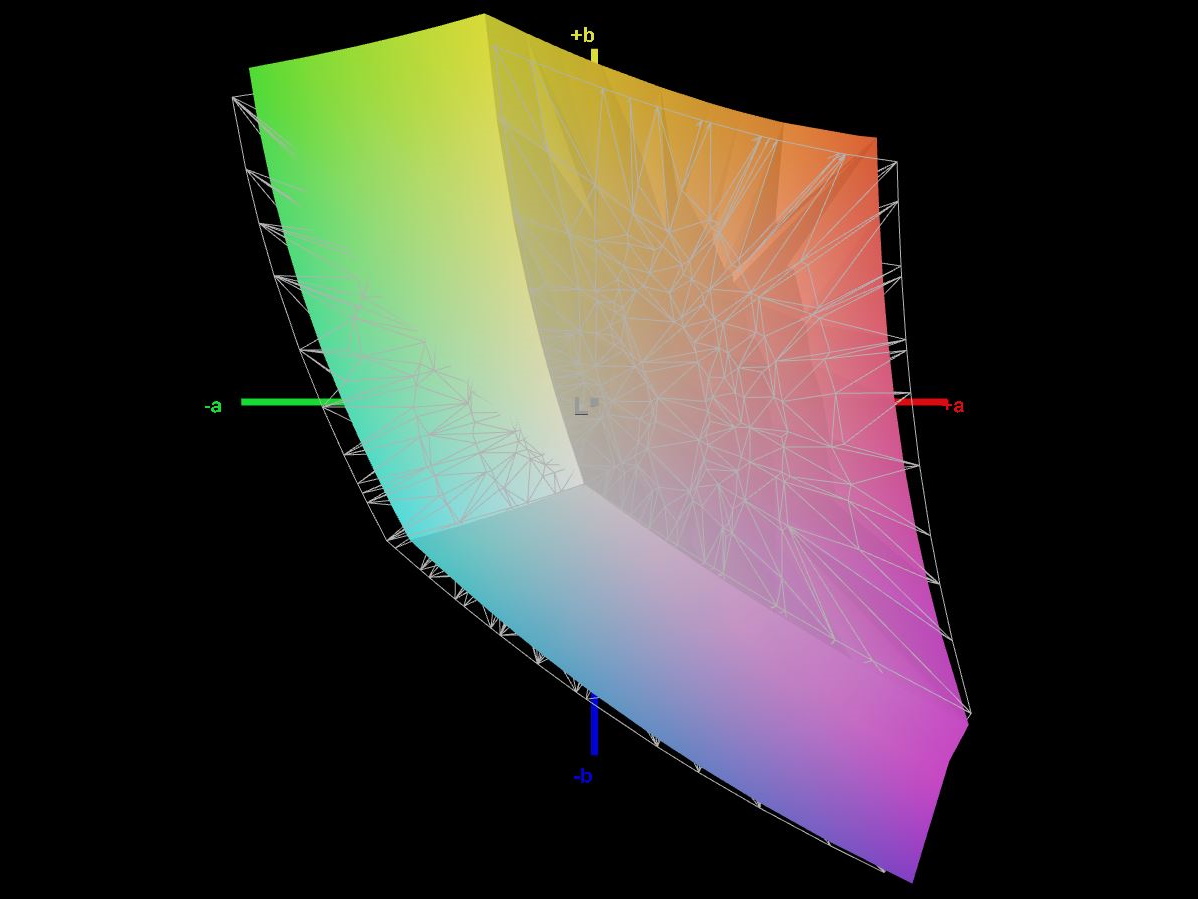
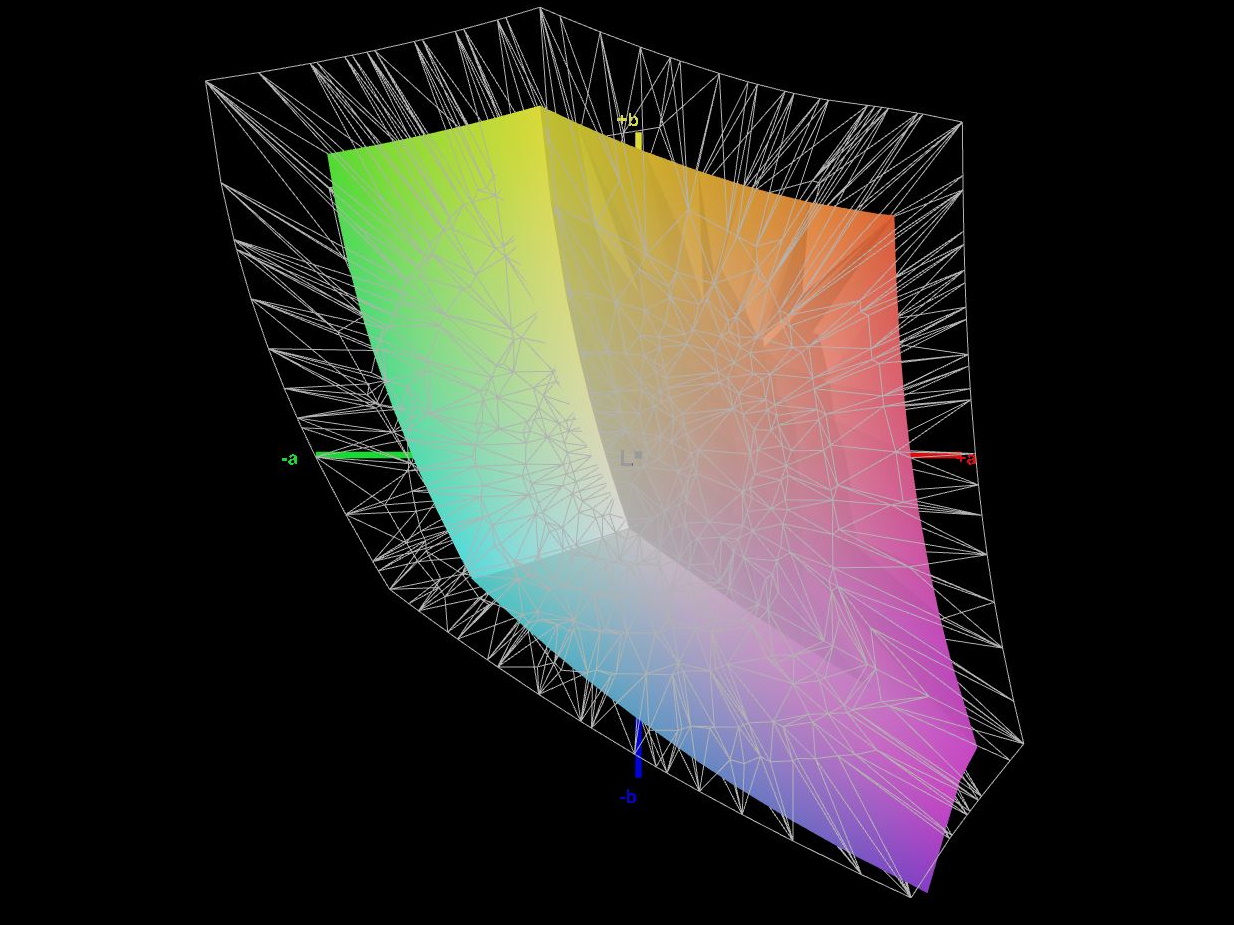
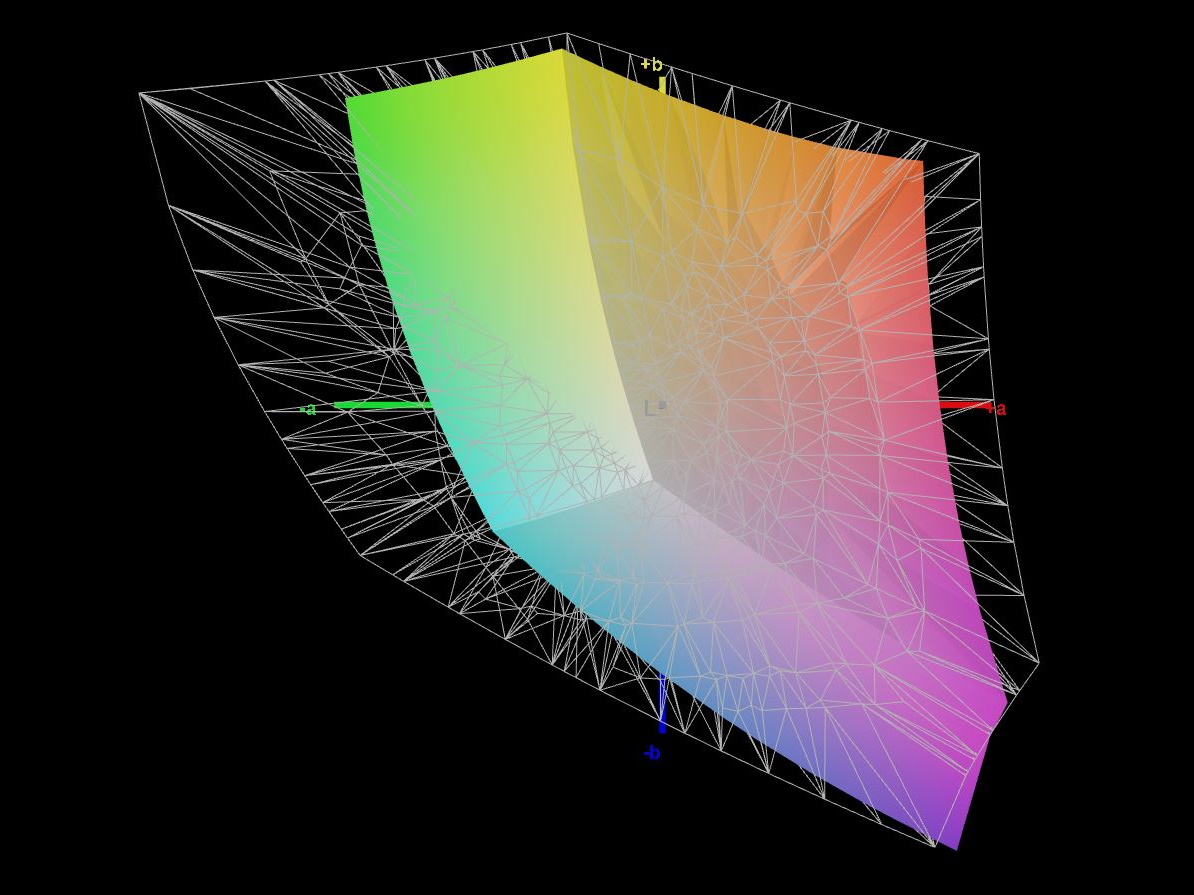
66.3% AdobeRGB 1998 (Argyll 3D)
92.6% sRGB (Argyll 3D)
64.9% Display P3 (Argyll 3D)
Gamma: 2.47
CCT: 7362 K
| Intel NUC X15 LAPAC71H BOE HF NV156FHM-N4G, IPS, 1920x1080, 15.6" | Asus TUF A15 FA507 N156HMA-GA1, IPS, 1920x1080, 15.6" | Gigabyte G5 KE Chi Mei N156HRA-EA1, IPS, 1920x1080, 15.6" | Dell Inspiron 16 Plus 7630 LG Philips 160WQ2, IPS, 2560x1600, 16" | Asus VivoBook Pro 16 Au Optronics B160QAN02.L, IPS, 2560x1600, 16" | MSI Cyborg 15 A12VF AU Optronics B156HAN15.1, IPS, 1920x1080, 15.6" | |
|---|---|---|---|---|---|---|
| Display | 1% | -36% | 8% | 30% | -34% | |
| Display P3 Coverage (%) | 64.9 | 64.9 0% | 40.7 -37% | 70.1 8% | 98.5 52% | 42.3 -35% |
| sRGB Coverage (%) | 92.6 | 96.5 4% | 61 -34% | 99.6 8% | 99.9 8% | 62.6 -32% |
| AdobeRGB 1998 Coverage (%) | 66.3 | 66.6 0% | 42.1 -37% | 72.3 9% | 86.1 30% | 43.7 -34% |
| Response Times | -238% | -199% | -291% | 32% | -137% | |
| Response Time Grey 50% / Grey 80% * (ms) | 7.8 ? | 30.4 ? -290% | 26.64 ? -242% | 35 ? -349% | 2 ? 74% | 22 ? -182% |
| Response Time Black / White * (ms) | 7.3 ? | 20.8 ? -185% | 18.65 ? -155% | 24.2 ? -232% | 8 ? -10% | 14 ? -92% |
| PWM Frequency (Hz) | ||||||
| Screen | 13% | -67% | -10% | 5% | -27% | |
| Brightness middle (cd/m²) | 365 | 288 -21% | 269 -26% | 299.4 -18% | 504 38% | 247 -32% |
| Brightness (cd/m²) | 356 | 271 -24% | 248 -30% | 290 -19% | 465 31% | 234 -34% |
| Brightness Distribution (%) | 86 | 91 6% | 85 -1% | 92 7% | 87 1% | 89 3% |
| Black Level * (cd/m²) | 0.17 | 0.17 -0% | 0.5 -194% | 0.21 -24% | 0.35 -106% | 0.25 -47% |
| Contrast (:1) | 2147 | 1694 -21% | 538 -75% | 1426 -34% | 1440 -33% | 988 -54% |
| Colorchecker dE 2000 * | 3.51 | 1.9 46% | 4.54 -29% | 4.25 -21% | 1.83 48% | 3.78 -8% |
| Colorchecker dE 2000 max. * | 6.37 | 3.3 48% | 17.28 -171% | 6.71 -5% | 5.51 14% | 6.42 -1% |
| Colorchecker dE 2000 calibrated * | 1.88 | 0.9 52% | 3.34 -78% | 0.52 72% | 1.34 29% | 3.94 -110% |
| Greyscale dE 2000 * | 3.83 | 2.7 30% | 3.8 1% | 5.5 -44% | 3.02 21% | 2.16 44% |
| Gamma | 2.47 89% | 2.32 95% | 2.17 101% | 2.35 94% | 2.39 92% | 2.33 94% |
| CCT | 7362 88% | 6535 99% | 7408 88% | 6368 102% | 6688 97% | 6906 94% |
| Toplam Ortalama (Program / Ayarlar) | -75% /
-25% | -101% /
-79% | -98% /
-46% | 22% /
14% | -66% /
-44% |
* ... daha küçük daha iyidir
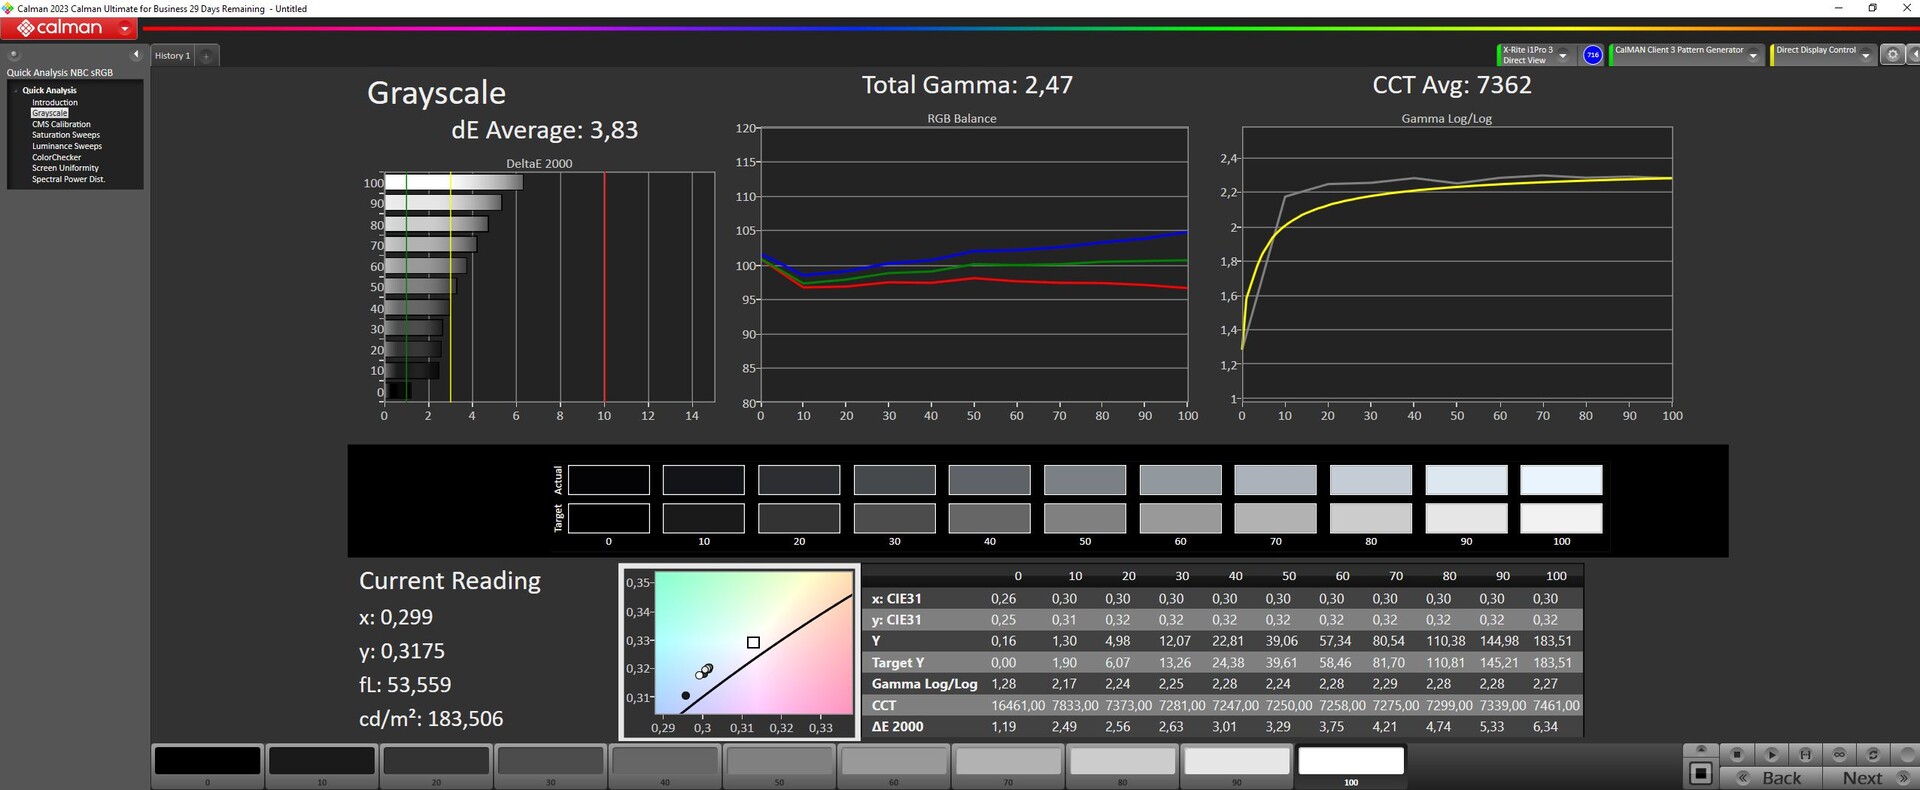
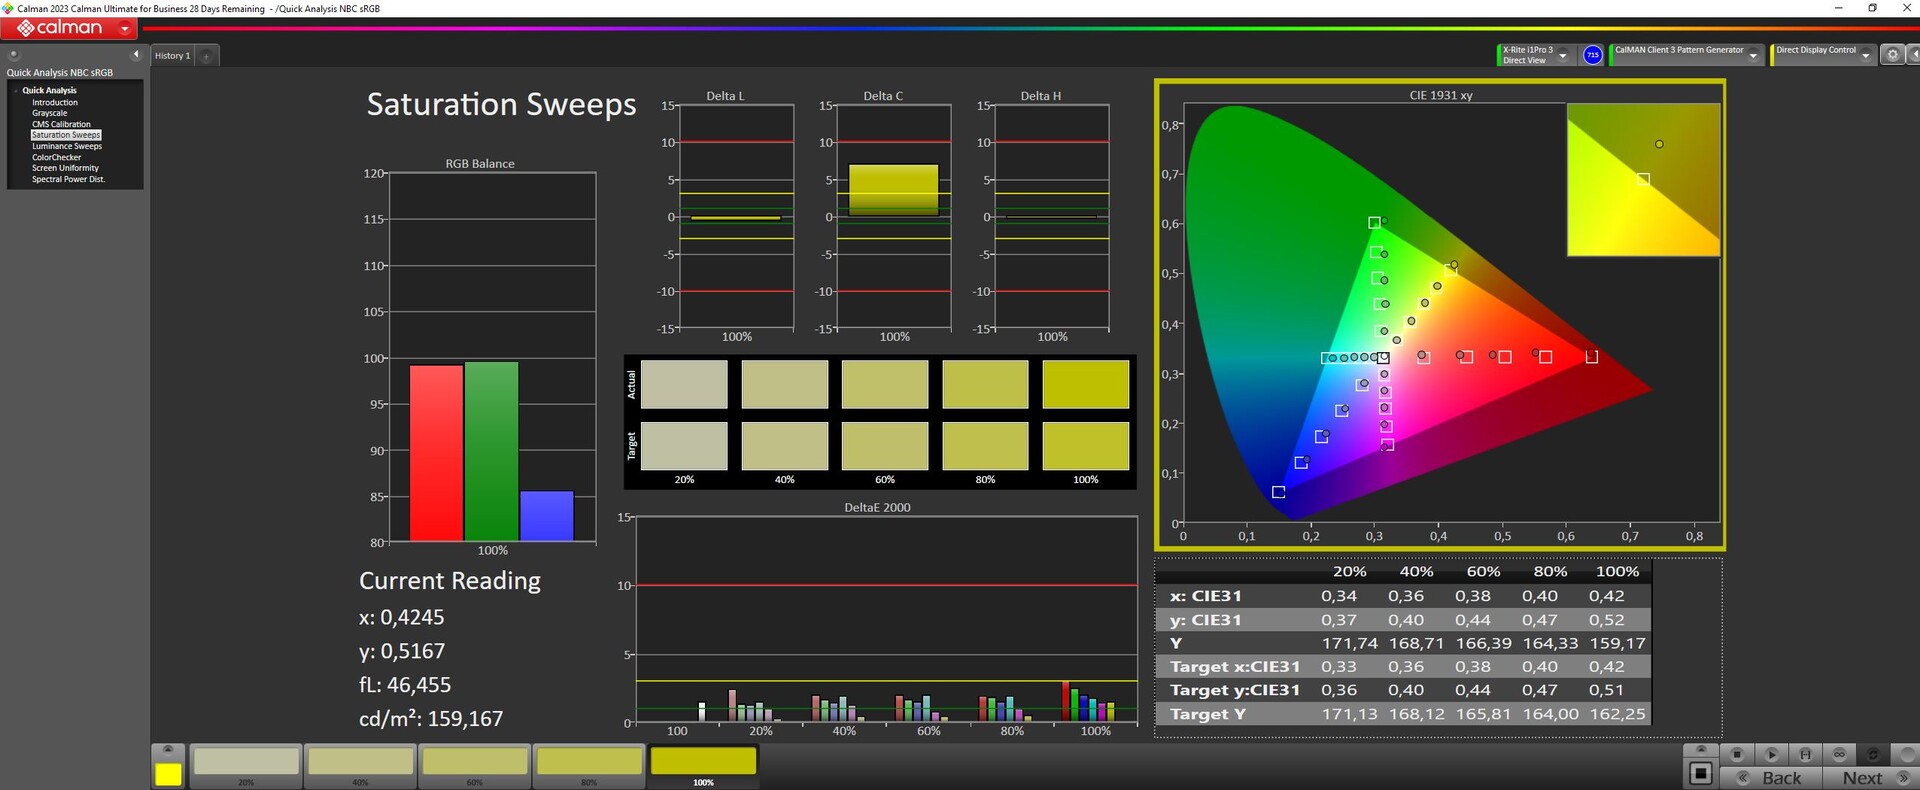
Eski çalışmalarda, ekran nispeten iyi renk tasviri gösterir: Yaklaşık 3,5'lik bir sapma ile hedef (DeltaE < 3) sadece kaçırıldı. Ekranın kalibre edilmesi sapmayı 1,9'a düşürüyor ve daha dengeli gri tonlar elde edilmesini sağlıyor. Panel, sRGB renk alanını neredeyse tamamen kapsayabilir, ancak AdobeRGB veya DCI P3'ü kapsayamaz. Rakiplerinin panellerinin çoğu benzer bir tablo çiziyor. YalnızcaVivoBook'nin ekranı P3 renk alanını kapsayabilir.
Yanıt Sürelerini Görüntüle
| ↔ Tepki Süresi Siyahtan Beyaza | ||
|---|---|---|
| 7.3 ms ... yükseliş ↗ ve sonbahar↘ birleşimi | ↗ 3.3 ms yükseliş | 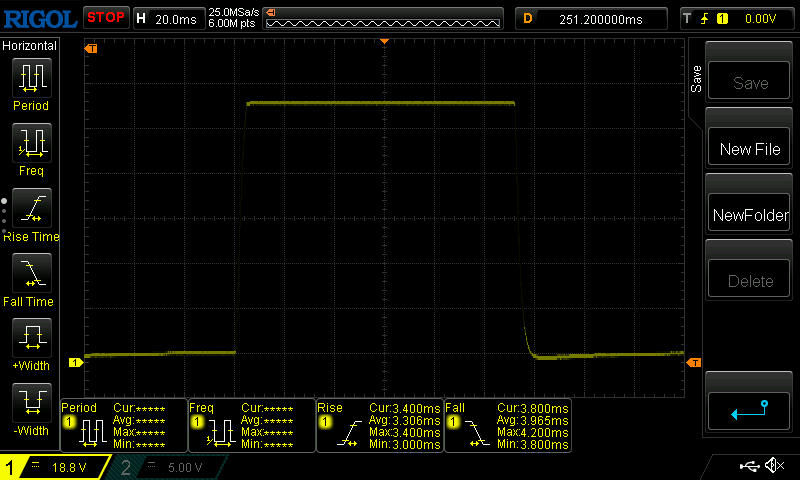 |
| ↘ 4 ms sonbahar | ||
| Ekran, testlerimizde çok hızlı yanıt oranları gösteriyor ve hızlı oyun oynamaya çok uygun olmalı. Karşılaştırıldığında, test edilen tüm cihazlar 0.1 (minimum) ile 240 (maksimum) ms arasında değişir. » Tüm cihazların 22 %'si daha iyi. Bu, ölçülen yanıt süresinin test edilen tüm cihazların ortalamasından (19.8 ms) daha iyi olduğu anlamına gelir. | ||
| ↔ Tepki Süresi %50 Griden %80 Griye | ||
| 7.8 ms ... yükseliş ↗ ve sonbahar↘ birleşimi | ↗ 3.9 ms yükseliş | 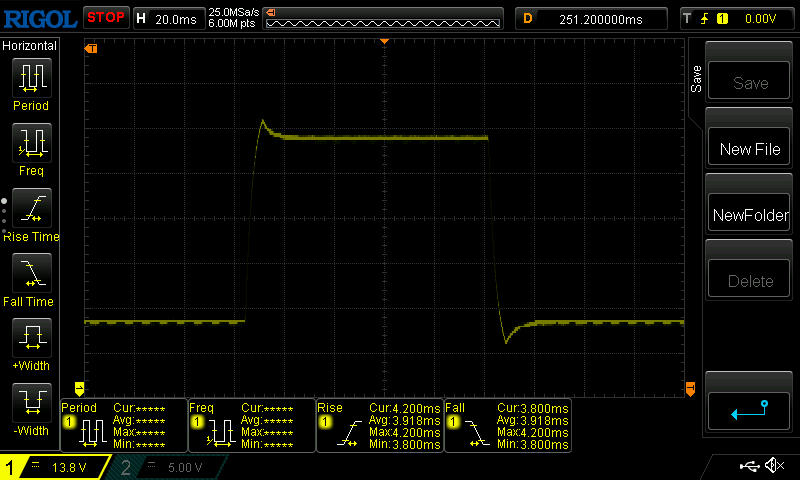 |
| ↘ 3.9 ms sonbahar | ||
| Ekran, testlerimizde çok hızlı yanıt oranları gösteriyor ve hızlı oyun oynamaya çok uygun olmalı. Karşılaştırıldığında, test edilen tüm cihazlar 0.165 (minimum) ile 636 (maksimum) ms arasında değişir. » Tüm cihazların 21 %'si daha iyi. Bu, ölçülen yanıt süresinin test edilen tüm cihazların ortalamasından (30.9 ms) daha iyi olduğu anlamına gelir. | ||
Ekran Titremesi / PWM (Darbe Genişliği Modülasyonu)
| Ekran titriyor / PWM algılanmadı | 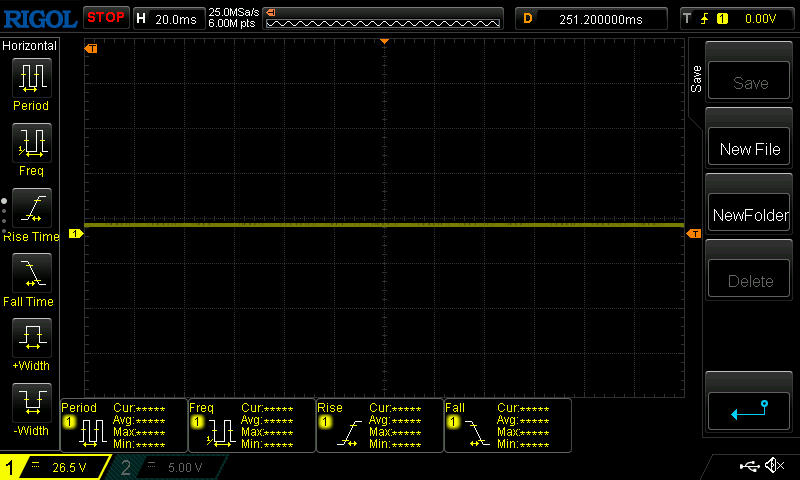 | ||
Karşılaştırıldığında: Test edilen tüm cihazların %52 %'si ekranı karartmak için PWM kullanmıyor. PWM tespit edilirse, ortalama 7748 (minimum: 5 - maksimum: 343500) Hz ölçüldü. | |||
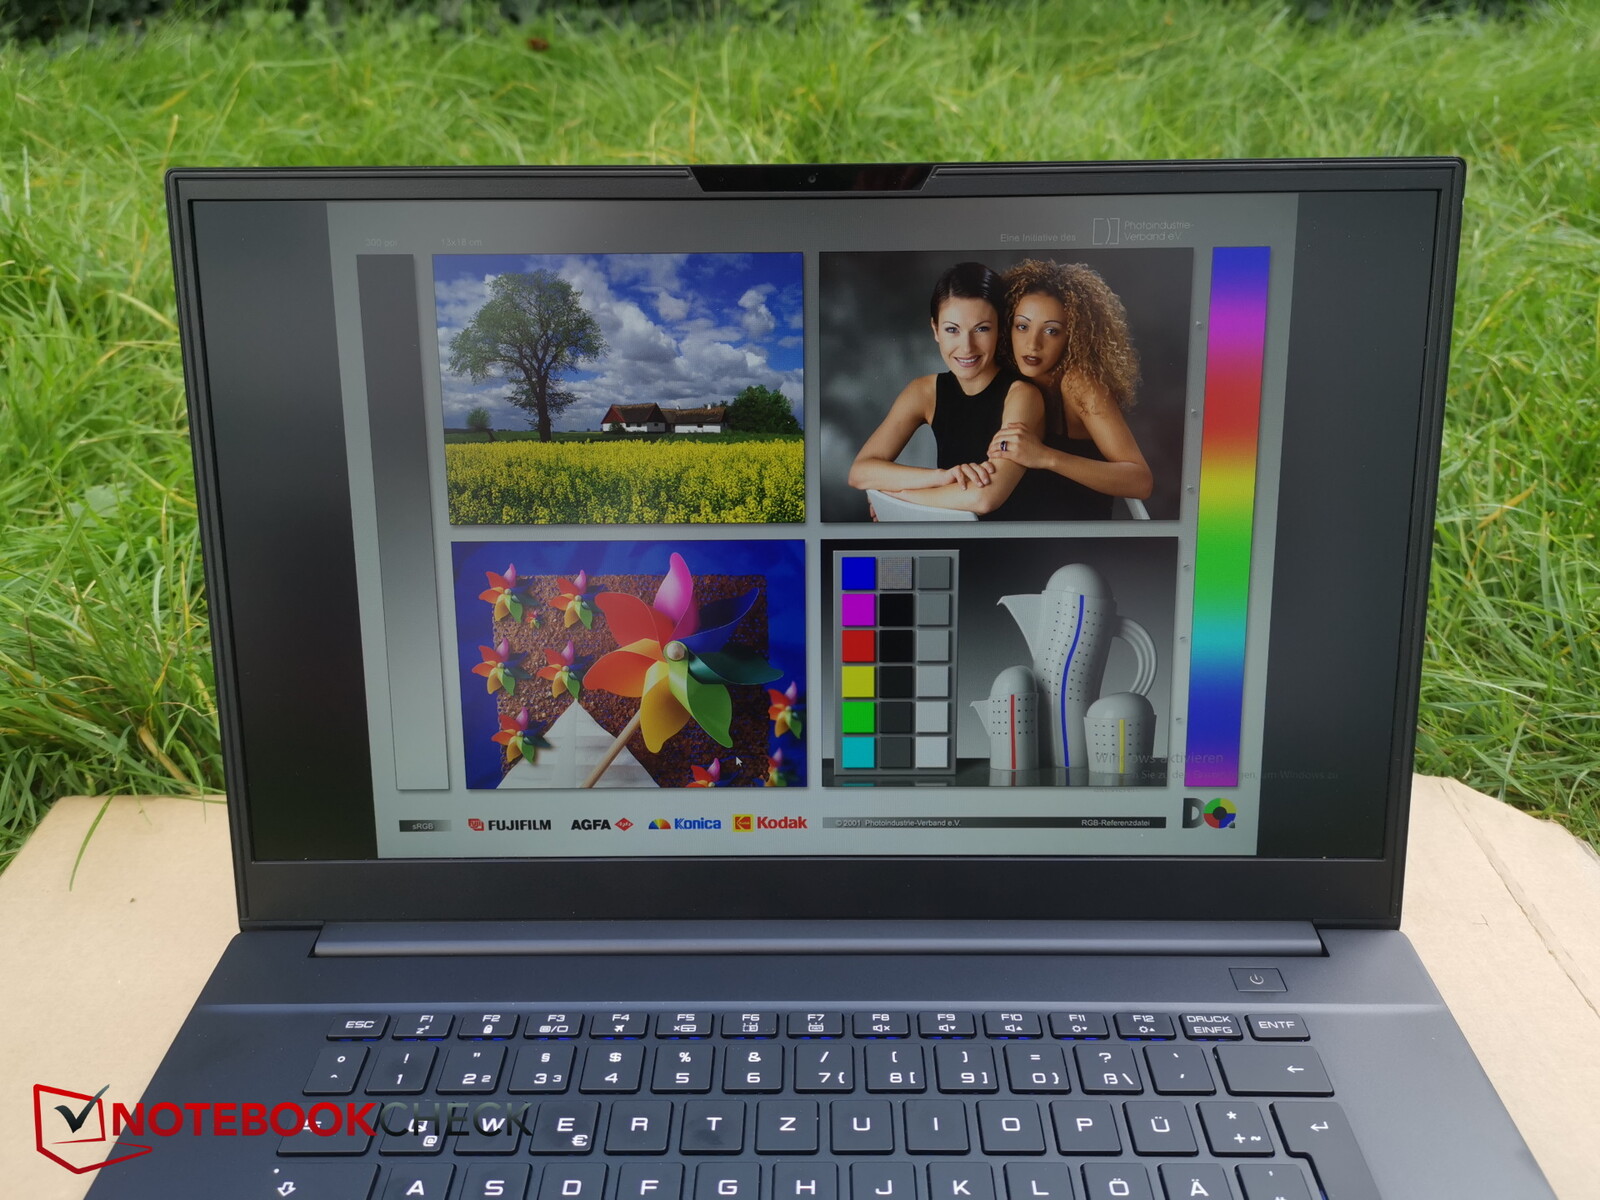
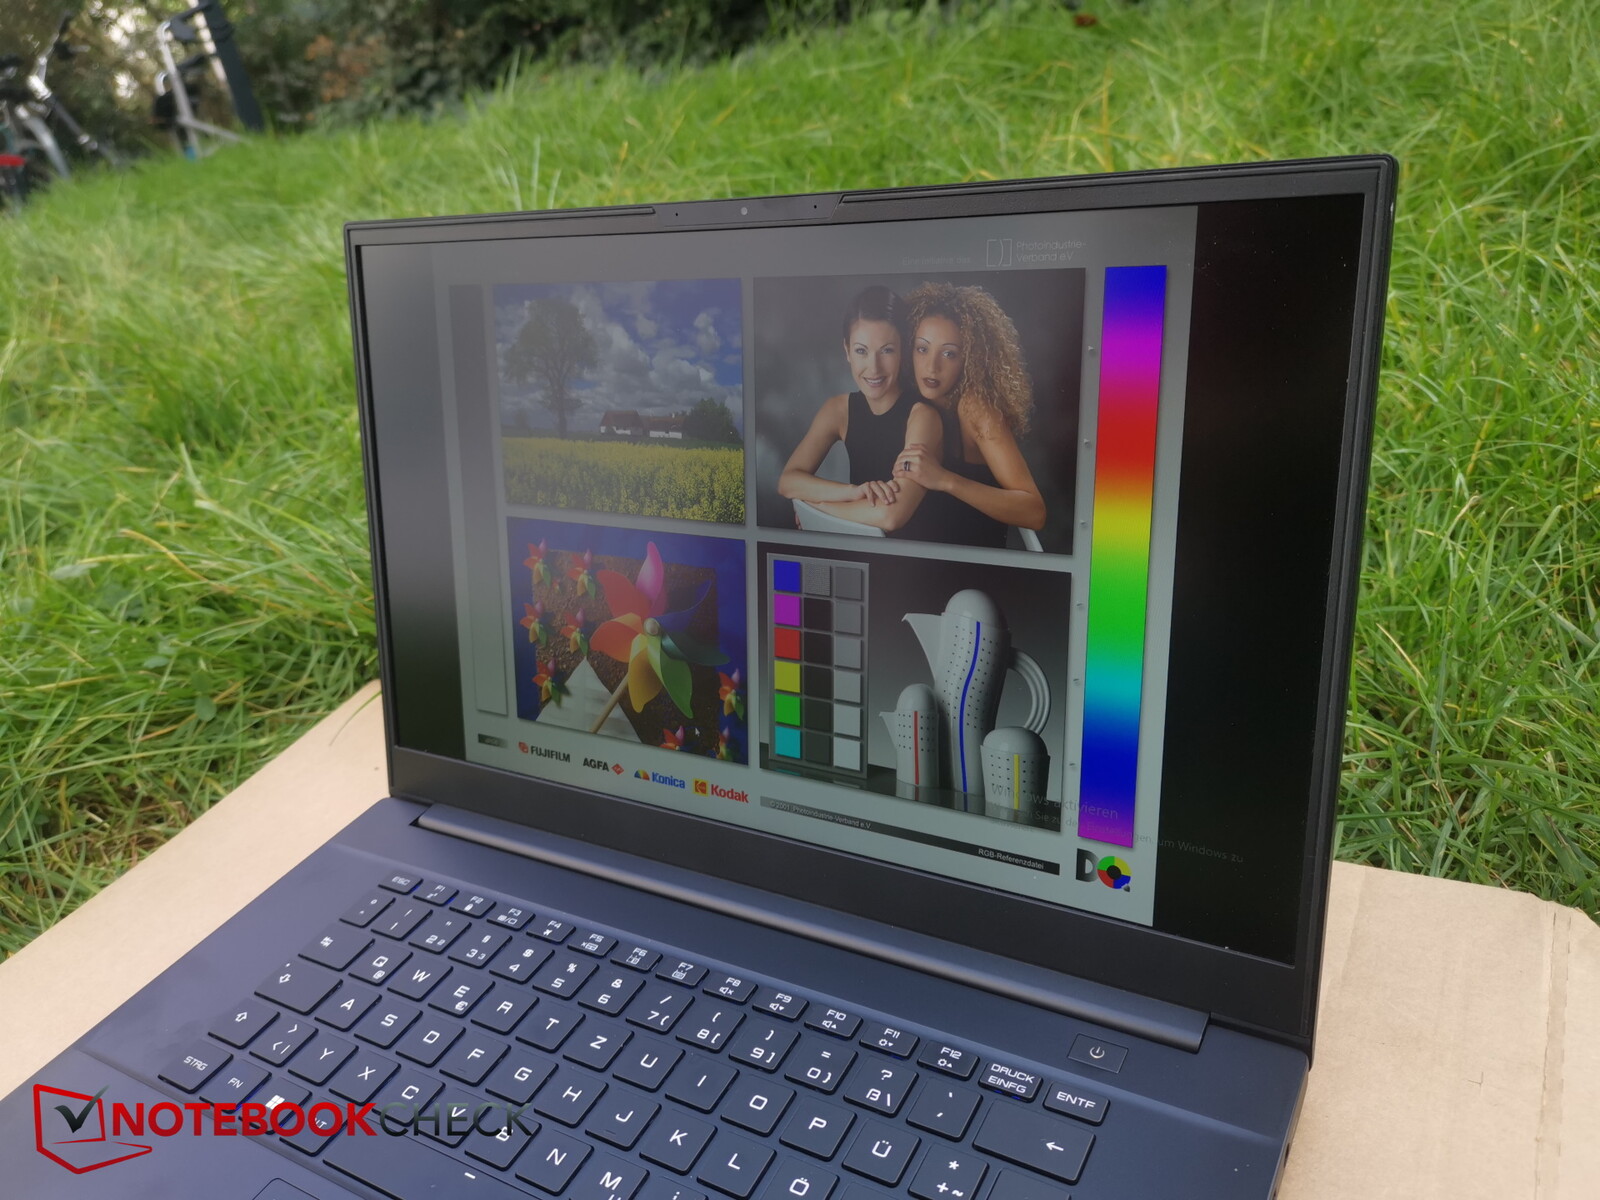
Görüş açısı sabit IPS panel her açıdan okunaklı kalır. Dışarıda, güneş çok parlak olmadığı sürece ekrandan okuyabilirsiniz.

Performans - Intel ekibi oyun dizüstü bilgisayarına güç veriyor
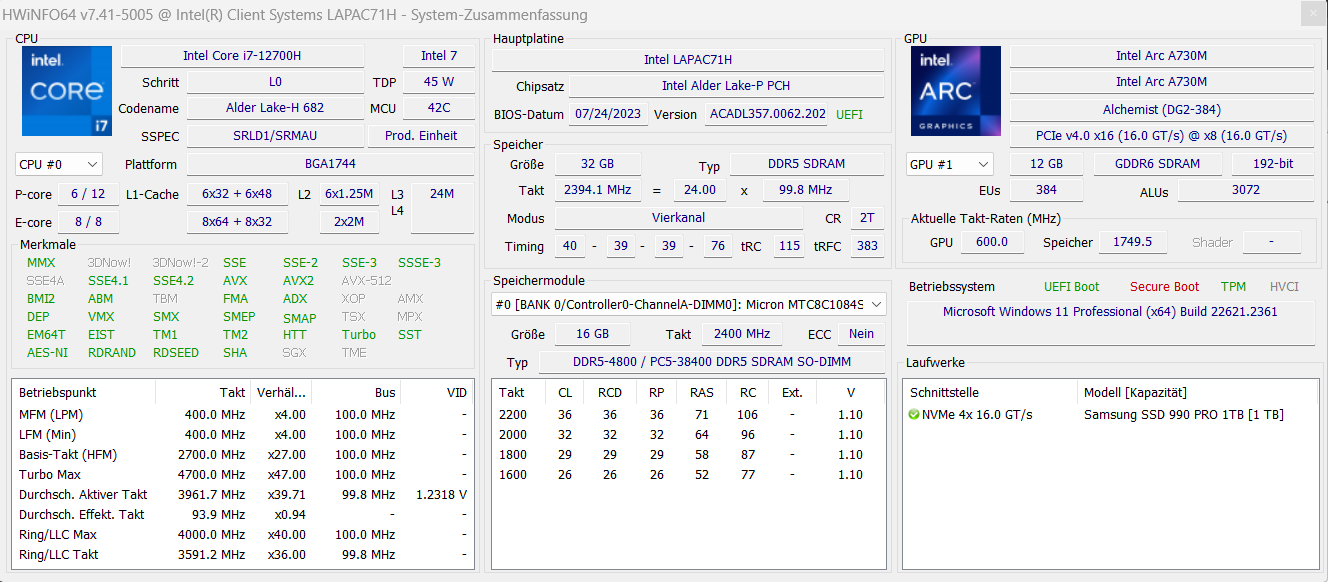
ACore i7-12700Hve Arc A730Moyunculara ve yaratıcılara yönelik Intel NUC X15 LAPAC71H'ye güç verir. Diğer seçenekler mevcut değildir. Dizüstü bilgisayar şu anda yaklaşık 1.050 ABD dolarından bulunabilir. Mevcut varyantın maliyeti yaklaşık 1.280 ABD dolarıdır. Muhtemelen bir Windows lisansı için ek maliyetleri hesaba katmanız gerekecektir.
Test koşulları
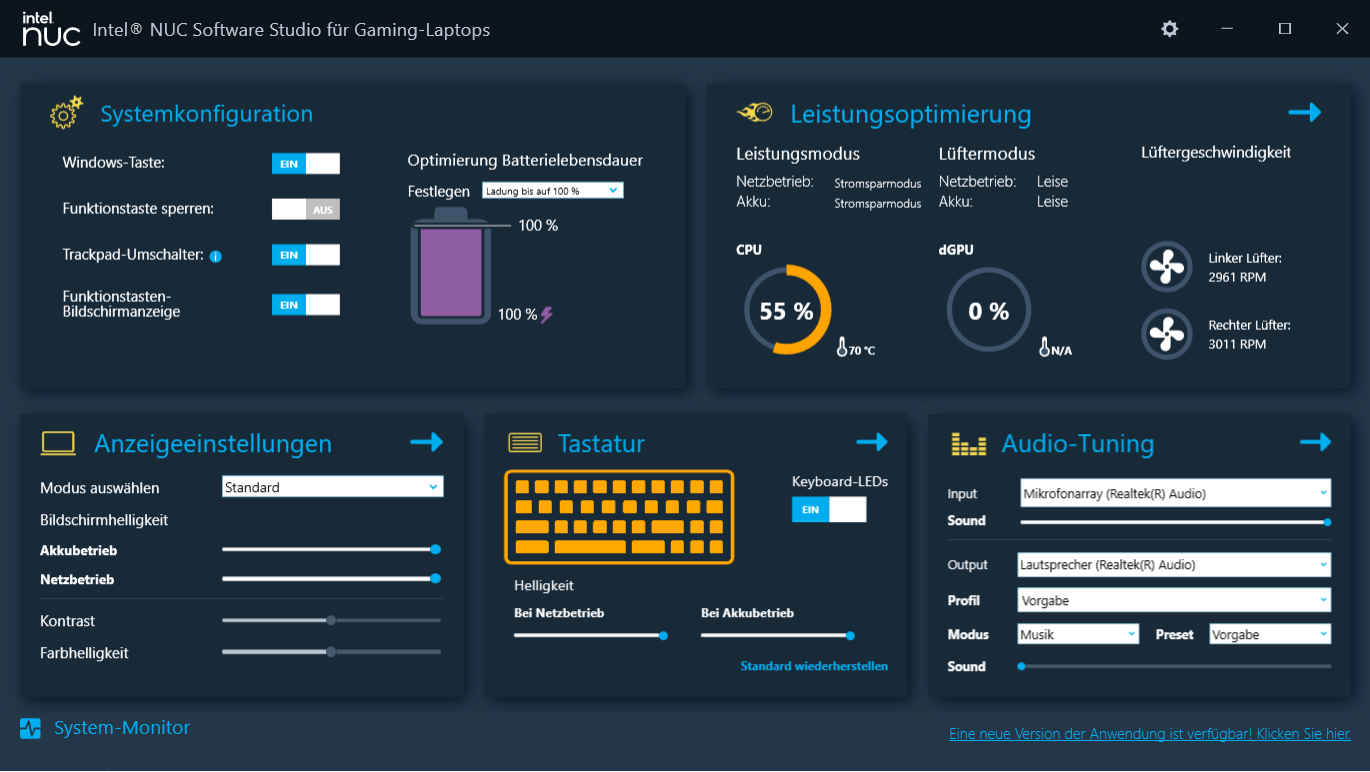
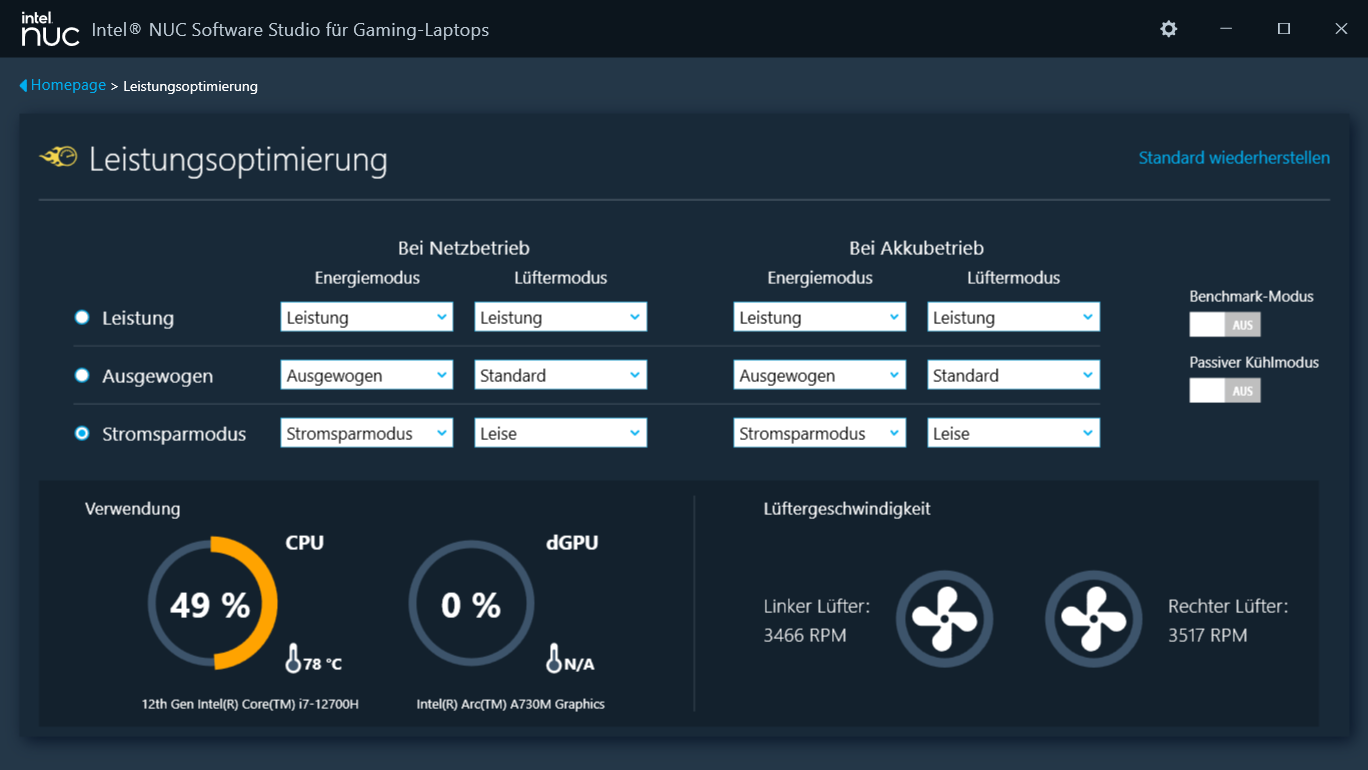
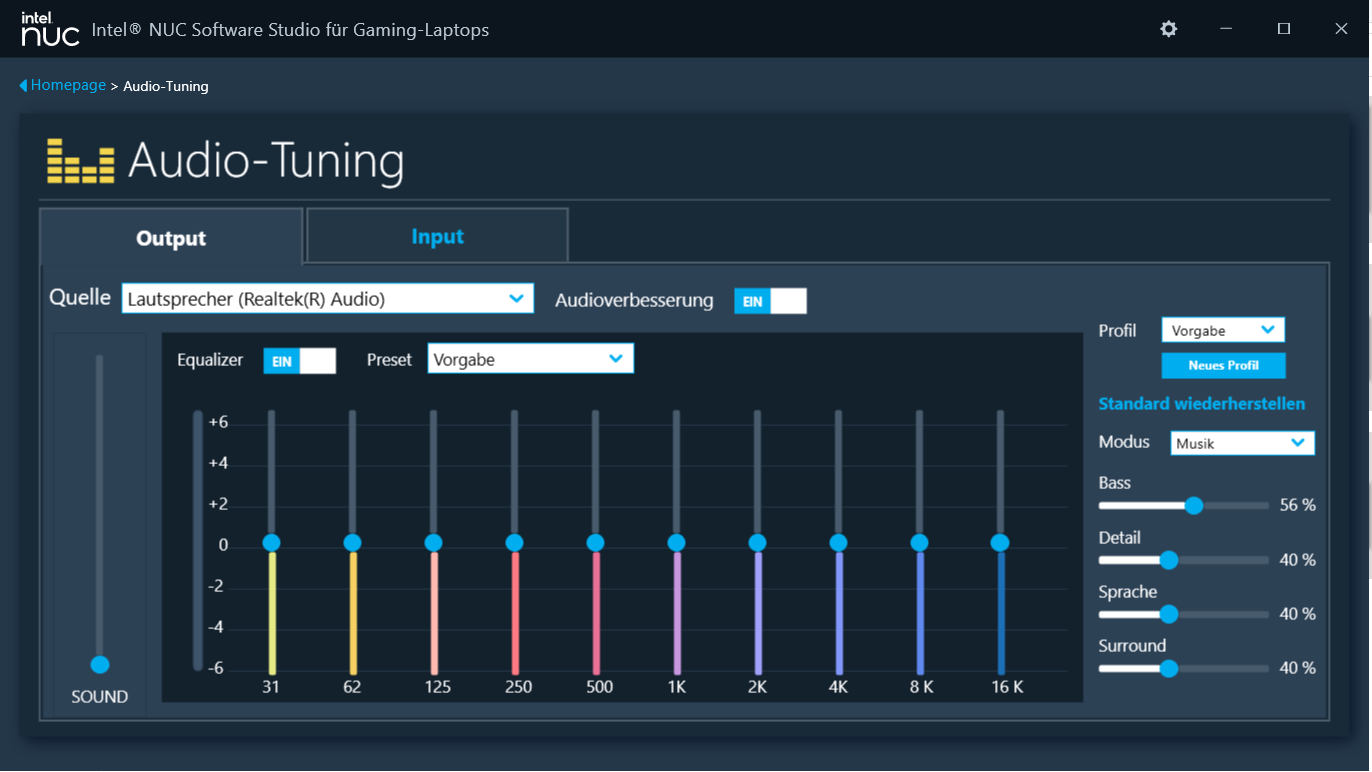
Intel NUC Yazılım Stüdyosu (Kontrol Merkezi), performansını ve fan kontrolünü etkilemek için üç profil sunar (tabloya bakın). Bu testi gerçekleştirmek için "Performans" (kıyaslamalar) ve "Güç Tasarrufu Modu" (pil testleri) profilleri kullanılmıştır. Maksimum performans sadece "Benchmark Modu" seçeneği etkinleştirildikten sonra kullanılabilir. Ancak bu durumda fanlar da sürekli olarak tam güçte çalışır.
| Performans | Dengeli | Güç Tasarrufu Modu | Benchmark Modu | |
|---|---|---|---|---|
| Güç Sınırı 1 (HWInfo) | 45 watt | 35 watt | 35 watt | 45 watt |
| Güç Sınırı 2 (HWInfo) | 90 watt | 80 watt | 65 watt | 90 watt |
| TGP (Ark Kontrolü) | 75 watt | 65 watt | 55 watt | 85 watt |
İşlemci
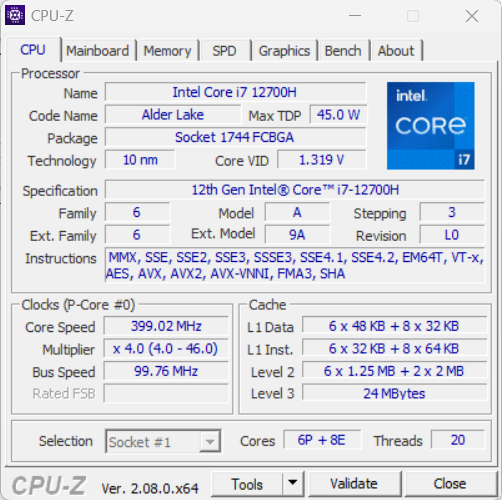
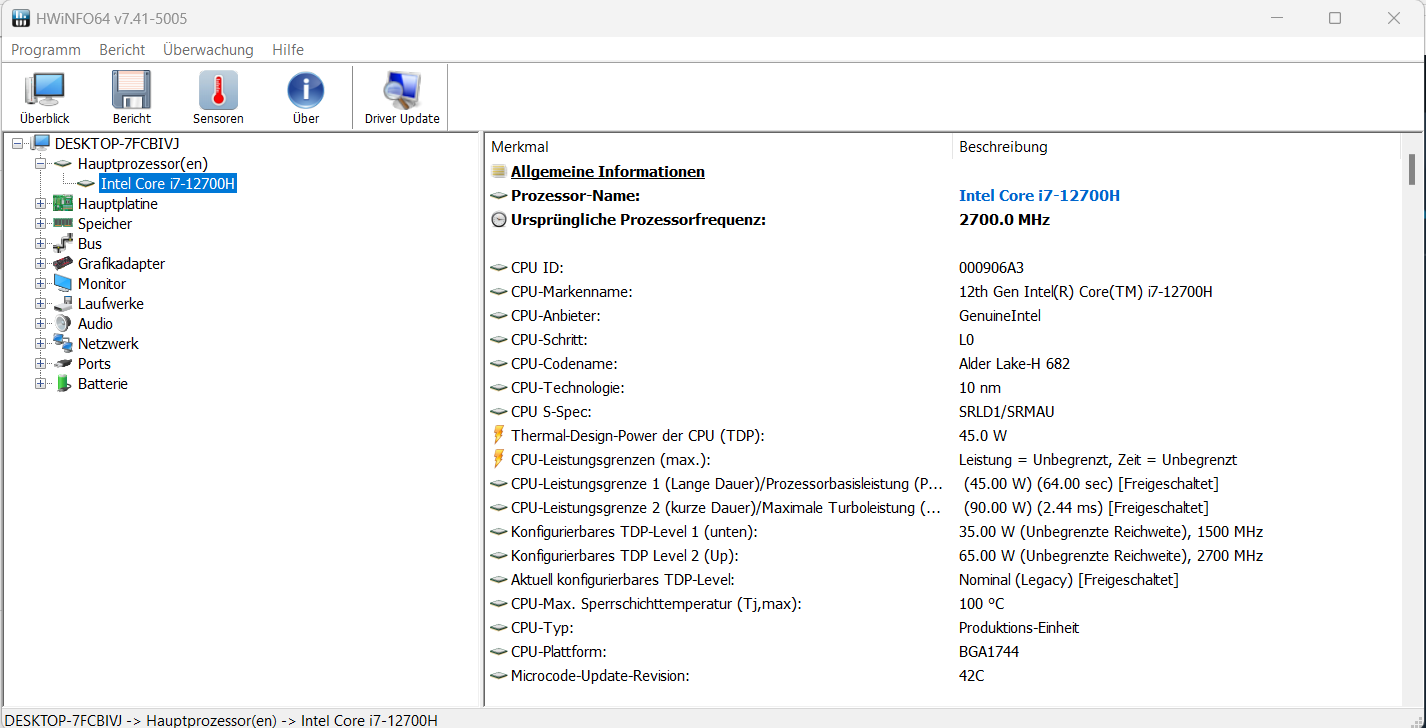
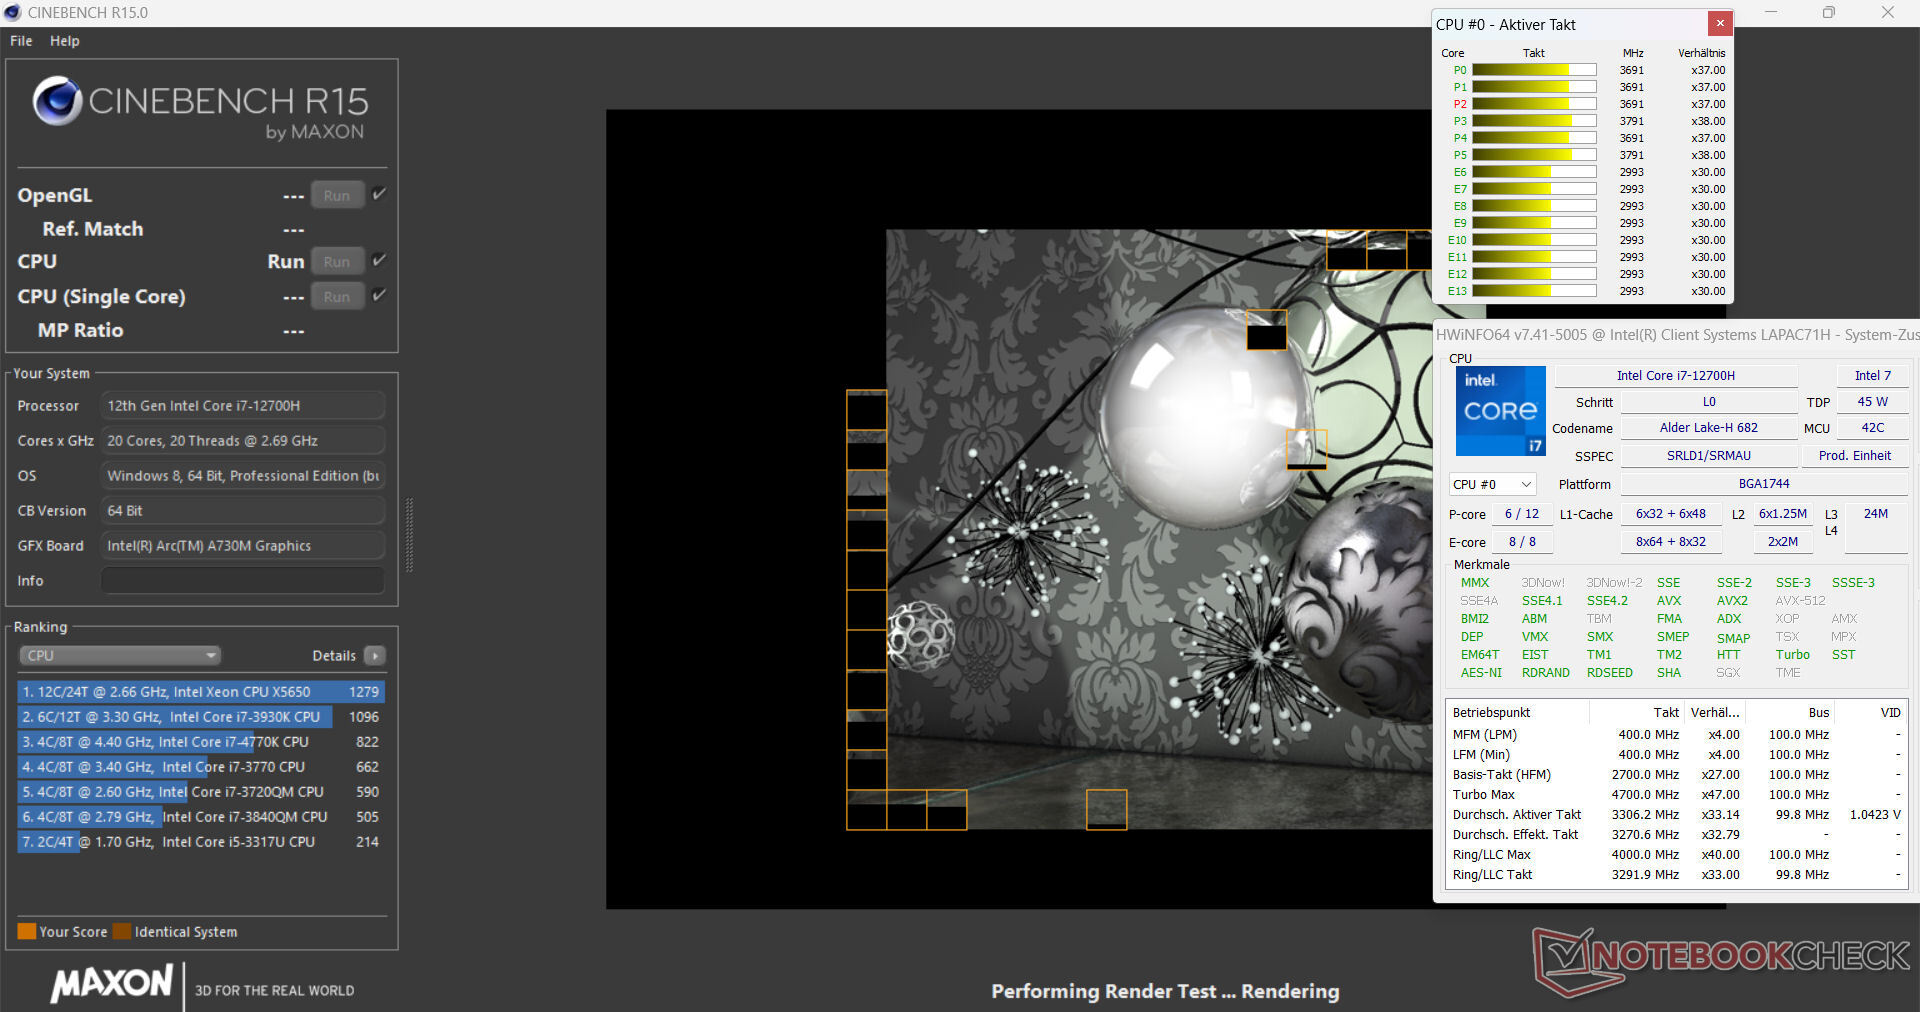
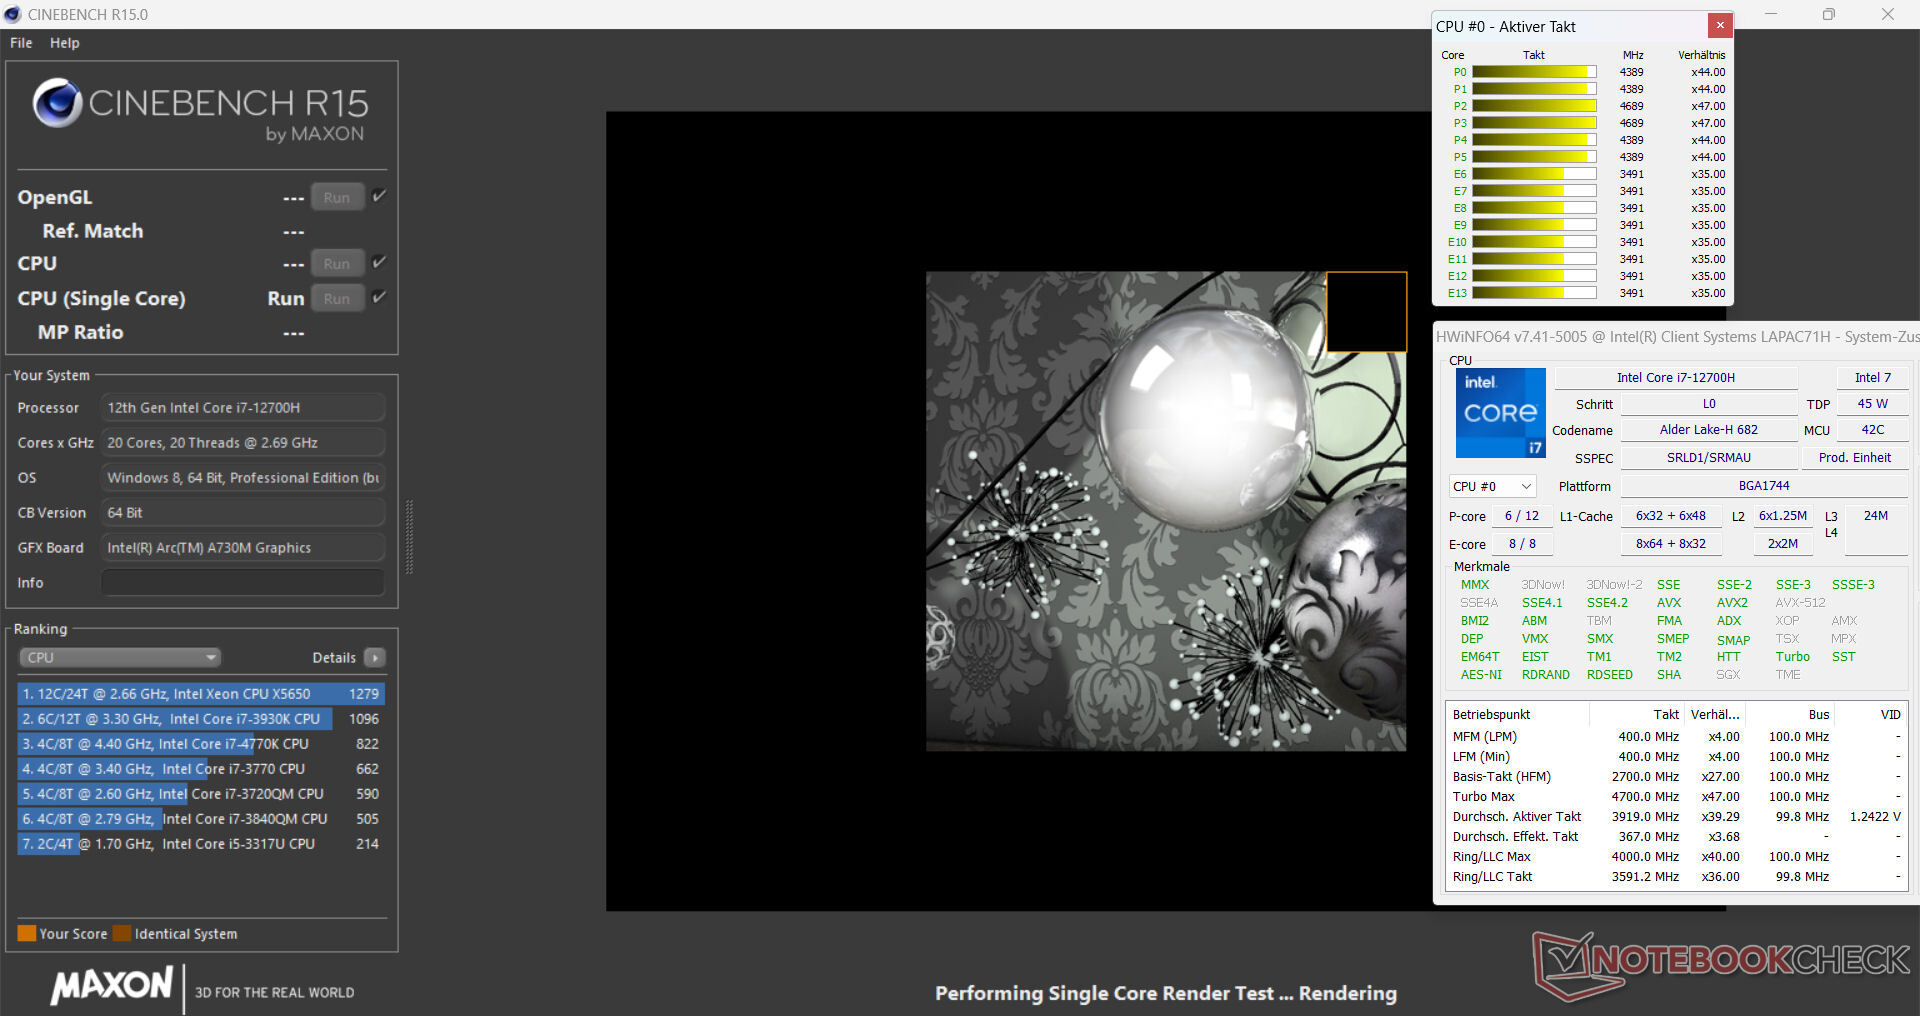
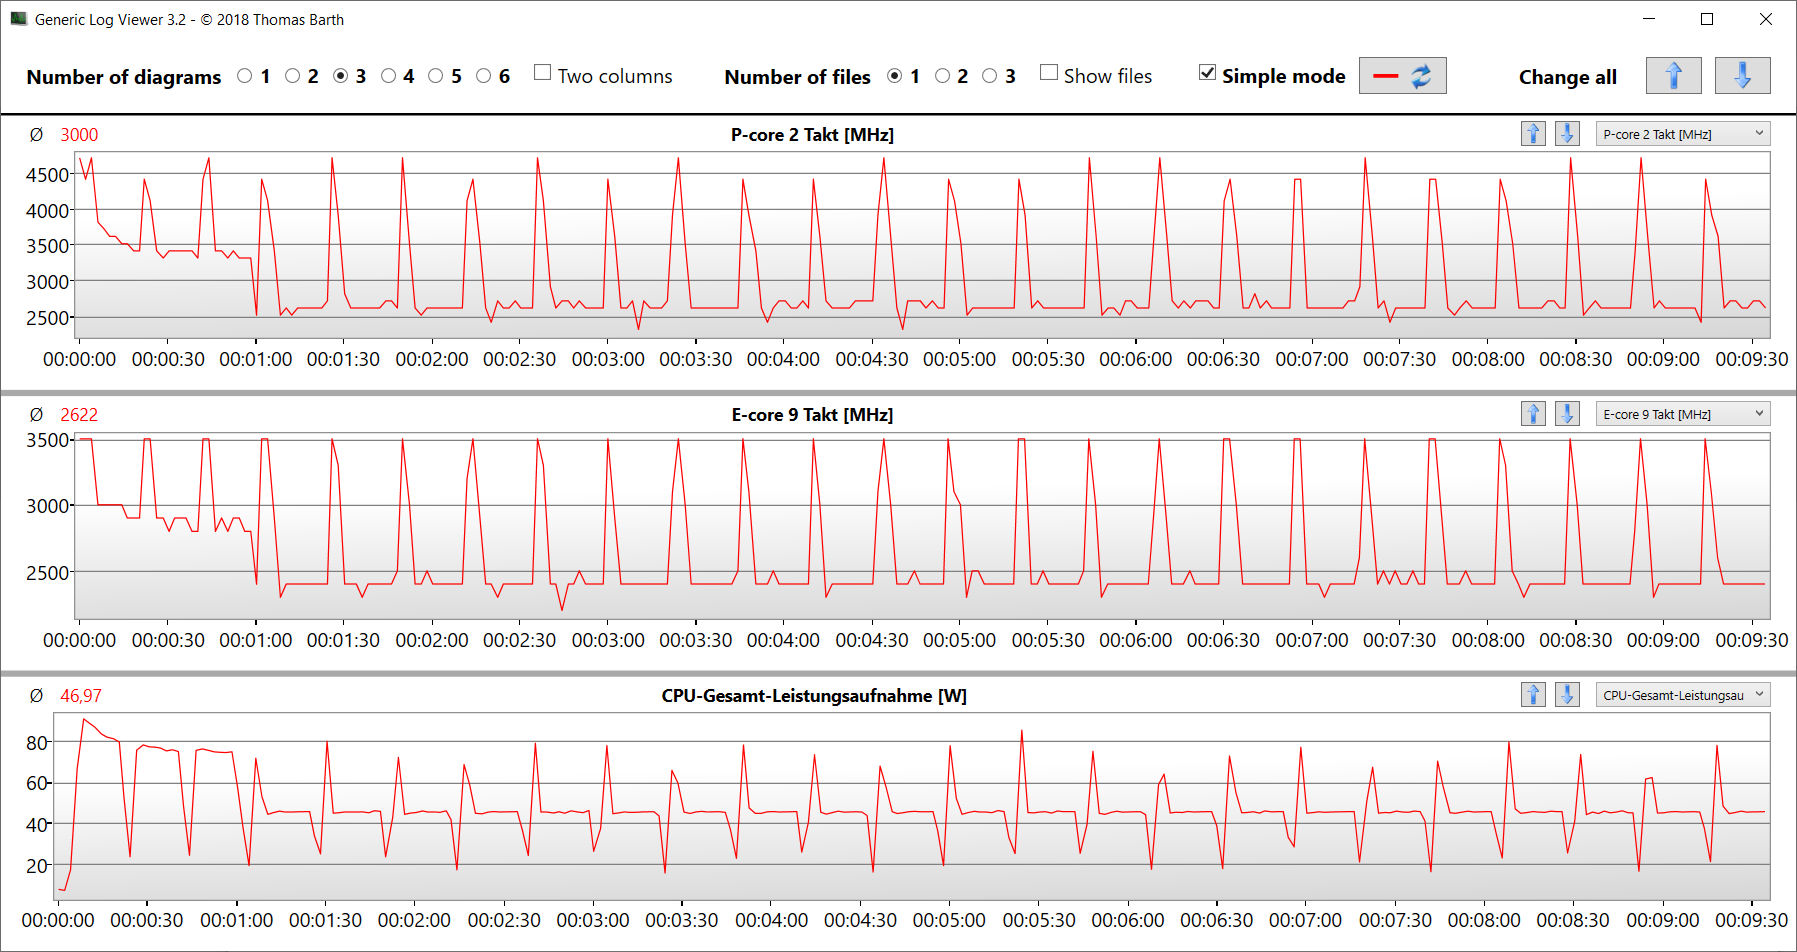
Core i7-12700H'nin 14 CPU çekirdeği (6P, 8E) 4,7 GHz (P) ve 3,5 GHz (E) maksimum saat hızlarına ulaşır. Sürekli çoklu iş parçacığı performansı (CB15 Döngüsü) turbo saatin ilk çalıştırmadan ikinci çalıştırmaya kadar düşmesine neden oldu. Bundan sonra sabit kalmıştır.
Kıyaslama sonuçları şebekeye bağlıyken CPU ortalamasının biraz üzerindeydi. Pil modunda, daha alakalı olan tek iş parçacıklı performansı (213 puan), çok iş parçacıklı performansından (1.012 puan) daha az düşmüştür.
Cinebench R15 Multi continuous test
| CPU Performance rating - Percent | |
| Sınıf ortalaması Multimedia | |
| Intel NUC X15 LAPAC71H | |
| Dell Inspiron 16 Plus 7630 | |
| Ortalama Intel Core i7-12700H | |
| MSI Cyborg 15 A12VF | |
| Asus VivoBook Pro 16 | |
| Asus TUF A15 FA507 | |
| Gigabyte G5 KE | |
| Cinebench R23 | |
| Multi Core | |
| Sınıf ortalaması Multimedia (4861 - 33362, n=65, son 2 yıl) | |
| Intel NUC X15 LAPAC71H | |
| Dell Inspiron 16 Plus 7630 | |
| Ortalama Intel Core i7-12700H (4032 - 19330, n=64) | |
| Asus VivoBook Pro 16 | |
| MSI Cyborg 15 A12VF | |
| Asus TUF A15 FA507 | |
| Gigabyte G5 KE | |
| Single Core | |
| Sınıf ortalaması Multimedia (1128 - 2459, n=64, son 2 yıl) | |
| Dell Inspiron 16 Plus 7630 | |
| Intel NUC X15 LAPAC71H | |
| Ortalama Intel Core i7-12700H (778 - 1826, n=63) | |
| MSI Cyborg 15 A12VF | |
| Asus VivoBook Pro 16 | |
| Gigabyte G5 KE | |
| Asus TUF A15 FA507 | |
| Cinebench R20 | |
| CPU (Multi Core) | |
| Sınıf ortalaması Multimedia (1887 - 12912, n=56, son 2 yıl) | |
| Intel NUC X15 LAPAC71H | |
| Dell Inspiron 16 Plus 7630 | |
| Ortalama Intel Core i7-12700H (1576 - 7407, n=64) | |
| Asus VivoBook Pro 16 | |
| MSI Cyborg 15 A12VF | |
| Asus TUF A15 FA507 | |
| Gigabyte G5 KE | |
| CPU (Single Core) | |
| Sınıf ortalaması Multimedia (425 - 853, n=56, son 2 yıl) | |
| Dell Inspiron 16 Plus 7630 | |
| Intel NUC X15 LAPAC71H | |
| MSI Cyborg 15 A12VF | |
| Ortalama Intel Core i7-12700H (300 - 704, n=64) | |
| Asus VivoBook Pro 16 | |
| Gigabyte G5 KE | |
| Asus TUF A15 FA507 | |
| Cinebench R15 | |
| CPU Multi 64Bit | |
| Sınıf ortalaması Multimedia (856 - 5224, n=60, son 2 yıl) | |
| Intel NUC X15 LAPAC71H | |
| Ortalama Intel Core i7-12700H (1379 - 2916, n=70) | |
| Asus VivoBook Pro 16 | |
| Dell Inspiron 16 Plus 7630 | |
| Asus TUF A15 FA507 | |
| MSI Cyborg 15 A12VF | |
| Gigabyte G5 KE | |
| CPU Single 64Bit | |
| Sınıf ortalaması Multimedia (184.8 - 326, n=58, son 2 yıl) | |
| Dell Inspiron 16 Plus 7630 | |
| Intel NUC X15 LAPAC71H | |
| Ortalama Intel Core i7-12700H (113 - 263, n=65) | |
| Asus VivoBook Pro 16 | |
| Asus TUF A15 FA507 | |
| Gigabyte G5 KE | |
| MSI Cyborg 15 A12VF | |
| Blender - v2.79 BMW27 CPU | |
| Sınıf ortalaması Multimedia (100 - 557, n=57, son 2 yıl) | |
| MSI Cyborg 15 A12VF | |
| Intel NUC X15 LAPAC71H | |
| Gigabyte G5 KE | |
| Asus VivoBook Pro 16 | |
| Ortalama Intel Core i7-12700H (168 - 732, n=63) | |
| Asus TUF A15 FA507 | |
| Dell Inspiron 16 Plus 7630 | |
| 7-Zip 18.03 | |
| 7z b 4 | |
| Intel NUC X15 LAPAC71H | |
| Asus TUF A15 FA507 | |
| Ortalama Intel Core i7-12700H (22844 - 73067, n=63) | |
| Dell Inspiron 16 Plus 7630 | |
| Sınıf ortalaması Multimedia (26062 - 130368, n=54, son 2 yıl) | |
| MSI Cyborg 15 A12VF | |
| Gigabyte G5 KE | |
| Asus VivoBook Pro 16 | |
| 7z b 4 -mmt1 | |
| Sınıf ortalaması Multimedia (3666 - 7545, n=55, son 2 yıl) | |
| Intel NUC X15 LAPAC71H | |
| Asus TUF A15 FA507 | |
| MSI Cyborg 15 A12VF | |
| Dell Inspiron 16 Plus 7630 | |
| Ortalama Intel Core i7-12700H (2743 - 5972, n=63) | |
| Asus VivoBook Pro 16 | |
| Gigabyte G5 KE | |
| Geekbench 5.5 | |
| Multi-Core | |
| Sınıf ortalaması Multimedia (4652 - 20422, n=55, son 2 yıl) | |
| Intel NUC X15 LAPAC71H | |
| Dell Inspiron 16 Plus 7630 | |
| Ortalama Intel Core i7-12700H (5144 - 13745, n=64) | |
| MSI Cyborg 15 A12VF | |
| Gigabyte G5 KE | |
| Asus TUF A15 FA507 | |
| Asus VivoBook Pro 16 | |
| Single-Core | |
| Sınıf ortalaması Multimedia (805 - 2974, n=55, son 2 yıl) | |
| Dell Inspiron 16 Plus 7630 | |
| MSI Cyborg 15 A12VF | |
| Intel NUC X15 LAPAC71H | |
| Ortalama Intel Core i7-12700H (803 - 1851, n=64) | |
| Asus VivoBook Pro 16 | |
| Gigabyte G5 KE | |
| Asus TUF A15 FA507 | |
| HWBOT x265 Benchmark v2.2 - 4k Preset | |
| Sınıf ortalaması Multimedia (5.26 - 36.1, n=55, son 2 yıl) | |
| Asus TUF A15 FA507 | |
| Intel NUC X15 LAPAC71H | |
| Gigabyte G5 KE | |
| Ortalama Intel Core i7-12700H (4.67 - 21.8, n=64) | |
| MSI Cyborg 15 A12VF | |
| MSI Cyborg 15 A12VF | |
| Dell Inspiron 16 Plus 7630 | |
| Asus VivoBook Pro 16 | |
| LibreOffice - 20 Documents To PDF | |
| Gigabyte G5 KE | |
| Asus TUF A15 FA507 | |
| Sınıf ortalaması Multimedia (23.9 - 146.7, n=56, son 2 yıl) | |
| Asus VivoBook Pro 16 | |
| Ortalama Intel Core i7-12700H (34.2 - 95.3, n=63) | |
| Dell Inspiron 16 Plus 7630 | |
| MSI Cyborg 15 A12VF | |
| Intel NUC X15 LAPAC71H | |
| R Benchmark 2.5 - Overall mean | |
| Asus TUF A15 FA507 | |
| Asus VivoBook Pro 16 | |
| Gigabyte G5 KE | |
| Ortalama Intel Core i7-12700H (0.4441 - 1.052, n=63) | |
| MSI Cyborg 15 A12VF | |
| Sınıf ortalaması Multimedia (0.3604 - 0.947, n=55, son 2 yıl) | |
| Intel NUC X15 LAPAC71H | |
| Dell Inspiron 16 Plus 7630 | |
* ... daha küçük daha iyidir
AIDA64: FP32 Ray-Trace | FPU Julia | CPU SHA3 | CPU Queen | FPU SinJulia | FPU Mandel | CPU AES | CPU ZLib | FP64 Ray-Trace | CPU PhotoWorxx
| Performance rating | |
| Asus TUF A15 FA507 | |
| Sınıf ortalaması Multimedia | |
| Intel NUC X15 LAPAC71H | |
| Dell Inspiron 16 Plus 7630 | |
| Gigabyte G5 KE | |
| Asus VivoBook Pro 16 | |
| MSI Cyborg 15 A12VF | |
| Ortalama Intel Core i7-12700H | |
| AIDA64 / FP32 Ray-Trace | |
| Sınıf ortalaması Multimedia (2214 - 50388, n=53, son 2 yıl) | |
| Asus TUF A15 FA507 | |
| Asus VivoBook Pro 16 | |
| Dell Inspiron 16 Plus 7630 | |
| Intel NUC X15 LAPAC71H | |
| MSI Cyborg 15 A12VF | |
| Gigabyte G5 KE | |
| Ortalama Intel Core i7-12700H (2585 - 17957, n=64) | |
| AIDA64 / FPU Julia | |
| Asus TUF A15 FA507 | |
| Sınıf ortalaması Multimedia (12867 - 201874, n=53, son 2 yıl) | |
| Asus VivoBook Pro 16 | |
| MSI Cyborg 15 A12VF | |
| Dell Inspiron 16 Plus 7630 | |
| Gigabyte G5 KE | |
| Intel NUC X15 LAPAC71H | |
| Ortalama Intel Core i7-12700H (12439 - 90760, n=64) | |
| AIDA64 / CPU SHA3 | |
| Sınıf ortalaması Multimedia (626 - 8623, n=53, son 2 yıl) | |
| Asus TUF A15 FA507 | |
| Asus VivoBook Pro 16 | |
| Gigabyte G5 KE | |
| Ortalama Intel Core i7-12700H (833 - 4242, n=64) | |
| Dell Inspiron 16 Plus 7630 | |
| Intel NUC X15 LAPAC71H | |
| MSI Cyborg 15 A12VF | |
| AIDA64 / CPU Queen | |
| Dell Inspiron 16 Plus 7630 | |
| Asus TUF A15 FA507 | |
| Asus VivoBook Pro 16 | |
| Intel NUC X15 LAPAC71H | |
| Ortalama Intel Core i7-12700H (57923 - 103202, n=63) | |
| MSI Cyborg 15 A12VF | |
| Gigabyte G5 KE | |
| Sınıf ortalaması Multimedia (13483 - 181505, n=40, son 2 yıl) | |
| AIDA64 / FPU SinJulia | |
| Asus TUF A15 FA507 | |
| Ortalama Intel Core i7-12700H (3249 - 9939, n=64) | |
| Asus VivoBook Pro 16 | |
| Dell Inspiron 16 Plus 7630 | |
| Sınıf ortalaması Multimedia (886 - 28794, n=53, son 2 yıl) | |
| MSI Cyborg 15 A12VF | |
| Intel NUC X15 LAPAC71H | |
| Gigabyte G5 KE | |
| AIDA64 / FPU Mandel | |
| Asus TUF A15 FA507 | |
| Sınıf ortalaması Multimedia (6395 - 105740, n=53, son 2 yıl) | |
| Asus VivoBook Pro 16 | |
| Dell Inspiron 16 Plus 7630 | |
| Gigabyte G5 KE | |
| Intel NUC X15 LAPAC71H | |
| MSI Cyborg 15 A12VF | |
| Ortalama Intel Core i7-12700H (7135 - 44760, n=64) | |
| AIDA64 / CPU AES | |
| Intel NUC X15 LAPAC71H | |
| Gigabyte G5 KE | |
| Ortalama Intel Core i7-12700H (31839 - 144360, n=64) | |
| Asus TUF A15 FA507 | |
| Asus VivoBook Pro 16 | |
| MSI Cyborg 15 A12VF | |
| Sınıf ortalaması Multimedia (8171 - 126790, n=53, son 2 yıl) | |
| Dell Inspiron 16 Plus 7630 | |
| AIDA64 / CPU ZLib | |
| Ortalama Intel Core i7-12700H (305 - 1171, n=64) | |
| Sınıf ortalaması Multimedia (143.8 - 2022, n=53, son 2 yıl) | |
| Asus VivoBook Pro 16 | |
| Gigabyte G5 KE | |
| MSI Cyborg 15 A12VF | |
| Intel NUC X15 LAPAC71H | |
| Dell Inspiron 16 Plus 7630 | |
| Asus TUF A15 FA507 | |
| AIDA64 / FP64 Ray-Trace | |
| Sınıf ortalaması Multimedia (1014 - 26875, n=53, son 2 yıl) | |
| Asus TUF A15 FA507 | |
| Asus VivoBook Pro 16 | |
| Dell Inspiron 16 Plus 7630 | |
| Gigabyte G5 KE | |
| Intel NUC X15 LAPAC71H | |
| MSI Cyborg 15 A12VF | |
| Ortalama Intel Core i7-12700H (1437 - 9692, n=64) | |
| AIDA64 / CPU PhotoWorxx | |
| Sınıf ortalaması Multimedia (8187 - 88154, n=53, son 2 yıl) | |
| Intel NUC X15 LAPAC71H | |
| Dell Inspiron 16 Plus 7630 | |
| MSI Cyborg 15 A12VF | |
| Ortalama Intel Core i7-12700H (12863 - 52207, n=64) | |
| Gigabyte G5 KE | |
| Asus TUF A15 FA507 | |
| Asus VivoBook Pro 16 | |
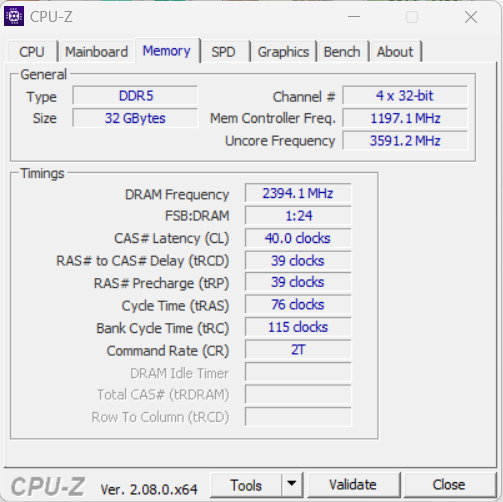
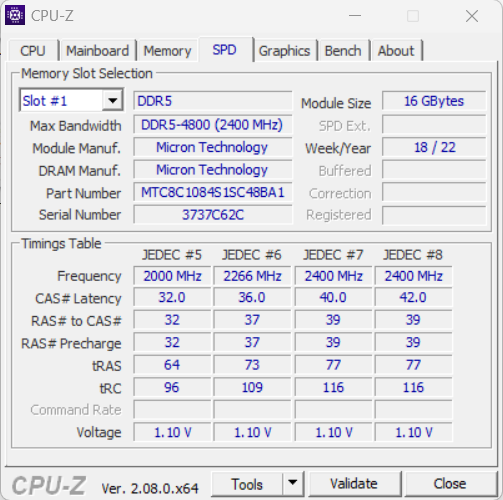
Sistem performansı
Sorunsuz çalışan sistem, bilgi işlem gücünden yoksun değildir. Dizüstü bilgisayar oyun, akış ve render işlemlerini sorunsuzca gerçekleştiriyor. RAM'in aktarım hızları DDR5-4800 RAM için normal seviyede.
CrossMark: Overall | Productivity | Creativity | Responsiveness
| PCMark 10 / Score | |
| Sınıf ortalaması Multimedia (4325 - 10386, n=51, son 2 yıl) | |
| Dell Inspiron 16 Plus 7630 | |
| Asus TUF A15 FA507 | |
| Gigabyte G5 KE | |
| MSI Cyborg 15 A12VF | |
| Intel NUC X15 LAPAC71H | |
| Ortalama Intel Core i7-12700H, Intel Arc A730M (6830 - 6845, n=2) | |
| Asus VivoBook Pro 16 | |
| PCMark 10 / Essentials | |
| Dell Inspiron 16 Plus 7630 | |
| Gigabyte G5 KE | |
| Ortalama Intel Core i7-12700H, Intel Arc A730M (10529 - 11116, n=2) | |
| MSI Cyborg 15 A12VF | |
| Asus TUF A15 FA507 | |
| Intel NUC X15 LAPAC71H | |
| Sınıf ortalaması Multimedia (8025 - 11664, n=50, son 2 yıl) | |
| Asus VivoBook Pro 16 | |
| PCMark 10 / Productivity | |
| Sınıf ortalaması Multimedia (7323 - 18233, n=50, son 2 yıl) | |
| MSI Cyborg 15 A12VF | |
| Gigabyte G5 KE | |
| Dell Inspiron 16 Plus 7630 | |
| Asus TUF A15 FA507 | |
| Asus VivoBook Pro 16 | |
| Ortalama Intel Core i7-12700H, Intel Arc A730M (7070 - 7260, n=2) | |
| Intel NUC X15 LAPAC71H | |
| PCMark 10 / Digital Content Creation | |
| Intel NUC X15 LAPAC71H | |
| Dell Inspiron 16 Plus 7630 | |
| Ortalama Intel Core i7-12700H, Intel Arc A730M (10714 - 11691, n=2) | |
| Sınıf ortalaması Multimedia (3651 - 16240, n=50, son 2 yıl) | |
| Asus TUF A15 FA507 | |
| Gigabyte G5 KE | |
| Asus VivoBook Pro 16 | |
| MSI Cyborg 15 A12VF | |
| CrossMark / Overall | |
| Intel NUC X15 LAPAC71H | |
| Ortalama Intel Core i7-12700H, Intel Arc A730M (n=1) | |
| Sınıf ortalaması Multimedia (866 - 2728, n=59, son 2 yıl) | |
| Dell Inspiron 16 Plus 7630 | |
| MSI Cyborg 15 A12VF | |
| Gigabyte G5 KE | |
| Asus VivoBook Pro 16 | |
| Asus TUF A15 FA507 | |
| CrossMark / Productivity | |
| Intel NUC X15 LAPAC71H | |
| Ortalama Intel Core i7-12700H, Intel Arc A730M (n=1) | |
| Sınıf ortalaması Multimedia (931 - 2489, n=59, son 2 yıl) | |
| Dell Inspiron 16 Plus 7630 | |
| Gigabyte G5 KE | |
| MSI Cyborg 15 A12VF | |
| Asus VivoBook Pro 16 | |
| Asus TUF A15 FA507 | |
| CrossMark / Creativity | |
| Sınıf ortalaması Multimedia (907 - 3465, n=59, son 2 yıl) | |
| Dell Inspiron 16 Plus 7630 | |
| Intel NUC X15 LAPAC71H | |
| Ortalama Intel Core i7-12700H, Intel Arc A730M (n=1) | |
| MSI Cyborg 15 A12VF | |
| Gigabyte G5 KE | |
| Asus TUF A15 FA507 | |
| Asus VivoBook Pro 16 | |
| CrossMark / Responsiveness | |
| Intel NUC X15 LAPAC71H | |
| Ortalama Intel Core i7-12700H, Intel Arc A730M (n=1) | |
| Gigabyte G5 KE | |
| Asus VivoBook Pro 16 | |
| MSI Cyborg 15 A12VF | |
| Dell Inspiron 16 Plus 7630 | |
| Sınıf ortalaması Multimedia (605 - 2024, n=59, son 2 yıl) | |
| Asus TUF A15 FA507 | |
| PCMark 10 Score | 6845 puan | |
Yardım | ||
| AIDA64 / Memory Copy | |
| Sınıf ortalaması Multimedia (11299 - 132135, n=53, son 2 yıl) | |
| Intel NUC X15 LAPAC71H | |
| Dell Inspiron 16 Plus 7630 | |
| MSI Cyborg 15 A12VF | |
| Ortalama Intel Core i7-12700H (25615 - 80511, n=64) | |
| Asus TUF A15 FA507 | |
| Gigabyte G5 KE | |
| Asus VivoBook Pro 16 | |
| AIDA64 / Memory Read | |
| Sınıf ortalaması Multimedia (11624 - 174586, n=53, son 2 yıl) | |
| Dell Inspiron 16 Plus 7630 | |
| Intel NUC X15 LAPAC71H | |
| MSI Cyborg 15 A12VF | |
| Ortalama Intel Core i7-12700H (25586 - 79442, n=64) | |
| Asus TUF A15 FA507 | |
| Gigabyte G5 KE | |
| Asus VivoBook Pro 16 | |
| AIDA64 / Memory Write | |
| Sınıf ortalaması Multimedia (11755 - 134998, n=53, son 2 yıl) | |
| Intel NUC X15 LAPAC71H | |
| Dell Inspiron 16 Plus 7630 | |
| MSI Cyborg 15 A12VF | |
| Asus TUF A15 FA507 | |
| Ortalama Intel Core i7-12700H (23679 - 88660, n=64) | |
| Gigabyte G5 KE | |
| Asus VivoBook Pro 16 | |
| AIDA64 / Memory Latency | |
| Sınıf ortalaması Multimedia (7 - 535, n=52, son 2 yıl) | |
| Gigabyte G5 KE | |
| Dell Inspiron 16 Plus 7630 | |
| Asus VivoBook Pro 16 | |
| MSI Cyborg 15 A12VF | |
| Intel NUC X15 LAPAC71H | |
| Asus TUF A15 FA507 | |
| Ortalama Intel Core i7-12700H (76.2 - 133.9, n=62) | |
* ... daha küçük daha iyidir
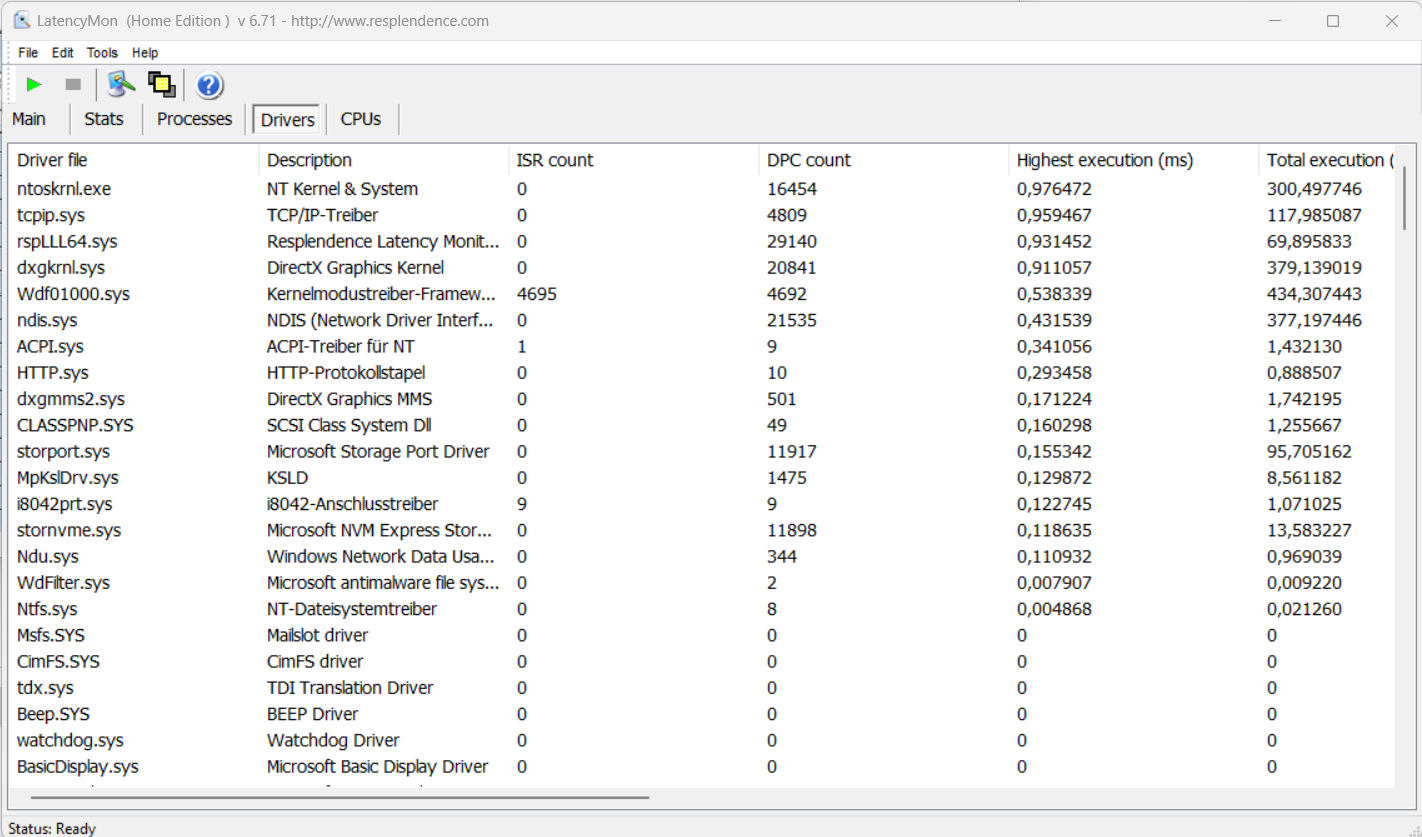
DPC gecikme süresi
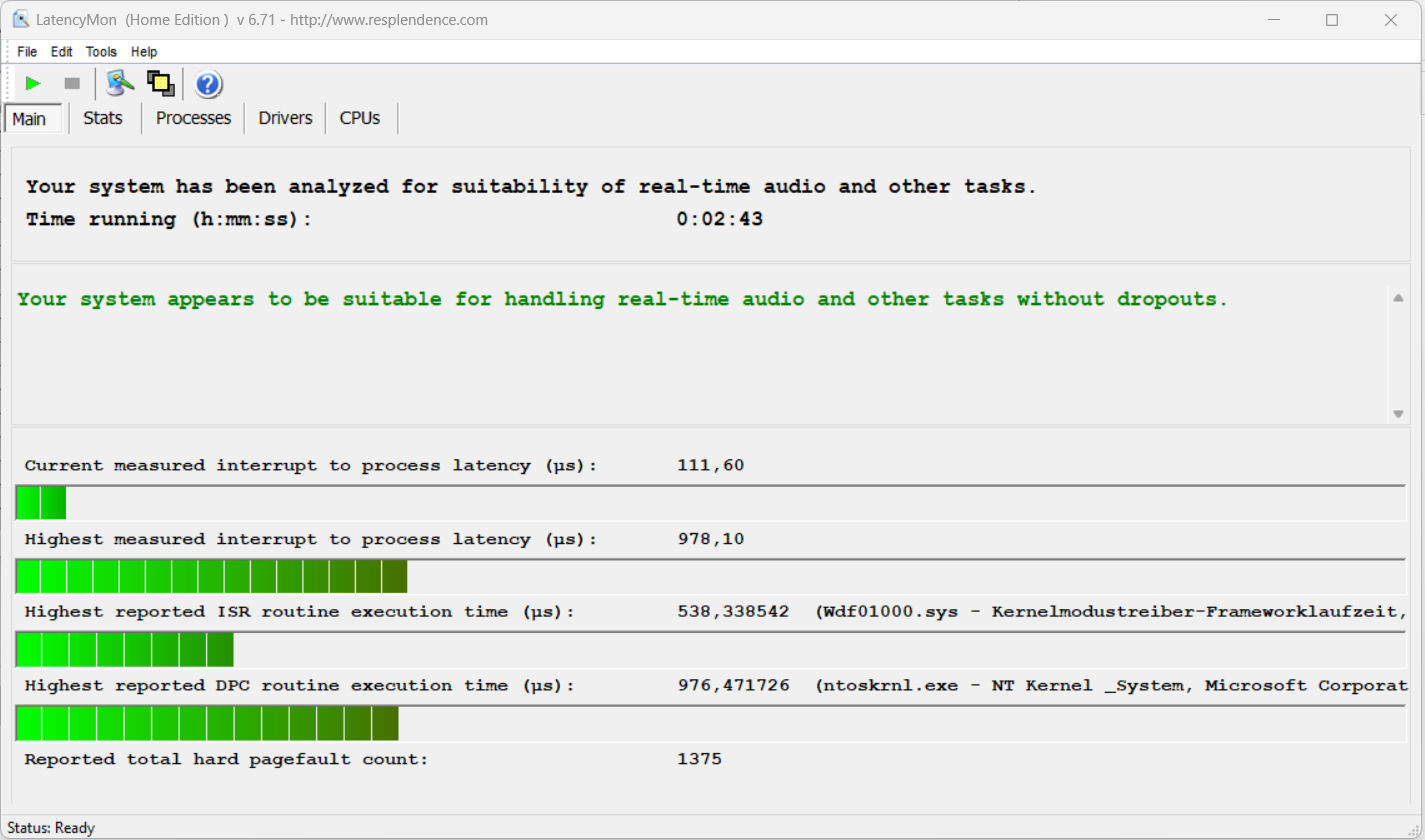
Standartlaştırılmış gecikme monitör testi (web'de gezinme, 4k video oynatma, Prime95 yüksek yük) herhangi bir anormallik ortaya çıkarmadı. Sistem gerçek zamanlı video ve ses düzenleme için uygun görünüyor. Gelecekteki yazılım güncellemeleri iyileştirmelere ve hatta bozulmalara yol açabilir.
| DPC Latencies / LatencyMon - interrupt to process latency (max), Web, Youtube, Prime95 | |
| Asus VivoBook Pro 16 | |
| MSI Cyborg 15 A12VF | |
| Dell Inspiron 16 Plus 7630 | |
| Gigabyte G5 KE | |
| Intel NUC X15 LAPAC71H | |
* ... daha küçük daha iyidir
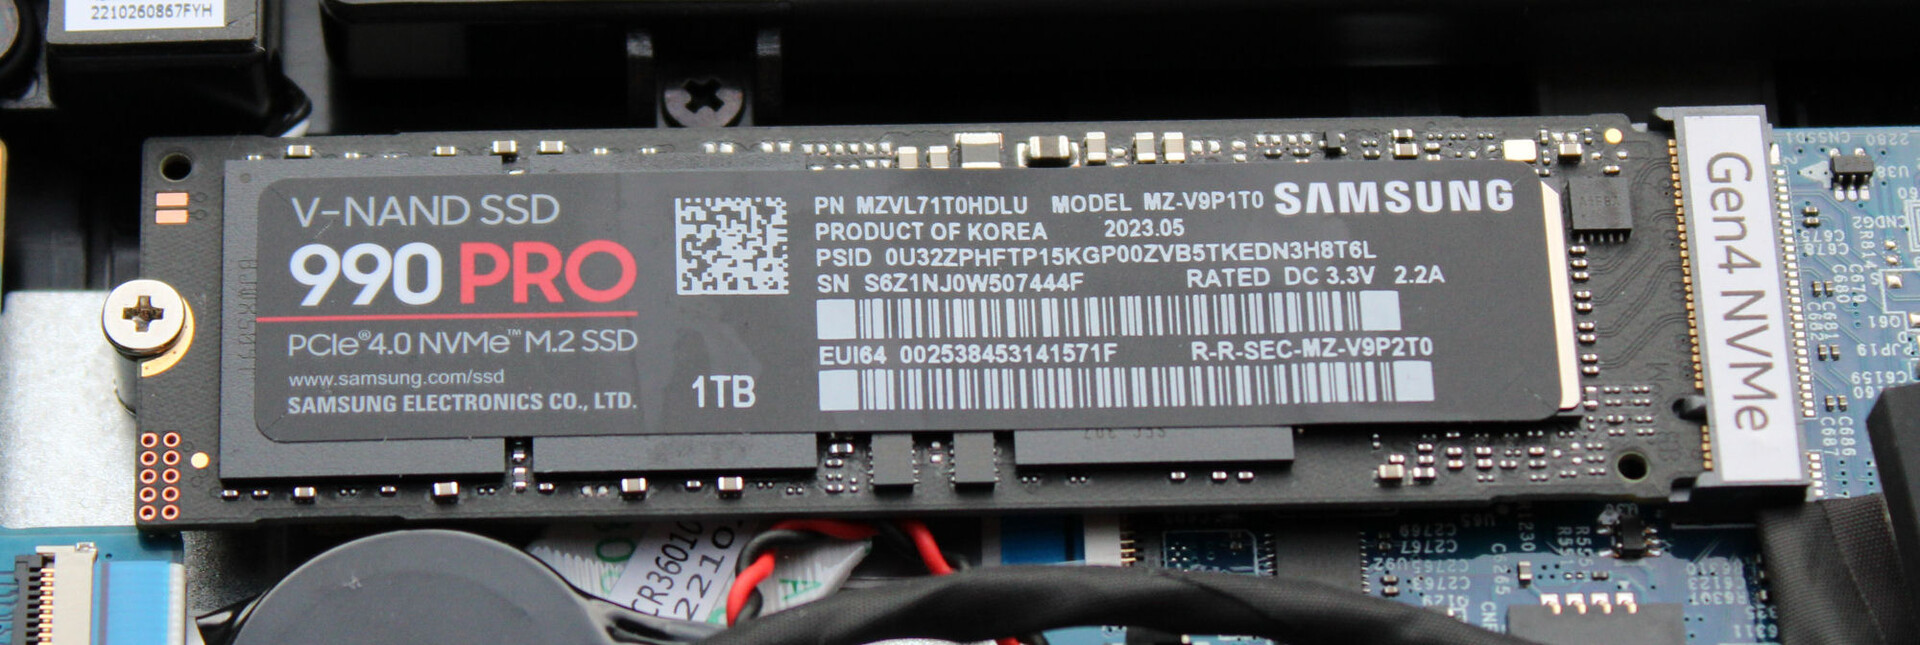
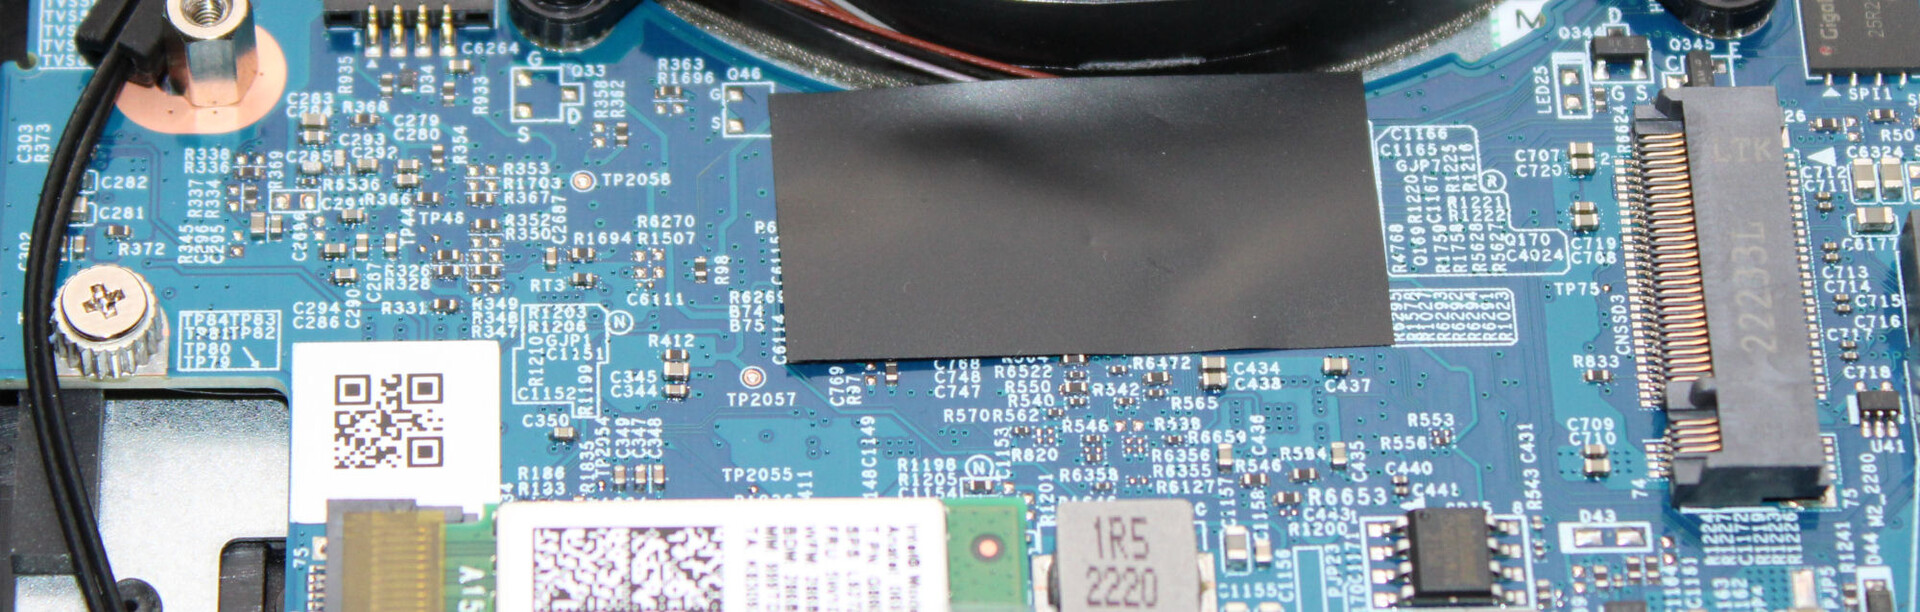
Depolama cihazları
Dizüstü bilgisayar iki adet M.2-2280 SSD (1x PCIe 4.0, 1x PCIe 3.0/SATA) barındırabilir. RAID-0/1 desteklenmektedir. Test cihazımızdaki Samsung SSD (1 TB, PCIe 4, M.2-2280) mükemmel aktarım hızları sağladı. Pozitif: Termal daralma meydana gelmedi.

| Drive Performance rating - Percent | |
| Intel NUC X15 LAPAC71H | |
| Ortalama Samsung 990 Pro 1 TB | |
| Gigabyte G5 KE | |
| MSI Cyborg 15 A12VF | |
| Sınıf ortalaması Multimedia | |
| Dell Inspiron 16 Plus 7630 | |
| Asus VivoBook Pro 16 | |
| Asus TUF A15 FA507 | |
* ... daha küçük daha iyidir
Reading continuous performance: DiskSpd Read Loop, Queue Depth 8
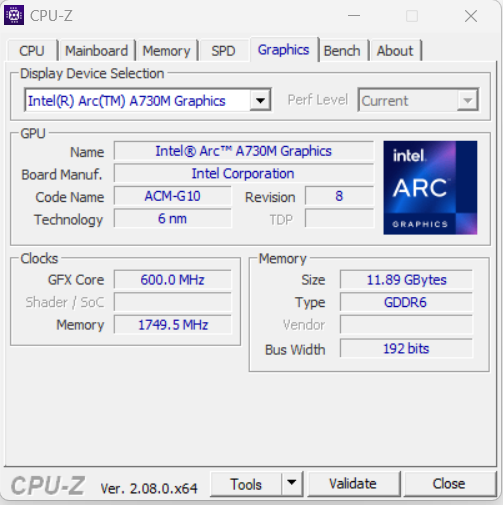
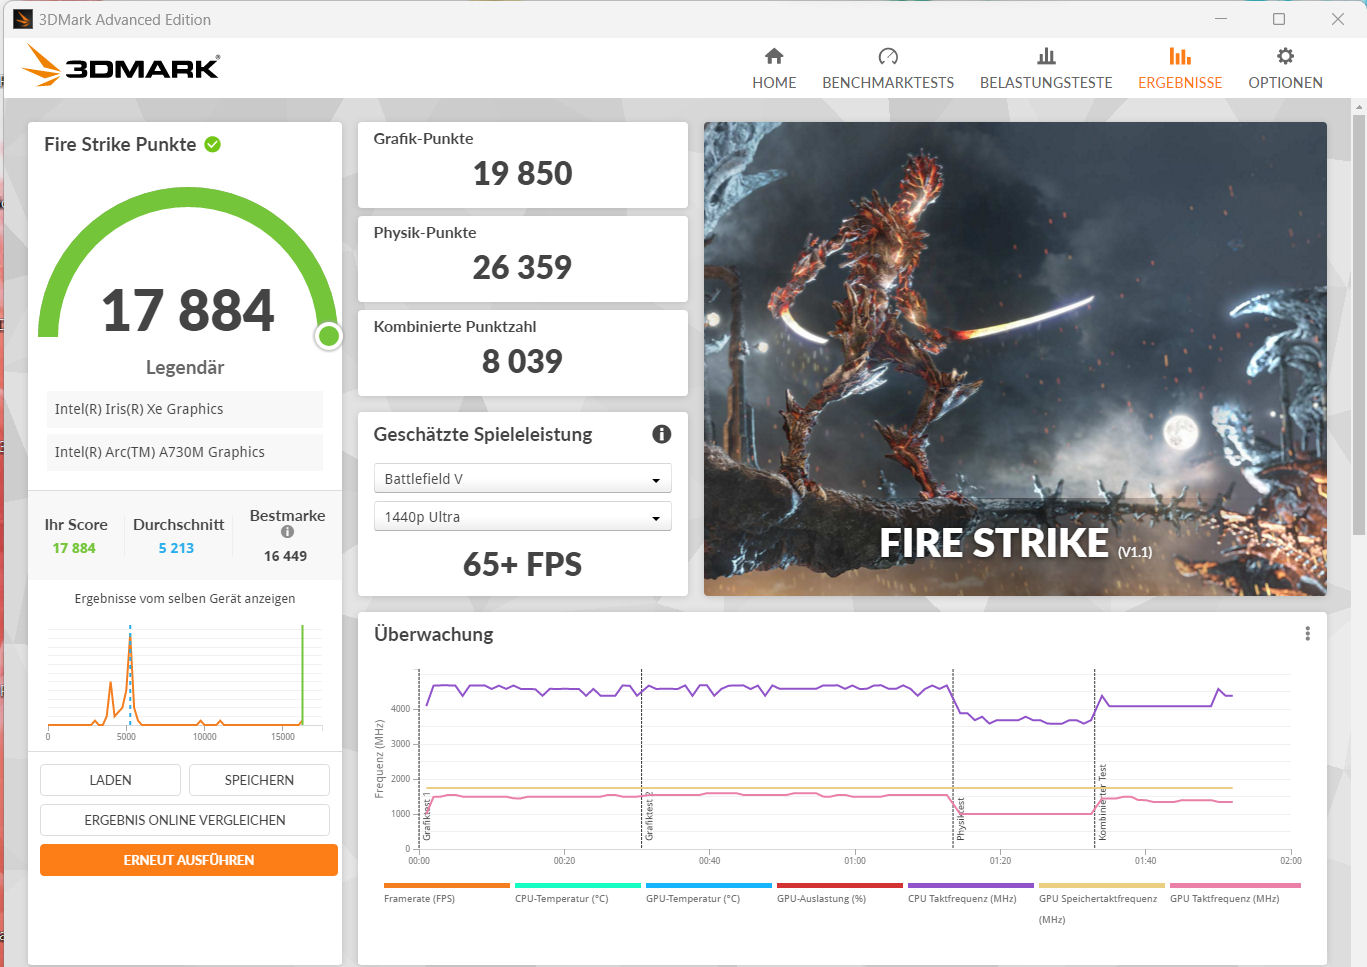
Grafik kartı
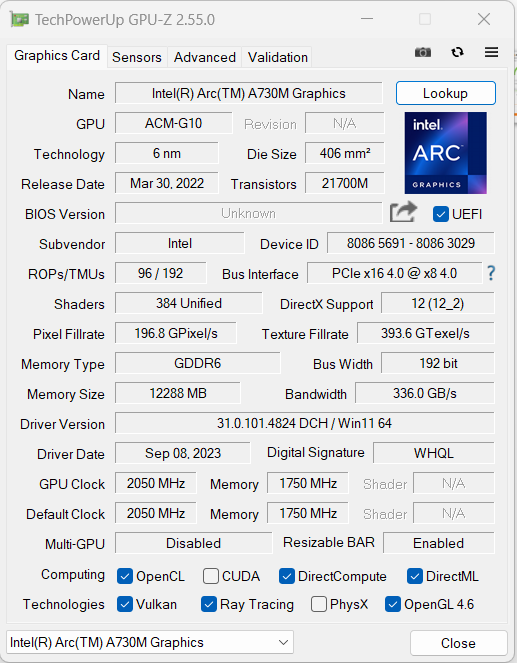
BuArc A730M- Intel'in en güçlü ikinci mobil DGPU'su - maksimum 85 watt TGP'ye sahiptir, süper hızlı GDDR6 belleğe (12.288 GB) dayanır ve maksimum 2,05 GHz saat hızına ulaşabilir. Grafik çekirdeği, orta ila yüksek ayarlarda FHD oyun için uygundur. Daha az zorlu oyunlar daha fazlasına izin verir.
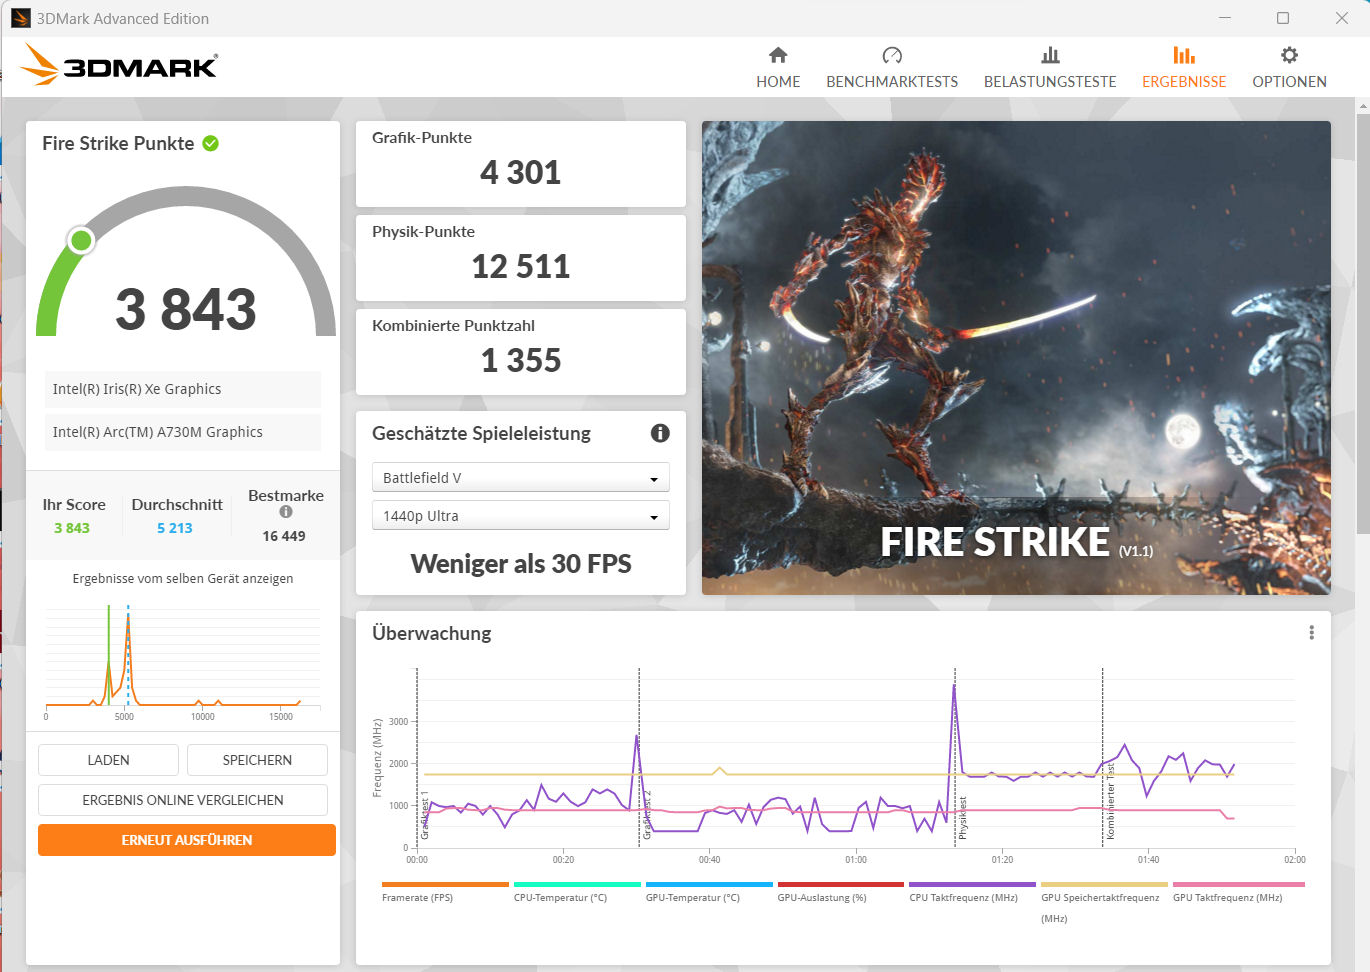
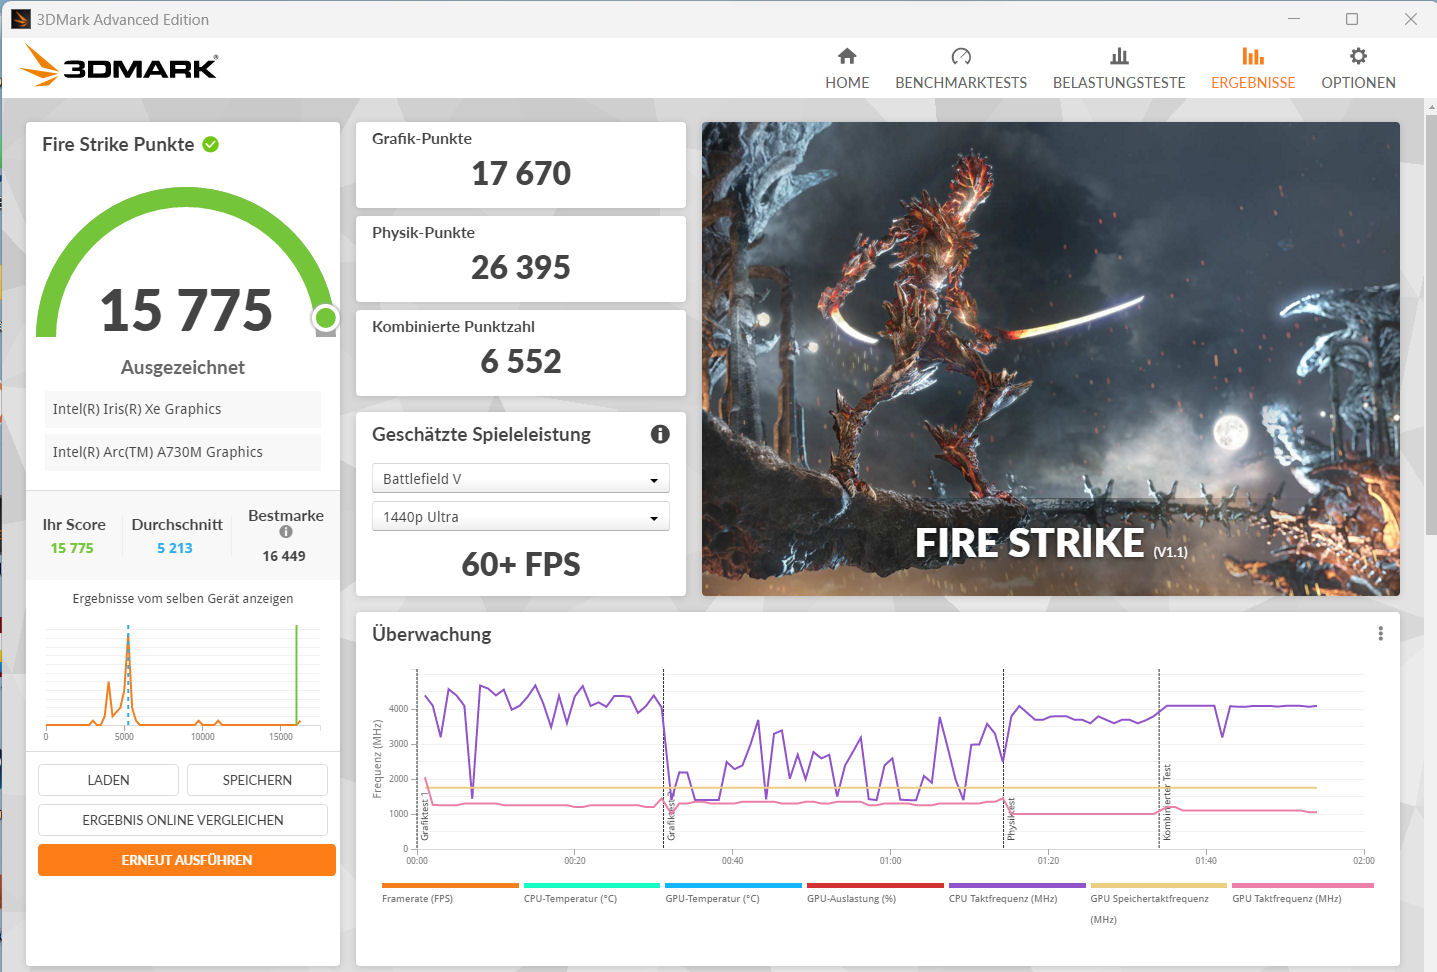
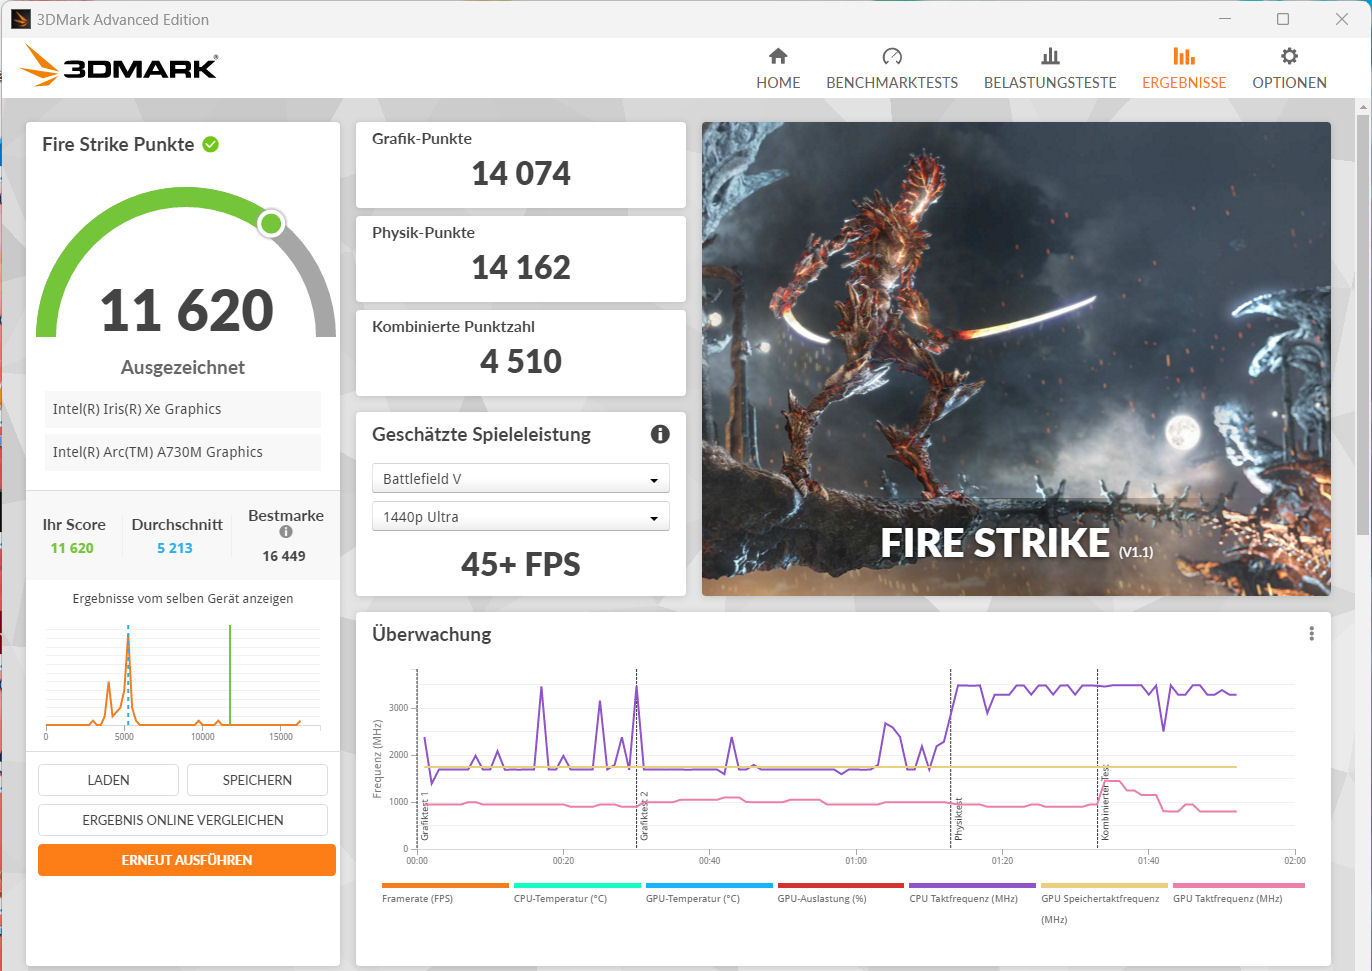
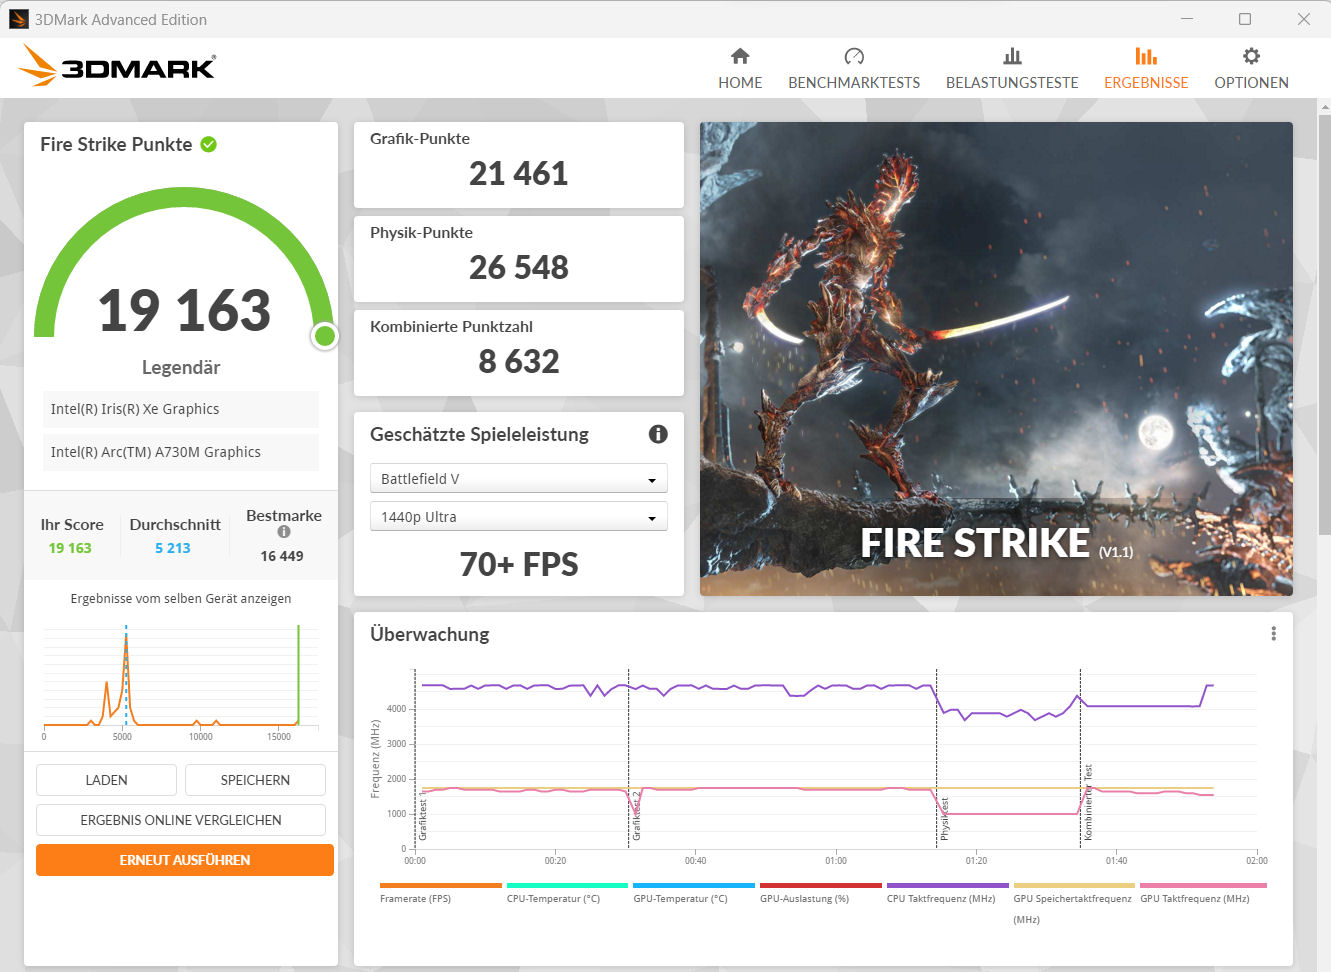
GPU performansı büyük ölçüde hangi performans modunun kullanıldığına bağlıdır: "Performans" profili, daha önce belirlenen GPU ortalamasının altında (sentetik kıyaslamalar) veya eşit (oyun pratiği) kıyaslama sonuçlarıyla sonuçlandı. Maksimum performans "Benchmark Mode" aktifken elde edildi (TGP: 85 watt). Sonuç olarak GPU, en iyi performans sıralamasındaGeForce RTX 3050 veRTX 3060 performans açısından.
| 3DMark Performance rating - Percent | |
| Asus TUF A15 FA507 -1! | |
| Gigabyte G5 KE | |
| MSI Cyborg 15 A12VF | |
| Dell Inspiron 16 Plus 7630 -1! | |
| Ortalama Intel Arc A730M | |
| Intel NUC X15 LAPAC71H | |
| Sınıf ortalaması Multimedia | |
| Asus VivoBook Pro 16 | |
| 3DMark 11 - 1280x720 Performance GPU | |
| Asus TUF A15 FA507 | |
| Gigabyte G5 KE | |
| Ortalama Intel Arc A730M (24928 - 31551, n=4) | |
| Dell Inspiron 16 Plus 7630 | |
| MSI Cyborg 15 A12VF | |
| Intel NUC X15 LAPAC71H | |
| Sınıf ortalaması Multimedia (3749 - 60002, n=54, son 2 yıl) | |
| Asus VivoBook Pro 16 | |
| 3DMark | |
| 1280x720 Cloud Gate Standard Graphics | |
| MSI Cyborg 15 A12VF | |
| Gigabyte G5 KE | |
| Intel NUC X15 LAPAC71H | |
| Ortalama Intel Arc A730M (75370 - 105420, n=4) | |
| Asus VivoBook Pro 16 | |
| Sınıf ortalaması Multimedia (16765 - 143501, n=32, son 2 yıl) | |
| 1920x1080 Fire Strike Graphics | |
| Asus TUF A15 FA507 | |
| Gigabyte G5 KE | |
| Dell Inspiron 16 Plus 7630 | |
| Ortalama Intel Arc A730M (19850 - 22620, n=4) | |
| MSI Cyborg 15 A12VF | |
| Intel NUC X15 LAPAC71H | |
| Sınıf ortalaması Multimedia (2328 - 48907, n=57, son 2 yıl) | |
| Asus VivoBook Pro 16 | |
| 2560x1440 Time Spy Graphics | |
| Ortalama Intel Arc A730M (7212 - 10352, n=4) | |
| Asus TUF A15 FA507 | |
| Gigabyte G5 KE | |
| Dell Inspiron 16 Plus 7630 | |
| MSI Cyborg 15 A12VF | |
| Intel NUC X15 LAPAC71H | |
| Sınıf ortalaması Multimedia (696 - 19403, n=57, son 2 yıl) | |
| Asus VivoBook Pro 16 | |
| 3DMark 11 Performance | 23160 puan | |
| 3DMark Cloud Gate Standard Score | 46415 puan | |
| 3DMark Fire Strike Score | 17884 puan | |
| 3DMark Time Spy Score | 7653 puan | |
Yardım | ||
| Blender - v3.3 Classroom CPU | |
| Ortalama Intel Arc A730M (315 - 633, n=3) | |
| MSI Cyborg 15 A12VF | |
| Gigabyte G5 KE | |
| Intel NUC X15 LAPAC71H | |
| Sınıf ortalaması Multimedia (134.5 - 1042, n=61, son 2 yıl) | |
| Dell Inspiron 16 Plus 7630 | |
| Asus VivoBook Pro 16 | |
| Asus TUF A15 FA507 | |
| Asus TUF A15 FA507 | |
| Geekbench 5.5 | |
| OpenCL Score | |
| Gigabyte G5 KE | |
| Dell Inspiron 16 Plus 7630 | |
| MSI Cyborg 15 A12VF | |
| Asus TUF A15 FA507 | |
| Ortalama Intel Arc A730M (20185 - 138625, n=3) | |
| Intel NUC X15 LAPAC71H | |
| Asus VivoBook Pro 16 | |
| Sınıf ortalaması Multimedia (11562 - 217159, n=55, son 2 yıl) | |
| Vulkan Score 5.5 | |
| Intel NUC X15 LAPAC71H | |
| Dell Inspiron 16 Plus 7630 | |
| Sınıf ortalaması Multimedia (9837 - 161655, n=48, son 2 yıl) | |
| Ortalama Intel Arc A730M (20299 - 61294, n=3) | |
| V-Ray Benchmark Next 4.10 | |
| GPU | |
| Asus TUF A15 FA507 | |
| MSI Cyborg 15 A12VF | |
| Gigabyte G5 KE | |
| Sınıf ortalaması Multimedia (32 - 1191, n=52, son 2 yıl) | |
| Asus VivoBook Pro 16 | |
| Intel NUC X15 LAPAC71H | |
| Ortalama Intel Arc A730M (53 - 88, n=3) | |
| CPU | |
| Sınıf ortalaması Multimedia (4772 - 35165, n=52, son 2 yıl) | |
| Intel NUC X15 LAPAC71H | |
| MSI Cyborg 15 A12VF | |
| Asus TUF A15 FA507 | |
| Asus VivoBook Pro 16 | |
| Gigabyte G5 KE | |
| Ortalama Intel Arc A730M (9833 - 15998, n=3) | |
* ... daha küçük daha iyidir
| Performance rating - Percent | |
| Dell Inspiron 16 Plus 7630 -1! | |
| Gigabyte G5 KE | |
| MSI Cyborg 15 A12VF | |
| Asus TUF A15 FA507 | |
| Asus VivoBook Pro 16 | |
| Sınıf ortalaması Multimedia | |
| Intel NUC X15 LAPAC71H | |
| Ortalama Intel Arc A730M | |
| The Witcher 3 - 1920x1080 Ultra Graphics & Postprocessing (HBAO+) | |
| Dell Inspiron 16 Plus 7630 | |
| Gigabyte G5 KE | |
| Asus TUF A15 FA507 | |
| MSI Cyborg 15 A12VF | |
| Asus VivoBook Pro 16 | |
| Sınıf ortalaması Multimedia (11 - 107, n=5, son 2 yıl) | |
| Ortalama Intel Arc A730M (39.8 - 49.4, n=2) | |
| Intel NUC X15 LAPAC71H | |
| GTA V - 1920x1080 Highest AA:4xMSAA + FX AF:16x | |
| Gigabyte G5 KE | |
| MSI Cyborg 15 A12VF | |
| Asus TUF A15 FA507 | |
| Sınıf ortalaması Multimedia (7.92 - 141.6, n=53, son 2 yıl) | |
| Asus VivoBook Pro 16 | |
| Ortalama Intel Arc A730M (40.1 - 43.1, n=3) | |
| Intel NUC X15 LAPAC71H | |
| Final Fantasy XV Benchmark - 1920x1080 High Quality | |
| Gigabyte G5 KE | |
| Dell Inspiron 16 Plus 7630 | |
| Asus TUF A15 FA507 | |
| MSI Cyborg 15 A12VF | |
| Sınıf ortalaması Multimedia (7.61 - 144.4, n=56, son 2 yıl) | |
| Asus VivoBook Pro 16 | |
| Ortalama Intel Arc A730M (41.1 - 49.7, n=3) | |
| Intel NUC X15 LAPAC71H | |
| Strange Brigade - 1920x1080 ultra AA:ultra AF:16 | |
| Dell Inspiron 16 Plus 7630 | |
| Gigabyte G5 KE | |
| Asus TUF A15 FA507 | |
| MSI Cyborg 15 A12VF | |
| Ortalama Intel Arc A730M (116.6 - 137.7, n=3) | |
| Intel NUC X15 LAPAC71H | |
| Sınıf ortalaması Multimedia (13.3 - 303, n=55, son 2 yıl) | |
| Asus VivoBook Pro 16 | |
| Dota 2 Reborn - 1920x1080 ultra (3/3) best looking | |
| Dell Inspiron 16 Plus 7630 | |
| Gigabyte G5 KE | |
| MSI Cyborg 15 A12VF | |
| Asus TUF A15 FA507 | |
| Asus VivoBook Pro 16 | |
| Sınıf ortalaması Multimedia (29 - 179.9, n=57, son 2 yıl) | |
| Intel NUC X15 LAPAC71H | |
| Ortalama Intel Arc A730M (80.4 - 91.9, n=3) | |
| X-Plane 11.11 - 1920x1080 high (fps_test=3) | |
| Dell Inspiron 16 Plus 7630 | |
| MSI Cyborg 15 A12VF | |
| Asus VivoBook Pro 16 | |
| Gigabyte G5 KE | |
| Asus TUF A15 FA507 | |
| Sınıf ortalaması Multimedia (16.9 - 141.1, n=53, son 2 yıl) | |
| Intel NUC X15 LAPAC71H | |
| Ortalama Intel Arc A730M (14.4 - 47.6, n=3) | |
Witcher 3 FPS diagram
| düşük | orta | yüksek | ultra | |
|---|---|---|---|---|
| GTA V (2015) | 177.4 | 170.6 | 94.3 | 40.1 |
| The Witcher 3 (2015) | 267.3 | 190.3 | 106.9 | 39.8 |
| Dota 2 Reborn (2015) | 102.2 | 101.6 | 96.8 | 91.9 |
| Final Fantasy XV Benchmark (2018) | 98.5 | 67.9 | 41.1 | |
| X-Plane 11.11 (2018) | 70.7 | 55.8 | 47.6 | |
| Strange Brigade (2018) | 377 | 167.8 | 140 | 116.6 |
| Control (2019) | 145.7 | 66 | 51.1 | |
| Flight Simulator 2020 (2020) | 69.3 | 44.2 | 33.7 | 25.7 |
| Cyberpunk 2077 1.6 (2022) | 70.5 | 57.5 | 50.4 | 47 |
| Uncharted Legacy of Thieves Collection (2022) | 31.3 | 35.3 | 27.6 | 26.7 |
| Call of Duty Modern Warfare 2 2022 (2022) | 77 | 65 | 56 | 55 |
| Spider-Man Miles Morales (2022) | 60.5 | 58 | 53.4 | 51.4 |
| The Callisto Protocol (2022) | 80.2 | 72.6 | 67.9 | 47.5 |
| Need for Speed Unbound (2022) | 59.8 | 52.5 | 44.7 | 37.9 |
| High On Life (2023) | 147.9 | 110.1 | 80.9 | 64.7 |
| The Witcher 3 v4 (2023) | 126.2 | 102.8 | 51.2 | 44.4 |
| Dead Space Remake (2023) | 48.2 | 46.7 | 42.2 | 41.3 |
| Hogwarts Legacy (2023) | 69.6 | 48.6 | 43.7 | 34.3 |
| Returnal (2023) | 55 | 53 | 49 | 41 |
| Atomic Heart (2023) | 100.1 | 73.3 | 51.1 | 37.5 |
| Company of Heroes 3 (2023) | 111.3 | 90.6 | 74 | 72.8 |
| Sons of the Forest (2023) | 53.1 | 35.2 | 34.9 | 34.2 |
| Resident Evil 4 Remake (2023) | 86.4 | 64.9 | 60 | 41.3 |
| The Last of Us (2023) | 34.3 | 32.2 | 31.3 | 28.7 |
| Star Wars Jedi Survivor (2023) | 44 | 39.4 | 36.7 | 34.7 |
| Diablo 4 (2023) | 129.7 | 115.6 | 104.5 | 87.8 |
| F1 23 (2023) | 164.9 | 150.3 | 109.6 | 33.1 |
| Ratchet & Clank Rift Apart (2023) | 55.4 | 50.7 | 42.5 | 42.1 |
| Atlas Fallen (2023) | 78 | 74.1 | 70.4 | 59.2 |
| Starfield (2023) | 34 | 30.1 | 24.8 | 22 |
| The Crew Motorfest (2023) | 60 | 57 | 50 | 46 |
| Lies of P (2023) | 97 | 85.8 | 75.1 | 67 |
| Baldur's Gate 3 (2023) | 74.6 | 63 | 55.1 | 52.8 |
| Cyberpunk 2077 (2023) | 71.6 | 57 | 50 | 47.7 |
| EA Sports FC 24 (2023) | 121.8 | |||
| Assassin's Creed Mirage (2023) | 60 | 55 | 55 | 44 |
| Total War Pharaoh (2023) | 207.4 | 121.7 | 74.9 | 60.9 |
| Lords of the Fallen (2023) | 45.1 | 40.1 | 36.8 | 35.4 |
Emisyonlar ve Güç - NUC X15 yetersiz çalışma süreleri sunar
Gürültü emisyonları
Oyun oynarken, dizüstü bilgisayarın gürültü emisyonları 51 dB(A)'ya ("Performans") kadar yükselir. "Benchmark Modu", fanlar sürekli olarak tam hızda çalıştığı için daha da yüksek emisyonlara yol açar. Boş modda ve günlük kullanımda (ofis, internet), NUC çok daha sessizdir. Ancak: İki fandan biri sürekli olarak düşük hızda çalışıyor. NUC Software Studio'da "Pasif Soğutma Modu" ayarı etkinleştirilerek bu durum önlenebilir.
Ses yüksekliği
| Boşta |
| 23 / 24 / 24 dB |
| Çalışırken |
| 50.61 / 50.89 dB |
 | ||
30 dB sessiz 40 dB(A) duyulabilirlik 50 dB(A) gürültülü |
||
min: | ||
| Intel NUC X15 LAPAC71H A730M, i7-12700H, Samsung 990 Pro 1 TB | Asus TUF A15 FA507 GeForce RTX 4050 Laptop GPU, R7 7735HS, Micron 2400 MTFDKBA512QFM | Gigabyte G5 KE GeForce RTX 3060 Laptop GPU, i5-12500H, Gigabyte AG4512G-SI B10 | Dell Inspiron 16 Plus 7630 GeForce RTX 4060 Laptop GPU, i7-13700H, WD PC SN740 SDDPTQD-1T00 | Asus VivoBook Pro 16 GeForce RTX 3050 Ti Laptop GPU, i7-12700H, Intel SSD 670p SSDPEKNU010TZ | MSI Cyborg 15 A12VF GeForce RTX 4060 Laptop GPU, i7-12650H, Samsung PM9B1 1024GB MZVL41T0HBLB | |
|---|---|---|---|---|---|---|
| Noise | 11% | -15% | 4% | -10% | -28% | |
| kapalı / ortam * (dB) | 23 | 23.3 -1% | 19.52 15% | 23.2 -1% | 25.2 -10% | 27 -17% |
| Idle Minimum * (dB) | 23 | 23.3 -1% | 31.05 -35% | 23.2 -1% | 25.2 -10% | 27 -17% |
| Idle Average * (dB) | 24 | 23.3 3% | 31.05 -29% | 23.2 3% | 25.2 -5% | 37.5 -56% |
| Idle Maximum * (dB) | 24 | 23.3 3% | 31.05 -29% | 23.2 3% | 25.2 -5% | 38 -58% |
| Load Average * (dB) | 50.61 | 29.6 42% | 55.66 -10% | 35.1 31% | 55.1 -9% | 56.3 -11% |
| Witcher 3 ultra * (dB) | 50.65 | 43 15% | 55.7 -10% | 52.5 -4% | ||
| Load Maximum * (dB) | 50.89 | 43 16% | 55.51 -9% | 52.5 -3% | 61.5 -21% | 56.3 -11% |
* ... daha küçük daha iyidir
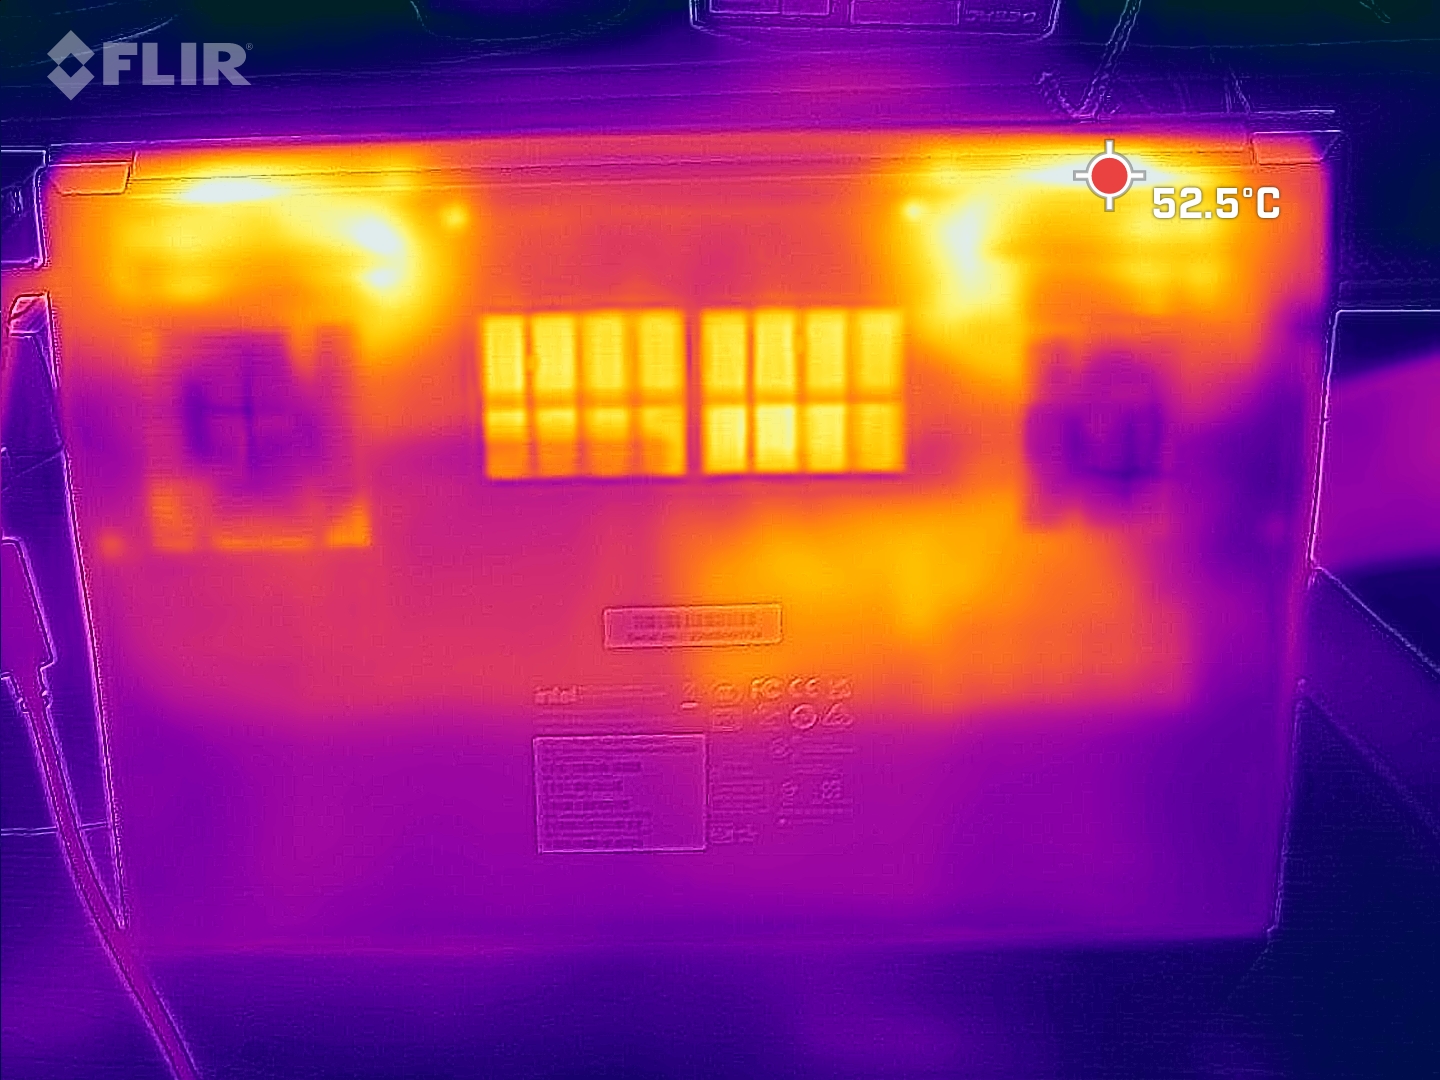
Sıcaklık
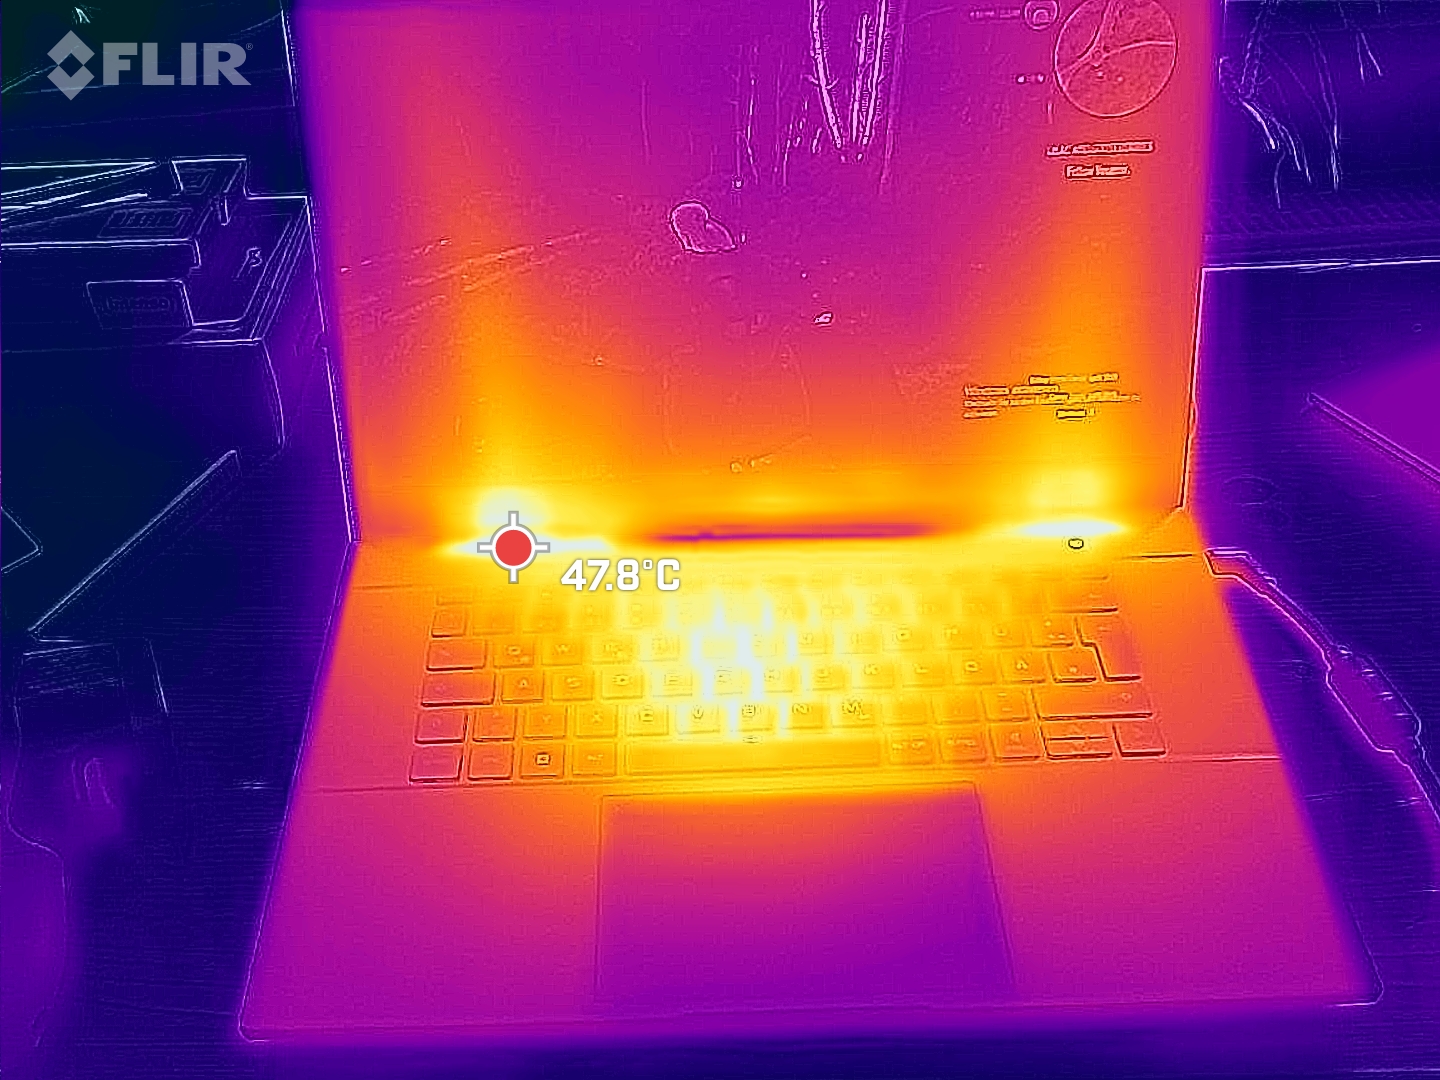
Yüksek yükler (stres testi, Witcher 3 testi) dizüstü bilgisayarın bazı bölgelerde önemli ölçüde ısınmasına neden olur. Sonuç olarak, değerler hiçbir zaman kritik seviyelere ulaşmadı. Günlük kullanımda (ofis, internet) kasa sıcaklıkları yeşil bölge içinde kalmaktadır.
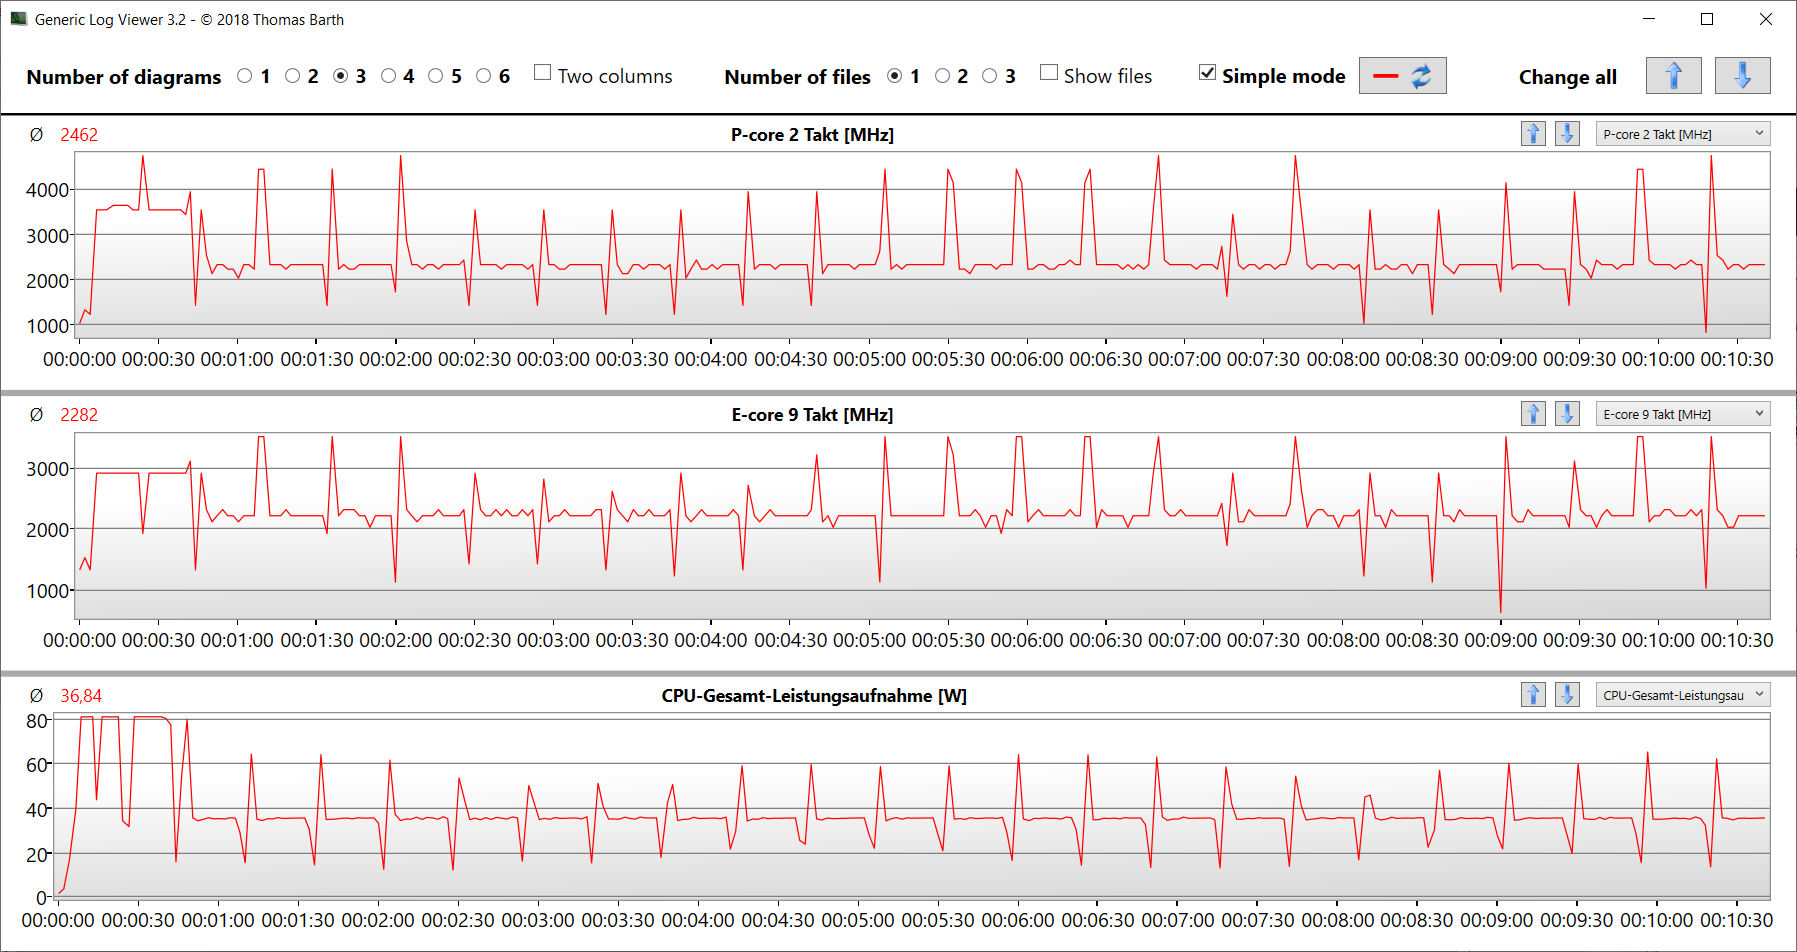
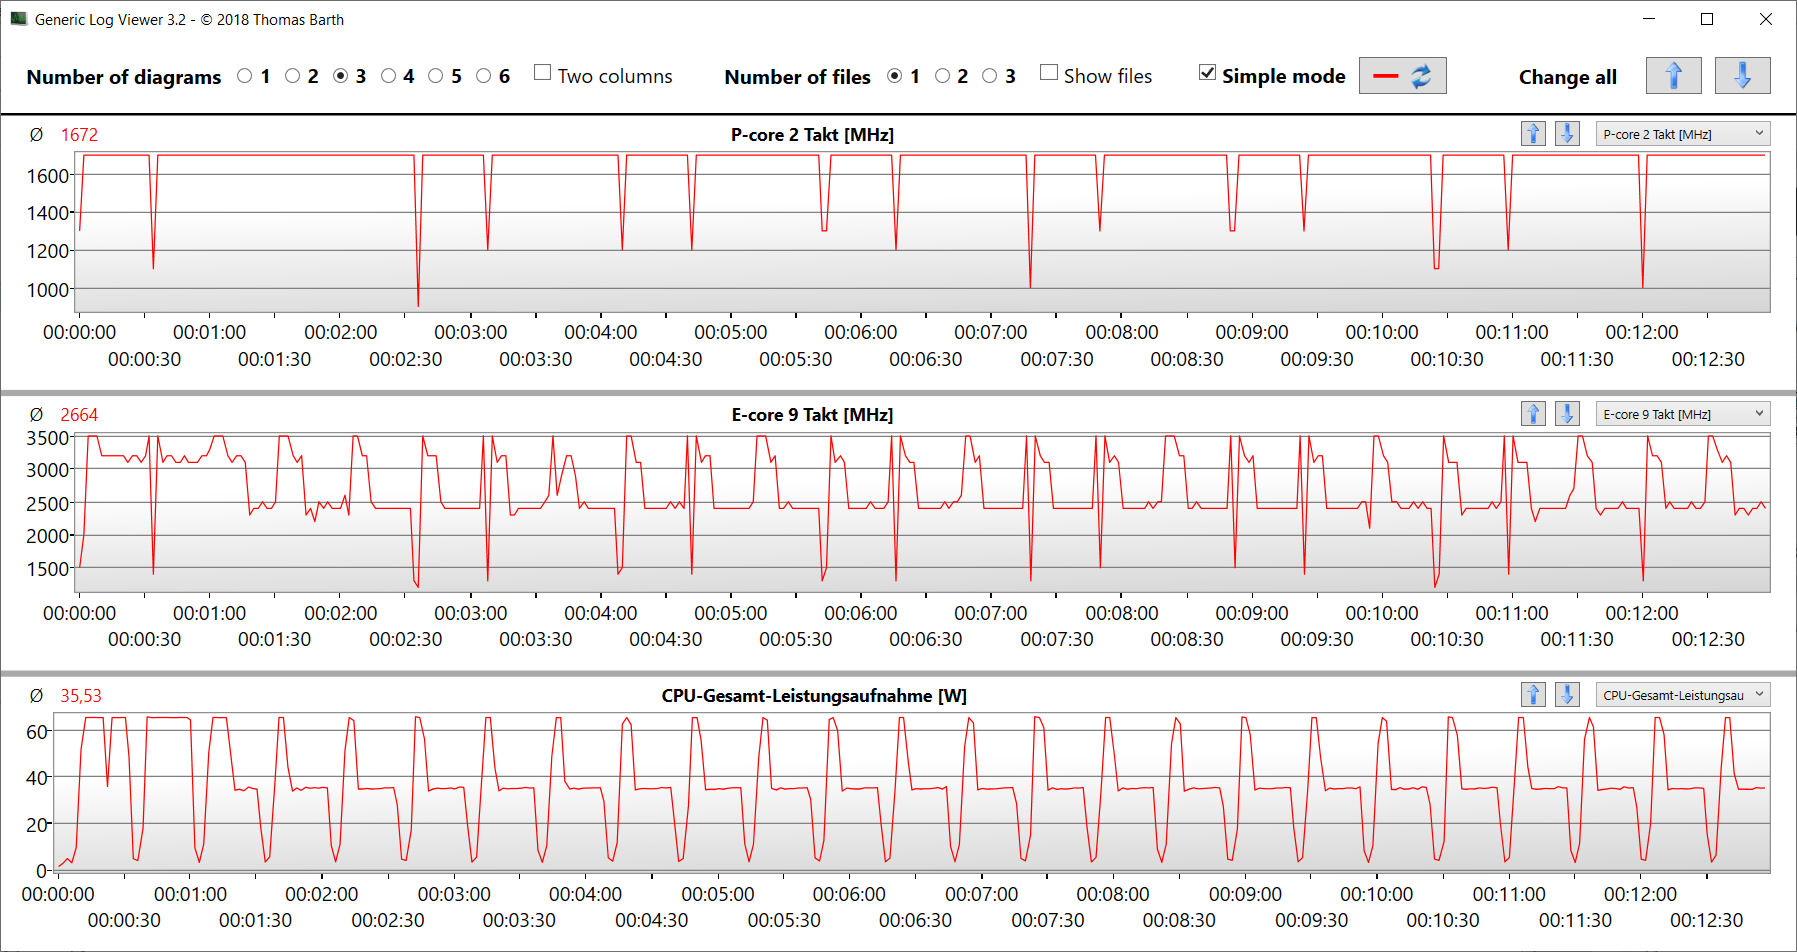
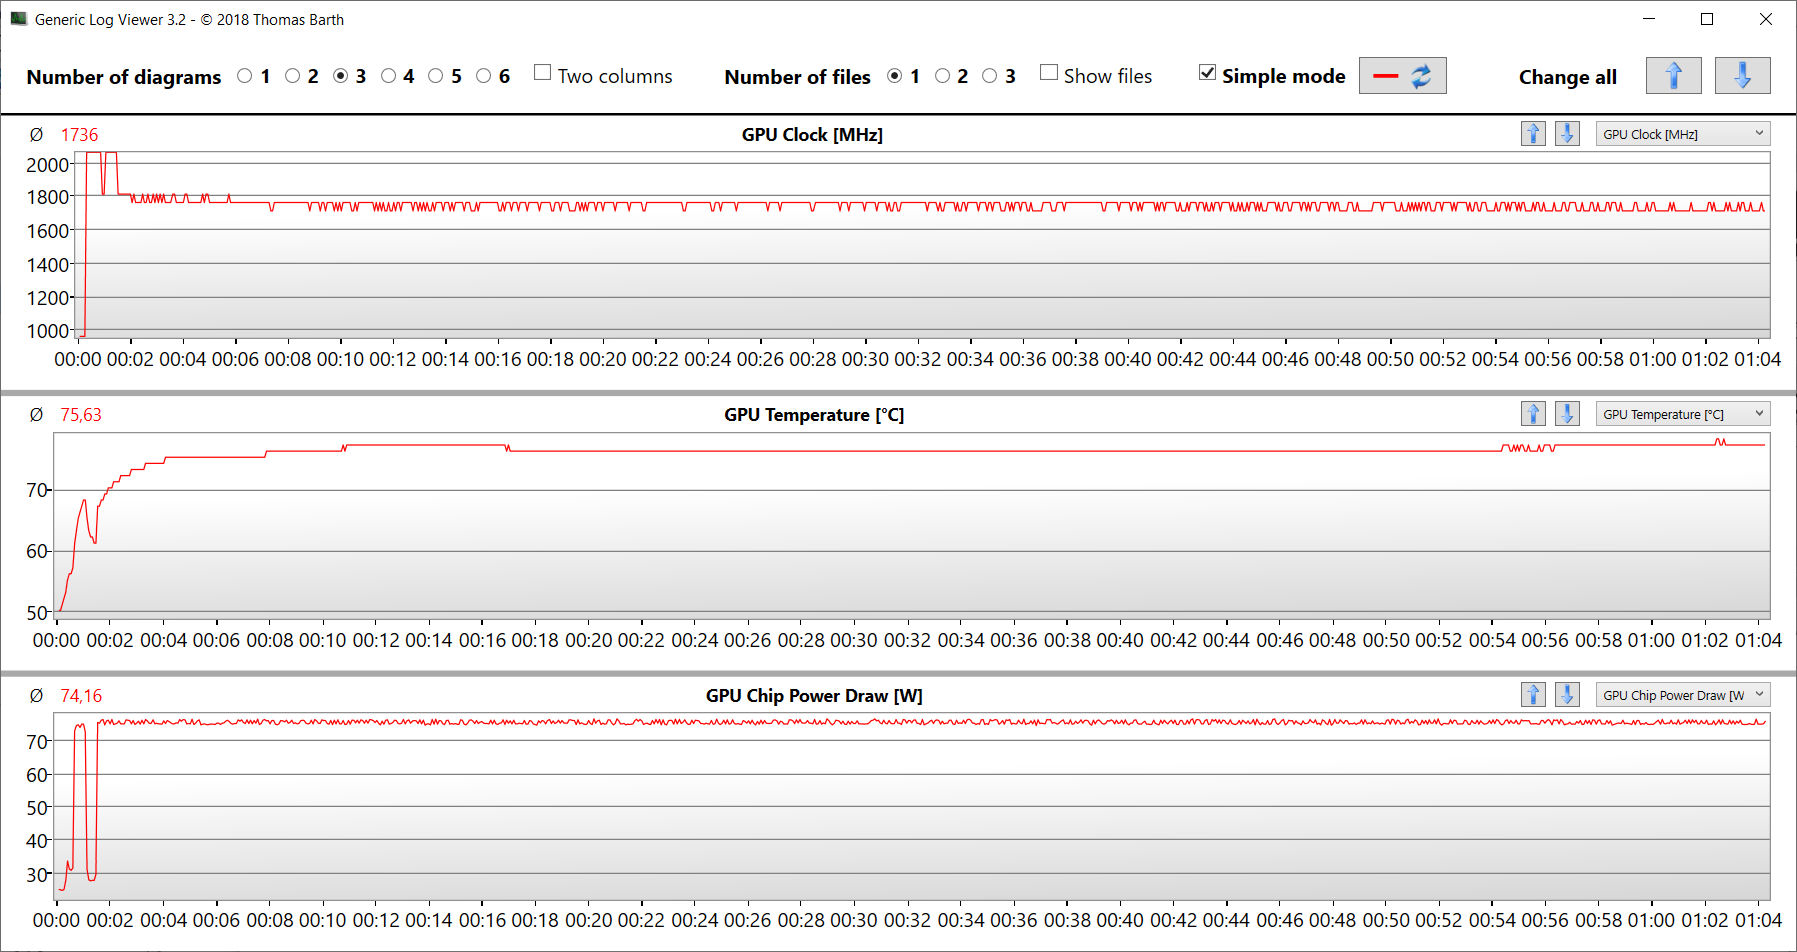
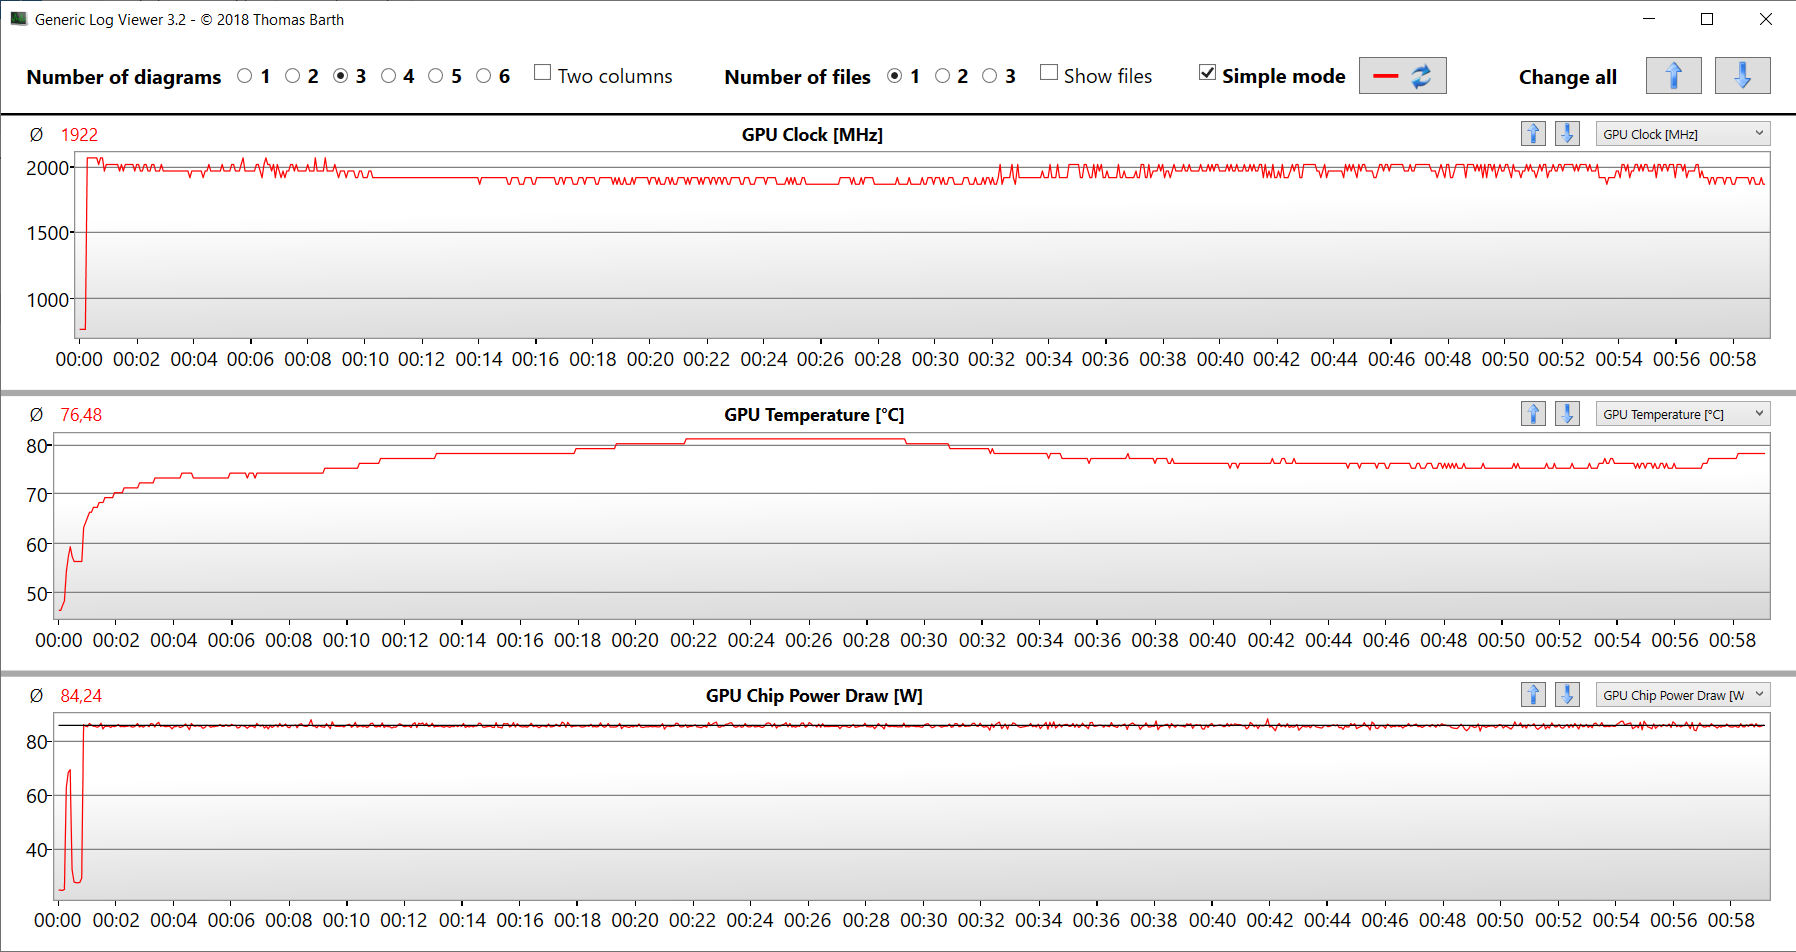
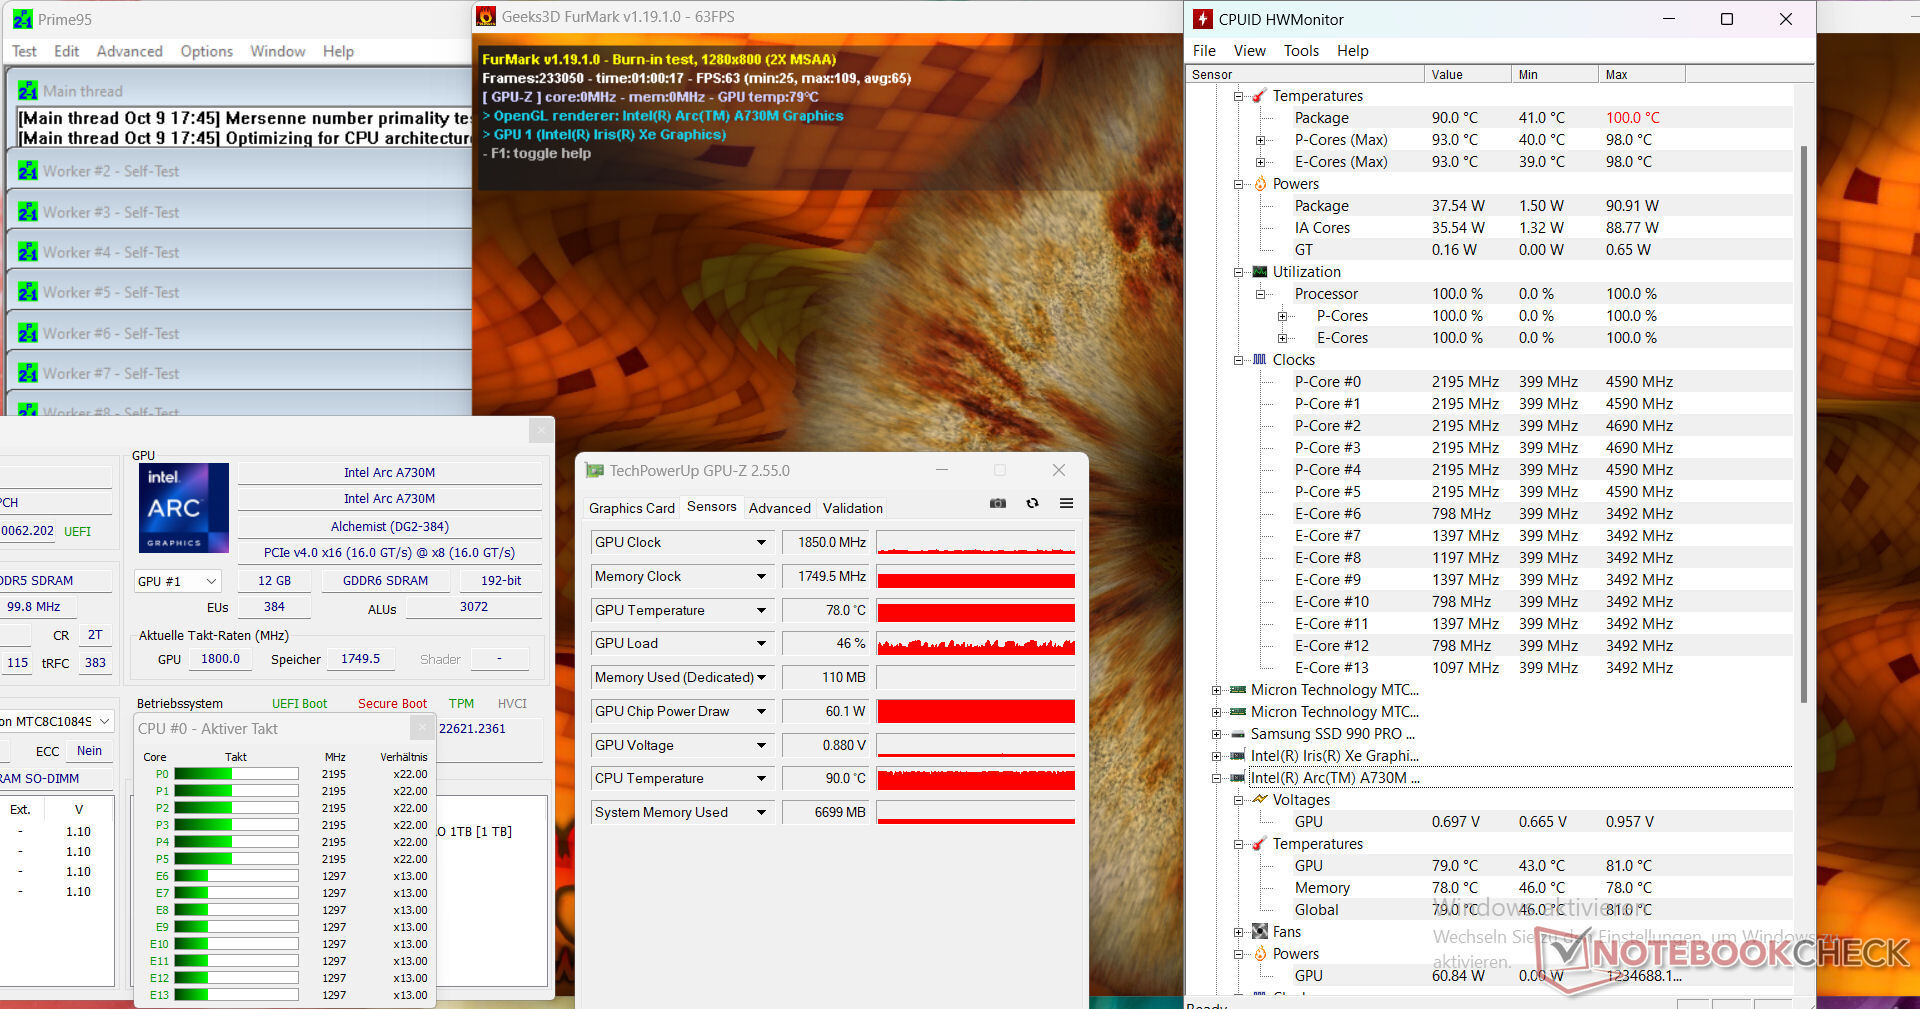
Stres testi (sürekli çalışmada Prime95 ve Furmark), sistemin tam yük altında kararlılığını test etmek için aşırı bir senaryoyu simüle eder. CPU ve GPU saat hızları ortalama aralıkta dalgalanmıştır.
(-) Üst taraftaki maksimum sıcaklık, 36.8 °C / 98 F ortalamasına kıyasla 59 °C / 138 F'dir. , Multimedia sınıfı için 21 ile 71 °C arasında değişir.
(-) Alt kısım, 39.1 °C / 102 F ortalamasına kıyasla maksimum 51 °C / 124 F'ye kadar ısınır
(+) Boşta kullanımda, üst tarafın ortalama sıcaklığı 27.3 °C / 81 F olup, cihazın 31.3 °C / 88 F.
(-) The Witcher 3 oynarken, üst tarafın ortalama sıcaklığı 40.9 °C / 106 F olup, cihazın 31.3 °C / 88 F.
(±) Avuç içi dayanakları ve dokunmatik yüzey maksimum 36 °C / 96.8 F ile dokunulamayacak kadar ısınabilir.
(-) Benzer cihazların avuç içi dayanağı alanının ortalama sıcaklığı 28.7 °C / 83.7 F (-7.3 °C / -13.1 F) idi.
| Intel NUC X15 LAPAC71H Intel Core i7-12700H, Intel Arc A730M | Asus TUF A15 FA507 AMD Ryzen 7 7735HS, NVIDIA GeForce RTX 4050 Laptop GPU | Gigabyte G5 KE Intel Core i5-12500H, NVIDIA GeForce RTX 3060 Laptop GPU | Dell Inspiron 16 Plus 7630 Intel Core i7-13700H, NVIDIA GeForce RTX 4060 Laptop GPU | Asus VivoBook Pro 16 Intel Core i7-12700H, NVIDIA GeForce RTX 3050 Ti Laptop GPU | MSI Cyborg 15 A12VF Intel Core i7-12650H, NVIDIA GeForce RTX 4060 Laptop GPU | |
|---|---|---|---|---|---|---|
| Heat | 10% | -12% | -2% | -6% | 13% | |
| Maximum Upper Side * (°C) | 59 | 48.9 17% | 52.6 11% | 47.8 19% | 44.2 25% | 47.5 19% |
| Maximum Bottom * (°C) | 51 | 44.6 13% | 62.4 -22% | 42.2 17% | 53 -4% | 35.5 30% |
| Idle Upper Side * (°C) | 28 | 27.1 3% | 33.6 -20% | 35.2 -26% | 32.1 -15% | 27.7 1% |
| Idle Bottom * (°C) | 30 | 27.5 8% | 34.8 -16% | 35 -17% | 38.4 -28% | 29.5 2% |
* ... daha küçük daha iyidir
Konuşmacılar
Stereo hoparlörler iyi bir ses üretiyor ancak neredeyse hiç bas yok.
Intel NUC X15 LAPAC71H ses analizi
(±) | hoparlör ses yüksekliği ortalama ama iyi (79.38 dB)
Bas 100 - 315Hz
(-) | neredeyse hiç bas yok - ortalama olarak medyandan 17.1% daha düşük
(±) | Bas doğrusallığı ortalamadır (14.2% delta - önceki frekans)
Ortalar 400 - 2000 Hz
(+) | dengeli ortalar - medyandan yalnızca 1.7% uzakta
(+) | orta frekanslar doğrusaldır (3.8% deltadan önceki frekansa)
Yüksekler 2 - 16 kHz
(+) | dengeli yüksekler - medyandan yalnızca 2.2% uzakta
(+) | yüksekler doğrusaldır (5.4% deltadan önceki frekansa)
Toplam 100 - 16.000 Hz
(+) | genel ses doğrusaldır (12.1% ortancaya göre fark)
Aynı sınıfla karşılaştırıldığında
» Bu sınıftaki tüm test edilen cihazların %22%'si daha iyi, 3% benzer, 76% daha kötüydü
» En iyisinin deltası 5% idi, ortalama 17% idi, en kötüsü 45% idi
Test edilen tüm cihazlarla karşılaştırıldığında
» Test edilen tüm cihazların %10'si daha iyi, 2 benzer, % 88 daha kötüydü
» En iyisinin deltası 4% idi, ortalama 23% idi, en kötüsü 134% idi
Dell Inspiron 16 Plus 7630 ses analizi
(±) | hoparlör ses yüksekliği ortalama ama iyi (81.8 dB)
Bas 100 - 315Hz
(-) | neredeyse hiç bas yok - ortalama olarak medyandan 17% daha düşük
(±) | Bas doğrusallığı ortalamadır (8.4% delta - önceki frekans)
Ortalar 400 - 2000 Hz
(±) | daha yüksek ortalar - ortalama olarak medyandan 6.3% daha yüksek
(+) | orta frekanslar doğrusaldır (6.2% deltadan önceki frekansa)
Yüksekler 2 - 16 kHz
(+) | dengeli yüksekler - medyandan yalnızca 2.2% uzakta
(+) | yüksekler doğrusaldır (5.6% deltadan önceki frekansa)
Toplam 100 - 16.000 Hz
(±) | Genel sesin doğrusallığı ortalamadır (15.9% ortancaya göre fark)
Aynı sınıfla karşılaştırıldığında
» Bu sınıftaki tüm test edilen cihazların %40%'si daha iyi, 6% benzer, 54% daha kötüydü
» En iyisinin deltası 5% idi, ortalama 17% idi, en kötüsü 45% idi
Test edilen tüm cihazlarla karşılaştırıldığında
» Test edilen tüm cihazların %25'si daha iyi, 5 benzer, % 70 daha kötüydü
» En iyisinin deltası 4% idi, ortalama 23% idi, en kötüsü 134% idi
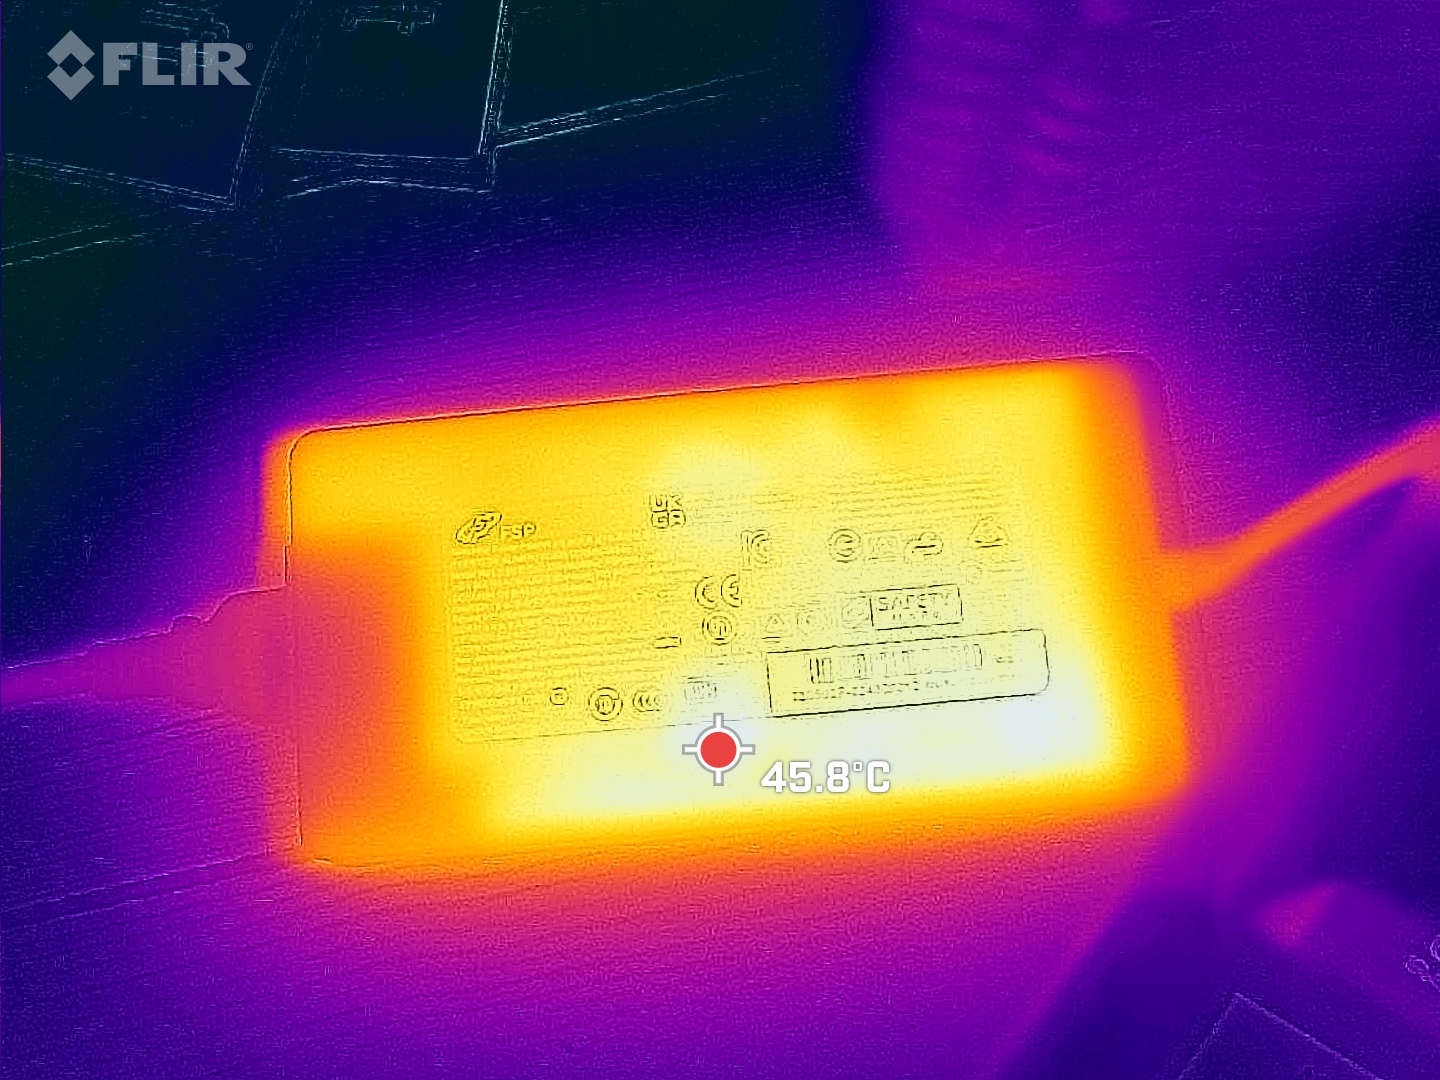
Güç tüketimi
Dizüstü bilgisayarın güç tüketimi, kurulu donanım için beklenen düzeydedir. Stres testi ve Witcher 3 test (biraz) dalgalı güç tüketim seviyeleri ile çalıştırıldı. Birlikte verilen güç kaynağı (230 watt) yeterli büyüklükte.
Watt başına performansına bakılırsa, cihaz çok güç tüketiyor. Karşılaştırma için: Karşılaştırma içinMSI Cyborg yük altında yalnızca yarısı kadar güce ihtiyaç duyar ancak önemli ölçüde daha fazla oyun performansı sunar. BuGeForce RTX 4060 mSI dizüstü bilgisayarın içinde 45 watt'lık bir TGP ile sınırlı olan Arc 730M'den çok daha verimli çalışıyor.
| Kapalı / Bekleme modu | |
| Boşta | |
| Çalışırken |
|
Key:
min: | |
| Intel NUC X15 LAPAC71H Intel Core i7-12700H, Intel Arc A730M | Asus TUF A15 FA507 AMD Ryzen 7 7735HS, NVIDIA GeForce RTX 4050 Laptop GPU | Gigabyte G5 KE Intel Core i5-12500H, NVIDIA GeForce RTX 3060 Laptop GPU | Dell Inspiron 16 Plus 7630 Intel Core i7-13700H, NVIDIA GeForce RTX 4060 Laptop GPU | Asus VivoBook Pro 16 Intel Core i7-12700H, NVIDIA GeForce RTX 3050 Ti Laptop GPU | MSI Cyborg 15 A12VF Intel Core i7-12650H, NVIDIA GeForce RTX 4060 Laptop GPU | |
|---|---|---|---|---|---|---|
| Power Consumption | 12% | -1% | -18% | 1% | 32% | |
| Idle Minimum * (Watt) | 7.5 | 8 -7% | 7.66 -2% | 15.6 -108% | 8.7 -16% | 6 20% |
| Idle Average * (Watt) | 11.9 | 12.1 -2% | 10.3 13% | 17.7 -49% | 13.1 -10% | 8.8 26% |
| Idle Maximum * (Watt) | 13.9 | 12.5 10% | 16.05 -15% | 20.6 -48% | 18.3 -32% | 11.9 14% |
| Load Average * (Watt) | 137 | 74.9 45% | 115.8 15% | 87.4 36% | 116 15% | 89 35% |
| Witcher 3 ultra * (Watt) | 166 | 136.6 18% | 168.7 -2% | 121.7 27% | 117.6 29% | 90.3 46% |
| Load Maximum * (Watt) | 203 | 185 9% | 234.6 -16% | 138 32% | 162 20% | 99 51% |
* ... daha küçük daha iyidir
Power consumption Witcher 3 / stress test
Power consumption with external monitor
Çalışma Zamanları
15,6 inçlik cihaz, gerçekçi WLAN testimizde (bir komut dosyası kullanarak web sayfalarını çağırırken yükü eşleme) 5:44 saatlik çalışma süreleri elde etti - iyi ama müthiş bir değer değil.
| Battery Runtime - WiFi Websurfing | |
| Sınıf ortalaması Multimedia (4.37 - 26.6, n=63, son 2 yıl) | |
| Asus TUF A15 FA507 | |
| Dell Inspiron 16 Plus 7630 | |
| MSI Cyborg 15 A12VF | |
| Asus VivoBook Pro 16 | |
| Intel NUC X15 LAPAC71H | |
| Gigabyte G5 KE | |
Artılar
Eksiler
Karar - Burada yapılacak bir pazarlık yok
Intel, NUC X15 ile oyunculara ve yaratıcı çalışanlara hitap ediyor. Bu da video ve görüntü düzenleme, akış, işleme ve oyun oynamanın dizüstü bilgisayarın kullanım alanlarına ait olduğu anlamına geliyor. ACore i7-12700HveArc A730Mgerekli gücü sağlar - her iki yonga da sürekli olarak yüksek saat hızlarında çalışır.
Intel NUC X15 ne etkiliyor ne de hayal kırıklığına uğratıyor. Bununla birlikte, CPU performansı ve yüksek güç tüketimi göz önüne alındığında, dizüstü bilgisayarın fiyatı çok yüksek.
Verimsiz Arc GPU'su, benzer rakiplerine kıyasla watt başına daha az performans sunuyor. Mevcut tüm GPU'larda (RX7000, RTX 4000) olduğu gibi, A730M'de de ışın izleme çekirdekleri ve AV1 desteği (kod çözme ve kodlama) bulunuyor - yaratıcı bir dizüstü bilgisayarda gerekli olan özellikler.
Cihazın emisyonları bu sınıf için tipiktir. Neredeyse 6 saatlik pratik çalışma süreleri iyi olarak sınıflandırılabilir. USB-C portu (Thunderbolt 4) Güç Dağıtımı'nı desteklemiyor ancak DisplayPort sinyali çıkışı sağlayabiliyor. Ayrıca, dizüstü bilgisayar genişletme seçeneklerine (yerleştirme çözümü, harici GPU) sahiptir. Sonuç olarak, kurulu FHD ekran (15,6 inç, IPS, 144 Hz) üzerimizde iyi bir izlenim bıraktı.
Bir alternatif şu olabilirAsus VivoBook Pro 16: Toplamda biraz daha düşük bilgi işlem performansına sahiptir, ancak daha uzun çalışma süreleri, Power Delivery ve 16:10 ekrandan yararlanır. Aorus 15 9KF-E3DE383SH iyi bir bütçe alternatifi olabilir. GeForce RTX 4060 (TGP: 140 watt) sayesinde X15'ten çok daha iyi oyun performansı sunar. Şu anda internette yaklaşık 1.040 ABD dolarına bulabilirsiniz. Zaten bir test ettikdaha güçlü versiyonaorus 15'in.
Fiyat ve bulunabilirlik
Intel NUC X15 LAPAC71H, Schenker'in çevrimiçi mağazası üzerinden bireysel olarak yapılandırılabilir ve sipariş edilebilir. Mevcut test cihazına yaklaşık 1.280 ABD Doları karşılığında sahip olunabilir. Temel varyant (16 GB RAM, 500 GB SSD) yaklaşık 1.050 ABD Doları karşılığında satın alınabilir.
Intel NUC X15 LAPAC71H
- 10/13/2023 v7 (old)
Sascha Mölck
Şeffaflık
İncelenecek cihazların seçimi editör ekibimiz tarafından yapılır. Test örneği, bu incelemenin amacı doğrultusunda üretici veya perakendeci tarafından yazara ödünç olarak sağlanmıştır. Borç verenin bu inceleme üzerinde herhangi bir etkisi olmadığı gibi, üretici de yayınlanmadan önce bu incelemenin bir kopyasını almamıştır. Bu incelemeyi yayınlama zorunluluğu yoktu. Bağımsız bir medya şirketi olarak Notebookcheck, üreticilerin, perakendecilerin veya yayıncıların otoritesine tabi değildir.
Notebookcheck bu şekilde test yapıyor
Notebookcheck, tüm sonuçların karşılaştırılabilir olmasını sağlamak için her yıl yüzlerce dizüstü bilgisayarı ve akıllı telefonu standart prosedürler kullanarak bağımsız olarak inceliyor. Yaklaşık 20 yıldır test yöntemlerimizi sürekli olarak geliştirdik ve bu süreçte endüstri standartlarını belirledik. Test laboratuvarlarımızda deneyimli teknisyenler ve editörler tarafından yüksek kaliteli ölçüm ekipmanları kullanılmaktadır. Bu testler çok aşamalı bir doğrulama sürecini içerir. Karmaşık derecelendirme sistemimiz, nesnelliği koruyan yüzlerce sağlam temellere dayanan ölçüm ve kıyaslamaya dayanmaktadır.Price comparison

