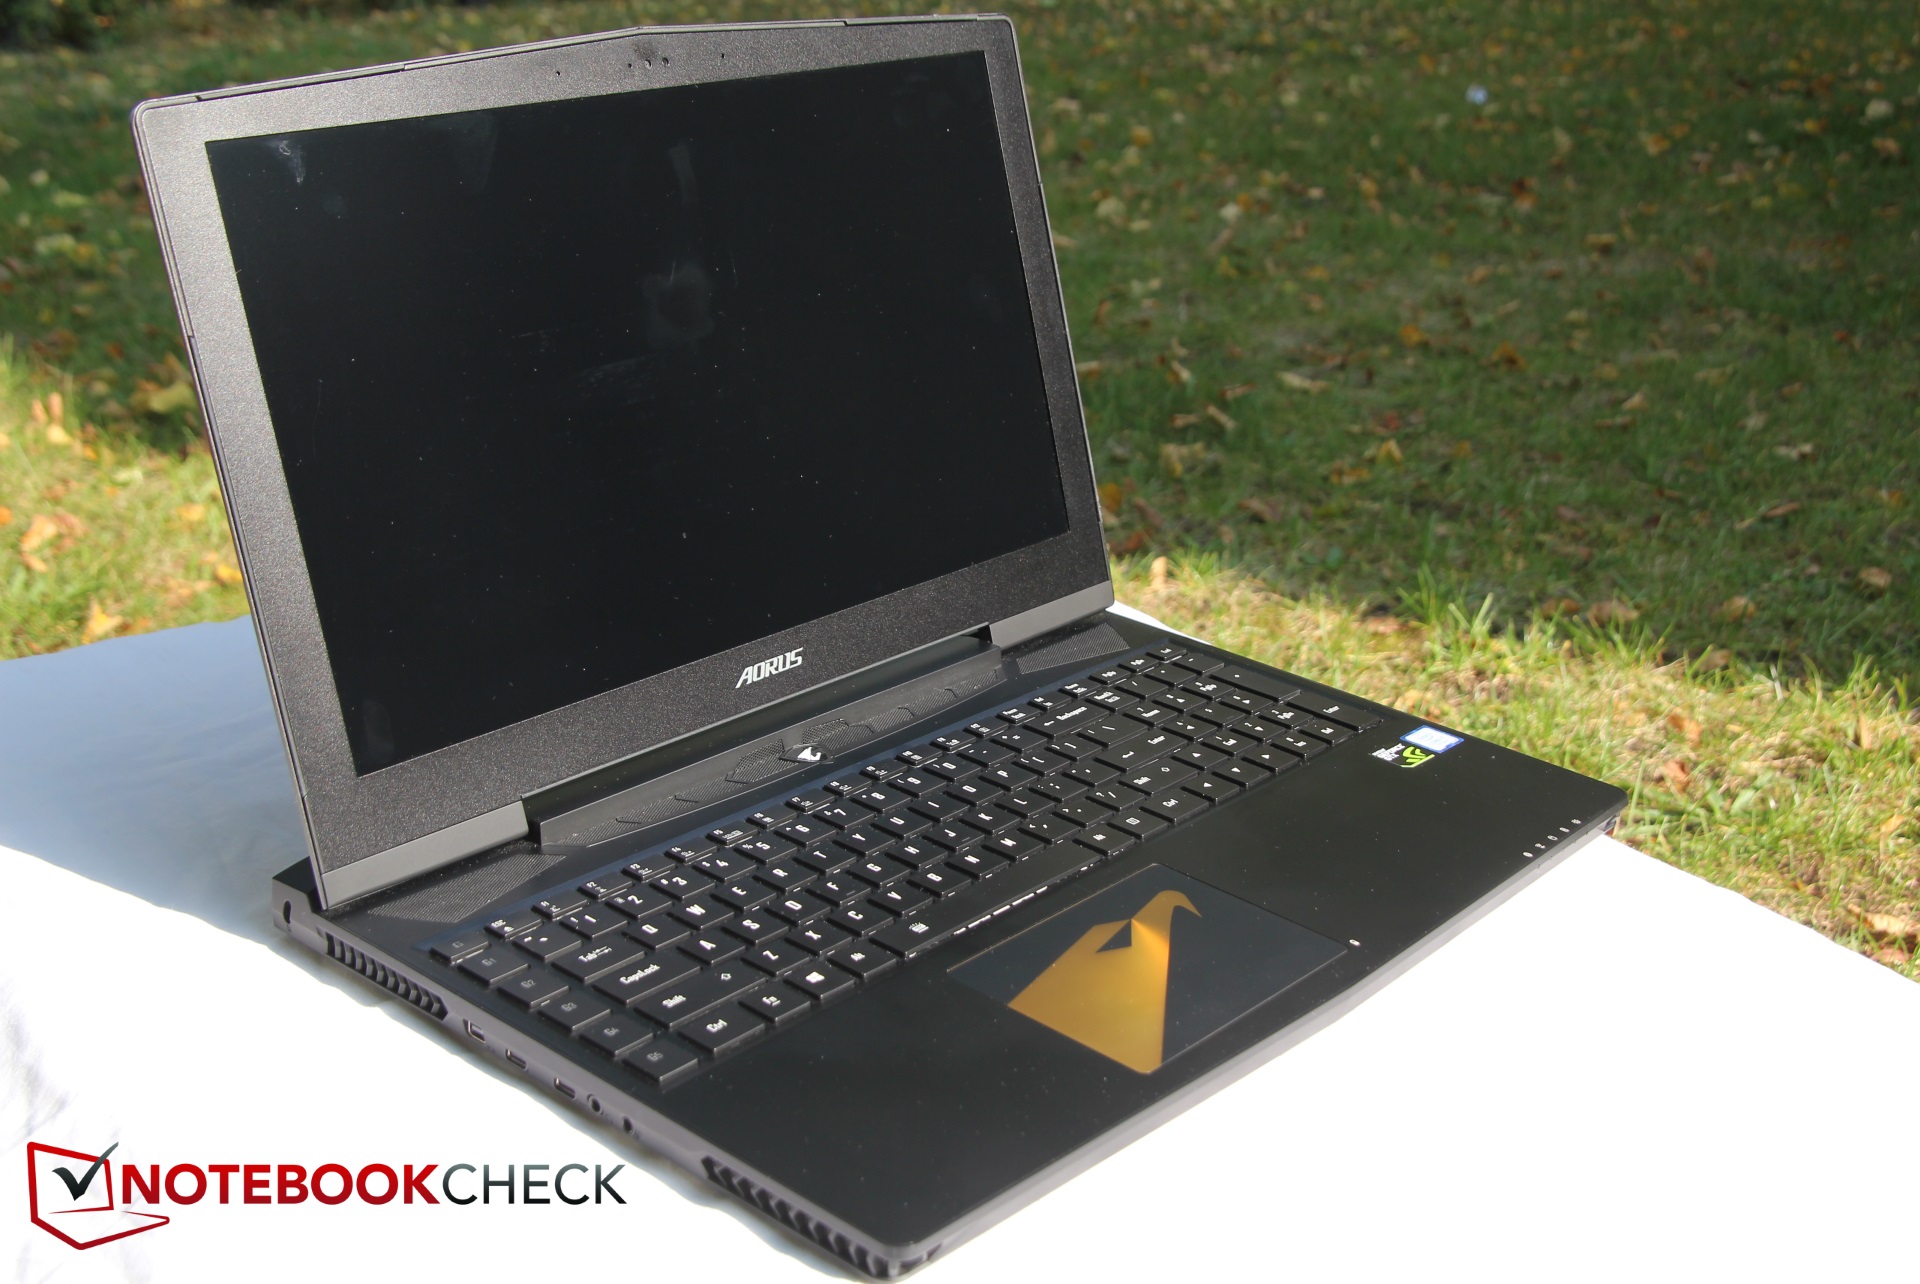
Kısa inceleme: Aorus X5 v7 (i7-7820HK, GTX 1070, UHD) Laptop
| SD Card Reader | |
| average JPG Copy Test (av. of 3 runs) | |
| Aorus X5 v7 (Toshiba Exceria Pro SDXC 64 GB UHS-II) | |
| MSI GT62VR 7RE-223 (Toshiba Exceria Pro SDXC 64 GB UHS-II) | |
| Eurocom Sky MX5 R3 (Toshiba Exceria Pro SDXC 64 GB UHS-II) | |
| Aorus X5 v6 (Toshiba Exceria Pro SDXC 64 GB UHS-II) | |
| Schenker XMG P507 PRO (Toshiba Exceria Pro SDXC 64 GB UHS-II) | |
| Gigabyte P56XT (Toshiba Exceria Pro SDXC 64 GB UHS-II) | |
| maximum AS SSD Seq Read Test (1GB) | |
| Aorus X5 v7 (Toshiba Exceria Pro SDXC 64 GB UHS-II) | |
| MSI GT62VR 7RE-223 (Toshiba Exceria Pro SDXC 64 GB UHS-II) | |
| Aorus X5 v6 (Toshiba Exceria Pro SDXC 64 GB UHS-II) | |
| Eurocom Sky MX5 R3 (Toshiba Exceria Pro SDXC 64 GB UHS-II) | |
| Gigabyte P56XT (Toshiba Exceria Pro SDXC 64 GB UHS-II) | |
| Schenker XMG P507 PRO (Toshiba Exceria Pro SDXC 64 GB UHS-II) | |
| Networking | |
| iperf3 transmit AX12 | |
| Eurocom Sky MX5 R3 | |
| MSI GT62VR 7RE-223 | |
| Schenker XMG P507 PRO | |
| Aorus X5 v7 | |
| Gigabyte P56XT | |
| iperf3 receive AX12 | |
| Gigabyte P56XT | |
| Eurocom Sky MX5 R3 | |
| Schenker XMG P507 PRO | |
| MSI GT62VR 7RE-223 | |
| Aorus X5 v7 | |
| |||||||||||||||||||||||||
Aydınlatma: 92 %
Batarya modunda parlaklık: 307 cd/m²
Kontrast: 1023:1 (Siyah: 0.3 cd/m²)
ΔE ColorChecker Calman: 4.72 | ∀{0.5-29.43 Ø4.72}
ΔE Greyscale Calman: 4.79 | ∀{0.09-98 Ø4.97}
92% sRGB (Argyll 1.6.3 3D)
60% AdobeRGB 1998 (Argyll 1.6.3 3D)
66.3% AdobeRGB 1998 (Argyll 3D)
91.9% sRGB (Argyll 3D)
65.3% Display P3 (Argyll 3D)
Gamma: 2.42
CCT: 7690 K
| Aorus X5 v7 AU Optronics B156ZAN02.3 (AUO23EB), 3840x2160, 15.6" | Aorus X5 v6 2880x1620, 15.6" | Gigabyte P56XT LG Philips LP156WF6 (LGD046F), 1920x1080, 15.6" | Schenker XMG P507 PRO AUO B156HTN05.2 (AUO52ED), 1920x1080, 15.6" | Eurocom Sky MX5 R3 ID: AUO52ED, Name: AU Optronics B156HTN05.2, 1920x1080, 15.6" | MSI GT62VR 7RE-223 LG Philips LP156WF6 (LGD046F), 1920x1080, 15.6" | |
|---|---|---|---|---|---|---|
| Display | -5% | -5% | -1% | -2% | -7% | |
| Display P3 Coverage (%) | 65.3 | 62.5 -4% | 64.8 -1% | 66.4 2% | 65.9 1% | 63.9 -2% |
| sRGB Coverage (%) | 91.9 | 86.2 -6% | 84.6 -8% | 88.9 -3% | 87.8 -4% | 83.1 -10% |
| AdobeRGB 1998 Coverage (%) | 66.3 | 62.5 -6% | 61.8 -7% | 65.1 -2% | 64.2 -3% | 60.8 -8% |
| Response Times | 1% | 11% | 50% | 60% | 11% | |
| Response Time Grey 50% / Grey 80% * (ms) | 44 ? | 34 ? 23% | 37.2 ? 15% | 24 ? 45% | 20.8 ? 53% | 37 ? 16% |
| Response Time Black / White * (ms) | 26.4 ? | 32 ? -21% | 24.8 ? 6% | 12 ? 55% | 8.8 ? 67% | 25 ? 5% |
| PWM Frequency (Hz) | 198.4 | 20000 ? | ||||
| Screen | -3% | -14% | -38% | -48% | -3% | |
| Brightness middle (cd/m²) | 307 | 280.4 -9% | 301 -2% | 357 16% | 416.2 36% | 310 1% |
| Brightness (cd/m²) | 297 | 271 -9% | 280 -6% | 365 23% | 409 38% | 311 5% |
| Brightness Distribution (%) | 92 | 83 -10% | 87 -5% | 85 -8% | 94 2% | 85 -8% |
| Black Level * (cd/m²) | 0.3 | 0.249 17% | 0.32 -7% | 0.5 -67% | 0.86 -187% | 0.3 -0% |
| Contrast (:1) | 1023 | 1126 10% | 941 -8% | 714 -30% | 484 -53% | 1033 1% |
| Colorchecker dE 2000 * | 4.72 | 4.94 -5% | 6.21 -32% | 9.93 -110% | 8.4 -78% | 4.82 -2% |
| Colorchecker dE 2000 max. * | 8.07 | 8.13 -1% | 10.78 -34% | 14.87 -84% | 15.4 -91% | 10.14 -26% |
| Greyscale dE 2000 * | 4.79 | 5.13 -7% | 6.08 -27% | 10.32 -115% | 11.2 -134% | 3.94 18% |
| Gamma | 2.42 91% | 2.26 97% | 2.31 95% | 2.11 104% | 2.23 99% | 2.45 90% |
| CCT | 7690 85% | 7433 87% | 7375 88% | 10096 64% | 10036 65% | 6877 95% |
| Color Space (Percent of AdobeRGB 1998) (%) | 60 | 55.9 -7% | 55 -8% | 58 -3% | 57.2 -5% | 54 -10% |
| Color Space (Percent of sRGB) (%) | 92 | 85.9 -7% | 84 -9% | 89 -3% | 87.3 -5% | 83 -10% |
| Toplam Ortalama (Program / Ayarlar) | -2% /
-3% | -3% /
-9% | 4% /
-19% | 3% /
-24% | 0% /
-2% |
* ... daha küçük daha iyidir
Yanıt Sürelerini Görüntüle
| ↔ Tepki Süresi Siyahtan Beyaza | ||
|---|---|---|
| 26.4 ms ... yükseliş ↗ ve sonbahar↘ birleşimi | ↗ 14 ms yükseliş | 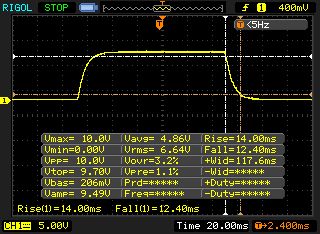 |
| ↘ 12.4 ms sonbahar | ||
| Ekran, testlerimizde nispeten yavaş yanıt oranları gösteriyor ve oyuncular için çok yavaş olabilir. Karşılaştırıldığında, test edilen tüm cihazlar 0.1 (minimum) ile 240 (maksimum) ms arasında değişir. » Tüm cihazların 66 %'si daha iyi. Bu, ölçülen yanıt süresinin test edilen tüm cihazların ortalamasından (19.8 ms) daha kötü olduğu anlamına gelir. | ||
| ↔ Tepki Süresi %50 Griden %80 Griye | ||
| 44 ms ... yükseliş ↗ ve sonbahar↘ birleşimi | ↗ 21.2 ms yükseliş | 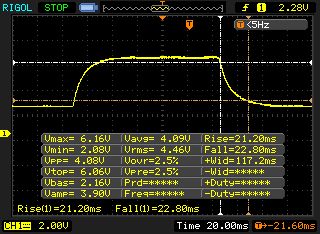 |
| ↘ 22.8 ms sonbahar | ||
| Ekran, testlerimizde yavaş yanıt oranları gösteriyor ve oyuncular için yetersiz olacaktır. Karşılaştırıldığında, test edilen tüm cihazlar 0.165 (minimum) ile 636 (maksimum) ms arasında değişir. » Tüm cihazların 73 %'si daha iyi. Bu, ölçülen yanıt süresinin test edilen tüm cihazların ortalamasından (31 ms) daha kötü olduğu anlamına gelir. | ||
Ekran Titremesi / PWM (Darbe Genişliği Modülasyonu)
| Ekran titriyor / PWM algılanmadı |  | ||
Karşılaştırıldığında: Test edilen tüm cihazların %52 %'si ekranı karartmak için PWM kullanmıyor. PWM tespit edilirse, ortalama 7753 (minimum: 5 - maksimum: 343500) Hz ölçüldü. | |||
| Cinebench R15 | |
| CPU Single 64Bit | |
| Aorus X5 v7 | |
| Aorus X5 v6 | |
| Schenker XMG P507 PRO | |
| MSI GT62VR 7RE-223 | |
| Gigabyte P56XT | |
| Eurocom Sky MX5 R3 | |
| CPU Multi 64Bit | |
| Aorus X5 v7 | |
| Aorus X5 v6 | |
| Eurocom Sky MX5 R3 | |
| Schenker XMG P507 PRO | |
| Gigabyte P56XT | |
| MSI GT62VR 7RE-223 | |
| Cinebench R11.5 | |
| CPU Single 64Bit | |
| Aorus X5 v7 | |
| Aorus X5 v6 | |
| Eurocom Sky MX5 R3 | |
| Gigabyte P56XT | |
| Schenker XMG P507 PRO | |
| MSI GT62VR 7RE-223 | |
| CPU Multi 64Bit | |
| Aorus X5 v7 | |
| Aorus X5 v6 | |
| Eurocom Sky MX5 R3 | |
| Gigabyte P56XT | |
| Schenker XMG P507 PRO | |
| MSI GT62VR 7RE-223 | |
| Cinebench R10 | |
| Rendering Single CPUs 64Bit | |
| Aorus X5 v7 | |
| Rendering Multiple CPUs 64Bit | |
| Aorus X5 v7 | |
| PCMark 8 | |
| Home Score Accelerated v2 | |
| Eurocom Sky MX5 R3 | |
| MSI GT62VR 7RE-223 | |
| Aorus X5 v6 | |
| Aorus X5 v7 | |
| Schenker XMG P507 PRO | |
| Gigabyte P56XT | |
| Work Score Accelerated v2 | |
| MSI GT62VR 7RE-223 | |
| Gigabyte P56XT | |
| Eurocom Sky MX5 R3 | |
| Schenker XMG P507 PRO | |
| Aorus X5 v6 | |
| PCMark 10 - Score | |
| Gigabyte P56XT | |
| PCMark 8 Home Score Accelerated v2 | 4718 puan | |
Yardım | ||
| Aorus X5 v7 Toshiba NVMe THNSN5256GPU7 | Aorus X5 v6 Samsung SM951 MZVPV256 m.2 | Schenker XMG P507 PRO Samsung SSD 960 Evo 500GB m.2 NVMe | Eurocom Sky MX5 R3 Samsung SSD 960 Evo 500GB m.2 NVMe | MSI GT62VR 7RE-223 Samsung SSD PM871a MZNLN256HMHQ | |
|---|---|---|---|---|---|
| CrystalDiskMark 3.0 | 3% | 14% | 2% | -47% | |
| Write 4k QD32 (MB/s) | 556 | 358.7 -35% | 546 -2% | 511 -8% | 257.9 -54% |
| Read 4k QD32 (MB/s) | 697 | 688 -1% | 668 -4% | 524 -25% | 388.4 -44% |
| Write 4k (MB/s) | 137.8 | 158.8 15% | 177.5 29% | 152.7 11% | 122.8 -11% |
| Read 4k (MB/s) | 44 | 53 20% | 59.1 34% | 58.8 34% | 38.55 -12% |
| Write 512 (MB/s) | 1101 | 1221 11% | 1216 10% | 1132 3% | 286.9 -74% |
| Read 512 (MB/s) | 1086 | 990 -9% | 873 -20% | 840 -23% | 462 -57% |
| Write Seq (MB/s) | 1076 | 1275 18% | 1635 52% | 1521 41% | 422.8 -61% |
| Read Seq (MB/s) | 1479 | 1565 6% | 1718 16% | 1219 -18% | 521 -65% |

| 3DMark | |
| 1920x1080 Fire Strike Score | |
| Aorus X5 v6 | |
| Eurocom Sky MX5 R3 | |
| Aorus X5 v7 | |
| MSI GT62VR 7RE-223 | |
| Gigabyte P56XT | |
| Schenker XMG P507 PRO | |
| 1280x720 Cloud Gate Standard Score | |
| Aorus X5 v7 | |
| Aorus X5 v6 | |
| Eurocom Sky MX5 R3 | |
| MSI GT62VR 7RE-223 | |
| Gigabyte P56XT | |
| Schenker XMG P507 PRO | |
| 3DMark 11 - 1280x720 Performance | |
| Aorus X5 v6 | |
| Eurocom Sky MX5 R3 | |
| Aorus X5 v7 | |
| Schenker XMG P507 PRO | |
| Gigabyte P56XT | |
| MSI GT62VR 7RE-223 | |
| 3DMark 11 Performance | 17468 puan | |
| 3DMark Cloud Gate Standard Score | 30201 puan | |
| 3DMark Fire Strike Score | 13827 puan | |
Yardım | ||
| The Witcher 3 | |
| 1920x1080 Ultra Graphics & Postprocessing (HBAO+) | |
| Eurocom Sky MX5 R3 | |
| Aorus X5 v7 | |
| Gigabyte P56XT | |
| 3840x2160 High Graphics & Postprocessing (Nvidia HairWorks Off) | |
| Aorus X5 v7 | |
| Rise of the Tomb Raider | |
| 1920x1080 Very High Preset AA:FX AF:16x | |
| Eurocom Sky MX5 R3 | |
| Aorus X5 v6 | |
| Aorus X5 v7 | |
| 3840x2160 High Preset AA:FX AF:4x | |
| Aorus X5 v7 | |
| Doom | |
| 1920x1080 Ultra Preset AA:SM | |
| Aorus X5 v7 | |
| Aorus X5 v6 | |
| Eurocom Sky MX5 R3 | |
| 3840x2160 High Preset AA:FX | |
| Aorus X5 v7 | |
| düşük | orta | yüksek | ultra | 4K | |
|---|---|---|---|---|---|
| The Witcher 3 (2015) | 264.4 | 192.1 | 86.8 | 61.1 | 39.19 |
| Rise of the Tomb Raider (2016) | 250 | 183.6 | 117.7 | 96.9 | 36.52 |
| Doom (2016) | 169.4 | 169.7 | 144.2 | 139.4 | 53.3 |
Ses yüksekliği
| Boşta |
| 35 / 36 / 40 dB |
| HDD |
| 33 dB |
| Çalışırken |
| 43 / 55 dB |
 | ||
30 dB sessiz 40 dB(A) duyulabilirlik 50 dB(A) gürültülü |
||
min: | ||
| Aorus X5 v7 i7-7820HK, GeForce GTX 1070 Mobile | Aorus X5 v6 6820HK, GeForce GTX 1070 Mobile | Gigabyte P56XT i7-7700HQ, GeForce GTX 1070 Mobile | Schenker XMG P507 PRO i7-7700HQ, GeForce GTX 1070 Mobile | Eurocom Sky MX5 R3 i7-7820HK, GeForce GTX 1070 Mobile | MSI GT62VR 7RE-223 i7-7700HQ, GeForce GTX 1070 Mobile | |
|---|---|---|---|---|---|---|
| Noise | -1% | 4% | -1% | 9% | 7% | |
| kapalı / ortam * (dB) | 30 | 29.3 2% | 30 -0% | 31 -3% | 28 7% | 30 -0% |
| Idle Minimum * (dB) | 35 | 33.4 5% | 34 3% | 33 6% | 28.5 19% | 34 3% |
| Idle Average * (dB) | 36 | 35.2 2% | 35 3% | 34 6% | 29.2 19% | 35 3% |
| Idle Maximum * (dB) | 40 | 35.2 12% | 39 2% | 44 -10% | 35.5 11% | 36 10% |
| Load Average * (dB) | 43 | 53.3 -24% | 39 9% | 46 -7% | 47 -9% | 40 7% |
| Witcher 3 ultra * (dB) | 49 | 48 2% | ||||
| Load Maximum * (dB) | 55 | 57.6 -5% | 49 11% | 52 5% | 51 7% | 46 16% |
* ... daha küçük daha iyidir
(-) Üst taraftaki maksimum sıcaklık, 40.4 °C / 105 F ortalamasına kıyasla 64 °C / 147 F'dir. , Gaming sınıfı için 21.2 ile 68.8 °C arasında değişir.
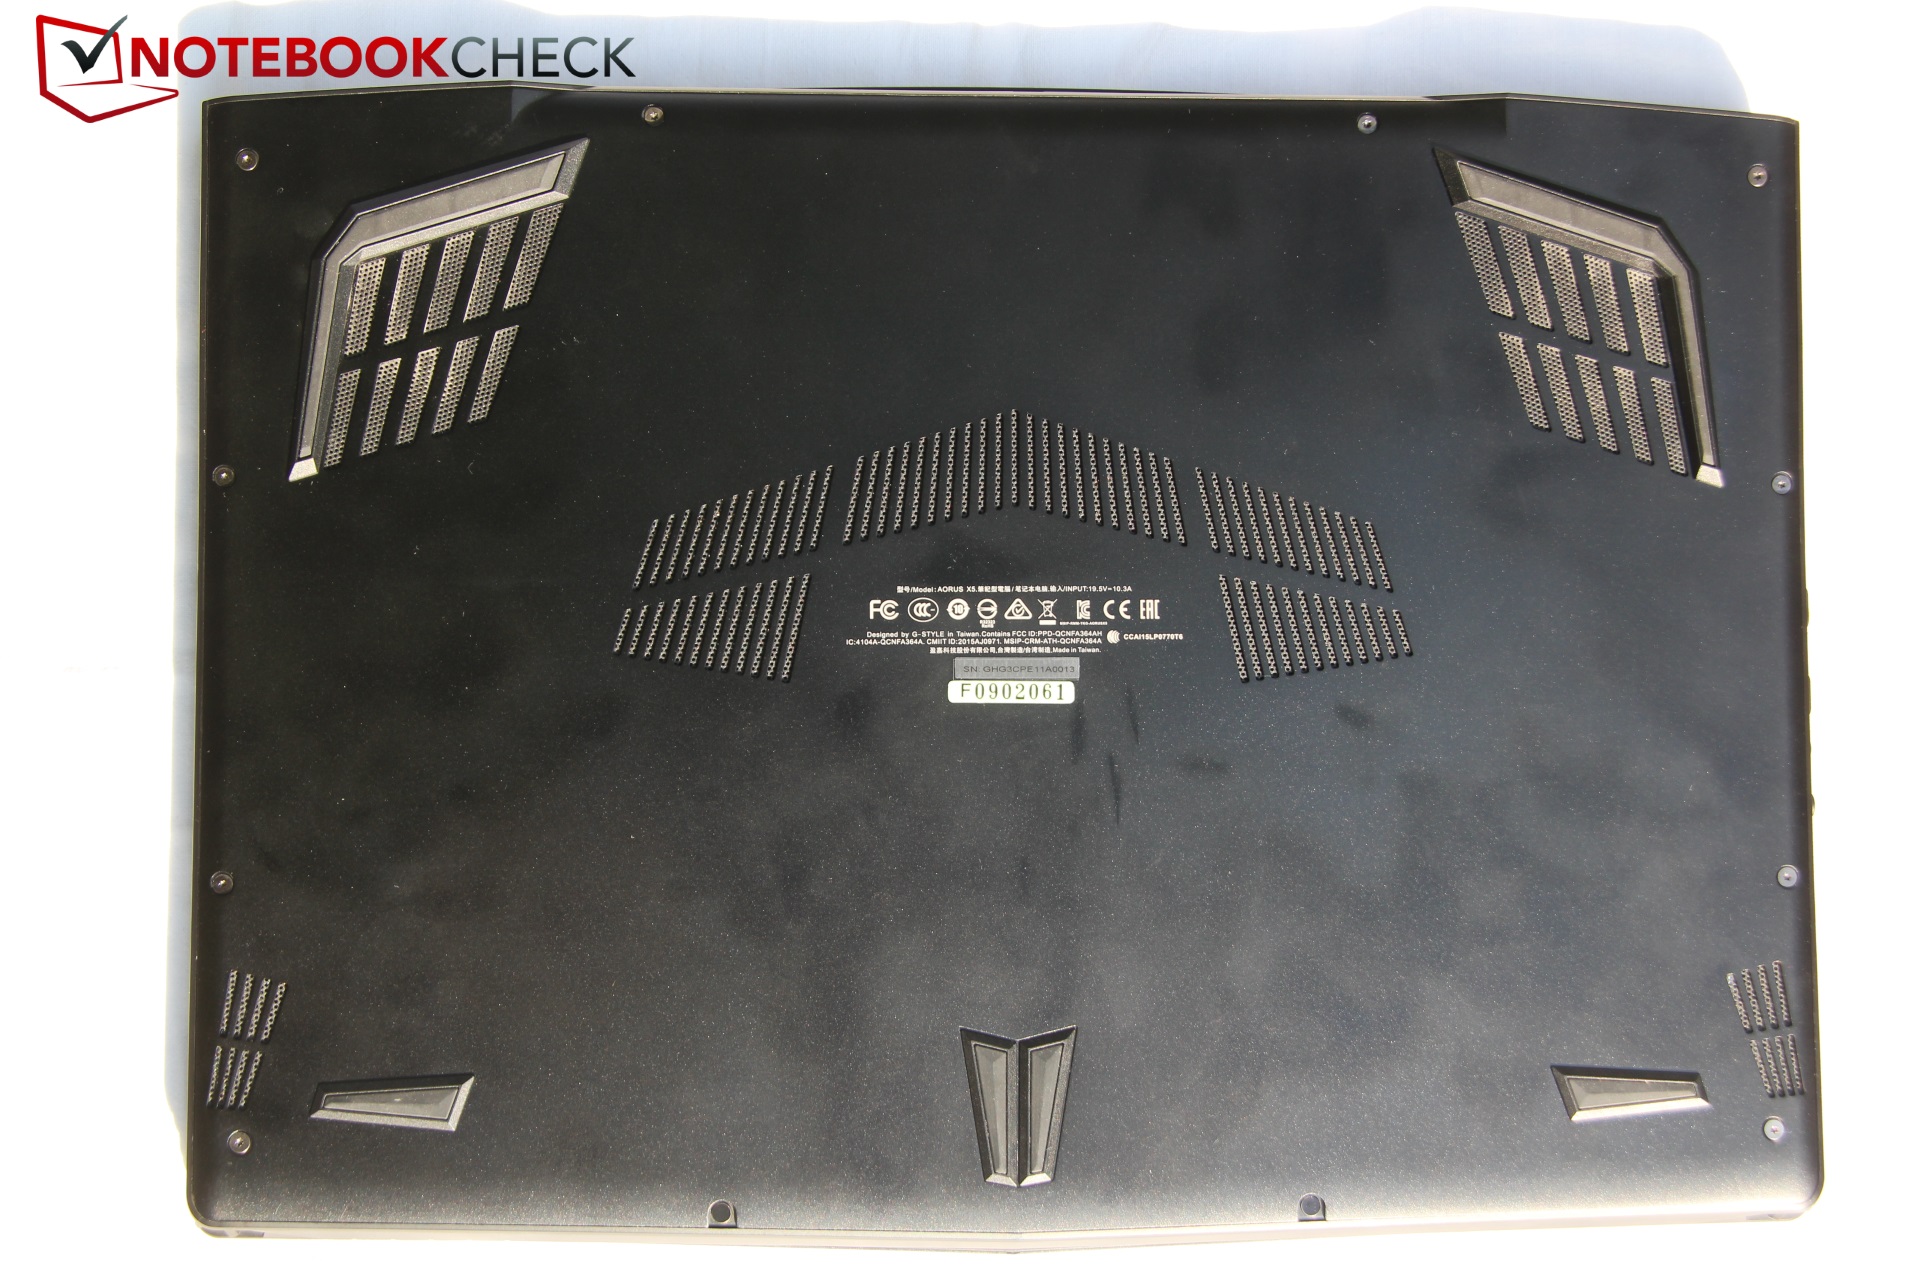
(-) Alt kısım, 43.2 °C / 110 F ortalamasına kıyasla maksimum 56 °C / 133 F'ye kadar ısınır
(+) Boşta kullanımda, üst tarafın ortalama sıcaklığı 27.2 °C / 81 F olup, cihazın 33.9 °C / 93 F.
(-) The Witcher 3 oynarken, üst tarafın ortalama sıcaklığı 43.7 °C / 111 F olup, cihazın 33.9 °C / 93 F.
(±) Avuç içi dayanakları ve dokunmatik yüzey maksimum 38 °C / 100.4 F ile dokunulamayacak kadar ısınabilir.
(-) Benzer cihazların avuç içi dayanağı alanının ortalama sıcaklığı 28.8 °C / 83.8 F (-9.2 °C / -16.6 F) idi.
| Aorus X5 v7 i7-7820HK, GeForce GTX 1070 Mobile | Aorus X5 v6 6820HK, GeForce GTX 1070 Mobile | Gigabyte P56XT i7-7700HQ, GeForce GTX 1070 Mobile | Schenker XMG P507 PRO i7-7700HQ, GeForce GTX 1070 Mobile | Eurocom Sky MX5 R3 i7-7820HK, GeForce GTX 1070 Mobile | MSI GT62VR 7RE-223 i7-7700HQ, GeForce GTX 1070 Mobile | |
|---|---|---|---|---|---|---|
| Heat | -9% | -13% | -3% | 2% | 18% | |
| Maximum Upper Side * (°C) | 64 | 57 11% | 65 -2% | 49.2 23% | 50 22% | 40.6 37% |
| Maximum Bottom * (°C) | 56 | 54 4% | 71 -27% | 62 -11% | 52.2 7% | 48.4 14% |
| Idle Upper Side * (°C) | 29 | 36.2 -25% | 35 -21% | 32.4 -12% | 33.2 -14% | 26.8 8% |
| Idle Bottom * (°C) | 30 | 38 -27% | 30 -0% | 33 -10% | 32.4 -8% | 26.4 12% |
* ... daha küçük daha iyidir
Aorus X5 v7 ses analizi
(±) | hoparlör ses yüksekliği ortalama ama iyi (78 dB)
Bas 100 - 315Hz
(-) | neredeyse hiç bas yok - ortalama olarak medyandan 19% daha düşük
(±) | Bas doğrusallığı ortalamadır (10.6% delta - önceki frekans)
Ortalar 400 - 2000 Hz
(+) | dengeli ortalar - medyandan yalnızca 4.2% uzakta
(+) | orta frekanslar doğrusaldır (5.8% deltadan önceki frekansa)
Yüksekler 2 - 16 kHz
(+) | dengeli yüksekler - medyandan yalnızca 2.1% uzakta
(+) | yüksekler doğrusaldır (5.4% deltadan önceki frekansa)
Toplam 100 - 16.000 Hz
(±) | Genel sesin doğrusallığı ortalamadır (18.7% ortancaya göre fark)
Aynı sınıfla karşılaştırıldığında
» Bu sınıftaki tüm test edilen cihazların %61%'si daha iyi, 8% benzer, 30% daha kötüydü
» En iyisinin deltası 6% idi, ortalama 18% idi, en kötüsü 132% idi
Test edilen tüm cihazlarla karşılaştırıldığında
» Test edilen tüm cihazların %43'si daha iyi, 8 benzer, % 50 daha kötüydü
» En iyisinin deltası 4% idi, ortalama 23% idi, en kötüsü 134% idi
MSI GS63VR 7RF-228US ses analizi
(±) | hoparlör ses yüksekliği ortalama ama iyi (75 dB)
Bas 100 - 315Hz
(-) | neredeyse hiç bas yok - ortalama olarak medyandan 25.3% daha düşük
(±) | Bas doğrusallığı ortalamadır (12.4% delta - önceki frekans)
Ortalar 400 - 2000 Hz
(+) | dengeli ortalar - medyandan yalnızca 3.3% uzakta
(±) | Ortaların doğrusallığı ortalamadır (7% delta - önceki frekans)
Yüksekler 2 - 16 kHz
(±) | daha yüksek en yüksekler - ortalama olarak medyandan 8.1% daha yüksek
(±) | Yükseklerin doğrusallığı ortalamadır (8.6% delta - önceki frekans)
Toplam 100 - 16.000 Hz
(±) | Genel sesin doğrusallığı ortalamadır (28.4% ortancaya göre fark)
Aynı sınıfla karşılaştırıldığında
» Bu sınıftaki tüm test edilen cihazların %94%'si daha iyi, 1% benzer, 4% daha kötüydü
» En iyisinin deltası 6% idi, ortalama 18% idi, en kötüsü 132% idi
Test edilen tüm cihazlarla karşılaştırıldığında
» Test edilen tüm cihazların %86'si daha iyi, 3 benzer, % 12 daha kötüydü
» En iyisinin deltası 4% idi, ortalama 23% idi, en kötüsü 134% idi
| Kapalı / Bekleme modu | |
| Boşta | |
| Çalışırken |
|
Key:
min: | |
| Aorus X5 v7 i7-7820HK, GeForce GTX 1070 Mobile | Aorus X5 v6 6820HK, GeForce GTX 1070 Mobile | Gigabyte P56XT i7-7700HQ, GeForce GTX 1070 Mobile | Schenker XMG P507 PRO i7-7700HQ, GeForce GTX 1070 Mobile | Eurocom Sky MX5 R3 i7-7820HK, GeForce GTX 1070 Mobile | MSI GT62VR 7RE-223 i7-7700HQ, GeForce GTX 1070 Mobile | |
|---|---|---|---|---|---|---|
| Power Consumption | -9% | 28% | 29% | 12% | 19% | |
| Idle Minimum * (Watt) | 26 | 25 4% | 13 50% | 14 46% | 22 15% | 20 23% |
| Idle Average * (Watt) | 31 | 28.9 7% | 17 45% | 18 42% | 24.5 21% | 24 23% |
| Idle Maximum * (Watt) | 36 | 30.1 16% | 22 39% | 24 33% | 25.2 30% | 29 19% |
| Load Average * (Watt) | 93 | 167.3 -80% | 85 9% | 87 6% | 97.2 -5% | 82 12% |
| Witcher 3 ultra * (Watt) | 176 | 154 12% | 177.5 -1% | |||
| Load Maximum * (Watt) | 240 | 222.6 7% | 208 13% | 201 16% | 213.8 11% | 193 20% |
* ... daha küçük daha iyidir
| Aorus X5 v7 i7-7820HK, GeForce GTX 1070 Mobile, 94 Wh | Aorus X5 v6 6820HK, GeForce GTX 1070 Mobile, 94.24 Wh | Gigabyte P56XT i7-7700HQ, GeForce GTX 1070 Mobile, 91.2 Wh | Schenker XMG P507 PRO i7-7700HQ, GeForce GTX 1070 Mobile, 60 Wh | Eurocom Sky MX5 R3 i7-7820HK, GeForce GTX 1070 Mobile, Wh | MSI GT62VR 7RE-223 i7-7700HQ, GeForce GTX 1070 Mobile, 75 Wh | |
|---|---|---|---|---|---|---|
| Pil Çalışma Süresi | 20% | 125% | 33% | 14% | 54% | |
| Reader / Idle (h) | 3.5 | 4.2 20% | 9.5 171% | 3.4 -3% | 6.3 80% | |
| H.264 (h) | 2.7 | 6.2 130% | 3.6 33% | 4.2 56% | ||
| WiFi v1.3 (h) | 2.5 | 3 20% | 6.4 156% | 3.3 32% | 2.9 16% | 4.1 64% |
| Load (h) | 1.4 | 1.7 21% | 2 43% | 1.8 29% | 1.6 14% |
Artılar
Eksiler
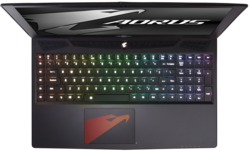
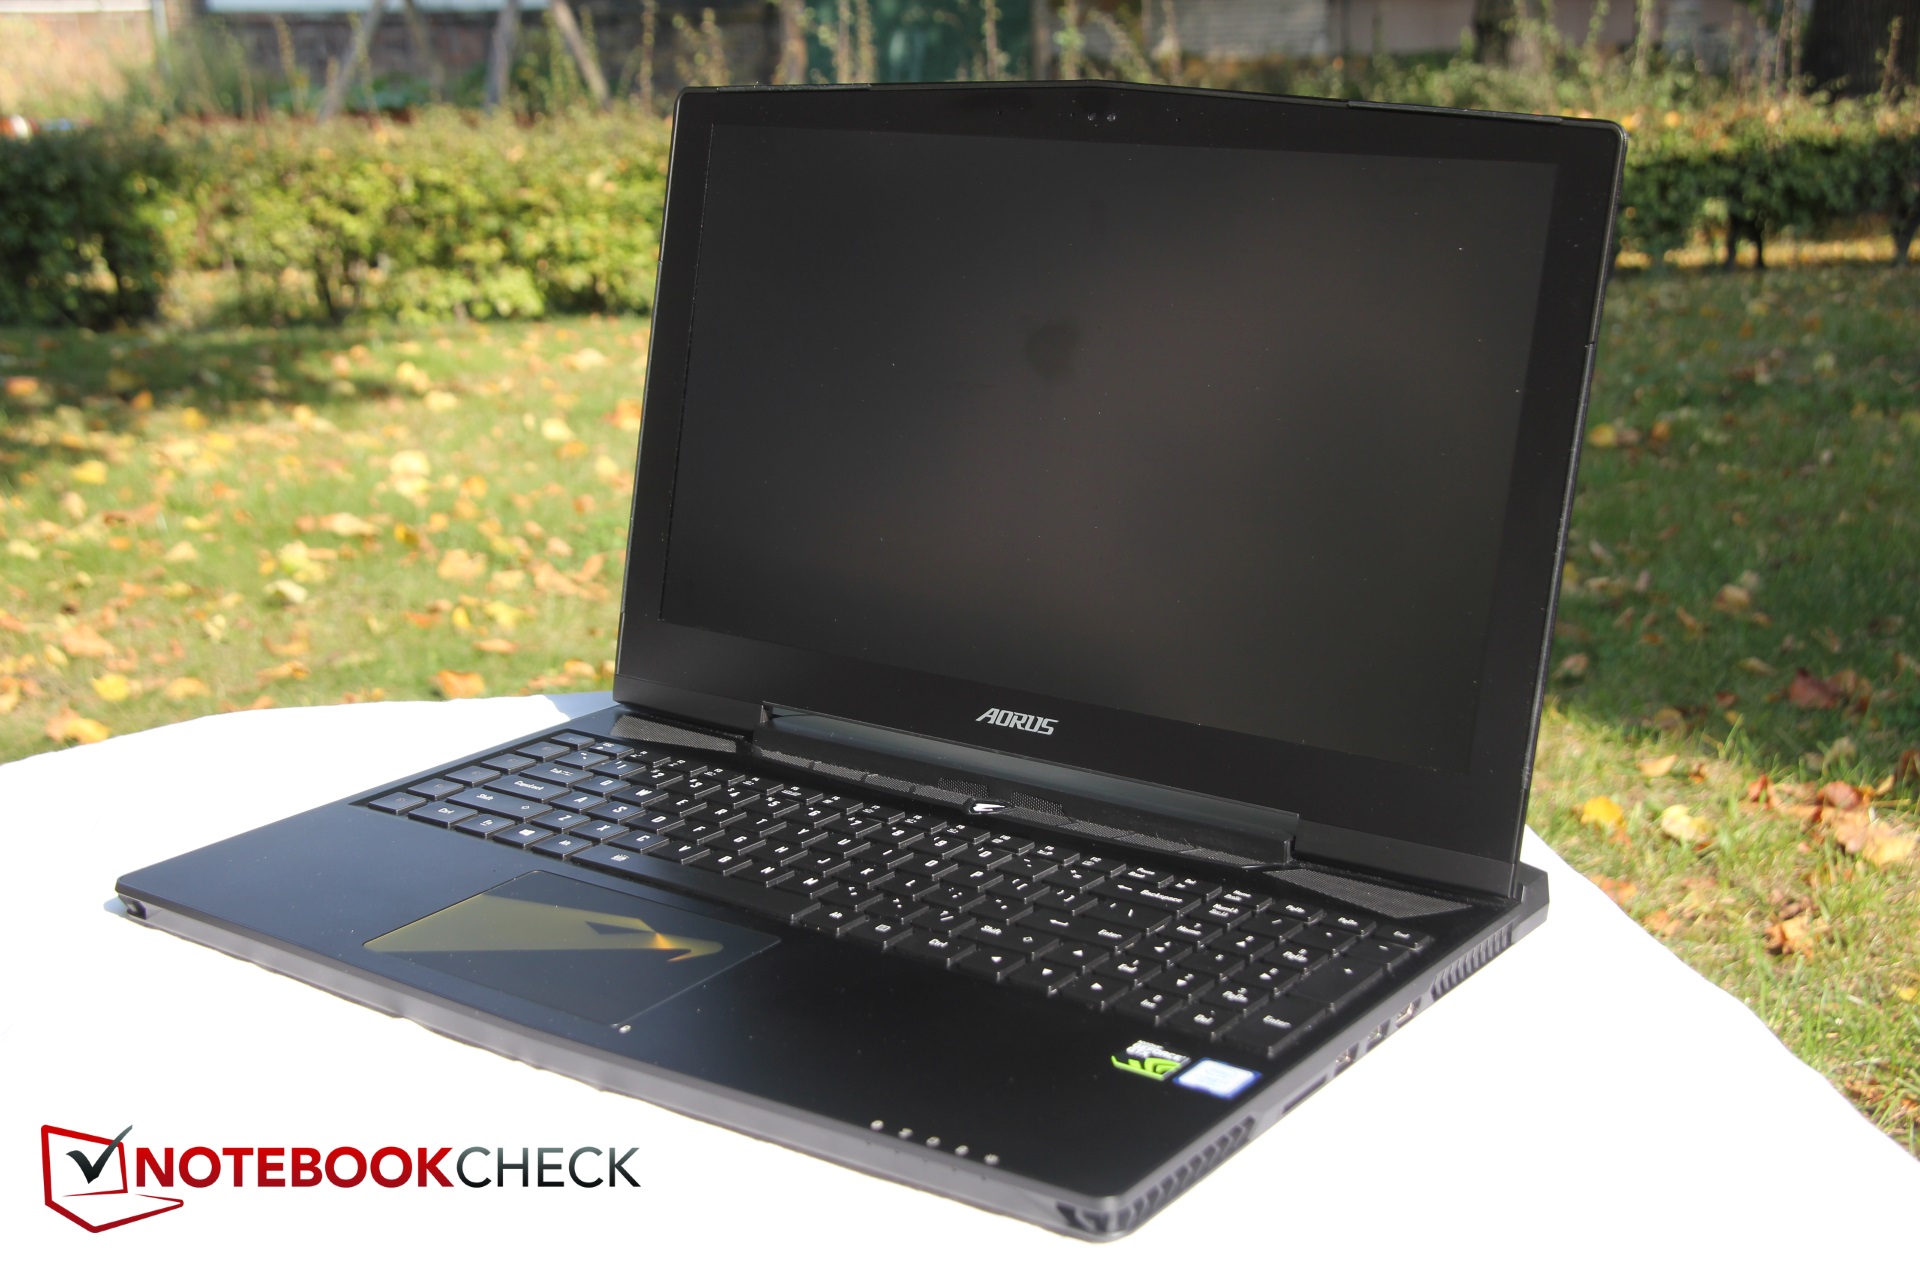
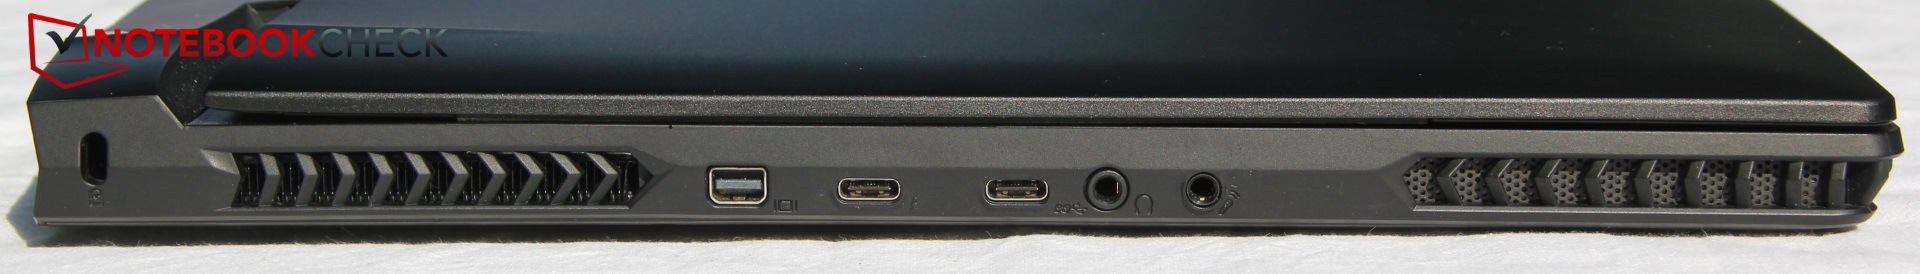
Aorus X5 V7 iyi bir oyun paketi ve önceki modele göre iyi bir güncelleme. İyi 4K ekran ve Thunderbolt 3 dahil olmak üzere birçok bağlantı noktası ile harika eklentiler var diyebiliriz.
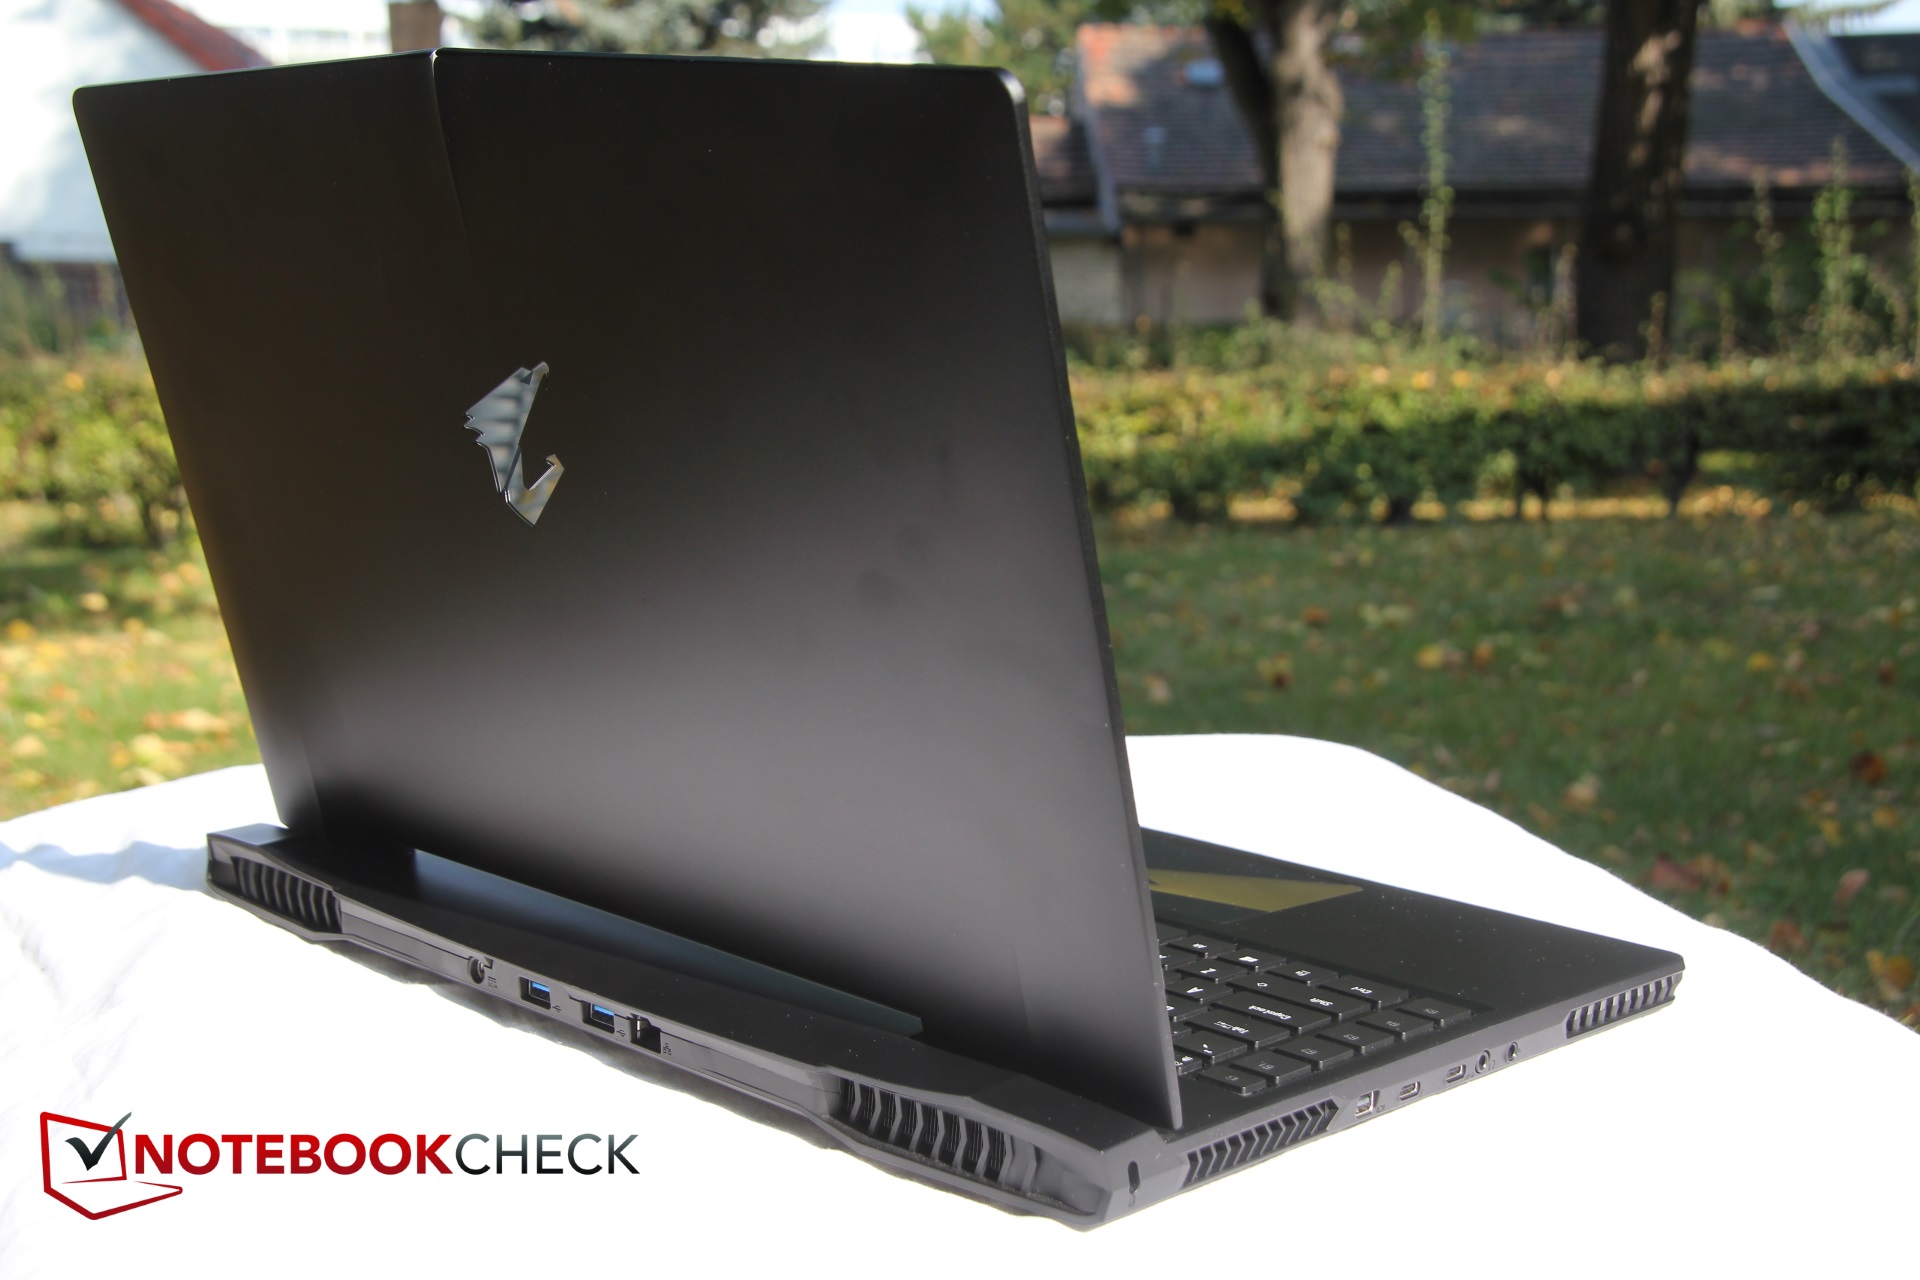
Malesef bazı eksiklikler var. Yüksek güç tüketimi ve kısa batarya ömrü bunların başında. Olası alıcıların portatifliğin kendileri için ne kadar önemli olduğu konusunda karar vermeleri gerekli. Isı yönetiminin de daha iyi yapılması gerekirdi. Geliştirilen soğutma sistemine rağmen özellikle WASD tuşları alanında ısınma mevcut.
Aorus X5 V7 çoğu oyuncuyu performansı ile memnun edecektir. Ama ince kasası yüksek mobilite sunması gerekirken farklı sonuçlara sebep olabiliyor.
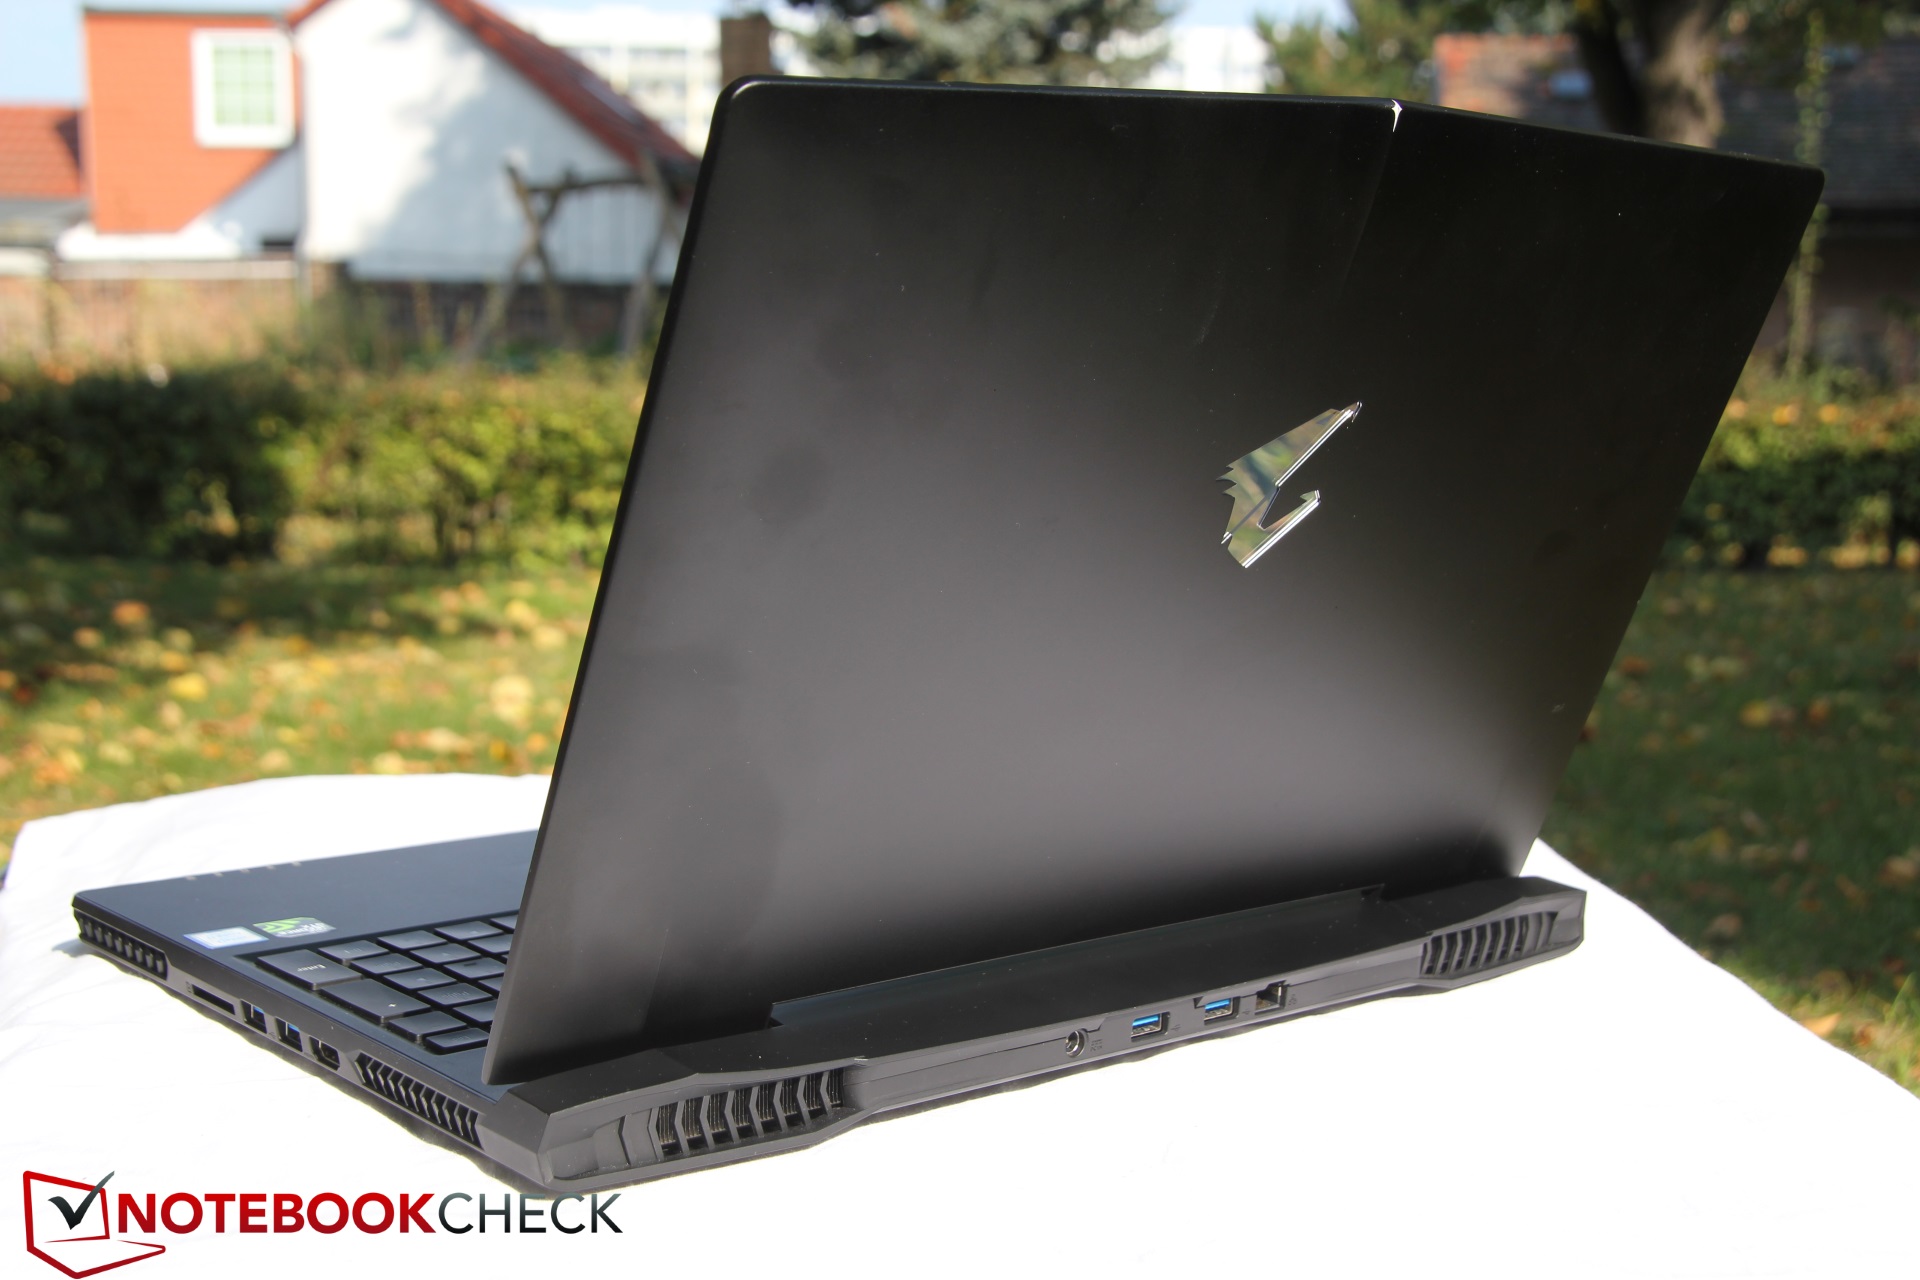
Genel olarak Aorus halen iyi bir oyun cihazı ve geliştiricilerinin iyi bir emek harcadığını söyleyebiliriz. Ama Aorus ucuz değil ve hatta tüm rakipleri arasında da en pahalı cihaz. Olası alıcıların yine bu noktada ne tür özelliklere ihtiyaç duyduğuna karar verip bu yönde bir satın alma kararı vermeleri yerinde olacaktır.
Aorus X5 v7
- 10/08/2017 v6 (old)
Christian Hintze