Kısa inceleme: Asus ROG Chimera G703GI (i9 8950HK, GTX 1080, Full HD) Laptop
| SD Card Reader | |
| average JPG Copy Test (av. of 3 runs) | |
| Aorus X9 DT (Toshiba Exceria Pro SDXC 64 GB UHS-II) | |
| Asus Chimera G703GI (Toshiba Exceria Pro SDXC 64 GB UHS-II) | |
| Schenker XMG Ultra 17 (Toshiba Exceria Pro SDXC 64 GB UHS-II) | |
| Asus G703 (Toshiba Exceria Pro SDXC 64 GB UHS-II) | |
| Sınıf ortalaması Gaming (20.9 - 210, n=54, son 2 yıl) | |
| MSI GT75 8RG-090 Titan (Toshiba Exceria Pro SDXC 64 GB UHS-II) | |
| maximum AS SSD Seq Read Test (1GB) | |
| Asus Chimera G703GI (Toshiba Exceria Pro SDXC 64 GB UHS-II) | |
| Aorus X9 DT (Toshiba Exceria Pro SDXC 64 GB UHS-II) | |
| Asus G703 (Toshiba Exceria Pro SDXC 64 GB UHS-II) | |
| Schenker XMG Ultra 17 (Toshiba Exceria Pro SDXC 64 GB UHS-II) | |
| Sınıf ortalaması Gaming (25.5 - 261, n=51, son 2 yıl) | |
| MSI GT75 8RG-090 Titan (Toshiba Exceria Pro SDXC 64 GB UHS-II) | |
| Networking | |
| iperf3 transmit AX12 | |
| Asus Chimera G703GI | |
| MSI GT75 8RG-090 Titan | |
| Aorus X9 DT | |
| Schenker XMG Ultra 17 | |
| Asus G703 | |
| iperf3 receive AX12 | |
| Schenker XMG Ultra 17 | |
| MSI GT75 8RG-090 Titan | |
| Asus G703 | |
| Asus Chimera G703GI | |
| Aorus X9 DT | |
| |||||||||||||||||||||||||
Aydınlatma: 82 %
Batarya modunda parlaklık: 285 cd/m²
Kontrast: 1295:1 (Siyah: 0.22 cd/m²)
ΔE ColorChecker Calman: 3.18 | ∀{0.5-29.43 Ø4.72}
calibrated: 1.73
ΔE Greyscale Calman: 2.93 | ∀{0.09-98 Ø4.97}
93% sRGB (Argyll 1.6.3 3D)
60% AdobeRGB 1998 (Argyll 1.6.3 3D)
67% AdobeRGB 1998 (Argyll 3D)
92.6% sRGB (Argyll 3D)
65.8% Display P3 (Argyll 3D)
Gamma: 2.45
CCT: 7165 K
| Asus Chimera G703GI B173HAN03.2 (AUO329D), IPS, 1920x1080 | Asus G703 AUO B173HAN03.0 (AUO309D), IPS, 1920x1080 | MSI GT75 8RG-090 Titan CMN N173HHE-G32 (CMN1747), TN, 1920x1080 | Aorus X9 DT AUO B173HAN03.0 (AUO309D), IPS, 1920x1080 | Schenker XMG Ultra 17 AU Optronics B173ZAN01.0 (AUO109B), IPS, 3840x2160 | |
|---|---|---|---|---|---|
| Display | -0% | 25% | 0% | 29% | |
| Display P3 Coverage (%) | 65.8 | 65.5 0% | 90.9 38% | 66.8 2% | 86.4 31% |
| sRGB Coverage (%) | 92.6 | 92.4 0% | 100 8% | 92.1 -1% | 100 8% |
| AdobeRGB 1998 Coverage (%) | 67 | 66.6 -1% | 86.2 29% | 67.3 0% | 99.1 48% |
| Response Times | -90% | 12% | -99% | -359% | |
| Response Time Grey 50% / Grey 80% * (ms) | 6.4 ? | 17.6 ? -175% | 8 ? -25% | 18.4 ? -187% | 44 ? -588% |
| Response Time Black / White * (ms) | 10.8 ? | 11.2 ? -4% | 5.6 ? 48% | 12 ? -11% | 24.8 ? -130% |
| PWM Frequency (Hz) | 26000 ? | ||||
| Screen | -15% | 9% | 15% | -1% | |
| Brightness middle (cd/m²) | 285 | 274 -4% | 240 -16% | 280 -2% | 332 16% |
| Brightness (cd/m²) | 275 | 268 -3% | 248 -10% | 262 -5% | 313 14% |
| Brightness Distribution (%) | 82 | 80 -2% | 83 1% | 86 5% | 88 7% |
| Black Level * (cd/m²) | 0.22 | 0.29 -32% | 0.22 -0% | 0.22 -0% | 0.28 -27% |
| Contrast (:1) | 1295 | 945 -27% | 1091 -16% | 1273 -2% | 1186 -8% |
| Colorchecker dE 2000 * | 3.18 | 3.99 -25% | 2.14 33% | 1.78 44% | 3.86 -21% |
| Colorchecker dE 2000 max. * | 5.99 | 7.33 -22% | 5.04 16% | 3.91 35% | 5.88 2% |
| Colorchecker dE 2000 calibrated * | 1.73 | 1.79 -3% | 1.54 11% | ||
| Greyscale dE 2000 * | 2.93 | 4.14 -41% | 1.62 45% | 0.74 75% | 4.33 -48% |
| Gamma | 2.45 90% | 2.58 85% | 2.28 96% | 2.43 91% | 2.41 91% |
| CCT | 7165 91% | 7352 88% | 6846 95% | 6494 100% | 6595 99% |
| Color Space (Percent of AdobeRGB 1998) (%) | 60 | 60 0% | 77 28% | 60 0% | 88 47% |
| Color Space (Percent of sRGB) (%) | 93 | 92 -1% | 100 8% | 92 -1% | 100 8% |
| Toplam Ortalama (Program / Ayarlar) | -35% /
-21% | 15% /
12% | -28% /
-3% | -110% /
-43% |
* ... daha küçük daha iyidir
Yanıt Sürelerini Görüntüle
| ↔ Tepki Süresi Siyahtan Beyaza | ||
|---|---|---|
| 10.8 ms ... yükseliş ↗ ve sonbahar↘ birleşimi | ↗ 6 ms yükseliş | 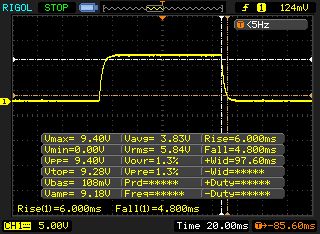 |
| ↘ 4.8 ms sonbahar | ||
| Ekran, testlerimizde iyi yanıt oranları gösteriyor ancak rekabetçi oyuncular için çok yavaş olabilir. Karşılaştırıldığında, test edilen tüm cihazlar 0.1 (minimum) ile 240 (maksimum) ms arasında değişir. » Tüm cihazların 29 %'si daha iyi. Bu, ölçülen yanıt süresinin test edilen tüm cihazların ortalamasından (19.8 ms) daha iyi olduğu anlamına gelir. | ||
| ↔ Tepki Süresi %50 Griden %80 Griye | ||
| 6.4 ms ... yükseliş ↗ ve sonbahar↘ birleşimi | ↗ 3.4 ms yükseliş | 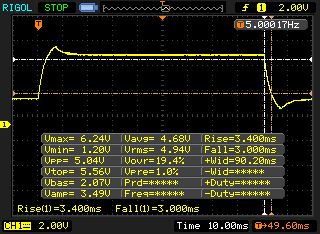 |
| ↘ 3 ms sonbahar | ||
| Ekran, testlerimizde çok hızlı yanıt oranları gösteriyor ve hızlı oyun oynamaya çok uygun olmalı. Karşılaştırıldığında, test edilen tüm cihazlar 0.165 (minimum) ile 636 (maksimum) ms arasında değişir. » Tüm cihazların 19 %'si daha iyi. Bu, ölçülen yanıt süresinin test edilen tüm cihazların ortalamasından (31 ms) daha iyi olduğu anlamına gelir. | ||
Ekran Titremesi / PWM (Darbe Genişliği Modülasyonu)
| Ekran titriyor / PWM algılanmadı | 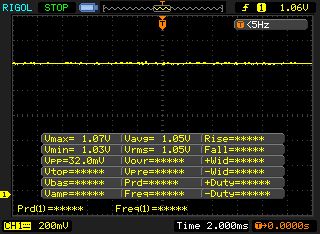 | ||
Karşılaştırıldığında: Test edilen tüm cihazların %52 %'si ekranı karartmak için PWM kullanmıyor. PWM tespit edilirse, ortalama 7769 (minimum: 5 - maksimum: 343500) Hz ölçüldü. | |||
| Cinebench R15 | |
| CPU Single 64Bit | |
| Sınıf ortalaması Gaming (188.8 - 343, n=109, son 2 yıl) | |
| Asus Chimera G703GI | |
| MSI GT75 8RG-090 Titan | |
| Schenker XMG Ultra 17 | |
| Asus G703 | |
| Aorus X9 DT | |
| CPU Multi 64Bit | |
| Sınıf ortalaması Gaming (1578 - 6271, n=108, son 2 yıl) | |
| Aorus X9 DT | |
| MSI GT75 8RG-090 Titan | |
| Asus Chimera G703GI | |
| Schenker XMG Ultra 17 | |
| Asus G703 | |
| Cinebench R11.5 | |
| CPU Single 64Bit | |
| Sınıf ortalaması Gaming (3.3 - 3.98, n=8, son 2 yıl) | |
| Asus Chimera G703GI | |
| MSI GT75 8RG-090 Titan | |
| Schenker XMG Ultra 17 | |
| Aorus X9 DT | |
| Asus G703 | |
| CPU Multi 64Bit | |
| Sınıf ortalaması Gaming (29.8 - 70.7, n=8, son 2 yıl) | |
| Asus Chimera G703GI | |
| Aorus X9 DT | |
| MSI GT75 8RG-090 Titan | |
| Schenker XMG Ultra 17 | |
| Asus G703 | |
| PCMark 10 - Score | |
| Sınıf ortalaması Gaming (5828 - 11574, n=95, son 2 yıl) | |
| Asus Chimera G703GI | |
| MSI GT75 8RG-090 Titan | |
| Aorus X9 DT | |
| Schenker XMG Ultra 17 | |
| Asus G703 | |
| PCMark 8 | |
| Home Score Accelerated v2 | |
| Asus Chimera G703GI | |
| Asus G703 | |
| Aorus X9 DT | |
| MSI GT75 8RG-090 Titan | |
| Sınıf ortalaması Gaming (n=1son 2 yıl) | |
| Schenker XMG Ultra 17 | |
| Work Score Accelerated v2 | |
| Asus Chimera G703GI | |
| Aorus X9 DT | |
| Asus G703 | |
| MSI GT75 8RG-090 Titan | |
| Schenker XMG Ultra 17 | |
| Sınıf ortalaması Gaming (n=1son 2 yıl) | |
| PCMark 8 Home Score Accelerated v2 | 6093 puan | |
| PCMark 8 Work Score Accelerated v2 | 6281 puan | |
| PCMark 10 Score | 6607 puan | |
Yardım | ||
| Asus Chimera G703GI 2x Intel 760p 512 GB + 1x Samsung SM961 512 GB (RAID) | Asus G703 2x Samsung SM961 MZVKW512HMJP NVMe (RAID 0) | MSI GT75 8RG-090 Titan 2x Samsung PM961 MZVLW256HEHP (RAID 0) | Aorus X9 DT Transcend TS1TMTE850 | Schenker XMG Ultra 17 Samsung SSD 960 Evo 500GB m.2 NVMe | |
|---|---|---|---|---|---|
| AS SSD | -20% | -28% | -57% | -24% | |
| Seq Read (MB/s) | 4886 | 3177 -35% | 3058 -37% | 1518 -69% | 2533 -48% |
| Seq Write (MB/s) | 4110 | 2556 -38% | 2196 -47% | 1019 -75% | 1771 -57% |
| 4K Read (MB/s) | 57.4 | 47.61 -17% | 38.37 -33% | 22.23 -61% | 43.65 -24% |
| 4K Write (MB/s) | 141.3 | 148.4 5% | 97.7 -31% | 98.9 -30% | 139.5 -1% |
| Score Read (Points) | 1999 | 1633 -18% | 1691 -15% | 828 -59% | 1716 -14% |
| Score Write (Points) | 1855 | 1519 -18% | 1553 -16% | 916 -51% | 1615 -13% |
| Score Total (Points) | 4843 | 3962 -18% | 4066 -16% | 2145 -56% | 4173 -14% |

| 3DMark - 1920x1080 Fire Strike Graphics | |
| Sınıf ortalaması Gaming (12242 - 62849, n=118, son 2 yıl) | |
| Aorus X9 DT | |
| Asus G703 | |
| Asus Chimera G703GI | |
| MSI GT75 8RG-090 Titan | |
| Schenker XMG Ultra 17 | |
| 3DMark 11 - 1280x720 Performance GPU | |
| Sınıf ortalaması Gaming (21841 - 80022, n=106, son 2 yıl) | |
| Asus Chimera G703GI | |
| Asus G703 | |
| MSI GT75 8RG-090 Titan | |
| Schenker XMG Ultra 17 | |
| Aorus X9 DT | |
| 3DMark 11 Performance | 23488 puan | |
| 3DMark Ice Storm Standard Score | 214443 puan | |
| 3DMark Cloud Gate Standard Score | 38913 puan | |
| 3DMark Fire Strike Score | 18999 puan | |
Yardım | ||
| The Witcher 3 - 1920x1080 Ultra Graphics & Postprocessing (HBAO+) | |
| Sınıf ortalaması Gaming (95 - 240, n=8, son 2 yıl) | |
| Asus G703 | |
| Aorus X9 DT | |
| MSI GT75 8RG-090 Titan | |
| Asus Chimera G703GI | |
| Schenker XMG Ultra 17 | |
| düşük | orta | yüksek | ultra | |
|---|---|---|---|---|
| The Witcher 3 (2015) | 145 | 76.7 | ||
| Far Cry 5 (2018) | 113 | 103 |
Ses yüksekliği
| Boşta |
| 30 / 34 / 42 dB |
| HDD |
| 31 dB |
| Çalışırken |
| 53 / 53 dB |
 | ||
30 dB sessiz 40 dB(A) duyulabilirlik 50 dB(A) gürültülü |
||
min: | ||
| Asus Chimera G703GI i9-8950HK, GeForce GTX 1080 Mobile | Asus G703 i7-7820HK, GeForce GTX 1080 Mobile | MSI GT75 8RG-090 Titan i9-8950HK, GeForce GTX 1080 Mobile | Aorus X9 DT i9-8950HK, GeForce GTX 1080 Mobile | Schenker XMG Ultra 17 i7-8700, GeForce GTX 1080 Mobile | Sınıf ortalaması Gaming | |
|---|---|---|---|---|---|---|
| Noise | 0% | -1% | -8% | -2% | 16% | |
| kapalı / ortam * (dB) | 29 | 30 -3% | 30 -3% | 30 -3% | 30 -3% | 24.1 ? 17% |
| Idle Minimum * (dB) | 30 | 35 -17% | 32 -7% | 36 -20% | 34 -13% | 25.9 ? 14% |
| Idle Average * (dB) | 34 | 36 -6% | 34 -0% | 37 -9% | 35 -3% | 27.4 ? 19% |
| Idle Maximum * (dB) | 42 | 38 10% | 37 12% | 43 -2% | 40 5% | 29.9 ? 29% |
| Load Average * (dB) | 53 | 46 13% | 43 19% | 50 6% | 45 15% | 43 ? 19% |
| Witcher 3 ultra * (dB) | 51 | 48 6% | 57 -12% | 57 -12% | 52 -2% | |
| Load Maximum * (dB) | 53 | 54 -2% | 62 -17% | 61 -15% | 60 -13% | 54.1 ? -2% |
* ... daha küçük daha iyidir
(-) Üst taraftaki maksimum sıcaklık, 40.4 °C / 105 F ortalamasına kıyasla 50 °C / 122 F'dir. , Gaming sınıfı için 21.2 ile 68.8 °C arasında değişir.
(-) Alt kısım, 43.2 °C / 110 F ortalamasına kıyasla maksimum 50 °C / 122 F'ye kadar ısınır
(+) Boşta kullanımda, üst tarafın ortalama sıcaklığı 29.8 °C / 86 F olup, cihazın 33.9 °C / 93 F.
(±) The Witcher 3 oynarken, üst tarafın ortalama sıcaklığı 37.4 °C / 99 F olup, cihazın 33.9 °C / 93 F.
(+) Avuç içi dayanakları ve dokunmatik yüzey, maksimum 30 °C / 86 F ile cilt sıcaklığından daha soğuktur ve bu nedenle dokunulduğunda soğuktur.
(±) Benzer cihazların avuç içi dayanağı alanının ortalama sıcaklığı 28.8 °C / 83.8 F (-1.2 °C / -2.2 F) idi.
| Asus Chimera G703GI i9-8950HK, GeForce GTX 1080 Mobile | Asus G703 i7-7820HK, GeForce GTX 1080 Mobile | MSI GT75 8RG-090 Titan i9-8950HK, GeForce GTX 1080 Mobile | Aorus X9 DT i9-8950HK, GeForce GTX 1080 Mobile | Schenker XMG Ultra 17 i7-8700, GeForce GTX 1080 Mobile | Sınıf ortalaması Gaming | |
|---|---|---|---|---|---|---|
| Heat | -2% | 9% | 8% | 6% | 3% | |
| Maximum Upper Side * (°C) | 50 | 55 -10% | 47 6% | 43 14% | 41 18% | 45.2 ? 10% |
| Maximum Bottom * (°C) | 50 | 54 -8% | 53 -6% | 55 -10% | 48 4% | 48.1 ? 4% |
| Idle Upper Side * (°C) | 32 | 29 9% | 26 19% | 27 16% | 30 6% | 31.1 ? 3% |
| Idle Bottom * (°C) | 33 | 32 3% | 27 18% | 29 12% | 35 -6% | 34.3 ? -4% |
* ... daha küçük daha iyidir
Asus Chimera G703GI ses analizi
(+) | hoparlörler nispeten yüksek sesle çalabilir (89 dB)
Bas 100 - 315Hz
(±) | azaltılmış bas - ortalama olarak medyandan 8.9% daha düşük
(+) | bas doğrusaldır (6.4% delta ile önceki frekans)
Ortalar 400 - 2000 Hz
(+) | dengeli ortalar - medyandan yalnızca 3.1% uzakta
(+) | orta frekanslar doğrusaldır (2.4% deltadan önceki frekansa)
Yüksekler 2 - 16 kHz
(+) | dengeli yüksekler - medyandan yalnızca 4.4% uzakta
(+) | yüksekler doğrusaldır (3.2% deltadan önceki frekansa)
Toplam 100 - 16.000 Hz
(+) | genel ses doğrusaldır (11.8% ortancaya göre fark)
Aynı sınıfla karşılaştırıldığında
» Bu sınıftaki tüm test edilen cihazların %11%'si daha iyi, 4% benzer, 85% daha kötüydü
» En iyisinin deltası 6% idi, ortalama 18% idi, en kötüsü 132% idi
Test edilen tüm cihazlarla karşılaştırıldığında
» Test edilen tüm cihazların %8'si daha iyi, 3 benzer, % 89 daha kötüydü
» En iyisinin deltası 4% idi, ortalama 24% idi, en kötüsü 134% idi
MSI GT75 8RG-090 Titan ses analizi
(+) | hoparlörler nispeten yüksek sesle çalabilir (94 dB)
Bas 100 - 315Hz
(±) | azaltılmış bas - ortalama olarak medyandan 9.4% daha düşük
(±) | Bas doğrusallığı ortalamadır (8.7% delta - önceki frekans)
Ortalar 400 - 2000 Hz
(±) | daha yüksek ortalar - ortalama olarak medyandan 6.8% daha yüksek
(±) | Ortaların doğrusallığı ortalamadır (8.4% delta - önceki frekans)
Yüksekler 2 - 16 kHz
(±) | daha yüksek en yüksekler - ortalama olarak medyandan 5% daha yüksek
(±) | Yükseklerin doğrusallığı ortalamadır (7.8% delta - önceki frekans)
Toplam 100 - 16.000 Hz
(+) | genel ses doğrusaldır (14.4% ortancaya göre fark)
Aynı sınıfla karşılaştırıldığında
» Bu sınıftaki tüm test edilen cihazların %27%'si daha iyi, 7% benzer, 66% daha kötüydü
» En iyisinin deltası 6% idi, ortalama 18% idi, en kötüsü 132% idi
Test edilen tüm cihazlarla karşılaştırıldığında
» Test edilen tüm cihazların %18'si daha iyi, 4 benzer, % 78 daha kötüydü
» En iyisinin deltası 4% idi, ortalama 24% idi, en kötüsü 134% idi
| Kapalı / Bekleme modu | |
| Boşta | |
| Çalışırken |
|
Key:
min: | |
| Asus Chimera G703GI i9-8950HK, GeForce GTX 1080 Mobile | Asus G703 i7-7820HK, GeForce GTX 1080 Mobile | MSI GT75 8RG-090 Titan i9-8950HK, GeForce GTX 1080 Mobile | Aorus X9 DT i9-8950HK, GeForce GTX 1080 Mobile | Schenker XMG Ultra 17 i7-8700, GeForce GTX 1080 Mobile | Sınıf ortalaması Gaming | |
|---|---|---|---|---|---|---|
| Power Consumption | 10% | -1% | 5% | 5% | 40% | |
| Idle Minimum * (Watt) | 29 | 26 10% | 31 -7% | 28 3% | 32 -10% | 13.2 ? 54% |
| Idle Average * (Watt) | 37 | 30 19% | 35 5% | 37 -0% | 38 -3% | 18.9 ? 49% |
| Idle Maximum * (Watt) | 46 | 37 20% | 45 2% | 40 13% | 45 2% | 24.5 ? 47% |
| Load Average * (Watt) | 156 | 123 21% | 130 17% | 109 30% | 96 38% | 108.8 ? 30% |
| Witcher 3 ultra * (Watt) | 252 | 257 -2% | 268 -6% | 256 -2% | 237 6% | |
| Load Maximum * (Watt) | 314 | 341 -9% | 374 -19% | 353 -12% | 331 -5% | 254 ? 19% |
* ... daha küçük daha iyidir
| Asus Chimera G703GI i9-8950HK, GeForce GTX 1080 Mobile, 71 Wh | Asus G703 i7-7820HK, GeForce GTX 1080 Mobile, 71 Wh | MSI GT75 8RG-090 Titan i9-8950HK, GeForce GTX 1080 Mobile, 75 Wh | Aorus X9 DT i9-8950HK, GeForce GTX 1080 Mobile, 94.24 Wh | Schenker XMG Ultra 17 i7-8700, GeForce GTX 1080 Mobile, 82 Wh | Sınıf ortalaması Gaming | |
|---|---|---|---|---|---|---|
| Pil Çalışma Süresi | 11% | 29% | 46% | 13% | 163% | |
| Reader / Idle (h) | 2.8 | 3.3 18% | 3.8 36% | 4.2 50% | 2.7 -4% | 8.71 ? 211% |
| WiFi v1.3 (h) | 2.2 | 2.5 14% | 3.2 45% | 2.4 9% | 6.96 ? 216% | |
| Load (h) | 0.9 | 0.9 0% | 1.1 22% | 1.3 44% | 1.2 33% | 1.47 ? 63% |
| H.264 (h) | 2.4 | 2.9 | 2.5 | 8.28 ? |
Artılar
Eksiler
Like its predecessor, the new Coffee Lake edition of the Asus ROG Chimera G703 is one of the best high-end laptops for avid gamers.
If we factor out its heavy weight and thick build, the case has a lot of strengths. The attraction of the 17-inch powerhouse lies not only with its quick and contrast-rich 144 Hz display with stable viewing angles and G-Sync support, but it is also with its modern connections (Thunderbolt 3) and good input devices.
In the realm of performance, there is simply nothing to criticize. In the device's native resolution, the hexa-core CPU and GeForce GTX 1080 run every game on the market at a fluid frame rate. The laptop does make a lot of noise under load, but other competitors like the MSI GT75 8RG and Aorus X9 DT get even louder in 3D mode.
All aspects considered together, the computer scores just enough for a rating of "Very Good". In our Gaming Top 10, the G703 once again snatches a leading position.
Asus Chimera G703GI
- 06/07/2018 v6 (old)
Florian Glaser
Price comparison