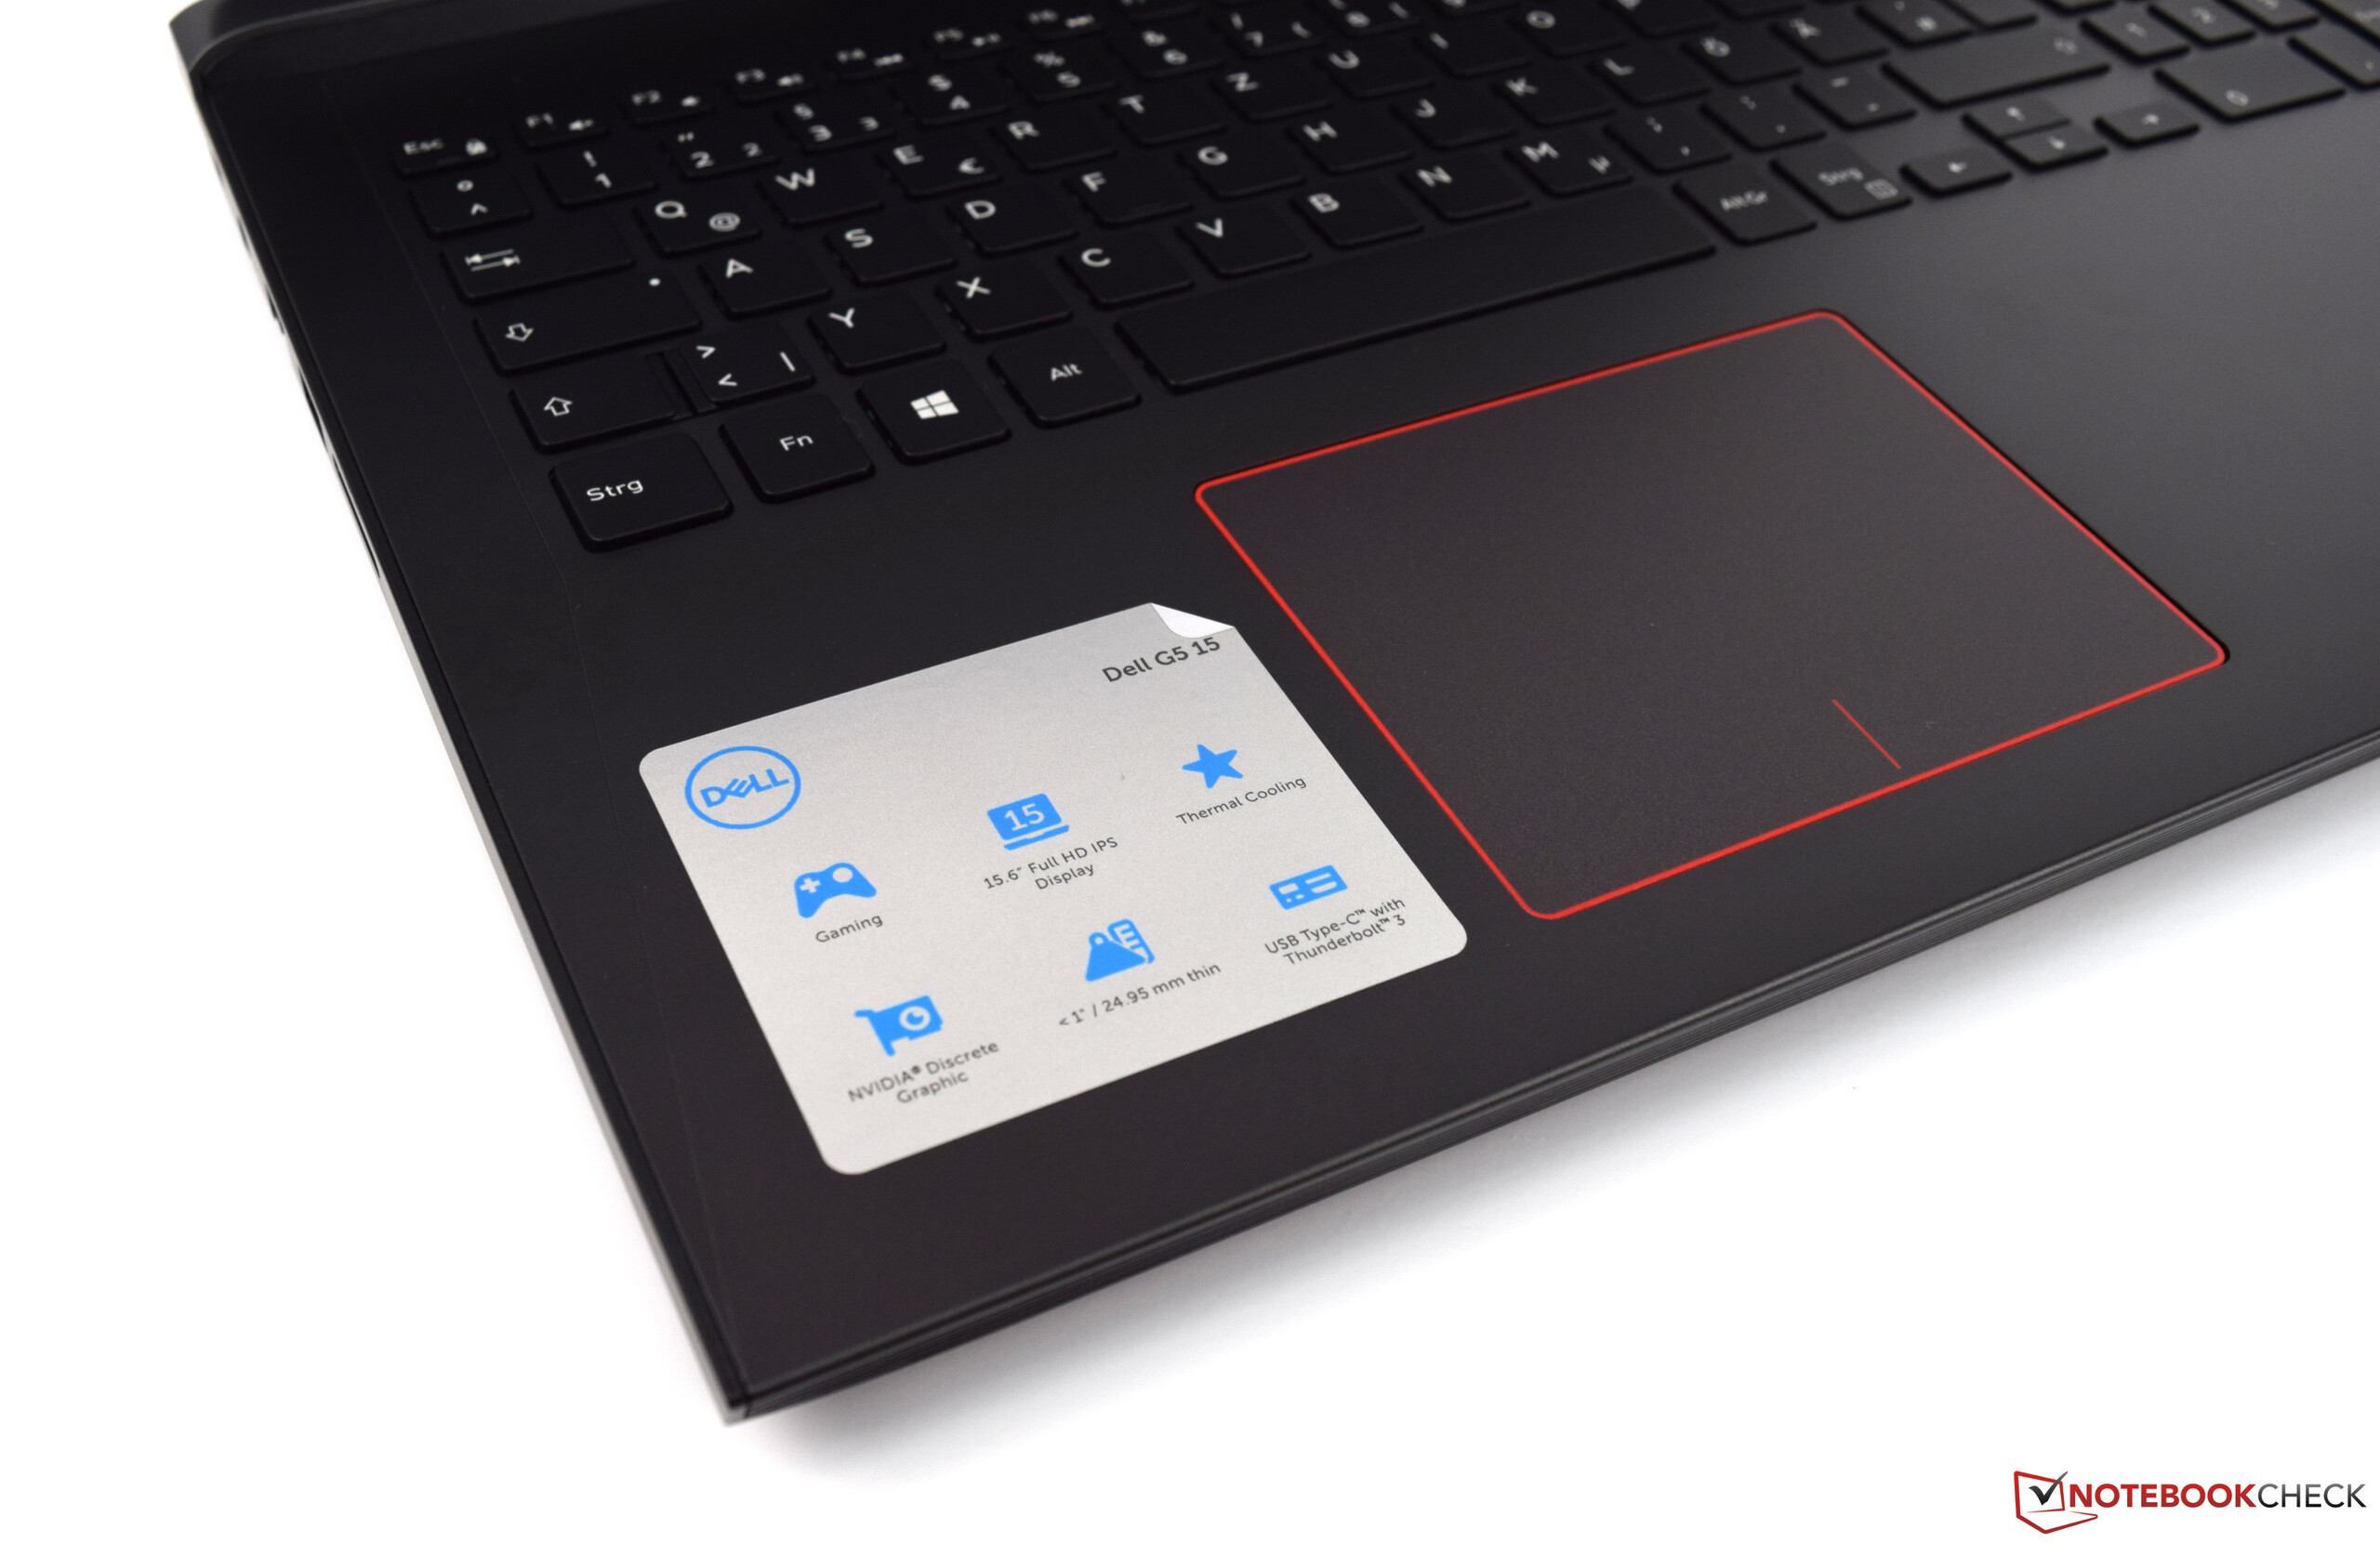
Kısa inceleme: Dell G5 15 5587 (i5-8300H, GTX 1060 Max-Q, SSD, IPS) Laptop

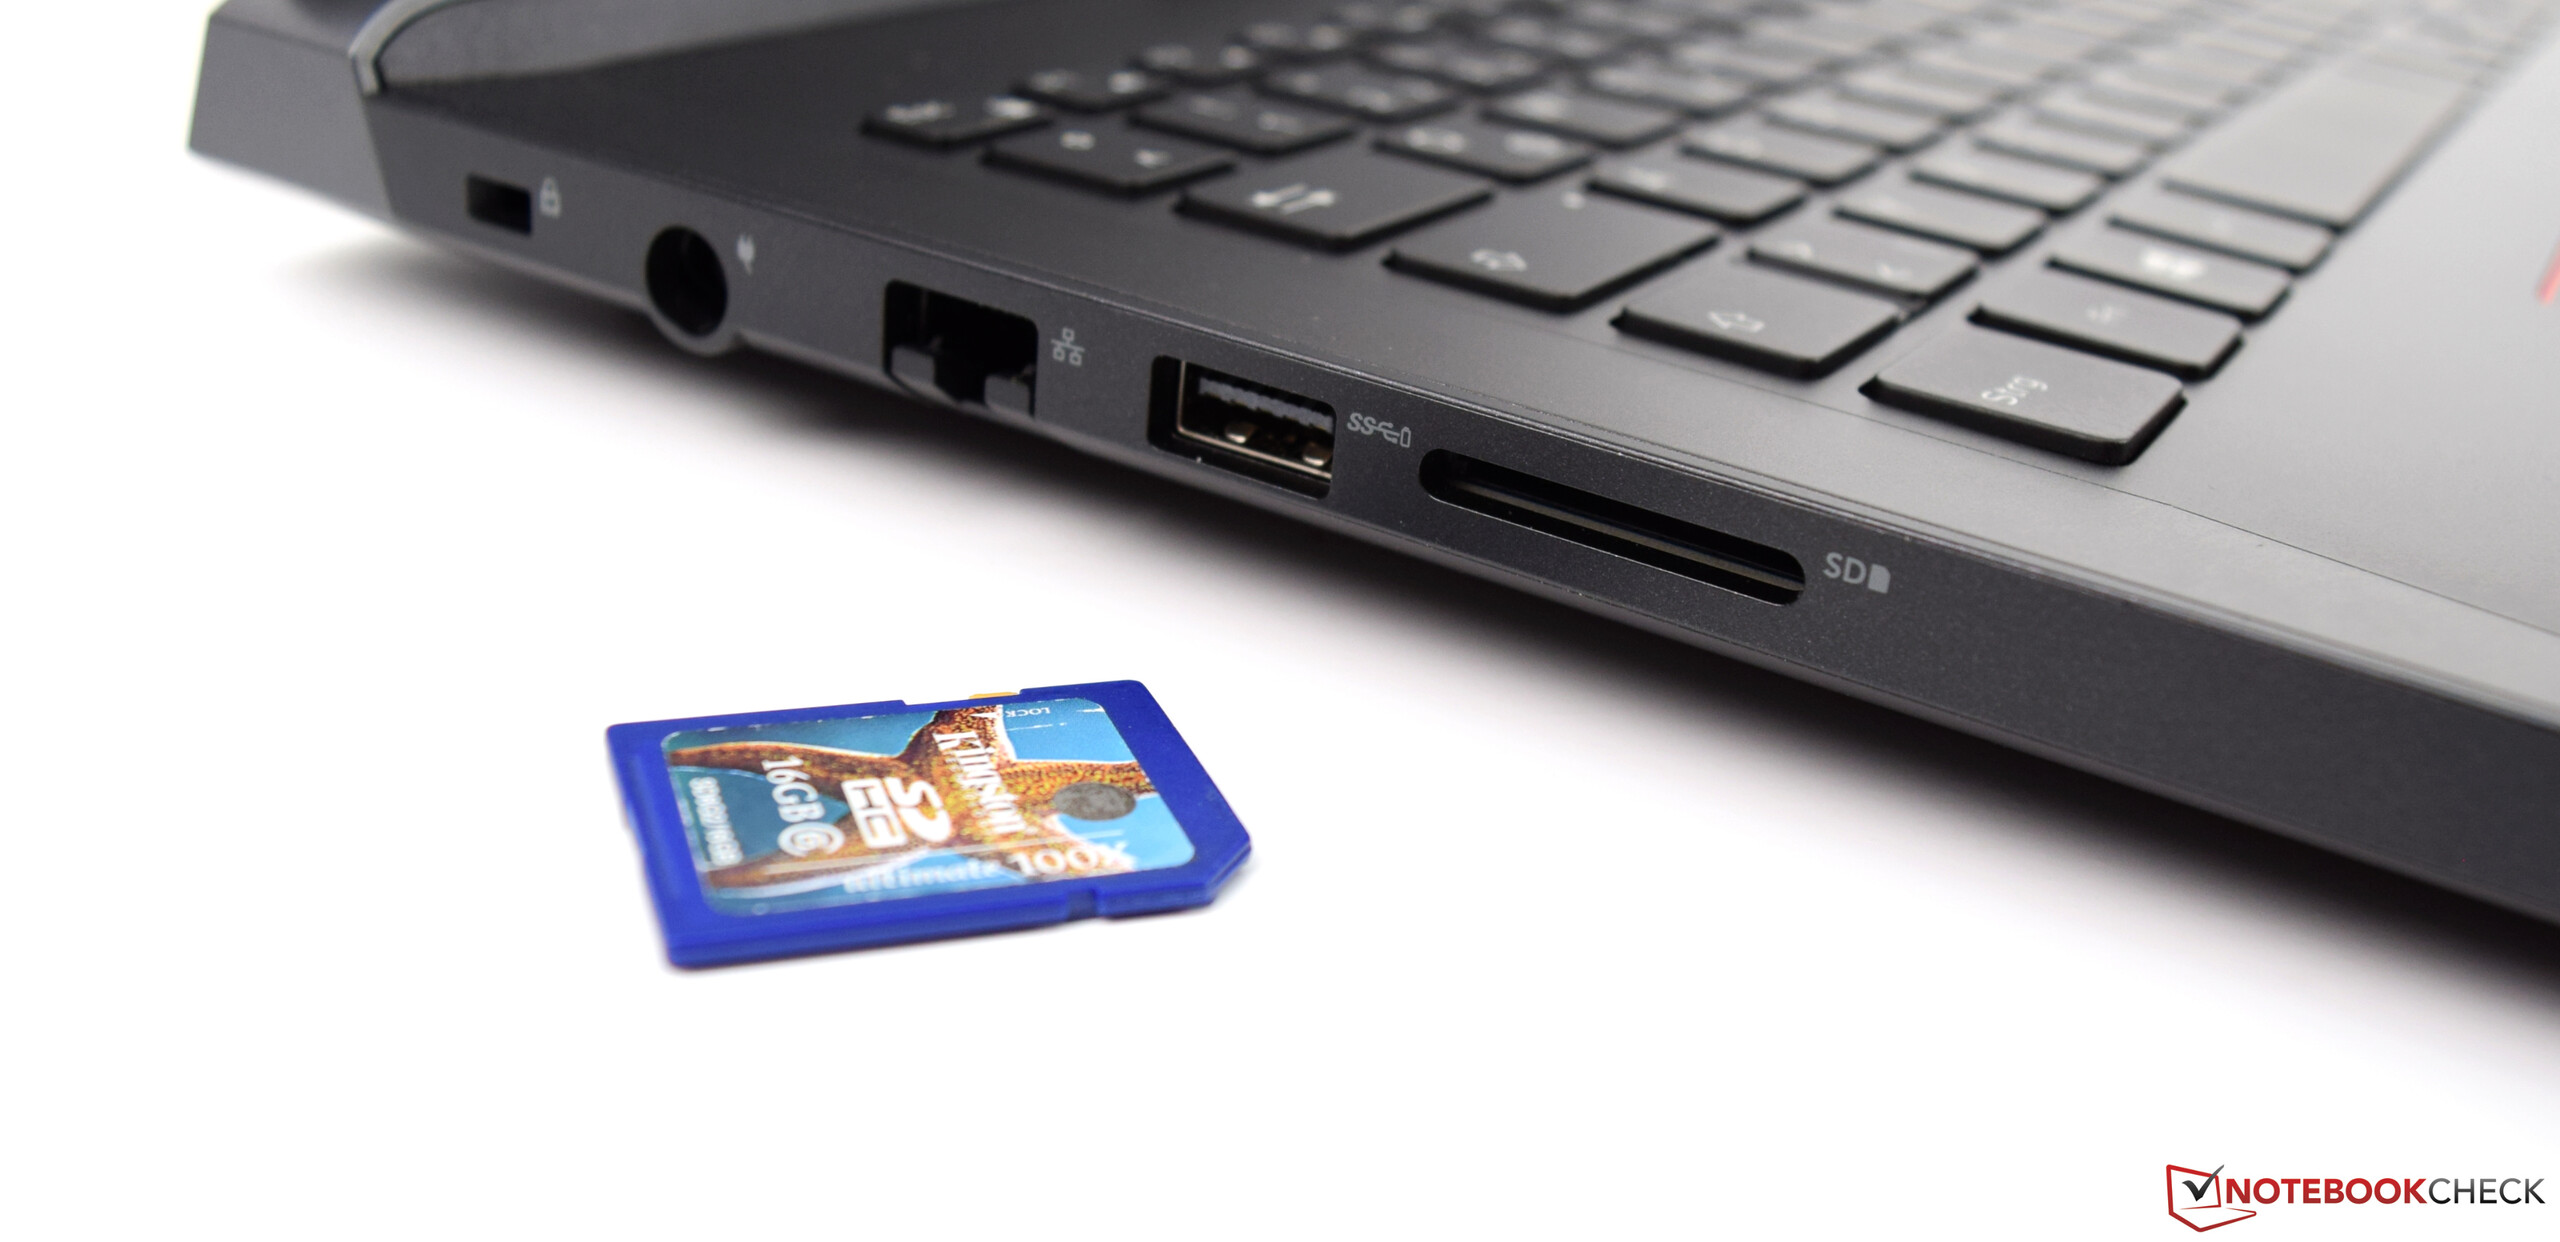
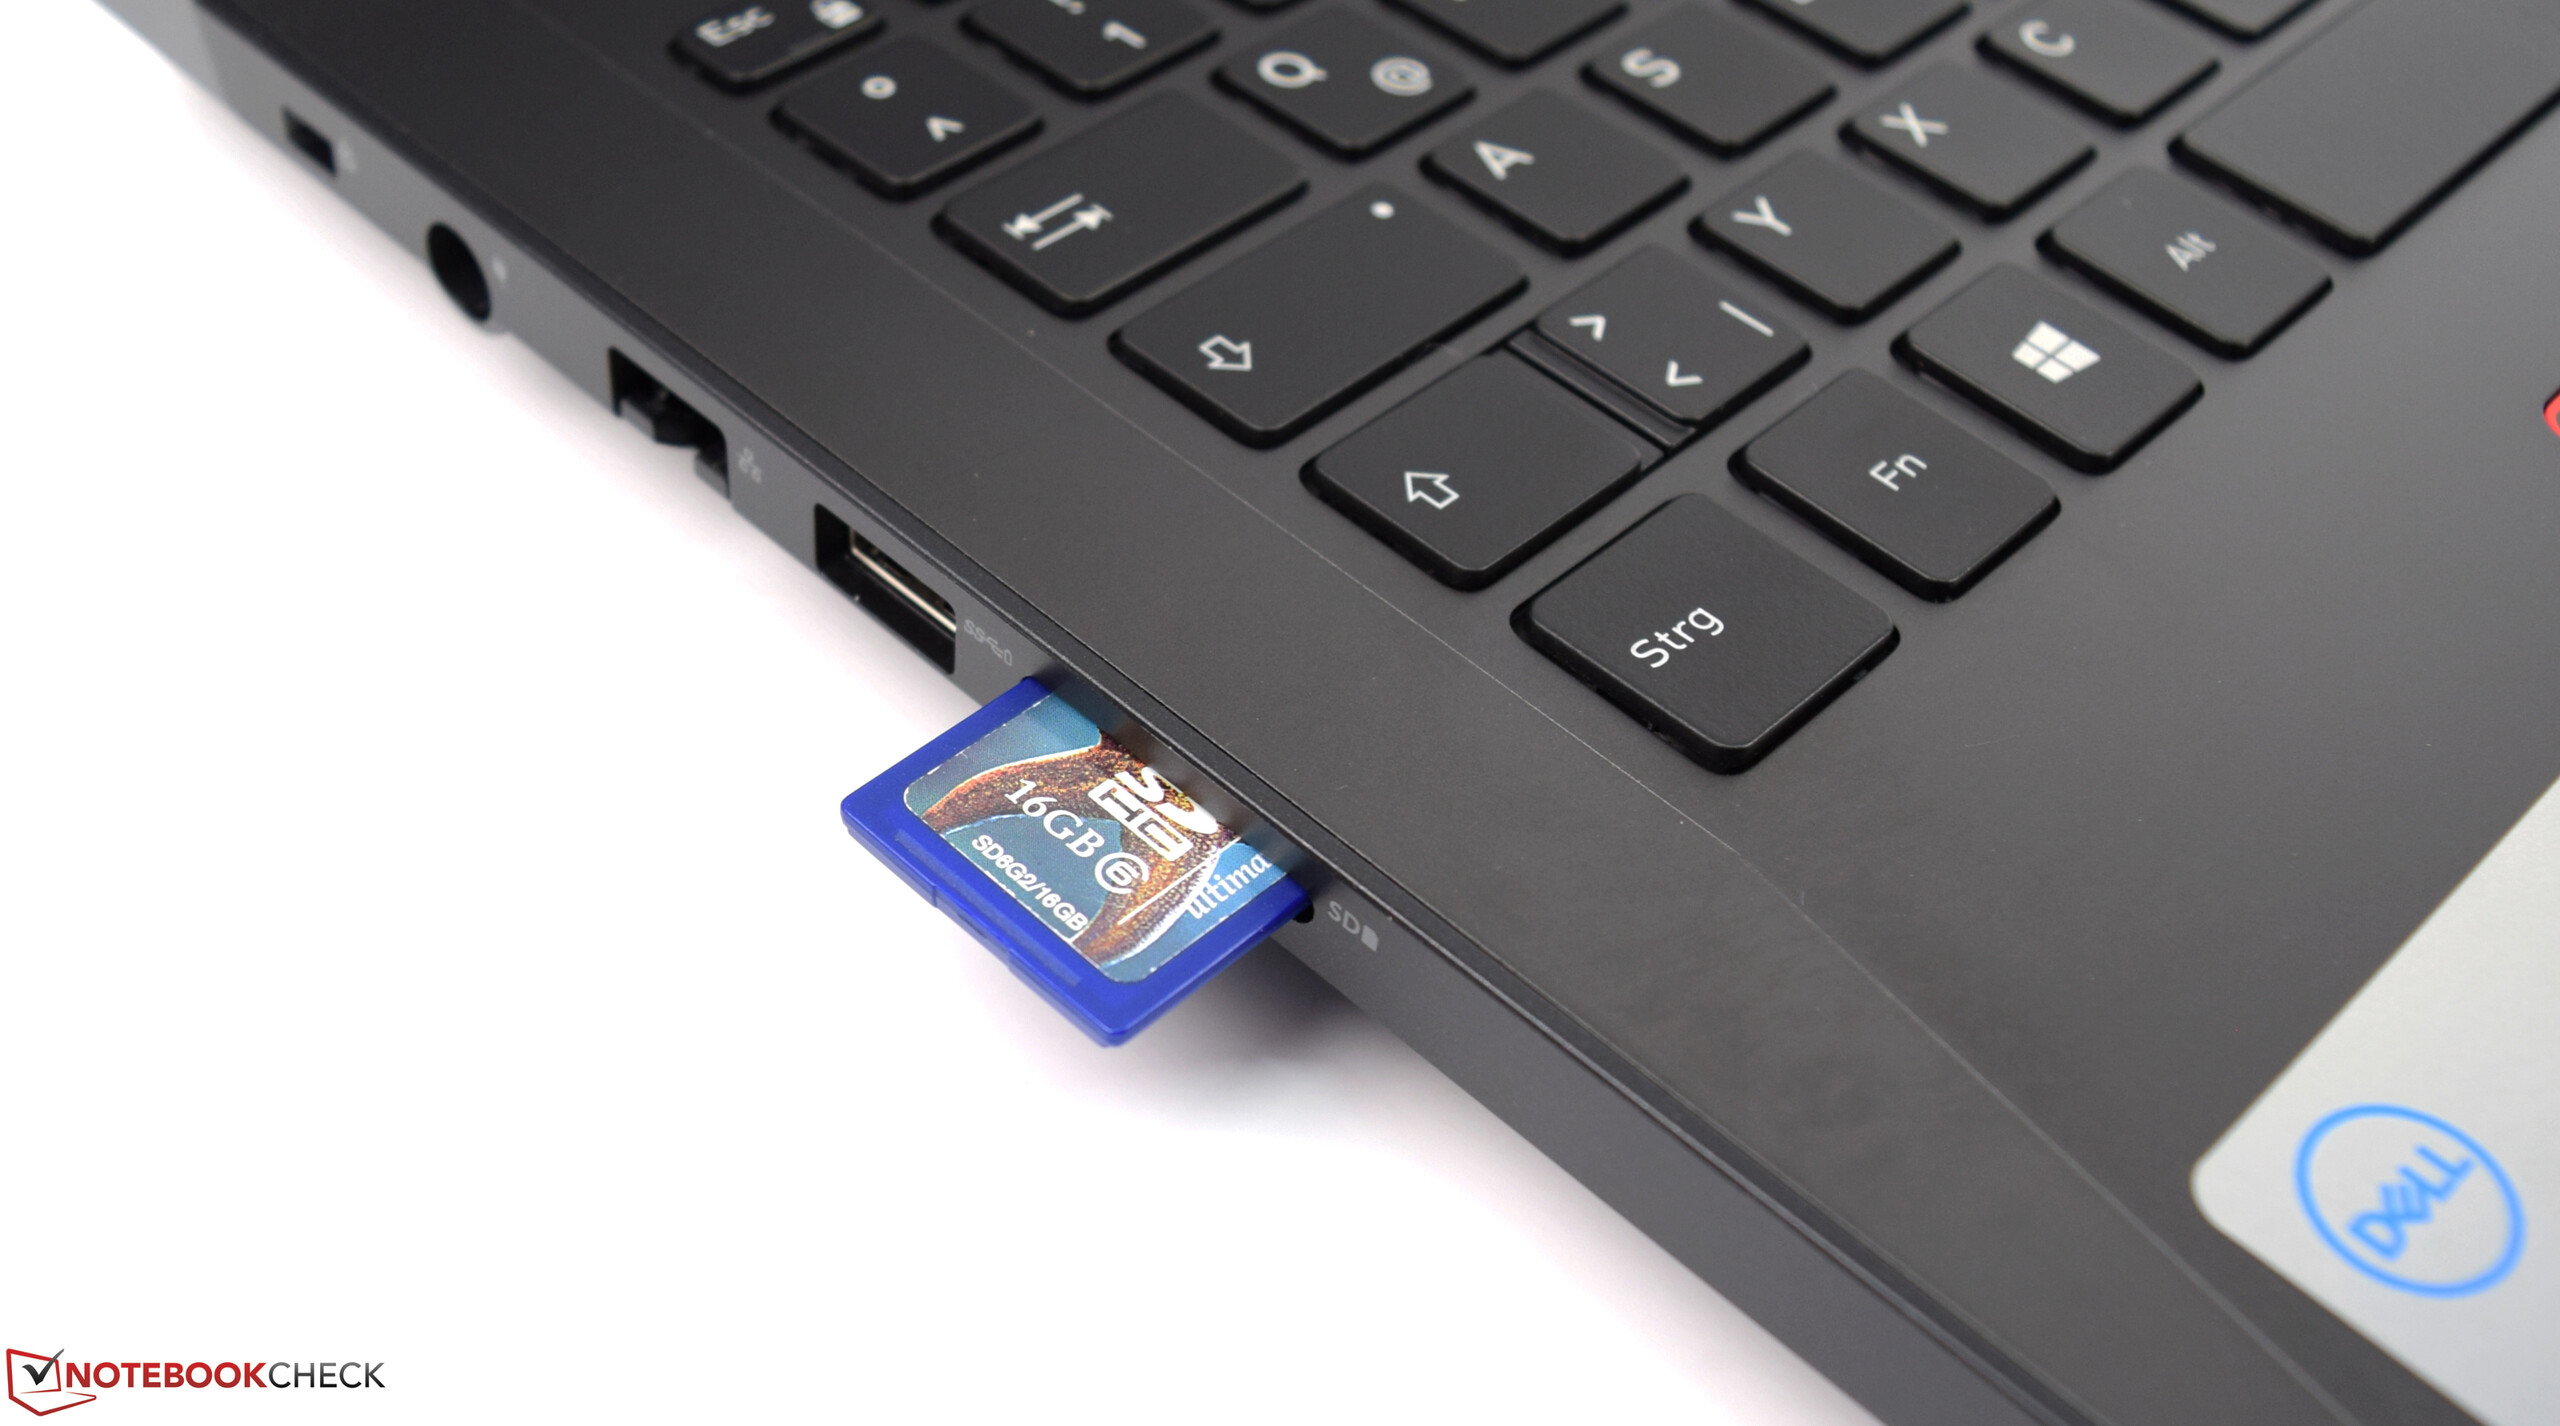
| SD Card Reader | |
| average JPG Copy Test (av. of 3 runs) | |
| Sınıf ortalaması Gaming (20.9 - 210, n=54, son 2 yıl) | |
| PC Zentrum Proteus V (Toshiba Exceria Pro SDXC 64 GB UHS-II) | |
| Asus FX503VM-EH73 (Toshiba Exceria Pro SDXC 64 GB UHS-II) | |
| Acer Predator Helios 300 PH317-52-51M6 (Toshiba Exceria Pro SDXC 64 GB UHS-II) | |
| Dell Inspiron 15 7000 7577 (Toshiba Exceria Pro SDXC 64 GB UHS-II) | |
| Acer Nitro 5 Spin NP515-51-86CX (Toshiba Exceria Pro SDXC 64 GB UHS-II) | |
| Dell G5 15 5587 (Toshiba Exceria Pro SDXC 64 GB UHS-II) | |
| Dell Inspiron 15 7000 7577 (Toshiba Exceria Pro SDXC 64 GB UHS-II) | |
| maximum AS SSD Seq Read Test (1GB) | |
| Sınıf ortalaması Gaming (25.5 - 261, n=51, son 2 yıl) | |
| PC Zentrum Proteus V (Toshiba Exceria Pro SDXC 64 GB UHS-II) | |
| Asus FX503VM-EH73 (Toshiba Exceria Pro SDXC 64 GB UHS-II) | |
| Acer Predator Helios 300 PH317-52-51M6 (Toshiba Exceria Pro SDXC 64 GB UHS-II) | |
| Dell G5 15 5587 (Toshiba Exceria Pro SDXC 64 GB UHS-II) | |
| Dell Inspiron 15 7000 7577 (Toshiba Exceria Pro SDXC 64 GB UHS-II) | |
| Dell Inspiron 15 7000 7577 (Toshiba Exceria Pro SDXC 64 GB UHS-II) | |
| Acer Nitro 5 Spin NP515-51-86CX (Toshiba Exceria Pro SDXC 64 GB UHS-II) | |
| Networking | |
| iperf3 transmit AX12 | |
| Dell Inspiron 15 7000 7577 | |
| Acer Nitro 5 Spin NP515-51-86CX | |
| Acer Predator Helios 300 PH317-52-51M6 | |
| Dell G5 15 5587 | |
| Dell Inspiron 15 7000 7577 | |
| PC Zentrum Proteus V | |
| Asus FX503VM-EH73 | |
| iperf3 receive AX12 | |
| Acer Predator Helios 300 PH317-52-51M6 | |
| PC Zentrum Proteus V | |
| Dell Inspiron 15 7000 7577 | |
| Acer Nitro 5 Spin NP515-51-86CX | |
| Asus FX503VM-EH73 | |
| Dell Inspiron 15 7000 7577 | |
| Dell G5 15 5587 | |
| |||||||||||||||||||||||||
Aydınlatma: 87 %
Batarya modunda parlaklık: 229 cd/m²
Kontrast: 818:1 (Siyah: 0.28 cd/m²)
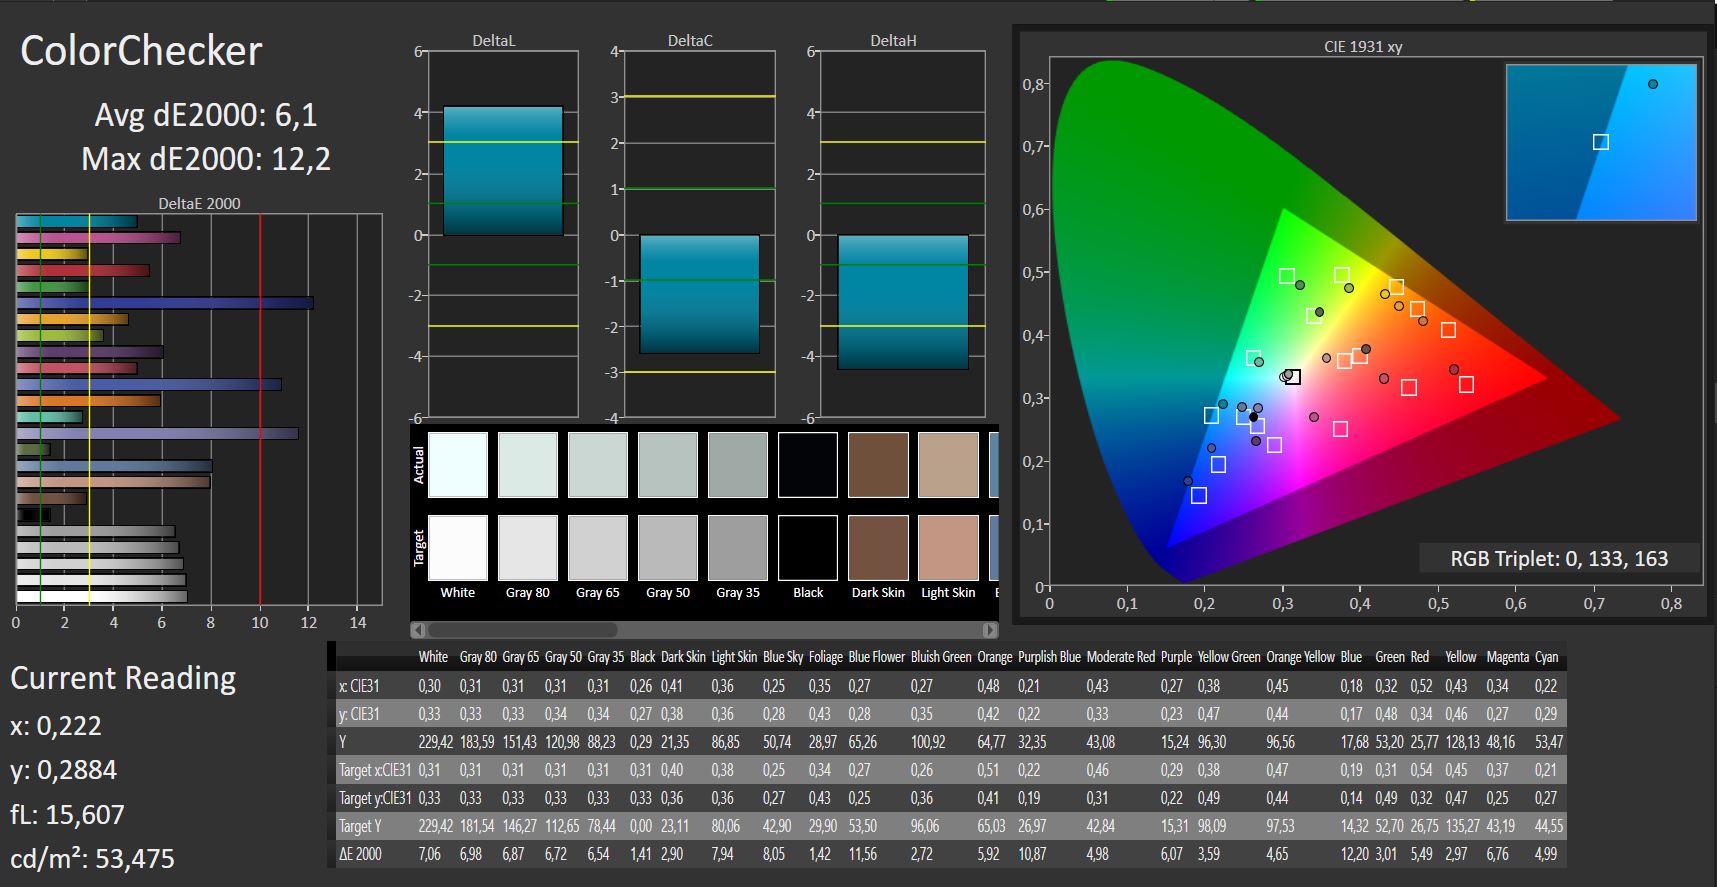
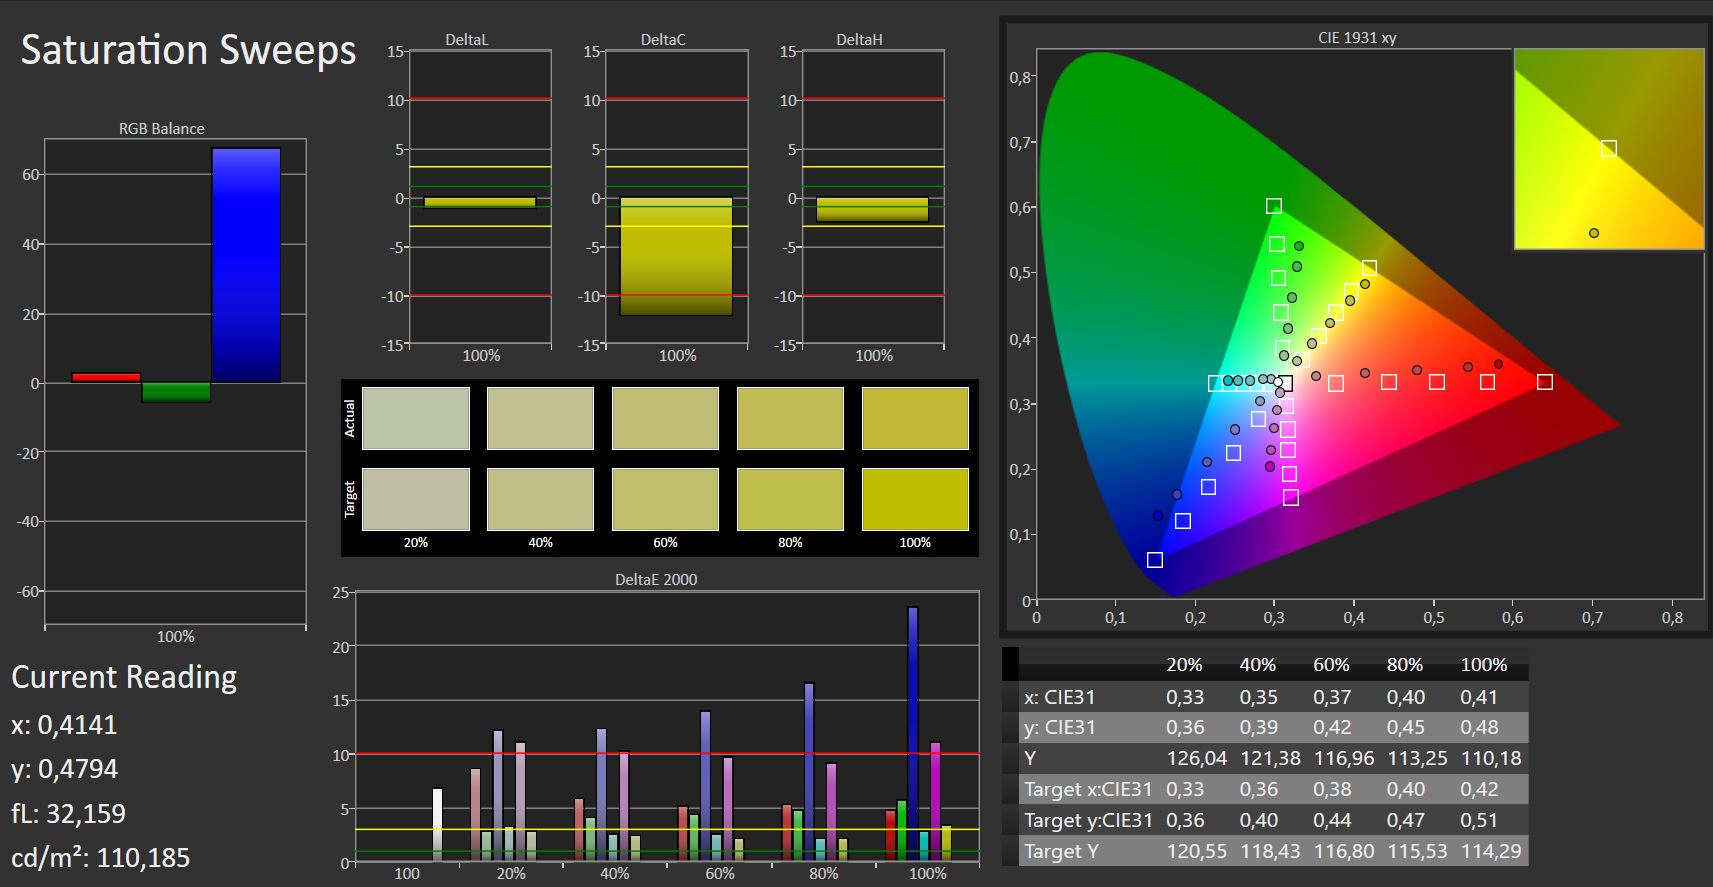
ΔE ColorChecker Calman: 6.1 | ∀{0.5-29.43 Ø4.72}
calibrated: 6.12
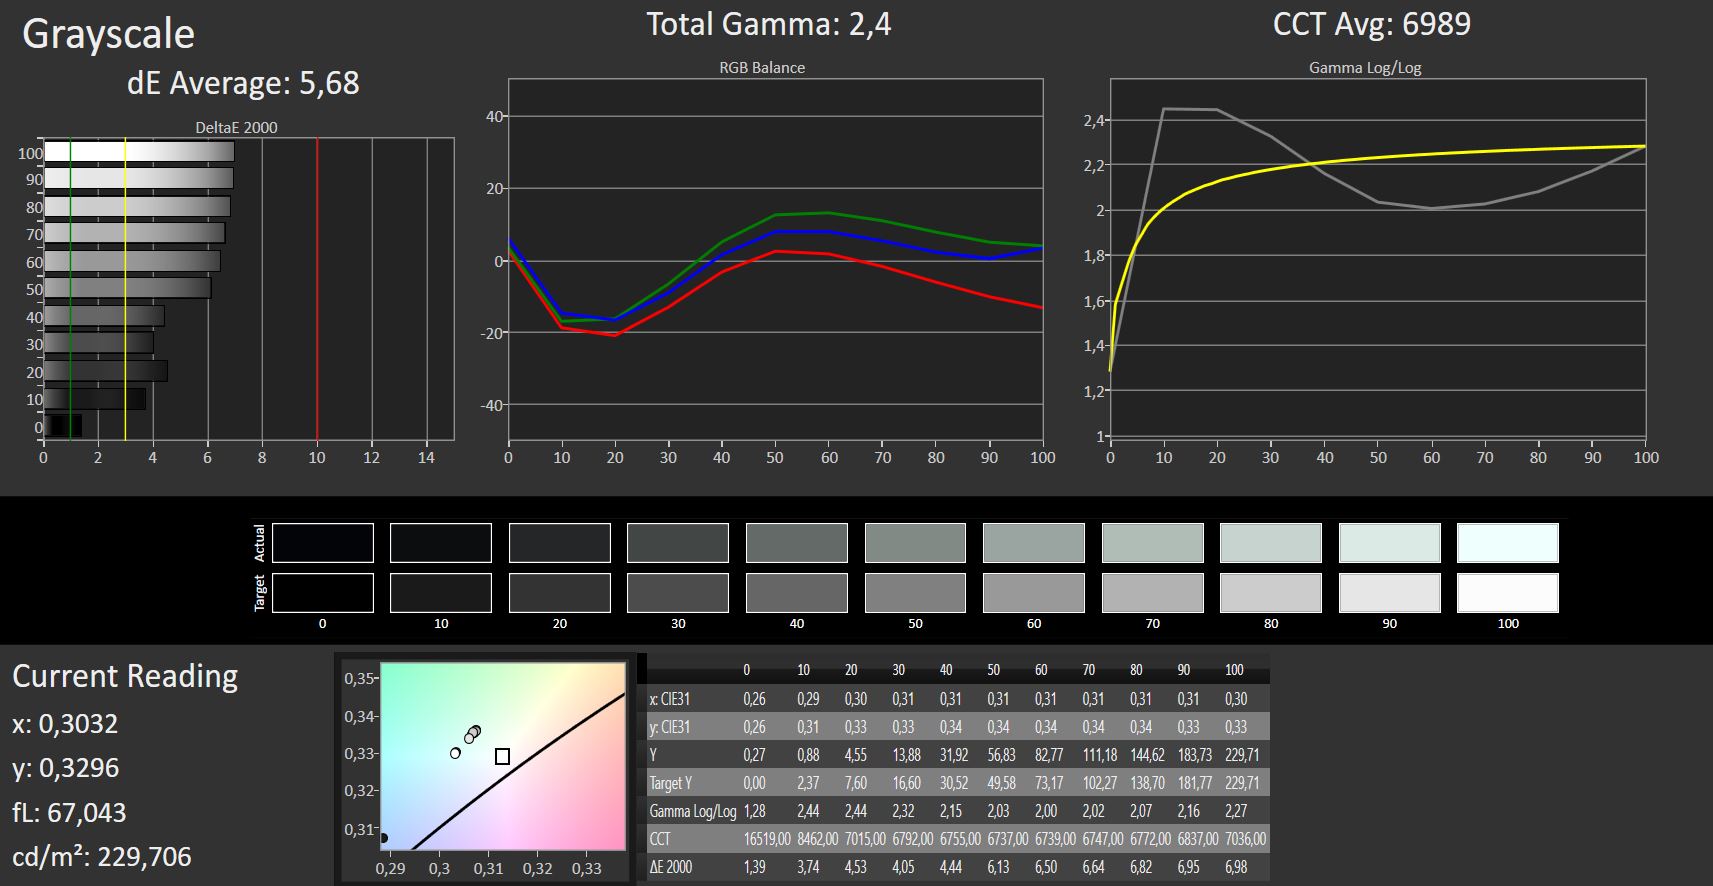
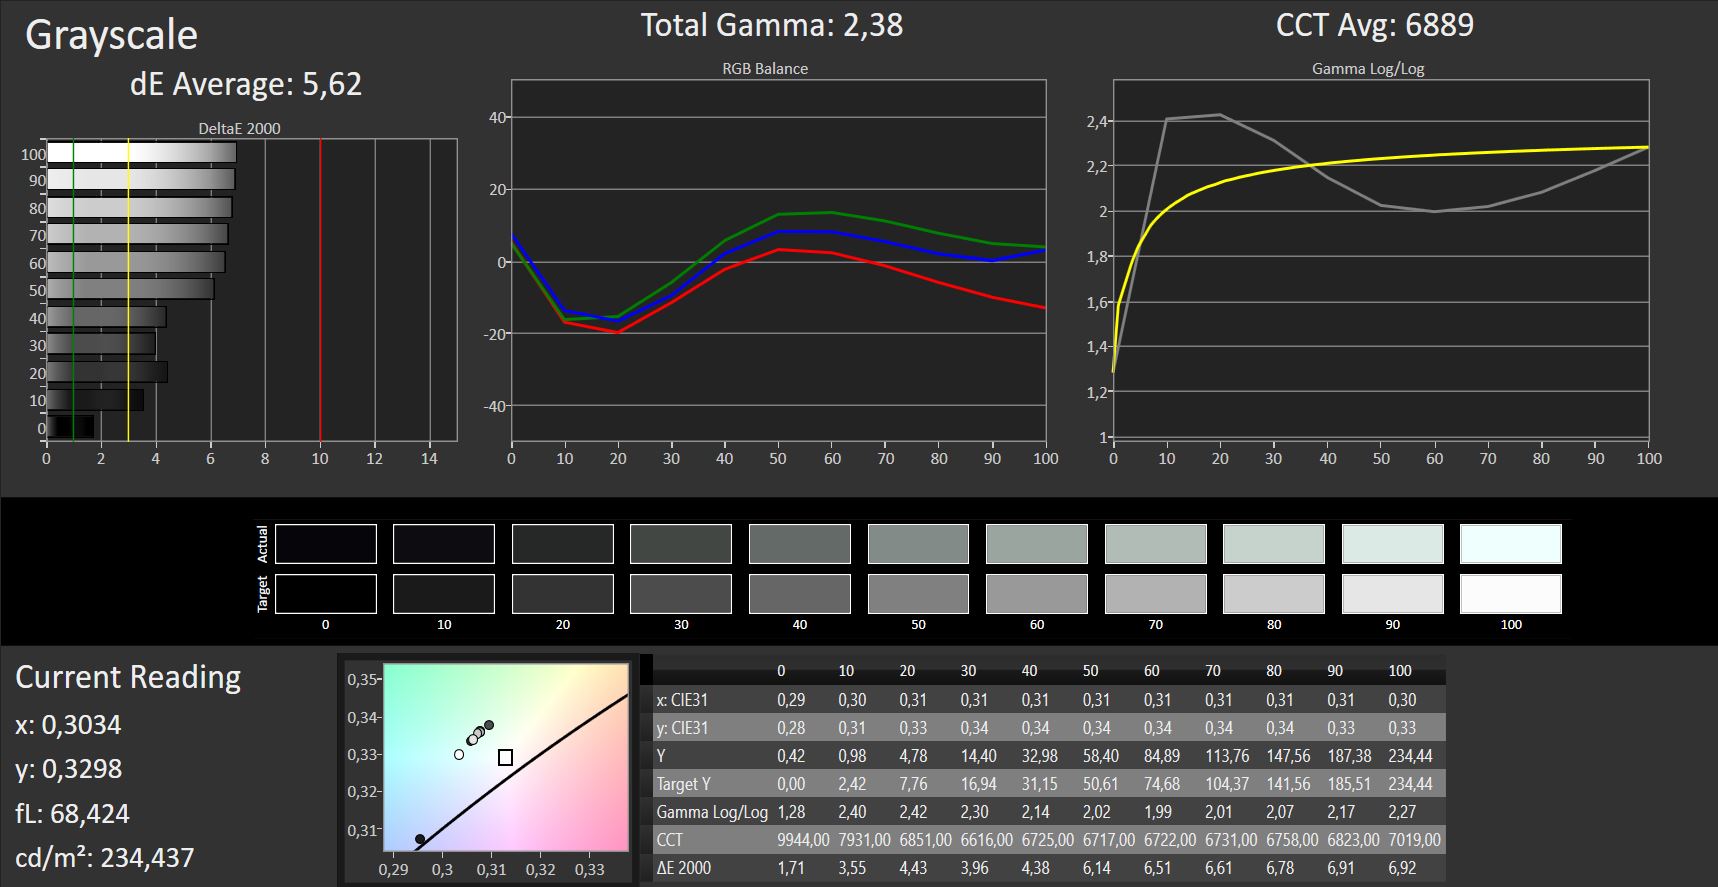
ΔE Greyscale Calman: 5.68 | ∀{0.09-98 Ø4.97}
57% sRGB (Argyll 1.6.3 3D)
36% AdobeRGB 1998 (Argyll 1.6.3 3D)
39.47% AdobeRGB 1998 (Argyll 3D)
56.8% sRGB (Argyll 3D)
38.13% Display P3 (Argyll 3D)
Gamma: 2.4
CCT: 6989 K
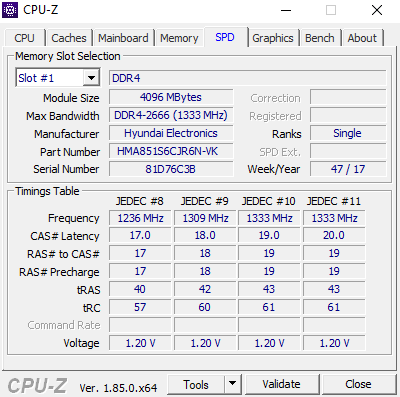
| Dell G5 15 5587 LGD053F, 156WF6, 1920x1080, 15.6" | Dell Inspiron 15 7000 7577 ID: LG Philips LGD053F, Name: 156WF6, Dell P/N: 4XK13, 1920x1080, 15.6" | Dell Inspiron 15 7000 7577 ID: LG Philips LGD053F, Name: 156WF6, Dell P/N: 4XK13, 1920x1080, 15.6" | PC Zentrum Proteus V BOEhydis NV156FHM-N42 (BOE06C6), 1920x1080, 15.6" | Asus FX503VM-EH73 AU Optronics B156HAN06.1, 1920x1080, 15.6" | Acer Nitro 5 Spin NP515-51-86CX Chi Mei CMN15D7, 1920x1080, 15.6" | Acer Predator Helios 300 PH317-52-51M6 LG Philips LP173WF4-SPF5 (LGD056D), 1920x1080, 17.3" | |
|---|---|---|---|---|---|---|---|
| Display | 6% | -3% | 2% | -2% | 67% | 63% | |
| Display P3 Coverage (%) | 38.13 | 40.4 6% | 37.07 -3% | 39.13 3% | 37.48 -2% | 64.9 70% | 67.1 76% |
| sRGB Coverage (%) | 56.8 | 60.5 7% | 55.6 -2% | 58 2% | 56.3 -1% | 92.6 63% | 86.1 52% |
| AdobeRGB 1998 Coverage (%) | 39.47 | 41.77 6% | 38.32 -3% | 40.42 2% | 38.72 -2% | 66.3 68% | 63 60% |
| Response Times | -21% | -12% | -63% | -22% | -9% | -1% | |
| Response Time Grey 50% / Grey 80% * (ms) | 33 ? | 41 ? -24% | 35.6 ? -8% | 52.8 ? -60% | 36.8 ? -12% | 36 ? -9% | 36 ? -9% |
| Response Time Black / White * (ms) | 24 ? | 28 ? -17% | 27.6 ? -15% | 39.6 ? -65% | 31.6 ? -32% | 26 ? -8% | 22 ? 8% |
| PWM Frequency (Hz) | 21930 ? | 122000 ? | |||||
| Screen | 19% | -2% | 21% | 1% | 25% | 23% | |
| Brightness middle (cd/m²) | 229 | 257 12% | 235.4 3% | 242 6% | 235.9 3% | 345 51% | 365 59% |
| Brightness (cd/m²) | 224 | 229 2% | 223 0% | 235 5% | 235 5% | 332 48% | 341 52% |
| Brightness Distribution (%) | 87 | 84 -3% | 91 5% | 85 -2% | 91 5% | 92 6% | 89 2% |
| Black Level * (cd/m²) | 0.28 | 0.17 39% | 0.28 -0% | 0.21 25% | 0.27 4% | 0.28 -0% | 0.32 -14% |
| Contrast (:1) | 818 | 1512 85% | 841 3% | 1152 41% | 874 7% | 1232 51% | 1141 39% |
| Colorchecker dE 2000 * | 6.1 | 5.34 12% | 5.6 8% | 4.27 30% | 4.81 21% | 5.85 4% | 6.51 -7% |
| Colorchecker dE 2000 max. * | 12.2 | 9.99 18% | 20.3 -66% | 7.09 42% | 21.55 -77% | 11.87 3% | 12.32 -1% |
| Colorchecker dE 2000 calibrated * | 6.12 | 2.9 53% | |||||
| Greyscale dE 2000 * | 5.68 | 4.82 15% | 3.6 37% | 2.17 62% | 3.1 45% | 8.11 -43% | 7.65 -35% |
| Gamma | 2.4 92% | 2.46 89% | 2.23 99% | 2.38 92% | 2.31 95% | 2.48 89% | 2.64 83% |
| CCT | 6989 93% | 6587 99% | 7214 90% | 6912 94% | 6984 93% | 6741 96% | 8066 81% |
| Color Space (Percent of AdobeRGB 1998) (%) | 36 | 38 6% | 35.2 -2% | 37 3% | 36 0% | 60 67% | 56 56% |
| Color Space (Percent of sRGB) (%) | 57 | 60 5% | 55.4 -3% | 58 2% | 56 -2% | 93 63% | 86 51% |
| Toplam Ortalama (Program / Ayarlar) | 1% /
11% | -6% /
-3% | -13% /
6% | -8% /
-3% | 28% /
29% | 28% /
28% |
* ... daha küçük daha iyidir


Yanıt Sürelerini Görüntüle
| ↔ Tepki Süresi Siyahtan Beyaza | ||
|---|---|---|
| 24 ms ... yükseliş ↗ ve sonbahar↘ birleşimi | ↗ 14 ms yükseliş | 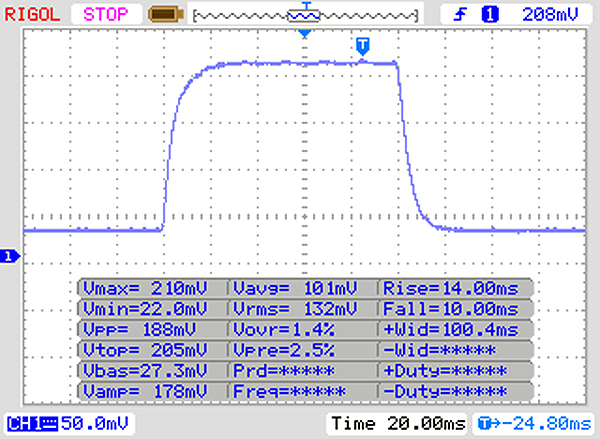 |
| ↘ 10 ms sonbahar | ||
| Ekran, testlerimizde iyi yanıt oranları gösteriyor ancak rekabetçi oyuncular için çok yavaş olabilir. Karşılaştırıldığında, test edilen tüm cihazlar 0.1 (minimum) ile 240 (maksimum) ms arasında değişir. » Tüm cihazların 54 %'si daha iyi. Bu, ölçülen yanıt süresinin test edilen tüm cihazların ortalamasından (19.8 ms) daha kötü olduğu anlamına gelir. | ||
| ↔ Tepki Süresi %50 Griden %80 Griye | ||
| 33 ms ... yükseliş ↗ ve sonbahar↘ birleşimi | ↗ 16 ms yükseliş | 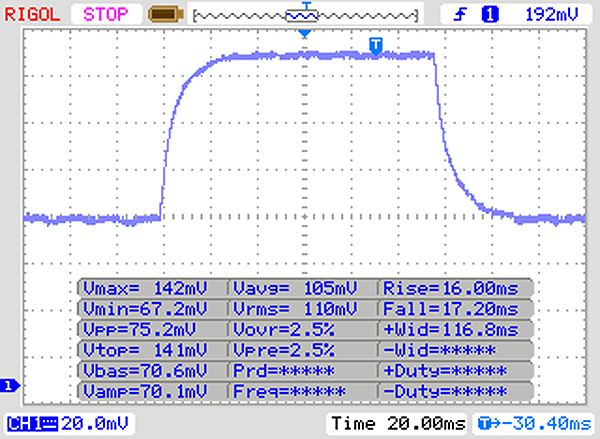 |
| ↘ 17 ms sonbahar | ||
| Ekran, testlerimizde yavaş yanıt oranları gösteriyor ve oyuncular için yetersiz olacaktır. Karşılaştırıldığında, test edilen tüm cihazlar 0.165 (minimum) ile 636 (maksimum) ms arasında değişir. » Tüm cihazların 45 %'si daha iyi. Bu, ölçülen yanıt süresinin test edilen tüm cihazların ortalamasına benzer olduğu anlamına gelir (31 ms). | ||
Ekran Titremesi / PWM (Darbe Genişliği Modülasyonu)
| Ekran titriyor / PWM algılanmadı | 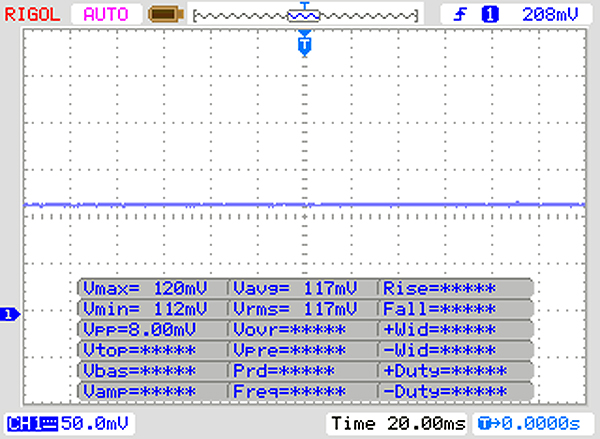 | ||
Karşılaştırıldığında: Test edilen tüm cihazların %52 %'si ekranı karartmak için PWM kullanmıyor. PWM tespit edilirse, ortalama 7763 (minimum: 5 - maksimum: 343500) Hz ölçüldü. | |||
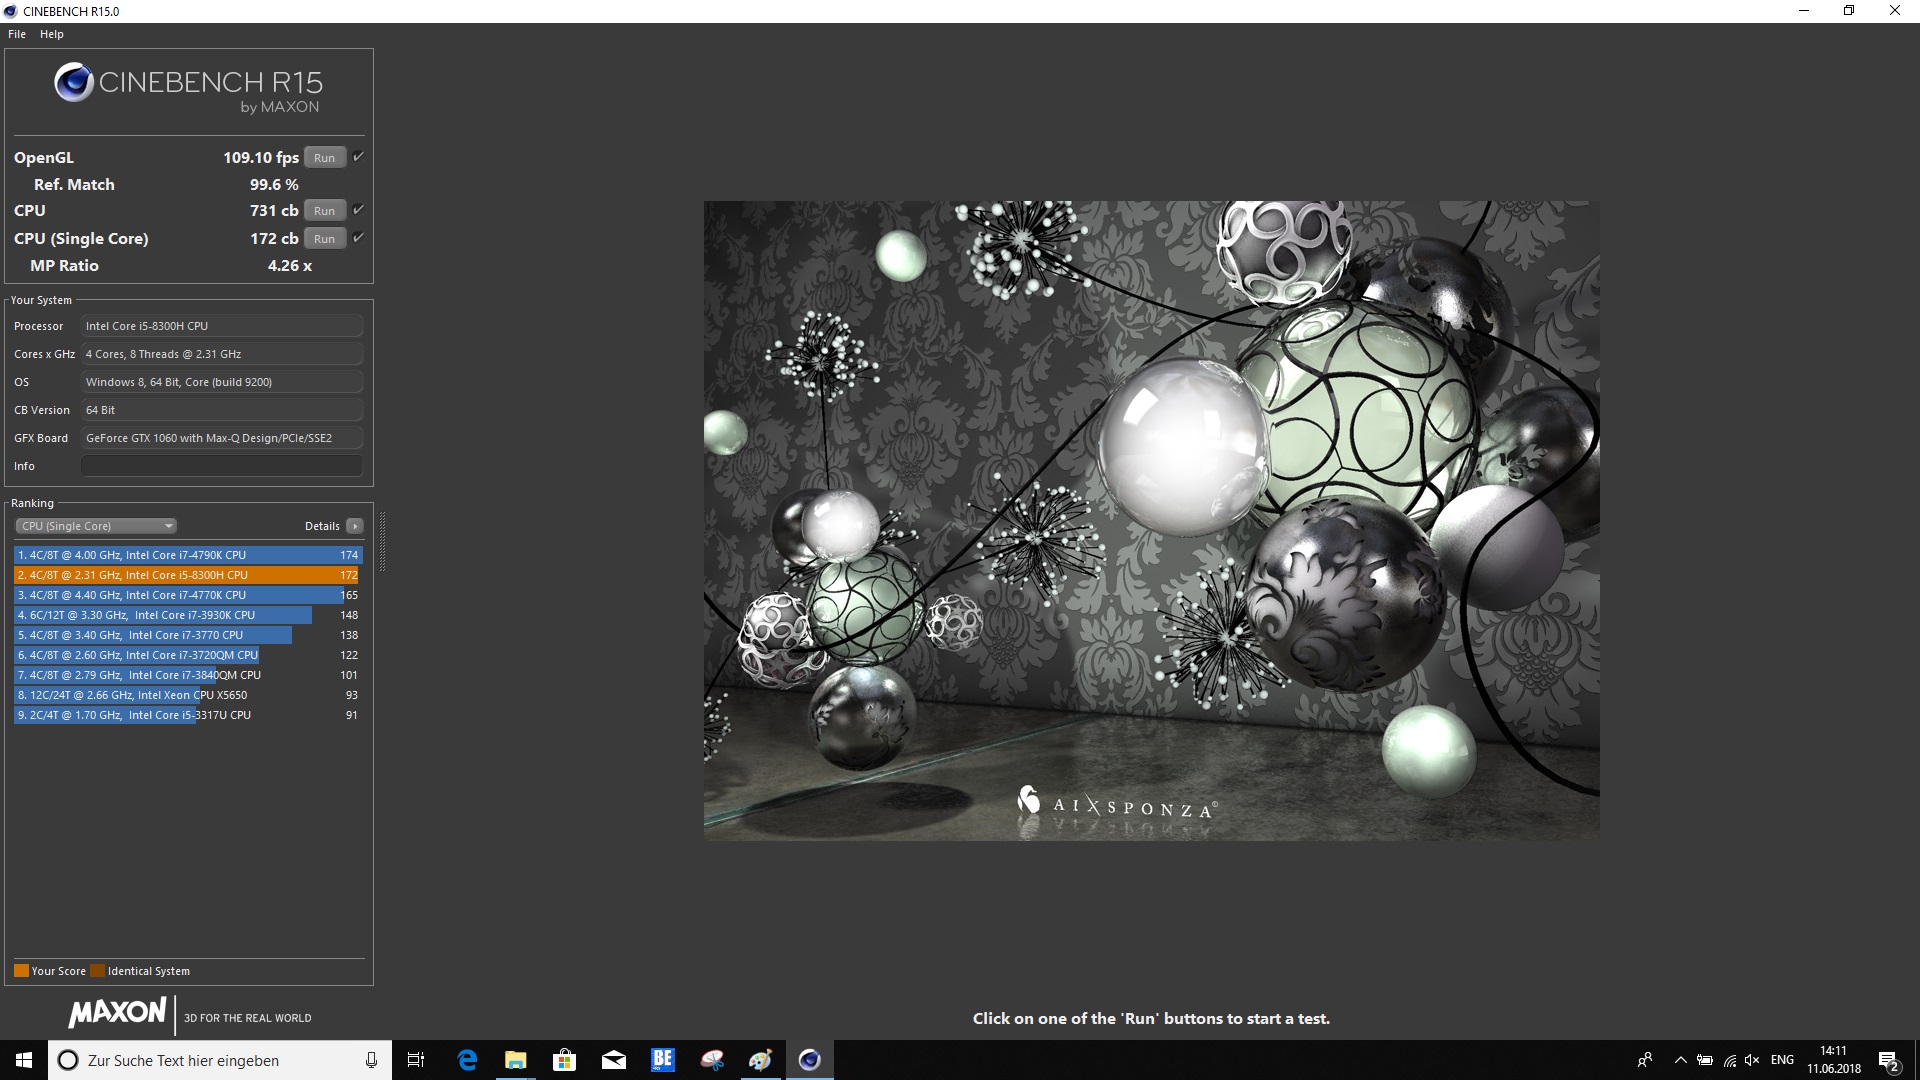
| Cinebench R15 | |
| CPU Single 64Bit | |
| Sınıf ortalaması Gaming (188.8 - 343, n=109, son 2 yıl) | |
| Acer Predator Helios 300 PH317-52-51M6 | |
| Dell G5 15 5587 | |
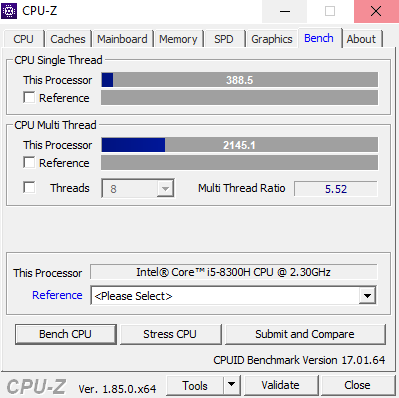
| Ortalama Intel Core i5-8300H (151 - 174, n=17) | |
| Acer Nitro 5 Spin NP515-51-86CX | |
| Asus FX503VM-EH73 | |
| PC Zentrum Proteus V | |
| Dell Inspiron 15 7000 7577 | |
| Dell Inspiron 15 7000 7577 | |
| CPU Multi 64Bit | |
| Sınıf ortalaması Gaming (1578 - 6271, n=108, son 2 yıl) | |
| Acer Predator Helios 300 PH317-52-51M6 | |
| Ortalama Intel Core i5-8300H (609 - 850, n=17) | |
| Dell G5 15 5587 | |
| PC Zentrum Proteus V | |
| Asus FX503VM-EH73 | |
| Acer Nitro 5 Spin NP515-51-86CX | |
| Dell Inspiron 15 7000 7577 | |
| Dell Inspiron 15 7000 7577 | |
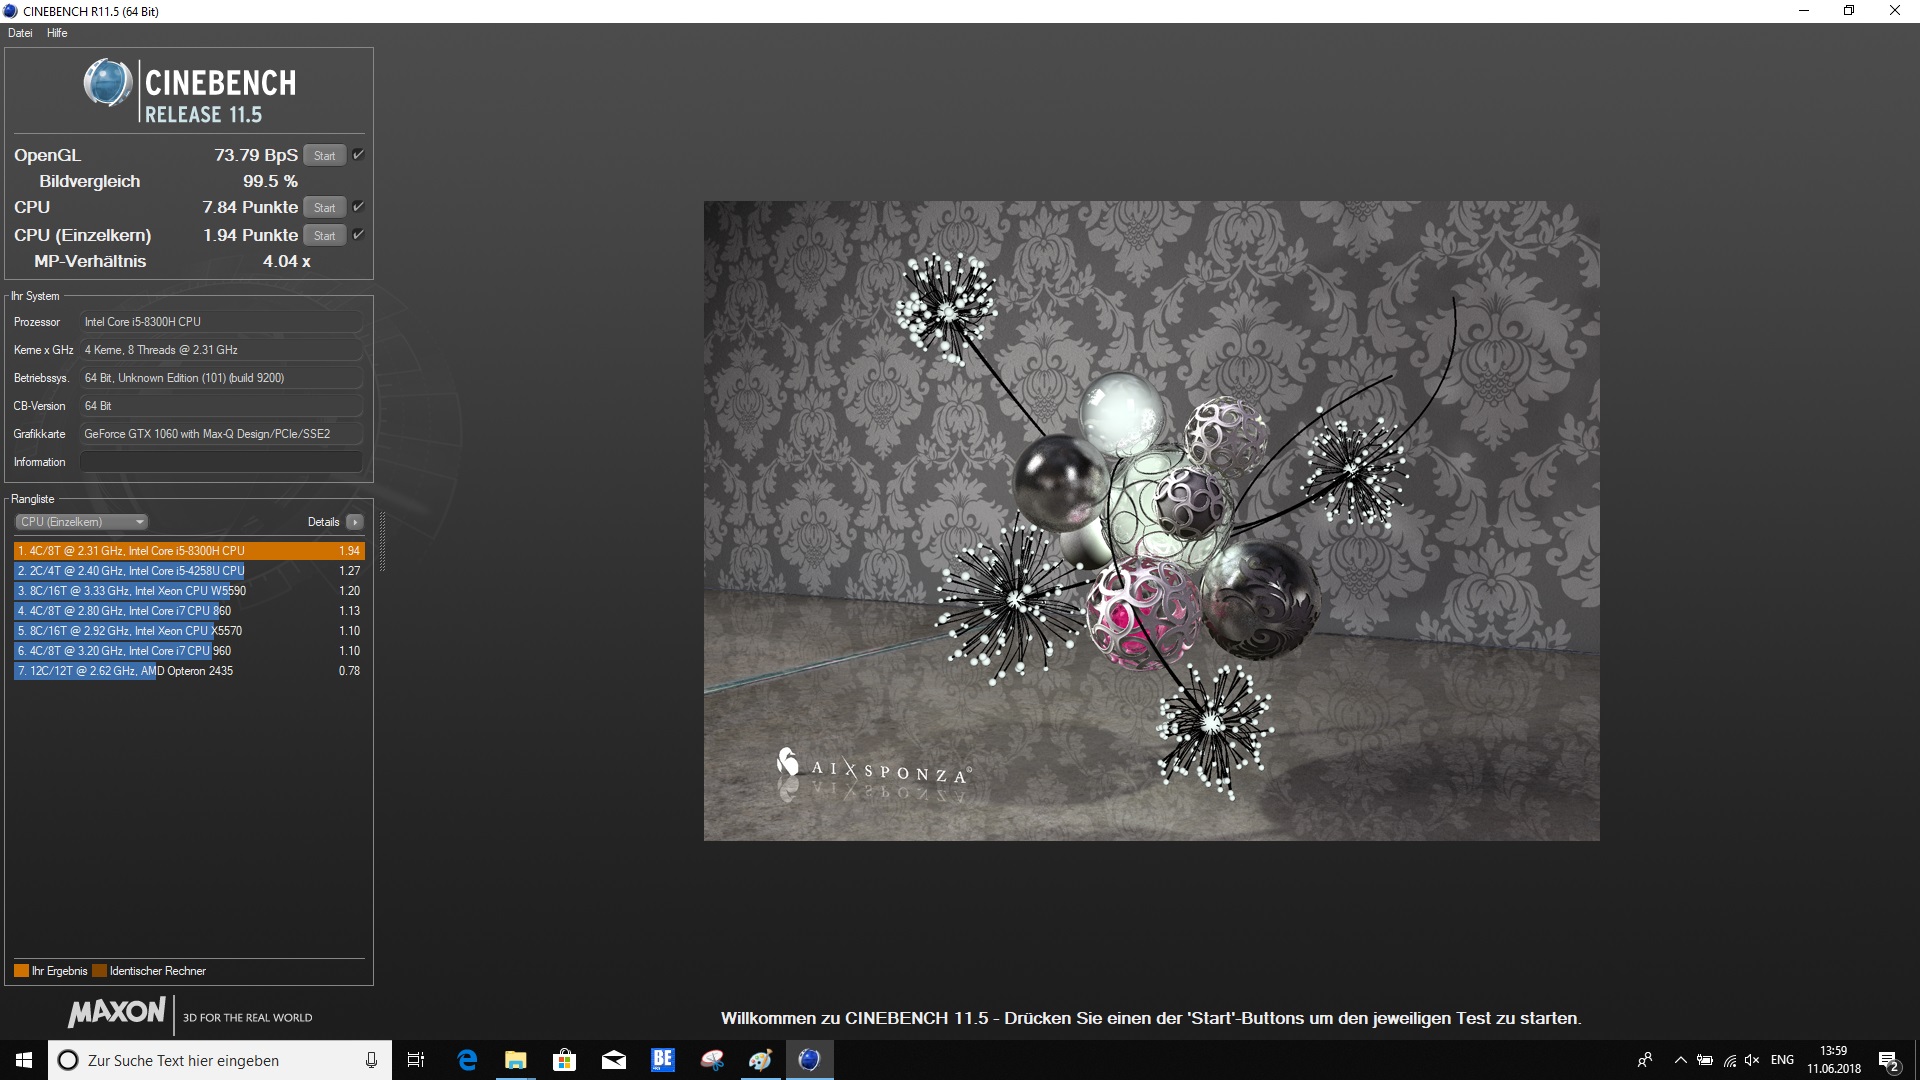
| Cinebench R11.5 | |
| CPU Multi 64Bit | |
| Sınıf ortalaması Gaming (29.8 - 70.7, n=8, son 2 yıl) | |
| Acer Predator Helios 300 PH317-52-51M6 | |
| Asus FX503VM-EH73 | |
| PC Zentrum Proteus V | |
| Ortalama Intel Core i5-8300H (6.2 - 8.79, n=7) | |
| Dell G5 15 5587 | |
| Dell Inspiron 15 7000 7577 | |
| Dell Inspiron 15 7000 7577 | |
| Acer Nitro 5 Spin NP515-51-86CX | |
| CPU Single 64Bit | |
| Sınıf ortalaması Gaming (3.3 - 3.98, n=8, son 2 yıl) | |
| Acer Predator Helios 300 PH317-52-51M6 | |
| Dell G5 15 5587 | |
| Ortalama Intel Core i5-8300H (1.72 - 1.96, n=7) | |
| Acer Nitro 5 Spin NP515-51-86CX | |
| Asus FX503VM-EH73 | |
| PC Zentrum Proteus V | |
| Dell Inspiron 15 7000 7577 | |
| Dell Inspiron 15 7000 7577 | |
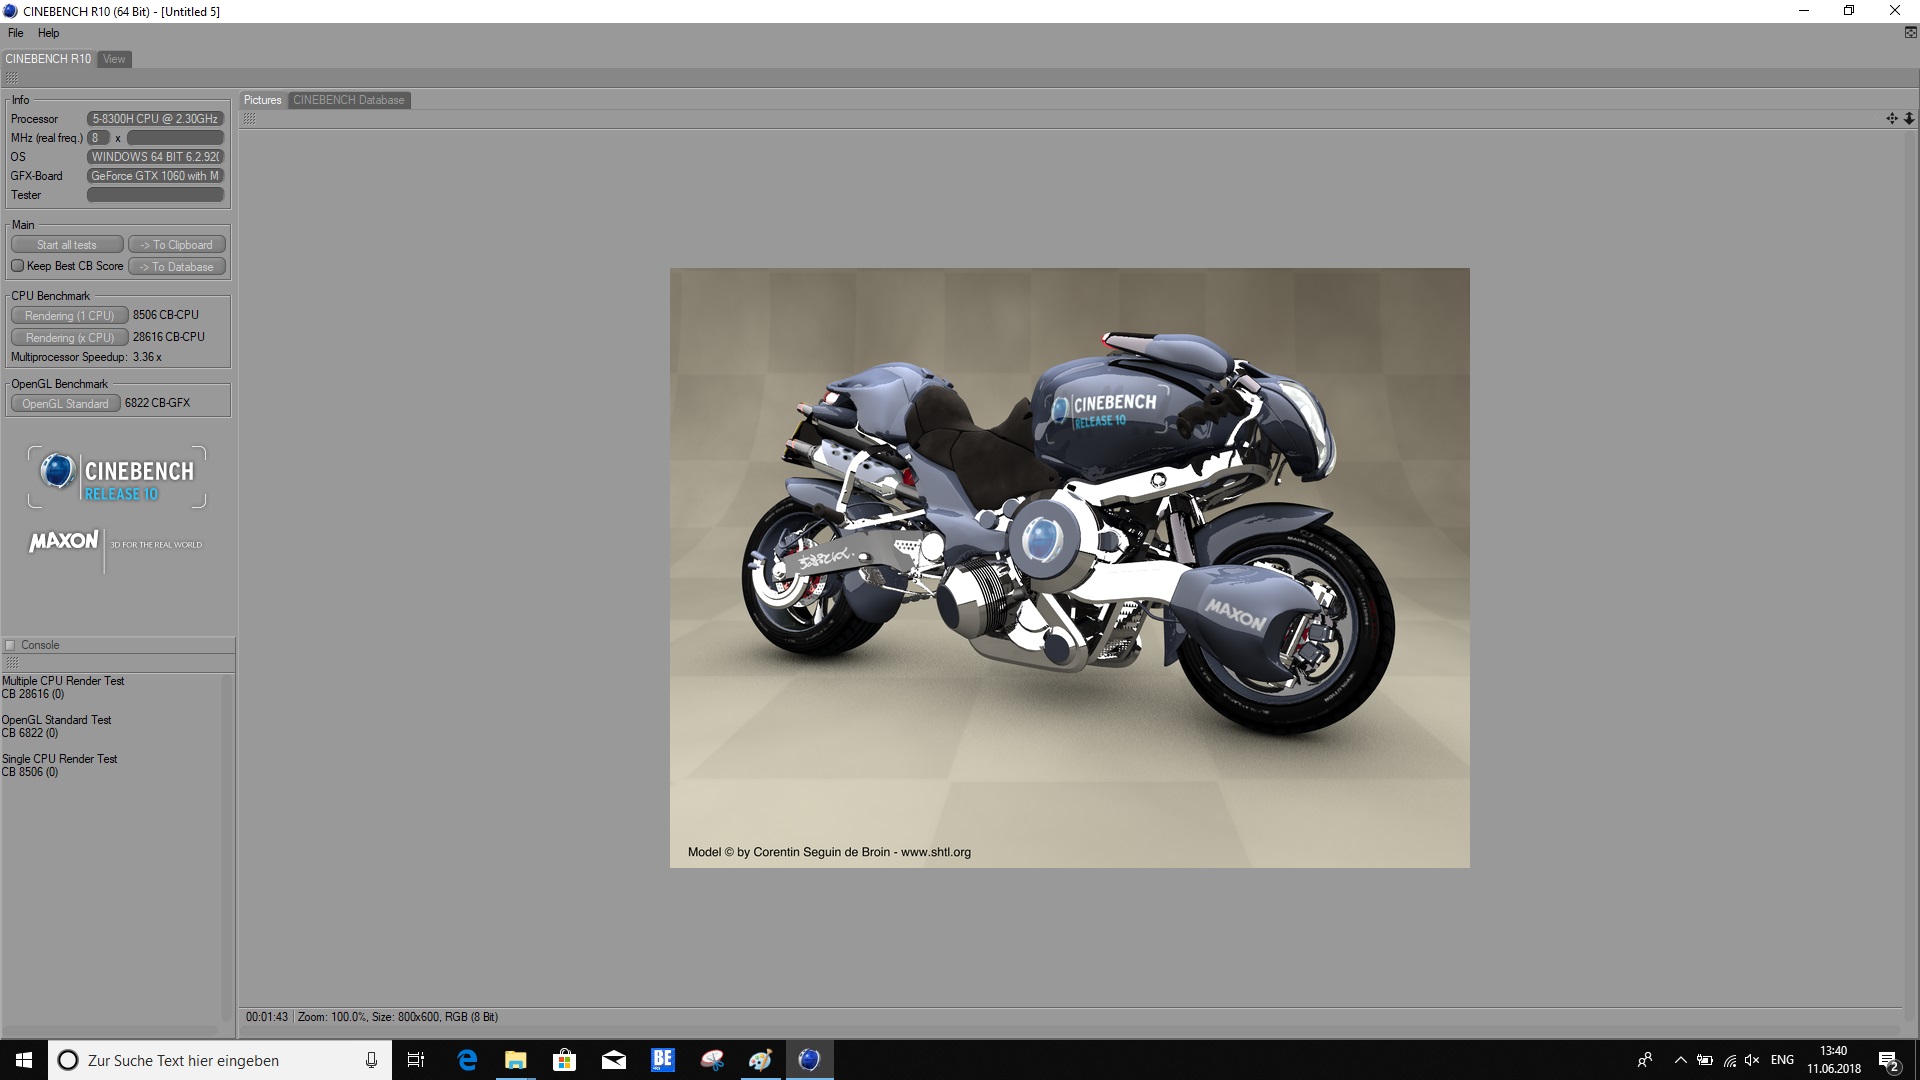
| Cinebench R10 | |
| Rendering Single CPUs 64Bit | |
| Sınıf ortalaması Gaming (17067 - 17085, n=2, son 2 yıl) | |
| Dell G5 15 5587 | |
| Ortalama Intel Core i5-8300H (8277 - 8506, n=2) | |
| Dell Inspiron 15 7000 7577 | |
| Rendering Multiple CPUs 64Bit | |
| Sınıf ortalaması Gaming (14159 - 144628, n=2, son 2 yıl) | |
| Ortalama Intel Core i5-8300H (28616 - 32021, n=2) | |
| Dell G5 15 5587 | |
| Dell Inspiron 15 7000 7577 | |
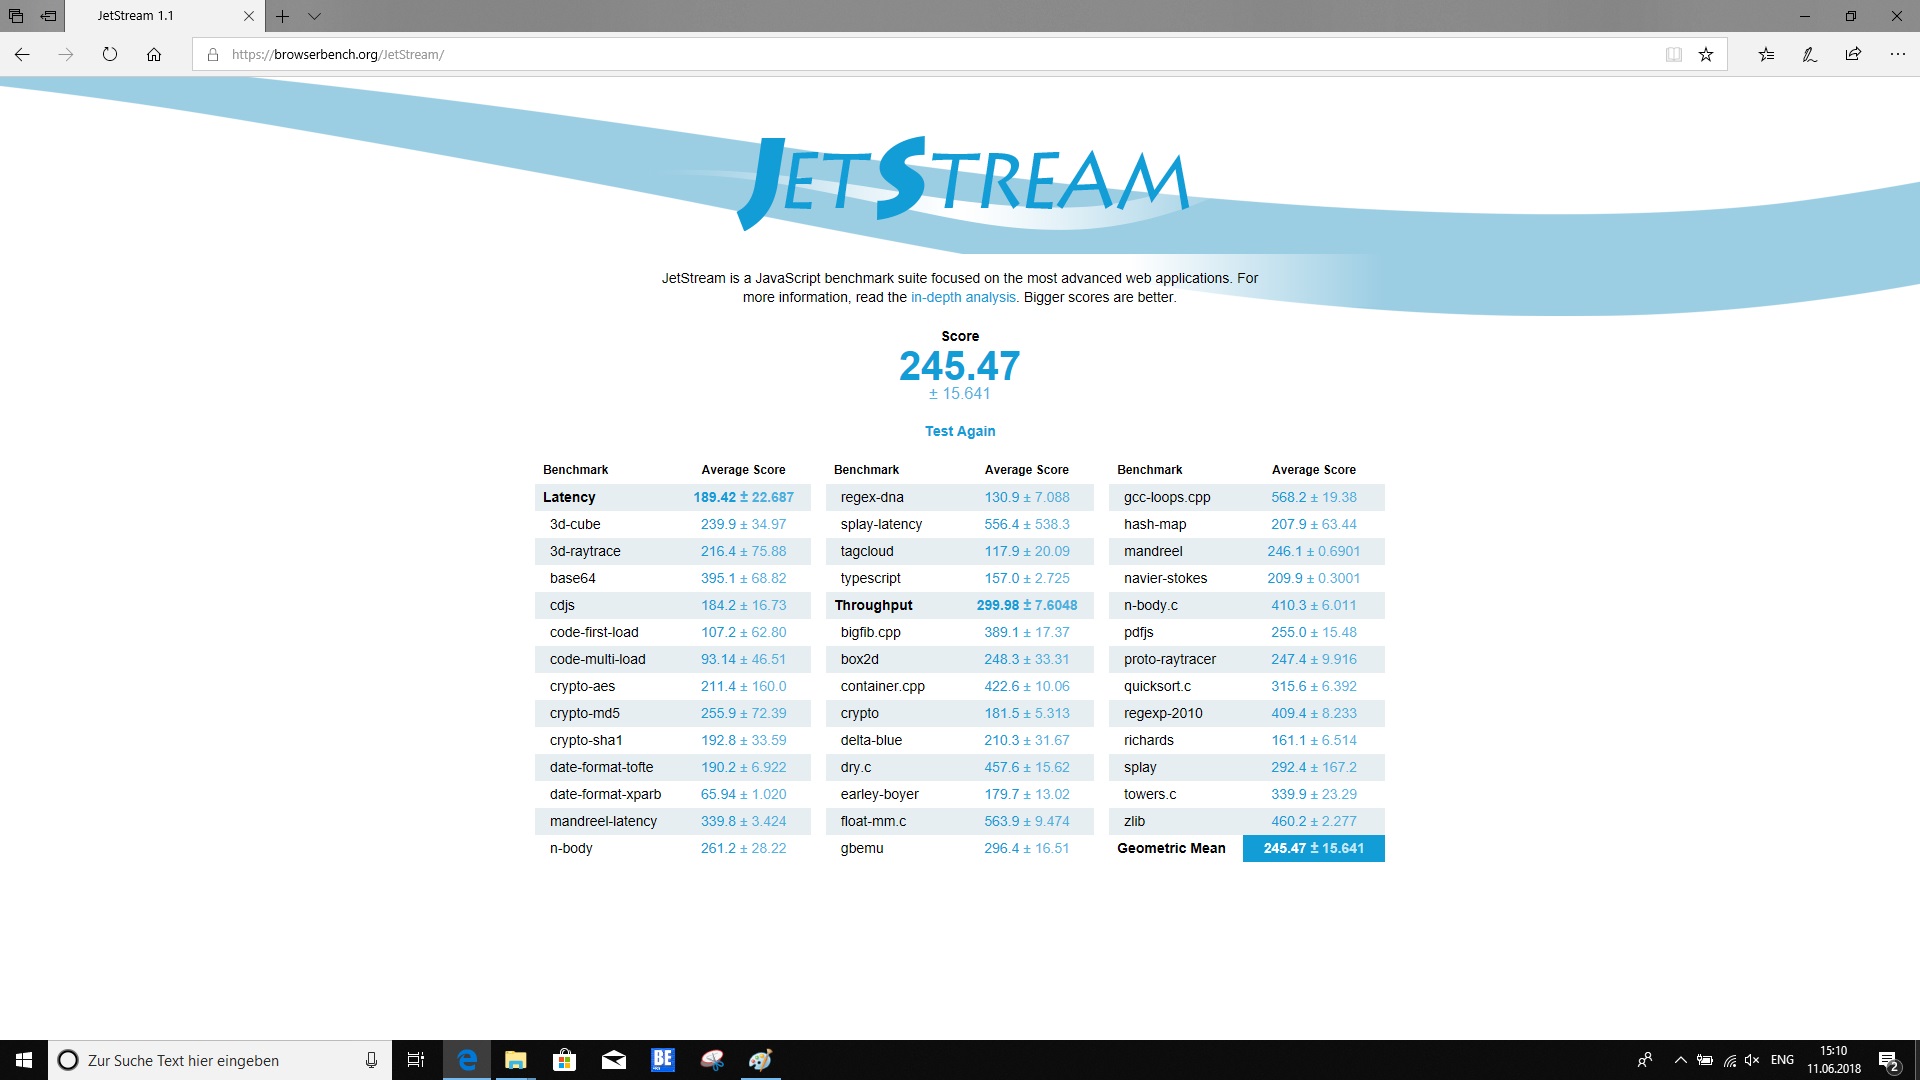
| JetStream 1.1 - 1.1 Total | |
| Sınıf ortalaması Gaming (549 - 647, n=3, son 2 yıl) | |
| Dell G5 15 5587 | |
| Ortalama Intel Core i5-8300H (208 - 251, n=10) | |
| Dell Inspiron 15 7000 7577 | |
| Acer Nitro 5 Spin NP515-51-86CX | |
| Asus FX503VM-EH73 | |
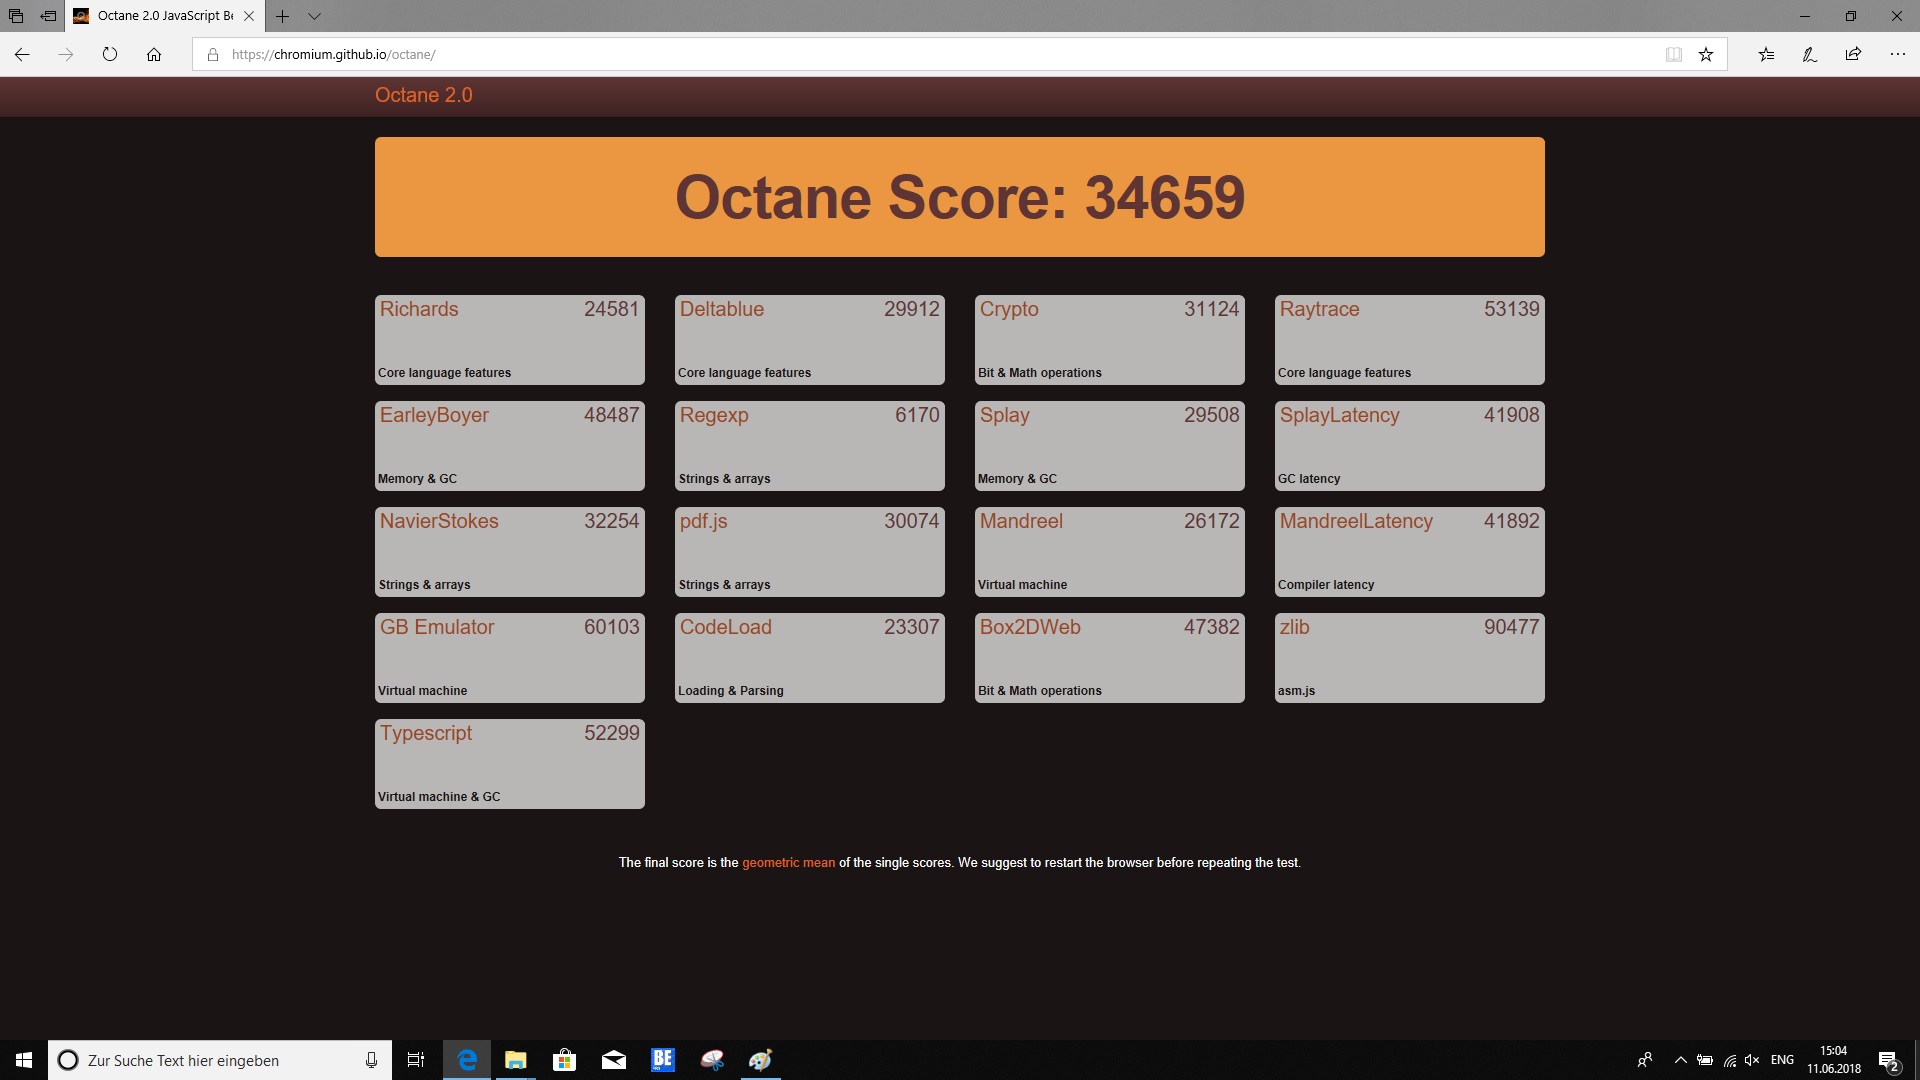
| Octane V2 - Total Score | |
| Sınıf ortalaması Gaming (93292 - 139447, n=27, son 2 yıl) | |
| Dell G5 15 5587 | |
| Ortalama Intel Core i5-8300H (30806 - 34659, n=10) | |
| Dell Inspiron 15 7000 7577 | |
| Asus FX503VM-EH73 | |
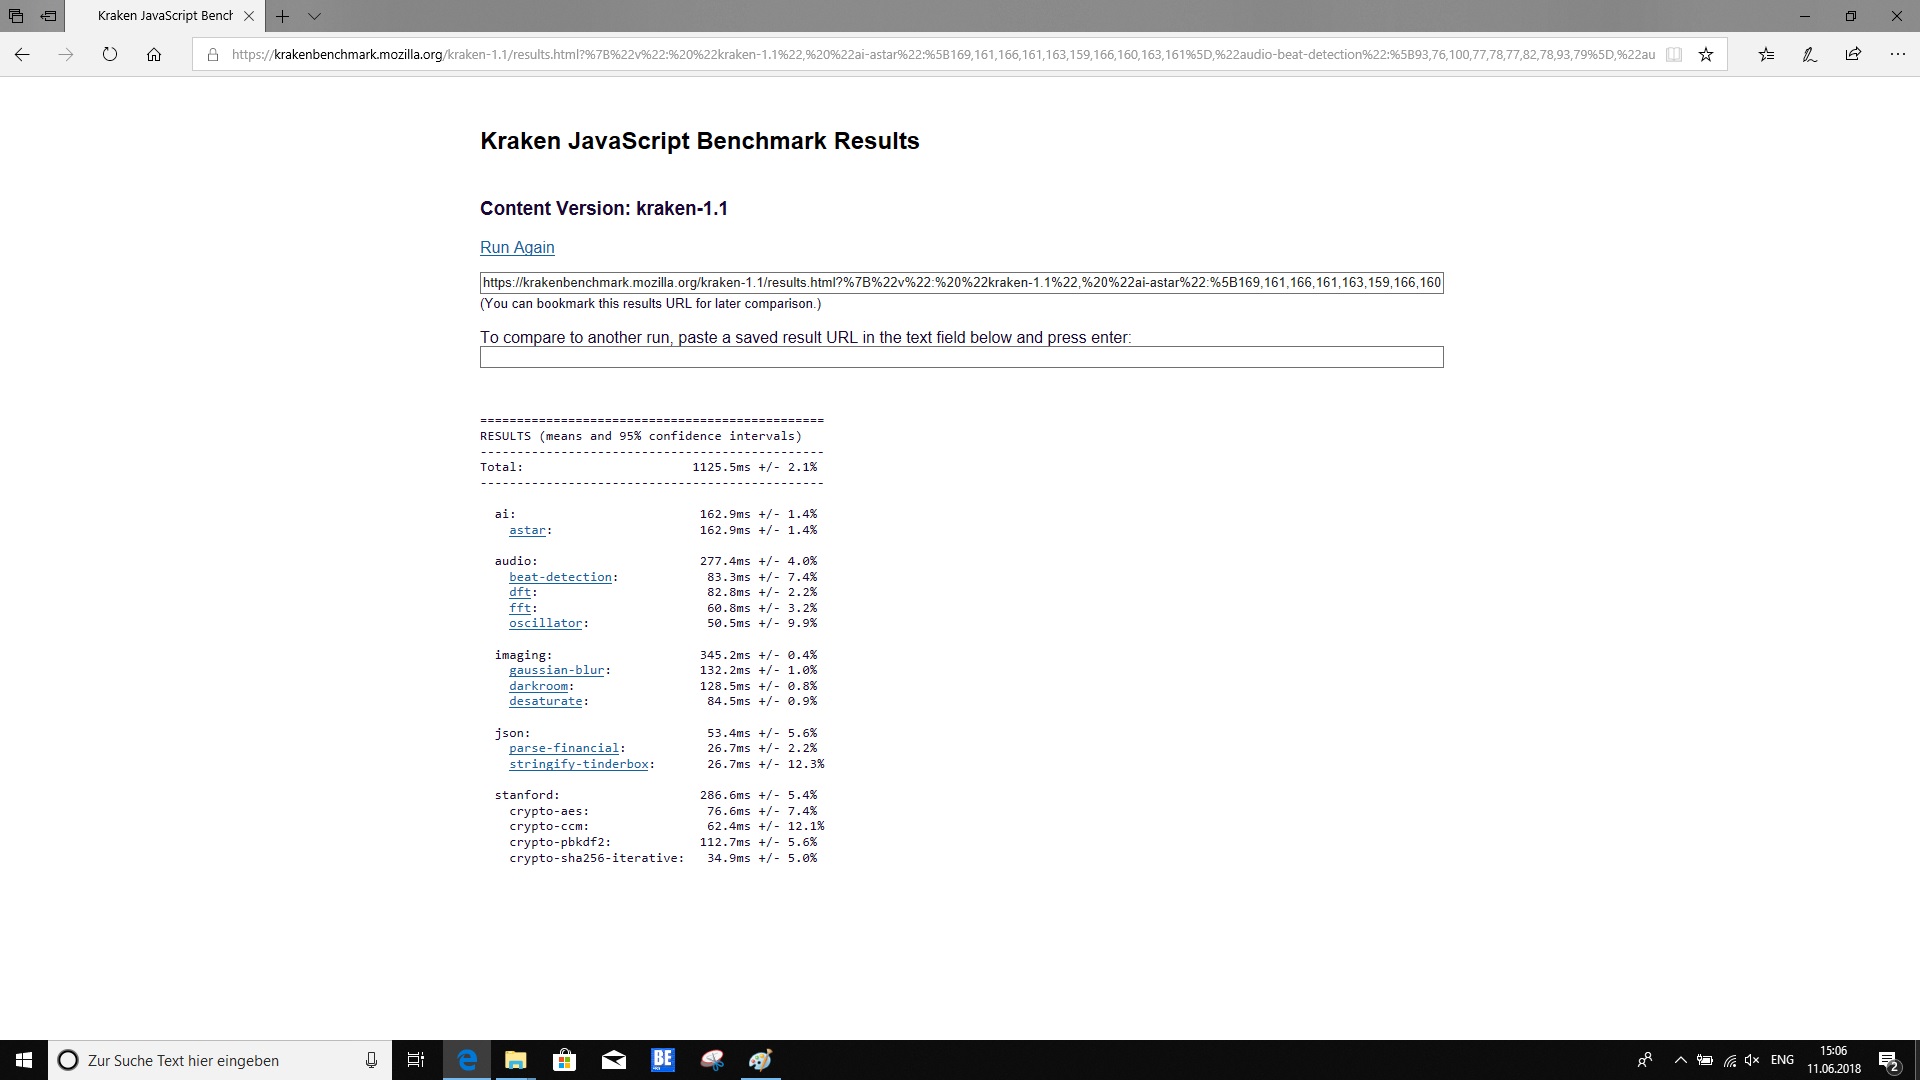
| Mozilla Kraken 1.1 - Total | |
| Asus FX503VM-EH73 | |
| Ortalama Intel Core i5-8300H (1095 - 1209, n=9) | |
| Acer Nitro 5 Spin NP515-51-86CX | |
| Dell Inspiron 15 7000 7577 | |
| Dell G5 15 5587 | |
| Sınıf ortalaması Gaming (391 - 590, n=104, son 2 yıl) | |
* ... daha küçük daha iyidir
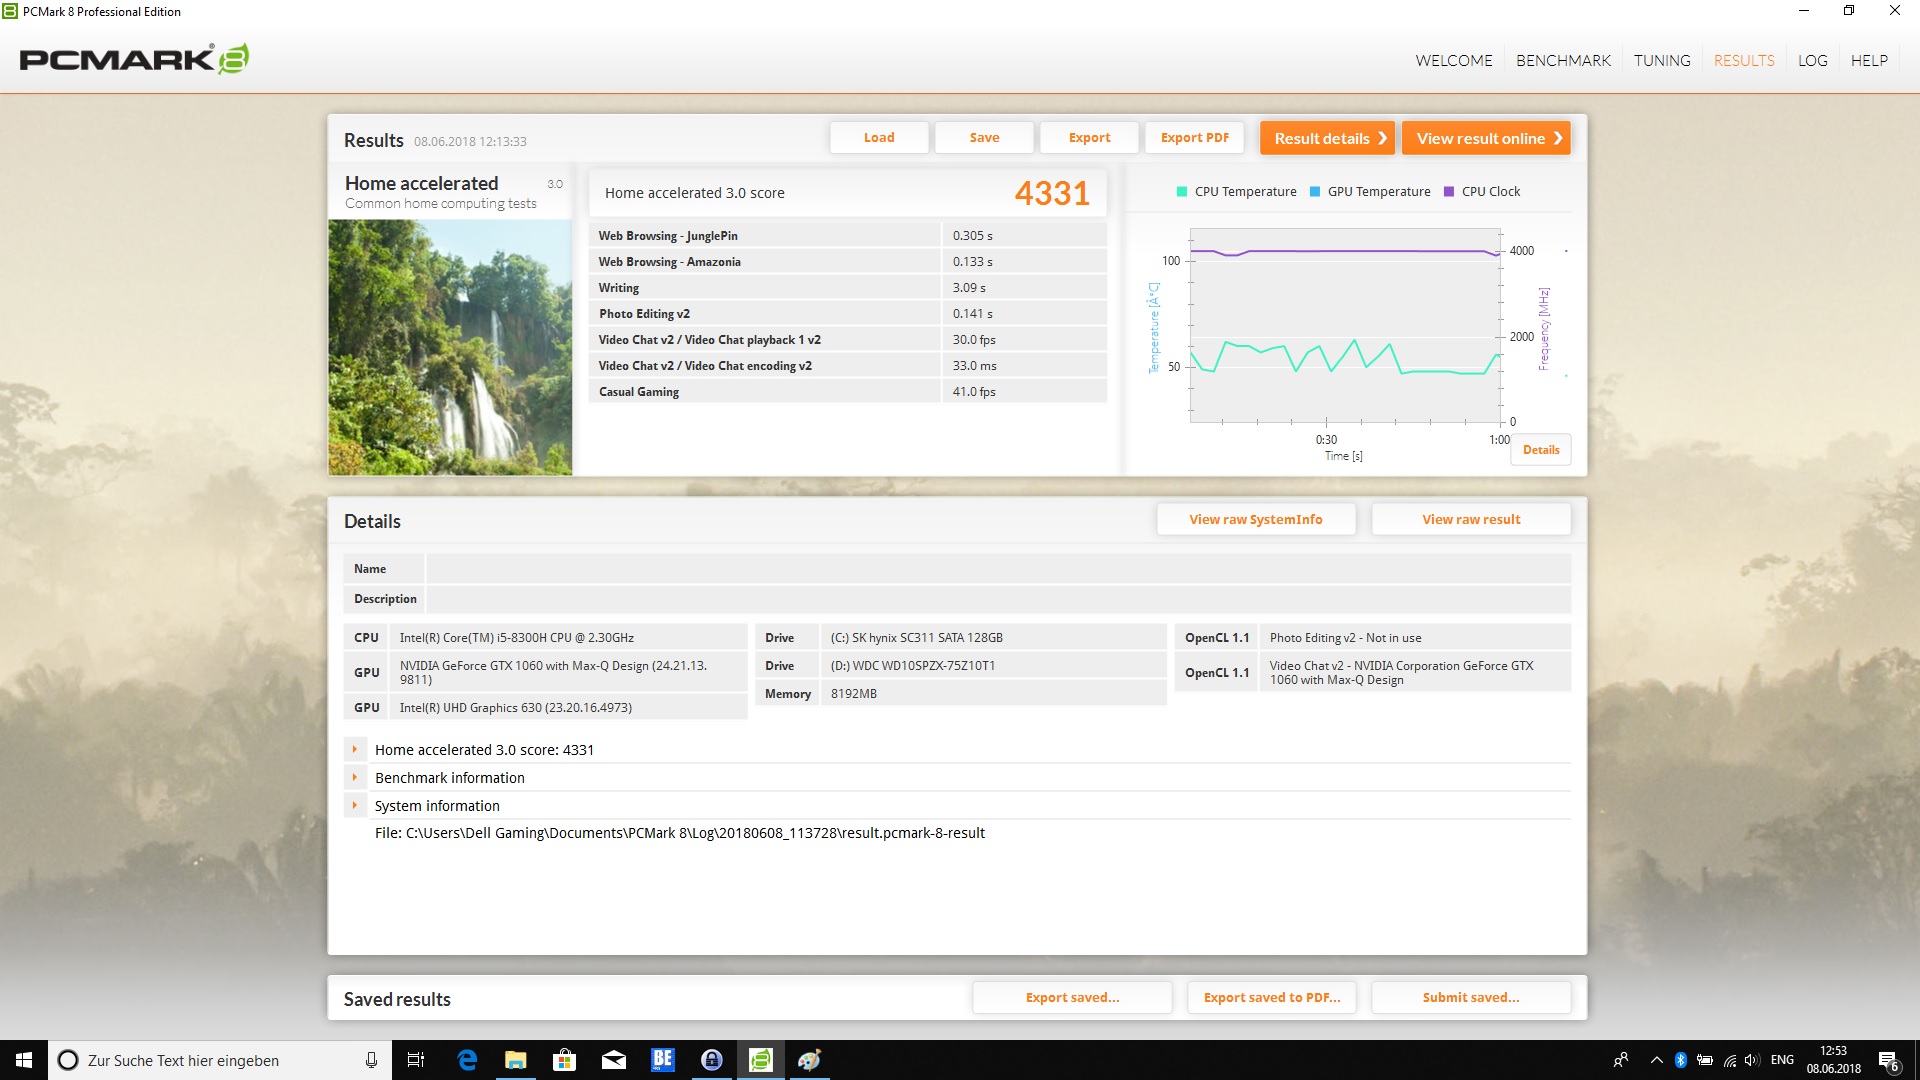
| PCMark 8 | |
| Home Score Accelerated v2 | |
| Sınıf ortalaması Gaming (n=1son 2 yıl) | |
| Asus FX503VM-EH73 | |
| PC Zentrum Proteus V | |
| Dell G5 15 5587 | |
| Ortalama Intel Core i5-8300H, NVIDIA GeForce GTX 1060 Max-Q (n=1) | |
| Acer Predator Helios 300 PH317-52-51M6 | |
| Acer Nitro 5 Spin NP515-51-86CX | |
| Dell Inspiron 15 7000 7577 | |
| Dell Inspiron 15 7000 7577 | |
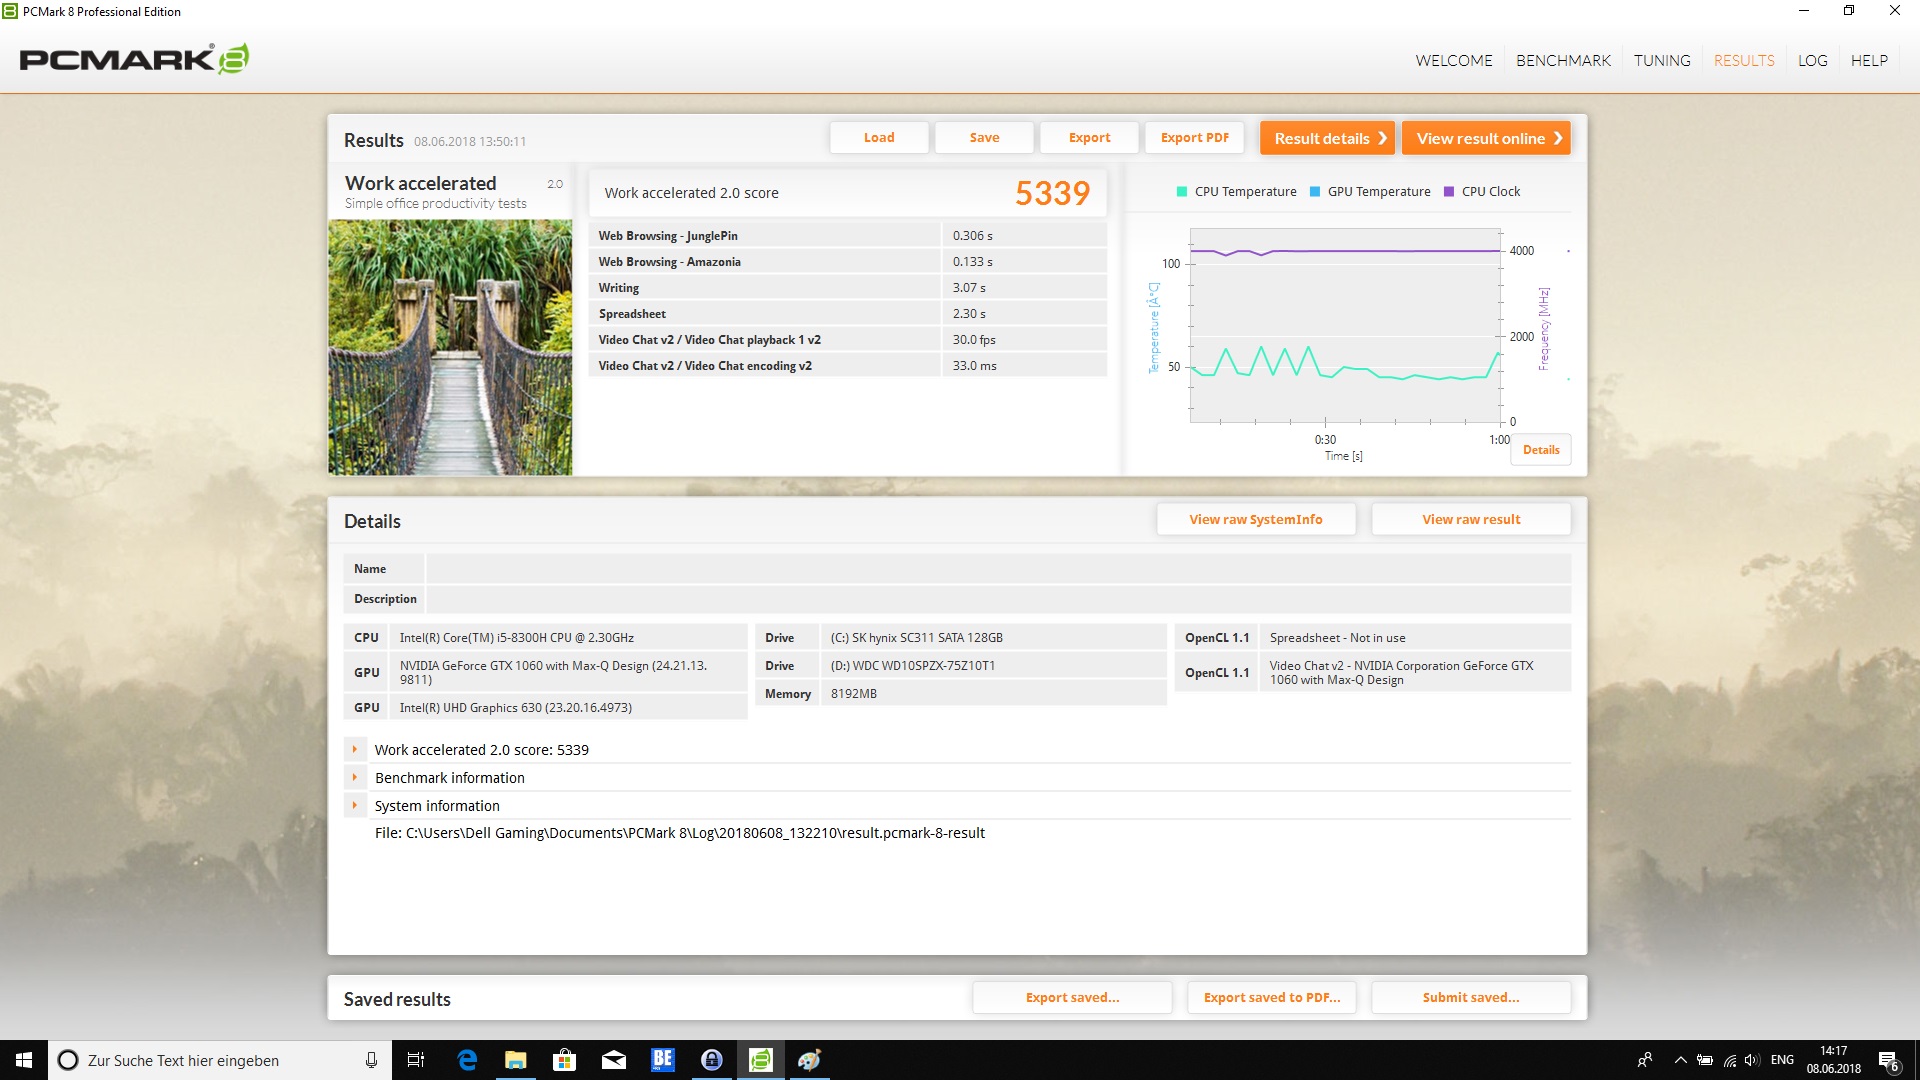
| Work Score Accelerated v2 | |
| Acer Predator Helios 300 PH317-52-51M6 | |
| Dell G5 15 5587 | |
| Ortalama Intel Core i5-8300H, NVIDIA GeForce GTX 1060 Max-Q (n=1) | |
| Acer Nitro 5 Spin NP515-51-86CX | |
| Asus FX503VM-EH73 | |
| Dell Inspiron 15 7000 7577 | |
| Dell Inspiron 15 7000 7577 | |
| Sınıf ortalaması Gaming (n=1son 2 yıl) | |
| PCMark 10 | |
| Score | |
| Sınıf ortalaması Gaming (5828 - 11574, n=95, son 2 yıl) | |
| Dell G5 15 5587 | |
| Ortalama Intel Core i5-8300H, NVIDIA GeForce GTX 1060 Max-Q (n=1) | |
| Asus FX503VM-EH73 | |
| Dell Inspiron 15 7000 7577 | |
| PC Zentrum Proteus V | |
| Acer Nitro 5 Spin NP515-51-86CX | |
| Dell Inspiron 15 7000 7577 | |
| Essentials | |
| Sınıf ortalaması Gaming (8810 - 12600, n=99, son 2 yıl) | |
| PC Zentrum Proteus V | |
| Asus FX503VM-EH73 | |
| Dell G5 15 5587 | |
| Ortalama Intel Core i5-8300H, NVIDIA GeForce GTX 1060 Max-Q (n=1) | |
| Acer Nitro 5 Spin NP515-51-86CX | |
| Dell Inspiron 15 7000 7577 | |
| Dell Inspiron 15 7000 7577 | |
| PCMark 8 Home Score Accelerated v2 | 4331 puan | |
| PCMark 8 Work Score Accelerated v2 | 5339 puan | |
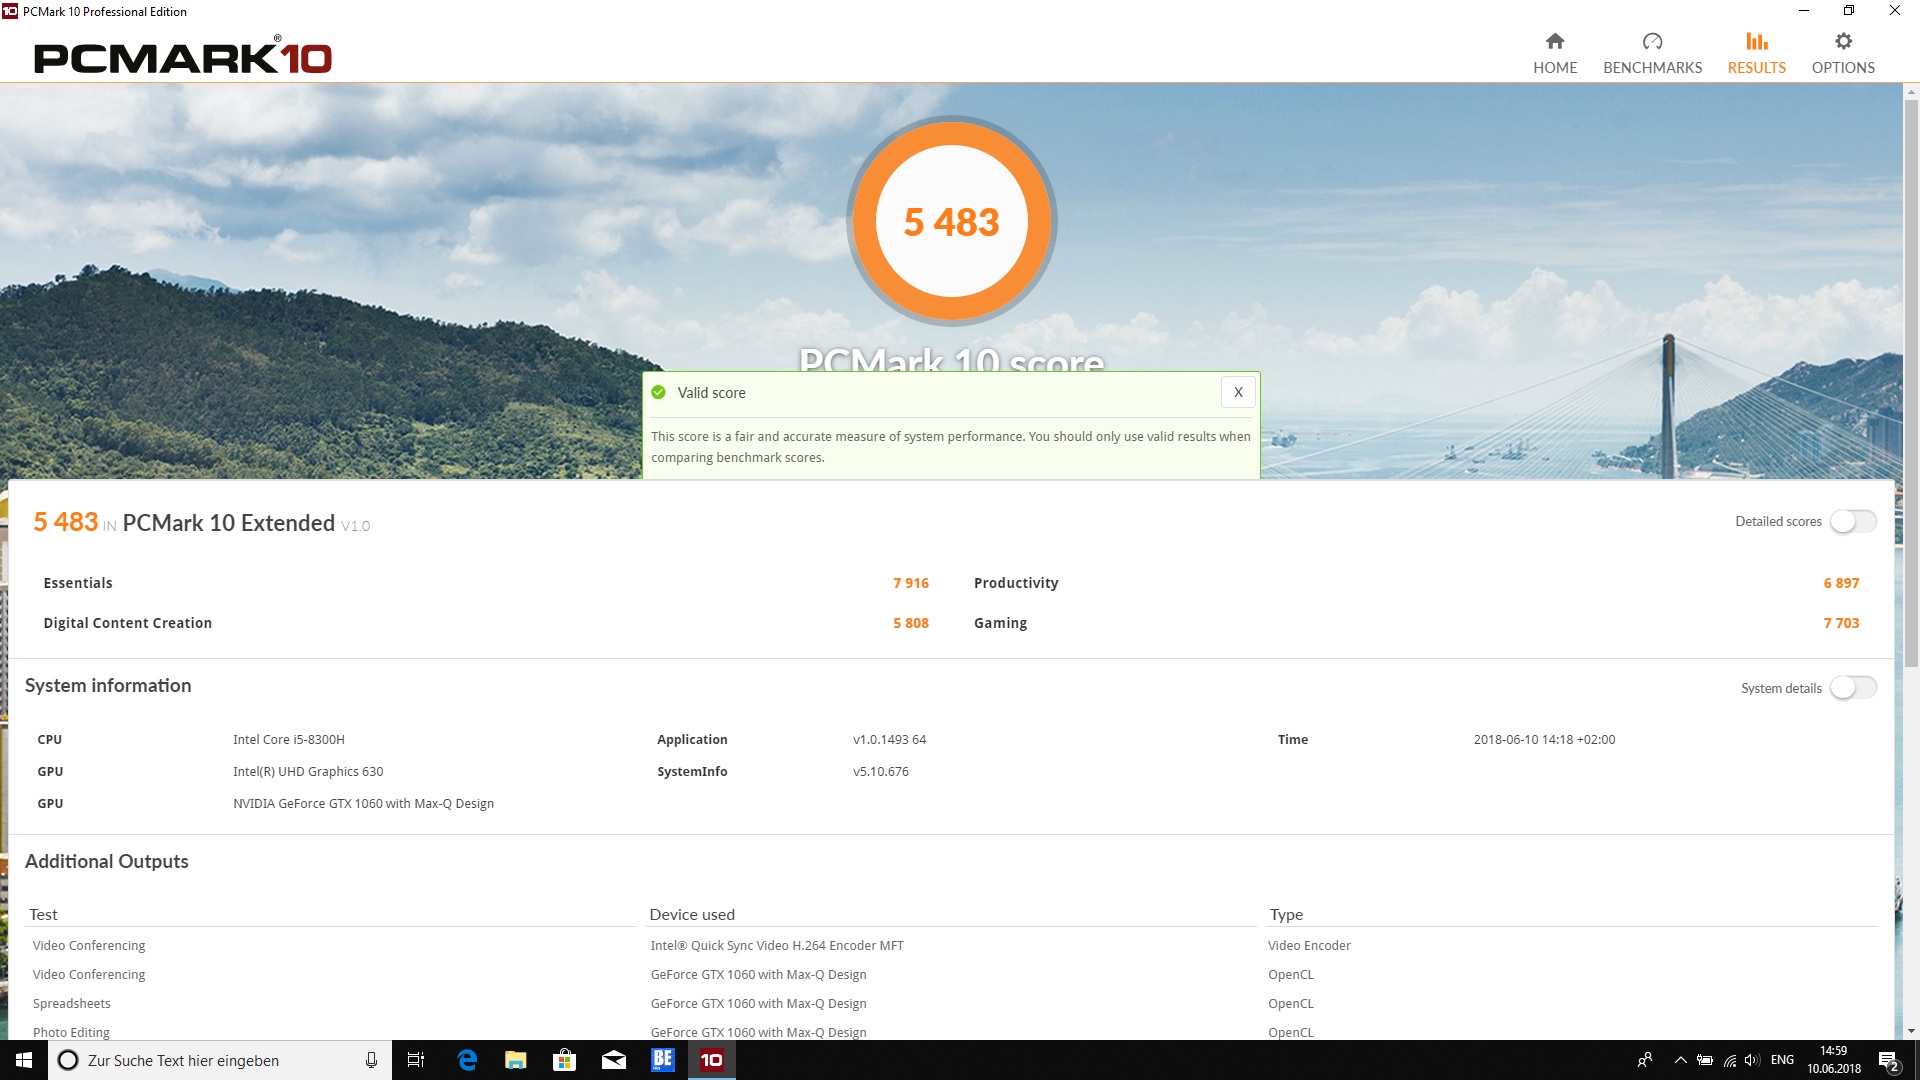
| PCMark 10 Score | 5483 puan | |
Yardım | ||
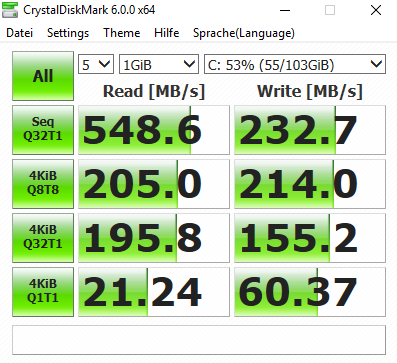
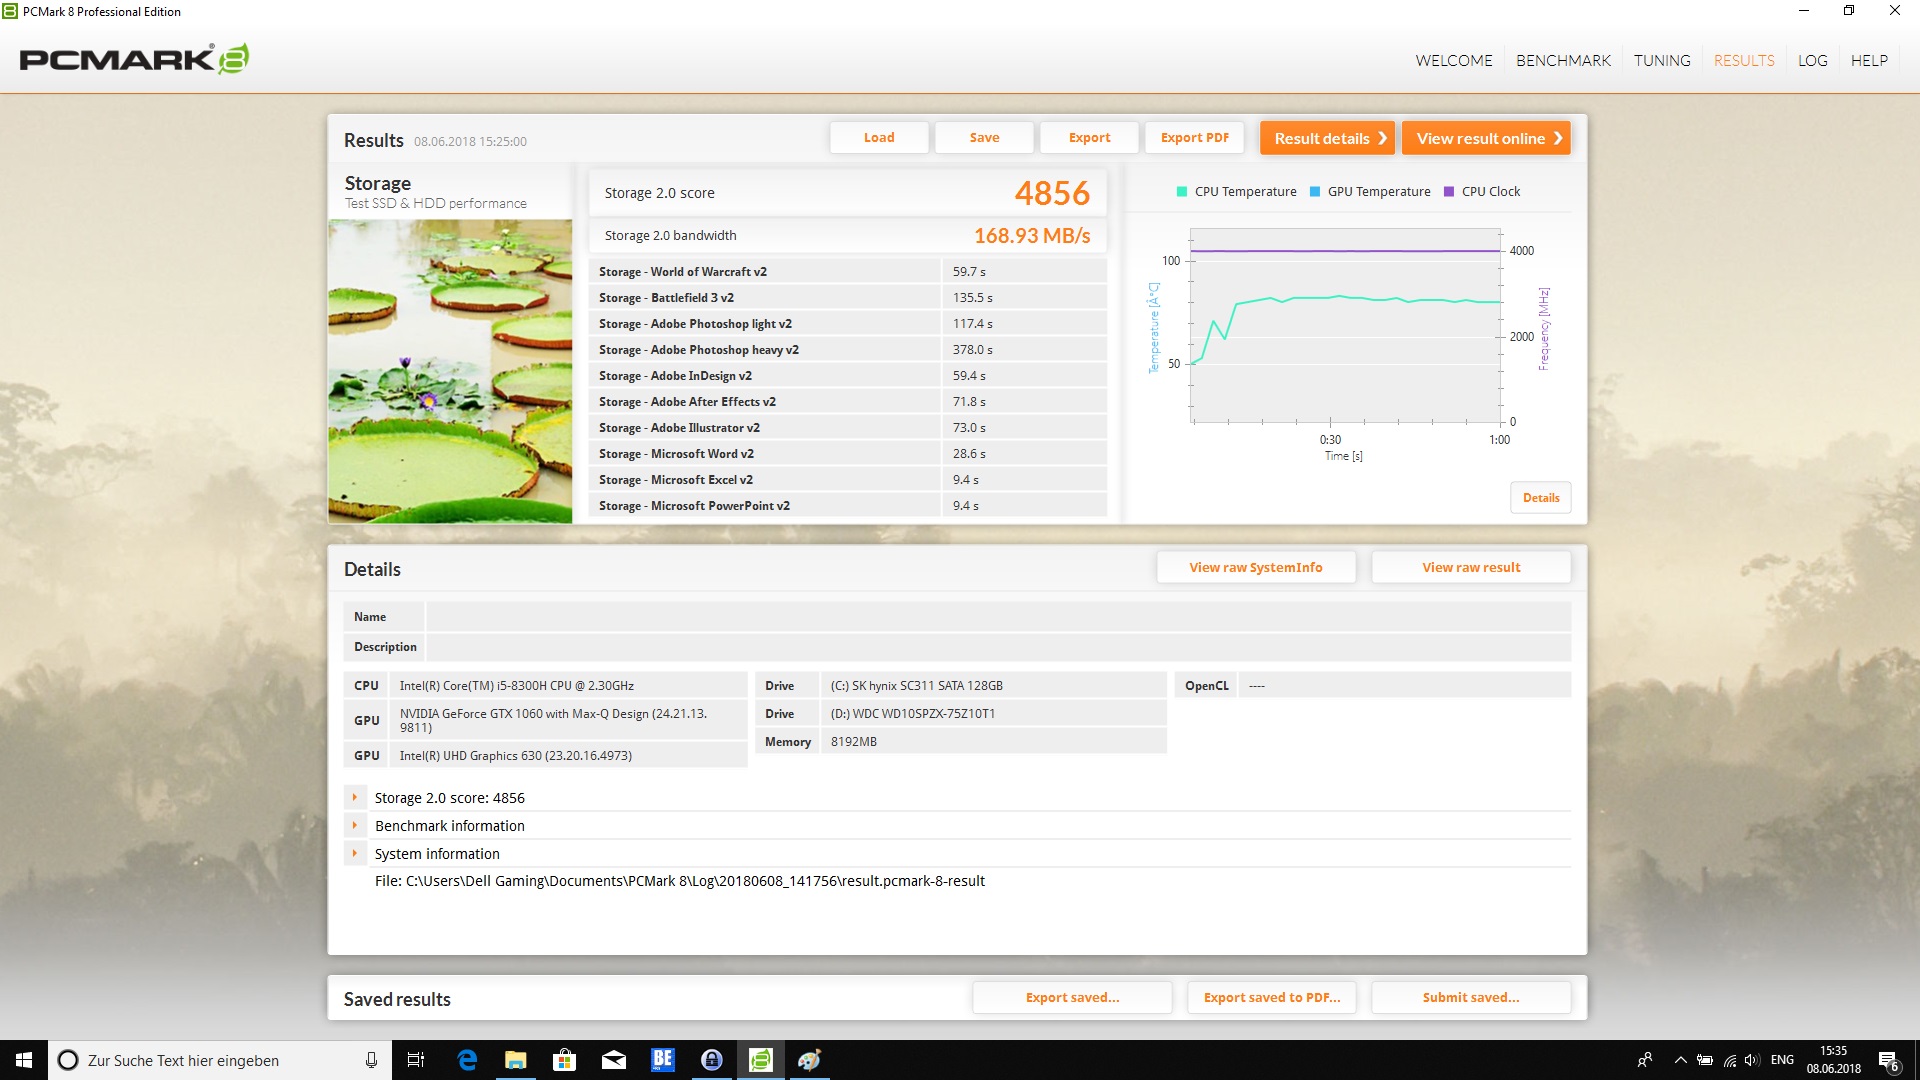
| Dell G5 15 5587 SK hynix SC311 M.2 | Dell Inspiron 15 7000 7577 Samsung PM961 MZVLW256HEHP | PC Zentrum Proteus V Samsung PM961 MZVLW256HEHP | Asus FX503VM-EH73 SanDisk SD8SN8U128G1002 | Acer Nitro 5 Spin NP515-51-86CX Micron 1100 MTFDDAV256TBN | Acer Predator Helios 300 PH317-52-51M6 Hynix HFS128G39TND | |
|---|---|---|---|---|---|---|
| AS SSD | 198% | 220% | -6% | 22% | -47% | |
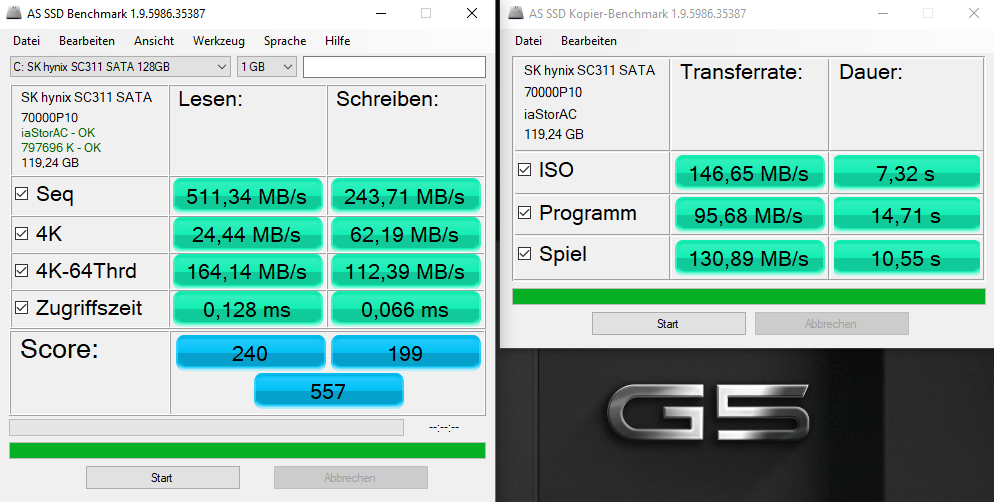
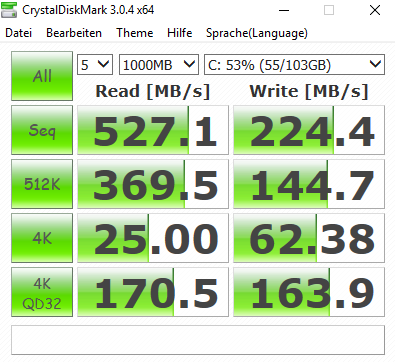
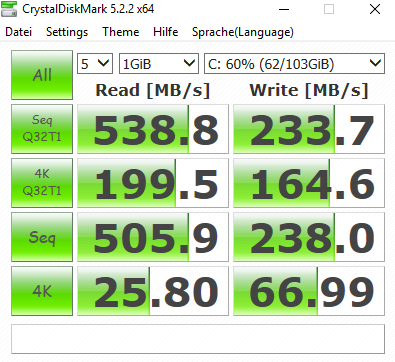
| Seq Read (MB/s) | 511 | 2652 419% | 2541 397% | 476.3 -7% | 490.1 -4% | 513 0% |
| Seq Write (MB/s) | 243.7 | 1181 385% | 1180 384% | 328.4 35% | 335.2 38% | 128.2 -47% |
| 4K Read (MB/s) | 24.44 | 46.95 92% | 51 109% | 20.44 -16% | 25.86 6% | 26.5 8% |
| 4K Write (MB/s) | 62.2 | 100.2 61% | 136.4 119% | 46.48 -25% | 78.1 26% | 62.7 1% |
| Access Time Read * (ms) | 0.128 | 0.058 55% | 0.045 65% | 0.17 -33% | 0.085 34% | |
| Access Time Write * (ms) | 0.066 | 0.037 44% | 0.028 58% | 0.09 -36% | 0.065 2% | 0.259 -292% |
| Score Total (Points) | 557 | 2405 332% | 2842 410% | 798 43% | 835 50% | 811 46% |
* ... daha küçük daha iyidir

| 3DMark | |
| 1280x720 Cloud Gate Standard Graphics | |
| Sınıf ortalaması Gaming (86886 - 223650, n=62, son 2 yıl) | |
| PC Zentrum Proteus V | |
| Asus FX503VM-EH73 | |
| Dell G5 15 5587 | |
| Dell Inspiron 15 7000 7577 | |
| Ortalama NVIDIA GeForce GTX 1060 Max-Q (42781 - 81720, n=10) | |
| Acer Predator Helios 300 PH317-52-51M6 | |
| Dell Inspiron 15 7000 7577 | |
| Acer Nitro 5 Spin NP515-51-86CX | |
| 1920x1080 Fire Strike Graphics | |
| Sınıf ortalaması Gaming (12242 - 62849, n=118, son 2 yıl) | |
| PC Zentrum Proteus V | |
| Asus FX503VM-EH73 | |
| Dell G5 15 5587 | |
| Ortalama NVIDIA GeForce GTX 1060 Max-Q (9992 - 11366, n=10) | |
| Dell Inspiron 15 7000 7577 | |
| Acer Predator Helios 300 PH317-52-51M6 | |
| Dell Inspiron 15 7000 7577 | |
| Acer Nitro 5 Spin NP515-51-86CX | |
| 3DMark 11 - 1280x720 Performance GPU | |
| Sınıf ortalaması Gaming (21841 - 80022, n=106, son 2 yıl) | |
| PC Zentrum Proteus V | |
| Asus FX503VM-EH73 | |
| Dell G5 15 5587 | |
| Ortalama NVIDIA GeForce GTX 1060 Max-Q (12970 - 14487, n=10) | |
| Dell Inspiron 15 7000 7577 | |
| Acer Predator Helios 300 PH317-52-51M6 | |
| Dell Inspiron 15 7000 7577 | |
| Acer Nitro 5 Spin NP515-51-86CX | |
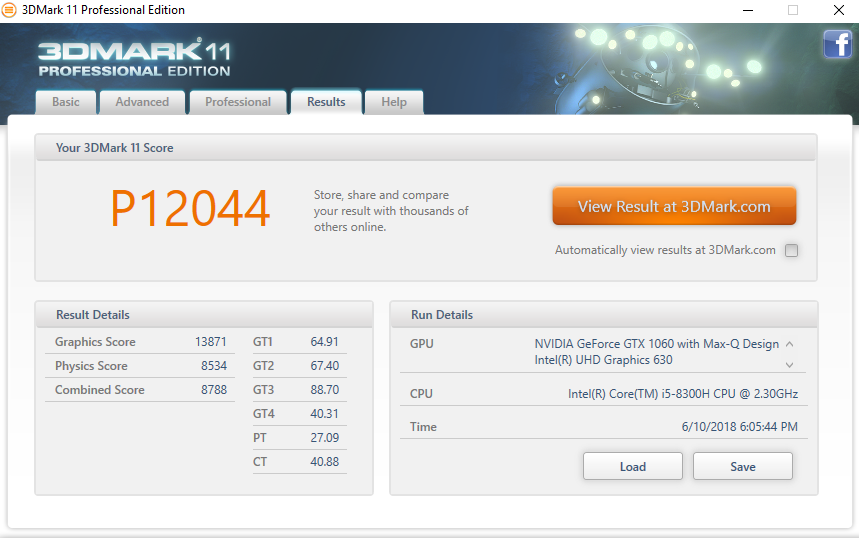
| 3DMark 11 Performance | 12044 puan | |
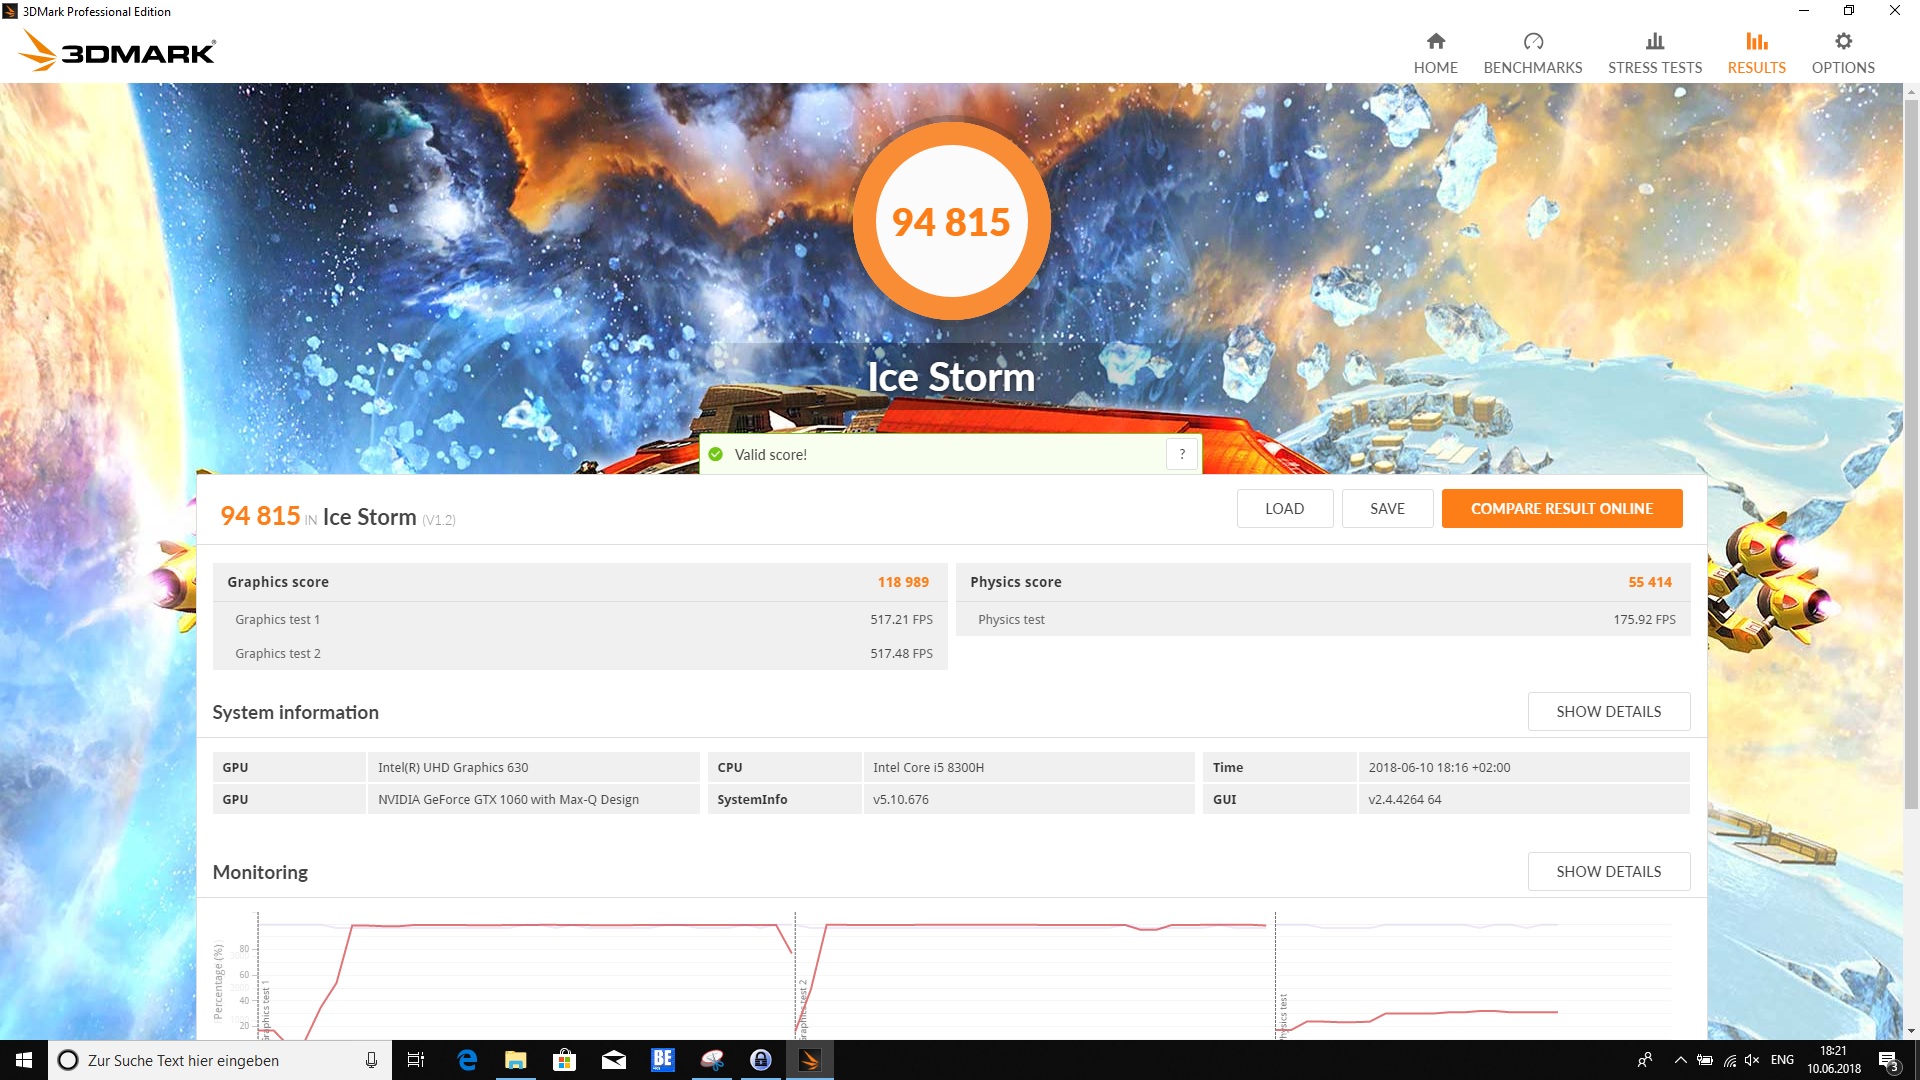
| 3DMark Ice Storm Standard Score | 94815 puan | |
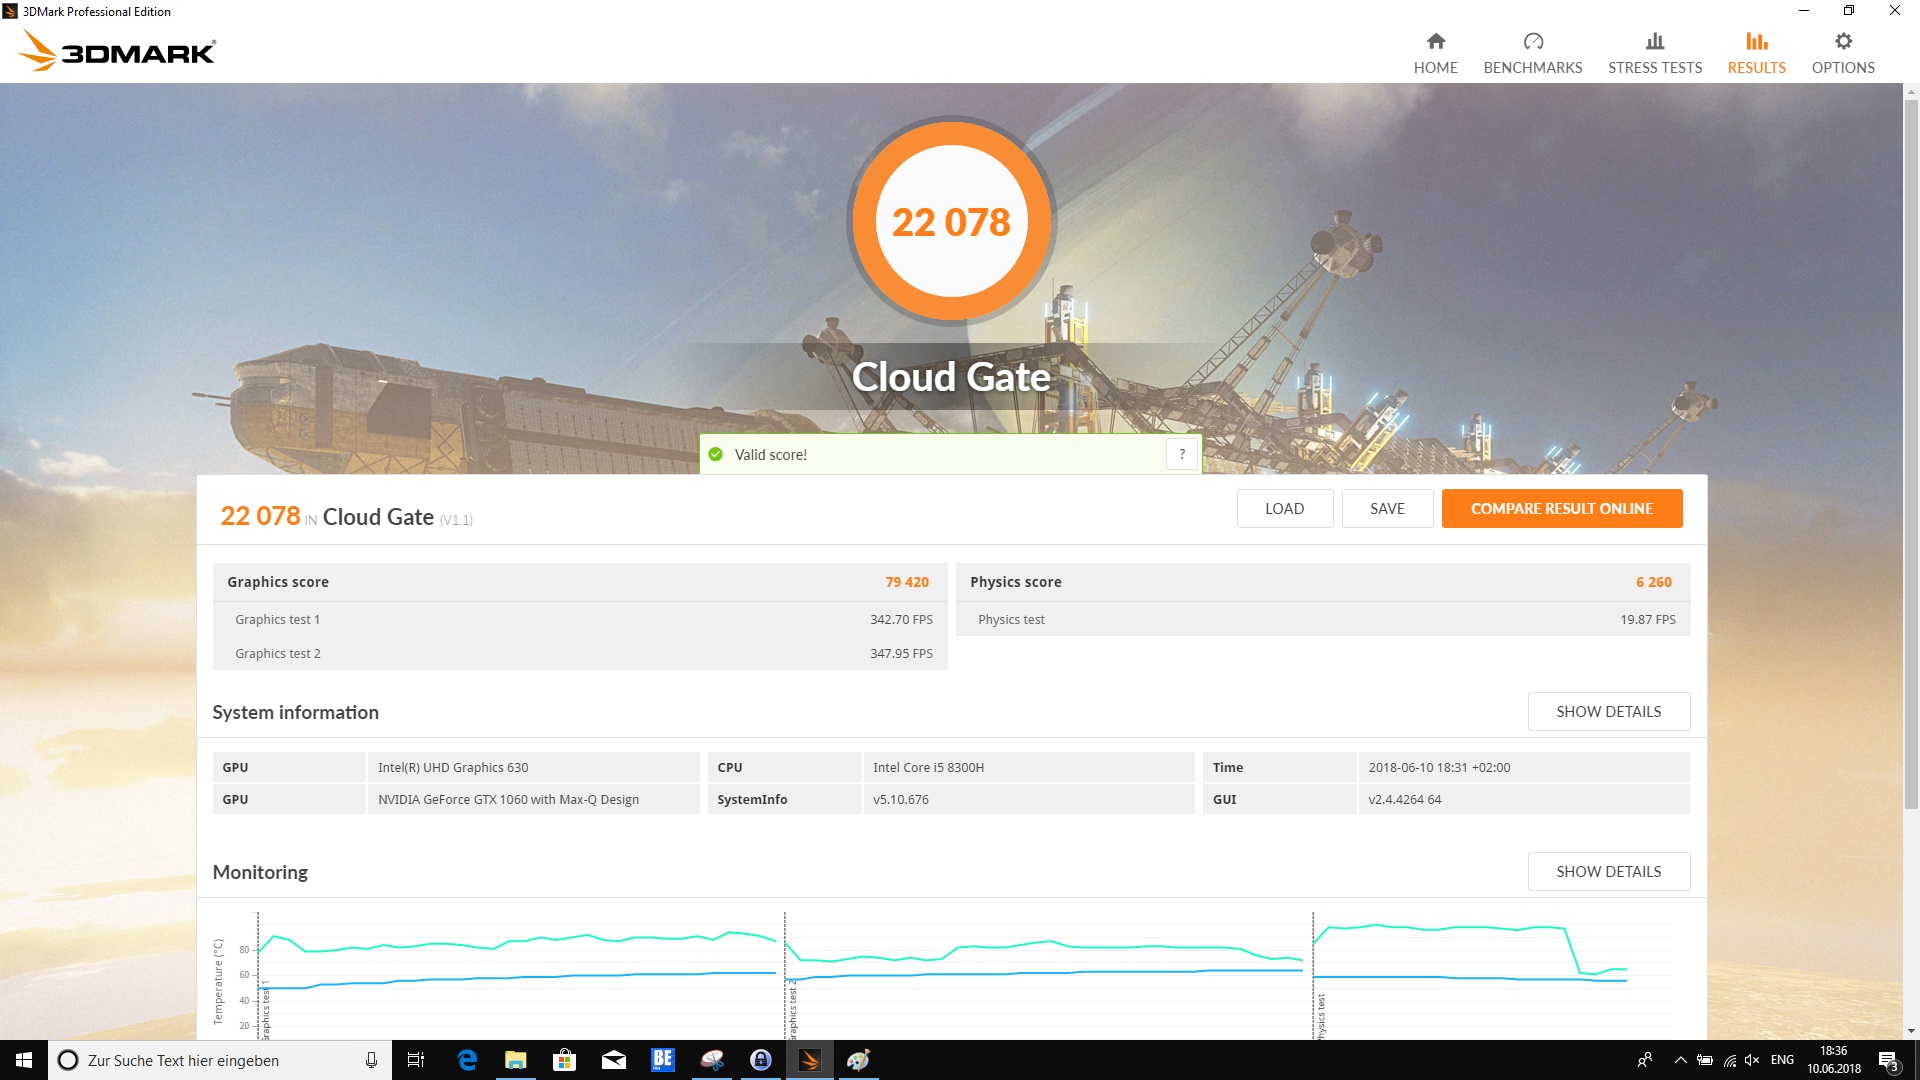
| 3DMark Cloud Gate Standard Score | 22078 puan | |
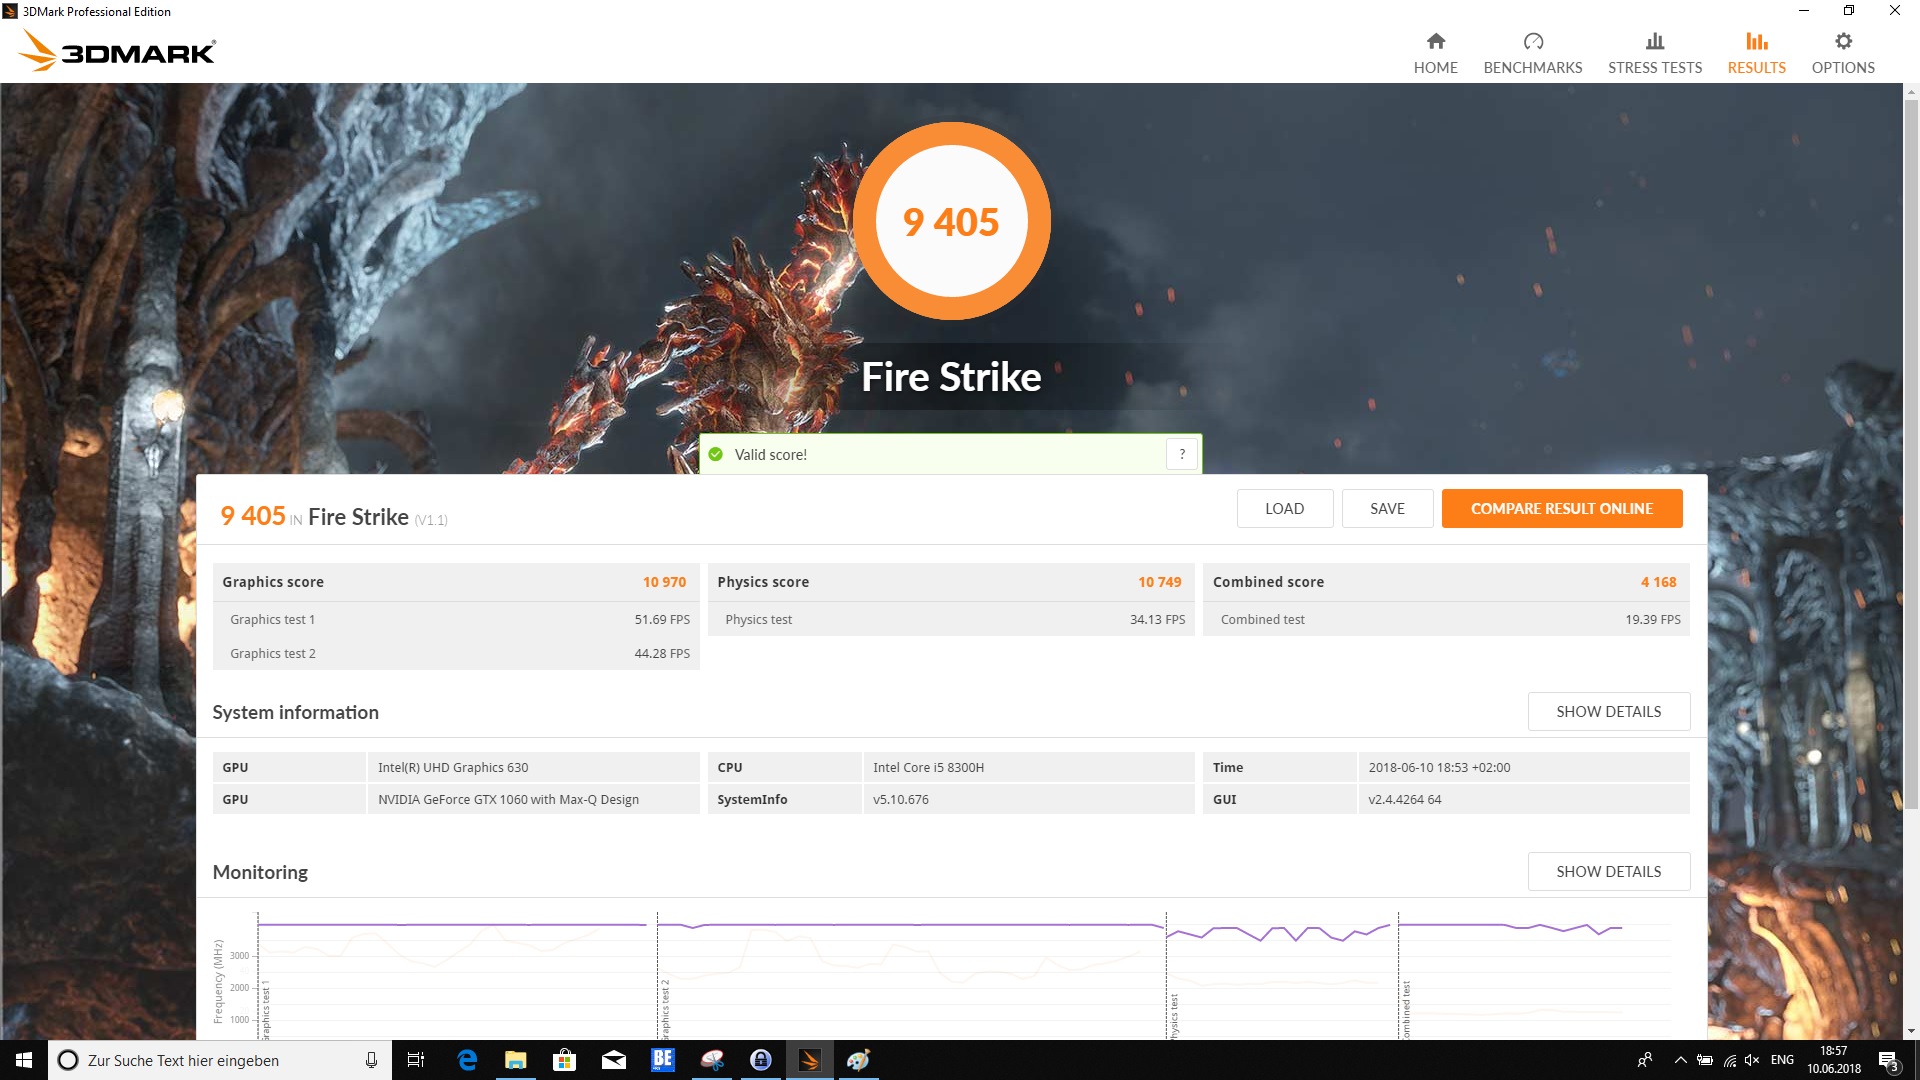
| 3DMark Fire Strike Score | 9405 puan | |
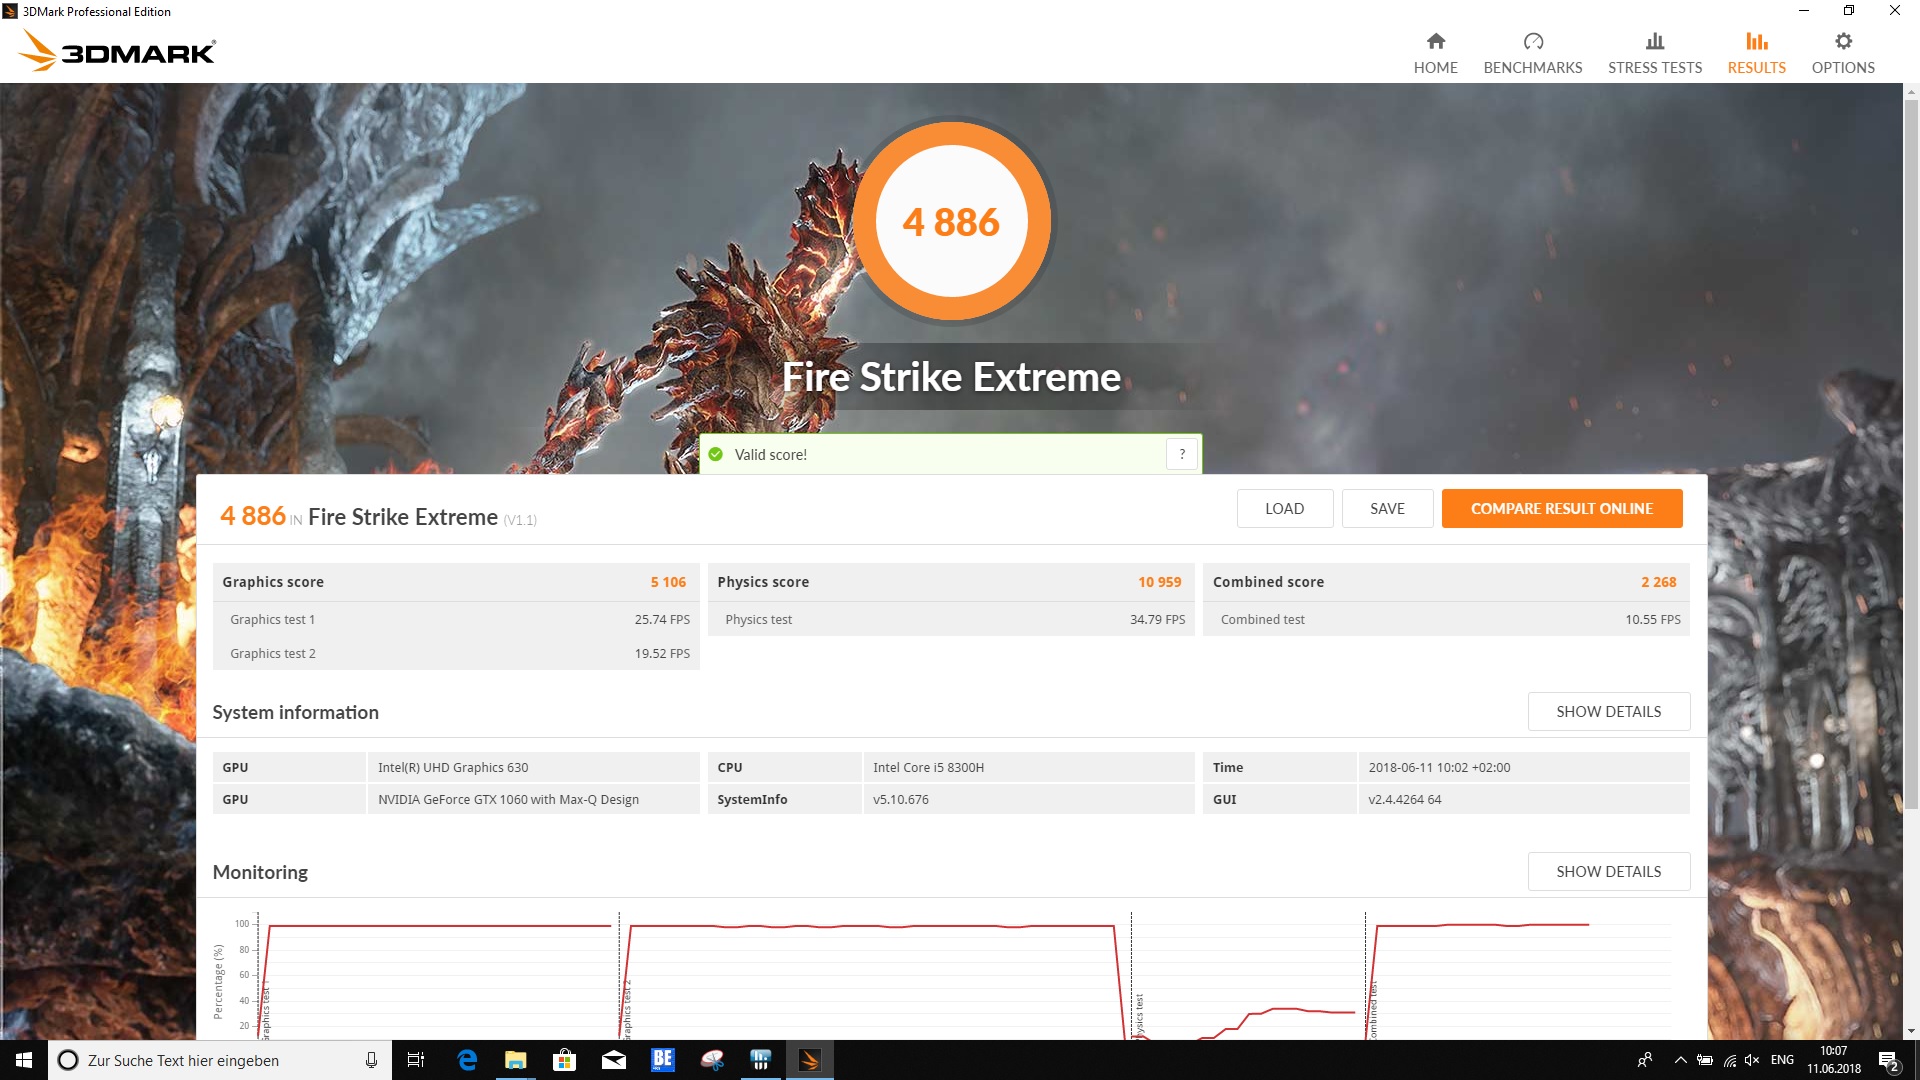
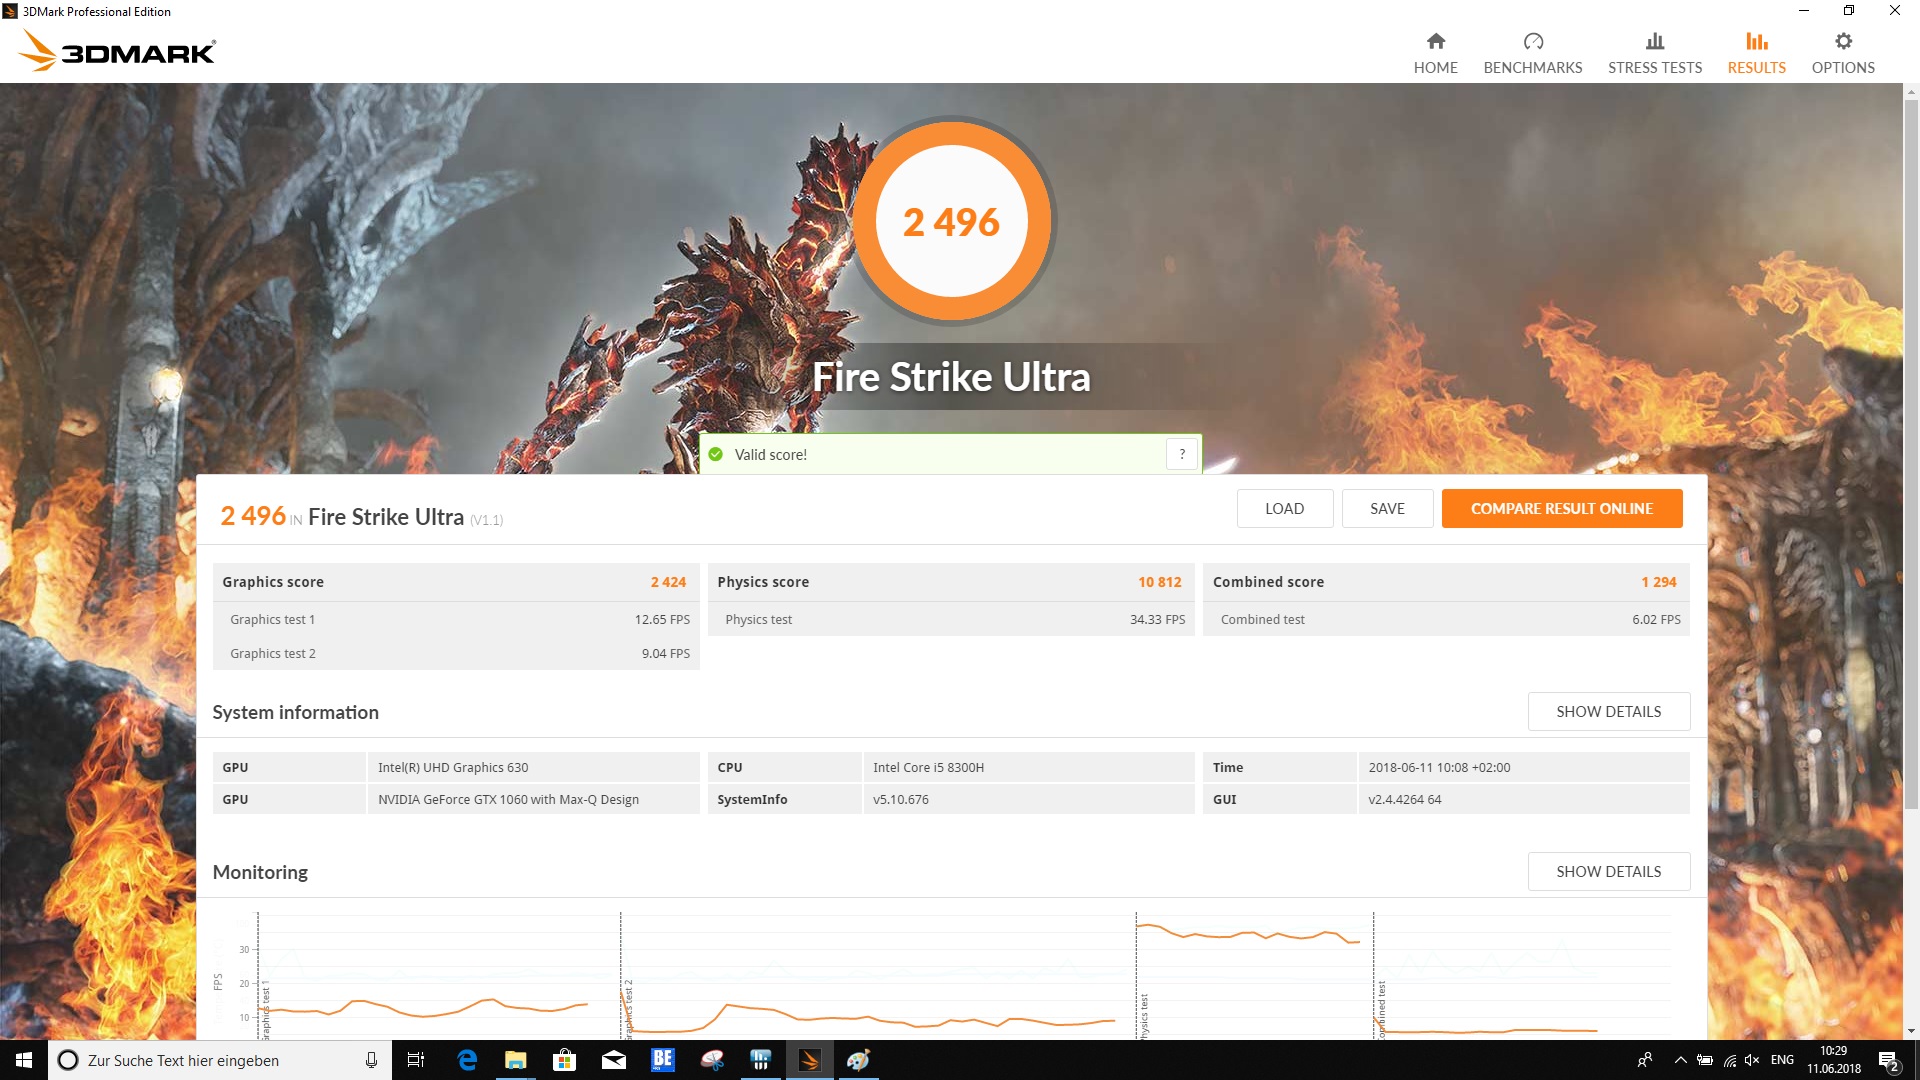
| 3DMark Fire Strike Extreme Score | 4886 puan | |
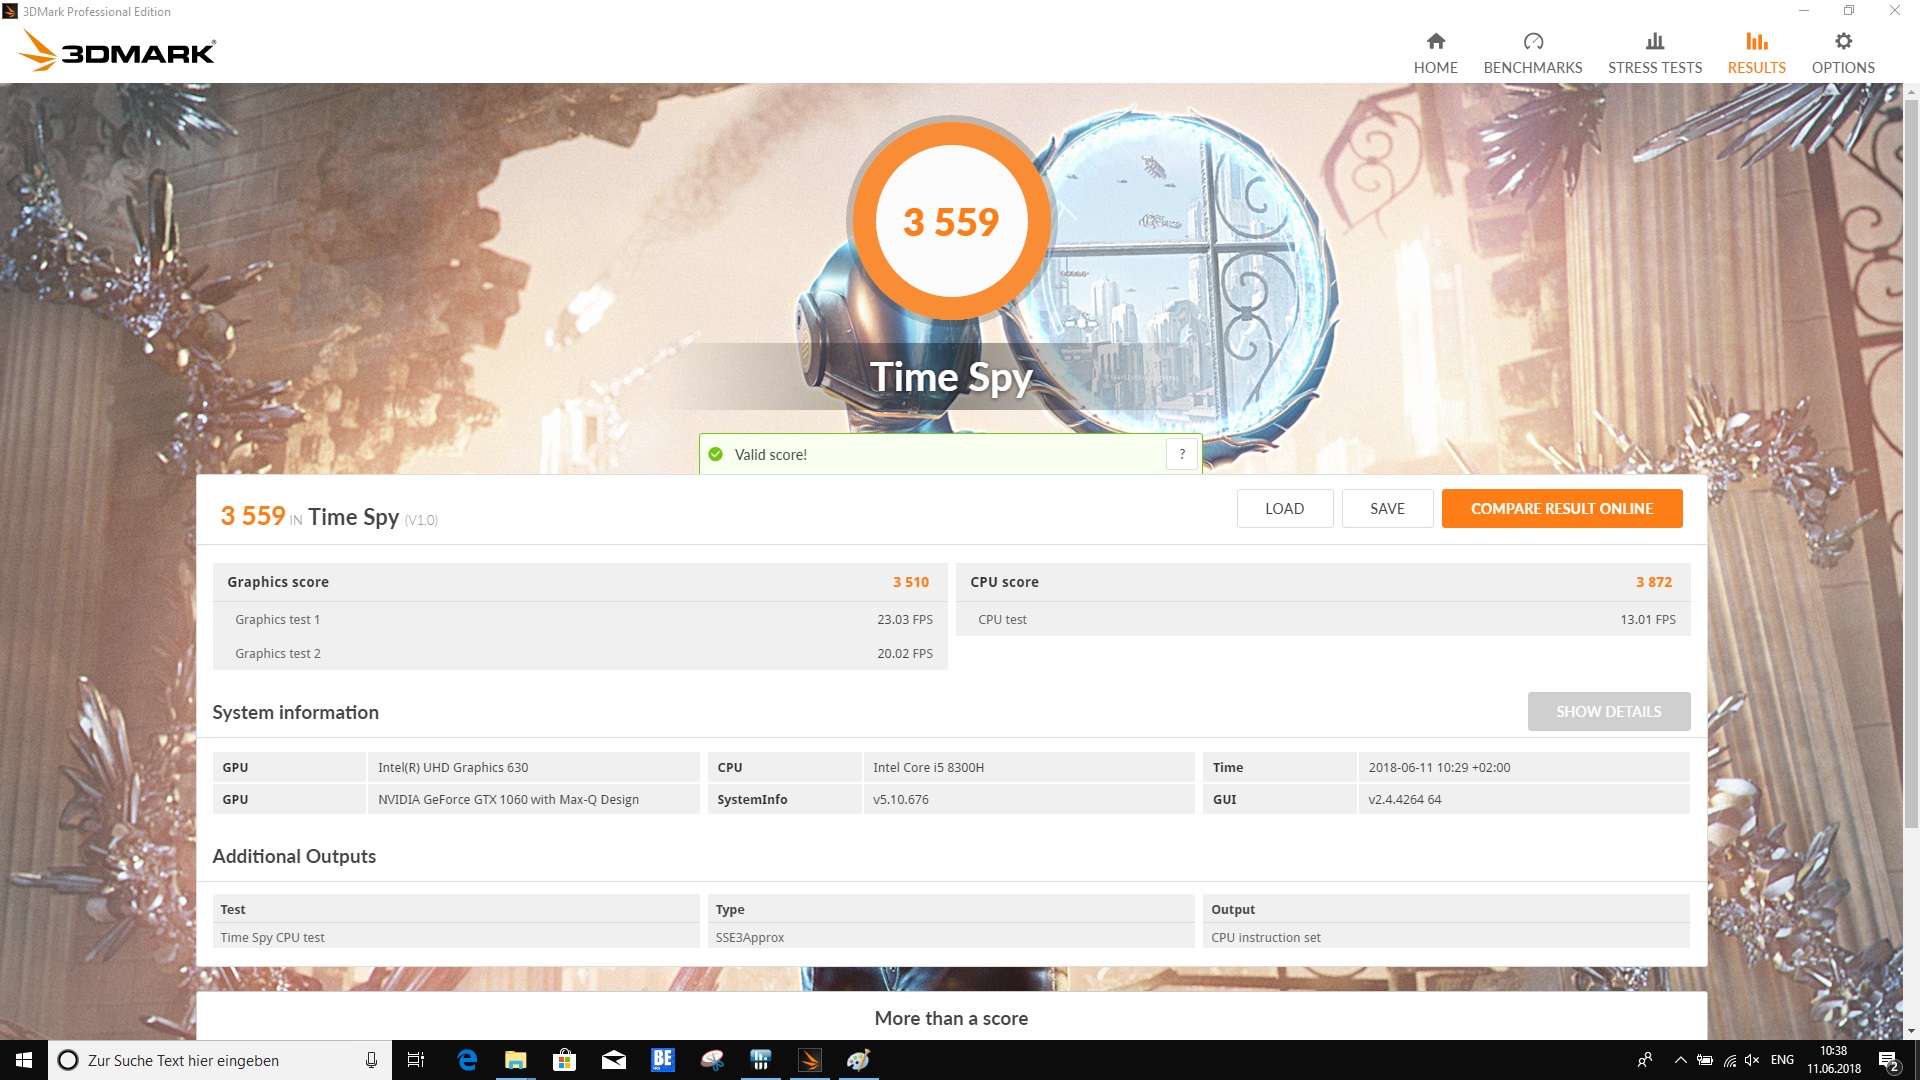
| 3DMark Time Spy Score | 3559 puan | |
Yardım | ||
| BioShock Infinite - 1920x1080 Ultra Preset, DX11 (DDOF) | |
| Dell G5 15 5587 | |
| Ortalama NVIDIA GeForce GTX 1060 Max-Q (87.2 - 112, n=8) | |
| Dell Inspiron 15 7000 7577 | |
| Dell Inspiron 15 7000 7577 | |
| Rise of the Tomb Raider - 1920x1080 Very High Preset AA:FX AF:16x | |
| Dell G5 15 5587 | |
| Asus FX503VM-EH73 | |
| Ortalama NVIDIA GeForce GTX 1060 Max-Q (45.3 - 66.4, n=8) | |
| Dell Inspiron 15 7000 7577 | |
| Dell Inspiron 15 7000 7577 | |
| Acer Nitro 5 Spin NP515-51-86CX | |
| The Witcher 3 - 1920x1080 Ultra Graphics & Postprocessing (HBAO+) | |
| Sınıf ortalaması Gaming (95 - 240, n=7, son 2 yıl) | |
| PC Zentrum Proteus V | |
| Asus FX503VM-EH73 | |
| Ortalama NVIDIA GeForce GTX 1060 Max-Q (34.6 - 38.5, n=9) | |
| Dell Inspiron 15 7000 7577 | |
| Dell G5 15 5587 | |
| Acer Predator Helios 300 PH317-52-51M6 | |
| Dell Inspiron 15 7000 7577 | |
| düşük | orta | yüksek | ultra | 4K | |
|---|---|---|---|---|---|
| BioShock Infinite (2013) | 264 | 233.1 | 213.3 | 107.5 | |
| GTA V (2015) | 156.8 | 151.6 | 106.5 | 61.8 | 53.7 |
| The Witcher 3 (2015) | 172.2 | 122.3 | 58.3 | 34.9 | 23.3 |
| Rise of the Tomb Raider (2016) | 160.9 | 128.1 | 72.7 | 60.5 | 24.6 |
| Playerunknown's Battlegrounds (PUBG) (2017) | 141.9 | 92.5 | 85.6 | 63.3 | 12.9 |
| FIFA 18 (2017) | 290.6 | 277.9 | 252.3 | 245.7 | 130 |
| Assassin´s Creed Origins (2017) | 77 | 67 | 62 | 52 | 21 |
| Call of Duty WWII (2017) | 174.9 | 163.3 | 91.9 | 70.9 | 31.3 |
| Need for Speed Payback (2017) | 117.9 | 89.1 | 78.5 | 66.6 | 23.8 |
| Star Wars Battlefront 2 (2017) | 135.5 | 93.4 | 81.5 | 62.2 | |
| Fortnite (2018) | 178 | 132.6 | 115.7 | 72.8 | |
| Kingdom Come: Deliverance (2018) | 110 | 66.8 | 52.7 | 38 | 12 |
| Far Cry 5 (2018) | 110 | 70 | 65 | 48 | 20 |
Ses yüksekliği
| Boşta |
| 31.1 / 31.1 / 34.2 dB |
| Çalışırken |
| 34.9 / 44 dB |
 | ||
30 dB sessiz 40 dB(A) duyulabilirlik 50 dB(A) gürültülü |
||
min: | ||
| Dell G5 15 5587 GeForce GTX 1060 Max-Q, i5-8300H, SK hynix SC311 M.2 | Dell Inspiron 15 7000 7577 GeForce GTX 1050 Mobile, i5-7300HQ, Seagate Mobile HDD 1TB ST1000LX015-1U7172 | Dell Inspiron 15 7000 7577 GeForce GTX 1060 Max-Q, i5-7300HQ, Samsung PM961 MZVLW256HEHP | PC Zentrum Proteus V GeForce GTX 1060 Mobile, i7-7700HQ, Samsung PM961 MZVLW256HEHP | Asus FX503VM-EH73 GeForce GTX 1060 Mobile, i7-7700HQ, SanDisk SD8SN8U128G1002 | Acer Nitro 5 Spin NP515-51-86CX GeForce GTX 1050 Mobile, i5-8550U, Micron 1100 MTFDDAV256TBN | Acer Predator Helios 300 PH317-52-51M6 GeForce GTX 1050 Ti Mobile, i5-8300H, Hynix HFS128G39TND | |
|---|---|---|---|---|---|---|---|
| Noise | -2% | 9% | -16% | -2% | -2% | -5% | |
| kapalı / ortam * (dB) | 30.3 | 31 -2% | 28 8% | 31 -2% | 27.8 8% | 30.4 -0% | 29 4% |
| Idle Minimum * (dB) | 31.1 | 32.7 -5% | 28 10% | 37 -19% | 29.6 5% | 30.9 1% | 29 7% |
| Idle Average * (dB) | 31.1 | 32.7 -5% | 28 10% | 38 -22% | 29.6 5% | 30.9 1% | 31 -0% |
| Idle Maximum * (dB) | 34.2 | 32.7 4% | 28 18% | 39 -14% | 29.6 13% | 30.9 10% | 33 4% |
| Load Average * (dB) | 34.9 | 38.7 -11% | 30.3 13% | 47 -35% | 37.3 -7% | 42.6 -22% | 45 -29% |
| Witcher 3 ultra * (dB) | 42.7 | 39 9% | 39.5 7% | 43 -1% | 49.8 -17% | 45 -5% | |
| Load Maximum * (dB) | 44 | 44.6 -1% | 46.5 -6% | 52 -18% | 53.7 -22% | 45 -2% | 51 -16% |
* ... daha küçük daha iyidir
(-) Üst taraftaki maksimum sıcaklık, 40.4 °C / 105 F ortalamasına kıyasla 50.2 °C / 122 F'dir. , Gaming sınıfı için 21.2 ile 68.8 °C arasında değişir.
(-) Alt kısım, 43.2 °C / 110 F ortalamasına kıyasla maksimum 57 °C / 135 F'ye kadar ısınır
(+) Boşta kullanımda, üst tarafın ortalama sıcaklığı 27.3 °C / 81 F olup, cihazın 33.9 °C / 93 F.
(-) The Witcher 3 oynarken, üst tarafın ortalama sıcaklığı 38.5 °C / 101 F olup, cihazın 33.9 °C / 93 F.
(+) Avuç içi dayanakları ve dokunmatik yüzey maksimum (33.7 °C / 92.7 F) cilt sıcaklığına ulaşıyor ve bu nedenle sıcak değil.
(-) Benzer cihazların avuç içi dayanağı alanının ortalama sıcaklığı 28.8 °C / 83.8 F (-4.9 °C / -8.9 F) idi.
| Dell G5 15 5587 GeForce GTX 1060 Max-Q, i5-8300H, SK hynix SC311 M.2 | Dell Inspiron 15 7000 7577 GeForce GTX 1050 Mobile, i5-7300HQ, Seagate Mobile HDD 1TB ST1000LX015-1U7172 | Dell Inspiron 15 7000 7577 GeForce GTX 1060 Max-Q, i5-7300HQ, Samsung PM961 MZVLW256HEHP | PC Zentrum Proteus V GeForce GTX 1060 Mobile, i7-7700HQ, Samsung PM961 MZVLW256HEHP | Asus FX503VM-EH73 GeForce GTX 1060 Mobile, i7-7700HQ, SanDisk SD8SN8U128G1002 | Acer Nitro 5 Spin NP515-51-86CX GeForce GTX 1050 Mobile, i5-8550U, Micron 1100 MTFDDAV256TBN | Acer Predator Helios 300 PH317-52-51M6 GeForce GTX 1050 Ti Mobile, i5-8300H, Hynix HFS128G39TND | |
|---|---|---|---|---|---|---|---|
| Heat | 13% | 12% | 5% | -20% | 10% | -3% | |
| Maximum Upper Side * (°C) | 50.2 | 35.9 28% | 44 12% | 44 12% | 59.6 -19% | 46 8% | 50 -0% |
| Maximum Bottom * (°C) | 57 | 41.6 27% | 43.8 23% | 53 7% | 56 2% | 47 18% | 52 9% |
| Idle Upper Side * (°C) | 28.6 | 27.9 2% | 26 9% | 29 -1% | 37 -29% | 29.6 -3% | 33 -15% |
| Idle Bottom * (°C) | 28.9 | 30.5 -6% | 28 3% | 29 -0% | 38.6 -34% | 24.6 15% | 30 -4% |
* ... daha küçük daha iyidir
Dell G5 15 5587 ses analizi
(-) | hoparlörler çok yüksek ses çıkarmıyor (68.5 dB)
Bas 100 - 315Hz
(±) | azaltılmış bas - ortalama olarak medyandan 12.5% daha düşük
(+) | bas doğrusaldır (5.9% delta ile önceki frekans)
Ortalar 400 - 2000 Hz
(+) | dengeli ortalar - medyandan yalnızca 4.6% uzakta
(+) | orta frekanslar doğrusaldır (5.1% deltadan önceki frekansa)
Yüksekler 2 - 16 kHz
(+) | dengeli yüksekler - medyandan yalnızca 1.1% uzakta
(+) | yüksekler doğrusaldır (3.6% deltadan önceki frekansa)
Toplam 100 - 16.000 Hz
(+) | genel ses doğrusaldır (14.9% ortancaya göre fark)
Aynı sınıfla karşılaştırıldığında
» Bu sınıftaki tüm test edilen cihazların %30%'si daha iyi, 7% benzer, 63% daha kötüydü
» En iyisinin deltası 6% idi, ortalama 18% idi, en kötüsü 132% idi
Test edilen tüm cihazlarla karşılaştırıldığında
» Test edilen tüm cihazların %20'si daha iyi, 4 benzer, % 76 daha kötüydü
» En iyisinin deltası 4% idi, ortalama 23% idi, en kötüsü 134% idi
Asus FX503VM-EH73 ses analizi
(-) | hoparlörler çok yüksek ses çıkarmıyor (68.2 dB)
Bas 100 - 315Hz
(±) | azaltılmış bas - ortalama olarak medyandan 11.5% daha düşük
(±) | Bas doğrusallığı ortalamadır (14.8% delta - önceki frekans)
Ortalar 400 - 2000 Hz
(+) | dengeli ortalar - medyandan yalnızca 1.9% uzakta
(+) | orta frekanslar doğrusaldır (6.7% deltadan önceki frekansa)
Yüksekler 2 - 16 kHz
(+) | dengeli yüksekler - medyandan yalnızca 4.2% uzakta
(±) | Yükseklerin doğrusallığı ortalamadır (7.6% delta - önceki frekans)
Toplam 100 - 16.000 Hz
(±) | Genel sesin doğrusallığı ortalamadır (19.4% ortancaya göre fark)
Aynı sınıfla karşılaştırıldığında
» Bu sınıftaki tüm test edilen cihazların %67%'si daha iyi, 7% benzer, 26% daha kötüydü
» En iyisinin deltası 6% idi, ortalama 18% idi, en kötüsü 132% idi
Test edilen tüm cihazlarla karşılaştırıldığında
» Test edilen tüm cihazların %48'si daha iyi, 7 benzer, % 45 daha kötüydü
» En iyisinin deltası 4% idi, ortalama 23% idi, en kötüsü 134% idi
| Kapalı / Bekleme modu | |
| Boşta | |
| Çalışırken |
|
Key:
min: | |
| Dell G5 15 5587 i5-8300H, GeForce GTX 1060 Max-Q, SK hynix SC311 M.2, IPS, 1920x1080, 15.6" | Dell Inspiron 15 7000 7577 i5-7300HQ, GeForce GTX 1050 Mobile, Seagate Mobile HDD 1TB ST1000LX015-1U7172, IPS, 1920x1080, 15.6" | Dell Inspiron 15 7000 7577 i5-7300HQ, GeForce GTX 1060 Max-Q, Samsung PM961 MZVLW256HEHP, IPS, 1920x1080, 15.6" | PC Zentrum Proteus V i7-7700HQ, GeForce GTX 1060 Mobile, Samsung PM961 MZVLW256HEHP, IPS, 1920x1080, 15.6" | Asus FX503VM-EH73 i7-7700HQ, GeForce GTX 1060 Mobile, SanDisk SD8SN8U128G1002, IPS, 1920x1080, 15.6" | Acer Nitro 5 Spin NP515-51-86CX i5-8550U, GeForce GTX 1050 Mobile, Micron 1100 MTFDDAV256TBN, IPS, 1920x1080, 15.6" | Acer Predator Helios 300 PH317-52-51M6 i5-8300H, GeForce GTX 1050 Ti Mobile, Hynix HFS128G39TND, IPS, 1920x1080, 17.3" | Ortalama NVIDIA GeForce GTX 1060 Max-Q | Sınıf ortalaması Gaming | |
|---|---|---|---|---|---|---|---|---|---|
| Power Consumption | 3% | 8% | -181% | -50% | 20% | -10% | -40% | -109% | |
| Idle Minimum * (Watt) | 4.9 | 5.3 -8% | 7.1 -45% | 28 -471% | 12.8 -161% | 4.1 16% | 6 -22% | 9.14 ? -87% | 13 ? -165% |
| Idle Average * (Watt) | 8.5 | 8.8 -4% | 7.6 11% | 32 -276% | 15.4 -81% | 7.4 13% | 9 -6% | 13.2 ? -55% | 18.7 ? -120% |
| Idle Maximum * (Watt) | 9.1 | 9.7 -7% | 8.6 5% | 38 -318% | 15.9 -75% | 8.6 5% | 13 -43% | 15.1 ? -66% | 24.3 ? -167% |
| Load Average * (Watt) | 90.7 | 100 -10% | 59.5 34% | 91 -0% | 78 14% | 66 27% | 95 -5% | 88.3 ? 3% | 108.2 ? -19% |
| Witcher 3 ultra * (Watt) | 110 | 87 21% | 89 19% | 124 -13% | 107.3 2% | 102 7% | |||
| Load Maximum * (Watt) | 144 | 109 24% | 112.8 22% | 152 -6% | 143.4 -0% | 87 40% | 134 7% | 134.9 ? 6% | 254 ? -76% |
* ... daha küçük daha iyidir
| Dell G5 15 5587 i5-8300H, GeForce GTX 1060 Max-Q, 56 Wh | Dell Inspiron 15 7000 7577 i5-7300HQ, GeForce GTX 1050 Mobile, 56 Wh | Dell Inspiron 15 7000 7577 i5-7300HQ, GeForce GTX 1060 Max-Q, 56 Wh | PC Zentrum Proteus V i7-7700HQ, GeForce GTX 1060 Mobile, Wh | Asus FX503VM-EH73 i7-7700HQ, GeForce GTX 1060 Mobile, 64 Wh | Acer Nitro 5 Spin NP515-51-86CX i5-8550U, GeForce GTX 1050 Mobile, 48 Wh | Acer Predator Helios 300 PH317-52-51M6 i5-8300H, GeForce GTX 1050 Ti Mobile, 48 Wh | Sınıf ortalaması Gaming | |
|---|---|---|---|---|---|---|---|---|
| Pil Çalışma Süresi | -6% | -9% | -47% | -44% | 2% | -11% | 4% | |
| Reader / Idle (h) | 11.8 | 11.1 -6% | 11 -7% | 3.7 -69% | 5.7 -52% | 12.5 6% | 11.8 0% | 8.71 ? -26% |
| H.264 (h) | 5.4 | 5.2 -4% | 3.3 -39% | 6.2 15% | 8.9 ? 65% | |||
| WiFi v1.3 (h) | 6.5 | 6.8 5% | 6.9 6% | 3.3 -49% | 4.6 -29% | 6.6 2% | 5.9 -9% | 7.06 ? 9% |
| Load (h) | 2.2 | 1.8 -18% | 1.6 -27% | 1.5 -32% | 1.1 -50% | 1.9 -14% | 1.7 -23% | 1.51 ? -31% |
Artılar
Eksiler
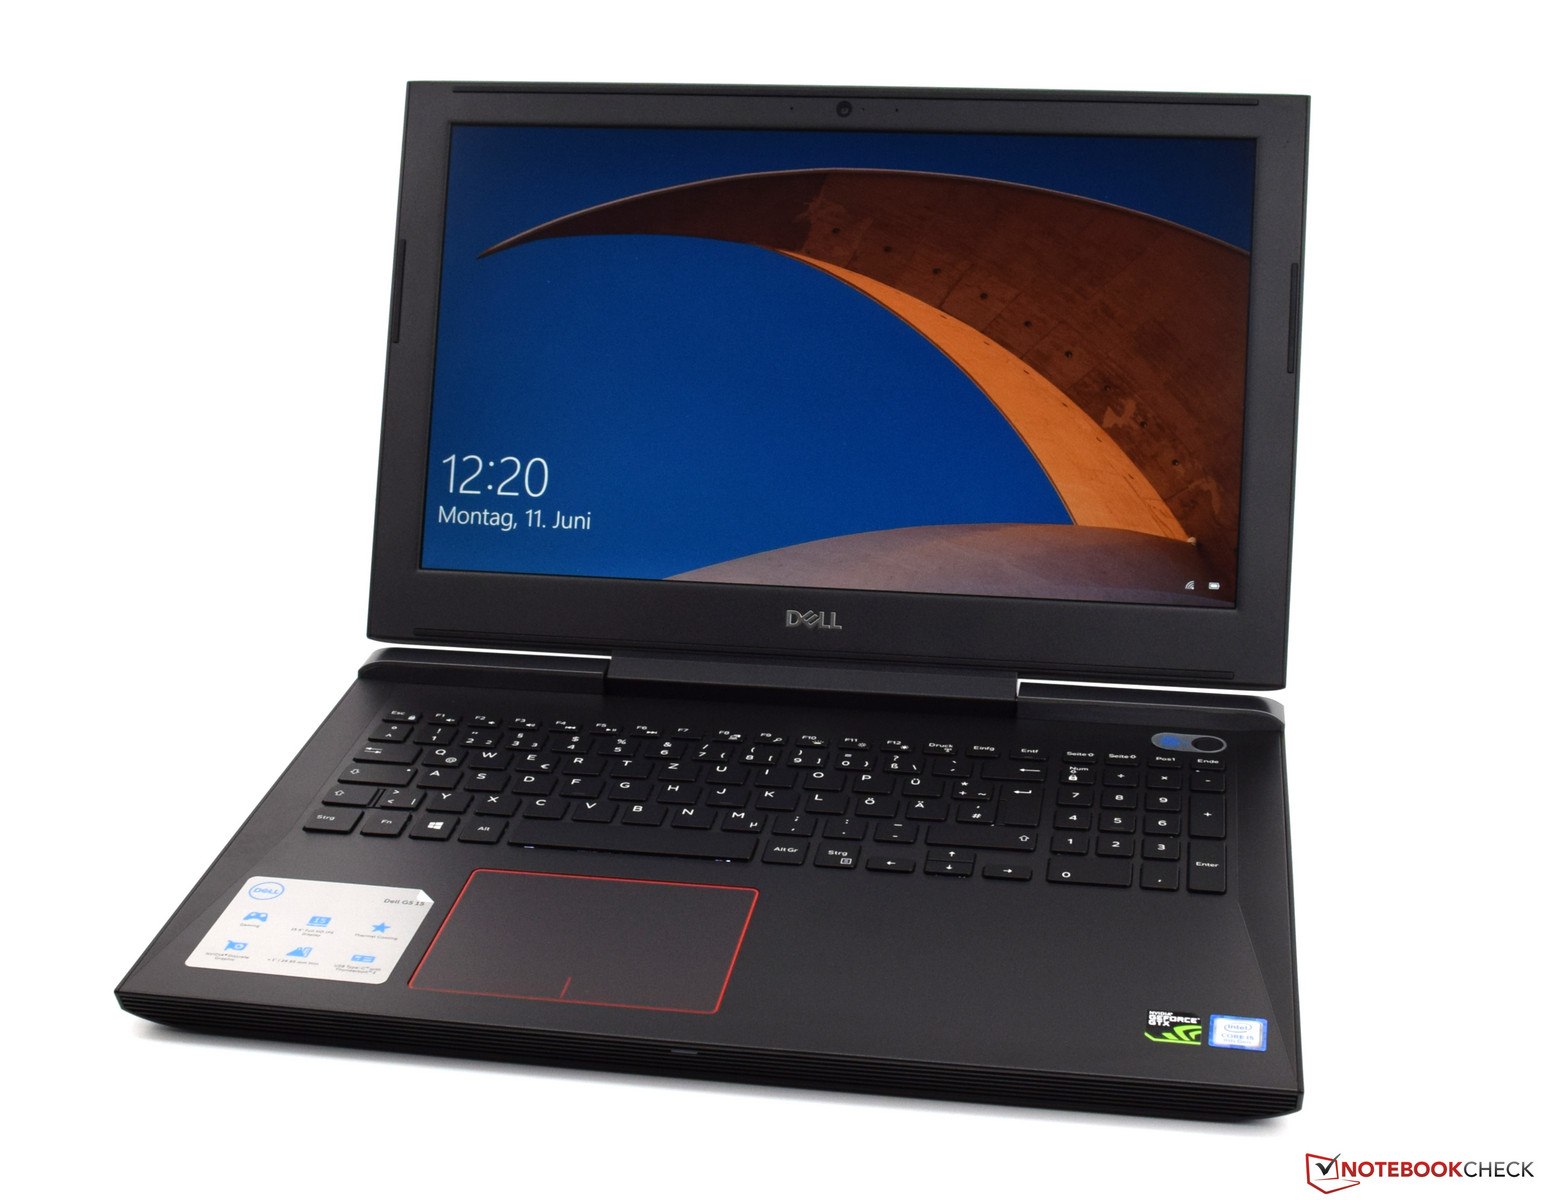
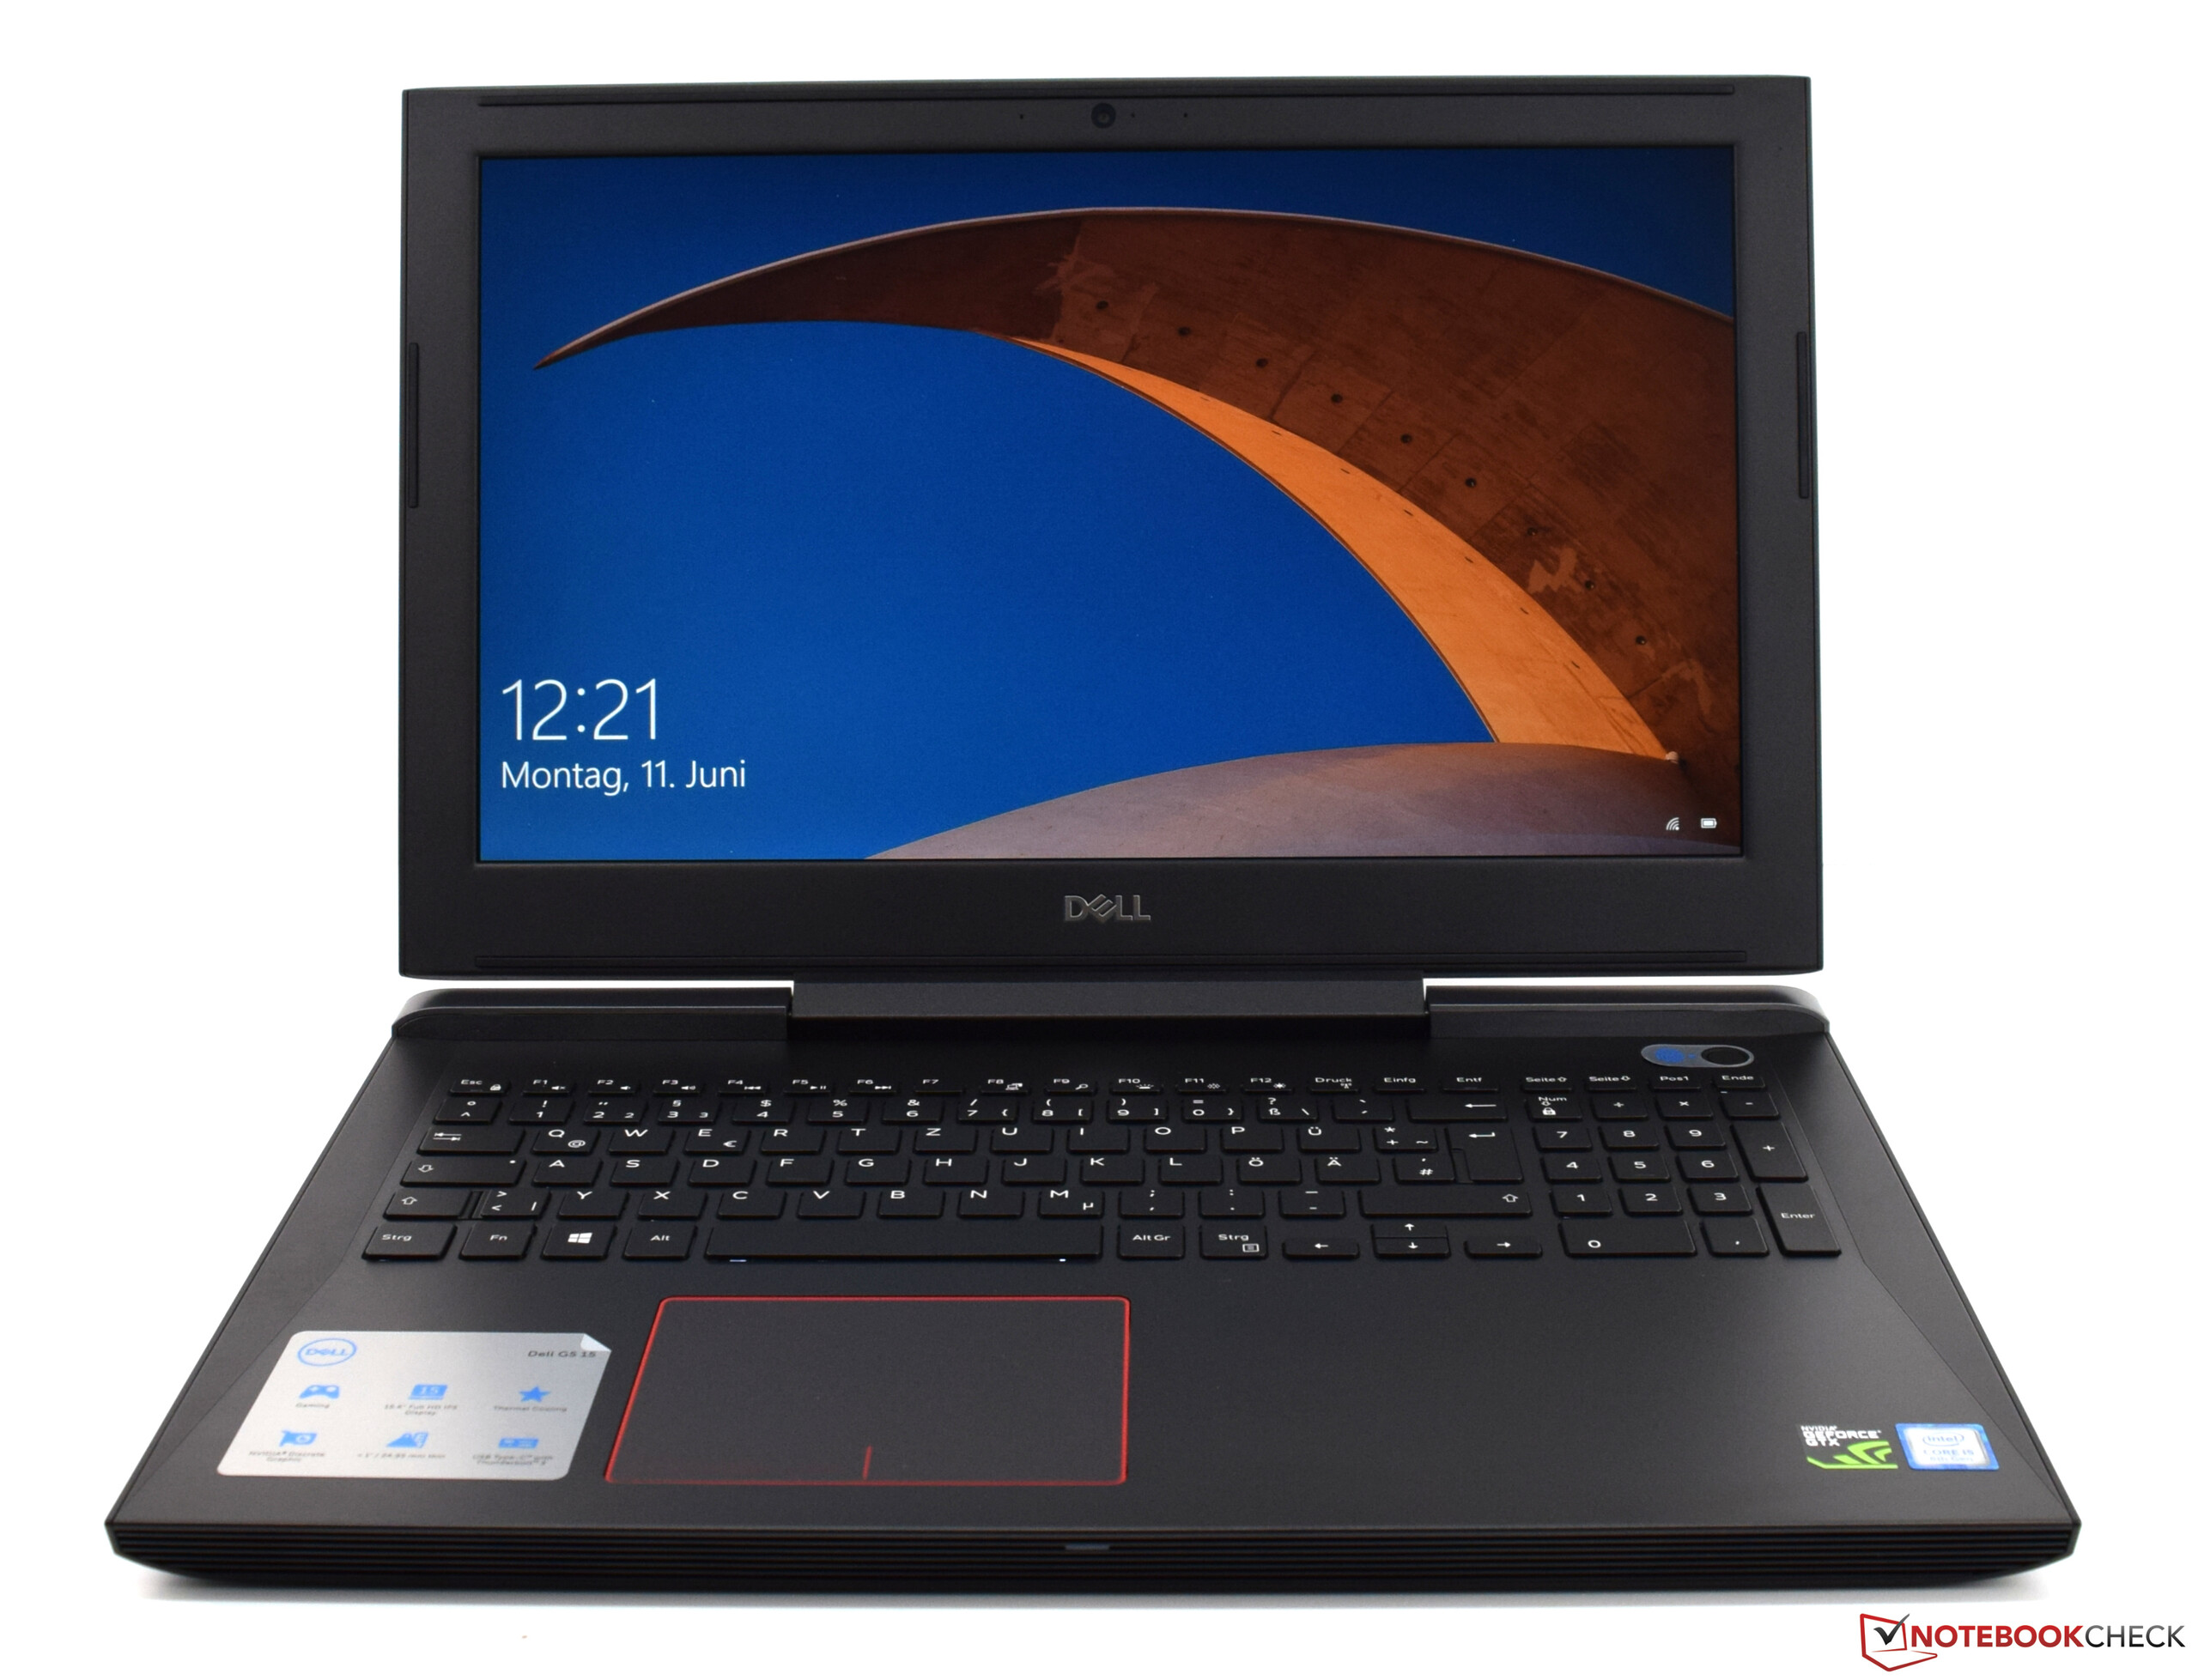
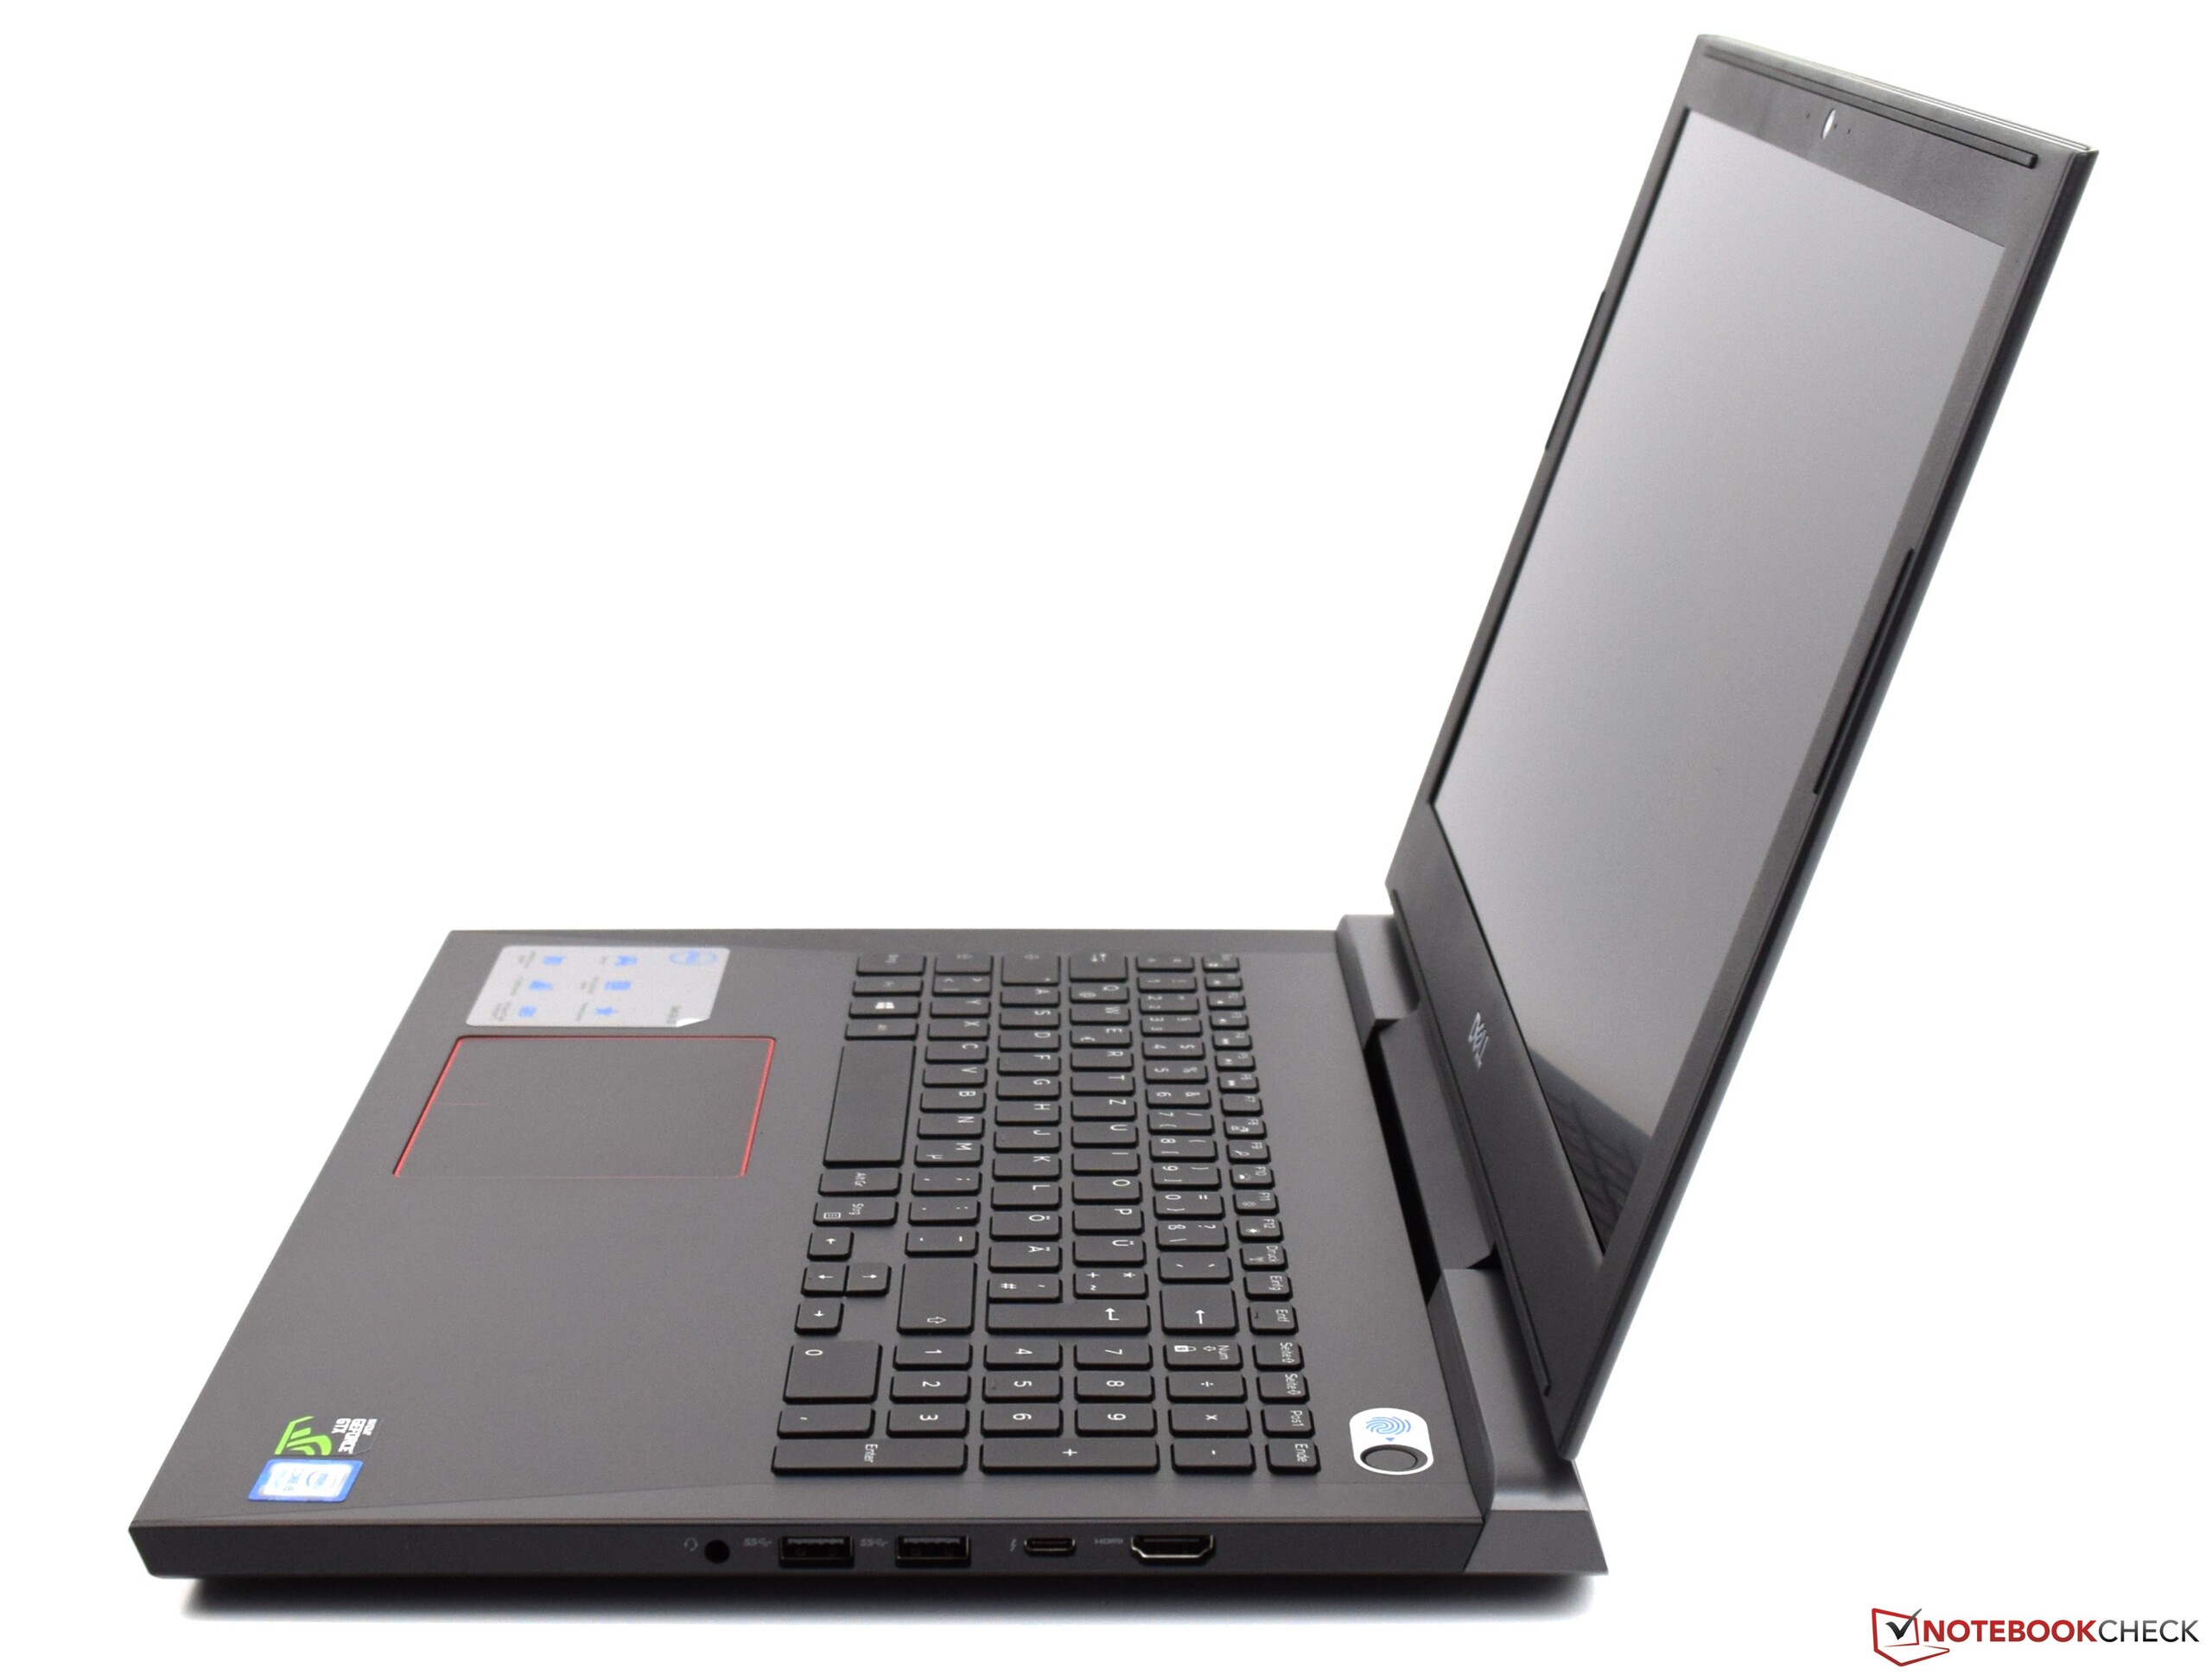
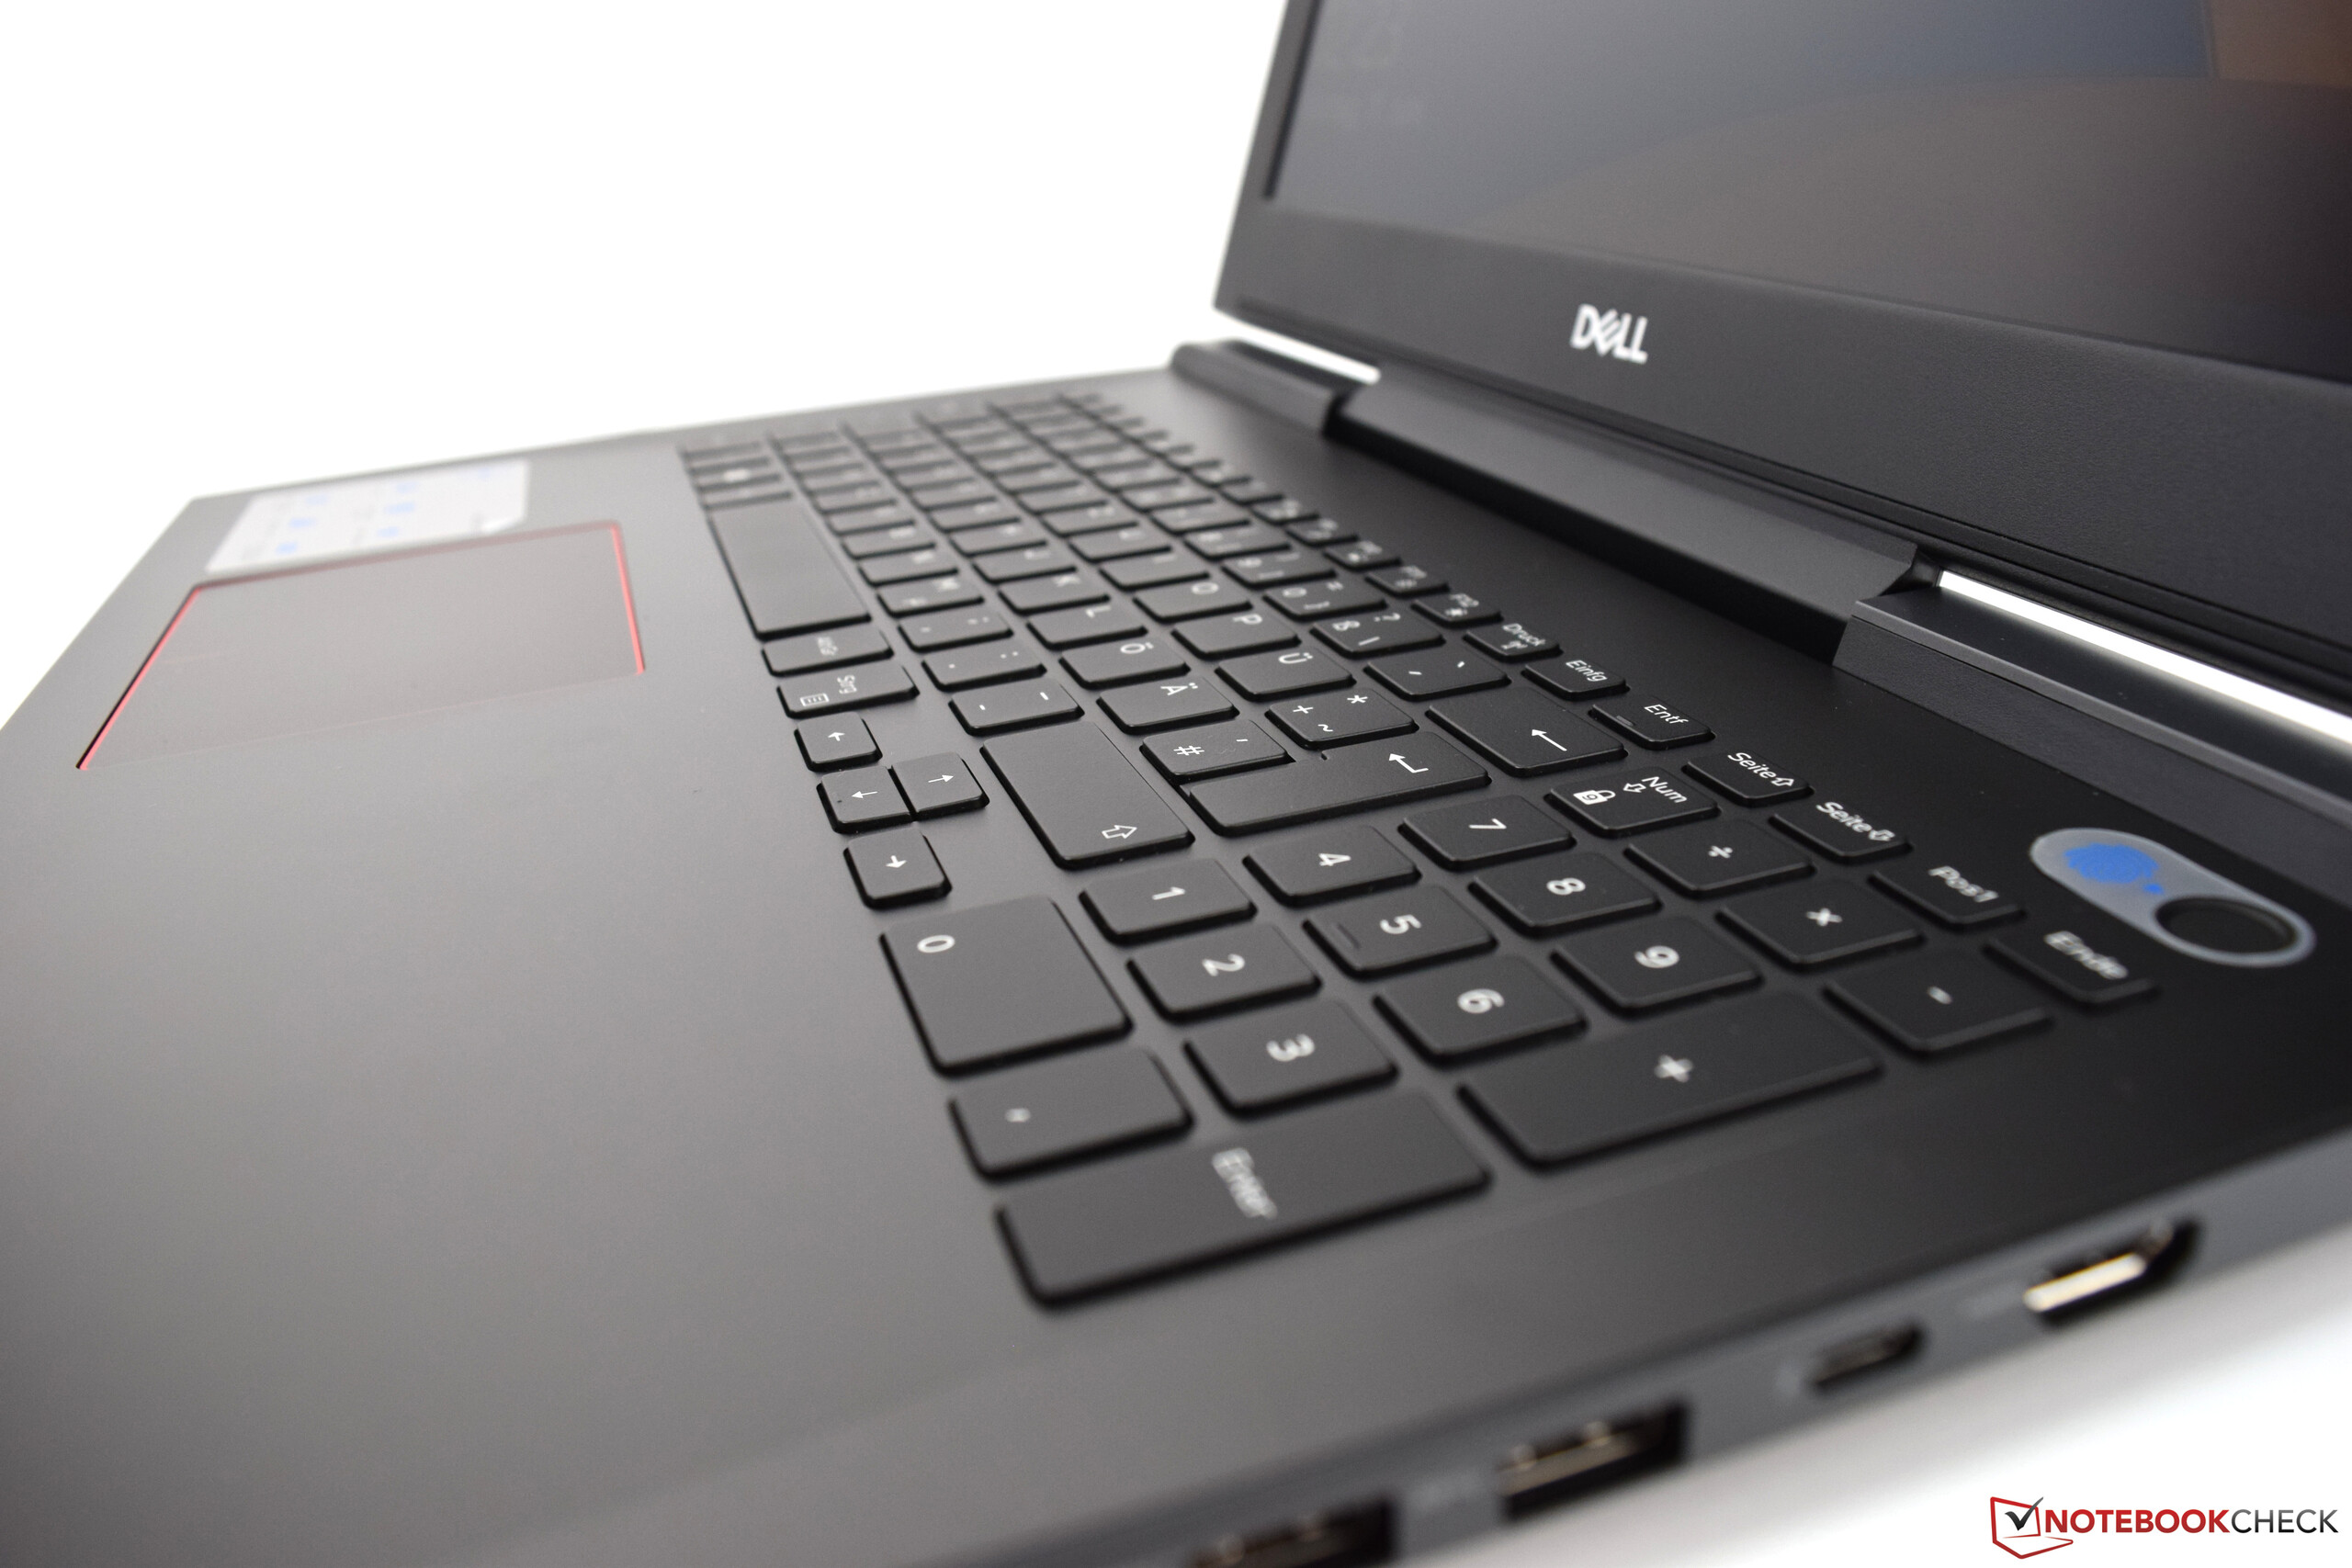
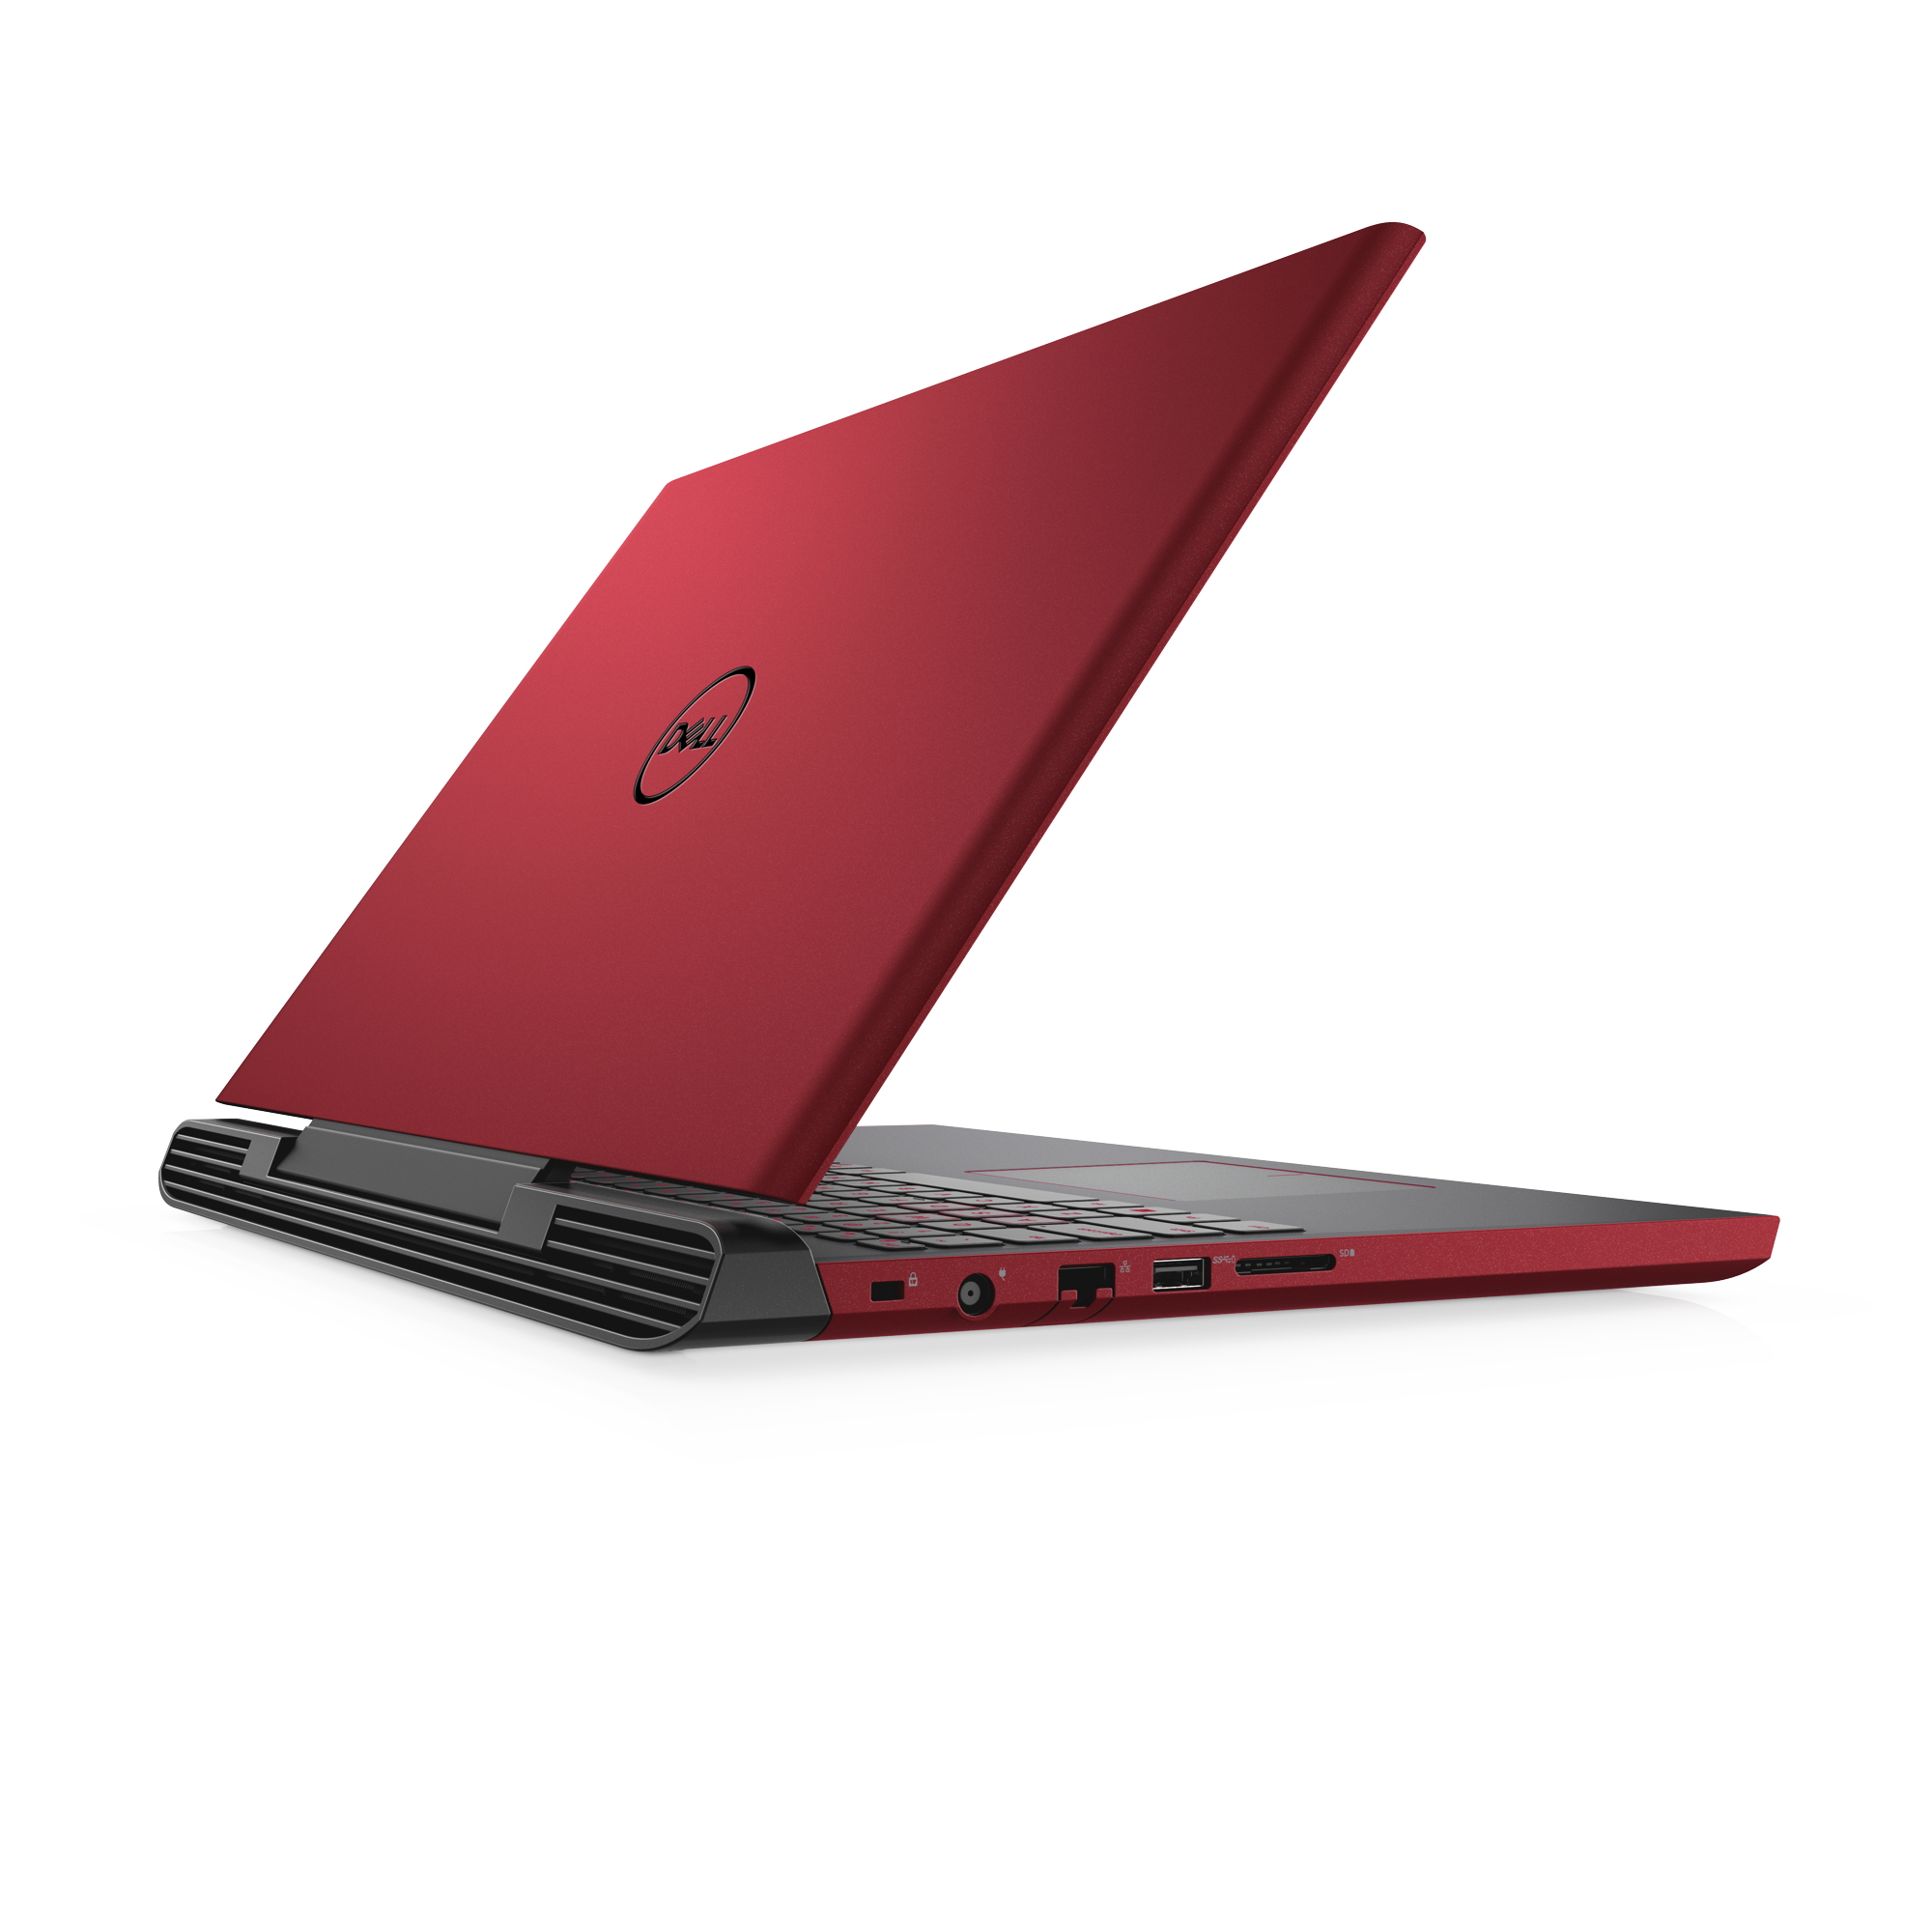
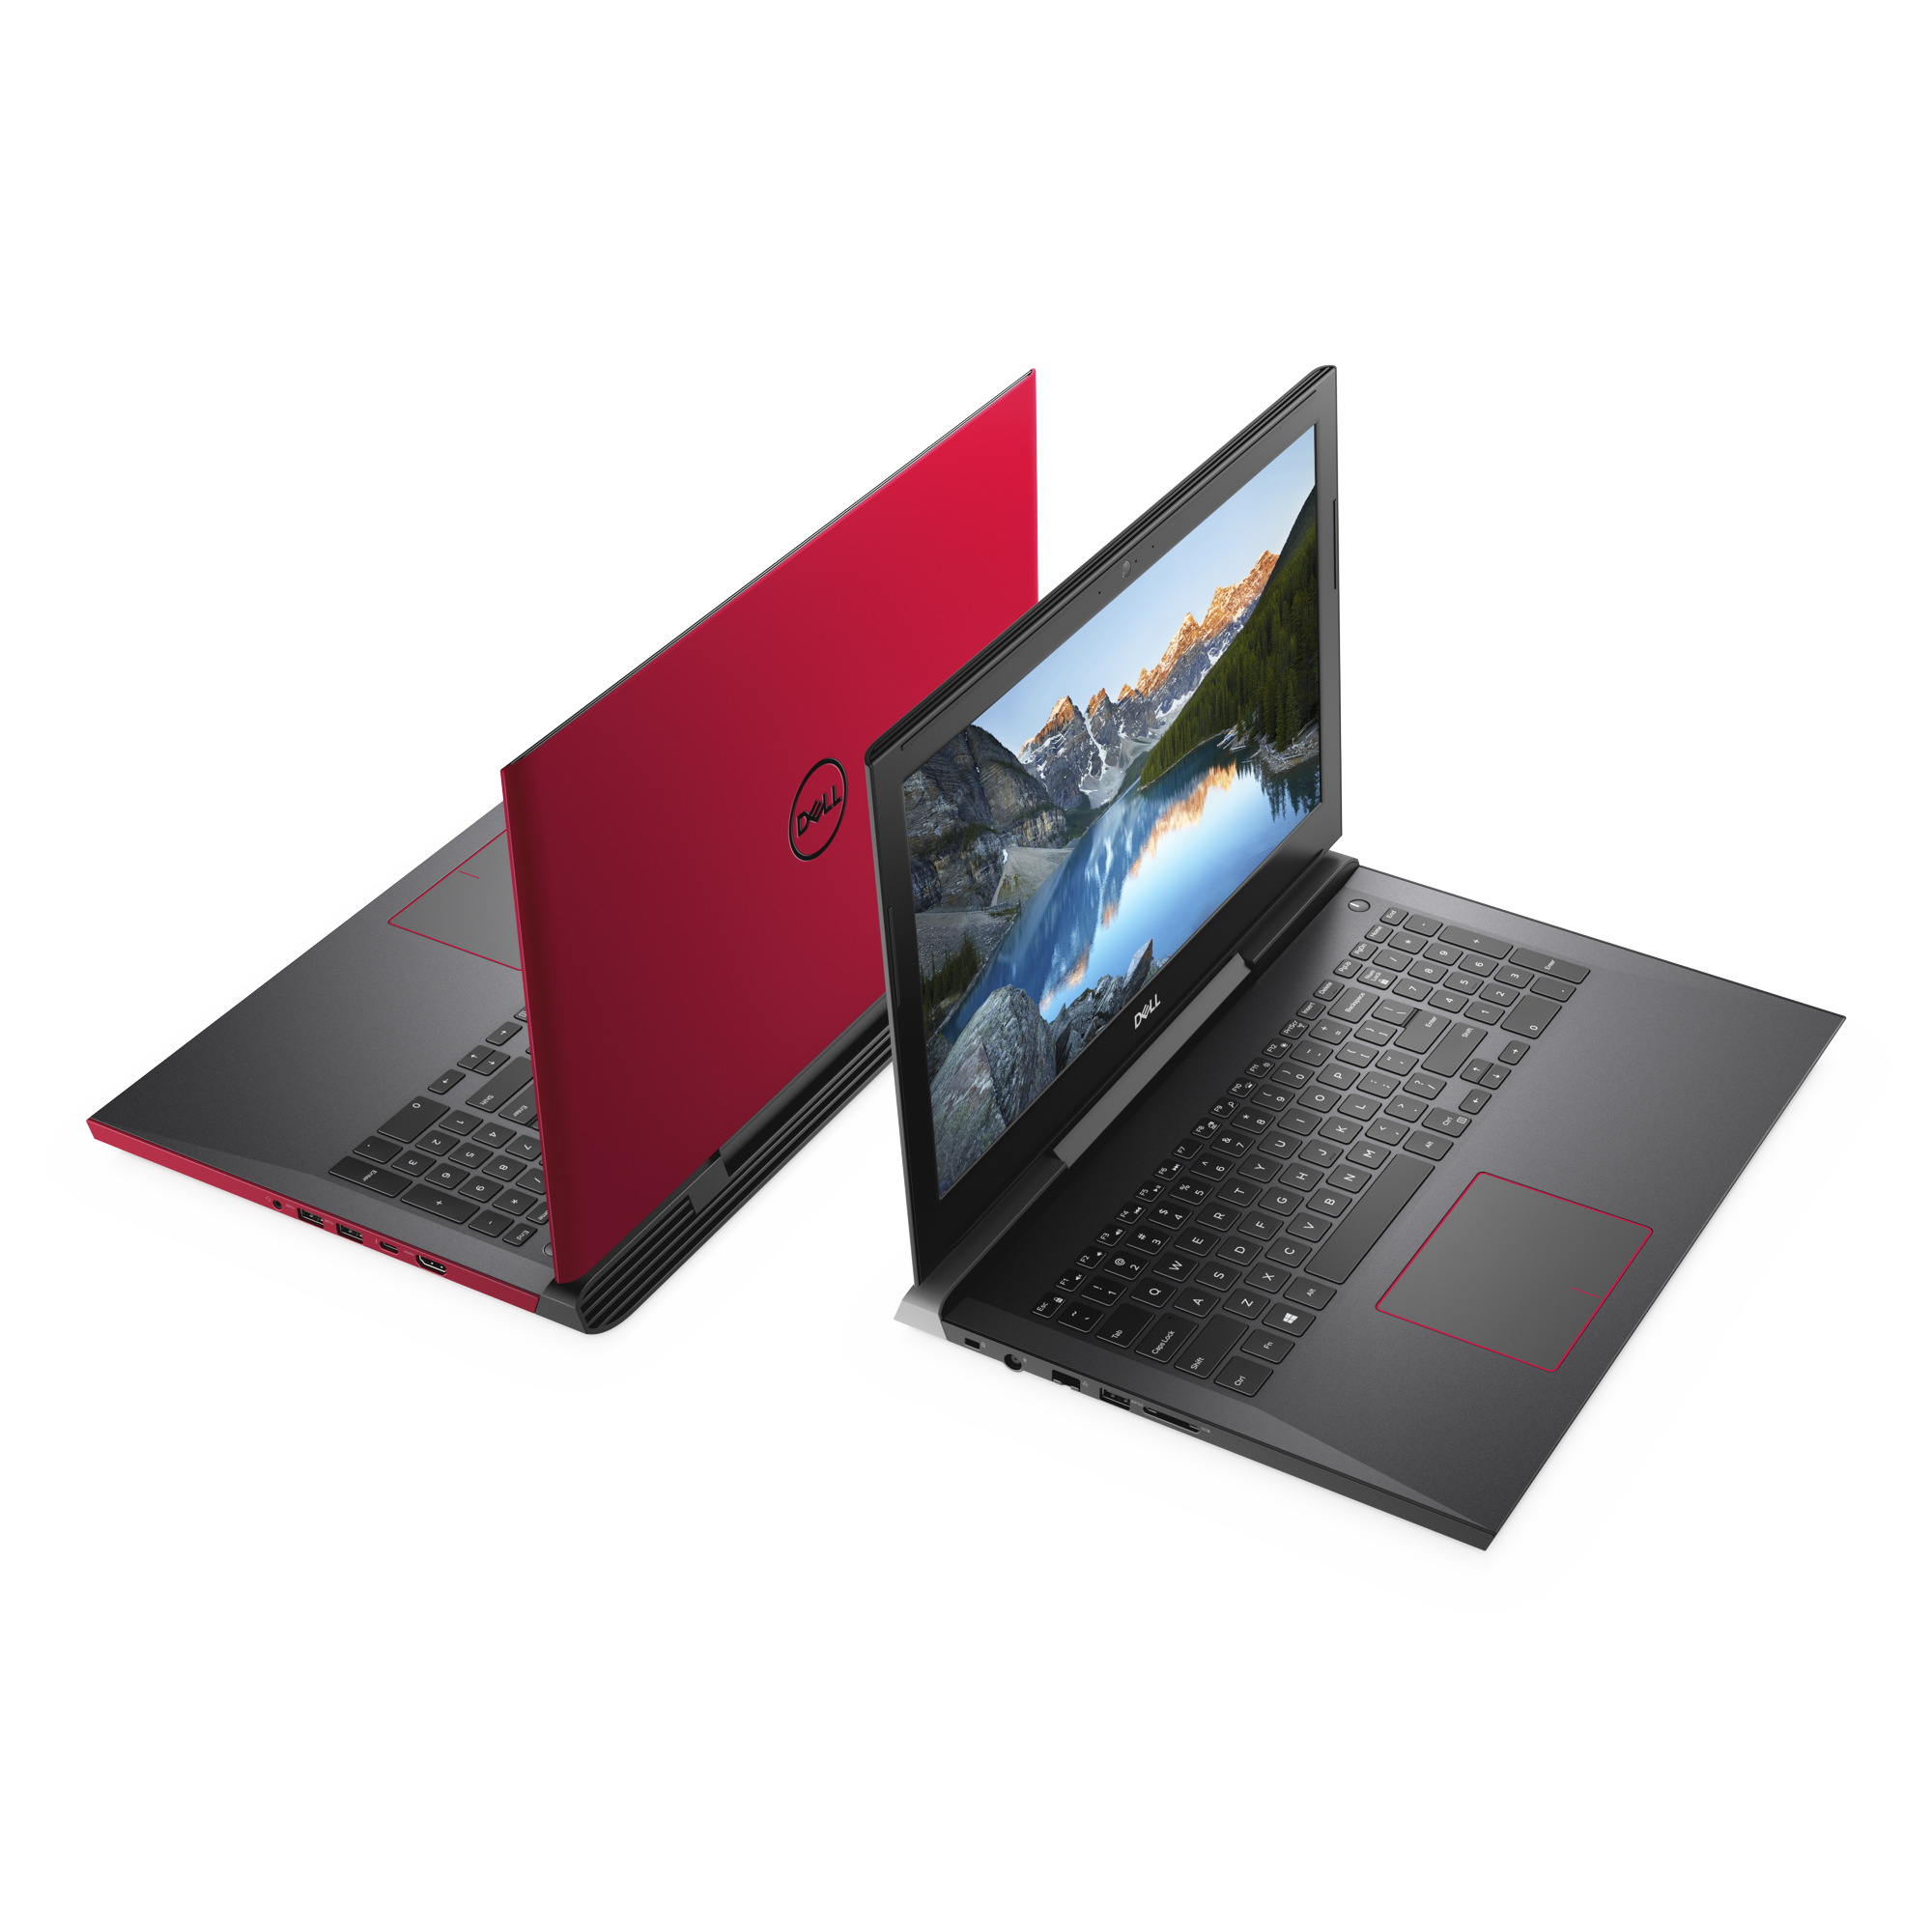
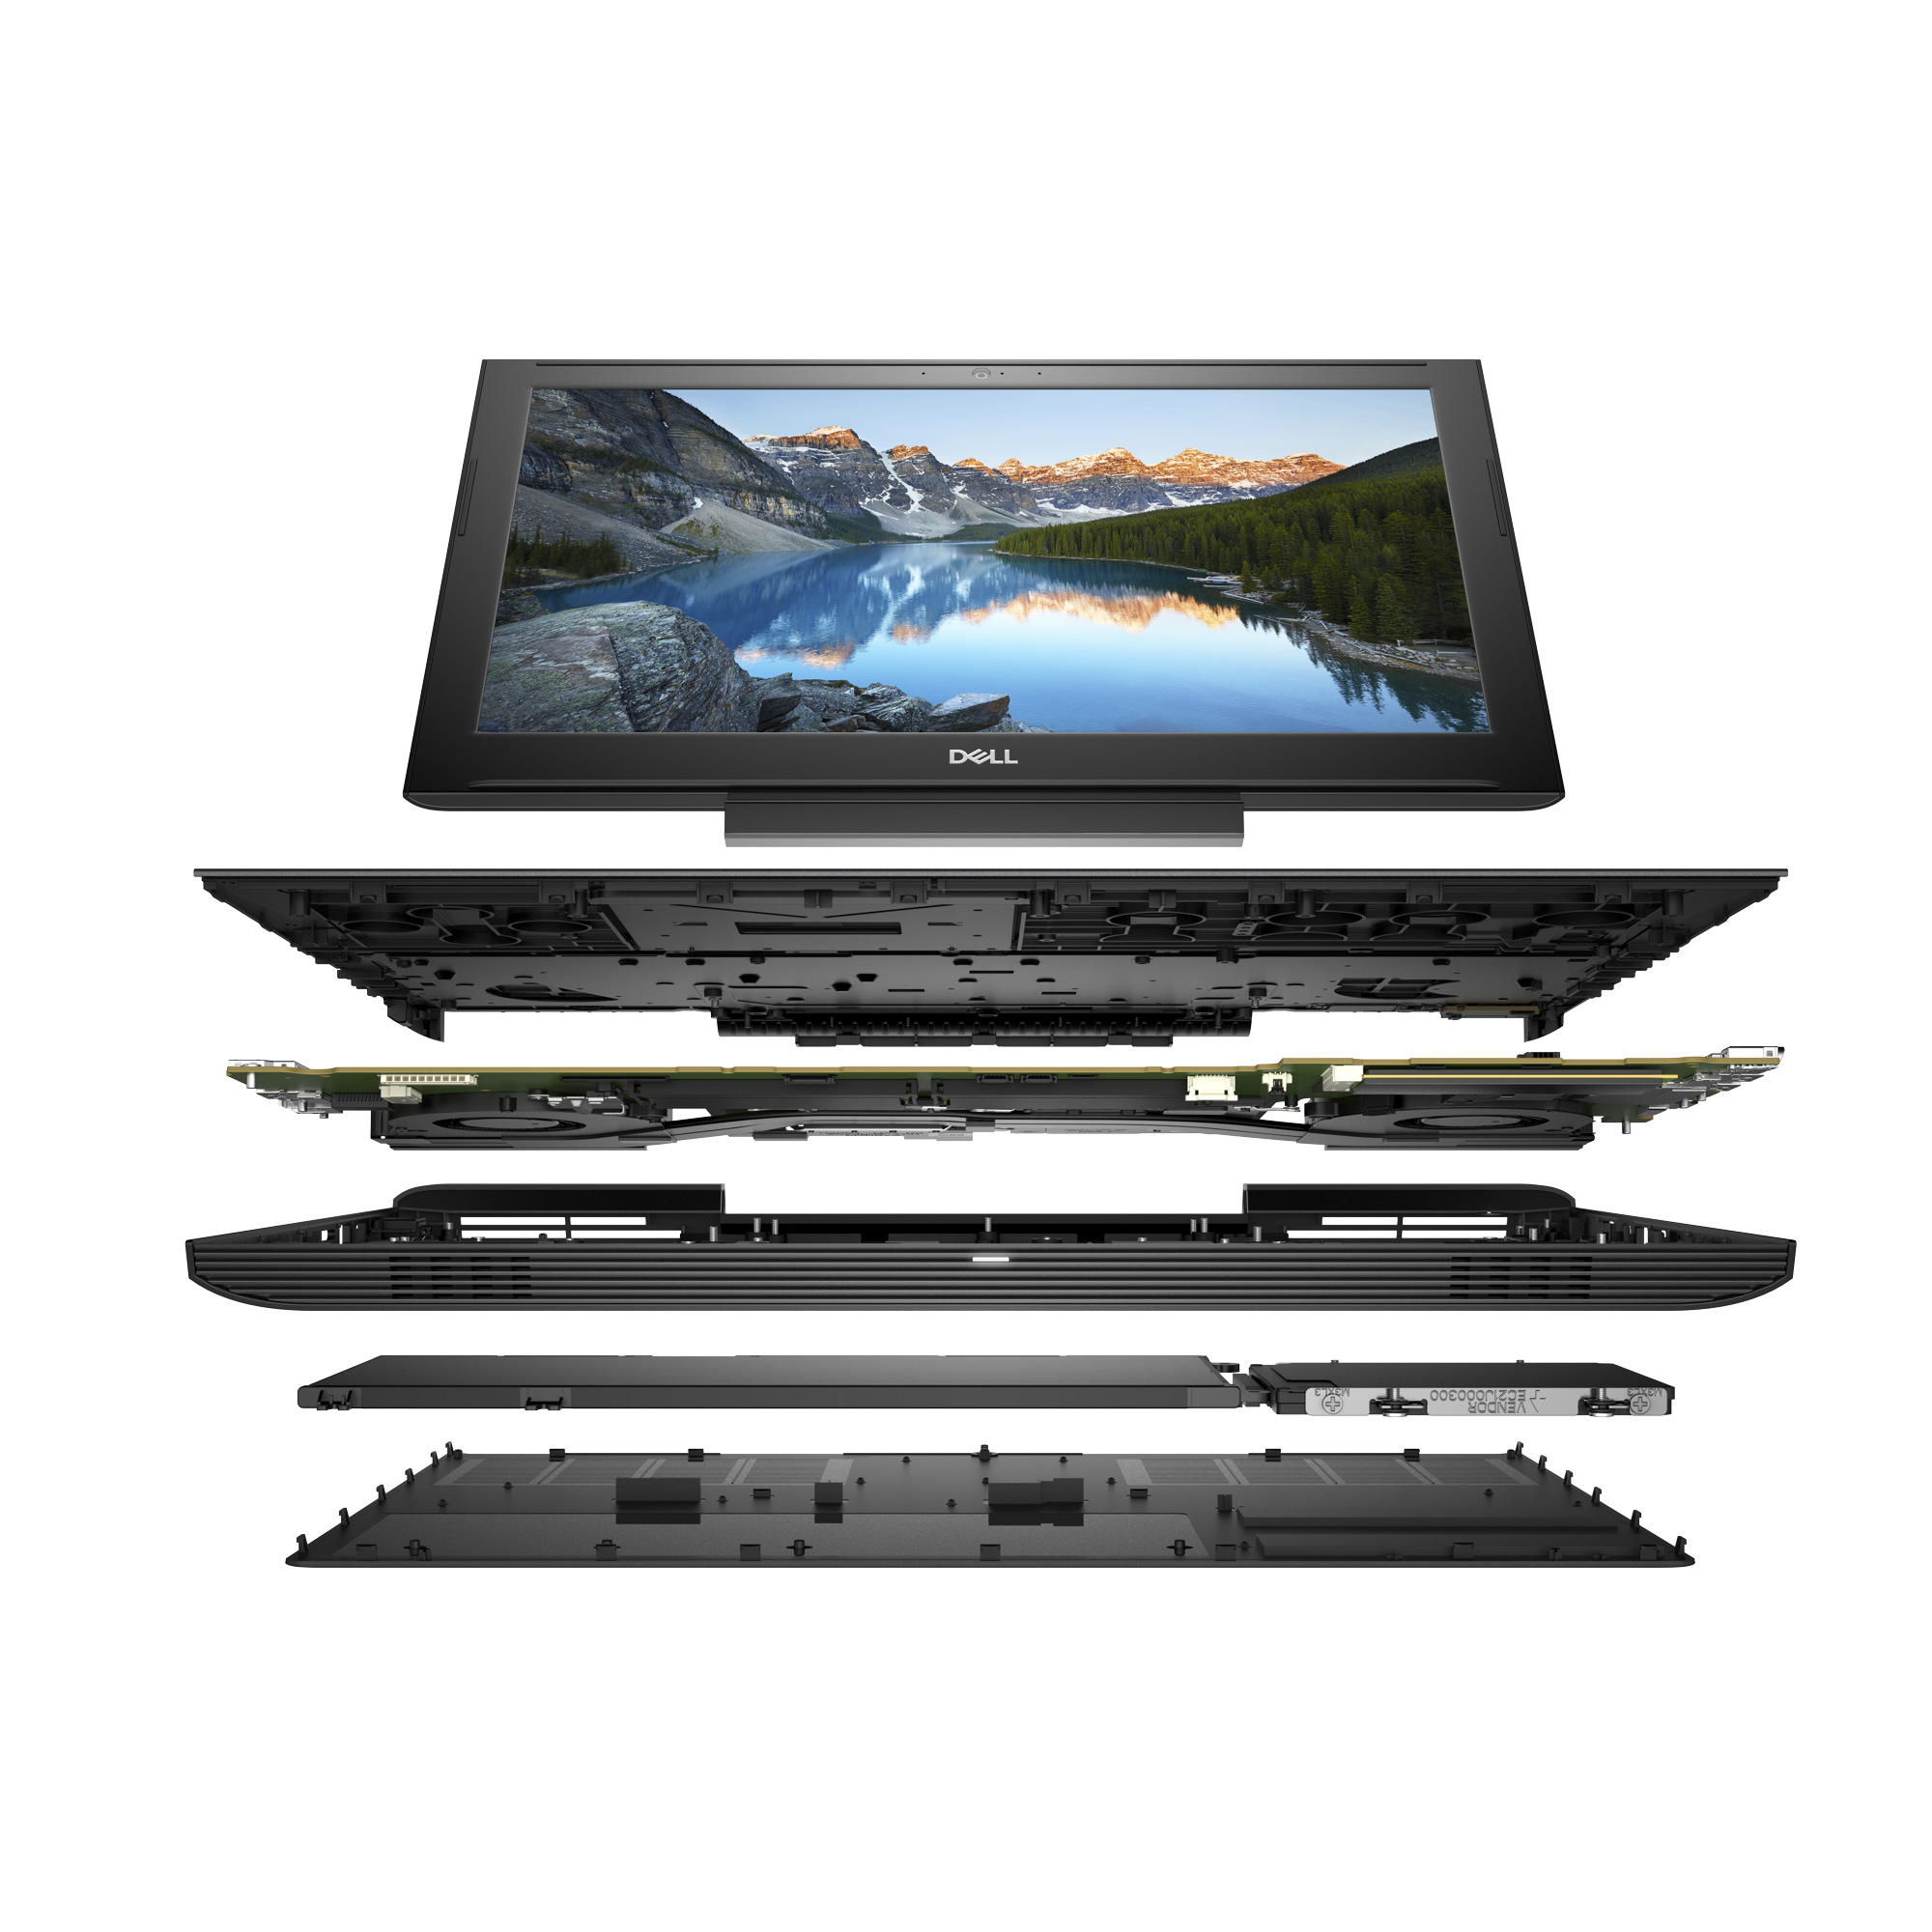
Dell G5 15 5587 ilgi çekici fiyatı ile oyuncular için farklı bir alternatif olmaya devam ediyor. Özellikle sağlam kasası ve ekran menteşeleri ile oldukça tatmin edici. Yeni işlemcisi ile eski modele göre de oldukça hızlı.
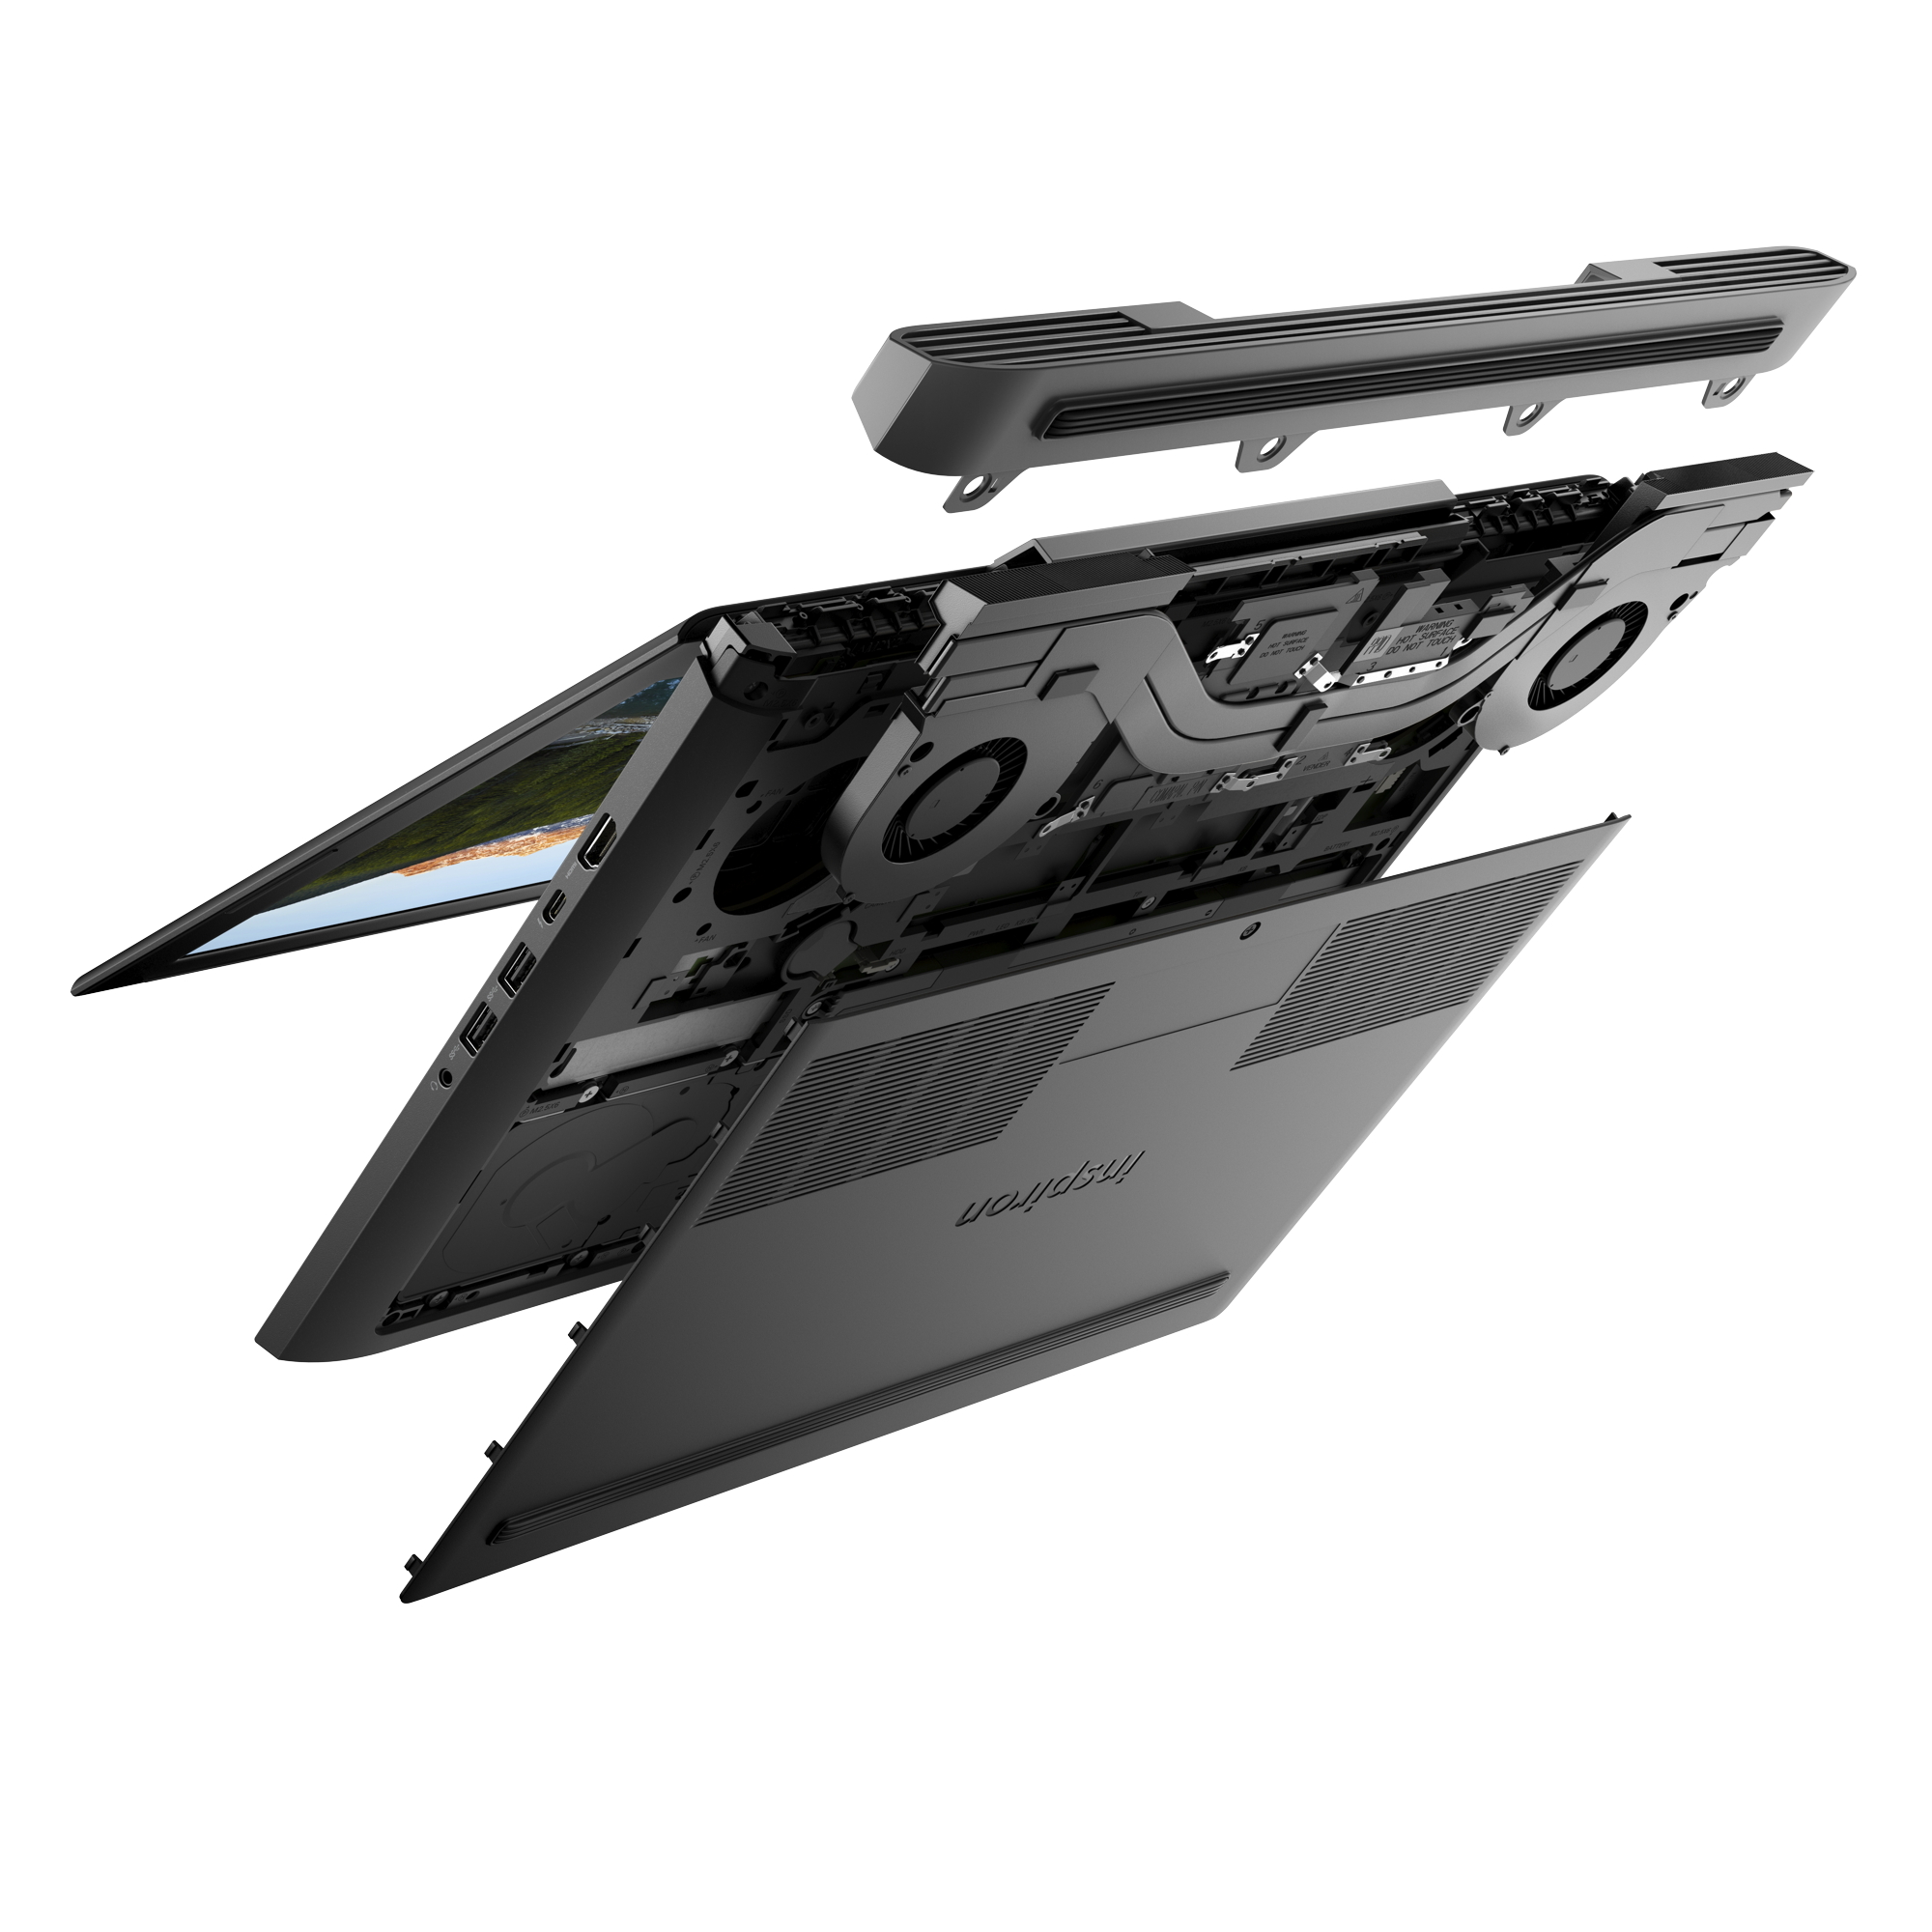
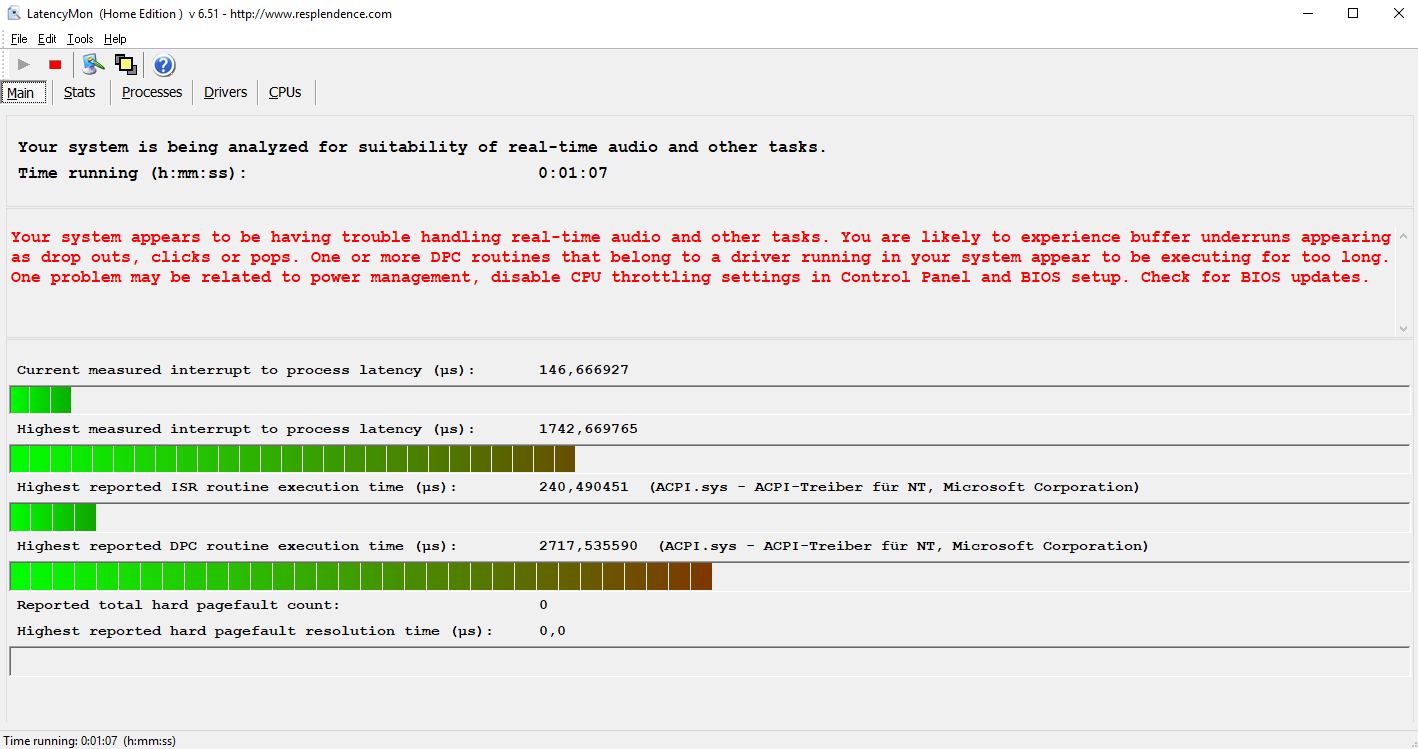
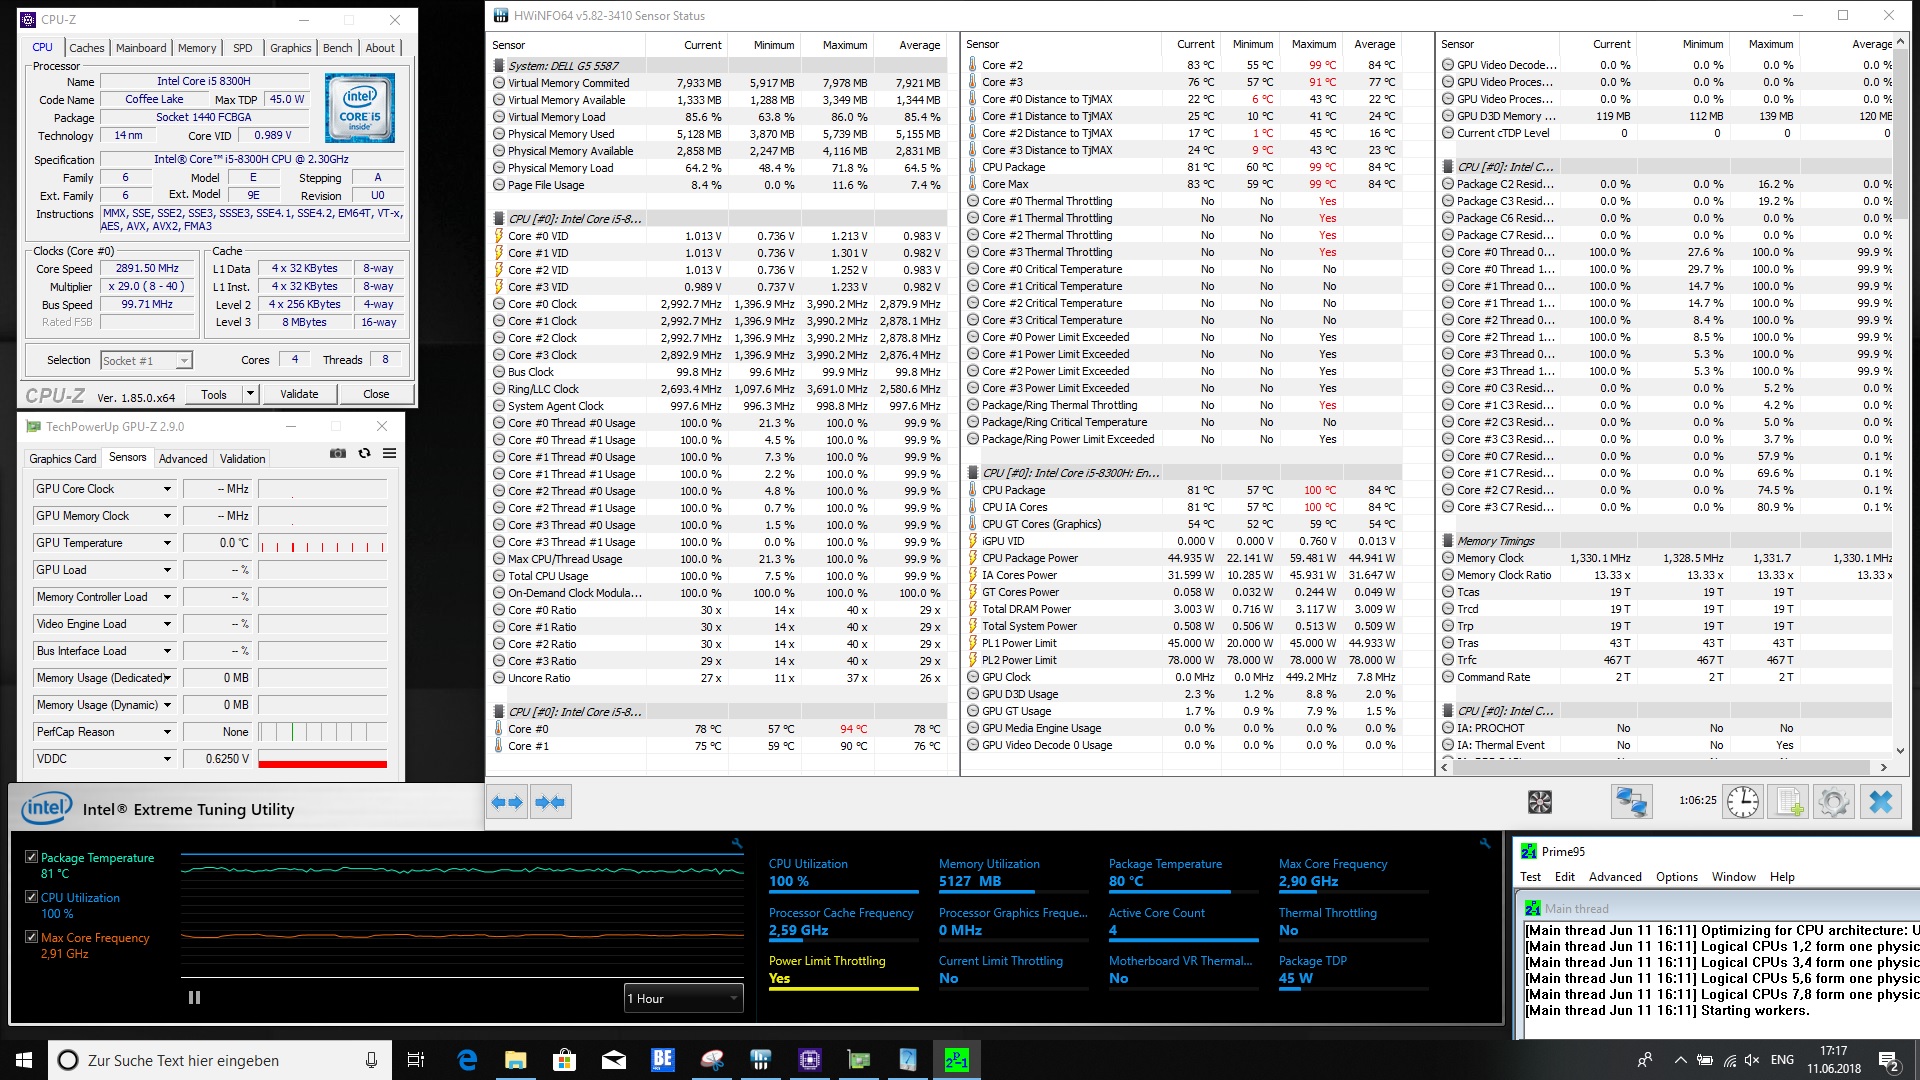
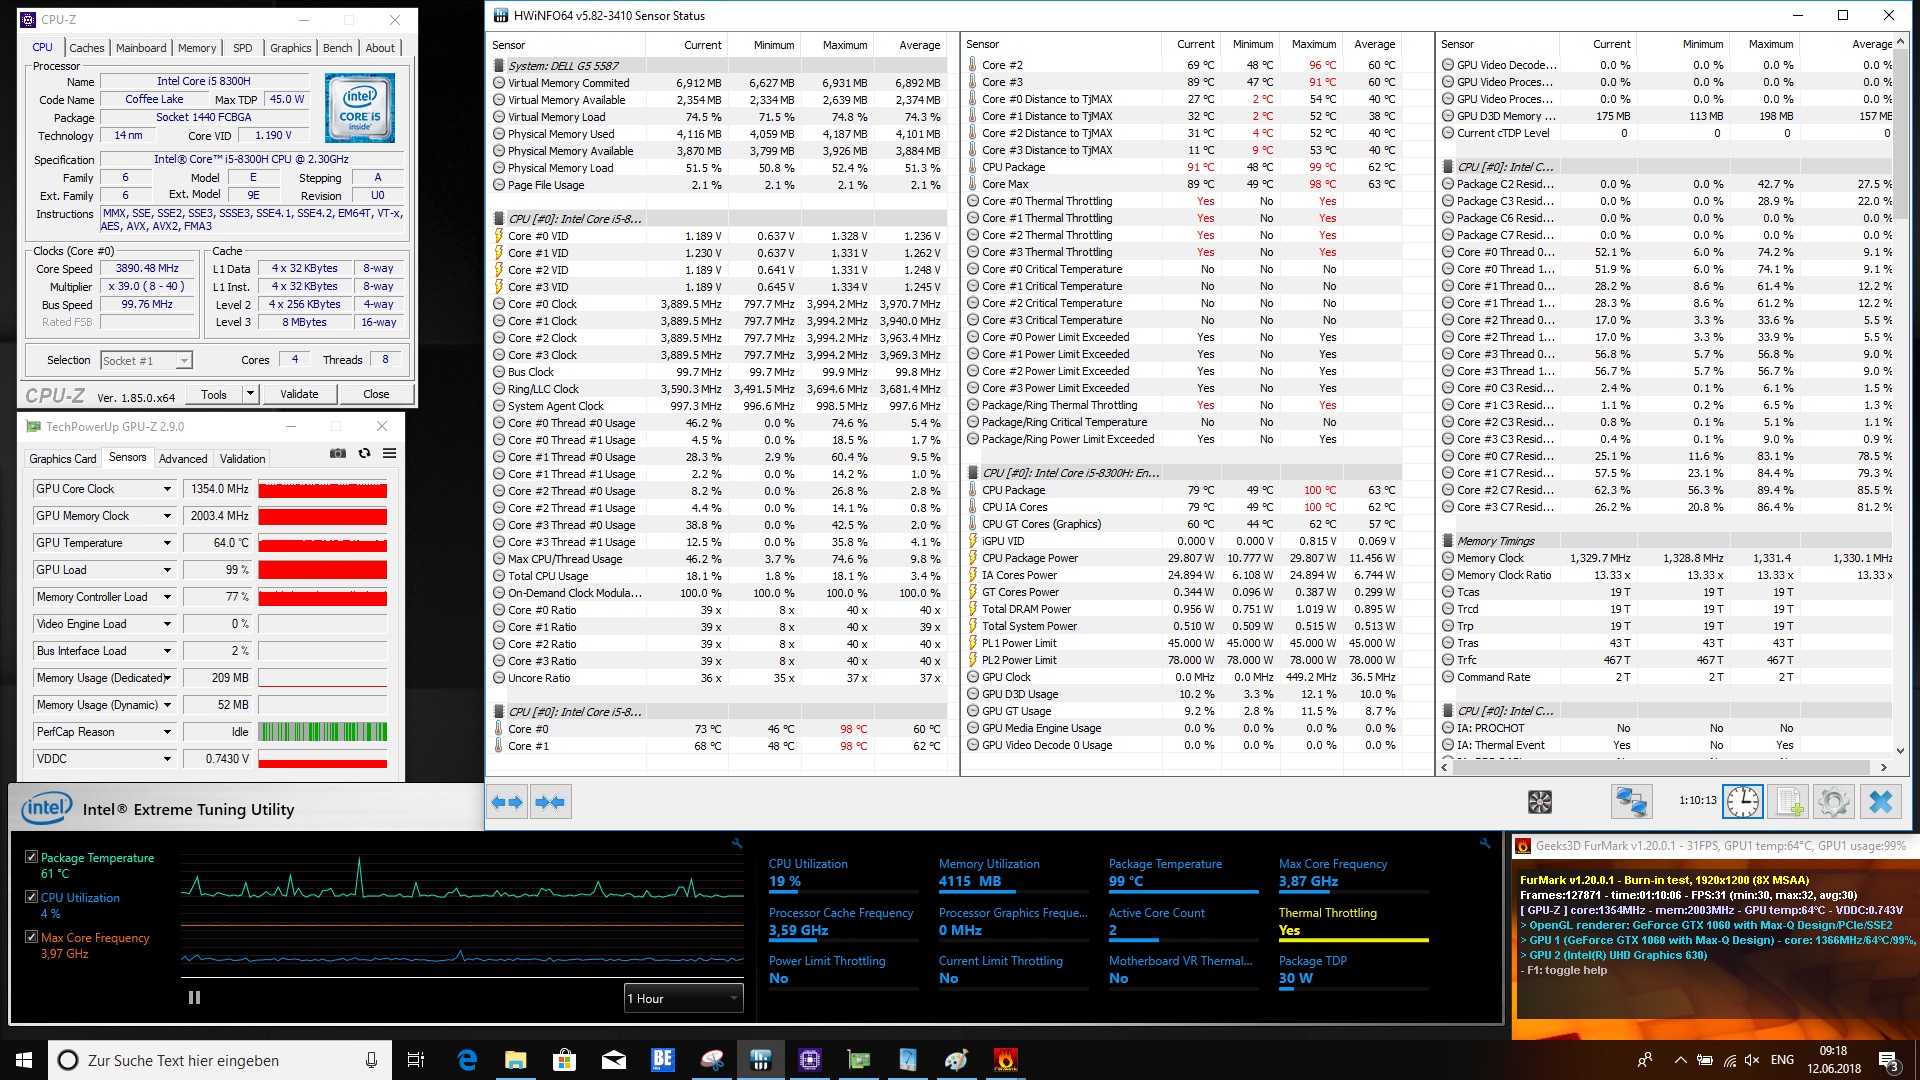
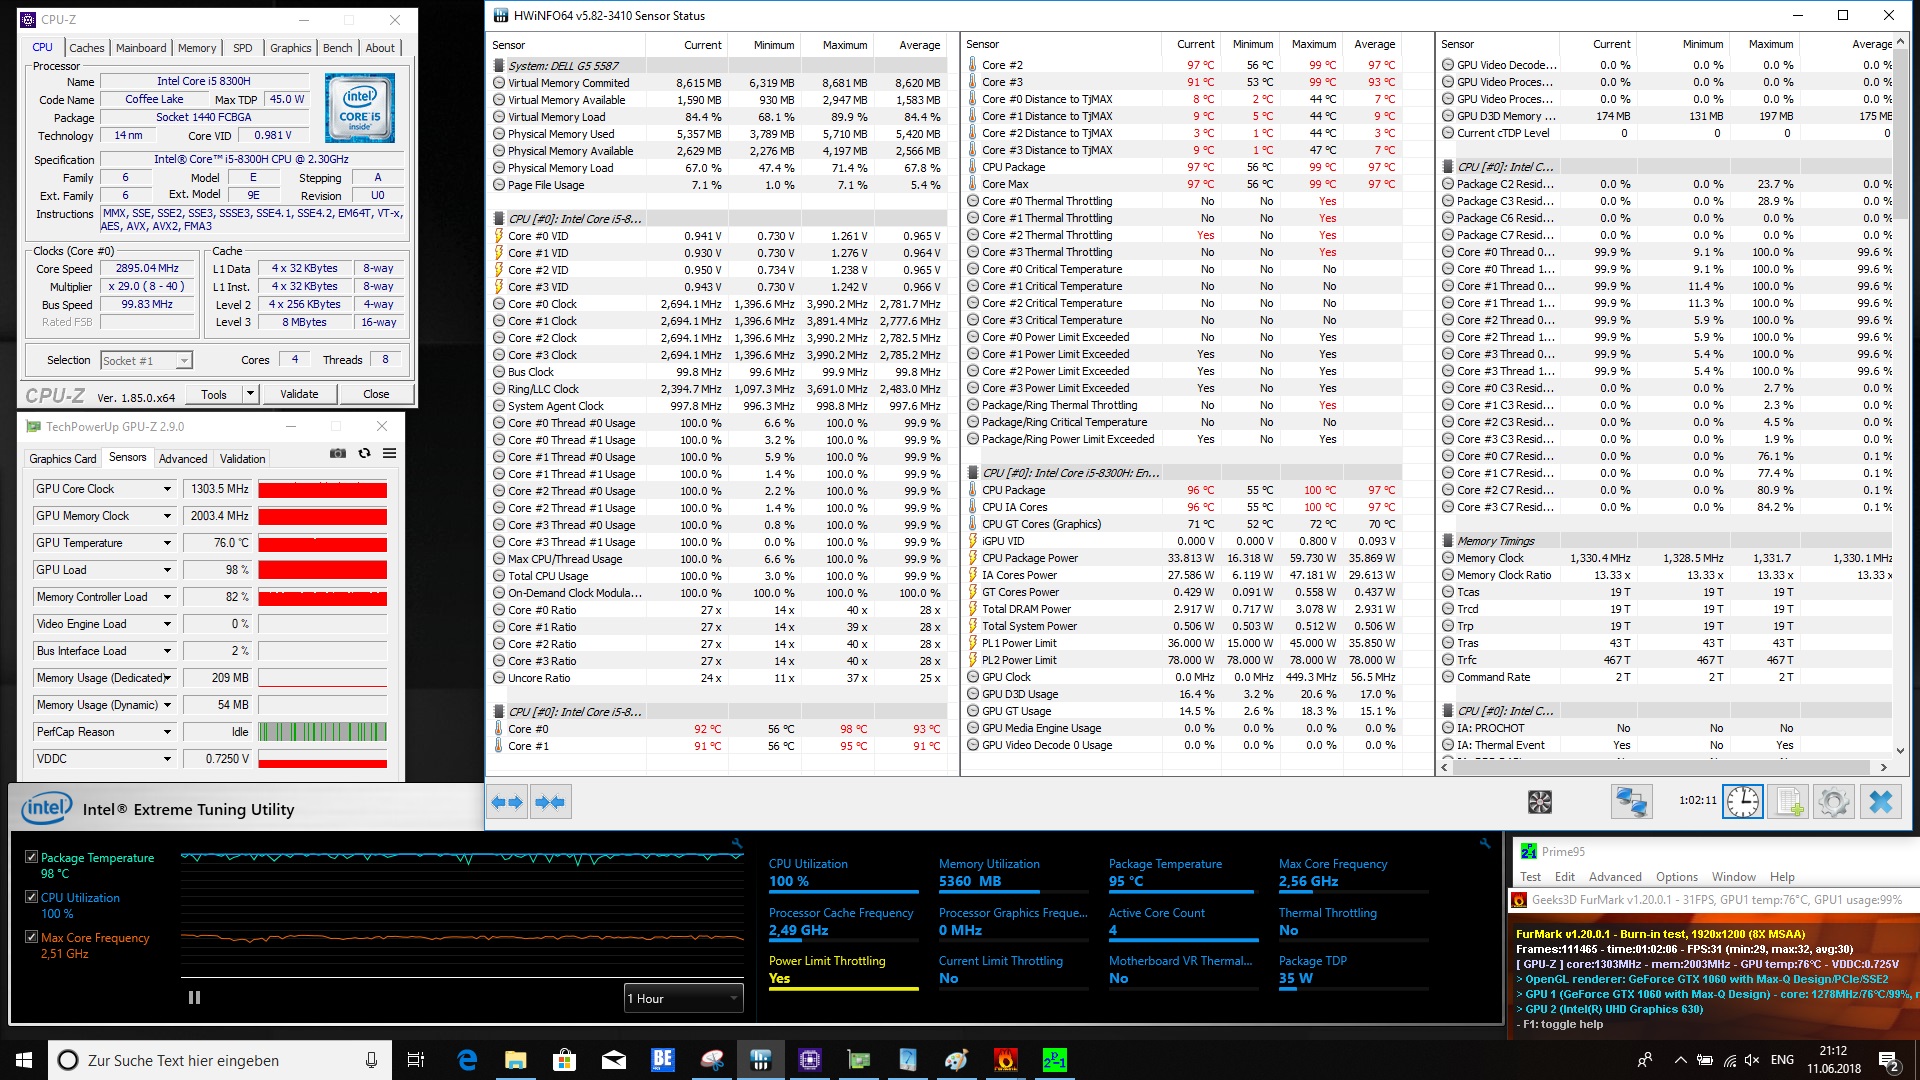
Sıcaklık üretimine bakacak olursanız, sınırlarına çabuk ulaştığını görmek mümkün. Ama işlemci takılmaları sistemi çok etkilemiyor.
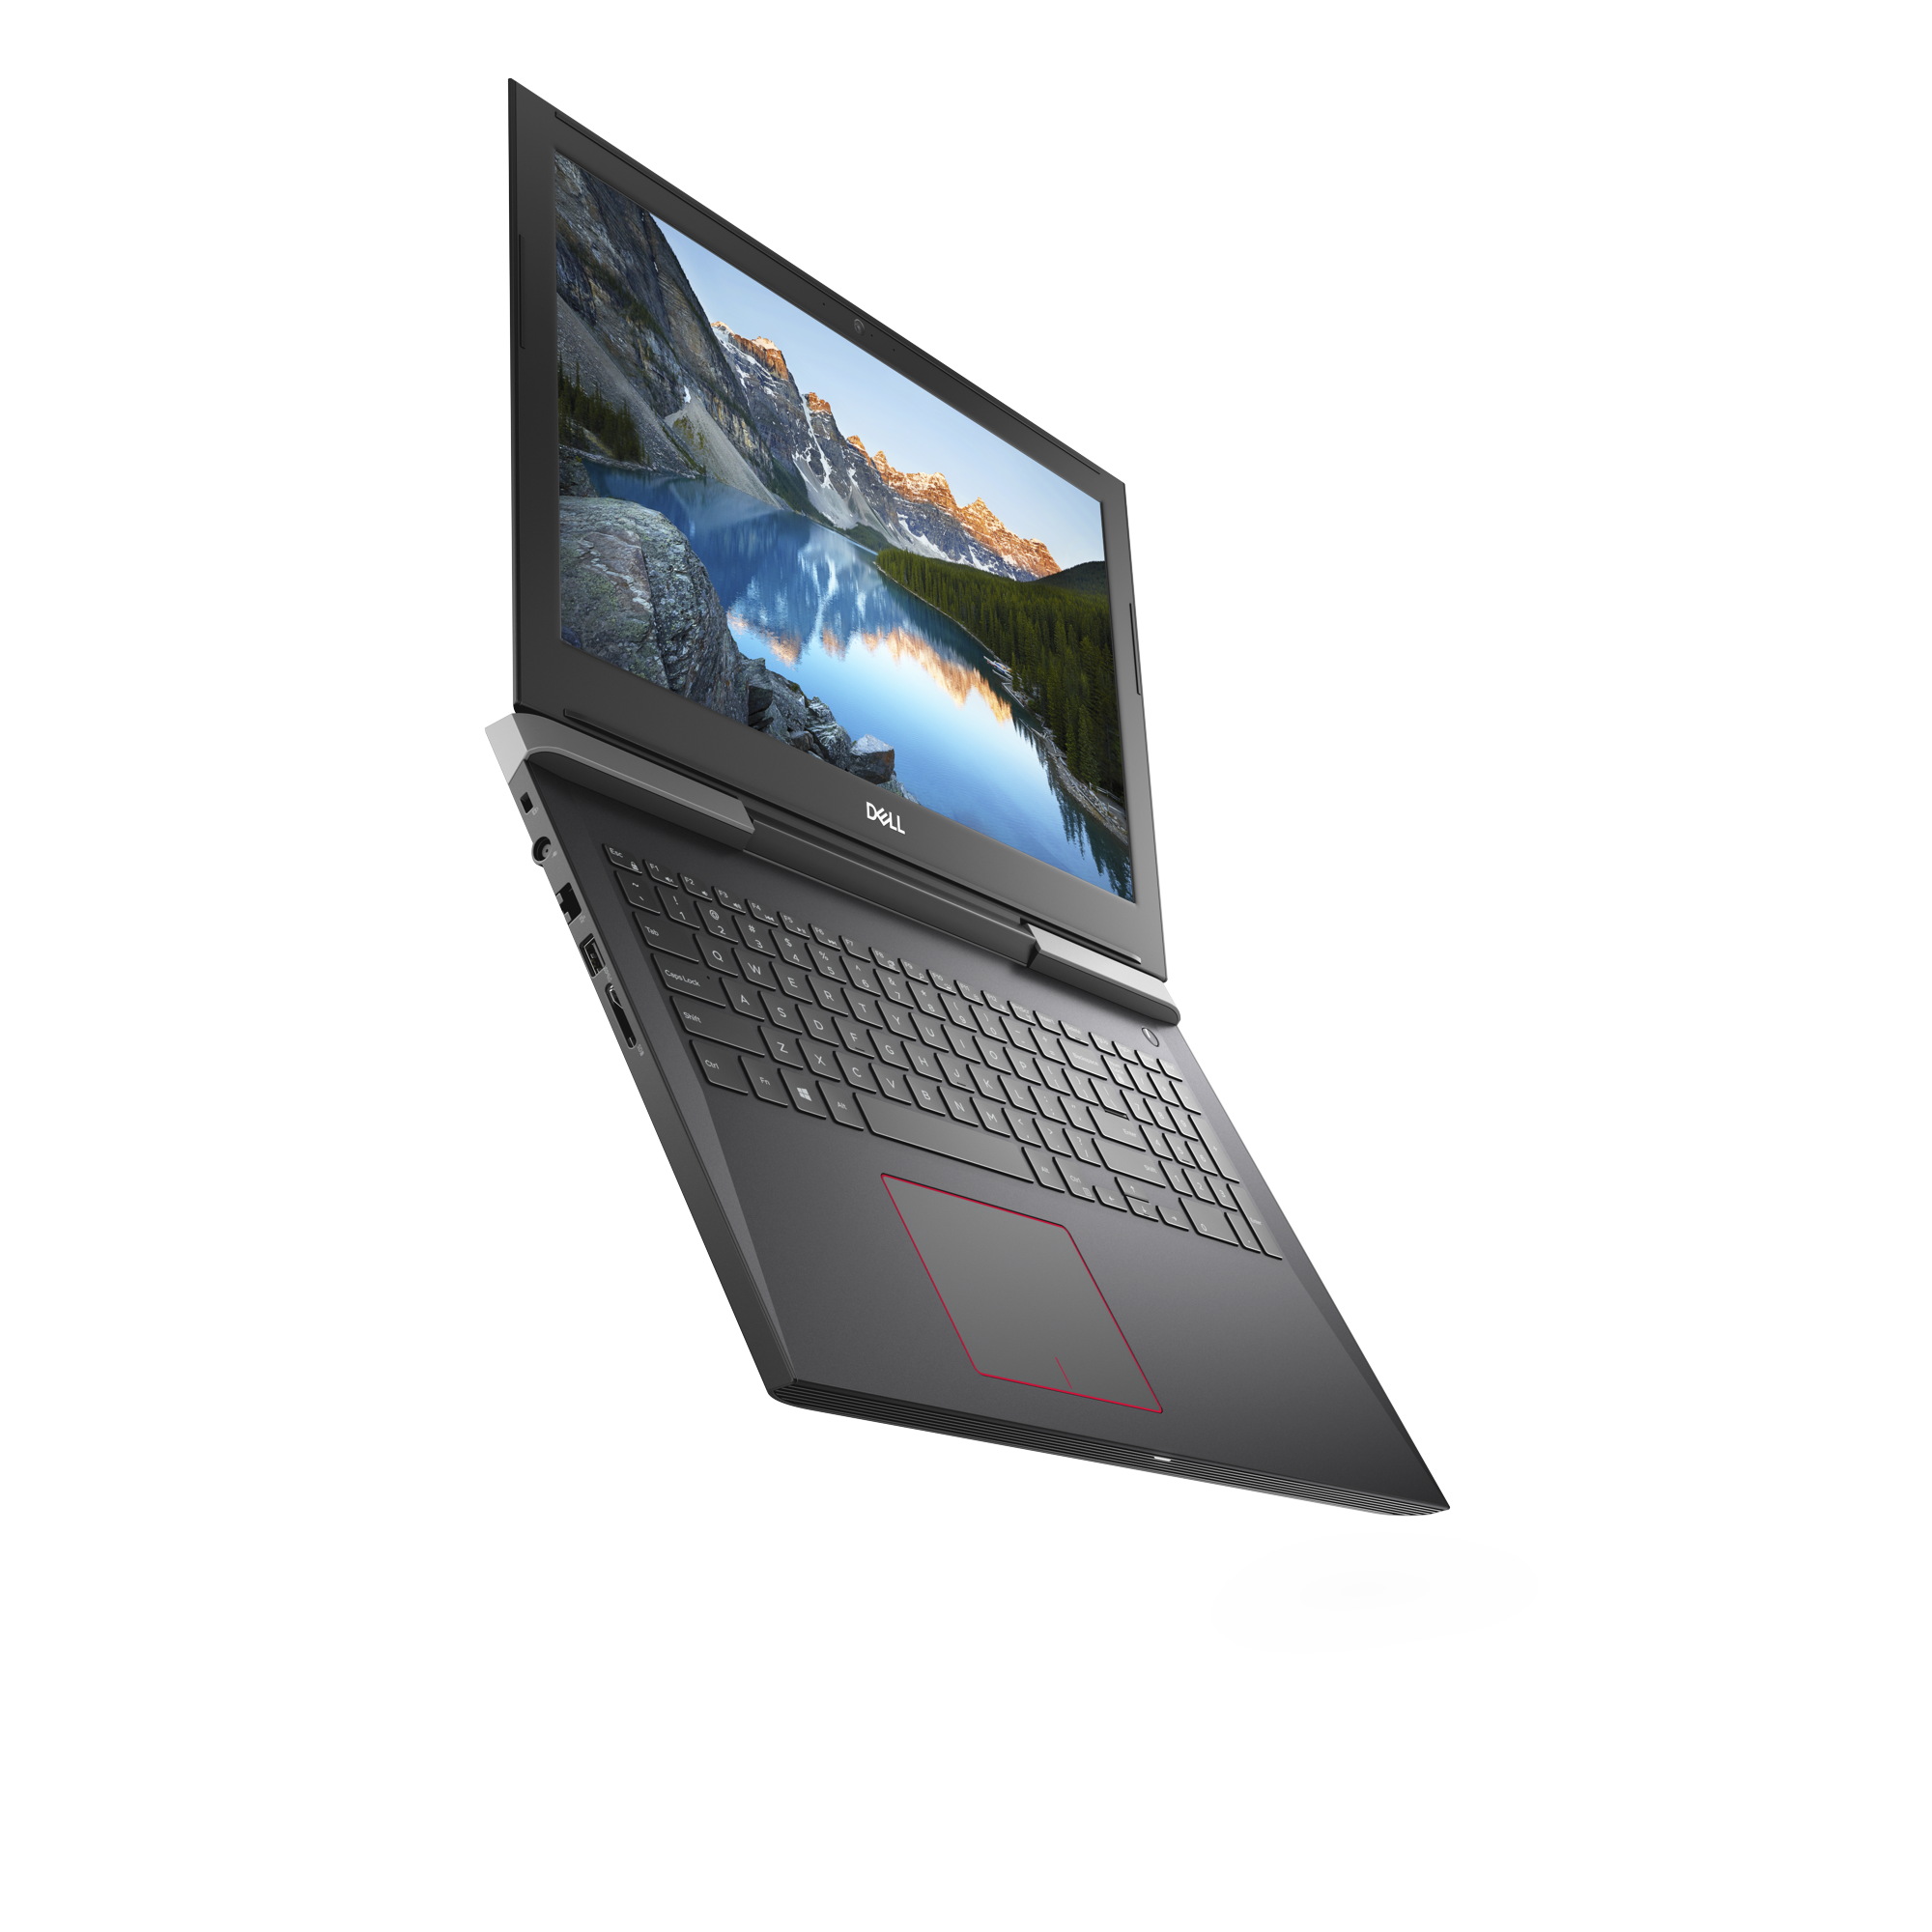
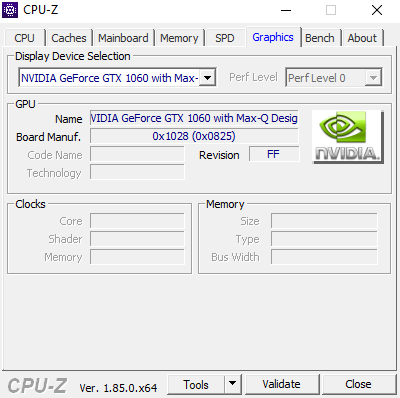
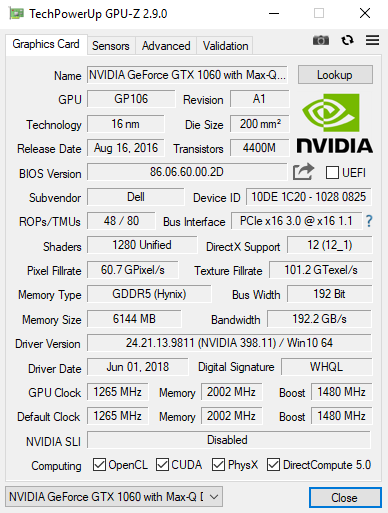
Nvidia GeForce GTX 1060 Max-Q ile mevcut tüm oyunları yüksek çözünürlüklerde oynayacak yeterli performansı sunuyor.
Dell G5 15 5587 modern bir işlemci ile hızlı grafik kartını ilgi çekici bir fiyata sunan iyi donanımlı bir oyun cihazı.
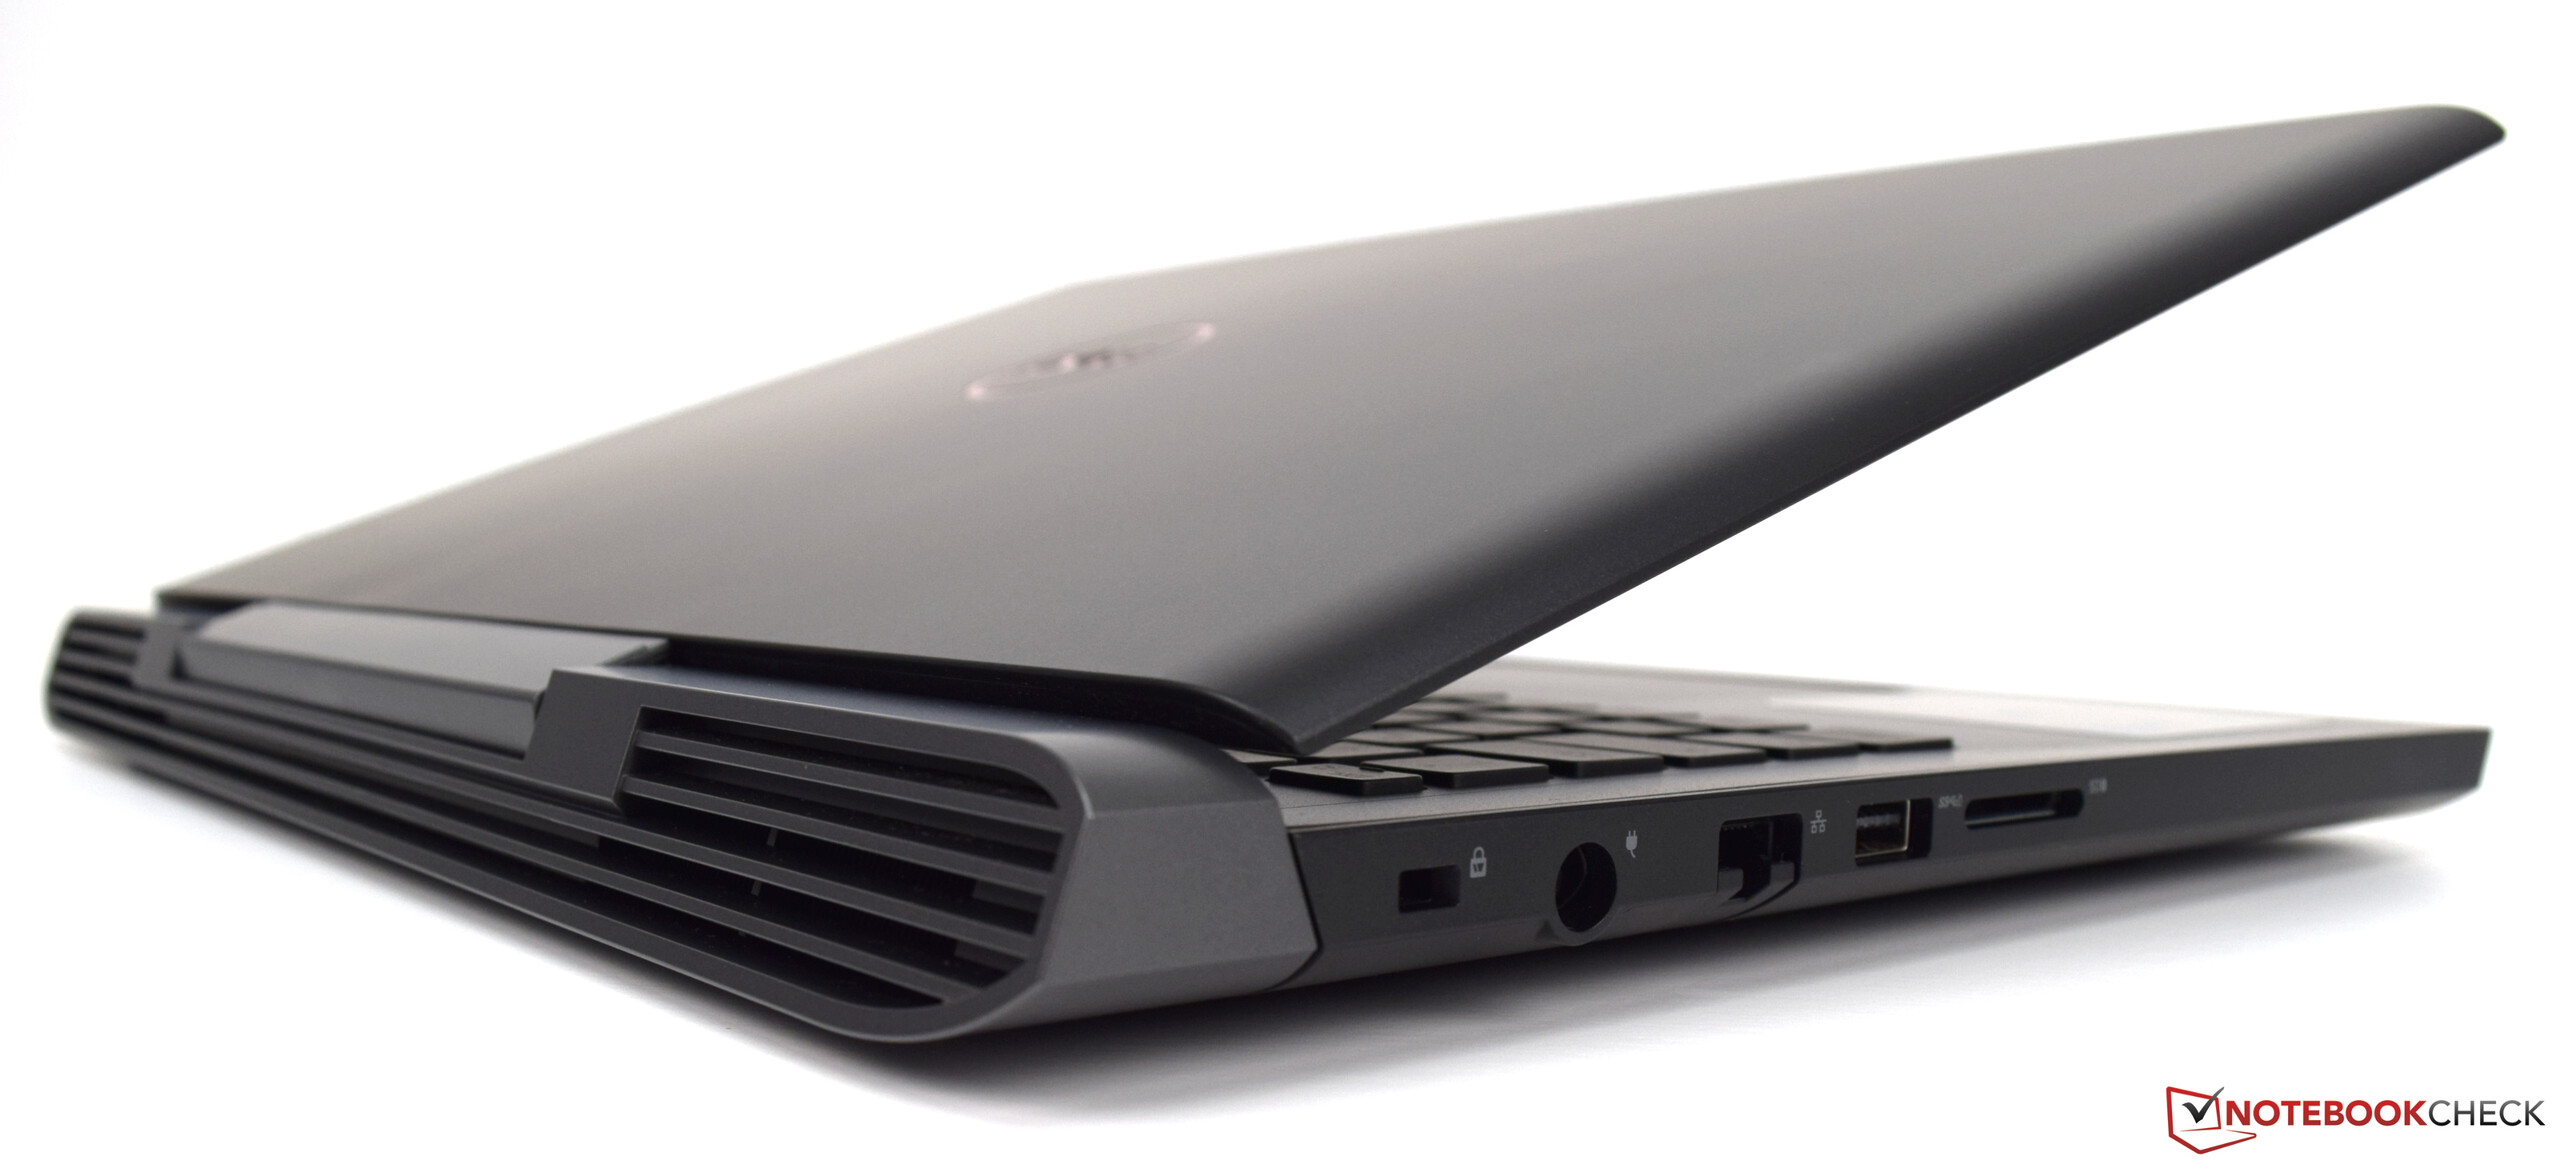
Ekran bizi tam manasıyla tatmin edememiş olsa da, pozitif yönleri de mevcut. Ama mat bir yüzey kullanmak her daim daha iyi. Cihazımızda kontrast ve parlaklık yönünden eksiklik vardı. Kart okuyucu yönünden ise USB 2.0 bağlantının ne kadar güncel olduğunun sorgulanması gerekli.
Ses yönünden biraz daha iyisini beklerdik, bu haliyle bir oyun cihazı için yeterli değil. Harici bir subwoofer güzel olabilirdi. Bir diğer nokta da 15.6 inçlik cihazın 3kglik ağırlığı.
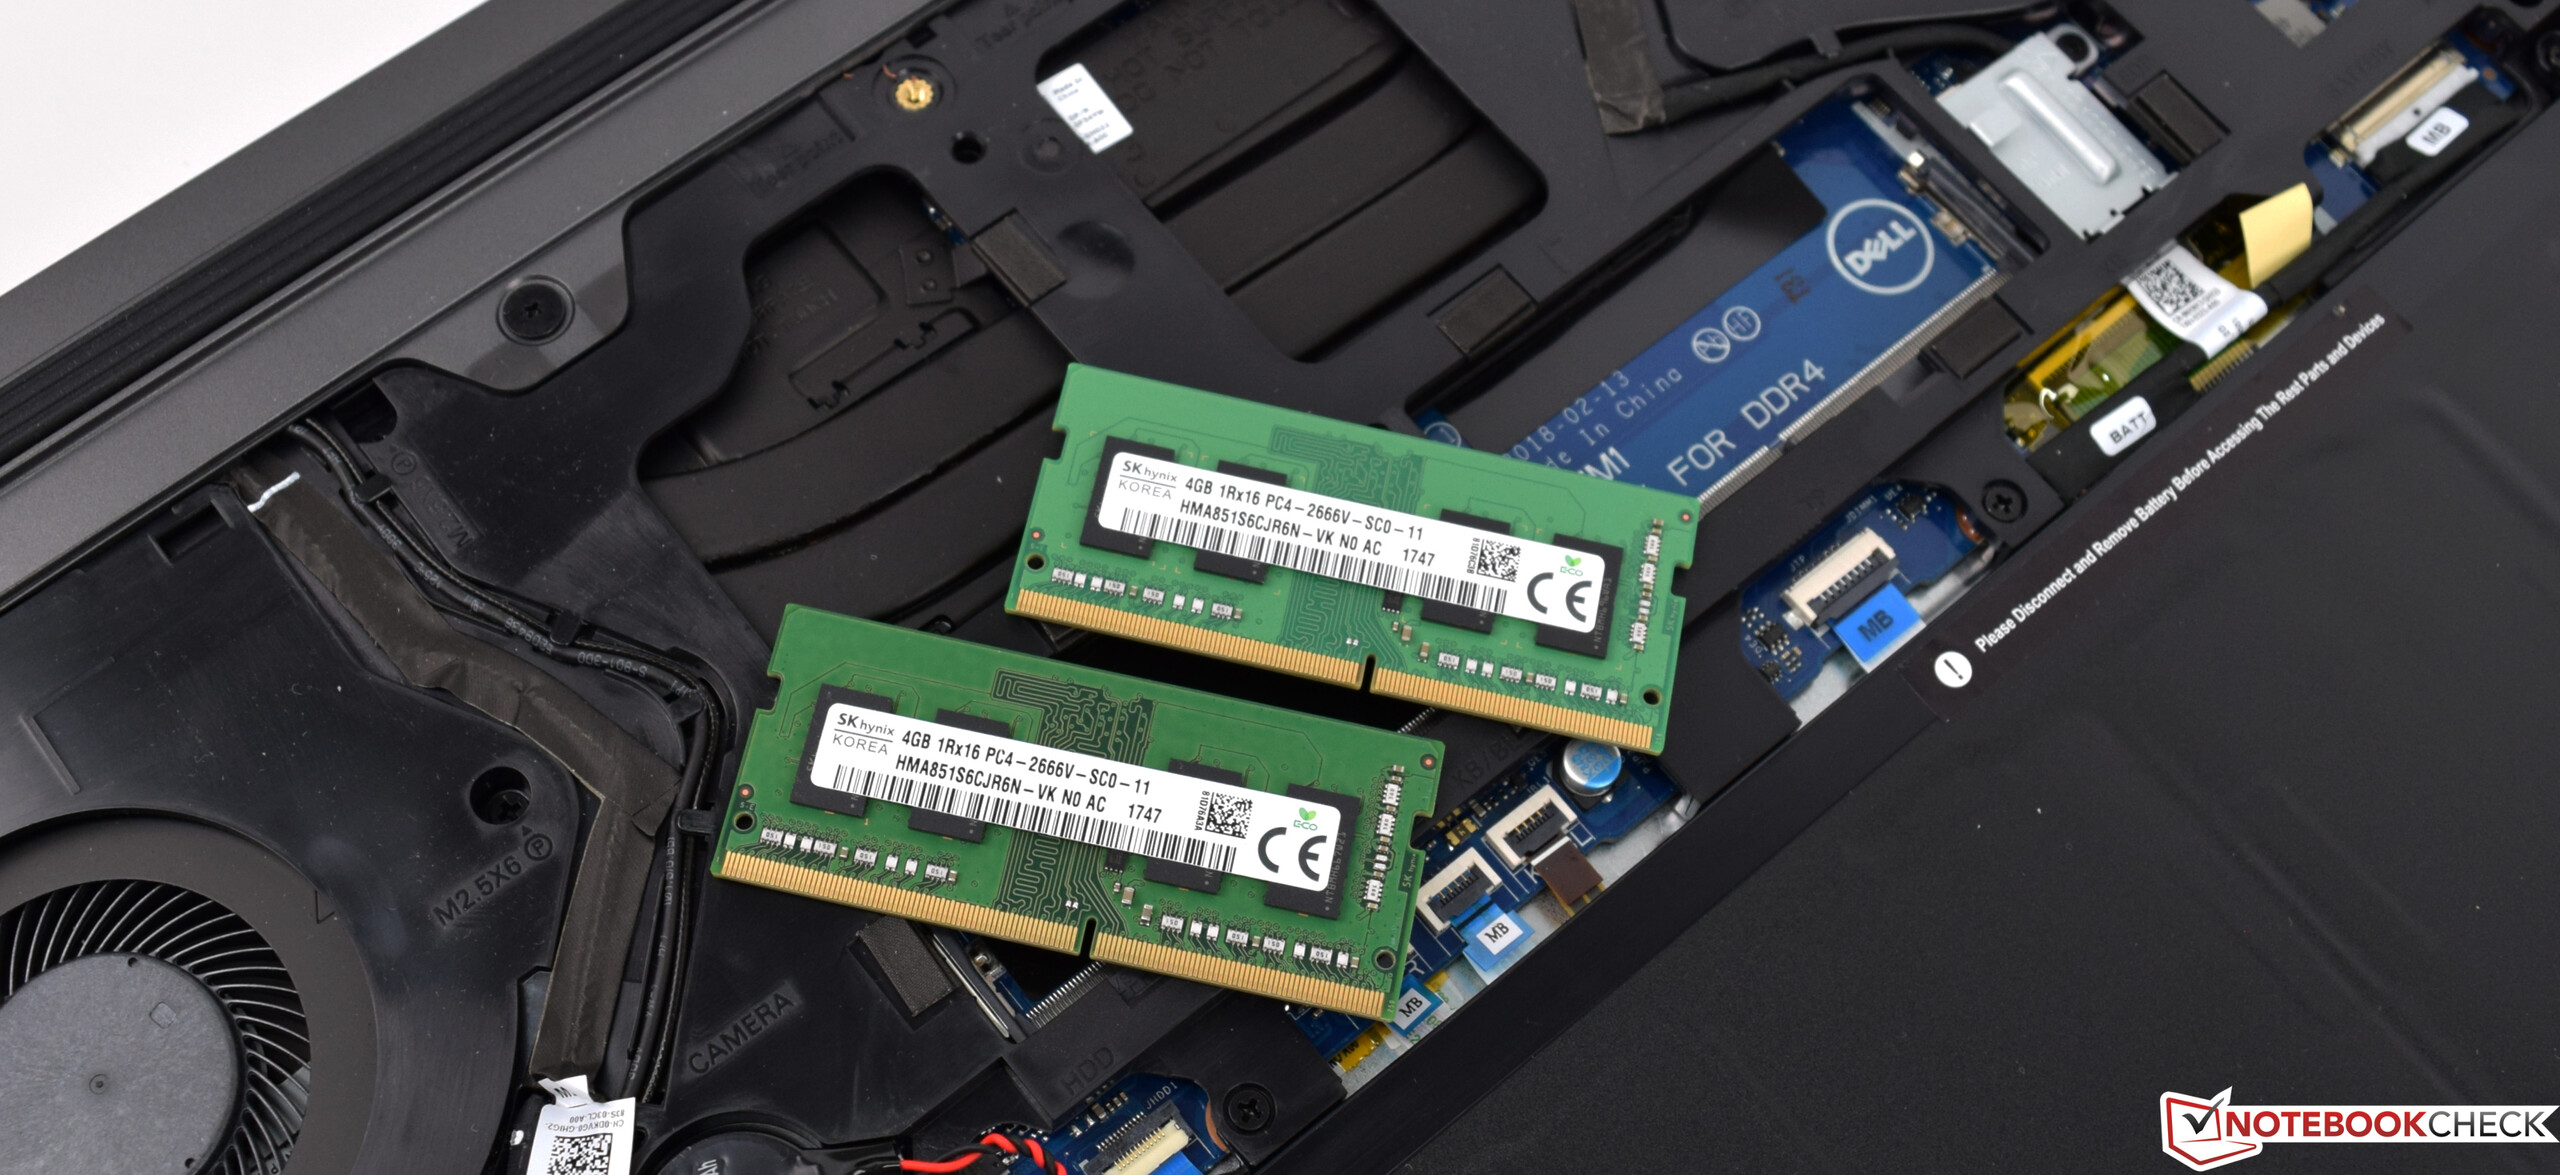
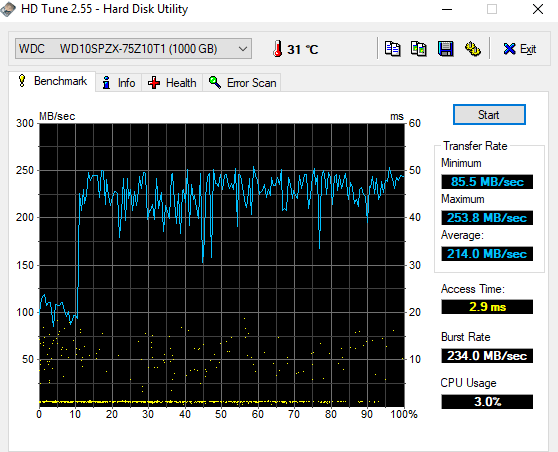
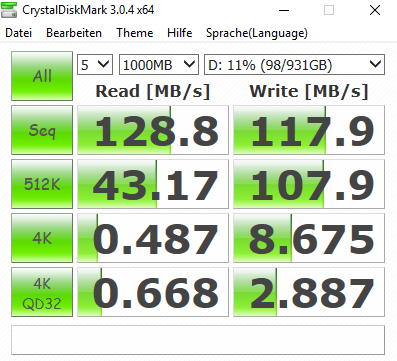
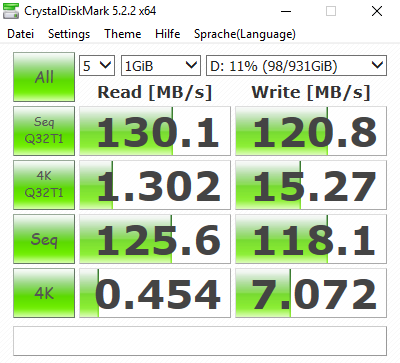
Depolama alanı başlangıçta yeterli olsa da, daha geniş bir SSD depolama alanını tavsiye etmeden geçemiyoruz.
Yazının orjinali için tıklayın.
Dell G5 15 5587
- 06/21/2018 v6 (old)
Sebastian Bade