Kısa inceleme: Dell Latitude 12 E7270 Notebook
| Networking | |
| iperf Server (receive) TCP 1 m 512KB | |
| Dell Latitude 12 E7270 | |
| Dell Latitude 13 7370 | |
| Lenovo ThinkPad X260-20F6007RGE | |
| iperf Client (transmit) TCP 1 m 512KB | |
| Lenovo ThinkPad X260-20F6007RGE | |
| Dell Latitude 13 7370 | |
| Dell Latitude 12 E7270 | |
| |||||||||||||||||||||||||
Aydınlatma: 91 %
Batarya modunda parlaklık: 354 cd/m²
Kontrast: 751:1 (Siyah: 0.47 cd/m²)
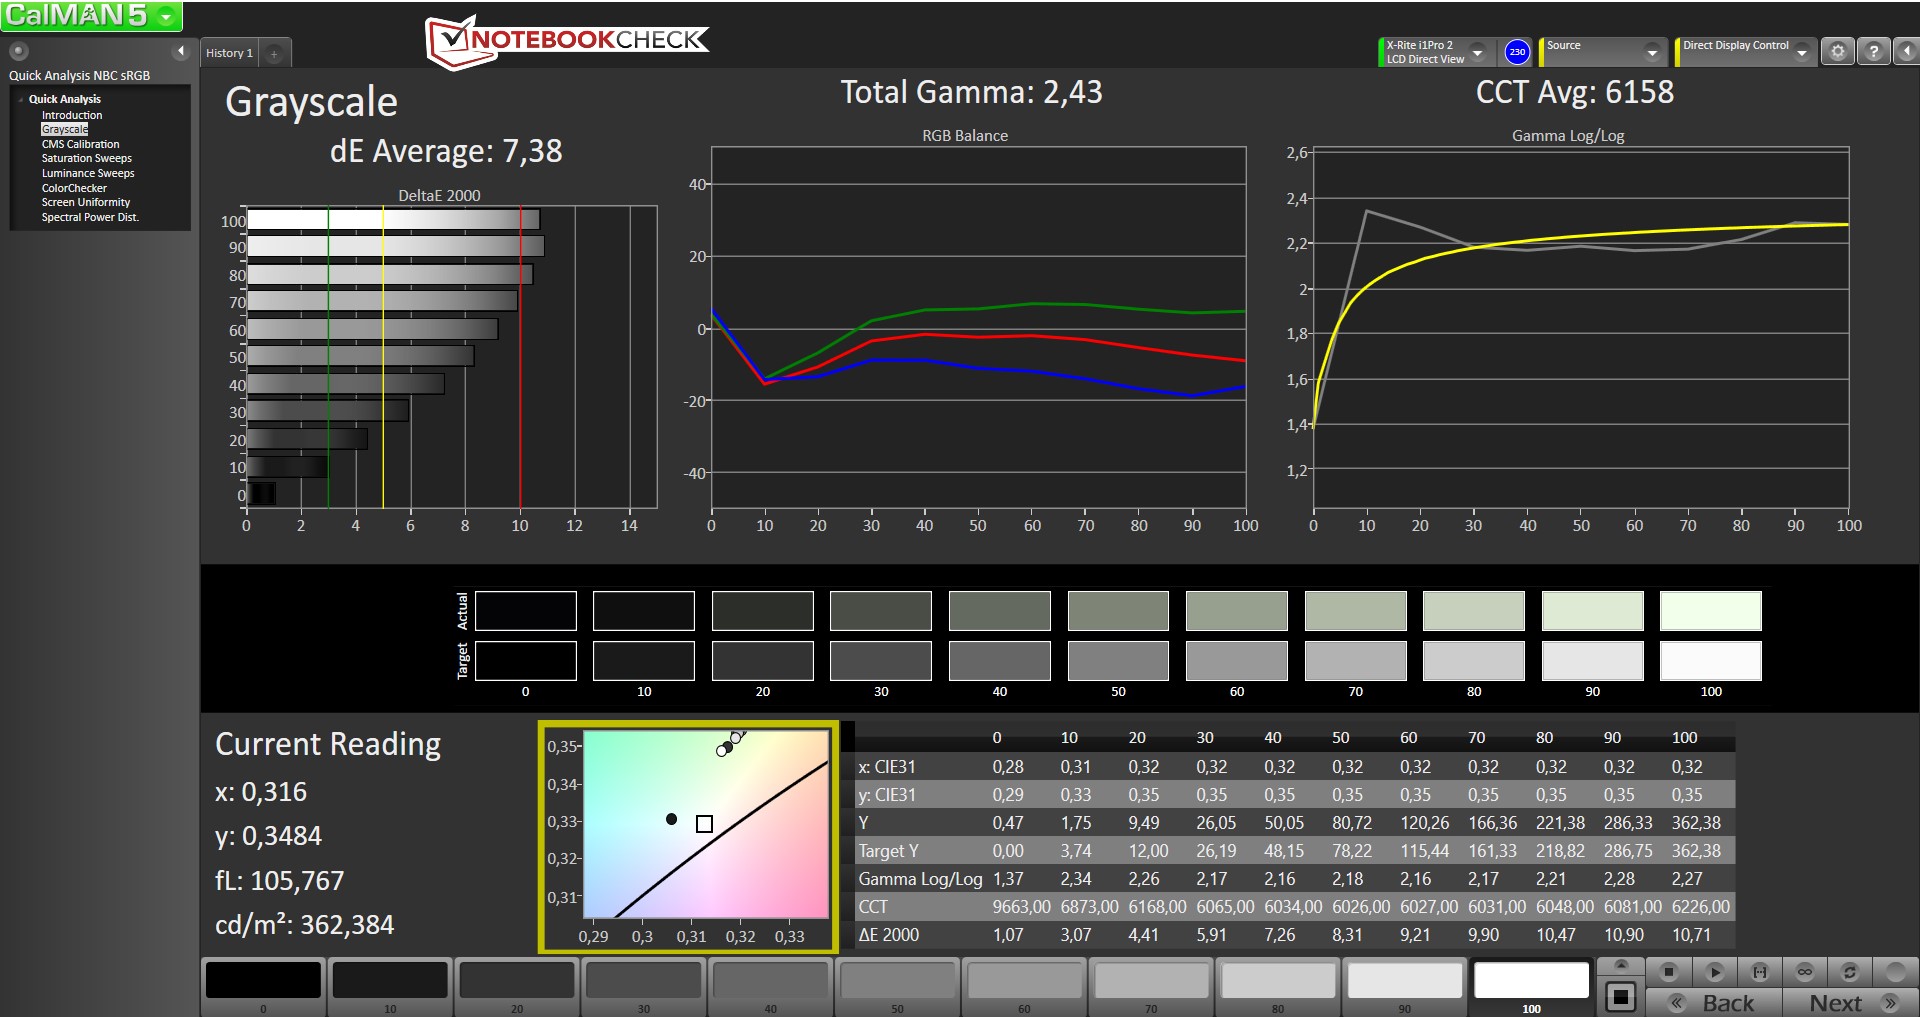
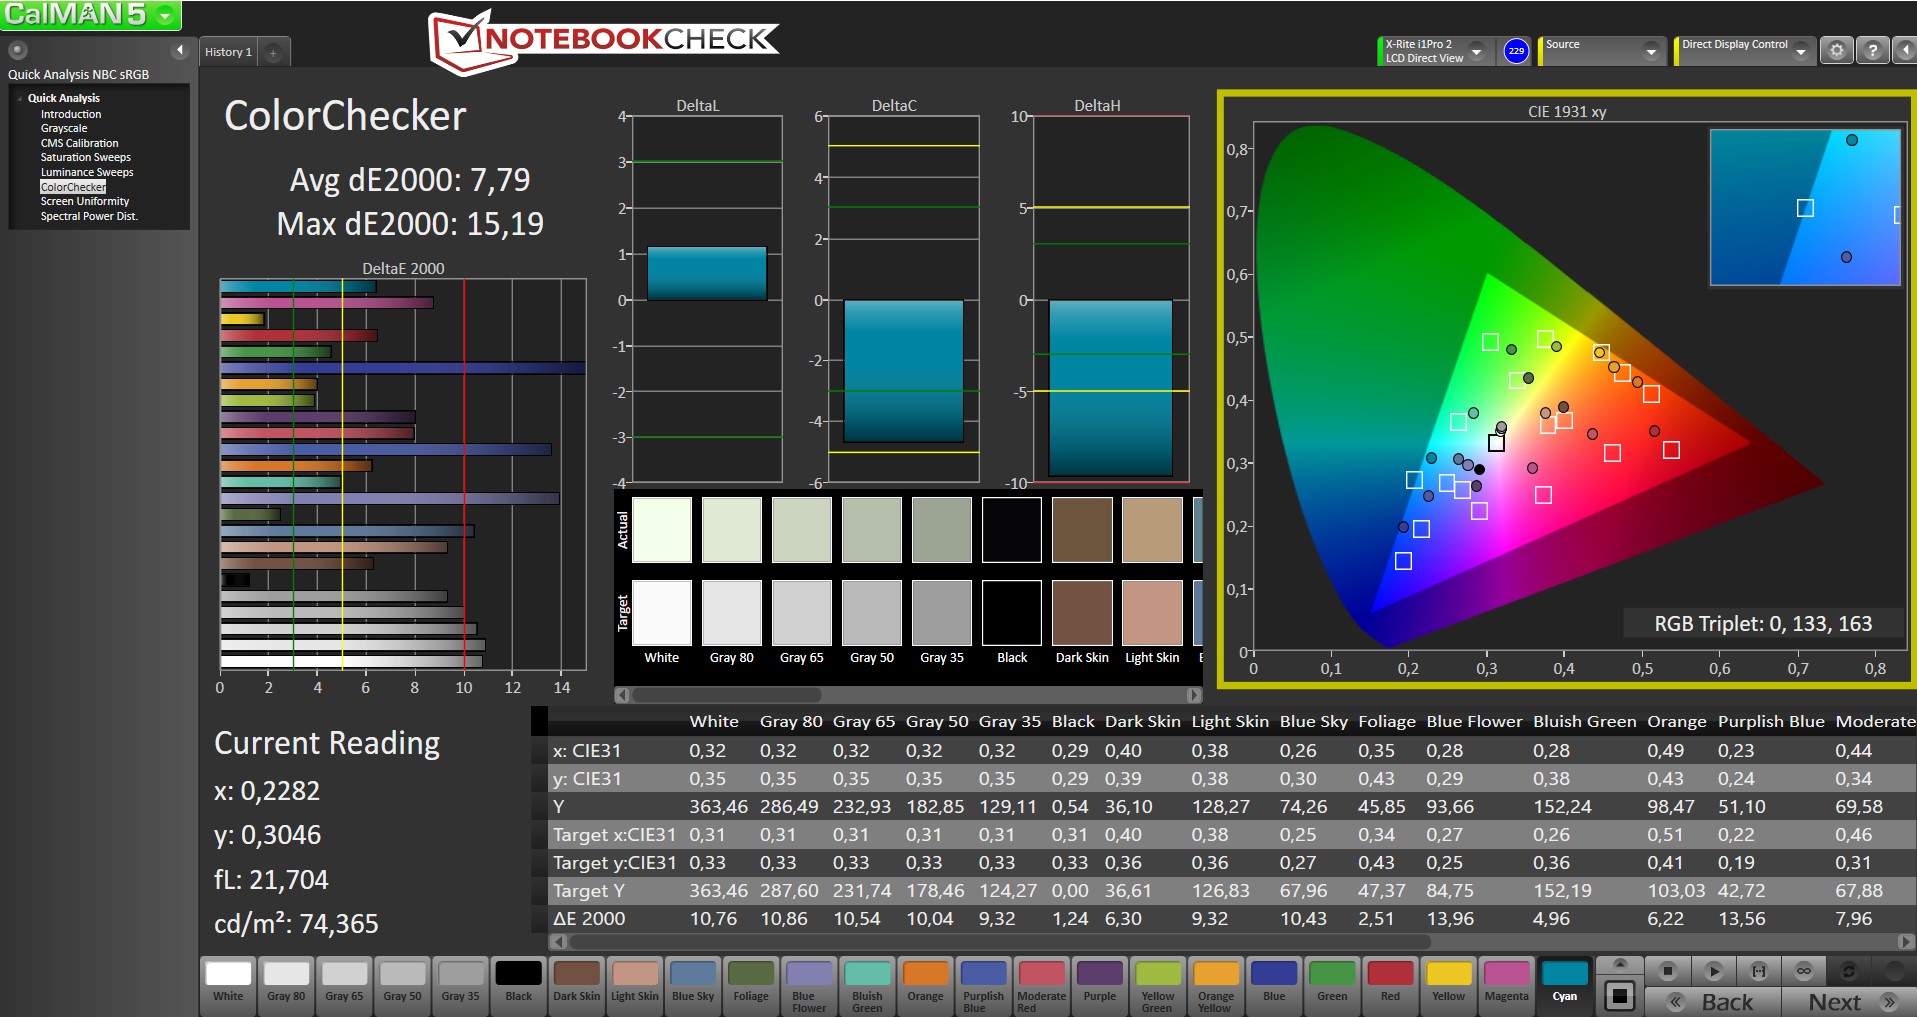
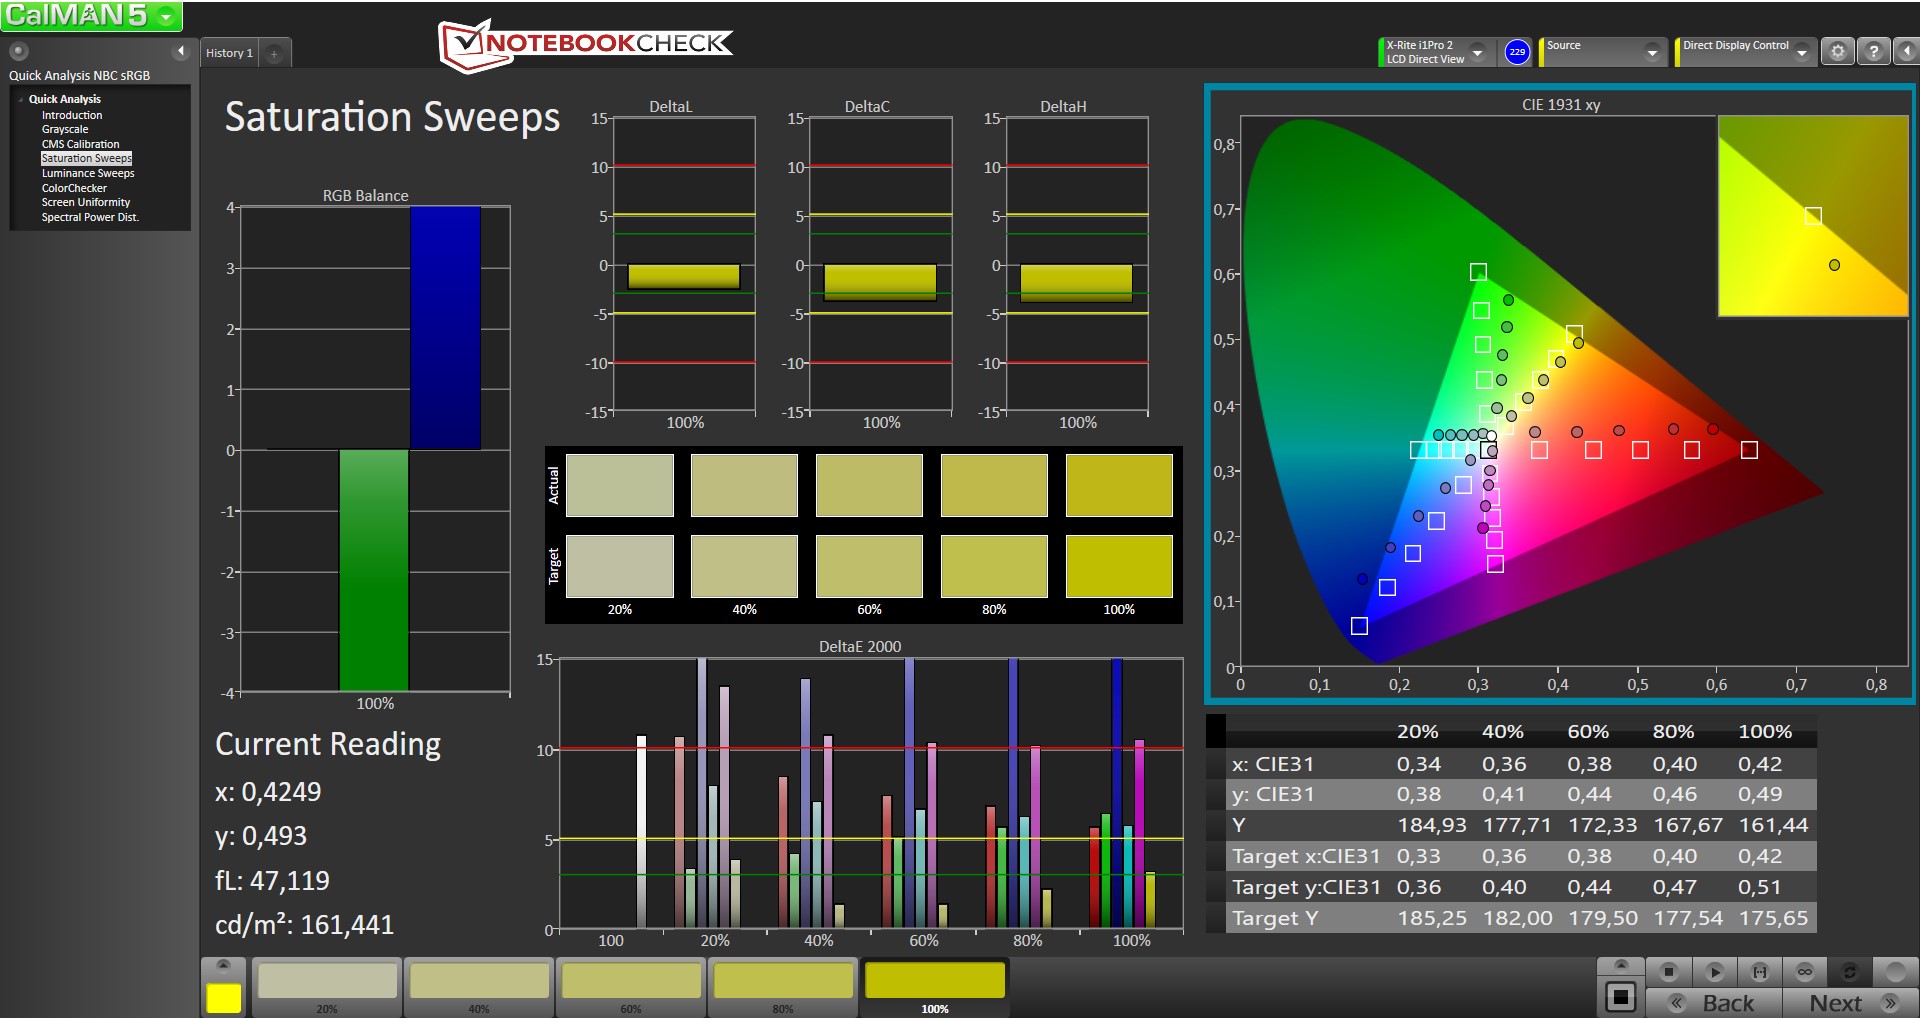
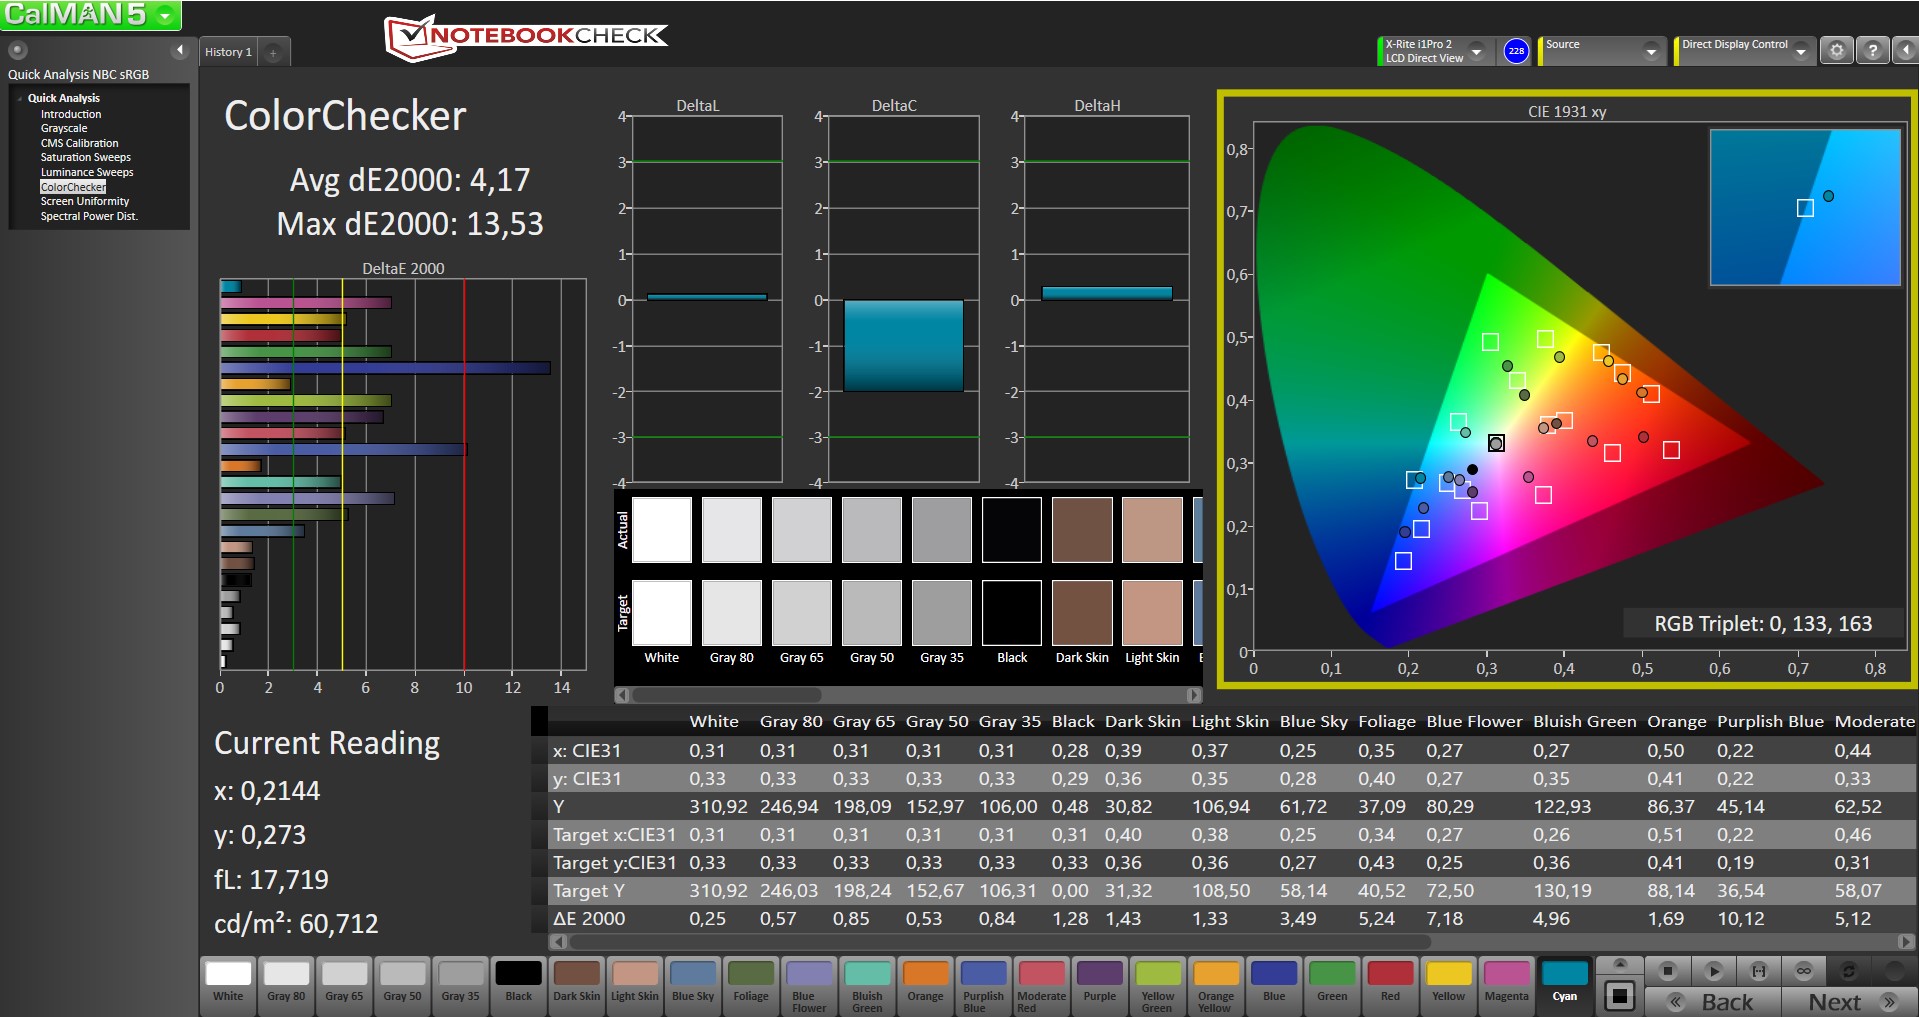
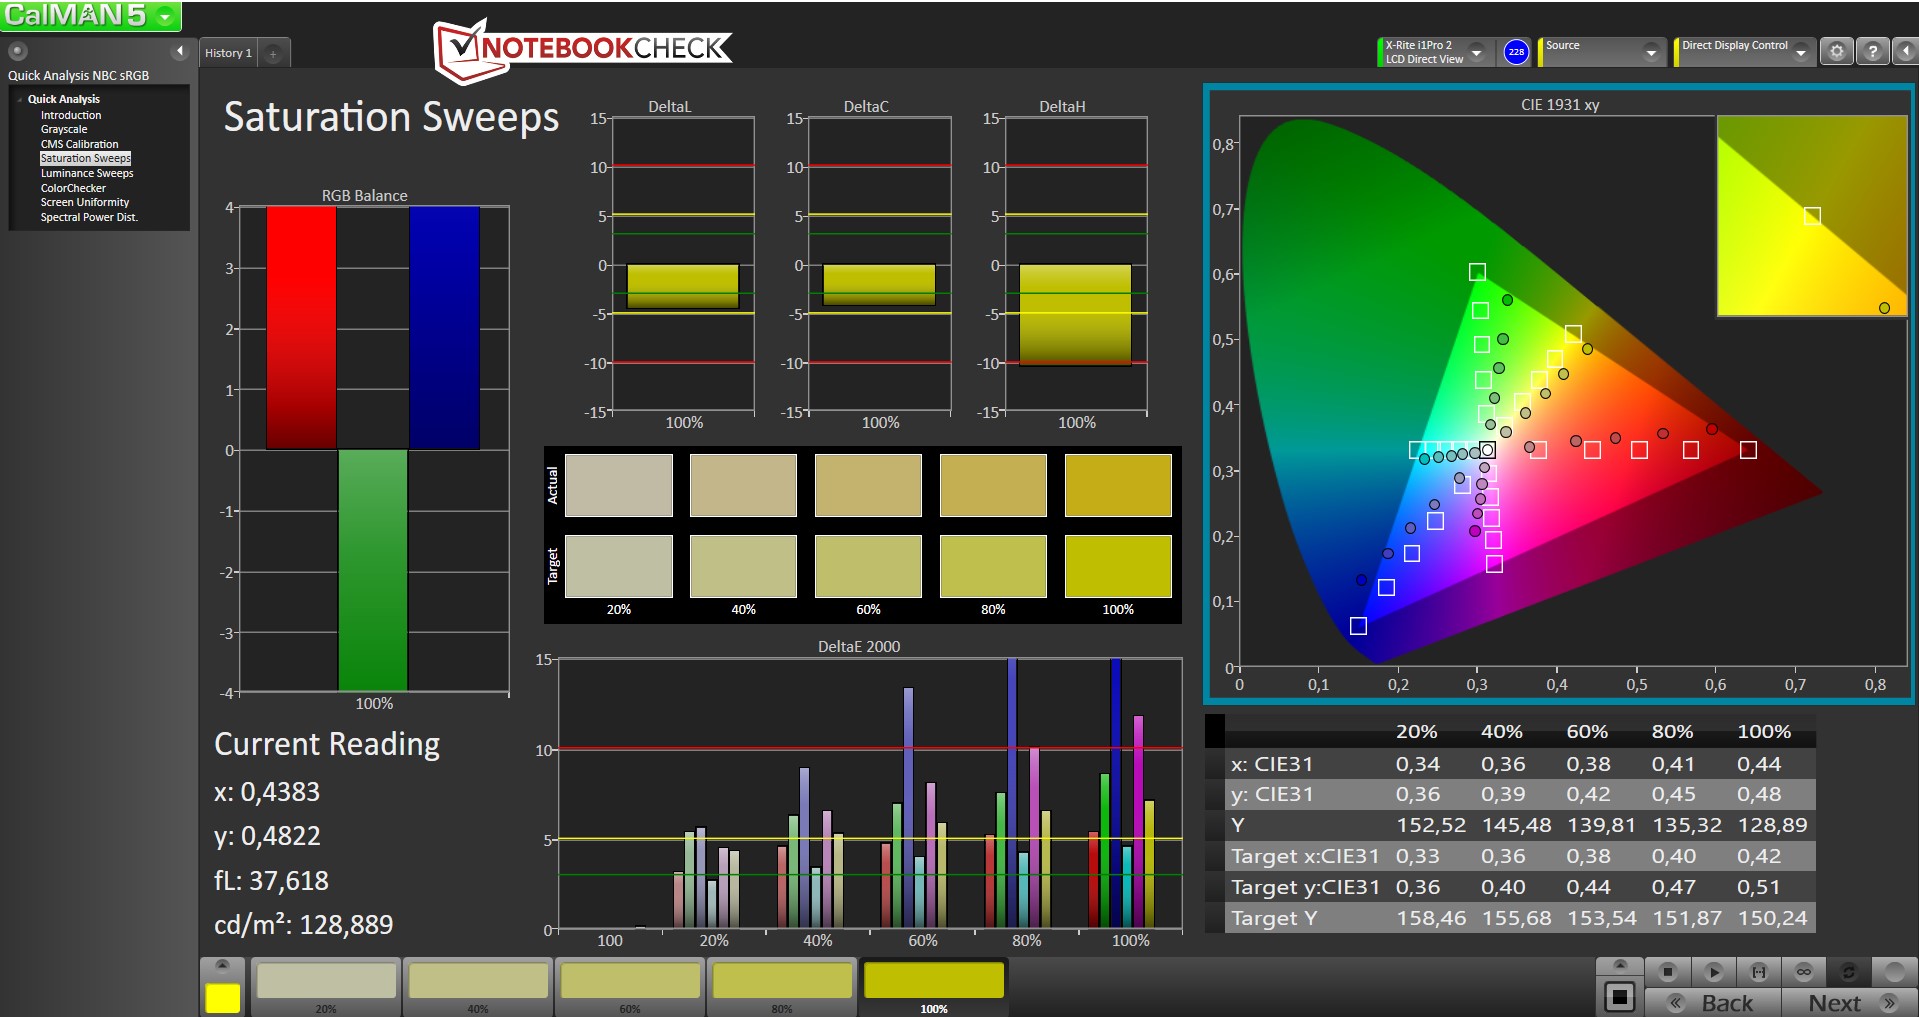
ΔE ColorChecker Calman: 7.79 | ∀{0.5-29.43 Ø4.73}
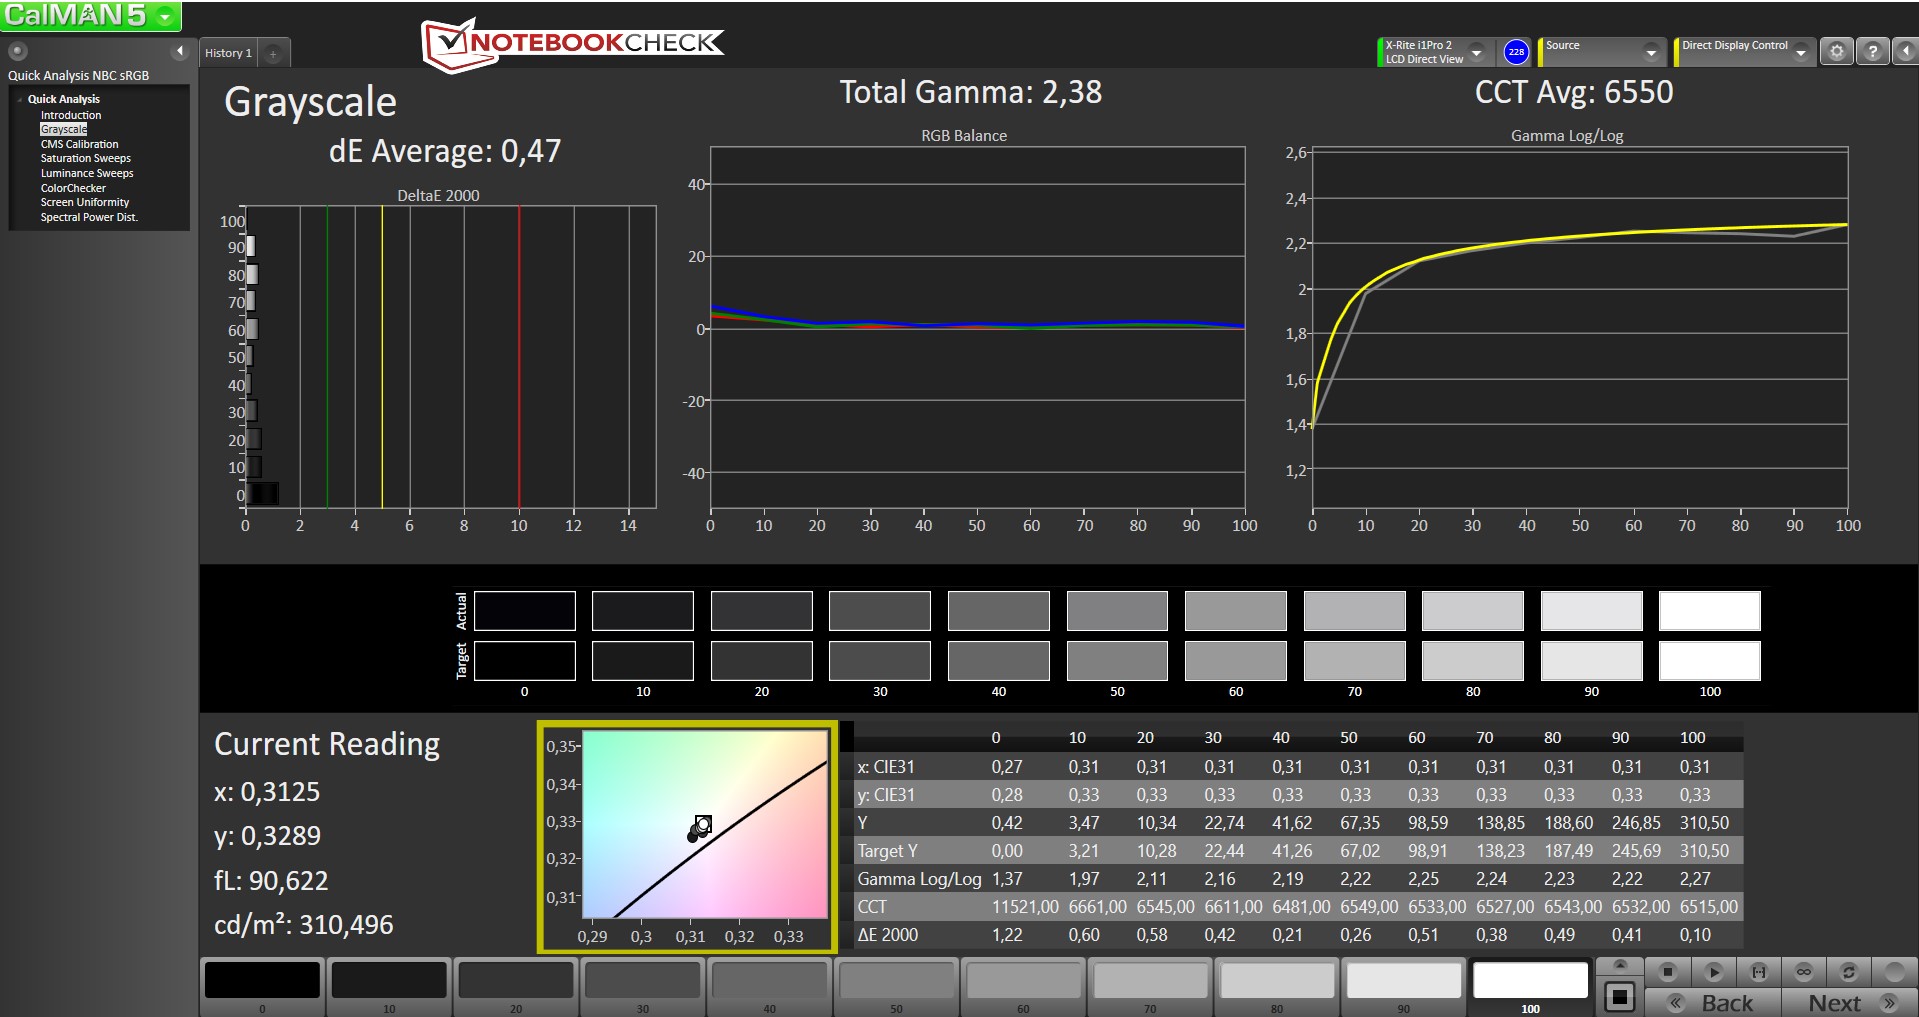
ΔE Greyscale Calman: 7.38 | ∀{0.09-98 Ø4.97}
58.87% sRGB (Argyll 1.6.3 3D)
37.72% AdobeRGB 1998 (Argyll 1.6.3 3D)
41.07% AdobeRGB 1998 (Argyll 3D)
59.2% sRGB (Argyll 3D)
39.7% Display P3 (Argyll 3D)
Gamma: 2.43
CCT: 6158 K
| Dell Latitude 12 E7270 IPS LED, 1920x1080 | Lenovo ThinkPad X260-20F6007RGE IPS, 1920x1080 | HP EliteBook 820 G3 TN LED, 1366x768 | Dell Latitude 13 7370 IPS, 1920x1080 | Dell XPS 13 9350 WQXGA IPS, 3200x1800 | |
|---|---|---|---|---|---|
| Display | 13% | -2% | 31% | 58% | |
| Display P3 Coverage (%) | 39.7 | 44.71 13% | 38.9 -2% | 52.2 31% | 63.6 60% |
| sRGB Coverage (%) | 59.2 | 66.1 12% | 58.5 -1% | 78.3 32% | 92.3 56% |
| AdobeRGB 1998 Coverage (%) | 41.07 | 46.23 13% | 40.2 -2% | 53.9 31% | 65.4 59% |
| Response Times | 11% | -26% | -24% | -18% | |
| Response Time Grey 50% / Grey 80% * (ms) | 38.4 ? | 32.8 ? 15% | 58 ? -51% | 50.4 ? -31% | 50.8 ? -32% |
| Response Time Black / White * (ms) | 28.8 ? | 27.2 ? 6% | 29.2 ? -1% | 33.6 ? -17% | 29.6 ? -3% |
| PWM Frequency (Hz) | |||||
| Screen | 14% | -19% | 19% | 37% | |
| Brightness middle (cd/m²) | 353 | 337 -5% | 244 -31% | 261 -26% | 307.5 -13% |
| Brightness (cd/m²) | 334 | 322 -4% | 240 -28% | 241 -28% | 297 -11% |
| Brightness Distribution (%) | 91 | 91 0% | 84 -8% | 85 -7% | 92 1% |
| Black Level * (cd/m²) | 0.47 | 0.32 32% | 0.6 -28% | 0.26 45% | 0.207 56% |
| Contrast (:1) | 751 | 1053 40% | 407 -46% | 1004 34% | 1486 98% |
| Colorchecker dE 2000 * | 7.79 | 5.71 27% | 9 -16% | 4.3 45% | 4.18 46% |
| Colorchecker dE 2000 max. * | 15.19 | 15.39 -1% | 15.73 -4% | 8.66 43% | 7.84 48% |
| Greyscale dE 2000 * | 7.38 | 5.15 30% | 9.48 -28% | 5.82 21% | 4.94 33% |
| Gamma | 2.43 91% | 2.38 92% | 2.44 90% | 2.44 90% | 2.31 95% |
| CCT | 6158 106% | 6881 94% | 11116 58% | 6771 96% | 7645 85% |
| Color Space (Percent of AdobeRGB 1998) (%) | 37.72 | 42.38 12% | 37.18 -1% | 49.18 30% | 59 56% |
| Color Space (Percent of sRGB) (%) | 58.87 | 65.62 11% | 58.63 0% | 77.84 32% | 92 56% |
| Toplam Ortalama (Program / Ayarlar) | 13% /
13% | -16% /
-16% | 9% /
16% | 26% /
34% |
* ... daha küçük daha iyidir
Yanıt Sürelerini Görüntüle
| ↔ Tepki Süresi Siyahtan Beyaza | ||
|---|---|---|
| 28.8 ms ... yükseliş ↗ ve sonbahar↘ birleşimi | ↗ 10.8 ms yükseliş | 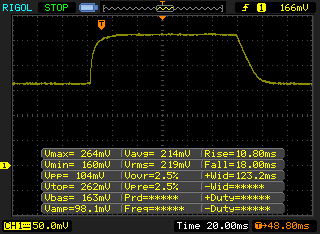 |
| ↘ 18 ms sonbahar | ||
| Ekran, testlerimizde nispeten yavaş yanıt oranları gösteriyor ve oyuncular için çok yavaş olabilir. Karşılaştırıldığında, test edilen tüm cihazlar 0.1 (minimum) ile 240 (maksimum) ms arasında değişir. » Tüm cihazların 76 %'si daha iyi. Bu, ölçülen yanıt süresinin test edilen tüm cihazların ortalamasından (19.9 ms) daha kötü olduğu anlamına gelir. | ||
| ↔ Tepki Süresi %50 Griden %80 Griye | ||
| 38.4 ms ... yükseliş ↗ ve sonbahar↘ birleşimi | ↗ 17.2 ms yükseliş | 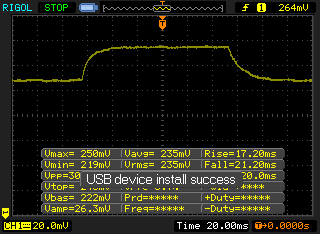 |
| ↘ 21.2 ms sonbahar | ||
| Ekran, testlerimizde yavaş yanıt oranları gösteriyor ve oyuncular için yetersiz olacaktır. Karşılaştırıldığında, test edilen tüm cihazlar 0.165 (minimum) ile 636 (maksimum) ms arasında değişir. » Tüm cihazların 57 %'si daha iyi. Bu, ölçülen yanıt süresinin test edilen tüm cihazların ortalamasından (31.1 ms) daha kötü olduğu anlamına gelir. | ||
Ekran Titremesi / PWM (Darbe Genişliği Modülasyonu)
| Ekran titriyor / PWM algılanmadı | ||
Karşılaştırıldığında: Test edilen tüm cihazların %52 %'si ekranı karartmak için PWM kullanmıyor. PWM tespit edilirse, ortalama 7801 (minimum: 5 - maksimum: 343500) Hz ölçüldü. | ||
| PCMark 8 Home Score Accelerated v2 | 3420 puan | |
| PCMark 8 Work Score Accelerated v2 | 4395 puan | |
Yardım | ||
| CrystalDiskMark 3.0 | |
| Write 4k | |
| Samsung SM951 MZVPV256HDGL m.2 PCI-e | |
| Liteon L8H-256V2G | |
| Liteonit LCH-512V2S | |
| Read 4k | |
| Samsung SM951 MZVPV256HDGL m.2 PCI-e | |
| Liteonit LCH-512V2S | |
| Liteon L8H-256V2G | |

| 3DMark - 1280x720 Cloud Gate Standard Score | |
| Dell XPS 13 9350 WQXGA | |
| Lenovo ThinkPad X260-20F6007RGE | |
| Dell Latitude 12 E7270 | |
| HP EliteBook 820 G3 | |
| Dell Latitude 12 E7250 | |
| Dell Latitude 13 7370 | |
| 3DMark 11 - 1280x720 Performance | |
| Dell XPS 13 9350 WQXGA | |
| Dell Latitude 12 E7270 | |
| HP EliteBook 820 G3 | |
| Lenovo ThinkPad X260-20F6007RGE | |
| Dell Latitude 13 7370 | |
| Dell Latitude 12 E7250 | |
| 3DMark 11 Performance | 1433 puan | |
| 3DMark Ice Storm Standard Score | 47956 puan | |
| 3DMark Cloud Gate Standard Score | 5250 puan | |
| 3DMark Fire Strike Score | 698 puan | |
Yardım | ||
| düşük | orta | yüksek | ultra | |
|---|---|---|---|---|
| BioShock Infinite (2013) | 38 | 25 | 19 | 5 |
| Battlefield 4 (2013) | 35 | 25 | 16 | 5 |
| Rise of the Tomb Raider (2016) | 14 | 9 | 5 |
Ses yüksekliği
| Boşta |
| 28.9 / 28.9 / 28.9 dB |
| Çalışırken |
| 31.3 / 37.6 dB |
 | ||
30 dB sessiz 40 dB(A) duyulabilirlik 50 dB(A) gürültülü |
||
min: | ||
(±) Üst taraftaki maksimum sıcaklık, 35.9 °C / 97 F ortalamasına kıyasla 44.3 °C / 112 F'dir. , Subnotebook sınıfı için 21.4 ile 59 °C arasında değişir.
(-) Alt kısım, 39.2 °C / 103 F ortalamasına kıyasla maksimum 52.6 °C / 127 F'ye kadar ısınır
(+) Boşta kullanımda, üst tarafın ortalama sıcaklığı 30.2 °C / 86 F olup, cihazın 30.8 °C / 87 F.
(+) Avuç içi dayanakları ve dokunmatik yüzey maksimum (32.8 °C / 91 F) cilt sıcaklığına ulaşıyor ve bu nedenle sıcak değil.
(-) Benzer cihazların avuç içi dayanağı alanının ortalama sıcaklığı 28.2 °C / 82.8 F (-4.6 °C / -8.2 F) idi.
| Kapalı / Bekleme modu | |
| Boşta | |
| Çalışırken |
|
Key:
min: | |
| Dell Latitude 12 E7270 55 Wh | Lenovo ThinkPad X260-20F6007RGE 46 Wh | HP Elitebook 820 G2-J8R58EA 46 Wh | Dell Latitude 12 E7250 52 Wh | Dell XPS 13 9350 WQXGA 56 Wh | Dell Latitude 13 7370 34 Wh | |
|---|---|---|---|---|---|---|
| Power Consumption | -2% | -5% | -23% | -41% | 0% | |
| Idle Minimum * (Watt) | 3.8 | 3.5 8% | 3.1 18% | 4.1 -8% | 7.2 -89% | 5 -32% |
| Idle Average * (Watt) | 6.7 | 5.5 18% | 5.8 13% | 8.3 -24% | 9.3 -39% | 7.5 -12% |
| Idle Maximum * (Watt) | 7.2 | 6.7 7% | 6.5 10% | 9.4 -31% | 11.6 -61% | 8 -11% |
| Load Average * (Watt) | 27.2 | 28.9 -6% | 30.5 -12% | 31.6 -16% | 31.9 -17% | 15.3 44% |
| Load Maximum * (Watt) | 30.2 | 42.1 -39% | 46.3 -53% | 40.4 -34% | 29.9 1% | 26.8 11% |
* ... daha küçük daha iyidir
| Battery Runtime - WiFi Websurfing | |
| Dell Latitude 12 E7270 | |
| Lenovo ThinkPad X260-20F6007RGE | |
| Dell Latitude 13 7370 | |
| HP Elitebook 820 G2-J8R58EA | |
| Dell XPS 13 9350 WQXGA | |
Artılar
Eksiler
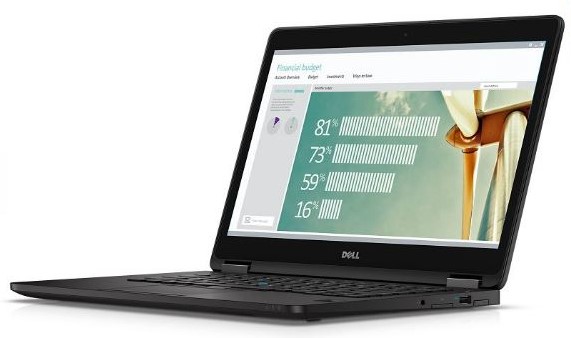
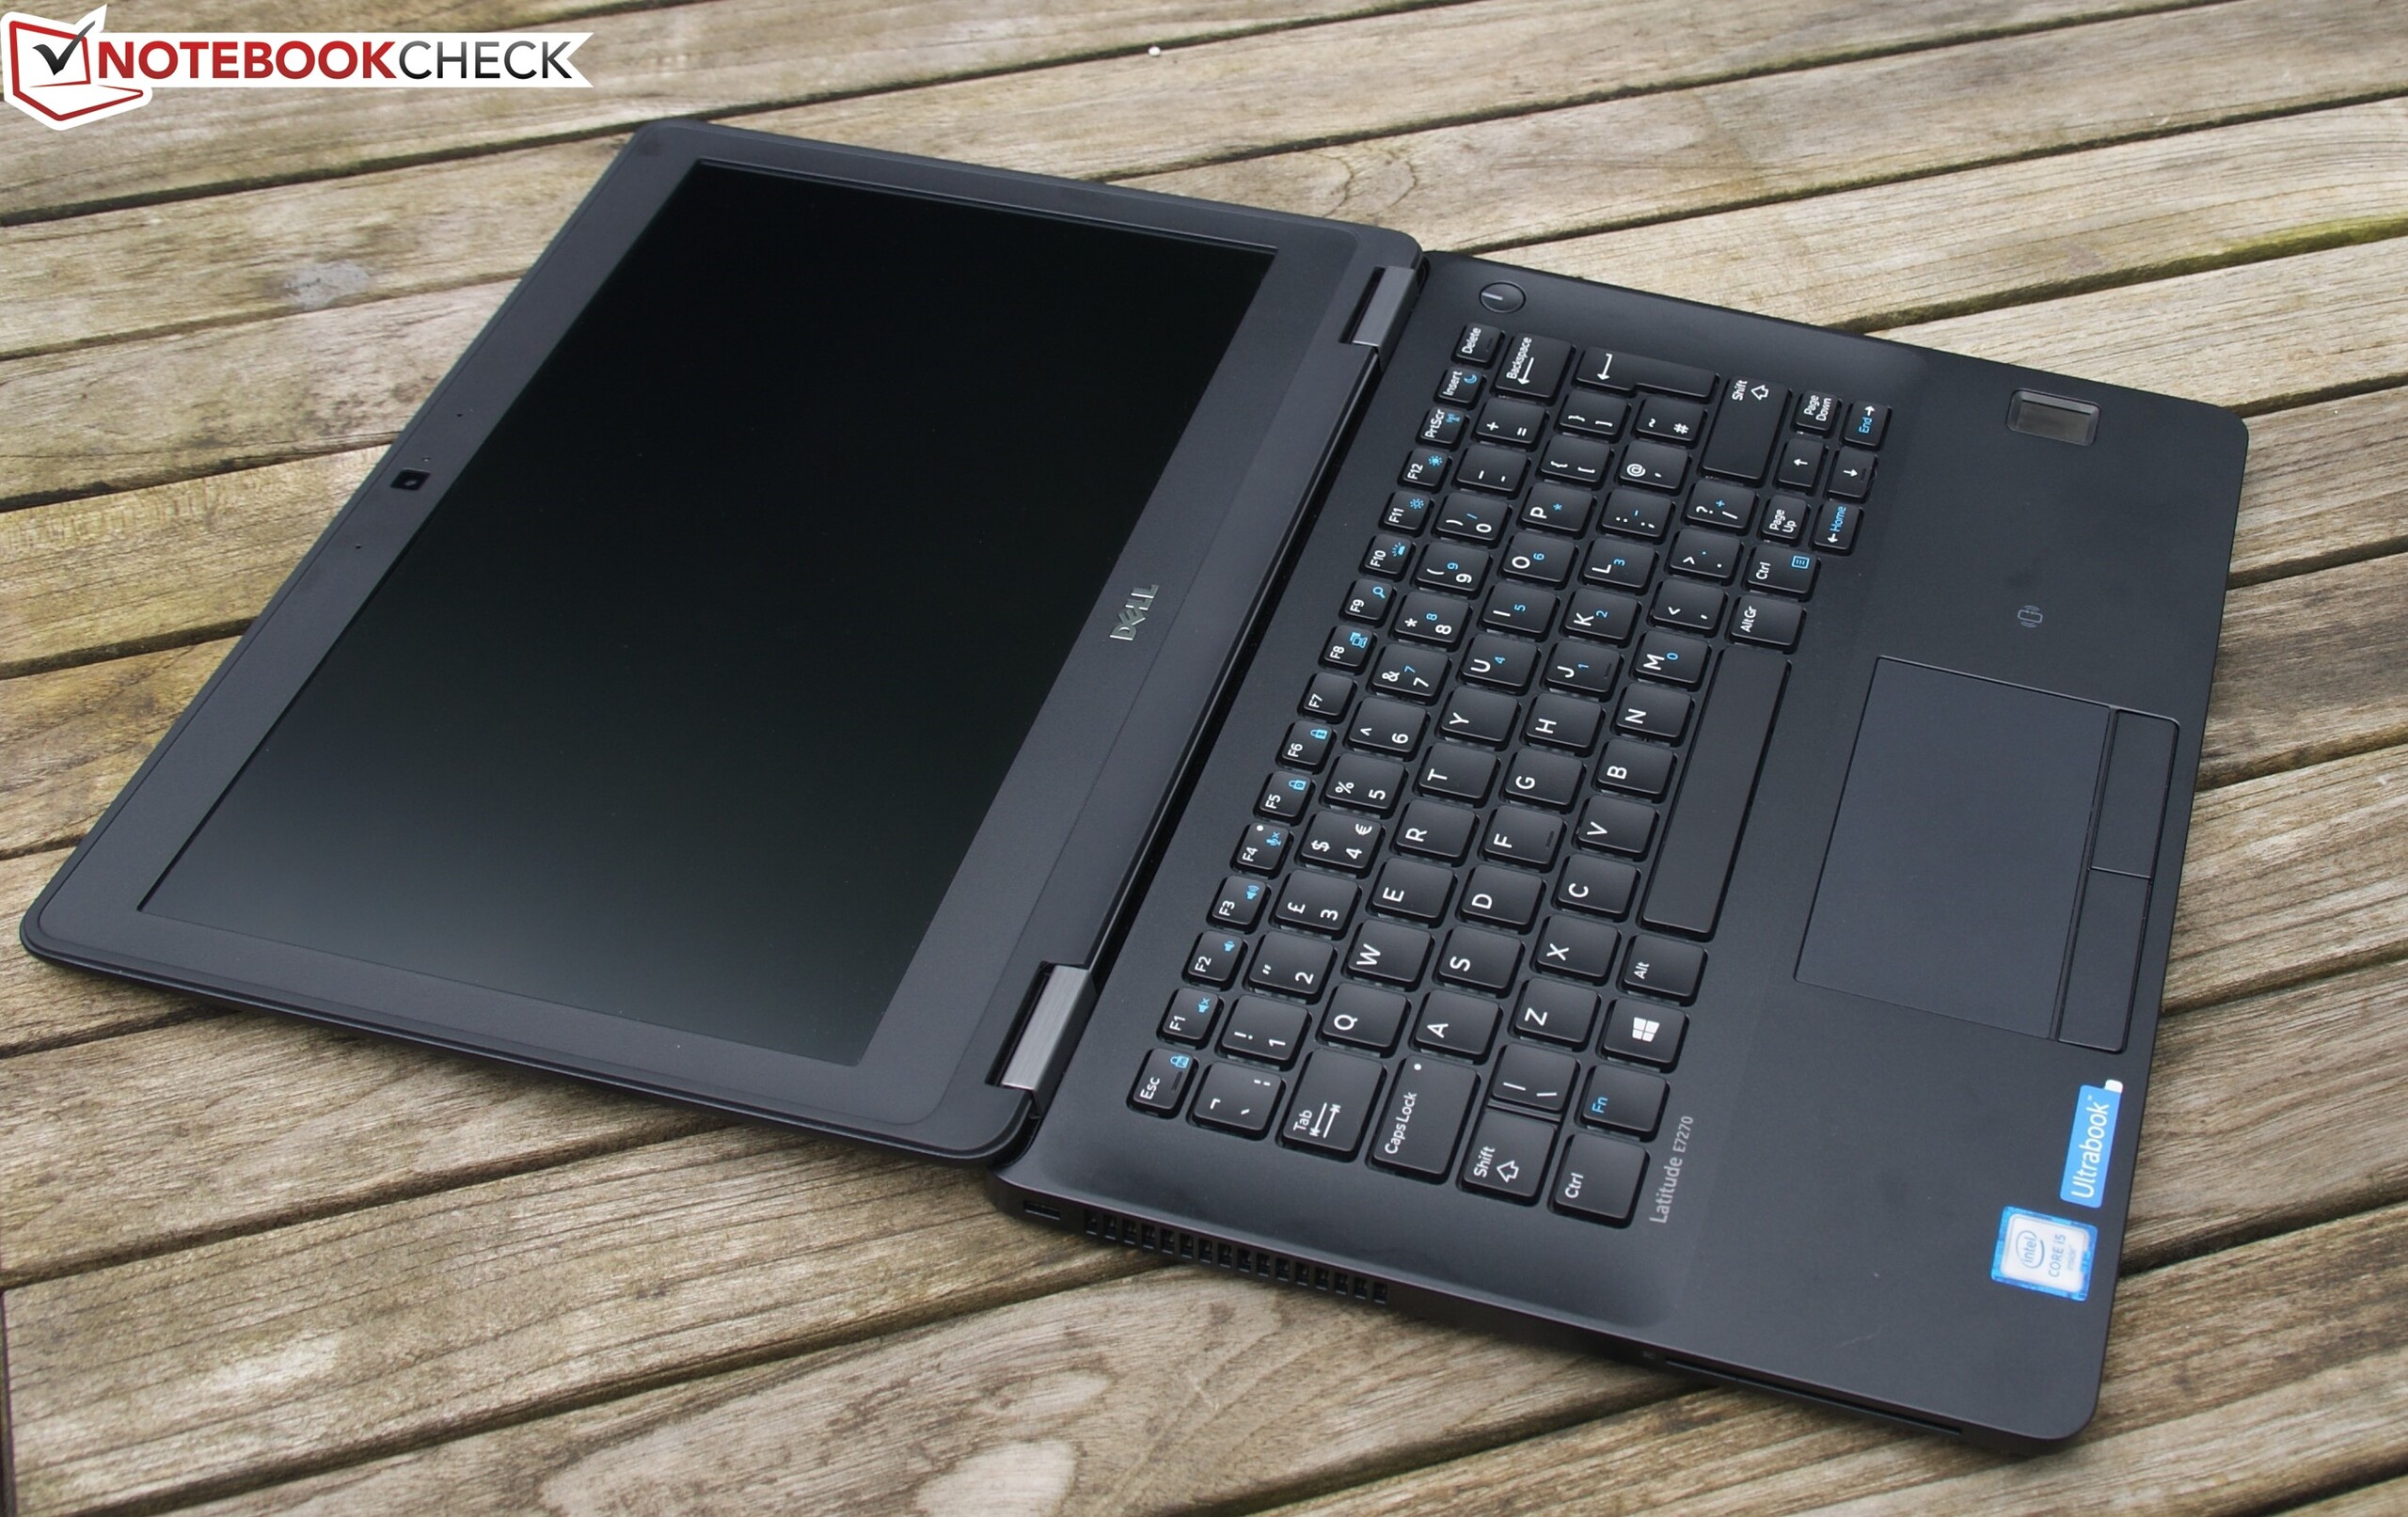
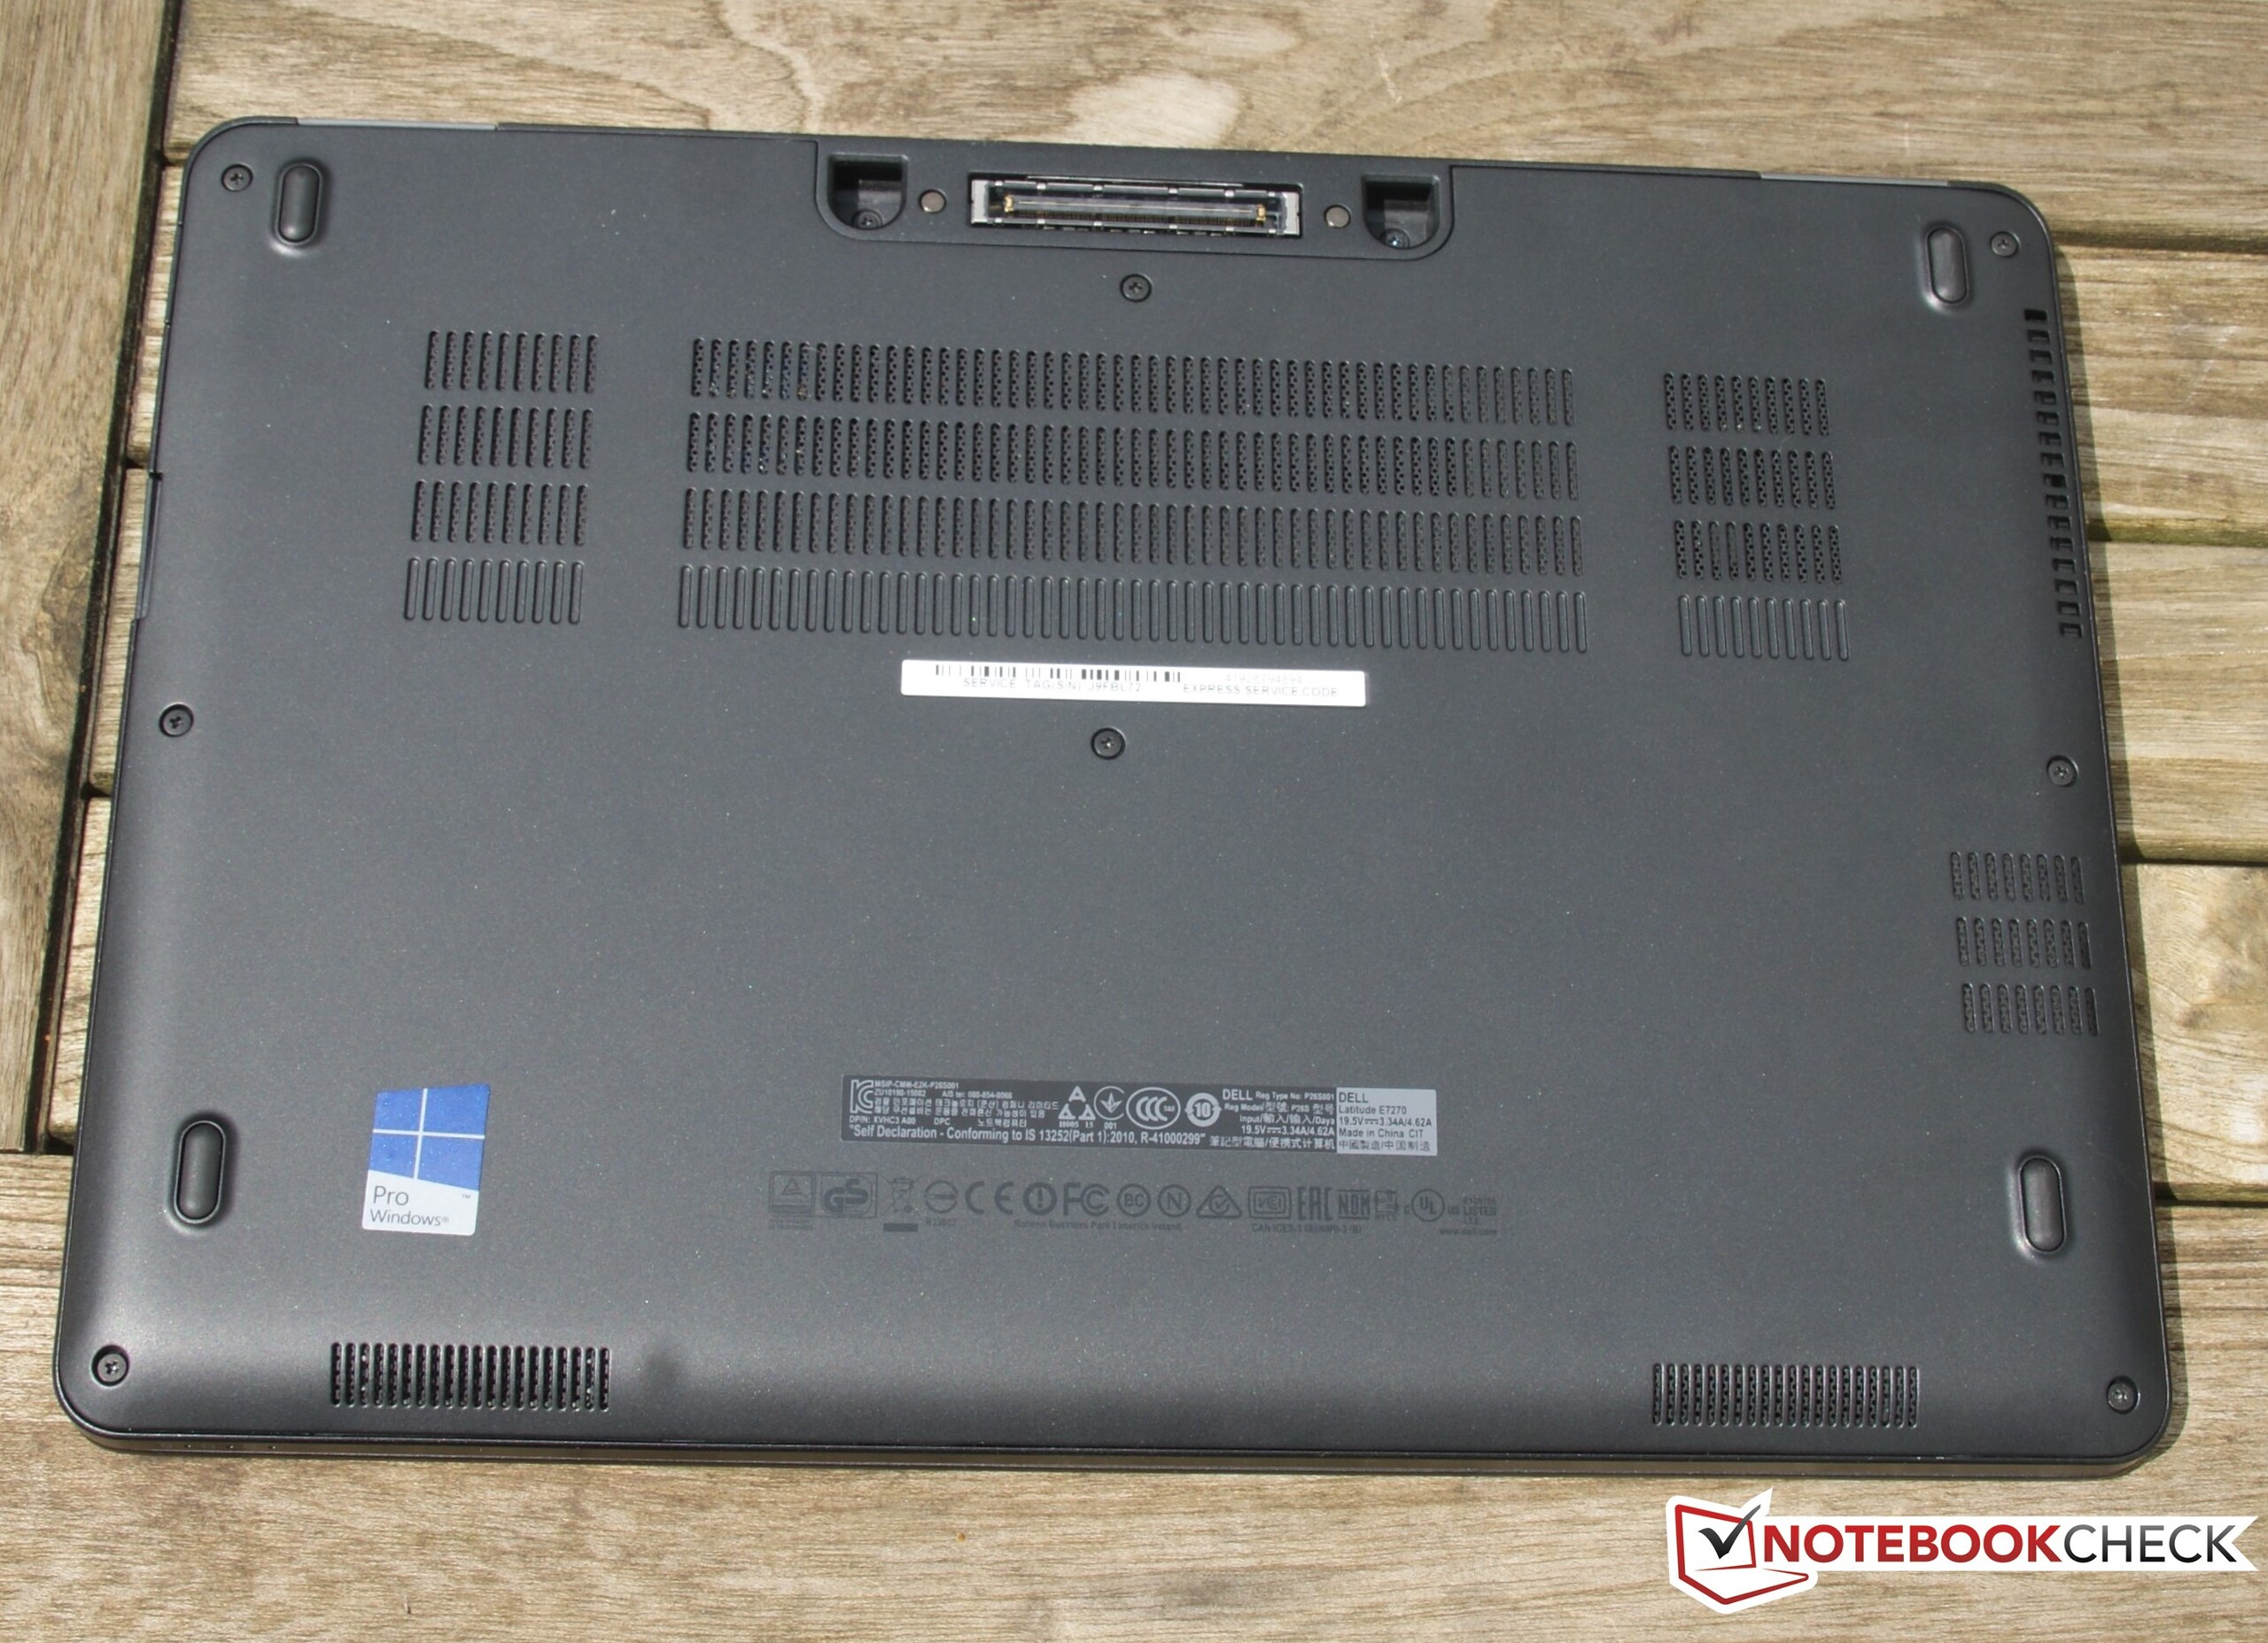
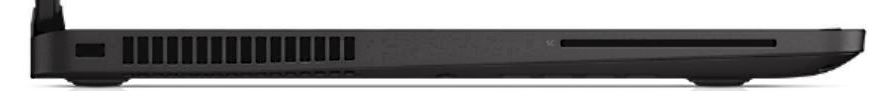
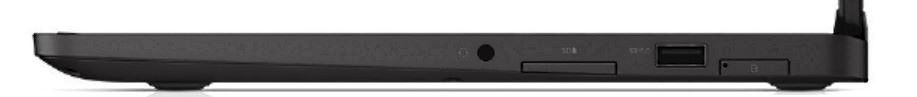
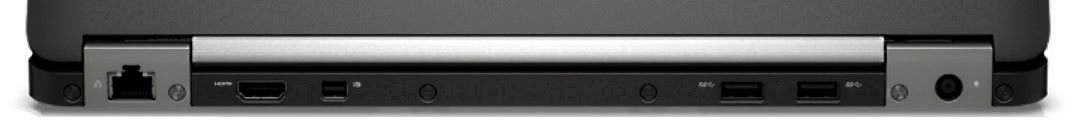
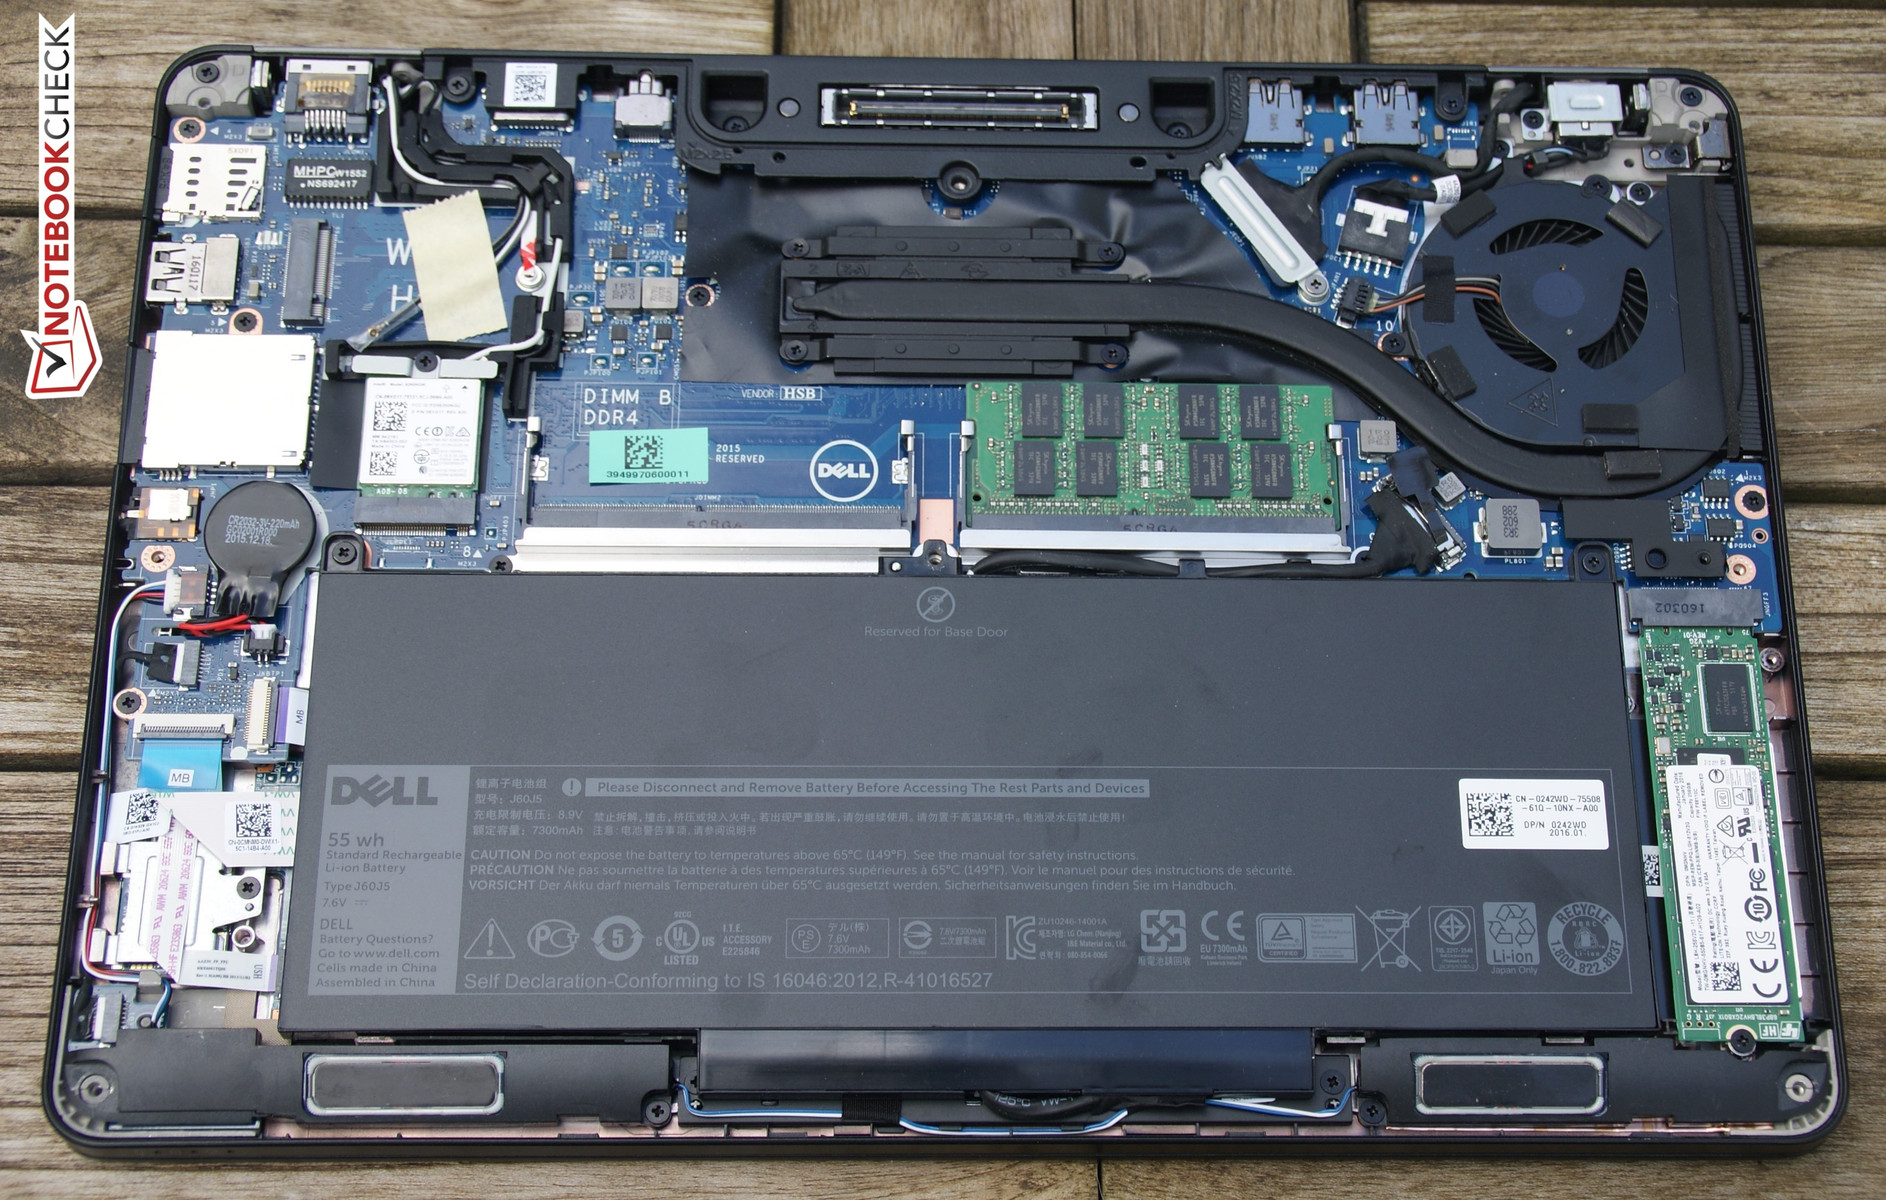
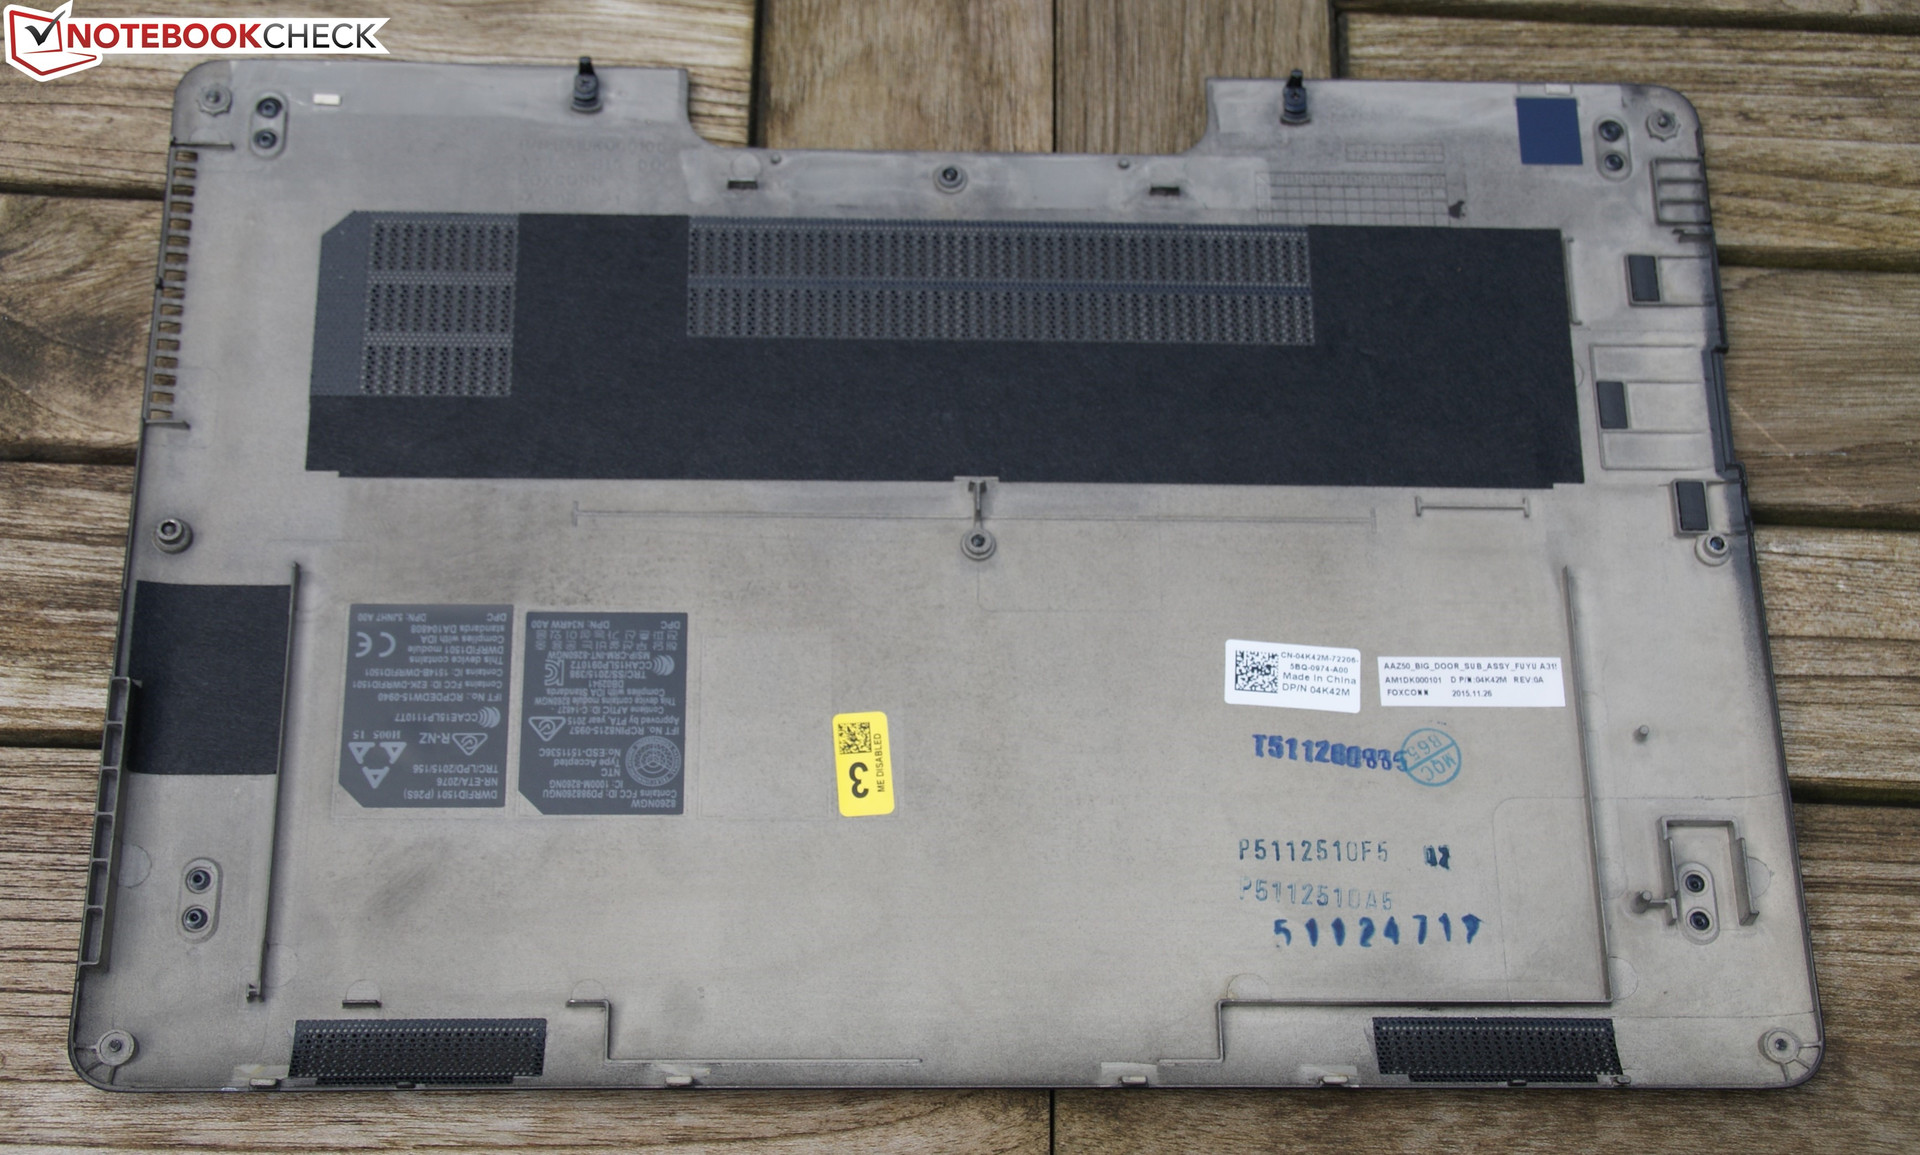
Latitude 7000 serisinin Skylake güncellemesi hayak kırıklığı yaratmıyor. E7270 modeli ile Dell sağlam ve iyi geliştirilmiş özellikle mobiliteye odaklanmış bir cihaz sunuyor. Ekran çok yüksek parlaklığa sahip, batarya ömrü harika ve cihaz oldukça hafif ve ince. Sağlam kasası ile kullanıcının yolculuklar esnasında cihazın sağlamlığı konusunda endişe duymasına gerek yok. E7270 port çeşitliliği sayesinde de bağlantı olanakları yönünden oldukça zengin. E7270 bu sayede mobil bir ofis çalışanının tüm ihtiyaçlarını karşılayabilecek güçte.
Ancak cihazı iş amaçları için kullanmayacaksanız bir multimedia cihazı olan XPS 13 modeli de ilginizi çekebilir.
Yazının orjinali için tıklayın.
Dell Latitude 12 E7270
- 06/30/2016 v5.1 (old)
Benjamin Herzig