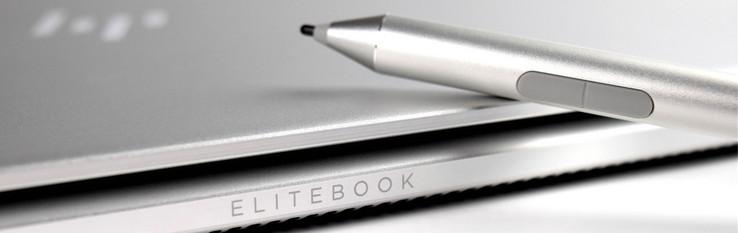
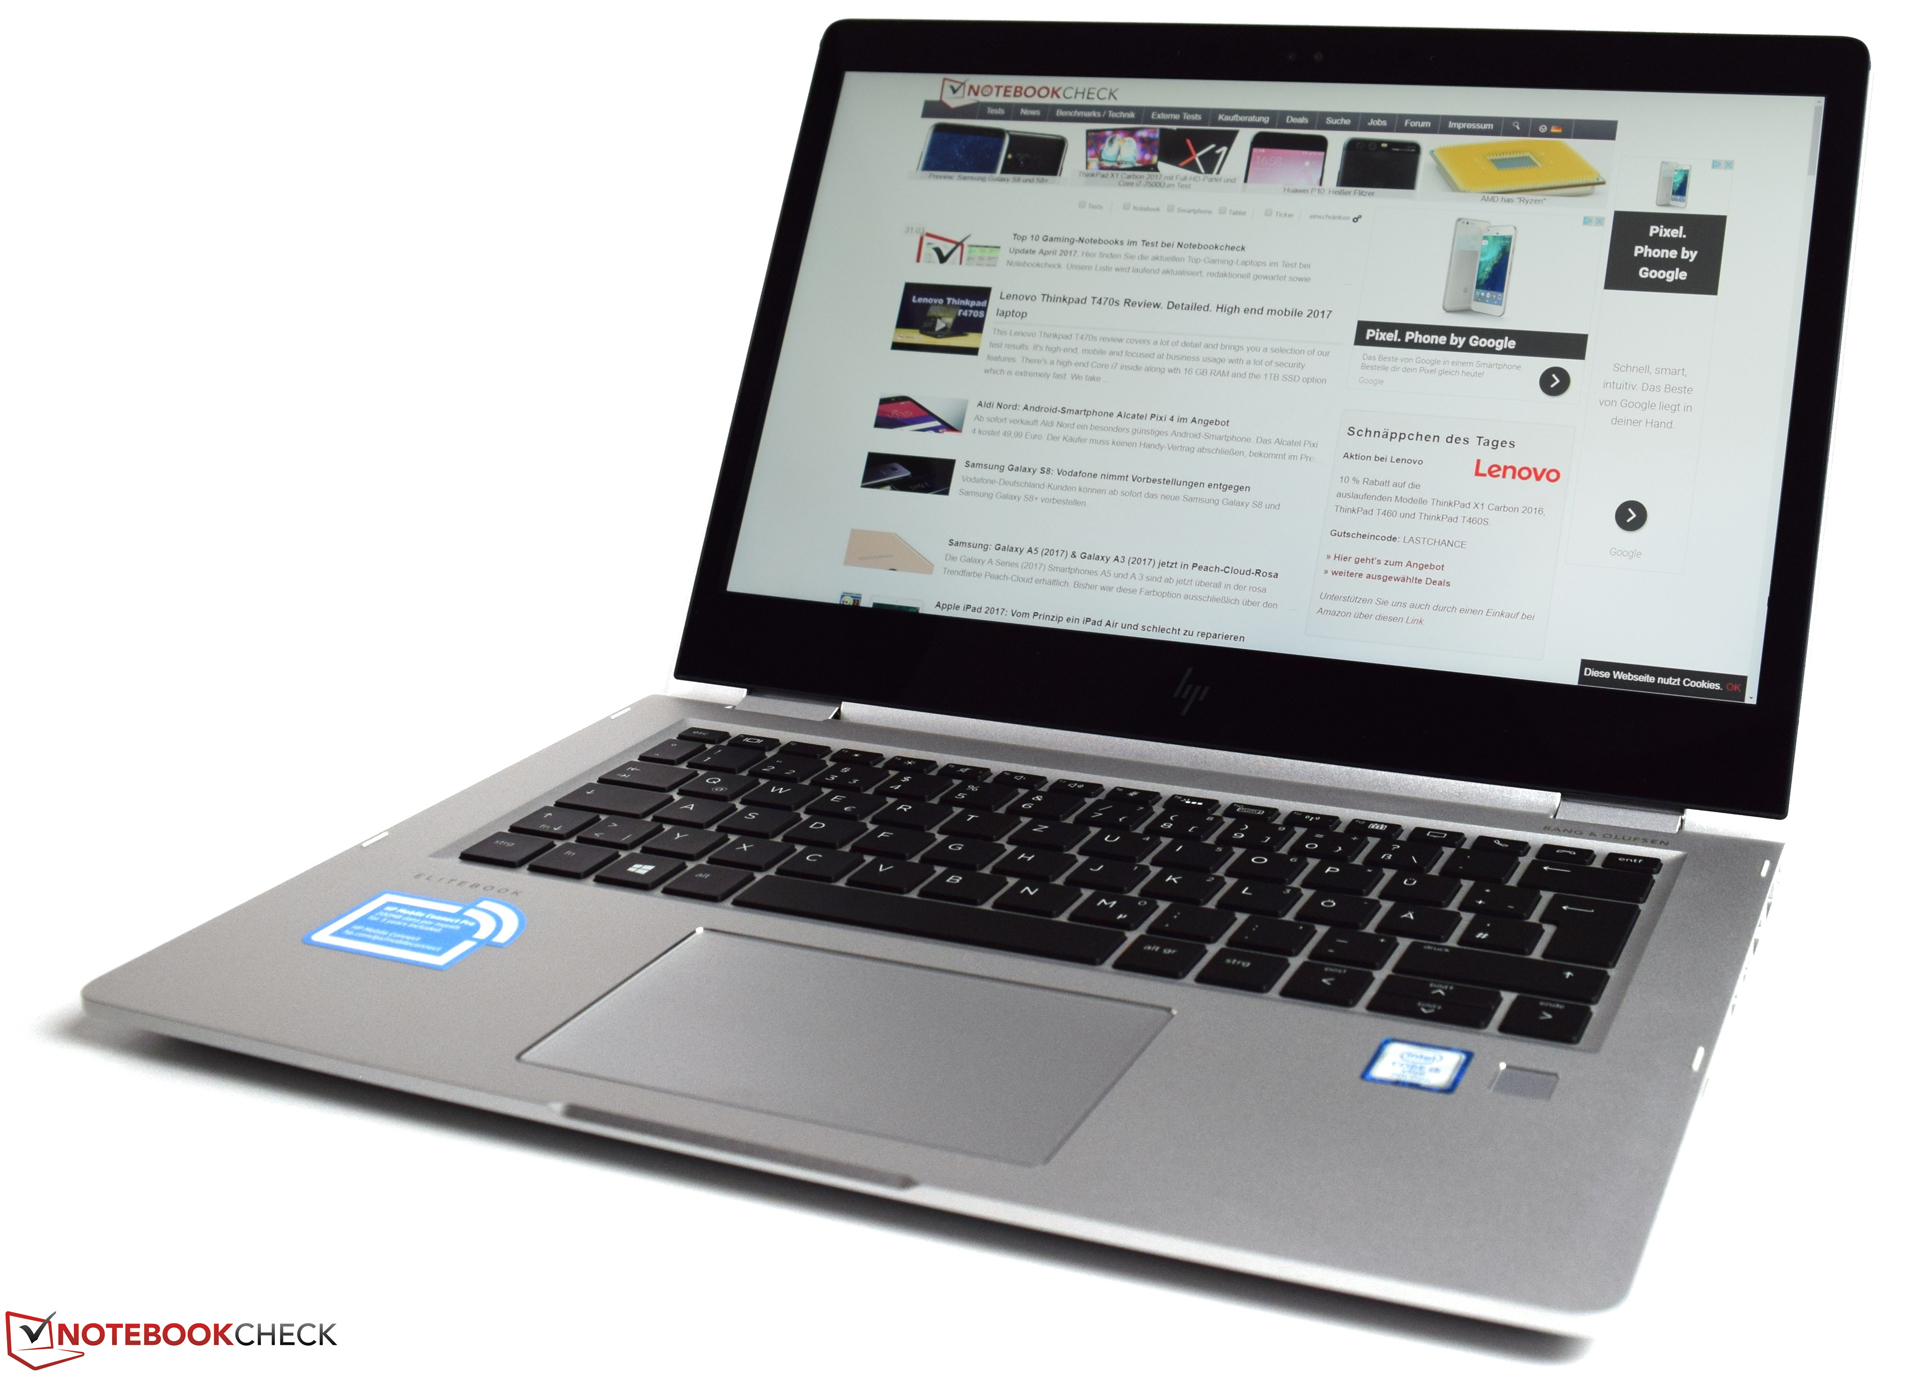
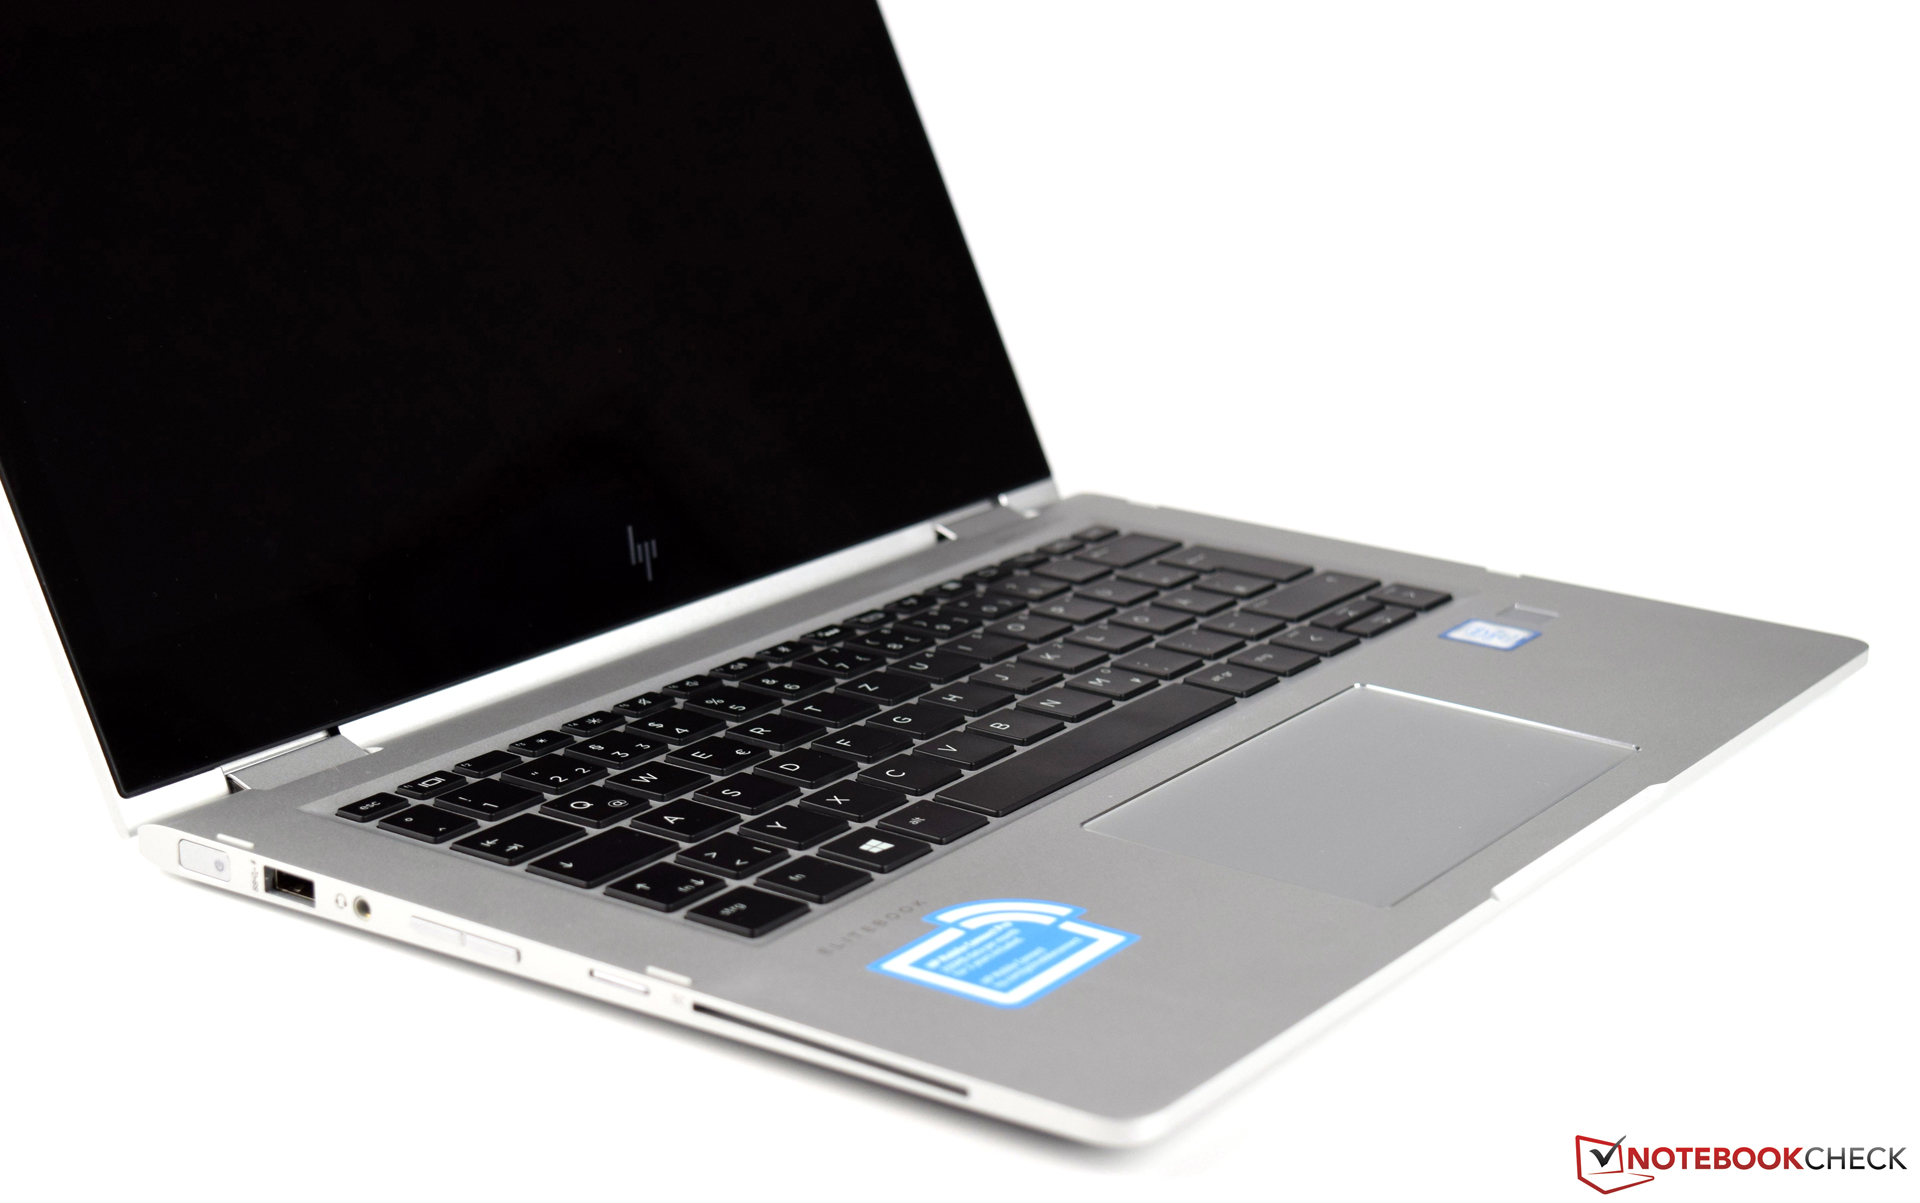
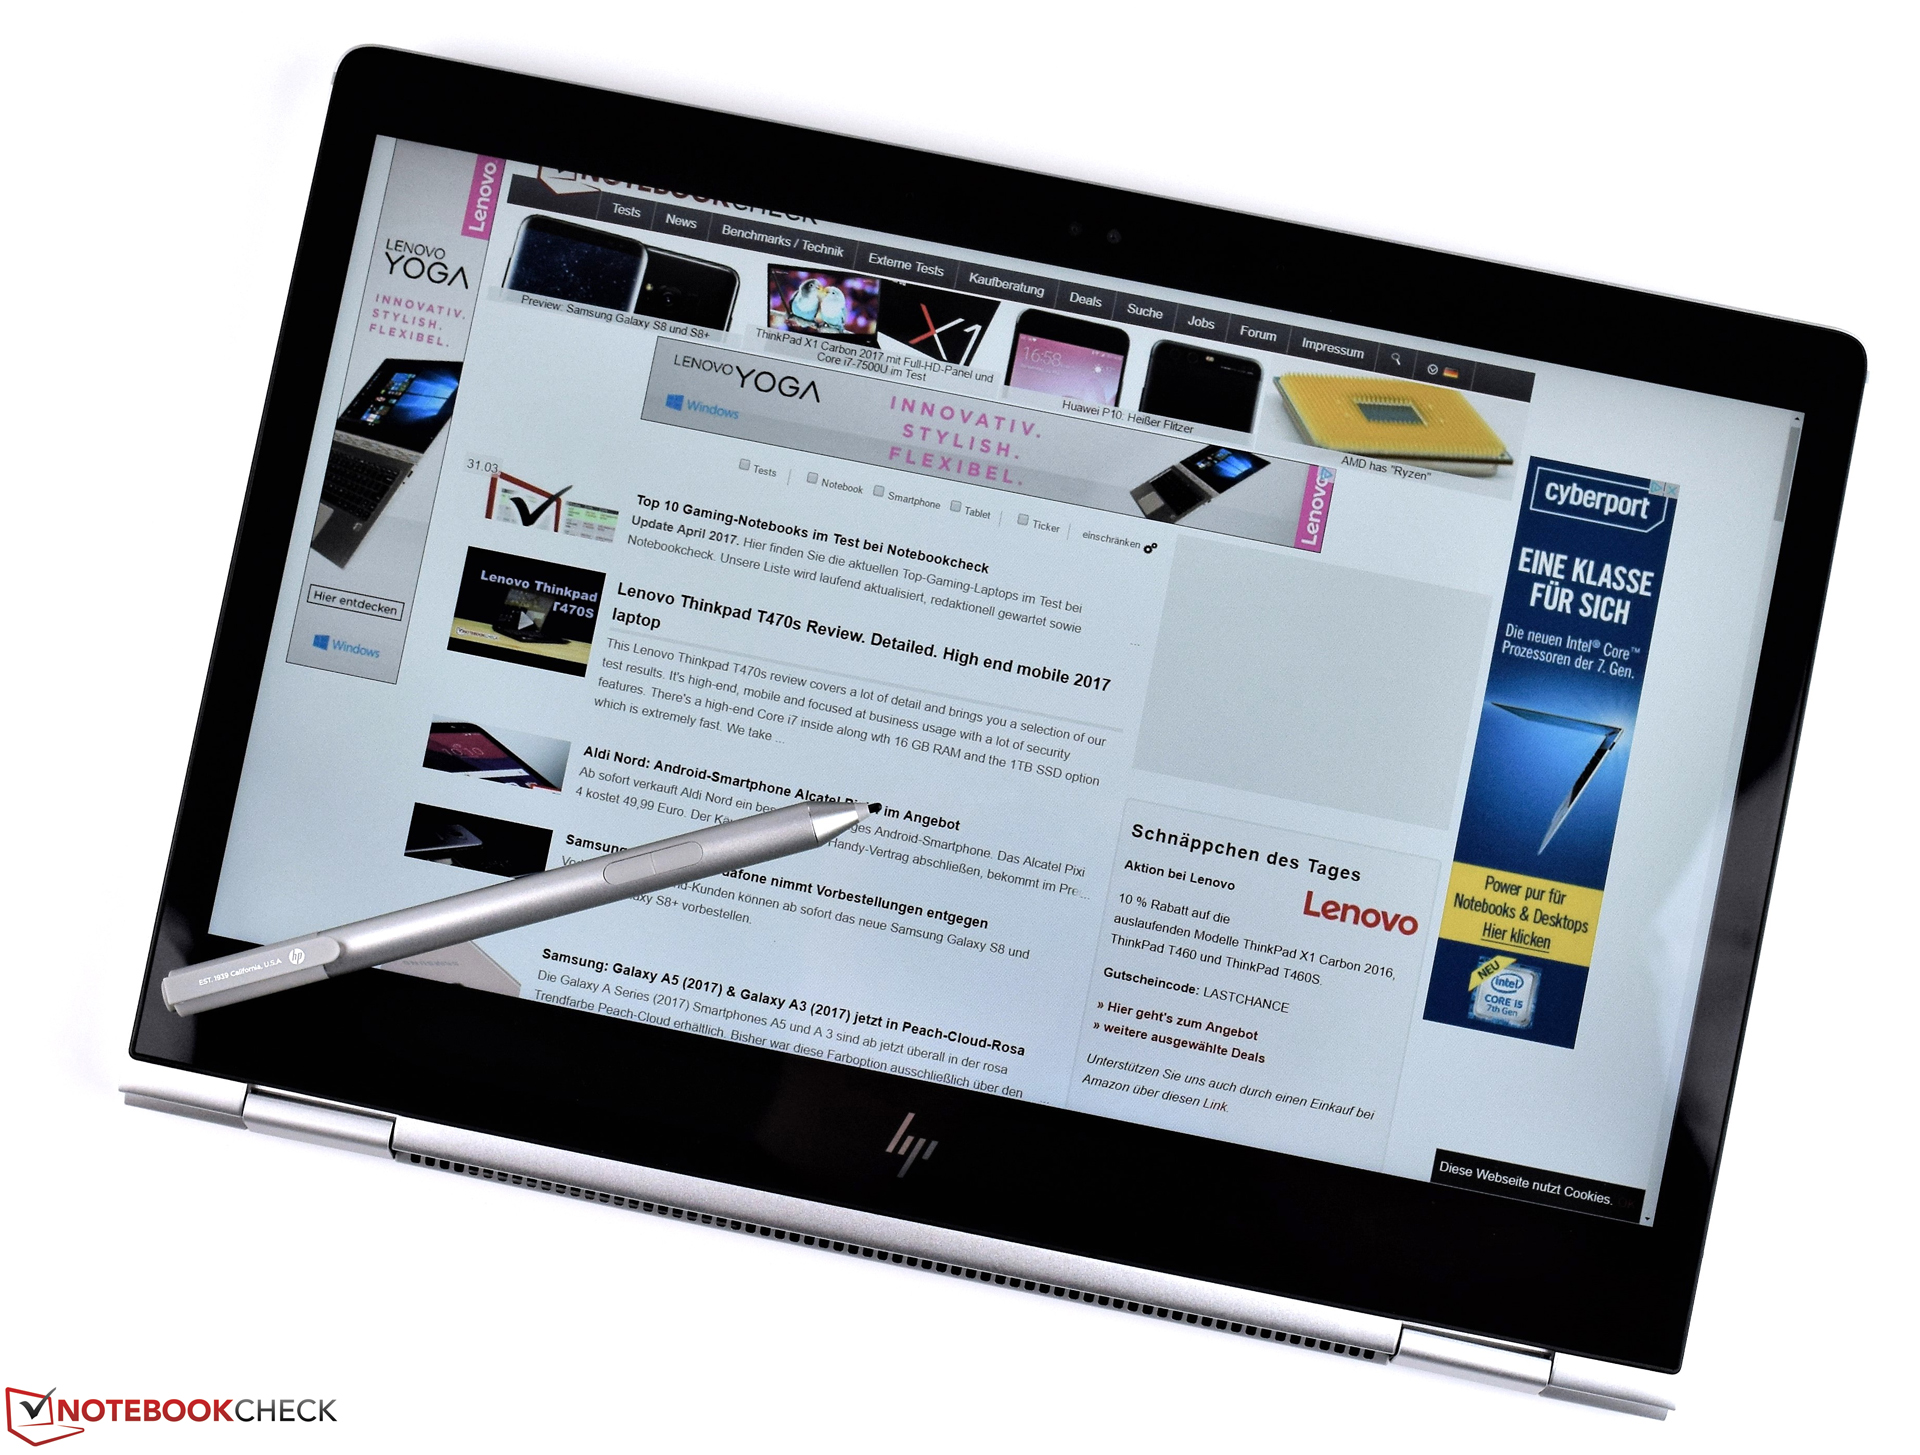
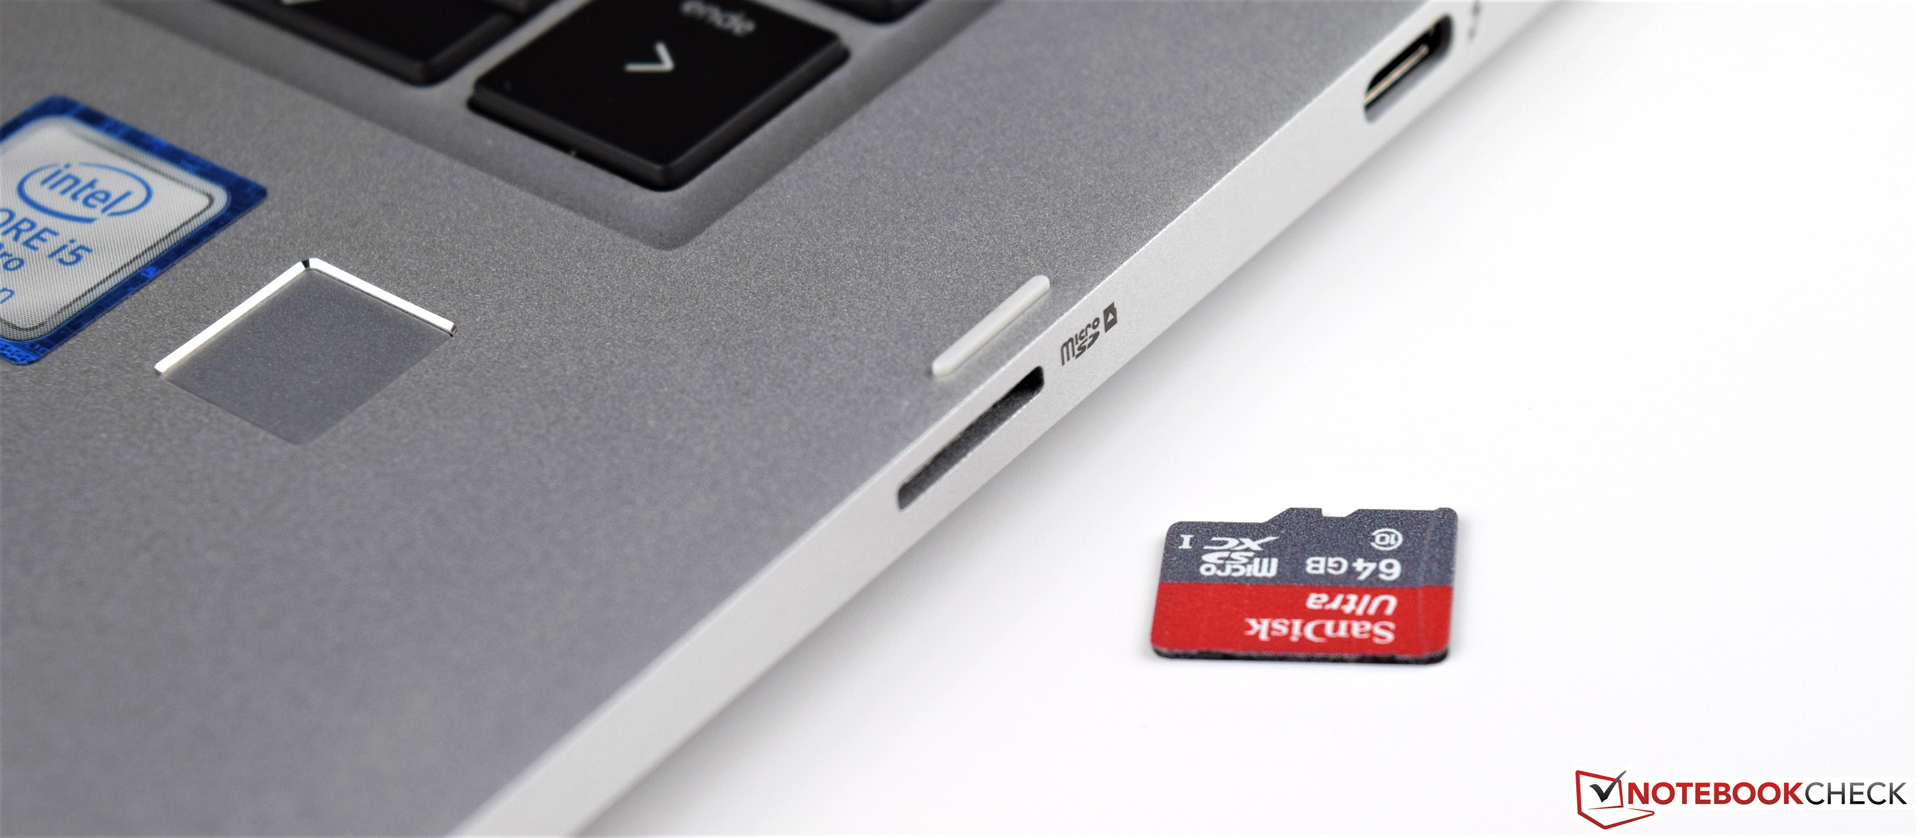
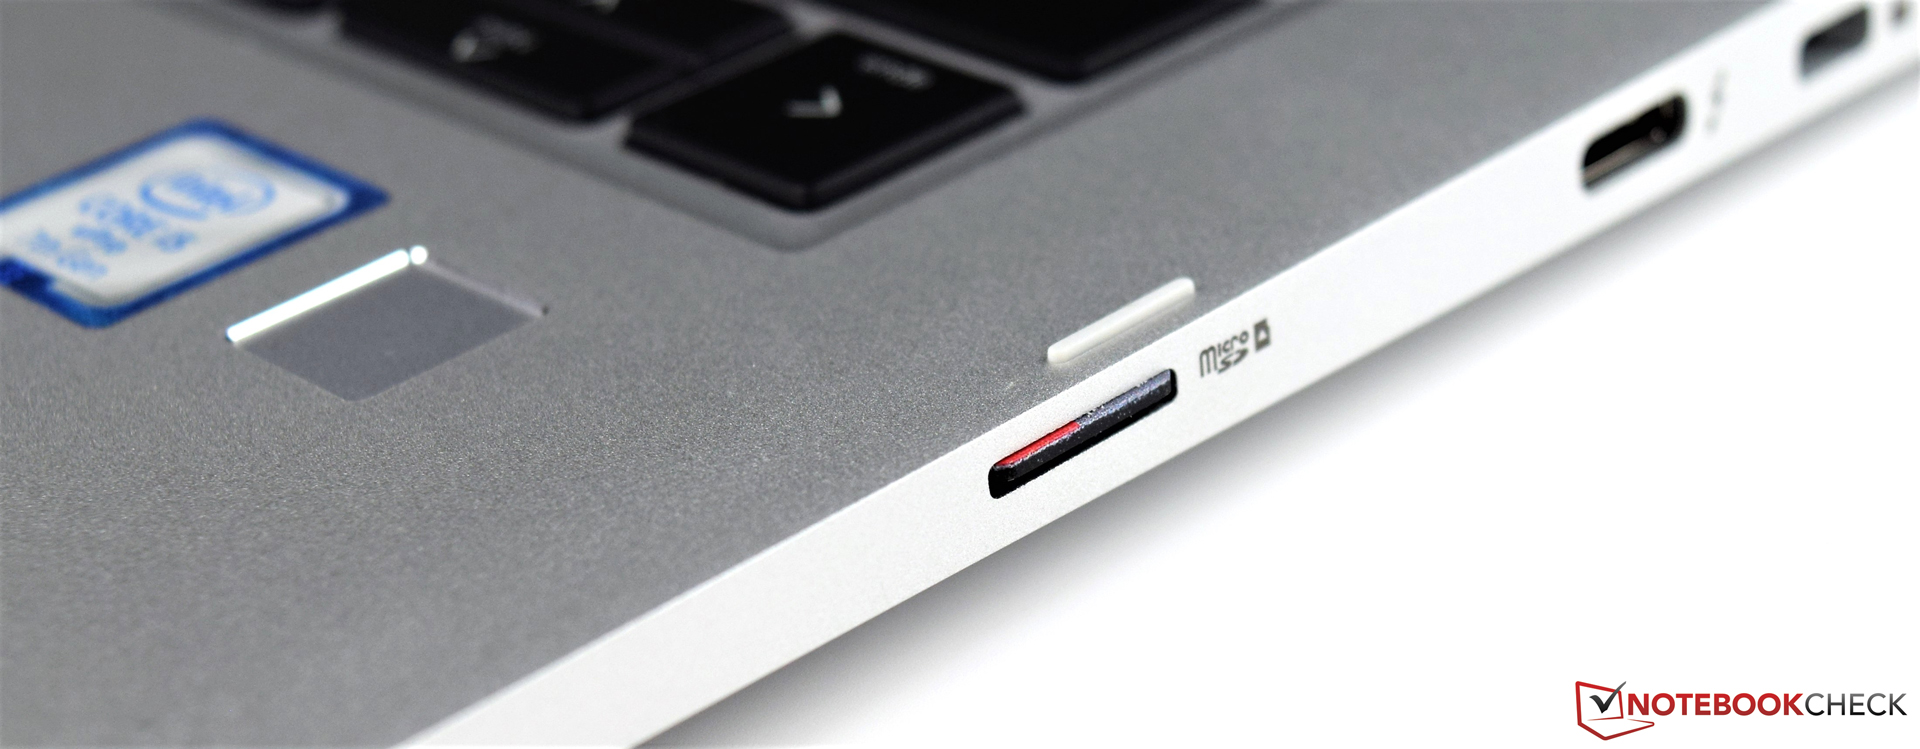
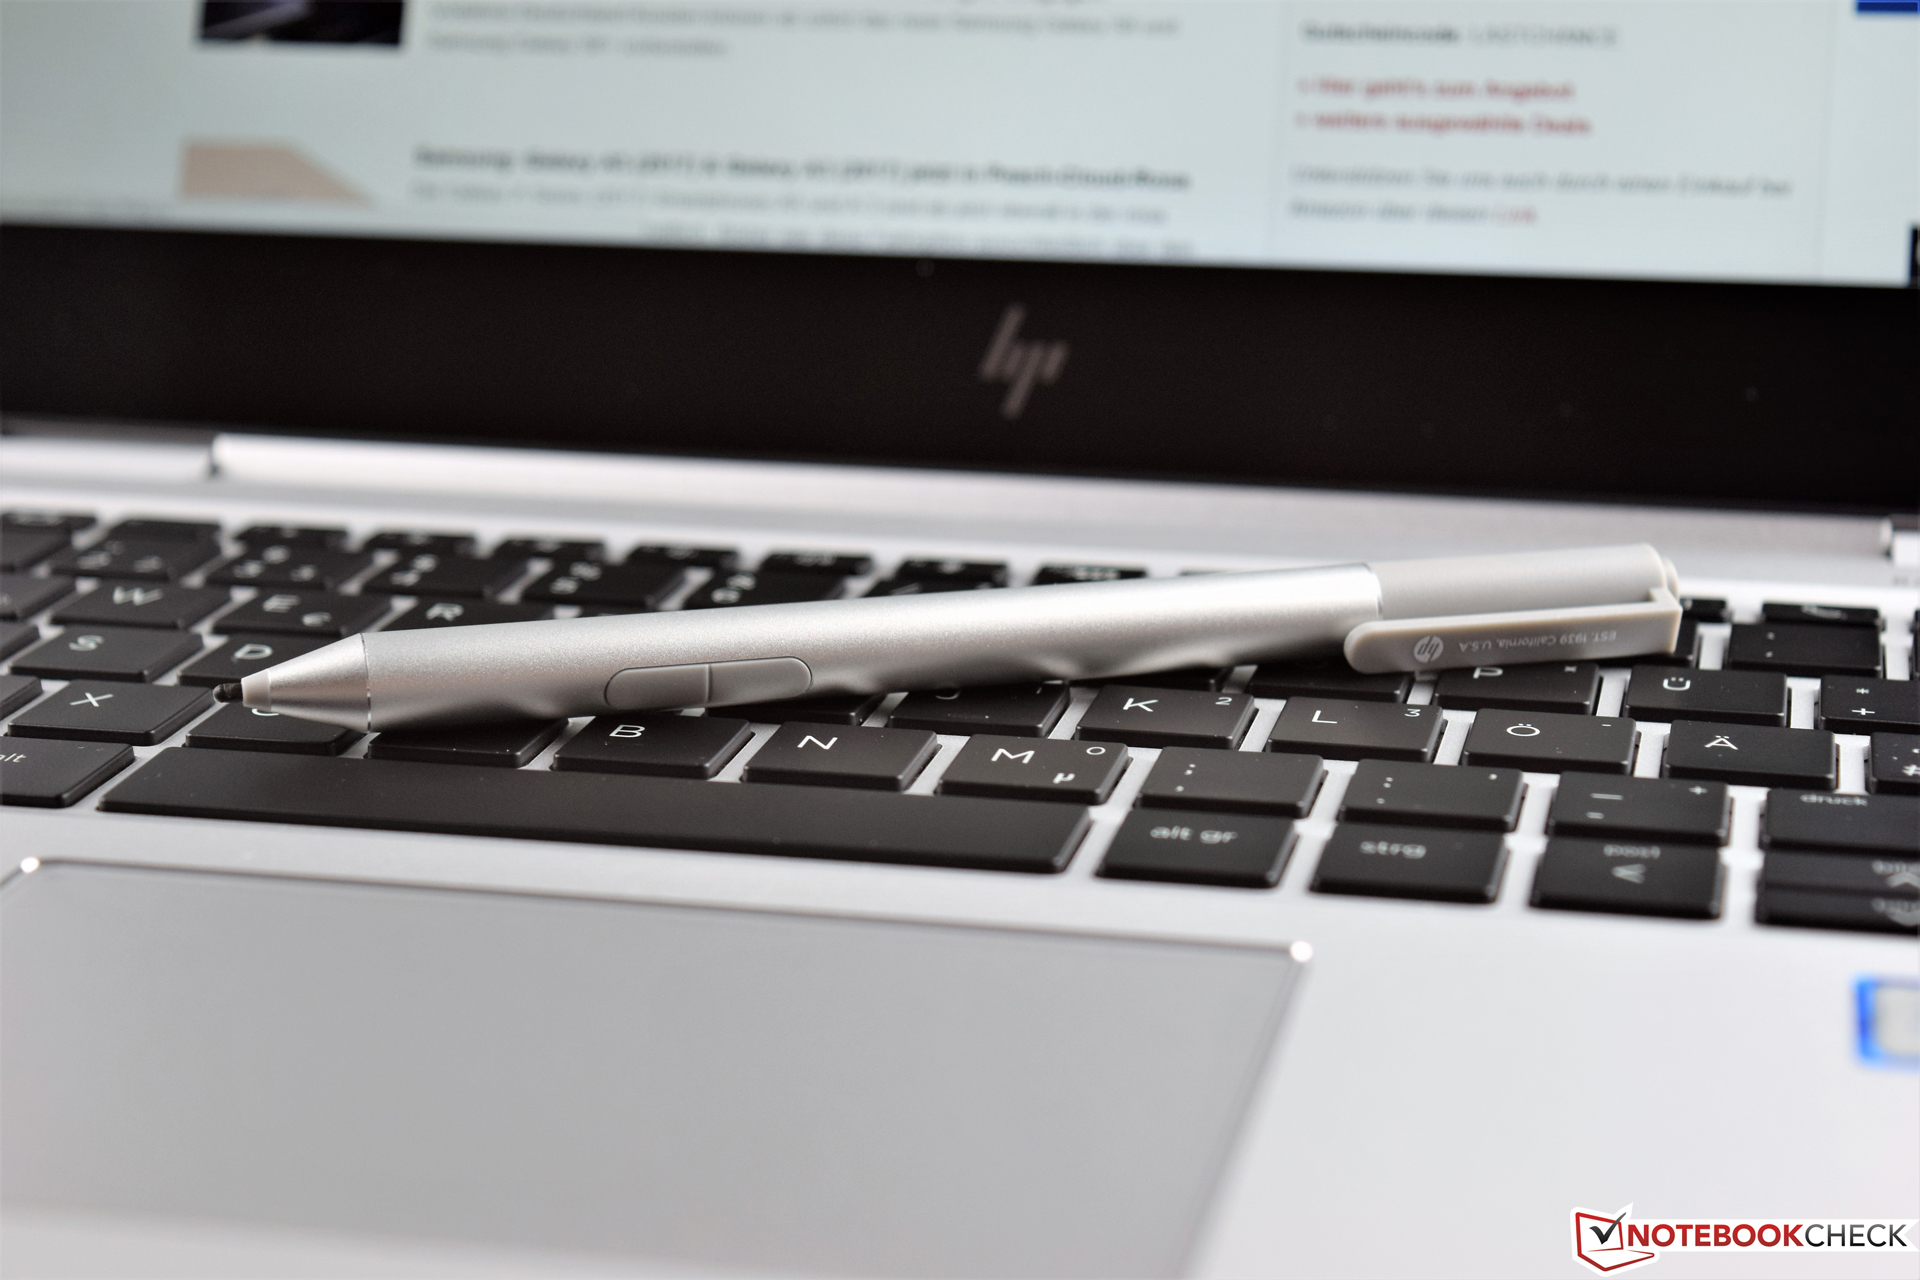
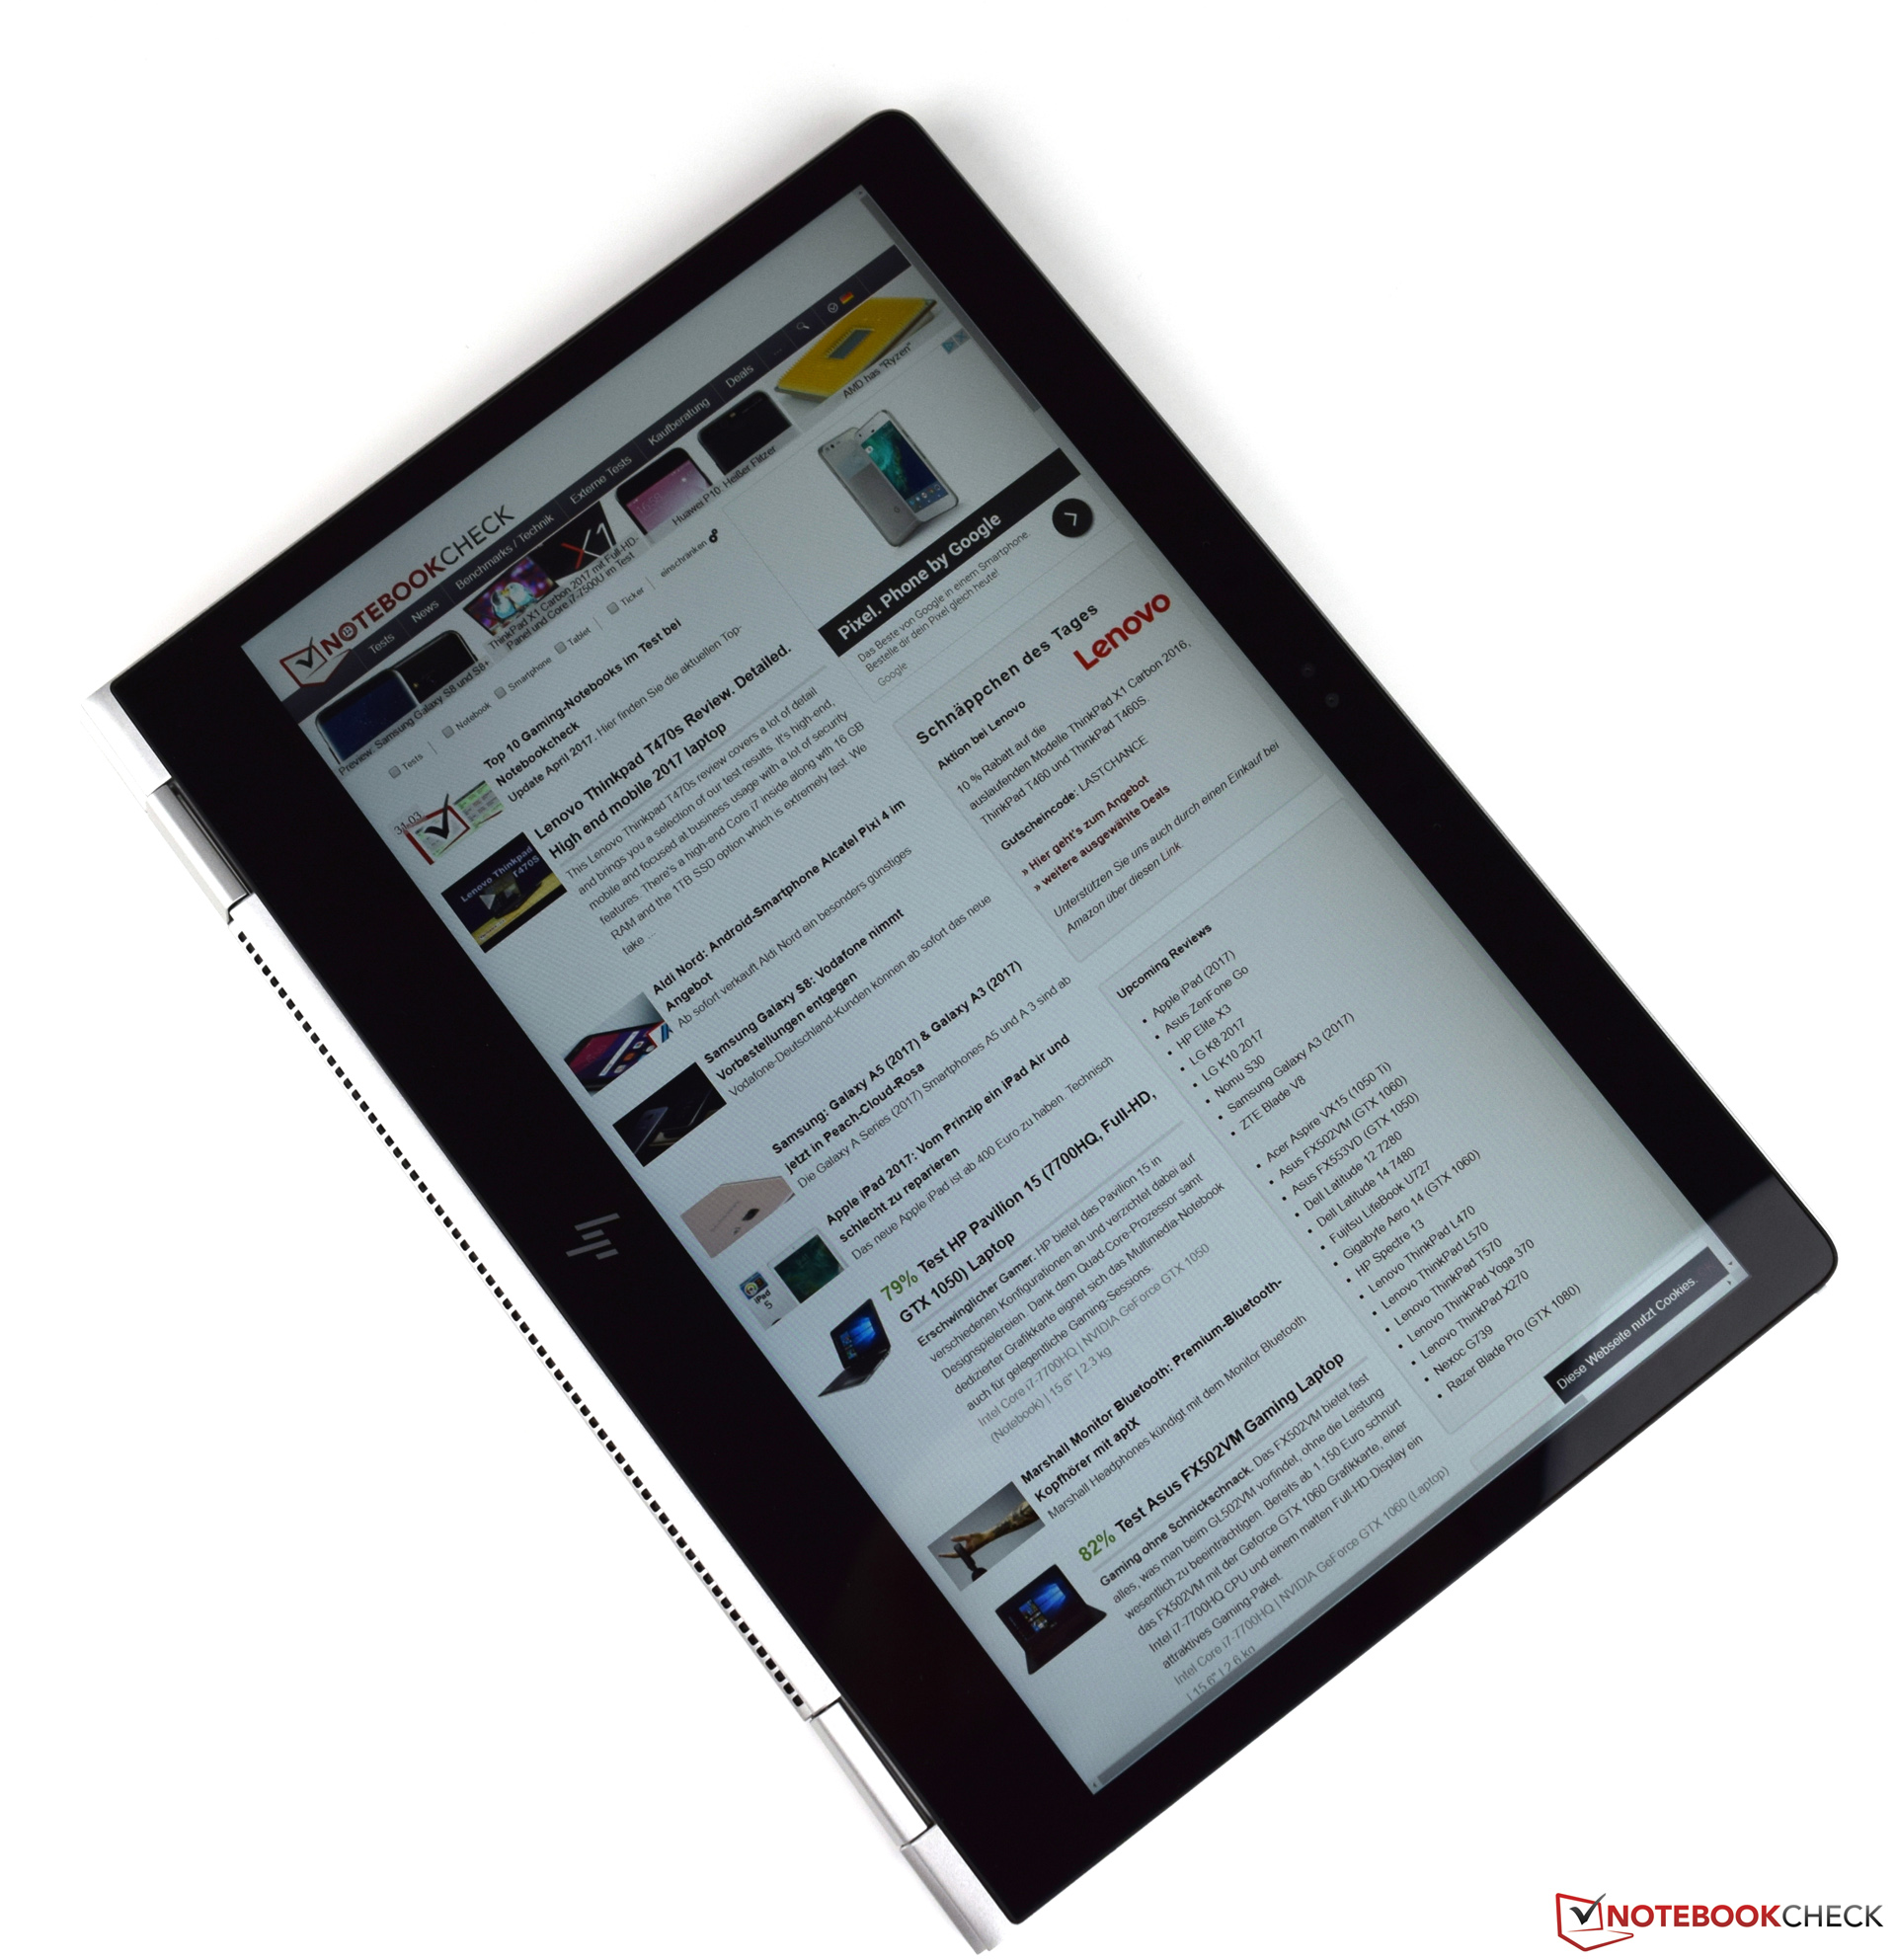
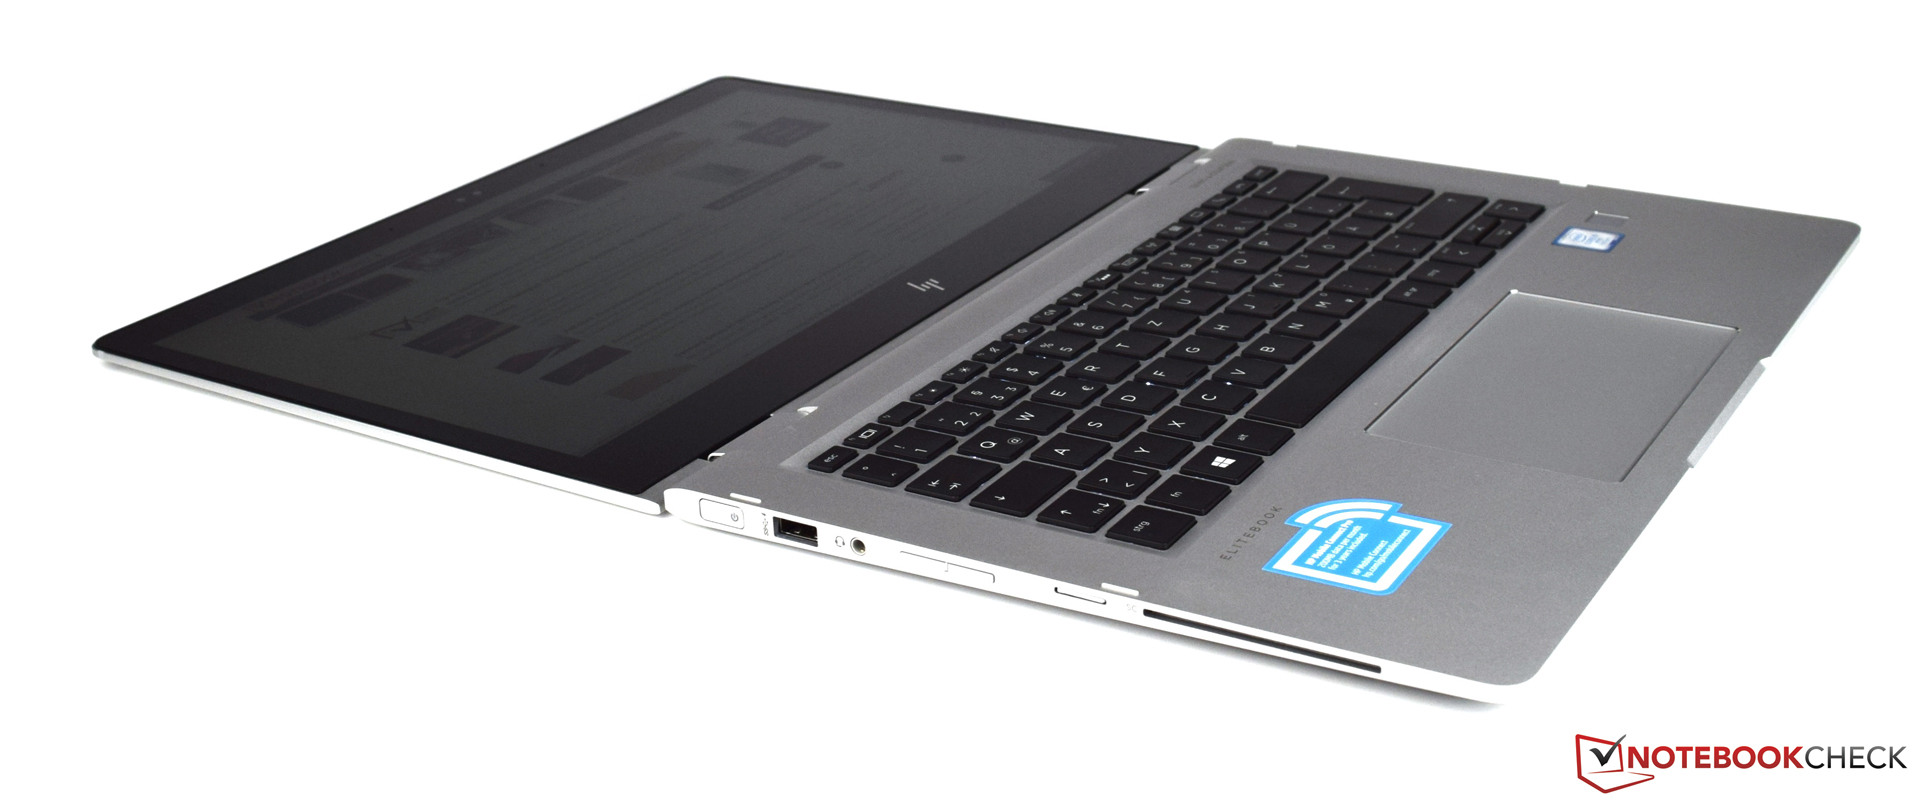
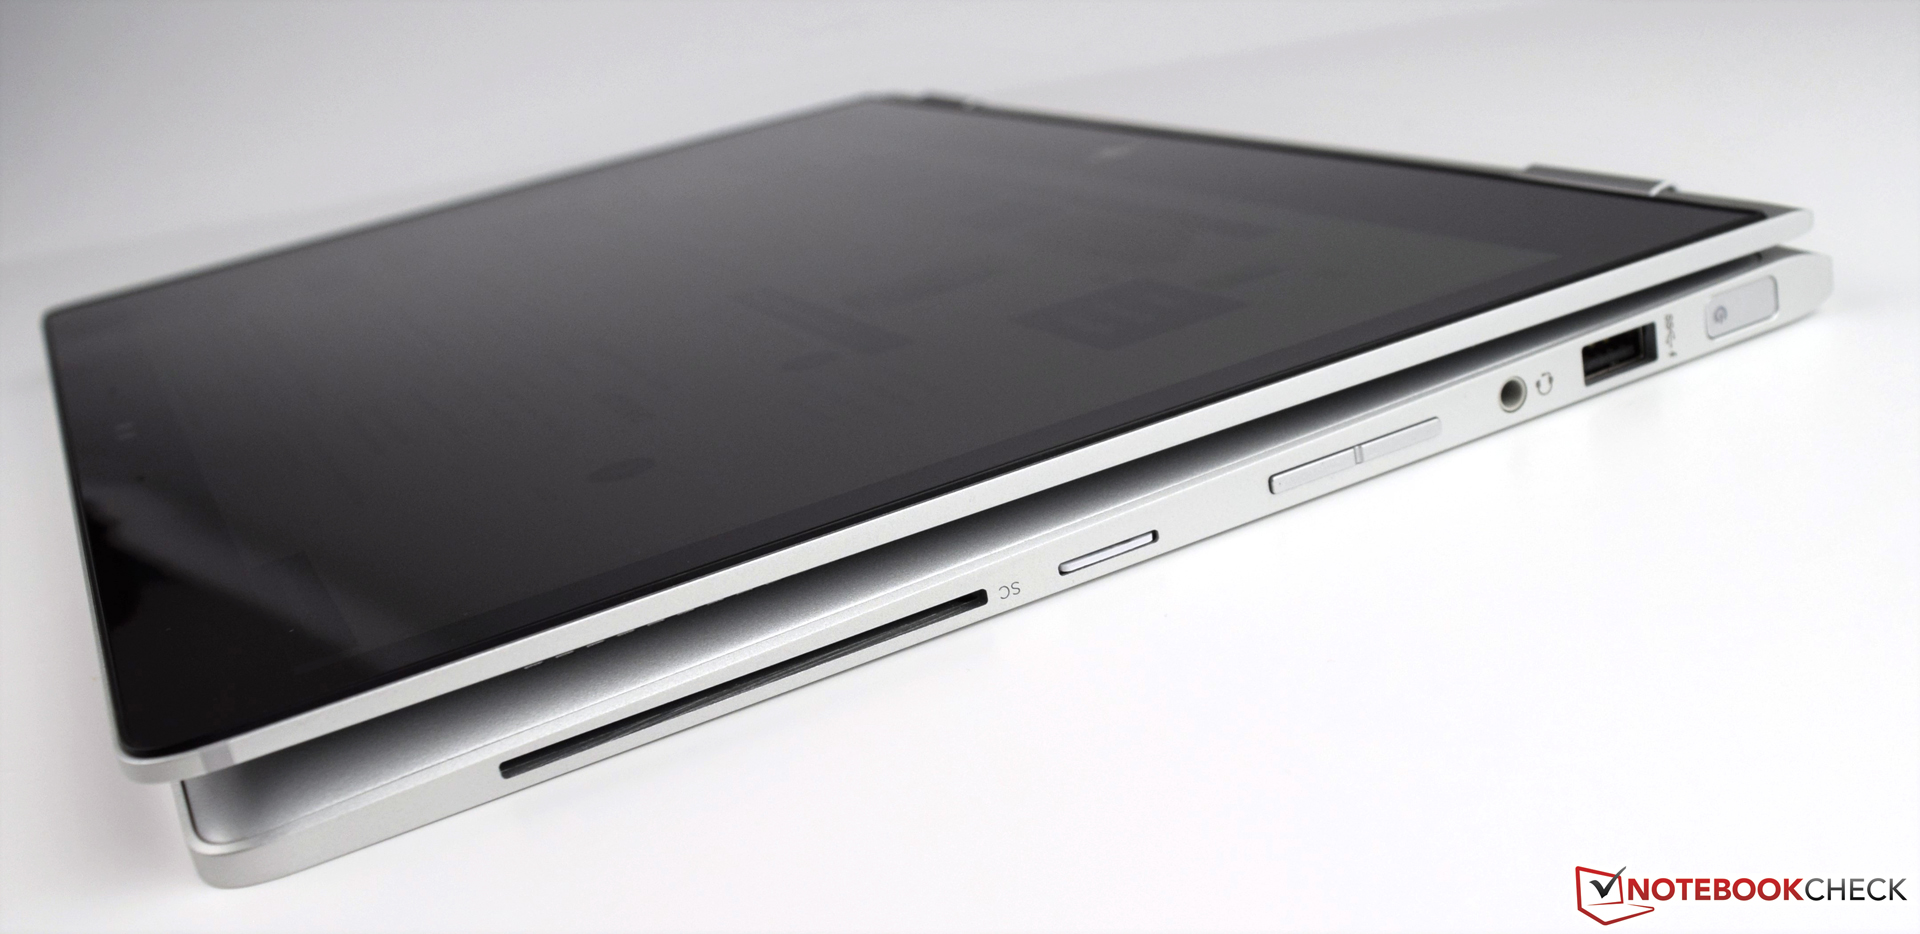
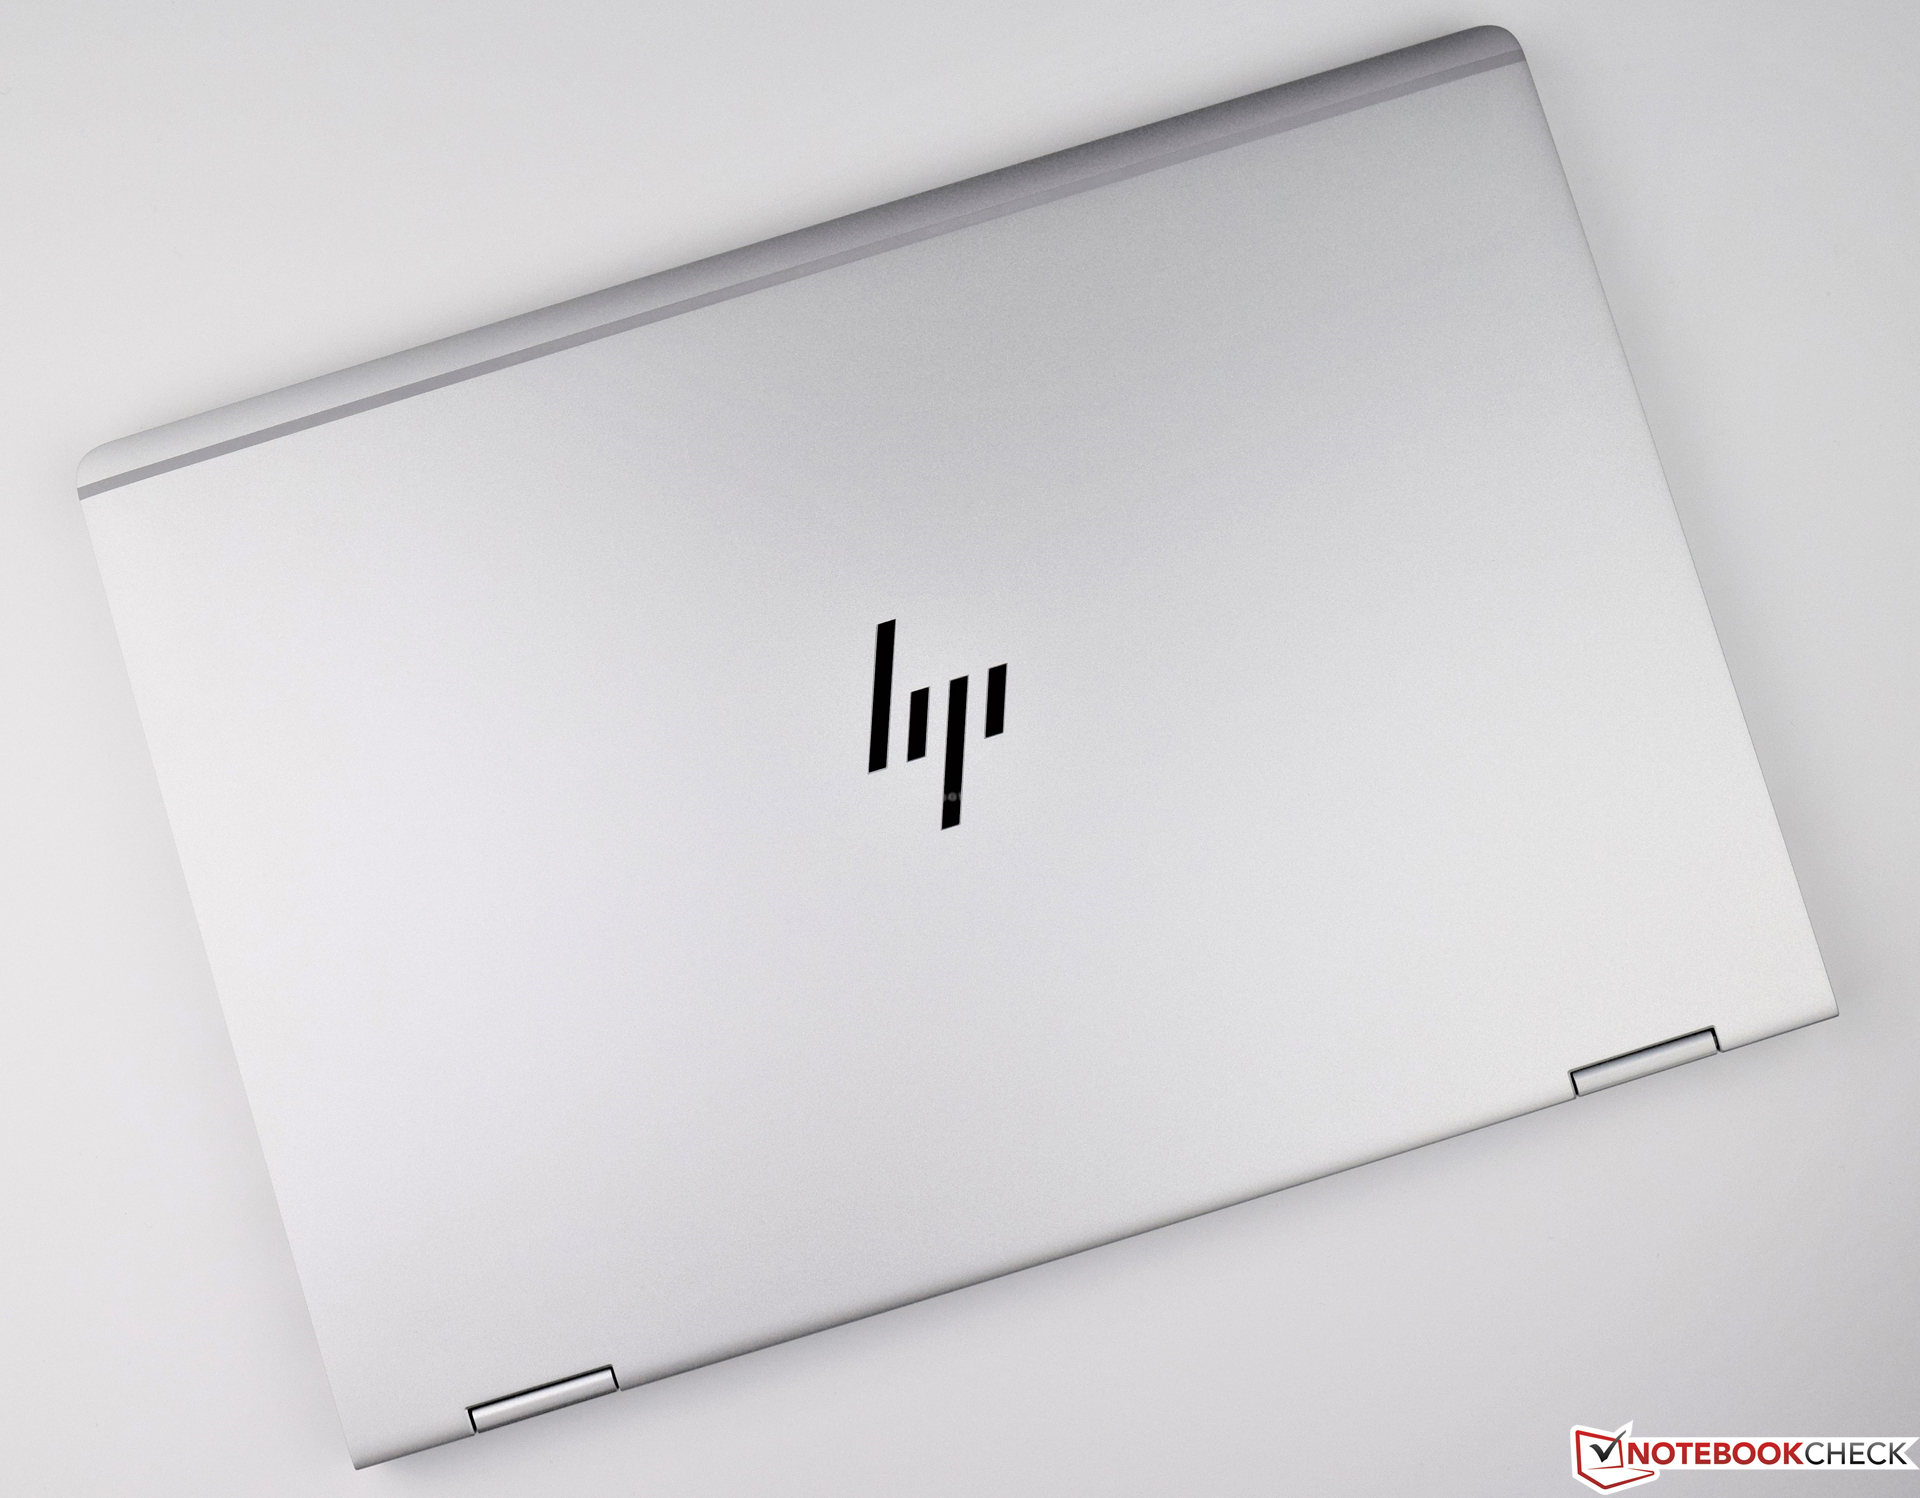
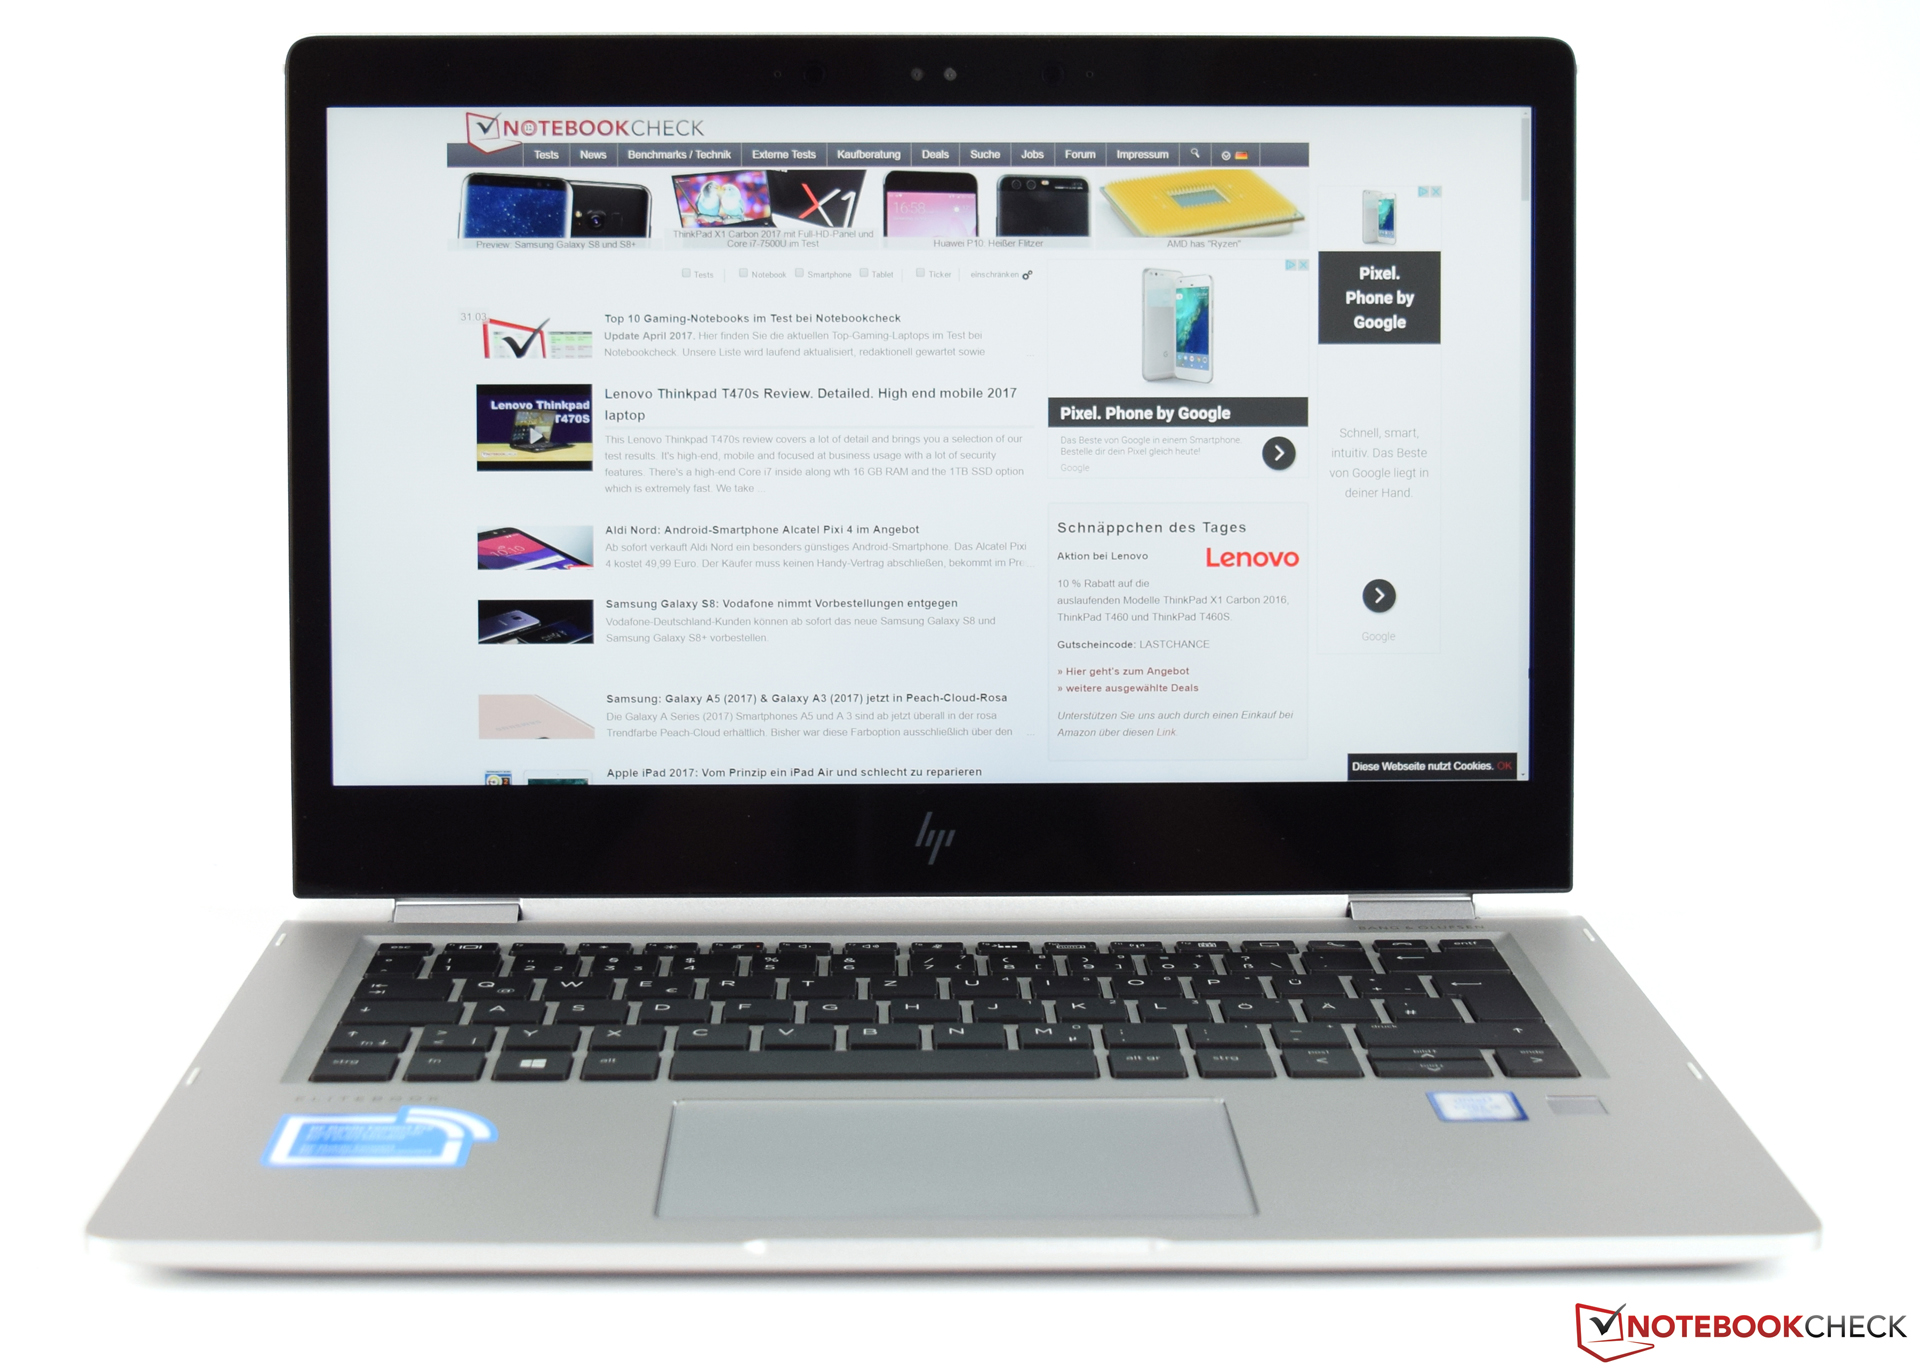
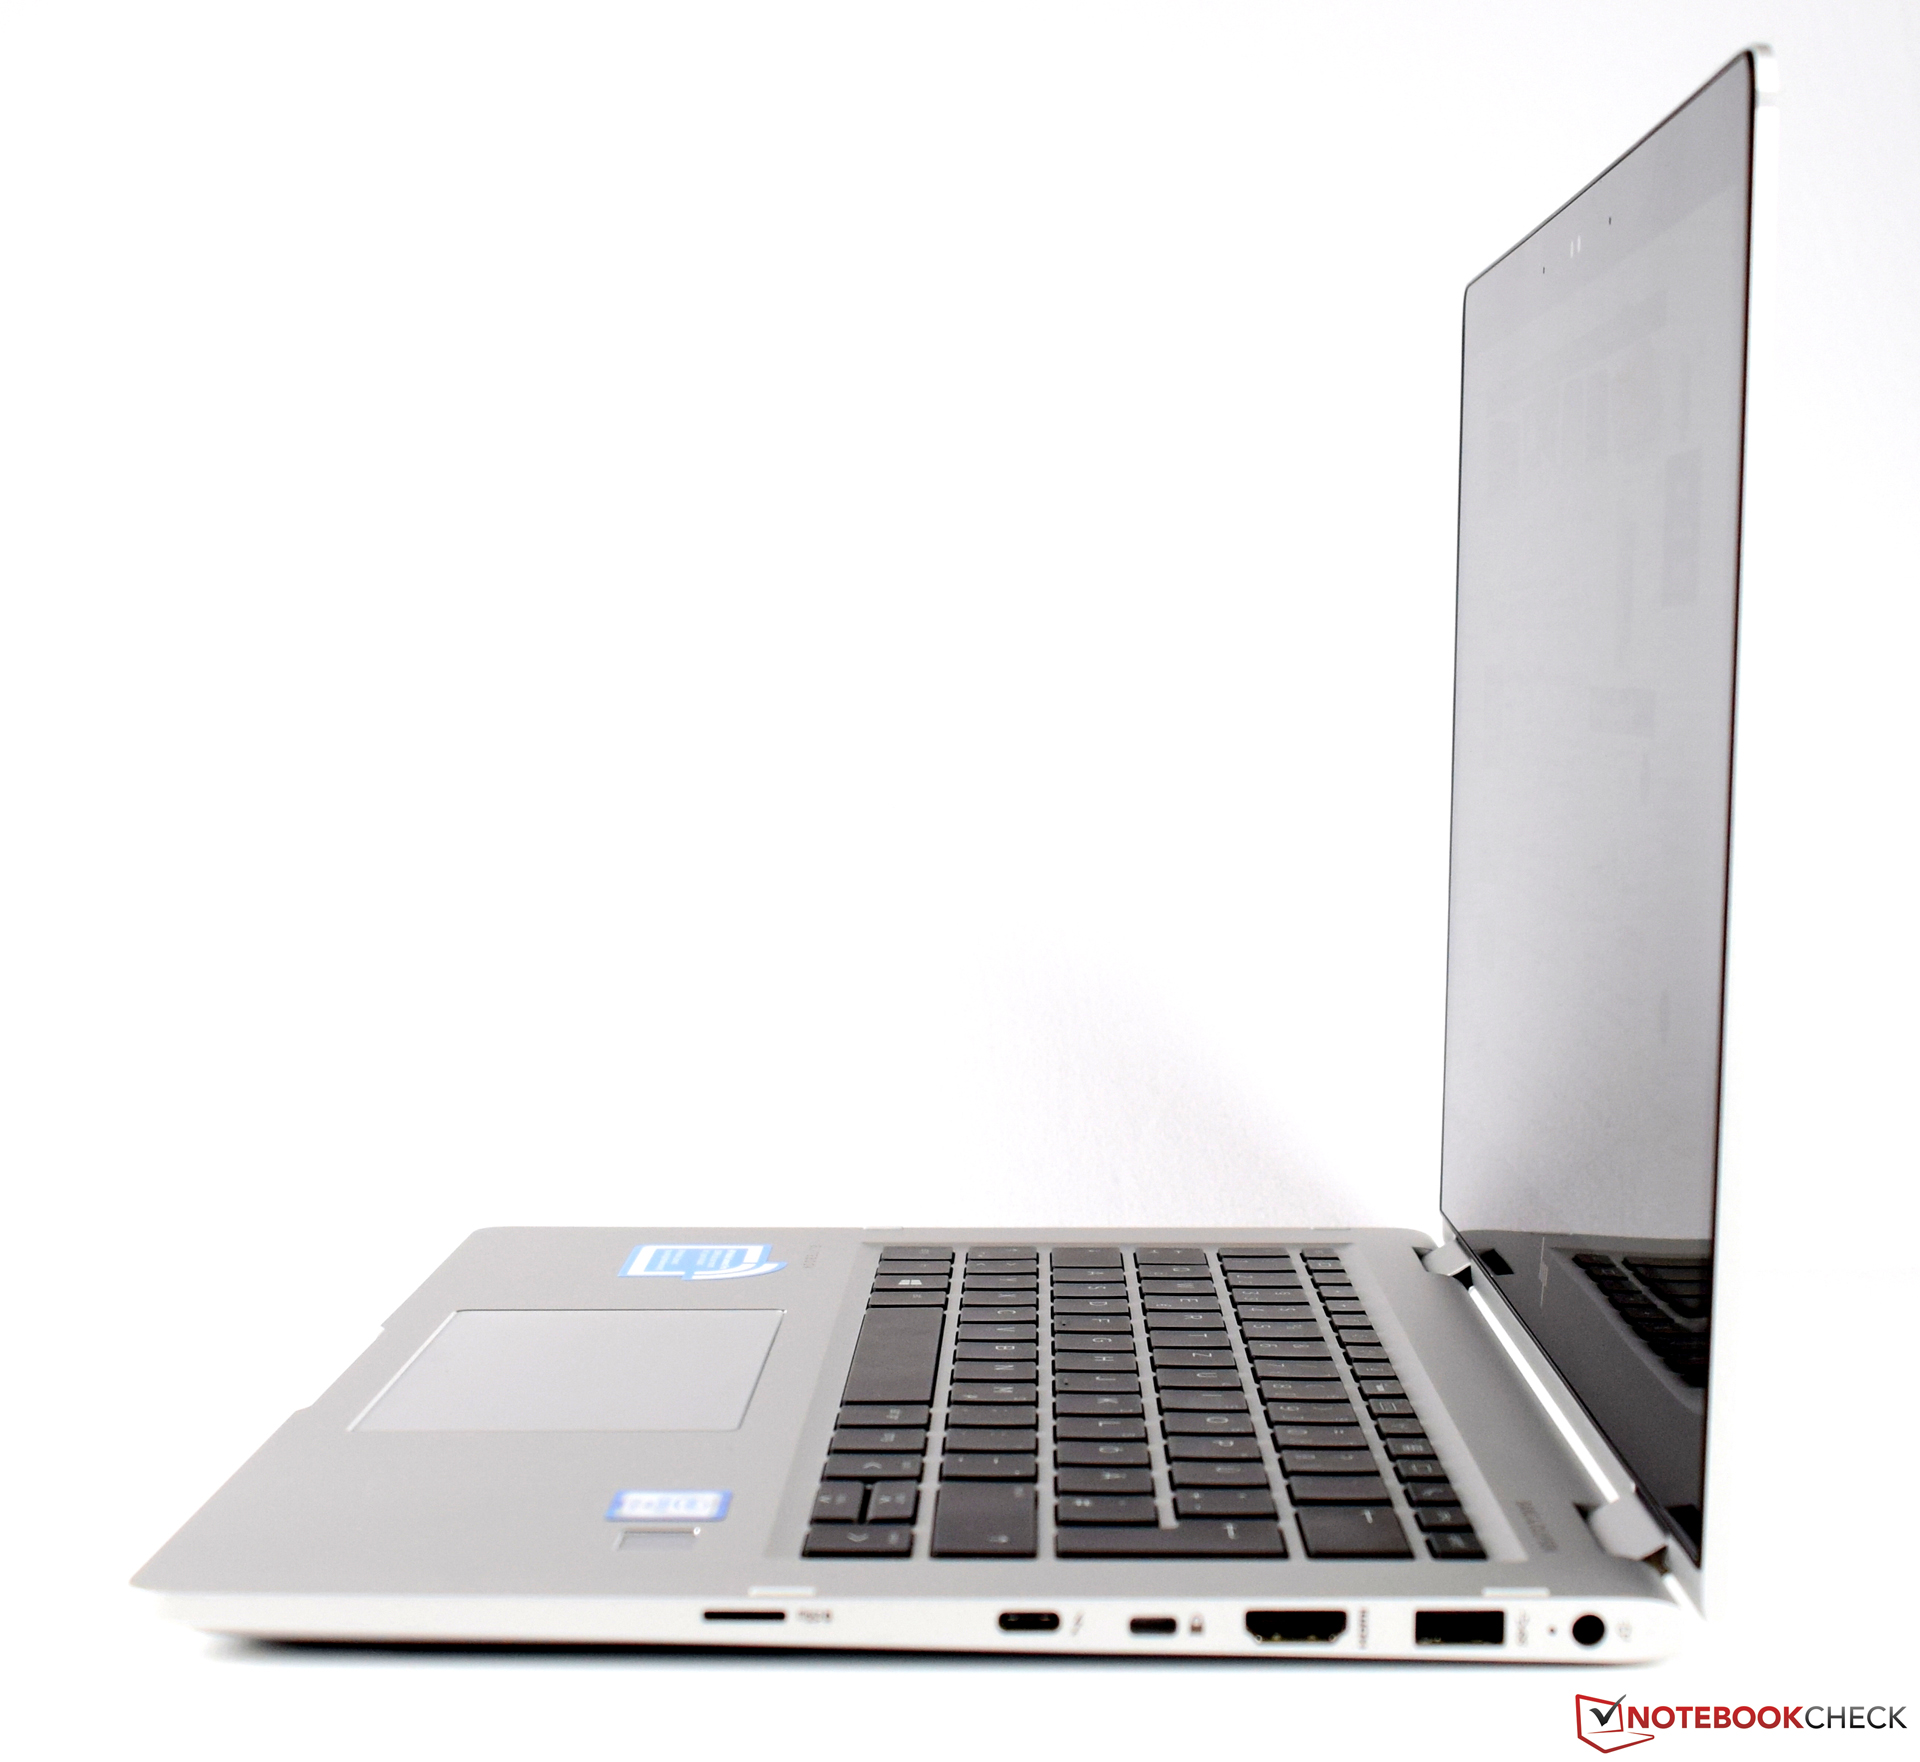
Kısa inceleme: HP EliteBook x360 1030 G2 (Core i5, Full HD) dönüştürülebilir notebook

| Networking | |
| iperf3 transmit AX12 | |
| Lenovo ThinkPad X1 Carbon 2017-20HQS03P00 | |
| Lenovo ThinkPad Yoga 370-20JJS00100 | |
| HP EliteBook x360 1030 G2 | |
| iperf3 receive AX12 | |
| Lenovo ThinkPad Yoga 370-20JJS00100 | |
| Lenovo ThinkPad X1 Carbon 2017-20HQS03P00 | |
| HP EliteBook x360 1030 G2 | |
| |||||||||||||||||||||||||
Aydınlatma: 83 %
Batarya modunda parlaklık: 261 cd/m²
Kontrast: 1048:1 (Siyah: 0.25 cd/m²)
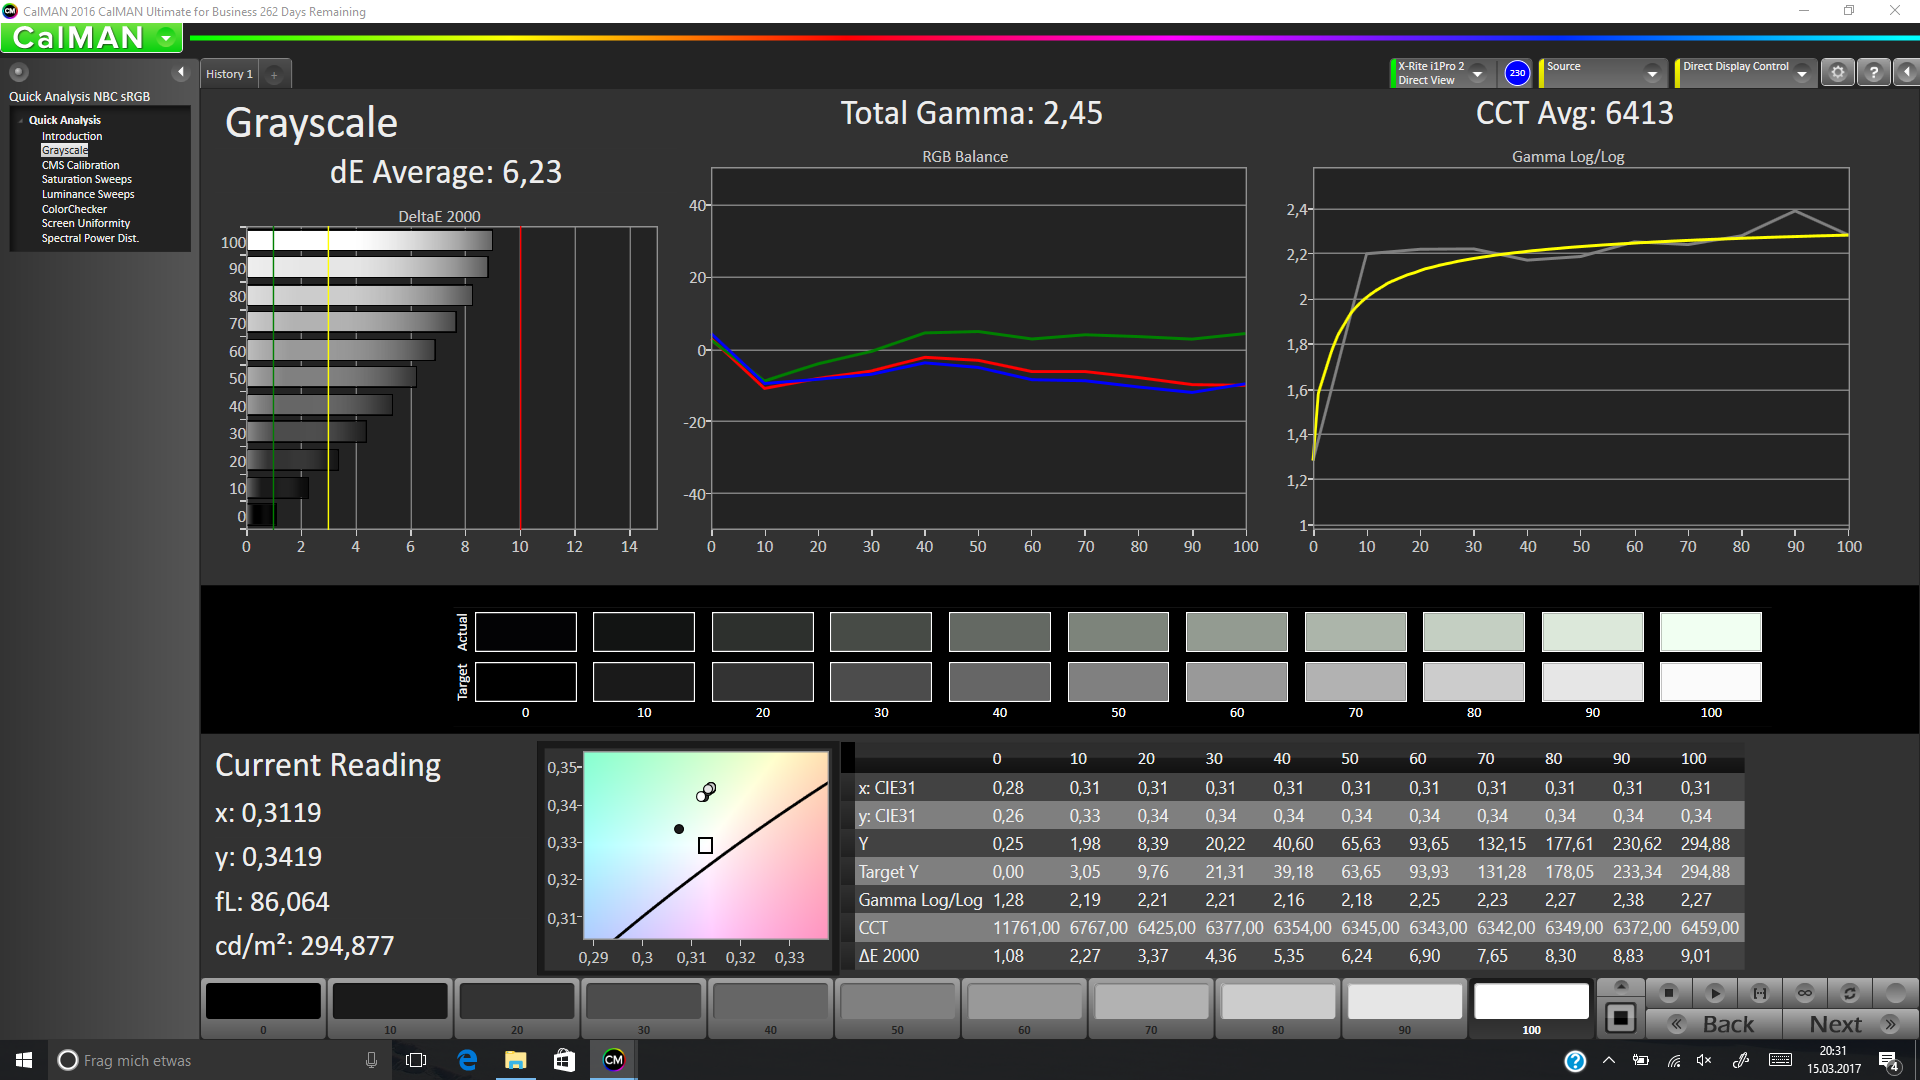
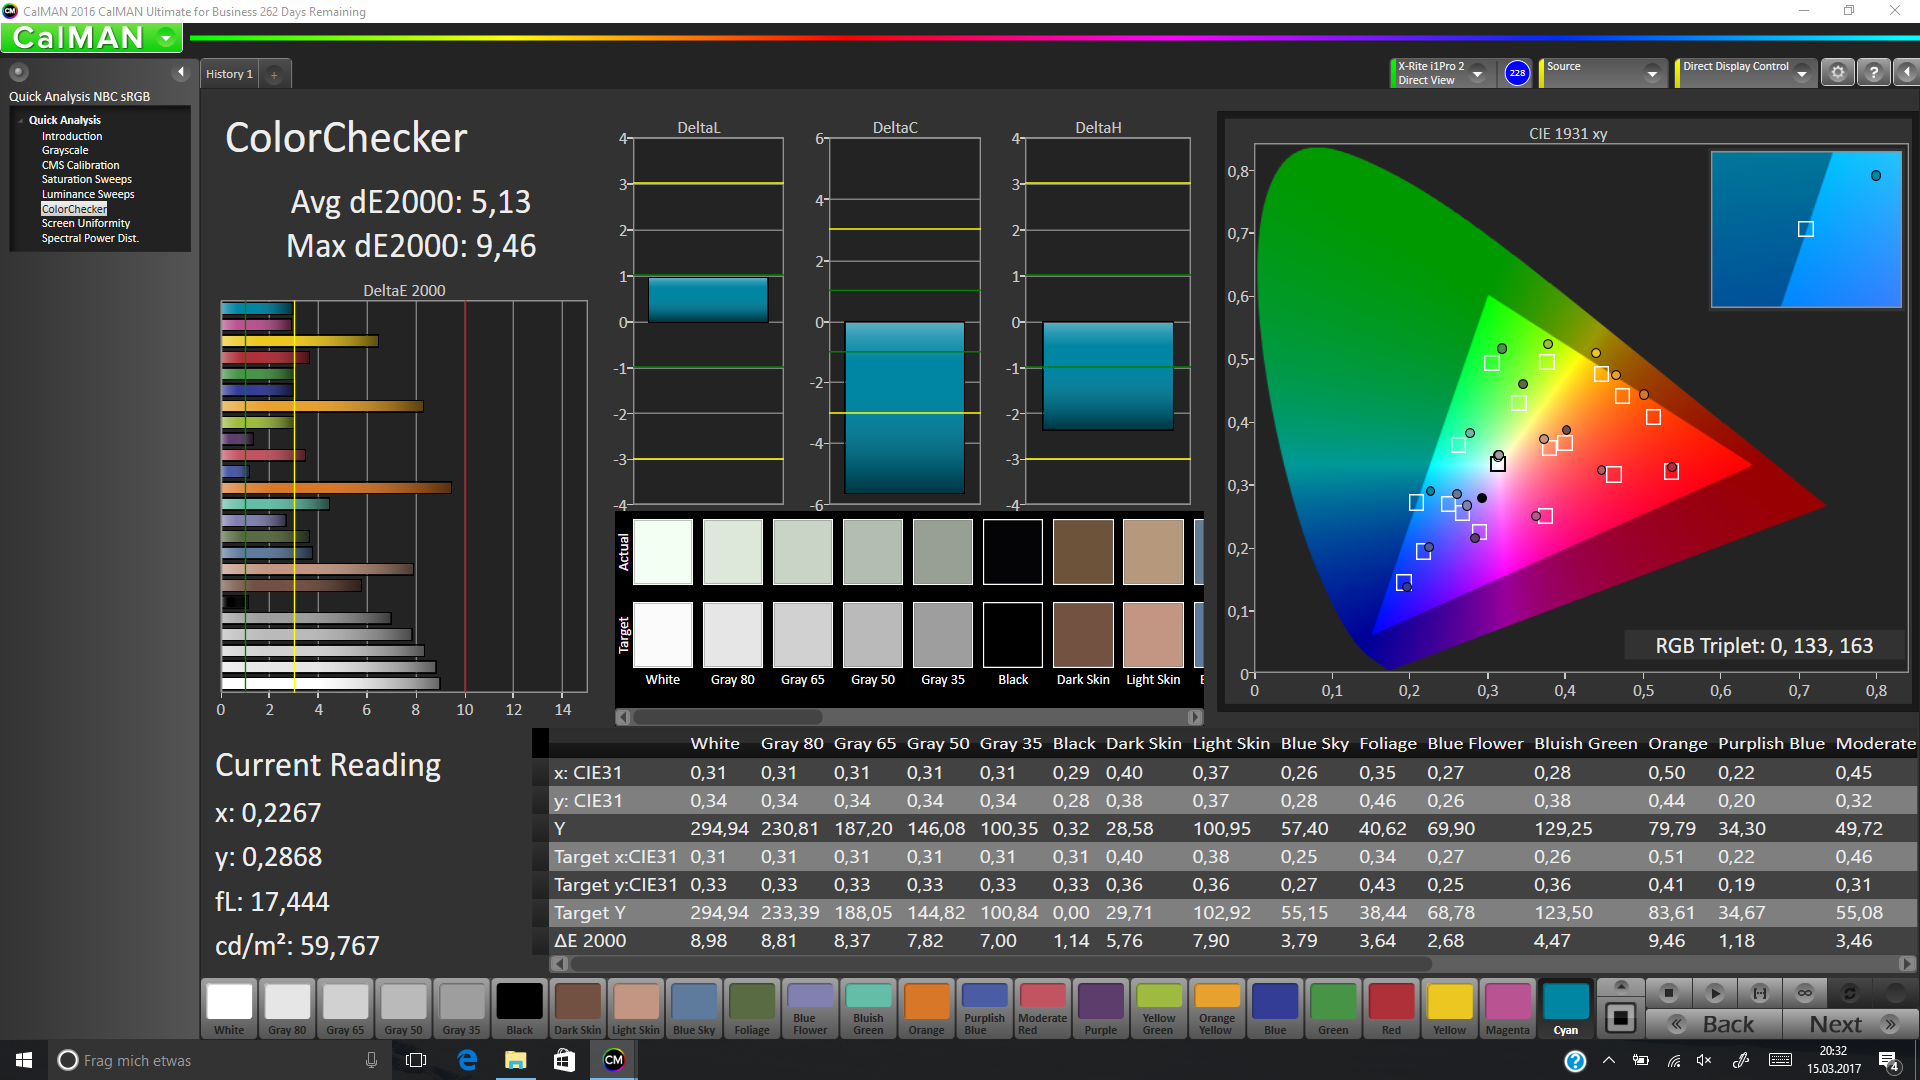
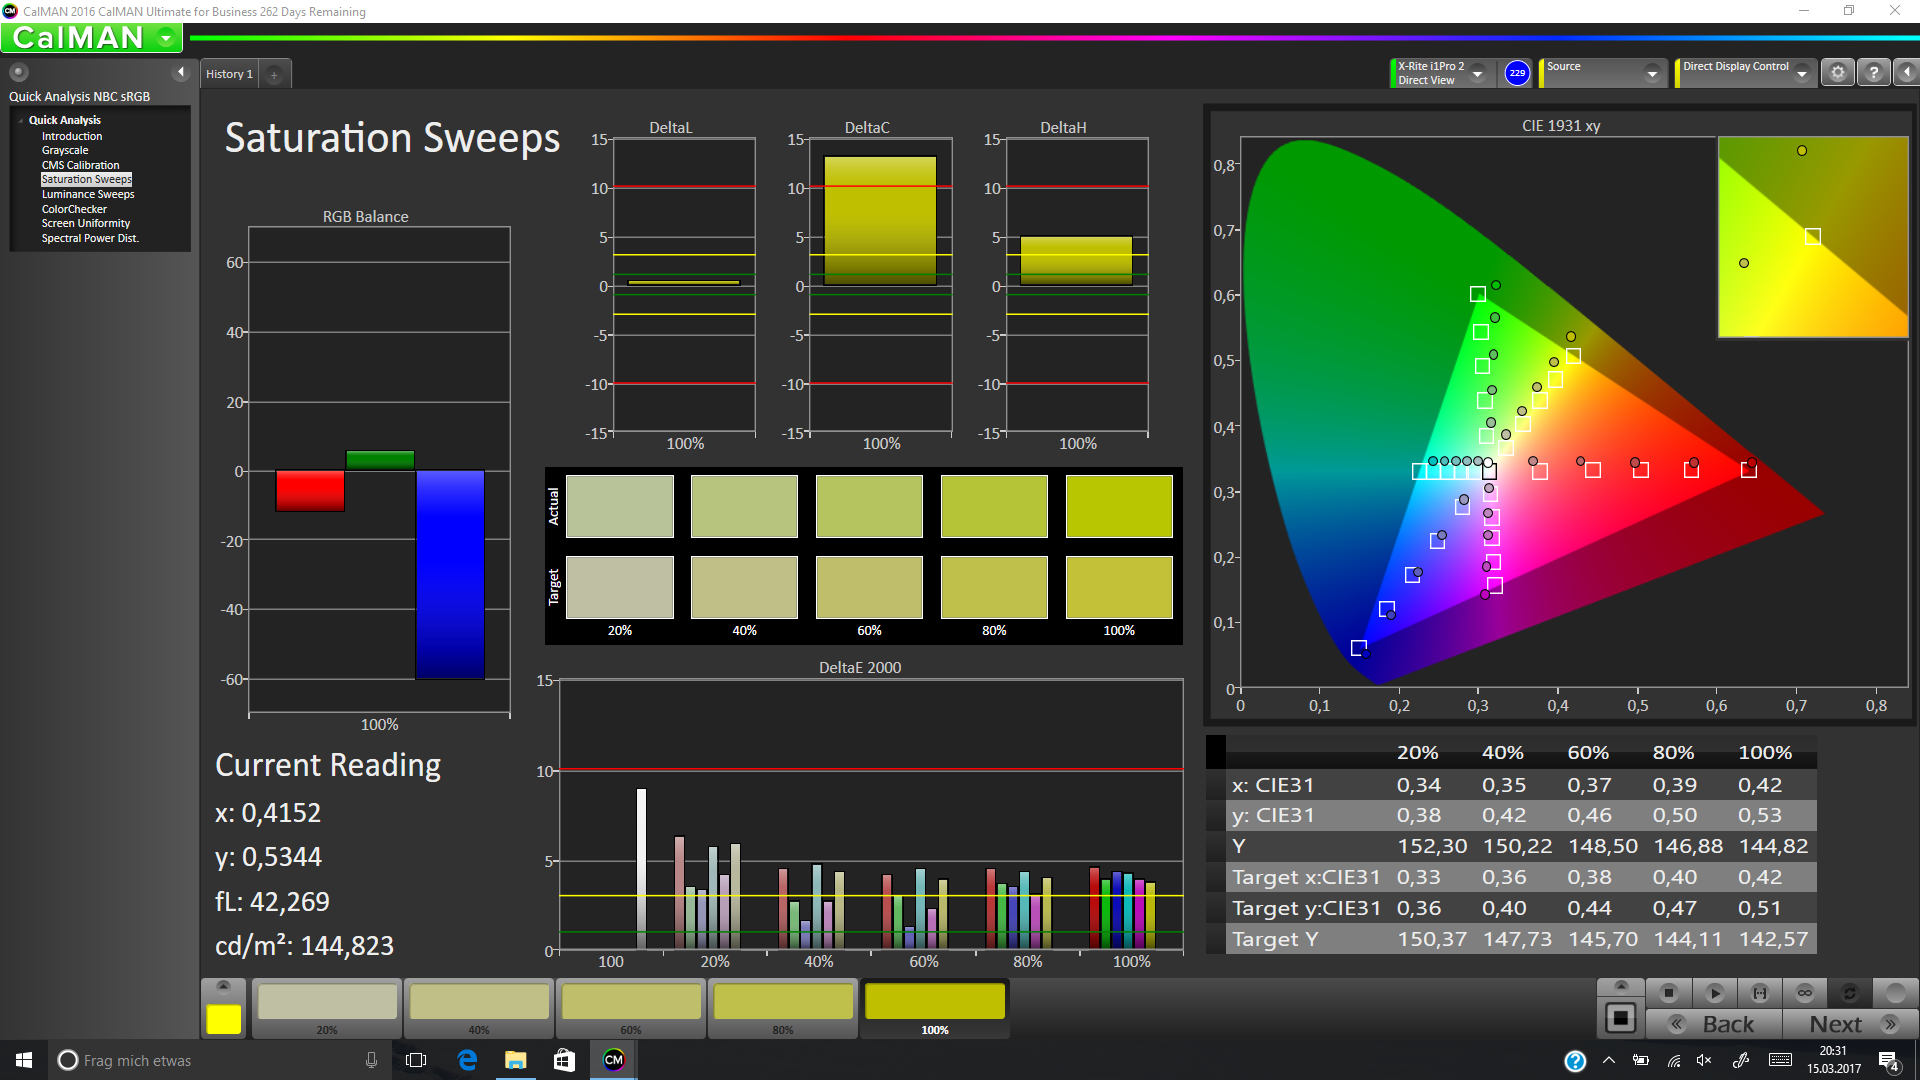
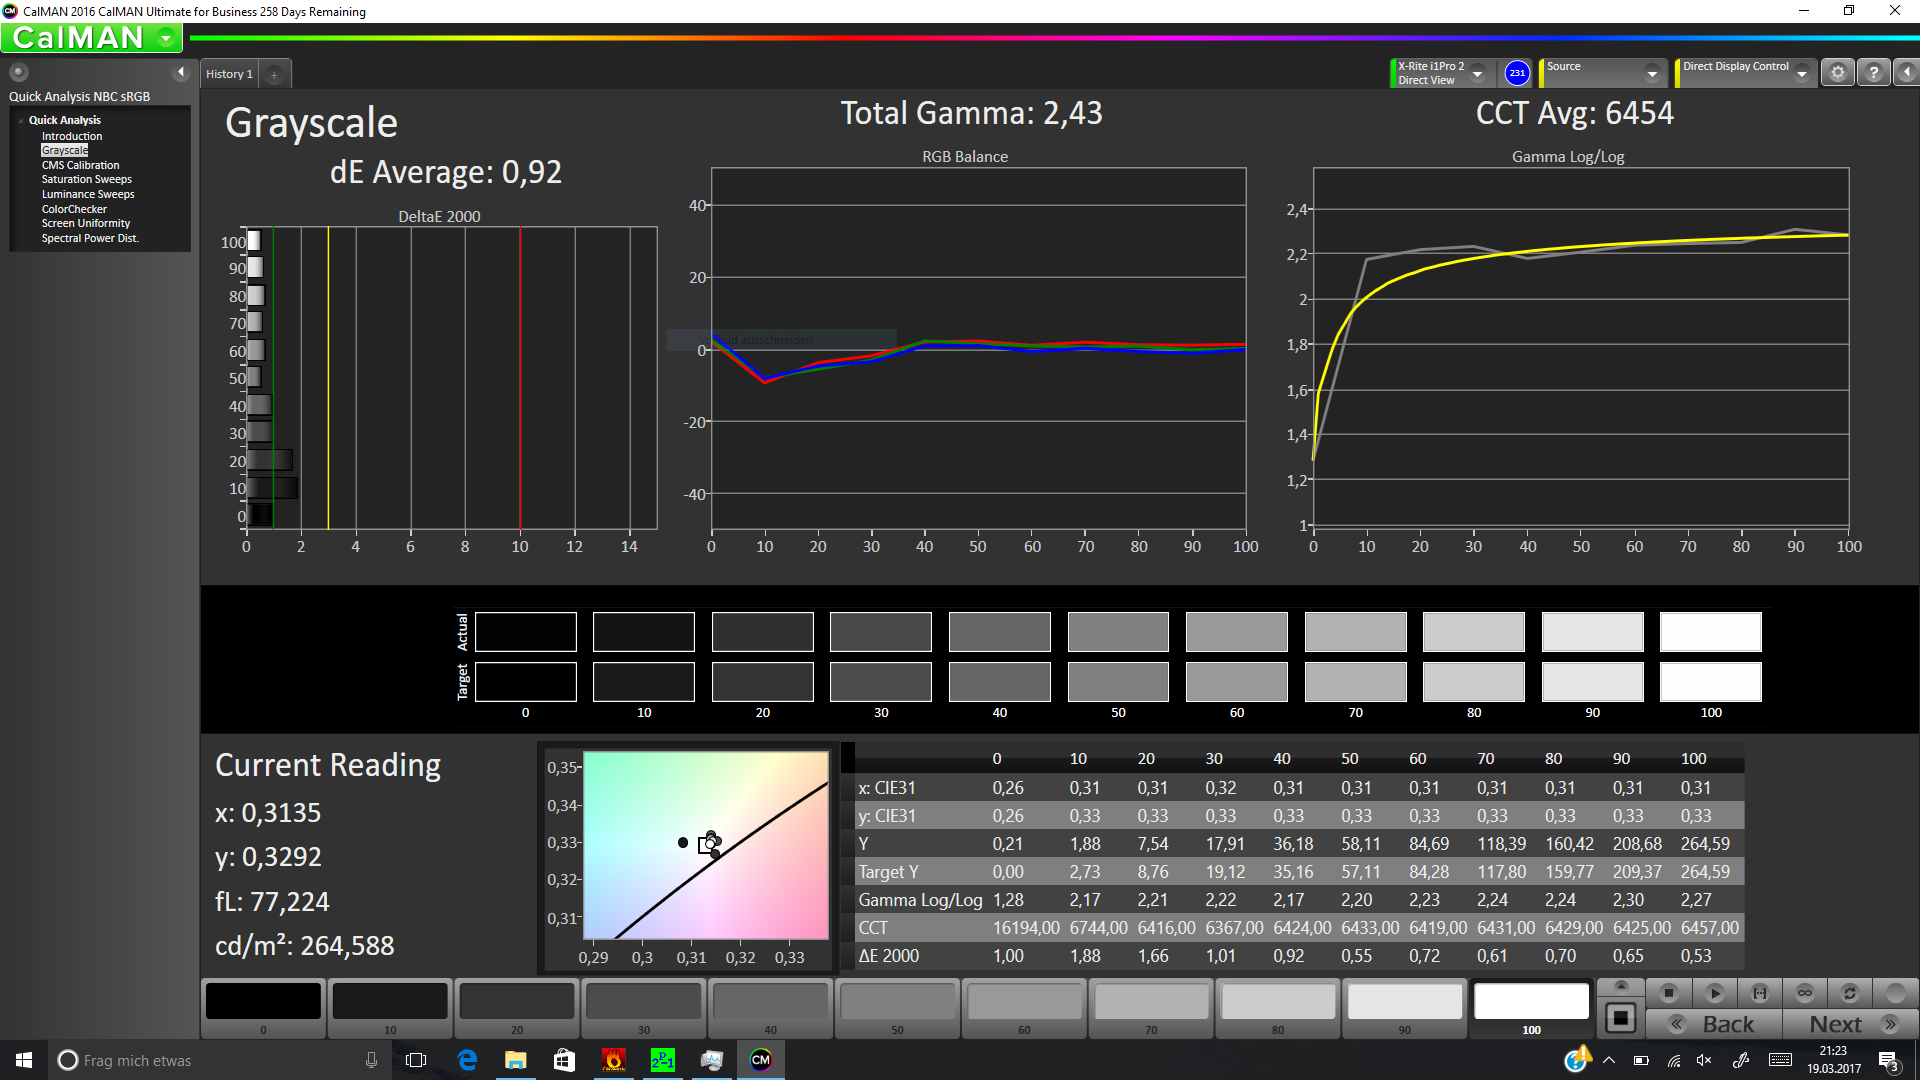
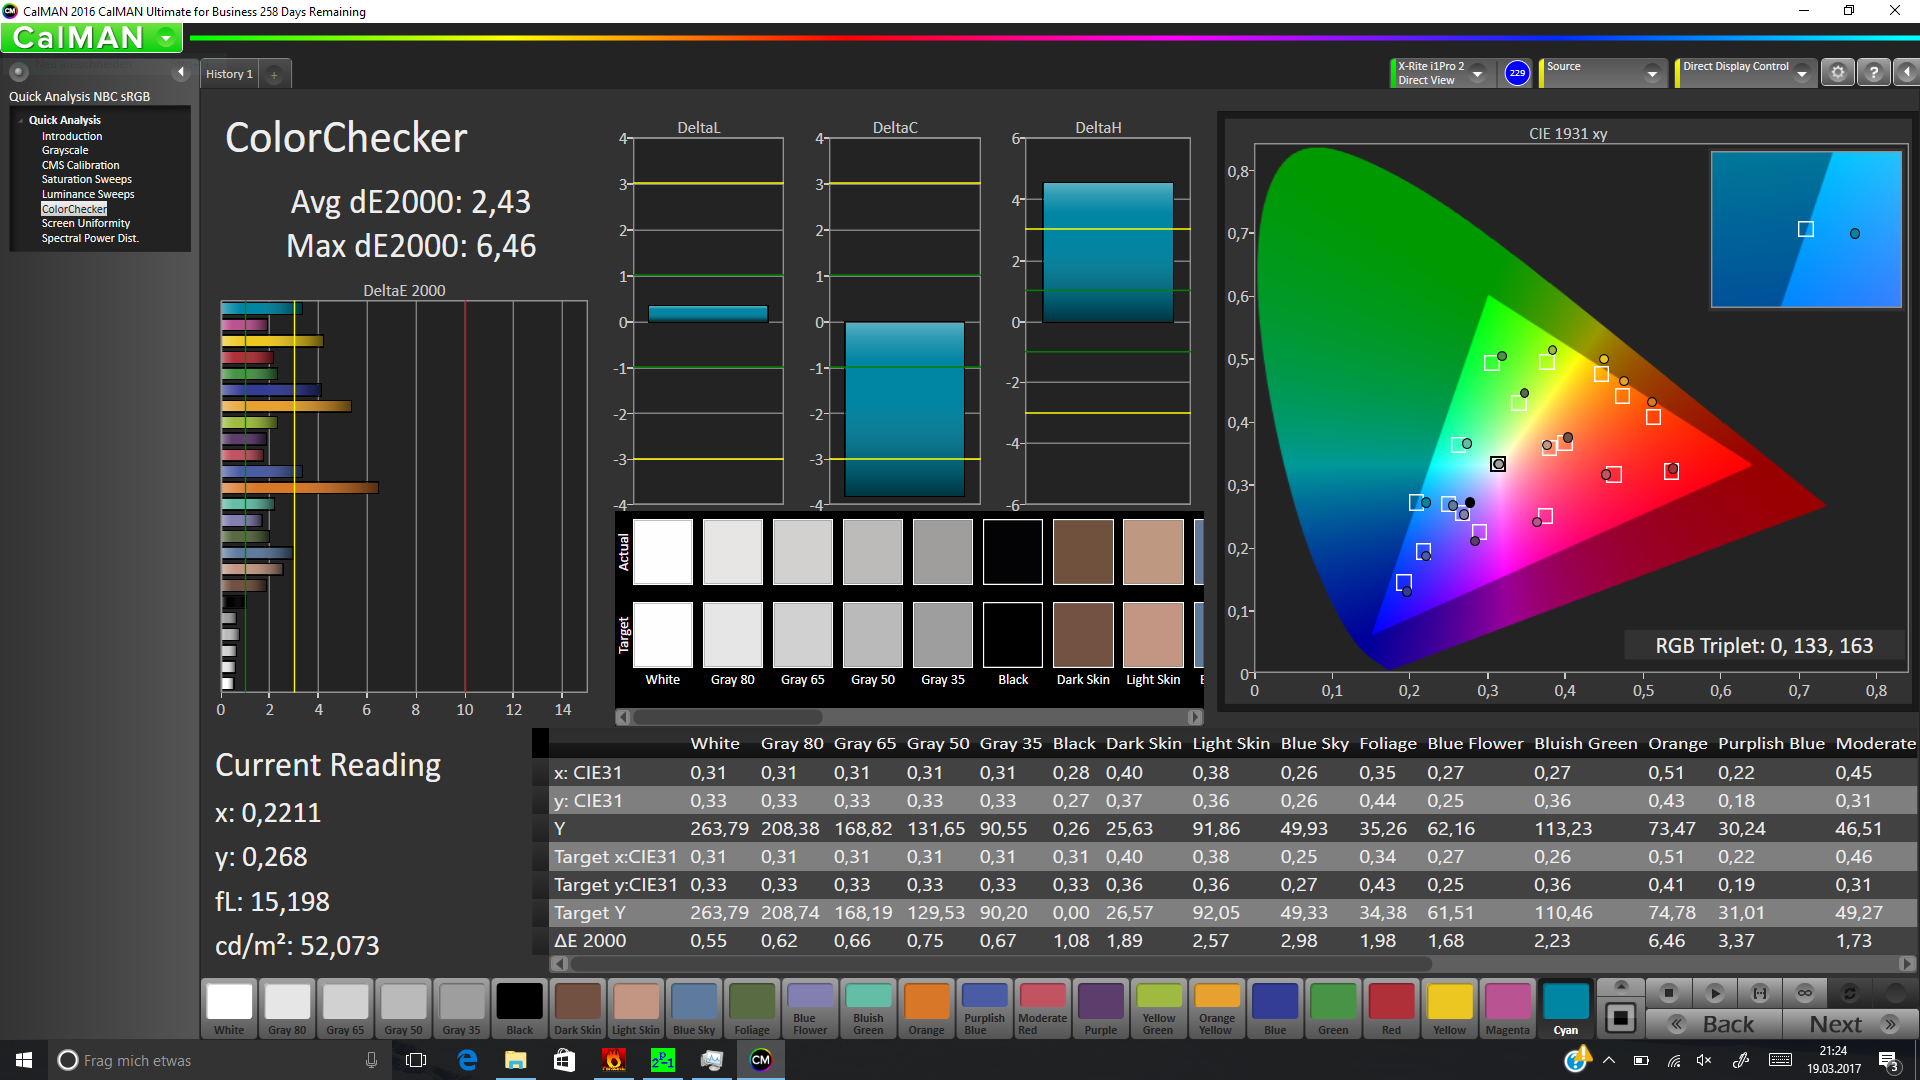
ΔE ColorChecker Calman: 5.13 | ∀{0.5-29.43 Ø4.72}
ΔE Greyscale Calman: 6.23 | ∀{0.09-98 Ø4.97}
88.57% sRGB (Argyll 1.6.3 3D)
57.84% AdobeRGB 1998 (Argyll 1.6.3 3D)
64.9% AdobeRGB 1998 (Argyll 3D)
88.8% sRGB (Argyll 3D)
65.5% Display P3 (Argyll 3D)
Gamma: 2.45
CCT: 6413 K
| HP EliteBook x360 1030 G2 CMN1374, 1920x1080, 13.3" | Lenovo Yoga 910-13IKB-80VF004CGE AU Optronics AUO323D / B139HAN03.2, 3840x2160, 13.9" | Lenovo ThinkPad X1 Yoga-20FRS1VS00 Samsung ATNA40JU01-0, 2560x1440, 14" | Lenovo ThinkPad X1 Carbon 2017-20HQS03P00 B140HAN03_1, 1920x1080, 14" | Dell Latitude 13 7370 Sharp LQ133M1, 1920x1080, 13.3" | HP Spectre x360 13-w023dx Chi Mei CMN1367, 1920x1080, 13.3" | Lenovo ThinkPad Yoga 370-20JJS00100 Sharp LQ133M1JX15, 1920x1080, 13.3" | |
|---|---|---|---|---|---|---|---|
| Display | -2% | -4% | -16% | 1% | 7% | ||
| Display P3 Coverage (%) | 65.5 | 62.2 -5% | 61.4 -6% | 52.2 -20% | 65.4 0% | 67.9 4% | |
| sRGB Coverage (%) | 88.8 | 90.1 1% | 85.9 -3% | 78.3 -12% | 90.4 2% | 97.3 10% | |
| AdobeRGB 1998 Coverage (%) | 64.9 | 63.5 -2% | 62.4 -4% | 53.9 -17% | 65.8 1% | 69.9 8% | |
| Response Times | 15% | 97% | 5% | -8% | 19% | 2% | |
| Response Time Grey 50% / Grey 80% * (ms) | 55.2 ? | 46 ? 17% | 1 ? 98% | 41.6 ? 25% | 50.4 ? 9% | 33.2 ? 40% | 42 ? 24% |
| Response Time Black / White * (ms) | 27.2 ? | 24 ? 12% | 1 ? 96% | 31.6 ? -16% | 33.6 ? -24% | 28 ? -3% | 32.8 ? -21% |
| PWM Frequency (Hz) | 240 ? | 217.4 ? | |||||
| Screen | -4% | 16% | 5% | -1% | -5% | 9% | |
| Brightness middle (cd/m²) | 262 | 348 33% | 279 6% | 311 19% | 261 0% | 334.6 28% | 374 43% |
| Brightness (cd/m²) | 256 | 310 21% | 277 8% | 288 13% | 241 -6% | 319 25% | 356 39% |
| Brightness Distribution (%) | 83 | 80 -4% | 91 10% | 85 2% | 85 2% | 90 8% | 87 5% |
| Black Level * (cd/m²) | 0.25 | 0.25 -0% | 0.24 4% | 0.26 -4% | 0.336 -34% | 0.33 -32% | |
| Contrast (:1) | 1048 | 1392 33% | 1296 24% | 1004 -4% | 996 -5% | 1133 8% | |
| Colorchecker dE 2000 * | 5.13 | 7.86 -53% | 5.15 -0% | 5.5 -7% | 4.3 16% | 6.21 -21% | 4.7 8% |
| Colorchecker dE 2000 max. * | 9.46 | 13.43 -42% | 8.28 12% | 9 5% | 8.66 8% | 12 -27% | 9.5 -0% |
| Greyscale dE 2000 * | 6.23 | 8.25 -32% | 5.44 13% | 6.2 -0% | 5.82 7% | 7.71 -24% | 6.5 -4% |
| Gamma | 2.45 90% | 2.05 107% | 2.28 96% | 2.02 109% | 2.44 90% | 2.36 93% | 2.19 100% |
| CCT | 6413 101% | 6834 95% | 5686 114% | 5950 109% | 6771 96% | 6458 101% | 7086 92% |
| Color Space (Percent of AdobeRGB 1998) (%) | 57.84 | 58 0% | 98 69% | 55.96 -3% | 49.18 -15% | 58.6 1% | 63.1 9% |
| Color Space (Percent of sRGB) (%) | 88.57 | 90 2% | 100 13% | 85.77 -3% | 77.84 -12% | 90 2% | 97.2 10% |
| Toplam Ortalama (Program / Ayarlar) | 3% /
-1% | 57% /
33% | 2% /
3% | -8% /
-5% | 5% /
-0% | 6% /
7% |
* ... daha küçük daha iyidir

Yanıt Sürelerini Görüntüle
| ↔ Tepki Süresi Siyahtan Beyaza | ||
|---|---|---|
| 27.2 ms ... yükseliş ↗ ve sonbahar↘ birleşimi | ↗ 7.6 ms yükseliş | 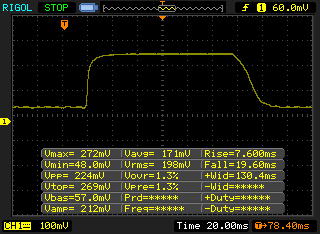 |
| ↘ 19.6 ms sonbahar | ||
| Ekran, testlerimizde nispeten yavaş yanıt oranları gösteriyor ve oyuncular için çok yavaş olabilir. Karşılaştırıldığında, test edilen tüm cihazlar 0.1 (minimum) ile 240 (maksimum) ms arasında değişir. » Tüm cihazların 69 %'si daha iyi. Bu, ölçülen yanıt süresinin test edilen tüm cihazların ortalamasından (19.9 ms) daha kötü olduğu anlamına gelir. | ||
| ↔ Tepki Süresi %50 Griden %80 Griye | ||
| 55.2 ms ... yükseliş ↗ ve sonbahar↘ birleşimi | ↗ 21.2 ms yükseliş | 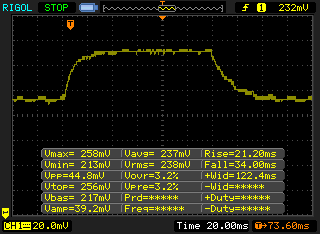 |
| ↘ 34 ms sonbahar | ||
| Ekran, testlerimizde yavaş yanıt oranları gösteriyor ve oyuncular için yetersiz olacaktır. Karşılaştırıldığında, test edilen tüm cihazlar 0.165 (minimum) ile 636 (maksimum) ms arasında değişir. » Tüm cihazların 92 %'si daha iyi. Bu, ölçülen yanıt süresinin test edilen tüm cihazların ortalamasından (31.1 ms) daha kötü olduğu anlamına gelir. | ||
Ekran Titremesi / PWM (Darbe Genişliği Modülasyonu)
| Ekran titriyor / PWM algılanmadı | ||
Karşılaştırıldığında: Test edilen tüm cihazların %52 %'si ekranı karartmak için PWM kullanmıyor. PWM tespit edilirse, ortalama 7784 (minimum: 5 - maksimum: 343500) Hz ölçüldü. | ||
| Cinebench R15 | |
| CPU Single 64Bit | |
| Lenovo Yoga 910-13IKB-80VF004CGE | |
| HP EliteBook x360 1030 G2 | |
| Lenovo ThinkPad X1 Carbon 2017-20HQS03P00 | |
| Lenovo ThinkPad X1 Yoga-20FRS1VS00 | |
| HP Spectre x360 13-w023dx | |
| Lenovo ThinkPad Yoga 370-20JJS00100 | |
| Dell Latitude 13 7370 | |
| CPU Multi 64Bit | |
| Lenovo ThinkPad X1 Carbon 2017-20HQS03P00 | |
| Lenovo Yoga 910-13IKB-80VF004CGE | |
| HP EliteBook x360 1030 G2 | |
| HP Spectre x360 13-w023dx | |
| Lenovo ThinkPad Yoga 370-20JJS00100 | |
| Lenovo ThinkPad X1 Yoga-20FRS1VS00 | |
| Dell Latitude 13 7370 | |
| Cinebench R11.5 | |
| CPU Single 64Bit | |
| HP Spectre x360 13-w023dx | |
| HP EliteBook x360 1030 G2 | |
| Lenovo ThinkPad X1 Yoga-20FRS1VS00 | |
| Dell Latitude 13 7370 | |
| CPU Multi 64Bit | |
| HP EliteBook x360 1030 G2 | |
| HP Spectre x360 13-w023dx | |
| Lenovo ThinkPad X1 Yoga-20FRS1VS00 | |
| Dell Latitude 13 7370 | |
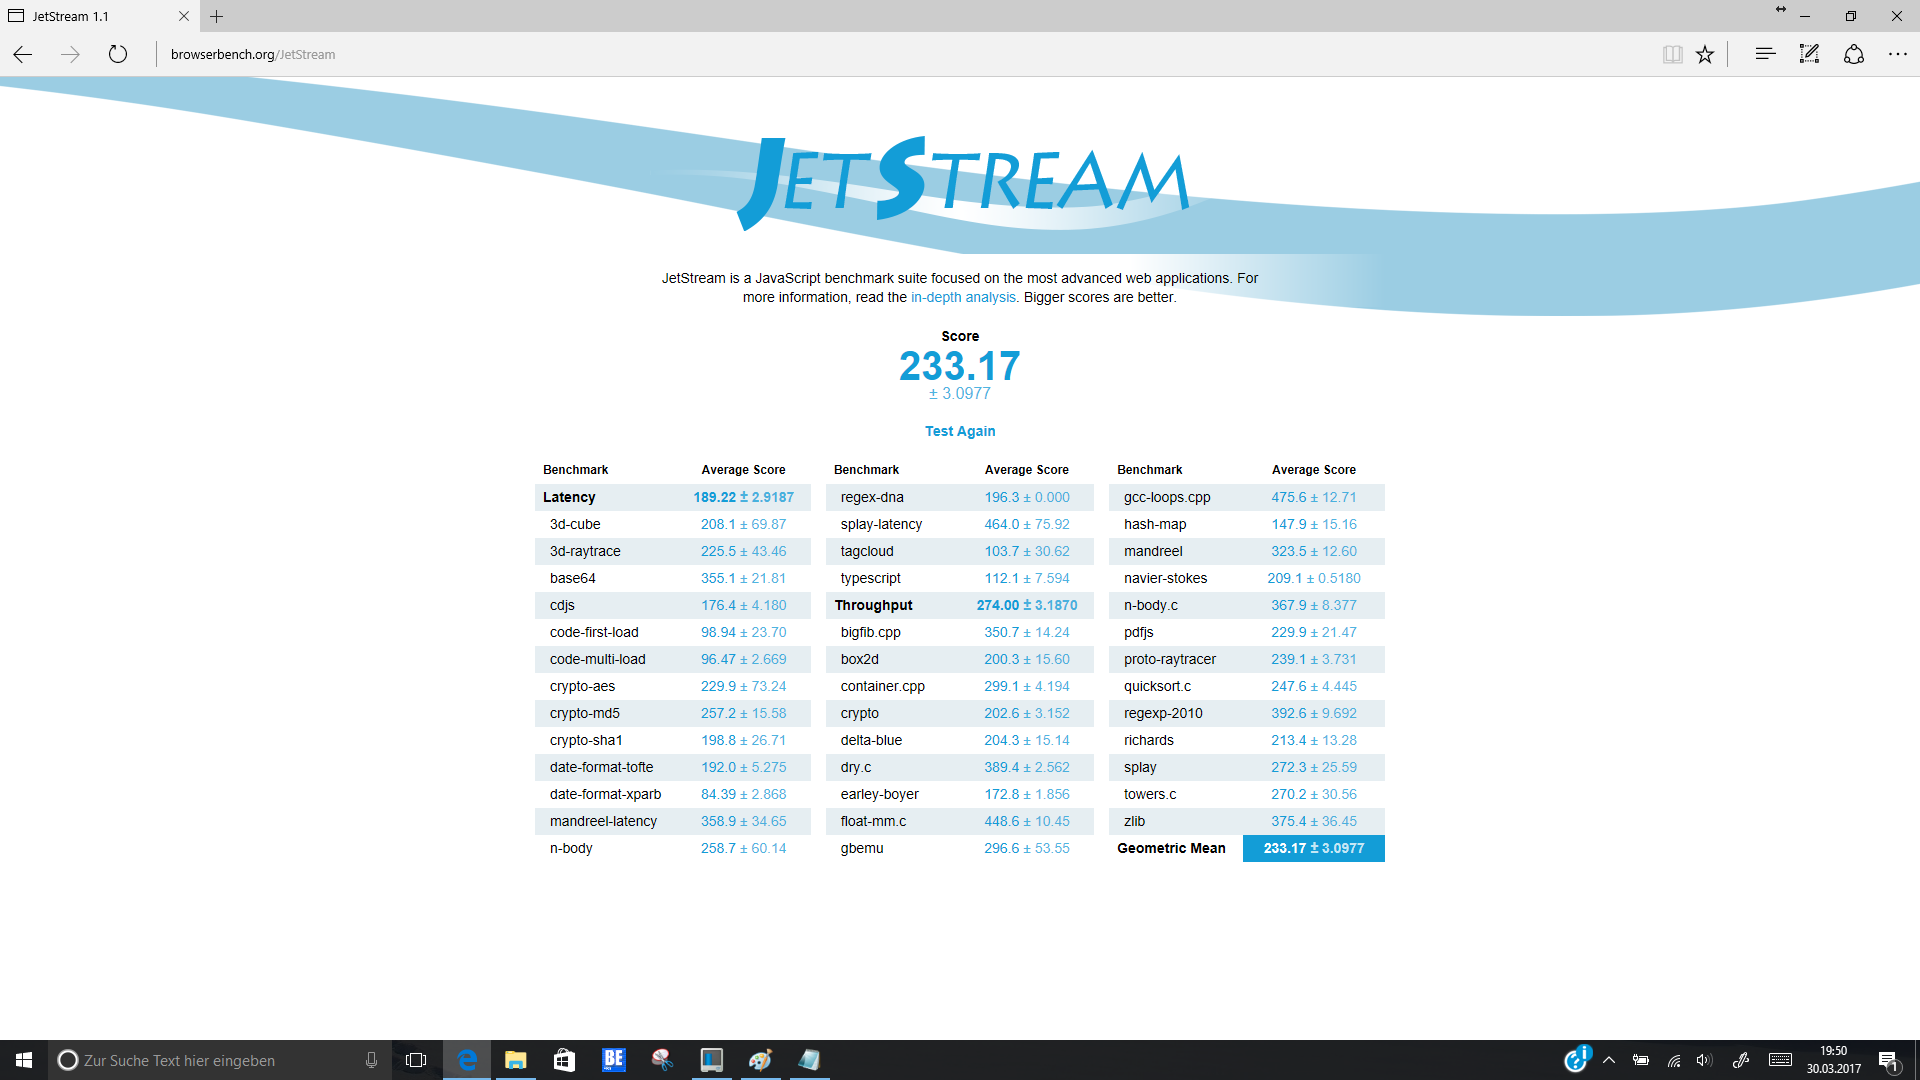
| JetStream 1.1 - 1.1 Total | |
| Lenovo Yoga 910-13IKB-80VF004CGE | |
| Lenovo ThinkPad X1 Carbon 2017-20HQS03P00 | |
| HP EliteBook x360 1030 G2 | |
| Lenovo ThinkPad Yoga 370-20JJS00100 | |
| Lenovo ThinkPad X1 Yoga-20FRS1VS00 | |
| Dell Latitude 13 7370 | |
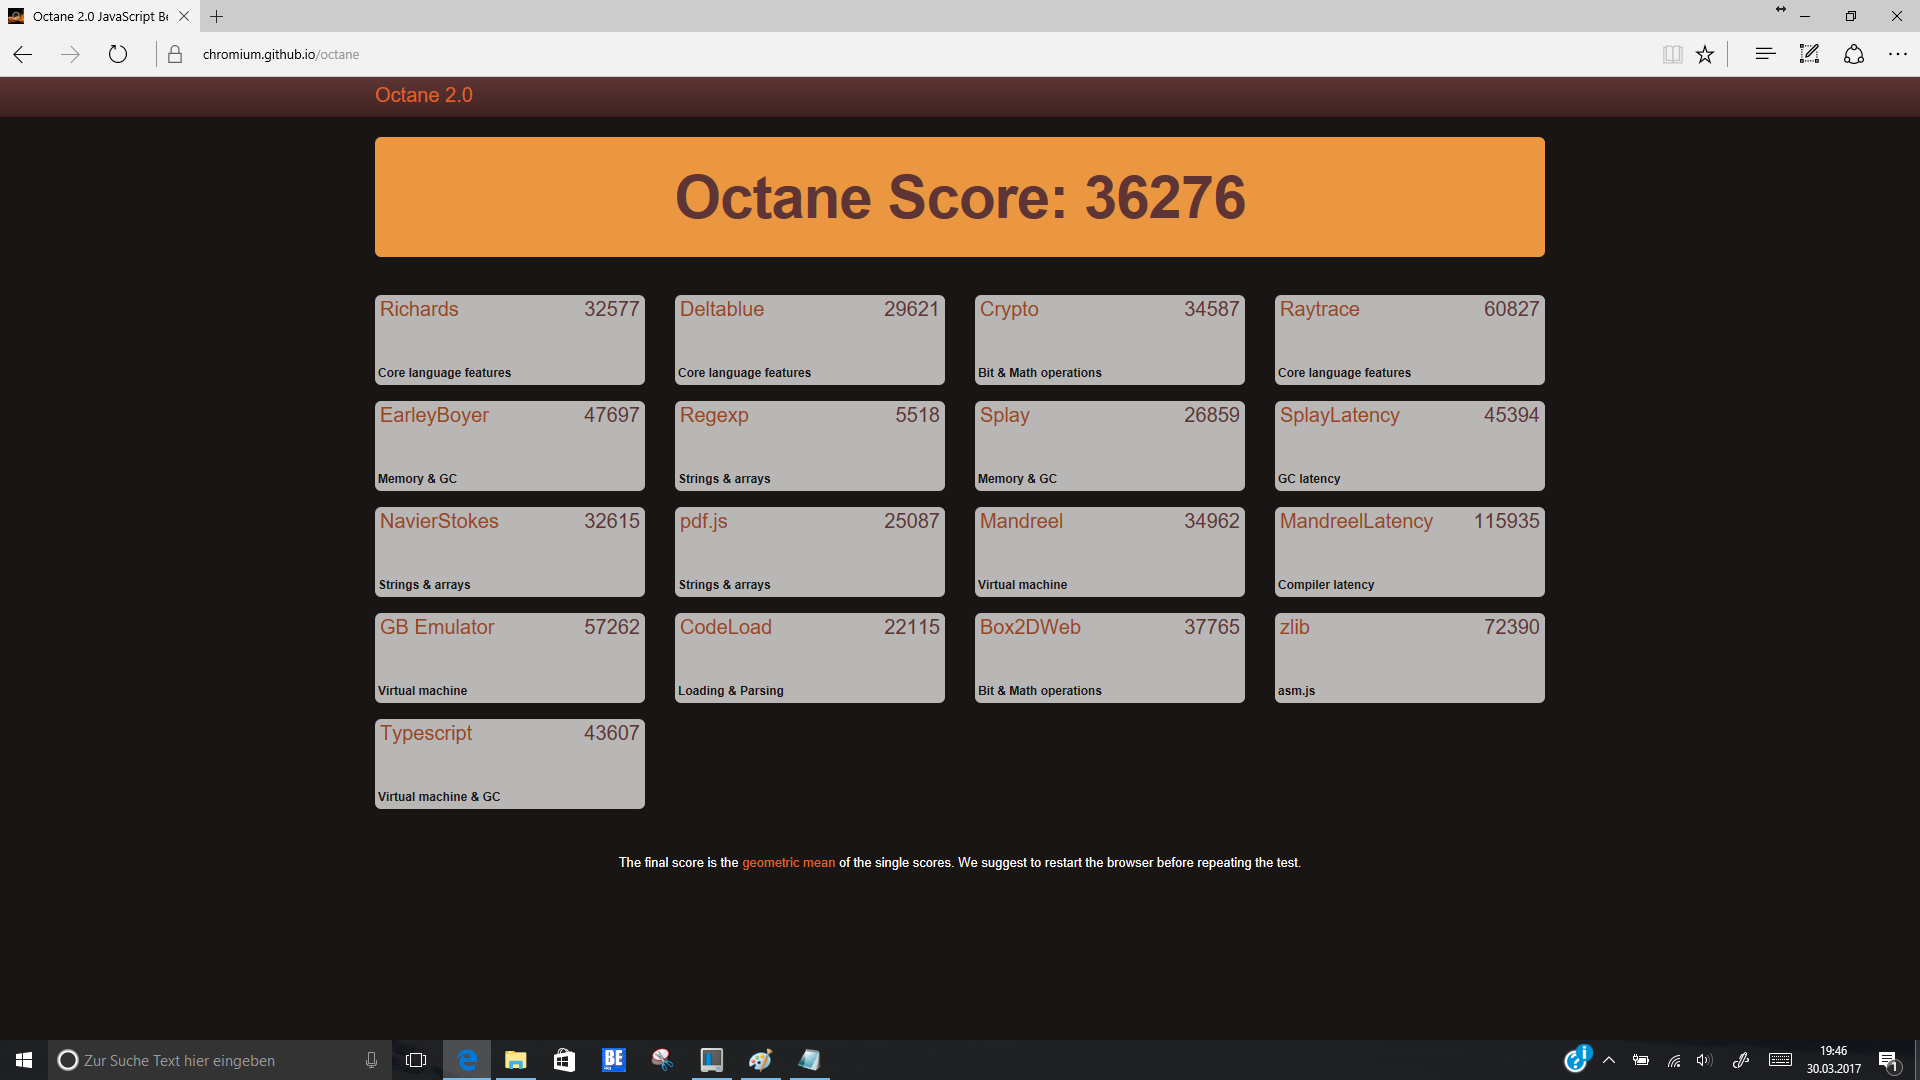
| Octane V2 - Total Score | |
| Lenovo Yoga 910-13IKB-80VF004CGE | |
| HP EliteBook x360 1030 G2 | |
| Lenovo ThinkPad X1 Carbon 2017-20HQS03P00 | |
| Lenovo ThinkPad Yoga 370-20JJS00100 | |
| Lenovo ThinkPad X1 Yoga-20FRS1VS00 | |
| Dell Latitude 13 7370 | |
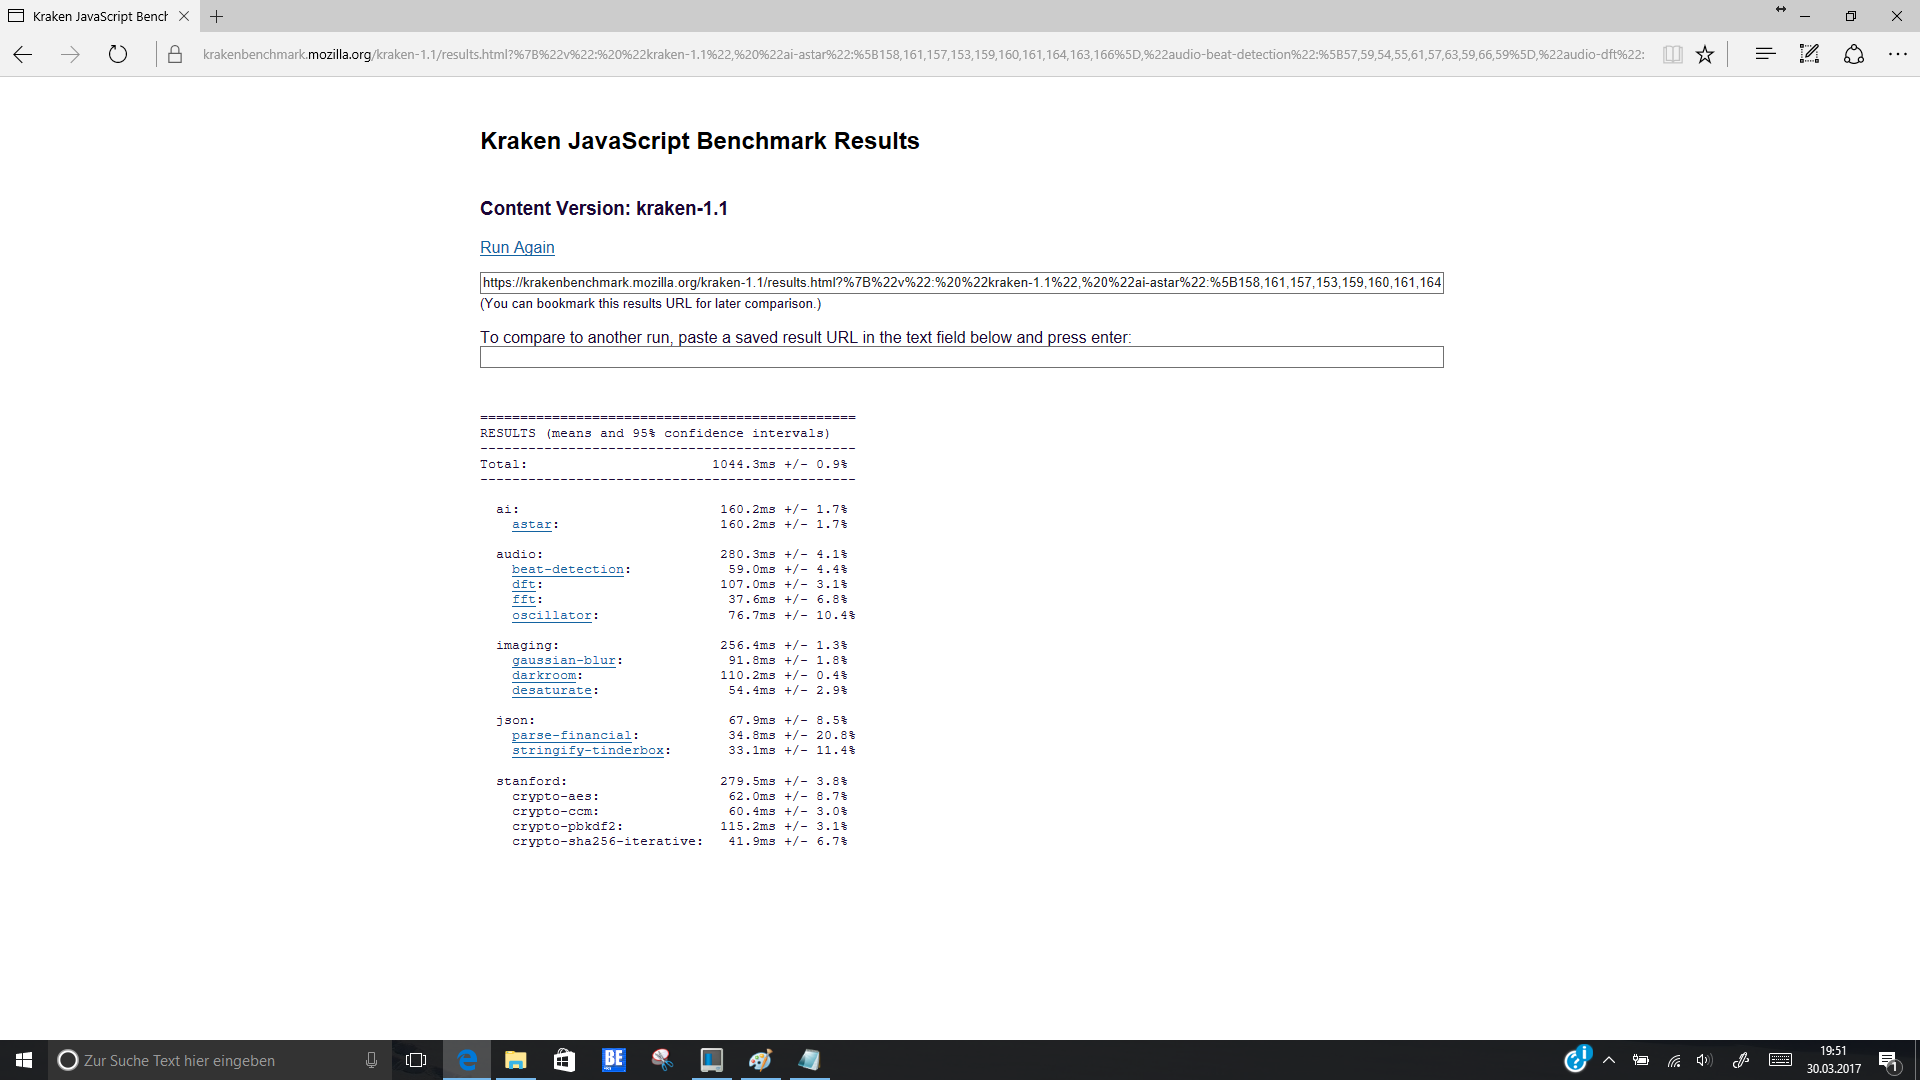
| Mozilla Kraken 1.1 - Total | |
| Dell Latitude 13 7370 | |
| Lenovo ThinkPad X1 Yoga-20FRS1VS00 | |
| Lenovo ThinkPad Yoga 370-20JJS00100 | |
| HP EliteBook x360 1030 G2 | |
| Lenovo ThinkPad X1 Carbon 2017-20HQS03P00 | |
| Lenovo Yoga 910-13IKB-80VF004CGE | |
* ... daha küçük daha iyidir
| PCMark 8 | |
| Home Score Accelerated v2 | |
| Lenovo ThinkPad X1 Carbon 2017-20HQS03P00 | |
| HP Spectre x360 13-w023dx | |
| HP EliteBook x360 1030 G2 | |
| Lenovo Yoga 910-13IKB-80VF004CGE | |
| Lenovo ThinkPad Yoga 370-20JJS00100 | |
| Lenovo ThinkPad X1 Yoga-20FRS1VS00 | |
| Dell Latitude 13 7370 | |
| Work Score Accelerated v2 | |
| Lenovo ThinkPad X1 Carbon 2017-20HQS03P00 | |
| HP Spectre x360 13-w023dx | |
| HP EliteBook x360 1030 G2 | |
| Lenovo ThinkPad X1 Yoga-20FRS1VS00 | |
| Lenovo ThinkPad Yoga 370-20JJS00100 | |
| Dell Latitude 13 7370 | |
| Creative Score Accelerated v2 | |
| Lenovo ThinkPad X1 Carbon 2017-20HQS03P00 | |
| HP EliteBook x360 1030 G2 | |
| HP Spectre x360 13-w023dx | |
| Lenovo ThinkPad Yoga 370-20JJS00100 | |
| Dell Latitude 13 7370 | |
| PCMark 7 | |
| Score | |
| Dell Latitude 13 7370 | |
| Productivity | |
| Dell Latitude 13 7370 | |
| PCMark 8 Home Score Accelerated v2 | 3774 puan | |
| PCMark 8 Creative Score Accelerated v2 | 4781 puan | |
| PCMark 8 Work Score Accelerated v2 | 4803 puan | |
Yardım | ||
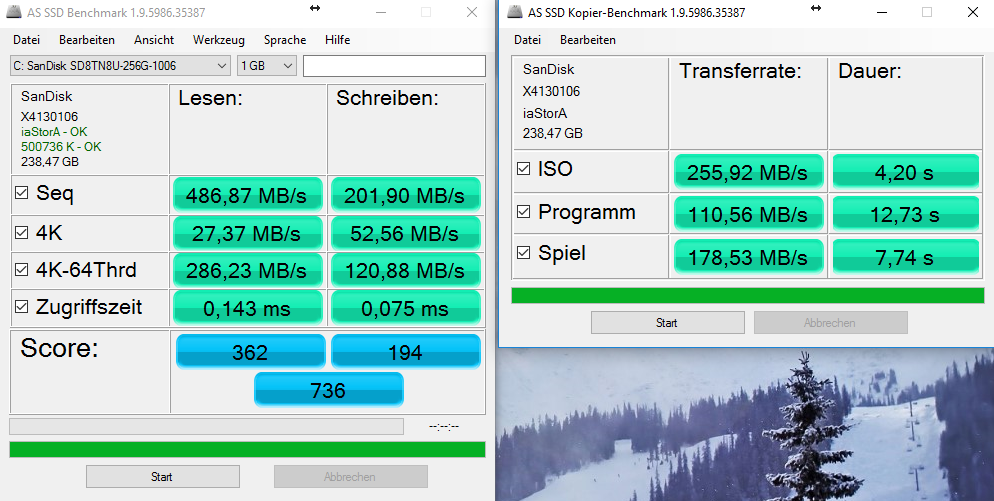
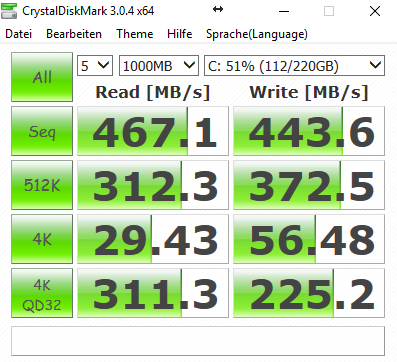
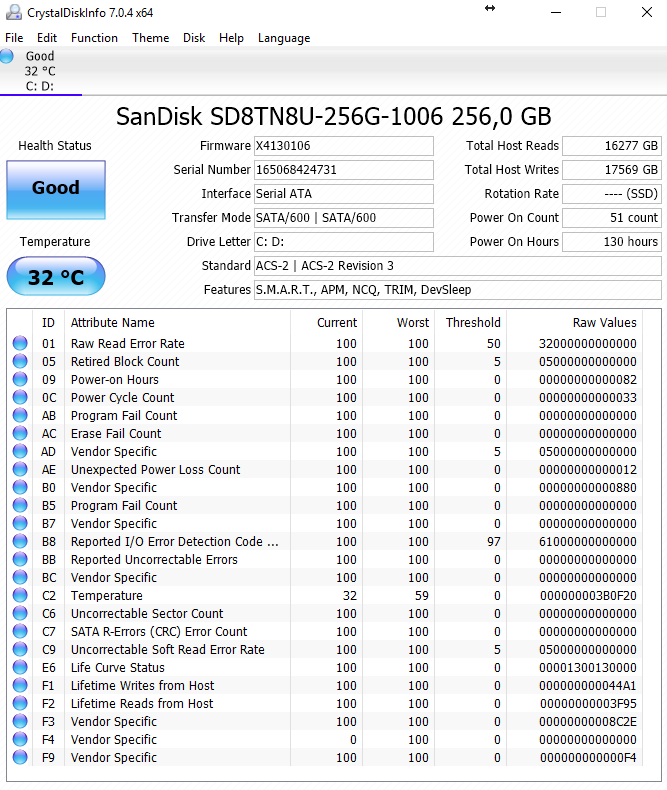
| HP EliteBook x360 1030 G2 Sandisk SD8TN8U-256G-1006 | Lenovo Yoga 910-13IKB-80VF004CGE Samsung PM951 NVMe MZVLV512 | Lenovo ThinkPad X1 Yoga-20FRS1VS00 Samsung SSD PM961 1TB M.2 PCIe 3.0 x4 NVMe (MZSLW1T0) | Lenovo ThinkPad X1 Carbon 2017-20HQS03P00 Samsung PM961 NVMe MZVLW512HMJP | Dell Latitude 13 7370 Toshiba NVMe THNSN5256GPU7 | HP Spectre x360 13-w023dx Samsung PM951 NVMe MZVLV512 | Lenovo ThinkPad Yoga 370-20JJS00100 Toshiba NVMe THNSF5512GPUK | |
|---|---|---|---|---|---|---|---|
| CrystalDiskMark 3.0 | 105% | 102% | 173% | 124% | 89% | 68% | |
| Read Seq (MB/s) | 467.1 | 1412 202% | 1510 223% | 1827 291% | 1354 190% | 1376 195% | 1070 129% |
| Write Seq (MB/s) | 443.6 | 578 30% | 1193 169% | 1383 212% | 1132 155% | 571 29% | 484.5 9% |
| Read 512 (MB/s) | 312.3 | 701 124% | 814 161% | 1140 265% | 679 117% | 680 118% | |
| Write 512 (MB/s) | 372.5 | 580 56% | 1098 195% | 1020 174% | 571 53% | 483.1 30% | |
| Read 4k (MB/s) | 29.43 | 43.5 48% | 37 26% | 61 107% | 42.13 43% | 42.66 45% | 30.55 4% |
| Write 4k (MB/s) | 56.5 | 159.7 183% | 126 123% | 172.2 205% | 105.8 87% | 137.9 144% | 127.3 125% |
| Read 4k QD32 (MB/s) | 311.3 | 570 83% | 404 30% | 601 93% | 400.5 29% | 535 72% | 460.8 48% |
| Write 4k QD32 (MB/s) | 225.2 | 488.7 117% | 319 42% | 495.6 120% | 328.4 46% | 361.2 60% | 414.5 84% |

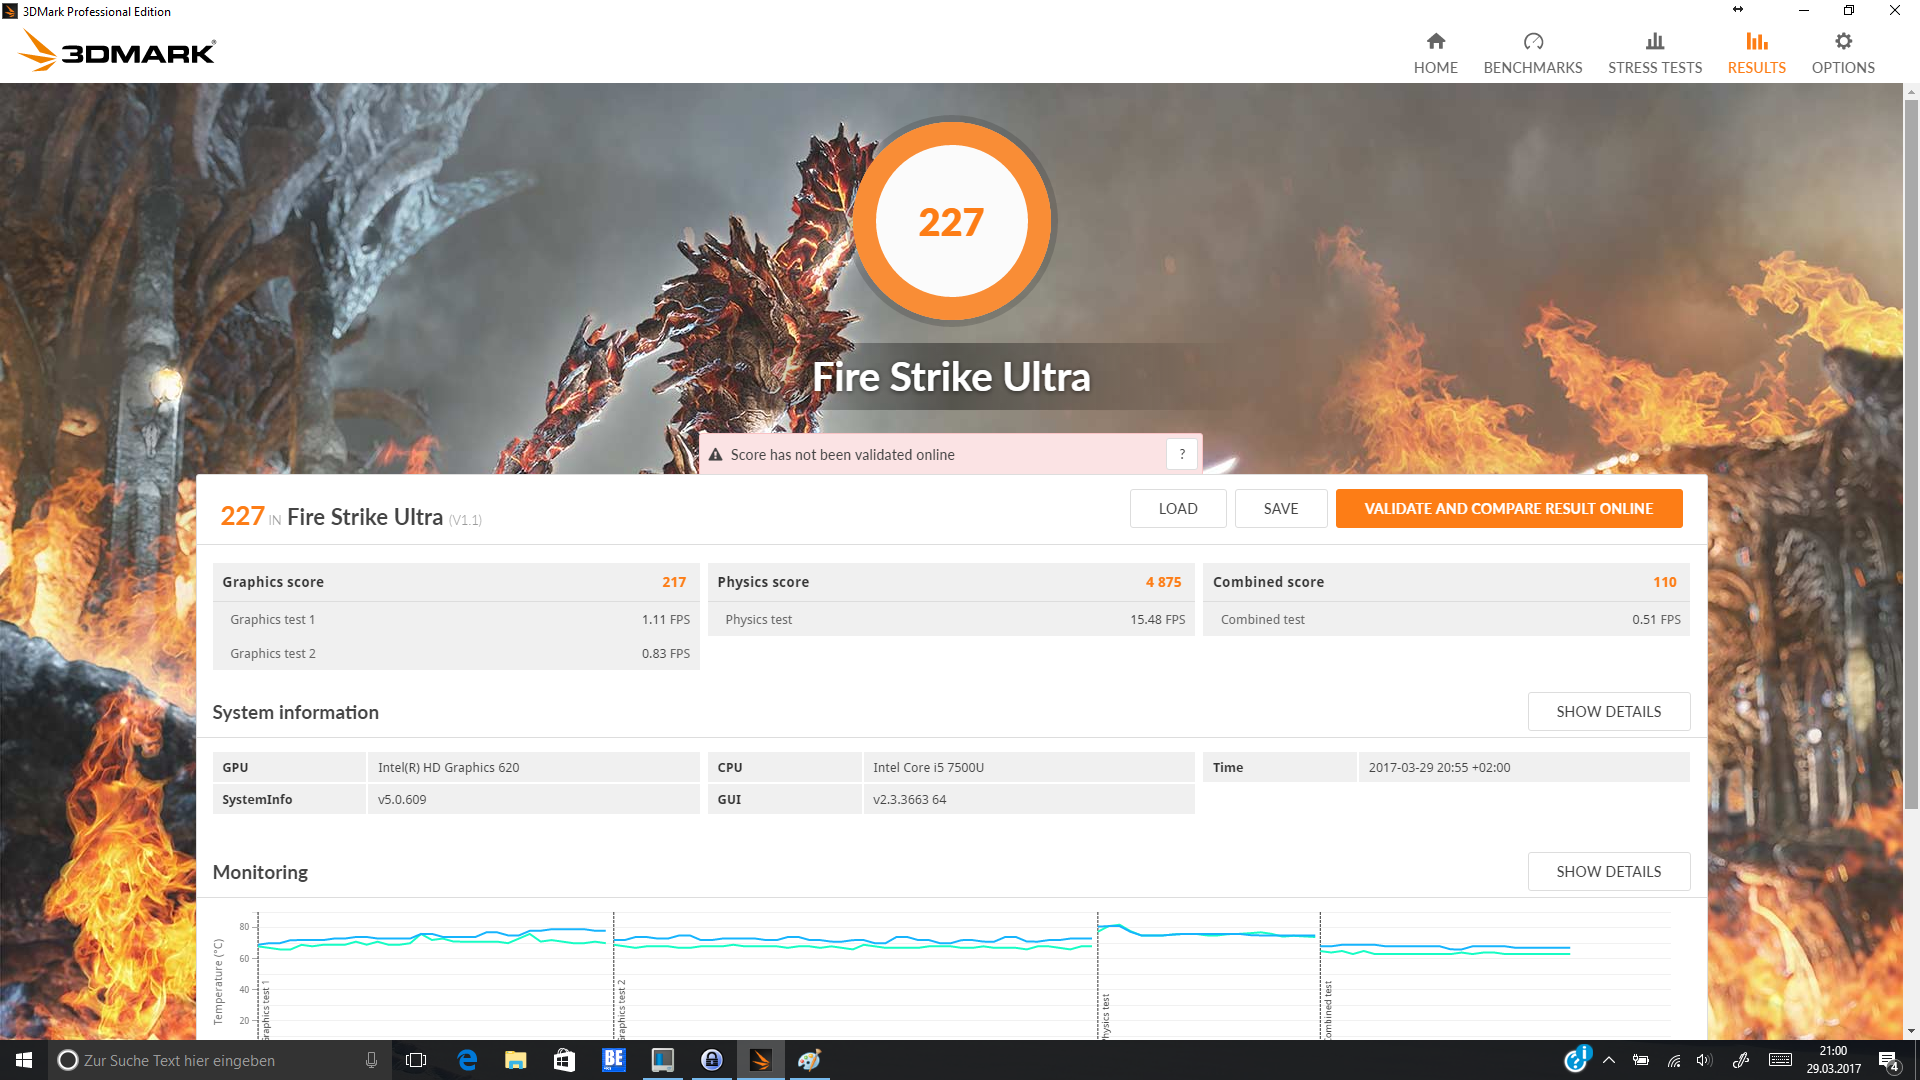

| 3DMark | |
| 1280x720 Cloud Gate Standard Graphics | |
| Lenovo Yoga 910-13IKB-80VF004CGE | |
| Lenovo ThinkPad X1 Carbon 2017-20HQS03P00 | |
| HP EliteBook x360 1030 G2 | |
| HP Spectre x360 13-w023dx | |
| Lenovo ThinkPad X1 Yoga-20FRS1VS00 | |
| Lenovo ThinkPad Yoga 370-20JJS00100 | |
| Dell Latitude 13 7370 | |
| 1920x1080 Fire Strike Graphics | |
| Lenovo ThinkPad X1 Carbon 2017-20HQS03P00 | |
| Lenovo Yoga 910-13IKB-80VF004CGE | |
| HP EliteBook x360 1030 G2 | |
| HP Spectre x360 13-w023dx | |
| Lenovo ThinkPad X1 Yoga-20FRS1VS00 | |
| Lenovo ThinkPad Yoga 370-20JJS00100 | |
| Dell Latitude 13 7370 | |
| 3DMark 11 - 1280x720 Performance GPU | |
| Lenovo ThinkPad X1 Carbon 2017-20HQS03P00 | |
| Lenovo Yoga 910-13IKB-80VF004CGE | |
| HP Spectre x360 13-w023dx | |
| HP EliteBook x360 1030 G2 | |
| Lenovo ThinkPad X1 Yoga-20FRS1VS00 | |
| Lenovo ThinkPad Yoga 370-20JJS00100 | |
| Dell Latitude 13 7370 | |
| 3DMark 05 Standard | 12125 puan | |
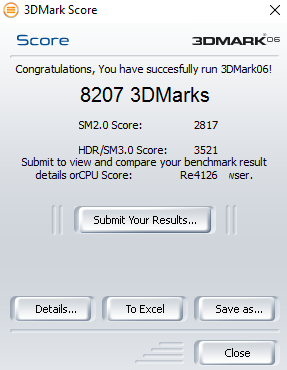
| 3DMark 06 Standard Score | 8207 puan | |
| 3DMark Vantage P Result | 5803 puan | |
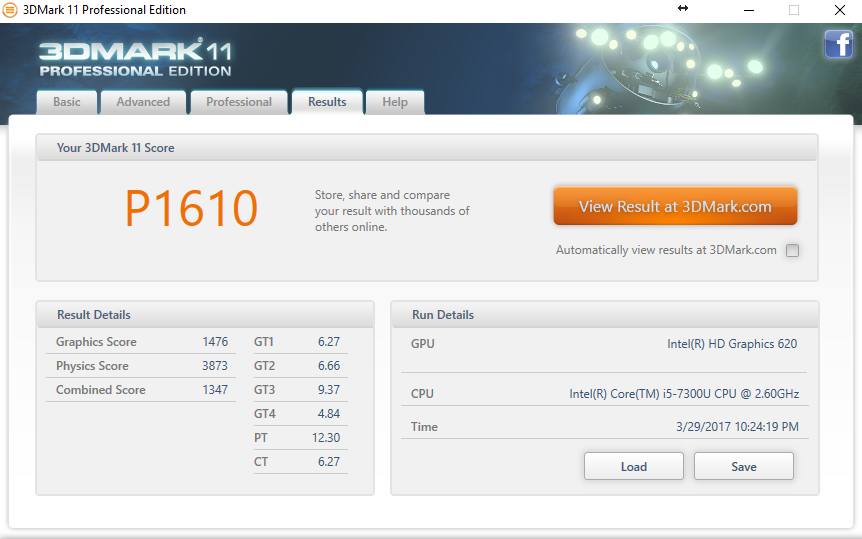
| 3DMark 11 Performance | 1610 puan | |
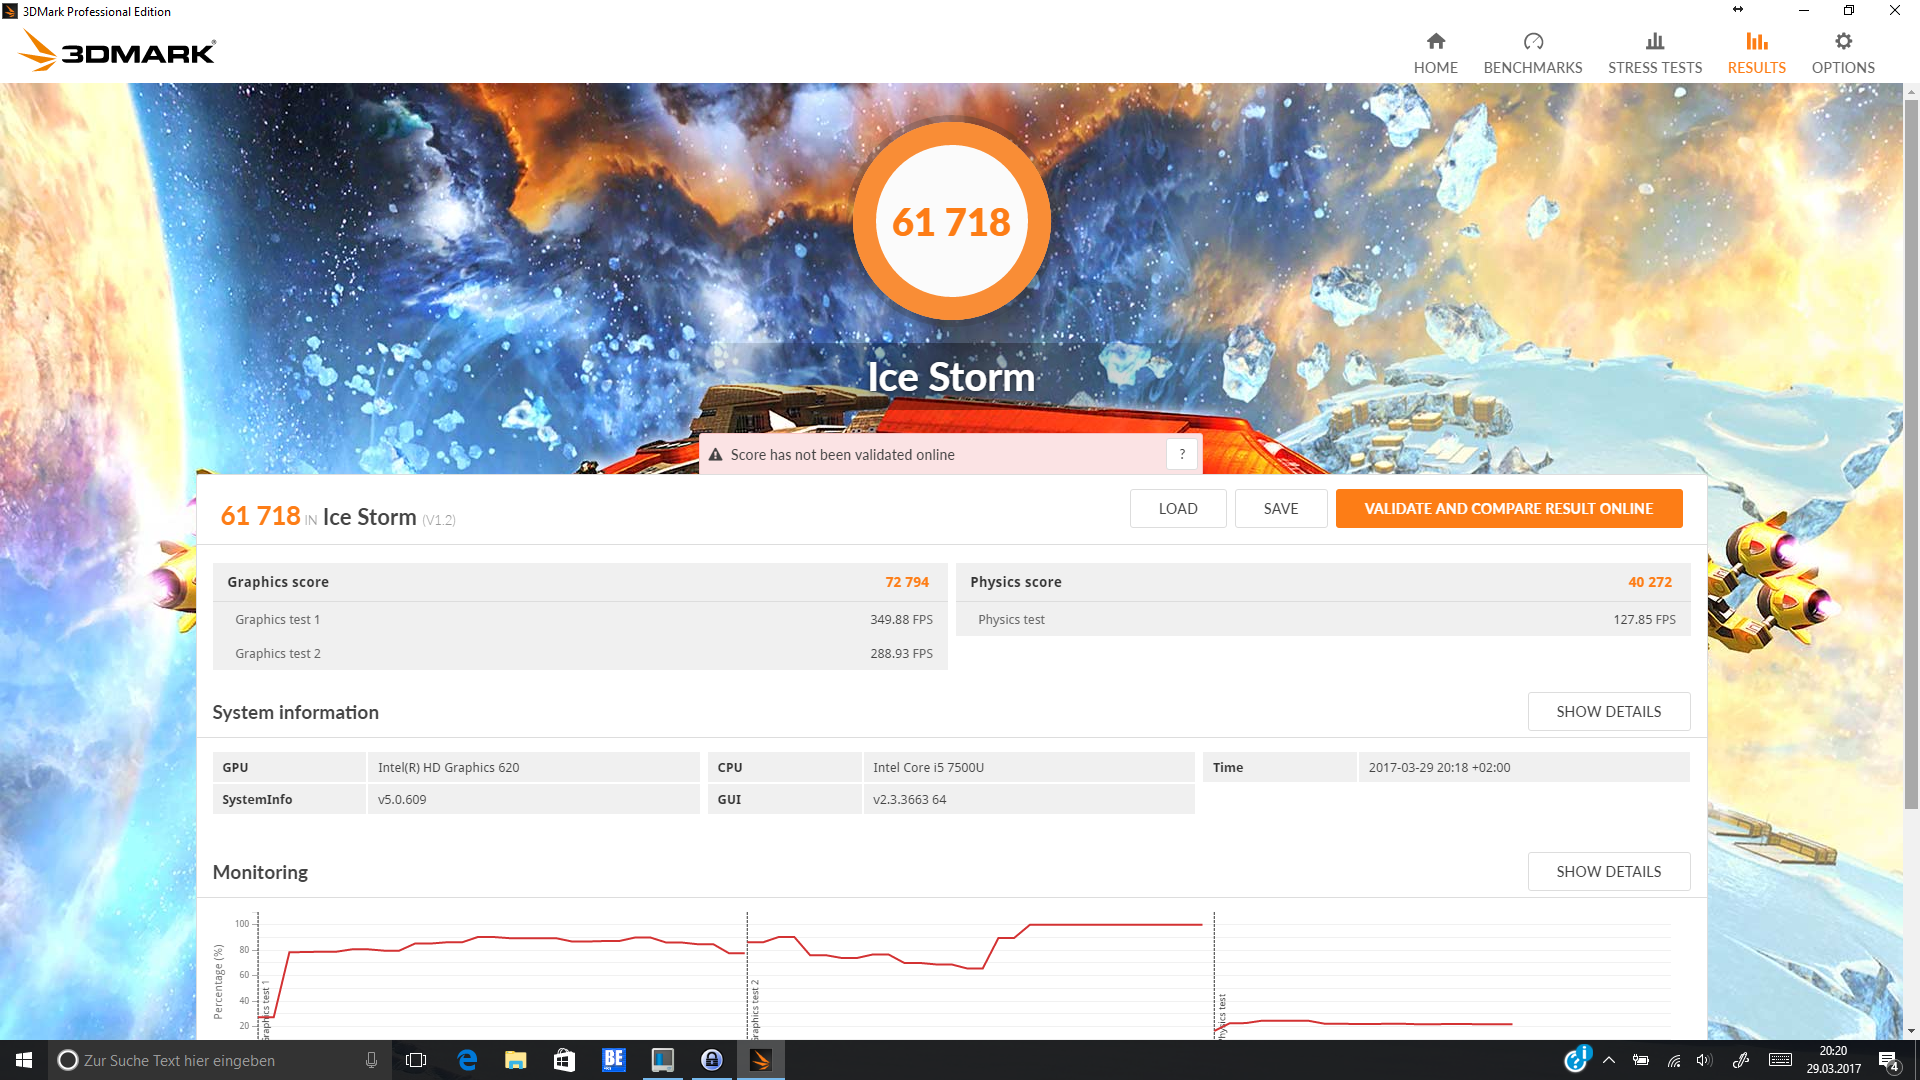
| 3DMark Ice Storm Standard Score | 61718 puan | |
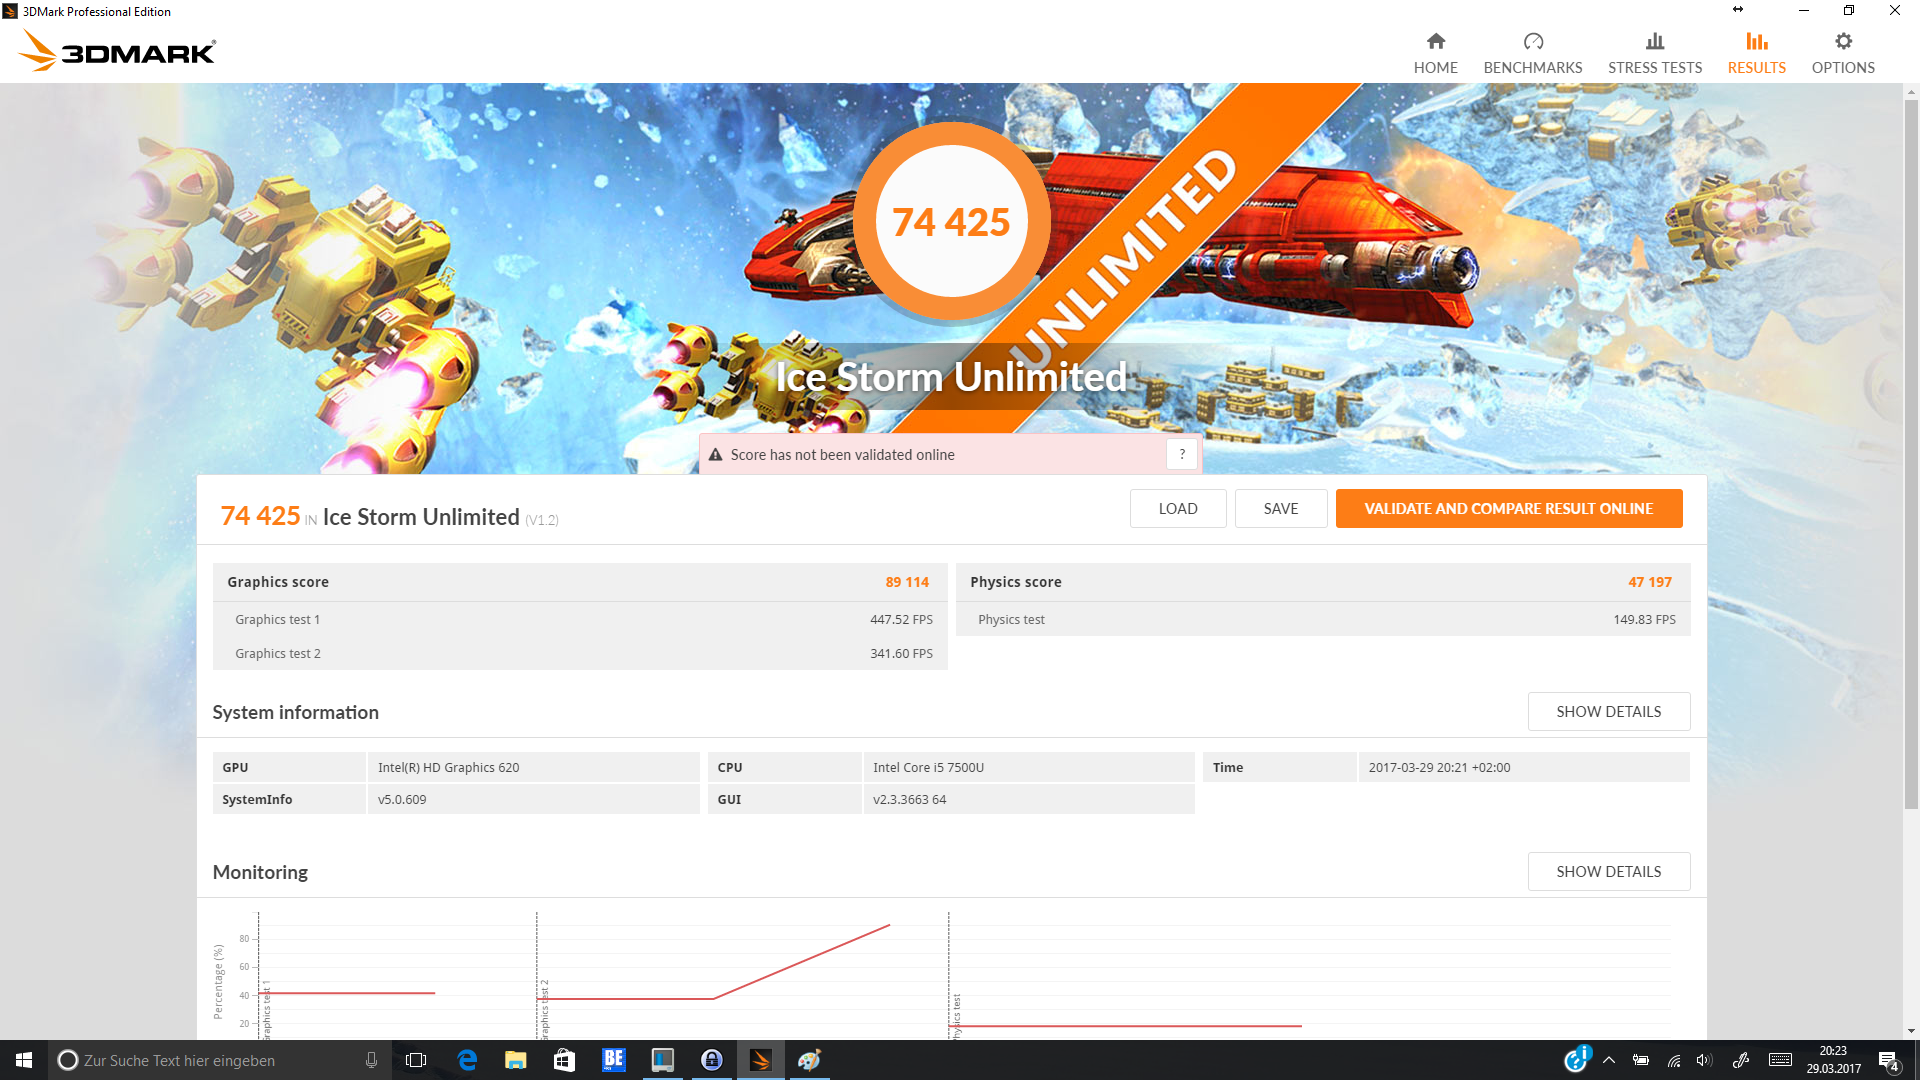
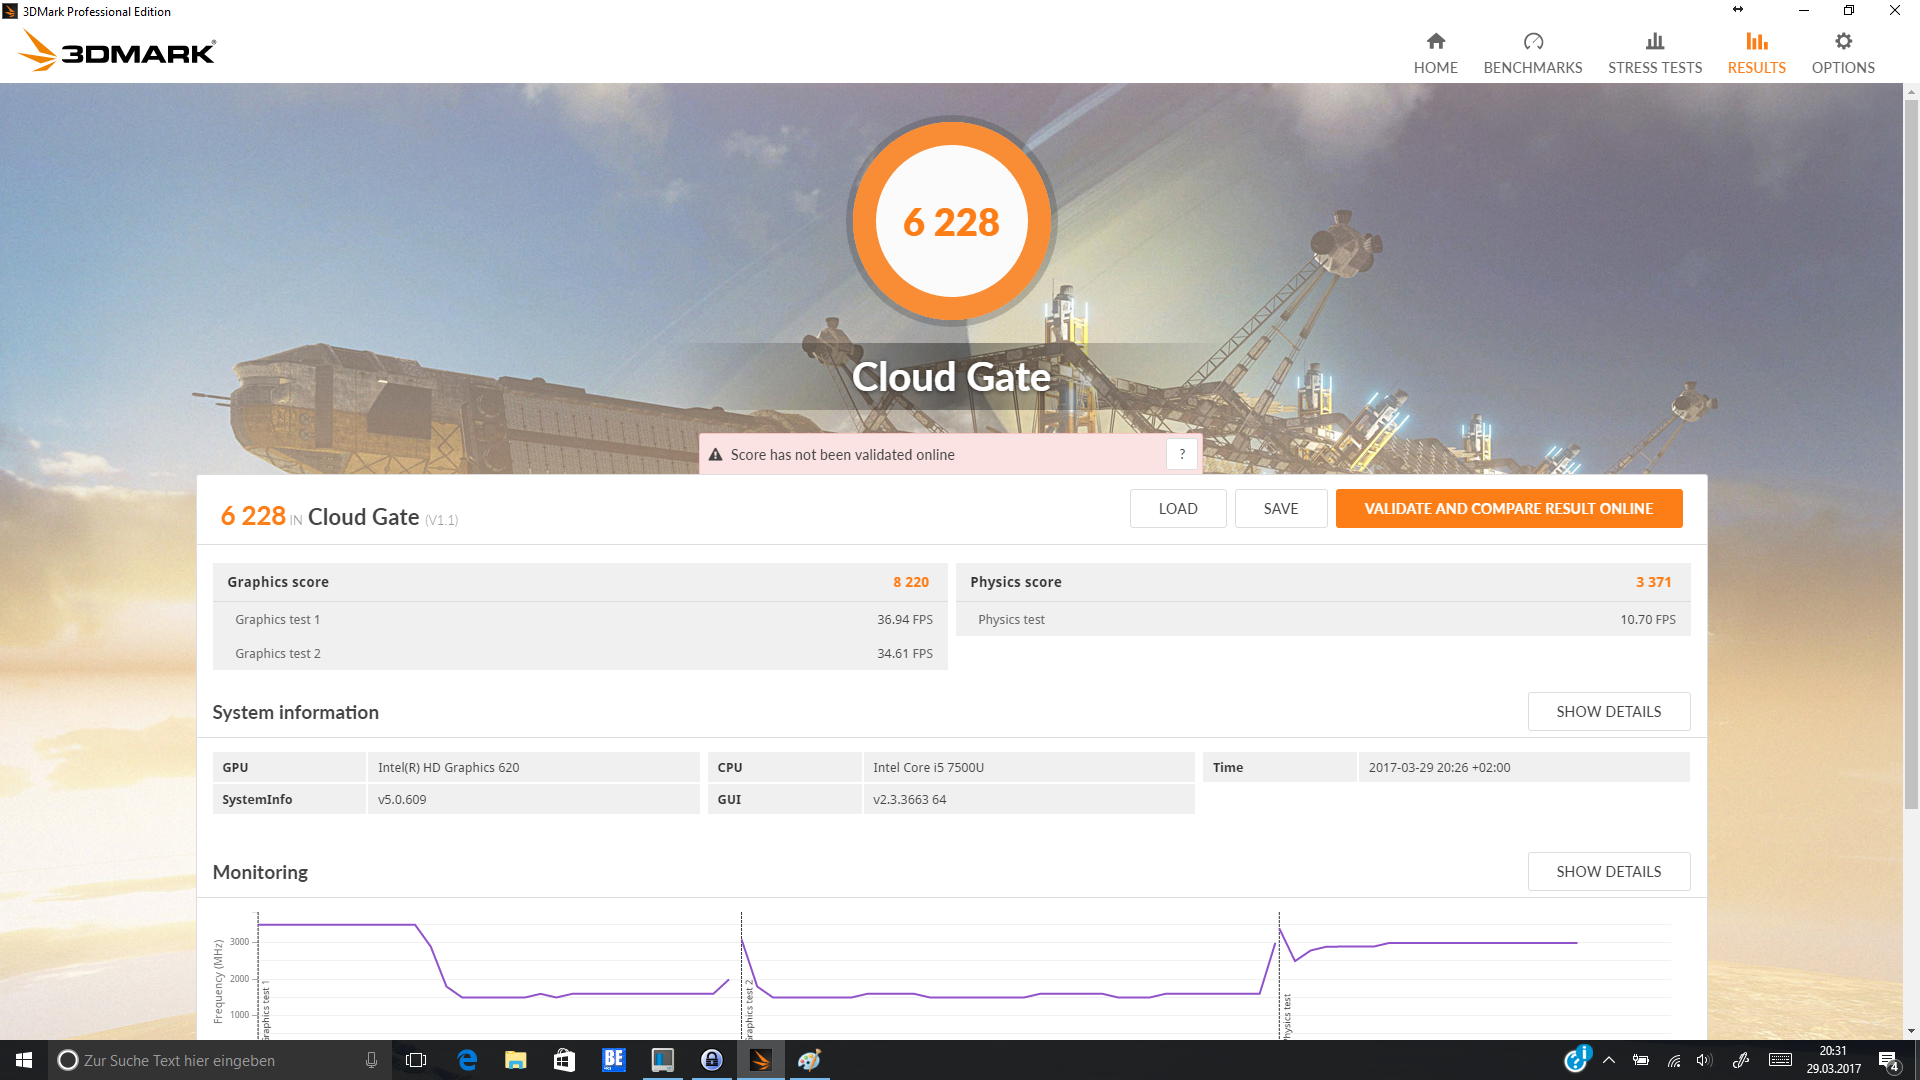
| 3DMark Cloud Gate Standard Score | 6228 puan | |
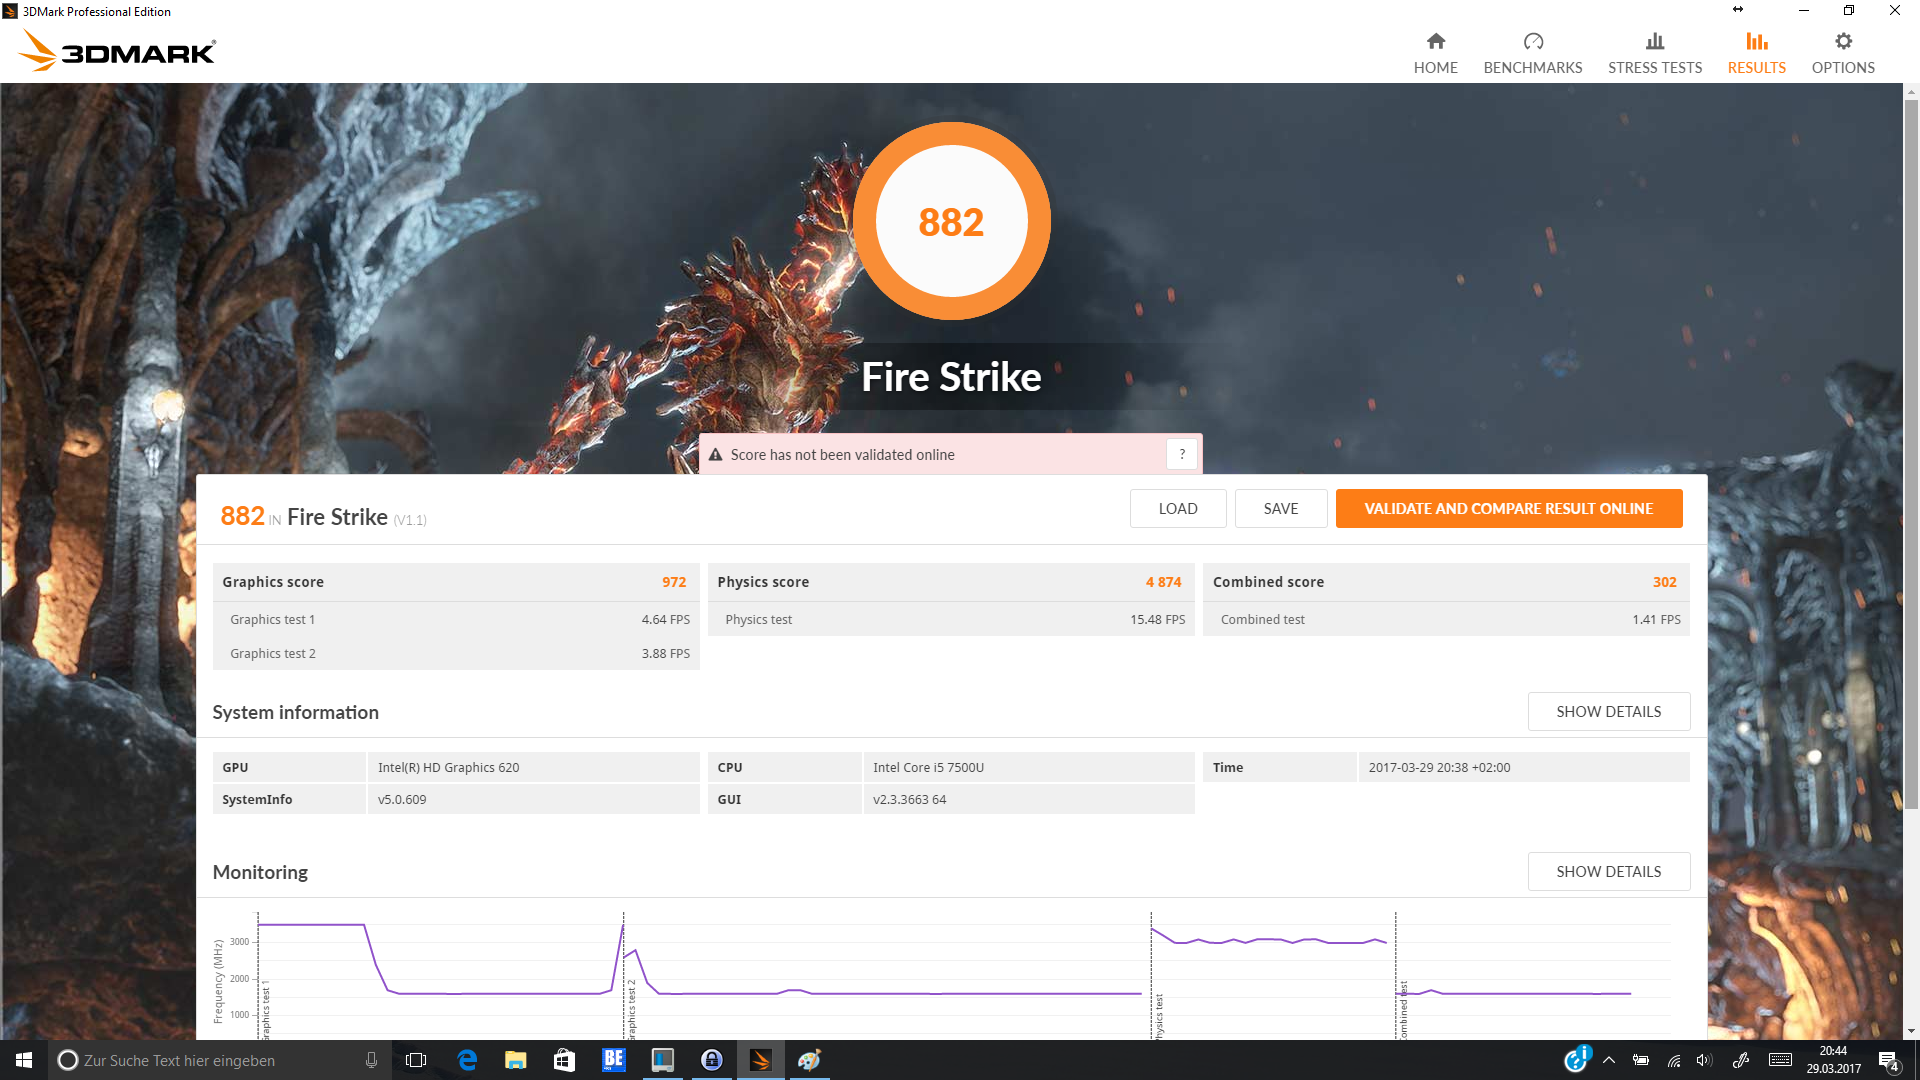
| 3DMark Fire Strike Score | 882 puan | |
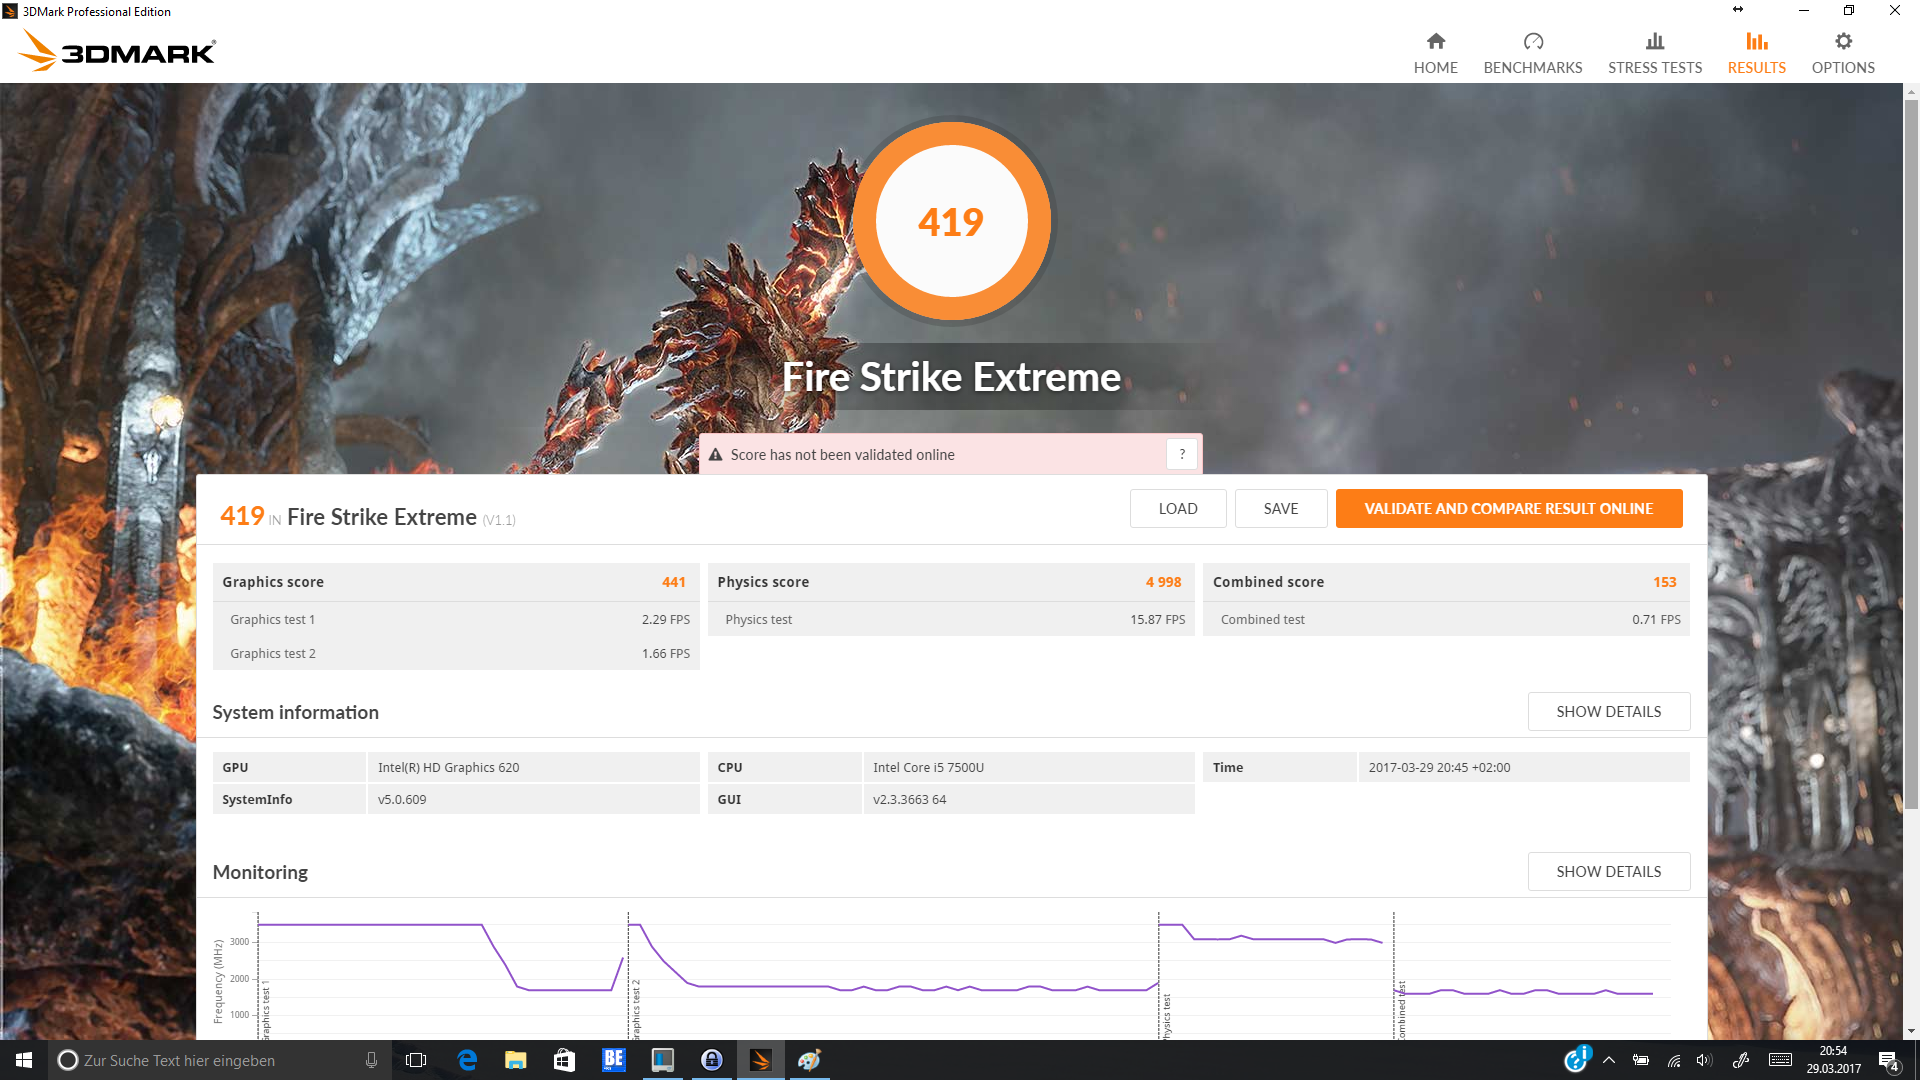
| 3DMark Fire Strike Extreme Score | 419 puan | |
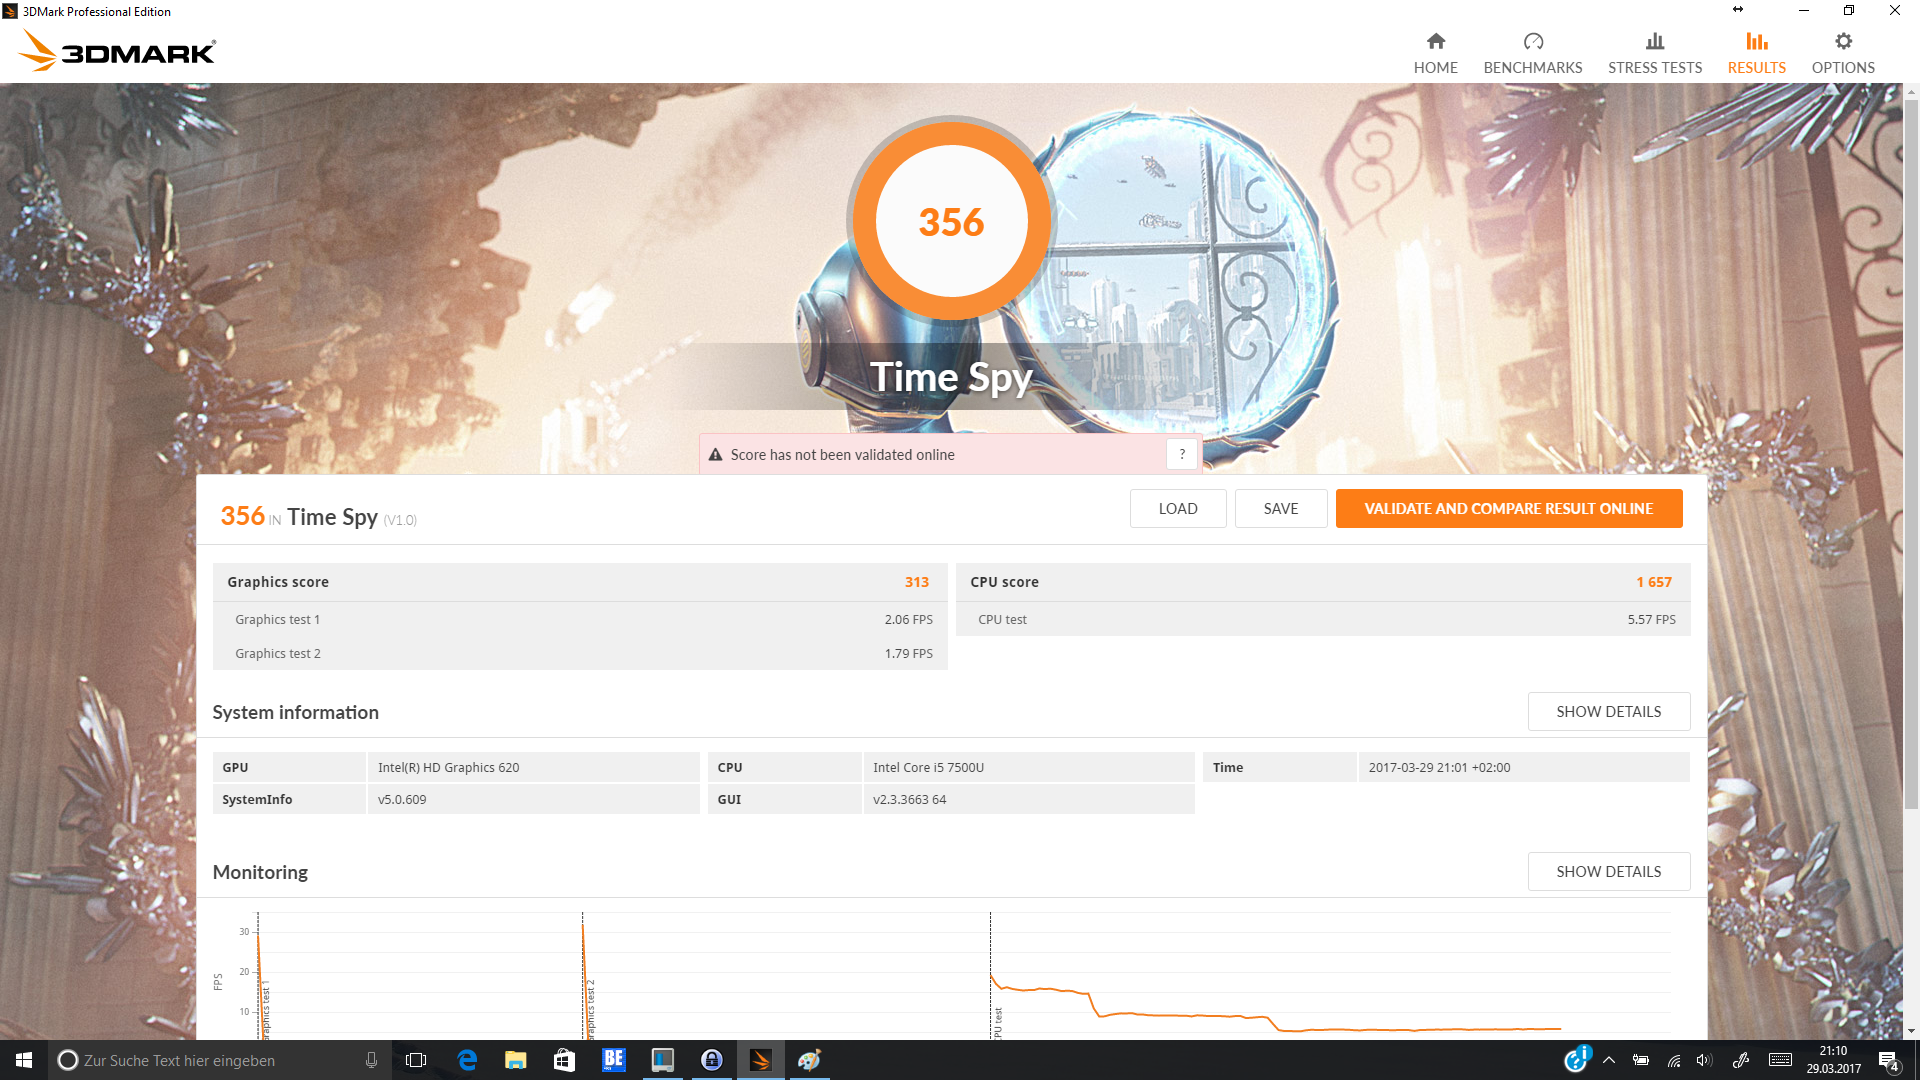
| 3DMark Time Spy Score | 356 puan | |
Yardım | ||
| düşük | orta | yüksek | ultra | |
|---|---|---|---|---|
| BioShock Infinite (2013) | 54.4 | 30.7 | 24.9 | 7.8 |
| Battlefield 4 (2013) | 40.2 | 31.4 | 20.9 | 7.5 |
| The Witcher 3 (2015) | 14.4 | 12.3 | 5.5 | |
| Rise of the Tomb Raider (2016) | 17.6 | 11 | 6.7 |
Ses yüksekliği
| Boşta |
| 29 / 29 / 29 dB |
| Çalışırken |
| 33.6 / 35.8 dB |
 | ||
30 dB sessiz 40 dB(A) duyulabilirlik 50 dB(A) gürültülü |
||
min: | ||
| HP EliteBook x360 1030 G2 i5-7300U, HD Graphics 620 | Lenovo Yoga 910-13IKB-80VF004CGE i7-7500U, HD Graphics 620 | Lenovo ThinkPad X1 Yoga-20FRS1VS00 6600U, HD Graphics 520 | Lenovo ThinkPad X1 Carbon 2017-20HQS03P00 i7-7500U, HD Graphics 620 | HP Spectre x360 13-w023dx i7-7500U, HD Graphics 620 | Lenovo ThinkPad Yoga 370-20JJS00100 i5-7200U, HD Graphics 620 | Dell Latitude 13 7370 6Y57, HD Graphics 515 | |
|---|---|---|---|---|---|---|---|
| Noise | -8% | -2% | -4% | -5% | -1% | ||
| kapalı / ortam * (dB) | 29 | 31.7 -9% | 28.9 -0% | 29.3 -1% | 29.1 -0% | 28.6 1% | |
| Idle Minimum * (dB) | 29 | 31.7 -9% | 28.9 -0% | 29.3 -1% | 29.1 -0% | 28.6 1% | |
| Idle Average * (dB) | 29 | 31.7 -9% | 28.9 -0% | 29.3 -1% | 29.1 -0% | 28.6 1% | |
| Idle Maximum * (dB) | 29 | 31.7 -9% | 28.9 -0% | 32.2 -11% | 31.2 -8% | 31.2 -8% | |
| Load Average * (dB) | 33.6 | 38.4 -14% | 35.3 -5% | 34.3 -2% | 37.3 -11% | 33.7 -0% | |
| Load Maximum * (dB) | 35.8 | 34.7 3% | 38.9 -9% | 39.3 -10% | 39.6 -11% | 36.7 -3% |
* ... daha küçük daha iyidir
(+) Üst taraftaki maksimum sıcaklık, 35.4 °C / 96 F ortalamasına kıyasla 36.1 °C / 97 F'dir. , Convertible sınıfı için 19.6 ile 60 °C arasında değişir.
(+) Alt kısım, 36.9 °C / 98 F ortalamasına kıyasla maksimum 36.7 °C / 98 F'ye kadar ısınır
(+) Boşta kullanımda, üst tarafın ortalama sıcaklığı 24.7 °C / 76 F olup, cihazın 30.3 °C / 87 F.
(+) Avuç içi dayanakları ve dokunmatik yüzey, maksimum 25.5 °C / 77.9 F ile cilt sıcaklığından daha soğuktur ve bu nedenle dokunulduğunda soğuktur.
(+) Benzer cihazların avuç içi dayanağı alanının ortalama sıcaklığı 28 °C / 82.4 F (+2.5 °C / 4.5 F) idi.
| HP EliteBook x360 1030 G2 i5-7300U, HD Graphics 620 | Lenovo Yoga 910-13IKB-80VF004CGE i7-7500U, HD Graphics 620 | Lenovo ThinkPad X1 Yoga-20FRS1VS00 6600U, HD Graphics 520 | Lenovo ThinkPad X1 Carbon 2017-20HQS03P00 i7-7500U, HD Graphics 620 | Dell Latitude 13 7370 6Y57, HD Graphics 515 | HP Spectre x360 13-w023dx i7-7500U, HD Graphics 620 | Lenovo ThinkPad Yoga 370-20JJS00100 i5-7200U, HD Graphics 620 | |
|---|---|---|---|---|---|---|---|
| Heat | -12% | -24% | -9% | -23% | -10% | -16% | |
| Maximum Upper Side * (°C) | 36.1 | 41.4 -15% | 45.5 -26% | 48 -33% | 43.2 -20% | 48.2 -34% | 42 -16% |
| Maximum Bottom * (°C) | 36.7 | 38.5 -5% | 47.1 -28% | 47.2 -29% | 50.8 -38% | 46 -25% | 48 -31% |
| Idle Upper Side * (°C) | 26.8 | 31 -16% | 31.1 -16% | 23.5 12% | 30.5 -14% | 24.6 8% | 28 -4% |
| Idle Bottom * (°C) | 26.5 | 29.6 -12% | 33.1 -25% | 22.6 15% | 31.2 -18% | 23.2 12% | 29.7 -12% |
* ... daha küçük daha iyidir
HP EliteBook x360 1030 G2 ses analizi
(+) | hoparlörler nispeten yüksek sesle çalabilir (86.3 dB)
Analysis not possible as minimum curve is missing or too high
Lenovo ThinkPad Yoga 370-20JJS00100 ses analizi
(±) | hoparlör ses yüksekliği ortalama ama iyi (79.4 dB)
Bas 100 - 315Hz
(-) | neredeyse hiç bas yok - ortalama olarak medyandan 23.5% daha düşük
(+) | bas doğrusaldır (6.5% delta ile önceki frekans)
Ortalar 400 - 2000 Hz
(+) | dengeli ortalar - medyandan yalnızca 4.4% uzakta
(+) | orta frekanslar doğrusaldır (6.8% deltadan önceki frekansa)
Yüksekler 2 - 16 kHz
(+) | dengeli yüksekler - medyandan yalnızca 4.6% uzakta
(+) | yüksekler doğrusaldır (6.9% deltadan önceki frekansa)
Toplam 100 - 16.000 Hz
(±) | Genel sesin doğrusallığı ortalamadır (24.2% ortancaya göre fark)
Aynı sınıfla karşılaştırıldığında
» Bu sınıftaki tüm test edilen cihazların %73%'si daha iyi, 5% benzer, 21% daha kötüydü
» En iyisinin deltası 6% idi, ortalama 20% idi, en kötüsü 57% idi
Test edilen tüm cihazlarla karşılaştırıldığında
» Test edilen tüm cihazların %73'si daha iyi, 6 benzer, % 21 daha kötüydü
» En iyisinin deltası 4% idi, ortalama 24% idi, en kötüsü 134% idi
| Kapalı / Bekleme modu | |
| Boşta | |
| Çalışırken |
|
Key:
min: | |
| HP EliteBook x360 1030 G2 i5-7300U, HD Graphics 620, Sandisk SD8TN8U-256G-1006, IPS, 1920x1080, 13.3" | Lenovo Yoga 910-13IKB-80VF004CGE i7-7500U, HD Graphics 620, Samsung PM951 NVMe MZVLV512, IPS, 3840x2160, 13.9" | Lenovo ThinkPad X1 Yoga-20FRS1VS00 6600U, HD Graphics 520, Samsung SSD PM961 1TB M.2 PCIe 3.0 x4 NVMe (MZSLW1T0), OLED, 2560x1440, 14" | Lenovo ThinkPad X1 Carbon 2017-20HQS03P00 i7-7500U, HD Graphics 620, Samsung PM961 NVMe MZVLW512HMJP, IPS, 1920x1080, 14" | Dell Latitude 13 7370 6Y57, HD Graphics 515, Toshiba NVMe THNSN5256GPU7, IPS, 1920x1080, 13.3" | HP Spectre x360 13-w023dx i7-7500U, HD Graphics 620, Samsung PM951 NVMe MZVLV512, IPS, 1920x1080, 13.3" | Lenovo ThinkPad Yoga 370-20JJS00100 i5-7200U, HD Graphics 620, Toshiba NVMe THNSF5512GPUK, IPS LED, 1920x1080, 13.3" | |
|---|---|---|---|---|---|---|---|
| Power Consumption | -13% | -43% | -25% | -6% | -20% | -10% | |
| Idle Minimum * (Watt) | 3.2 | 4.3 -34% | 4.7 -47% | 3.84 -20% | 5 -56% | 5.5 -72% | 3.6 -13% |
| Idle Average * (Watt) | 5.5 | 6.3 -15% | 8.6 -56% | 6.3 -15% | 7.5 -36% | 6.7 -22% | 7.2 -31% |
| Idle Maximum * (Watt) | 6.5 | 9 -38% | 12.2 -88% | 8.6 -32% | 8 -23% | 7.1 -9% | 8.4 -29% |
| Load Average * (Watt) | 29.7 | 32.7 -10% | 29.7 -0% | 41.9 -41% | 15.3 48% | 33.1 -11% | 29.9 -1% |
| Load Maximum * (Watt) | 41.3 | 28.8 30% | 50.5 -22% | 48.7 -18% | 26.8 35% | 35.2 15% | 32.2 22% |
* ... daha küçük daha iyidir
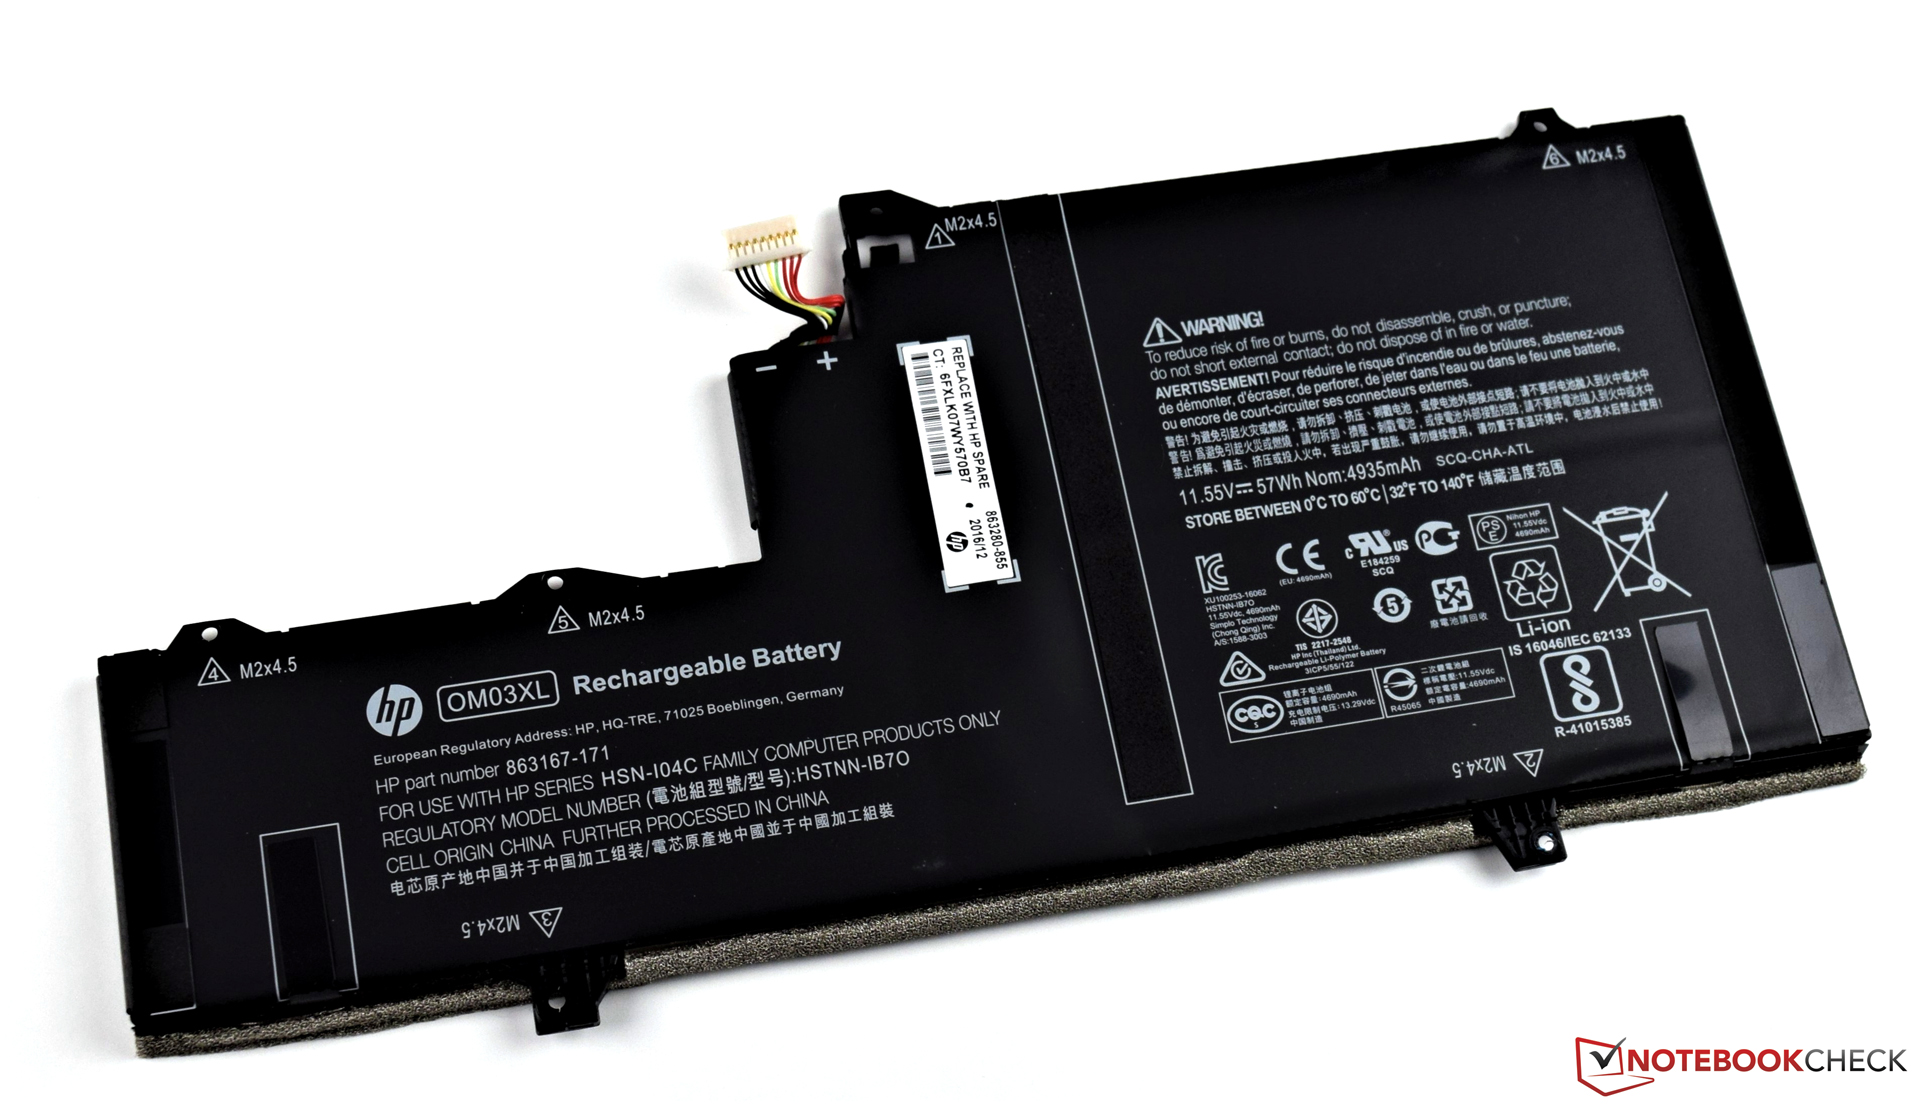
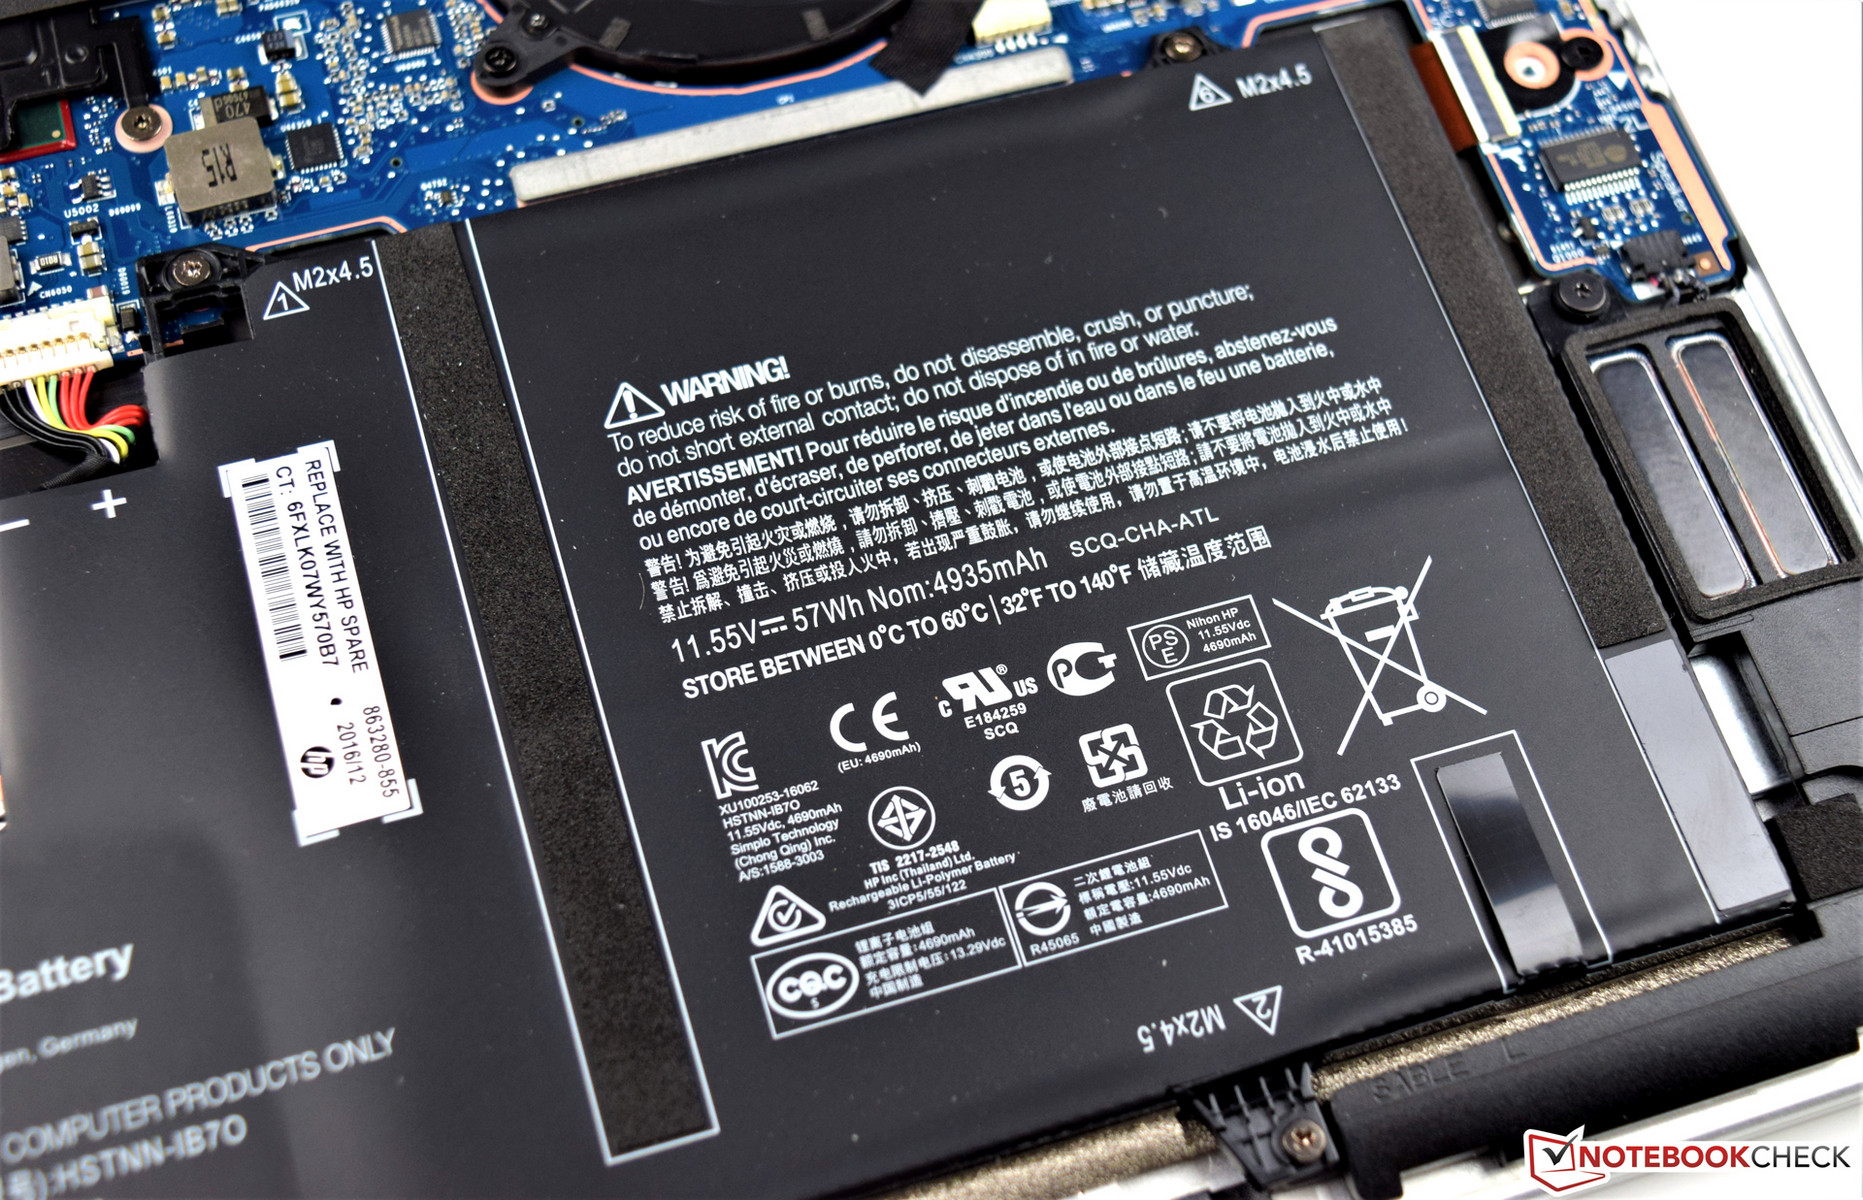

| HP EliteBook x360 1030 G2 i5-7300U, HD Graphics 620, 57 Wh | Lenovo Yoga 910-13IKB-80VF004CGE i7-7500U, HD Graphics 620, 78 Wh | Lenovo ThinkPad X1 Yoga-20FRS1VS00 6600U, HD Graphics 520, 56 Wh | Lenovo ThinkPad X1 Carbon 2017-20HQS03P00 i7-7500U, HD Graphics 620, 57 Wh | Dell Latitude 13 7370 6Y57, HD Graphics 515, 34 Wh | HP Spectre x360 13-w023dx i7-7500U, HD Graphics 620, 57.8 Wh | Lenovo ThinkPad Yoga 370-20JJS00100 i5-7200U, HD Graphics 620, 51 Wh | |
|---|---|---|---|---|---|---|---|
| Pil Çalışma Süresi | -17% | -40% | -20% | -43% | -24% | -25% | |
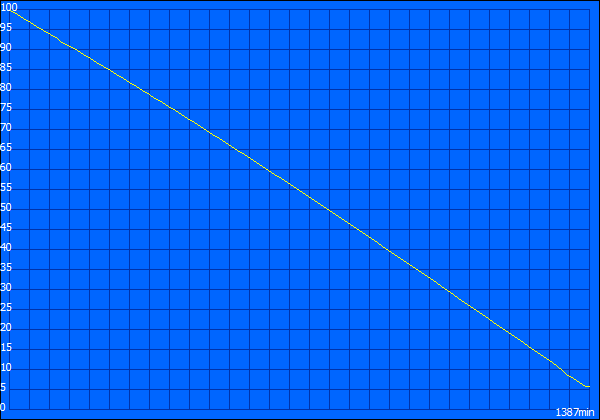
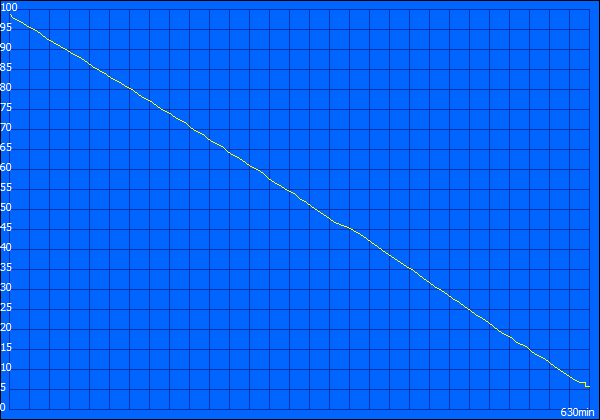
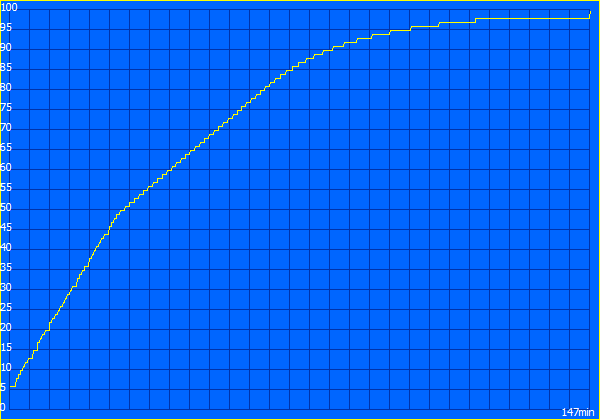
| Reader / Idle (h) | 23.1 | 17.8 -23% | 13.7 -41% | 20.9 -10% | 9.8 -58% | 20.6 -11% | 19.4 -16% |
| H.264 (h) | 11 | 8.7 -21% | 11.9 8% | 6.5 -41% | 9.6 -13% | ||
| WiFi v1.3 (h) | 10.5 | 10.7 2% | 5.3 -50% | 8.3 -21% | 6.1 -42% | 9.3 -11% | 8.1 -23% |
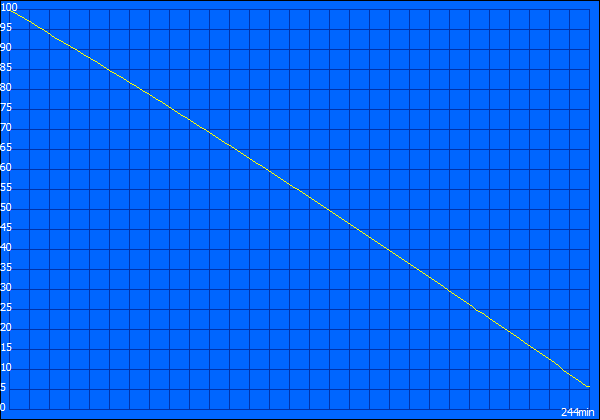
| Load (h) | 4.1 | 2.9 -29% | 2.2 -46% | 1.8 -56% | 2.9 -29% | 2 -51% | 2.1 -49% |
Artılar
Eksiler
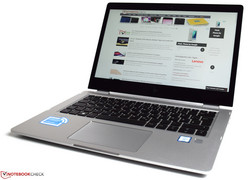
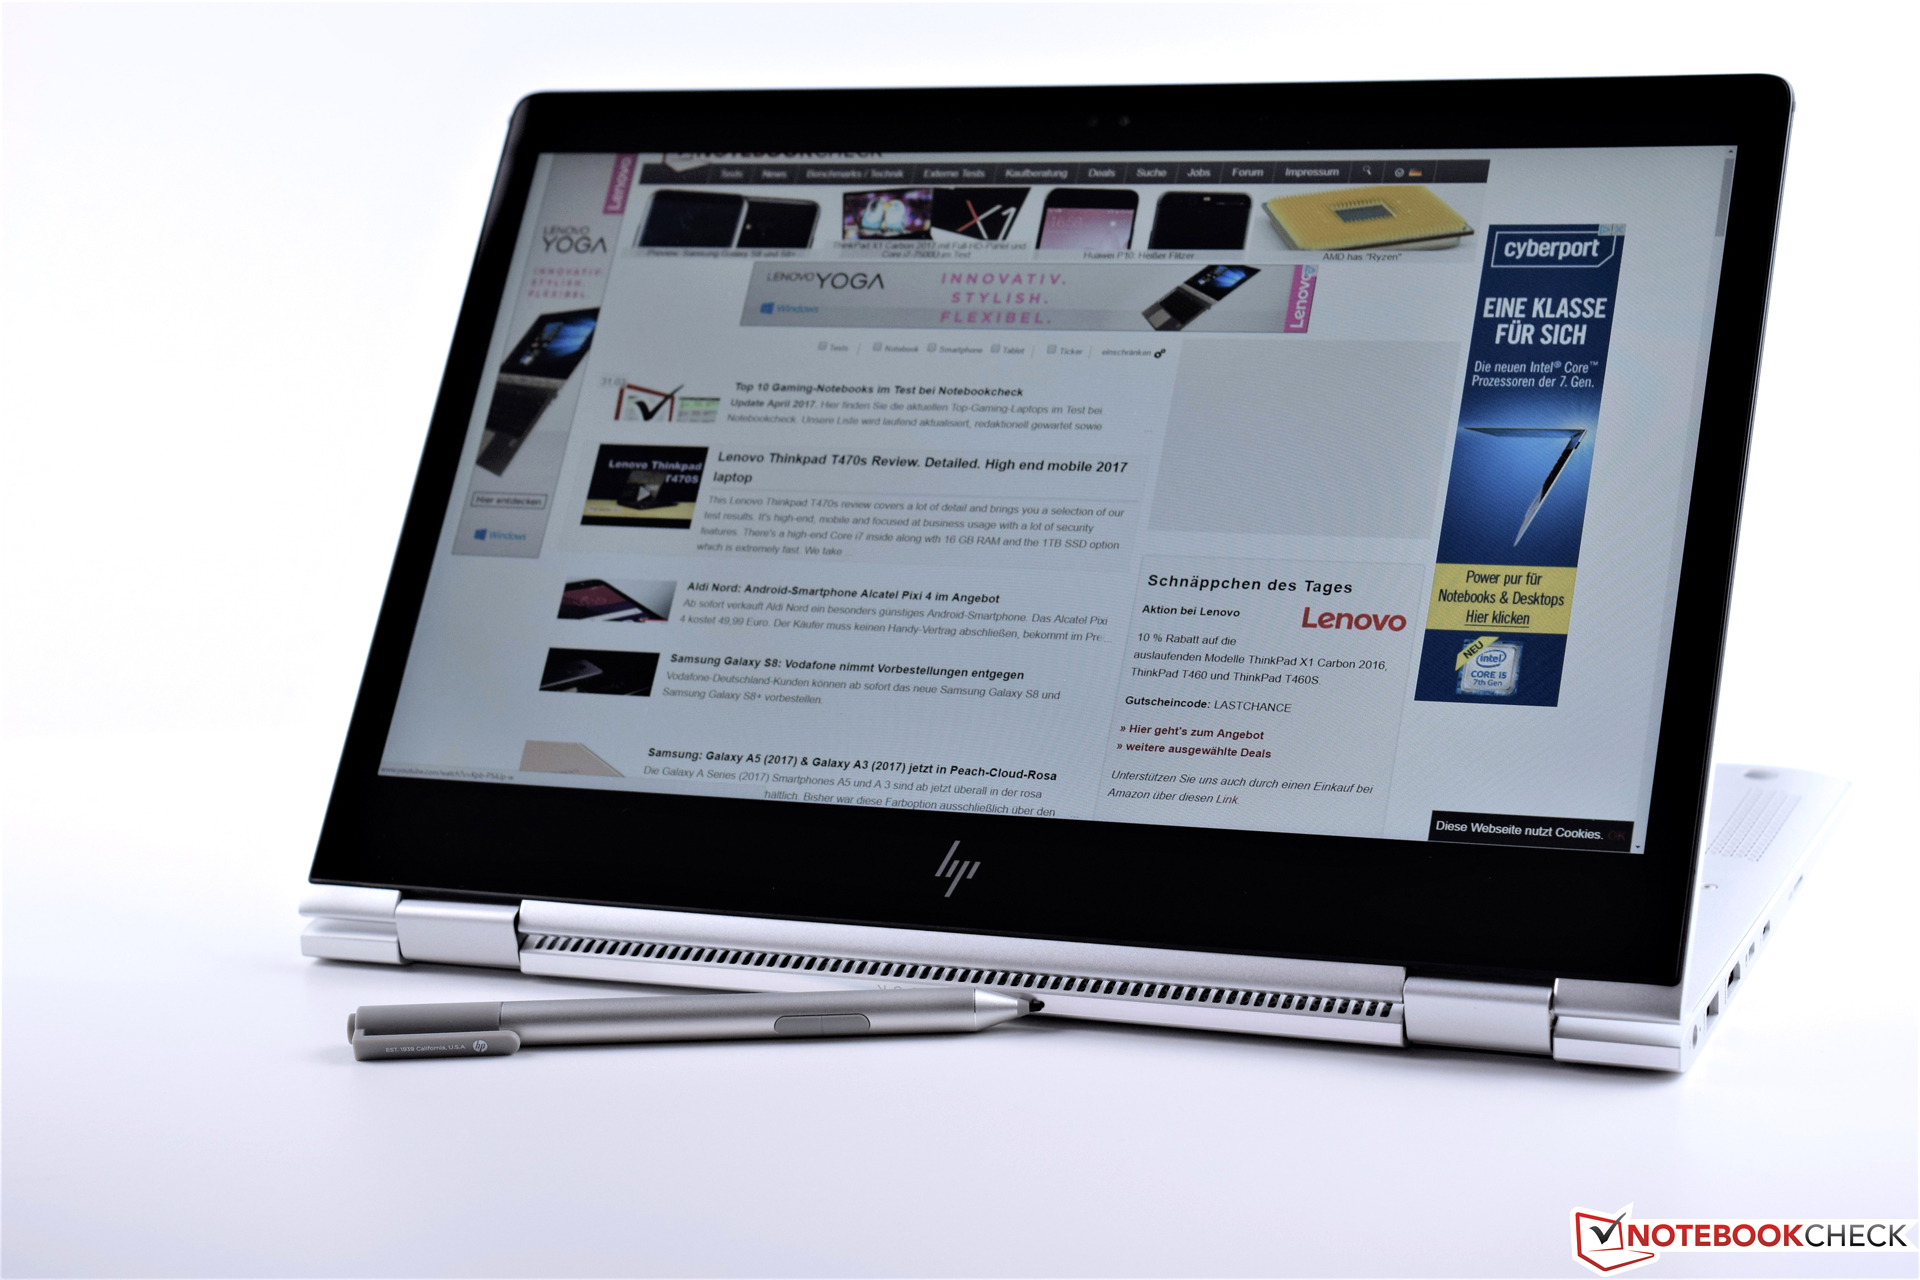
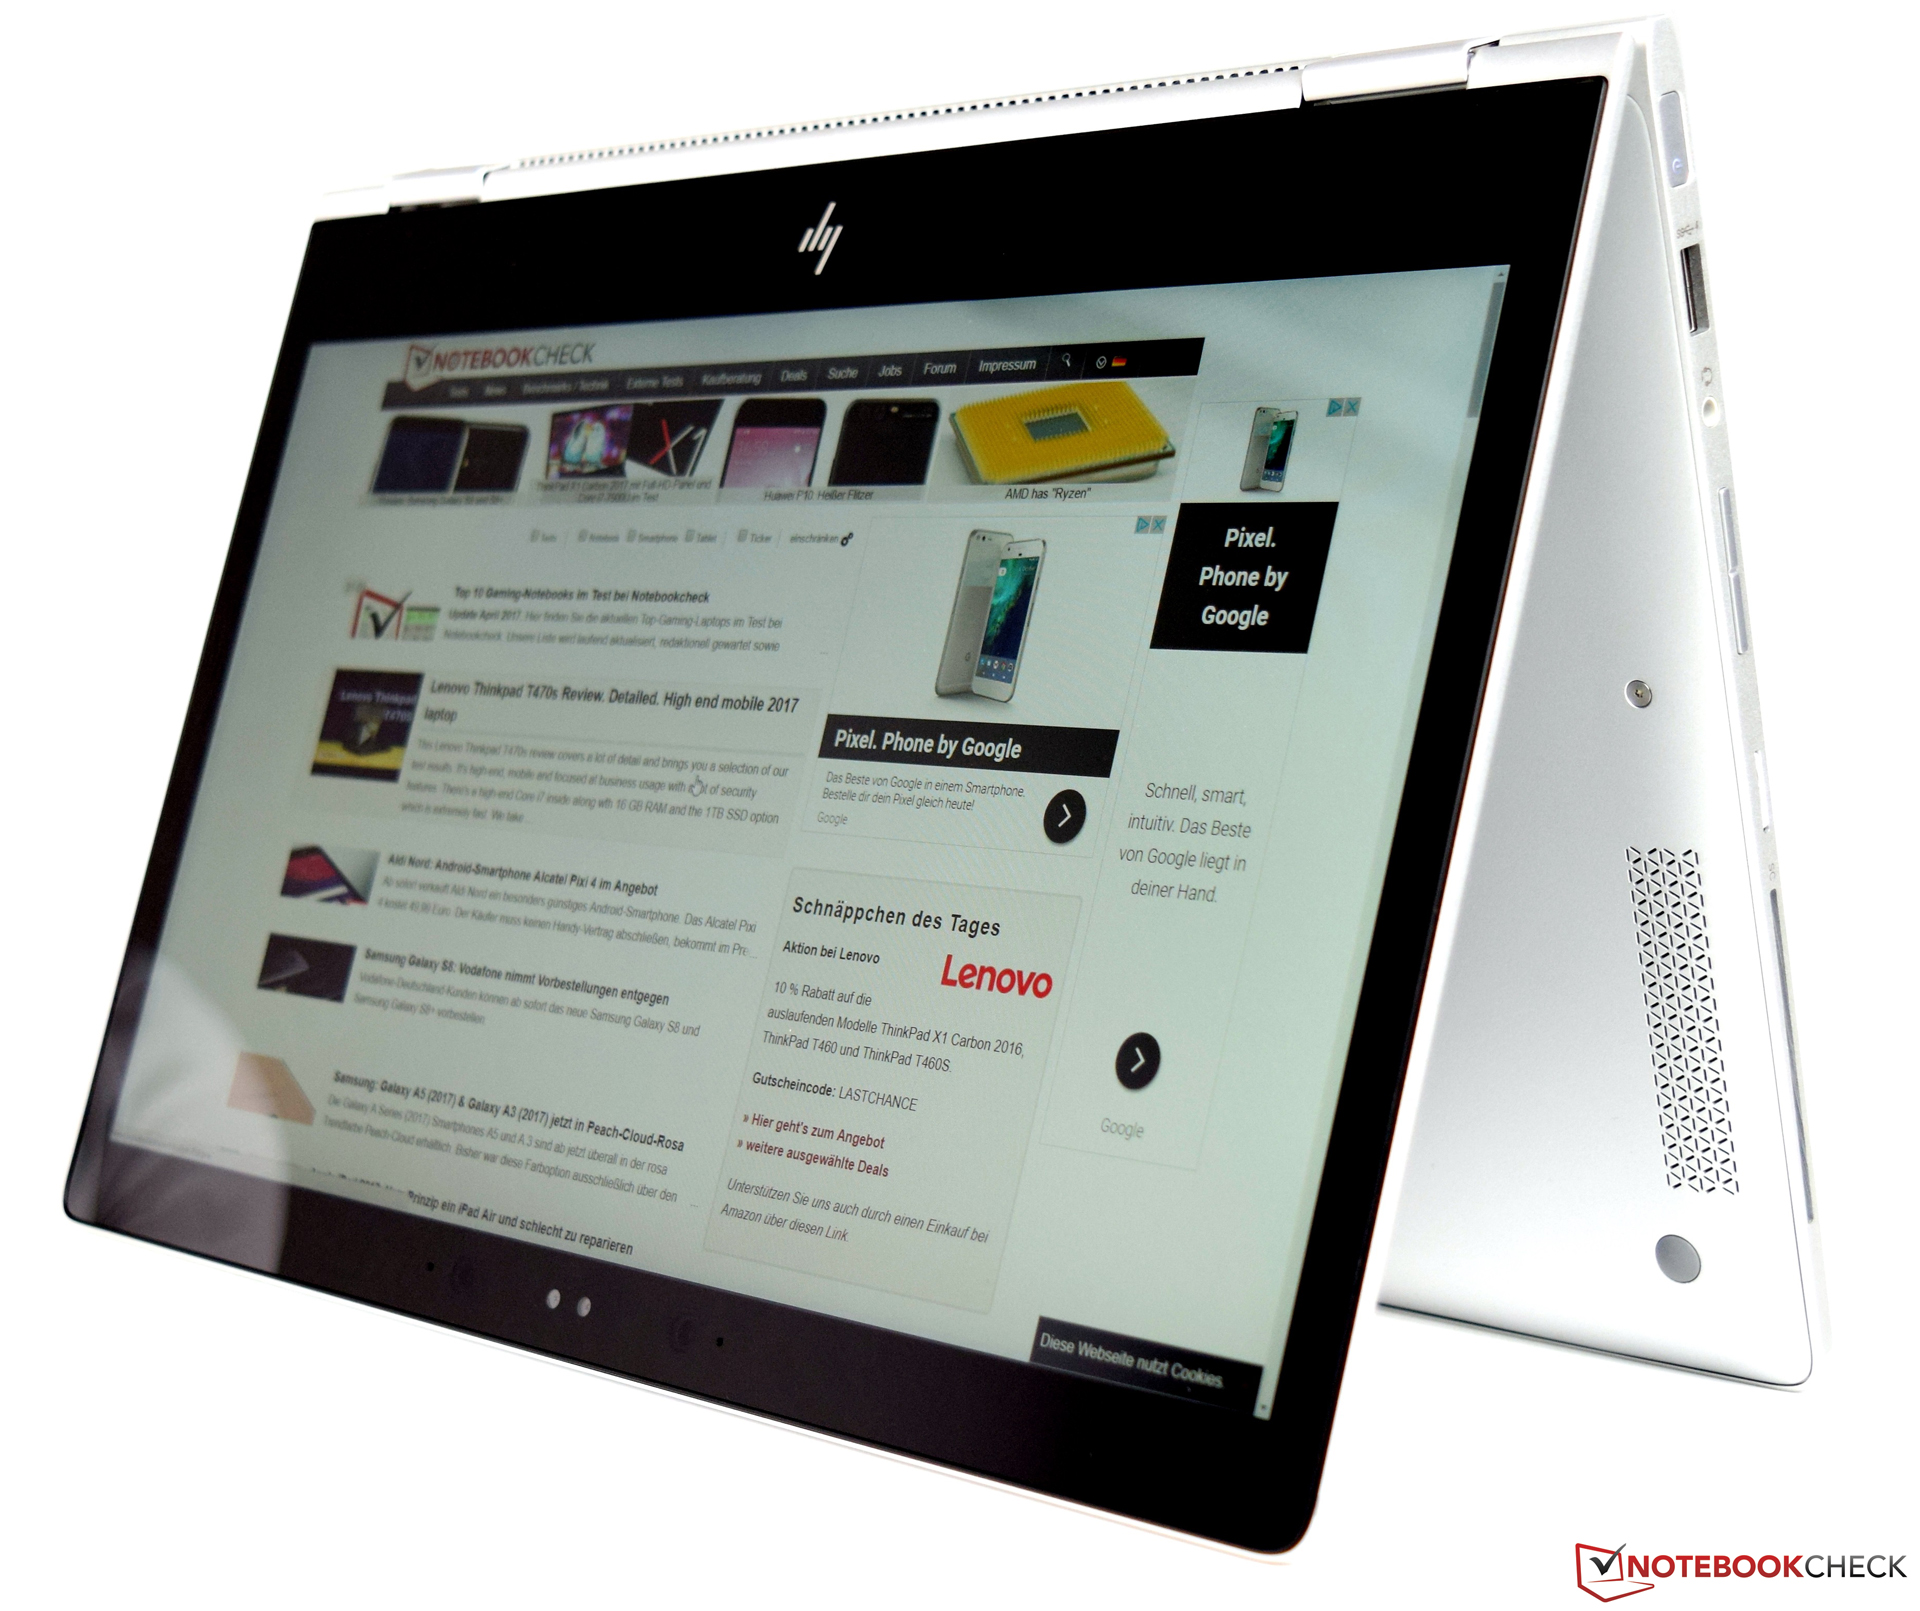
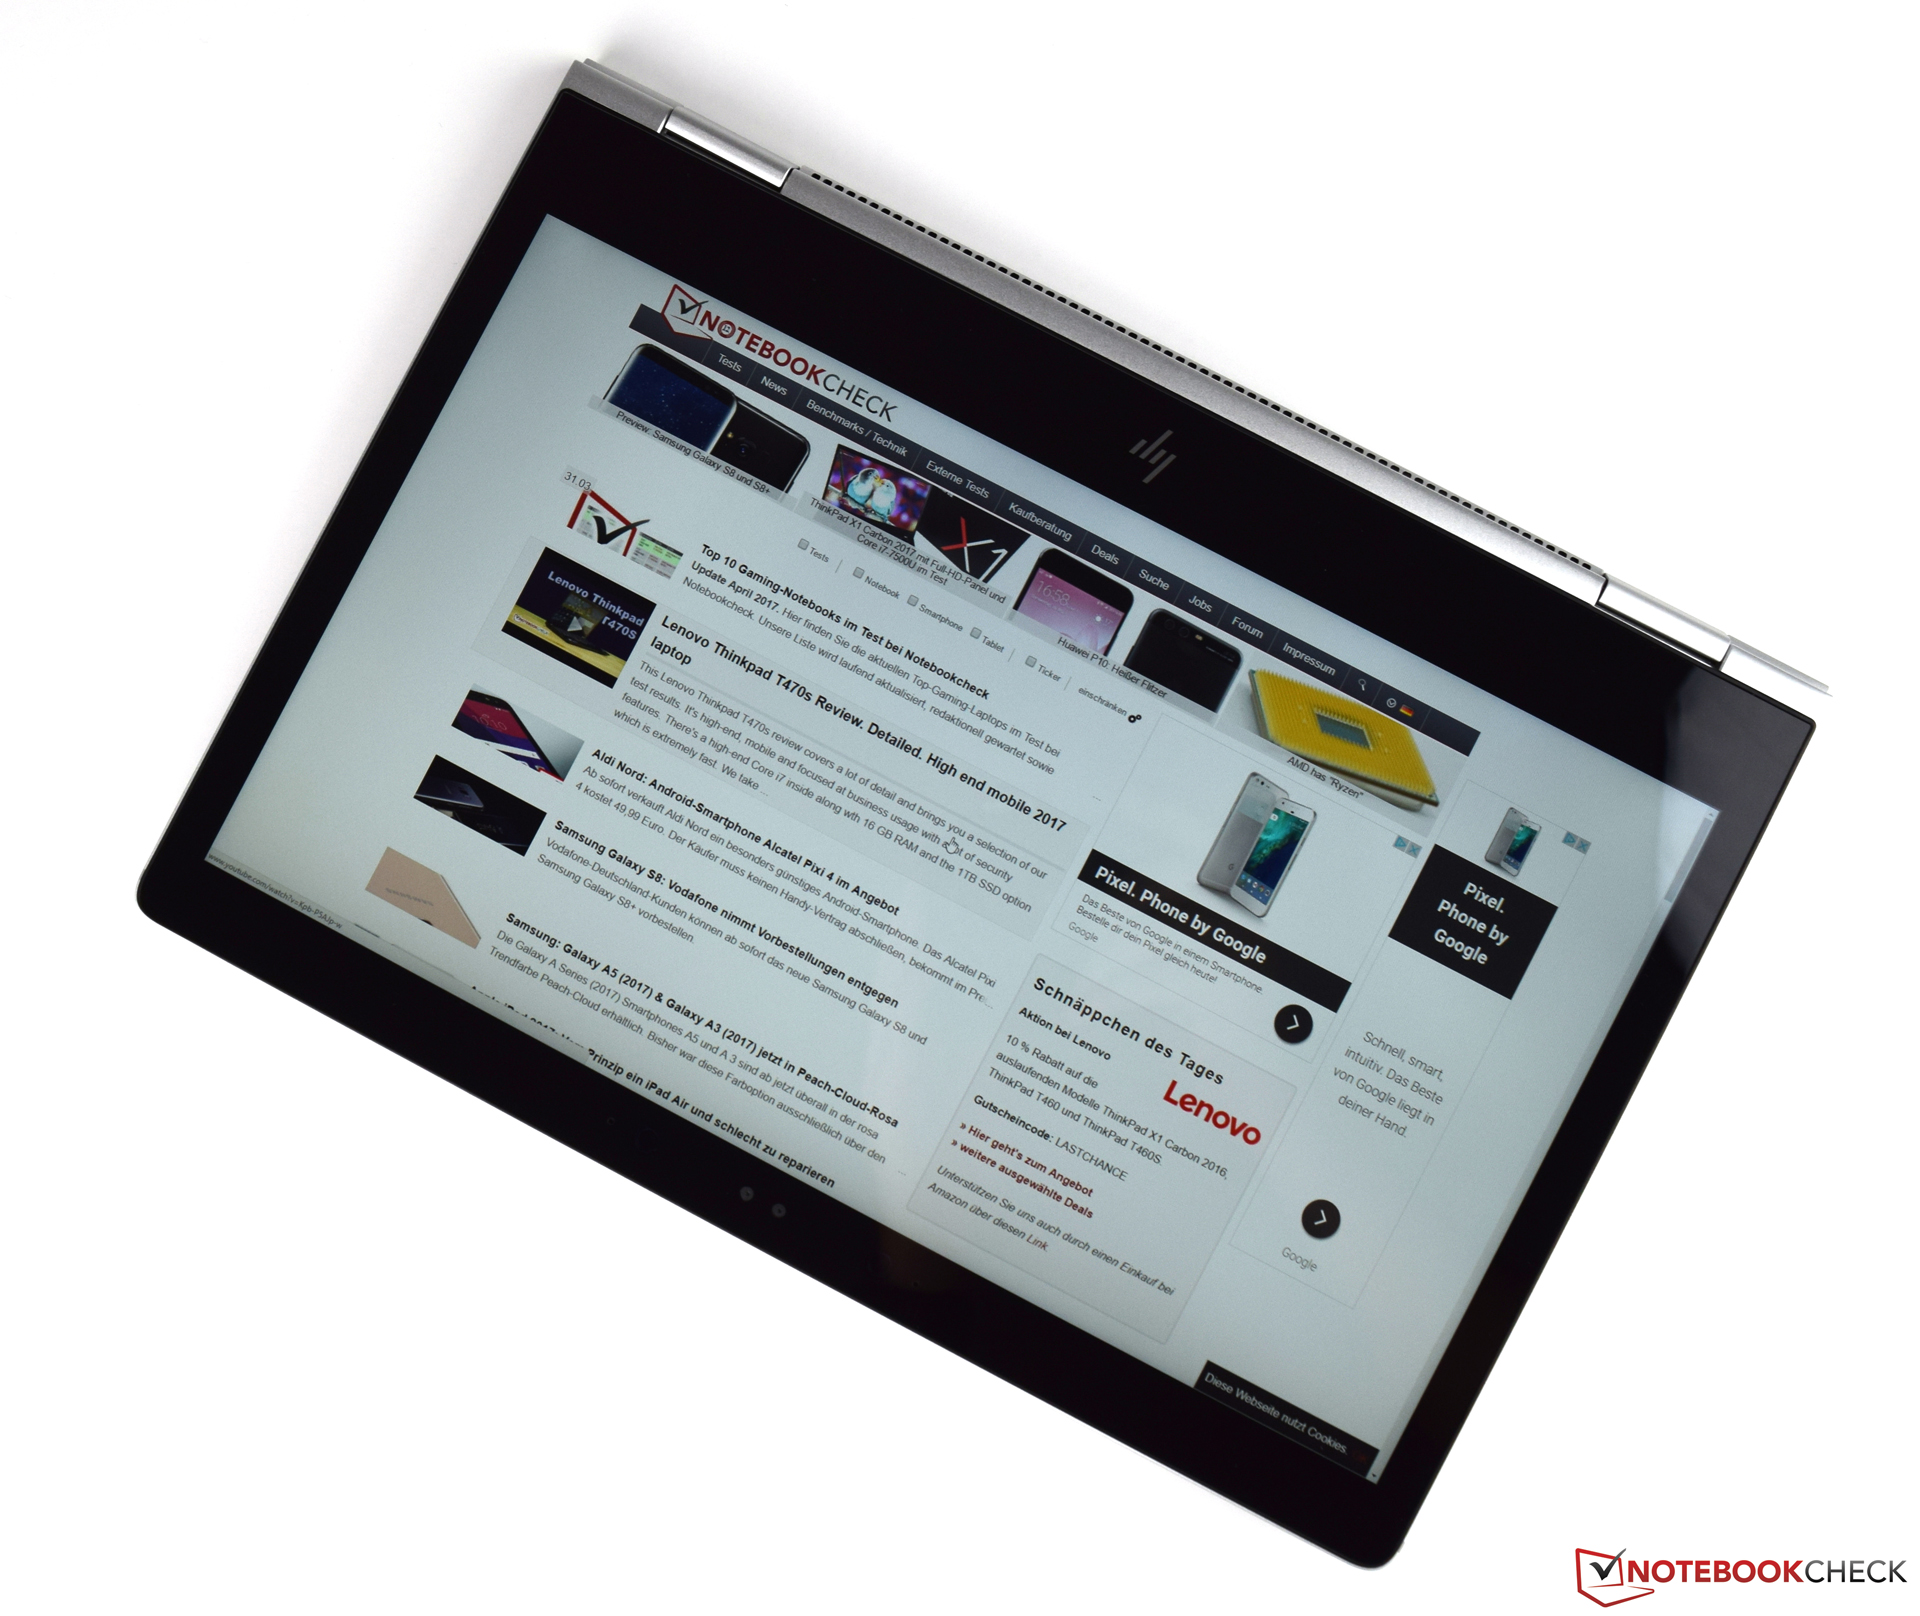
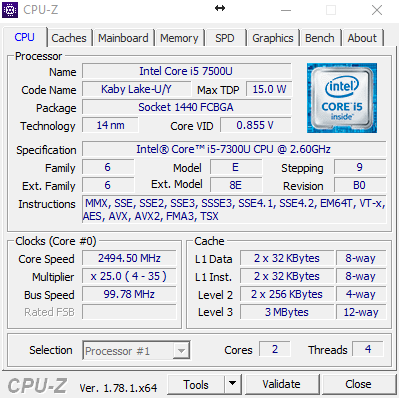
The HP EliteBook x360 1030 G2 is more than a classic business notebook. Due to the 360-degree hinges, this device is extremely flexible and the HP Active Pen enables creativity to run free. The many multimedia functions are another great feature of our test unit. The device turns out to be a great all-round notebook - with the exception of gaming performance. As the notebook was created mainly with the business sector in mind, it includes a lot of security features - which means that the price is quite high, even with the most basic equipment. Our test unit contains an Intel Core i5-7300U processor that has 8 GB of RAM available. The SSD with a capacity of 256 GB offers enough space for starters and the Full HD screen responds well to touch inputs. This configuration is available for 2000 Euros (~$2125) at the time of testing.
HP has created a very attractive device. The EliteBook x360 1030 G2 is versatile and impresses with its very long battery life.
We do have some points to criticize. One thing is the display, which has a good viewing-angle stability but has below mediocre screen brightness levels. The other thing is the SSD performance which is below what can be expected from a device of this price. HP should use only NVMe SSDs, which would be more representative of the price. But apart from these few points of criticism, the HP EliteBook x360 1030 G2 definitely convinced us during the tests. Of course, the elegant, slim design played a role in giving us such a positive impression.
HP EliteBook x360 1030 G2
- 04/10/2017 v6 (old)
Sebastian Bade