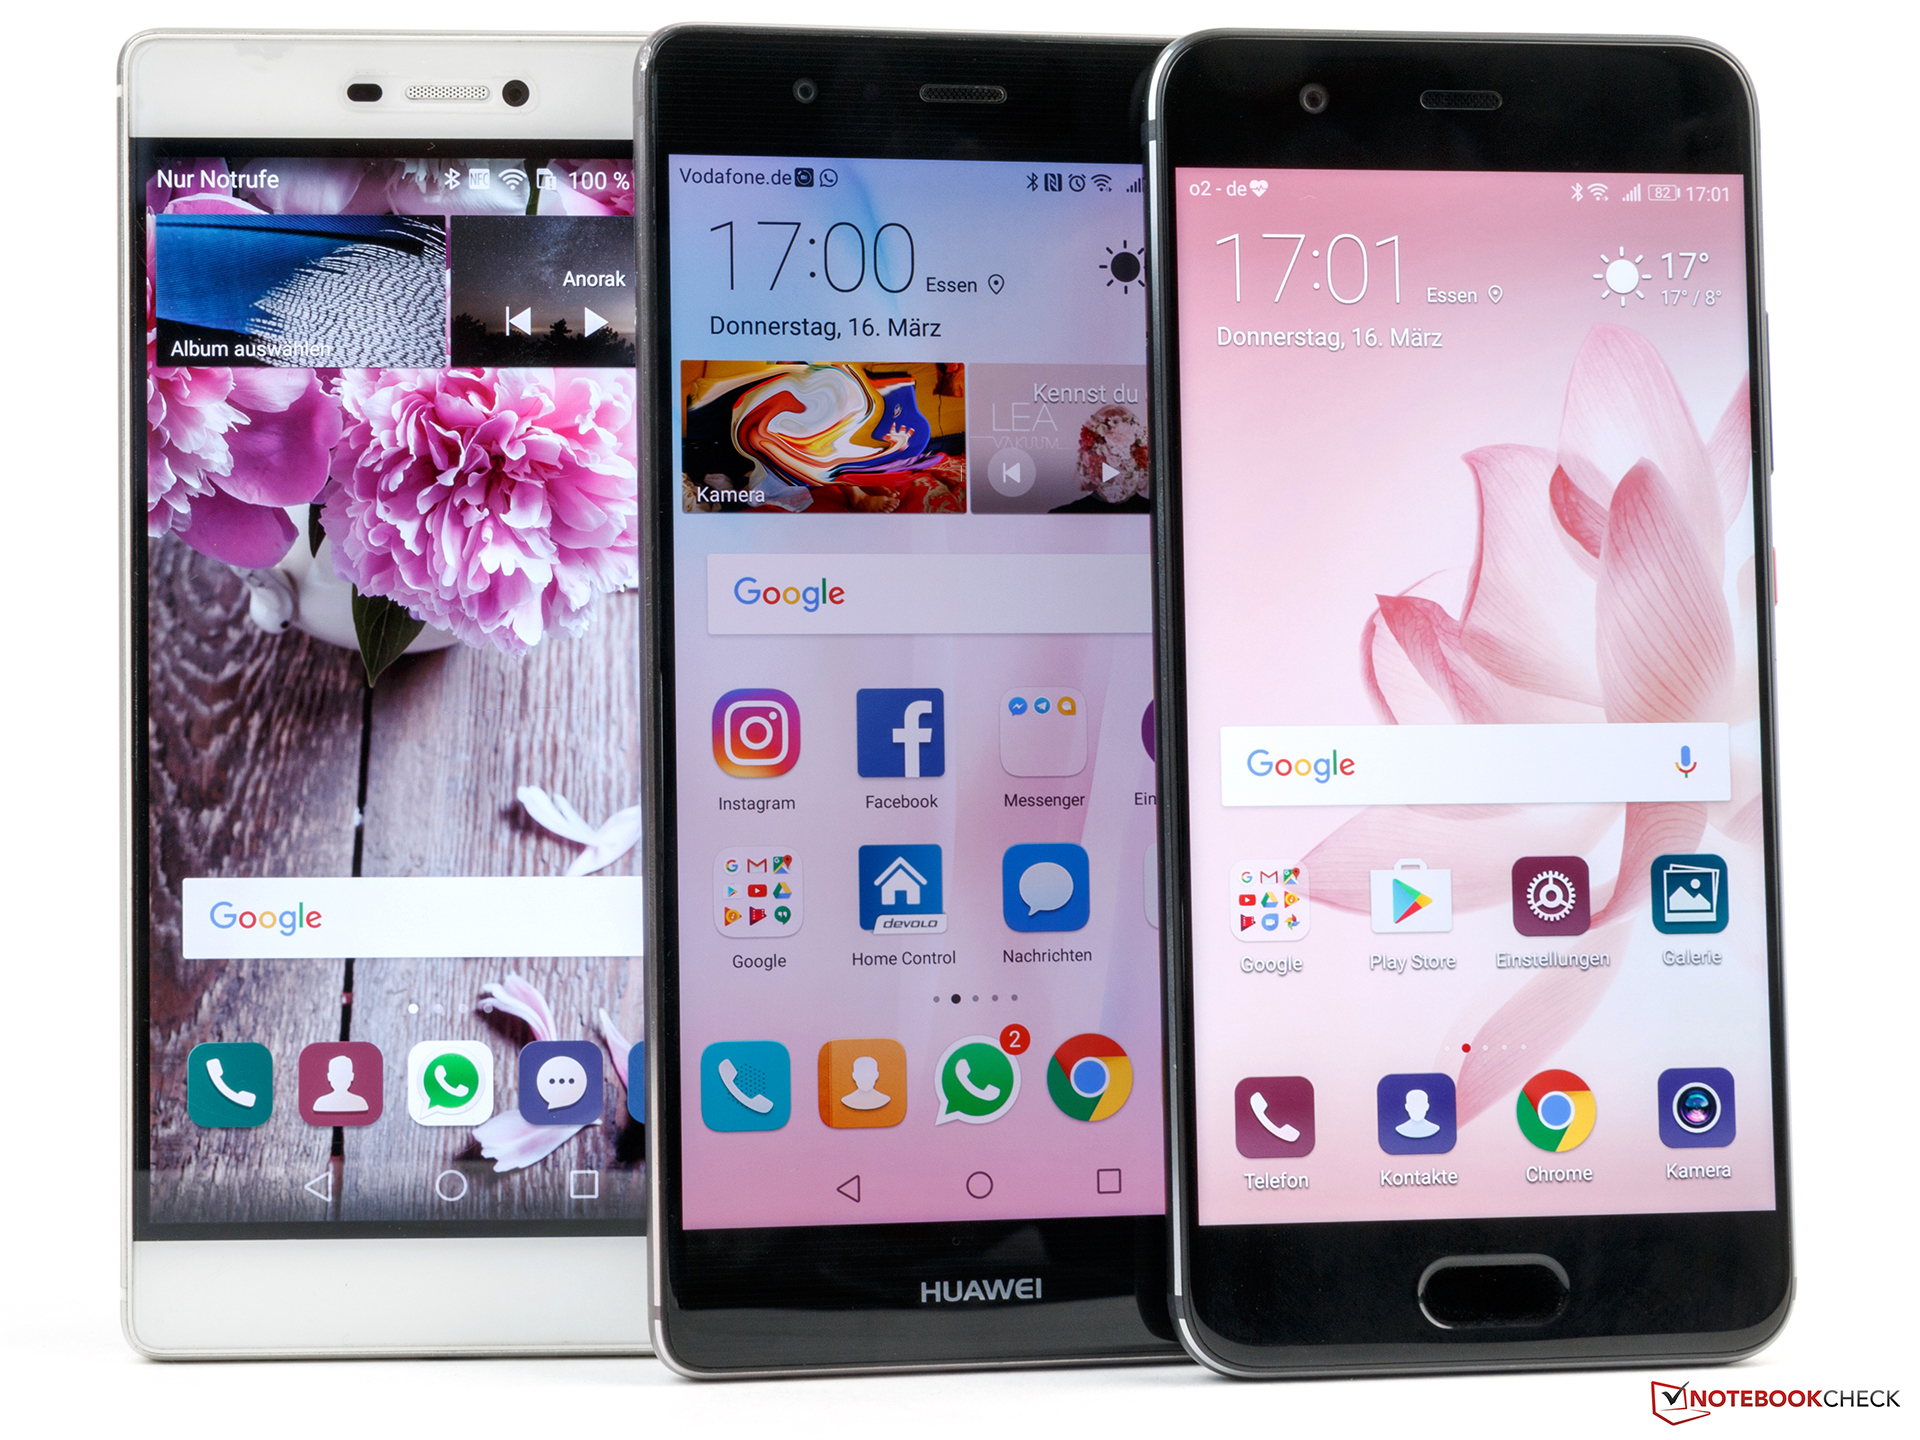
Kısa inceleme: Huawei P10 akıllı telefon
| Networking | |
| iperf3 transmit AX12 | |
| Apple iPhone 7 (Klaus I211) | |
| Huawei P10 | |
| Samsung Galaxy S7 | |
| Huawei P9 | |
| iperf3 receive AX12 | |
| Apple iPhone 7 (Klaus I211) | |
| Huawei P10 | |
| Samsung Galaxy S7 | |
| Huawei P9 | |


| |||||||||||||||||||||||||
Aydınlatma: 86 %
Batarya modunda parlaklık: 547 cd/m²
Kontrast: 1272:1 (Siyah: 0.43 cd/m²)
ΔE ColorChecker Calman: 4.8 | ∀{0.5-29.43 Ø4.73}
ΔE Greyscale Calman: 4.5 | ∀{0.09-98 Ø4.97}
Gamma: 2.39
CCT: 7194 K
| Huawei P10 LTPS, 1920x1080, 5.1" | Huawei P9 IPS-NEO, JDI, 1920x1080, 5.2" | Huawei P8 IPS-NEO, 1920x1080, 5.2" | Samsung Galaxy S7 SAMOLED, 2560x1440, 5.1" | Apple iPhone 7 IPS, 1334x750, 4.7" | Sony Xperia XZ IPS, 1920x1080, 5.2" | HTC 10 Super LCD 5, 2560x1440, 5.2" | |
|---|---|---|---|---|---|---|---|
| Screen | 8% | 3% | 21% | 31% | -8% | 9% | |
| Brightness middle (cd/m²) | 547 | 582 6% | 453 -17% | 350 -36% | 556 2% | 544 -1% | 445 -19% |
| Brightness (cd/m²) | 556 | 563 1% | 439 -21% | 351 -37% | 519 -7% | 521 -6% | 434 -22% |
| Brightness Distribution (%) | 86 | 91 6% | 91 6% | 98 14% | 90 5% | 93 8% | 93 8% |
| Black Level * (cd/m²) | 0.43 | 0.38 12% | 0.28 35% | 0.34 21% | 0.37 14% | 0.36 16% | |
| Contrast (:1) | 1272 | 1532 20% | 1618 27% | 1635 29% | 1470 16% | 1236 -3% | |
| Colorchecker dE 2000 * | 4.8 | 4.4 8% | 4.7 2% | 2.04 57% | 1.3 73% | 5.8 -21% | 2.8 42% |
| Colorchecker dE 2000 max. * | 8.8 | 7.4 16% | 3.25 63% | 2.6 70% | 9.8 -11% | 5.8 34% | |
| Greyscale dE 2000 * | 4.5 | 4.8 -7% | 5.03 -12% | 1.63 64% | 1.9 58% | 7.2 -60% | 3.7 18% |
| Gamma | 2.39 92% | 2.2 100% | 2.27 97% | 2.07 106% | 2.26 97% | 2.18 101% | 2.31 95% |
| CCT | 7194 90% | 6175 105% | 7439 87% | 6391 102% | 6818 95% | 8619 75% | 7164 91% |
| Color Space (Percent of AdobeRGB 1998) (%) | 77.78 | 72.04 | 86.86 | 63.15 | |||
| Color Space (Percent of sRGB) (%) | 99.44 | 99.35 | 99.71 |
* ... daha küçük daha iyidir
Ekran Titremesi / PWM (Darbe Genişliği Modülasyonu)
| Ekran titriyor / PWM algılanmadı | 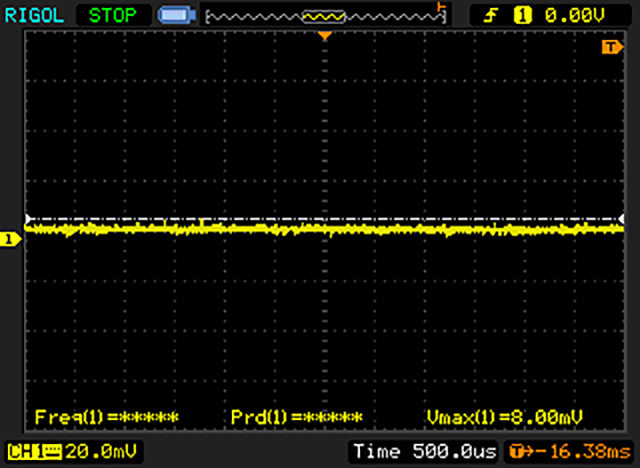 | ||
Karşılaştırıldığında: Test edilen tüm cihazların %52 %'si ekranı karartmak için PWM kullanmıyor. PWM tespit edilirse, ortalama 7798 (minimum: 5 - maksimum: 343500) Hz ölçüldü. | |||
Yanıt Sürelerini Görüntüle
| ↔ Tepki Süresi Siyahtan Beyaza | ||
|---|---|---|
| 16 ms ... yükseliş ↗ ve sonbahar↘ birleşimi | ↗ 5.2 ms yükseliş | 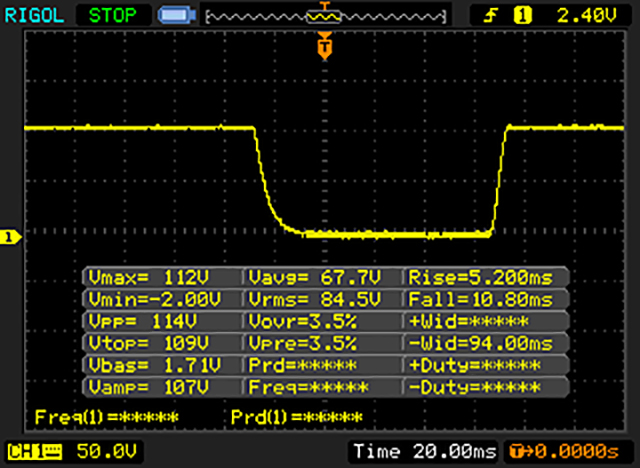 |
| ↘ 10.8 ms sonbahar | ||
| Ekran, testlerimizde iyi yanıt oranları gösteriyor ancak rekabetçi oyuncular için çok yavaş olabilir. Karşılaştırıldığında, test edilen tüm cihazlar 0.1 (minimum) ile 240 (maksimum) ms arasında değişir. » Tüm cihazların 37 %'si daha iyi. Bu, ölçülen yanıt süresinin test edilen tüm cihazların ortalamasından (19.9 ms) daha iyi olduğu anlamına gelir. | ||
| ↔ Tepki Süresi %50 Griden %80 Griye | ||
| 39.6 ms ... yükseliş ↗ ve sonbahar↘ birleşimi | ↗ 19.6 ms yükseliş | 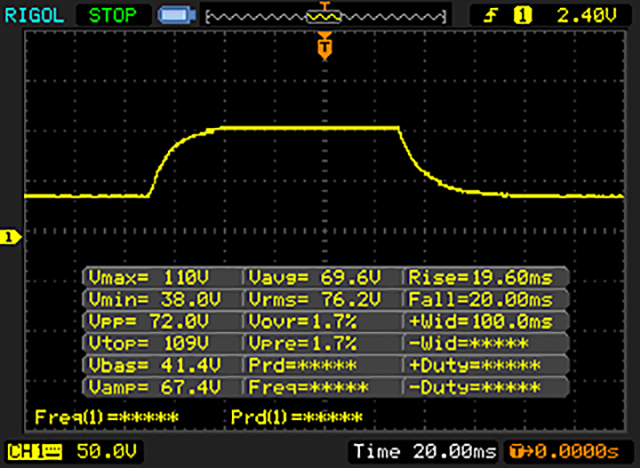 |
| ↘ 20 ms sonbahar | ||
| Ekran, testlerimizde yavaş yanıt oranları gösteriyor ve oyuncular için yetersiz olacaktır. Karşılaştırıldığında, test edilen tüm cihazlar 0.165 (minimum) ile 636 (maksimum) ms arasında değişir. » Tüm cihazların 60 %'si daha iyi. Bu, ölçülen yanıt süresinin test edilen tüm cihazların ortalamasından (31.1 ms) daha kötü olduğu anlamına gelir. | ||
| AnTuTu v6 - Total Score (değere göre sırala) | |
| Huawei P10 | |
| Huawei P9 | |
| Samsung Galaxy S7 Edge | |
| Apple iPhone 7 | |
| Lenovo Moto Z | |
| Sony Xperia XZ | |
| HTC 10 | |
| Huawei Mate 9 | |
| OnePlus 3T | |
| Geekbench 4.0 | |
| 64 Bit Single-Core Score (değere göre sırala) | |
| Huawei P10 | |
| Huawei P9 | |
| Samsung Galaxy S7 Edge | |
| Apple iPhone 7 | |
| Lenovo Moto Z | |
| Sony Xperia XZ | |
| Huawei Mate 9 | |
| OnePlus 3T | |
| 64 Bit Multi-Core Score (değere göre sırala) | |
| Huawei P10 | |
| Huawei P9 | |
| Samsung Galaxy S7 Edge | |
| Apple iPhone 7 | |
| Lenovo Moto Z | |
| Sony Xperia XZ | |
| Huawei Mate 9 | |
| OnePlus 3T | |
| GFXBench (DX / GLBenchmark) 2.7 | |
| T-Rex Onscreen (değere göre sırala) | |
| Huawei P10 | |
| Huawei P9 | |
| Samsung Galaxy S7 Edge | |
| Apple iPhone 7 | |
| Lenovo Moto Z | |
| Sony Xperia XZ | |
| HTC 10 | |
| Huawei Mate 9 | |
| OnePlus 3T | |
| 1920x1080 T-Rex Offscreen (değere göre sırala) | |
| Huawei P10 | |
| Huawei P9 | |
| Samsung Galaxy S7 Edge | |
| Apple iPhone 7 | |
| Lenovo Moto Z | |
| Sony Xperia XZ | |
| HTC 10 | |
| Huawei Mate 9 | |
| OnePlus 3T | |
| GFXBench 3.0 | |
| on screen Manhattan Onscreen OGL (değere göre sırala) | |
| Huawei P10 | |
| Huawei P9 | |
| Samsung Galaxy S7 Edge | |
| Apple iPhone 7 | |
| Lenovo Moto Z | |
| Sony Xperia XZ | |
| HTC 10 | |
| Huawei Mate 9 | |
| OnePlus 3T | |
| 1920x1080 1080p Manhattan Offscreen (değere göre sırala) | |
| Huawei P10 | |
| Huawei P9 | |
| Samsung Galaxy S7 Edge | |
| Apple iPhone 7 | |
| Lenovo Moto Z | |
| Sony Xperia XZ | |
| HTC 10 | |
| Huawei Mate 9 | |
| OnePlus 3T | |
| GFXBench 3.1 | |
| on screen Manhattan ES 3.1 Onscreen (değere göre sırala) | |
| Huawei P10 | |
| Huawei P9 | |
| Samsung Galaxy S7 Edge | |
| Apple iPhone 7 | |
| Lenovo Moto Z | |
| Sony Xperia XZ | |
| HTC 10 | |
| Huawei Mate 9 | |
| OnePlus 3T | |
| 1920x1080 Manhattan ES 3.1 Offscreen (değere göre sırala) | |
| Huawei P10 | |
| Huawei P9 | |
| Samsung Galaxy S7 Edge | |
| Apple iPhone 7 | |
| Lenovo Moto Z | |
| Sony Xperia XZ | |
| HTC 10 | |
| Huawei Mate 9 | |
| OnePlus 3T | |
| PCMark for Android | |
| Work performance score (değere göre sırala) | |
| Huawei P10 | |
| Huawei P9 | |
| Samsung Galaxy S7 Edge | |
| Lenovo Moto Z | |
| Sony Xperia XZ | |
| HTC 10 | |
| Huawei Mate 9 | |
| OnePlus 3T | |
| Work 2.0 performance score (değere göre sırala) | |
| Huawei P10 | |
| Huawei P9 | |
| Sony Xperia XZ | |
| HTC 10 | |
| Huawei Mate 9 | |
| Lightmark - 1920x1080 1080p (değere göre sırala) | |
| Huawei P10 | |
| Huawei P9 | |
| Samsung Galaxy S7 Edge | |
| Lenovo Moto Z | |
| Huawei Mate 9 | |
| Basemark ES 3.1 / Metal - offscreen Overall Score (değere göre sırala) | |
| Huawei P10 | |
| Huawei P9 | |
| Samsung Galaxy S7 Edge | |
| Apple iPhone 7 | |
| Apple iPhone 7 | |
| Lenovo Moto Z | |
| HTC 10 | |
| Huawei Mate 9 | |
| Epic Citadel - Ultra High Quality (değere göre sırala) | |
| Huawei P10 | |
| Huawei P9 | |
| Samsung Galaxy S7 Edge | |
| Lenovo Moto Z | |
| Huawei Mate 9 | |
| WebXPRT 2015 - Overall (değere göre sırala) | |
| Huawei P10 | |
| Huawei P9 | |
| Samsung Galaxy S7 Edge | |
| Apple iPhone 7 | |
| Lenovo Moto Z | |
| Sony Xperia XZ | |
| HTC 10 | |
| Huawei Mate 9 | |
| OnePlus 3T | |
| BaseMark OS II - Web (değere göre sırala) | |
| Huawei P10 | |
| Huawei P9 | |
| Samsung Galaxy S7 Edge | |
| Apple iPhone 7 | |
| Lenovo Moto Z | |
| Sony Xperia XZ | |
| HTC 10 | |
| Huawei Mate 9 | |
| OnePlus 3T | |
| Octane V2 - Total Score (değere göre sırala) | |
| Huawei P10 | |
| Huawei P9 | |
| Samsung Galaxy S7 Edge | |
| Apple iPhone 7 | |
| Lenovo Moto Z | |
| Sony Xperia XZ | |
| HTC 10 | |
| Huawei Mate 9 | |
| OnePlus 3T | |
| Mozilla Kraken 1.1 - Total (değere göre sırala) | |
| Huawei P10 | |
| Huawei P9 | |
| Samsung Galaxy S7 Edge | |
| Apple iPhone 7 | |
| Lenovo Moto Z | |
| Sony Xperia XZ | |
| HTC 10 | |
| Huawei Mate 9 | |
| OnePlus 3T | |
| JetStream 1.1 - 1.1 Total (değere göre sırala) | |
| Huawei P10 | |
| Huawei P9 | |
| Samsung Galaxy S7 Edge | |
| Apple iPhone 7 | |
| Lenovo Moto Z | |
| Sony Xperia XZ | |
| HTC 10 | |
| Huawei Mate 9 | |
| OnePlus 3T | |
| Vellamo 3.x - Browser (değere göre sırala) | |
| Huawei P10 | |
| Huawei P9 | |
| Samsung Galaxy S7 Edge | |
| Lenovo Moto Z | |
| Huawei Mate 9 | |
* ... daha küçük daha iyidir
| Huawei P10 | Huawei P9 | Lenovo Moto Z | Sony Xperia XZ | HTC 10 | Samsung Galaxy S7 | LG G5 | ZTE Axon 7 | |
|---|---|---|---|---|---|---|---|---|
| AndroBench 3-5 | -49% | -8% | -48% | -20% | -16% | -20% | -13% | |
| Sequential Read 256KB (MB/s) | 738 | 281.3 -62% | 439.7 -40% | 281 -62% | 275.1 -63% | 483.8 -34% | 427.6 -42% | 406.5 -45% |
| Sequential Write 256KB (MB/s) | 189.8 | 72.2 -62% | 168.3 -11% | 138 -27% | 115.6 -39% | 145.7 -23% | 141.3 -26% | 150.9 -20% |
| Random Read 4KB (MB/s) | 168.4 | 39 -77% | 117.2 -30% | 71.5 -58% | 29.92 -82% | 85.9 -49% | 89.3 -47% | 121.1 -28% |
| Random Write 4KB (MB/s) | 152.3 | 47.45 -69% | 74.9 -51% | 10.5 -93% | 15.89 -90% | 16.01 -89% | 16.22 -89% | 16.22 -89% |
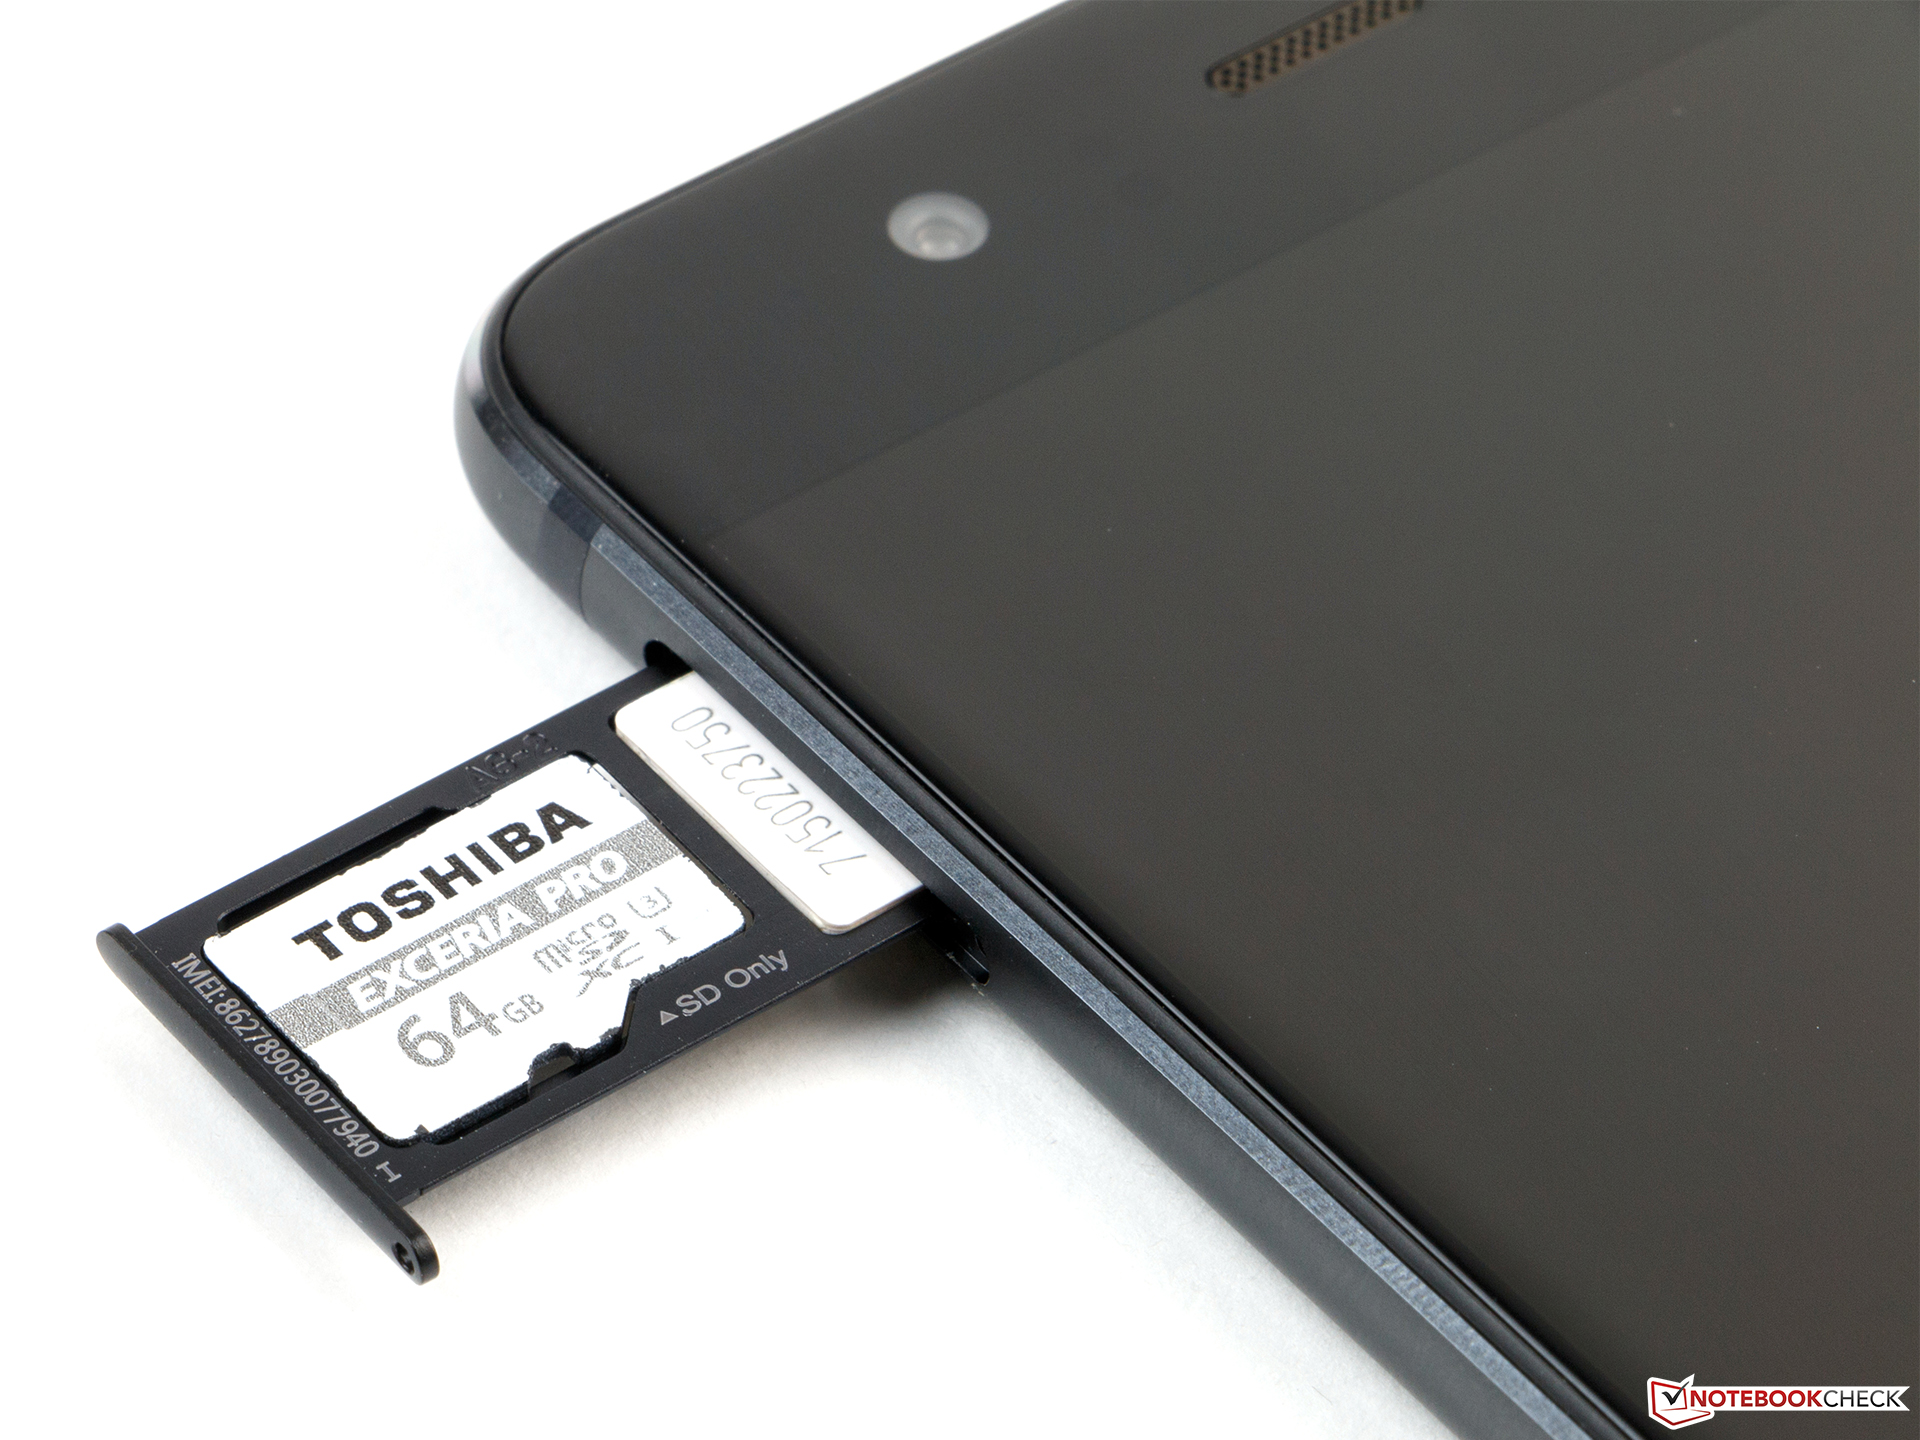
| Sequential Read 256KB SDCard (MB/s) | 54.2 | 55 1% | 78.5 45% | 33.5 -38% | 83.3 54% | 72.3 33% | 78.5 45% | 78.4 45% |
| Sequential Write 256KB SDCard (MB/s) | 32.19 | 24.83 -23% | 45.64 42% | 29.8 -7% | 65.4 103% | 53.6 67% | 45.53 41% | 51.3 59% |
(±) Üst taraftaki maksimum sıcaklık, 35.3 °C / 96 F ortalamasına kıyasla 44.6 °C / 112 F'dir. , Smartphone sınıfı için 21.9 ile 247 °C arasında değişir.
(±) Alt kısım, 34 °C / 93 F ortalamasına kıyasla maksimum 40.9 °C / 106 F'ye kadar ısınır
(±) Boşta kullanımda, üst tarafın ortalama sıcaklığı 32.1 °C / 90 F olup, cihazın 32.9 °C / 91 F.
Huawei P10 ses analizi
(+) | hoparlörler nispeten yüksek sesle çalabilir (82.7 dB)
Bas 100 - 315Hz
(-) | neredeyse hiç bas yok - ortalama olarak medyandan 20.9% daha düşük
(±) | Bas doğrusallığı ortalamadır (12.6% delta - önceki frekans)
Ortalar 400 - 2000 Hz
(+) | dengeli ortalar - medyandan yalnızca 4.2% uzakta
(+) | orta frekanslar doğrusaldır (6% deltadan önceki frekansa)
Yüksekler 2 - 16 kHz
(±) | daha yüksek en yüksekler - ortalama olarak medyandan 5.4% daha yüksek
(+) | yüksekler doğrusaldır (4.9% deltadan önceki frekansa)
Toplam 100 - 16.000 Hz
(±) | Genel sesin doğrusallığı ortalamadır (23.6% ortancaya göre fark)
Aynı sınıfla karşılaştırıldığında
» Bu sınıftaki tüm test edilen cihazların %54%'si daha iyi, 8% benzer, 38% daha kötüydü
» En iyisinin deltası 11% idi, ortalama 34% idi, en kötüsü 134% idi
Test edilen tüm cihazlarla karşılaştırıldığında
» Test edilen tüm cihazların %71'si daha iyi, 6 benzer, % 23 daha kötüydü
» En iyisinin deltası 4% idi, ortalama 24% idi, en kötüsü 134% idi
Apple iPhone 7 ses analizi
(+) | hoparlörler nispeten yüksek sesle çalabilir (83.1 dB)
Bas 100 - 315Hz
(-) | neredeyse hiç bas yok - ortalama olarak medyandan 21.8% daha düşük
(±) | Bas doğrusallığı ortalamadır (9.5% delta - önceki frekans)
Ortalar 400 - 2000 Hz
(+) | dengeli ortalar - medyandan yalnızca 4.3% uzakta
(+) | orta frekanslar doğrusaldır (6% deltadan önceki frekansa)
Yüksekler 2 - 16 kHz
(±) | daha yüksek en yüksekler - ortalama olarak medyandan 5.9% daha yüksek
(±) | Yükseklerin doğrusallığı ortalamadır (8.2% delta - önceki frekans)
Toplam 100 - 16.000 Hz
(±) | Genel sesin doğrusallığı ortalamadır (20.9% ortancaya göre fark)
Aynı sınıfla karşılaştırıldığında
» Bu sınıftaki tüm test edilen cihazların %39%'si daha iyi, 8% benzer, 53% daha kötüydü
» En iyisinin deltası 11% idi, ortalama 34% idi, en kötüsü 134% idi
Test edilen tüm cihazlarla karşılaştırıldığında
» Test edilen tüm cihazların %57'si daha iyi, 8 benzer, % 36 daha kötüydü
» En iyisinin deltası 4% idi, ortalama 24% idi, en kötüsü 134% idi
Samsung Galaxy S7 Edge ses analizi
(+) | hoparlörler nispeten yüksek sesle çalabilir (88.7 dB)
Bas 100 - 315Hz
(-) | neredeyse hiç bas yok - ortalama olarak medyandan 27.4% daha düşük
(±) | Bas doğrusallığı ortalamadır (8.7% delta - önceki frekans)
Ortalar 400 - 2000 Hz
(+) | dengeli ortalar - medyandan yalnızca 4.4% uzakta
(+) | orta frekanslar doğrusaldır (4.7% deltadan önceki frekansa)
Yüksekler 2 - 16 kHz
(±) | daha yüksek en yüksekler - ortalama olarak medyandan 5.8% daha yüksek
(+) | yüksekler doğrusaldır (6.2% deltadan önceki frekansa)
Toplam 100 - 16.000 Hz
(±) | Genel sesin doğrusallığı ortalamadır (20.6% ortancaya göre fark)
Aynı sınıfla karşılaştırıldığında
» Bu sınıftaki tüm test edilen cihazların %36%'si daha iyi, 9% benzer, 55% daha kötüydü
» En iyisinin deltası 11% idi, ortalama 34% idi, en kötüsü 134% idi
Test edilen tüm cihazlarla karşılaştırıldığında
» Test edilen tüm cihazların %55'si daha iyi, 8 benzer, % 37 daha kötüydü
» En iyisinin deltası 4% idi, ortalama 24% idi, en kötüsü 134% idi
| Kapalı / Bekleme modu | |
| Boşta | |
| Çalışırken |
|
Key:
min: | |
| Huawei P10 3200 mAh | Huawei P9 3000 mAh | HTC 10 3000 mAh | Samsung Galaxy S7 3000 mAh | Apple iPhone 7 1960 mAh | Lenovo ZUK Z2 3500 mAh | Xiaomi Mi 5s 3200 mAh | |
|---|---|---|---|---|---|---|---|
| Power Consumption | 16% | 8% | 34% | 36% | -1% | 20% | |
| Idle Minimum * (Watt) | 0.83 | 0.77 7% | 0.68 18% | 0.68 18% | 0.54 35% | 1.31 -58% | 0.4 52% |
| Idle Average * (Watt) | 2.1 | 2.36 -12% | 1.49 29% | 1.02 51% | 1.51 28% | 2.03 3% | 1.7 19% |
| Idle Maximum * (Watt) | 2.18 | 2.37 -9% | 1.91 12% | 1.14 48% | 1.54 29% | 2.08 5% | 1.81 17% |
| Load Average * (Watt) | 6.57 | 3.09 53% | 7.4 -13% | 4.73 28% | 3.75 43% | 5.45 17% | 5.84 11% |
| Load Maximum * (Watt) | 9.32 | 5.35 43% | 9.71 -4% | 7.16 23% | 5.01 46% | 6.75 28% | 9.12 2% |
* ... daha küçük daha iyidir
| Huawei P10 3200 mAh | Huawei P9 3000 mAh | Samsung Galaxy S7 3000 mAh | Apple iPhone 7 1960 mAh | HTC 10 3000 mAh | Lenovo ZUK Z2 3500 mAh | Lenovo Moto Z 2600 mAh | |
|---|---|---|---|---|---|---|---|
| Pil Çalışma Süresi | -7% | 14% | -9% | -12% | -43% | 10% | |
| Reader / Idle (h) | 25.7 | 25.2 -2% | 30.2 18% | 29.5 15% | 21.2 -18% | 22.9 -11% | |
| H.264 (h) | 9.7 | 9.5 -2% | 14.9 54% | 12 24% | 10.8 11% | 12.1 25% | |
| WiFi v1.3 (h) | 16.1 | 9.5 -41% | 7.6 -53% | 8.6 -47% | 6.9 -57% | 9.1 -43% | 6.8 -58% |
| Load (h) | 2.9 | 3.4 17% | 4 38% | 2.1 -28% | 3.4 17% | 5.3 83% |
Artılar
Eksiler
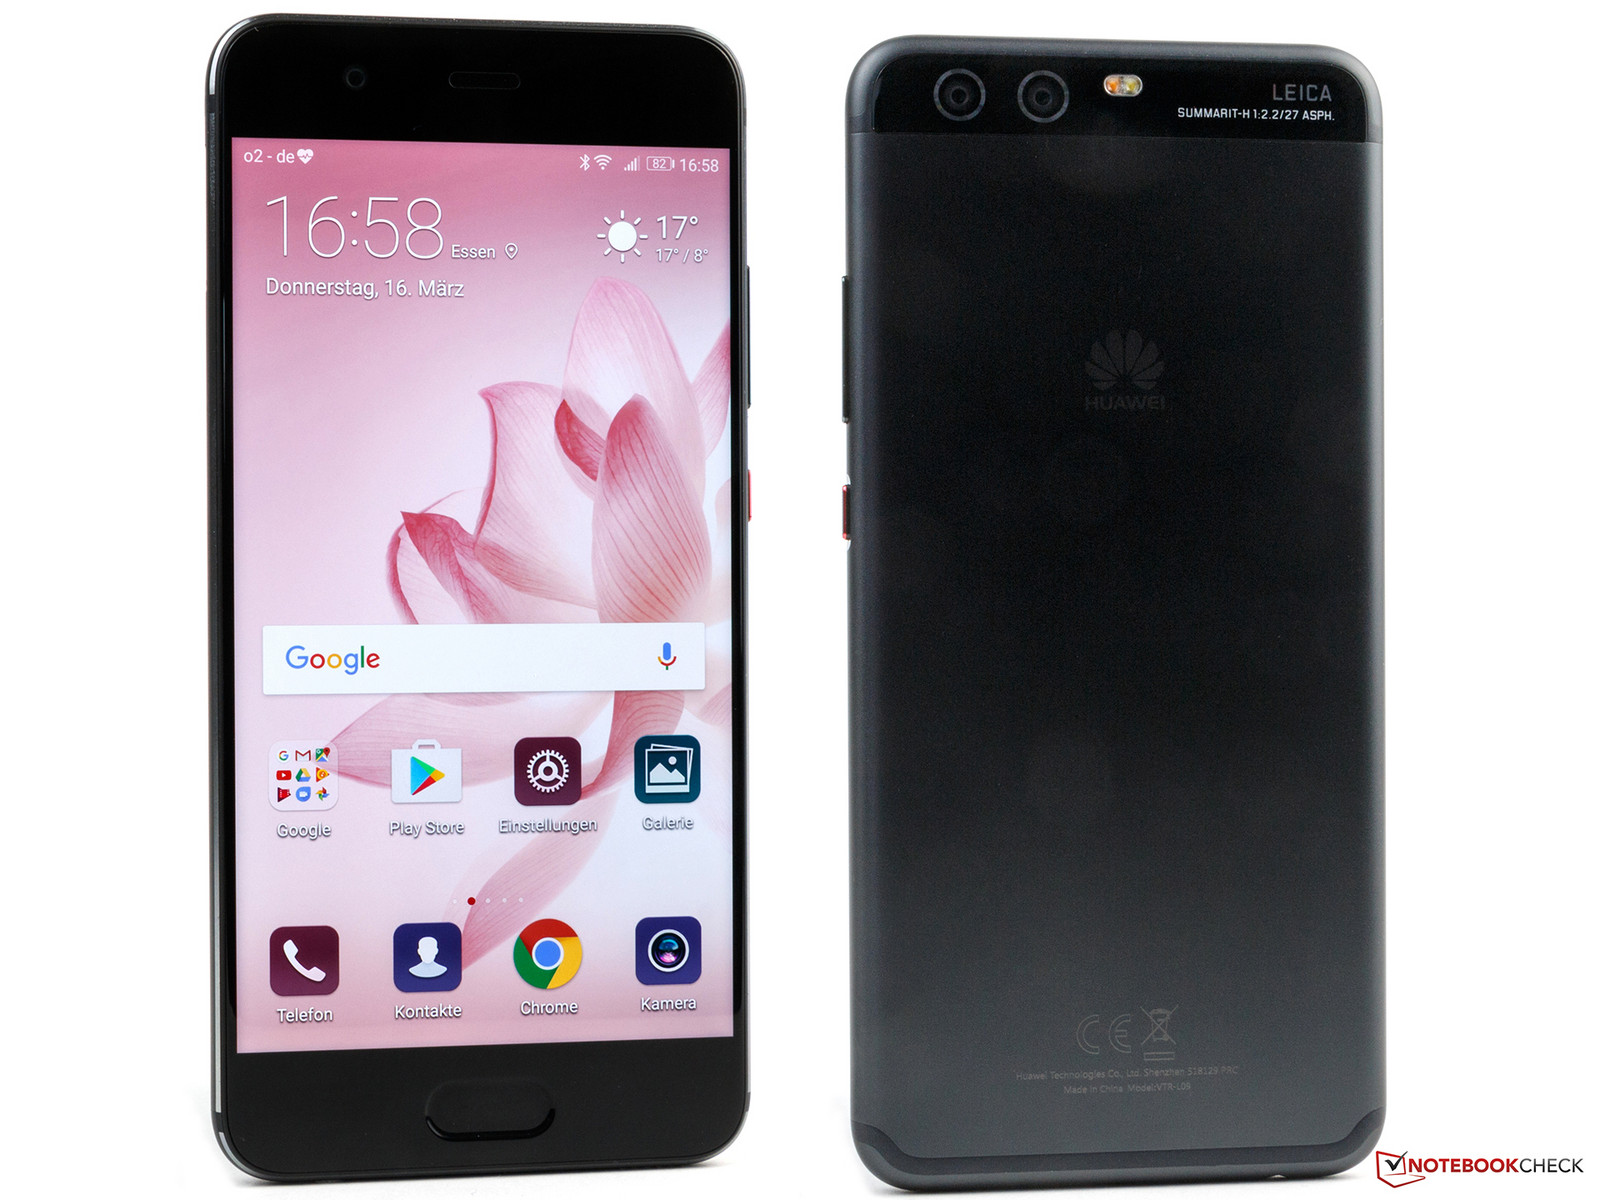
Huawei yine harika bir ürün sunuyor ve P10 lifestyle ürünüyle fazla eleştiriye yer bırakmıyor. Asıl üst sınıf ürünü ise P10 Plus modeli. Yine de daha küçük model birinci sınıf özelliklere sahip. UFS 2.1 depolama alanı, LTE Cat. 12 ve ışık hızında Kirin 960 sistem çipi sadece daha pahalı rakiplerde bulunan özellikler.
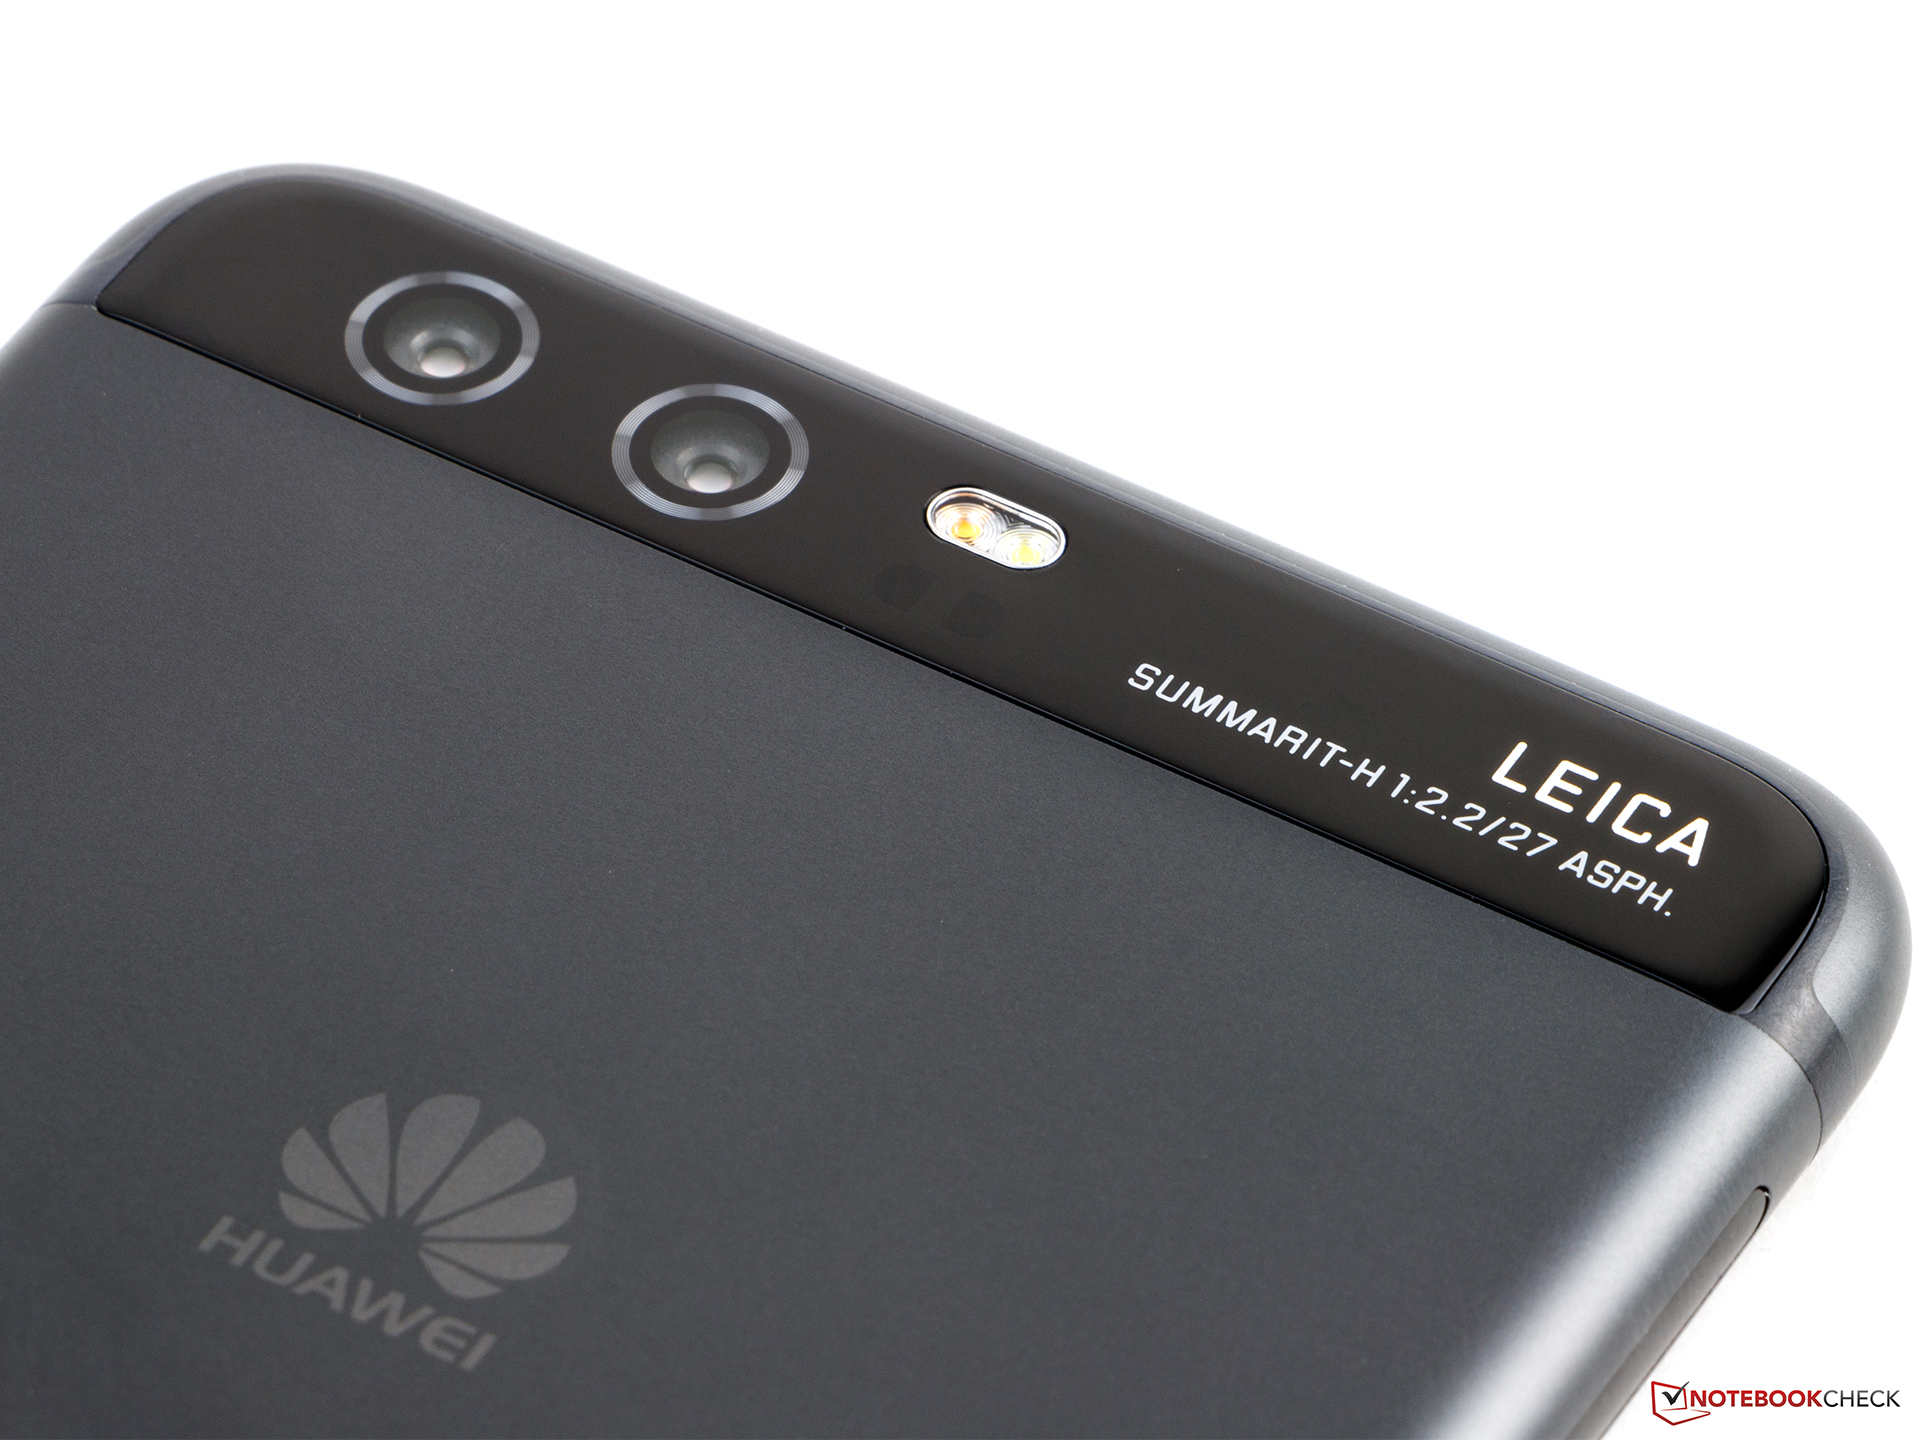
Leica'nın çift kamerası beğendiğimiz özelliklerden biri. Teknik olarak halen iyileştirilebilecek gibi dursa da, harika fotoğraflar seçiyor. Dahili portre modu oldukça iyi. Batarya ömrü de iyileştirilmiş.
Huawei'nin P10 modeli iyi kamerası ve geliştirilmiş batarya ömrü ile ileriye dönük bir geliştirme.
Ancak Huawei'nin üst segment bir ürün olduğu düşünüldüğünde bazı eksiklikleri mevcut. Öncelikle zayıf Wi-Fi modülü, yavaş microSD slotu ve sadece Full HD ekranı cihazın giriş yaptığı fiyat segmenti için uygun değil.
Huawei verdiği servis ile de ekstra puan kazanıyor. VIP servis alındığında garanti süresi 3 yıla kadar çıkıyor. Huawei yine harika bir ürün çıkartmış.
Huawei P10
- 07/11/2017 v6 (old)
Daniel Schmidt