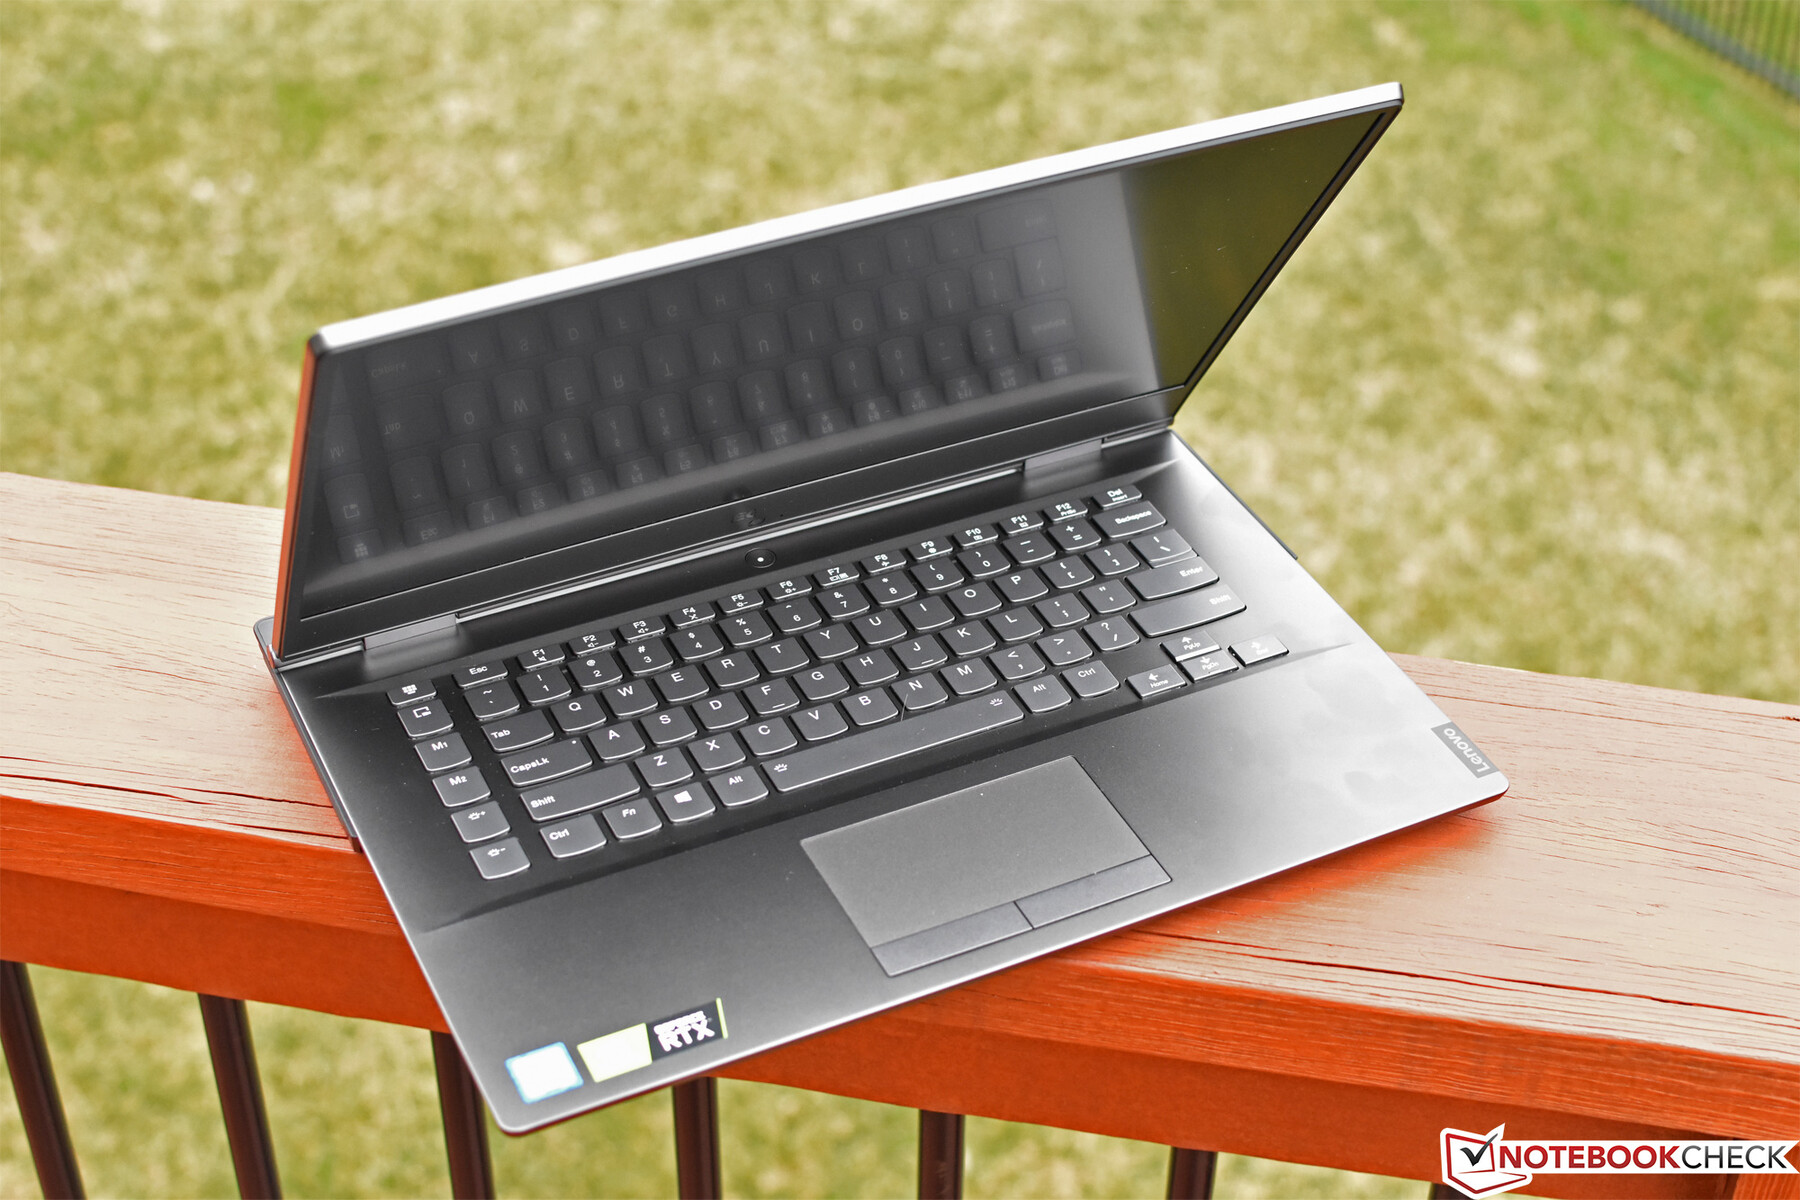
Kısa inceleme: Lenovo Legion Y740 Laptop
Lenovo, yalnızca 8. nesil Intel Core işlemcilere sahip Legion Y740-15ICHg ürününü teklif etti, ancak Y740'ı Coffee Lake Refresh (CL-R) nesline yükseltti. CL-R işlemciler seleflerinden daha yüksek takviye saatler sunar, bu yüzden Core i7-9750H motorlu Y740'ın Core i7-8750H motorlu selefine göre ne gibi faydalar sağladığını görmenin uygun olacağını düşündük. Bu arada, yeni test cihazımız Lenovo'nun ilk inceleme birimimize dahil ettiğinden çok daha parlak bir ekrana sahip. Elbette yeni inceleme birimimizi öncekilerle karşılaştıracağız. Y740 ayrıca HP Omen X 2S ve Acer Predator Triton 500 ile karşılaştırılabilir bir donanıma sahip olacak.

Ekran - G-Sync, Dolby Vision ve 144 Hz
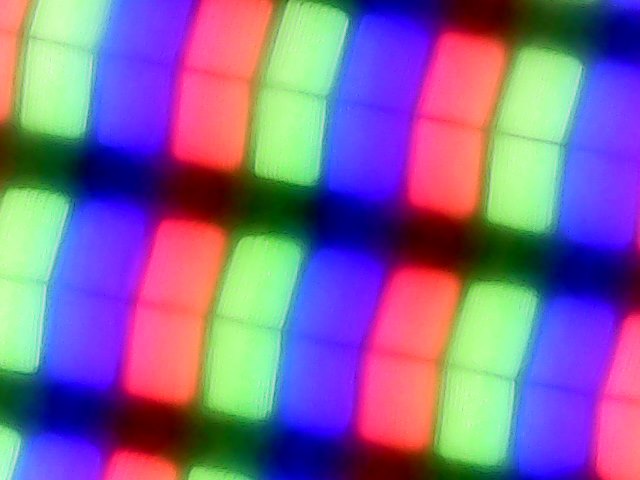
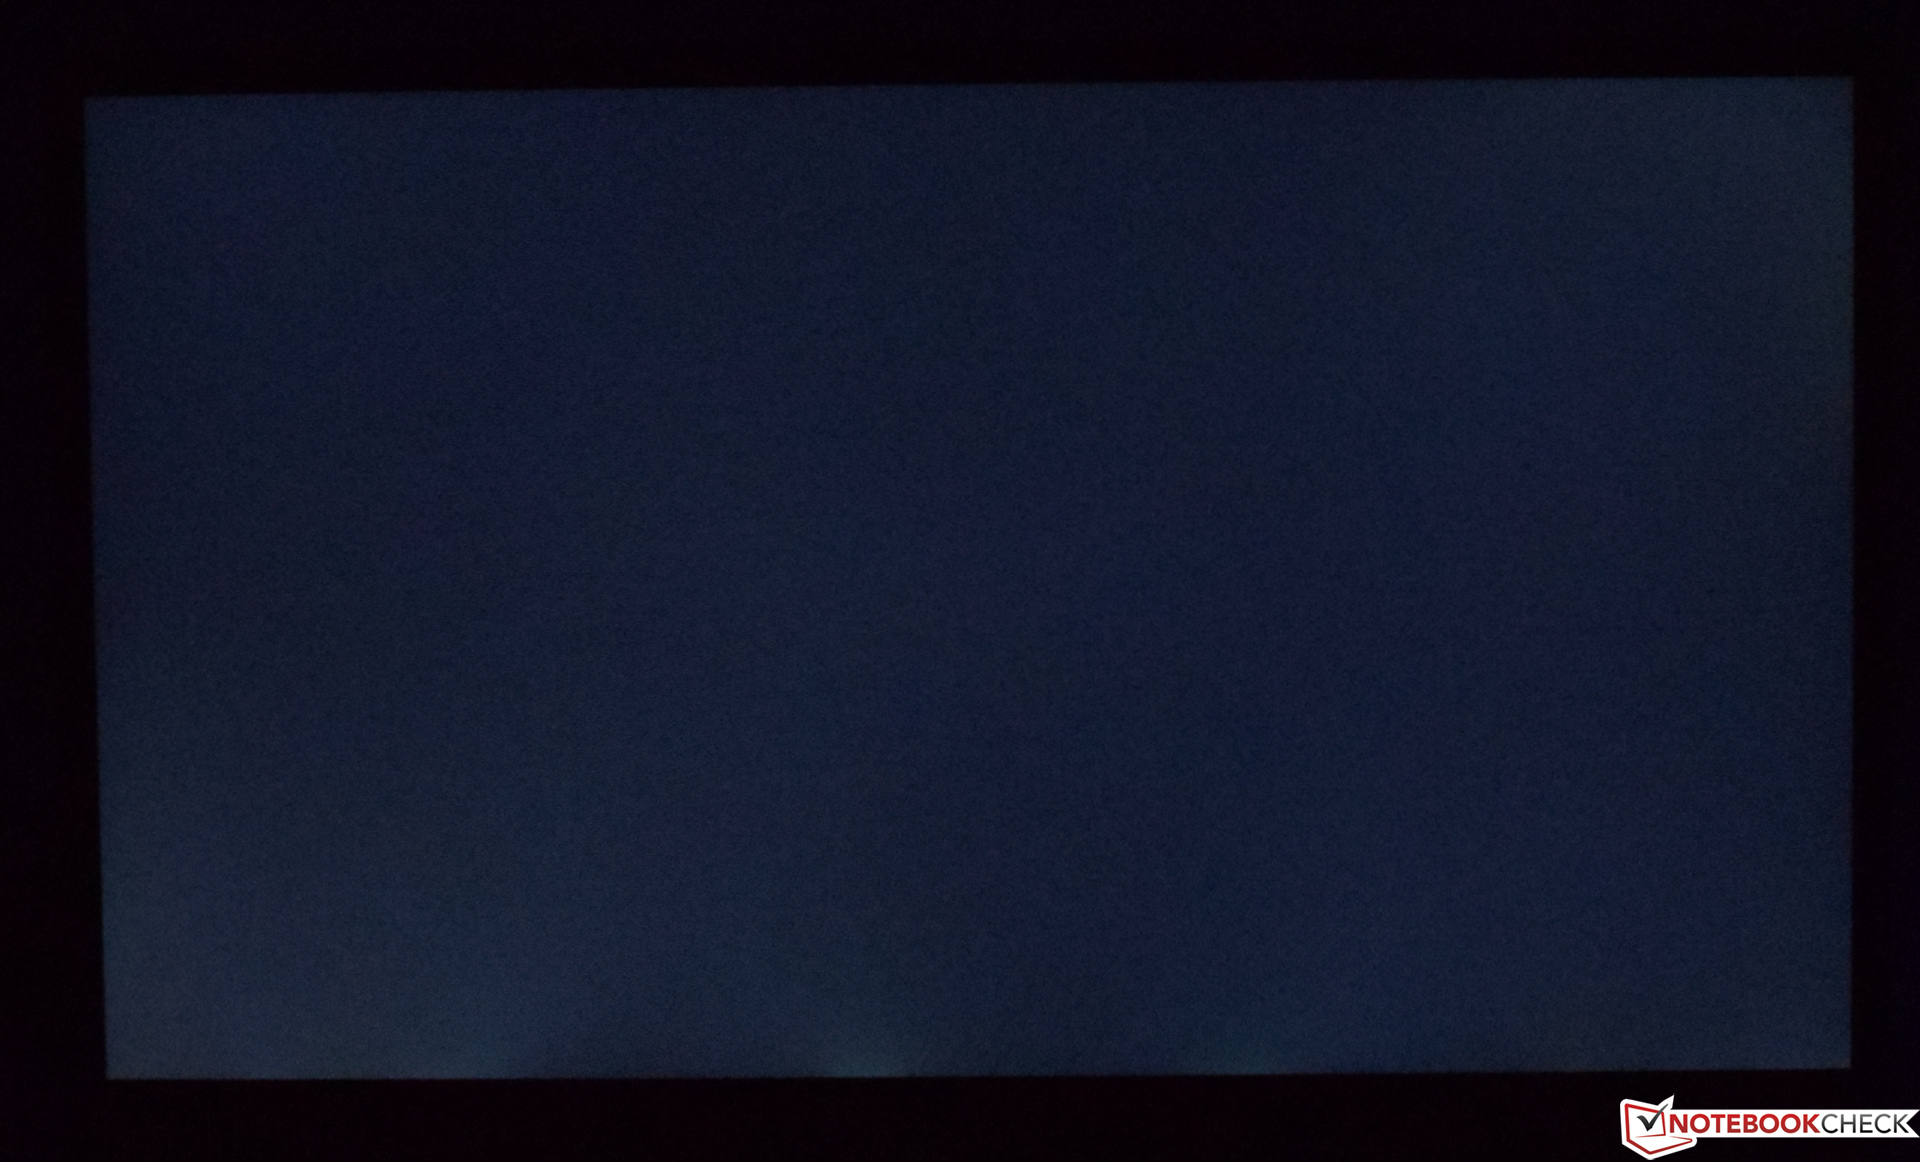
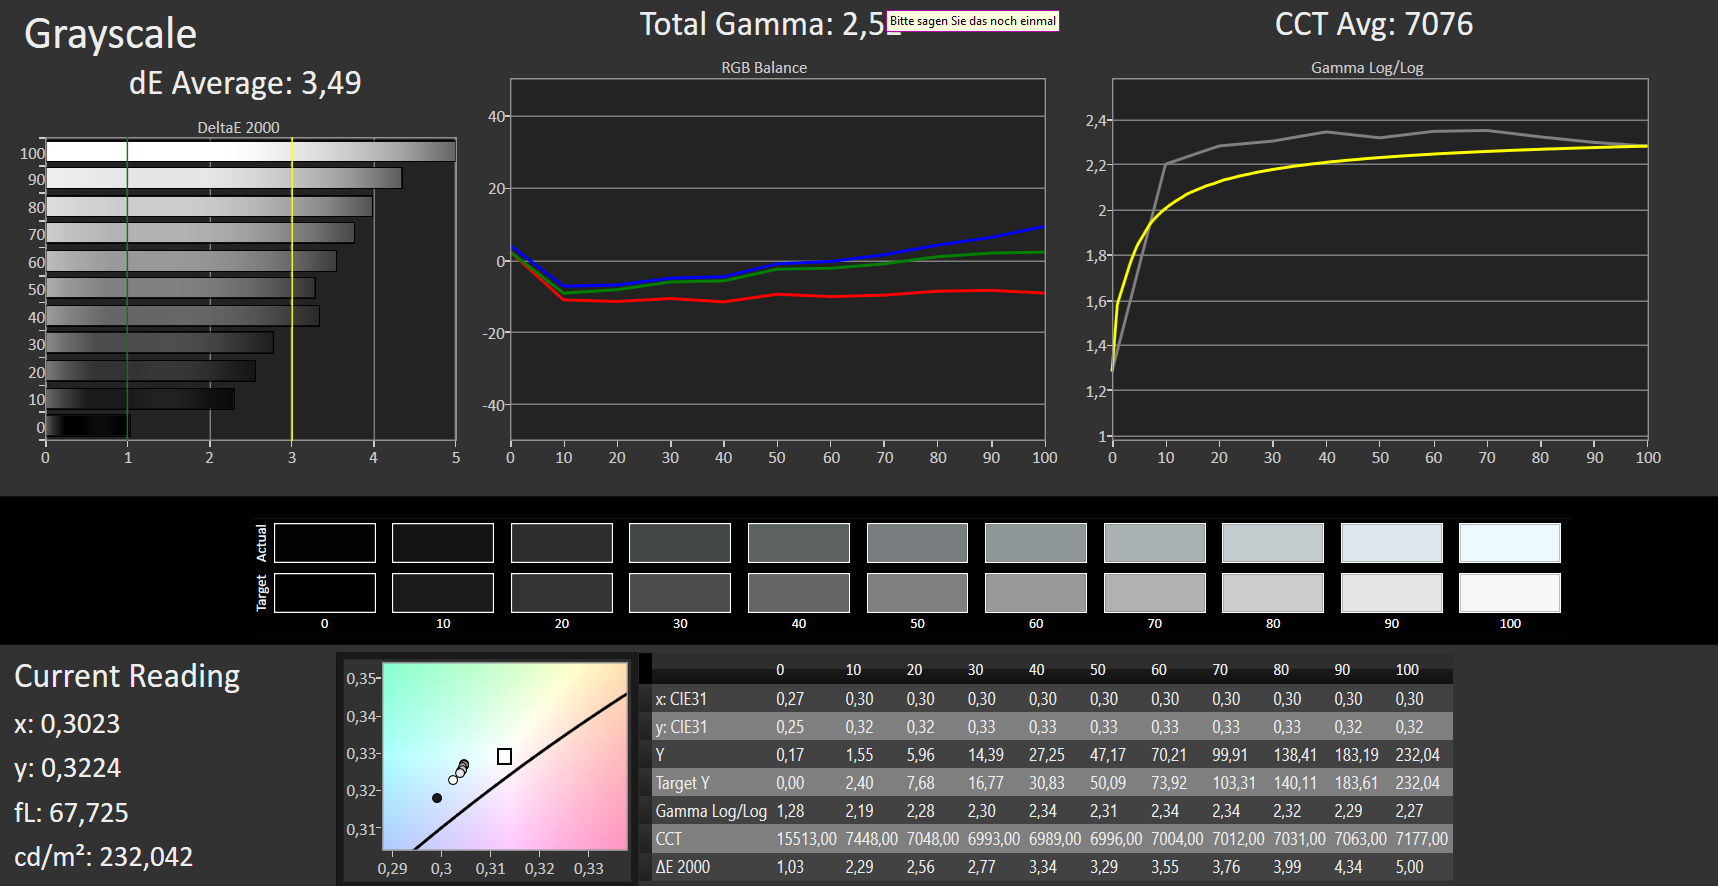
Lenovo, inceleme ünitemizi 500 cd / m²'ye kadar ulaşabileceğini iddia ettiği 15,6 inç IPS paneliyle donatıyor. 144 Hz panel, NVIDIA G-Sync, Dolby Vision ve HDR400 sertifikalıdır. Lenovo yalnızca 1080p seçenekleri satıyor, bu nedenle UHD veya QHD'de oynamak istiyorsanız harici bir monitöre ihtiyacınız olacak. Lenovo'nun iddialarının gerisinde kalıyor. Ekranın en parlak noktası yalnızca 477 cd / m²'ye çarpıyor, bu nedenle reklamı yapılan 500 cd / m²'lik eşiğe ulaşamıyor gibi görünüyor. Bununla birlikte, daha yakından incelendiğinde Lenovo, yalnızca ekranın 500 cd / m²'ye kadar erişebileceğini iddia ediyor, ancak bunun reklamı 500 cd / m²'lik bir panel değil. Ne olursa olsun, panel HDR400 sertifikasyonuna ulaşma seviyesini aşıyor ve karşılaştırma cihazlarımızdaki tüm ekranlardan daha parlak. IPS panel, aynı derecede etkileyici bir kontrast oranı veren nispeten düşük bir siyah seviyesine sahip. Diğer geleneksel IPS panelleri bu konuda rekabet edemez, ancak inceleme birimimizdeki panelin nispeten yavaş tepki süreleri vardır. Ancak oyun testlerimizde herhangi bir çizgi belirlemedik. Ekran, parlaklığını ayarlamak için nabız genişliği modülasyonunu (PWM) indükleyen baş ağrısına ve göz yorgunluğuna dayanmaz ve sadece küçük arka ışık kanamalarından muzdariptir.
| |||||||||||||||||||||||||
Aydınlatma: 84 %
Batarya modunda parlaklık: 477 cd/m²
Kontrast: 2726:1 (Siyah: 0.175 cd/m²)
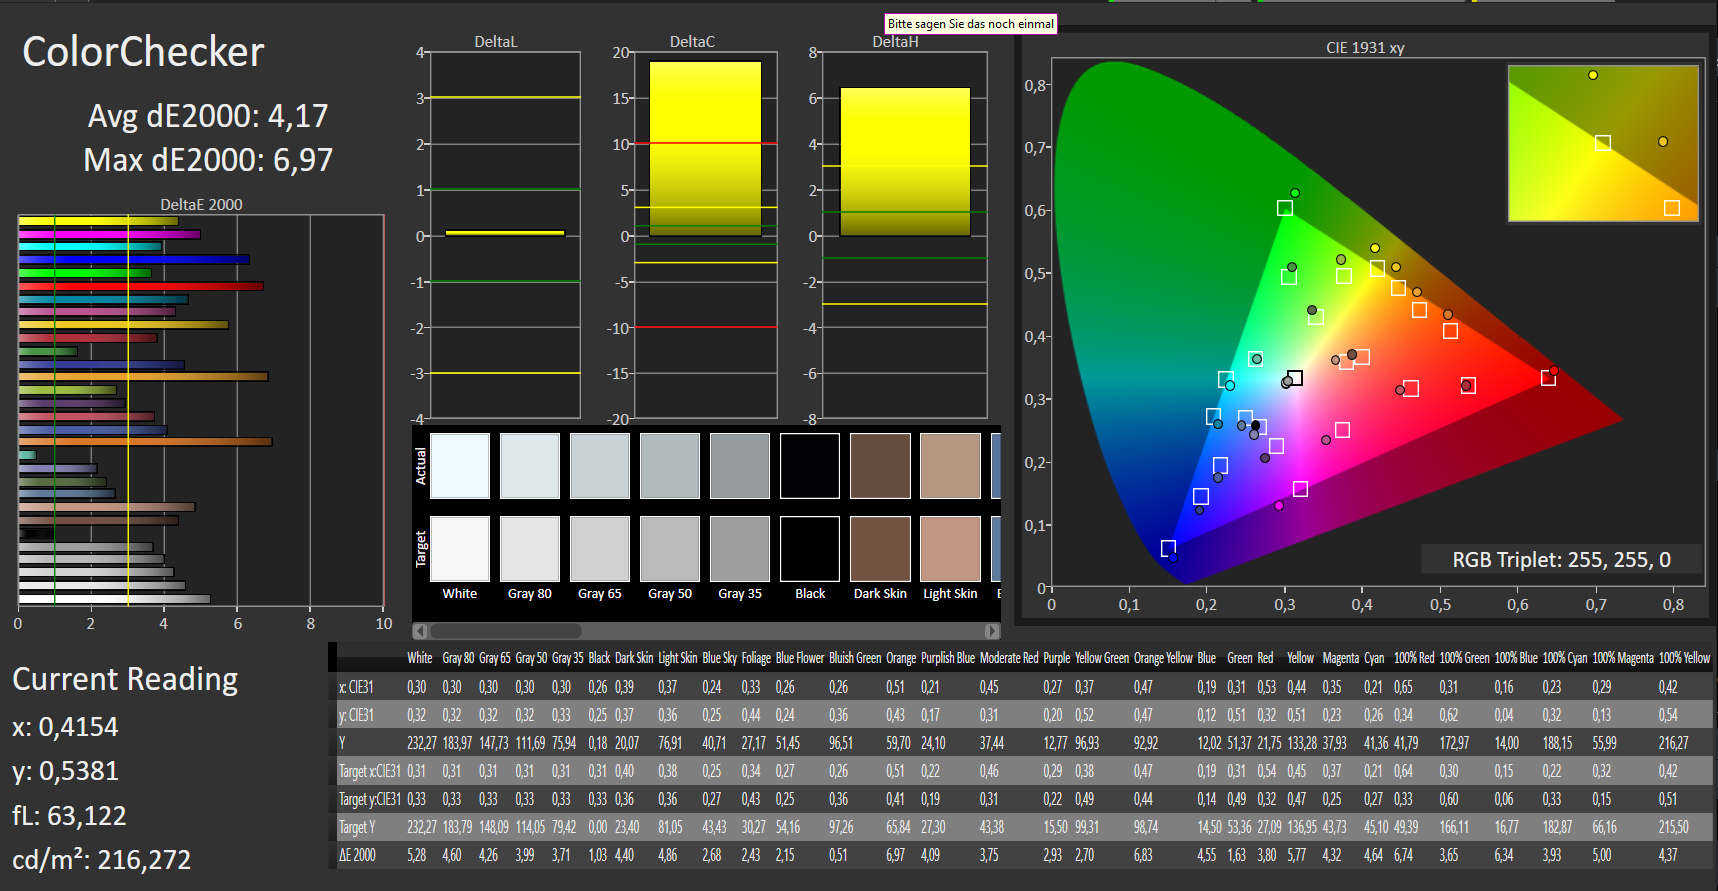
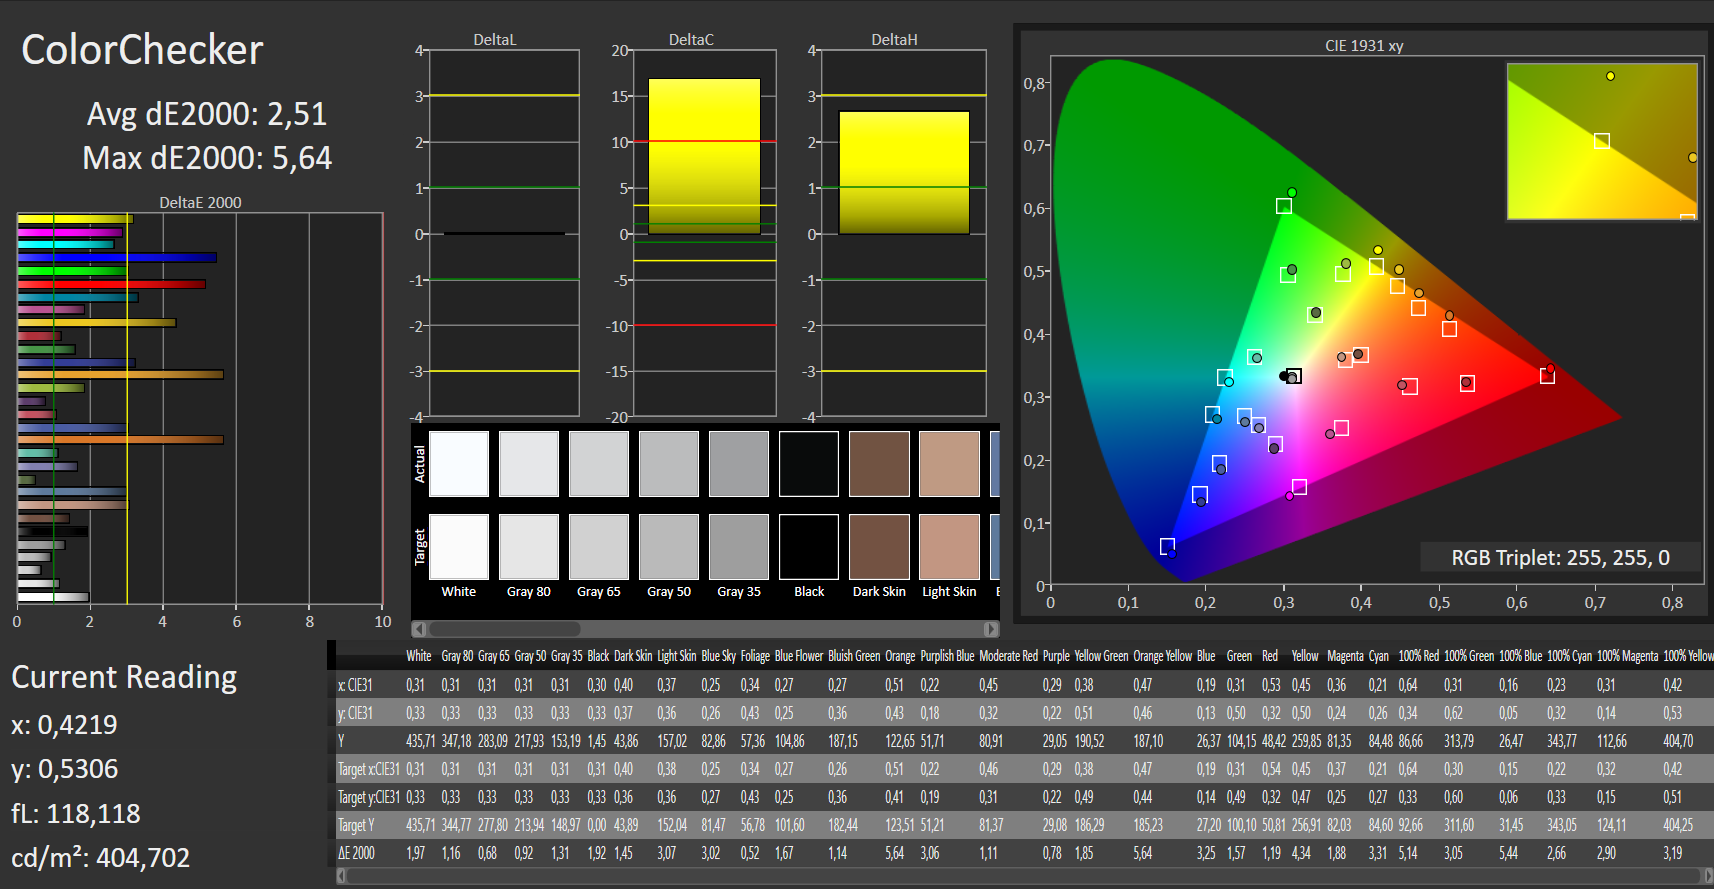
ΔE ColorChecker Calman: 4.17 | ∀{0.5-29.43 Ø4.73}
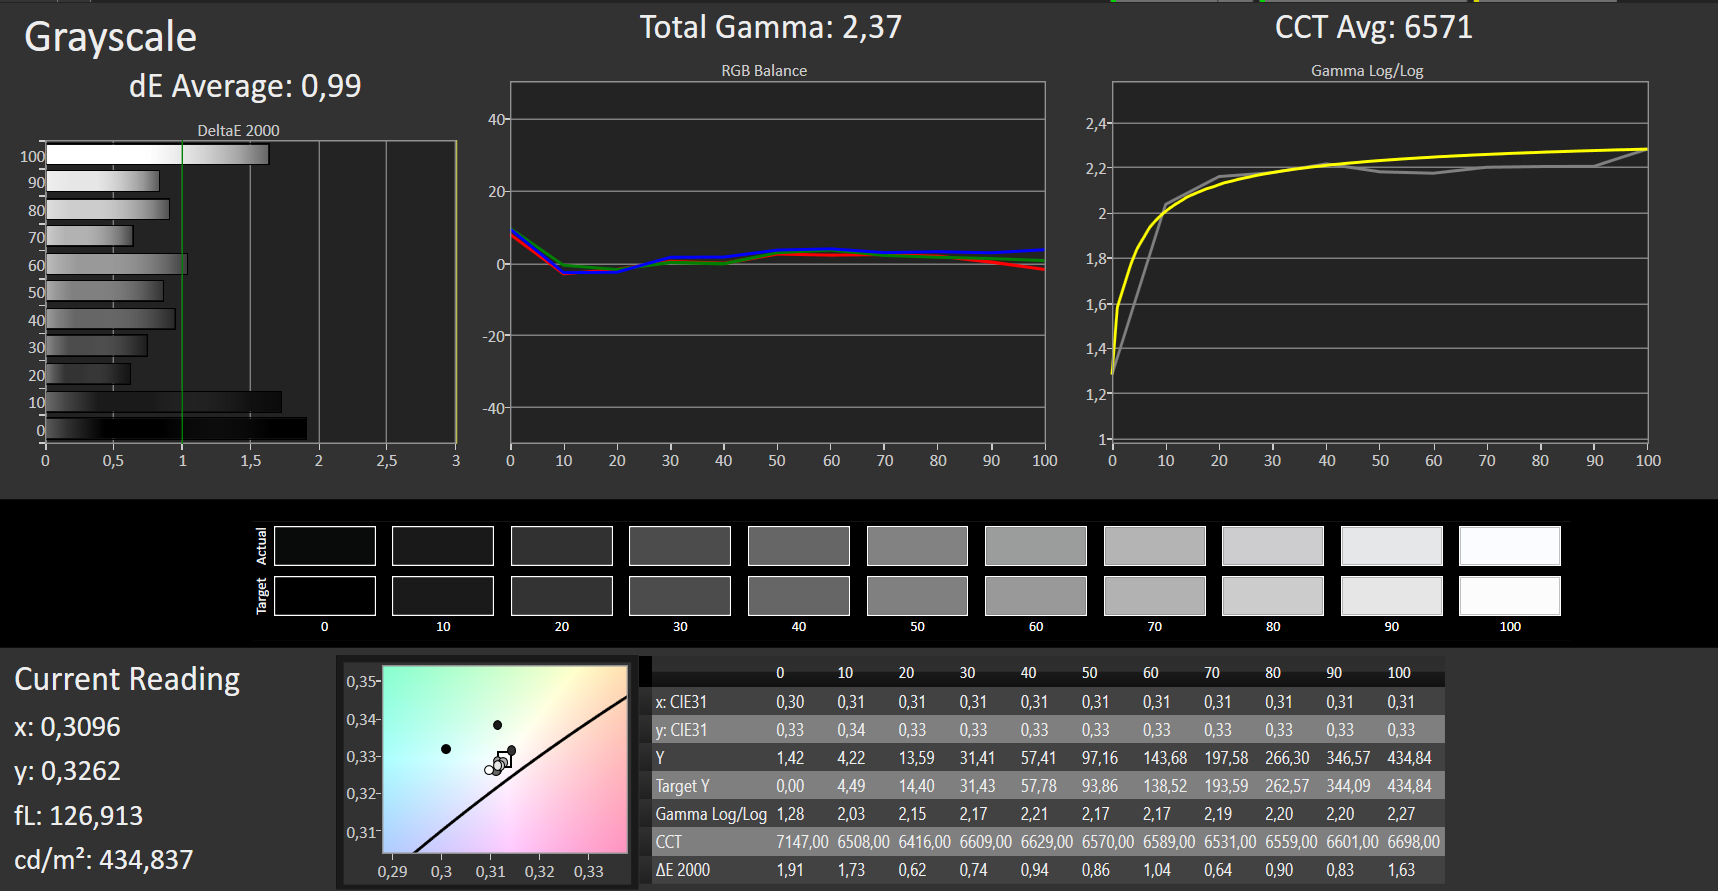
calibrated: 2.51
ΔE Greyscale Calman: 3.49 | ∀{0.09-98 Ø4.97}
91% sRGB (Argyll 1.6.3 3D)
60% AdobeRGB 1998 (Argyll 1.6.3 3D)
67.1% AdobeRGB 1998 (Argyll 3D)
91.6% sRGB (Argyll 3D)
67.7% Display P3 (Argyll 3D)
Gamma: 2.5
CCT: 7076 K
| Lenovo Legion Y740-15ICHg BOE NV156FHM-N4J, IPS, 1920x1080, 15.6" | Lenovo Legion Y740-15ICHg LP156WFG-SPB2, IPS, 1920x1080, 15.6" | HP Omen X 2S 15-dg0075cl AU Optronics AUO82ED, IPS, 1920x1080, 15.6" | Acer Predator Triton 500 PT515-51-71PZ NV156FHM-N4K (BOE082A), IPS, 1920x1080, 15.6" | |
|---|---|---|---|---|
| Display | -3% | -0% | -2% | |
| Display P3 Coverage (%) | 67.7 | 63.5 -6% | 66.2 -2% | 64.6 -5% |
| sRGB Coverage (%) | 91.6 | 92.4 1% | 92.3 1% | 92.6 1% |
| AdobeRGB 1998 Coverage (%) | 67.1 | 64.7 -4% | 67.2 0% | 66 -2% |
| Response Times | -16% | 6% | 31% | |
| Response Time Grey 50% / Grey 80% * (ms) | 19 ? | 18.8 ? 1% | 15.2 ? 20% | 5.2 ? 73% |
| Response Time Black / White * (ms) | 10 ? | 13.2 ? -32% | 10.8 ? -8% | 11.2 ? -12% |
| PWM Frequency (Hz) | ||||
| Screen | -21% | -25% | -7% | |
| Brightness middle (cd/m²) | 477 | 320.4 -33% | 324.8 -32% | 288 -40% |
| Brightness (cd/m²) | 431 | 298 -31% | 316 -27% | 265 -39% |
| Brightness Distribution (%) | 84 | 85 1% | 84 0% | 84 0% |
| Black Level * (cd/m²) | 0.175 | 0.42 -140% | 0.26 -49% | 0.22 -26% |
| Contrast (:1) | 2726 | 763 -72% | 1249 -54% | 1309 -52% |
| Colorchecker dE 2000 * | 4.17 | 3.21 23% | 4.96 -19% | 3.22 23% |
| Colorchecker dE 2000 max. * | 6.97 | 5.54 21% | 8.95 -28% | 6.26 10% |
| Colorchecker dE 2000 calibrated * | 2.51 | 2.36 6% | 3.23 -29% | 1.5 40% |
| Greyscale dE 2000 * | 3.49 | 3.6 -3% | 5 -43% | 3.43 2% |
| Gamma | 2.5 88% | 2.27 97% | 2.21 100% | 2.41 91% |
| CCT | 7076 92% | 6503 100% | 7742 84% | 7290 89% |
| Color Space (Percent of AdobeRGB 1998) (%) | 60 | 59 -2% | 59.8 0% | 60 0% |
| Color Space (Percent of sRGB) (%) | 91 | 92 1% | 91.8 1% | 93 2% |
| Toplam Ortalama (Program / Ayarlar) | -13% /
-17% | -6% /
-17% | 7% /
-2% |
* ... daha küçük daha iyidir
Yanıt Sürelerini Görüntüle
| ↔ Tepki Süresi Siyahtan Beyaza | ||
|---|---|---|
| 10 ms ... yükseliş ↗ ve sonbahar↘ birleşimi | ↗ 6 ms yükseliş | 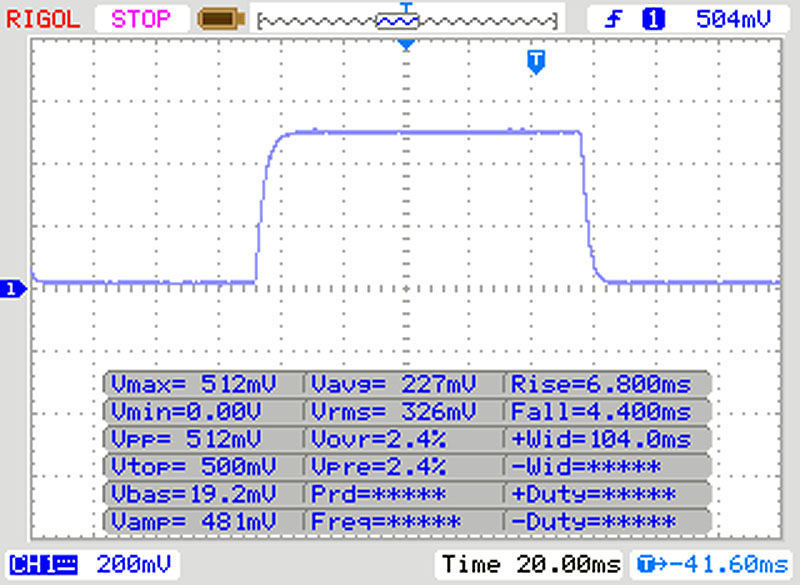 |
| ↘ 4 ms sonbahar | ||
| Ekran, testlerimizde iyi yanıt oranları gösteriyor ancak rekabetçi oyuncular için çok yavaş olabilir. Karşılaştırıldığında, test edilen tüm cihazlar 0.1 (minimum) ile 240 (maksimum) ms arasında değişir. » Tüm cihazların 27 %'si daha iyi. Bu, ölçülen yanıt süresinin test edilen tüm cihazların ortalamasından (19.9 ms) daha iyi olduğu anlamına gelir. | ||
| ↔ Tepki Süresi %50 Griden %80 Griye | ||
| 19 ms ... yükseliş ↗ ve sonbahar↘ birleşimi | ↗ 9 ms yükseliş | 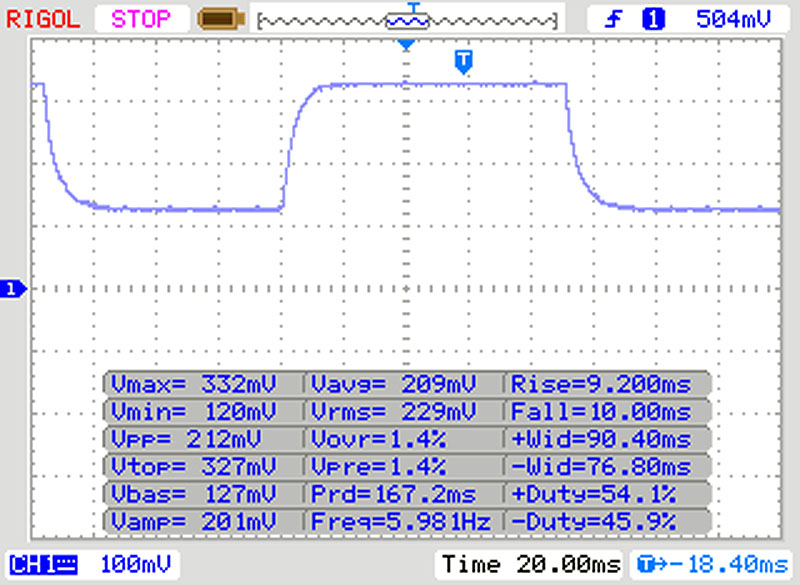 |
| ↘ 10 ms sonbahar | ||
| Ekran, testlerimizde iyi yanıt oranları gösteriyor ancak rekabetçi oyuncular için çok yavaş olabilir. Karşılaştırıldığında, test edilen tüm cihazlar 0.165 (minimum) ile 636 (maksimum) ms arasında değişir. » Tüm cihazların 32 %'si daha iyi. Bu, ölçülen yanıt süresinin test edilen tüm cihazların ortalamasından (31.1 ms) daha iyi olduğu anlamına gelir. | ||
Ekran Titremesi / PWM (Darbe Genişliği Modülasyonu)
| Ekran titriyor / PWM algılanmadı | 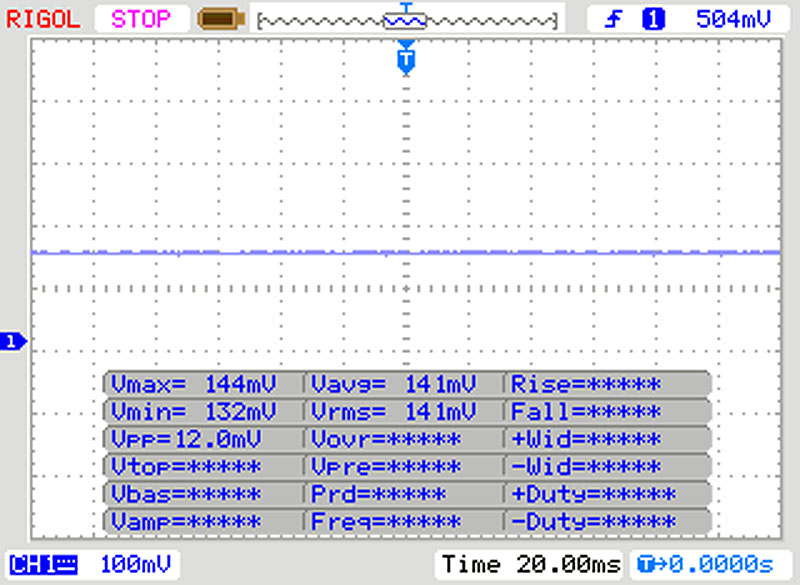 | ||
Karşılaştırıldığında: Test edilen tüm cihazların %52 %'si ekranı karartmak için PWM kullanmıyor. PWM tespit edilirse, ortalama 7794 (minimum: 5 - maksimum: 343500) Hz ölçüldü. | |||
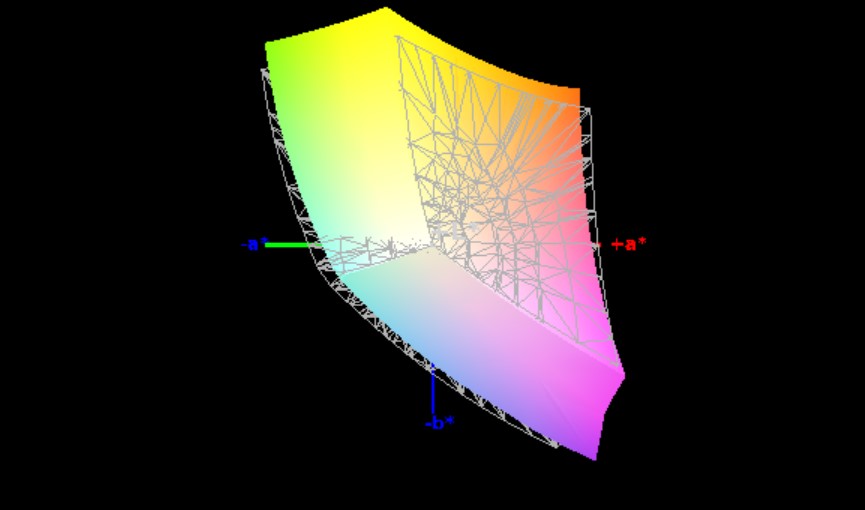
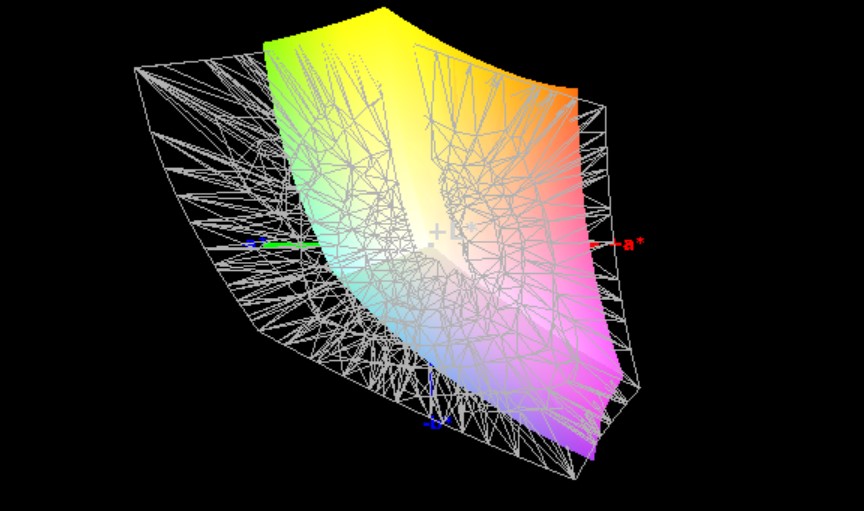
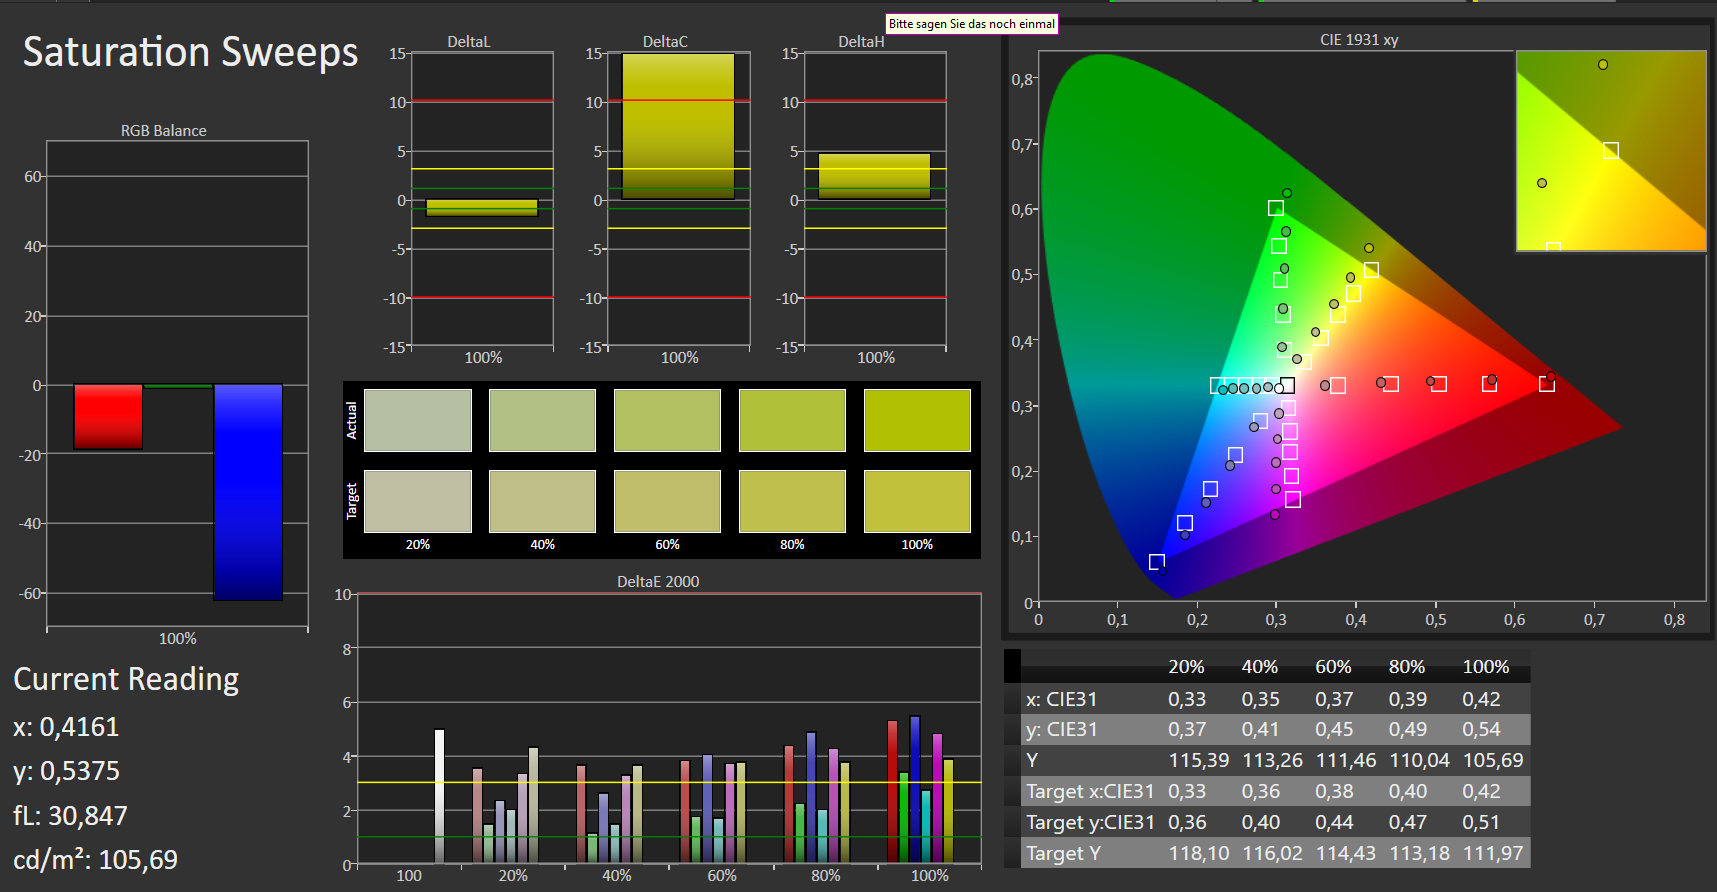
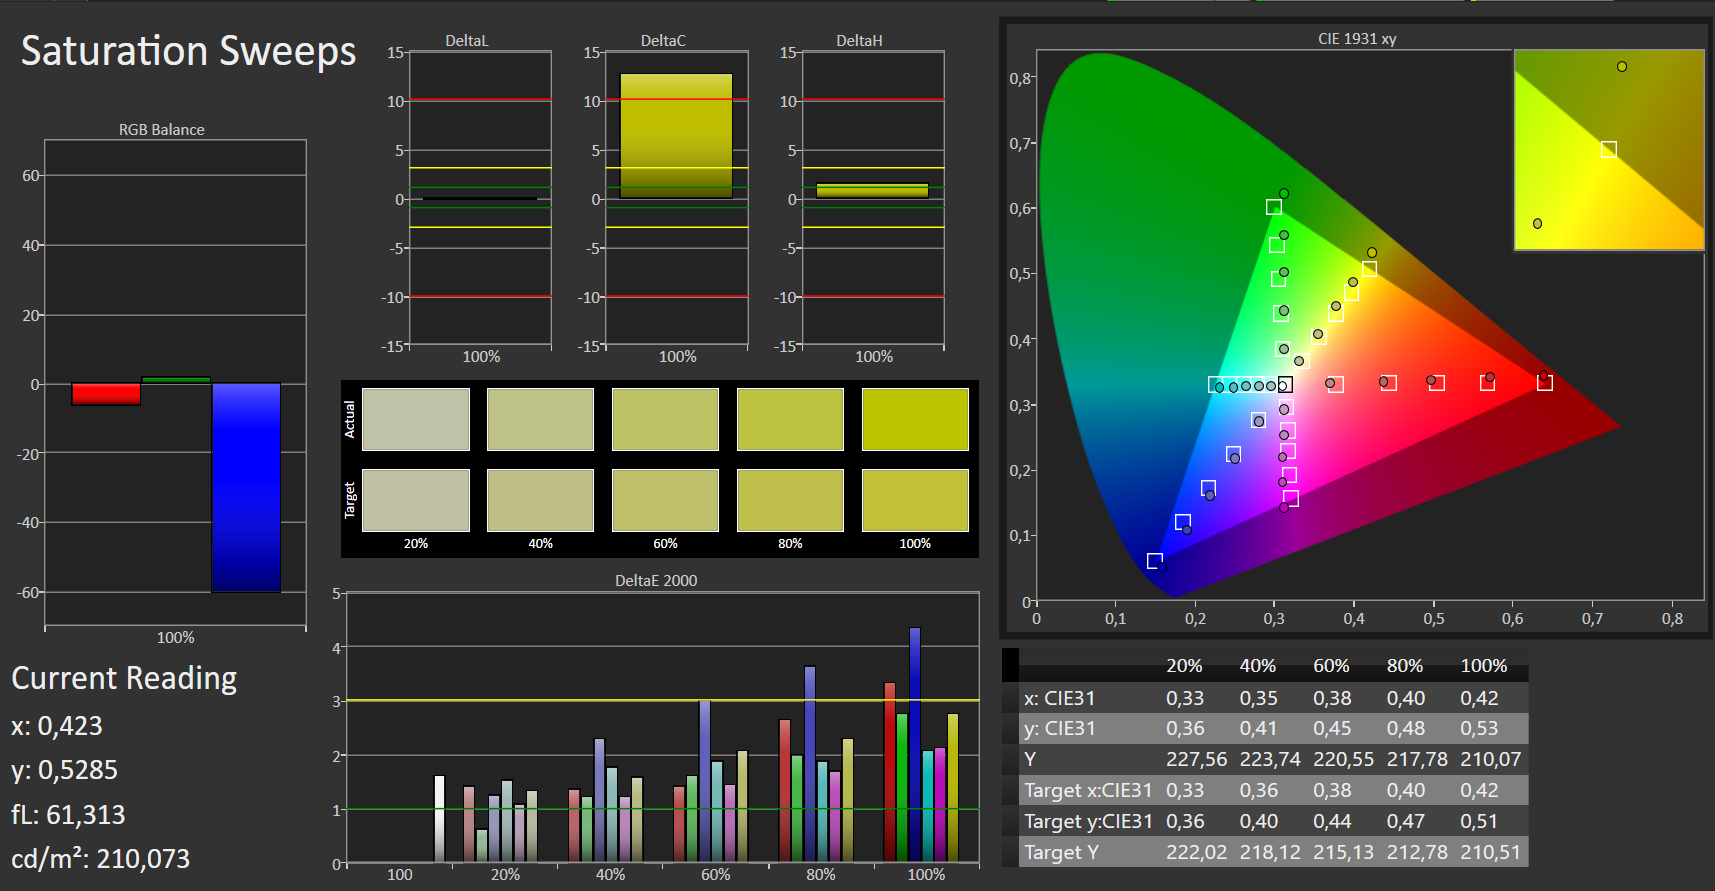
Ekran, yüksek kontrast oranı sayesinde renkleri zengin bir şekilde üretirken düşük siyah değeri siyahların yoğun görünmesini sağlar. Bazı siyah alanlar, ekranın arka ışık kanaması geçiren kısımlarında daha gri görünüyor. Ancak, yalnızca OLED panelleri, inceleme birimimizdeki ekrandan daha canlı renkler üretir. Lenovo, aynı zamanda ekranı kalibre etmek için mükemmel bir fabrika işi yapar. Fotoğraf spektrometremiz ve CalMAN analiz yazılımımız, panelin teslimat sırasında sRGB renk alanından biraz sapmadığını, ancak önceki Legion Y740 test cihazımız ve Predator Triton 500'ün burada biraz daha iyi performans gösterdiğini tespit etti. Ek kalibrasyon bu sapmaları azalttı, ancak ekranı etkileyen hafif mavi tonu ortadan kaldıramadık. Kalibre edilmiş ICC profilini, kullanmak istemeniz durumunda, karşılaştırma tablomuzun üzerindeki kutuya bağladık. İnceleme birimimiz, sRGB renk alanının% 91'ini ve hobist düzeyinde renk çalışması için yeterince doğru olan AdobeRGB'nin% 60'ını kapsıyor. Bu puanlar Y740'ı rakipleriyle aynı seviyeye çıkarsa da, profesyonel fotoğraf ve video düzenleme gibi renk açısından kritik çalışmalar için yeterince yüksek değiller.
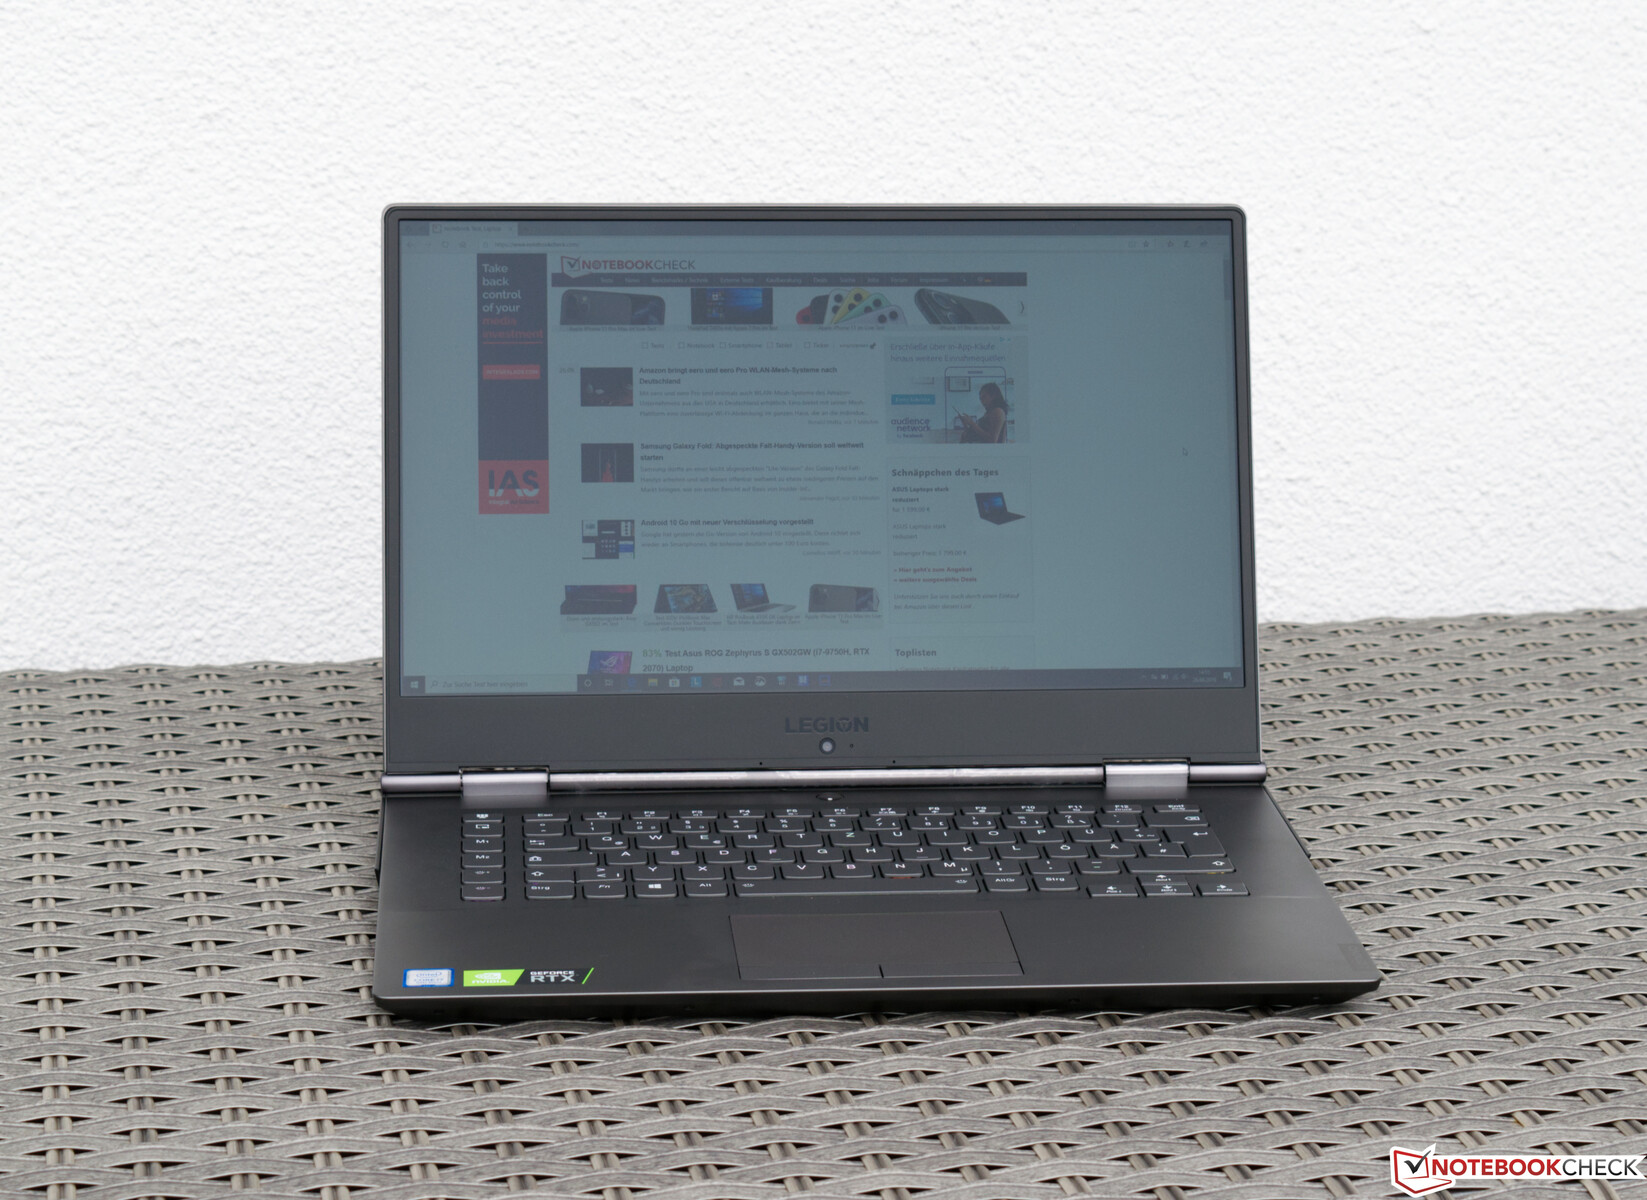
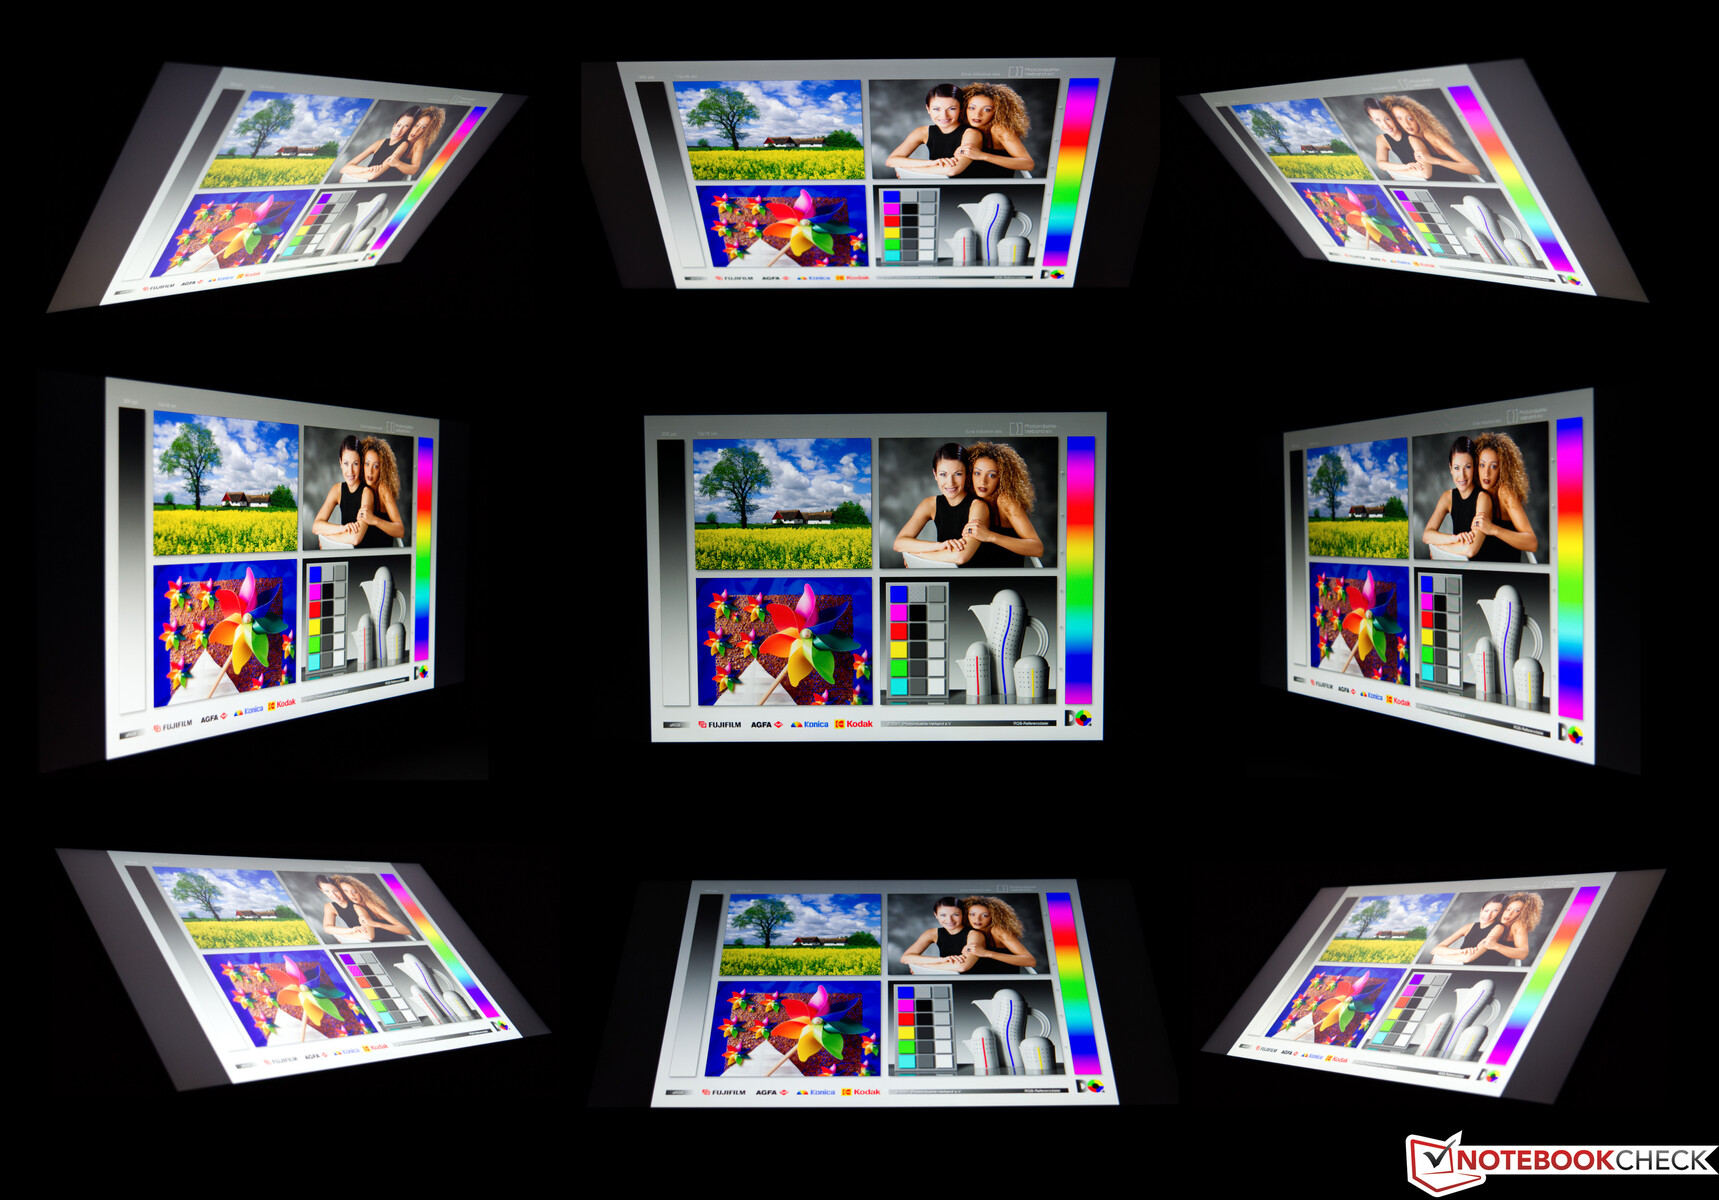
Y740, güneşli bir günde bile dış mekanda kullanım için yeterince parlak olurken, mat yüzeyi yansımaları hoş bir şekilde dağıtır. IPS panelinde de sabit görüş açıları var, ancak ekranın köşelerinde bazı şeyleri hafifçe bozan bazı gri tehlikeler olduğunu fark ettik. Bununla birlikte, bu günlük kullanımda okunabilirliği etkilememelidir.
Performans - Hızlı, ancak yeterince hızlı değil
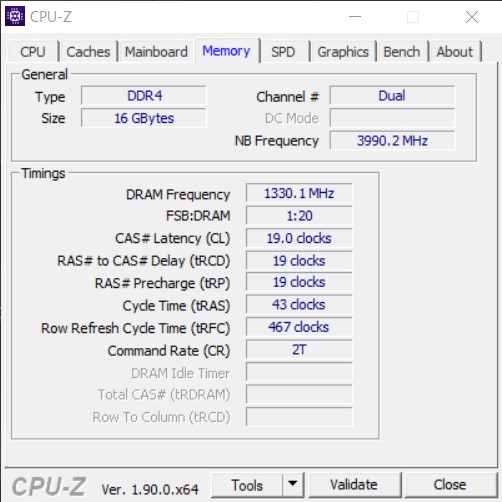
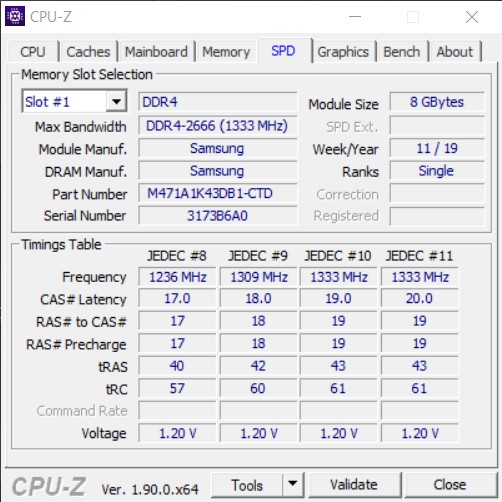
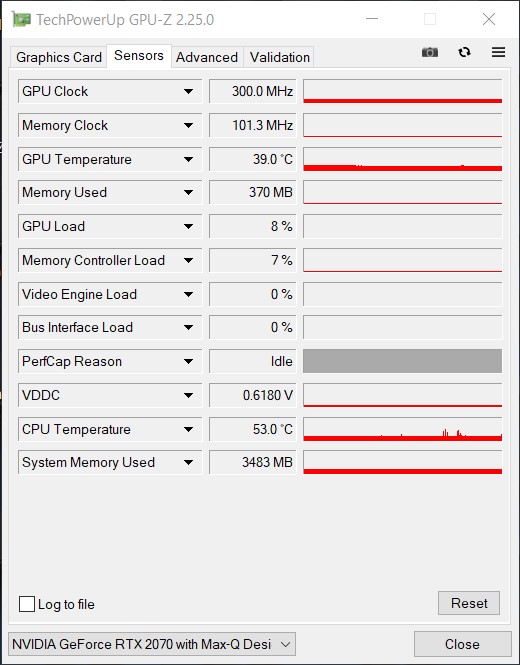
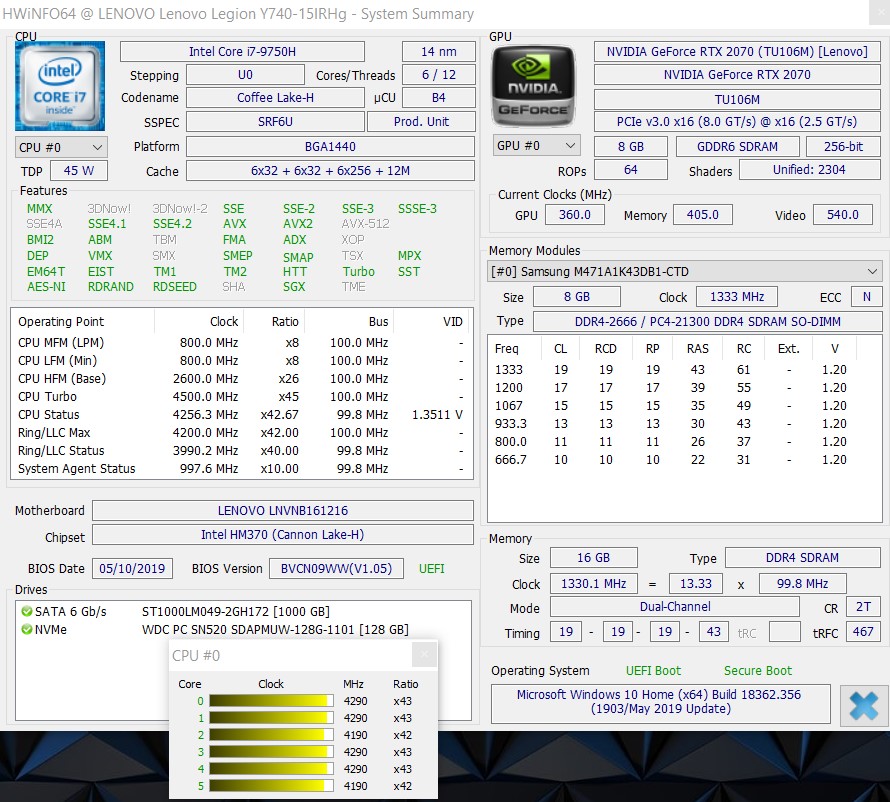
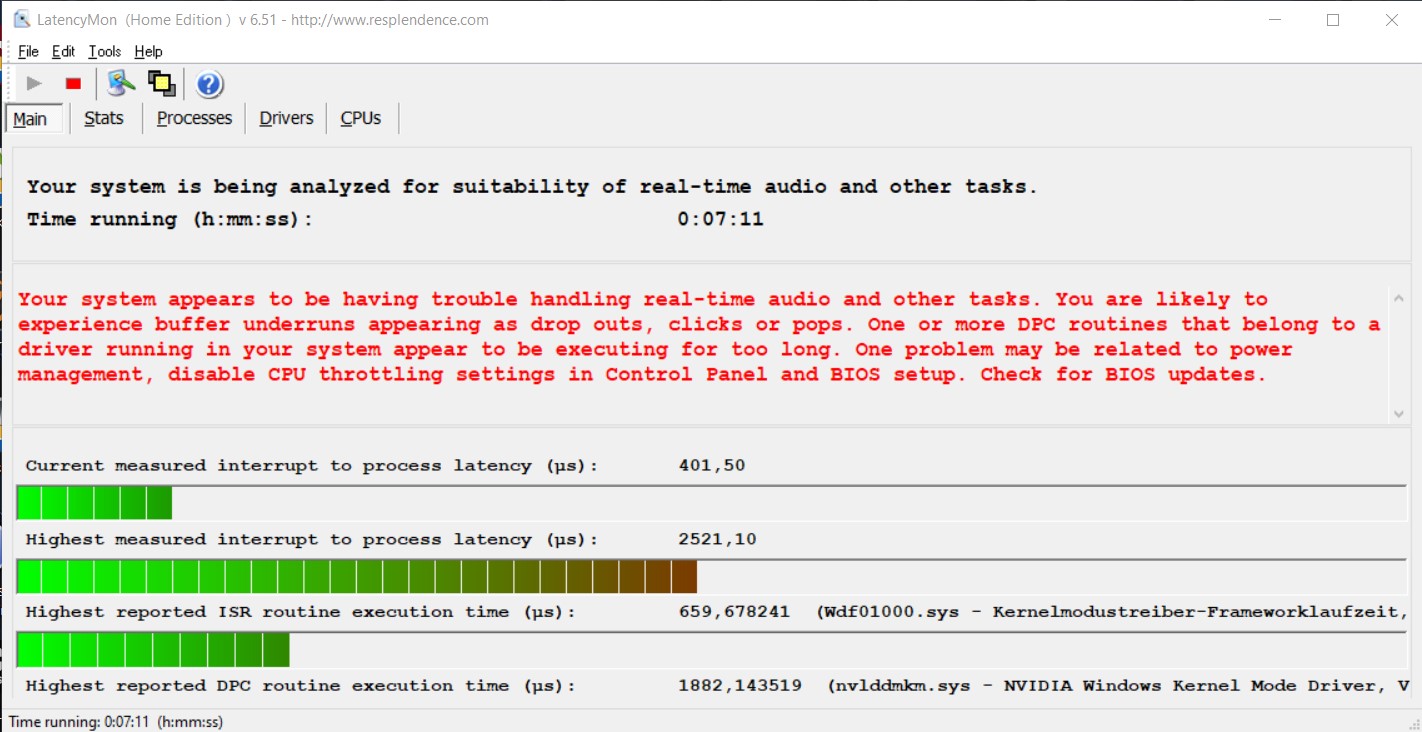
İnceleme birimimiz selefinden teorik olarak daha hızlı bir CPU ile gelebilir, ancak bu tüm senaryolarda mutlaka doğru değildir. Lenovo, Y740'ı aynı miktarda RAM ve depolama ile birlikte bir GeForce RTX 2070 Max-Q ile donatmaya devam ediyor. 16 GB'lık çift kanallı DDR4 RAM, çoğu bellek yoğun uygulama için de yeterli olmalıdır. Ayrıca, LatencyMon'un önceki inceleme birimimizle öncekinden çok daha yüksek DPC gecikmeleri bildirdiğini de belirtmeliyiz. Ancak testlerimiz sırasında hiçbir sorun fark etmedik ve umarım gelecekteki sürücü güncellemeleri bu konuyu ele almalıdır.
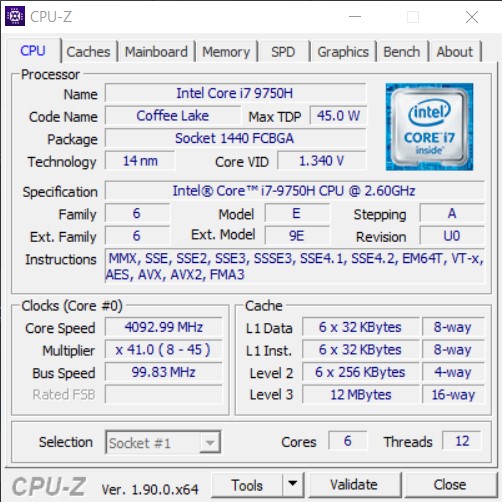
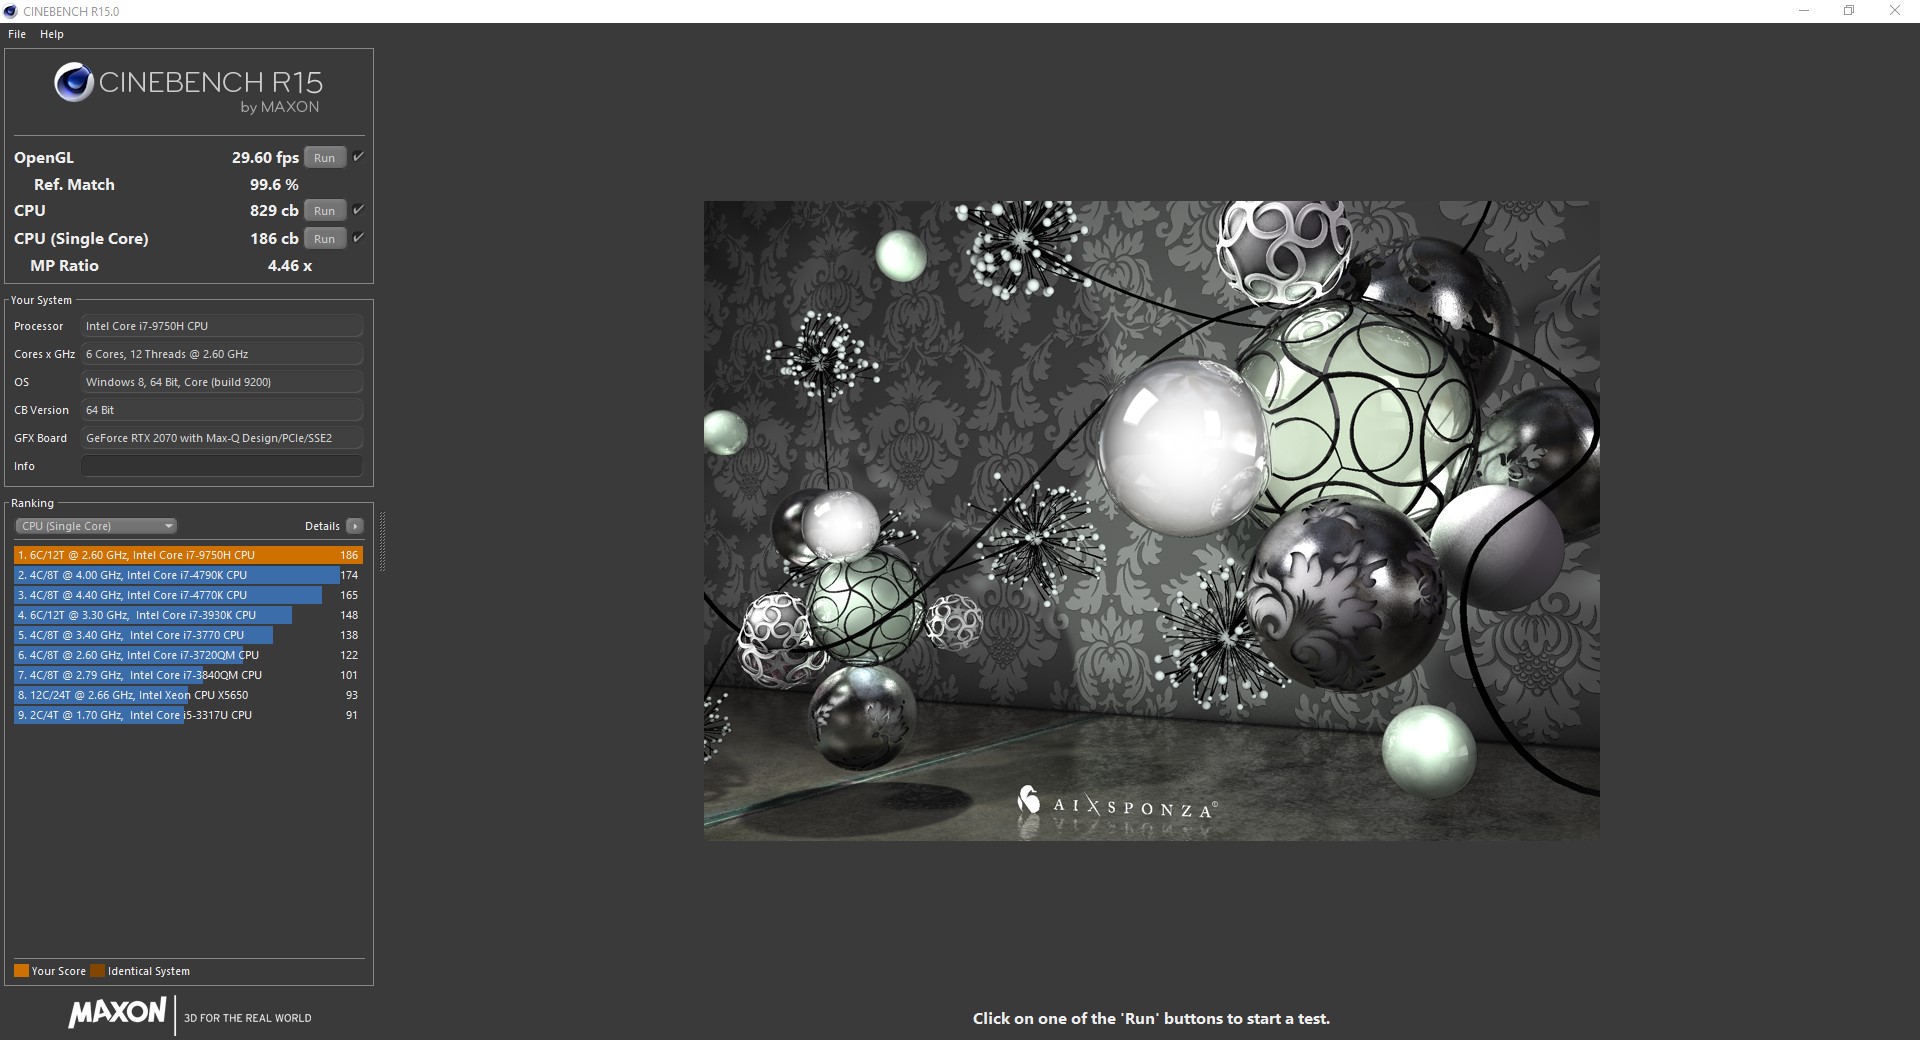
İşlemci
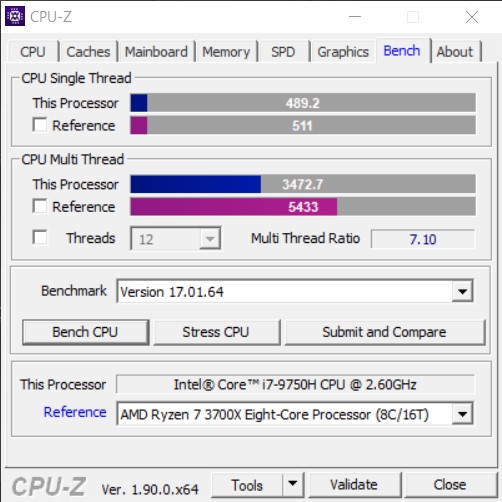
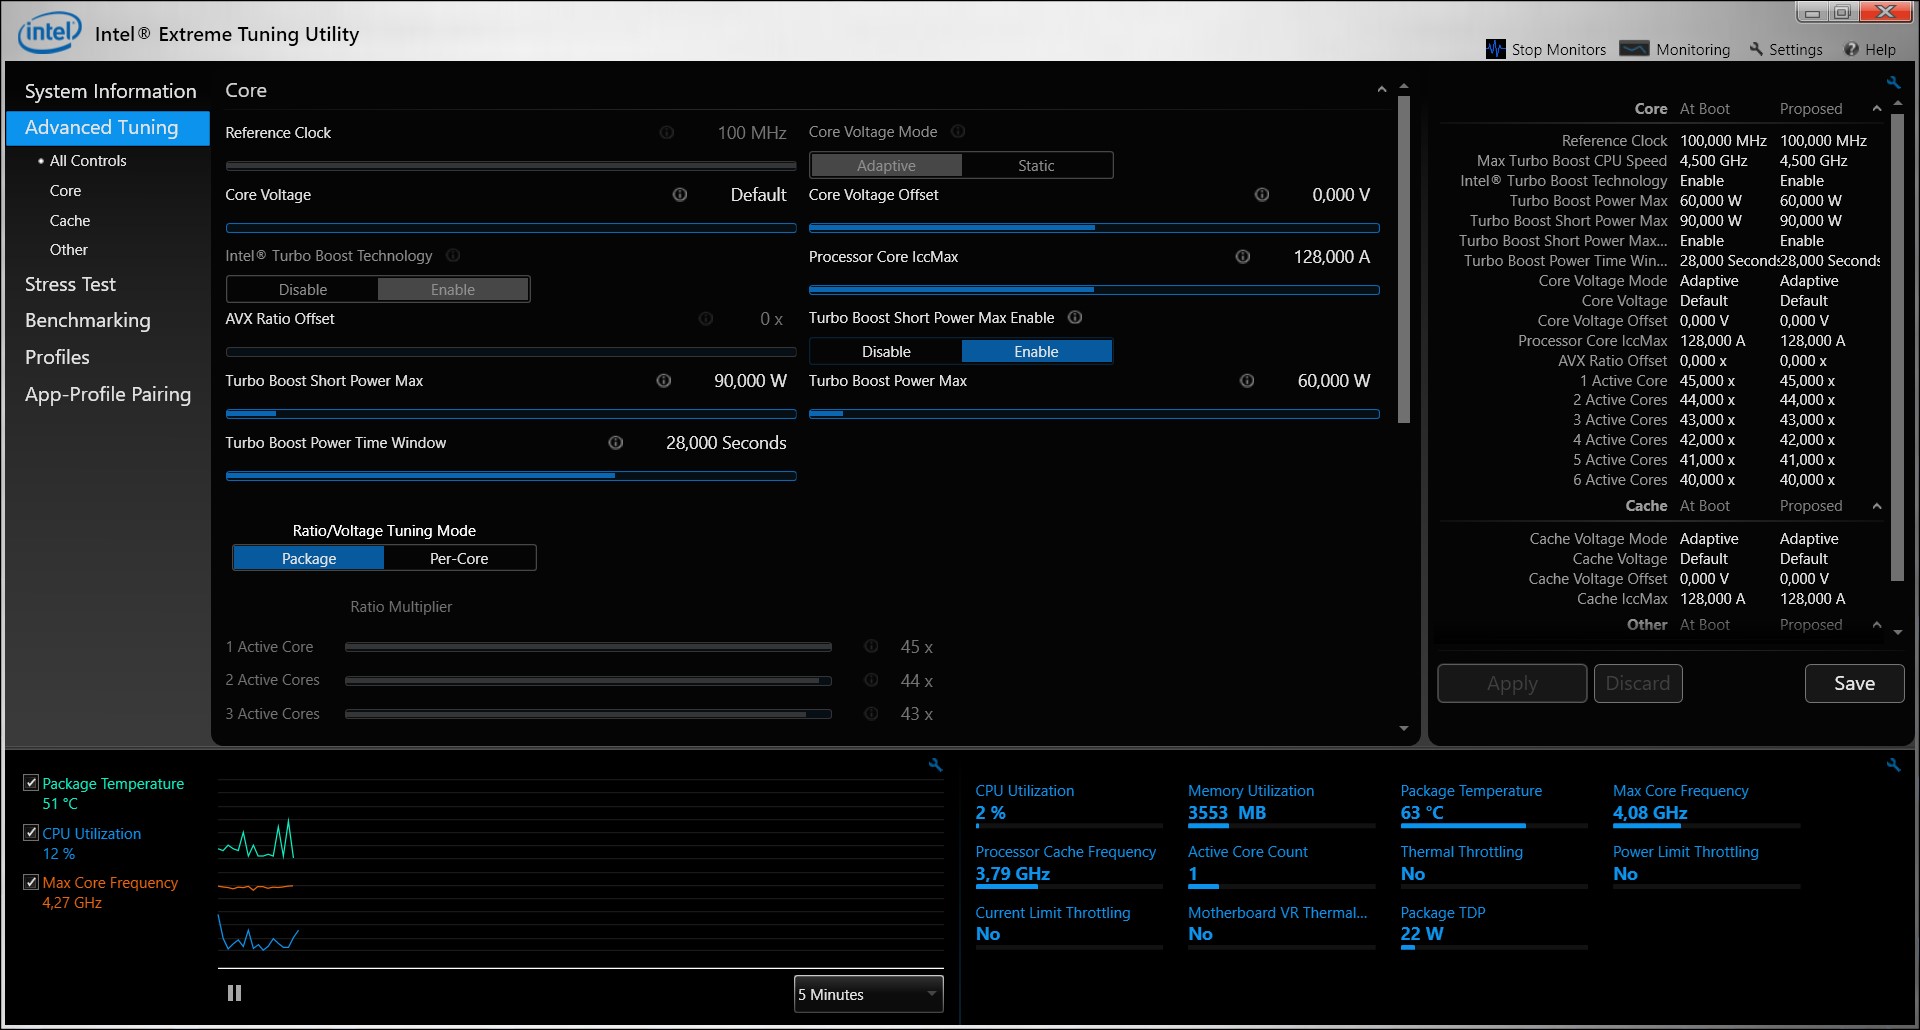
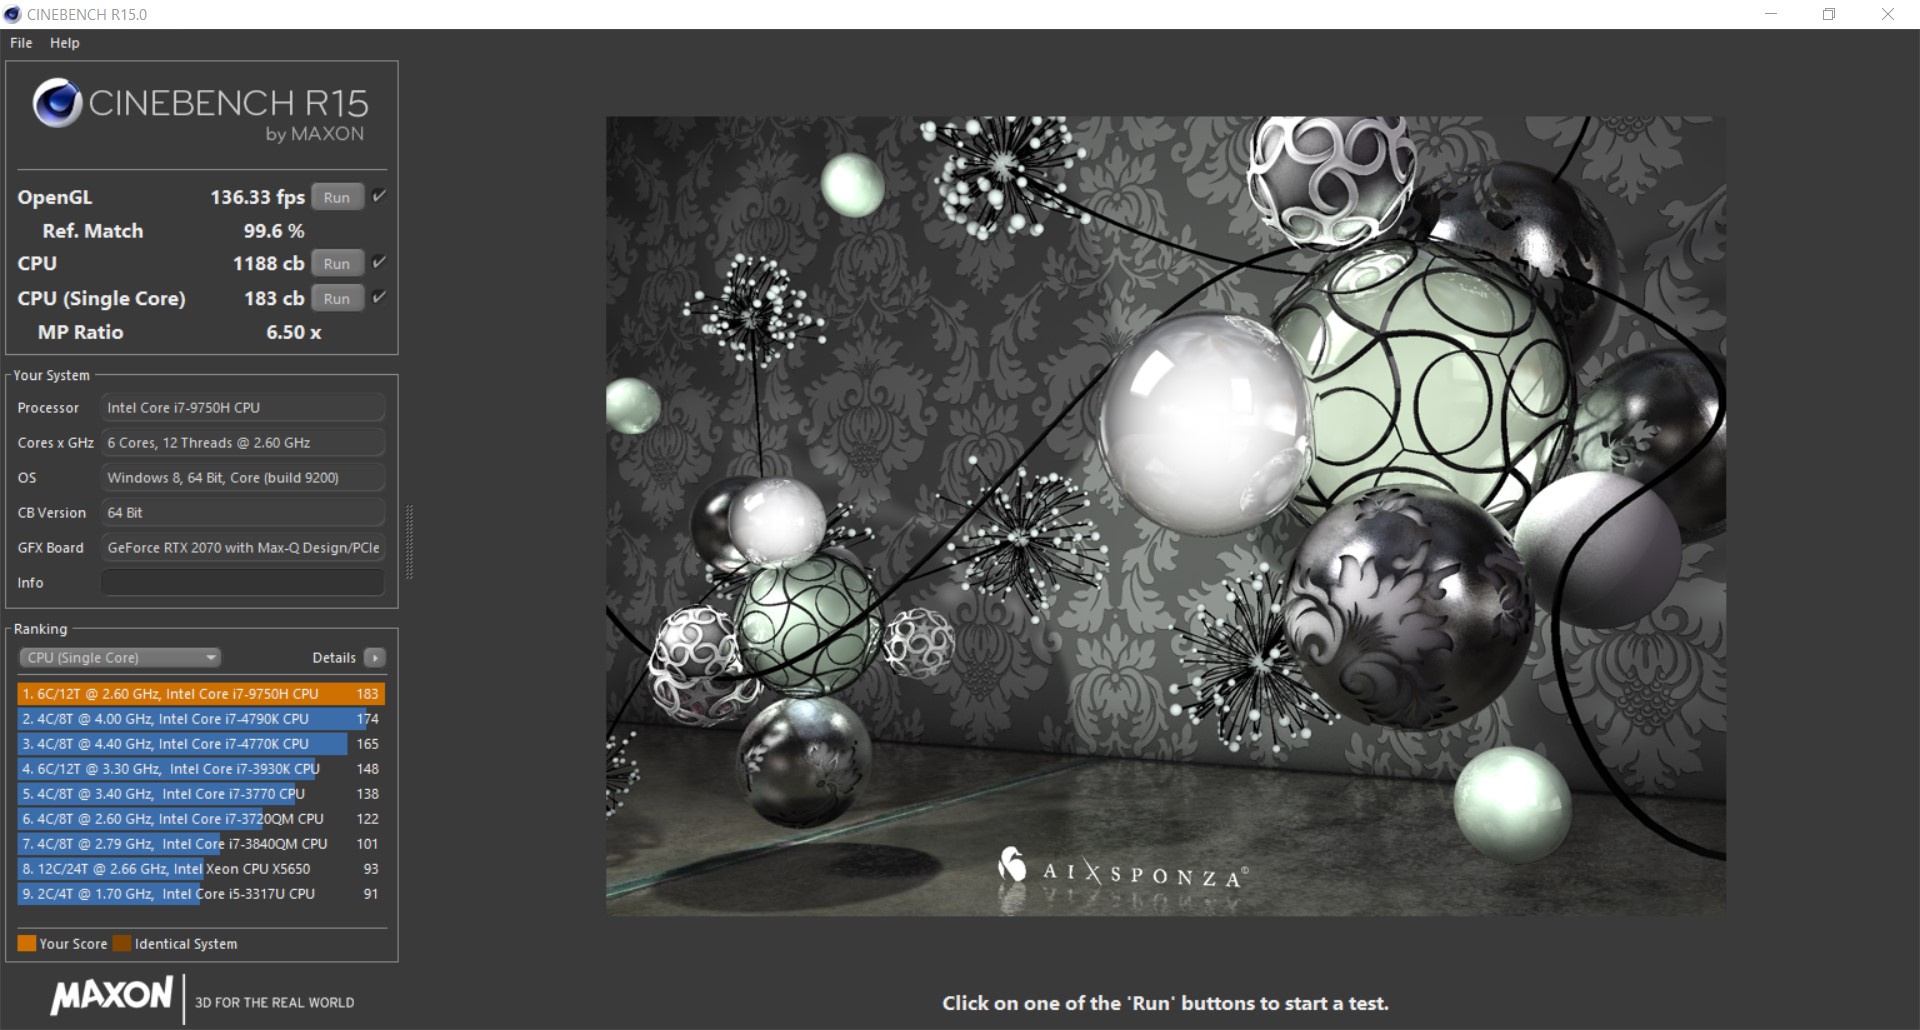
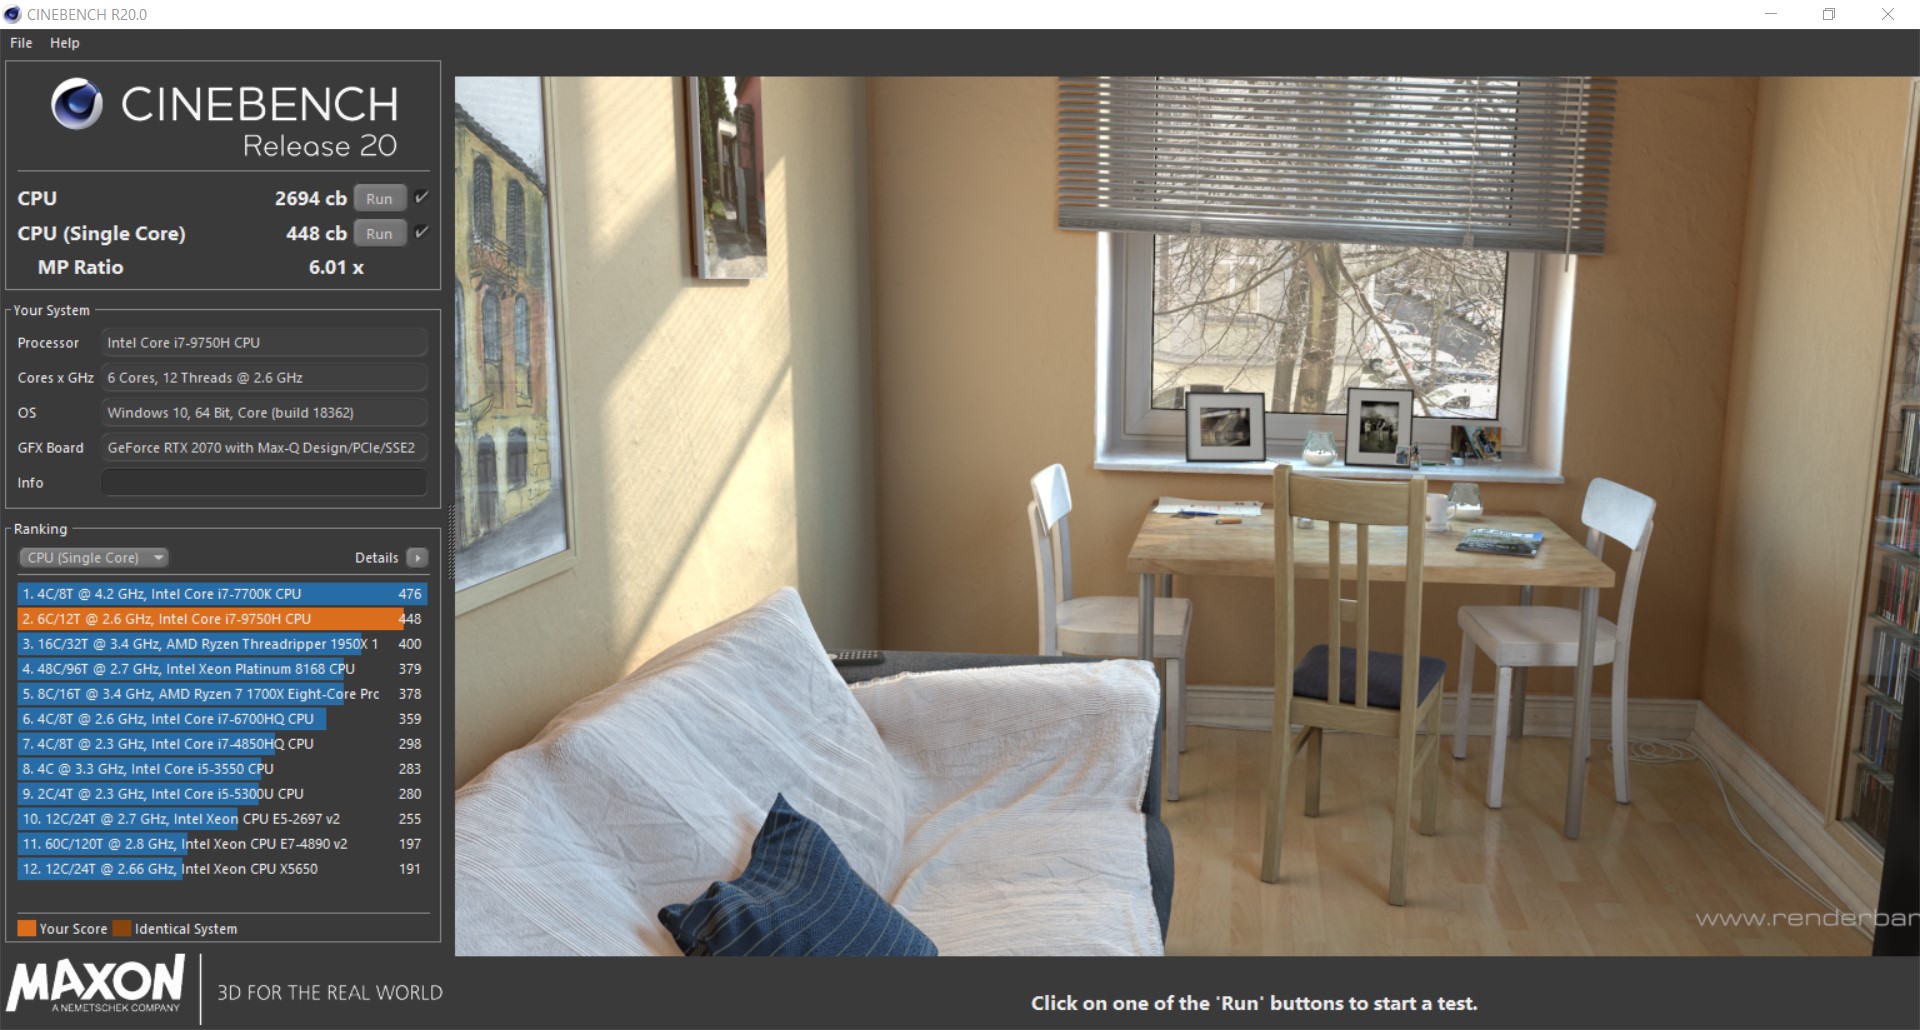
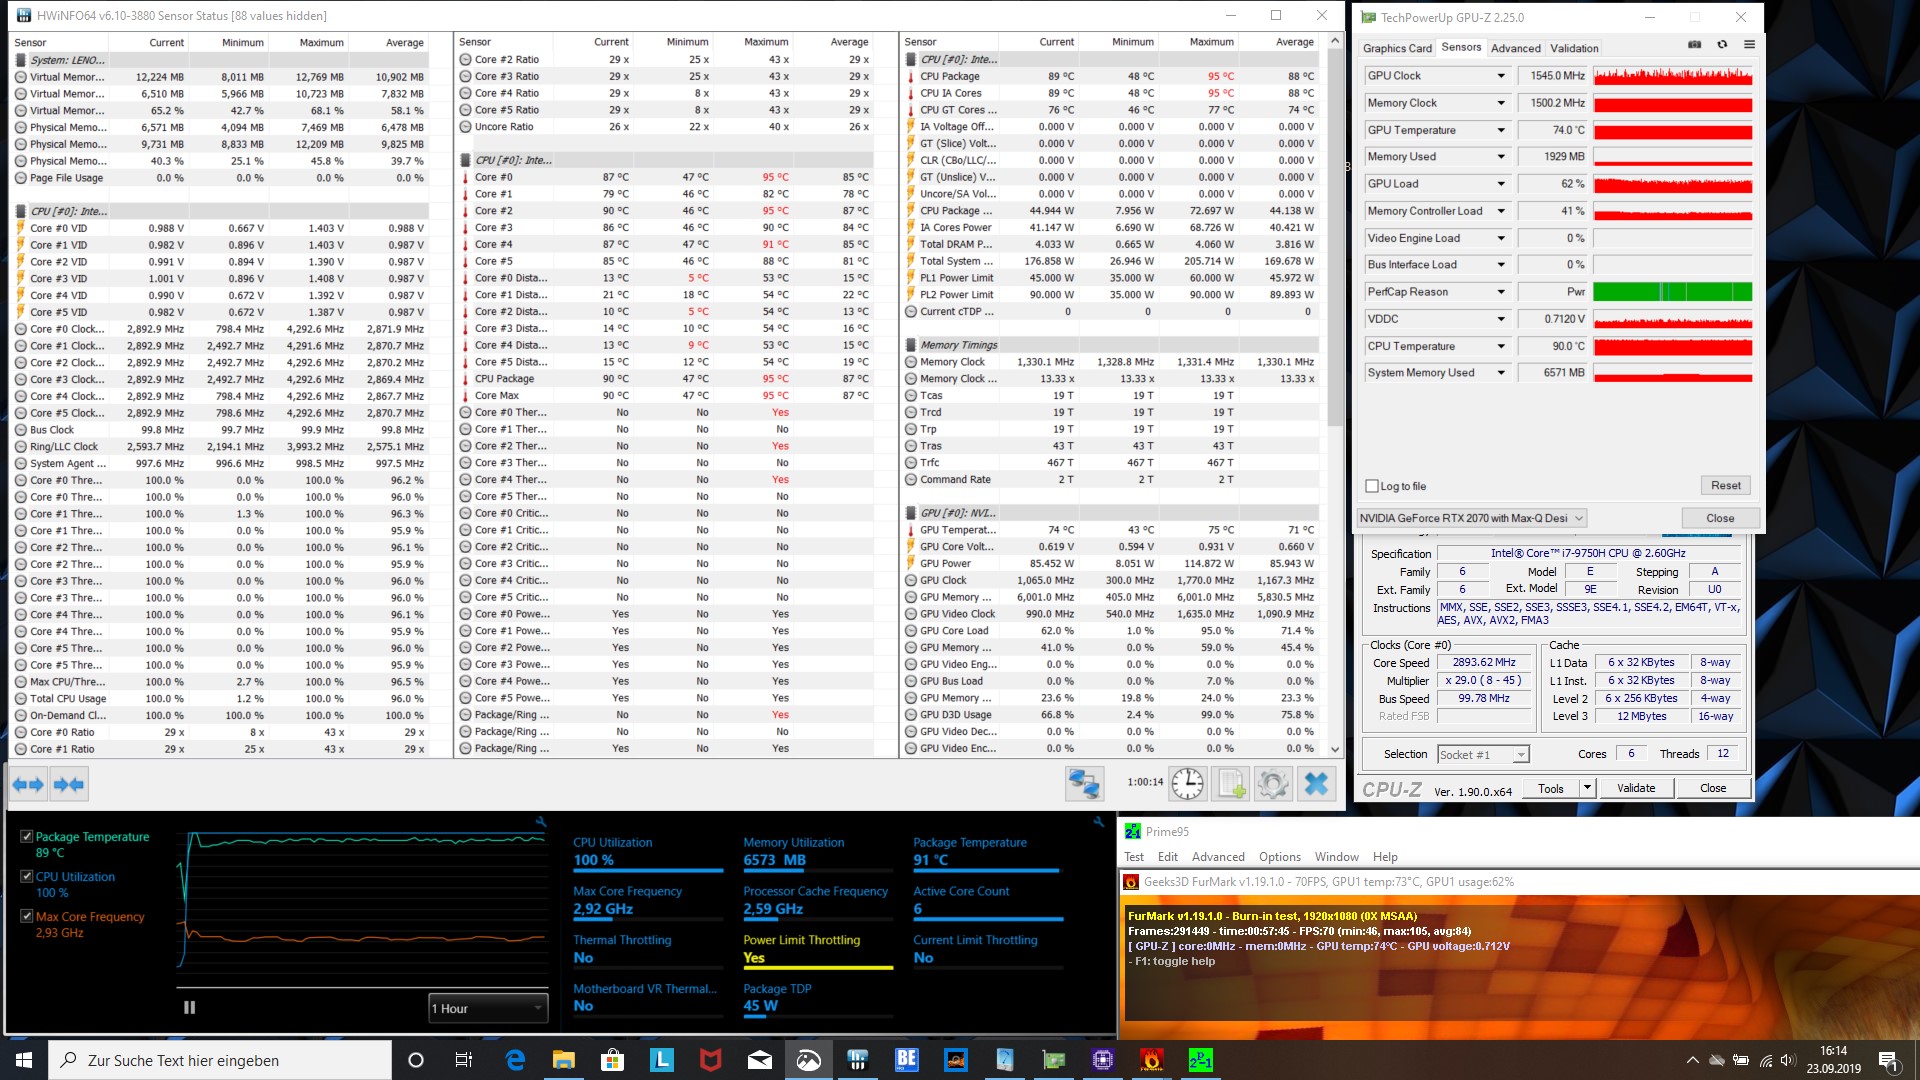
Core i7-9750H, Core i7-8750H modelini başardı; birincisi, daha yüksek bir temel sunuyor ve saat hızını ikincisine göre artırıyor. Core i7-9750H, iki çekirdekte yalnızca 4,5 GHz'e ulaşabilmesine rağmen, 2,6 GHz ve 4,5 GHz arasında saatler alıyor. Zirve artırma saati tüm çekirdeklerde 4.0 GHz'e düşüyor, bu da Core i7-8750H'nin eşdeğerinden 100 MHz daha yüksek. Buna karşılık, inceleme birimimiz, öncekilere göre genellikle tek çekirdekli sentetik referanslarda% 6 daha fazla puan alıyor. Şaşırtıcı bir şekilde, bunun tersi, Core i7-9750H'nin Core i7-9750H'nin% 4'ünün altına düştüğü çok çekirdekli karşılaştırmalardaki durumdur. İnceleme birimimiz sınıf ortalamasının üzerinde bir performans sergiliyor, ancak ısıl limitlerini Core i7-8750H ile çalışan bir öncekinden daha hızlı yapıyor. Lütfen Core i7-9750H ve diğer işlemcilerle nasıl karşılaştırılacağı hakkında daha fazla bilgi için CPU karşılaştırma sayfamıza bakın.
Ayrıca gözden geçirme ünitemizin sürekli yük altında ne kadar iyi performans gösterdiğini belirlemek için Cinebench R15 Multi 64Bit benchmark testini bir döngü içinde yaptık. Şaşırtıcı olmayan bir şekilde, Y740 selefinin performansının altına düştü, ancak Core i7-9750H ile çalışan rakiplerimizin çok üstünde kaldı.
| 3DMark 11 - 1280x720 Performance Physics | |
| HP Omen X 2S 15-dg0075cl | |
| Lenovo Legion Y740-15ICHg | |
| Acer Predator Triton 500 PT515-51-71PZ | |
| Ortalama Intel Core i7-9750H (9704 - 14337, n=80) | |
| Lenovo Legion Y740-15ICHg | |
| Blender - v2.79 BMW27 CPU | |
| Ortalama Intel Core i7-9750H (342 - 495, n=21) | |
| Lenovo Legion Y740-15ICHg | |
| Geekbench 4.4 | |
| 64 Bit Single-Core Score | |
| Lenovo Legion Y740-15ICHg | |
| Ortalama Intel Core i7-9750H (4440 - 5511, n=27) | |
| 64 Bit Multi-Core Score | |
| Lenovo Legion Y740-15ICHg | |
| Ortalama Intel Core i7-9750H (17054 - 25043, n=27) | |
| 7-Zip 18.03 | |
| 7z b 4 | |
| Lenovo Legion Y740-15ICHg | |
| Ortalama Intel Core i7-9750H (28512 - 35174, n=21) | |
| 7z b 4 -mmt1 | |
| Lenovo Legion Y740-15ICHg | |
| Ortalama Intel Core i7-9750H (4580 - 5090, n=21) | |
* ... daha küçük daha iyidir
Sistem performansı
Lenovo, mevcut gözden geçirme ünitemizi önceki Y740 test cihazımızdaki cihazdan daha yavaş bir SSD ile donatırken, iki PCMark'ta neredeyse aynı puan aldı. Tüm sınıf ortalamasının üzerinde puanlama ile karşılaştırma aygıtlarımızı sistem performans ölçütlerinde çok az ayırır. Sonuç olarak, inceleme birimimiz hızlı hissediyor. Uygulamalar ve işletim sistemi hızlı bir şekilde yüklenirken, testlerimiz sırasında sistem problemleri veya gereksiz bekleme süreleri olmadığını fark ettik.
| PCMark 8 Home Score Accelerated v2 | 5661 puan | |
| PCMark 8 Creative Score Accelerated v2 | 8613 puan | |
| PCMark 8 Work Score Accelerated v2 | 5870 puan | |
| PCMark 10 Score | 5938 puan | |
Yardım | ||
Depolama aygıtları
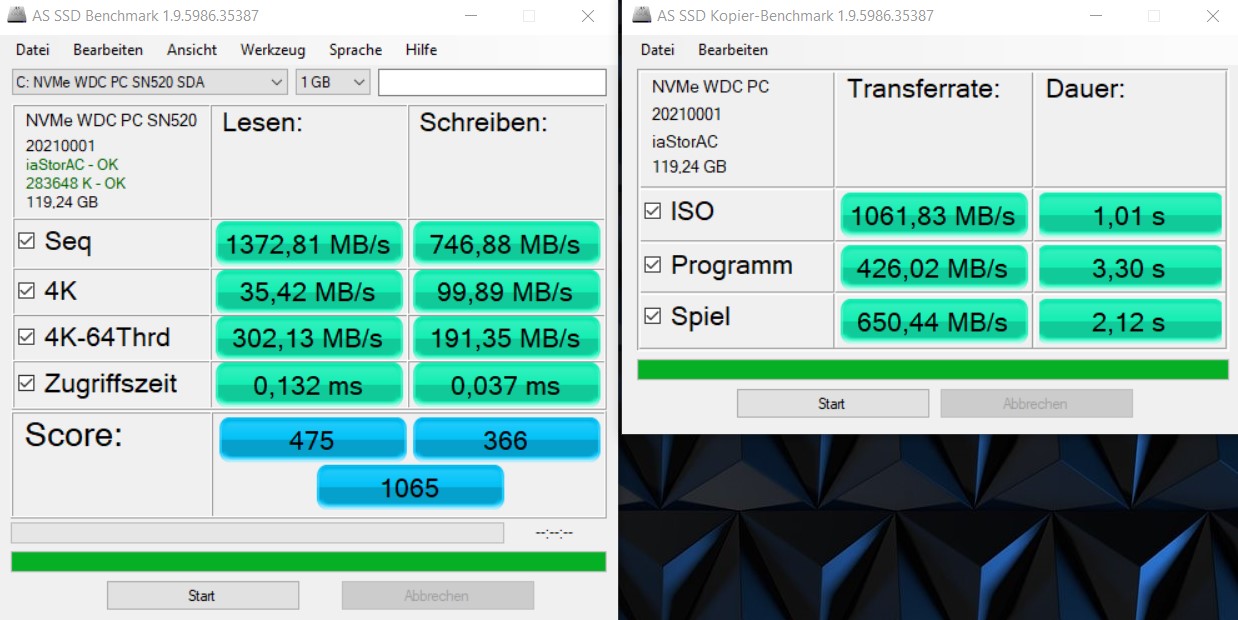
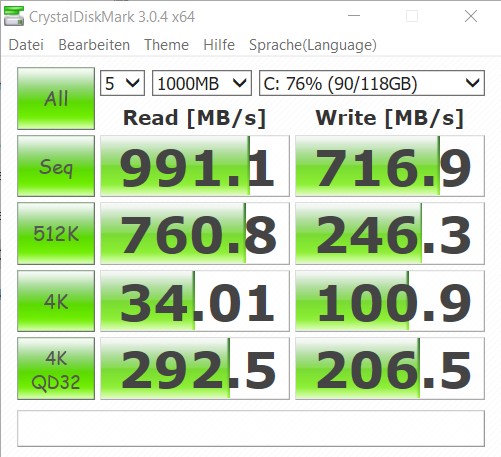
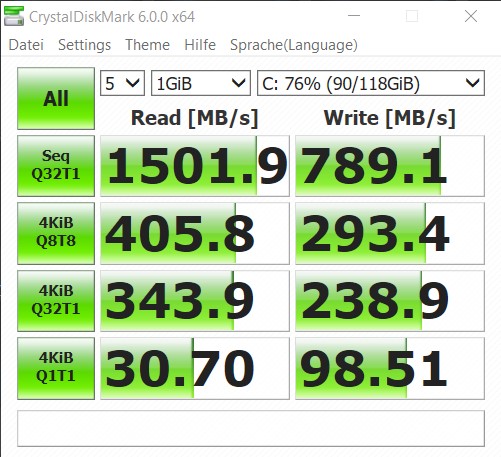
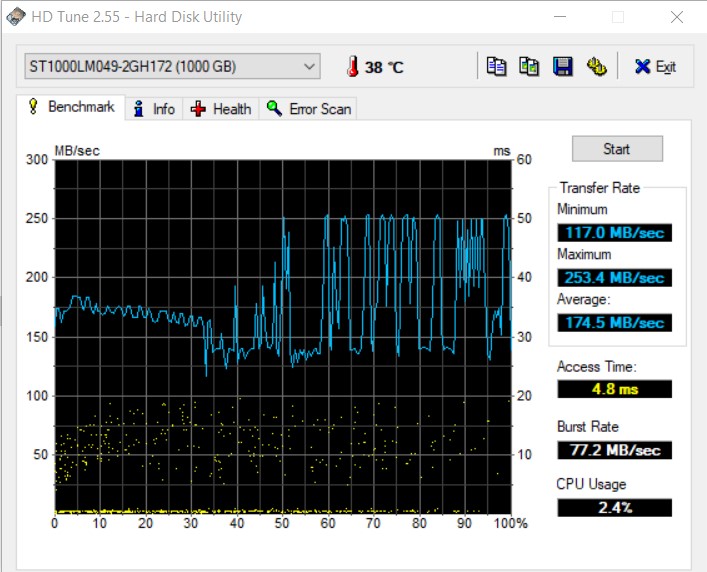
Y740, Lenovo'nun 128 GB M.2-2280 SSD ve 1 TB 2,5 inç HDD ile kapladığı M.2-2280 ve 2,5 inçlik sürücü yuvalarına sahiptir. Eski, Lenovo'nun Windows 10'u önceden yüklediği bir Western Digital sürücüdür. Sürücü günlük kullanımda iyi bir performans gösterse de, AS SSD ve CrystalDiskMark'taki karşılaştırma cihazlarımızdaki sürücülerden oldukça az kaldı. Oyun kütüphanesini depolamak için, ne kadar ucuz olduklarını düşünerek SSD ile değiştirmenizi tavsiye ederiz. Alternatif olarak, HDD'yi çıkarabilir ve daha büyük bir kapasite ve daha hızlı bir sürücü için 128 GB SSD'yi değiştirebilirsiniz. Bununla birlikte, HDD karmaşık modern oyunları yüklemek için yeterince hızlıdır. Daha fazla bilgi için lütfen HDD / SSD karşılaştırma sayfamıza bakın.
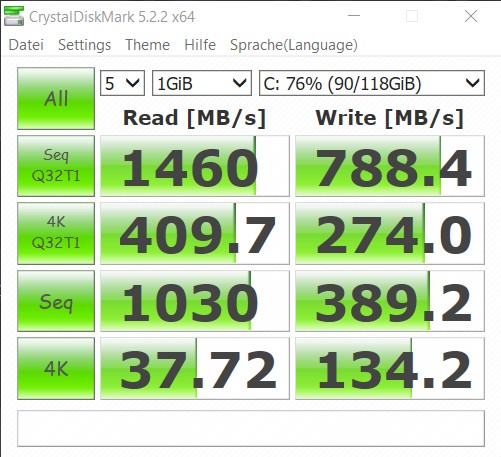
| Lenovo Legion Y740-15ICHg WDC PC SN520 SDAPMUW-128G | Lenovo Legion Y740-15ICHg Samsung SSD PM981 MZVLB256HAHQ | HP Omen X 2S 15-dg0075cl WDC PC SN720 SDAPNTW-1T00 | Acer Predator Triton 500 PT515-51-71PZ WDC PC SN720 SDAPNTW-512G | Ortalama WDC PC SN520 SDAPMUW-128G | Sınıf ortalaması Gaming | |
|---|---|---|---|---|---|---|
| AS SSD | 133% | 199% | 266% | -4% | 365% | |
| Seq Read (MB/s) | 1372 | 1953 42% | 2105 53% | 2888 110% | 1356 ? -1% | 5490 ? 300% |
| Seq Write (MB/s) | 746 | 1629 118% | 2493 234% | 2374 218% | 717 ? -4% | 3914 ? 425% |
| 4K Read (MB/s) | 35.42 | 33.2 -6% | 25.01 -29% | 42.95 21% | 29.3 ? -17% | 70 ? 98% |
| 4K Write (MB/s) | 99.9 | 88.1 -12% | 108.7 9% | 143.6 44% | 99.4 ? -1% | 215 ? 115% |
| 4K-64 Read (MB/s) | 302.1 | 757 151% | 1604 431% | 1272 321% | 302 ? 0% | 1633 ? 441% |
| 4K-64 Write (MB/s) | 191.4 | 1501 684% | 1593 732% | 1546 708% | 198 ? 3% | 2875 ? 1402% |
| Access Time Read * (ms) | 0.132 | 0.077 42% | 0.046 65% | 0.158 ? -20% | 0.06415 ? 51% | |
| Access Time Write * (ms) | 0.037 | 0.043 -16% | 0.102 -176% | 0.037 ? -0% | 0.03953 ? -7% | |
| Score Read (Points) | 475 | 985 107% | 1840 287% | 1604 238% | 467 ? -2% | 2252 ? 374% |
| Score Write (Points) | 366 | 1752 379% | 1951 433% | 1927 427% | 369 ? 1% | 3481 ? 851% |
| Score Total (Points) | 1065 | 3230 203% | 4743 345% | 4329 306% | 1052 ? -1% | 6815 ? 540% |
| Copy ISO MB/s (MB/s) | 1062 | 1872 76% | 2250 112% | 1025 ? -3% | 3074 ? 189% | |
| Copy Program MB/s (MB/s) | 426 | 478.2 12% | 896 110% | 377 ? -12% | 951 ? 123% | |
| Copy Game MB/s (MB/s) | 650 | 1165 79% | 1854 185% | 704 ? 8% | 2035 ? 213% |
* ... daha küçük daha iyidir

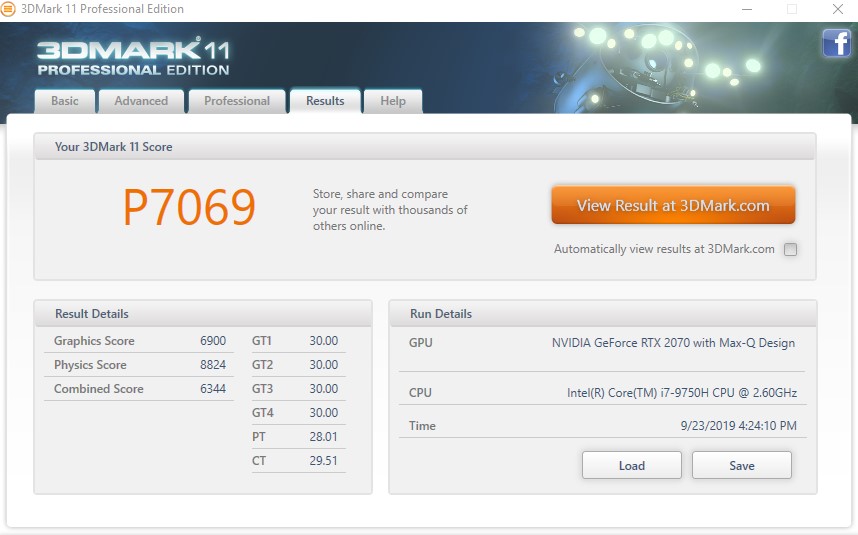
Grafik kartı
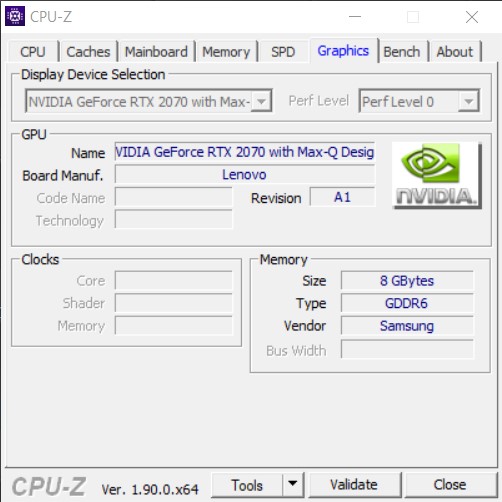
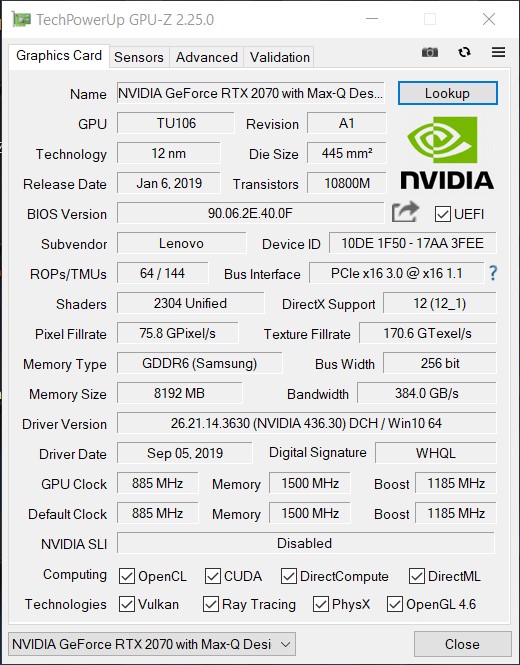
GeForce RTX 2070 Max-Q, NVIDIA'nın kompakt dizüstü bilgisayarlar için tasarladığı normal GeForce RTX 2070'in daha verimli bir sürümüdür. GeForce RTX 2070 Max-Q, normal GeForce RTX 2070'e kıyasla daha düşük saat hızlarına ve düşük termal tasarım gücüne (TDP) sahip, ancak her ikisi de 8 GB GDDR6 VRAM'a sahipler. Eşit temelde öncekiler, mevcut inceleme ünitemizle 3DMark Time Spy'da Core i7-8750H destekli Y740 modelini sadece% 6 daha yüksek performans gösterebiliyor. Ancak, HP Omen X 2S, aynı CPU ve GPU'ya sahip olmalarına rağmen, burada test cihazımızı eziyor. GeForce RTX 2070 Max-Q ve diğer GPU'larla nasıl karşılaştırıldığı hakkında daha fazla bilgi için lütfen GPU karşılaştırma sayfamıza bakın.
| 3DMark 11 Performance | 18733 puan | |
| 3DMark Ice Storm Standard Score | 175118 puan | |
| 3DMark Cloud Gate Standard Score | 36994 puan | |
| 3DMark Fire Strike Score | 15386 puan | |
| 3DMark Fire Strike Extreme Score | 7892 puan | |
| 3DMark Time Spy Score | 6777 puan | |
Yardım | ||
Oyun Performansı
Şu anki inceleme birimimiz selefinden biraz daha iyi kare hızlar elde edebiliyor; Core i7-9750H'nin biraz daha yüksek saat hızı görünüşte olumlu bir etkiye sahip. 1080p'de Ultra önceden ayarlanmış olan "The Witcher 3" e% 5 daha fazla kare oranı kaydettik; Eşit derecede iyi donanımlı HP Omen X 2S, inceleme ünitemizden% 15 daha fazla FPS elde etmesine rağmen, Y740'ın CPU ve GPU'sunu en iyi şekilde kullanamayacağının altını çiziyor. Lütfen daha fazla oyun karşılaştırması için GPU oyunları sayfamızı ziyaret edin.
Ayrıca, GPU’nun CPU ve CB R15 Multi 64Bit döngülü testimizde olduğu gibi, uzun bir yük altında kaldığını görmek için inceleme ünitemizi uzatılmış bir "The Witcher 3" testine tabi tuttuk. Y740, Ultra ön ayarında ortalama 60 FPS'yi 1080p'de tamamladı, bu nedenle uzun süreli oyun seanslarında performansta herhangi bir azalma hissetmemeniz gerekir.
| The Witcher 3 - 1920x1080 Ultra Graphics & Postprocessing (HBAO+) | |
| Sınıf ortalaması Gaming (95 - 240, n=8, son 2 yıl) | |
| HP Omen X 2S 15-dg0075cl | |
| Ortalama NVIDIA GeForce RTX 2070 Max-Q (56 - 83.8, n=31) | |
| Acer Predator Triton 500 PT515-51-71PZ | |
| Lenovo Legion Y740-15ICHg | |
| Lenovo Legion Y740-15ICHg | |
| düşük | orta | yüksek | ultra | |
|---|---|---|---|---|
| The Witcher 3 (2015) | 300 | 213 | 123 | 60 |
| Dota 2 Reborn (2015) | 142.4 | 133.7 | 133 | 124.1 |
| X-Plane 11.11 (2018) | 110 | 99 | 83 | |
| Shadow of the Tomb Raider (2018) | 126 | 99 | 92 | 81 |
| Metro Exodus (2019) | 127.2 | 76.8 | 57.3 | 47 |
Emisyonlar - Selefinden daha sıcak ve gürültülü fakat rekabetten daha iyi
Fan Gürültüsü
Ses yüksekliği
| Boşta |
| 31.3 / 31.3 / 31.3 dB |
| HDD |
| 32 dB |
| Çalışırken |
| 42 / 46.5 dB |
 | ||
30 dB sessiz 40 dB(A) duyulabilirlik 50 dB(A) gürültülü |
||
min: | ||
| Lenovo Legion Y740-15ICHg GeForce RTX 2070 Max-Q, i7-9750H, WDC PC SN520 SDAPMUW-128G | Lenovo Legion Y740-15ICHg GeForce RTX 2070 Max-Q, i7-8750H, Samsung SSD PM981 MZVLB256HAHQ | HP Omen X 2S 15-dg0075cl GeForce RTX 2070 Max-Q, i7-9750H, WDC PC SN720 SDAPNTW-1T00 | Acer Predator Triton 500 PT515-51-71PZ GeForce RTX 2070 Max-Q, i7-9750H, WDC PC SN720 SDAPNTW-512G | |
|---|---|---|---|---|
| Noise | 3% | -4% | -8% | |
| kapalı / ortam * (dB) | 30 | 28 7% | 29 3% | 30 -0% |
| Idle Minimum * (dB) | 31.3 | 32.6 -4% | 30.5 3% | 30 4% |
| Idle Average * (dB) | 31.3 | 32.7 -4% | 31.5 -1% | 33 -5% |
| Idle Maximum * (dB) | 31.3 | 32.7 -4% | 31.5 -1% | 39 -25% |
| Load Average * (dB) | 42 | 33.3 21% | 40.6 3% | 45 -7% |
| Witcher 3 ultra * (dB) | 42.1 | 41.6 1% | 49.5 -18% | 49 -16% |
| Load Maximum * (dB) | 46.5 | 45.2 3% | 53.4 -15% | 51 -10% |
* ... daha küçük daha iyidir
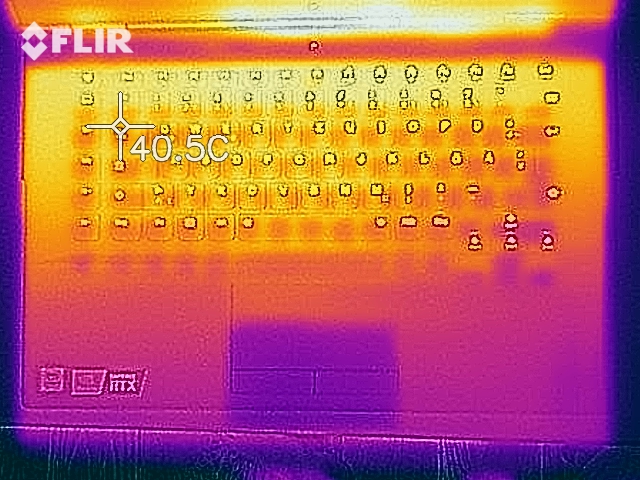
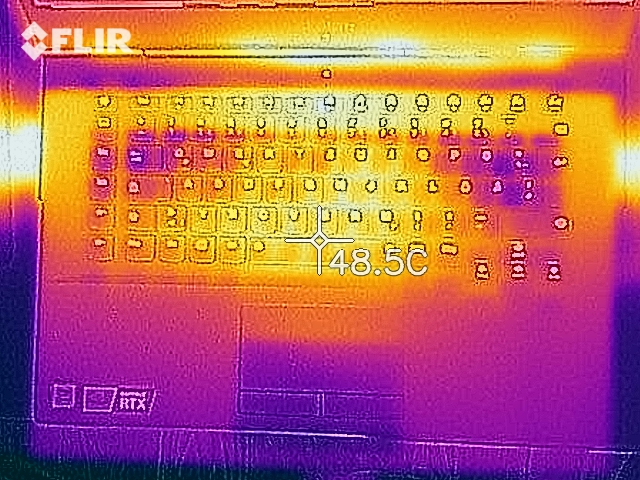
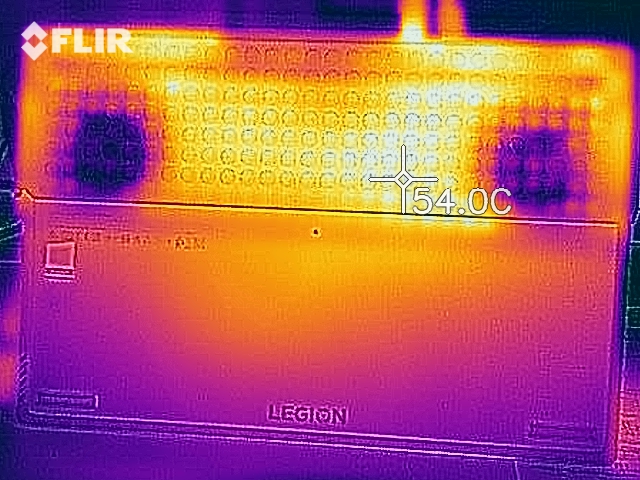
Sıcaklık
(±) Üst taraftaki maksimum sıcaklık, 40.4 °C / 105 F ortalamasına kıyasla 43.9 °C / 111 F'dir. , Gaming sınıfı için 21.2 ile 68.8 °C arasında değişir.
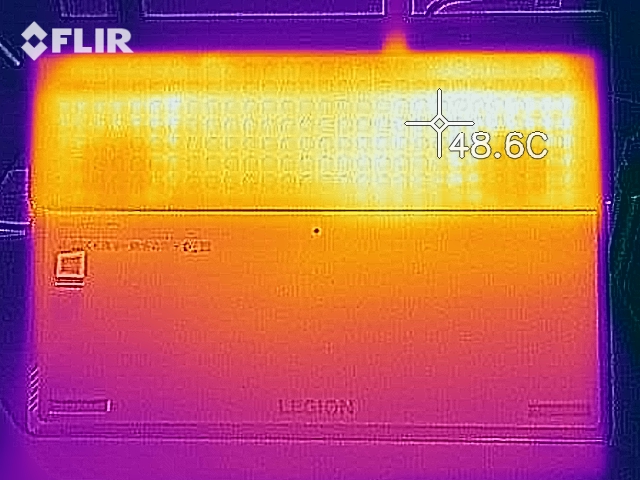
(-) Alt kısım, 43.2 °C / 110 F ortalamasına kıyasla maksimum 47.6 °C / 118 F'ye kadar ısınır
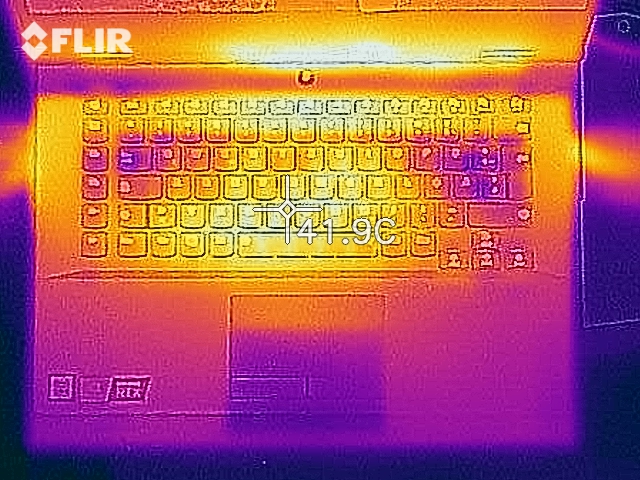
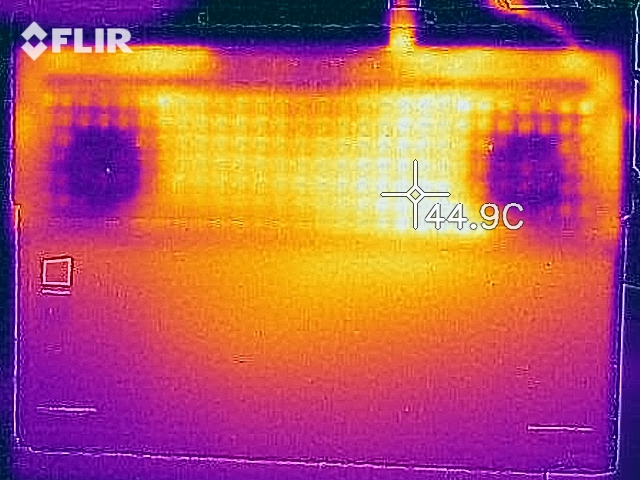
(±) Boşta kullanımda, üst tarafın ortalama sıcaklığı 34.5 °C / 94 F olup, cihazın 33.9 °C / 93 F.
(±) The Witcher 3 oynarken, üst tarafın ortalama sıcaklığı 33 °C / 91 F olup, cihazın 33.9 °C / 93 F.
(+) Avuç içi dayanakları ve dokunmatik yüzey maksimum (32.5 °C / 90.5 F) cilt sıcaklığına ulaşıyor ve bu nedenle sıcak değil.
(-) Benzer cihazların avuç içi dayanağı alanının ortalama sıcaklığı 28.8 °C / 83.8 F (-3.7 °C / -6.7 F) idi.
| Lenovo Legion Y740-15ICHg GeForce RTX 2070 Max-Q, i7-9750H, WDC PC SN520 SDAPMUW-128G | Lenovo Legion Y740-15ICHg GeForce RTX 2070 Max-Q, i7-8750H, Samsung SSD PM981 MZVLB256HAHQ | HP Omen X 2S 15-dg0075cl GeForce RTX 2070 Max-Q, i7-9750H, WDC PC SN720 SDAPNTW-1T00 | Acer Predator Triton 500 PT515-51-71PZ GeForce RTX 2070 Max-Q, i7-9750H, WDC PC SN720 SDAPNTW-512G | |
|---|---|---|---|---|
| Heat | 11% | -11% | 5% | |
| Maximum Upper Side * (°C) | 43.9 | 37.6 14% | 48.8 -11% | 49 -12% |
| Maximum Bottom * (°C) | 47.6 | 45.2 5% | 55 -16% | 59 -24% |
| Idle Upper Side * (°C) | 38.6 | 32.2 17% | 41 -6% | 28 27% |
| Idle Bottom * (°C) | 40.8 | 37.2 9% | 45.6 -12% | 29 29% |
* ... daha küçük daha iyidir
Hoparlörler
Lenovo Legion Y740-15ICHg ses analizi
(-) | hoparlörler çok yüksek ses çıkarmıyor (68.1 dB)
Bas 100 - 315Hz
(±) | azaltılmış bas - ortalama olarak medyandan 14.6% daha düşük
(±) | Bas doğrusallığı ortalamadır (12.4% delta - önceki frekans)
Ortalar 400 - 2000 Hz
(+) | dengeli ortalar - medyandan yalnızca 4.7% uzakta
(+) | orta frekanslar doğrusaldır (5.9% deltadan önceki frekansa)
Yüksekler 2 - 16 kHz
(+) | dengeli yüksekler - medyandan yalnızca 3.4% uzakta
(±) | Yükseklerin doğrusallığı ortalamadır (7.2% delta - önceki frekans)
Toplam 100 - 16.000 Hz
(±) | Genel sesin doğrusallığı ortalamadır (18.8% ortancaya göre fark)
Aynı sınıfla karşılaştırıldığında
» Bu sınıftaki tüm test edilen cihazların %62%'si daha iyi, 8% benzer, 30% daha kötüydü
» En iyisinin deltası 6% idi, ortalama 18% idi, en kötüsü 132% idi
Test edilen tüm cihazlarla karşılaştırıldığında
» Test edilen tüm cihazların %43'si daha iyi, 8 benzer, % 49 daha kötüydü
» En iyisinin deltası 4% idi, ortalama 24% idi, en kötüsü 134% idi
Acer Predator Triton 500 PT515-51-71PZ ses analizi
(±) | hoparlör ses yüksekliği ortalama ama iyi (80 dB)
Bas 100 - 315Hz
(±) | azaltılmış bas - ortalama olarak medyandan 12.2% daha düşük
(±) | Bas doğrusallığı ortalamadır (12.6% delta - önceki frekans)
Ortalar 400 - 2000 Hz
(+) | dengeli ortalar - medyandan yalnızca 4.5% uzakta
(+) | orta frekanslar doğrusaldır (4.7% deltadan önceki frekansa)
Yüksekler 2 - 16 kHz
(+) | dengeli yüksekler - medyandan yalnızca 2.2% uzakta
(+) | yüksekler doğrusaldır (3.2% deltadan önceki frekansa)
Toplam 100 - 16.000 Hz
(+) | genel ses doğrusaldır (14.8% ortancaya göre fark)
Aynı sınıfla karşılaştırıldığında
» Bu sınıftaki tüm test edilen cihazların %29%'si daha iyi, 7% benzer, 64% daha kötüydü
» En iyisinin deltası 6% idi, ortalama 18% idi, en kötüsü 132% idi
Test edilen tüm cihazlarla karşılaştırıldığında
» Test edilen tüm cihazların %20'si daha iyi, 4 benzer, % 76 daha kötüydü
» En iyisinin deltası 4% idi, ortalama 24% idi, en kötüsü 134% idi
Güç Yönetimi - Selefinden daha yüksek güç tüketimi, ancak daha iyi pil ömrü
Güç tüketimi
| Kapalı / Bekleme modu | |
| Boşta | |
| Çalışırken |
|
Key:
min: | |
| Lenovo Legion Y740-15ICHg i7-9750H, GeForce RTX 2070 Max-Q, WDC PC SN520 SDAPMUW-128G, IPS, 1920x1080, 15.6" | Lenovo Legion Y740-15ICHg i7-8750H, GeForce RTX 2070 Max-Q, Samsung SSD PM981 MZVLB256HAHQ, IPS, 1920x1080, 15.6" | HP Omen X 2S 15-dg0075cl i7-9750H, GeForce RTX 2070 Max-Q, WDC PC SN720 SDAPNTW-1T00, IPS, 1920x1080, 15.6" | Acer Predator Triton 500 PT515-51-71PZ i7-9750H, GeForce RTX 2070 Max-Q, WDC PC SN720 SDAPNTW-512G, IPS, 1920x1080, 15.6" | |
|---|---|---|---|---|
| Power Consumption | 5% | -64% | 28% | |
| Idle Minimum * (Watt) | 22.2 | 22.9 -3% | 46 -107% | 7 68% |
| Idle Average * (Watt) | 24.9 | 27.2 -9% | 59 -137% | 12 52% |
| Idle Maximum * (Watt) | 30.6 | 27.5 10% | 65.5 -114% | 22 28% |
| Load Average * (Watt) | 101 | 83.4 17% | 99.8 1% | 86 15% |
| Witcher 3 ultra * (Watt) | 143 | 143.6 -0% | 154.1 -8% | 144 -1% |
| Load Maximum * (Watt) | 186 | 160.5 14% | 222.7 -20% | 177 5% |
* ... daha küçük daha iyidir
Pil ömrü
| Battery Runtime - WiFi Websurfing | |
| Acer Predator Triton 500 PT515-51-71PZ | |
| Sınıf ortalaması Gaming (1.967 - 14.6, n=103, son 2 yıl) | |
| Lenovo Legion Y740-15ICHg | |
| Lenovo Legion Y740-15ICHg (240, switchable graphics enabled) | |
| HP Omen X 2S 15-dg0075cl | |
Artılar
Eksiler
Karar - Çok para için çok fazla performans
Lenovo Legion Y740, tüm modern üçlü A oyunlarını kolaylıkla idare edebilen pahalı, ancak makul fiyatlı, 15.6 inçlik bir oyun dizüstü bilgisayarıdır. Güçlü hexa-core işlemcisi ve GeForce RTX 2070 Max-Q GPU, mükemmel sistem performansı sağlamak için bir araya getirildi. Ancak, inceleme ünitemizdeki Core i7-9750H, öncekinden daha kötü bir performans sergilemesine rağmen, Intel yüksek hızlara ulaşabiliyor Saat hızı. Bu eksiklik, en azından testlerimiz sırasında oyun performansını etkilemedi. Lenovo Legion Y740-15ICHg tüm modern oyunlarda güçlü bir donanıma ve üstünlüğe sahip. Giriş aygıtları, başka türlü uygulanabilir bir oyun dizüstü bilgisayarıdır. Ancak, Legion Y740, Lenovo'nun göze çarpmayan RGB aydınlatmasıyla tamamladığı sade bir tasarıma sahip, iyi bir oyun dizüstü bilgisayarıdır. Legion Y740, öncüllerinden daha yetenekli bir yükseltmedir. Y740 sadece Y730'dan daha iyi bir oyun performansı sunmakla kalmıyor, aynı zamanda bazı oyuncuları memnun etmesi gereken daha parlak bir ekrana sahip. 144 Hz'lik panel de G-Sync ve HDR400 sertifikasına sahiptir, ancak oyun dizüstü bilgisayarına yaklaşık 2.000 € (~ 2.179) düşürmeyi düşünüyorsanız, nispeten yavaş tepki süreleri akılda tutuluyor.
Lenovo Legion Y740-15ICHg
- 06/20/2020 v7 (old)
Sebastian Bade
Price comparison
