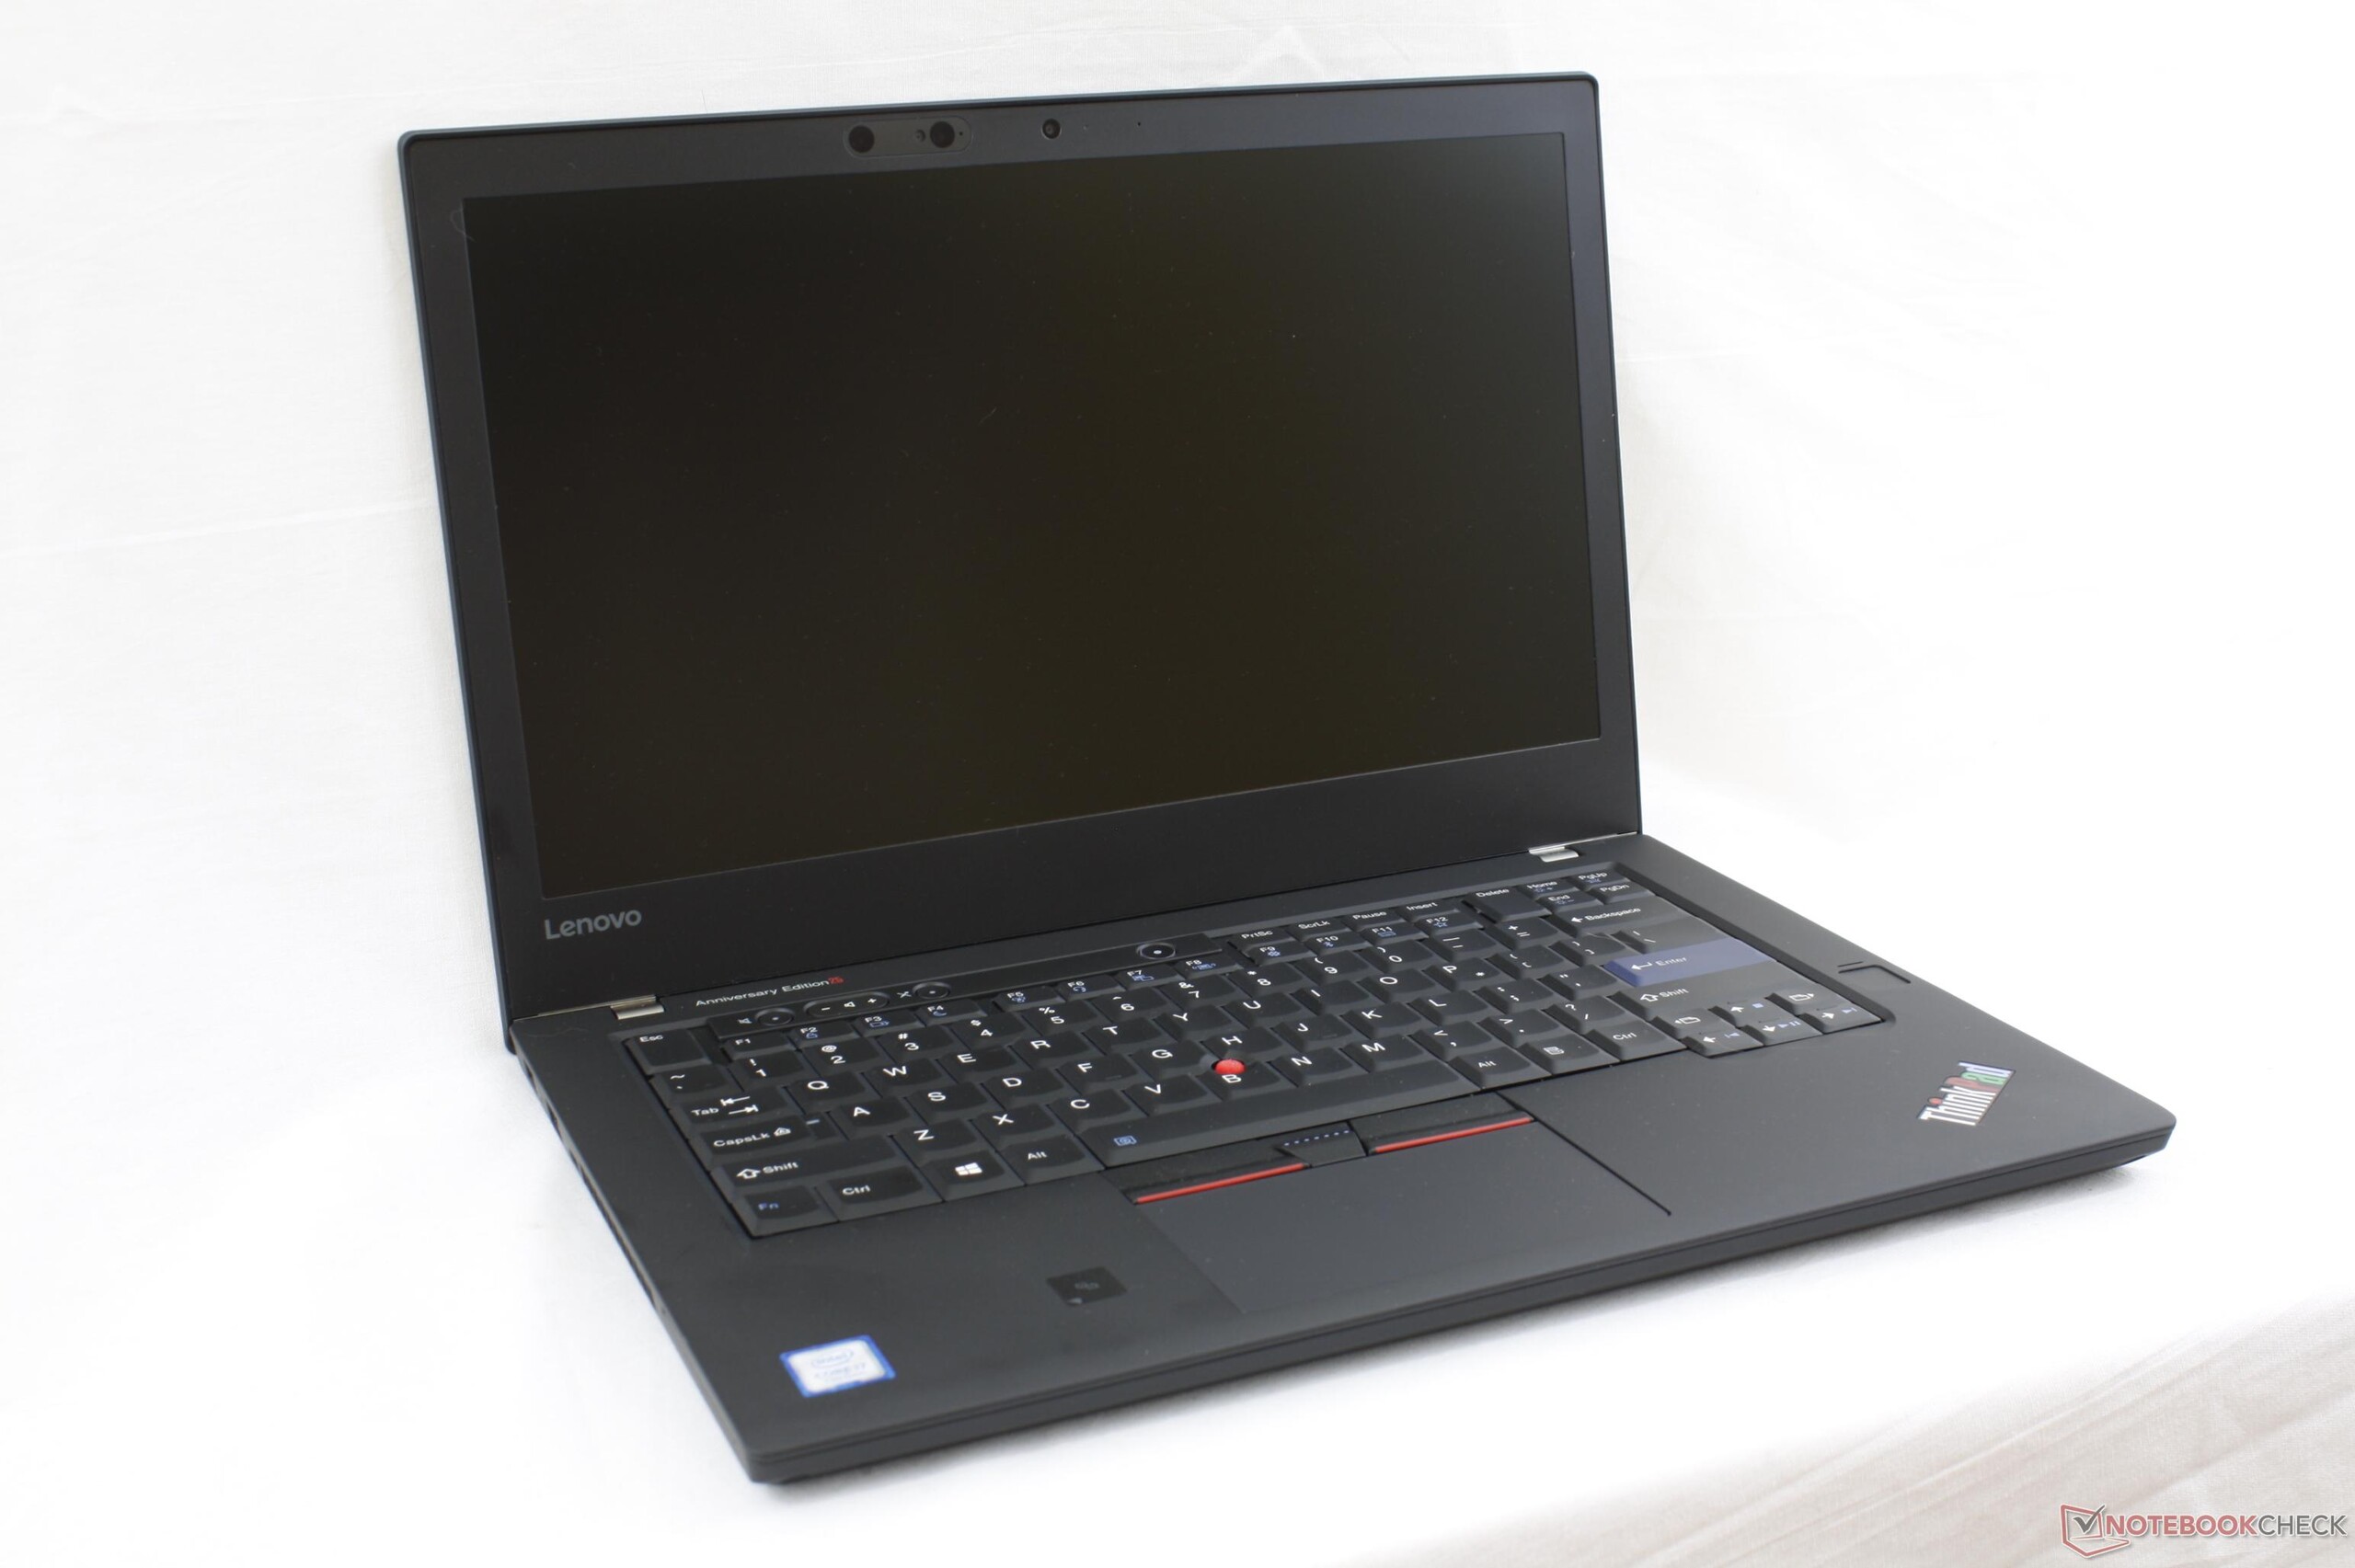
Kısa inceleme: Lenovo ThinkPad 25. yıl versiyonu


| SD Card Reader | |
| average JPG Copy Test (av. of 3 runs) | |
| Dell XPS 15 9560 (i7-7700HQ, UHD) | |
| Lenovo ThinkPad 25 | |
| Lenovo ThinkPad T470s-20HF0012US | |
| maximum AS SSD Seq Read Test (1GB) | |
| Dell XPS 15 9560 (i7-7700HQ, UHD) | |
| Lenovo ThinkPad T470s-20HF0012US | |
| Lenovo ThinkPad 25 | |
| Networking | |
| iperf3 transmit AX12 | |
| Dell XPS 15 9560 (i7-7700HQ, UHD) | |
| Lenovo ThinkPad 25 | |
| Lenovo ThinkPad T470s-20HF0012US | |
| iperf3 receive AX12 | |
| Lenovo ThinkPad 25 | |
| Dell XPS 15 9560 (i7-7700HQ, UHD) | |
| Lenovo ThinkPad T470s-20HF0012US | |
| |||||||||||||||||||||||||
Aydınlatma: 84 %
Batarya modunda parlaklık: 240.1 cd/m²
Kontrast: 1091:1 (Siyah: 0.22 cd/m²)
ΔE ColorChecker Calman: 6.3 | ∀{0.5-29.43 Ø4.71}
ΔE Greyscale Calman: 3.3 | ∀{0.09-98 Ø4.96}
63% sRGB (Argyll 1.6.3 3D)
40.6% AdobeRGB 1998 (Argyll 1.6.3 3D)
44.07% AdobeRGB 1998 (Argyll 3D)
63.3% sRGB (Argyll 3D)
42.57% Display P3 (Argyll 3D)
Gamma: 2.26
CCT: 6081 K
| Lenovo ThinkPad 25 ID: LEN40A9, Name: R140NWF5 R1, IPS, 14", 1920x1080 | Lenovo ThinkPad T470s-20HF0012US LEN40A9 (R140NWF5 R1), IPS, 14", 1920x1080 | Lenovo ThinkPad T470-20HD002HGE N140HCA-EAB, IPS, 14", 1920x1080 | Lenovo ThinkPad T470p-20J7S00000 LEN40AA, B140QAN01.5, IPS, 14", 2560x1440 | Apple MacBook Pro 13 2017 APPA033, IPS, 13.3", 2560x1600 | Samsung Notebook 9 NP900X5N-X01US ID: BOE06E8, Name: BOE HF NV150FHB-N31, IPS, 15", 1920x1080 | |
|---|---|---|---|---|---|---|
| Display | -5% | -2% | 57% | 96% | 53% | |
| Display P3 Coverage (%) | 42.57 | 40.35 -5% | 41.6 -2% | 69.3 63% | 99.2 133% | 65.2 53% |
| sRGB Coverage (%) | 63.3 | 60.3 -5% | 61.9 -2% | 94.9 50% | 99.9 58% | 97.7 54% |
| AdobeRGB 1998 Coverage (%) | 44.07 | 41.72 -5% | 43.06 -2% | 69.5 58% | 87.1 98% | 67.2 52% |
| Response Times | 17% | 10% | 7% | 15% | 13% | |
| Response Time Grey 50% / Grey 80% * (ms) | 45.6 ? | 40.8 ? 11% | 41.6 ? 9% | 52.8 ? -16% | 42.8 ? 6% | 40.8 ? 11% |
| Response Time Black / White * (ms) | 37.6 ? | 28.8 ? 23% | 34 ? 10% | 26.8 ? 29% | 28.8 ? 23% | 32.4 ? 14% |
| PWM Frequency (Hz) | 1000 ? | 219.3 ? | 208.3 ? | |||
| Screen | 2% | -1% | -1% | 57% | 44% | |
| Brightness middle (cd/m²) | 240.1 | 271.6 13% | 306 27% | 271 13% | 588 145% | 565.6 136% |
| Brightness (cd/m²) | 227 | 264 16% | 287 26% | 266 17% | 561 147% | 524 131% |
| Brightness Distribution (%) | 84 | 88 5% | 88 5% | 87 4% | 92 10% | 88 5% |
| Black Level * (cd/m²) | 0.22 | 0.24 -9% | 0.3 -36% | 0.25 -14% | 0.45 -105% | 0.49 -123% |
| Contrast (:1) | 1091 | 1132 4% | 1020 -7% | 1084 -1% | 1307 20% | 1154 6% |
| Colorchecker dE 2000 * | 6.3 | 6.1 3% | 6.2 2% | 6.68 -6% | 1.7 73% | 2 68% |
| Colorchecker dE 2000 max. * | 28.9 | 28.6 1% | 13.6 53% | 12.96 55% | 3.5 88% | 5 83% |
| Greyscale dE 2000 * | 3.3 | 3.4 -3% | 5.8 -76% | 9.21 -179% | 1.9 42% | 2.5 24% |
| Gamma | 2.26 97% | 2.12 104% | 2.04 108% | 2.42 91% | 2.33 94% | 2.21 100% |
| CCT | 6081 107% | 6077 107% | 6277 104% | 6018 108% | 6738 96% | 6896 94% |
| Color Space (Percent of AdobeRGB 1998) (%) | 40.6 | 38 -6% | 39.62 -2% | 61.49 51% | 77.92 92% | 61.2 51% |
| Color Space (Percent of sRGB) (%) | 63 | 60 -5% | 61.44 -2% | 94.72 50% | 99.94 59% | 97.5 55% |
| Toplam Ortalama (Program / Ayarlar) | 5% /
3% | 2% /
0% | 21% /
12% | 56% /
59% | 37% /
41% |
* ... daha küçük daha iyidir
Yanıt Sürelerini Görüntüle
| ↔ Tepki Süresi Siyahtan Beyaza | ||
|---|---|---|
| 37.6 ms ... yükseliş ↗ ve sonbahar↘ birleşimi | ↗ 22 ms yükseliş | 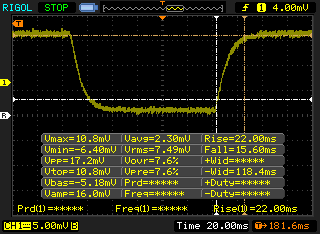 |
| ↘ 15.6 ms sonbahar | ||
| Ekran, testlerimizde yavaş yanıt oranları gösteriyor ve oyuncular için yetersiz olacaktır. Karşılaştırıldığında, test edilen tüm cihazlar 0.1 (minimum) ile 240 (maksimum) ms arasında değişir. » Tüm cihazların 95 %'si daha iyi. Bu, ölçülen yanıt süresinin test edilen tüm cihazların ortalamasından (19.8 ms) daha kötü olduğu anlamına gelir. | ||
| ↔ Tepki Süresi %50 Griden %80 Griye | ||
| 45.6 ms ... yükseliş ↗ ve sonbahar↘ birleşimi | ↗ 18 ms yükseliş | 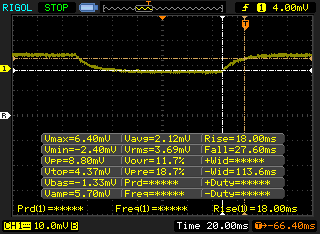 |
| ↘ 27.6 ms sonbahar | ||
| Ekran, testlerimizde yavaş yanıt oranları gösteriyor ve oyuncular için yetersiz olacaktır. Karşılaştırıldığında, test edilen tüm cihazlar 0.165 (minimum) ile 636 (maksimum) ms arasında değişir. » Tüm cihazların 78 %'si daha iyi. Bu, ölçülen yanıt süresinin test edilen tüm cihazların ortalamasından (31 ms) daha kötü olduğu anlamına gelir. | ||
Ekran Titremesi / PWM (Darbe Genişliği Modülasyonu)
| Ekran titriyor / PWM algılandı | 1000 Hz | ≤ 99 % parlaklık ayarı | 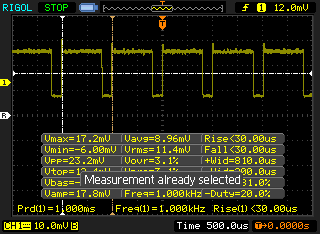 |
Ekran arka ışığı 1000 Hz'de titriyor (en kötü durum, örneğin PWM kullanılması) 99 % ve altındaki parlaklık ayarında titreme algılandı. Bu parlaklık ayarının üzerinde titreme veya PWM olmamalıdır. 1000 Hz frekansı oldukça yüksektir, bu nedenle PWM'ye duyarlı çoğu kullanıcı herhangi bir titremeyi fark etmemelidir. Karşılaştırıldığında: Test edilen tüm cihazların %52 %'si ekranı karartmak için PWM kullanmıyor. PWM tespit edilirse, ortalama 7754 (minimum: 5 - maksimum: 343500) Hz ölçüldü. | |||
| Cinebench R15 | |
| CPU Single 64Bit | |
| Acer Swift 3 Pre-Sample Intel | |
| Eurocom Q5 | |
| Huawei MateBook D 15, i7-7500U 940MX | |
| Toshiba Tecra X40-D | |
| Lenovo ThinkPad 25 | |
| Asus Zenbook UX310UQ-GL011T | |
| Lenovo ThinkPad T470-20HD002HGE | |
| Lenovo ThinkPad E550-20DF00CNGE | |
| Lenovo Y40-59423035 | |
| Asus FX550IU-WSFX | |
| CPU Multi 64Bit | |
| Eurocom Q5 | |
| Acer Swift 3 Pre-Sample Intel | |
| Lenovo ThinkPad 25 | |
| Toshiba Tecra X40-D | |
| Huawei MateBook D 15, i7-7500U 940MX | |
| Asus Zenbook UX310UQ-GL011T | |
| Lenovo ThinkPad T470-20HD002HGE | |
| Asus FX550IU-WSFX | |
| Lenovo ThinkPad E550-20DF00CNGE | |
| Lenovo Y40-59423035 | |
| Cinebench R11.5 | |
| CPU Single 64Bit | |
| Toshiba Tecra X40-D | |
| Eurocom Q5 | |
| Huawei MateBook D 15, i7-7500U 940MX | |
| Lenovo ThinkPad 25 | |
| Asus Zenbook UX310UQ-GL011T | |
| Lenovo ThinkPad T470-20HD002HGE | |
| Lenovo ThinkPad E550-20DF00CNGE | |
| Lenovo Y40-59423035 | |
| Asus FX550IU-WSFX | |
| CPU Multi 64Bit | |
| Eurocom Q5 | |
| Huawei MateBook D 15, i7-7500U 940MX | |
| Toshiba Tecra X40-D | |
| Lenovo ThinkPad T470-20HD002HGE | |
| Asus FX550IU-WSFX | |
| Lenovo ThinkPad 25 | |
| Asus Zenbook UX310UQ-GL011T | |
| Lenovo ThinkPad E550-20DF00CNGE | |
| Lenovo Y40-59423035 | |
| Cinebench R10 | |
| Rendering Multiple CPUs 32Bit | |
| Eurocom Q5 | |
| Toshiba Tecra X40-D | |
| Lenovo ThinkPad 25 | |
| Huawei MateBook D 15, i7-7500U 940MX | |
| Asus Zenbook UX310UQ-GL011T | |
| Asus FX550IU-WSFX | |
| Lenovo ThinkPad E550-20DF00CNGE | |
| Rendering Single 32Bit | |
| Eurocom Q5 | |
| Huawei MateBook D 15, i7-7500U 940MX | |
| Lenovo ThinkPad 25 | |
| Asus Zenbook UX310UQ-GL011T | |
| Lenovo ThinkPad E550-20DF00CNGE | |
| Asus FX550IU-WSFX | |
| wPrime 2.10 - 1024m | |
| Lenovo Y40-59423035 | |
| Lenovo Thinkpad T420 4236-NGG | |
| Huawei MateBook D 15, i7-7500U 940MX | |
| Toshiba Tecra X40-D | |
| Lenovo ThinkPad 25 | |
| Asus FX550IU-WSFX | |
| Eurocom Q5 | |
* ... daha küçük daha iyidir
| PCMark 8 | |
| Home Score Accelerated v2 | |
| Lenovo ThinkPad T470s-20HF0012US | |
| Samsung Notebook 9 NP900X5N-X01US | |
| Lenovo ThinkPad 25 | |
| Lenovo ThinkPad T470p-20J7S00000 | |
| Work Score Accelerated v2 | |
| Lenovo ThinkPad T470s-20HF0012US | |
| Samsung Notebook 9 NP900X5N-X01US | |
| Lenovo ThinkPad 25 | |
| Lenovo ThinkPad T470p-20J7S00000 | |
| Creative Score Accelerated v2 | |
| Lenovo ThinkPad T470s-20HF0012US | |
| Lenovo ThinkPad T470p-20J7S00000 | |
| Samsung Notebook 9 NP900X5N-X01US | |
| Lenovo ThinkPad 25 | |
| PCMark 8 Home Score Accelerated v2 | 3764 puan | |
| PCMark 8 Creative Score Accelerated v2 | 4693 puan | |
| PCMark 8 Work Score Accelerated v2 | 4894 puan | |
| PCMark 10 Score | 3035 puan | |
Yardım | ||
| Lenovo ThinkPad 25 Samsung SM961 MZVKW512HMJP m.2 PCI-e | Lenovo ThinkPad T470s-20HF0012US Samsung PM961 MZVLW256HEHP | Lenovo ThinkPad T470p-20J7S00000 Samsung PM961 NVMe MZVLW512HMJP | Lenovo ThinkPad X1 Carbon 2017-20HR0021GE Toshiba THNSF5256GPUK | Dell XPS 15 9560 (i7-7700HQ, UHD) Lite-On CX2-8B512-Q11 | |
|---|---|---|---|---|---|
| AS SSD | 11% | 17% | -46% | 7% | |
| Copy Game MB/s (MB/s) | 598 | 309.9 -48% | 586 -2% | 229 -62% | 540 -10% |
| Copy Program MB/s (MB/s) | 400.6 | 291 -27% | 347.7 -13% | 172.4 -57% | 411.5 3% |
| Copy ISO MB/s (MB/s) | 1272 | 797 -37% | 673 -47% | 623 -51% | 1272 0% |
| Score Total (Points) | 2811 | 3875 38% | 3606 28% | 1398 -50% | 2810 0% |
| Score Write (Points) | 837 | 803 -4% | 1272 52% | 337 -60% | 1022 22% |
| Score Read (Points) | 1317 | 2083 58% | 1546 17% | 726 -45% | 1206 -8% |
| Access Time Write * (ms) | 0.031 | 0.025 19% | 0.024 23% | 0.034 -10% | 0.034 -10% |
| Access Time Read * (ms) | 0.04 | 0.06 -50% | 0.035 12% | 0.102 -155% | 0.034 15% |
| 4K-64 Write (MB/s) | 640 | 538 -16% | 1007 57% | 149.6 -77% | 789 23% |
| 4K-64 Read (MB/s) | 1130 | 1765 56% | 1344 19% | 526 -53% | 962 -15% |
| 4K Write (MB/s) | 113 | 147.9 31% | 147.3 30% | 109.4 -3% | 112.2 -1% |
| 4K Read (MB/s) | 50.4 | 48.84 -3% | 56.4 12% | 34.34 -32% | 41.34 -18% |
| Seq Write (MB/s) | 840 | 1170 39% | 1176 40% | 775 -8% | 1207 44% |
| Seq Read (MB/s) | 1369 | 2691 97% | 1455 6% | 1649 20% | 2026 48% |
* ... daha küçük daha iyidir
| 3DMark | |
| 1280x720 Cloud Gate Standard Graphics | |
| Acer Aspire E5-575G-549D | |
| Sager NP5852 | |
| Lenovo ThinkPad 25 | |
| Apple MacBook Pro 13 2016 (2.9 GHz) | |
| Apple MacBook Pro 13 2017 | |
| HP ProBook 440 G4-Y8B51EA | |
| Samsung Notebook 9 NP900X5N-X01US | |
| HP Elite x2 1012 G2-1LV76EA | |
| Dell Latitude 7285 | |
| Lenovo ThinkPad T470-20HD002HGE | |
| 1920x1080 Fire Strike Graphics | |
| Sager NP5852 | |
| Acer Aspire E5-575G-549D | |
| Lenovo ThinkPad 25 | |
| Apple MacBook Pro 13 2016 (2.9 GHz) | |
| HP ProBook 440 G4-Y8B51EA | |
| Samsung Notebook 9 NP900X5N-X01US | |
| Apple MacBook Pro 13 2017 | |
| HP Elite x2 1012 G2-1LV76EA | |
| Dell Latitude 7285 | |
| Lenovo ThinkPad T470-20HD002HGE | |
| 1920x1080 Fire Strike Physics | |
| Sager NP5852 | |
| Apple MacBook Pro 13 2017 | |
| Samsung Notebook 9 NP900X5N-X01US | |
| HP ProBook 440 G4-Y8B51EA | |
| Lenovo ThinkPad T470-20HD002HGE | |
| HP Elite x2 1012 G2-1LV76EA | |
| Apple MacBook Pro 13 2016 (2.9 GHz) | |
| Lenovo ThinkPad 25 | |
| Acer Aspire E5-575G-549D | |
| Dell Latitude 7285 | |
| 3DMark 11 | |
| 1280x720 Performance GPU | |
| Sager NP5852 | |
| Acer Aspire E5-575G-549D | |
| Lenovo ThinkPad 25 | |
| Apple MacBook Pro 13 2016 (2.9 GHz) | |
| Apple MacBook Pro 13 2017 | |
| Samsung Notebook 9 NP900X5N-X01US | |
| HP ProBook 440 G4-Y8B51EA | |
| HP Elite x2 1012 G2-1LV76EA | |
| Lenovo ThinkPad T470-20HD002HGE | |
| Dell Latitude 7285 | |
| 1280x720 Performance Combined | |
| Sager NP5852 | |
| Acer Aspire E5-575G-549D | |
| Lenovo ThinkPad 25 | |
| Apple MacBook Pro 13 2016 (2.9 GHz) | |
| Apple MacBook Pro 13 2017 | |
| HP ProBook 440 G4-Y8B51EA | |
| Samsung Notebook 9 NP900X5N-X01US | |
| HP Elite x2 1012 G2-1LV76EA | |
| Lenovo ThinkPad T470-20HD002HGE | |
| Dell Latitude 7285 | |
| 3DMark 11 Performance | 3063 puan | |
| 3DMark Ice Storm Standard Score | 47070 puan | |
| 3DMark Cloud Gate Standard Score | 8889 puan | |
| 3DMark Fire Strike Score | 2129 puan | |
| 3DMark Fire Strike Extreme Score | 1071 puan | |
Yardım | ||
| düşük | orta | yüksek | ultra | |
|---|---|---|---|---|
| BioShock Infinite (2013) | 126.1 | 72.1 | 61.7 | 23.9 |
| The Witcher 3 (2015) | 45.4 | 26 | 15.1 | |
| Rise of the Tomb Raider (2016) | 52.8 | 30 | 16.4 | 13.3 |
Ses yüksekliği
| Boşta |
| 27.9 / 27.9 / 30 dB |
| Çalışırken |
| 37.6 / 37.6 dB |
 | ||
30 dB sessiz 40 dB(A) duyulabilirlik 50 dB(A) gürültülü |
||
min: | ||
| Lenovo ThinkPad 25 GeForce 940MX, i7-7500U, Samsung SM961 MZVKW512HMJP m.2 PCI-e | Lenovo ThinkPad T470s-20HF0012US HD Graphics 620, i5-7300U, Samsung PM961 MZVLW256HEHP | Lenovo ThinkPad T470p-20J7S00000 GeForce 940MX, i7-7700HQ, Samsung PM961 NVMe MZVLW512HMJP | Apple MacBook Pro 13 2017 Iris Plus Graphics 640, i5-7360U, Apple SSD AP0128 | Lenovo ThinkPad T470-20HD002HGE HD Graphics 620, i5-7200U, Samsung PM961 NVMe MZVLW512HMJP | |
|---|---|---|---|---|---|
| Noise | -1% | -2% | -3% | 4% | |
| kapalı / ortam * (dB) | 27.9 | 27.8 -0% | 29 -4% | 30.2 -8% | 28 -0% |
| Idle Minimum * (dB) | 27.9 | 27.8 -0% | 29 -4% | 30.2 -8% | 28 -0% |
| Idle Average * (dB) | 27.9 | 27.8 -0% | 29 -4% | 30.2 -8% | 28 -0% |
| Idle Maximum * (dB) | 30 | 27.8 7% | 29 3% | 30.2 -1% | 29.4 2% |
| Load Average * (dB) | 37.6 | 34.8 7% | 35.6 5% | 32.9 13% | 31.4 16% |
| Witcher 3 ultra * (dB) | 37.6 | 42 -12% | |||
| Load Maximum * (dB) | 37.6 | 42 -12% | 39.7 -6% | 39.3 -5% | 34.6 8% |
* ... daha küçük daha iyidir
(±) Üst taraftaki maksimum sıcaklık, 34.3 °C / 94 F ortalamasına kıyasla 43.6 °C / 110 F'dir. , Office sınıfı için 21.2 ile 62.5 °C arasında değişir.
(-) Alt kısım, 36.8 °C / 98 F ortalamasına kıyasla maksimum 57.2 °C / 135 F'ye kadar ısınır
(+) Boşta kullanımda, üst tarafın ortalama sıcaklığı 27.2 °C / 81 F olup, cihazın 29.5 °C / 85 F.
(±) The Witcher 3 oynarken, üst tarafın ortalama sıcaklığı 33.6 °C / 92 F olup, cihazın 29.5 °C / 85 F.
(±) Avuç içi dayanakları ve dokunmatik yüzey maksimum 36.6 °C / 97.9 F ile dokunulamayacak kadar ısınabilir.
(-) Benzer cihazların avuç içi dayanağı alanının ortalama sıcaklığı 27.5 °C / 81.5 F (-9.1 °C / -16.4 F) idi.
Lenovo ThinkPad 25 ses analizi
(±) | hoparlör ses yüksekliği ortalama ama iyi (73.6 dB)
Bas 100 - 315Hz
(-) | neredeyse hiç bas yok - ortalama olarak medyandan 22% daha düşük
(±) | Bas doğrusallığı ortalamadır (9.9% delta - önceki frekans)
Ortalar 400 - 2000 Hz
(+) | dengeli ortalar - medyandan yalnızca 3.7% uzakta
(±) | Ortaların doğrusallığı ortalamadır (10.7% delta - önceki frekans)
Yüksekler 2 - 16 kHz
(+) | dengeli yüksekler - medyandan yalnızca 2.3% uzakta
(±) | Yükseklerin doğrusallığı ortalamadır (8.3% delta - önceki frekans)
Toplam 100 - 16.000 Hz
(±) | Genel sesin doğrusallığı ortalamadır (22.6% ortancaya göre fark)
Aynı sınıfla karşılaştırıldığında
» Bu sınıftaki tüm test edilen cihazların %61%'si daha iyi, 8% benzer, 31% daha kötüydü
» En iyisinin deltası 7% idi, ortalama 21% idi, en kötüsü 53% idi
Test edilen tüm cihazlarla karşılaştırıldığında
» Test edilen tüm cihazların %67'si daha iyi, 6 benzer, % 28 daha kötüydü
» En iyisinin deltası 4% idi, ortalama 23% idi, en kötüsü 134% idi
Apple MacBook 12 (Early 2016) 1.1 GHz ses analizi
(+) | hoparlörler nispeten yüksek sesle çalabilir (83.6 dB)
Bas 100 - 315Hz
(±) | azaltılmış bas - ortalama olarak medyandan 11.3% daha düşük
(±) | Bas doğrusallığı ortalamadır (14.2% delta - önceki frekans)
Ortalar 400 - 2000 Hz
(+) | dengeli ortalar - medyandan yalnızca 2.4% uzakta
(+) | orta frekanslar doğrusaldır (5.5% deltadan önceki frekansa)
Yüksekler 2 - 16 kHz
(+) | dengeli yüksekler - medyandan yalnızca 2% uzakta
(+) | yüksekler doğrusaldır (4.5% deltadan önceki frekansa)
Toplam 100 - 16.000 Hz
(+) | genel ses doğrusaldır (10.2% ortancaya göre fark)
Aynı sınıfla karşılaştırıldığında
» Bu sınıftaki tüm test edilen cihazların %7%'si daha iyi, 2% benzer, 90% daha kötüydü
» En iyisinin deltası 5% idi, ortalama 18% idi, en kötüsü 53% idi
Test edilen tüm cihazlarla karşılaştırıldığında
» Test edilen tüm cihazların %5'si daha iyi, 1 benzer, % 94 daha kötüydü
» En iyisinin deltası 4% idi, ortalama 23% idi, en kötüsü 134% idi
| Kapalı / Bekleme modu | |
| Boşta | |
| Çalışırken |
|
Key:
min: | |
| Lenovo ThinkPad 25 i7-7500U, GeForce 940MX, Samsung SM961 MZVKW512HMJP m.2 PCI-e, IPS, 1920x1080, 14" | Lenovo ThinkPad T470s-20HF0012US i5-7300U, HD Graphics 620, Samsung PM961 MZVLW256HEHP, IPS, 1920x1080, 14" | Lenovo ThinkPad T470p-20J7S00000 i7-7700HQ, GeForce 940MX, Samsung PM961 NVMe MZVLW512HMJP, IPS, 2560x1440, 14" | Apple MacBook Pro 13 2017 i5-7360U, Iris Plus Graphics 640, Apple SSD AP0128, IPS, 2560x1600, 13.3" | Lenovo ThinkPad T470-20HD002HGE i5-7200U, HD Graphics 620, Samsung PM961 NVMe MZVLW512HMJP, IPS, 1920x1080, 14" | |
|---|---|---|---|---|---|
| Power Consumption | 13% | -8% | 18% | 29% | |
| Idle Minimum * (Watt) | 4.2 | 4.8 -14% | 3.8 10% | 3.7 12% | 3.21 24% |
| Idle Average * (Watt) | 7.3 | 6.6 10% | 6.5 11% | 5.2 29% | 6.15 16% |
| Idle Maximum * (Watt) | 7.7 | 7 9% | 7.2 6% | 7.6 1% | 6.82 11% |
| Load Average * (Watt) | 55.4 | 39.2 29% | 62.5 -13% | 41.6 25% | 28.5 49% |
| Witcher 3 ultra * (Watt) | 49.1 | ||||
| Load Maximum * (Watt) | 64.4 | 44.8 30% | 99.6 -55% | 50.5 22% | 34.5 46% |
* ... daha küçük daha iyidir
| Lenovo ThinkPad 25 i7-7500U, GeForce 940MX, 48 Wh | Lenovo ThinkPad T470s-20HF0012US i5-7300U, HD Graphics 620, 51 Wh | Lenovo ThinkPad T470p-20J7S00000 i7-7700HQ, GeForce 940MX, 72 Wh | Apple MacBook Pro 13 2017 i5-7360U, Iris Plus Graphics 640, 54.5 Wh | Lenovo ThinkPad X1 Carbon 2017-20HR0021GE i5-7200U, HD Graphics 620, 57 Wh | Lenovo ThinkPad T470-20HD002HGE i5-7200U, HD Graphics 620, 48 Wh | |
|---|---|---|---|---|---|---|
| Pil Çalışma Süresi | 37% | 15% | 21% | 14% | 8% | |
| Reader / Idle (h) | 15.3 | 17.7 16% | 17.7 16% | 13.7 -10% | ||
| WiFi v1.3 (h) | 7.1 | 8.1 14% | 10 41% | 11.4 61% | 9.1 28% | 7.3 3% |
| Load (h) | 1.6 | 2.9 81% | 1.4 -13% | 1.3 -19% | 2 25% | 1.8 13% |
Artılar
Eksiler
ThinkPad 25 eski ThinkPad klavyesini özleyenler için özel bir model. Aksi taktirde mevcut T470 modeli üzerine bu cihazı seçmek için pek bir sebep yok.
Asıl ilginç olan ise ThinkPad 25 modelini T470 ile benzer bir donanım çerçevesinde sununca fiyatı da 1900$ seviyesinden başlıyor. T470 modelinde gem GeForce 940MX grafik kartı yok hem de klasik klavye ile gelmiyor. Ama Smart Card okuyucu ve biraz daha uzun bir Trackpade sahip. Aslında bu cihazın ortaya çıkmasının tek amacı ThinkPad serisinin 25. yılını kutlamak ve mevcut satışlarda rekabet yaratmamak. Daha fazla performans görmek isteyen kullanıcıların Kaby Lake-R işlemcileri beklemeye devam etmesi gerekli.
En iyi 14 inçlik iş cihazlarından biri olmasının dışında yıl dönümü modeli olması açısından bakınca biraz hayal kırıklığı yaşıyoruz. ThinkPad 25 sadece T470 modelinin birazcık farklılaşmış hali. Bu kötü değil elbette ama bir ThinkPad meraklısına sadece klavyeyi değiştirip yıl dönümü modeli olarak sunmak ne kadar tatmin edici tartışılır.
Lenovo ThinkPad 25
- 10/05/2017 v6 (old)
Allen Ngo
Price comparison
