Kısa inceleme: Lenovo ThinkPad X280 (i5-8250U, FHD) Laptop
| SD Card Reader | |
| average JPG Copy Test (av. of 3 runs) | |
| Lenovo ThinkPad X1 Carbon 2018-20KGS03900 (Toshiba Exceria Pro M501) | |
| HP EliteBook 820 G4 Z2V72ET (Toshiba Exceria Pro SDXC 64 GB UHS-II) | |
| Dell Latitude 7280 (Toshiba THN-M401S0640E2) | |
| Lenovo ThinkPad X280-20KES01S00 (Toshiba Excerie Pro M501) | |
| Dell Latitude 13 7380 (Toshiba Exceria Pro SDXC 64 GB UHS-II) | |
| Sınıf ortalaması Subnotebook (23.7 - 188, n=9, son 2 yıl) | |
| Lenovo ThinkPad X270-20HMS00T00 (Toshiba Exceria Pro SDXC 64 GB UHS-II) | |
| maximum AS SSD Seq Read Test (1GB) | |
| Lenovo ThinkPad X1 Carbon 2018-20KGS03900 (Toshiba Exceria Pro M501) | |
| Sınıf ortalaması Subnotebook (24.9 - 195, n=8, son 2 yıl) | |
| Dell Latitude 7280 (Toshiba THN-M401S0640E2) | |
| Lenovo ThinkPad X270-20HMS00T00 (Toshiba Exceria Pro SDXC 64 GB UHS-II) | |
| Dell Latitude 13 7380 (Toshiba Exceria Pro SDXC 64 GB UHS-II) | |
| HP EliteBook 820 G4 Z2V72ET (Toshiba Exceria Pro SDXC 64 GB UHS-II) | |
| Lenovo ThinkPad X280-20KES01S00 (Toshiba Excerie Pro M501) | |
| Networking | |
| iperf3 transmit AX12 | |
| Dell Latitude 13 7380 | |
| Dell Latitude 7280 | |
| Lenovo ThinkPad X280-20KES01S00 | |
| Lenovo ThinkPad X270-20HMS00T00 | |
| Lenovo ThinkPad X1 Carbon 2018-20KGS03900 | |
| HP EliteBook 820 G4 Z2V72ET (jseb) | |
| iperf3 receive AX12 | |
| Lenovo ThinkPad X270-20HMS00T00 | |
| Dell Latitude 7280 | |
| Lenovo ThinkPad X280-20KES01S00 | |
| Lenovo ThinkPad X1 Carbon 2018-20KGS03900 | |
| Dell Latitude 13 7380 | |
| HP EliteBook 820 G4 Z2V72ET (jseb) | |
| |||||||||||||||||||||||||
Aydınlatma: 82 %
Batarya modunda parlaklık: 336 cd/m²
Kontrast: 1376:1 (Siyah: 0.25 cd/m²)
ΔE ColorChecker Calman: 4.7 | ∀{0.5-29.43 Ø4.71}
ΔE Greyscale Calman: 2.2 | ∀{0.09-98 Ø4.96}
64.1% sRGB (Argyll 1.6.3 3D)
41.2% AdobeRGB 1998 (Argyll 1.6.3 3D)
45.45% AdobeRGB 1998 (Argyll 3D)
64.5% sRGB (Argyll 3D)
44% Display P3 (Argyll 3D)
Gamma: 2.16
CCT: 6252 K
| Lenovo ThinkPad X280-20KES01S00 B125HAN02.2, , 1920x1080, 12.5" | Lenovo ThinkPad X270-20HMS00T00 Innolux N125HCE-GN1, , 1920x1080, 12.5" | HP EliteBook 820 G4 Z2V72ET Chi Mei, , 1920x1080, 12.5" | Dell Latitude 7280 AUO236D , , 1920x1080, 12.5" | Lenovo ThinkPad X1 Carbon 2018-20KGS03900 B140QAN02.0, , 2560x1440, 14" | Dell Latitude 13 7380 LGD0589, , 1920x1080, 13.3" | |
|---|---|---|---|---|---|---|
| Display | 1% | 1% | 1% | 91% | 45% | |
| Display P3 Coverage (%) | 44 | 44.6 1% 44.6 1% | 44.45 1% | 44.41 1% | 87.7 99% | 65.5 49% |
| sRGB Coverage (%) | 64.5 | 65.9 2% 65.9 2% | 65.5 2% | 65.4 1% | 100 55% | 91.8 42% |
| AdobeRGB 1998 Coverage (%) | 45.45 | 46.11 1% 46.11 1% | 46.04 1% | 45.9 1% | 99.9 120% | 65.8 45% |
| Response Times | -3% | 12% | 7% | -32% | 8% | |
| Response Time Grey 50% / Grey 80% * (ms) | 40 ? | 40.8 ? -2% | 35 ? 12% | 32.4 ? 19% | 59.2 ? -48% | 34 ? 15% |
| Response Time Black / White * (ms) | 29.6 ? | 30.4 ? -3% | 26 ? 12% | 31.2 ? -5% | 34.4 ? -16% | 29.6 ? -0% |
| PWM Frequency (Hz) | 26040 ? | |||||
| Screen | -21% | -24% | -23% | 38% | -20% | |
| Brightness middle (cd/m²) | 344 | 283 -18% | 326 -5% | 310.4 -10% | 578 68% | 317 -8% |
| Brightness (cd/m²) | 313 | 281 -10% | 304 -3% | 301 -4% | 533 70% | 295 -6% |
| Brightness Distribution (%) | 82 | 94 15% | 81 -1% | 88 7% | 84 2% | 87 6% |
| Black Level * (cd/m²) | 0.25 | 0.25 -0% | 0.29 -16% | 0.32 -28% | 0.38 -52% | 0.3 -20% |
| Contrast (:1) | 1376 | 1132 -18% | 1124 -18% | 970 -30% | 1521 11% | 1057 -23% |
| Colorchecker dE 2000 * | 4.7 | 6.1 -30% | 6.49 -38% | 5.9 -26% | 1.9 60% | 6.3 -34% |
| Colorchecker dE 2000 max. * | 19.4 | 15.4 21% | 15.95 18% | 21 -8% | 3.8 80% | 10.4 46% |
| Greyscale dE 2000 * | 2.2 | 6 -173% | 6.16 -180% | 5.1 -132% | 3 -36% | 7.8 -255% |
| Gamma | 2.16 102% | 2.05 107% | 2.32 95% | 2.33 94% | 2.14 103% | 1.81 122% |
| CCT | 6252 104% | 6832 95% | 7575 86% | 6816 95% | 6377 102% | 7120 91% |
| Color Space (Percent of AdobeRGB 1998) (%) | 41.2 | 42.26 3% | 42 2% | 42 2% | 88.8 116% | 61 48% |
| Color Space (Percent of sRGB) (%) | 64.1 | 65.43 2% | 65 1% | 65 1% | 100 56% | 92 44% |
| Colorchecker dE 2000 calibrated * | 0.8 | |||||
| Toplam Ortalama (Program / Ayarlar) | -8% /
-11% | -4% /
-14% | -5% /
-14% | 32% /
39% | 11% /
-3% |
* ... daha küçük daha iyidir
Yanıt Sürelerini Görüntüle
| ↔ Tepki Süresi Siyahtan Beyaza | ||
|---|---|---|
| 29.6 ms ... yükseliş ↗ ve sonbahar↘ birleşimi | ↗ 16.4 ms yükseliş | 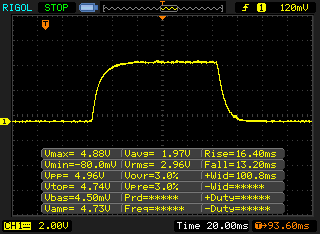 |
| ↘ 13.2 ms sonbahar | ||
| Ekran, testlerimizde nispeten yavaş yanıt oranları gösteriyor ve oyuncular için çok yavaş olabilir. Karşılaştırıldığında, test edilen tüm cihazlar 0.1 (minimum) ile 240 (maksimum) ms arasında değişir. » Tüm cihazların 79 %'si daha iyi. Bu, ölçülen yanıt süresinin test edilen tüm cihazların ortalamasından (19.8 ms) daha kötü olduğu anlamına gelir. | ||
| ↔ Tepki Süresi %50 Griden %80 Griye | ||
| 40 ms ... yükseliş ↗ ve sonbahar↘ birleşimi | ↗ 22 ms yükseliş | 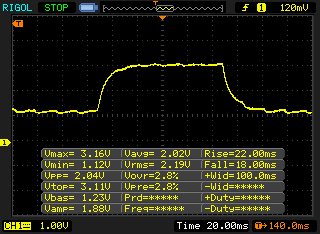 |
| ↘ 18 ms sonbahar | ||
| Ekran, testlerimizde yavaş yanıt oranları gösteriyor ve oyuncular için yetersiz olacaktır. Karşılaştırıldığında, test edilen tüm cihazlar 0.165 (minimum) ile 636 (maksimum) ms arasında değişir. » Tüm cihazların 61 %'si daha iyi. Bu, ölçülen yanıt süresinin test edilen tüm cihazların ortalamasından (31 ms) daha kötü olduğu anlamına gelir. | ||
Ekran Titremesi / PWM (Darbe Genişliği Modülasyonu)
| Ekran titriyor / PWM algılanmadı | 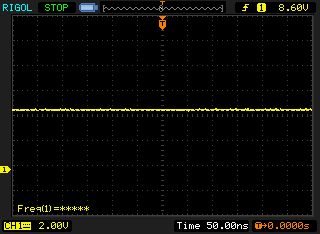 | ||
Karşılaştırıldığında: Test edilen tüm cihazların %52 %'si ekranı karartmak için PWM kullanmıyor. PWM tespit edilirse, ortalama 7757 (minimum: 5 - maksimum: 343500) Hz ölçüldü. | |||
| PCMark 8 Home Score Accelerated v2 | 3574 puan | |
| PCMark 8 Work Score Accelerated v2 | 4868 puan | |
| PCMark 10 Score | 3860 puan | |
Yardım | ||
| Lenovo ThinkPad X280-20KES01S00 Samsung SSD PM981 MZVLB512HAJQ | Lenovo ThinkPad X270-20HMS00T00 Toshiba NVMe THNSF5512GPUK | HP EliteBook 820 G4 Z2V72ET Samsung PM951 NVMe MZVLV512 | Dell Latitude 7280 SanDisk X400 M.2 2280 256GB | Dell Latitude 13 7380 Samsung PM961 MZVLW256HEHP | Lenovo ThinkPad X1 Carbon 2018-20KGS03900 Samsung SSD PM981 MZVLB512HAJQ | Ortalama Samsung SSD PM981 MZVLB512HAJQ | |
|---|---|---|---|---|---|---|---|
| AS SSD | -41% | -29% | -84% | -4% | 7% | -10% | |
| Seq Read (MB/s) | 2316 | 1374 -41% | 1393 -40% | 499.9 -78% | 1330 -43% | 2396 3% | 1976 ? -15% |
| Seq Write (MB/s) | 1385 | 931 -33% | 551 -60% | 473.3 -66% | 805 -42% | 1376 -1% | 1637 ? 18% |
| 4K Read (MB/s) | 47.2 | 42.16 -11% | 38.81 -18% | 27.92 -41% | 45.59 -3% | 52.4 11% | 50.5 ? 7% |
| 4K Write (MB/s) | 105.3 | 100.5 -5% | 125.3 19% | 53.6 -49% | 125.1 19% | 134.3 28% | 112 ? 6% |
| 4K-64 Read (MB/s) | 1218 | 450.6 -63% | 749 -39% | 354.6 -71% | 2072 70% | 876 -28% | 1203 ? -1% |
| 4K-64 Write (MB/s) | 1309 | 375 -71% | 495.1 -62% | 119.1 -91% | 484.5 -63% | 1529 17% | 1504 ? 15% |
| Access Time Read * (ms) | 0.041 | 0.062 -51% | 0.041 -0% | 0.117 -185% | 0.045 -10% | 0.029 29% | 0.05092 ? -24% |
| Access Time Write * (ms) | 0.036 | 0.035 3% | 0.029 19% | 0.076 -111% | 0.028 22% | 0.027 25% | 0.08337 ? -132% |
| Score Read (Points) | 1497 | 630 -58% | 927 -38% | 432 -71% | 2251 50% | 1168 -22% | 1451 ? -3% |
| Score Write (Points) | 1553 | 569 -63% | 675 -57% | 220 -86% | 690 -56% | 1801 16% | 1780 ? 15% |
| Score Total (Points) | 3774 | 1513 -60% | 2043 -46% | 881 -77% | 4063 8% | 3529 -6% | 3966 ? 5% |
* ... daha küçük daha iyidir

| 3DMark 11 - 1280x720 Performance GPU | |
| Sınıf ortalaması Subnotebook (995 - 18489, n=55, son 2 yıl) | |
| Lenovo ThinkPad X1 Carbon 2018-20KGS03900 | |
| Lenovo ThinkPad X280-20KES01S00 | |
| Ortalama Intel UHD Graphics 620 (1144 - 3432, n=244) | |
| Dell Latitude 13 7380 | |
| HP EliteBook 820 G4 Z2V72ET | |
| Dell Latitude 7280 | |
| Lenovo ThinkPad X270-20HMS00T00 | |
| 3DMark | |
| 1280x720 Cloud Gate Standard Graphics | |
| Sınıf ortalaması Subnotebook (5577 - 61591, n=28, son 2 yıl) | |
| Lenovo ThinkPad X1 Carbon 2018-20KGS03900 | |
| Lenovo ThinkPad X280-20KES01S00 | |
| Ortalama Intel UHD Graphics 620 (6205 - 16400, n=225) | |
| Dell Latitude 13 7380 | |
| HP EliteBook 820 G4 Z2V72ET | |
| Dell Latitude 7280 | |
| Lenovo ThinkPad X270-20HMS00T00 | |
| 1920x1080 Fire Strike Graphics | |
| Sınıf ortalaması Subnotebook (832 - 16347, n=56, son 2 yıl) | |
| Lenovo ThinkPad X1 Carbon 2018-20KGS03900 | |
| Lenovo ThinkPad X280-20KES01S00 | |
| Ortalama Intel UHD Graphics 620 (557 - 2608, n=213) | |
| Dell Latitude 13 7380 | |
| HP EliteBook 820 G4 Z2V72ET | |
| Dell Latitude 7280 | |
| Lenovo ThinkPad X270-20HMS00T00 | |
| 3DMark 11 Performance | 2029 puan | |
| 3DMark Cloud Gate Standard Score | 8541 puan | |
| 3DMark Fire Strike Score | 1107 puan | |
Yardım | ||
| düşük | orta | yüksek | ultra | |
|---|---|---|---|---|
| BioShock Infinite (2013) | 70.1 | 36.69 | 30.85 | 10.15 |
| Rise of the Tomb Raider (2016) | 21.56 | |||
| Civilization 6 (2016) | 43.14 | 15.84 |
Ses yüksekliği
| Boşta |
| 29.2 / 29.2 / 29.2 dB |
| Çalışırken |
| 39.7 / 39.7 dB |
 | ||
30 dB sessiz 40 dB(A) duyulabilirlik 50 dB(A) gürültülü |
||
min: | ||
(±) Üst taraftaki maksimum sıcaklık, 35.9 °C / 97 F ortalamasına kıyasla 43.2 °C / 110 F'dir. , Subnotebook sınıfı için 21.4 ile 59 °C arasında değişir.
(±) Alt kısım, 39.2 °C / 103 F ortalamasına kıyasla maksimum 43.1 °C / 110 F'ye kadar ısınır
(+) Boşta kullanımda, üst tarafın ortalama sıcaklığı 23.8 °C / 75 F olup, cihazın 30.8 °C / 87 F.
(+) Avuç içi dayanakları ve dokunmatik yüzey maksimum (34.1 °C / 93.4 F) cilt sıcaklığına ulaşıyor ve bu nedenle sıcak değil.
(-) Benzer cihazların avuç içi dayanağı alanının ortalama sıcaklığı 28.2 °C / 82.8 F (-5.9 °C / -10.6 F) idi.
Lenovo ThinkPad X280-20KES01S00 ses analizi
(±) | hoparlör ses yüksekliği ortalama ama iyi (76.8 dB)
Bas 100 - 315Hz
(-) | neredeyse hiç bas yok - ortalama olarak medyandan 17% daha düşük
(±) | Bas doğrusallığı ortalamadır (11.8% delta - önceki frekans)
Ortalar 400 - 2000 Hz
(+) | dengeli ortalar - medyandan yalnızca 4.1% uzakta
(±) | Ortaların doğrusallığı ortalamadır (9.9% delta - önceki frekans)
Yüksekler 2 - 16 kHz
(+) | dengeli yüksekler - medyandan yalnızca 1.9% uzakta
(+) | yüksekler doğrusaldır (4.7% deltadan önceki frekansa)
Toplam 100 - 16.000 Hz
(±) | Genel sesin doğrusallığı ortalamadır (17.7% ortancaya göre fark)
Aynı sınıfla karşılaştırıldığında
» Bu sınıftaki tüm test edilen cihazların %49%'si daha iyi, 7% benzer, 44% daha kötüydü
» En iyisinin deltası 5% idi, ortalama 18% idi, en kötüsü 53% idi
Test edilen tüm cihazlarla karşılaştırıldığında
» Test edilen tüm cihazların %35'si daha iyi, 8 benzer, % 57 daha kötüydü
» En iyisinin deltası 4% idi, ortalama 23% idi, en kötüsü 134% idi
Lenovo ThinkPad X270-20HMS00T00 ses analizi
(-) | hoparlörler çok yüksek ses çıkarmıyor (66.8 dB)
Bas 100 - 315Hz
(-) | neredeyse hiç bas yok - ortalama olarak medyandan 18.8% daha düşük
(±) | Bas doğrusallığı ortalamadır (11.1% delta - önceki frekans)
Ortalar 400 - 2000 Hz
(+) | dengeli ortalar - medyandan yalnızca 1.5% uzakta
(+) | orta frekanslar doğrusaldır (5.4% deltadan önceki frekansa)
Yüksekler 2 - 16 kHz
(+) | dengeli yüksekler - medyandan yalnızca 3.1% uzakta
(+) | yüksekler doğrusaldır (6.4% deltadan önceki frekansa)
Toplam 100 - 16.000 Hz
(±) | Genel sesin doğrusallığı ortalamadır (22.3% ortancaya göre fark)
Aynı sınıfla karşılaştırıldığında
» Bu sınıftaki tüm test edilen cihazların %59%'si daha iyi, 9% benzer, 32% daha kötüydü
» En iyisinin deltası 7% idi, ortalama 21% idi, en kötüsü 53% idi
Test edilen tüm cihazlarla karşılaştırıldığında
» Test edilen tüm cihazların %65'si daha iyi, 6 benzer, % 29 daha kötüydü
» En iyisinin deltası 4% idi, ortalama 23% idi, en kötüsü 134% idi
| Kapalı / Bekleme modu | |
| Boşta | |
| Çalışırken |
|
Key:
min: | |
| Lenovo ThinkPad X280-20KES01S00 i5-8250U, UHD Graphics 620, Samsung SSD PM981 MZVLB512HAJQ, IPS LED, 1920x1080, 12.5" | Lenovo ThinkPad X270-20HMS00T00 i5-7200U, HD Graphics 620, Toshiba NVMe THNSF5512GPUK, IPS LED, 1920x1080, 12.5" | HP EliteBook 820 G4 Z2V72ET i7-7500U, HD Graphics 620, Samsung PM951 NVMe MZVLV512, IPS, 1920x1080, 12.5" | Dell Latitude 7280 i7-7600U, HD Graphics 620, SanDisk X400 M.2 2280 256GB, IPS, 1920x1080, 12.5" | Dell Latitude 13 7380 i7-7600U, HD Graphics 620, Samsung PM961 MZVLW256HEHP, IPS, 1920x1080, 13.3" | Lenovo ThinkPad X1 Carbon 2018-20KGS03900 i5-8550U, UHD Graphics 620, Samsung SSD PM981 MZVLB512HAJQ, IPS, 2560x1440, 14" | |
|---|---|---|---|---|---|---|
| Power Consumption | 5% | 23% | 13% | 17% | -31% | |
| Idle Minimum * (Watt) | 3.11 | 3.5 -13% | 2.7 13% | 4.28 -38% | 3.2 -3% | 3.8 -22% |
| Idle Average * (Watt) | 5.01 | 5.8 -16% | 4.8 4% | 5.11 -2% | 5.5 -10% | 8.9 -78% |
| Idle Maximum * (Watt) | 8.11 | 7.6 6% | 6.6 19% | 5.49 32% | 6.1 25% | 11.9 -47% |
| Load Average * (Watt) | 44.6 | 33.2 26% | 28.5 36% | 29.83 33% | 29.5 34% | 47.5 -7% |
| Load Maximum * (Watt) | 51.7 | 40.4 22% | 29 44% | 30.05 42% | 32 38% | 52.5 -2% |
* ... daha küçük daha iyidir
| Lenovo ThinkPad X280-20KES01S00 i5-8250U, UHD Graphics 620, 50 Wh | Lenovo ThinkPad X270-20HMS00T00 i5-7200U, HD Graphics 620, 46 Wh | HP EliteBook 820 G4 Z2V72ET i7-7500U, HD Graphics 620, 49 Wh | Dell Latitude 7280 i7-7600U, HD Graphics 620, 60 Wh | Dell Latitude 13 7380 i7-7600U, HD Graphics 620, 60 Wh | Lenovo ThinkPad X1 Carbon 2018-20KGS03900 i5-8550U, UHD Graphics 620, 57 Wh | Sınıf ortalaması Subnotebook | |
|---|---|---|---|---|---|---|---|
| Pil Çalışma Süresi | -24% | 20% | 30% | 23% | -1% | 40% | |
| Reader / Idle (h) | 20.2 | 17.1 -15% | 22.4 11% | 25.9 28% | 26.6 32% | 22.1 9% | 28.6 ? 42% |
| H.264 (h) | 9.5 | 6.8 -28% | 8.9 -6% | 9.4 -1% | 15.4 ? 62% | ||
| WiFi v1.3 (h) | 8.9 | 5.4 -39% | 9.4 6% | 11.4 28% | 10.5 18% | 8.7 -2% | 14 ? 57% |
| Load (h) | 2 | 1.7 -15% | 3.4 70% | 2.7 35% | 2.4 20% | 1.8 -10% | 1.969 ? -2% |
Artılar
Eksiler
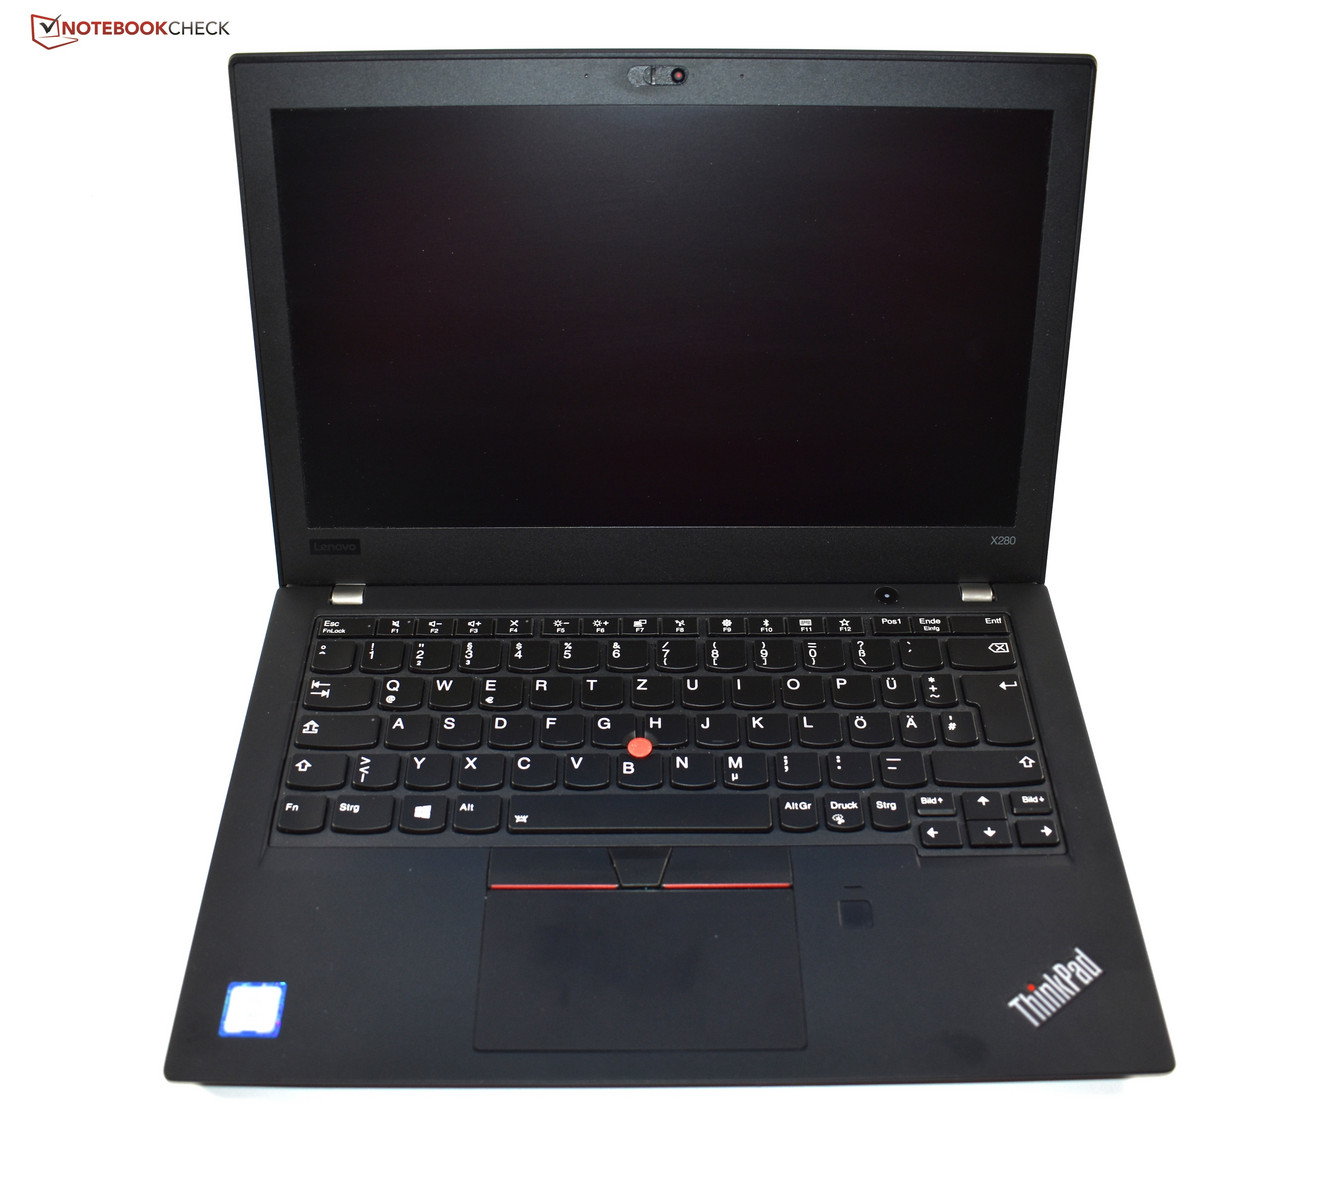
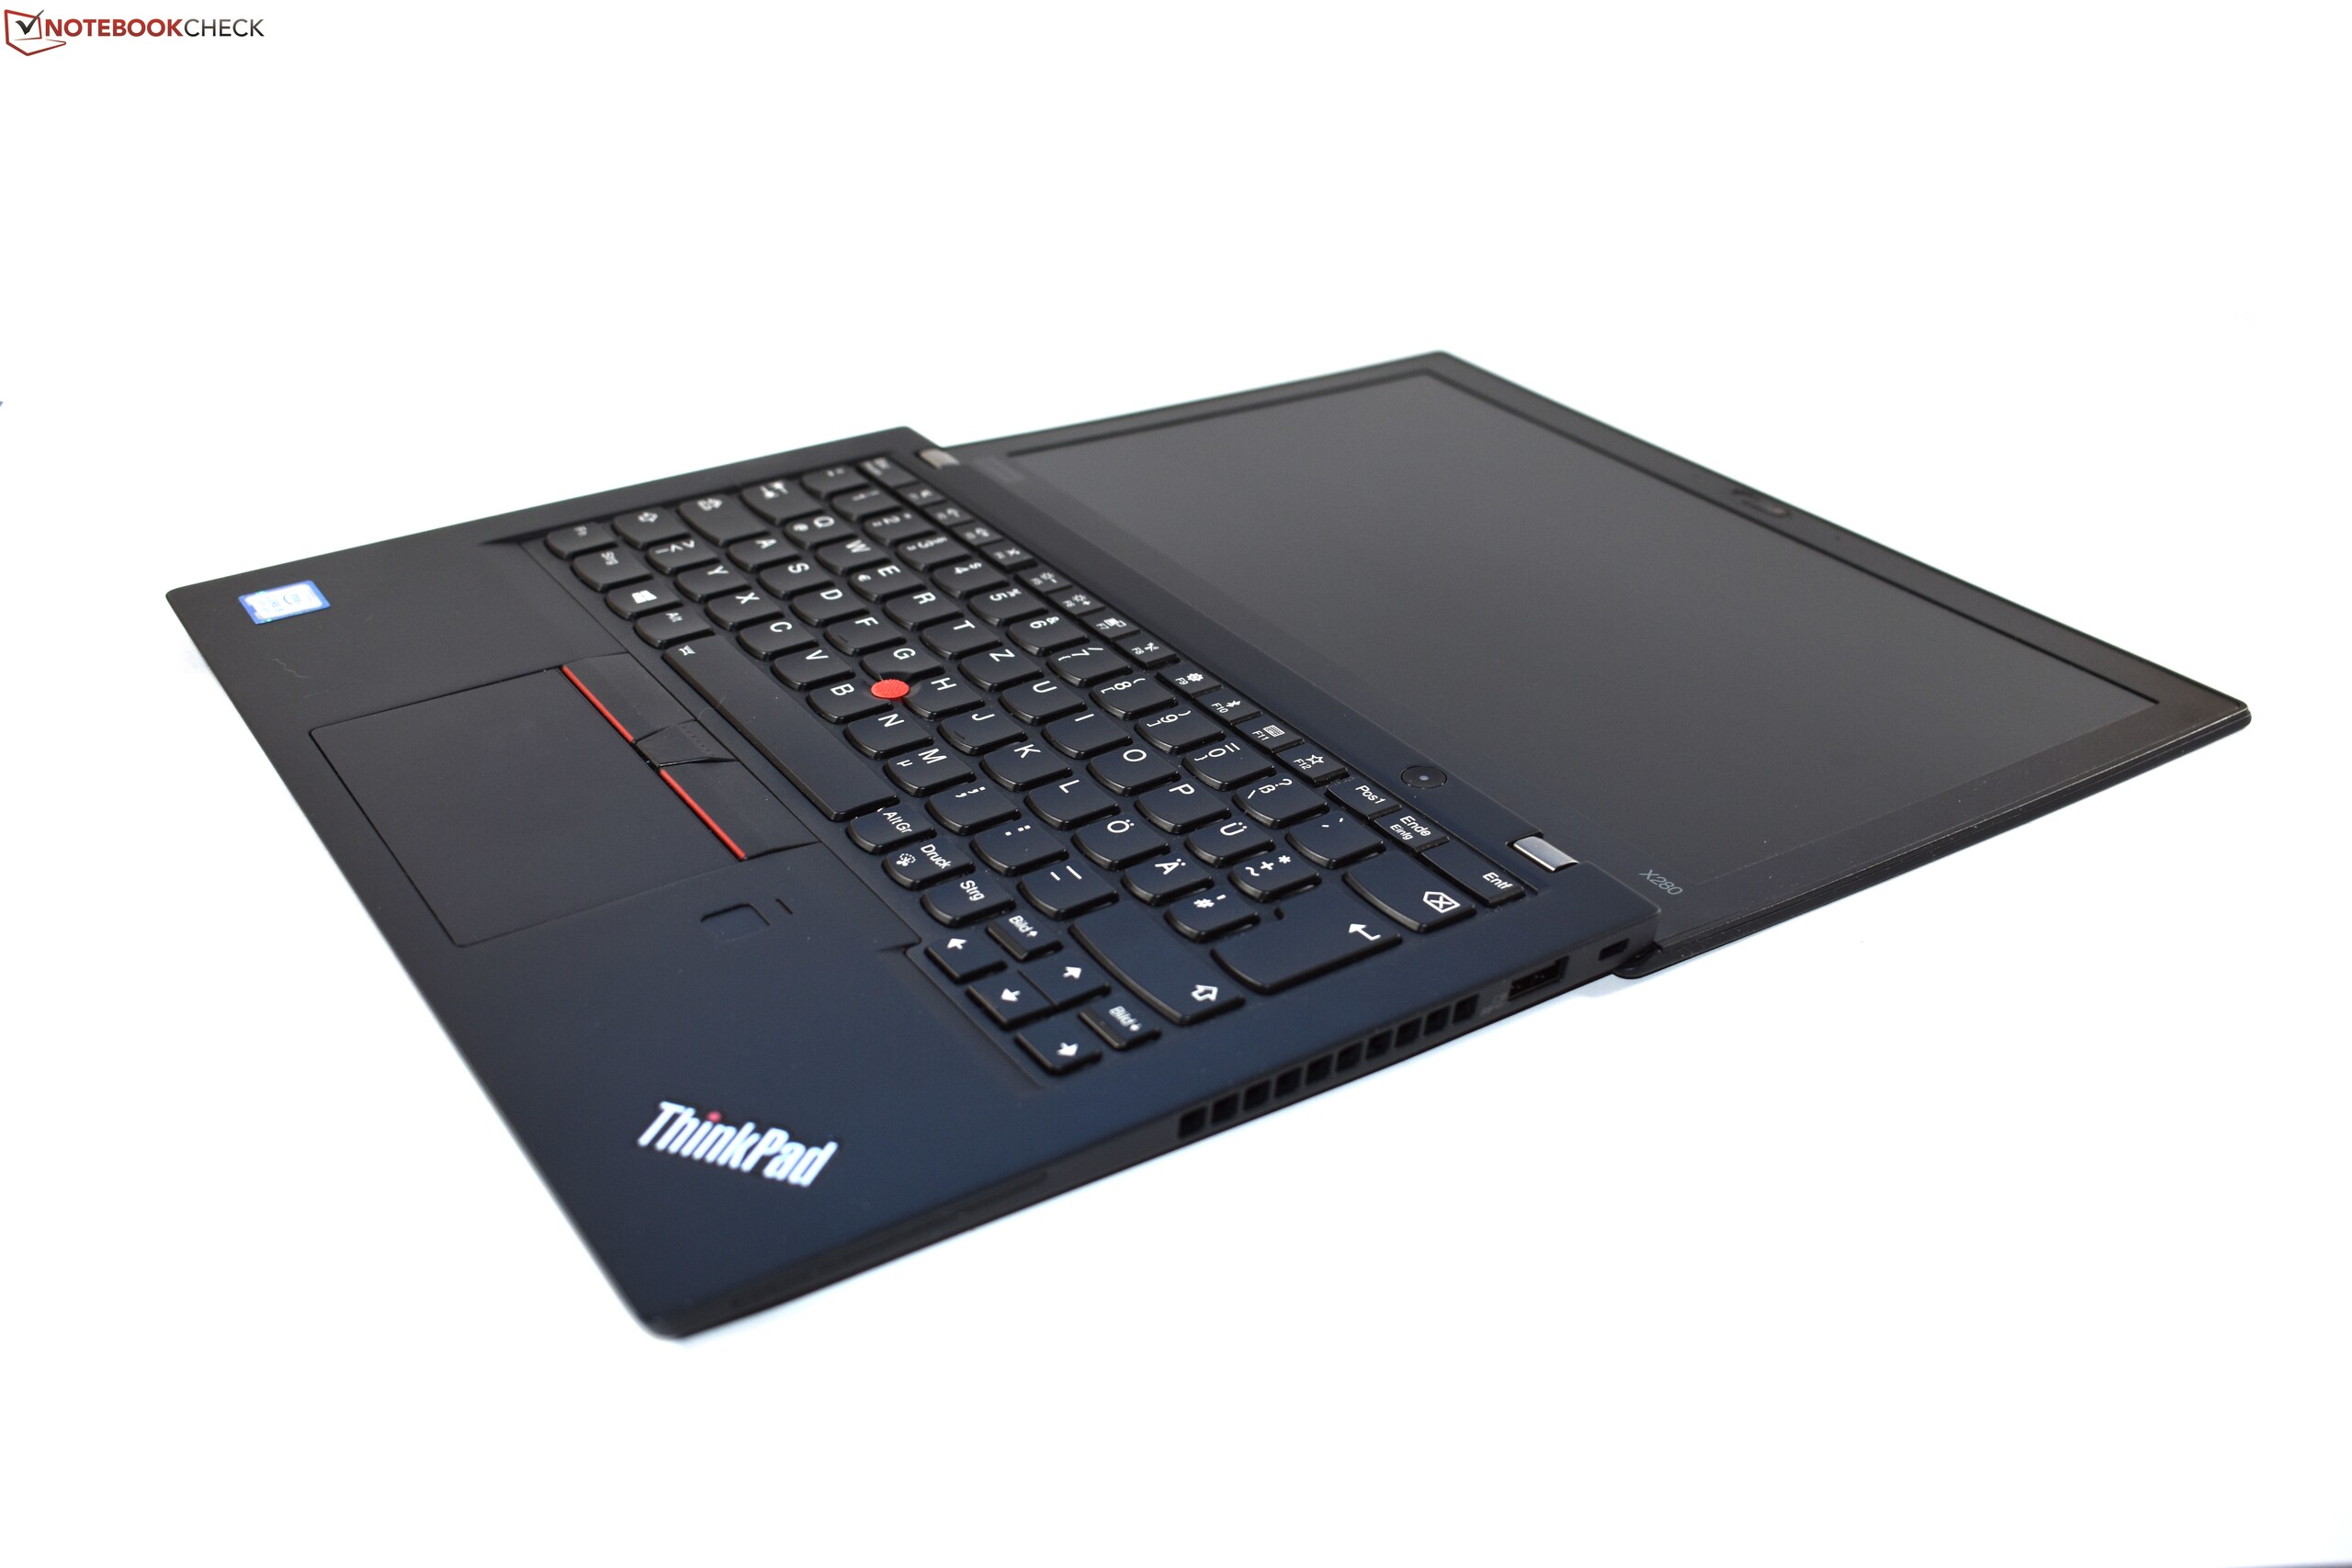
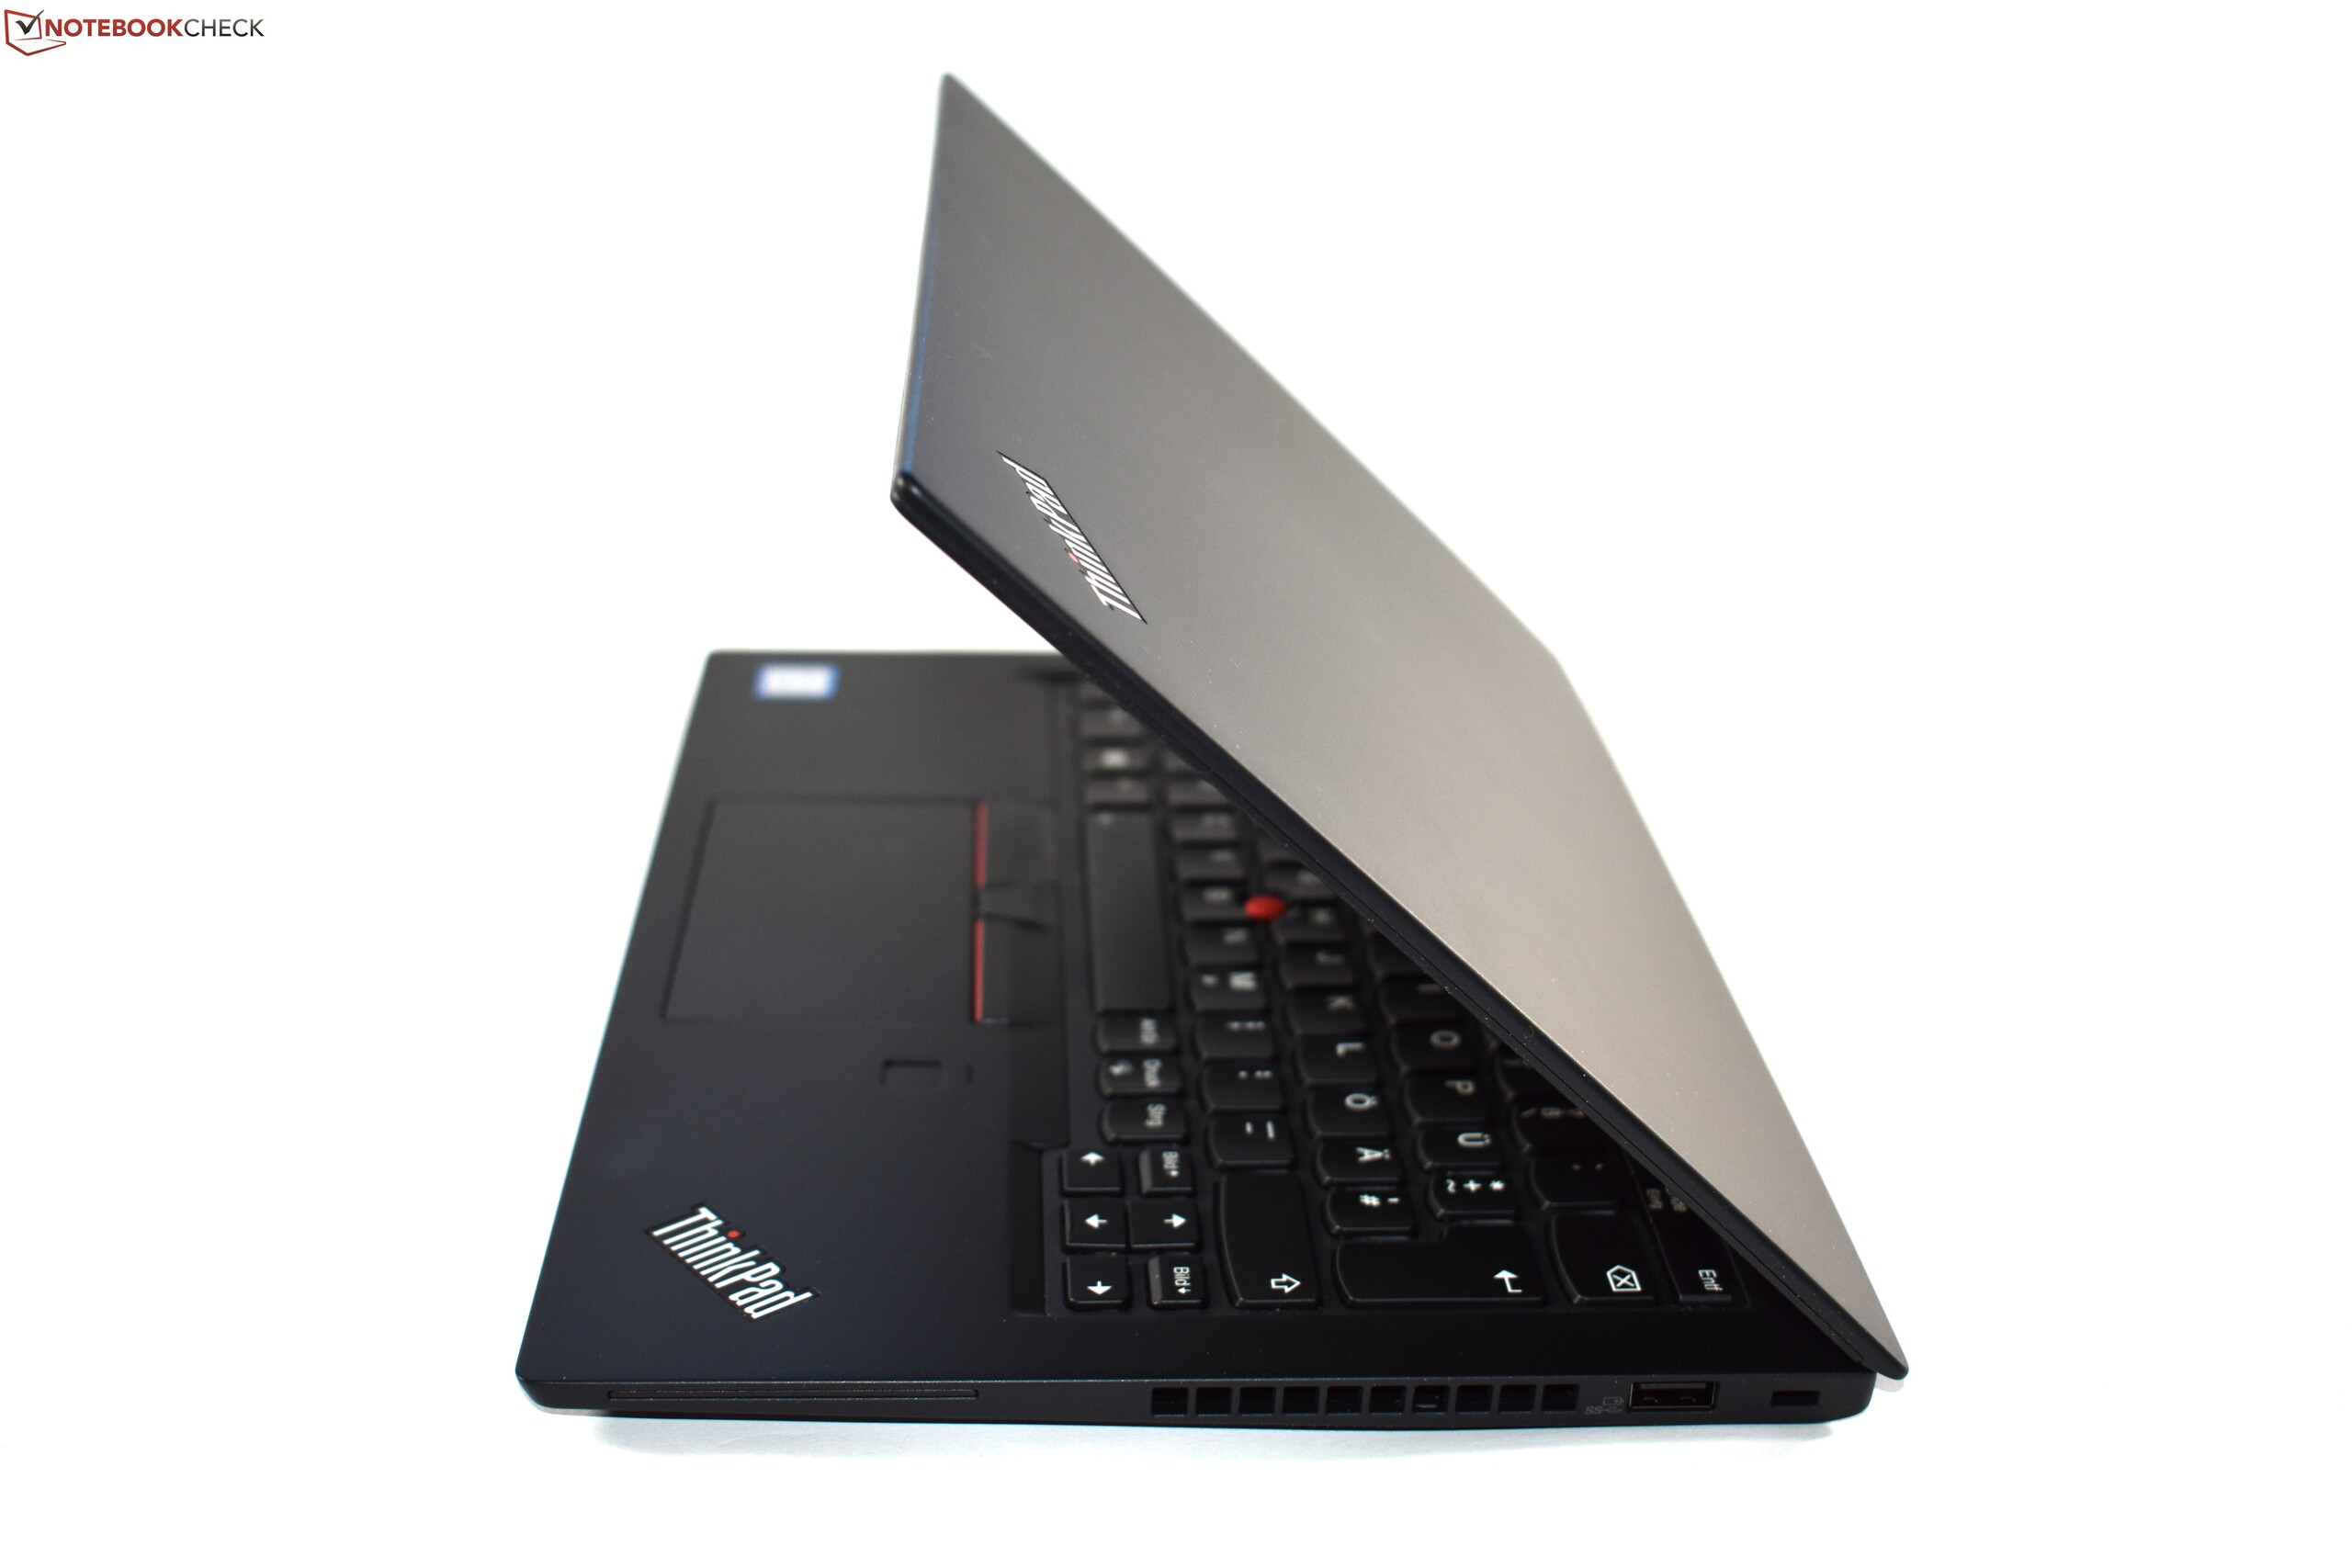
X280 belki de mevcut ThinkPadler arasında en kapsamlı yeni tasarıma sahip. Bu da bizi cihaz hakkında heyecanlandırıyor. ThinkPad X270 modeline göre oldukça farklı, ama eski modele göre de açıkca daha iyi.
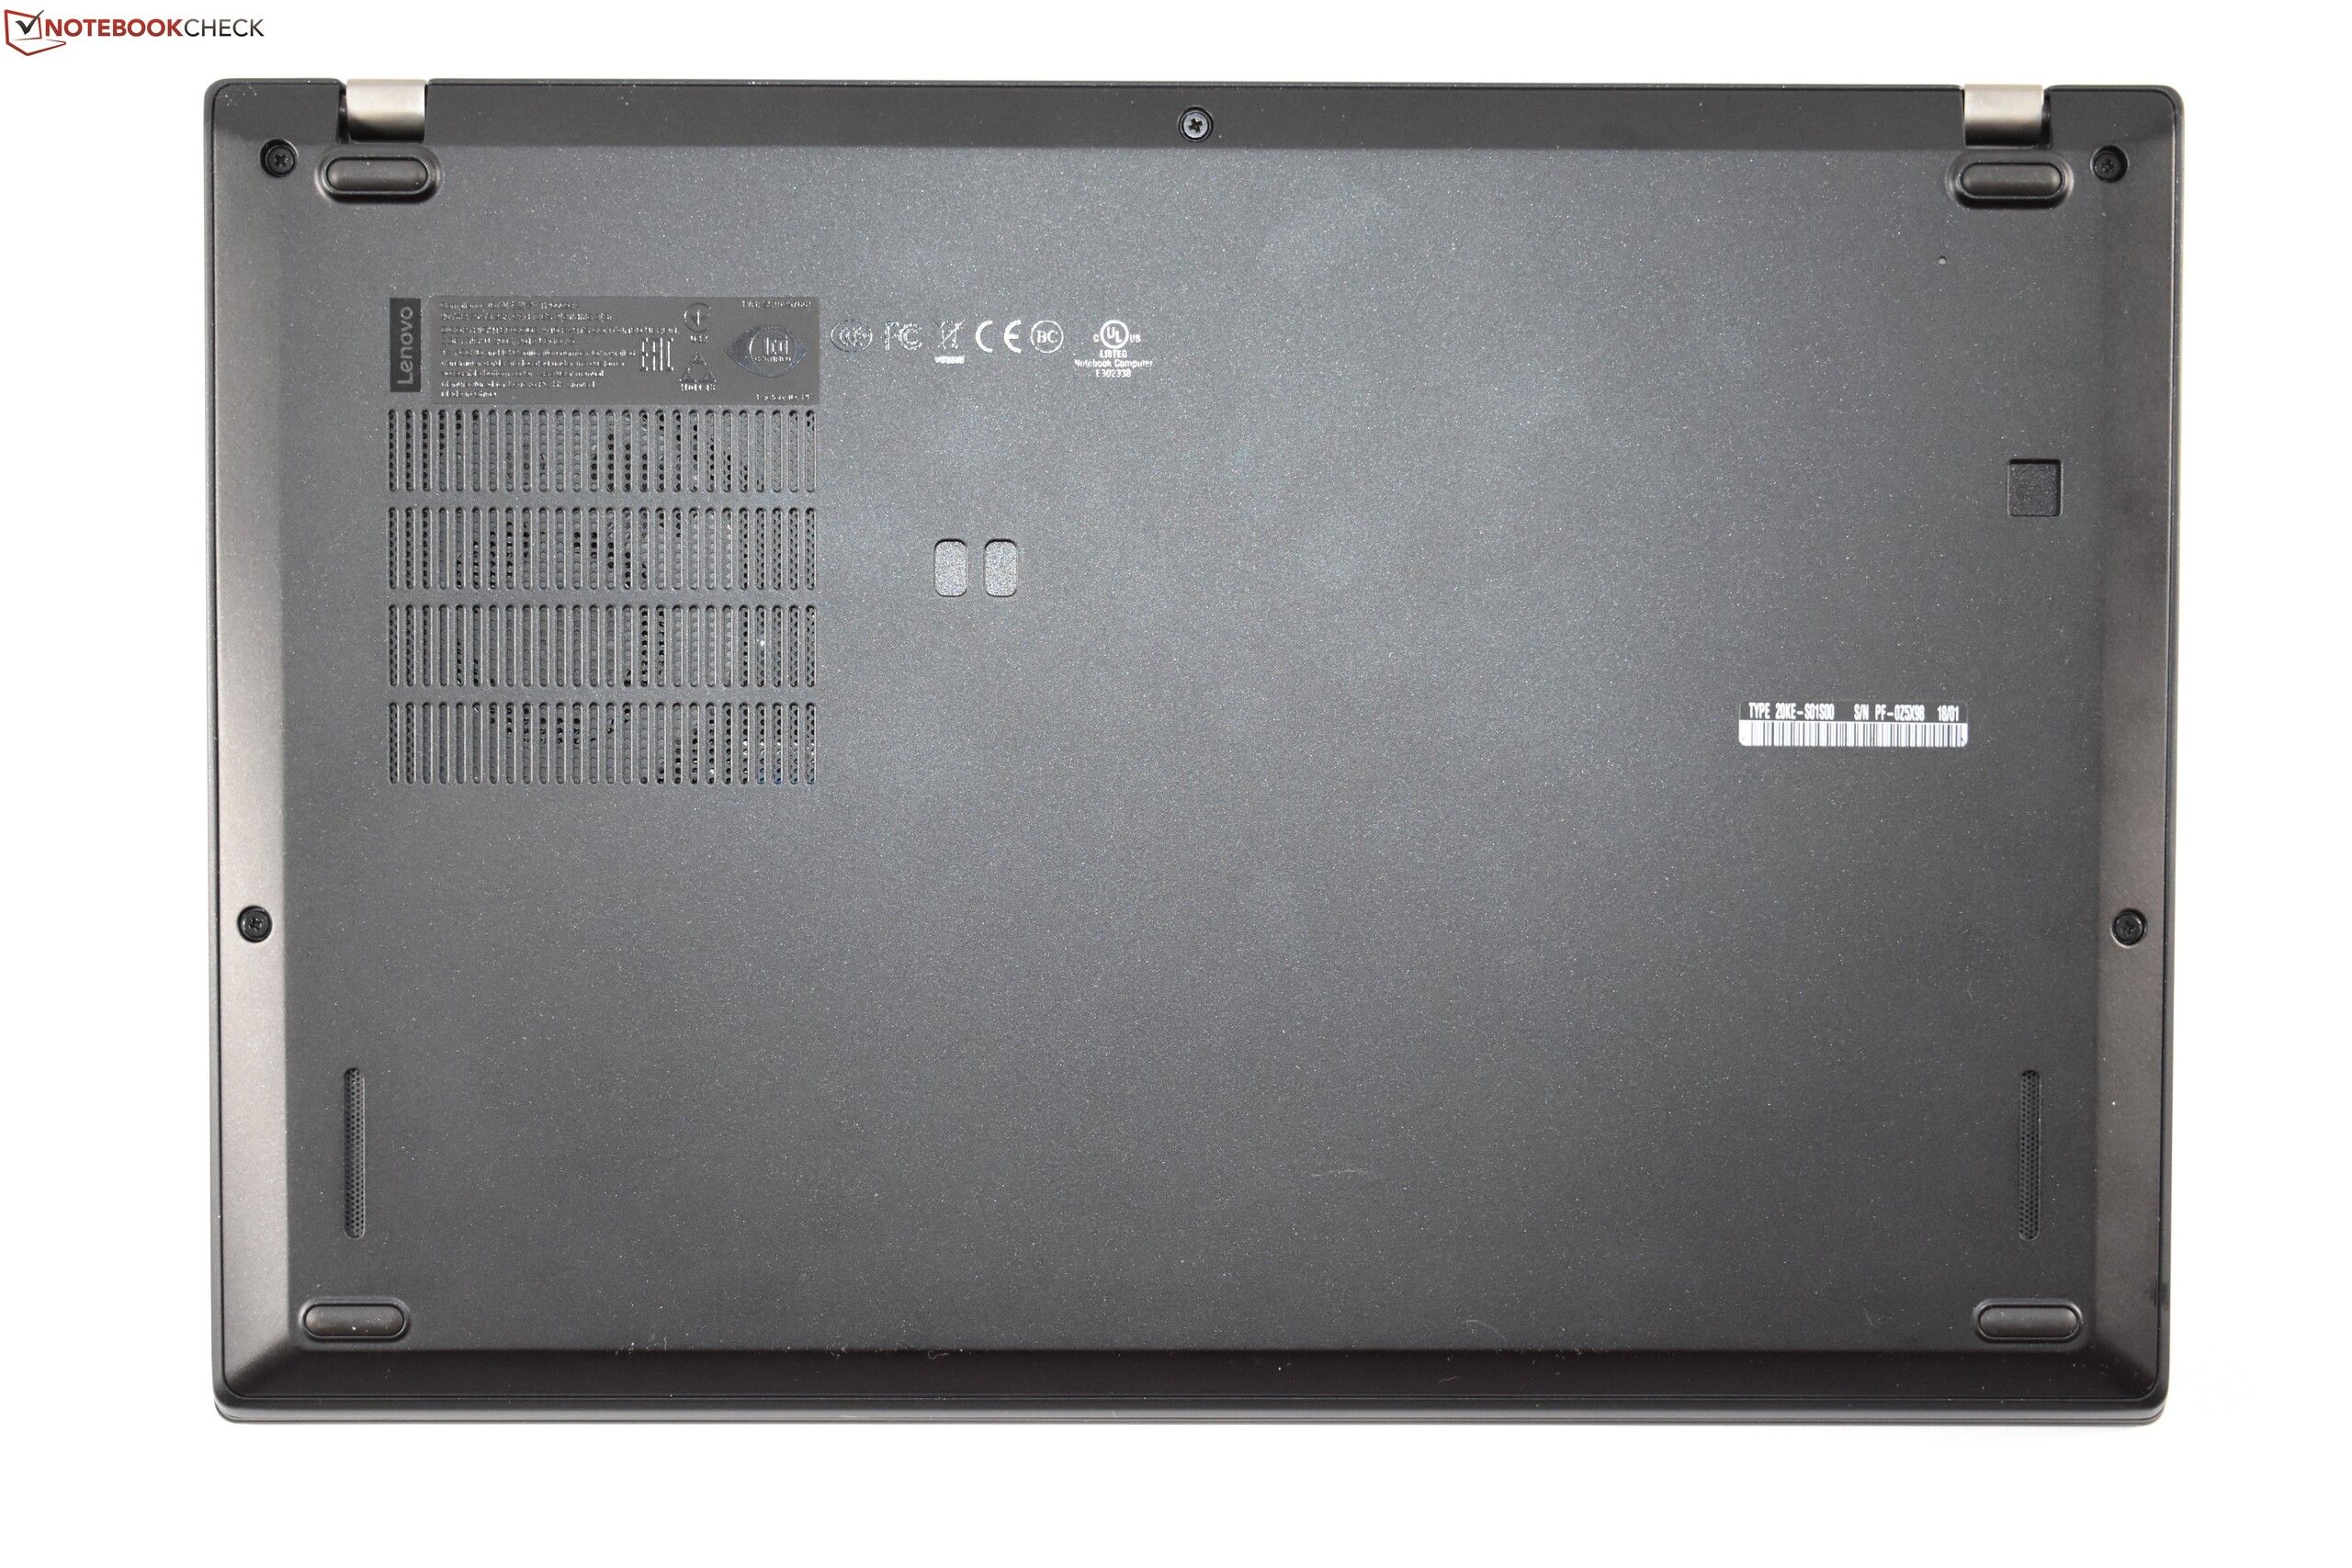
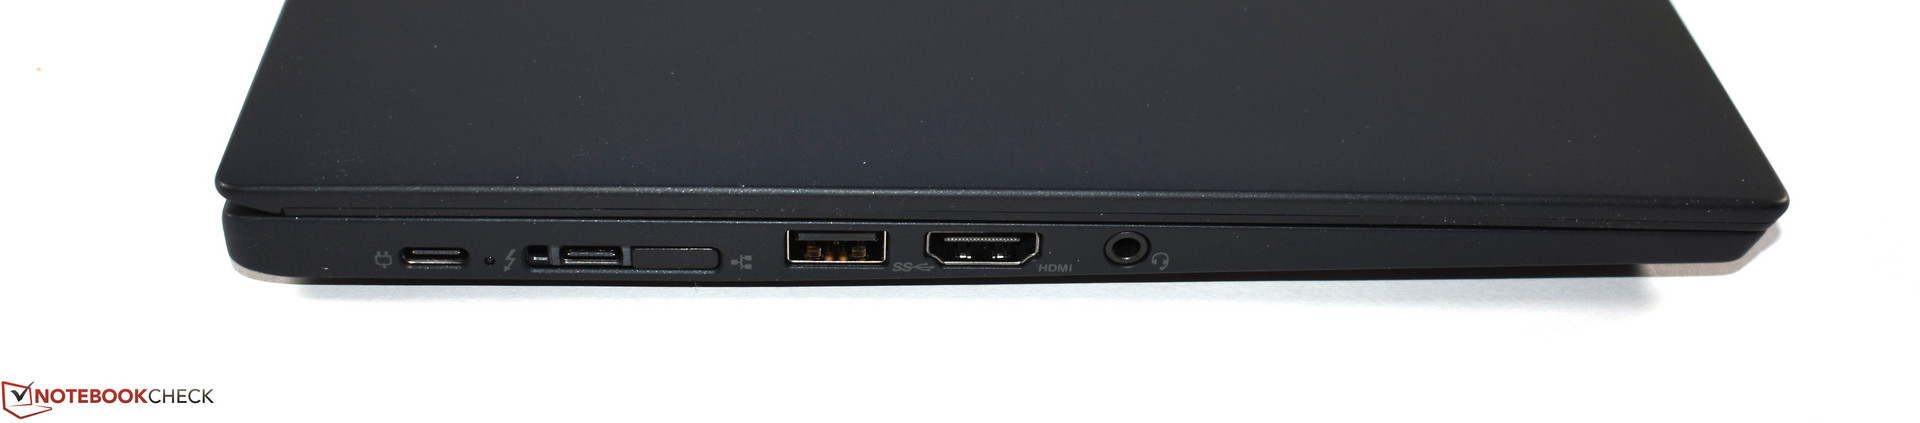
Yeni tasarımın en önemli noktası kasa. Eski modele göre oldukça ince. Magnezyum ve karbon fiber karışımı iyi çalışılmış ve bu sayede kalınlık ve ağırlık azalmış. X270 ise 12 inçlik bir cihaz olmasına karşın 14 inçlik benzerlerinden daha kalın ve ağırdı. Kasa sadece ince hafif değil aynı zamanda alt kısımda yer alan ve kolayca kırılan plastik tutucular da çıkarılmış. Fan daha az çalışıyor, cihaz daha sessiz, güç tüketimi dengelenmiş ve ekran daha parlak. X280, ThinkPad geleneğini harika arayüzler ile devam ettirerek Thunderbolt 3 desteğini de nihayet sunuyor. Eski modele göre çift kanallı bellek, grafik kartı performansı da daha iyi.
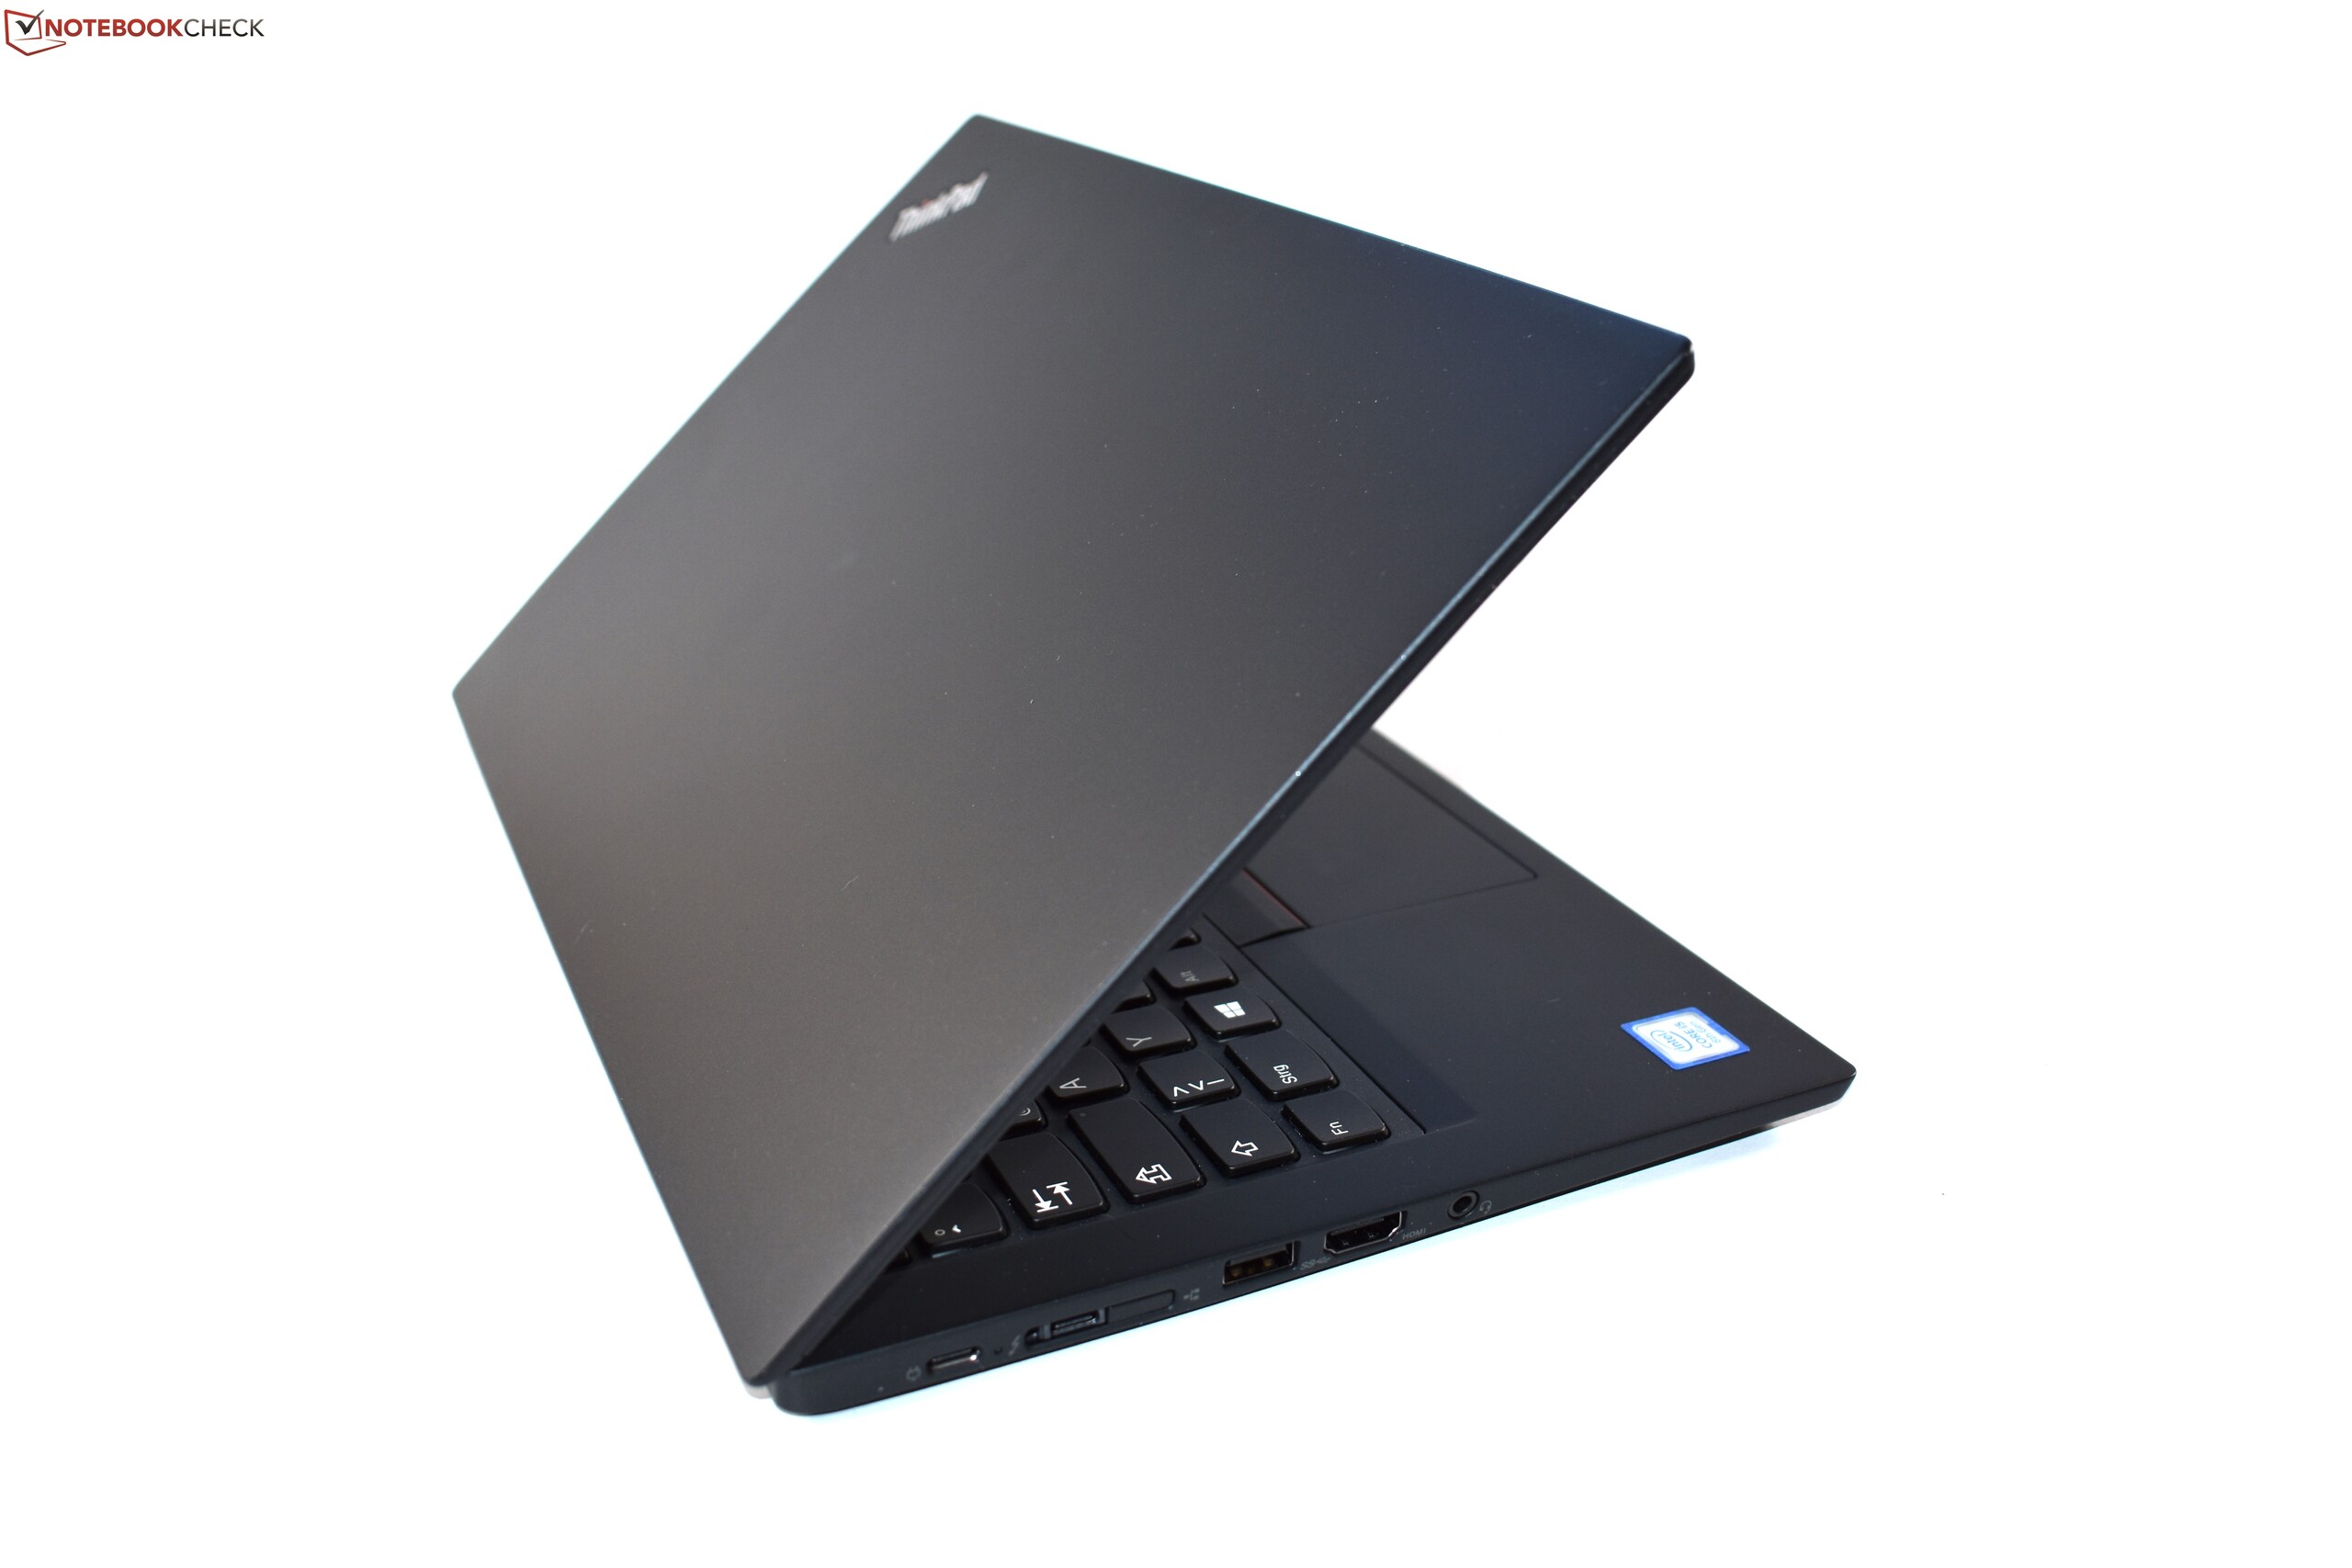
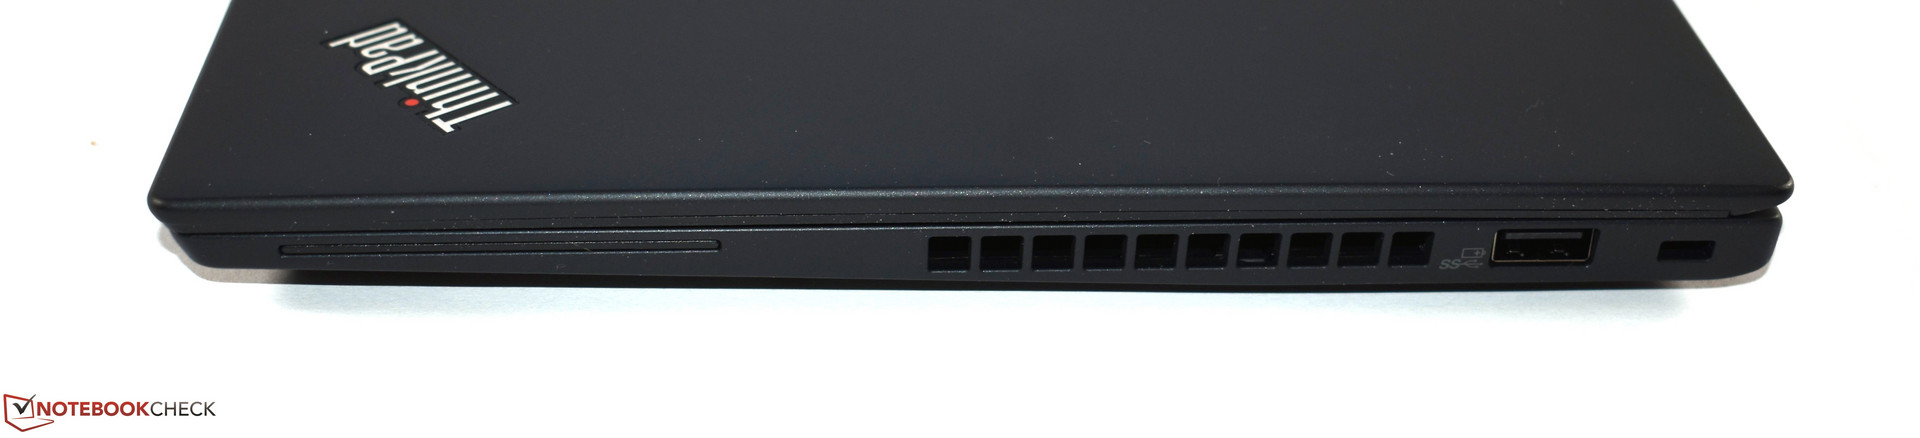
İyilerin yanında elbette kötü noktalar da var. Bunların başında batarya geliyor. Yeni model ile batarya değiştirilemiyor. RJ45 Ethernet portu çıkarılmış, bunun sebebini anlamak biraz zor. SD kart okuyucudan microSD okuyucuya geçilmiş. Yer tasarrufu için yapılan bir diğer çalışma da belleklerin anakarta lehimlenmesi olmuş. Bir diğer dezavantajda işlemci performansının sürdürülebilir olmayışı. Cihaz ışındığı zaman işlemci yavaşlamaya, sıcaklık değerleri normale geldiğinde tekrar hızlanmaya başlıyor. Bu bir BIOS güncellemesi ile düzeltilebilir belki, ancak henüz bu yönde bir açıklama yok. Bir diğer nokta da zayıf renk aralığı. Böylesi pahalı bir cihazdan daha iyisini her daim bekliyoruz. 13.3 inç bir ekranın sığabileceği yere 12 inçlik ekran koyulması da ayrı bir tercih.
Tüm bunlara karşın bu cihazı tavsiye ediyoruz. X280, X1 Carbon 2018 modeline kıyasla daha ucuz bir alternatif ve öğrenciler için bir tercih olabilir. Dell Latitude 7290, HP EliteBook 830 G5 diğer alternatifler. Bazı noktalarda rekabet daha iyi olabiliyorken, X280 daha iyi arayüzleri ve hafifliği ile bir adım önde. Her ne kadar cihazı önersek de, satın alma kararınızda kendi tercihlerinizi elbette daha ön planda tutmanız gerekir.
Lenovo ThinkPad X280-20KES01S00
- 03/02/2018 v6 (old)
Benjamin Herzig
Price comparison
