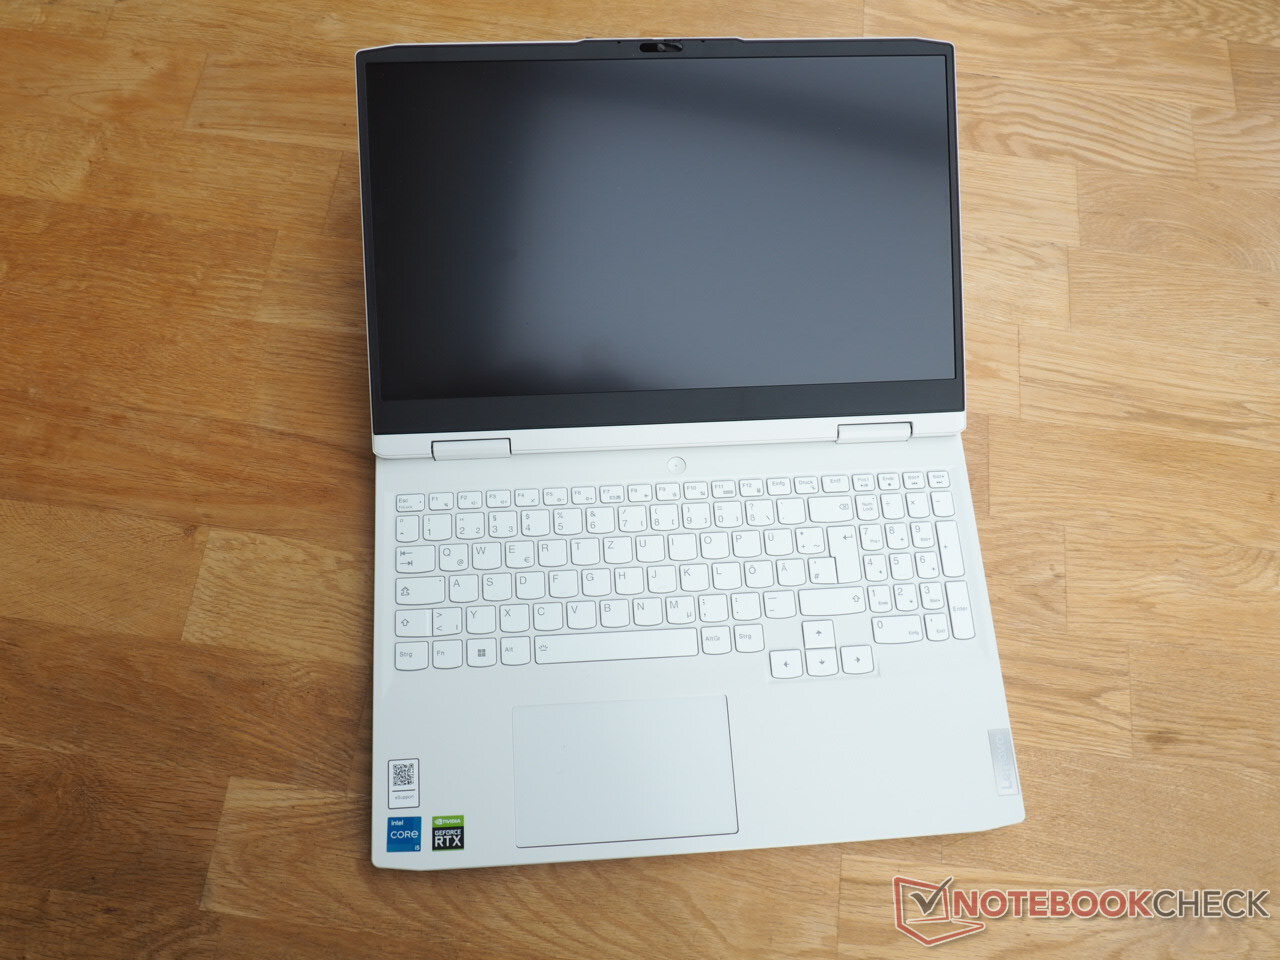
Lenovo IdeaPad Gaming 3 15IAH7 incelemesi: En güçlü RTX 3050 Ti dizüstü bilgisayarlardan biri

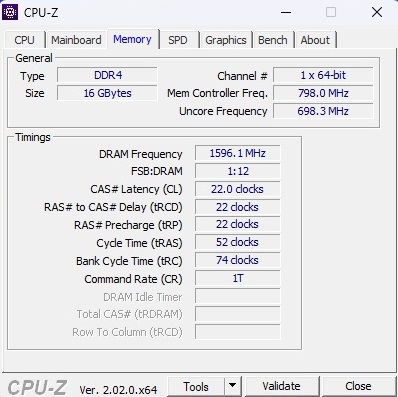
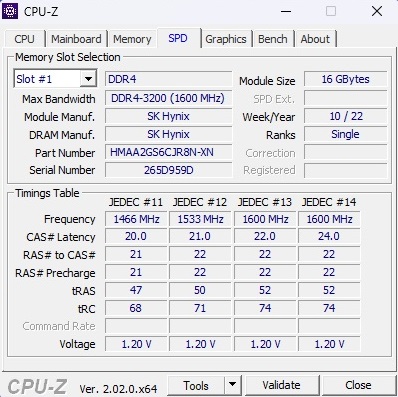
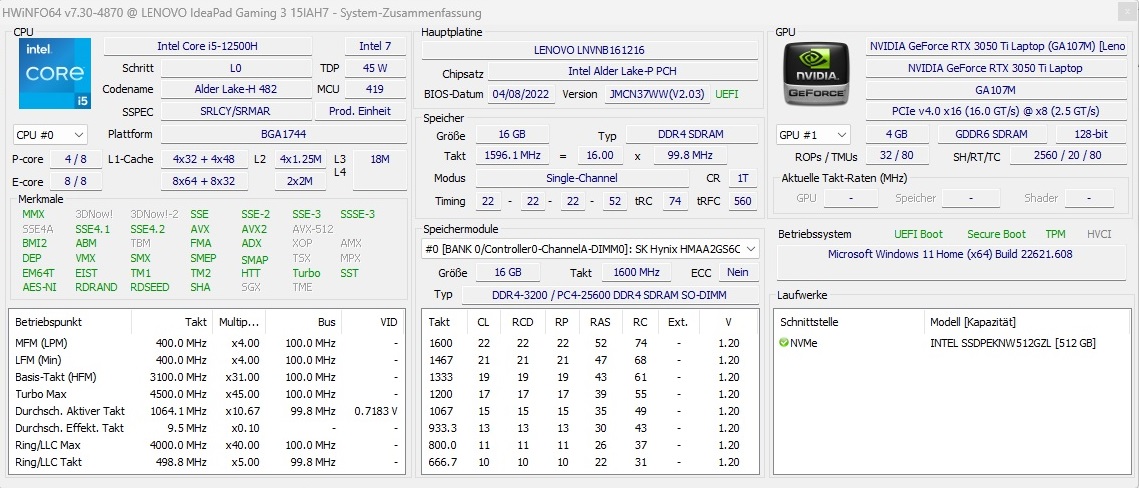
Çeşitli oyun dizüstü bilgisayarları 1.000 Euro (~ 978 $) civarında bir fiyat aralığında mevcut olsa da, bunların çoğu iyi bir parlaklığa ve düz renk alanı kapsamına sahip bir ekrandan vazgeçiyor. Ancak zaman zaman Core i5-12500H, GeForce RTX 3050 Ti, 16 GB of DDR4 RAM (maalesef yalnızca tek kanal modunda) sunan test ettiğimiz IdeaPad Gaming 3 15IAH7 gibi olumlu bir istisna bulabiliriz. ve 512 GB NVMe SSD. 15,6 inç IPS ekran 165 Hz yenileme hızına sahip olup, iyi tepki süreleri vaat ediyor ve 1920 x 1080 piksel çözünürlüğe sahip.
IdeaPad Gaming 3 15IAH7'nin rakipleri arasında HP Victus 16-e0145ng, Dell G15 5515, ve Dell Inspiron 16 Plus 7620 gibi RTX 3050 Ti'ye sahip diğer dizüstü bilgisayarlar yer alıyor. Ayrıca 15ARH7 kardeş modelini (Ryzen 5 6600H & RTX 3050) karşılaştırma aracı olarak tablolarımıza dahil ediyoruz.
Karşılaştırmada muhtemel rakipleri
Derece | Tarih | Model | Ağırlık | Yükseklik | Boyut | Çözünürlük | En iyi fiyat |
|---|---|---|---|---|---|---|---|
| 82.8 % v7 (old) | 11/2022 | Lenovo IdeaPad Gaming 3 15IAH7 i5-12500H, GeForce RTX 3050 Ti Laptop GPU | 2.4 kg | 26 mm | 15.60" | 1920x1080 | |
| 80.8 % v7 (old) | 09/2022 | Lenovo IdeaPad Gaming 3 15ARH7 R5 6600H, GeForce RTX 3050 4GB Laptop GPU | 2.4 kg | 21.8 mm | 15.60" | 1920x1080 | |
| 82.7 % v7 (old) | 11/2021 | Dell G15 5515 R7 5800H, GeForce RTX 3050 Ti Laptop GPU | 2.4 kg | 24.9 mm | 15.60" | 1920x1080 | |
| 82.3 % v7 (old) | 09/2023 | HP Victus 16-e0145ng R5 5600H, GeForce RTX 3050 Ti Laptop GPU | 2.4 kg | 23.5 mm | 16.10" | 1920x1080 | |
| 87.4 % v7 (old) | 09/2022 | Dell Inspiron 16 Plus 7620 i7-12700H, GeForce RTX 3050 Ti Laptop GPU | 2.1 kg | 18.99 mm | 16.00" | 3072x1920 |
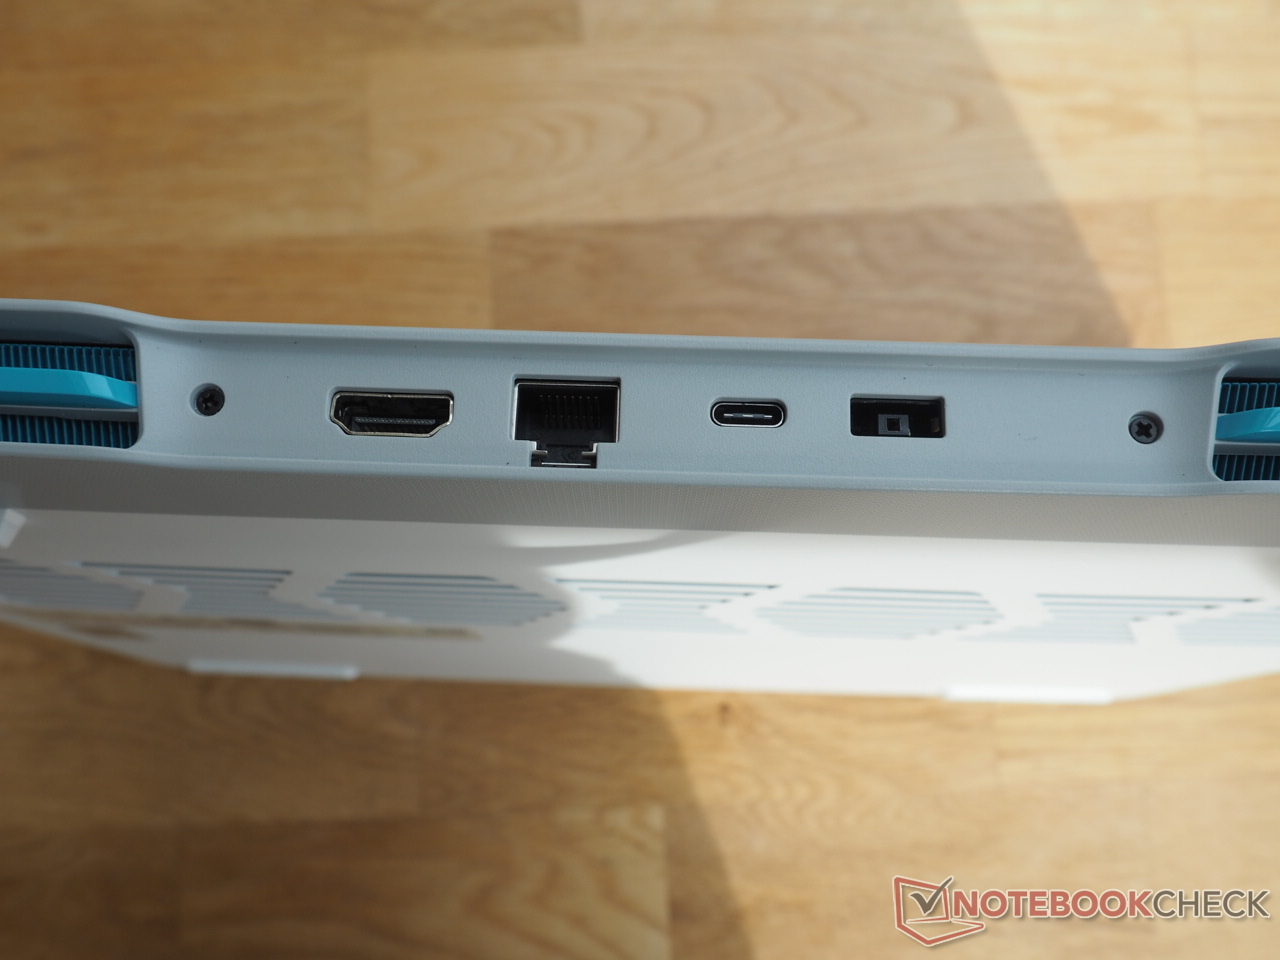
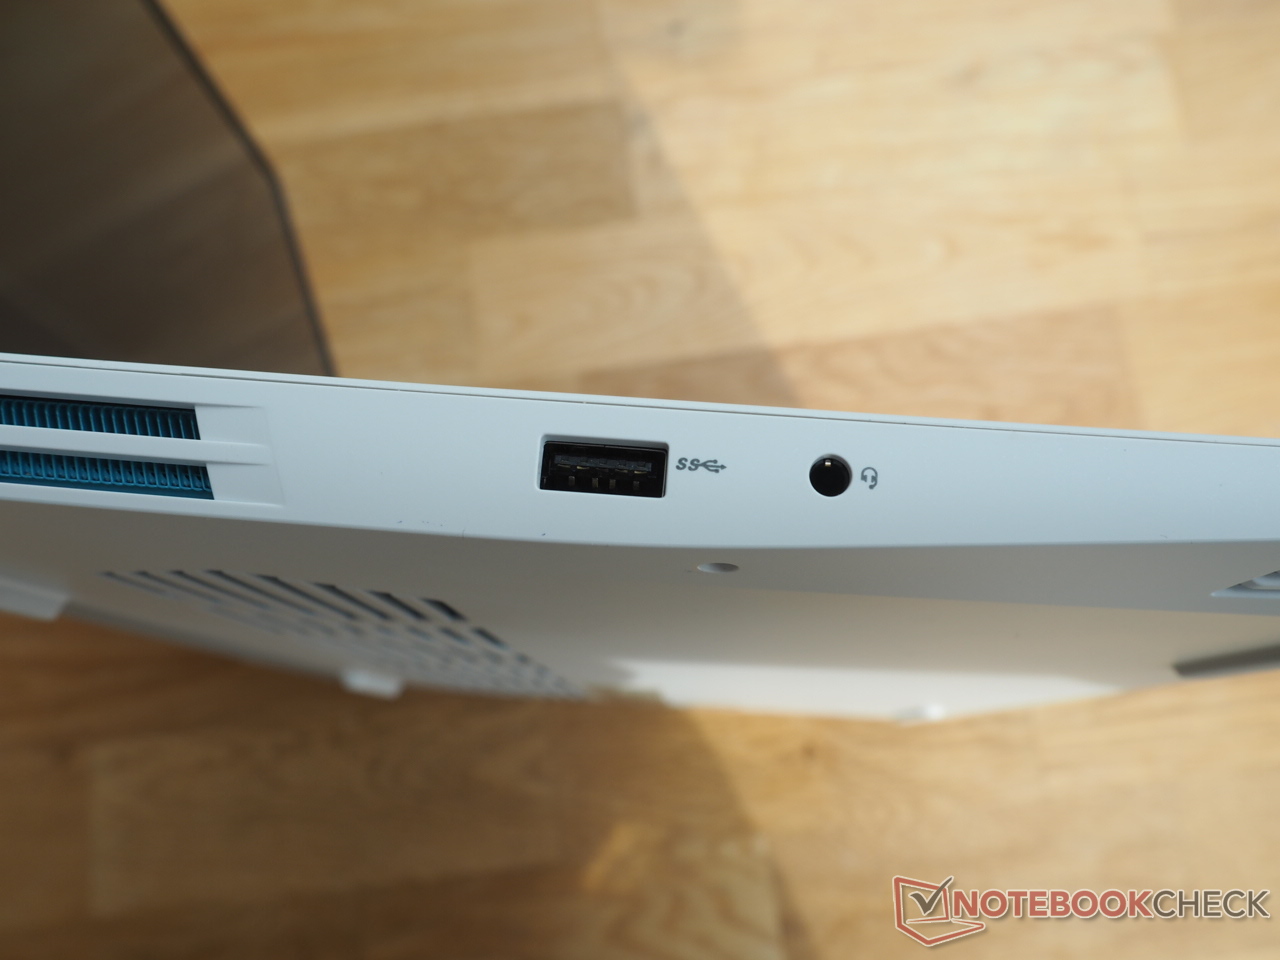
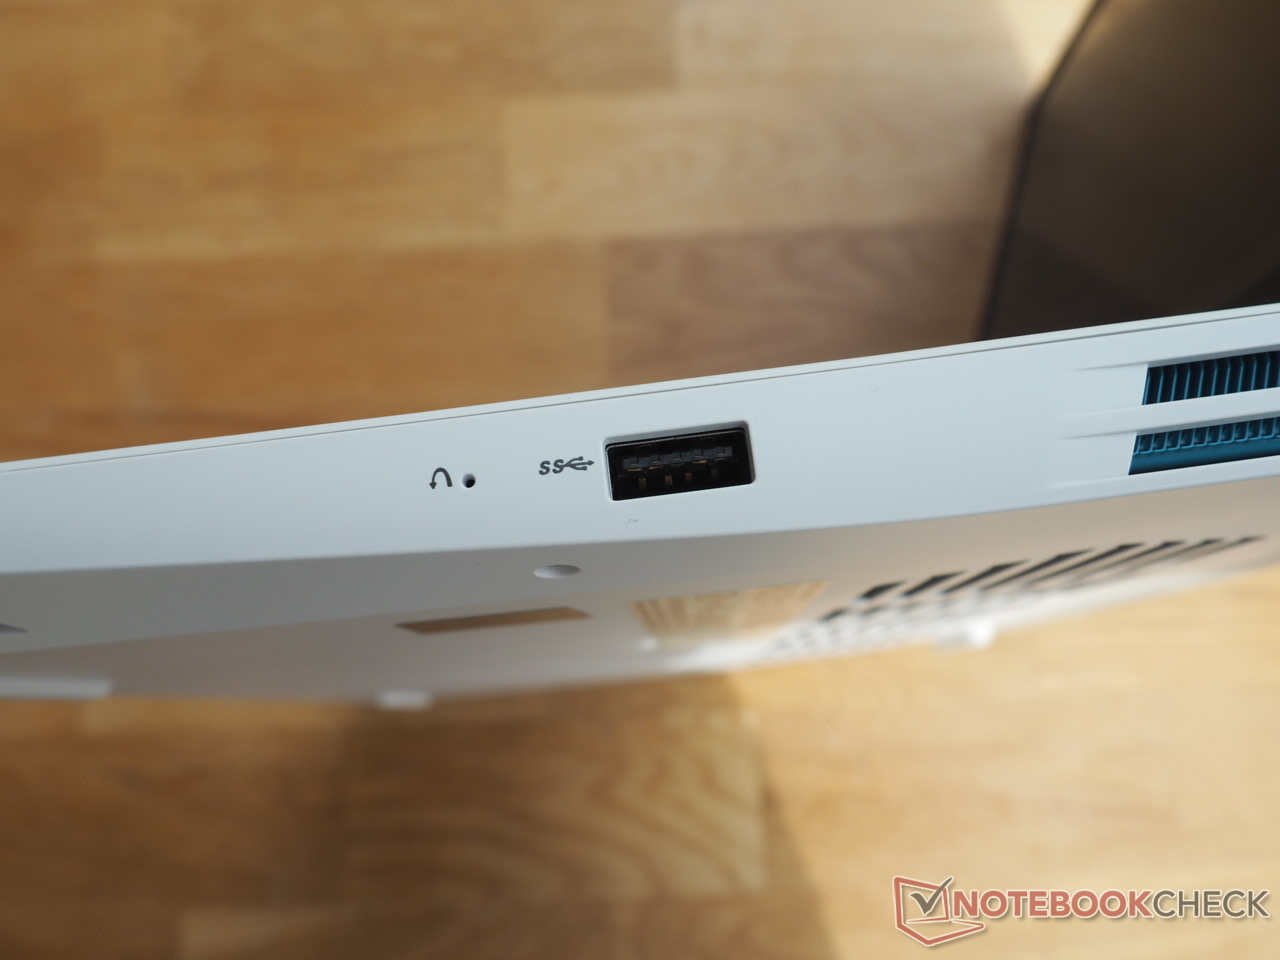
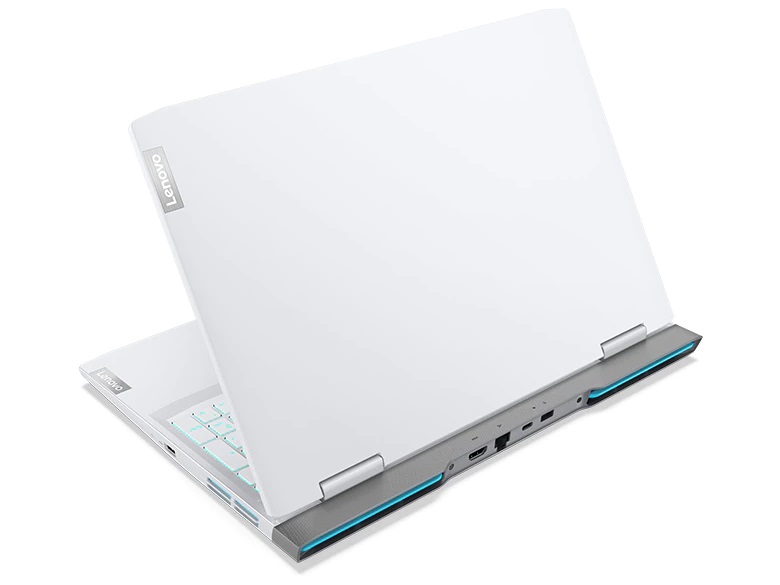
Renk (Onyx Grey yerine Buzul Beyazı) ve klavye düzeni (ABD yerine Almanca) dışında, kasa yukarıda listelenen kardeş modelle aynı olduğundan, kasa, ekipman ve giriş cihazlarını burada daha fazla tartışmayacağız. İlgili bilgileri kardeş modelin incelemesinde bulabilirsiniz.
| Networking - iperf3 receive AXE11000 | |
| Sınıf ortalaması Gaming (680 - 1745, n=95, son 2 yıl) | |
| Lenovo IdeaPad Gaming 3 15IAH7 | |
| Ortalama Realtek RTL8852BE (455 - 985, n=71) | |
| HP Victus 16-e0145ng | |
| Lenovo IdeaPad Gaming 3 15ARH7 | |
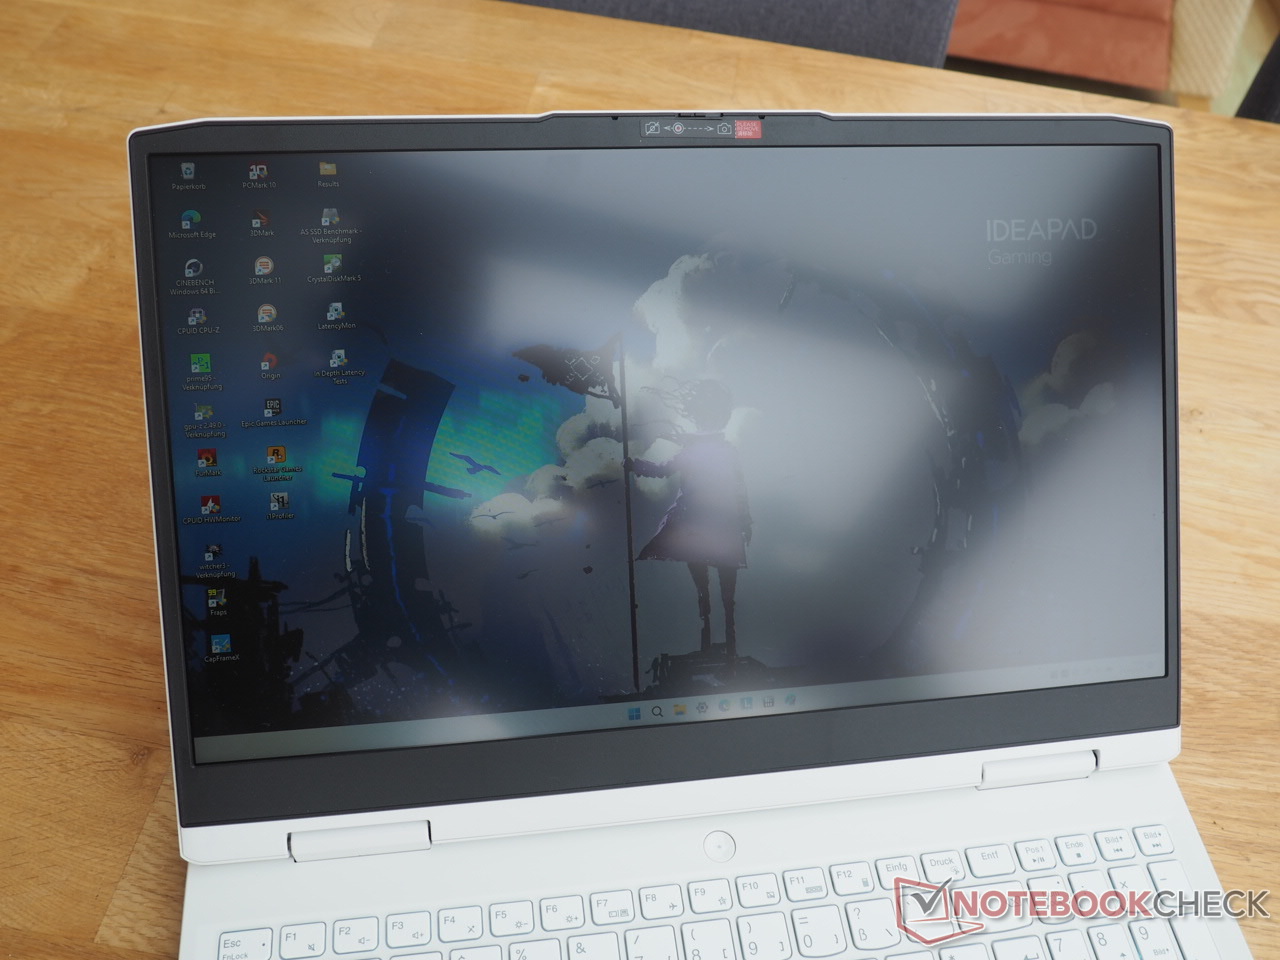
Kamerası


Ekran
Karşılaştırma alanına baktığınızda, uygun fiyatlı oyun dizüstü bilgisayarlarının genellikle yetersiz bir ekrana sahip olduğunu kolayca görebilirsiniz.
| |||||||||||||||||||||||||
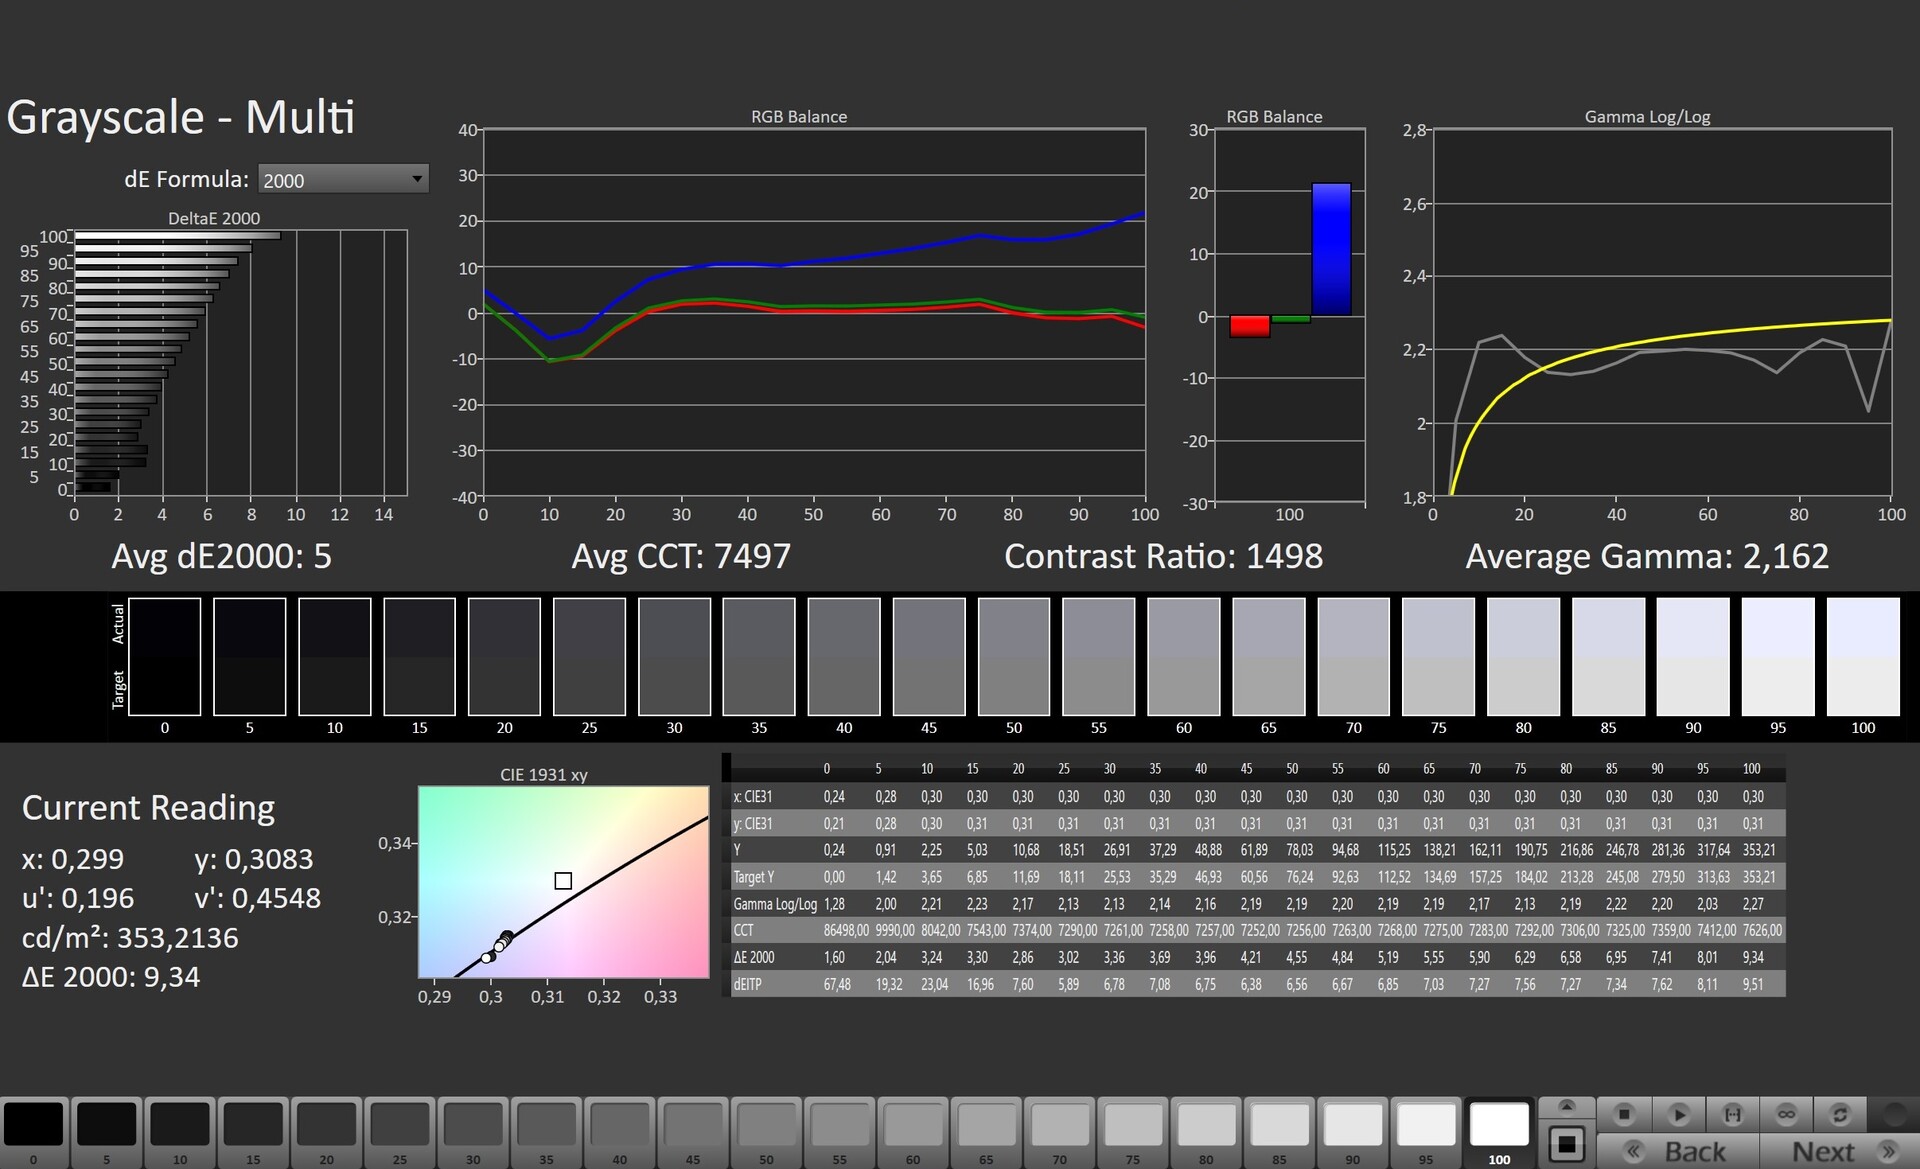
Aydınlatma: 92 %
Batarya modunda parlaklık: 338 cd/m²
Kontrast: 1252:1 (Siyah: 0.27 cd/m²)
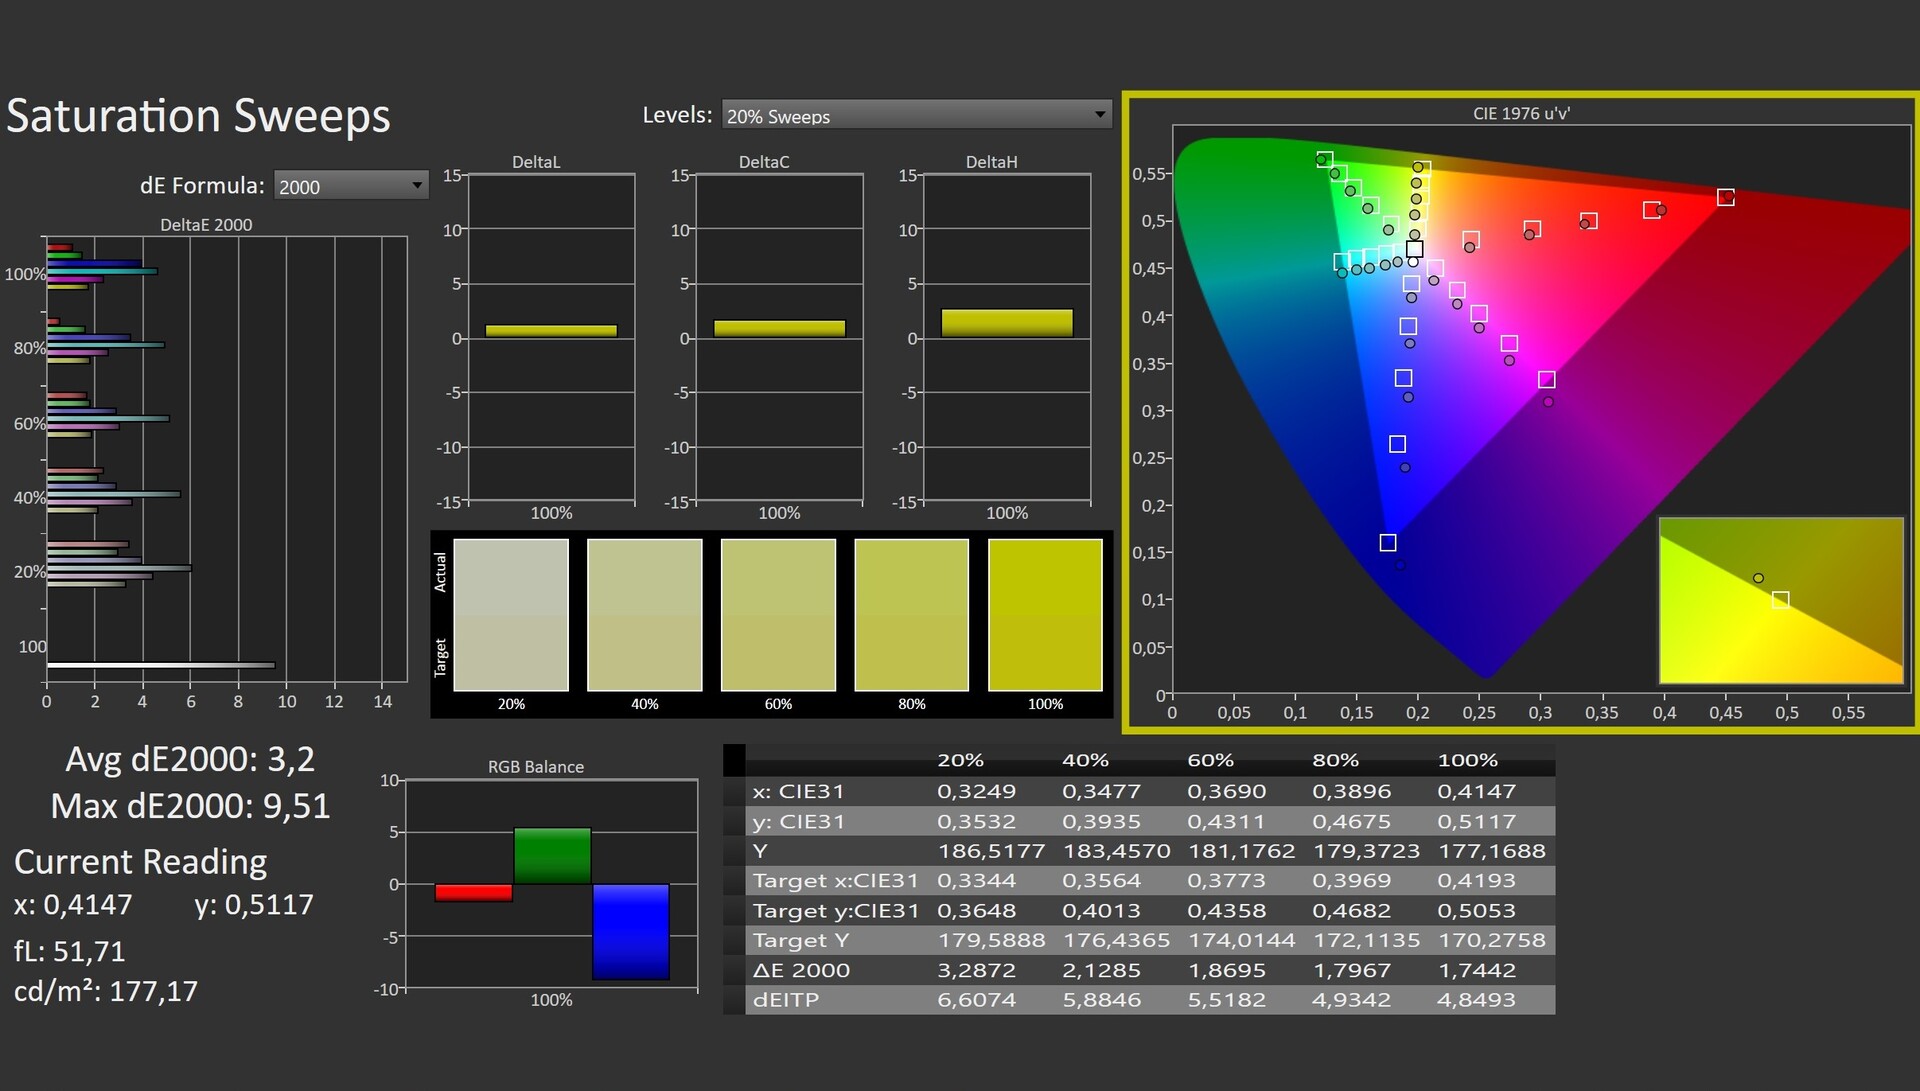
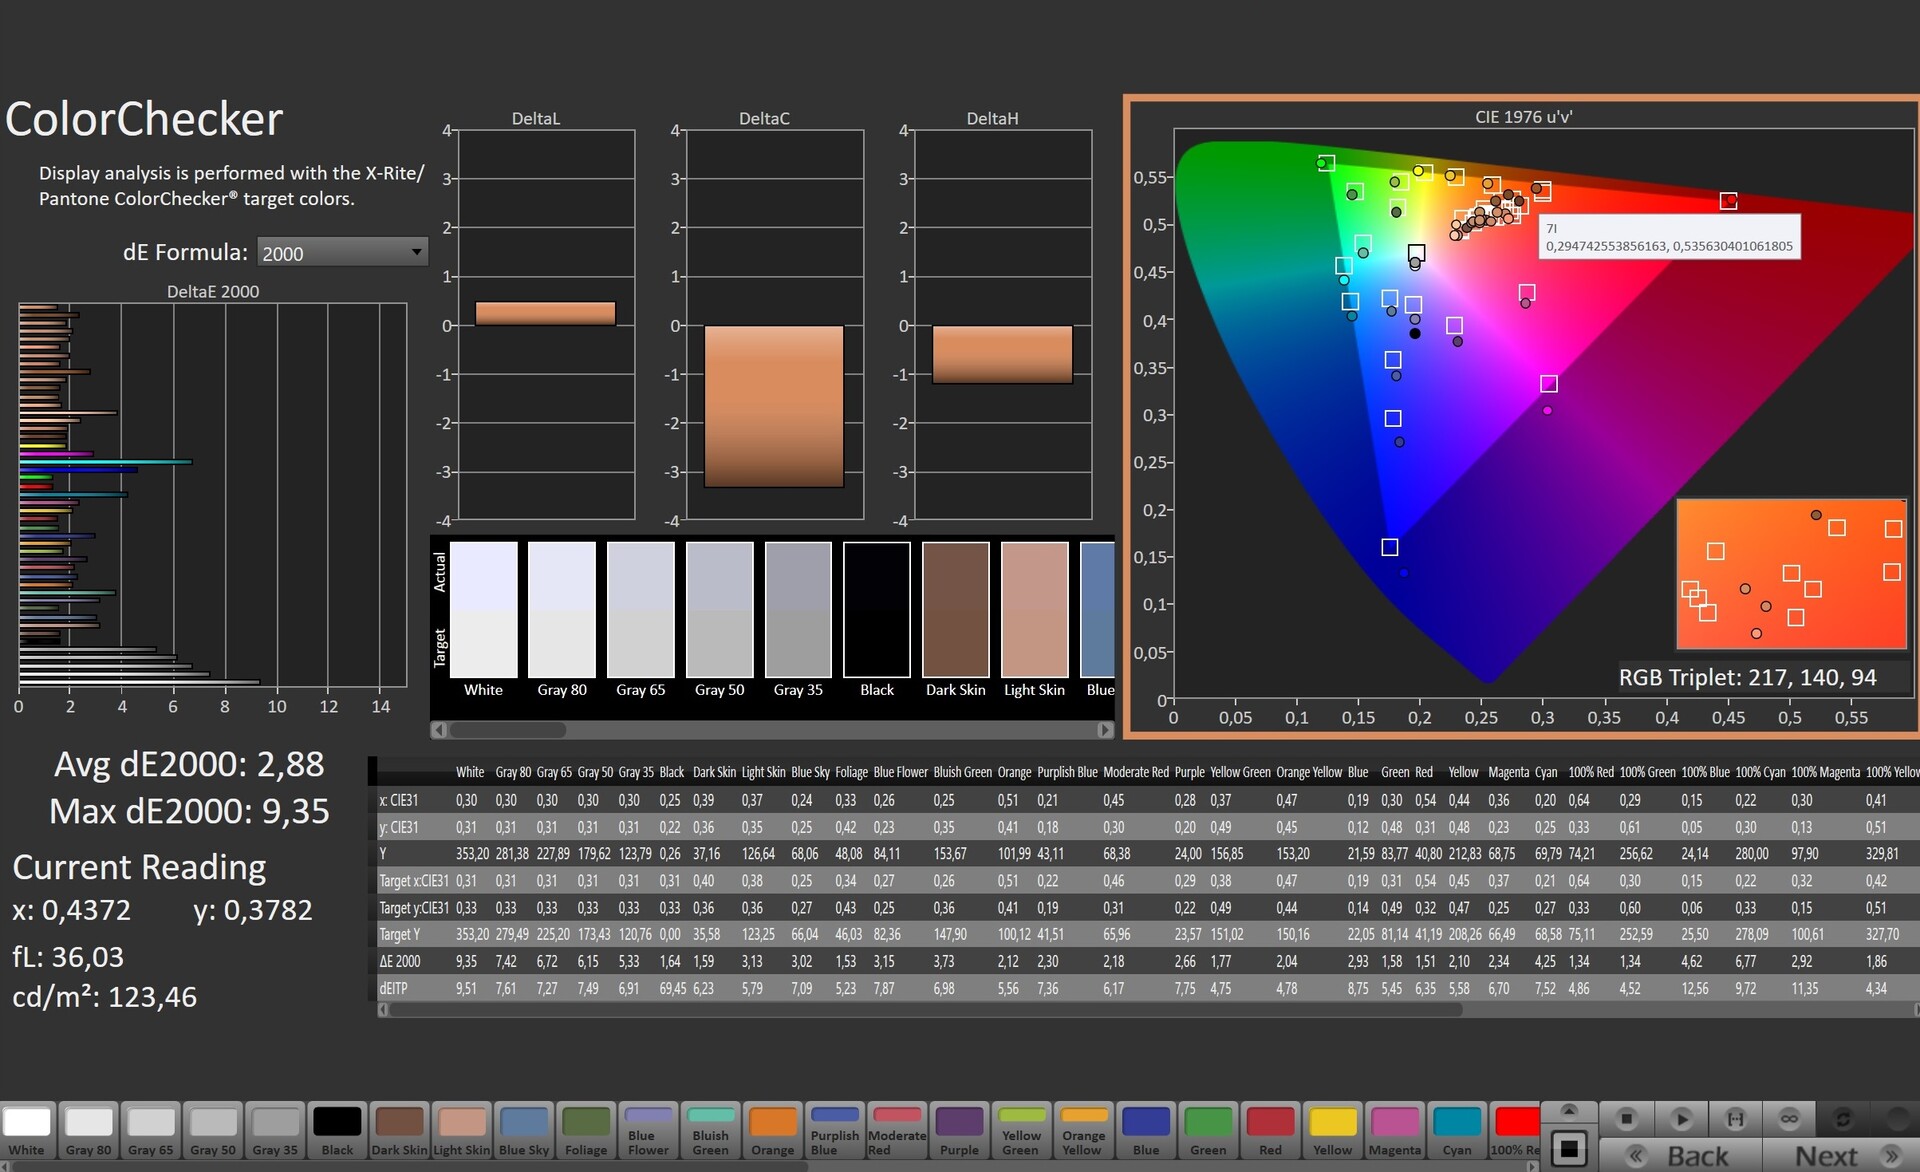
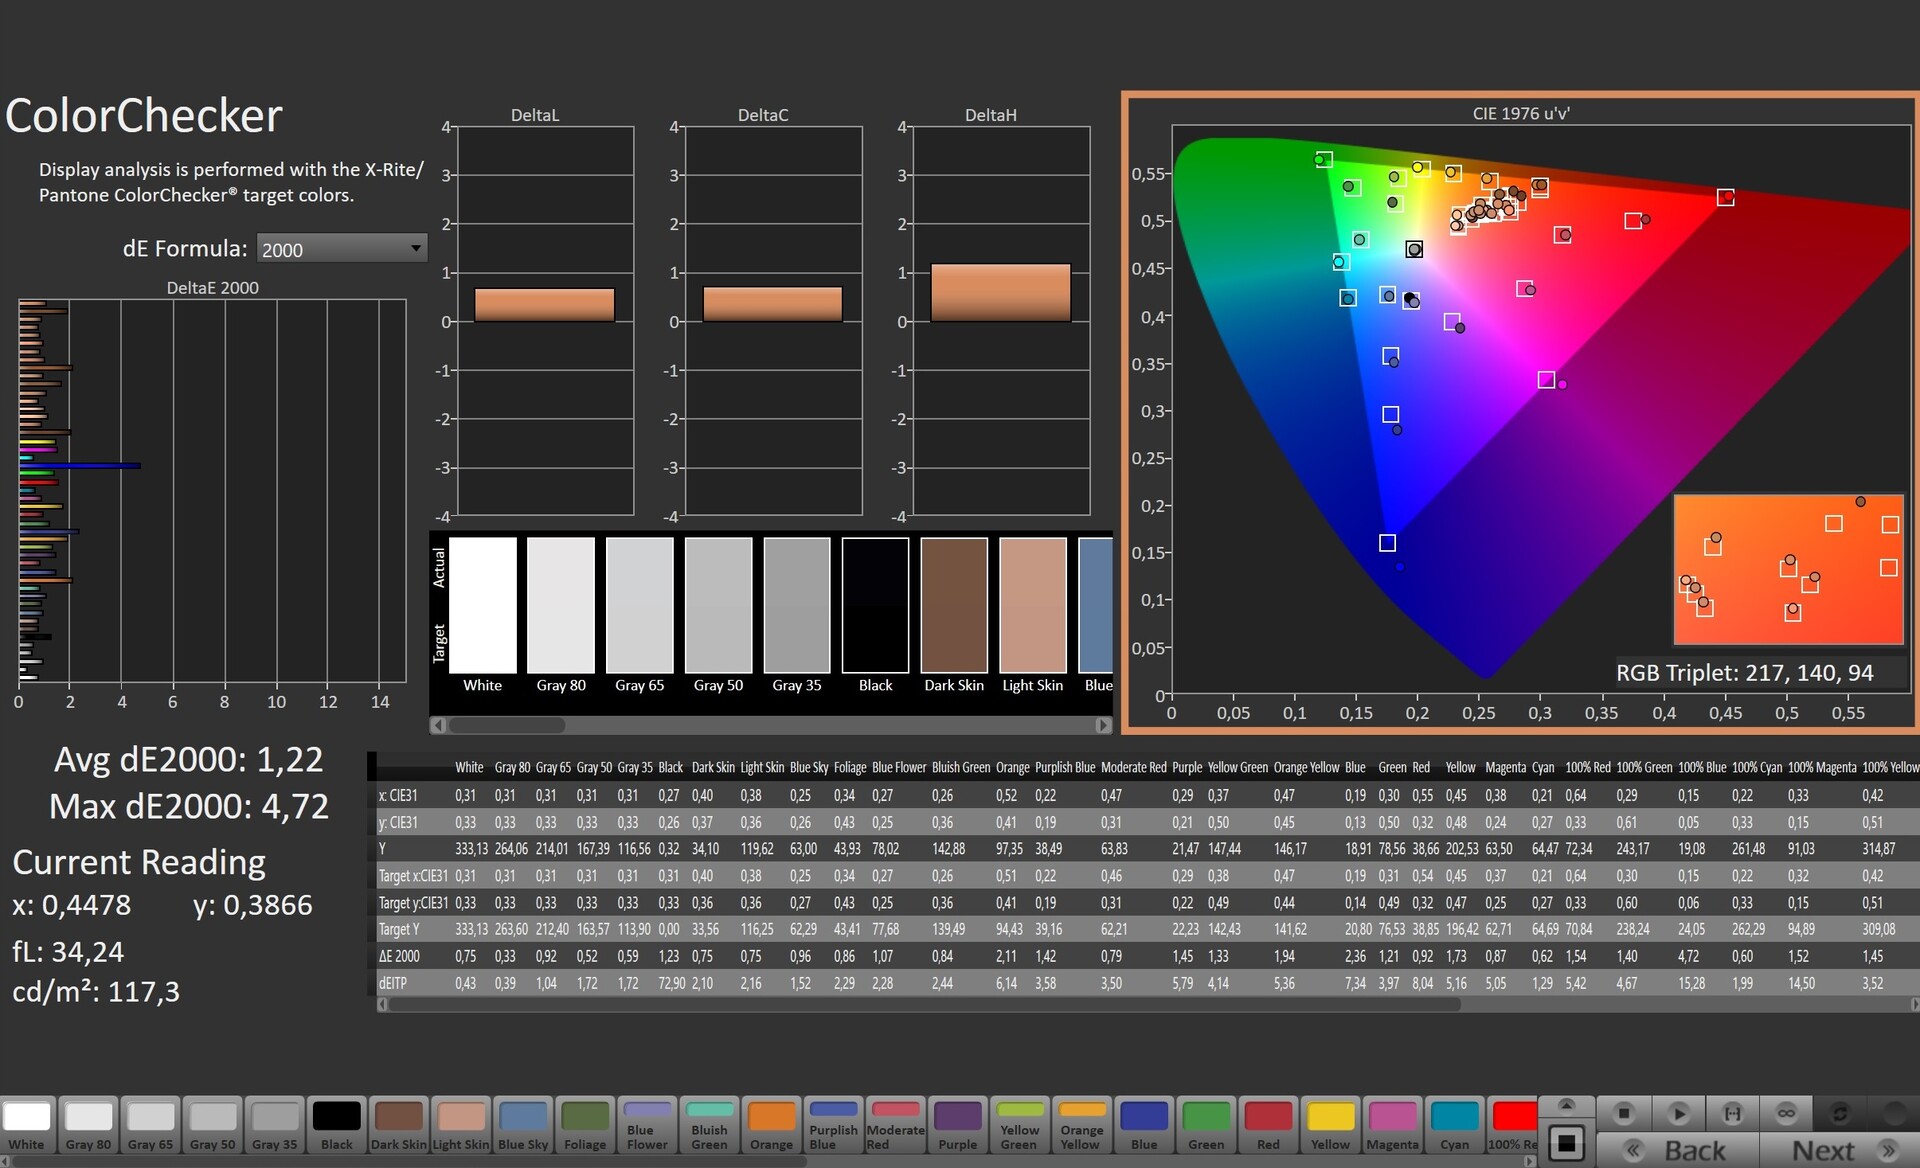
ΔE ColorChecker Calman: 2.88 | ∀{0.5-29.43 Ø4.73}
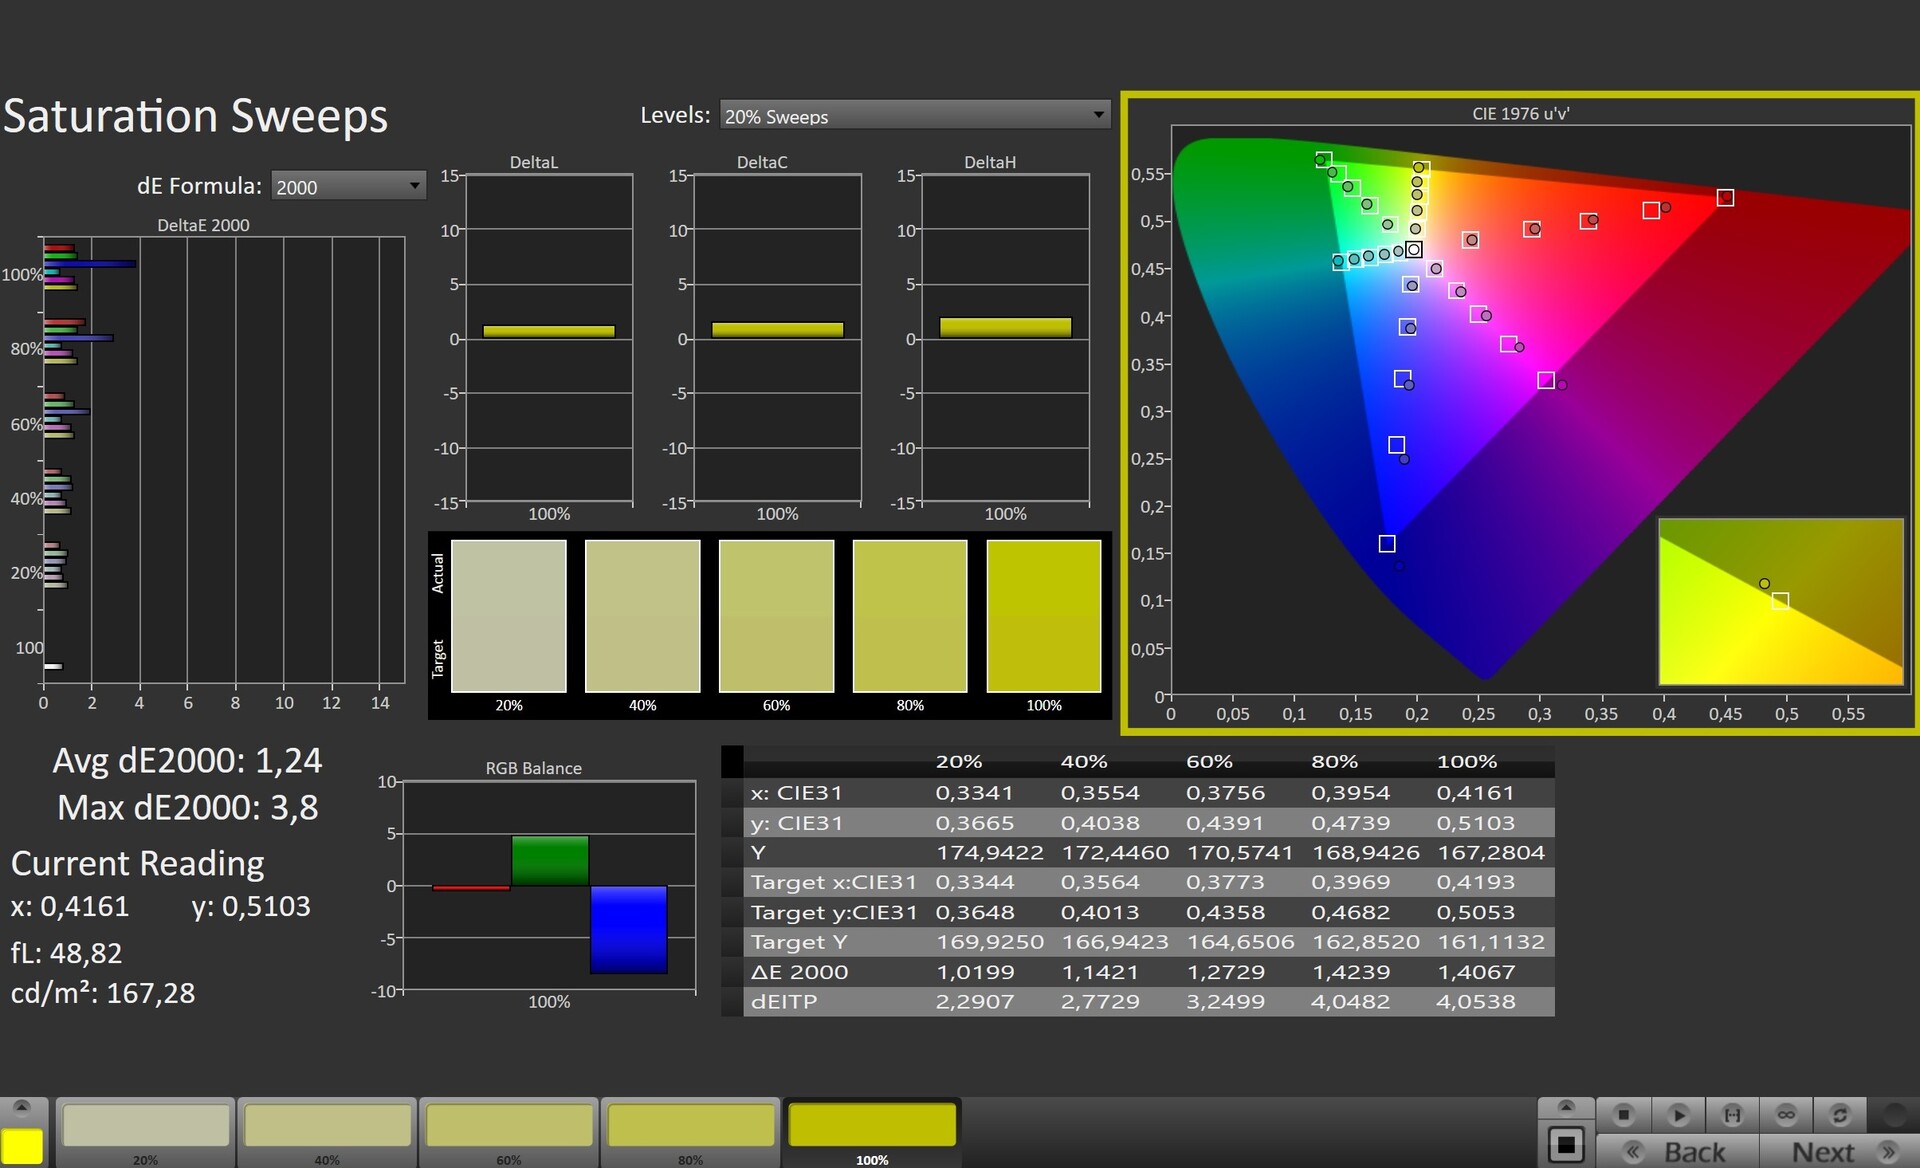
calibrated: 1.22
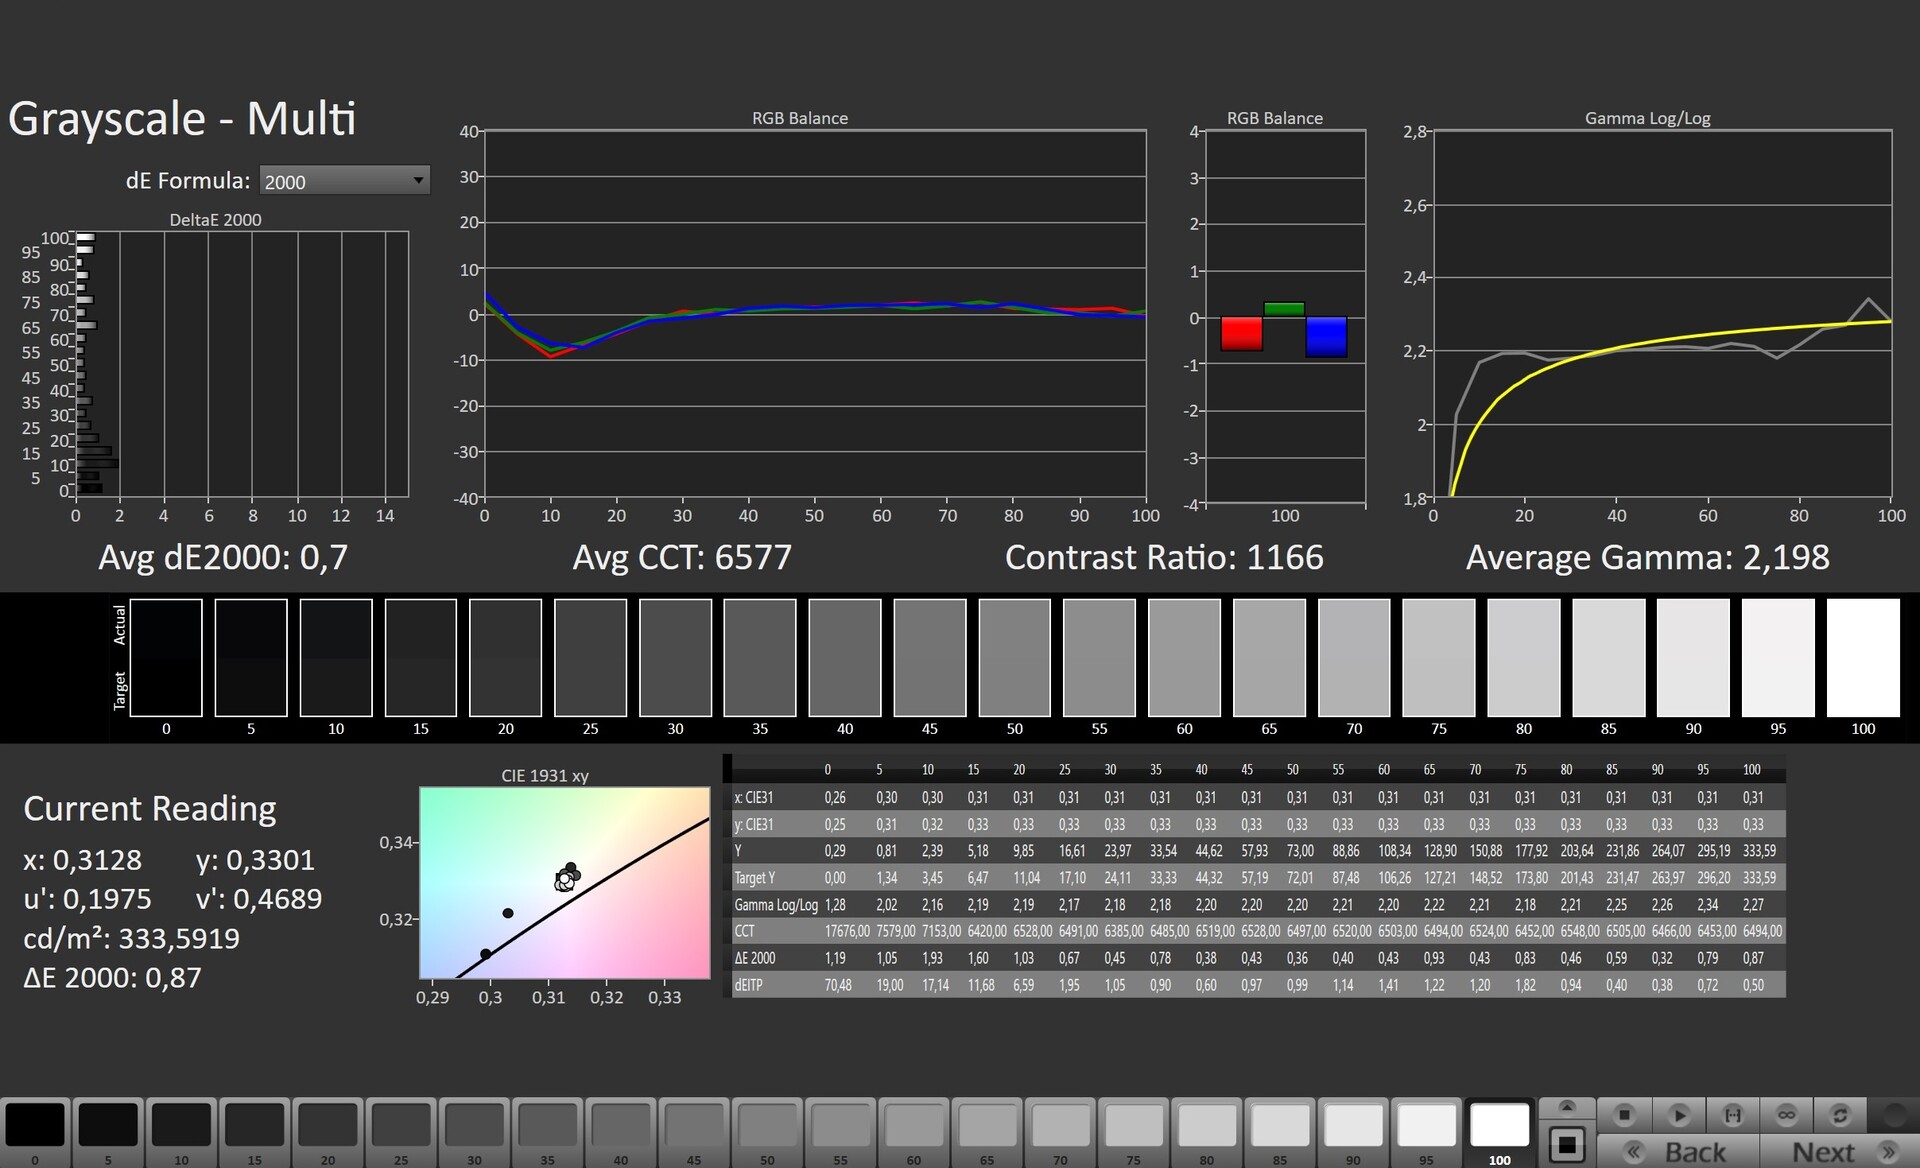
ΔE Greyscale Calman: 5 | ∀{0.09-98 Ø4.97}
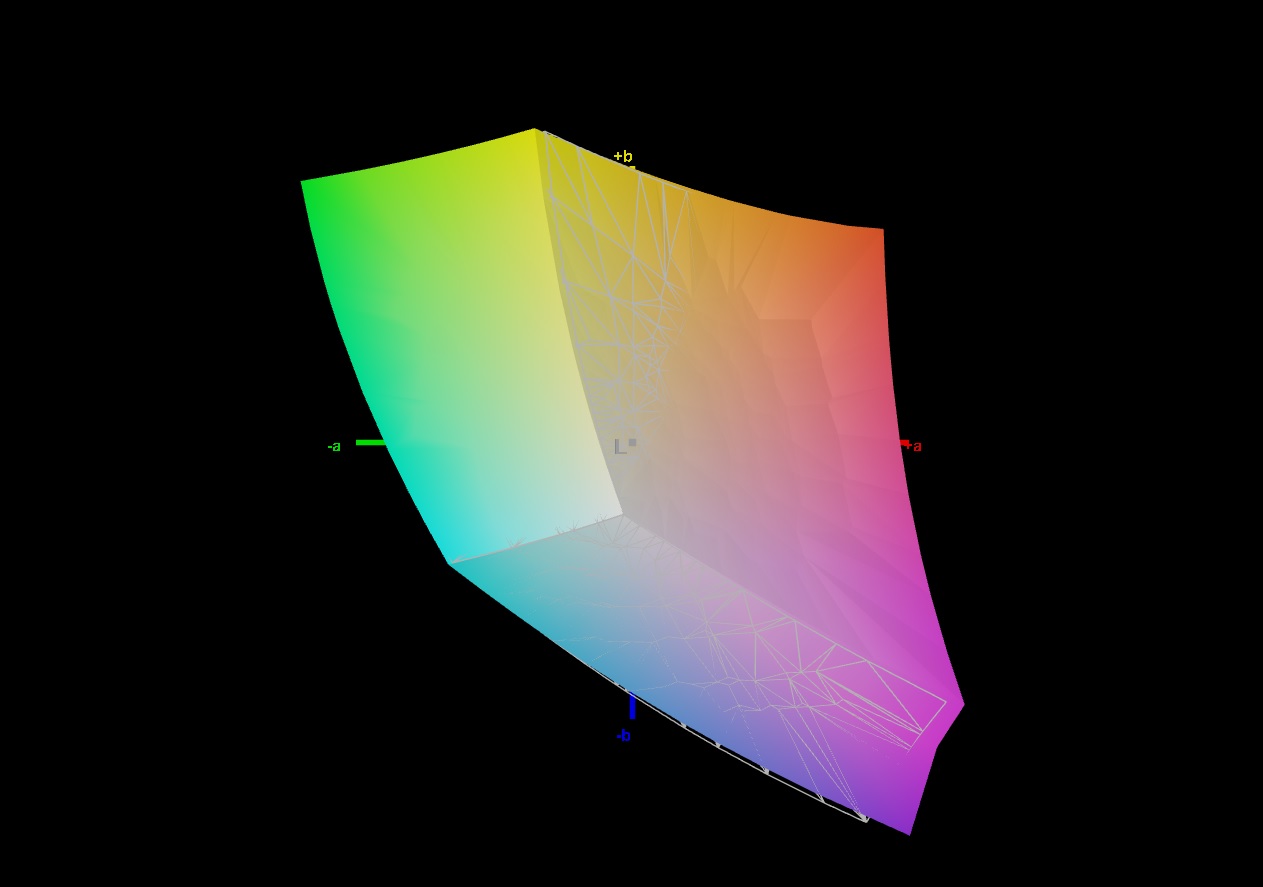
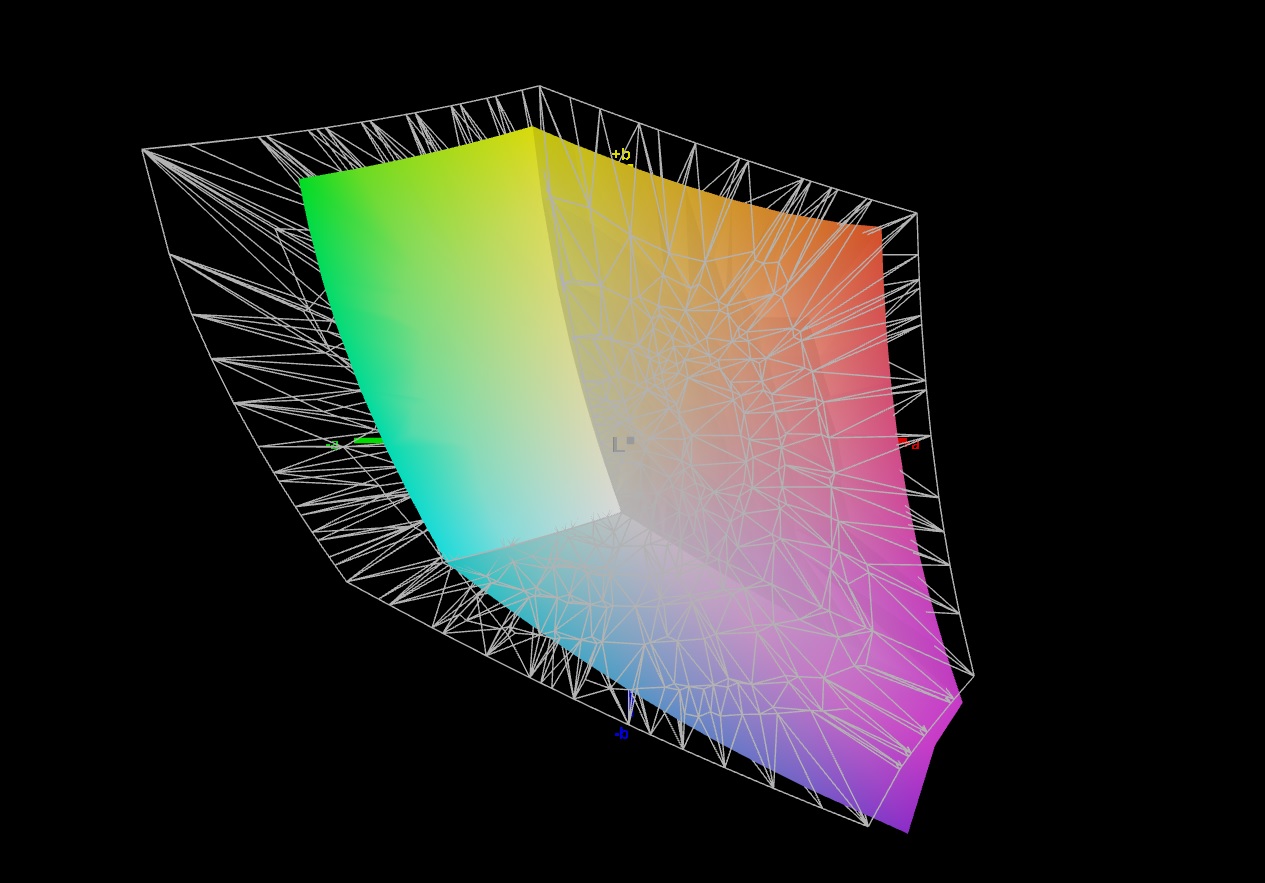
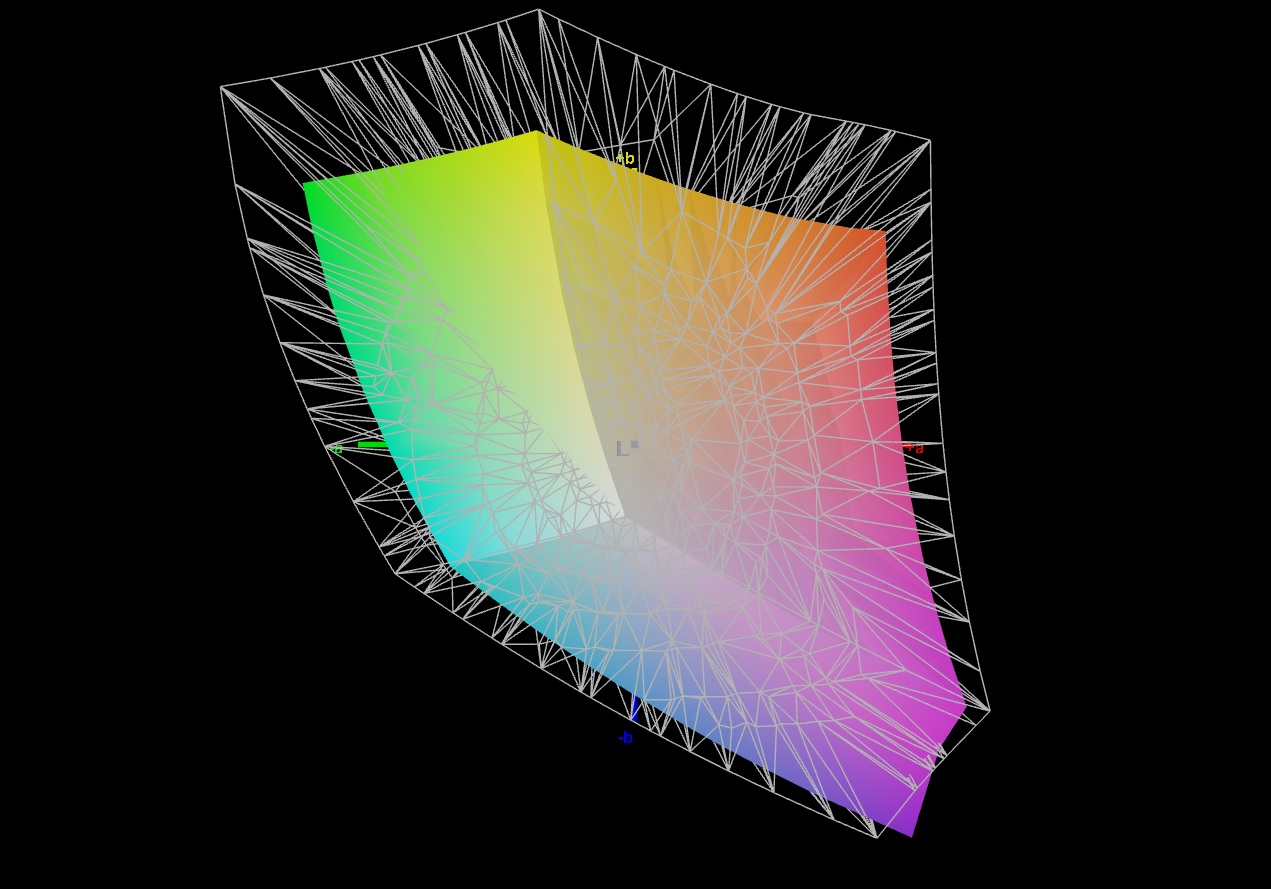
69.9% AdobeRGB 1998 (Argyll 3D)
99.2% sRGB (Argyll 3D)
69.1% Display P3 (Argyll 3D)
Gamma: 2.162
CCT: 7497 K
| Lenovo IdeaPad Gaming 3 15IAH7 Lenovo LEN156FHD, IPS, 1920x1080, 15.6" | Lenovo IdeaPad Gaming 3 15ARH7 LEN156FHD, IPS, 1920x1080, 15.6" | Dell G15 5515 BOE092A, IPS, 1920x1080, 15.6" | HP Victus 16-e0145ng CMN1609, IPS, 1920x1080, 16.1" | Dell Inspiron 16 Plus 7620 BOE NE16N41, IPS, 3072x1920, 16" | |
|---|---|---|---|---|---|
| Display | -42% | -43% | -39% | 2% | |
| Display P3 Coverage (%) | 69.1 | 39.4 -43% | 39.1 -43% | 41.6 -40% | 70.8 2% |
| sRGB Coverage (%) | 99.2 | 58 -42% | 56.9 -43% | 61.9 -38% | 99.5 0% |
| AdobeRGB 1998 Coverage (%) | 69.9 | 40.7 -42% | 40.4 -42% | 43 -38% | 73.2 5% |
| Response Times | -90% | -97% | -130% | -213% | |
| Response Time Grey 50% / Grey 80% * (ms) | 13 ? | 20.8 ? -60% | 25.2 ? -94% | 29.6 ? -128% | 38 ? -192% |
| Response Time Black / White * (ms) | 8.4 ? | 18.4 ? -119% | 16.8 ? -100% | 19.4 ? -131% | 28 ? -233% |
| PWM Frequency (Hz) | 200 ? | ||||
| Screen | -45% | -64% | -66% | 21% | |
| Brightness middle (cd/m²) | 338 | 287.8 -15% | 278 -18% | 257 -24% | 288.9 -15% |
| Brightness (cd/m²) | 329 | 268 -19% | 262 -20% | 239 -27% | 276 -16% |
| Brightness Distribution (%) | 92 | 86 -7% | 83 -10% | 88 -4% | 92 0% |
| Black Level * (cd/m²) | 0.27 | 0.3 -11% | 0.36 -33% | 0.25 7% | 0.26 4% |
| Contrast (:1) | 1252 | 959 -23% | 772 -38% | 1028 -18% | 1111 -11% |
| Colorchecker dE 2000 * | 2.88 | 6.3 -119% | 5.74 -99% | 6.91 -140% | 1.88 35% |
| Colorchecker dE 2000 max. * | 9.35 | 21.32 -128% | 19.63 -110% | 22.27 -138% | 4.37 53% |
| Colorchecker dE 2000 calibrated * | 1.22 | 2.53 -107% | 4.7 -285% | 3.61 -196% | 0.42 66% |
| Greyscale dE 2000 * | 5 | 4 20% | 3.1 38% | 7.5 -50% | 1.4 72% |
| Gamma | 2.162 102% | 2.21 100% | 2.011 109% | 2.125 104% | 2.3 96% |
| CCT | 7497 87% | 6762 96% | 6207 105% | 6025 108% | 6634 98% |
| Toplam Ortalama (Program / Ayarlar) | -59% /
-51% | -68% /
-64% | -78% /
-69% | -63% /
-16% |
* ... daha küçük daha iyidir
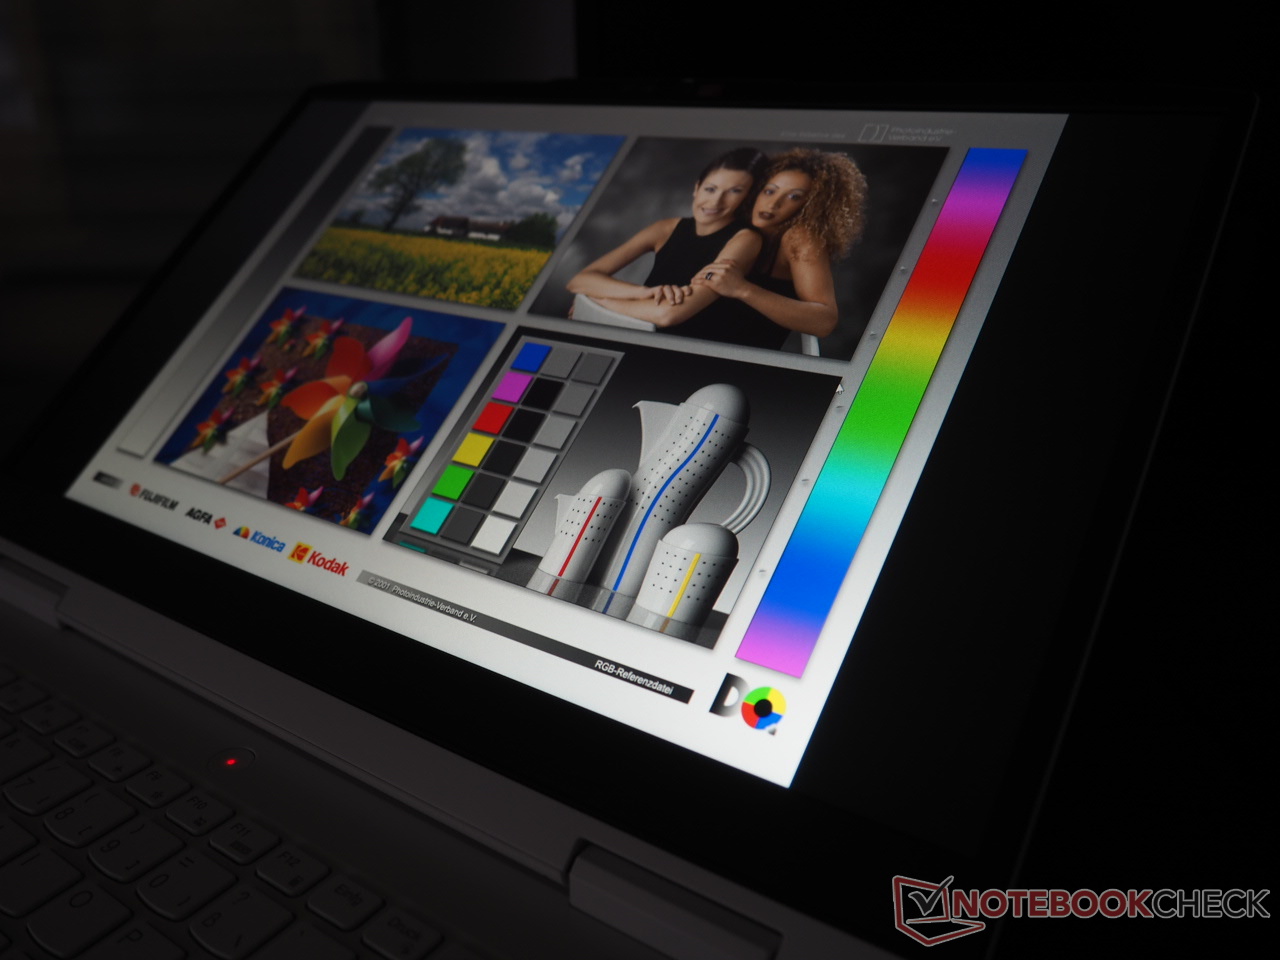
1.000 Euro'luk segmentte küçük renk alanları ve düşük parlaklık yaygındır. Ancak IdeaPad Gaming 15 15IAH7'de durum böyle değil: Yaklaşık %100 sRGB kapsamı ve ortalama 329 cd/m² parlaklık, dizüstü bilgisayarın fiyatının hakkını veriyor.
15 inçlik dizüstü bilgisayar, kalan disiplinlerde de iyi bir rakama ulaşıyor. 8 ila 13 ms'lik bir yanıt süresi kesinlikle iyi bir değerdir. Aynı şey, yine ortalamanın üzerinde olan 1252:1 kontrastı için de geçerli.
Şikayet edebileceğiniz tek şey renk doğruluğu. Teslimat durumunda, 165 Hz panel açık mavi bir renk tonuna sahiptir. Ancak bu bir kalibrasyon ile düzeltilebilir (ICC dosyamız yukarıda sağda, parlaklık dağılım grafiğinin yanında ücretsiz olarak indirilebilir). Test birimimiz herhangi bir ekran kanaması veya PWM titremesi göstermiyor.
Yanıt Sürelerini Görüntüle
| ↔ Tepki Süresi Siyahtan Beyaza | ||
|---|---|---|
| 8.4 ms ... yükseliş ↗ ve sonbahar↘ birleşimi | ↗ 4.2 ms yükseliş | 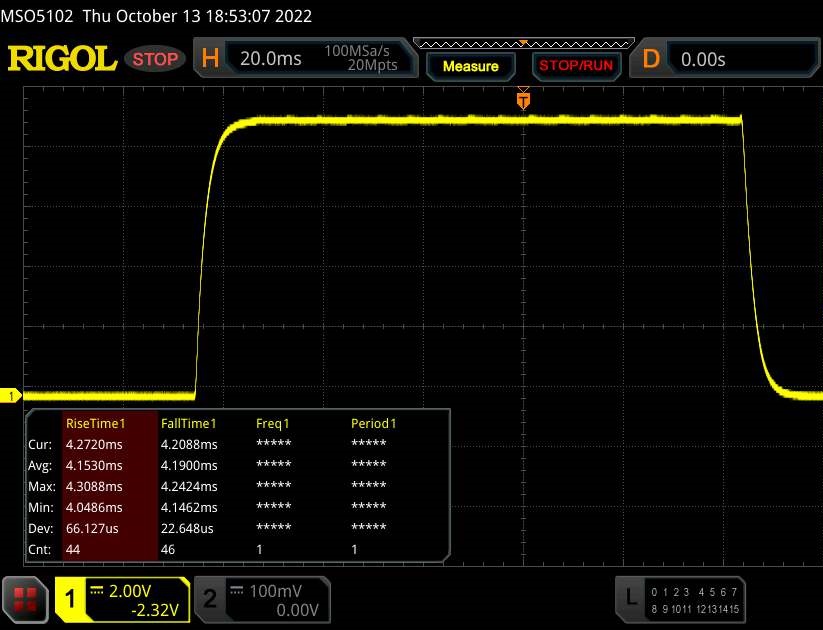 |
| ↘ 4.2 ms sonbahar | ||
| Ekran, testlerimizde hızlı yanıt oranları gösteriyor ve oyun oynamaya uygun olmalı. Karşılaştırıldığında, test edilen tüm cihazlar 0.1 (minimum) ile 240 (maksimum) ms arasında değişir. » Tüm cihazların 24 %'si daha iyi. Bu, ölçülen yanıt süresinin test edilen tüm cihazların ortalamasından (19.9 ms) daha iyi olduğu anlamına gelir. | ||
| ↔ Tepki Süresi %50 Griden %80 Griye | ||
| 13 ms ... yükseliş ↗ ve sonbahar↘ birleşimi | ↗ 6.3 ms yükseliş | 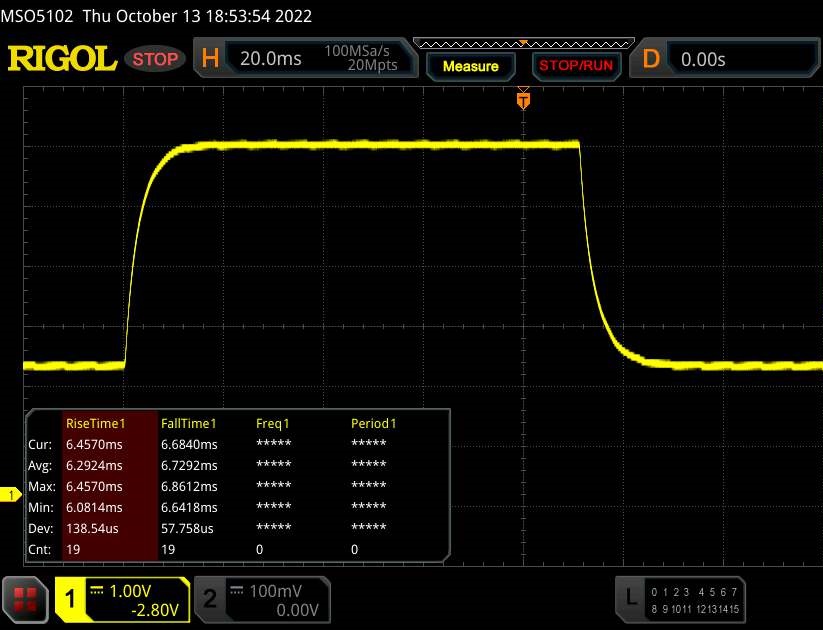 |
| ↘ 6.7 ms sonbahar | ||
| Ekran, testlerimizde iyi yanıt oranları gösteriyor ancak rekabetçi oyuncular için çok yavaş olabilir. Karşılaştırıldığında, test edilen tüm cihazlar 0.165 (minimum) ile 636 (maksimum) ms arasında değişir. » Tüm cihazların 26 %'si daha iyi. Bu, ölçülen yanıt süresinin test edilen tüm cihazların ortalamasından (31.1 ms) daha iyi olduğu anlamına gelir. | ||
Ekran Titremesi / PWM (Darbe Genişliği Modülasyonu)
| Ekran titriyor / PWM algılanmadı |  | ||
Karşılaştırıldığında: Test edilen tüm cihazların %52 %'si ekranı karartmak için PWM kullanmıyor. PWM tespit edilirse, ortalama 7794 (minimum: 5 - maksimum: 343500) Hz ölçüldü. | |||
Performans
IdeaPad Gaming 3 15IAH7'nin performansı onu orta seviyeye yerleştiriyor. Bol çekirdeğe ve 16 GB çalışan belleğe sahip işlemci, performans nedenleriyle Lenovo'nun tek bir RAM modülü yerine çift kanallı RAM kullanması gerekse bile, gelecek yıllar için yeterli rezerv sunmalıdır. Yerleşik M.2 SSD sadece 2242 formatında gelse de kasa klasik 2280 SSD için alan sunuyor. Grafik kartı karışık izlenimler bırakıyor. Bir yandan, RTX 3050 Ti sağlam bir fiyat-performans oranı sunarken, diğer yandan 4 GB VRAM geleceğe çok dayanıklı değil.
Test Koşulları
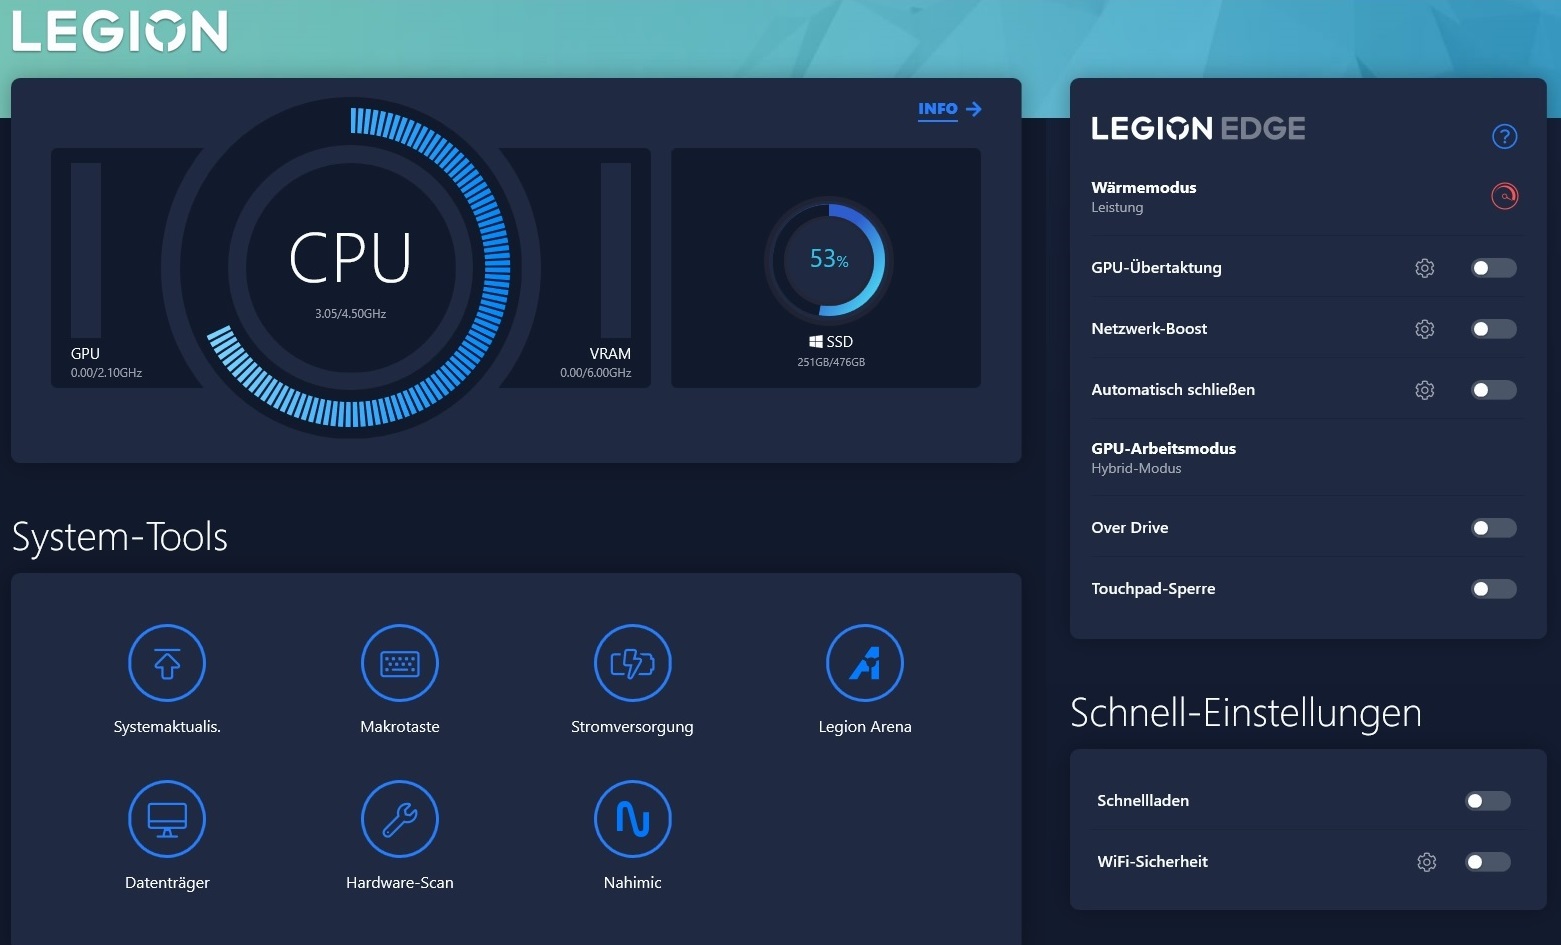
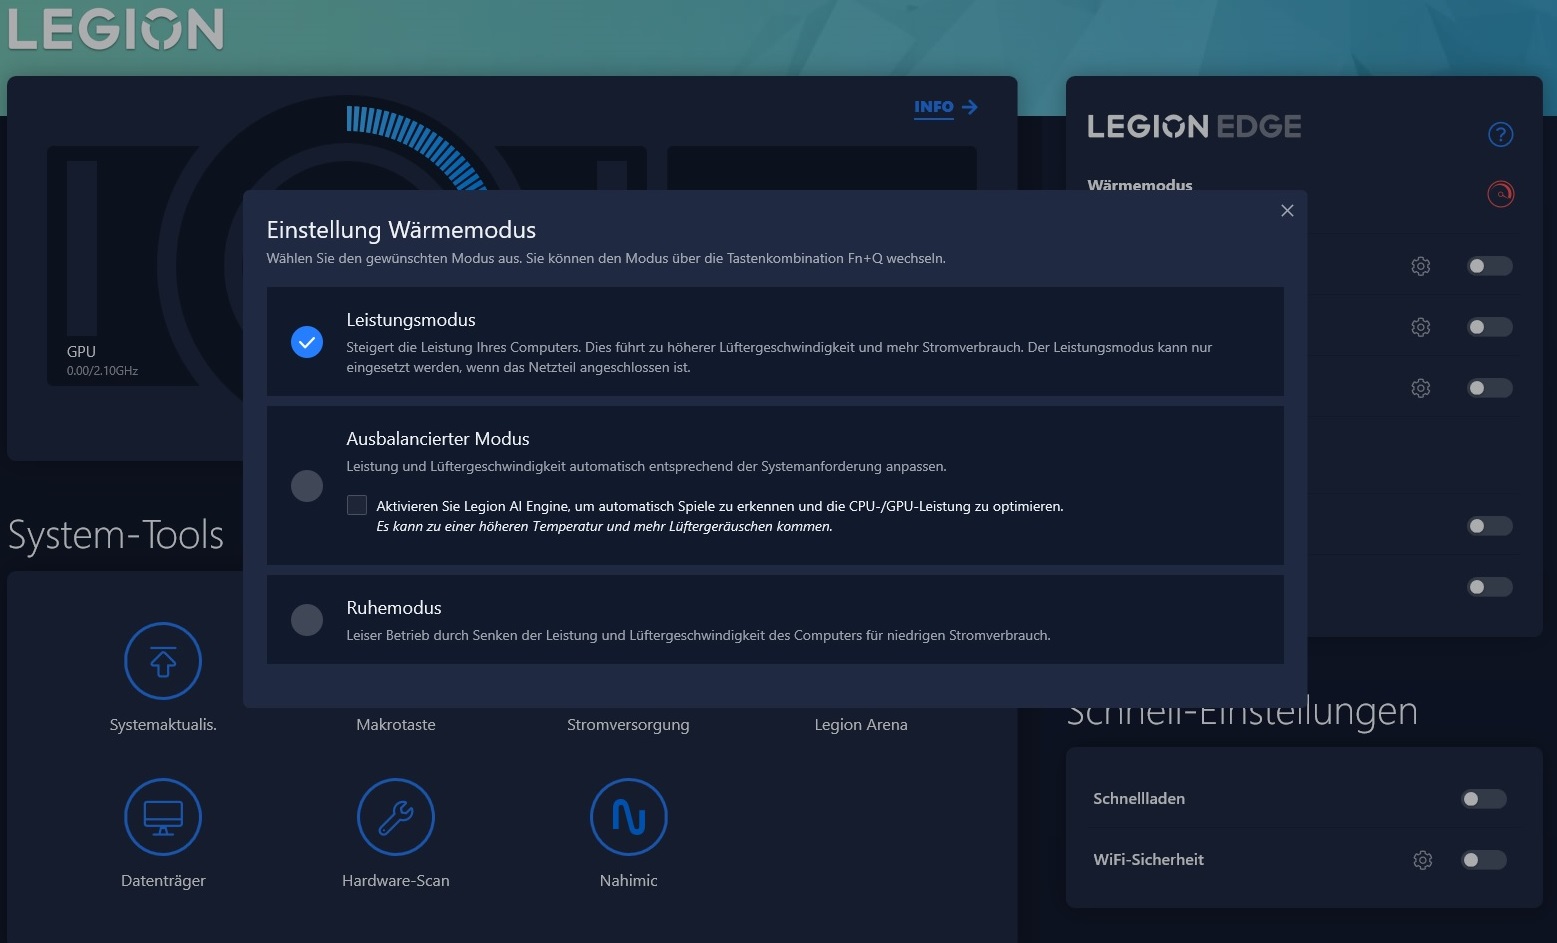
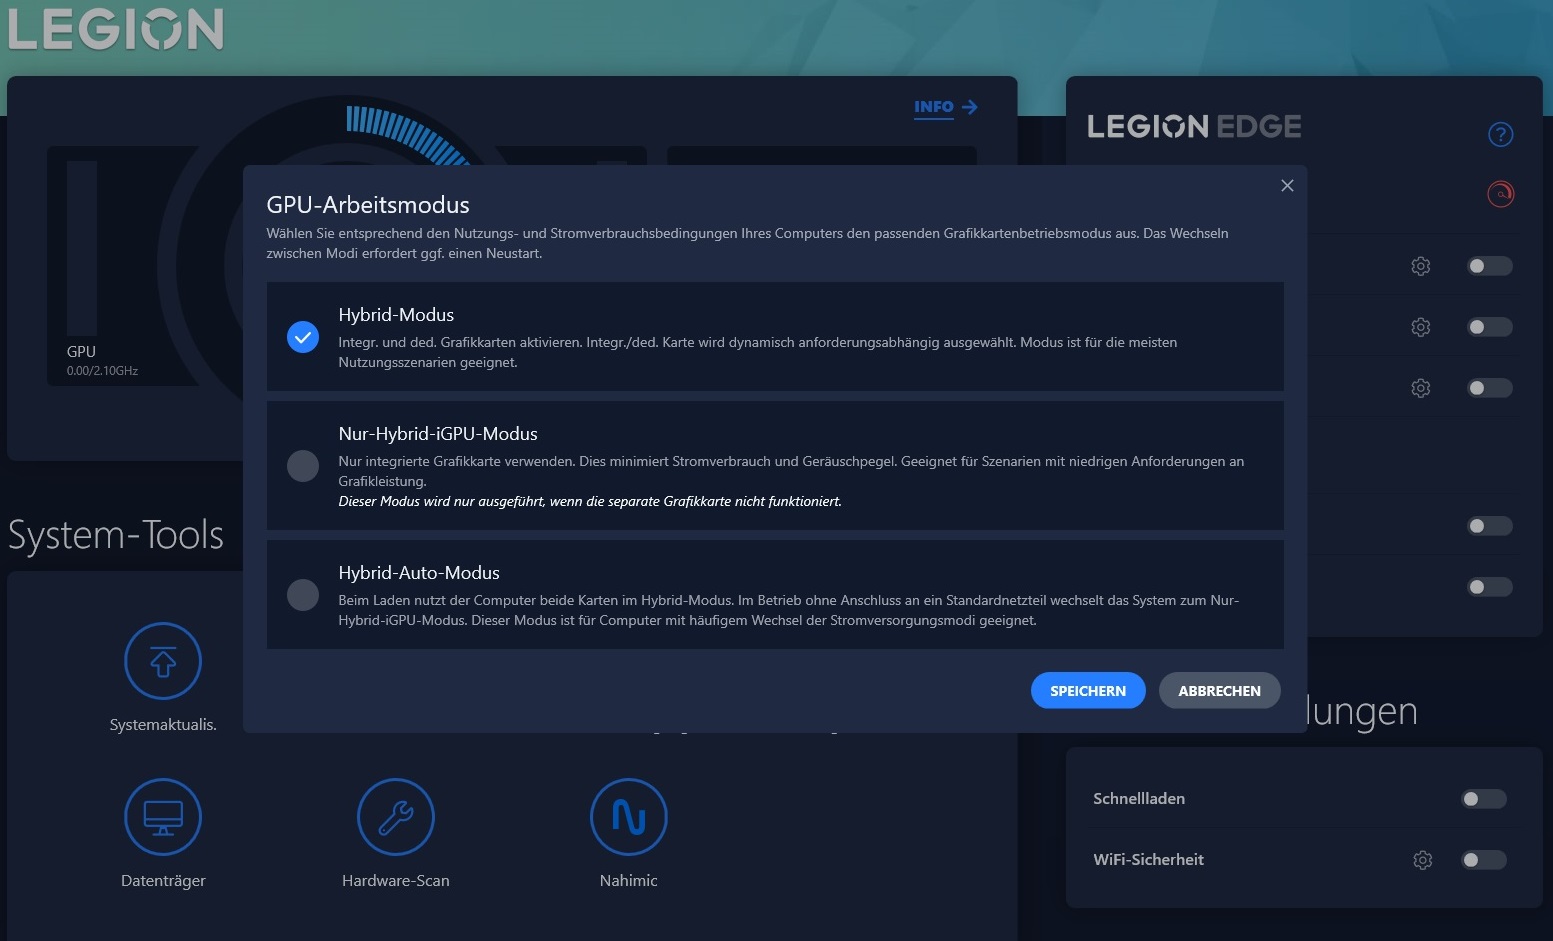
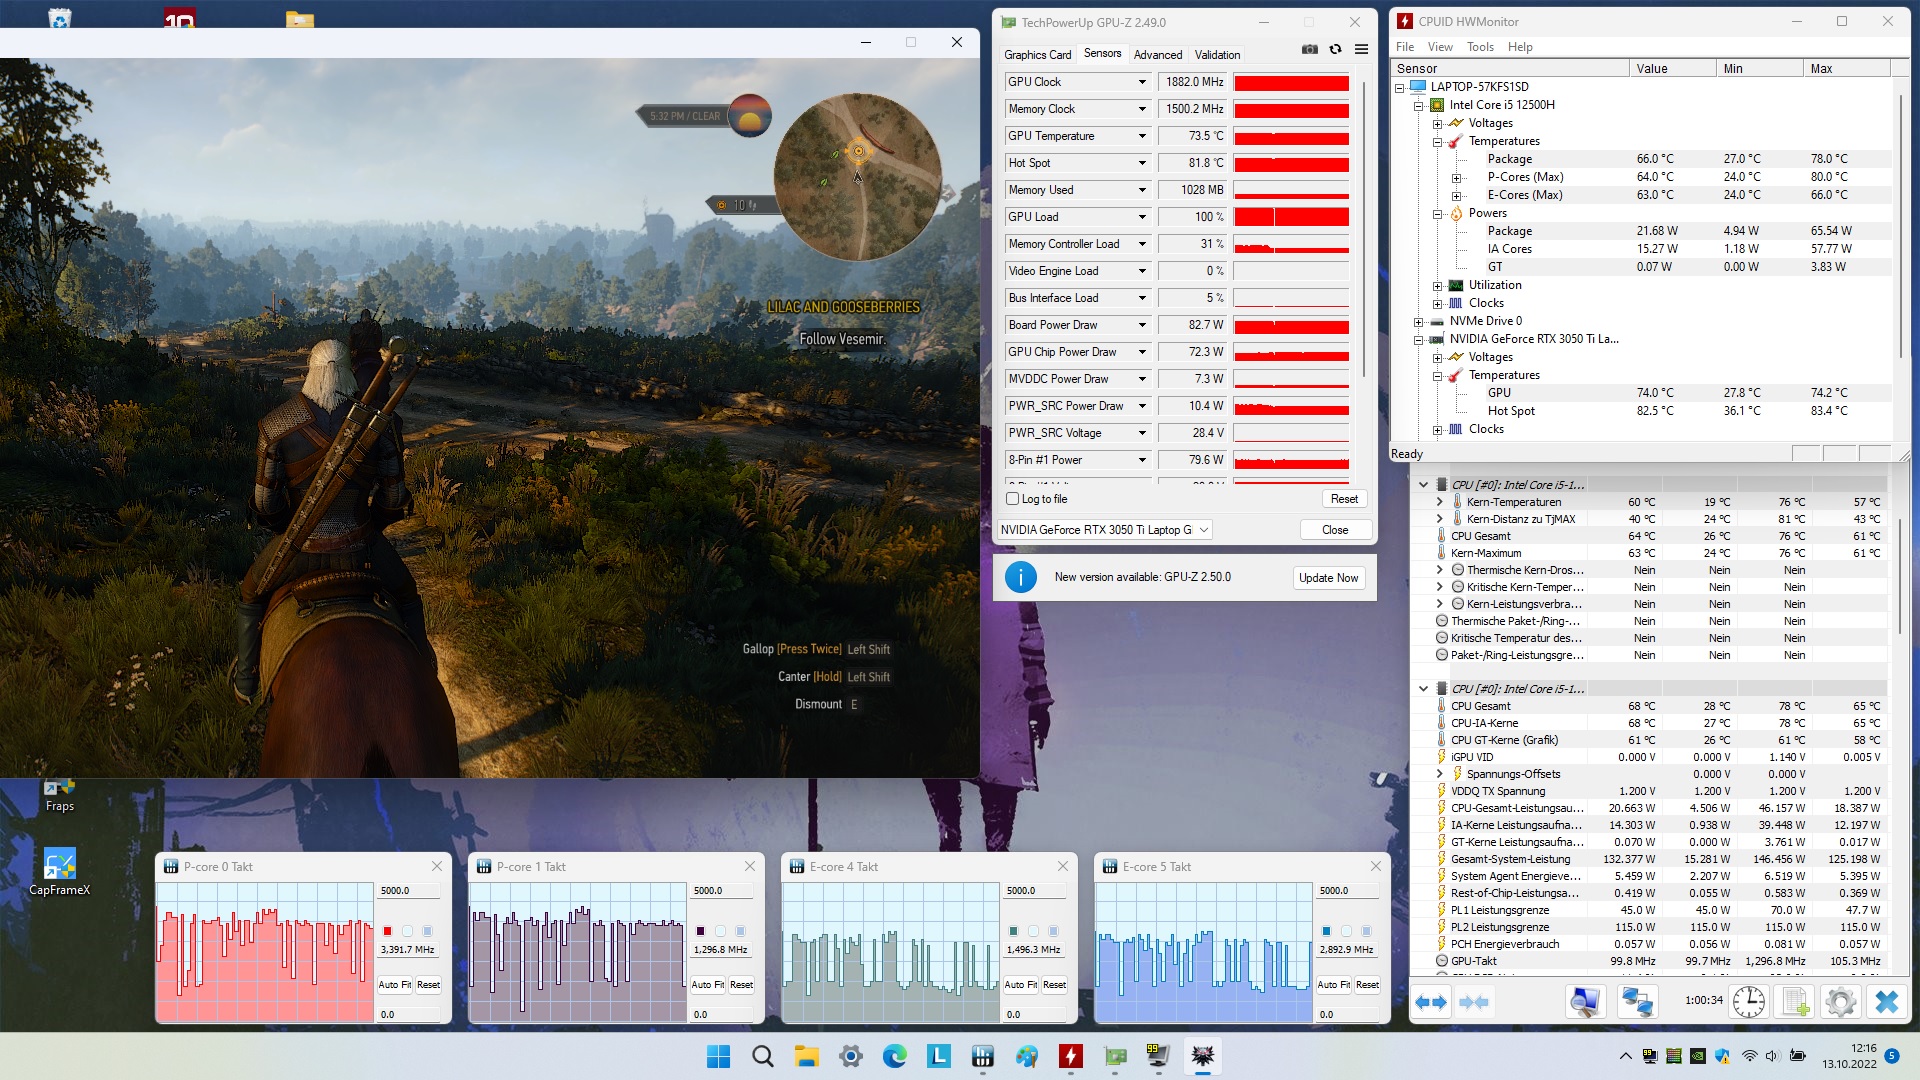
Önceden yüklenmiş Lenovo Vantage yazılımı, güç modu ve GPU çalışma modunun özellikle ilgili olduğu düzinelerce ayar seçeneği sunar. Aksi belirtilmedikçe, tüm ölçümlerimiz Performans modu ve normal hibrit grafik geçişi etkinken yapılır. Ancak, düşük performans düşüşünü göz önünde bulundurarak (tabloya bakınız), pratikte dengeli modun (Ayarlanmış profil) kullanılmasını tavsiye ederiz. Sessiz modda, cihazın çalışması yine önemli ölçüde daha sessizdir. Kare hızlarında yaklaşık %30'luk bir düşüşe rağmen, birçok oyun hala oynanabilir durumda.
| The Witcher 3 (FHD/Ultra) | Gürültü seviyesi | Performans |
| Performans modu | 46 dB(A) | temel (~60 FPS) |
| Ayarlanmış mod | 43 dB(A) | -7% (~56 FPS) |
| Sessiz mod | 34 dB(A) | -30% (~42 FPS) |
İşlemci
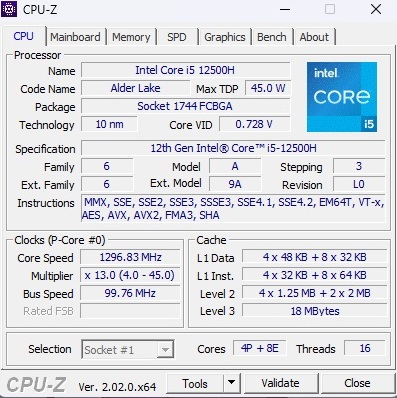
Core i5-12500H, Intel'in Alder Lake neslinden 4 Performans çekirdeği (hiper iş parçacığı dahil) ve 8 Verimlilik çekirdeği (hiper iş parçacığı olmadan) içeren 12 çekirdekli bir modeldir ve 45 Watt TDP'de belirtilir. CPU testlerinde 10-nm çip çok iyi bir performans sunuyor. Performans da sürekli olarak sabit kaldığı için IdeaPad Gaming 3 15IAH7 , Cinebench döngüsünde bir süre sonra Dell Inspiron 16 Plus'ın Core i7-12700H'sinin önüne geçerek en üst noktaya ulaşıyor. Diğer rakiplerin Ryzen CPU'ları (R5 5600H, R5 6600H & R7 5800H) biraz geride kalıyor.
Cinebench R15 Multi Constant Load Test
* ... daha küçük daha iyidir
AIDA64: FP32 Ray-Trace | FPU Julia | CPU SHA3 | CPU Queen | FPU SinJulia | FPU Mandel | CPU AES | CPU ZLib | FP64 Ray-Trace | CPU PhotoWorxx
| Performance rating | |
| Sınıf ortalaması Gaming | |
| Dell G15 5515 | |
| Dell Inspiron 16 Plus 7620 | |
| Lenovo IdeaPad Gaming 3 15IAH7 | |
| Ortalama Intel Core i5-12500H | |
| Lenovo IdeaPad Gaming 3 15ARH7 | |
| HP Victus 16-e0145ng | |
| AIDA64 / FP32 Ray-Trace | |
| Sınıf ortalaması Gaming (10227 - 85542, n=109, son 2 yıl) | |
| Dell G15 5515 | |
| Lenovo IdeaPad Gaming 3 15IAH7 | |
| Dell Inspiron 16 Plus 7620 | |
| Lenovo IdeaPad Gaming 3 15ARH7 | |
| Ortalama Intel Core i5-12500H (6851 - 13947, n=9) | |
| HP Victus 16-e0145ng | |
| AIDA64 / FPU Julia | |
| Sınıf ortalaması Gaming (51376 - 238426, n=109, son 2 yıl) | |
| Dell G15 5515 | |
| Lenovo IdeaPad Gaming 3 15ARH7 | |
| HP Victus 16-e0145ng | |
| Lenovo IdeaPad Gaming 3 15IAH7 | |
| Dell Inspiron 16 Plus 7620 | |
| Ortalama Intel Core i5-12500H (29874 - 68178, n=9) | |
| AIDA64 / CPU SHA3 | |
| Sınıf ortalaması Gaming (2180 - 9817, n=109, son 2 yıl) | |
| Lenovo IdeaPad Gaming 3 15IAH7 | |
| Dell G15 5515 | |
| Ortalama Intel Core i5-12500H (2287 - 3337, n=9) | |
| Dell Inspiron 16 Plus 7620 | |
| Lenovo IdeaPad Gaming 3 15ARH7 | |
| HP Victus 16-e0145ng | |
| AIDA64 / CPU Queen | |
| Sınıf ortalaması Gaming (49785 - 173351, n=100, son 2 yıl) | |
| Dell G15 5515 | |
| Dell Inspiron 16 Plus 7620 | |
| Lenovo IdeaPad Gaming 3 15IAH7 | |
| Ortalama Intel Core i5-12500H (77935 - 80703, n=9) | |
| Lenovo IdeaPad Gaming 3 15ARH7 | |
| HP Victus 16-e0145ng | |
| AIDA64 / FPU SinJulia | |
| Sınıf ortalaması Gaming (4424 - 33636, n=109, son 2 yıl) | |
| Dell G15 5515 | |
| Lenovo IdeaPad Gaming 3 15ARH7 | |
| HP Victus 16-e0145ng | |
| Dell Inspiron 16 Plus 7620 | |
| Lenovo IdeaPad Gaming 3 15IAH7 | |
| Ortalama Intel Core i5-12500H (6590 - 7431, n=9) | |
| AIDA64 / FPU Mandel | |
| Sınıf ortalaması Gaming (25115 - 128721, n=109, son 2 yıl) | |
| Dell G15 5515 | |
| Lenovo IdeaPad Gaming 3 15ARH7 | |
| HP Victus 16-e0145ng | |
| Lenovo IdeaPad Gaming 3 15IAH7 | |
| Dell Inspiron 16 Plus 7620 | |
| Ortalama Intel Core i5-12500H (18252 - 34041, n=9) | |
| AIDA64 / CPU AES | |
| Dell G15 5515 | |
| Lenovo IdeaPad Gaming 3 15IAH7 | |
| Sınıf ortalaması Gaming (39258 - 247074, n=109, son 2 yıl) | |
| Lenovo IdeaPad Gaming 3 15ARH7 | |
| Ortalama Intel Core i5-12500H (50298 - 111567, n=9) | |
| Dell Inspiron 16 Plus 7620 | |
| HP Victus 16-e0145ng | |
| AIDA64 / CPU ZLib | |
| Sınıf ortalaması Gaming (574 - 2531, n=109, son 2 yıl) | |
| Dell Inspiron 16 Plus 7620 | |
| Lenovo IdeaPad Gaming 3 15IAH7 | |
| Ortalama Intel Core i5-12500H (746 - 924, n=9) | |
| Dell G15 5515 | |
| Lenovo IdeaPad Gaming 3 15ARH7 | |
| HP Victus 16-e0145ng | |
| AIDA64 / FP64 Ray-Trace | |
| Sınıf ortalaması Gaming (5509 - 45446, n=109, son 2 yıl) | |
| Dell G15 5515 | |
| Lenovo IdeaPad Gaming 3 15IAH7 | |
| Dell Inspiron 16 Plus 7620 | |
| Lenovo IdeaPad Gaming 3 15ARH7 | |
| Ortalama Intel Core i5-12500H (3848 - 7405, n=9) | |
| HP Victus 16-e0145ng | |
| AIDA64 / CPU PhotoWorxx | |
| Sınıf ortalaması Gaming (12271 - 89891, n=109, son 2 yıl) | |
| Dell Inspiron 16 Plus 7620 | |
| Ortalama Intel Core i5-12500H (13686 - 43813, n=9) | |
| HP Victus 16-e0145ng | |
| Lenovo IdeaPad Gaming 3 15ARH7 | |
| Dell G15 5515 | |
| Lenovo IdeaPad Gaming 3 15IAH7 | |
Sistem performansı
PCMark 10'a göre sistem performansı da saygın. 6,755 puanla yalnızca Dell Inspiron 16 Plus tarafından geçildi. Öznel olarak, işletim sistemi rahat bir şekilde hızlı yanıt verir.
CrossMark: Overall | Productivity | Creativity | Responsiveness
| PCMark 10 / Score | |
| Sınıf ortalaması Gaming (5828 - 11574, n=95, son 2 yıl) | |
| Dell Inspiron 16 Plus 7620 | |
| Lenovo IdeaPad Gaming 3 15IAH7 | |
| Lenovo IdeaPad Gaming 3 15ARH7 | |
| Dell G15 5515 | |
| HP Victus 16-e0145ng | |
| PCMark 10 / Essentials | |
| Sınıf ortalaması Gaming (8810 - 12600, n=99, son 2 yıl) | |
| Dell Inspiron 16 Plus 7620 | |
| Lenovo IdeaPad Gaming 3 15IAH7 | |
| HP Victus 16-e0145ng | |
| Dell G15 5515 | |
| Lenovo IdeaPad Gaming 3 15ARH7 | |
| PCMark 10 / Productivity | |
| Sınıf ortalaması Gaming (6845 - 18766, n=97, son 2 yıl) | |
| Lenovo IdeaPad Gaming 3 15IAH7 | |
| Dell Inspiron 16 Plus 7620 | |
| Lenovo IdeaPad Gaming 3 15ARH7 | |
| Dell G15 5515 | |
| HP Victus 16-e0145ng | |
| PCMark 10 / Digital Content Creation | |
| Sınıf ortalaması Gaming (7602 - 19657, n=97, son 2 yıl) | |
| Dell Inspiron 16 Plus 7620 | |
| Lenovo IdeaPad Gaming 3 15IAH7 | |
| HP Victus 16-e0145ng | |
| Dell G15 5515 | |
| Lenovo IdeaPad Gaming 3 15ARH7 | |
| CrossMark / Overall | |
| Sınıf ortalaması Gaming (1366 - 2409, n=97, son 2 yıl) | |
| Dell Inspiron 16 Plus 7620 | |
| Lenovo IdeaPad Gaming 3 15ARH7 | |
| CrossMark / Productivity | |
| Sınıf ortalaması Gaming (1386 - 2254, n=97, son 2 yıl) | |
| Dell Inspiron 16 Plus 7620 | |
| Lenovo IdeaPad Gaming 3 15ARH7 | |
| CrossMark / Creativity | |
| Sınıf ortalaması Gaming (1343 - 2729, n=97, son 2 yıl) | |
| Dell Inspiron 16 Plus 7620 | |
| Lenovo IdeaPad Gaming 3 15ARH7 | |
| CrossMark / Responsiveness | |
| Sınıf ortalaması Gaming (1226 - 2334, n=97, son 2 yıl) | |
| Dell Inspiron 16 Plus 7620 | |
| Lenovo IdeaPad Gaming 3 15ARH7 | |
| PCMark 10 Score | 6755 puan | |
Yardım | ||
| AIDA64 / Memory Copy | |
| Sınıf ortalaması Gaming (21750 - 129946, n=109, son 2 yıl) | |
| Dell Inspiron 16 Plus 7620 | |
| Ortalama Intel Core i5-12500H (23850 - 66598, n=9) | |
| HP Victus 16-e0145ng | |
| Dell G15 5515 | |
| Lenovo IdeaPad Gaming 3 15ARH7 | |
| Lenovo IdeaPad Gaming 3 15IAH7 | |
| AIDA64 / Memory Read | |
| Sınıf ortalaması Gaming (22956 - 118858, n=109, son 2 yıl) | |
| Dell Inspiron 16 Plus 7620 | |
| Ortalama Intel Core i5-12500H (24879 - 68013, n=9) | |
| HP Victus 16-e0145ng | |
| Dell G15 5515 | |
| Lenovo IdeaPad Gaming 3 15ARH7 | |
| Lenovo IdeaPad Gaming 3 15IAH7 | |
| AIDA64 / Memory Write | |
| Sınıf ortalaması Gaming (22297 - 135096, n=109, son 2 yıl) | |
| Dell Inspiron 16 Plus 7620 | |
| Ortalama Intel Core i5-12500H (23543 - 58797, n=9) | |
| HP Victus 16-e0145ng | |
| Dell G15 5515 | |
| Lenovo IdeaPad Gaming 3 15ARH7 | |
| Lenovo IdeaPad Gaming 3 15IAH7 | |
| AIDA64 / Memory Latency | |
| Sınıf ortalaması Gaming (75.3 - 259, n=109, son 2 yıl) | |
| Ortalama Intel Core i5-12500H (83.8 - 114.7, n=9) | |
| Dell Inspiron 16 Plus 7620 | |
| Lenovo IdeaPad Gaming 3 15IAH7 | |
| Lenovo IdeaPad Gaming 3 15ARH7 | |
| Dell G15 5515 | |
| HP Victus 16-e0145ng | |
* ... daha küçük daha iyidir
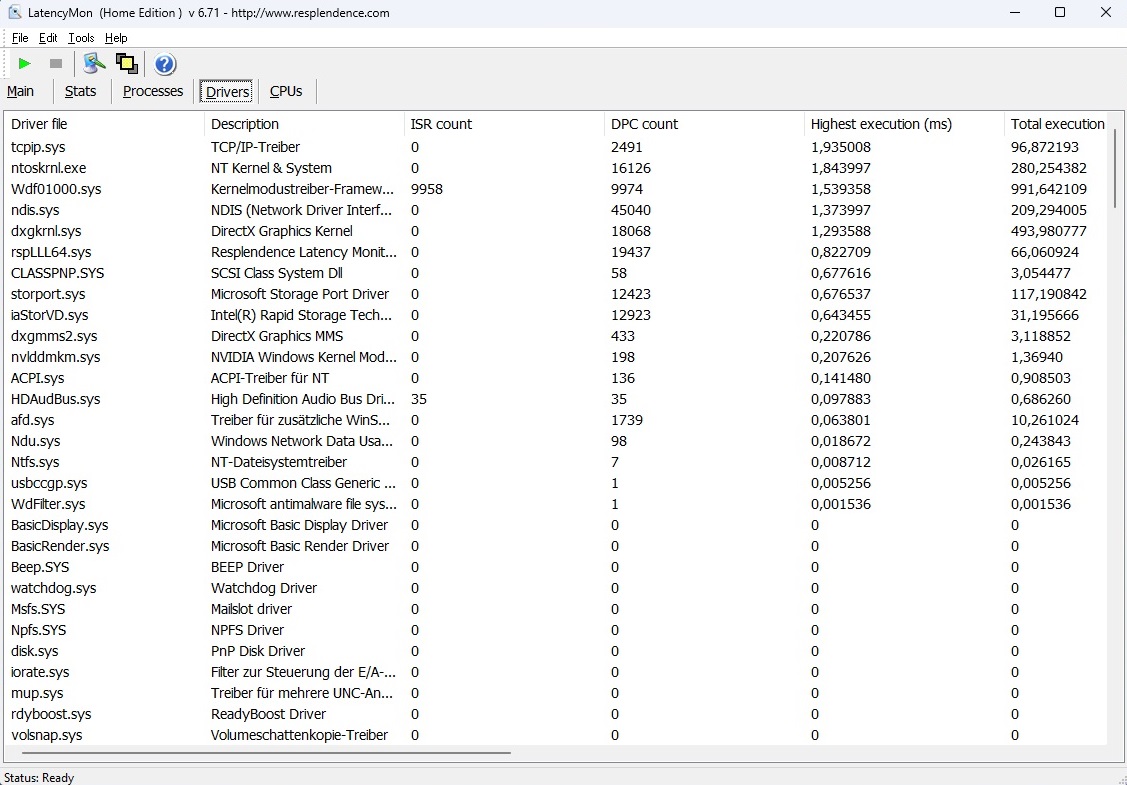
DPC Gecikmeleri
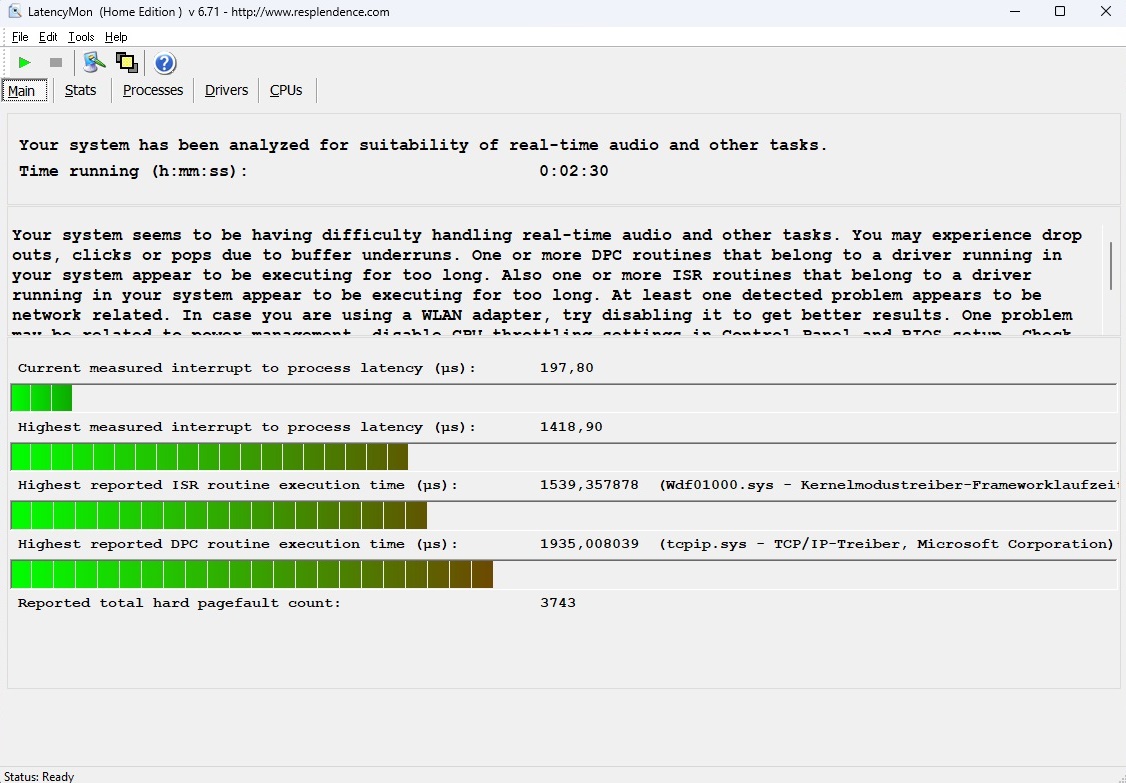
Gecikme testinde, 15 inçlik dizüstü bilgisayar pek iyi değil. LatencyMon aracı, gerçek zamanlı ses ve video işlemeyle ilgili olası sorunlardan bahseder. Ancak, bu uygulama senaryolarından yalnızca çok az sayıda kullanıcı etkilenmelidir.
| DPC Latencies / LatencyMon - interrupt to process latency (max), Web, Youtube, Prime95 | |
| Lenovo IdeaPad Gaming 3 15IAH7 | |
| Dell Inspiron 16 Plus 7620 | |
| HP Victus 16-e0145ng | |
| Lenovo IdeaPad Gaming 3 15ARH7 | |
| Dell G15 5515 | |
* ... daha küçük daha iyidir
Depolama Çözümü
SSD performansı, karşılaştırma alanımızın ortasında sona eriyor. Intel'in (660p) 512 GB modeli, bir NVMe sürücüsü için ne özellikle hızlı ne de özellikle yavaştır. CPU hızı gibi - SSD hızının da nispeten sabit kalması harika.

* ... daha küçük daha iyidir
Constant Performance Reading: DiskSpd Read Loop, Queue Depth 8
Ekran Kartı
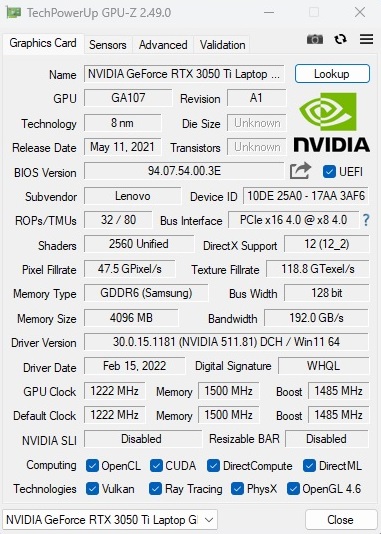
Nvidia'nın Ampere GPU'larının performansı büyük ölçüde ayarlanmış TGP'ye bağlıdır. Lenovo, kıyaslama sonuçlarına fayda sağlayan IdeaPad Gaming 3'te nispeten yüksek bir değere karar verdi. 85 Watt, bir RTX 3050 Ti için oldukça fazla. 15 inçlik dizüstü bilgisayar, 3DMarks kıyaslamalarında buna uygun olarak iyi bir performans sergiliyor. Tüm değerleri toplarsanız, RTX 3050 Ti, bu grafik kartının mevcut ortalamasından neredeyse %25 daha hızlı. Bu, bir dereceye kadar , 1000 Euro segmentinde 4 GB VRAM yerine 6 içeren RTX 3060 ile cihazları zaten alabileceğiniz gerçeğini telafi ediyor.
| 3DMark 11 Performance | 19254 puan | |
| 3DMark Cloud Gate Standard Score | 48874 puan | |
| 3DMark Fire Strike Score | 14086 puan | |
| 3DMark Time Spy Score | 6213 puan | |
Yardım | ||
* ... daha küçük daha iyidir
Oyun Performansı
Sentetik grafik testlerinden gelen olumlu eğilim, oyun testi çalışmalarımızda da devam ediyor. Bazı oyunlardaki performans, tek kanallı RAM'den önemli ölçüde düşebilse de (bu nedenle 2x 8 GB'a geçmenizi öneririz), RAM ağırlıklı olmayan oyunlar da daha düşük TGP'ye sahip bir RTX 3050 Ti'den önemli ölçüde daha hızlı çalışır.
| The Witcher 3 | |
| 1920x1080 High Graphics & Postprocessing (Nvidia HairWorks Off) | |
| Sınıf ortalaması Gaming (181 - 341, n=3, son 2 yıl) | |
| Lenovo IdeaPad Gaming 3 15IAH7 | |
| Dell Inspiron 16 Plus 7620 | |
| Lenovo IdeaPad Gaming 3 15ARH7 | |
| HP Victus 16-e0145ng | |
| Dell G15 5515 | |
| Ortalama NVIDIA GeForce RTX 3050 Ti Laptop GPU (30 - 110, n=26) | |
| 1920x1080 Ultra Graphics & Postprocessing (HBAO+) | |
| Sınıf ortalaması Gaming (95 - 240, n=8, son 2 yıl) | |
| Lenovo IdeaPad Gaming 3 15IAH7 | |
| Dell Inspiron 16 Plus 7620 | |
| Dell G15 5515 | |
| Lenovo IdeaPad Gaming 3 15ARH7 | |
| HP Victus 16-e0145ng | |
| Ortalama NVIDIA GeForce RTX 3050 Ti Laptop GPU (19 - 58.5, n=29) | |
The Witcher 3 ile 60 dakikalık sürekli testimizde göze çarpan hiçbir davranış fark etmedik. Temel olarak, IdeaPad Gaming 3 15IAH7, ışın izleme olmadan yaptığınız sürece (RTX 3050 Ti'nin bazı önemli zayıflıklar gösterdiği) 1920 x 1080 piksel doğal çözünürlükte neredeyse tüm modern oyunları yüksekten maksimuma kadar ayrıntılarla işleyebilir.)
The Witcher 3 FPS Chart
| düşük | orta | yüksek | ultra | |
|---|---|---|---|---|
| GTA V (2015) | 160.7 | 130.6 | 73.5 | |
| The Witcher 3 (2015) | 173 | 110 | 58.5 | |
| Dota 2 Reborn (2015) | 145.9 | 127.3 | 113.8 | 107.8 |
| Final Fantasy XV Benchmark (2018) | 81.5 | 58.8 | ||
| X-Plane 11.11 (2018) | 109.9 | 98.1 | 81.1 | |
| Strange Brigade (2018) | 145.5 | 117.3 | 101.3 | |
| Ghostwire Tokyo (2022) | 79.5 | 76.8 | 75.9 | |
| Tiny Tina's Wonderlands (2022) | 92.1 | 67.2 | 51.7 | |
| Vampire Bloodhunt (2022) | 111.8 | 110.9 | 106.1 | |
| F1 22 (2022) | 111 | 92 | 32 | |
| The Quarry (2022) | 69.7 | 58.3 | 45.8 |
Emisyonlar
Gürültü Emisyonları
Performans modunda, 15 inç dizüstü bilgisayar çok sessiz değil. Zaten boşta çalışma sırasında, 29 ila 32 dB(A) arasında çok fazla fan gürültüsü duyabilirsiniz. Yük altındayken, Victus 16 gibi diğer oyun dizüstü bilgisayarları da benzer şekilde yüksek ses çıkarsa da, cihaz 42 ila 54 dB(A) arasında muazzam bir ses seviyesi üretir. Ancak diğer iki güç modu sayesinde cihaz kolay ve hızlı bir şekilde sessize alınabiliyor.
Ses yüksekliği
| Boşta |
| 29 / 30 / 32 dB |
| Çalışırken |
| 42 / 54 dB |
 | ||
30 dB sessiz 40 dB(A) duyulabilirlik 50 dB(A) gürültülü |
||
min: | ||
| Lenovo IdeaPad Gaming 3 15IAH7 GeForce RTX 3050 Ti Laptop GPU, i5-12500H | Lenovo IdeaPad Gaming 3 15ARH7 GeForce RTX 3050 4GB Laptop GPU, R5 6600H | Dell G15 5515 GeForce RTX 3050 Ti Laptop GPU, R7 5800H | HP Victus 16-e0145ng GeForce RTX 3050 Ti Laptop GPU, R5 5600H | Dell Inspiron 16 Plus 7620 GeForce RTX 3050 Ti Laptop GPU, i7-12700H | |
|---|---|---|---|---|---|
| Noise | 11% | 7% | 0% | 4% | |
| kapalı / ortam * (dB) | 25 | 23.3 7% | 24 4% | 26 -4% | 23.3 7% |
| Idle Minimum * (dB) | 29 | 23.8 18% | 25 14% | 26 10% | 25.7 11% |
| Idle Average * (dB) | 30 | 23.8 21% | 26 13% | 28 7% | 26.1 13% |
| Idle Maximum * (dB) | 32 | 27.2 15% | 30 6% | 34 -6% | 30.6 4% |
| Load Average * (dB) | 42 | 34.8 17% | 44 -5% | 44 -5% | 46.2 -10% |
| Witcher 3 ultra * (dB) | 46 | 49.3 -7% | 44 4% | 48 -4% | 49.2 -7% |
| Load Maximum * (dB) | 54 | 49.4 9% | 48 11% | 53 2% | 49.4 9% |
* ... daha küçük daha iyidir
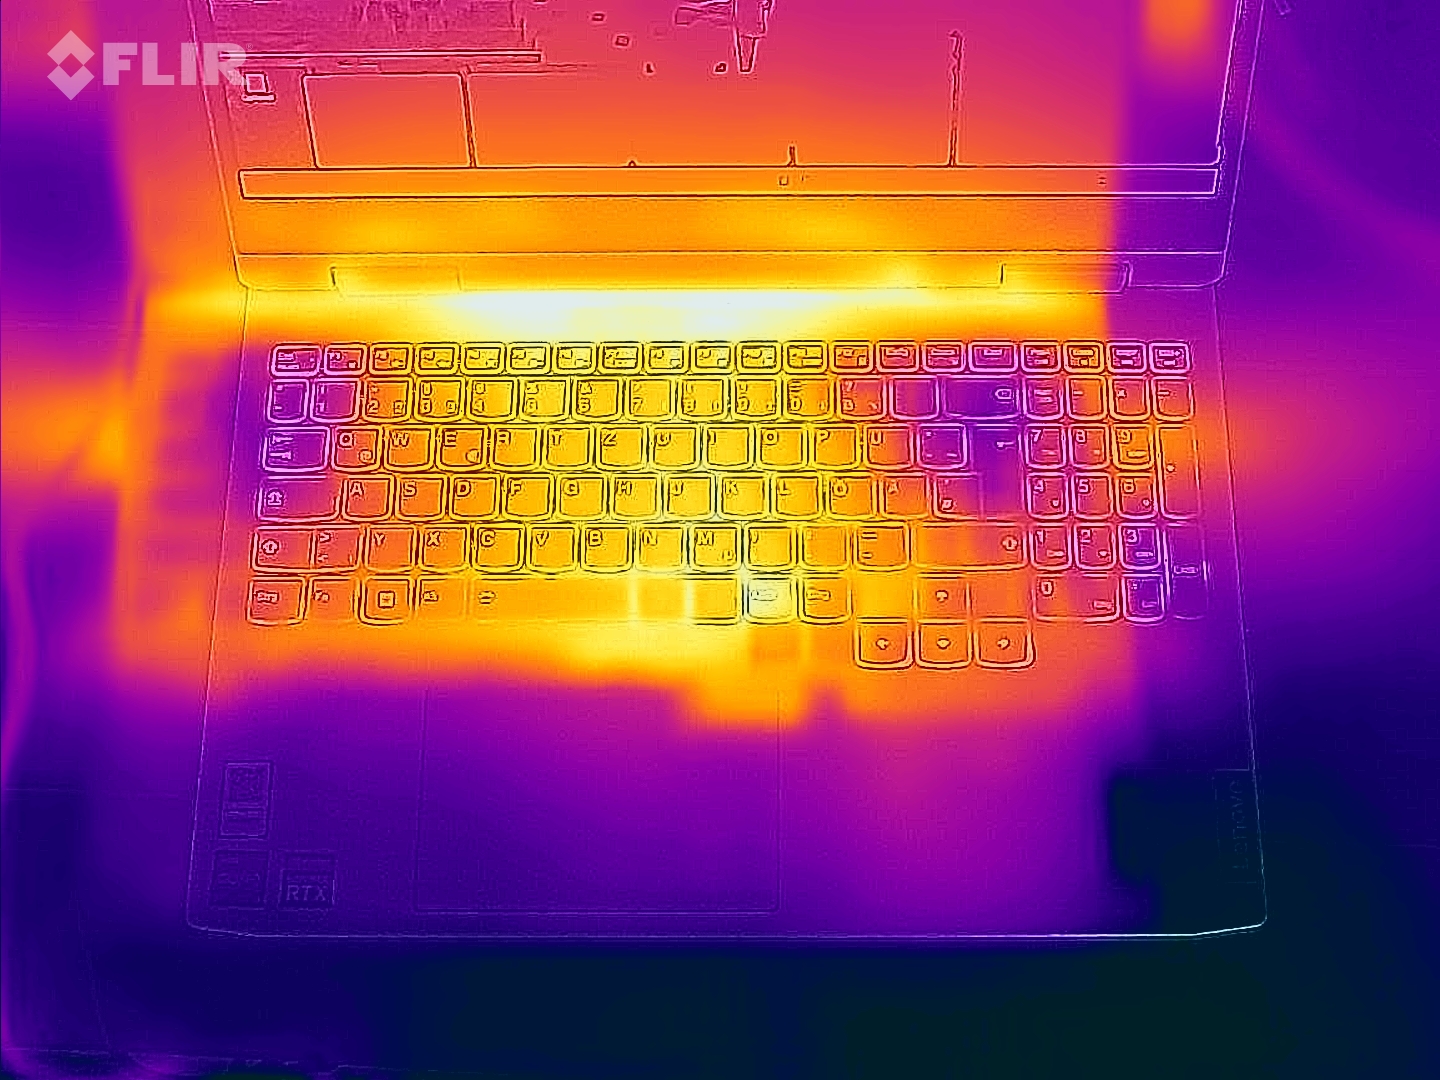
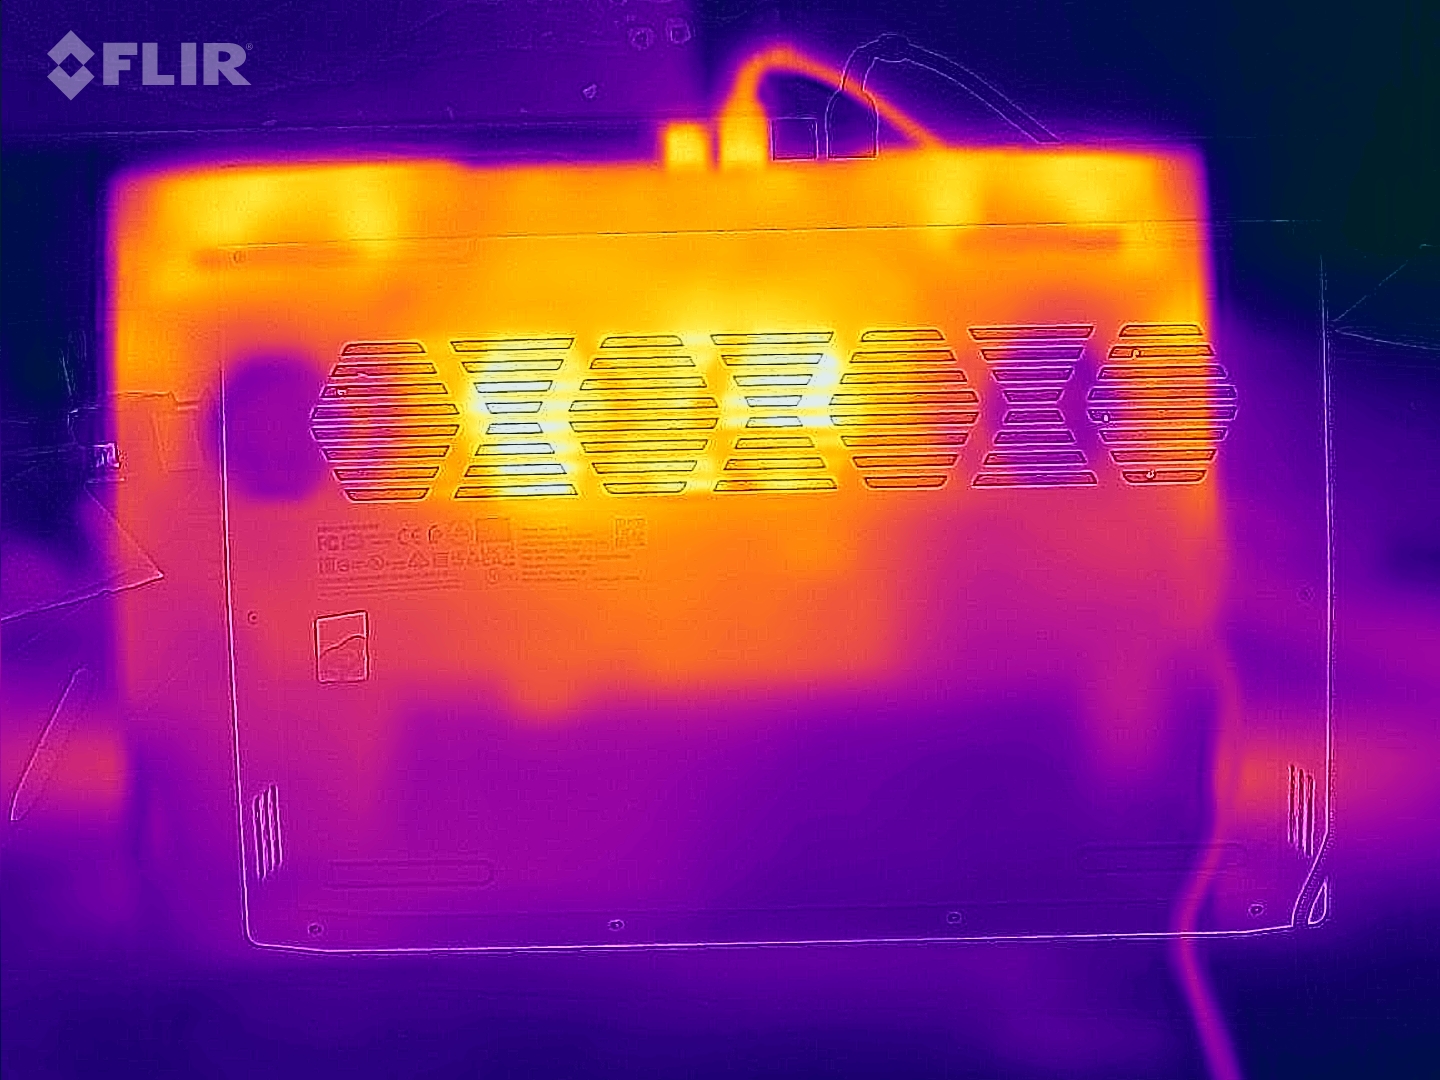
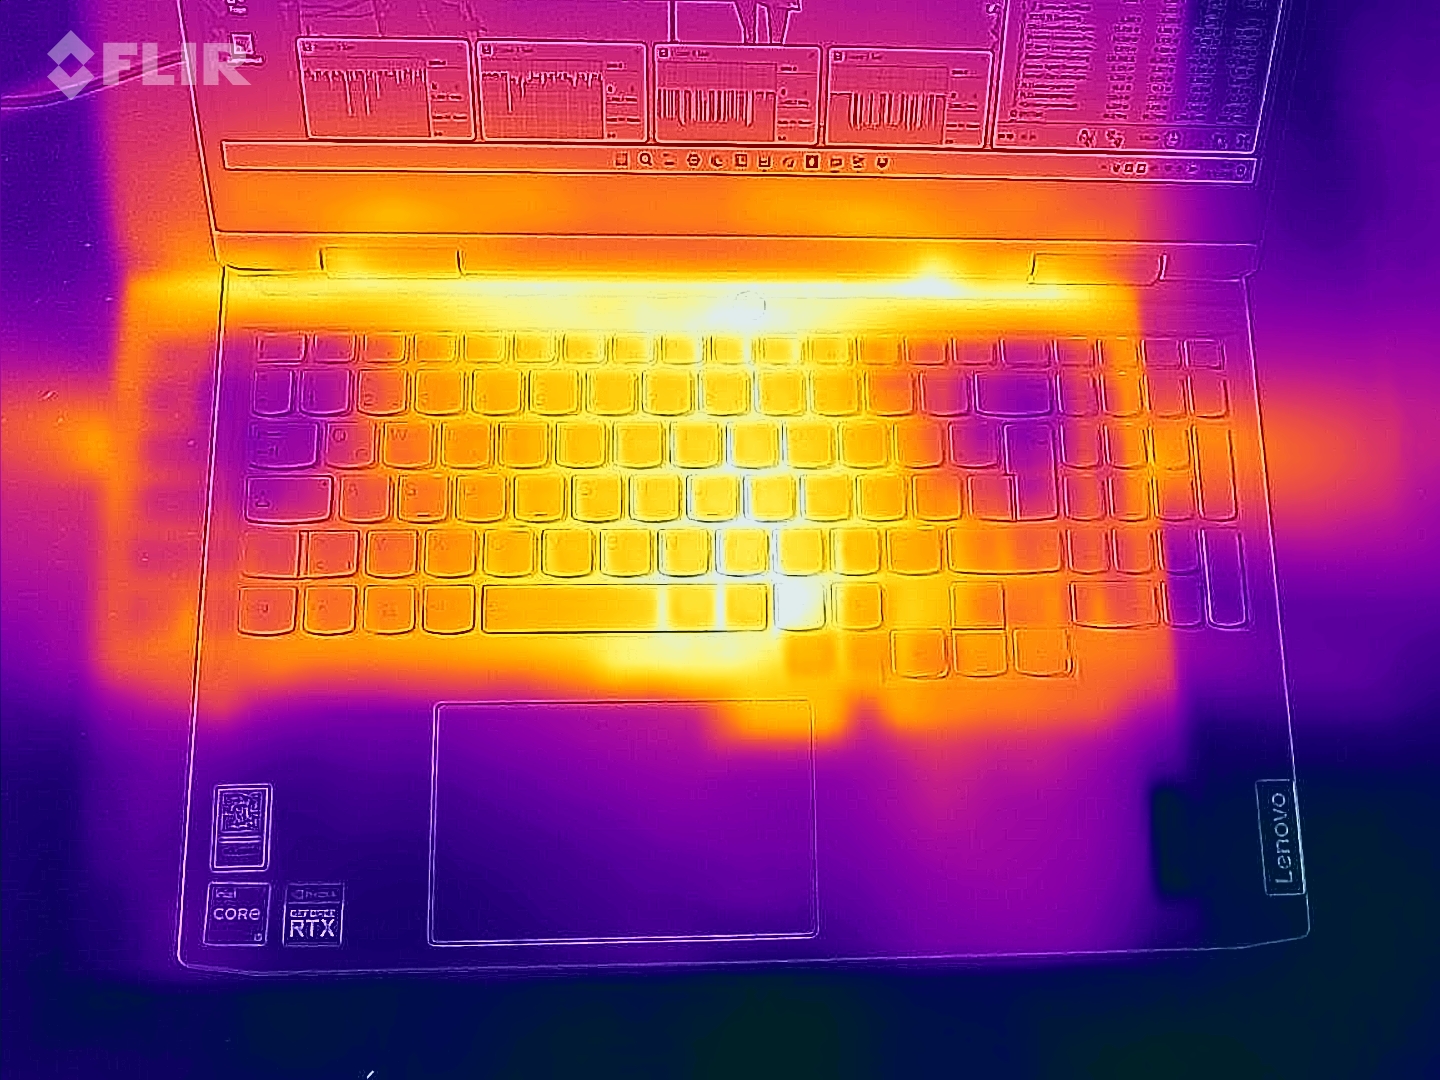
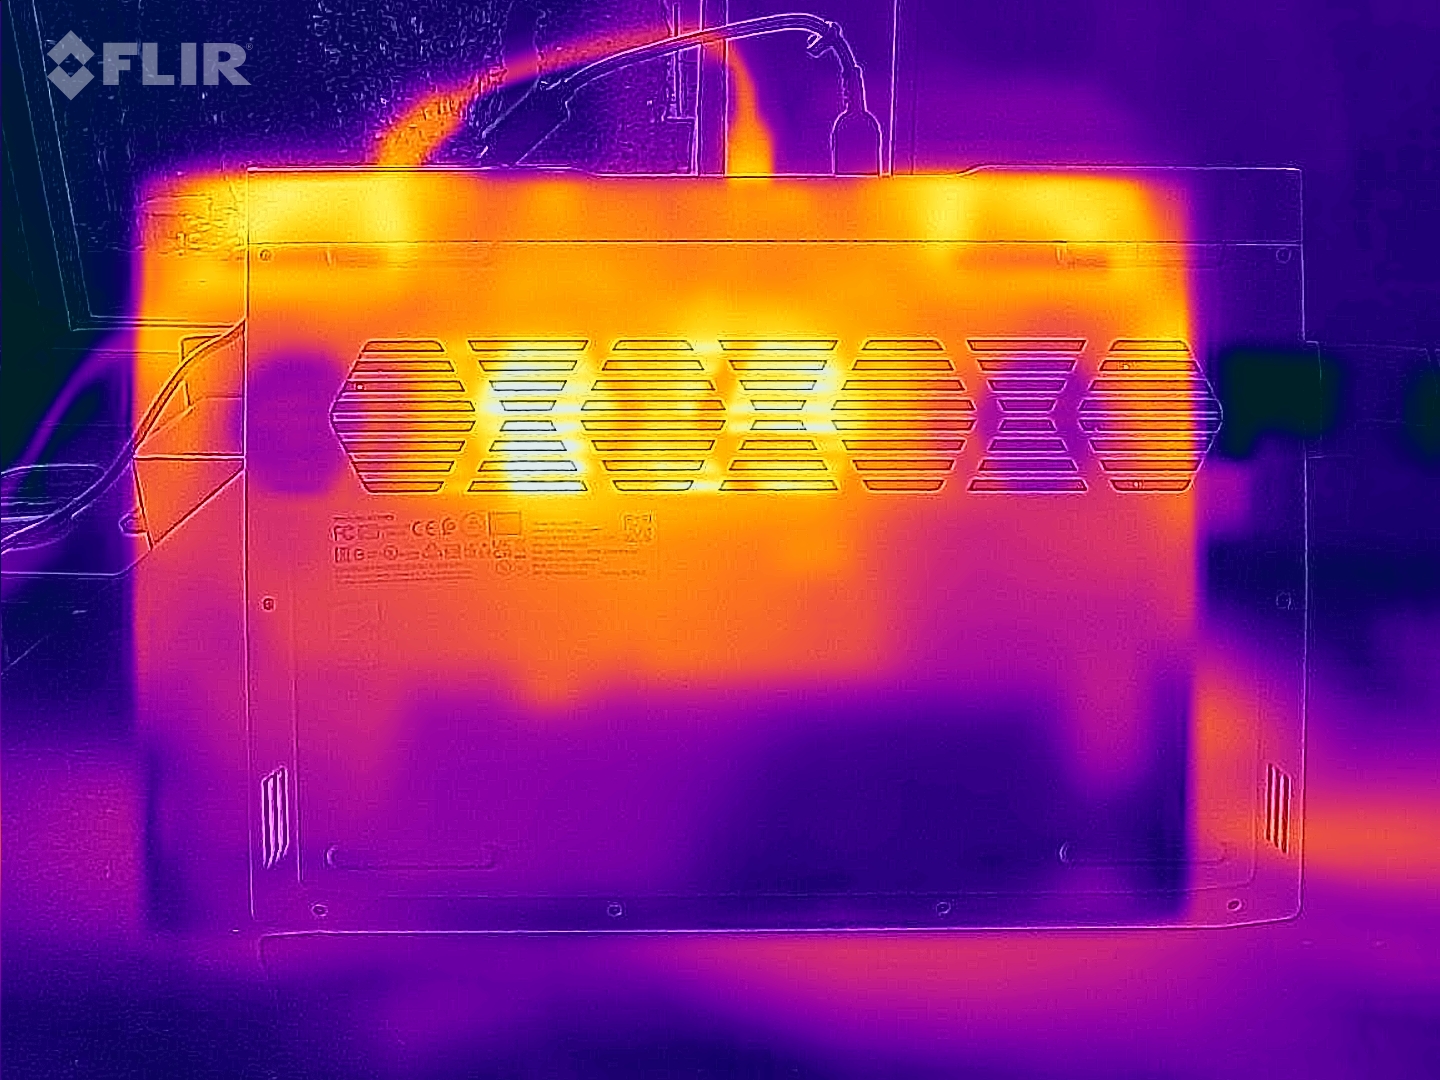
Sıcaklıklar
Sıcaklık gelişimi de bir oyun dizüstü bilgisayarı için tipiktir. Lenovo aygıtı boşta çalışma sırasında rahat bir şekilde serin kalırken, 3D çalışma sırasında sıcaklıklar üstte 47 °C'ye (~117 °F) ve altta 52 °C'ye (~126 °F) ulaşır. Bu yüzden dizüstü bilgisayar kucağınızdayken oyun oynamayı denememelisiniz.
(-) Üst taraftaki maksimum sıcaklık, 40.4 °C / 105 F ortalamasına kıyasla 47 °C / 117 F'dir. , Gaming sınıfı için 21.2 ile 68.8 °C arasında değişir.
(-) Alt kısım, 43.2 °C / 110 F ortalamasına kıyasla maksimum 52 °C / 126 F'ye kadar ısınır
(+) Boşta kullanımda, üst tarafın ortalama sıcaklığı 24.2 °C / 76 F olup, cihazın 33.9 °C / 93 F.
(-) The Witcher 3 oynarken, üst tarafın ortalama sıcaklığı 39.2 °C / 103 F olup, cihazın 33.9 °C / 93 F.
(±) Avuç içi dayanakları ve dokunmatik yüzey maksimum 37 °C / 98.6 F ile dokunulamayacak kadar ısınabilir.
(-) Benzer cihazların avuç içi dayanağı alanının ortalama sıcaklığı 28.8 °C / 83.8 F (-8.2 °C / -14.8 F) idi.
| Lenovo IdeaPad Gaming 3 15IAH7 GeForce RTX 3050 Ti Laptop GPU, i5-12500H | Lenovo IdeaPad Gaming 3 15ARH7 GeForce RTX 3050 4GB Laptop GPU, R5 6600H | Dell G15 5515 GeForce RTX 3050 Ti Laptop GPU, R7 5800H | HP Victus 16-e0145ng GeForce RTX 3050 Ti Laptop GPU, R5 5600H | Dell Inspiron 16 Plus 7620 GeForce RTX 3050 Ti Laptop GPU, i7-12700H | |
|---|---|---|---|---|---|
| Heat | -3% | -3% | -25% | -8% | |
| Maximum Upper Side * (°C) | 47 | 47.6 -1% | 50 -6% | 54 -15% | 46 2% |
| Maximum Bottom * (°C) | 52 | 46.6 10% | 49 6% | 47 10% | 45.8 12% |
| Idle Upper Side * (°C) | 25 | 27.2 -9% | 26 -4% | 41 -64% | 29.2 -17% |
| Idle Bottom * (°C) | 24 | 27.2 -13% | 26 -8% | 31 -29% | 31 -29% |
* ... daha küçük daha iyidir
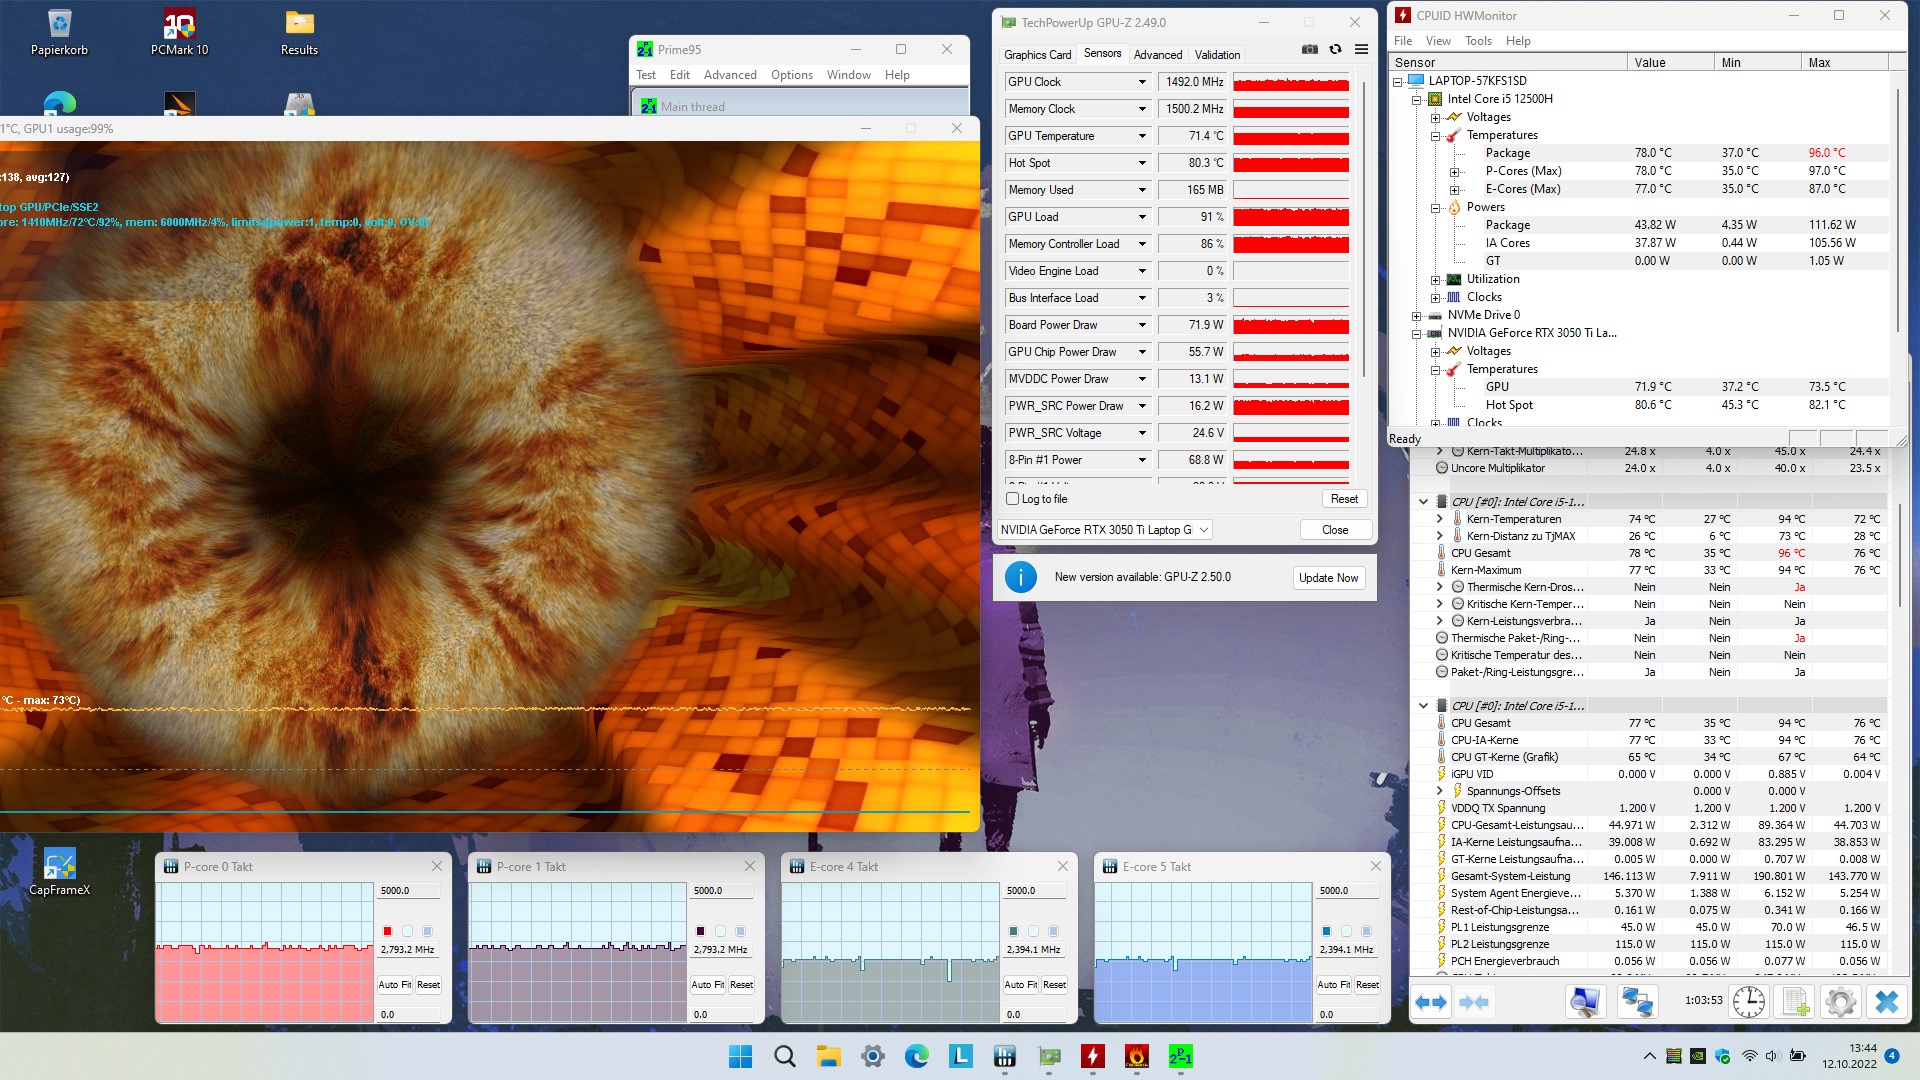
Stres testi
Bir saatlik FurMark & Prime95 ile yapılan stres testi, garip bir şey ortaya çıkarmaz. 15 inçlik dizüstü bilgisayar, kısıtlamalardan ve kritik donanım değerlerinden uzak durur. Tam yük altında GPU için yaklaşık 71 °C (~160 °F) ve CPU için 78 °C (~172 °F) ortalama değerler olarak kabul edilir.
Hoparlörler
Lenovo IdeaPad Gaming 3 15IAH7 ses analizi
(+) | hoparlörler nispeten yüksek sesle çalabilir (83 dB)
Bas 100 - 315Hz
(-) | neredeyse hiç bas yok - ortalama olarak medyandan 17.1% daha düşük
(±) | Bas doğrusallığı ortalamadır (12.8% delta - önceki frekans)
Ortalar 400 - 2000 Hz
(±) | daha yüksek ortalar - ortalama olarak medyandan 5.6% daha yüksek
(+) | orta frekanslar doğrusaldır (4.5% deltadan önceki frekansa)
Yüksekler 2 - 16 kHz
(+) | dengeli yüksekler - medyandan yalnızca 2% uzakta
(+) | yüksekler doğrusaldır (4.6% deltadan önceki frekansa)
Toplam 100 - 16.000 Hz
(+) | genel ses doğrusaldır (14.4% ortancaya göre fark)
Aynı sınıfla karşılaştırıldığında
» Bu sınıftaki tüm test edilen cihazların %27%'si daha iyi, 7% benzer, 66% daha kötüydü
» En iyisinin deltası 6% idi, ortalama 18% idi, en kötüsü 132% idi
Test edilen tüm cihazlarla karşılaştırıldığında
» Test edilen tüm cihazların %18'si daha iyi, 4 benzer, % 78 daha kötüydü
» En iyisinin deltası 4% idi, ortalama 24% idi, en kötüsü 134% idi
Dell G15 5515 ses analizi
(±) | hoparlör ses yüksekliği ortalama ama iyi (76 dB)
Bas 100 - 315Hz
(-) | neredeyse hiç bas yok - ortalama olarak medyandan 22% daha düşük
(±) | Bas doğrusallığı ortalamadır (14.9% delta - önceki frekans)
Ortalar 400 - 2000 Hz
(+) | dengeli ortalar - medyandan yalnızca 2.8% uzakta
(+) | orta frekanslar doğrusaldır (3% deltadan önceki frekansa)
Yüksekler 2 - 16 kHz
(+) | dengeli yüksekler - medyandan yalnızca 1.4% uzakta
(+) | yüksekler doğrusaldır (3.7% deltadan önceki frekansa)
Toplam 100 - 16.000 Hz
(±) | Genel sesin doğrusallığı ortalamadır (16.8% ortancaya göre fark)
Aynı sınıfla karşılaştırıldığında
» Bu sınıftaki tüm test edilen cihazların %44%'si daha iyi, 11% benzer, 46% daha kötüydü
» En iyisinin deltası 6% idi, ortalama 18% idi, en kötüsü 132% idi
Test edilen tüm cihazlarla karşılaştırıldığında
» Test edilen tüm cihazların %29'si daha iyi, 8 benzer, % 63 daha kötüydü
» En iyisinin deltası 4% idi, ortalama 24% idi, en kötüsü 134% idi
Güç yönetimi
Güç tüketimi
Güç tüketimi de göze çarpmıyor. Ortalama olarak Gaming 3, diğer RTX 3050 Ti dizüstü bilgisayarlardan biraz daha fazla güç tüketse de, bunun başlıca nedeni daha yüksek TGP'dir.
| Kapalı / Bekleme modu | |
| Boşta | |
| Çalışırken |
|
Key:
min: | |
| Lenovo IdeaPad Gaming 3 15IAH7 GeForce RTX 3050 Ti Laptop GPU, i5-12500H | Lenovo IdeaPad Gaming 3 15ARH7 GeForce RTX 3050 4GB Laptop GPU, R5 6600H | Dell G15 5515 GeForce RTX 3050 Ti Laptop GPU, R7 5800H | HP Victus 16-e0145ng GeForce RTX 3050 Ti Laptop GPU, R5 5600H | Dell Inspiron 16 Plus 7620 GeForce RTX 3050 Ti Laptop GPU, i7-12700H | Sınıf ortalaması Gaming | |
|---|---|---|---|---|---|---|
| Power Consumption | 8% | 7% | 5% | 6% | -53% | |
| Idle Minimum * (Watt) | 8 | 7.7 4% | 5 37% | 7 12% | 6.8 15% | 13.2 ? -65% |
| Idle Average * (Watt) | 10 | 9.1 9% | 9 10% | 9 10% | 9.6 4% | 18.9 ? -89% |
| Idle Maximum * (Watt) | 16 | 15.6 2% | 20 -25% | 15 6% | 17 -6% | 24.3 ? -52% |
| Load Average * (Watt) | 99 | 90.7 8% | 94 5% | 93 6% | 117.5 -19% | 108 ? -9% |
| Witcher 3 ultra * (Watt) | 144.6 | 122.9 15% | 123 15% | 134.5 7% | 113.1 22% | |
| Load Maximum * (Watt) | 168 | 155.2 8% | 172 -2% | 185 -10% | 137.4 18% | 254 ? -51% |
* ... daha küçük daha iyidir
The Witcher 3 tüketimi / Stress Test
Harici bir monitörle enerji tüketimi
Pil ömrü
Modele bağlı olarak IdeaPad, 45 Wh veya 60 Wh pil sunar. Test edilen Intel sürümü, AMD kardeşinin aksine, neyse ki daha güçlü pil ile puan alabiliyor. Ancak, daha yüksek tüketim nedeniyle, farklılıklar sınırlar içinde kalmaktadır. Sadece 6 saat olan pil ömrü, 150 cd/m²'ye düşürülen bir ekran parlaklığında kablosuz internette gezinme sırasında AMD versiyonundan bile biraz daha düşük çıkıyor. Diğer rakipler de bu konuda önde.
| Lenovo IdeaPad Gaming 3 15IAH7 GeForce RTX 3050 Ti Laptop GPU, i5-12500H, 60 Wh | Lenovo IdeaPad Gaming 3 15ARH7 GeForce RTX 3050 4GB Laptop GPU, R5 6600H, 45 Wh | Dell G15 5515 GeForce RTX 3050 Ti Laptop GPU, R7 5800H, 56 Wh | HP Victus 16-e0145ng GeForce RTX 3050 Ti Laptop GPU, R5 5600H, 70 Wh | Dell Inspiron 16 Plus 7620 GeForce RTX 3050 Ti Laptop GPU, i7-12700H, 86 Wh | Sınıf ortalaması Gaming | |
|---|---|---|---|---|---|---|
| Pil Çalışma Süresi | 10% | 36% | 20% | 63% | 19% | |
| WiFi v1.3 (h) | 5.9 | 6.5 10% | 8 36% | 7.1 20% | 9.6 63% | 7.02 ? 19% |
| Reader / Idle (h) | 2.4 | 13.5 | 18.6 | 8.71 ? | ||
| Load (h) | 0.9 | 1.5 | 1.2 | 1.47 ? | ||
| H.264 (h) | 8.8 | 8.26 ? |
Artılar
Eksiler
Son Görüş
Kasanın malzeme ve işçilik açısından vasat kalitesini göz ardı edecek olursak Lenovo, IdeaPad Gaming 3 15IAH7 ile bütçesine uygun başarılı bir oyun dizüstü bilgisayarı ortaya çıkarmış.
Yüksek TDP'ler ve sürekli performans gelişimi sayesinde Core i5-12500H ve GeForce RTX 3050 Ti tam güçlerini gösterirken, (çoğunlukla daha yavaş olan) rakipleri daha iyi bir pil ömrü sunuyor. Ancak alternatif laptopların neredeyse hiçbiri Gaming 3'ün görüntü kalitesine ulaşamıyor. Renk alanı ve parlaklık konusunda rakiplerinin çoğu geride kalıyor. Karşılaştırma alanımızda yalnızca Dell Inspiron 16 Plus, Lenovo dizüstü bilgisayarın yanına yaklaşabiliyor.
İyi bir ekran bekleyen ancak bir oyun dizüstü bilgisayarı için çok fazla para harcamak istemeyenler, IdeaPad Gaming 3 15IAH7'ye daha yakından bakmalıdır.
Fiyat ve Stok Durumu
Bu test sırasında, Core i5-12500H, GeForce RTX 3050 Ti, 8 GB RAM ve 512 GB SSD'ye sahip IdeaPad Gaming 3 15IAH7, BestBuy'dan 1031$'a satılıyor.
Lenovo IdeaPad Gaming 3 15IAH7
- 10/14/2022 v7 (old)
Florian Glaser
Price comparison

