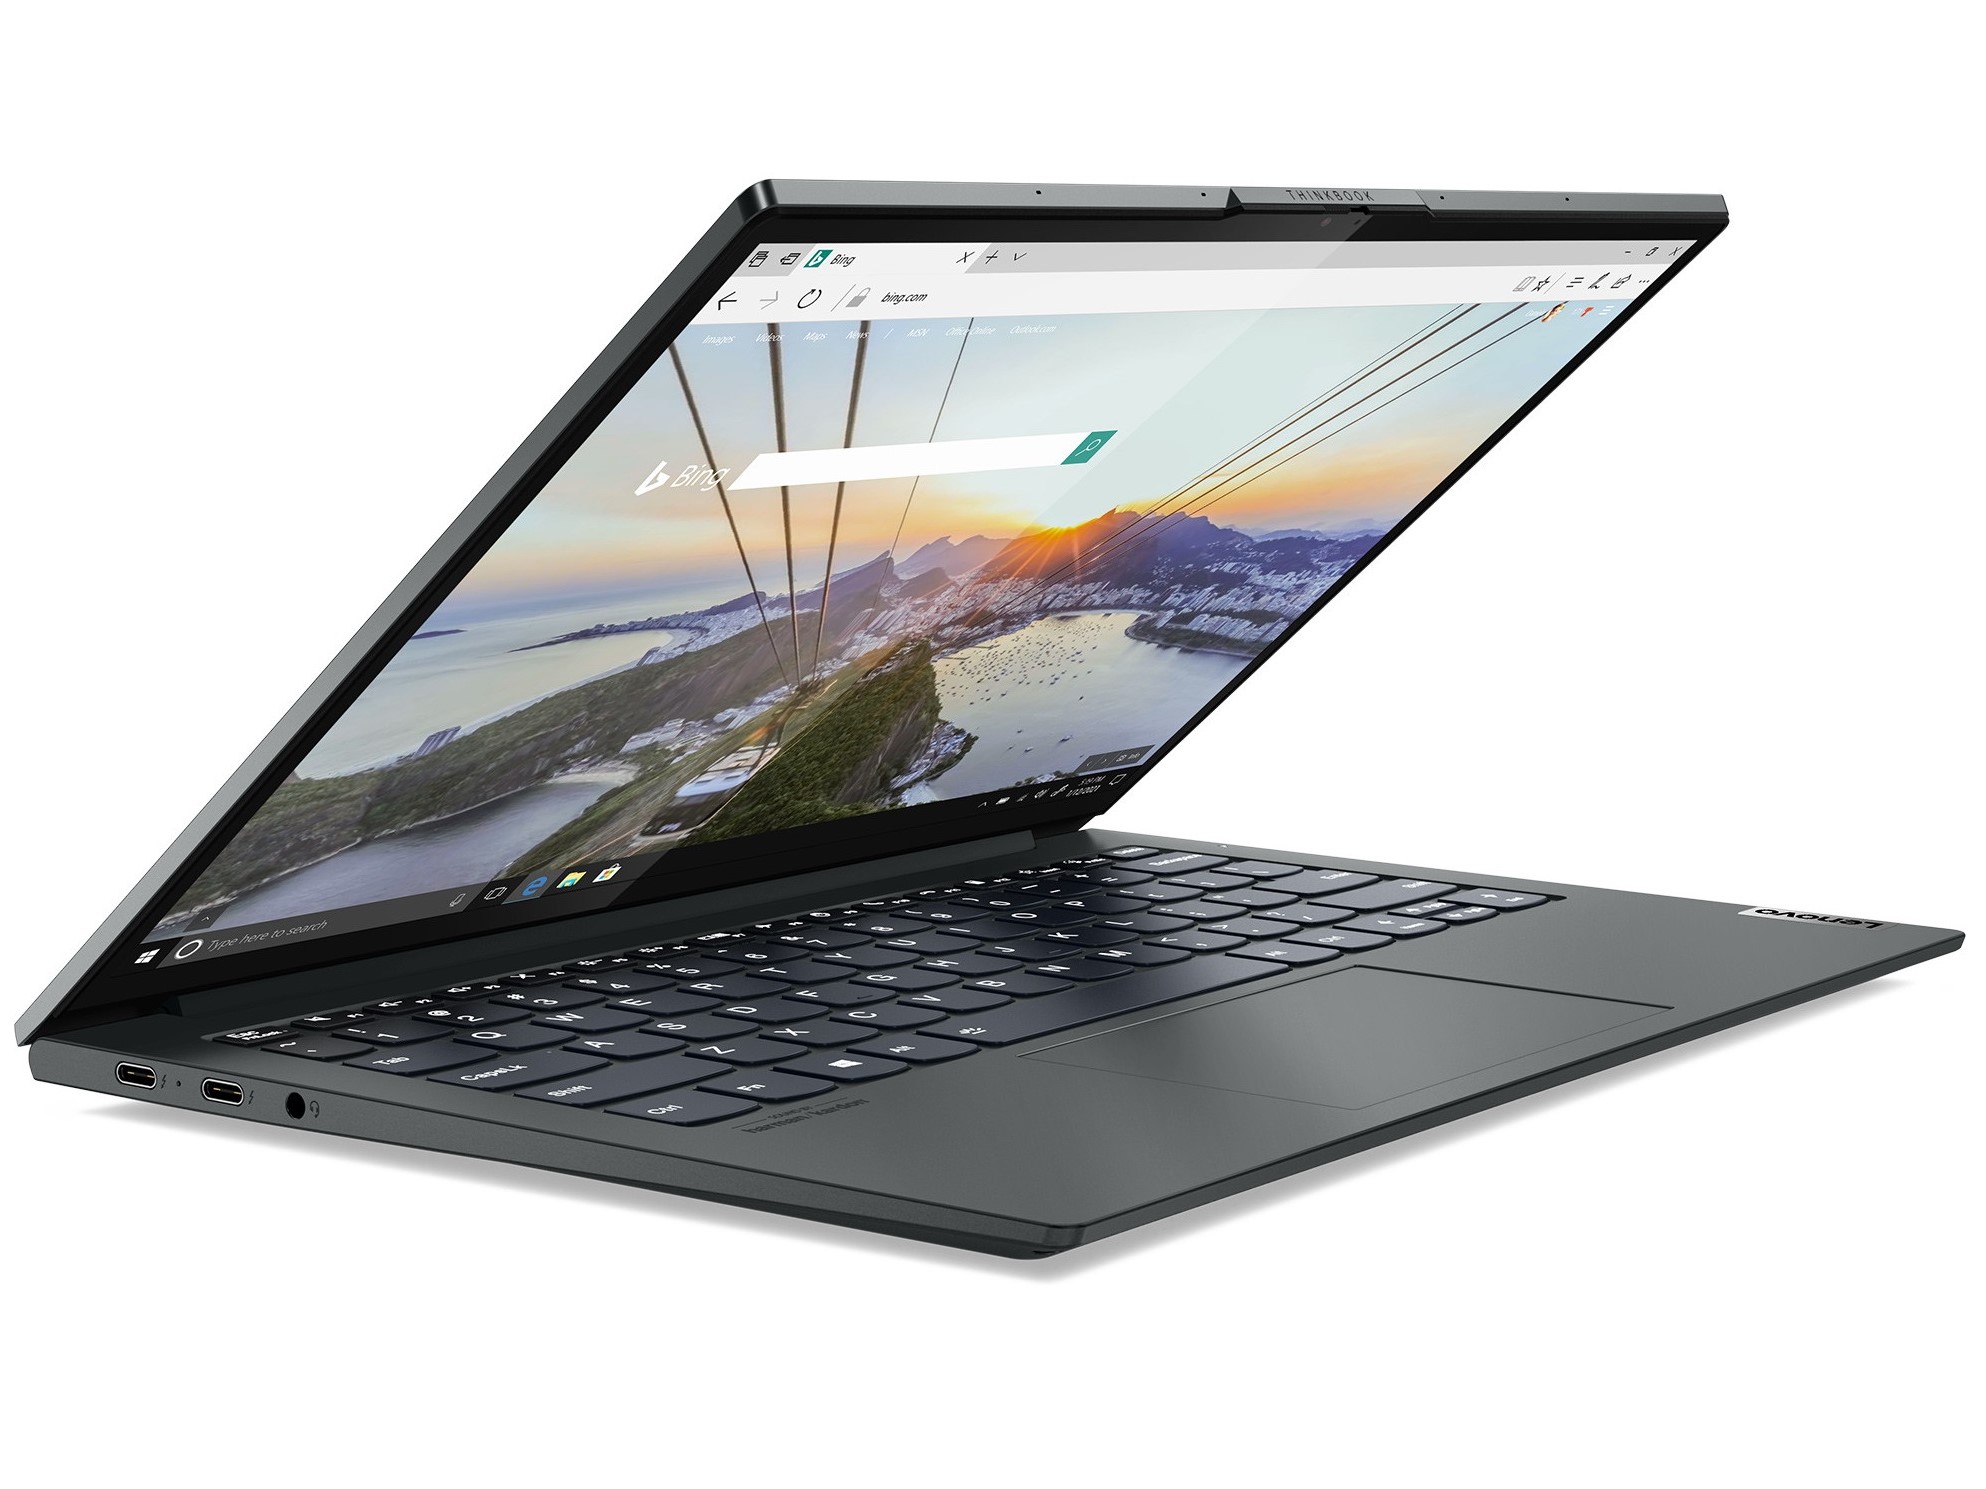
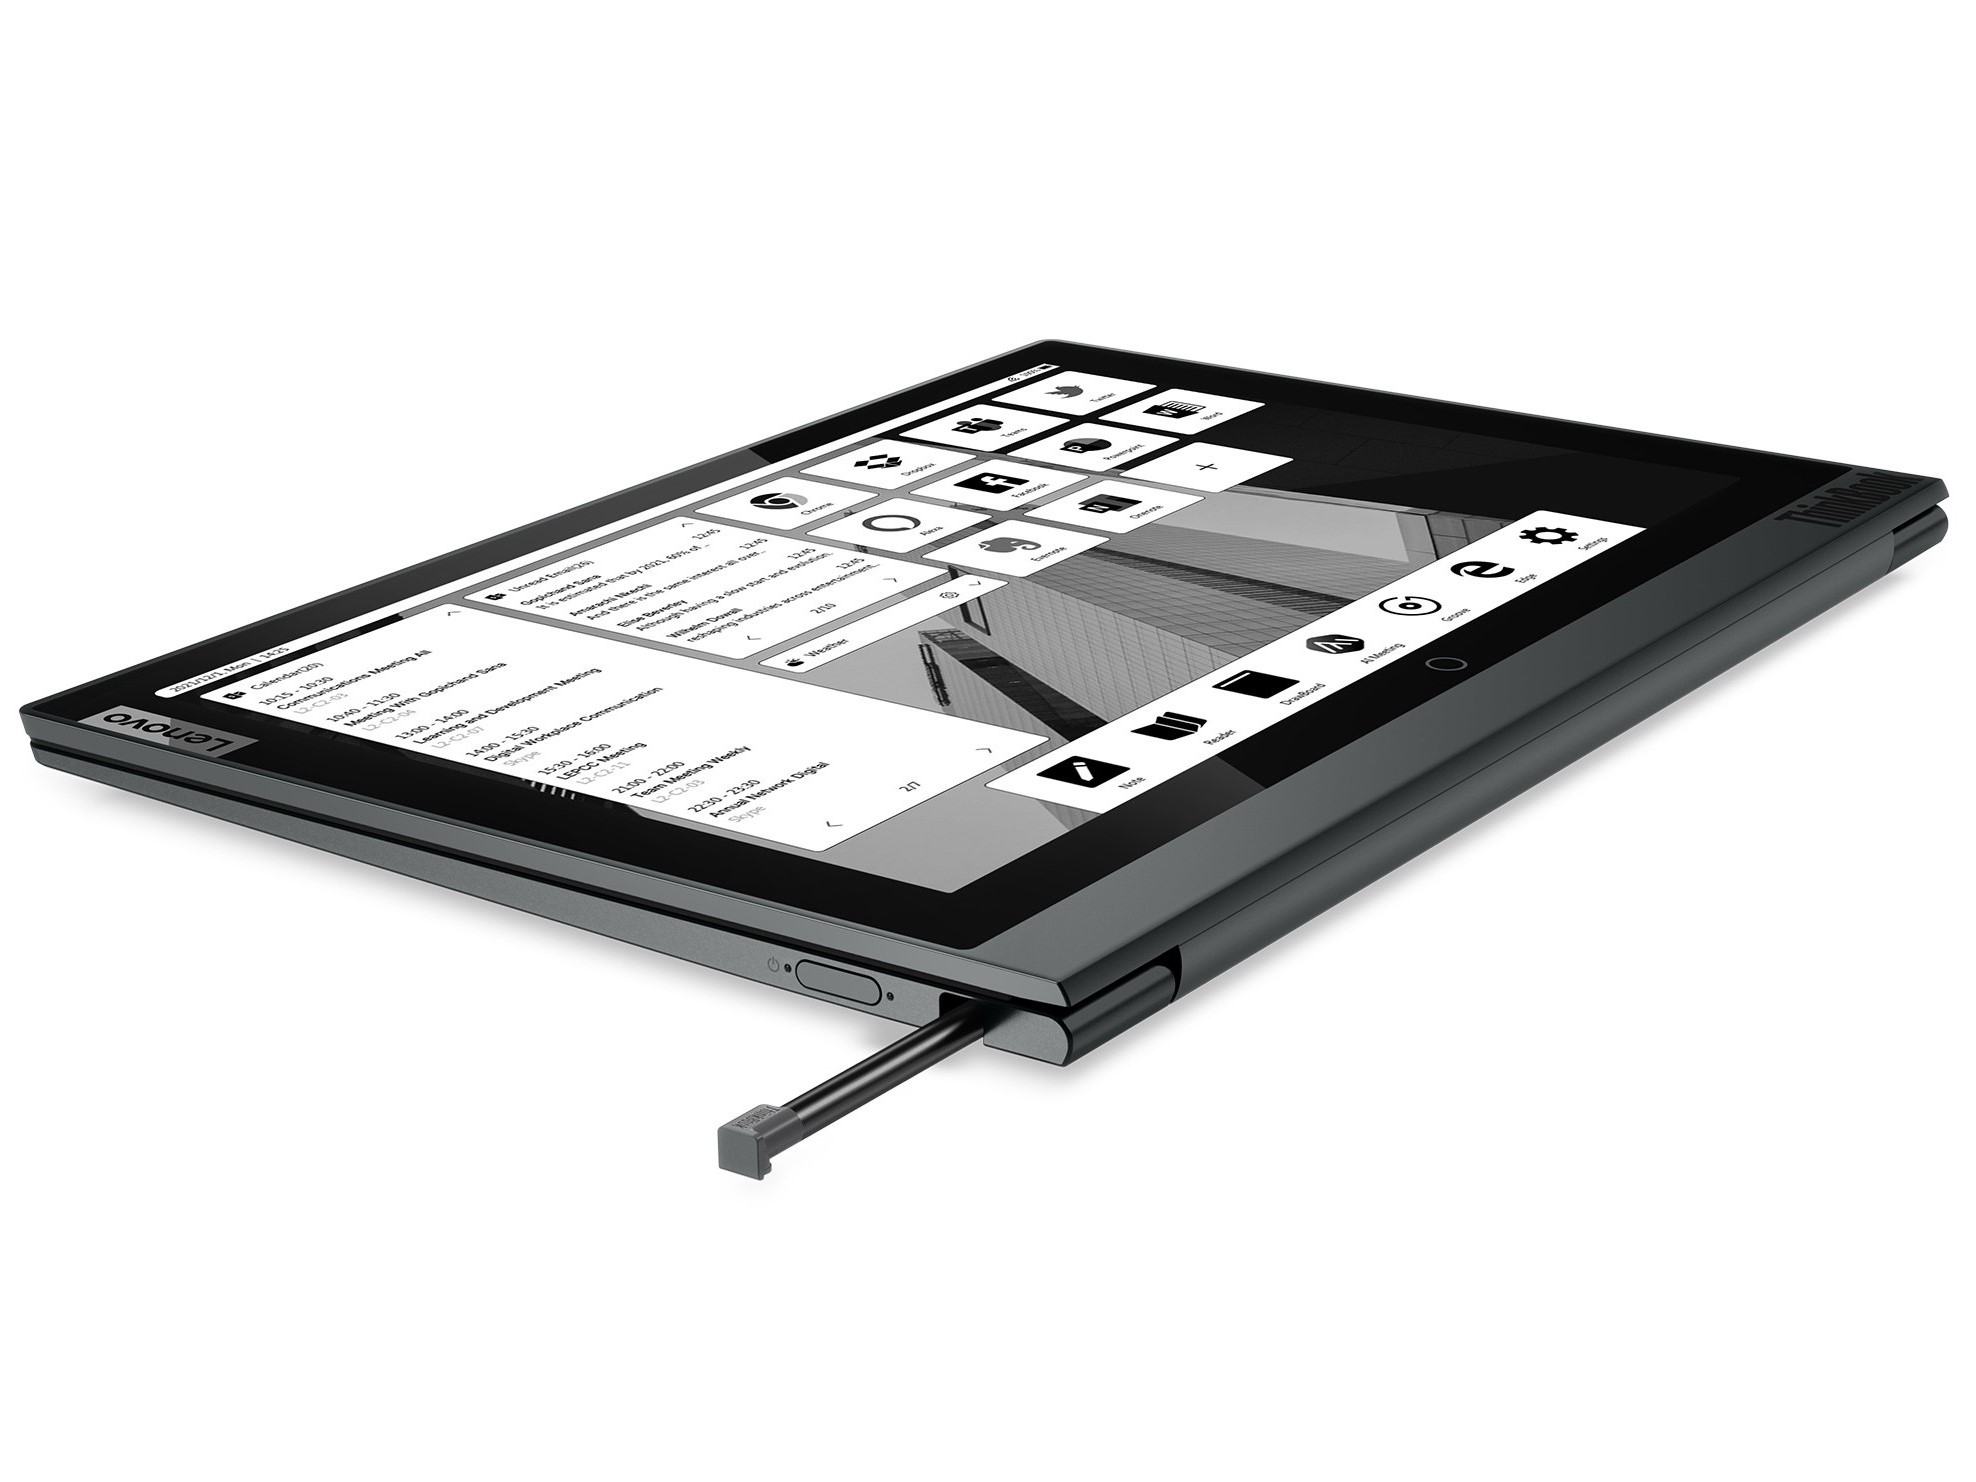
Lenovo ThinkBook Plus Gen2 rövid értékelés: E-ink laptop érintőképernyővel
Possible competitors in comparison
Derecelendirme | Tarih | Modeli | Ağırlık | Yükseklik | Boyut | Çözünürlük | Fiyat |
|---|---|---|---|---|---|---|---|
| 86.1 % v7 (old) | 12/2021 | Lenovo ThinkBook Plus Gen2 Core i5 i5-1130G7, Iris Xe G7 80EUs | 1.2 kg | 13.9 mm | 13.30" | 2560x1600 | |
| 86.9 % v7 (old) | 03/2020 | Lenovo ThinkBook Plus 13 i7 i7-10510U, UHD Graphics 620 | 1.4 kg | 17.4 mm | 13.30" | 1920x1080 | |
| 84.4 % v7 (old) | 12/2021 | HP Pavilion Aero 13 be0097nr R7 5800U, Vega 8 | 953 g | 17 mm | 13.30" | 1920x1200 | |
| 85.7 % v7 (old) | Acer Spin 3 SP313-51N-56YV i5-1135G7, Iris Xe G7 80EUs | 1.4 kg | 16 mm | 13.30" | 2560x1600 | ||
| 85.4 % v7 (old) | 06/2021 | Samsung Galaxy Book Pro 360 13 i5-1135G7, Iris Xe G7 80EUs | 1.1 kg | 13 mm | 13.20" | 1920x1080 |

Connection equipment
| Networking | |
| iperf3 transmit AX12 | |
| Lenovo ThinkBook Plus Gen2 Core i5 | |
| Ortalama Intel Wi-Fi 6 AX201 (49.8 - 1775, n=324) | |
| Samsung Galaxy Book Pro 360 13 | |
| Lenovo ThinkBook Plus 13 i7 | |
| Acer Spin 3 SP313-51N-56YV | |
| HP Pavilion Aero 13 be0097nr | |
| iperf3 receive AX12 | |
| Lenovo ThinkBook Plus Gen2 Core i5 | |
| Samsung Galaxy Book Pro 360 13 | |
| Ortalama Intel Wi-Fi 6 AX201 (136 - 1743, n=324) | |
| Acer Spin 3 SP313-51N-56YV | |
| HP Pavilion Aero 13 be0097nr | |
| Lenovo ThinkBook Plus 13 i7 | |


| |||||||||||||||||||||||||
Aydınlatma: 94 %
Batarya modunda parlaklık: 403 cd/m²
Kontrast: 1683:1 (Siyah: 0.24 cd/m²)
ΔE ColorChecker Calman: 3.1 | ∀{0.5-29.43 Ø4.71}
calibrated: 1.3
ΔE Greyscale Calman: 3.7 | ∀{0.09-98 Ø4.96}
72.2% AdobeRGB 1998 (Argyll 3D)
98% sRGB (Argyll 3D)
70.1% Display P3 (Argyll 3D)
Gamma: 2.26
CCT: 5936 K
| Lenovo ThinkBook Plus Gen2 Core i5 CSOT T3 MND307DA1-5 (LCD), IPS, E-Ink, 2560x1600, 13.3" | Lenovo ThinkBook Plus 13 i7 LP133WF7-SPB1, IPS LED, 1920x1080, 13.3" | HP Pavilion Aero 13 be0097nr AU Optronics AUO6496, IPS, 1920x1200, 13.3" | Acer Spin 3 SP313-51N-56YV AU Optronics AUOB493, IPS, 2560x1600, 13.3" | Samsung Galaxy Book Pro 360 13 AMOLED, 1920x1080, 13.2" | |
|---|---|---|---|---|---|
| Display | -5% | 4% | 7% | 26% | |
| Display P3 Coverage (%) | 70.1 | 66 -6% | 73.4 5% | 78.8 12% | 99.4 42% |
| sRGB Coverage (%) | 98 | 96.1 -2% | 99.8 2% | 99.8 2% | 100 2% |
| AdobeRGB 1998 Coverage (%) | 72.2 | 67 -7% | 74.8 4% | 77.6 7% | 96 33% |
| Response Times | -20% | -6% | -25% | 94% | |
| Response Time Grey 50% / Grey 80% * (ms) | 42.8 ? | 53.6 ? -25% | 42.4 ? 1% | 52 ? -21% | 2 ? 95% |
| Response Time Black / White * (ms) | 28 ? | 32 ? -14% | 31.6 ? -13% | 36 ? -29% | 2 ? 93% |
| PWM Frequency (Hz) | 60 ? | ||||
| Screen | -30% | 1% | -32% | 219% | |
| Brightness middle (cd/m²) | 404 | 328 -19% | 473.9 17% | 338 -16% | 287 -29% |
| Brightness (cd/m²) | 388 | 329 -15% | 458 18% | 307 -21% | 289 -26% |
| Brightness Distribution (%) | 94 | 89 -5% | 91 -3% | 83 -12% | 96 2% |
| Black Level * (cd/m²) | 0.24 | 0.21 12% | 0.36 -50% | 0.27 -13% | 0.01 96% |
| Contrast (:1) | 1683 | 1562 -7% | 1316 -22% | 1252 -26% | 28700 1605% |
| Colorchecker dE 2000 * | 3.1 | 6.4 -106% | 2.99 4% | 4.63 -49% | 2.24 28% |
| Colorchecker dE 2000 max. * | 6.9 | 11.2 -62% | 4.35 37% | 9.99 -45% | 3.69 47% |
| Colorchecker dE 2000 calibrated * | 1.3 | 1.2 8% | 1.1 15% | 1.64 -26% | |
| Greyscale dE 2000 * | 3.7 | 6.5 -76% | 4 -8% | 6.76 -83% | 2.73 26% |
| Gamma | 2.26 97% | 2.87 77% | 2.35 94% | 2.37 93% | 2.46 89% |
| CCT | 5936 110% | 6428 101% | 6269 104% | 5934 110% | 6523 100% |
| Color Space (Percent of AdobeRGB 1998) (%) | 61.6 | 68 | |||
| Color Space (Percent of sRGB) (%) | 95.9 | 98 | |||
| Toplam Ortalama (Program / Ayarlar) | -18% /
-23% | -0% /
1% | -17% /
-23% | 113% /
155% |
* ... daha küçük daha iyidir
Yanıt Sürelerini Görüntüle
| ↔ Tepki Süresi Siyahtan Beyaza | ||
|---|---|---|
| 28 ms ... yükseliş ↗ ve sonbahar↘ birleşimi | ↗ 14 ms yükseliş | 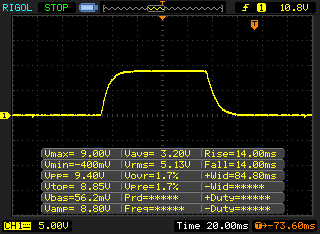 |
| ↘ 14 ms sonbahar | ||
| Ekran, testlerimizde nispeten yavaş yanıt oranları gösteriyor ve oyuncular için çok yavaş olabilir. Karşılaştırıldığında, test edilen tüm cihazlar 0.1 (minimum) ile 240 (maksimum) ms arasında değişir. » Tüm cihazların 71 %'si daha iyi. Bu, ölçülen yanıt süresinin test edilen tüm cihazların ortalamasından (19.8 ms) daha kötü olduğu anlamına gelir. | ||
| ↔ Tepki Süresi %50 Griden %80 Griye | ||
| 42.8 ms ... yükseliş ↗ ve sonbahar↘ birleşimi | ↗ 21.6 ms yükseliş | 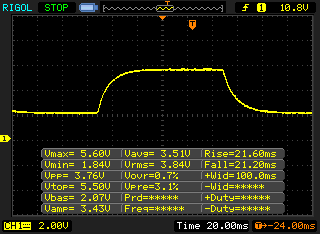 |
| ↘ 21.2 ms sonbahar | ||
| Ekran, testlerimizde yavaş yanıt oranları gösteriyor ve oyuncular için yetersiz olacaktır. Karşılaştırıldığında, test edilen tüm cihazlar 0.165 (minimum) ile 636 (maksimum) ms arasında değişir. » Tüm cihazların 70 %'si daha iyi. Bu, ölçülen yanıt süresinin test edilen tüm cihazların ortalamasından (31 ms) daha kötü olduğu anlamına gelir. | ||
Ekran Titremesi / PWM (Darbe Genişliği Modülasyonu)
| Ekran titriyor / PWM algılanmadı | 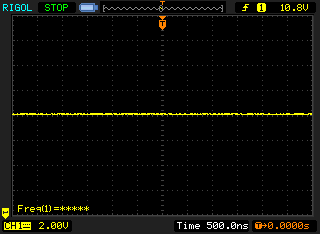 | ||
Karşılaştırıldığında: Test edilen tüm cihazların %52 %'si ekranı karartmak için PWM kullanmıyor. PWM tespit edilirse, ortalama 7757 (minimum: 5 - maksimum: 343500) Hz ölçüldü. | |||
Cinebench R15 Multi Endurance test
Cinebench R20: CPU (Multi Core) | CPU (Single Core)
Cinebench R15: CPU Multi 64Bit | CPU Single 64Bit
Blender: v2.79 BMW27 CPU
7-Zip 18.03: 7z b 4 | 7z b 4 -mmt1
Geekbench 5.5: Multi-Core | Single-Core
HWBOT x265 Benchmark v2.2: 4k Preset
LibreOffice : 20 Documents To PDF
R Benchmark 2.5: Overall mean
| Cinebench R23 / Multi Core | |
| Sınıf ortalaması Subnotebook (1555 - 21812, n=59, son 2 yıl) | |
| HP Pavilion Aero 13 be0097nr | |
| Acer Spin 3 SP313-51N-56YV | |
| Samsung Galaxy Book Pro 360 13 | |
| Samsung Galaxy Book Pro 360 13 | |
| Lenovo ThinkBook Plus Gen2 Core i5 | |
| Ortalama Intel Core i5-1130G7 (2237 - 3240, n=2) | |
| Cinebench R23 / Single Core | |
| Sınıf ortalaması Subnotebook (358 - 2213, n=60, son 2 yıl) | |
| HP Pavilion Aero 13 be0097nr | |
| Acer Spin 3 SP313-51N-56YV | |
| Samsung Galaxy Book Pro 360 13 | |
| Samsung Galaxy Book Pro 360 13 | |
| Lenovo ThinkBook Plus Gen2 Core i5 | |
| Ortalama Intel Core i5-1130G7 (1077 - 1226, n=2) | |
| Cinebench R20 / CPU (Multi Core) | |
| Sınıf ortalaması Subnotebook (579 - 8541, n=56, son 2 yıl) | |
| HP Pavilion Aero 13 be0097nr | |
| Acer Spin 3 SP313-51N-56YV | |
| Lenovo ThinkBook Plus 13 i7 | |
| Lenovo ThinkBook Plus 13 i7 | |
| Samsung Galaxy Book Pro 360 13 | |
| Samsung Galaxy Book Pro 360 13 | |
| Lenovo ThinkBook Plus Gen2 Core i5 | |
| Ortalama Intel Core i5-1130G7 (870 - 1251, n=2) | |
| Cinebench R20 / CPU (Single Core) | |
| Sınıf ortalaması Subnotebook (128 - 832, n=56, son 2 yıl) | |
| HP Pavilion Aero 13 be0097nr | |
| Acer Spin 3 SP313-51N-56YV | |
| Samsung Galaxy Book Pro 360 13 | |
| Samsung Galaxy Book Pro 360 13 | |
| Lenovo ThinkBook Plus Gen2 Core i5 | |
| Ortalama Intel Core i5-1130G7 (418 - 478, n=2) | |
| Lenovo ThinkBook Plus 13 i7 | |
| Cinebench R15 / CPU Multi 64Bit | |
| Sınıf ortalaması Subnotebook (327 - 3345, n=56, son 2 yıl) | |
| HP Pavilion Aero 13 be0097nr | |
| Acer Spin 3 SP313-51N-56YV | |
| Lenovo ThinkBook Plus 13 i7 | |
| Lenovo ThinkBook Plus 13 i7 | |
| Samsung Galaxy Book Pro 360 13 | |
| Samsung Galaxy Book Pro 360 13 | |
| Lenovo ThinkBook Plus Gen2 Core i5 | |
| Lenovo ThinkBook Plus Gen2 Core i5 | |
| Ortalama Intel Core i5-1130G7 (564 - 700, n=4) | |
| Cinebench R15 / CPU Single 64Bit | |
| Sınıf ortalaması Subnotebook (72.4 - 322, n=56, son 2 yıl) | |
| HP Pavilion Aero 13 be0097nr | |
| Acer Spin 3 SP313-51N-56YV | |
| Samsung Galaxy Book Pro 360 13 | |
| Samsung Galaxy Book Pro 360 13 | |
| Lenovo ThinkBook Plus Gen2 Core i5 | |
| Lenovo ThinkBook Plus Gen2 Core i5 | |
| Ortalama Intel Core i5-1130G7 (114 - 189.7, n=3) | |
| Lenovo ThinkBook Plus 13 i7 | |
| Blender / v2.79 BMW27 CPU | |
| Ortalama Intel Core i5-1130G7 (1124 - 1255, n=2) | |
| Lenovo ThinkBook Plus Gen2 Core i5 | |
| Samsung Galaxy Book Pro 360 13 | |
| Lenovo ThinkBook Plus 13 i7 | |
| Acer Spin 3 SP313-51N-56YV | |
| Sınıf ortalaması Subnotebook (159 - 2271, n=57, son 2 yıl) | |
| HP Pavilion Aero 13 be0097nr | |
| 7-Zip 18.03 / 7z b 4 | |
| Sınıf ortalaması Subnotebook (11668 - 77867, n=56, son 2 yıl) | |
| HP Pavilion Aero 13 be0097nr | |
| Samsung Galaxy Book Pro 360 13 | |
| Samsung Galaxy Book Pro 360 13 | |
| Acer Spin 3 SP313-51N-56YV | |
| Lenovo ThinkBook Plus 13 i7 | |
| Ortalama Intel Core i5-1130G7 (14453 - 14999, n=2) | |
| Lenovo ThinkBook Plus Gen2 Core i5 | |
| 7-Zip 18.03 / 7z b 4 -mmt1 | |
| Sınıf ortalaması Subnotebook (2643 - 6699, n=58, son 2 yıl) | |
| HP Pavilion Aero 13 be0097nr | |
| Acer Spin 3 SP313-51N-56YV | |
| Samsung Galaxy Book Pro 360 13 | |
| Samsung Galaxy Book Pro 360 13 | |
| Lenovo ThinkBook Plus 13 i7 | |
| Lenovo ThinkBook Plus Gen2 Core i5 | |
| Ortalama Intel Core i5-1130G7 (4094 - 4256, n=2) | |
| Geekbench 5.5 / Multi-Core | |
| Sınıf ortalaması Subnotebook (2557 - 17218, n=48, son 2 yıl) | |
| Acer Spin 3 SP313-51N-56YV | |
| Lenovo ThinkBook Plus Gen2 Core i5 | |
| Ortalama Intel Core i5-1130G7 (4710 - 4894, n=2) | |
| Lenovo ThinkBook Plus 13 i7 | |
| Geekbench 5.5 / Single-Core | |
| Sınıf ortalaması Subnotebook (726 - 2224, n=48, son 2 yıl) | |
| Acer Spin 3 SP313-51N-56YV | |
| Ortalama Intel Core i5-1130G7 (1306 - 1337, n=2) | |
| Lenovo ThinkBook Plus Gen2 Core i5 | |
| Lenovo ThinkBook Plus 13 i7 | |
| HWBOT x265 Benchmark v2.2 / 4k Preset | |
| Sınıf ortalaması Subnotebook (0.97 - 25.1, n=56, son 2 yıl) | |
| HP Pavilion Aero 13 be0097nr | |
| Acer Spin 3 SP313-51N-56YV | |
| Lenovo ThinkBook Plus 13 i7 | |
| Samsung Galaxy Book Pro 360 13 | |
| Ortalama Intel Core i5-1130G7 (n=1) | |
| LibreOffice / 20 Documents To PDF | |
| Lenovo ThinkBook Plus 13 i7 | |
| Lenovo ThinkBook Plus Gen2 Core i5 | |
| Ortalama Intel Core i5-1130G7 (57.7 - 58.9, n=2) | |
| Sınıf ortalaması Subnotebook (39.9 - 220, n=55, son 2 yıl) | |
| Samsung Galaxy Book Pro 360 13 | |
| Samsung Galaxy Book Pro 360 13 | |
| HP Pavilion Aero 13 be0097nr | |
| Acer Spin 3 SP313-51N-56YV | |
| R Benchmark 2.5 / Overall mean | |
| Ortalama Intel Core i5-1130G7 (0.714 - 0.753, n=2) | |
| Lenovo ThinkBook Plus Gen2 Core i5 | |
| Lenovo ThinkBook Plus 13 i7 | |
| Samsung Galaxy Book Pro 360 13 | |
| Acer Spin 3 SP313-51N-56YV | |
| HP Pavilion Aero 13 be0097nr | |
| Sınıf ortalaması Subnotebook (0.4024 - 1.456, n=57, son 2 yıl) | |
* ... daha küçük daha iyidir
| PCMark 10 / Score | |
| Sınıf ortalaması Subnotebook (4920 - 9939, n=45, son 2 yıl) | |
| HP Pavilion Aero 13 be0097nr | |
| Acer Spin 3 SP313-51N-56YV | |
| Samsung Galaxy Book Pro 360 13 | |
| Lenovo ThinkBook Plus Gen2 Core i5 | |
| Ortalama Intel Core i5-1130G7, Intel Iris Xe Graphics G7 80EUs (4082 - 4482, n=2) | |
| Lenovo ThinkBook Plus 13 i7 | |
| PCMark 10 / Essentials | |
| Sınıf ortalaması Subnotebook (8552 - 11646, n=45, son 2 yıl) | |
| Lenovo ThinkBook Plus Gen2 Core i5 | |
| HP Pavilion Aero 13 be0097nr | |
| Acer Spin 3 SP313-51N-56YV | |
| Ortalama Intel Core i5-1130G7, Intel Iris Xe Graphics G7 80EUs (8873 - 10226, n=2) | |
| Samsung Galaxy Book Pro 360 13 | |
| Lenovo ThinkBook Plus 13 i7 | |
| PCMark 10 / Productivity | |
| Sınıf ortalaması Subnotebook (5435 - 16606, n=45, son 2 yıl) | |
| HP Pavilion Aero 13 be0097nr | |
| Lenovo ThinkBook Plus 13 i7 | |
| Samsung Galaxy Book Pro 360 13 | |
| Acer Spin 3 SP313-51N-56YV | |
| Lenovo ThinkBook Plus Gen2 Core i5 | |
| Ortalama Intel Core i5-1130G7, Intel Iris Xe Graphics G7 80EUs (5875 - 6004, n=2) | |
| PCMark 10 / Digital Content Creation | |
| Sınıf ortalaması Subnotebook (5722 - 13779, n=45, son 2 yıl) | |
| HP Pavilion Aero 13 be0097nr | |
| Acer Spin 3 SP313-51N-56YV | |
| Samsung Galaxy Book Pro 360 13 | |
| Lenovo ThinkBook Plus Gen2 Core i5 | |
| Ortalama Intel Core i5-1130G7, Intel Iris Xe Graphics G7 80EUs (3543 - 3982, n=2) | |
| Lenovo ThinkBook Plus 13 i7 | |
| PCMark 10 Score | 4482 puan | |
Yardım | ||
| DPC Latencies / LatencyMon - interrupt to process latency (max), Web, Youtube, Prime95 | |
| Samsung Galaxy Book Pro 360 13 | |
| Lenovo ThinkBook Plus Gen2 Core i5 | |
| Acer Spin 3 SP313-51N-56YV | |
| HP Pavilion Aero 13 be0097nr | |
| Lenovo ThinkBook Plus 13 i7 | |
* ... daha küçük daha iyidir
| Lenovo ThinkBook Plus Gen2 Core i5 Samsung PM9A1 MZVL2512HCJQ | Lenovo ThinkBook Plus 13 i7 WDC PC SN730 SDBPNTY-512G | HP Pavilion Aero 13 be0097nr Intel SSD 660p SSDPEKNW512G8 | Acer Spin 3 SP313-51N-56YV Kingston OM8PCP3512F-AB | Samsung Galaxy Book Pro 360 13 Samsung PM991 MZVLQ256HAJD | Ortalama Samsung PM9A1 MZVL2512HCJQ | Sınıf ortalaması Subnotebook | |
|---|---|---|---|---|---|---|---|
| CrystalDiskMark 5.2 / 6 | -43% | -51% | -42% | -54% | -15% | -21% | |
| Write 4K (MB/s) | 222.8 | 135.4 -39% | 128.3 -42% | 286.1 28% | 170.6 -23% | 179.1 ? -20% | 151.1 ? -32% |
| Read 4K (MB/s) | 88.8 | 48.83 -45% | 50.9 -43% | 48.89 -45% | 44.51 -50% | 75.6 ? -15% | 63.5 ? -28% |
| Write Seq (MB/s) | 4096 | 2036 -50% | 971 -76% | 982 -76% | 872 -79% | 3016 ? -26% | 2795 ? -32% |
| Read Seq (MB/s) | 4439 | 2127 -52% | 1540 -65% | 1301 -71% | 1188 -73% | 3350 ? -25% | 3303 ? -26% |
| Write 4K Q32T1 (MB/s) | 467.1 | 394.1 -16% | 538 15% | 625 34% | 483.1 3% | 459 ? -2% | 432 ? -8% |
| Read 4K Q32T1 (MB/s) | 628 | 345.2 -45% | 344.4 -45% | 301 -52% | 284.3 -55% | 554 ? -12% | 502 ? -20% |
| Write Seq Q32T1 (MB/s) | 5023 | 2700 -46% | 980 -80% | 981 -80% | 950 -81% | 4346 ? -13% | 4677 ? -7% |
| Read Seq Q32T1 (MB/s) | 6822 | 3331 -51% | 1829 -73% | 1631 -76% | 1872 -73% | 6346 ? -7% | 5843 ? -14% |
| AS SSD | -58% | -111% | -100% | -79% | -14% | -41% | |
| Seq Read (MB/s) | 5403 | 2341 -57% | 1616 -70% | 1748 -68% | 1771 -67% | 4656 ? -14% | 4504 ? -17% |
| Seq Write (MB/s) | 3792 | 993 -74% | 761 -80% | 941 -75% | 894 -76% | 2742 ? -28% | 2934 ? -23% |
| 4K Read (MB/s) | 80.4 | 45.76 -43% | 46.87 -42% | 44.06 -45% | 53.5 -33% | 67 ? -17% | 59 ? -27% |
| 4K Write (MB/s) | 195.1 | 141.8 -27% | 126.6 -35% | 77.7 -60% | 157.8 -19% | 173.8 ? -11% | 164.4 ? -16% |
| 4K-64 Read (MB/s) | 1687 | 615 -64% | 324.6 -81% | 451.1 -73% | 478.1 -72% | 1514 ? -10% | 861 ? -49% |
| 4K-64 Write (MB/s) | 1797 | 1295 -28% | 815 -55% | 926 -48% | 741 -59% | 2355 ? 31% | 1695 ? -6% |
| Access Time Read * (ms) | 0.035 | 0.096 -174% | 0.074 -111% | 0.188 -437% | 0.156 -346% | 0.04867 ? -39% | 0.06711 ? -92% |
| Access Time Write * (ms) | 0.021 | 0.026 -24% | 0.135 -543% | 0.043 -105% | 0.023 -10% | 0.03605 ? -72% | 0.05138 ? -145% |
| Score Read (Points) | 2307 | 895 -61% | 533 -77% | 670 -71% | 709 -69% | 2047 ? -11% | 1369 ? -41% |
| Score Write (Points) | 2371 | 1536 -35% | 1018 -57% | 1098 -54% | 988 -58% | 2778 ? 17% | 2153 ? -9% |
| Score Total (Points) | 5792 | 2834 -51% | 1798 -69% | 2084 -64% | 2034 -65% | 5812 ? 0% | 4158 ? -28% |
| Toplam Ortalama (Program / Ayarlar) | -51% /
-52% | -81% /
-86% | -71% /
-76% | -67% /
-69% | -15% /
-14% | -31% /
-33% |
* ... daha küçük daha iyidir

Continuous reading: DiskSpd Read Loop, Queue Depth 8
| 3DMark 11 - 1280x720 Performance GPU | |
| Sınıf ortalaması Subnotebook (995 - 18489, n=54, son 2 yıl) | |
| Samsung Galaxy Book Pro 360 13 | |
| Acer Spin 3 SP313-51N-56YV | |
| HP Pavilion Aero 13 be0097nr | |
| Ortalama Intel Iris Xe Graphics G7 80EUs (2246 - 6579, n=112) | |
| Lenovo ThinkBook Plus Gen2 Core i5 | |
| Lenovo ThinkBook Plus 13 i7 | |
| 3DMark | |
| 1920x1080 Fire Strike Graphics | |
| Sınıf ortalaması Subnotebook (832 - 16347, n=55, son 2 yıl) | |
| Acer Spin 3 SP313-51N-56YV | |
| Ortalama Intel Iris Xe Graphics G7 80EUs (1560 - 5398, n=114) | |
| Lenovo ThinkBook Plus Gen2 Core i5 | |
| Samsung Galaxy Book Pro 360 13 | |
| HP Pavilion Aero 13 be0097nr | |
| Lenovo ThinkBook Plus 13 i7 | |
| 1280x720 Cloud Gate Standard Graphics | |
| Sınıf ortalaması Subnotebook (5577 - 61591, n=28, son 2 yıl) | |
| Acer Spin 3 SP313-51N-56YV | |
| HP Pavilion Aero 13 be0097nr | |
| Ortalama Intel Iris Xe Graphics G7 80EUs (6361 - 30894, n=96) | |
| Lenovo ThinkBook Plus Gen2 Core i5 | |
| Samsung Galaxy Book Pro 360 13 | |
| Lenovo ThinkBook Plus 13 i7 | |
| 2560x1440 Time Spy Graphics | |
| Sınıf ortalaması Subnotebook (804 - 6288, n=54, son 2 yıl) | |
| Ortalama Intel Iris Xe Graphics G7 80EUs (561 - 1576, n=111) | |
| HP Pavilion Aero 13 be0097nr | |
| Lenovo ThinkBook Plus Gen2 Core i5 | |
| Lenovo ThinkBook Plus 13 i7 | |
| 3DMark 11 Performance | 4466 puan | |
| 3DMark Cloud Gate Standard Score | 12148 puan | |
| 3DMark Fire Strike Score | 3116 puan | |
| 3DMark Time Spy Score | 1160 puan | |
Yardım | ||
Witcher 3 FPS-Diagram
| The Witcher 3 - 1366x768 Medium Graphics & Postprocessing | |
| Sınıf ortalaması Subnotebook (74.5 - 115, n=7, son 2 yıl) | |
| Acer Spin 3 SP313-51N-56YV | |
| Ortalama Intel Iris Xe Graphics G7 80EUs (21.8 - 56.9, n=103) | |
| Samsung Galaxy Book Pro 360 13 | |
| Lenovo ThinkBook Plus Gen2 Core i5 | |
| Dota 2 Reborn - 1366x768 med (1/3) | |
| Sınıf ortalaması Subnotebook (25 - 149.1, n=60, son 2 yıl) | |
| HP Pavilion Aero 13 be0097nr | |
| Samsung Galaxy Book Pro 360 13 | |
| Ortalama Intel Iris Xe Graphics G7 80EUs (10.9 - 119.5, n=113) | |
| Lenovo ThinkBook Plus Gen2 Core i5 | |
| Acer Spin 3 SP313-51N-56YV | |
| Lenovo ThinkBook Plus 13 i7 | |
| GTA V - 1366x768 Normal/Off AF:4x | |
| Sınıf ortalaması Subnotebook (81.2 - 176.9, n=53, son 2 yıl) | |
| Acer Spin 3 SP313-51N-56YV | |
| Samsung Galaxy Book Pro 360 13 | |
| Ortalama Intel Iris Xe Graphics G7 80EUs (28.9 - 133.8, n=87) | |
| Lenovo ThinkBook Plus Gen2 Core i5 | |
| Strange Brigade - 1920x1080 medium AA:medium AF:4 | |
| Sınıf ortalaması Subnotebook (29.8 - 137.5, n=49, son 2 yıl) | |
| Samsung Galaxy Book Pro 360 13 | |
| Acer Spin 3 SP313-51N-56YV | |
| HP Pavilion Aero 13 be0097nr | |
| Ortalama Intel Iris Xe Graphics G7 80EUs (6 - 48.8, n=86) | |
| Lenovo ThinkBook Plus Gen2 Core i5 | |
| düşük | orta | yüksek | ultra | |
|---|---|---|---|---|
| GTA V (2015) | 59.9 | 54.6 | 19.3 | 8.84 |
| The Witcher 3 (2015) | 66 | 39.5 | 20.7 | 9.65 |
| Dota 2 Reborn (2015) | 81.5 | 63.7 | 39.5 | 34.8 |
| X-Plane 11.11 (2018) | 36.8 | 24.6 | 21.5 | |
| Far Cry 5 (2018) | 29 | 16 | 15 | 14 |
| Strange Brigade (2018) | 60.4 | 27.1 | 21.7 | 18.2 |
Ses yüksekliği
| Boşta |
| 25.4 / 27.4 / 32.2 dB |
| Çalışırken |
| 32.2 / 34.5 dB |
 | ||
30 dB sessiz 40 dB(A) duyulabilirlik 50 dB(A) gürültülü |
||
min: | ||
(±) Üst taraftaki maksimum sıcaklık, 35.9 °C / 97 F ortalamasına kıyasla 42 °C / 108 F'dir. , Subnotebook sınıfı için 21.4 ile 59 °C arasında değişir.
(±) Alt kısım, 39.2 °C / 103 F ortalamasına kıyasla maksimum 44.5 °C / 112 F'ye kadar ısınır
(+) Boşta kullanımda, üst tarafın ortalama sıcaklığı 27.5 °C / 82 F olup, cihazın 30.8 °C / 87 F.
(±) The Witcher 3 oynarken, üst tarafın ortalama sıcaklığı 33.7 °C / 93 F olup, cihazın 30.8 °C / 87 F.
(+) Avuç içi dayanakları ve dokunmatik yüzey, maksimum 27.2 °C / 81 F ile cilt sıcaklığından daha soğuktur ve bu nedenle dokunulduğunda soğuktur.
(±) Benzer cihazların avuç içi dayanağı alanının ortalama sıcaklığı 28.2 °C / 82.8 F (+1 °C / 1.8 F) idi.
Lenovo ThinkBook Plus Gen2 Core i5 ses analizi
(±) | hoparlör ses yüksekliği ortalama ama iyi (81.9 dB)
Bas 100 - 315Hz
(±) | azaltılmış bas - ortalama olarak medyandan 13.5% daha düşük
(±) | Bas doğrusallığı ortalamadır (9.7% delta - önceki frekans)
Ortalar 400 - 2000 Hz
(+) | dengeli ortalar - medyandan yalnızca 3.2% uzakta
(+) | orta frekanslar doğrusaldır (5.3% deltadan önceki frekansa)
Yüksekler 2 - 16 kHz
(+) | dengeli yüksekler - medyandan yalnızca 2% uzakta
(+) | yüksekler doğrusaldır (4.1% deltadan önceki frekansa)
Toplam 100 - 16.000 Hz
(+) | genel ses doğrusaldır (10.9% ortancaya göre fark)
Aynı sınıfla karşılaştırıldığında
» Bu sınıftaki tüm test edilen cihazların %10%'si daha iyi, 3% benzer, 87% daha kötüydü
» En iyisinin deltası 5% idi, ortalama 18% idi, en kötüsü 53% idi
Test edilen tüm cihazlarla karşılaştırıldığında
» Test edilen tüm cihazların %6'si daha iyi, 2 benzer, % 92 daha kötüydü
» En iyisinin deltası 4% idi, ortalama 23% idi, en kötüsü 134% idi
Lenovo ThinkBook Plus 13 i7 ses analizi
(-) | hoparlörler çok yüksek ses çıkarmıyor (71.7 dB)
Bas 100 - 315Hz
(-) | neredeyse hiç bas yok - ortalama olarak medyandan 15% daha düşük
(-) | bas doğrusal değildir (16.1% delta ile önceki frekans)
Ortalar 400 - 2000 Hz
(±) | daha yüksek ortalar - ortalama olarak medyandan 5.9% daha yüksek
(+) | orta frekanslar doğrusaldır (5.6% deltadan önceki frekansa)
Yüksekler 2 - 16 kHz
(+) | dengeli yüksekler - medyandan yalnızca 3.6% uzakta
(±) | Yükseklerin doğrusallığı ortalamadır (9% delta - önceki frekans)
Toplam 100 - 16.000 Hz
(±) | Genel sesin doğrusallığı ortalamadır (23.9% ortancaya göre fark)
Aynı sınıfla karşılaştırıldığında
» Bu sınıftaki tüm test edilen cihazların %81%'si daha iyi, 4% benzer, 15% daha kötüydü
» En iyisinin deltası 5% idi, ortalama 18% idi, en kötüsü 53% idi
Test edilen tüm cihazlarla karşılaştırıldığında
» Test edilen tüm cihazların %72'si daha iyi, 6 benzer, % 22 daha kötüydü
» En iyisinin deltası 4% idi, ortalama 23% idi, en kötüsü 134% idi
| Kapalı / Bekleme modu | |
| Boşta | |
| Çalışırken |
|
Key:
min: | |
Power consumption Witcher 3 / Stress test
| Battery Runtime - WiFi Websurfing | |
| Sınıf ortalaması Subnotebook (7.25 - 26.4, n=59, son 2 yıl) | |
| Samsung Galaxy Book Pro 360 13 | |
| HP Pavilion Aero 13 be0097nr | |
| Lenovo ThinkBook Plus 13 i7 | |
| Acer Spin 3 SP313-51N-56YV | |
| Lenovo ThinkBook Plus Gen2 Core i5 | |
Artılar
Eksiler
Összegzés - A ThinkBook Plus G2 jobb kijelzőket kínál

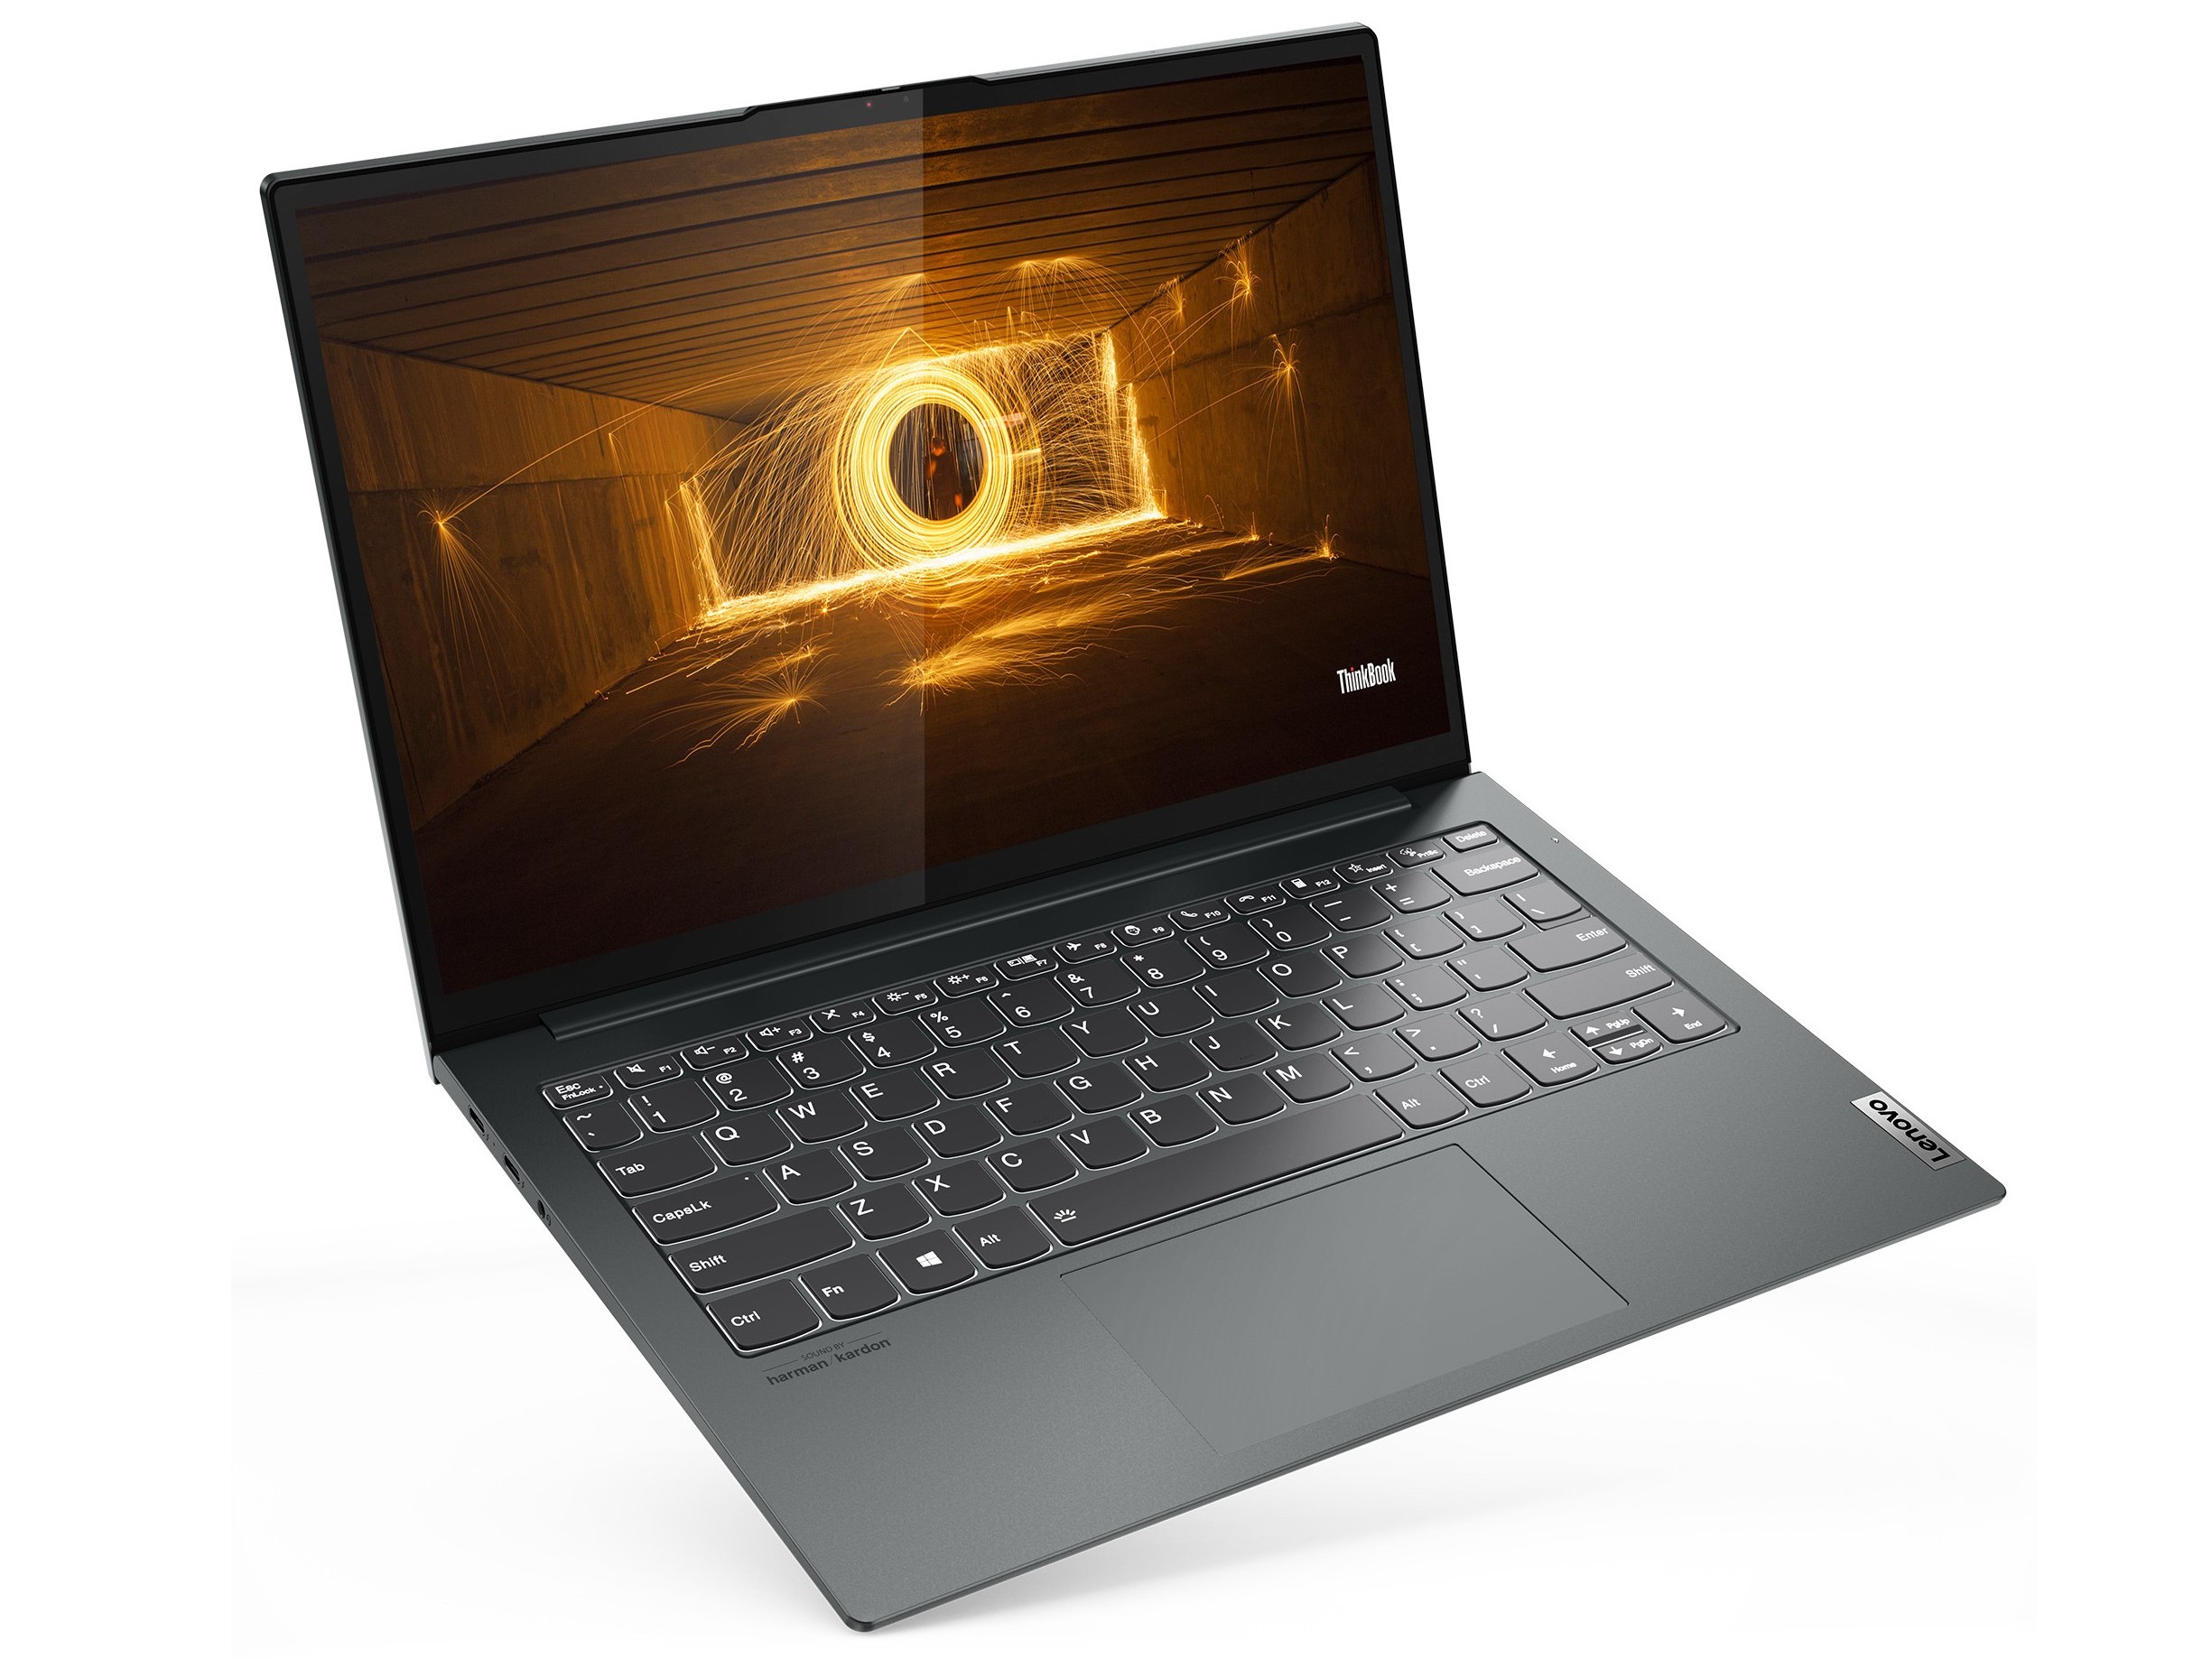
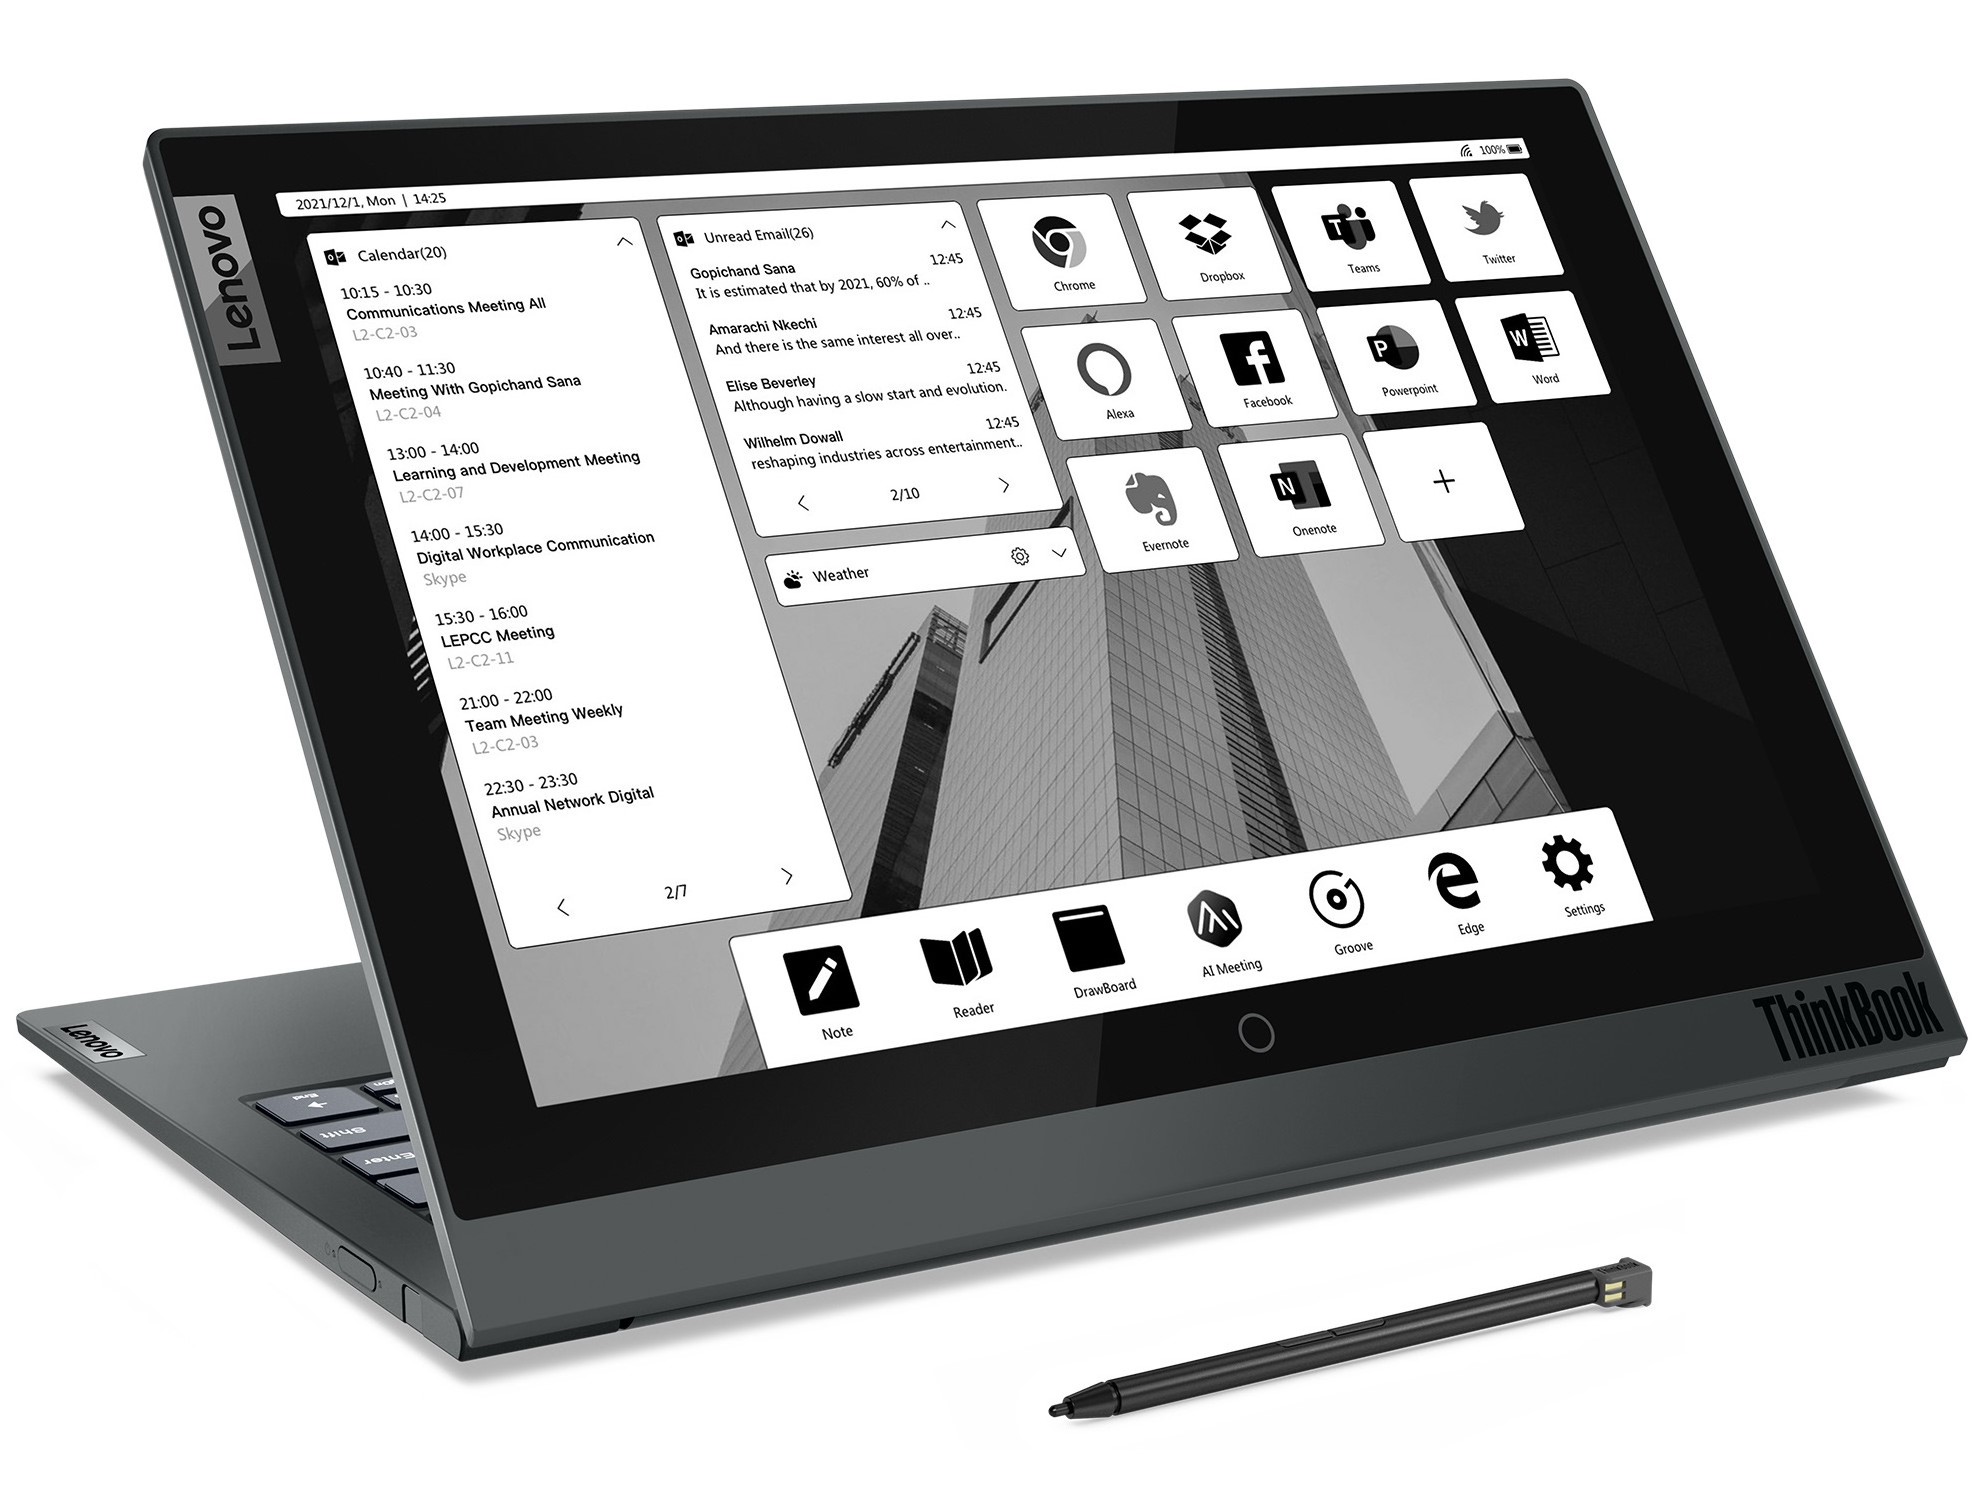
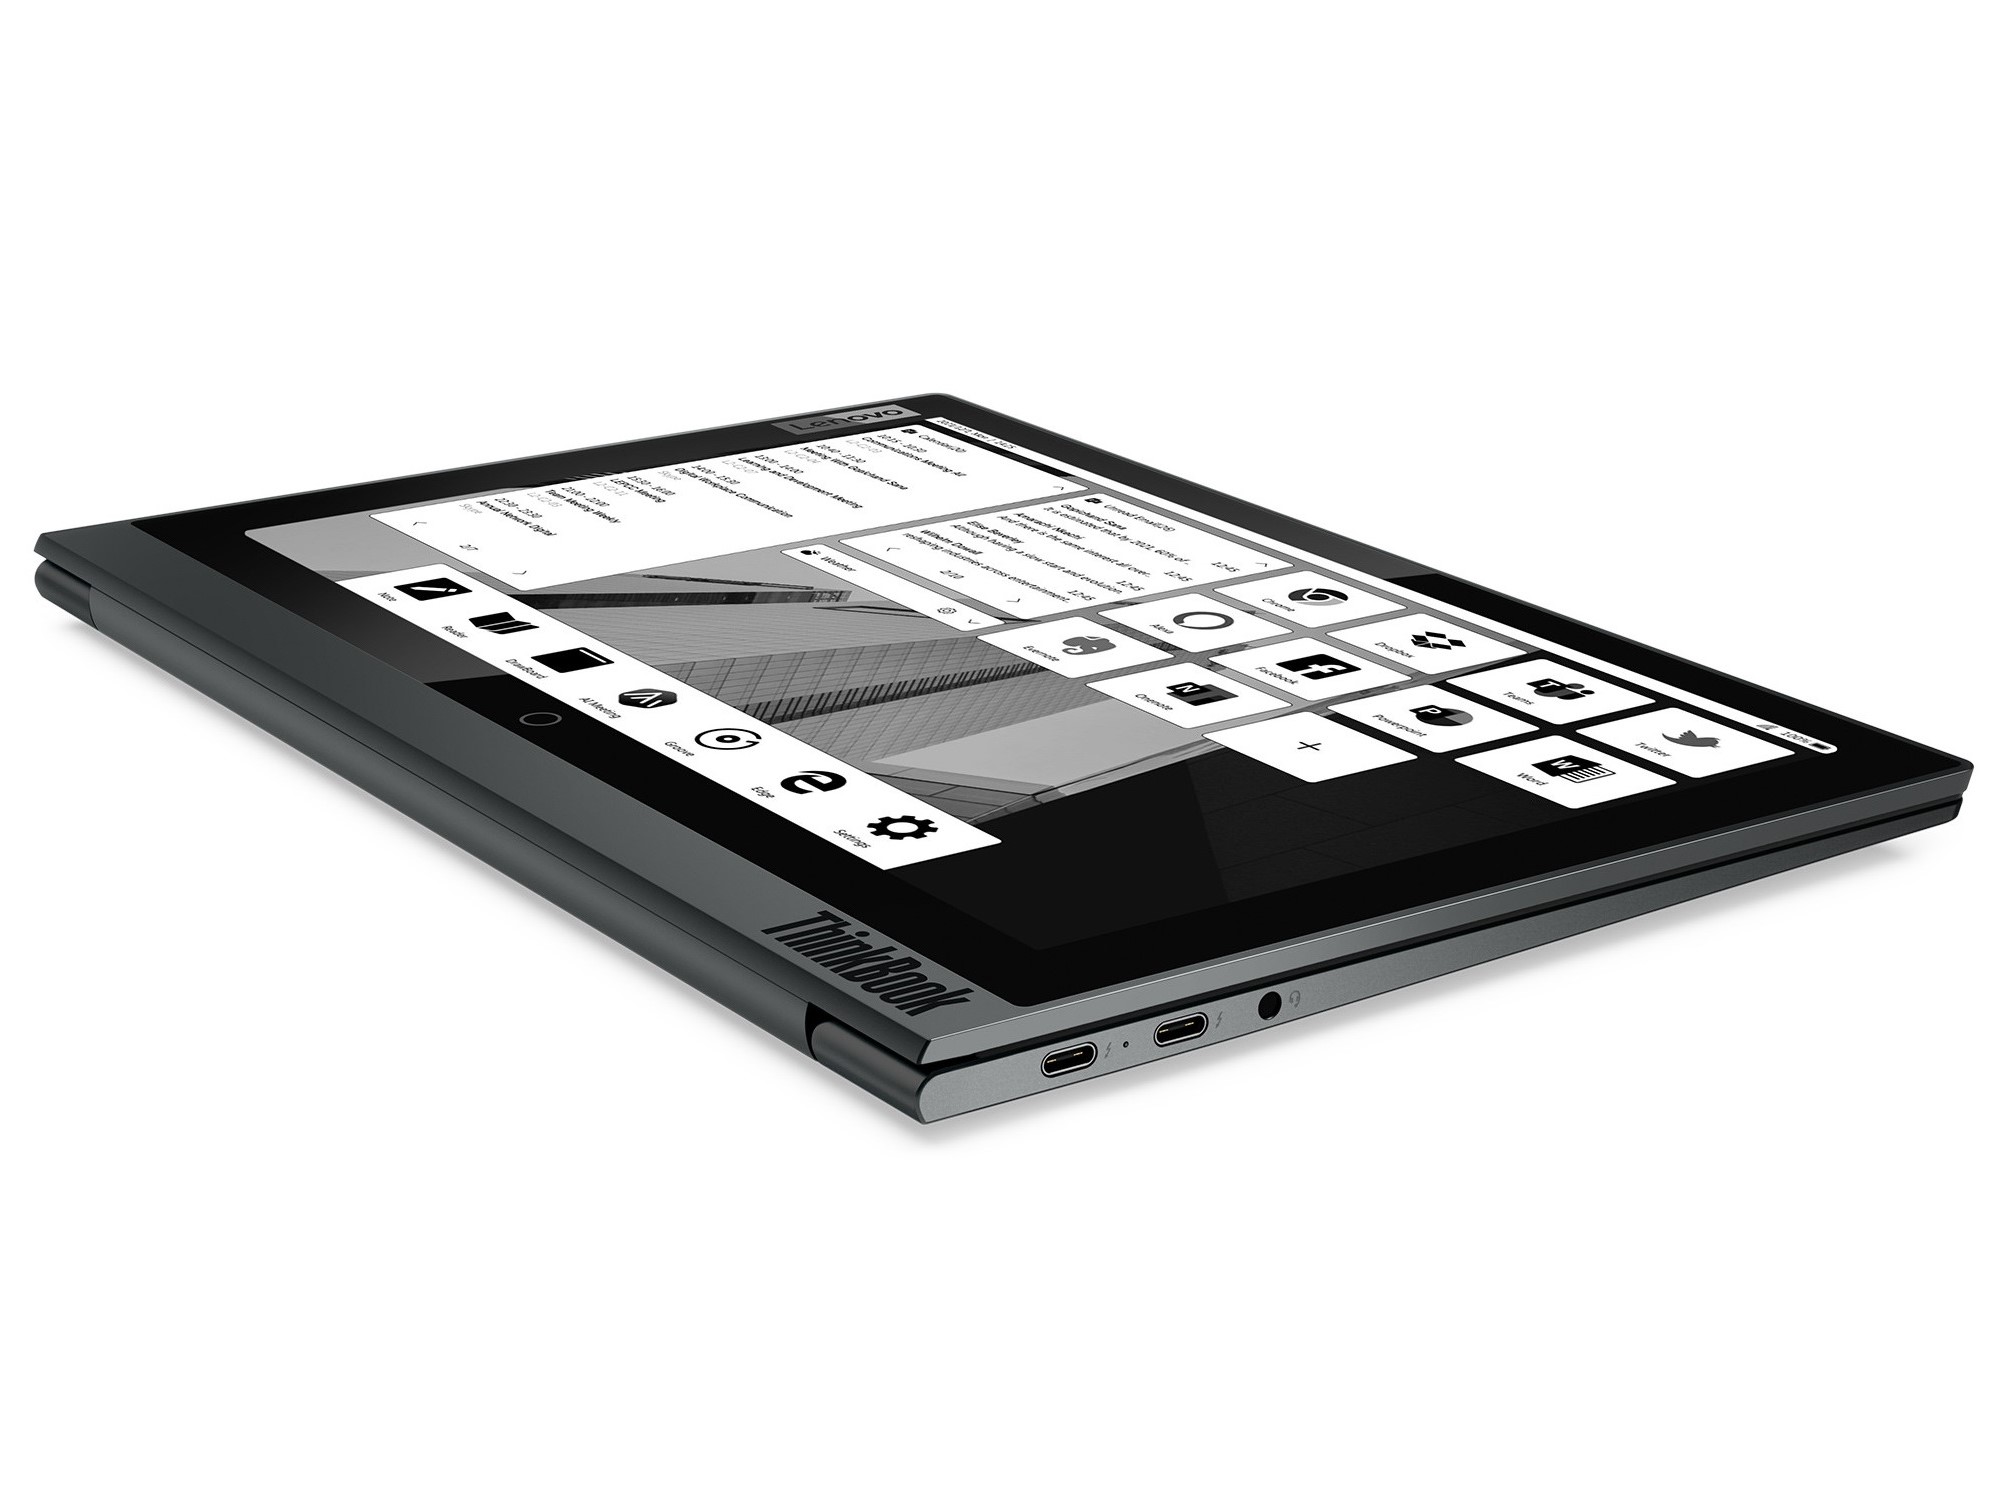
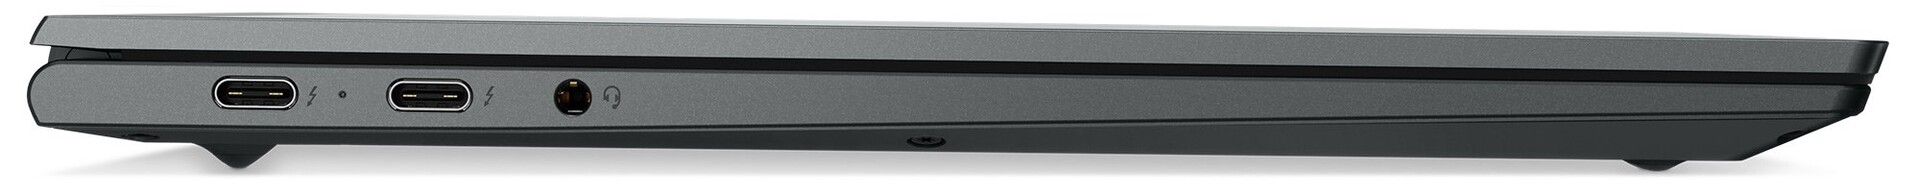
Aki már rendelkezik az 1. generációs ThinkBook Plus-szal, és a mindennapi használatban is hasznát veheti a koncepciónak, annak a ThinkBook Plus Gen2-vel egy ugyanolyan erős készüléket kap, nagyobb E-ink kijelzővel és a fő képernyő érintéses funkcionalitásával. A felbontás is nagyobb, és a képernyő formátuma 16:9 helyett most 16:10-es. A két Thunderbolt porttal rendelkezésre állnak a modern átviteli standardok, de az USB-A és a HDMI most hiányzik.
A Lenovo ThinkBook Plus Gen2 egy kiváló minőségű notebook. Azonban csak akkor érdemes megvenni, ha az E-ink kijelzőt a mindennapokban is használjuk.
A ThinkBook Plus Gen2 opción csak akkor érdemes komolyan gondolkodni, ha tényleg ki tudjuk használni a 12 hüvelykes második kijelzőt. Az akkumulátor kapacitása nagyobb, de nem bírja olyan sokáig, mint az elődje. A CPU teljesítménye is nagyjából ugyanaz marad, csak a belső grafikus egység lett erősebb. Cserébe a Lenovo notebookja könnyebb és vékonyabb lett. Nekünk tetszett a főképernyő minősége is, amely élénken és a gyári beállítástól csak enyhe eltéréssel jeleníti meg a színeket.
A ThinkBook Plus Gen2 ajánlása azonban attól a kérdéstől függ, hogy az E-ink kijelzőt valóban használjuk-e a mindennapokban. Ha ez nem így van, akkor érdemesebb egy olyan átalakítható készüléket választani, mint a Samsung Galaxy Book Pro 360. Ha alapvetően tudunk boldogulni egy nem érintéses képernyő és egy külső kijelző nélkül, akkor egy hagyományos notebook, mint a HP Pavilion Aero 13 a jobbik választás.
Ár és elérhetőség
A Lenovo ThinkBook Plus Gen2 már kapható, és megvásárolható például a Campuspoint nevű kölcsönzőnknél.
Lenovo ThinkBook Plus Gen2 Core i5
- 10/02/2021 v7 (old)
Mike Wobker
Price comparison
