MSI GE66 Raider 10SFS Dizüstü İnceleme: RTX 2070 Super için ön sunum

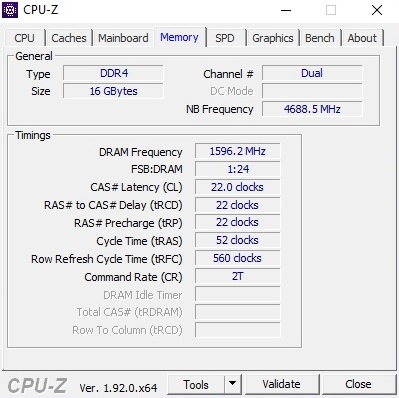
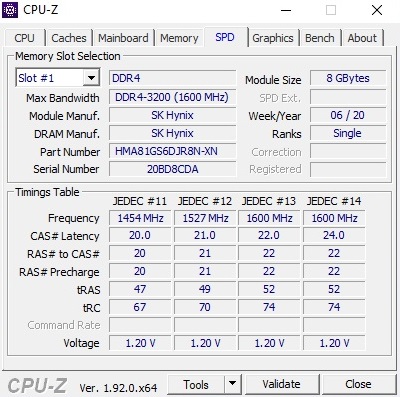
GE66 ile ilgilenenler üç farklı temel sürüm arasında seçim yapmak için şımarık. Raider 10SF bir GeForce RTX 2070 ile birlikte gelirken, Raider 10SFS, yerleşik RTX 2070'in Super versiyonuna sahiptir. Gıda zincirinin üst ucu, bir RTX 2080 Super Max-Q tarafından beslenen Raider 10SGS tarafından oluşturulur. . Modele bağlı olarak, 144, 240 veya 300 Hz'lik bir Full HD ekran veya 60 Hz'lik bir UHD ekran, görüntü reprodüksiyonu ile ilgilenir. İşlemci, Intel'in Comet Lake serisinden altı veya sekiz çekirdekli bir yonga. Seçim maksimum 64 GB DDR4 RAM ve en fazla iki M.2 SSD ile tamamlanır. 240 Hz panel, Core i9-10980HK, GeForce RTX 2070 Super, 2x 8 GB DDR4 içeren test yapılandırmamız için -3.200 RAM ve 1 TB SSD, şu anda yaklaşık 2.700 Euro (~ 3.090 $) ödemek zorunda kalacaksınız.
GE66 Raider'ın rakipleri arasında Asus Strix G531GW, Eurocom Nightsky RX15 ve şirket içi GE65 Raider gibi Core i9 ve RTX 2070 tabanlı diğer 15 inç oyun dizüstü bilgisayarları yer alıyor. Bu not defterleri tablolarda karşılaştırma cihazları olarak görünür.
Derecelendirme | Tarih | Modeli | Ağırlık | Yükseklik | Boyut | Çözünürlük | Fiyat |
|---|---|---|---|---|---|---|---|
| 84.6 % v7 (old) | 07/2020 | MSI GE66 Raider 10SFS i9-10980HK, GeForce RTX 2070 Super Mobile | 2.4 kg | 23 mm | 15.60" | 1920x1080 | |
| 84.7 % v7 (old) | 04/2020 | MSI GE65 Raider 9SF-049US i9-9880H, GeForce RTX 2070 Mobile | 2.3 kg | 26.9 mm | 15.60" | 1920x1080 | |
| 86 % v6 (old) | 06/2019 | Asus Strix Scar III G531GW i9-9880H, GeForce RTX 2070 Mobile | 2.3 kg | 25 mm | 15.60" | 1920x1080 | |
| 85.9 % v6 (old) | Eurocom Nightsky RX15 i9-9980HK, GeForce RTX 2070 Mobile | 2.5 kg | 29.9 mm | 15.60" | 3840x2160 |
Durum
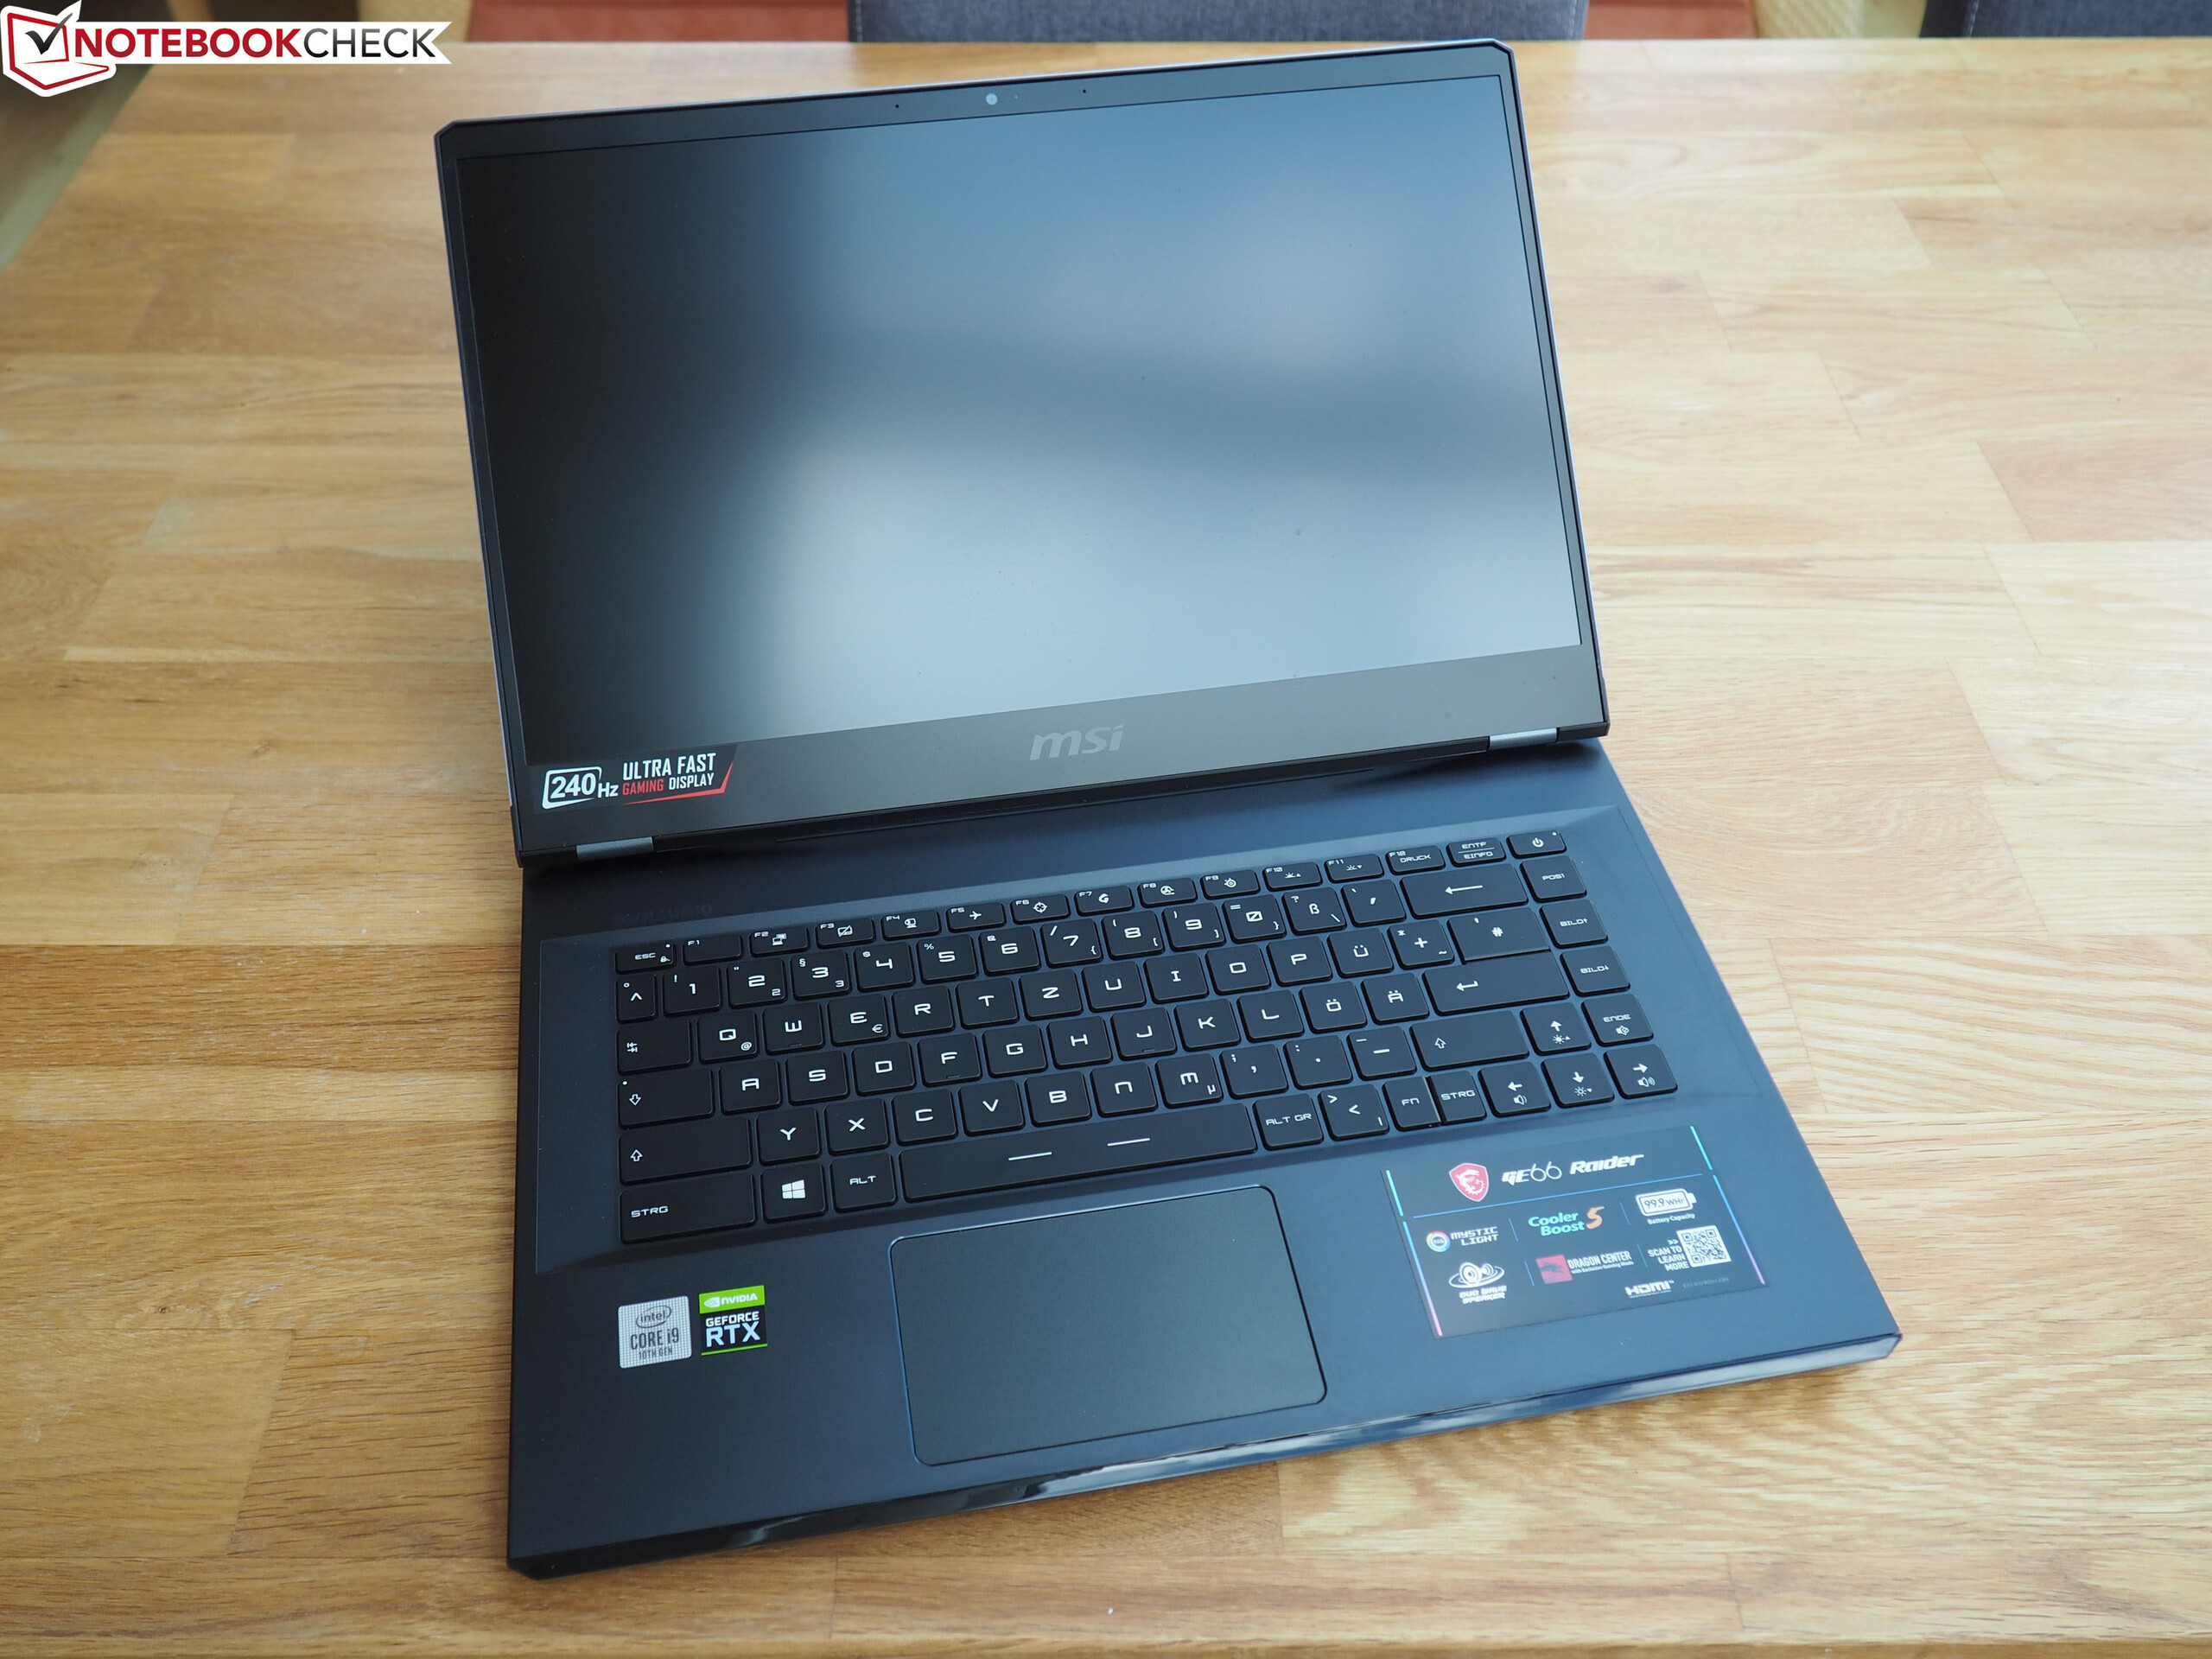
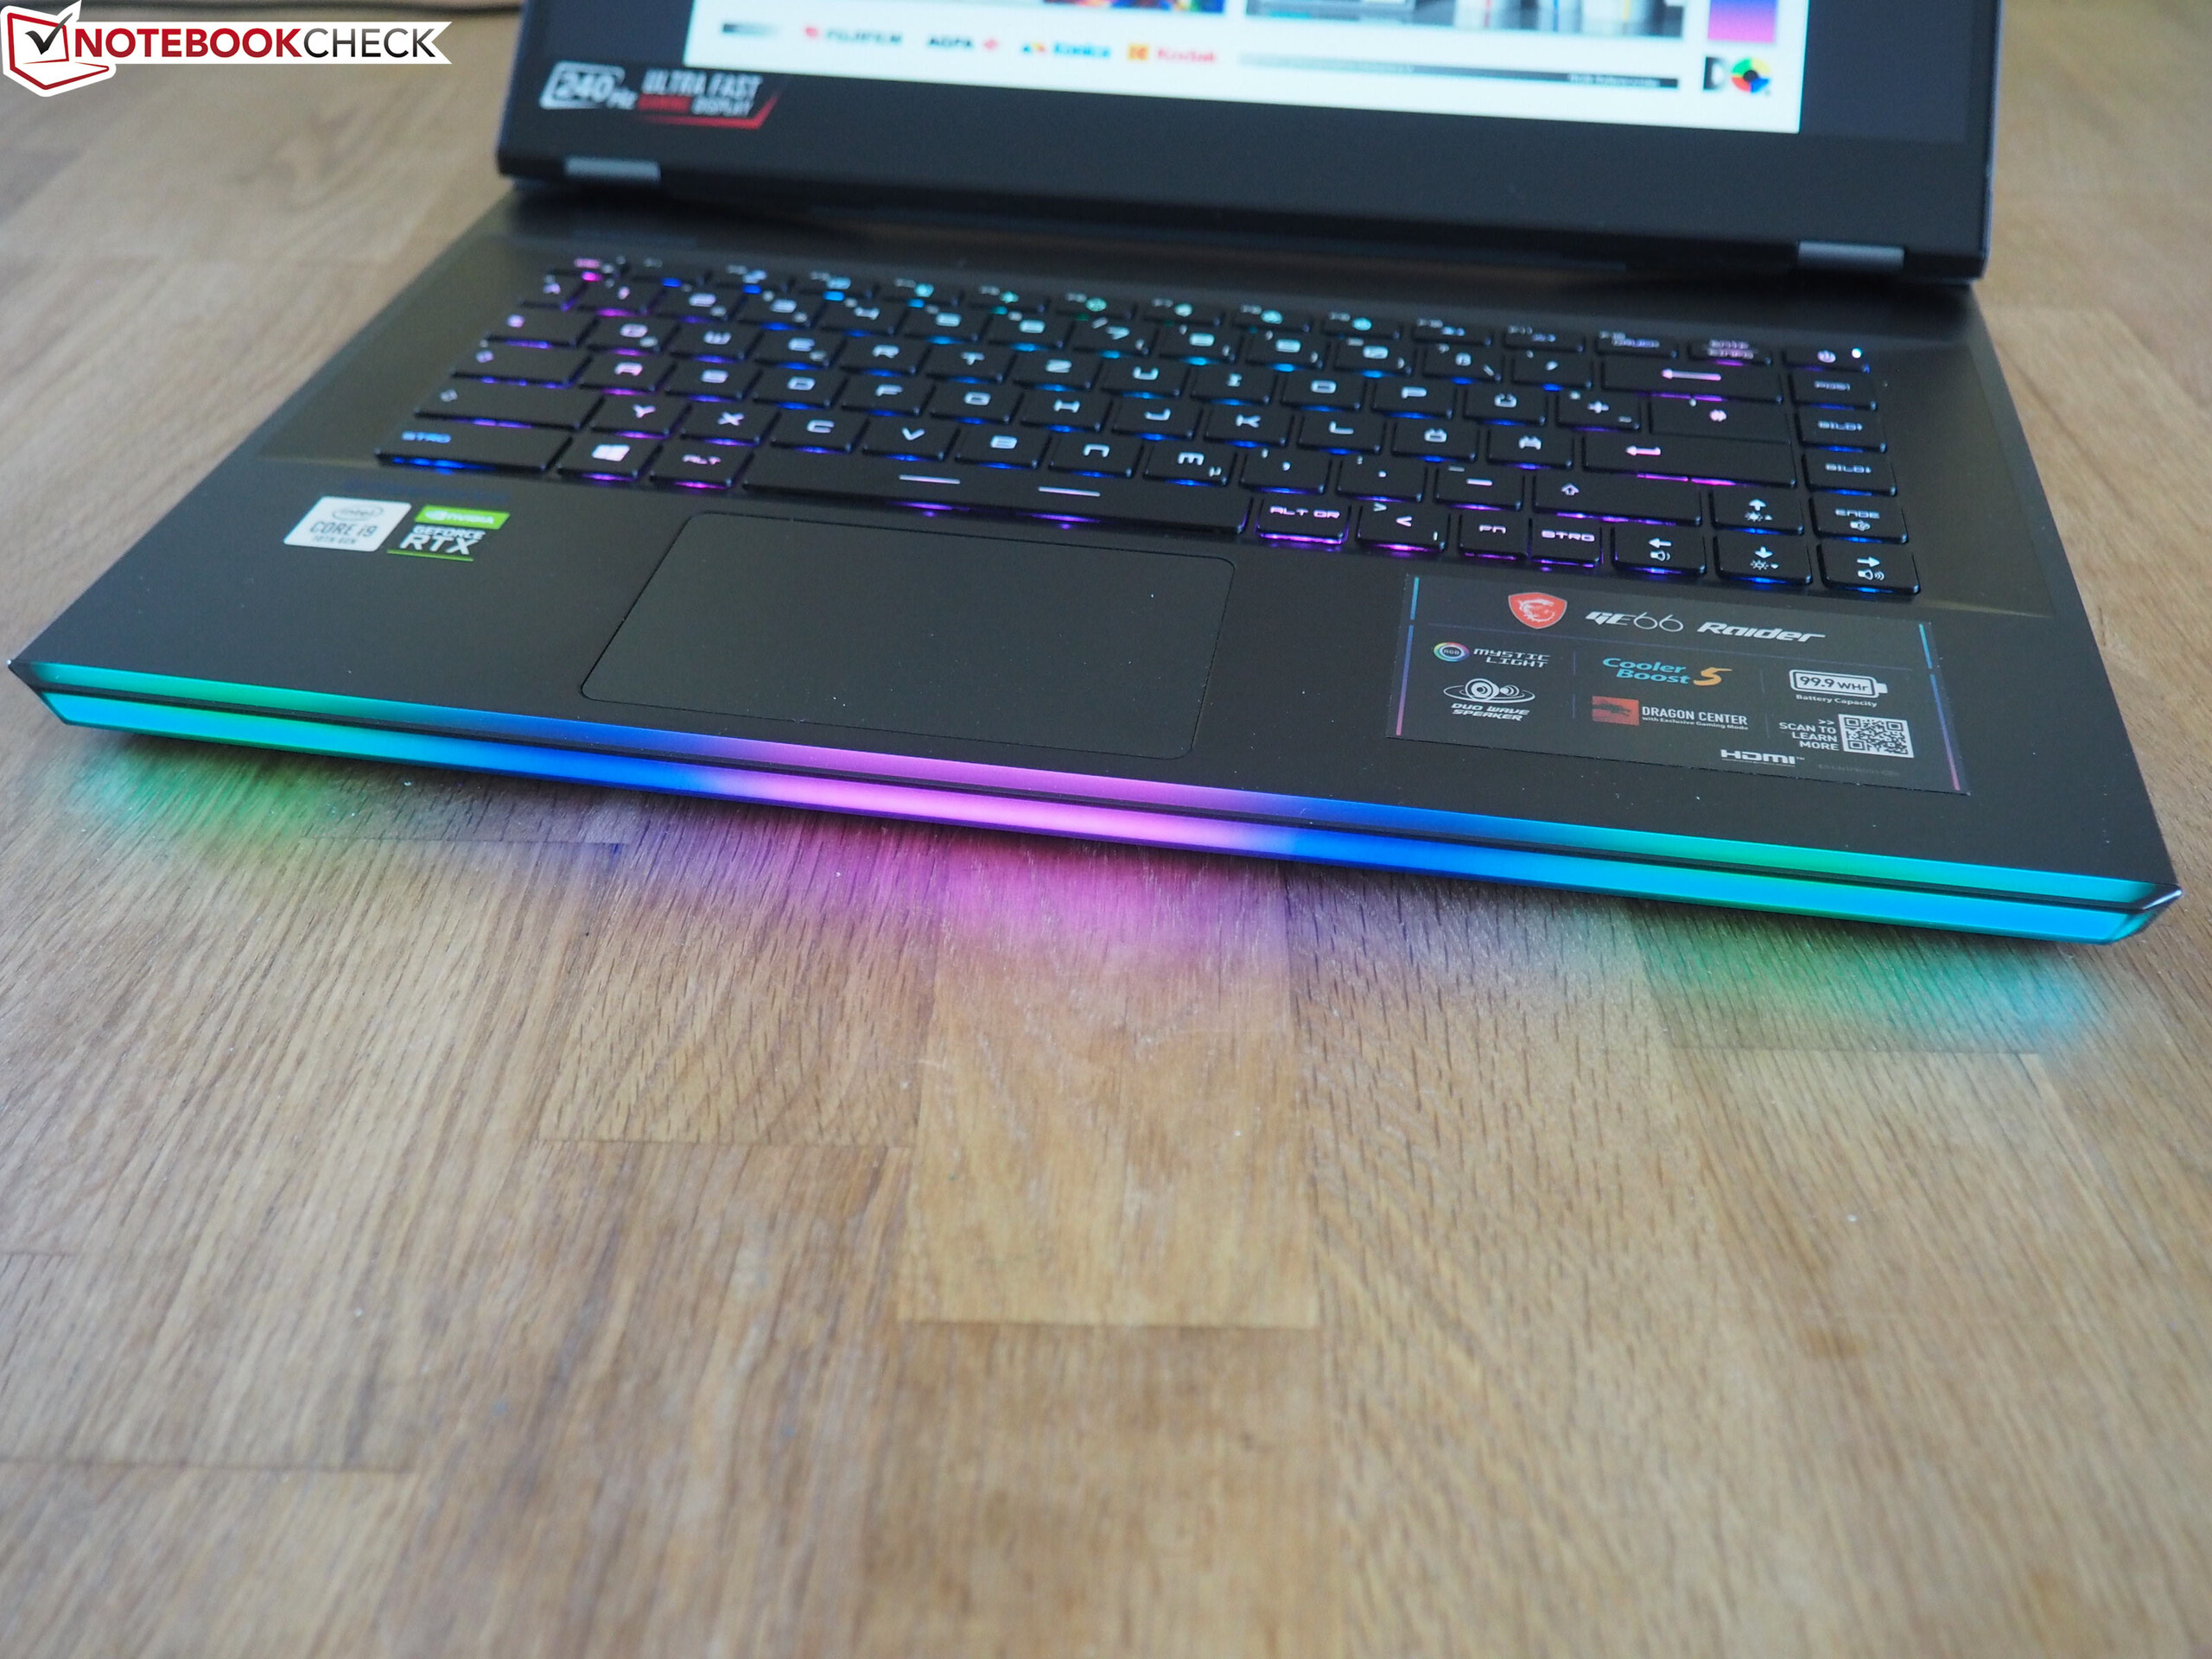
Görsel olarak GE66, 15 inçlik stabilerinden GE65'ten çok farklı. Biçim ve tasarım dili, 2019'da kapsamlı bir şekilde test ettiğimiz 17 inç GT76 Titan'a daha yönelik. Gri kapak, çok daha koyu renk tonunda tasarlanmış yüzeylerin geri kalanından güzel bir şekilde öne çıkıyor. eğriler ve tasarım öğeleri GE66'nın elbette bir zevk meselesi olan MSI meslektaşlarının çoğundan daha eğlenceli görünmesini sağlar. Dizüstü bilgisayarın ön tarafındaki LED şerit özellikle dikkat çekicidir ve klavyeye uyacak şekilde farklı renklerde aydınlatılabilir (veya istenirse devre dışı bırakılabilir). Davanın işçiliği ve istikrarı, eleştiriye neden olmaz - belki de çerçevede mükemmel bir şekilde kaybolmayan LED şerit hariç.
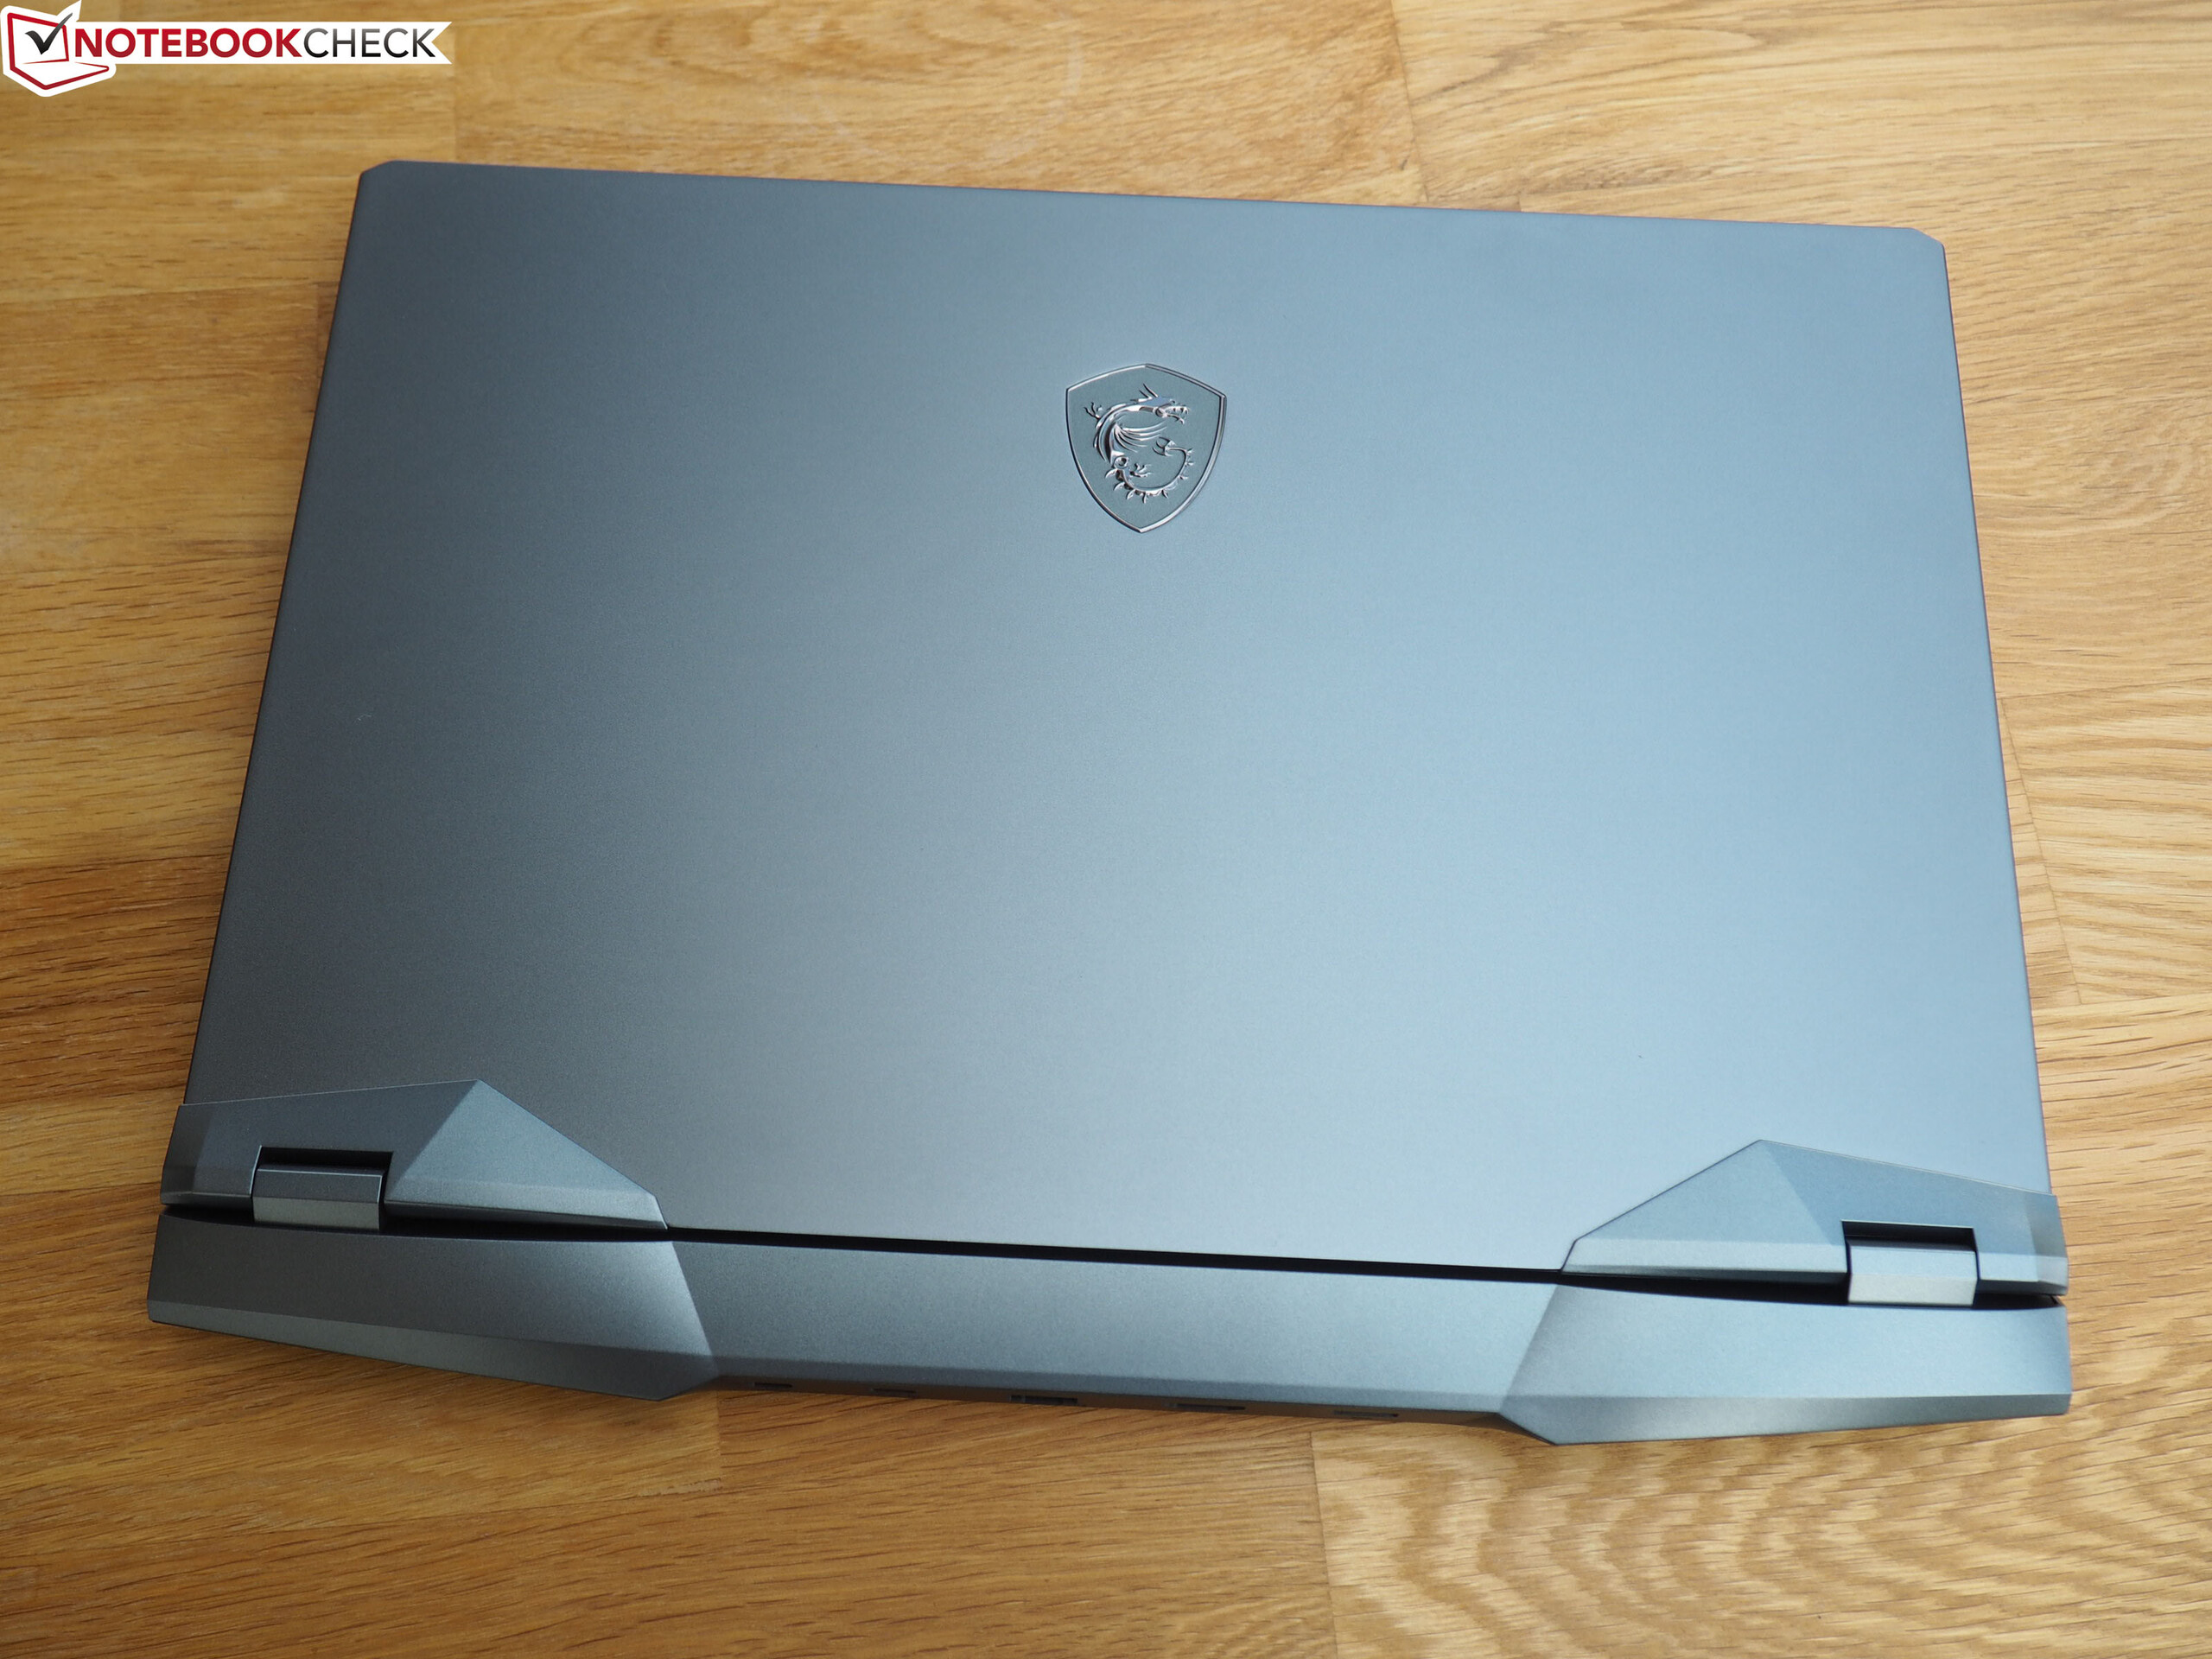

15 inçlik kalite açısından iyi bir rakam kesiyor. Kapak (A-kapak) dışında, ana birimin üst tarafı (C-kapak) da metalden yapılmıştır. Dizüstü bilgisayarın ağırlığı yaklaşık 2,4 kg, rakipleriyle eşit. Toplam yükseklik, rekabetten biraz daha düşüktür. GE66 2,5 cm ila 3,0 cm yerine yalnızca 2,3 cm'ye ulaşır. Taban alan büyüklüğü yaklaşık ortalamadır (35,8 x 26,7 cm). Mevcut trendin ardından MSI ince bir çerçeve tasarımı kullanıyor.
Bağlantı
Limanlar
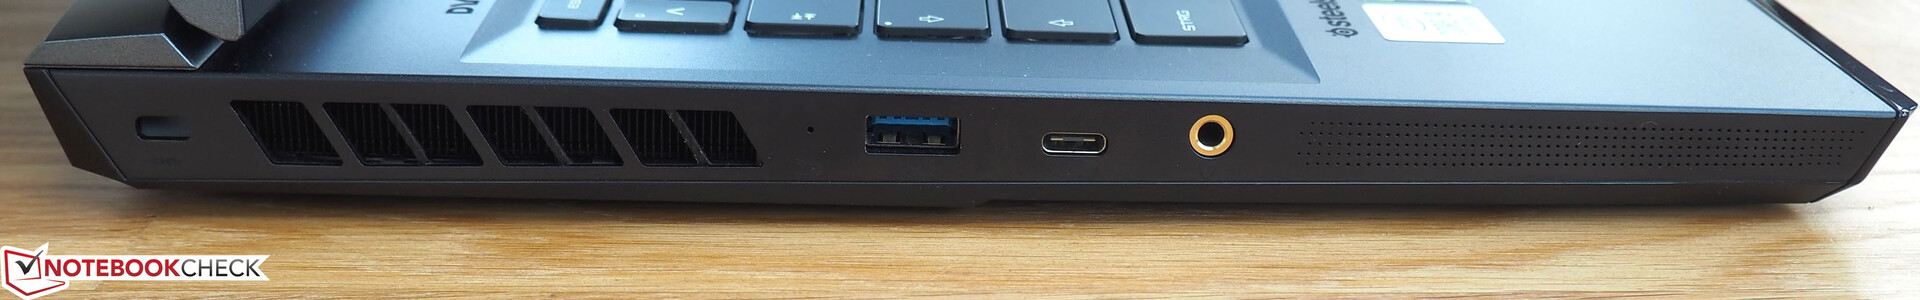
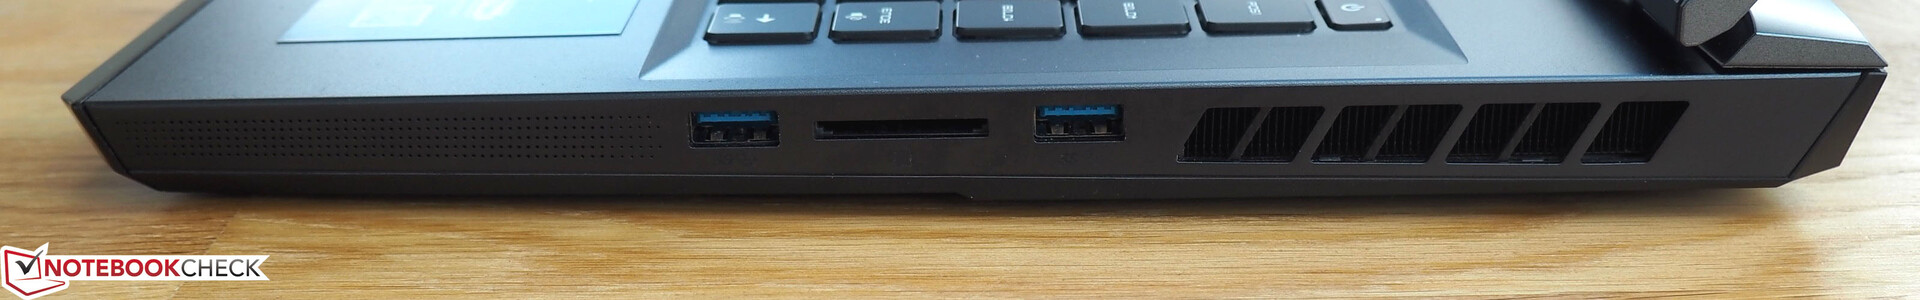
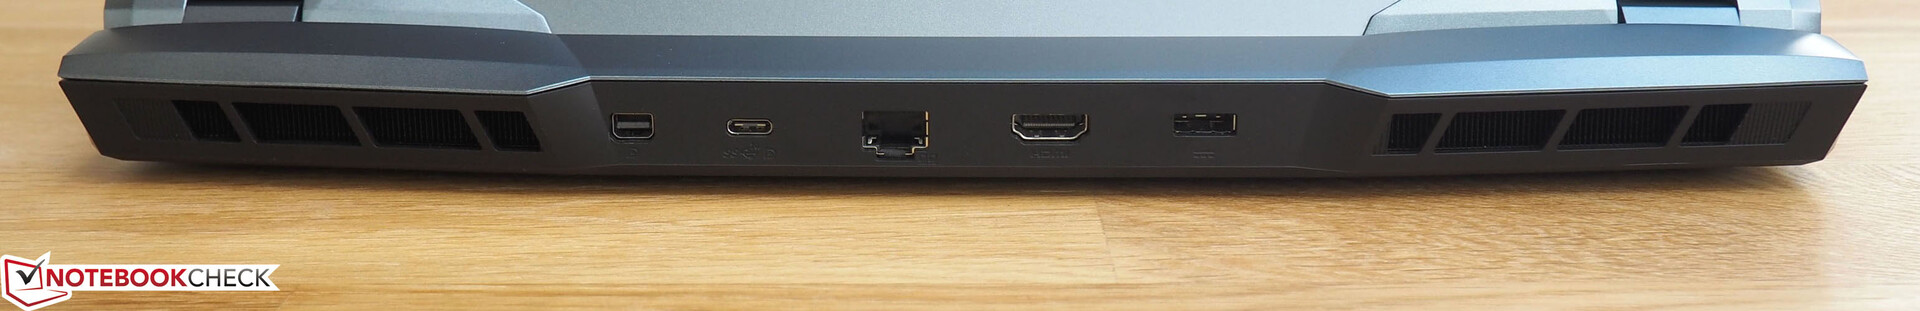
Eksik Thunderbolt 3 bağlantı noktasını gözden kaçırırsanız, bağlantı iyi düzeydedir. MSI, USB bağlantı noktası olarak üç Type-A soketi ve iki Type-C soketi kullanır. İkincisinden biri DisplayPort'u, diğeri modern 3.2 Gen 2x2 standardını (20 Gb / s'ye kadar) destekler. Harici ekranlar ayrıca özel Mini DisplayPort'a veya HDMI 2.0 çıkışına (4K @ 60 Hz) bağlanabilir. Ek olarak bir RJ45 bağlantı noktası, bir ses jakı ve bir kart okuyucu bulacaksınız.En önemli arayüzler arkada bulunduğundan, hem sol hem de sağ elini kullanan kullanıcılar, bir fare kullanırken hareket kısıtlamaları konusunda endişelenmek zorunda kalmazlar.
SD kart okuyucu
Dahili SD kart okuyucu çok yüksek aktarım hızları sunar. Referans kartımızla yaptığımız testte yaklaşık 200 MB / s Eurocom Nightsky RX15 ile aynı seviyede. GE65 9SF neredeyse 30 MB / s'de çok geride (sadece USB 2.0 hızında).
| SD Card Reader | |
| average JPG Copy Test (av. of 3 runs) | |
| MSI GE66 Raider 10SFS (Toshiba Exceria Pro SDXC 64 GB UHS-II) | |
| Eurocom Nightsky RX15 (Toshiba Exceria Pro SDXC 64 GB UHS-II) | |
| Sınıf ortalaması Gaming (20.9 - 210, n=54, son 2 yıl) | |
| MSI GE65 Raider 9SF-049US (Toshiba Exceria Pro SDXC 64 GB UHS-II) | |
| maximum AS SSD Seq Read Test (1GB) | |
| Eurocom Nightsky RX15 (Toshiba Exceria Pro SDXC 64 GB UHS-II) | |
| MSI GE66 Raider 10SFS (Toshiba Exceria Pro SDXC 64 GB UHS-II) | |
| Sınıf ortalaması Gaming (25.5 - 261, n=51, son 2 yıl) | |
| MSI GE65 Raider 9SF-049US (Toshiba Exceria Pro SDXC 64 GB UHS-II) | |
İletişim
WLAN hızı da çok inandırıcı olsa da, buradaki değerleri rekabetle karşılaştıramazsınız (son zamanlarda yönlendiricimizi güncelledik). Bir metre mesafeden GE66 ortalama 1.150 Mb / s (gönderme) ve 1.670 Mb / s (alma) elde etti. Hiç şüphe yok ki, Killer Wi-Fi 6 AX1650i modern bir kablosuz modüldür. Kablo bağlantılarından bir diğer çok hızlı Killer ürünü olan E3100G sorumludur.
| Networking | |
| iperf3 transmit AX12 | |
| MSI GE66 Raider 10SFS | |
| Eurocom Nightsky RX15 | |
| Asus Strix Scar III G531GW | |
| iperf3 receive AX12 | |
| MSI GE66 Raider 10SFS | |
| Eurocom Nightsky RX15 | |
| Asus Strix Scar III G531GW | |
Web kamerası
Web kamerası birçok rakipten biraz daha keskin görüntüler üretmesine rağmen, sunulan kalite dizüstü bilgisayarın fiyatına adalet vermiyor.


Aksesuarlar
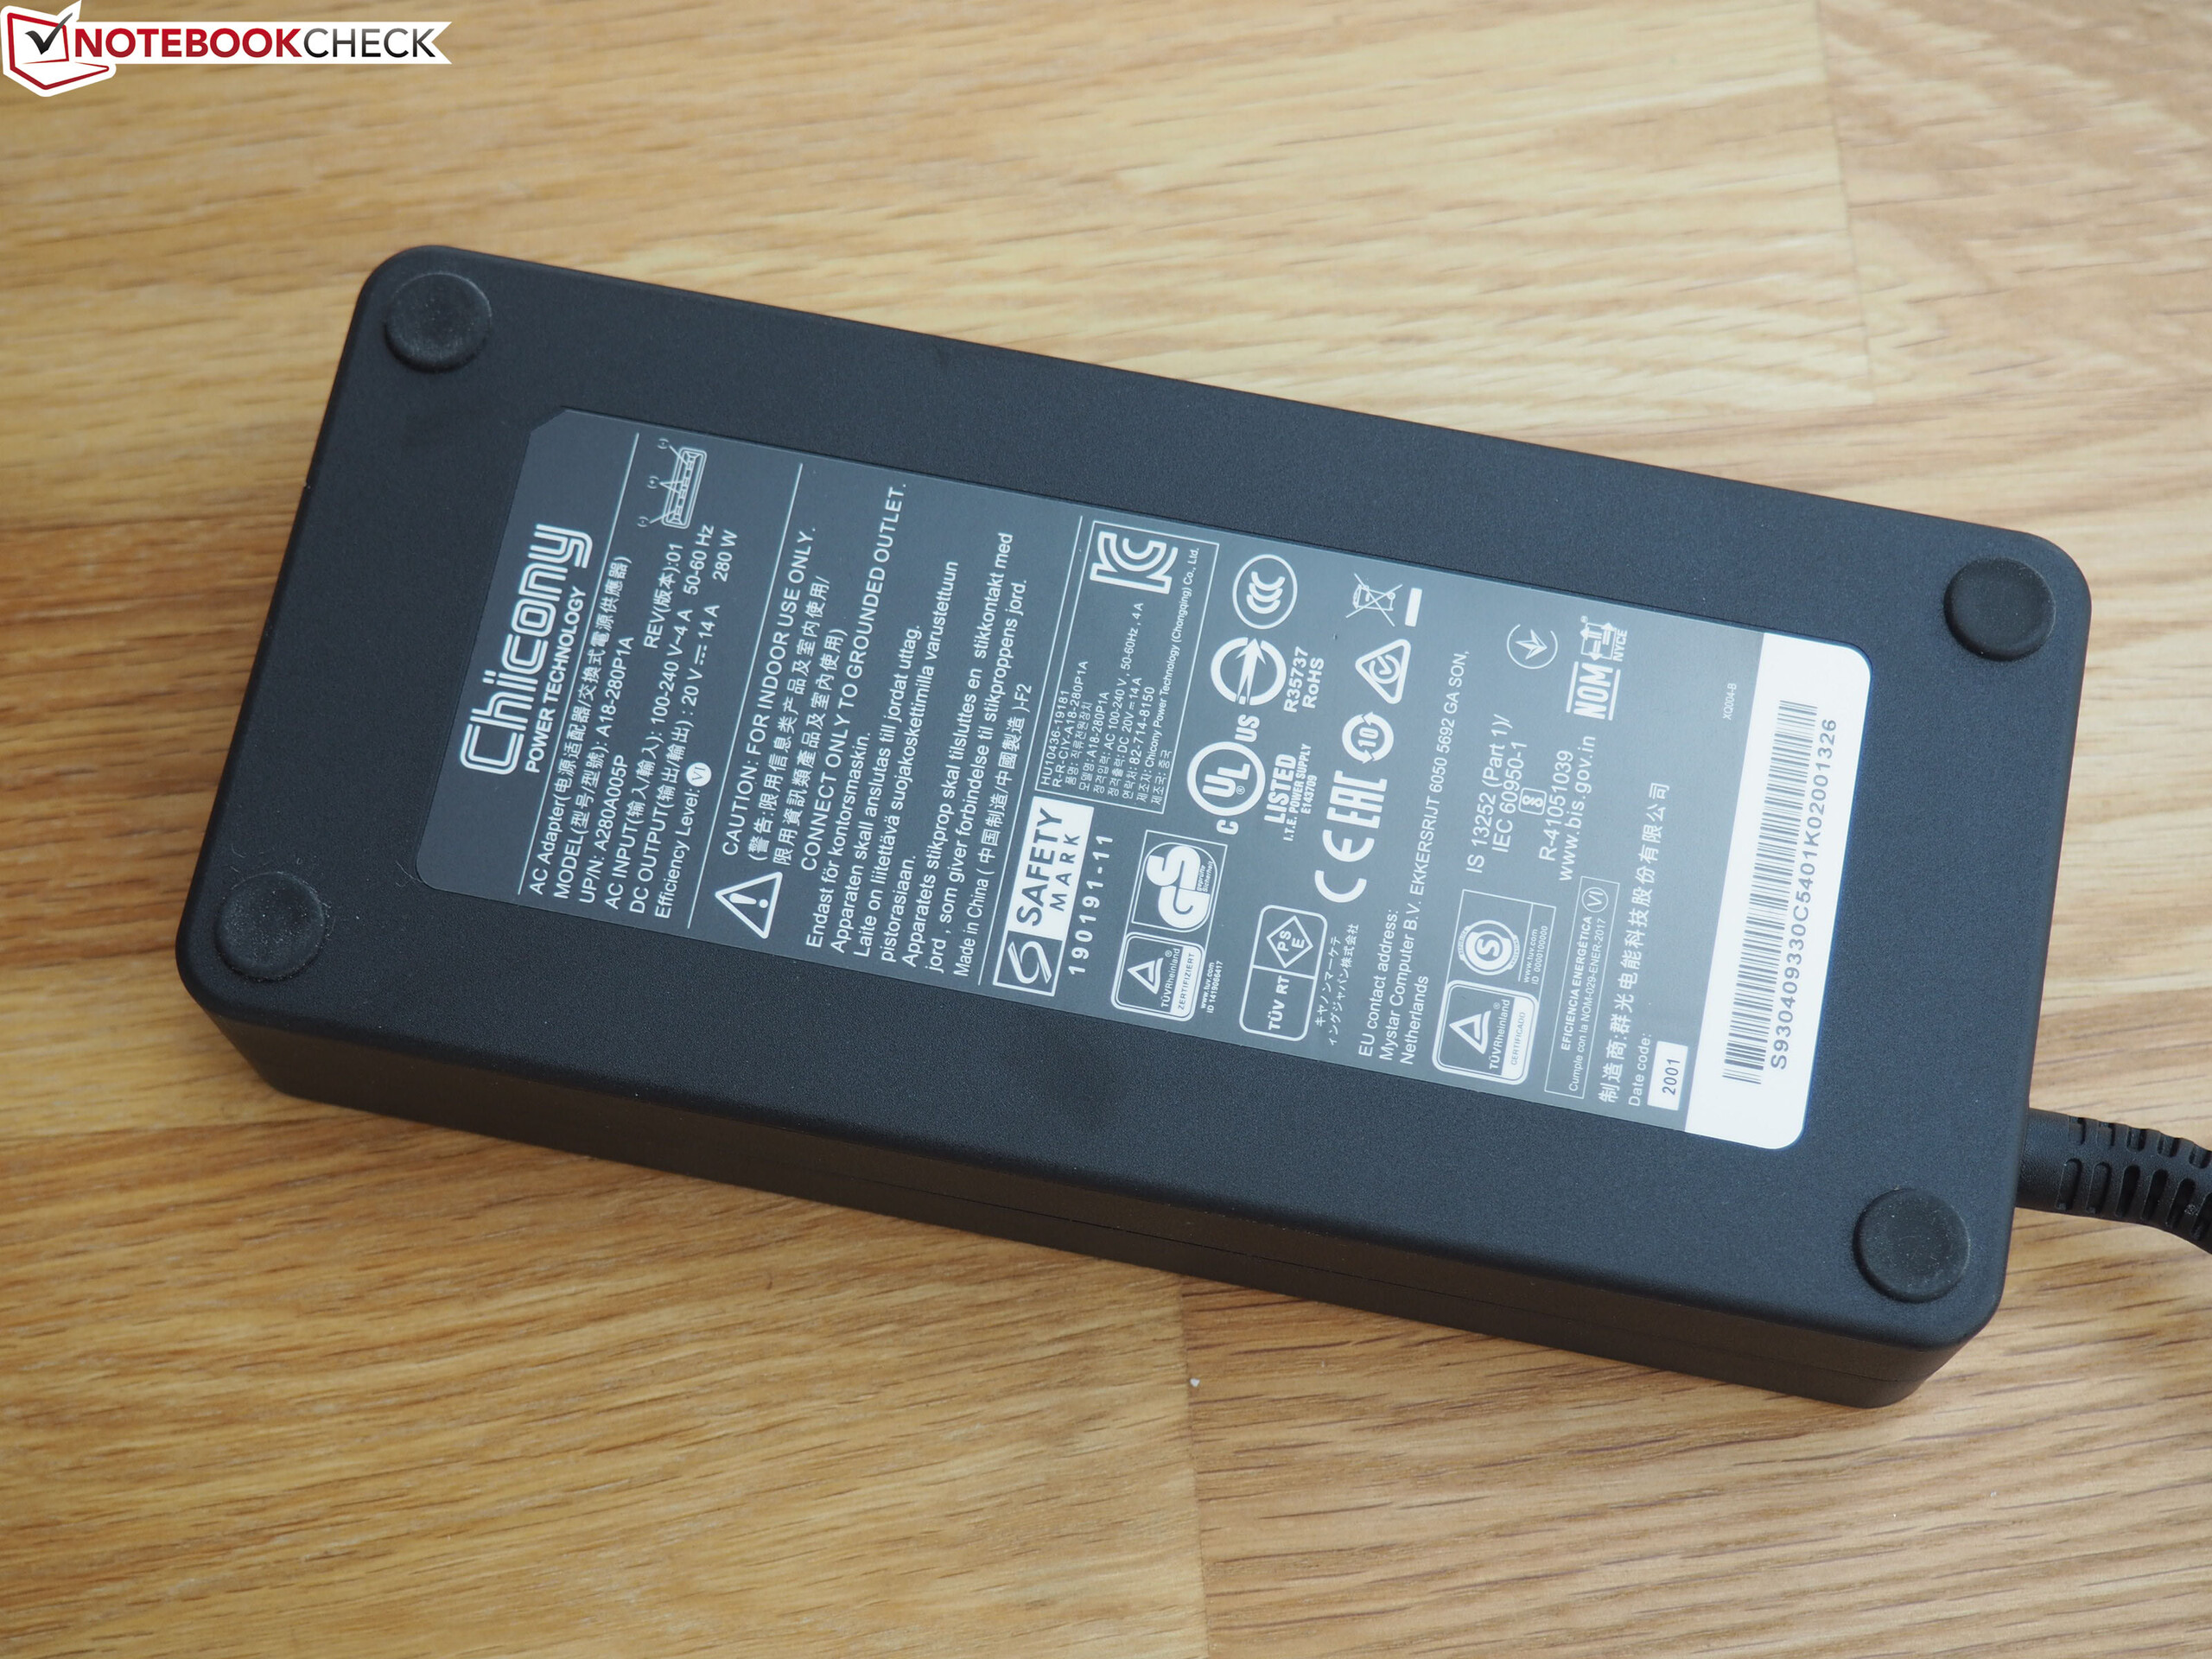
Üst düzey bileşenlerin yeterli güç almasını sağlamak için MSI, test yapılandırmasında yaklaşık 0,9 kg ağırlığında ve 18 x 8,5 x 3,5 cm ölçülerinde güçlü bir 280 Watt güç kaynağı ünitesi içerir.
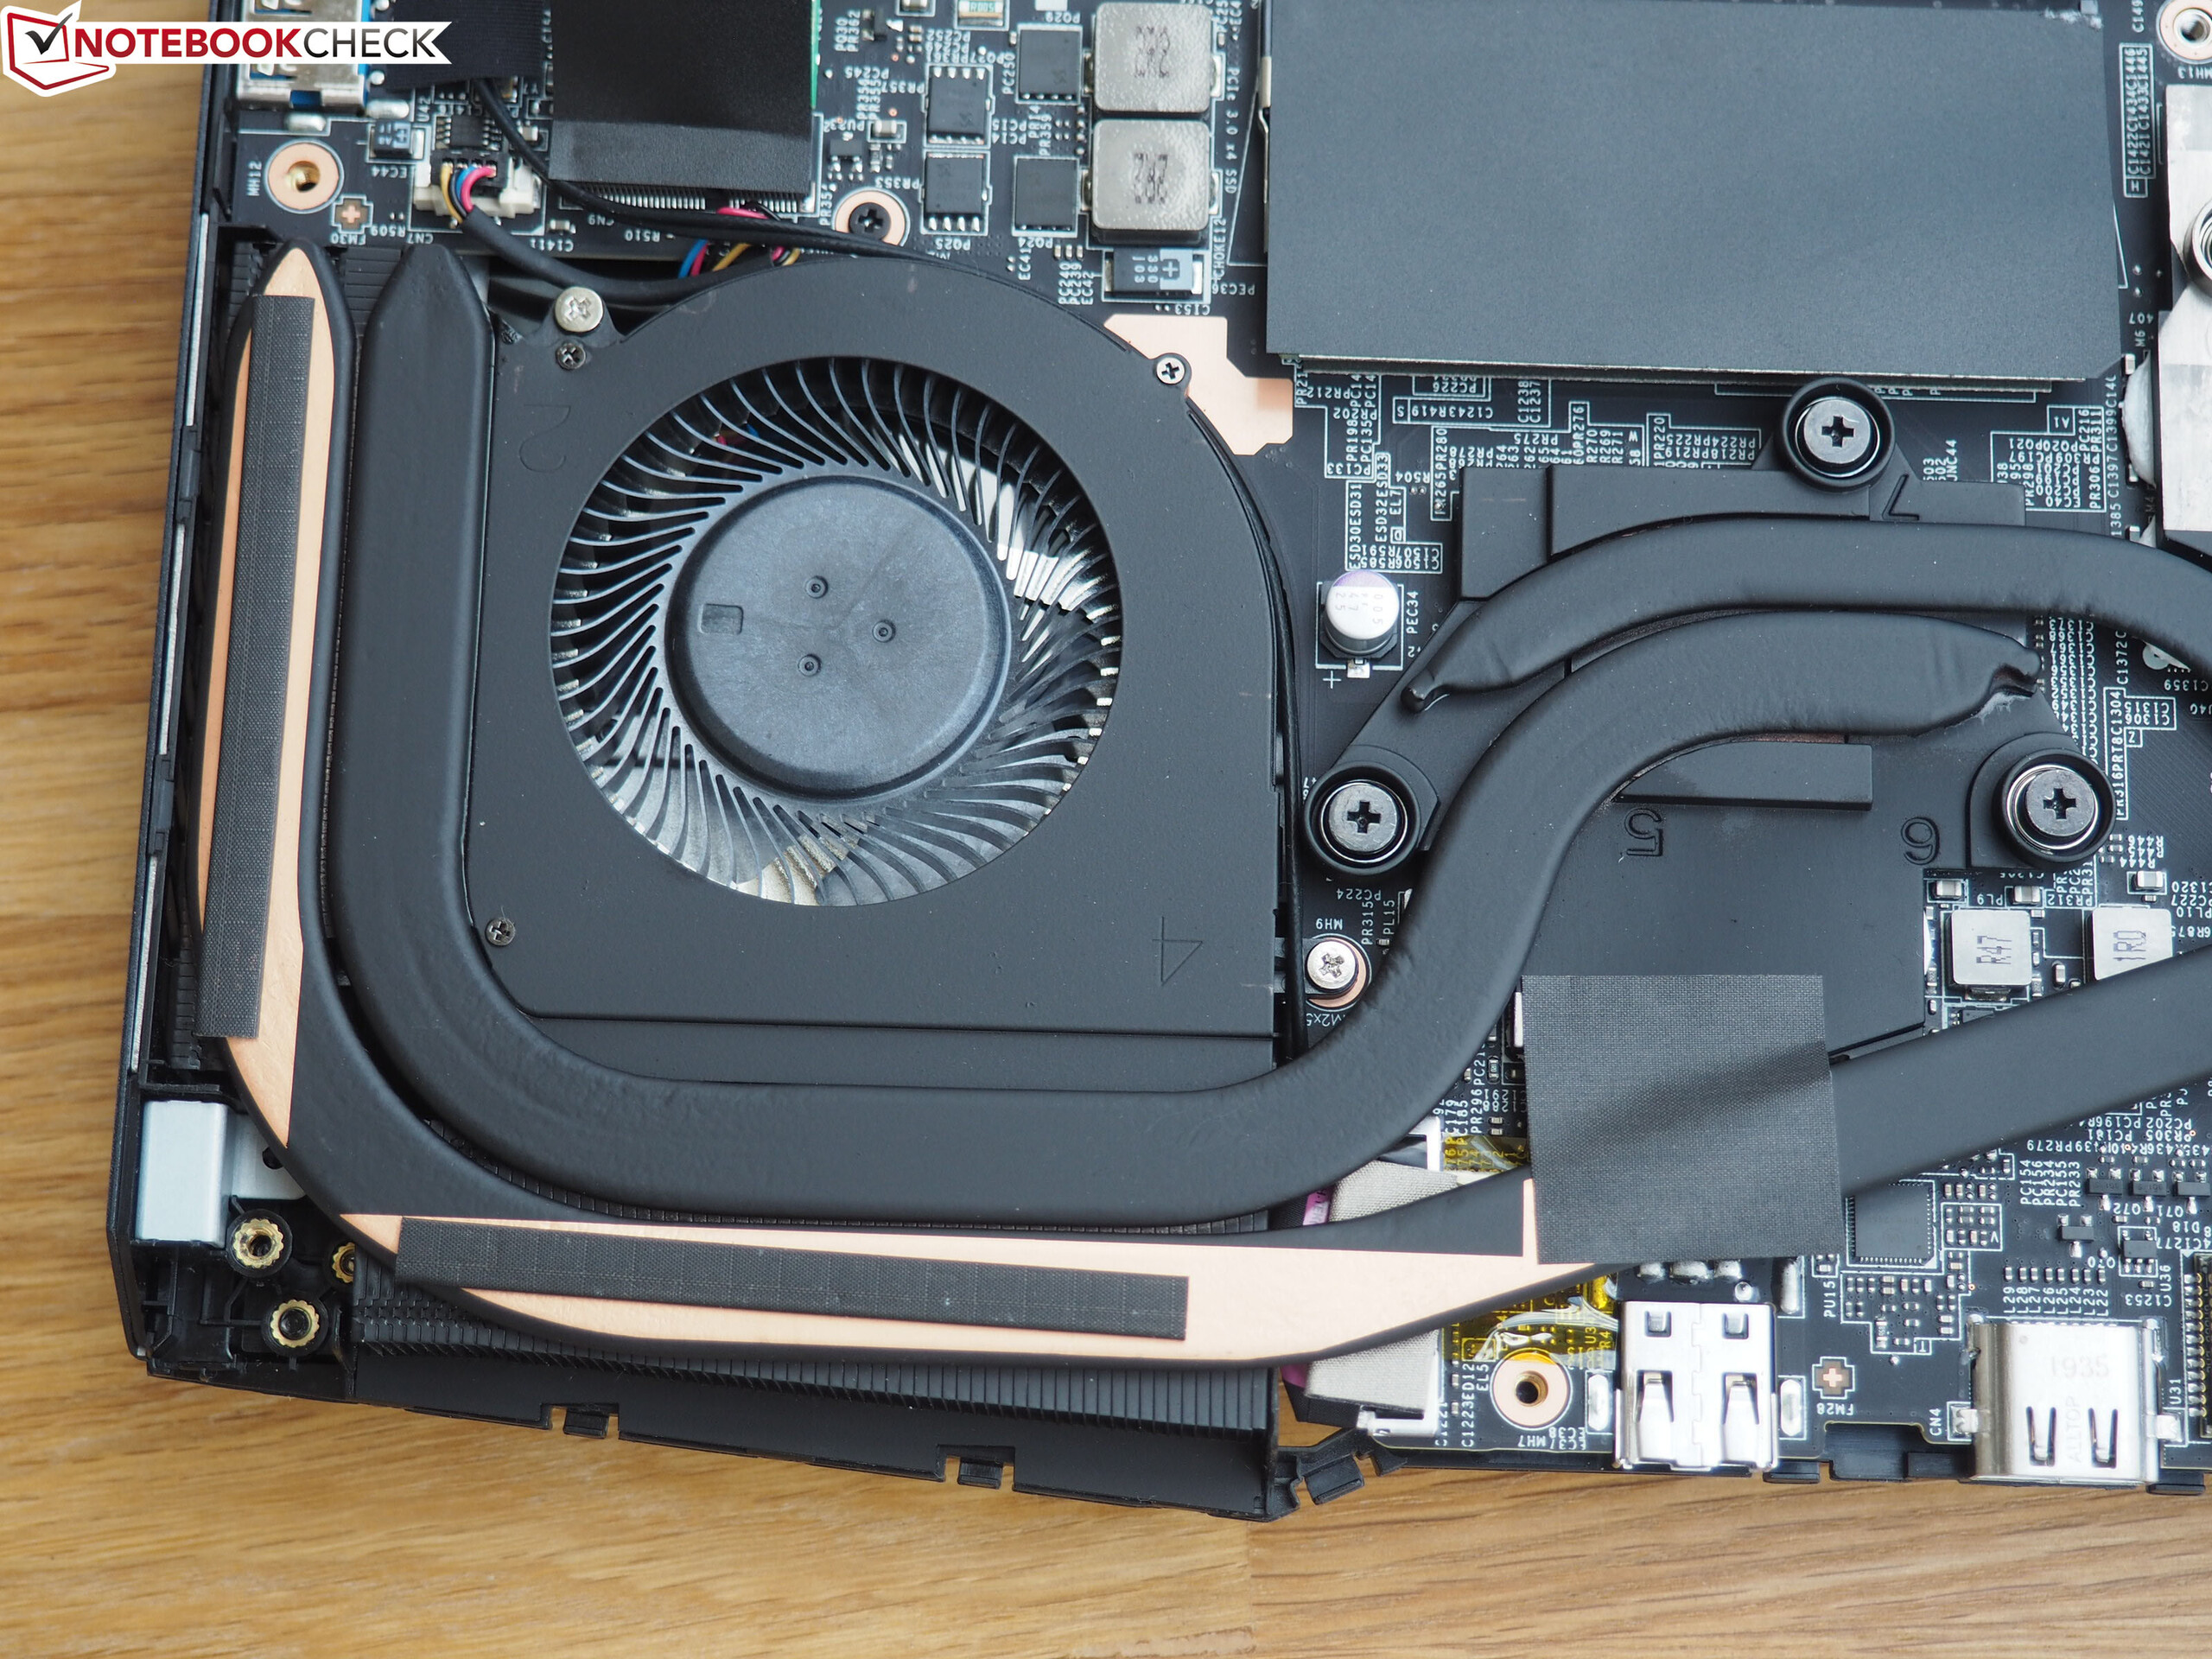
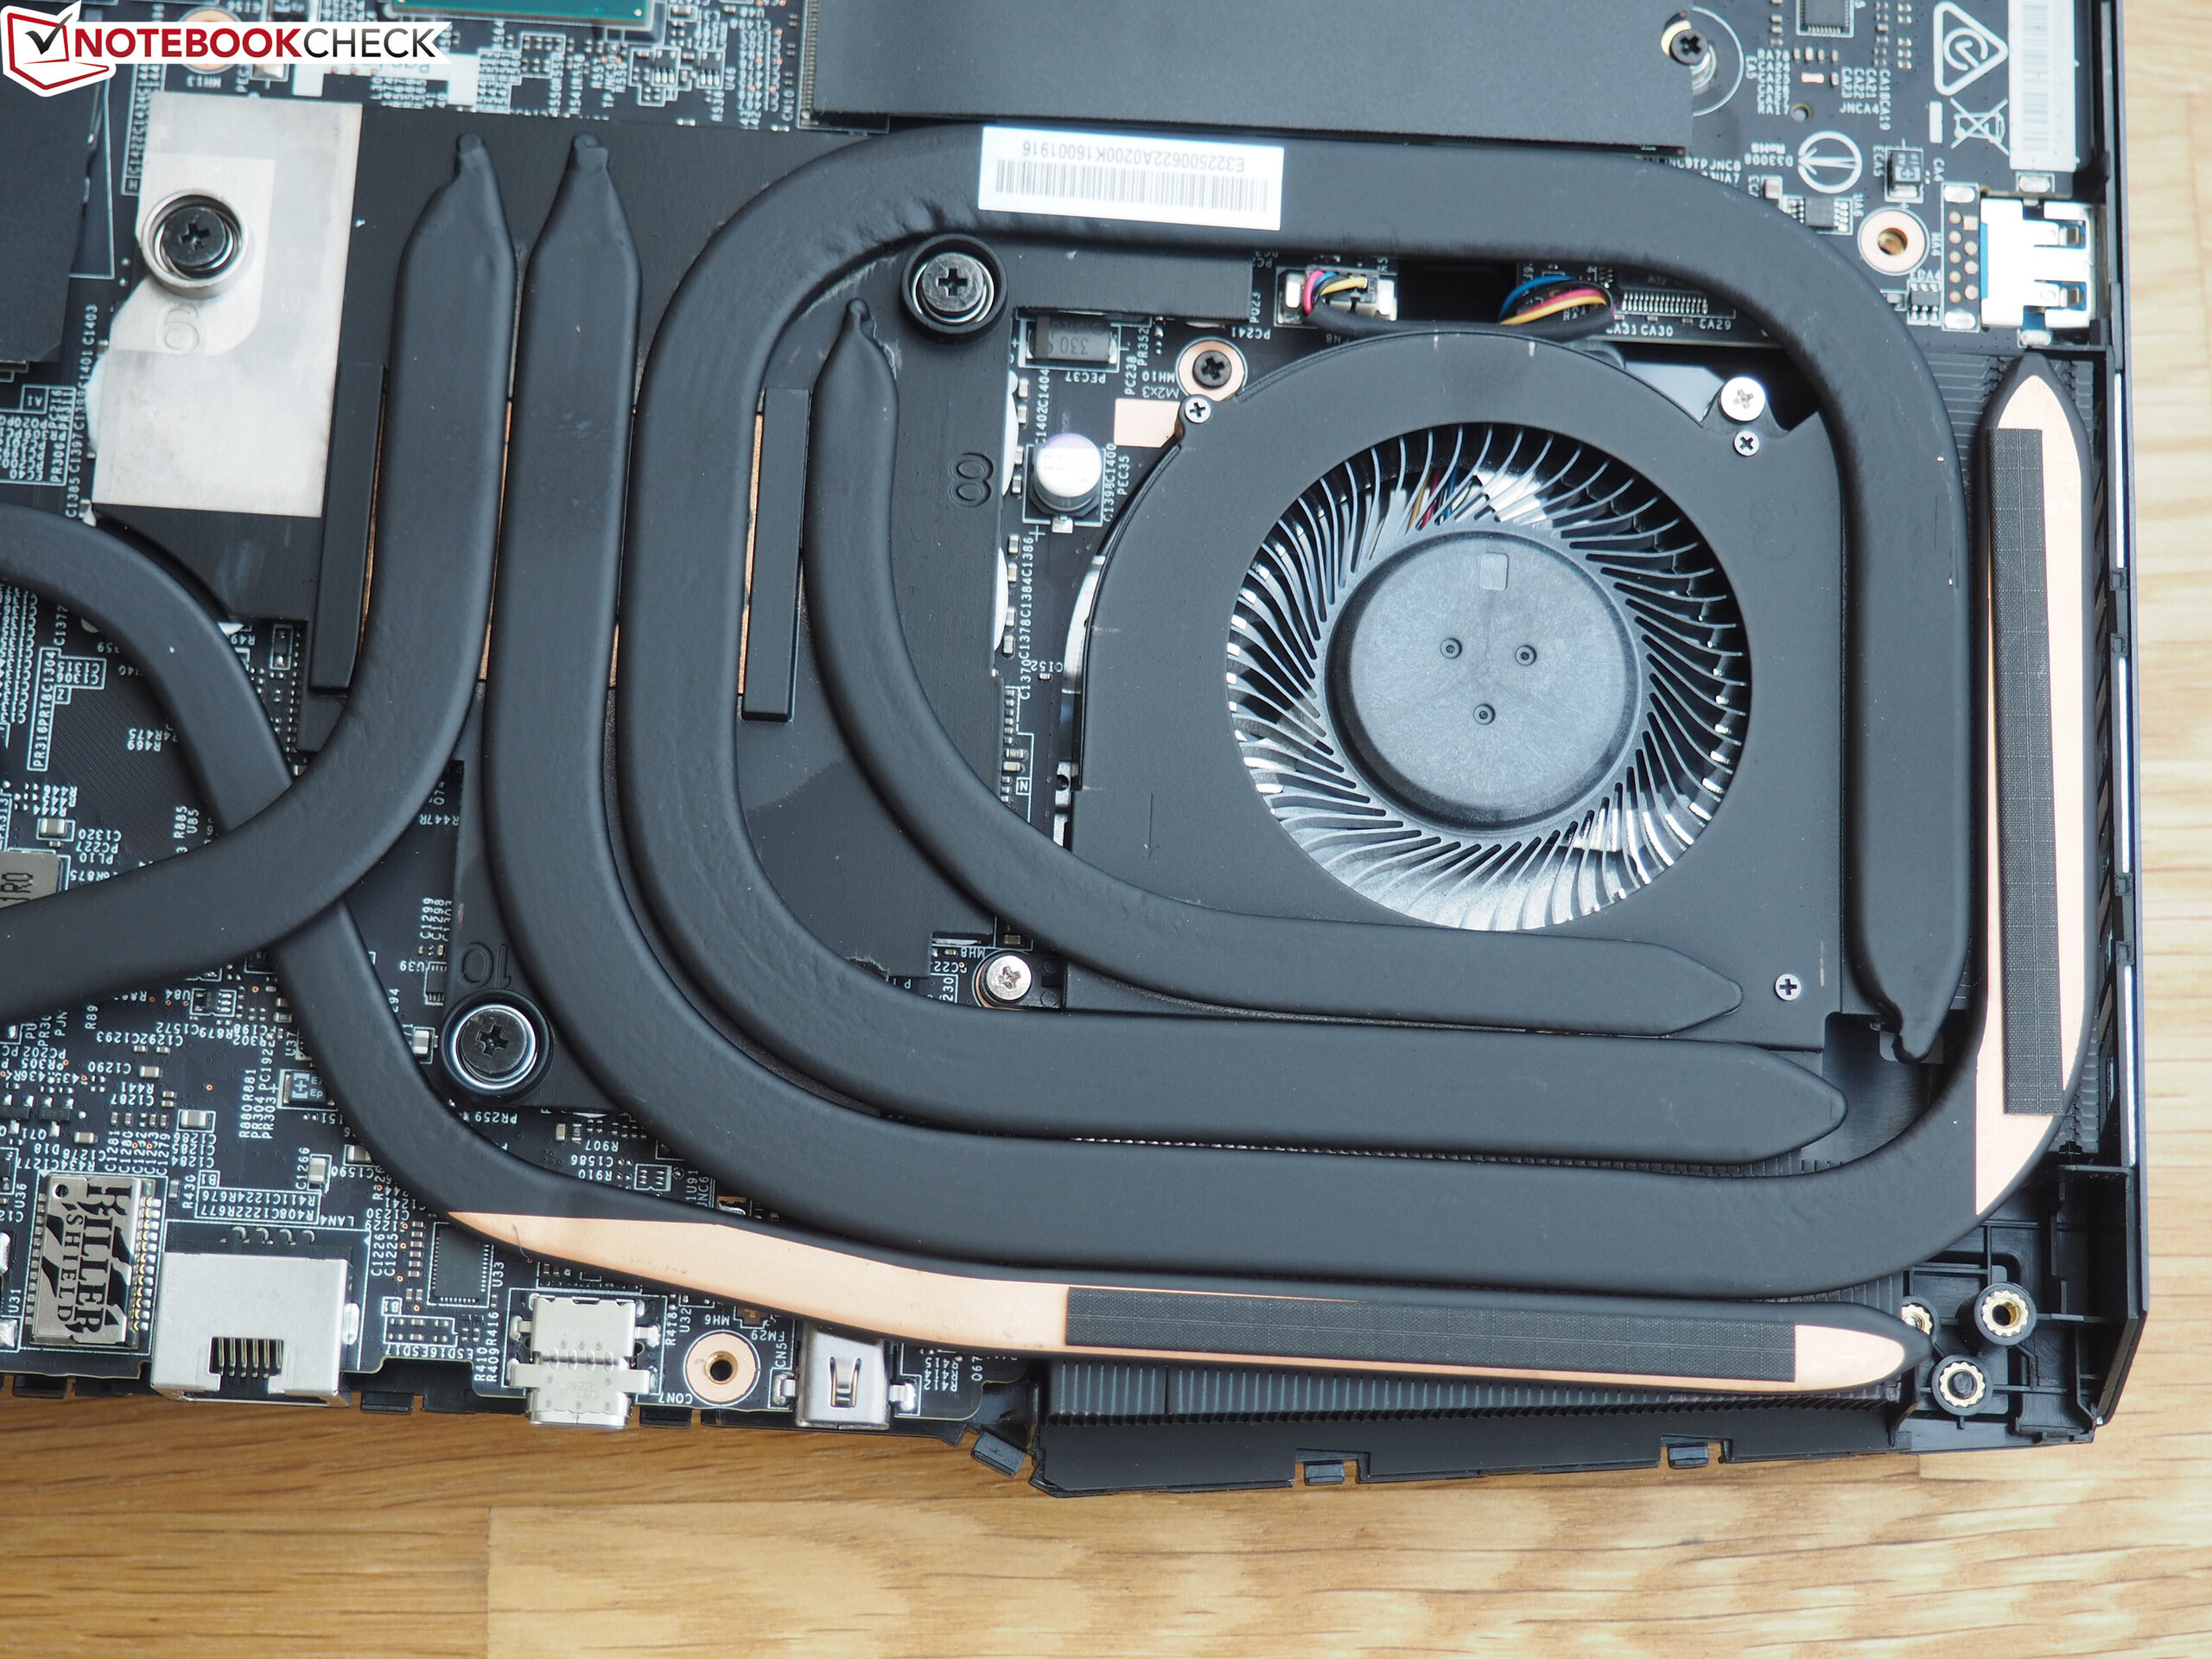
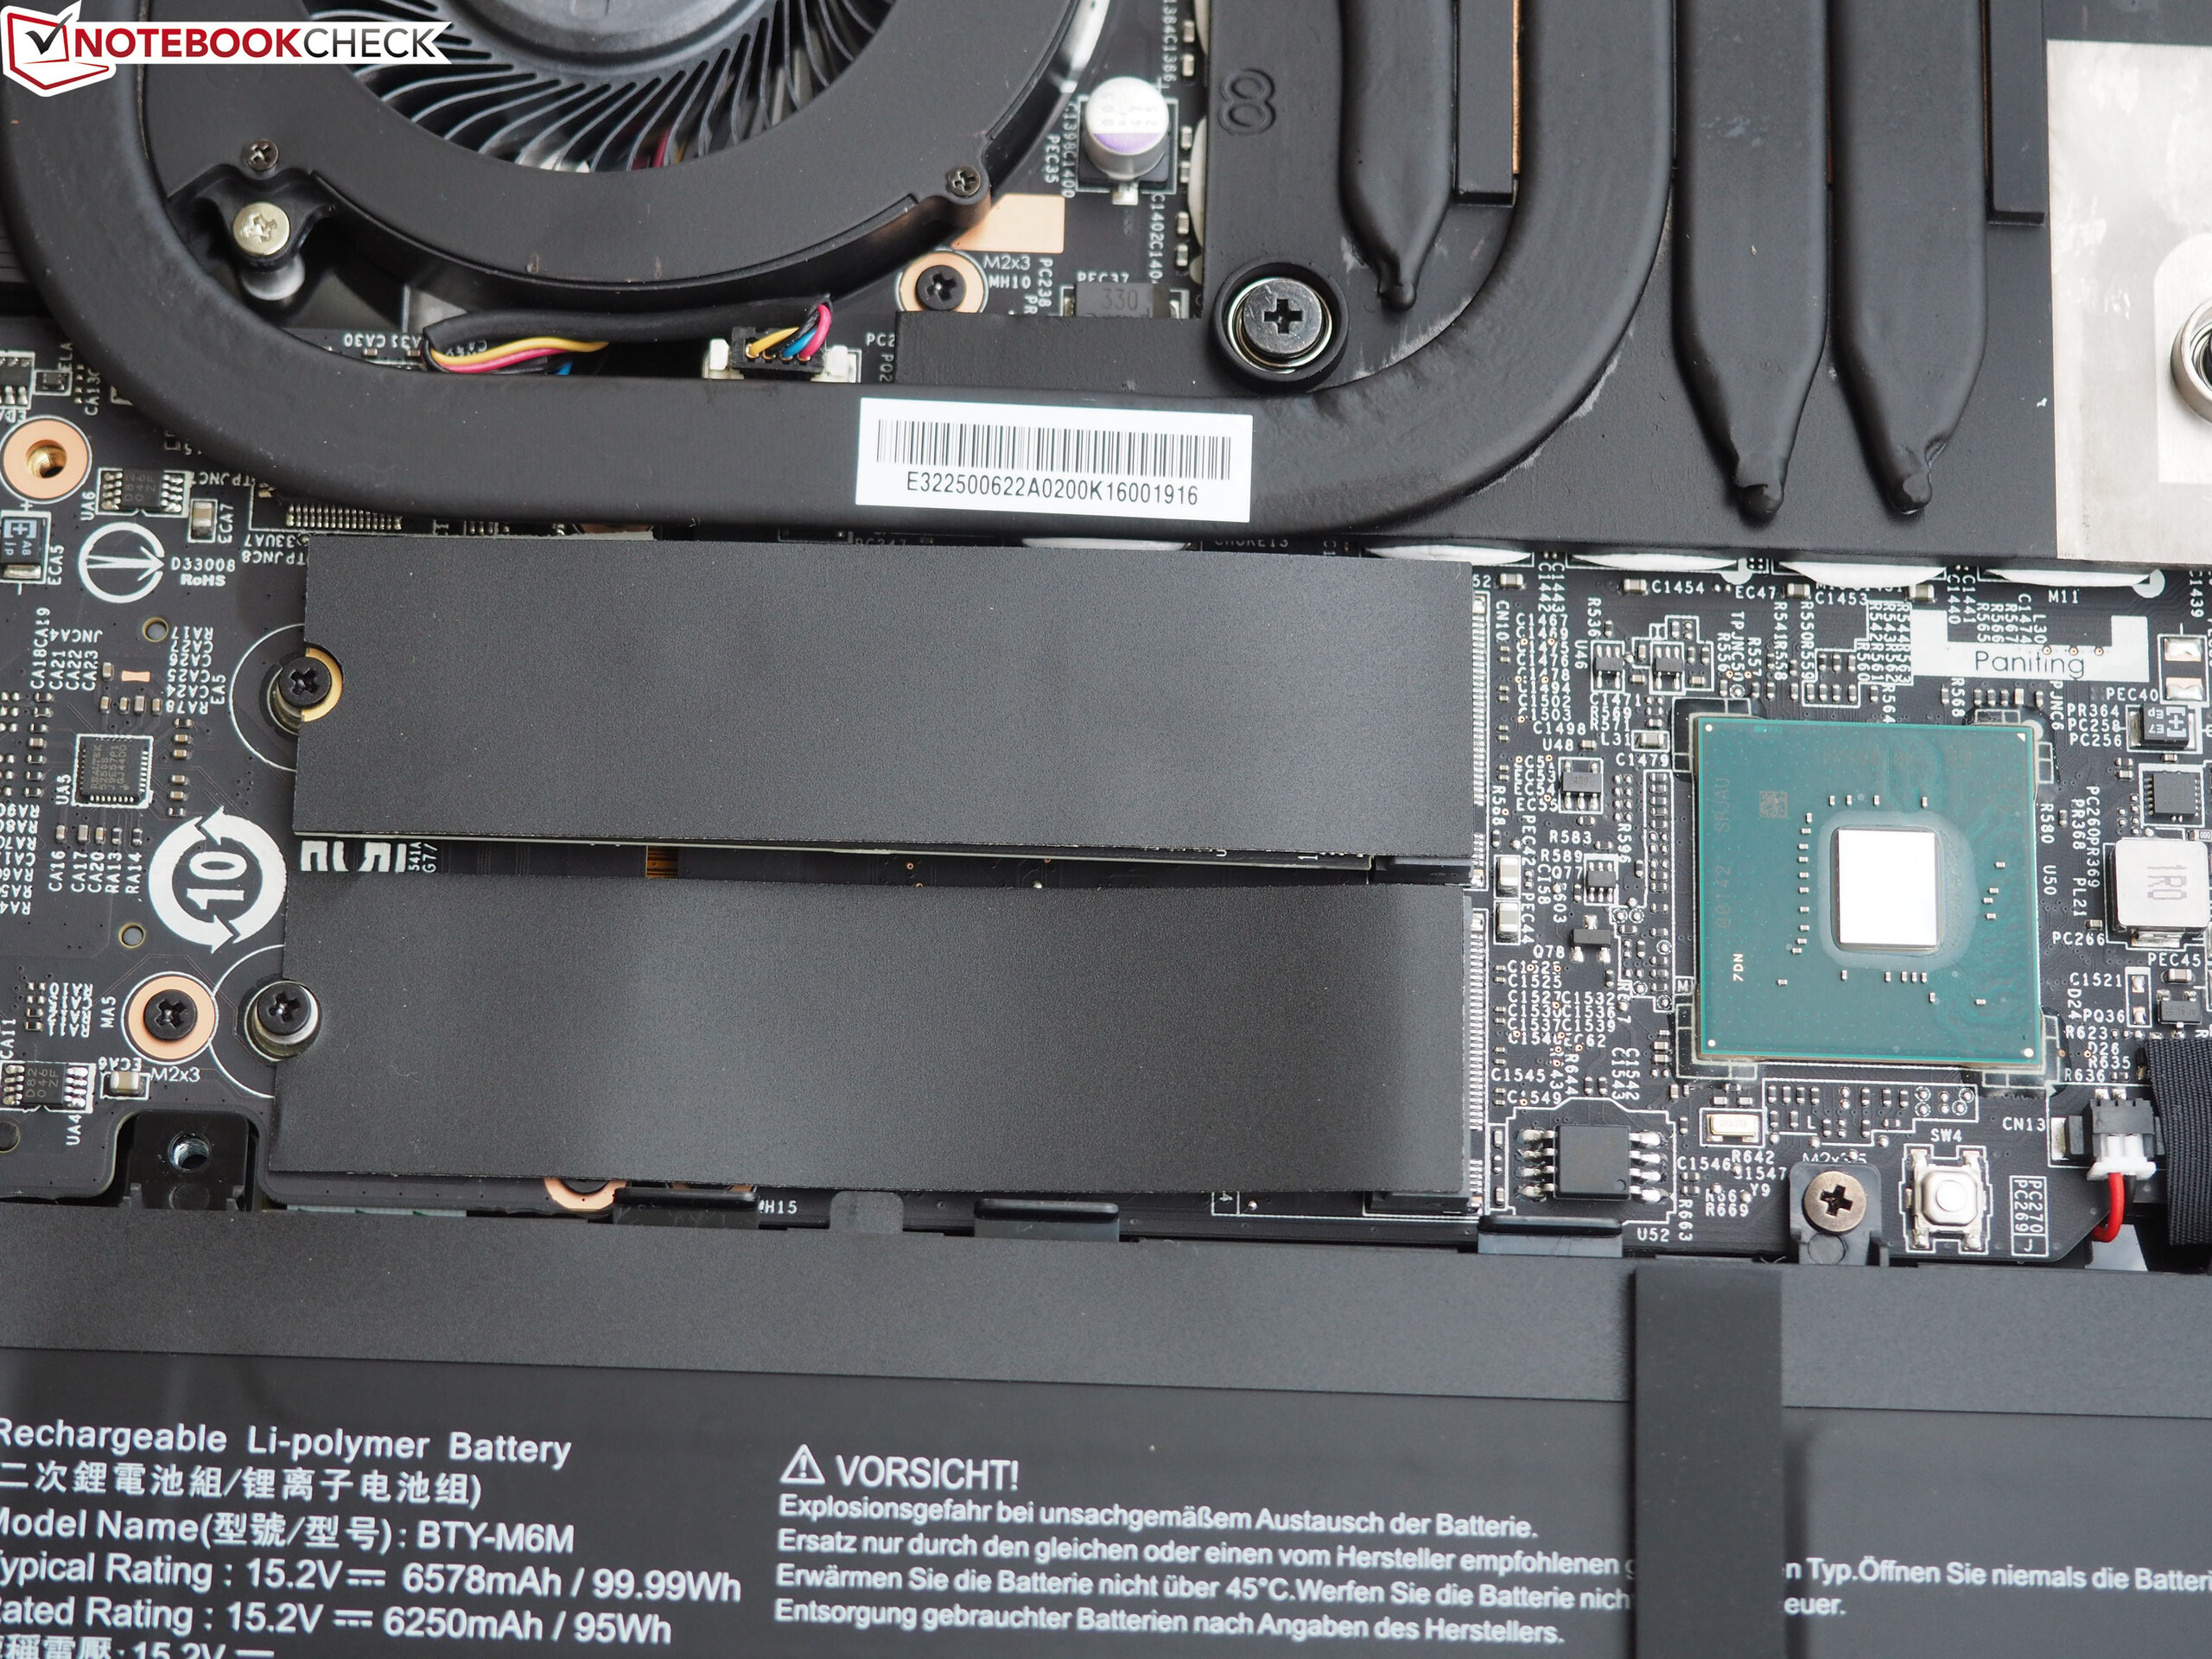
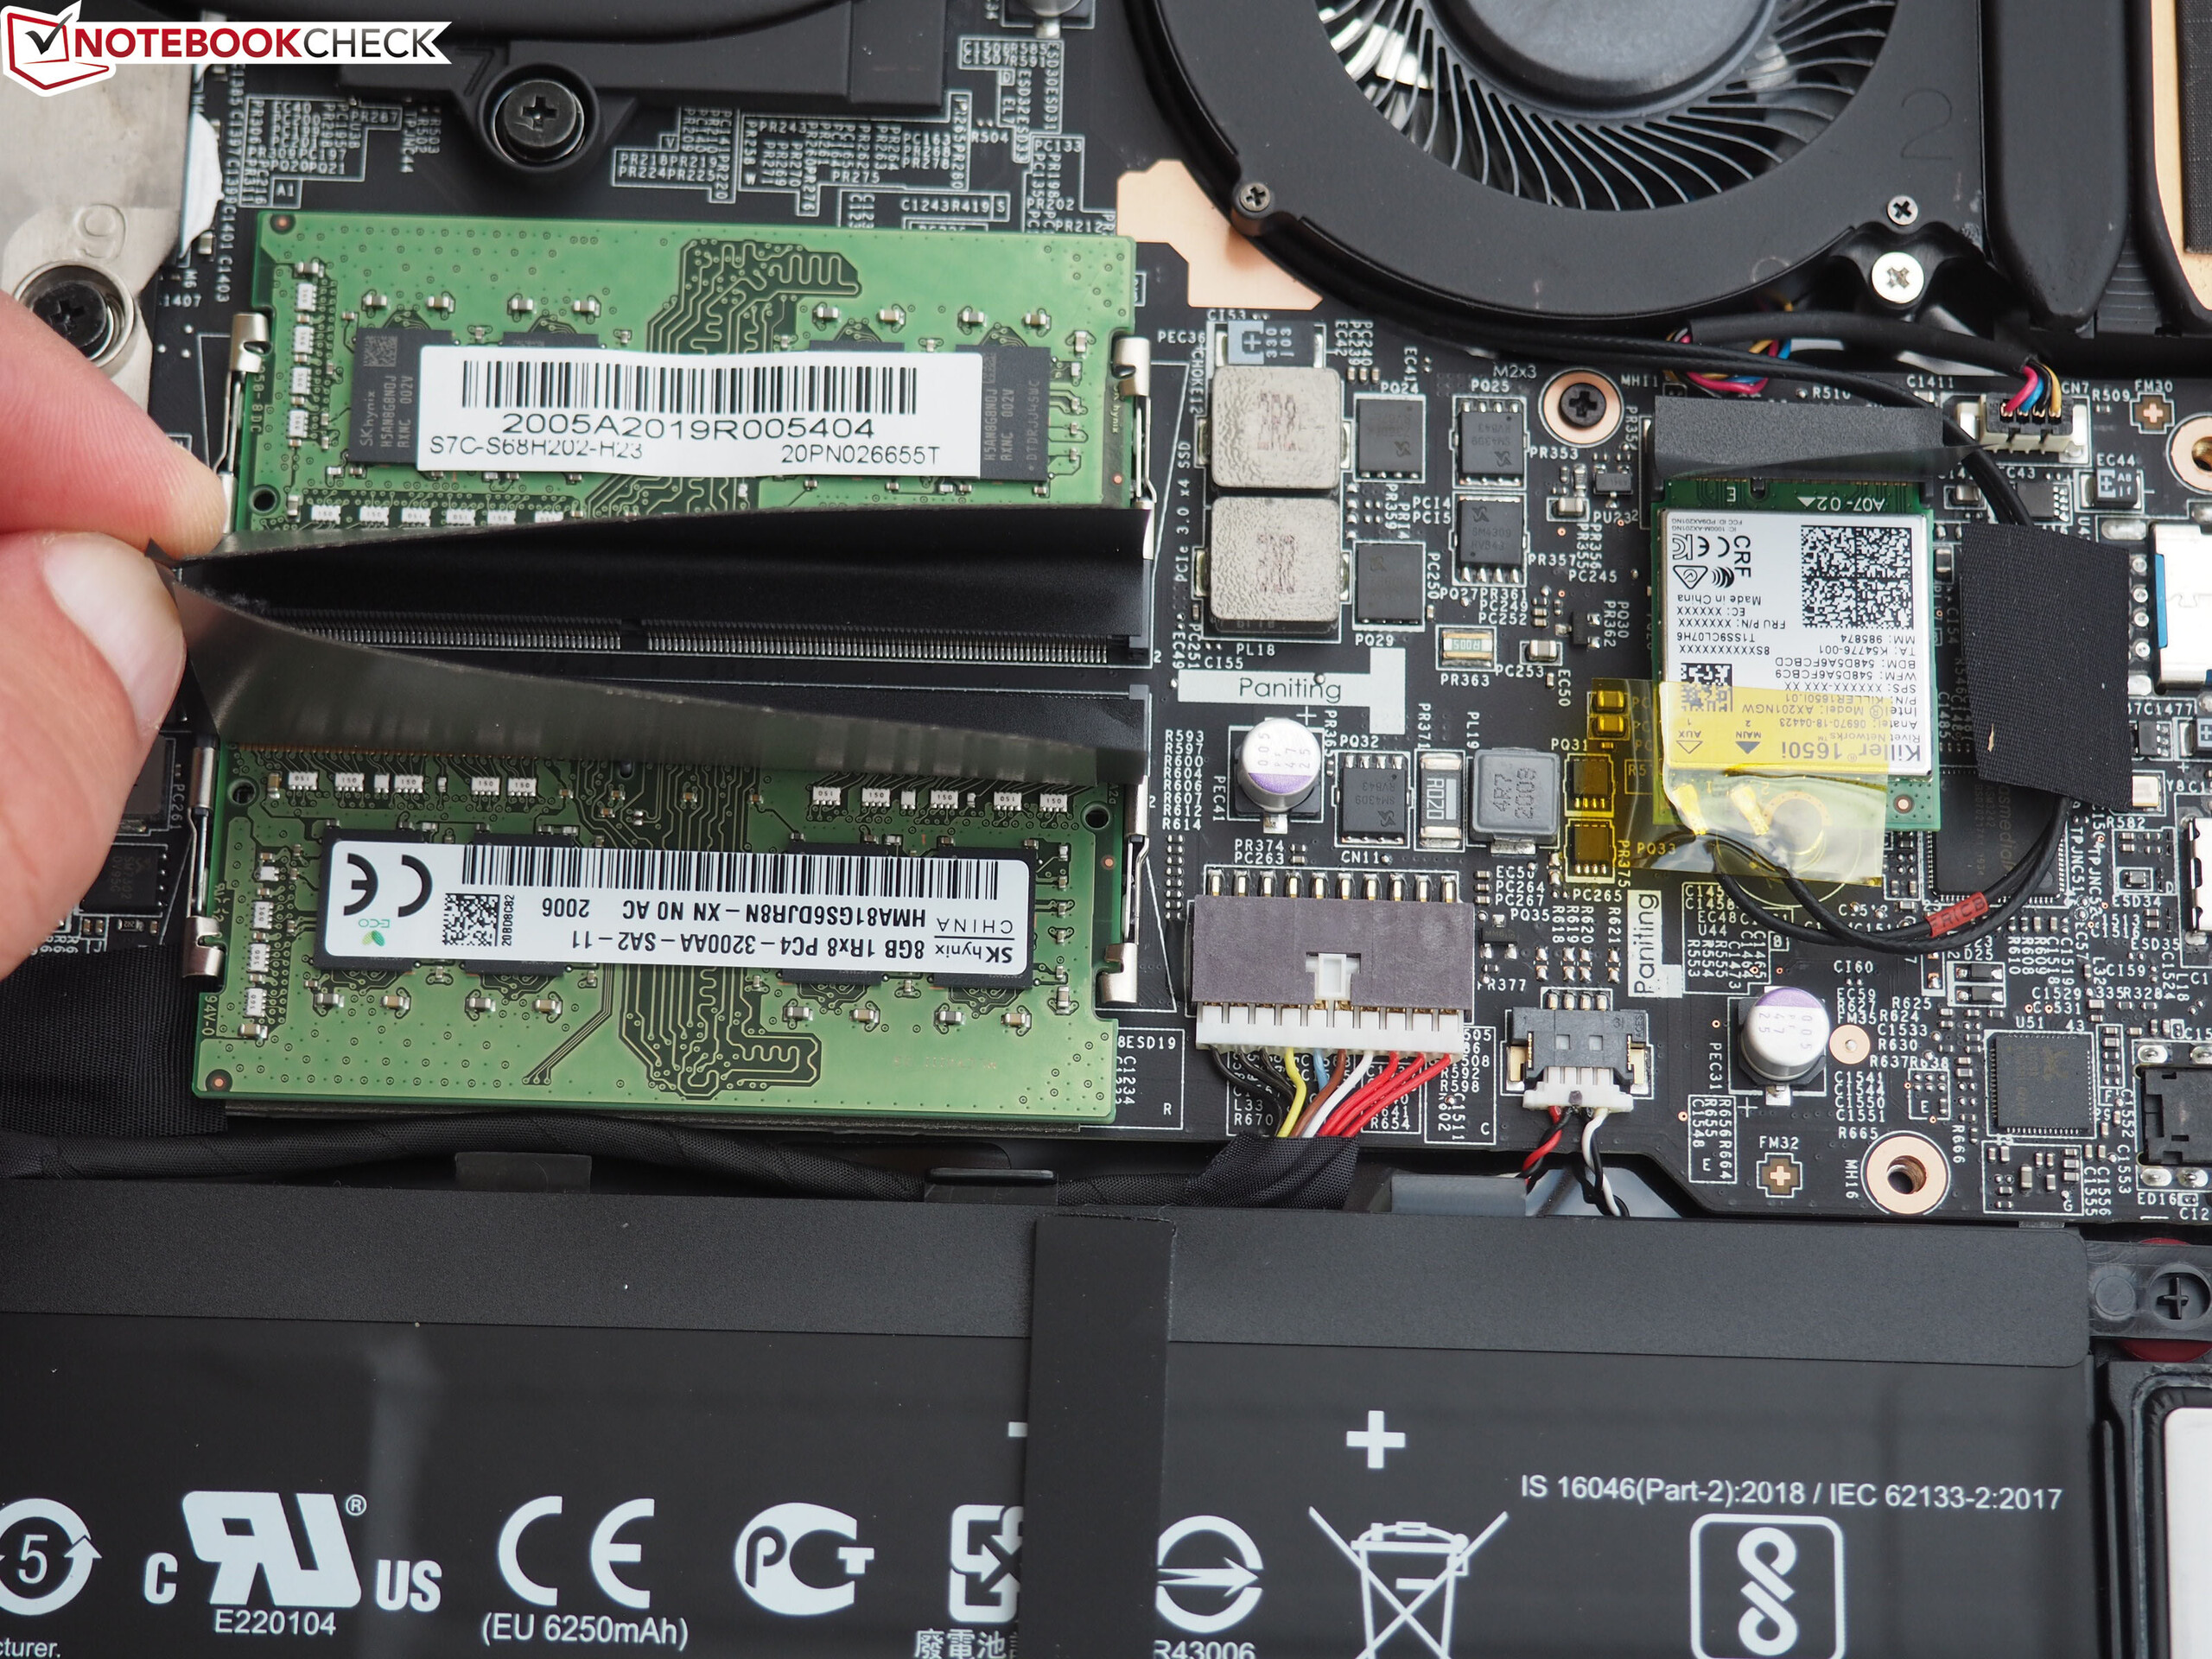
Bakım
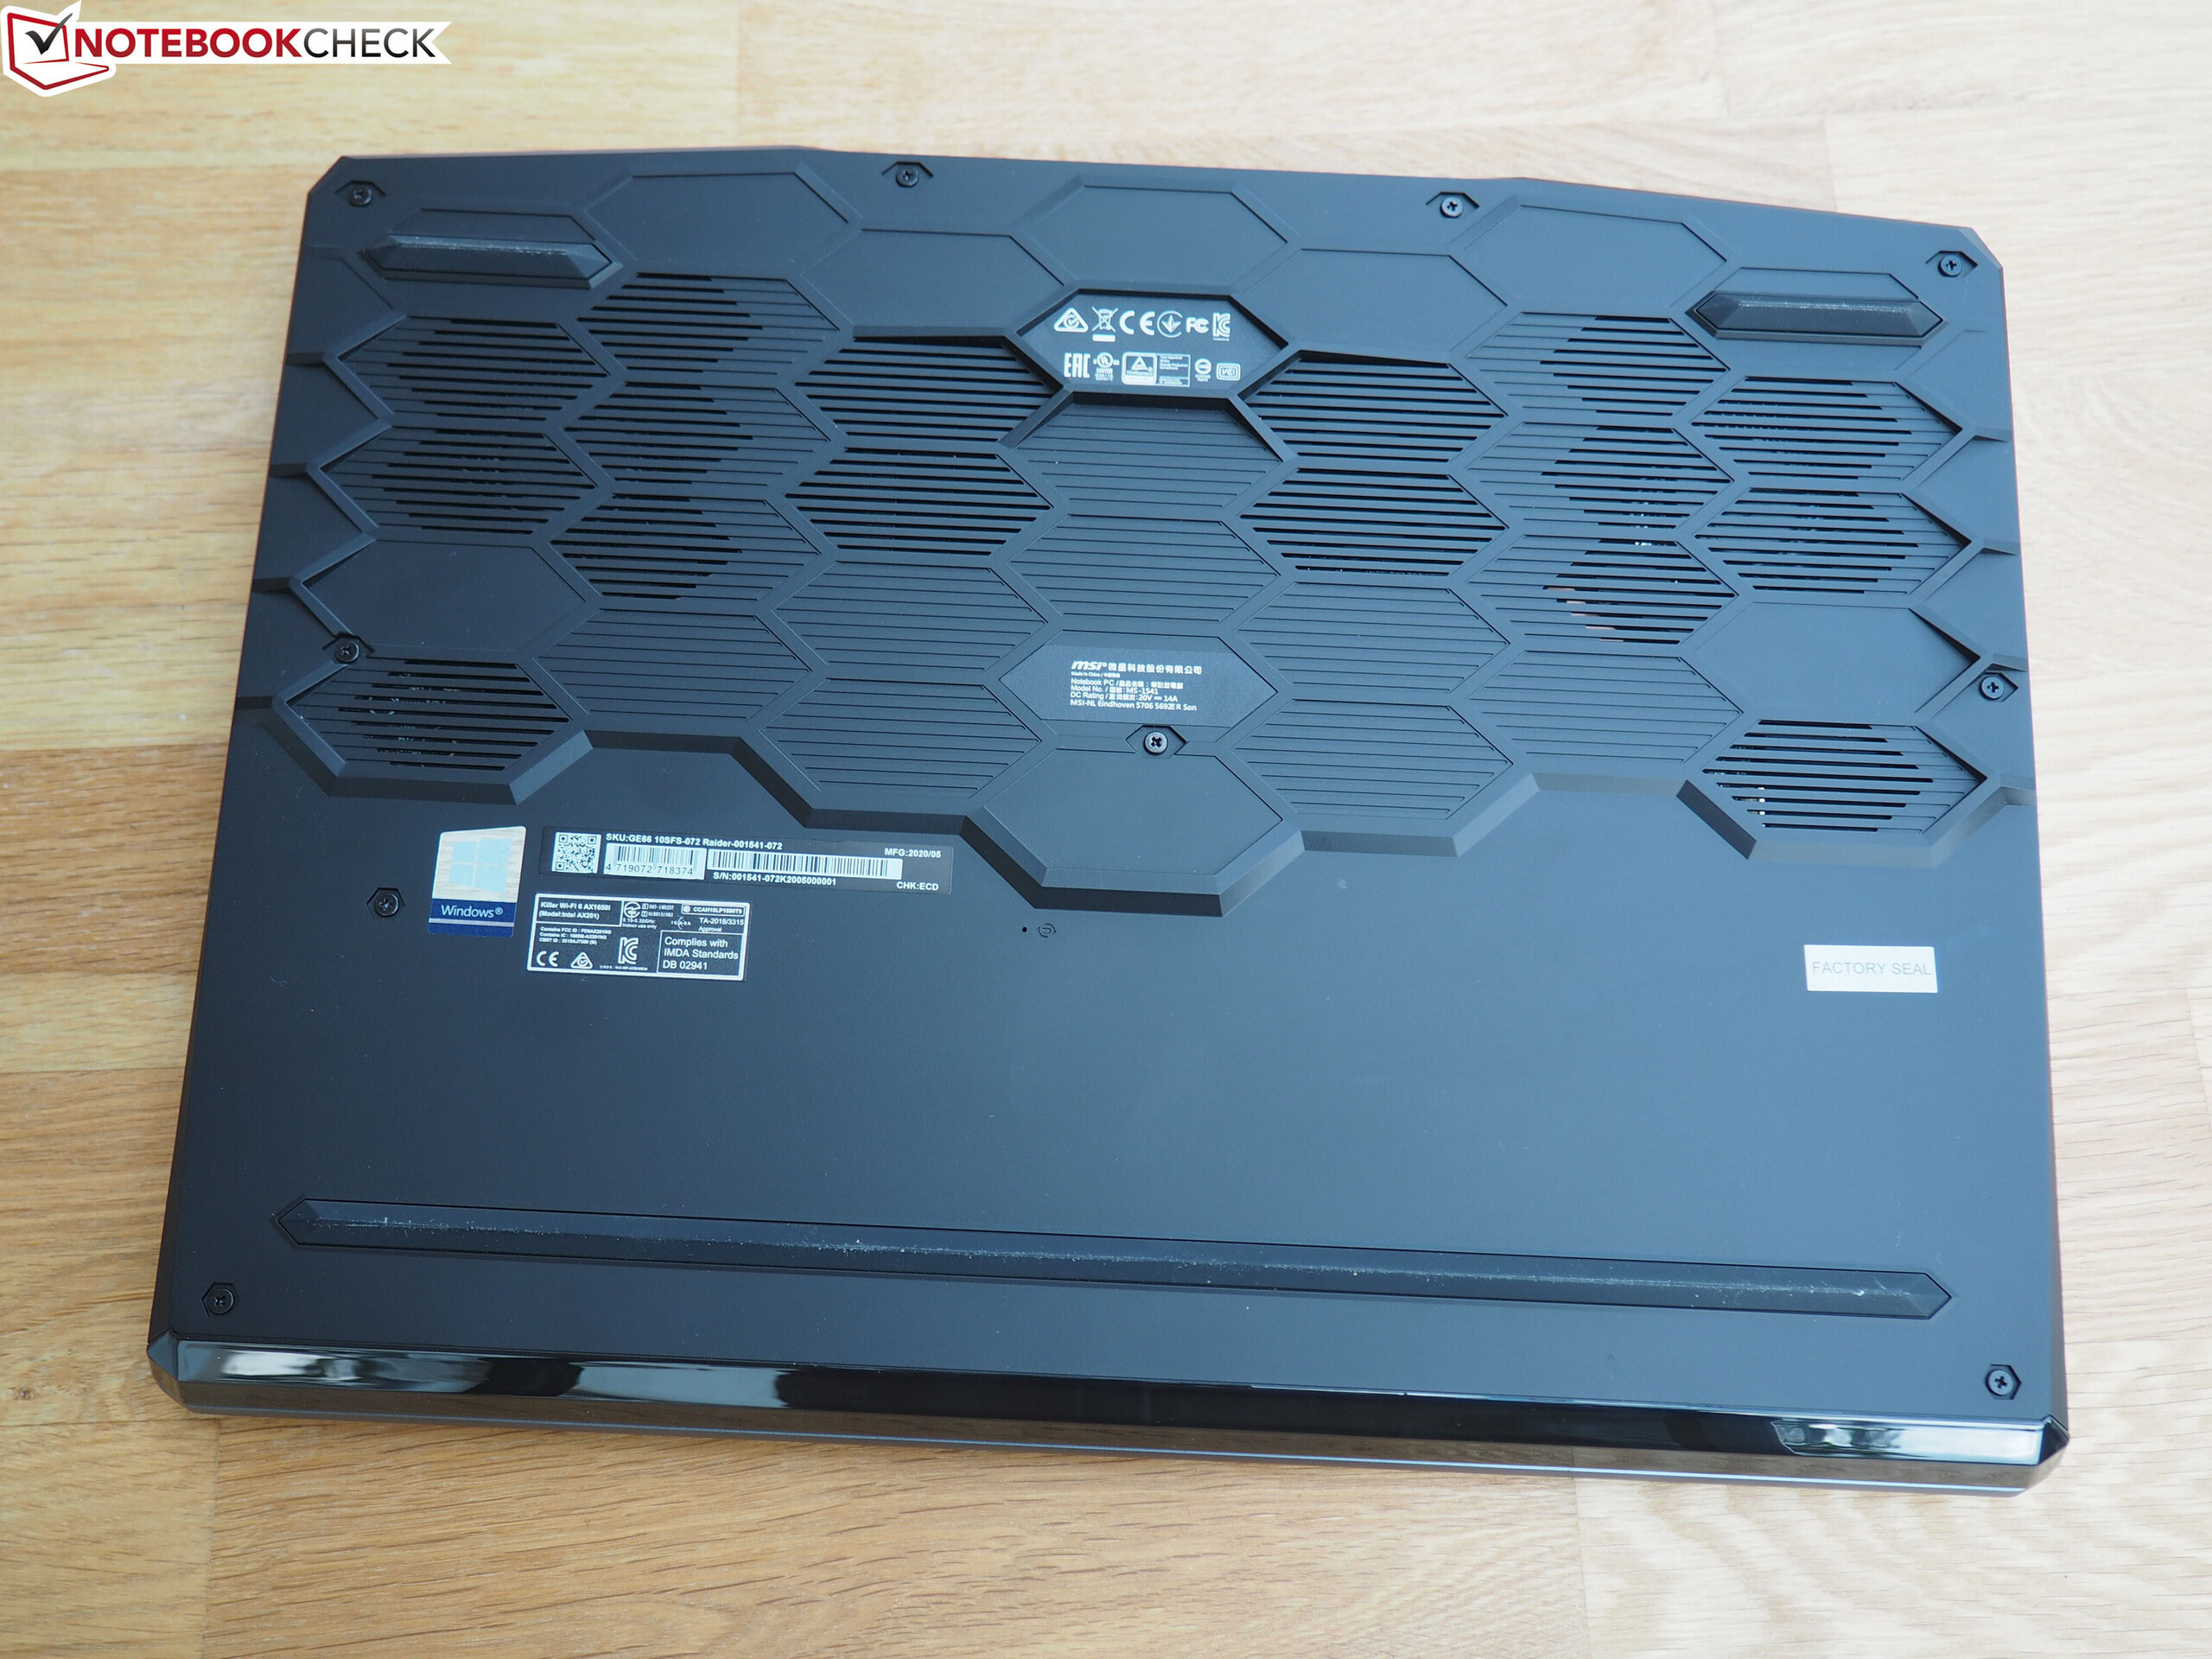
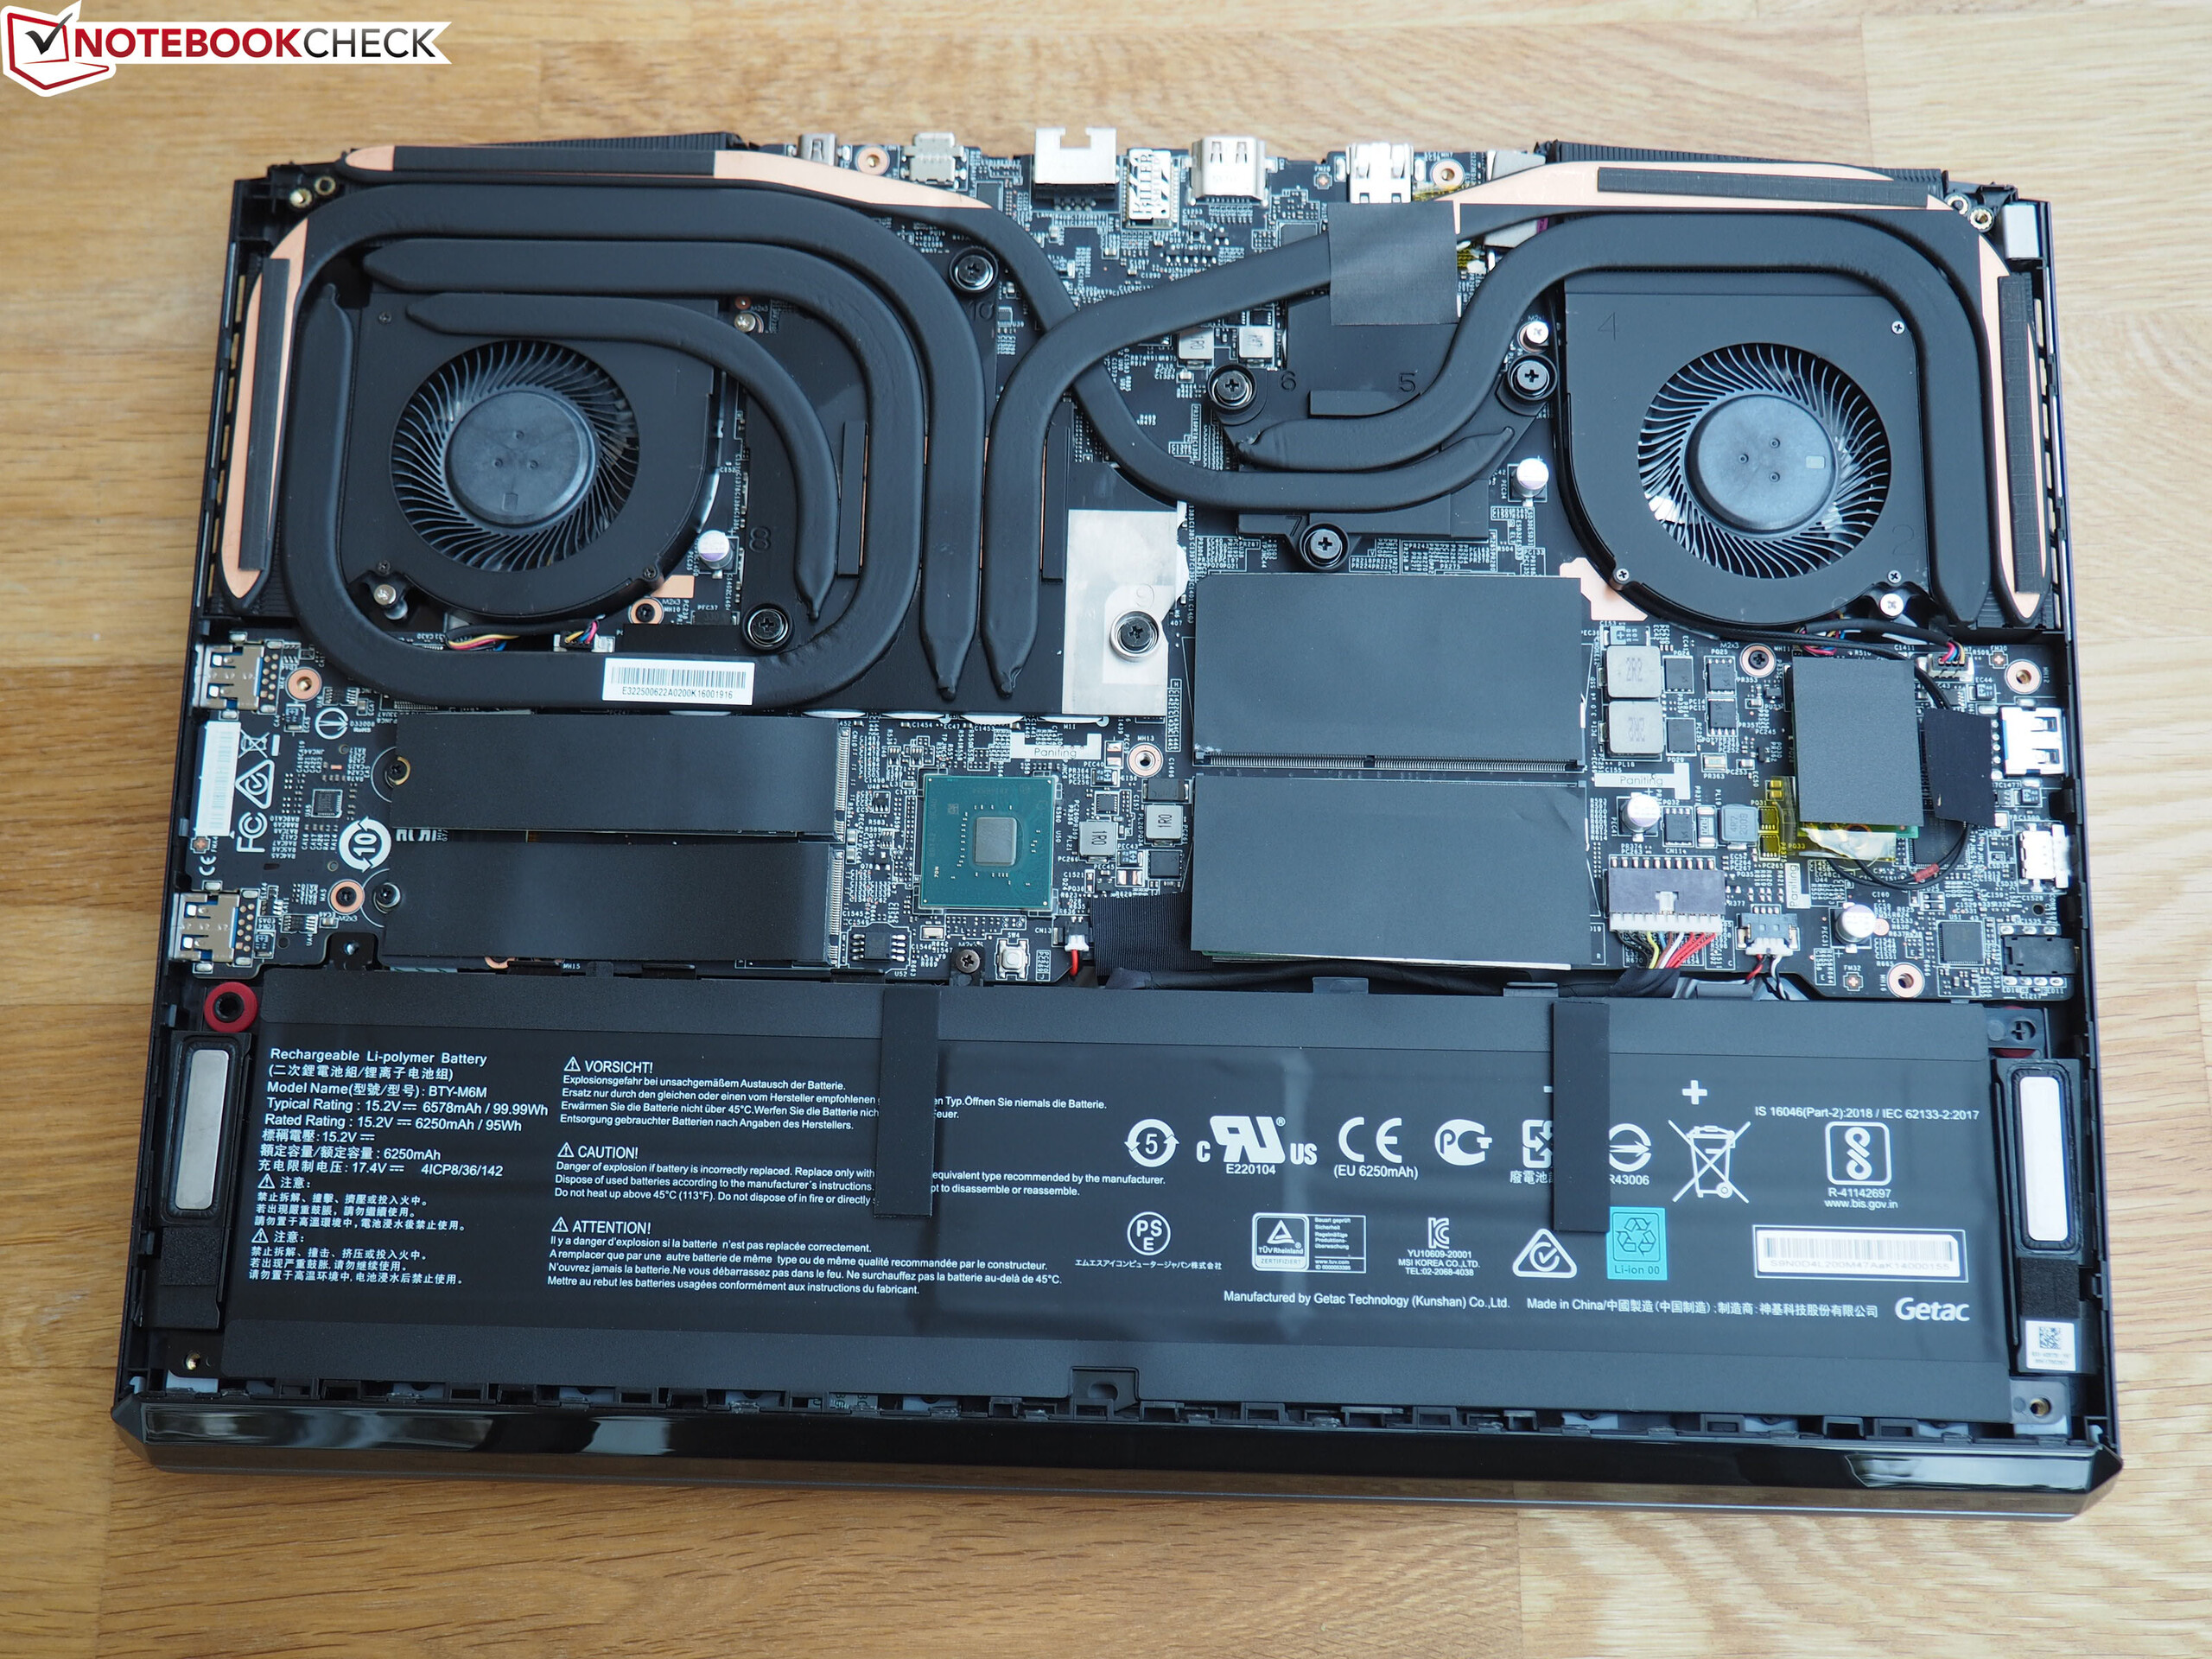
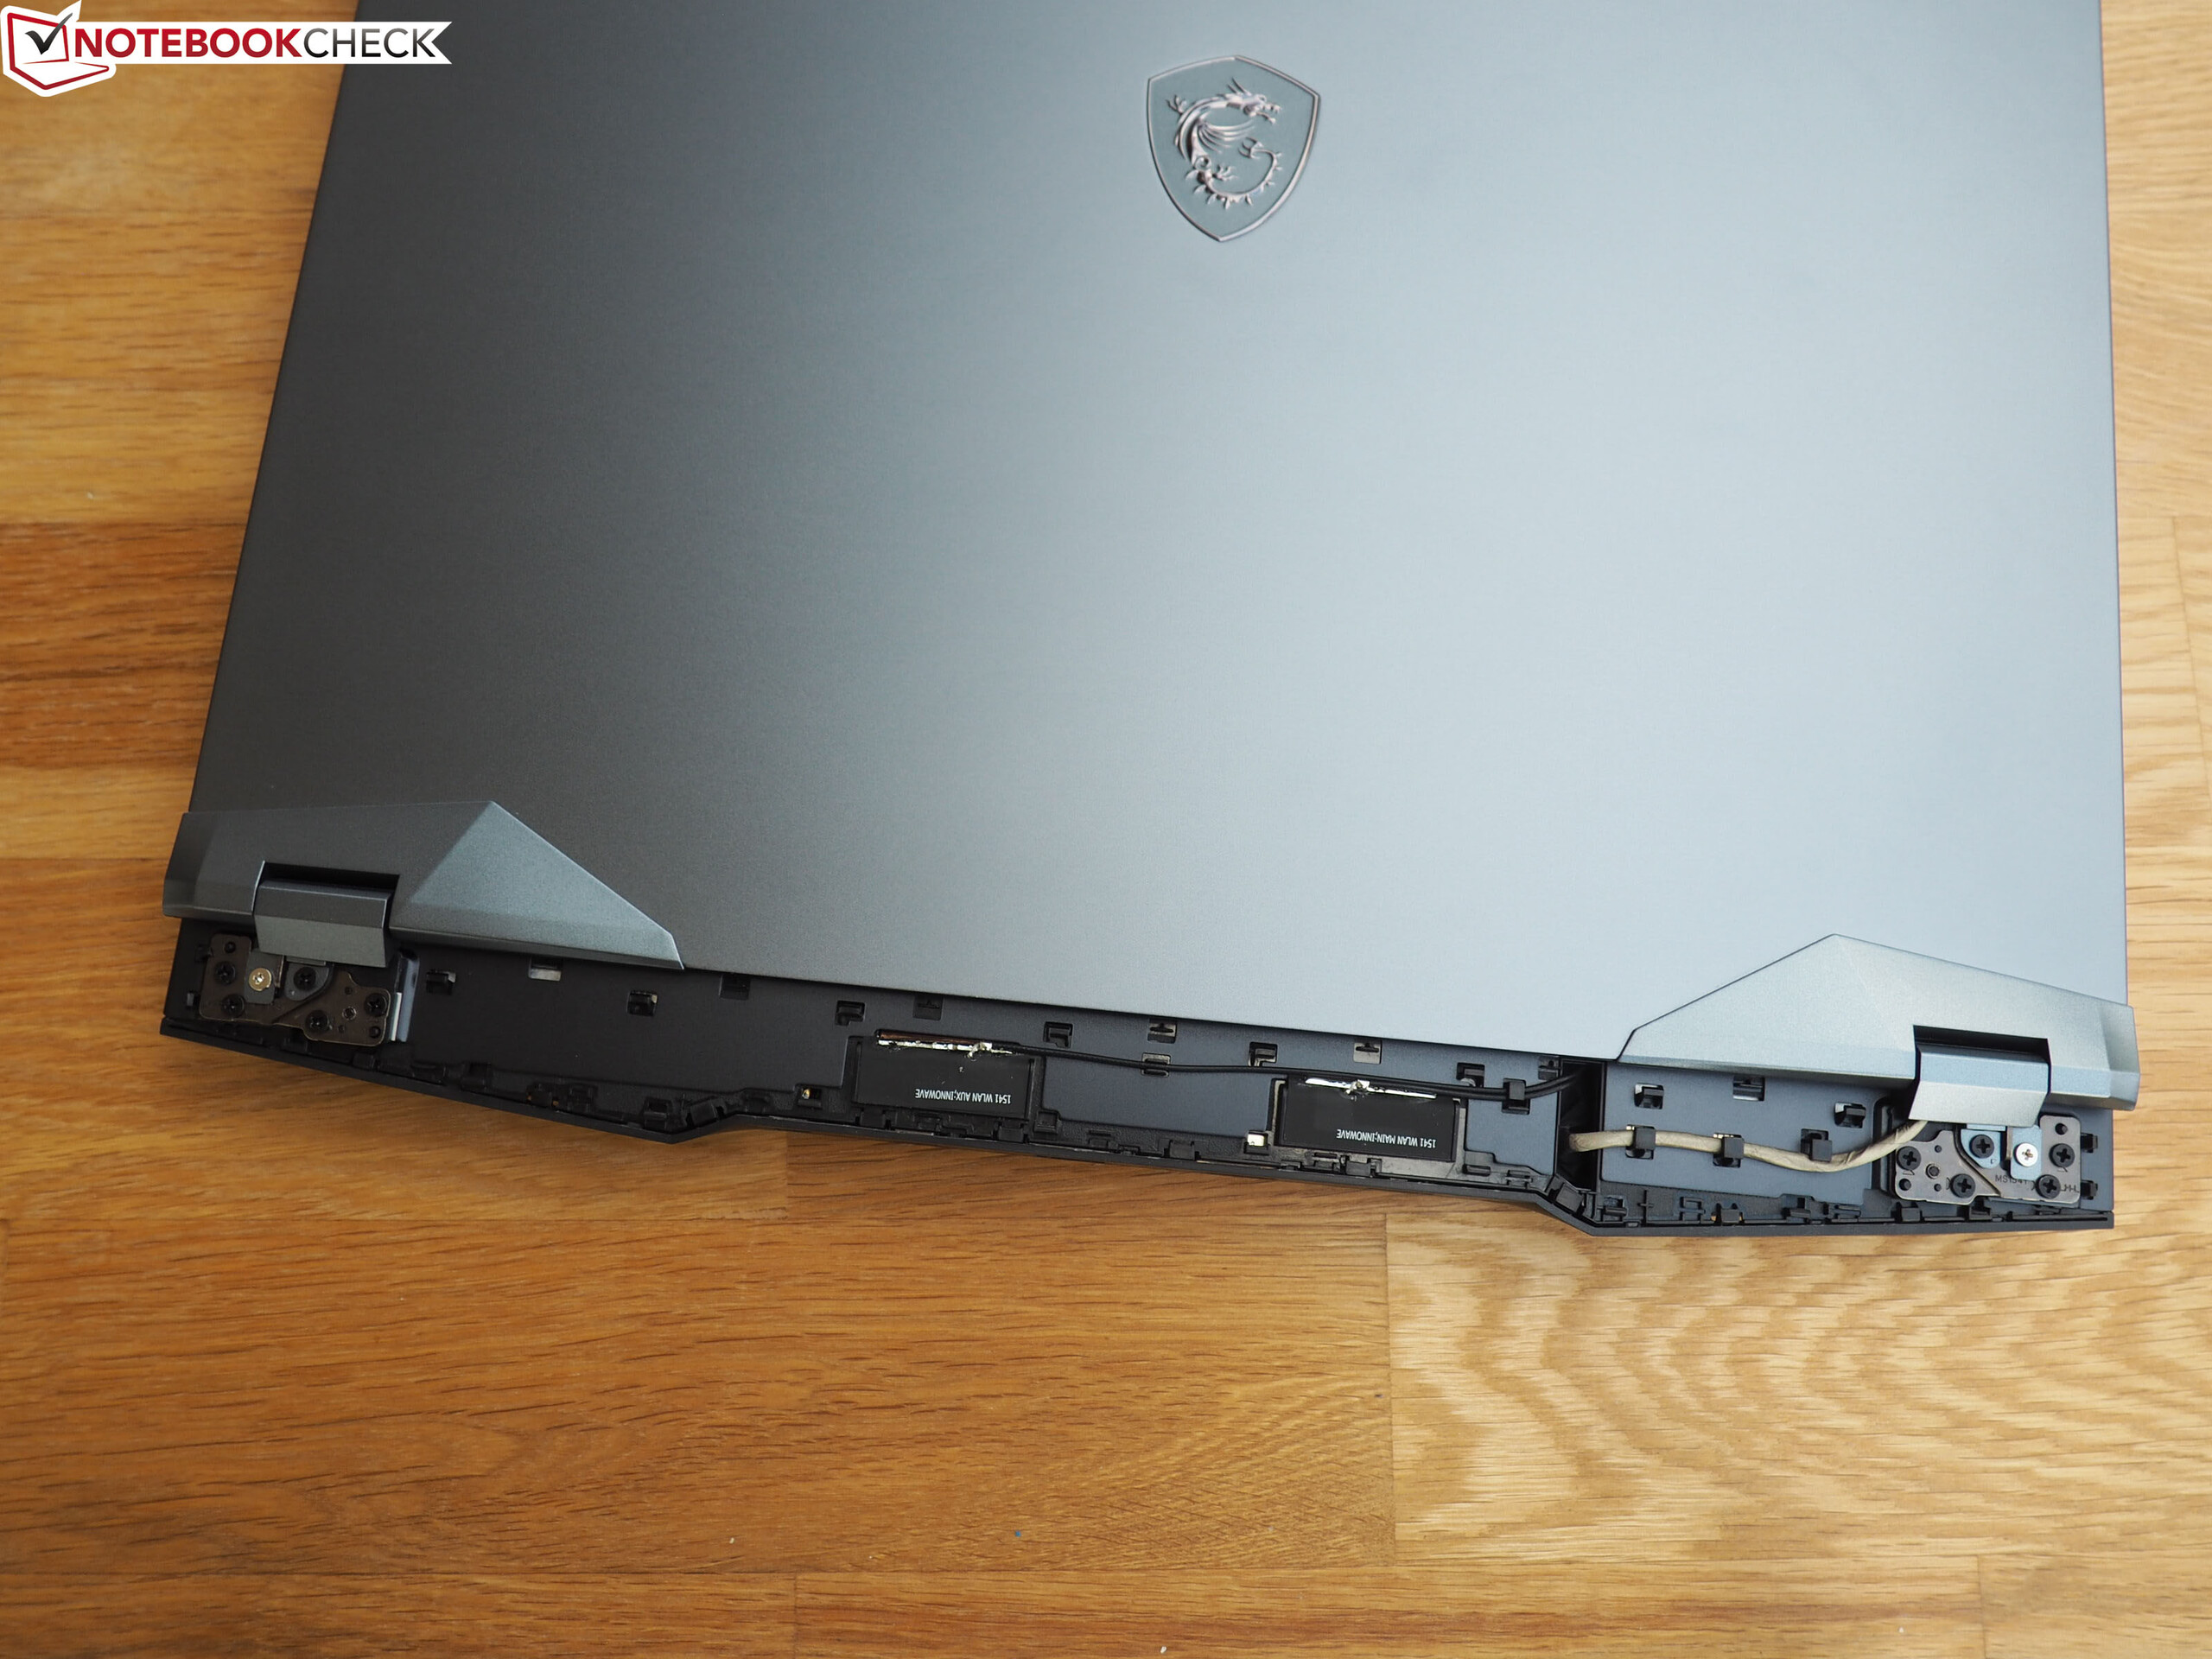
Bakım oldukça karmaşıktır. Kasanın alt kısmını ankrajından çıkarmak için sadece 11 vidanın gevşemesi değil, aynı zamanda kapağın arkasındaki plastik şeridin de çıkarılması gerekir. Bu prosedür biraz işe yaramaz ve bizim görüşümüze göre gereksiz. Çeşitli diğer oyun dizüstü bilgisayarları (MSI'nın kendisinden de) daha kolay nasıl yapılabileceğini gösteriyor.Neyse, kablosuz modül, iki SO-DIMM bankası ve iki tip 2280 (1x ücretsiz) M.2 yuvası davanın içinde bekliyor. Şaşırtıcı olmayan bir şekilde, soğutma sistemi iki fan ve birkaç ısı borusundan oluşur. GE66'nın ön alanı devasa batarya tarafından devralındı.
Garanti
MSI, teslim alındığında 24 ay garanti veriyor
Giriş cihazları
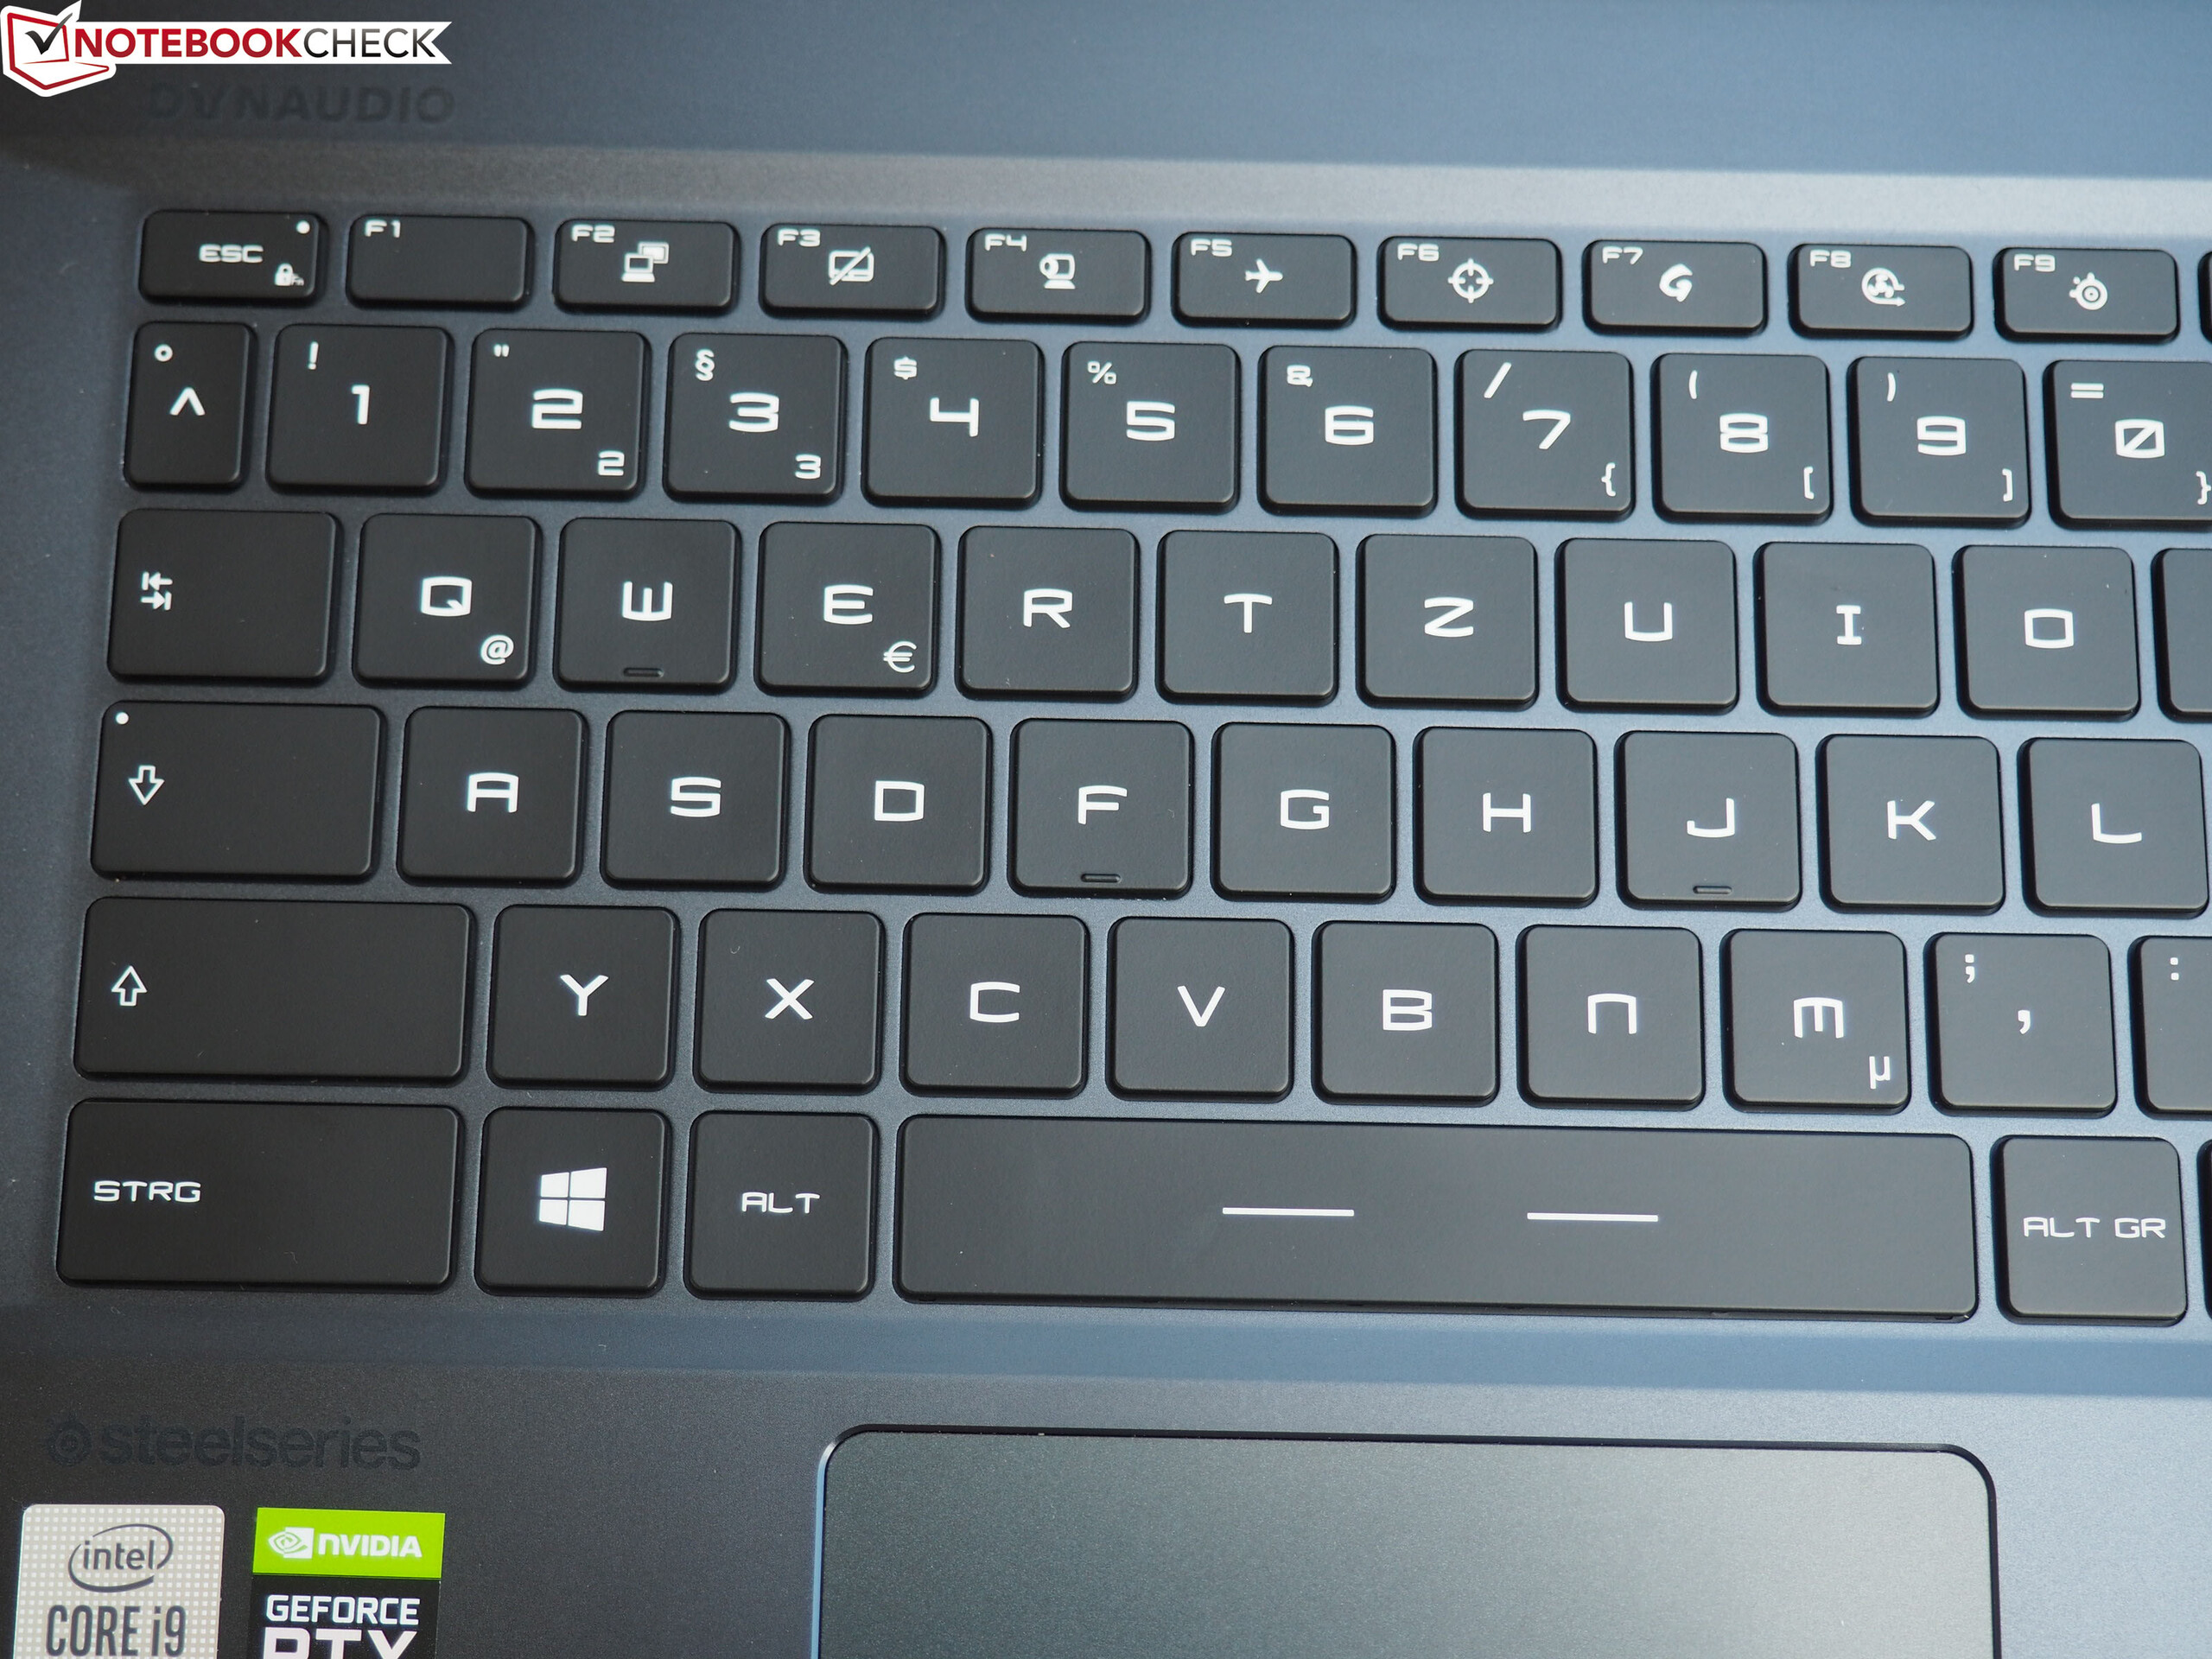
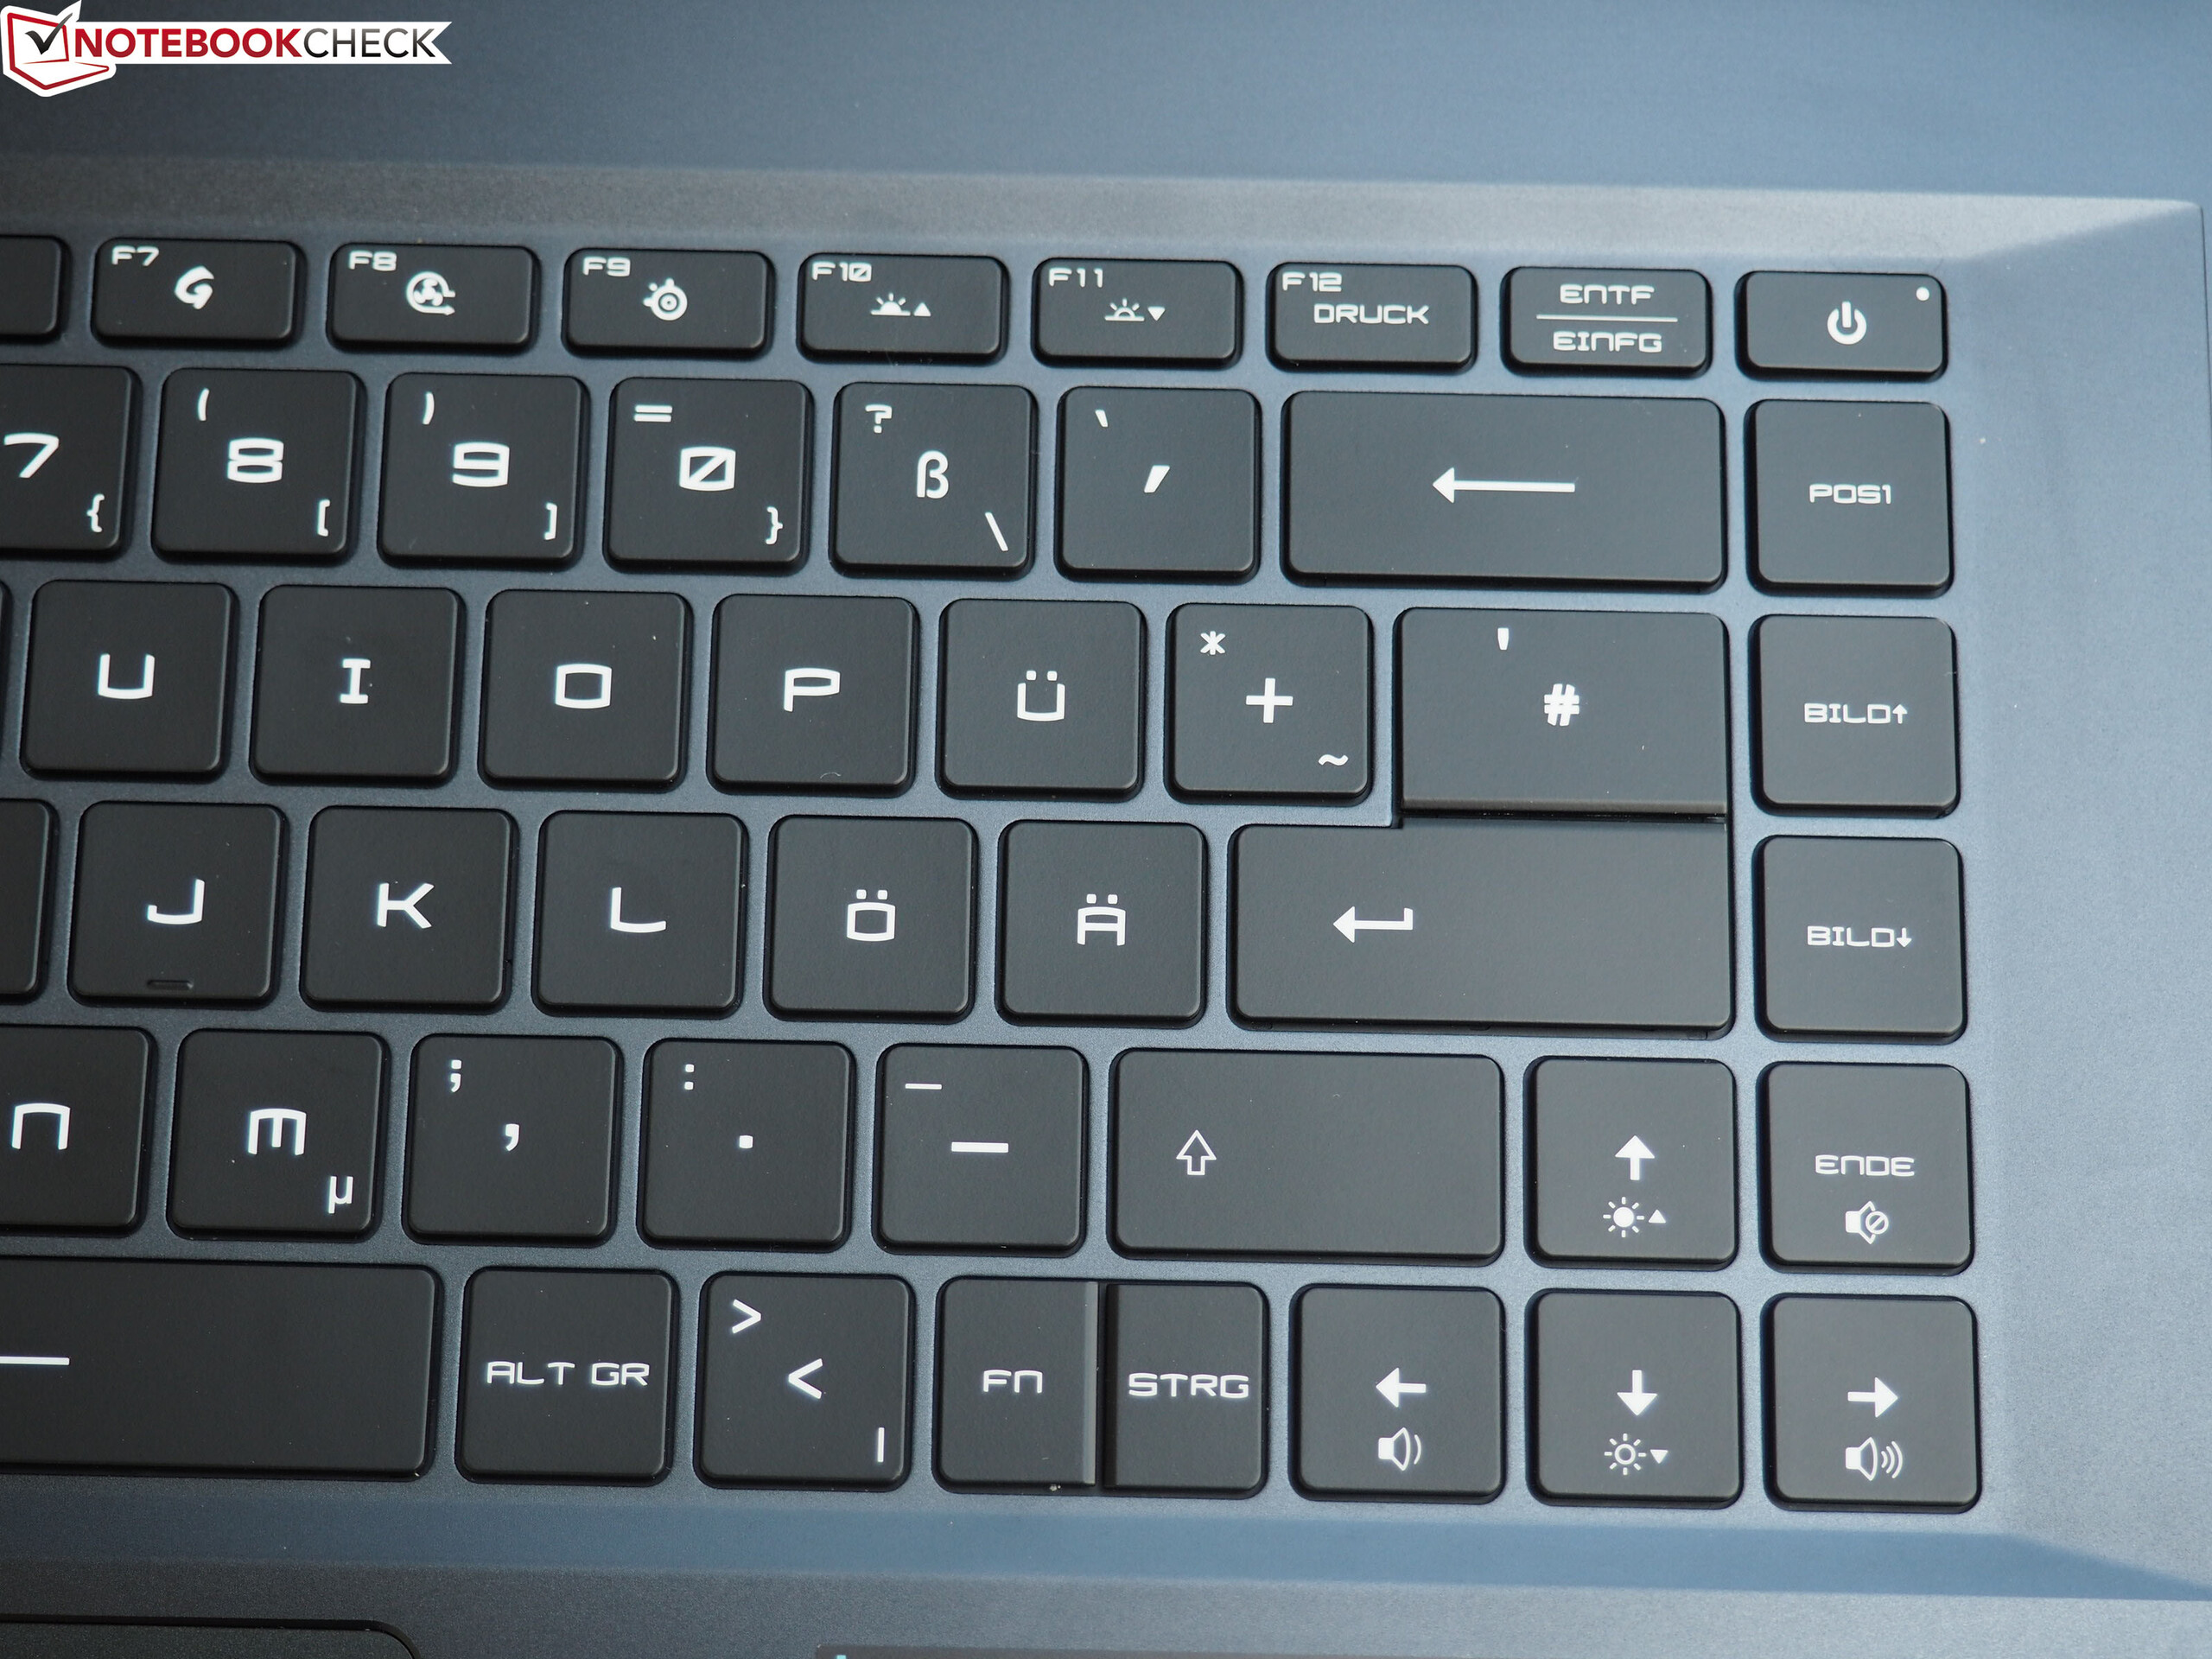
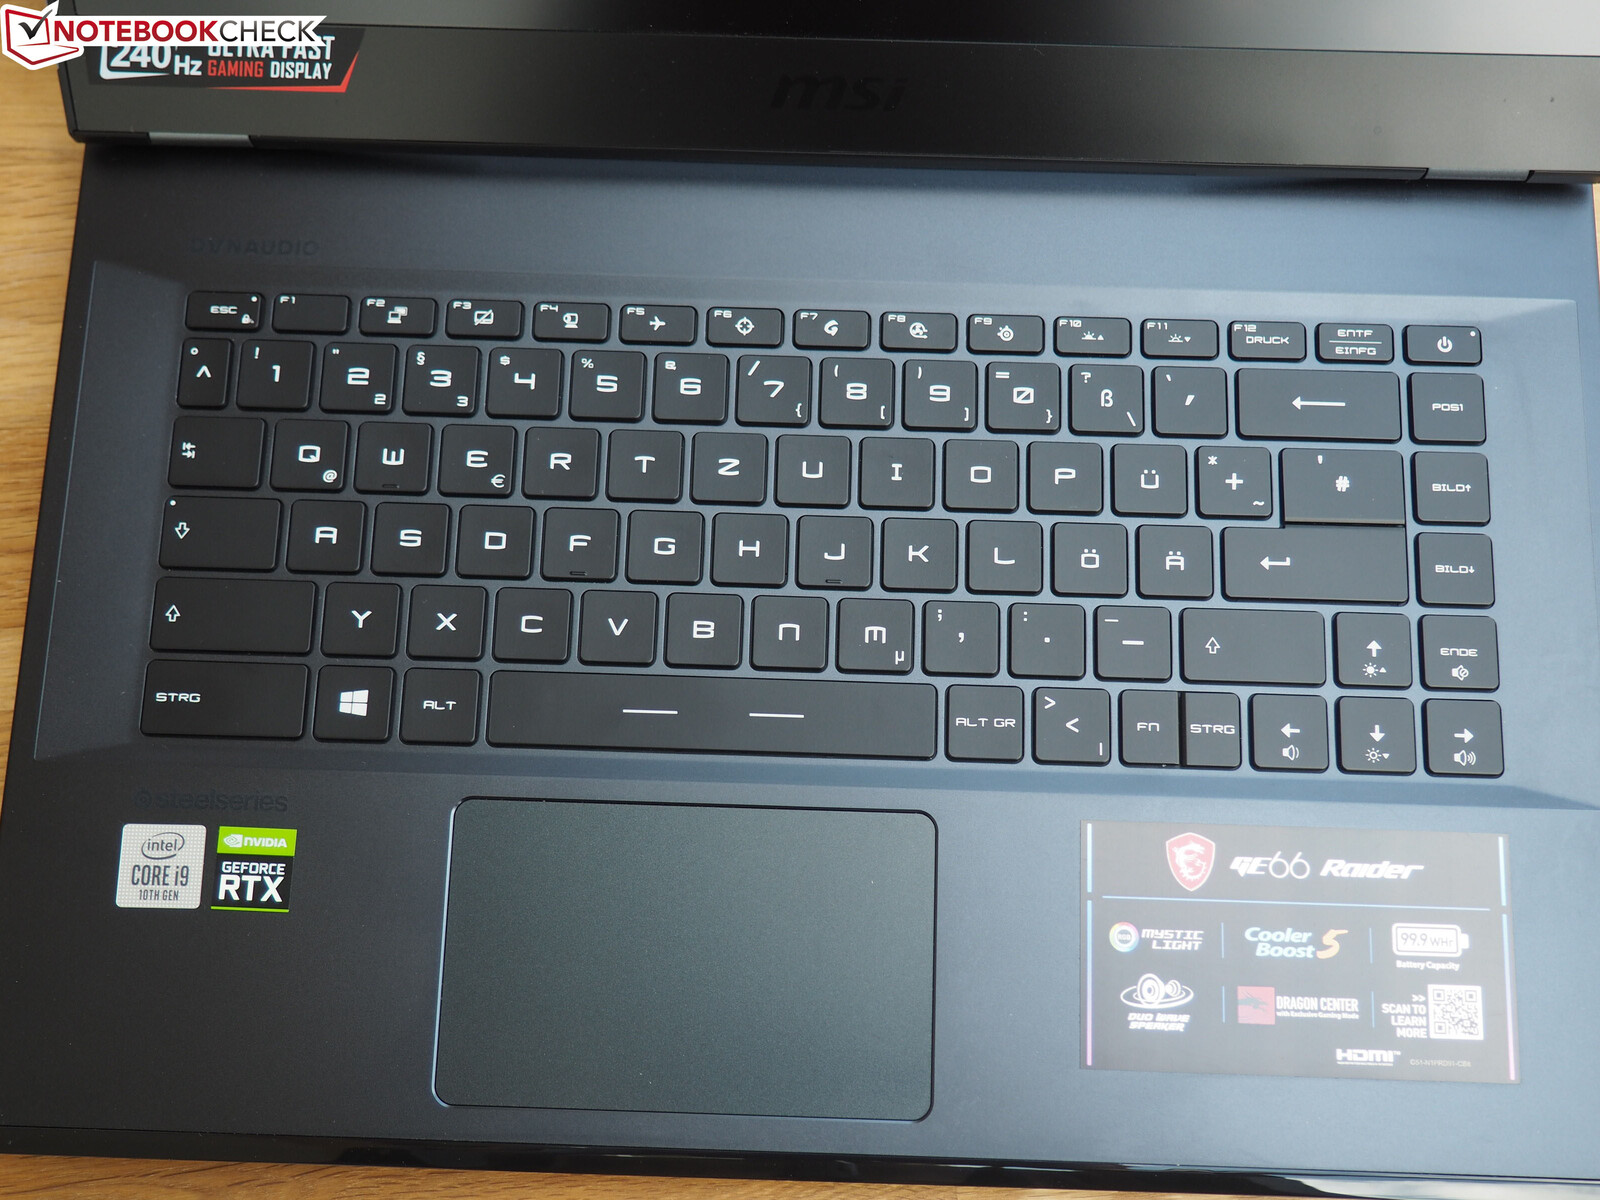
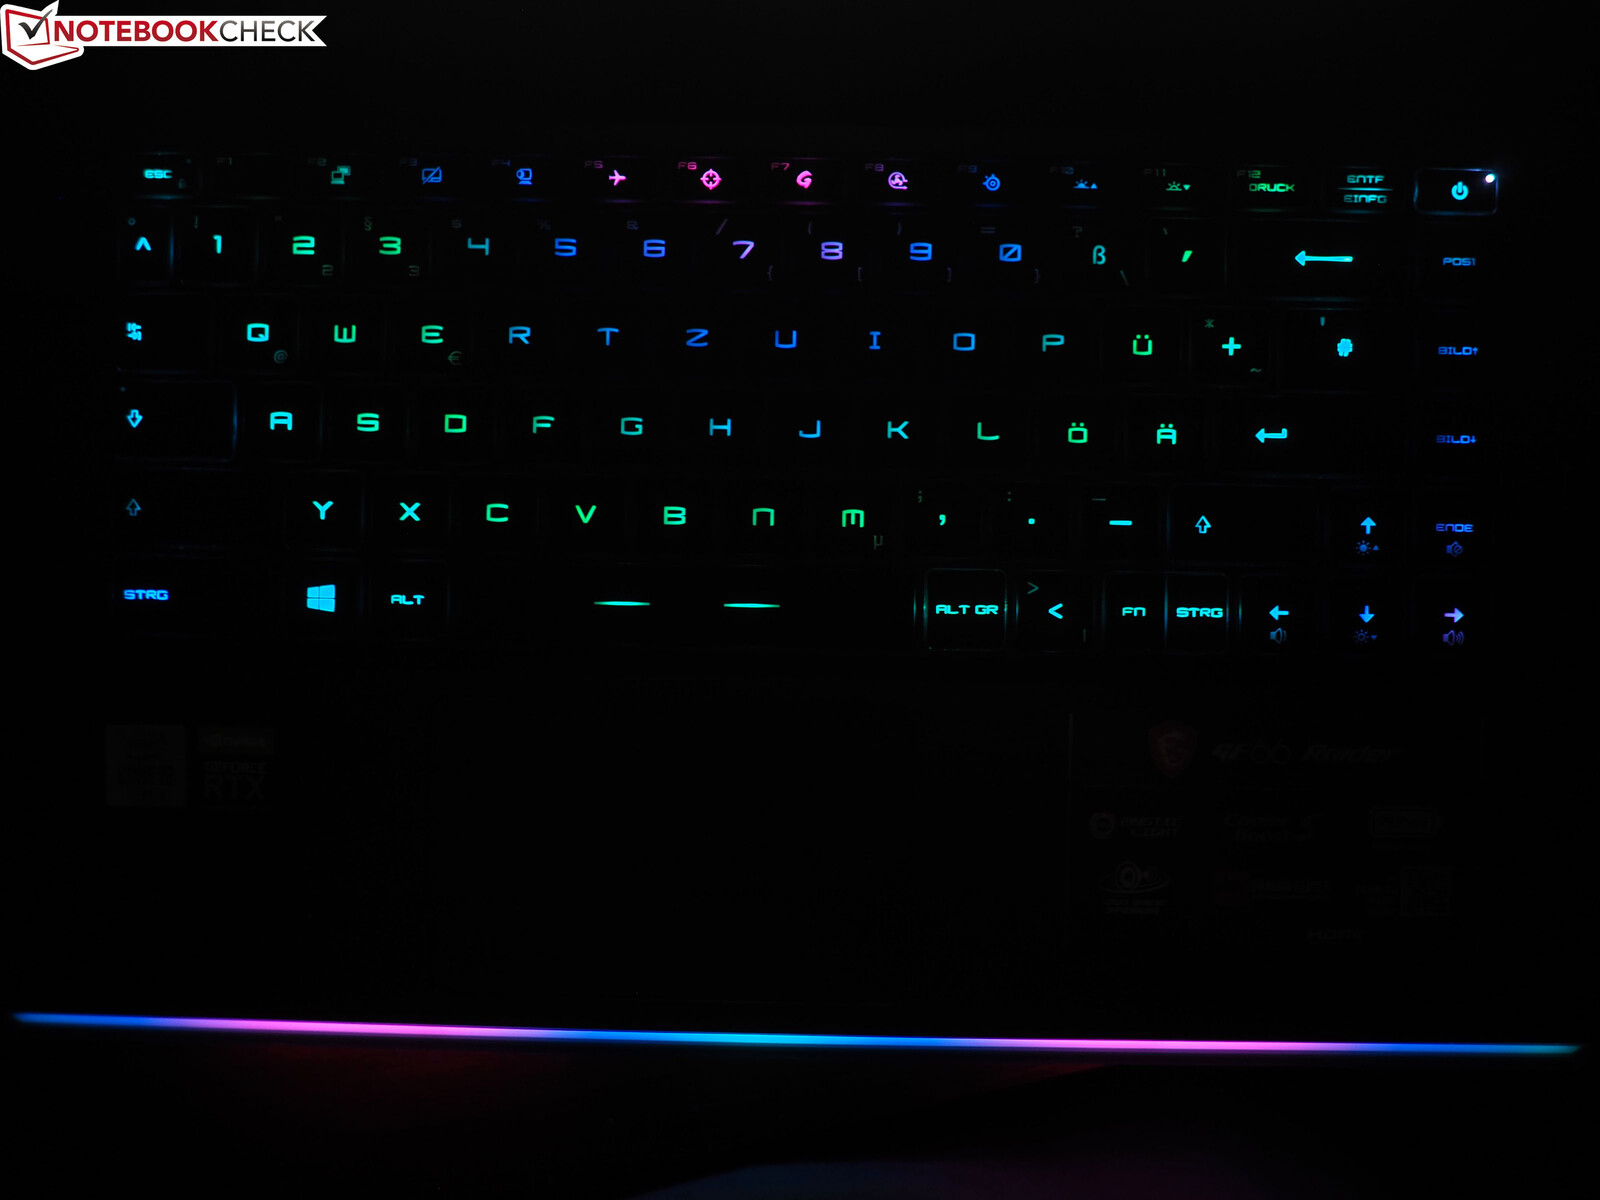
Keyboard
The keyboard, which is tailored to gamers, offers a good and relatively well-defined typing feel that will satisfy most buyers. Worthy of discussion is - as so often with MSI - once again the layout. For one thing, the position of some keys deviates from the (German) standard (<>| & #'). On the other hand, there are some unfavorable combinations (F12 + Print, Del + Ins). The single-line Enter and the lack of a dedicated numeric keypad could also disturb frequent writers. In addition, the Fn key and the right Ctrl are very narrow and clumped together. So there is a lot of time required to get used to the GE66 keyboard. The stylish RGB-illumination, however, which can be adjusted individually (colors, modes etc.), is a plus.
Dokunmatik
10.5 cm genişliğinde ve 6.5 cm yüksekliğinde, dokunmatik yüzey 15 inçlik bir cihaz için düzgün bir şekilde boyutlandırılmıştır. Pürüzsüz yüzey, genellikle temiz ve güvenilir bir şekilde tanınan hızlı girişler sağlar. Aynısı çoklu dokunma desteği için de geçerlidir. İçerik, iki parmak hareketiyle rahatça yakınlaştırılabilir ve kaydırılabilir. Özel fare düğmeleri eksik olduğundan, alt yüzeye basılarak sol ve sağ tıklamalar tetiklenir.
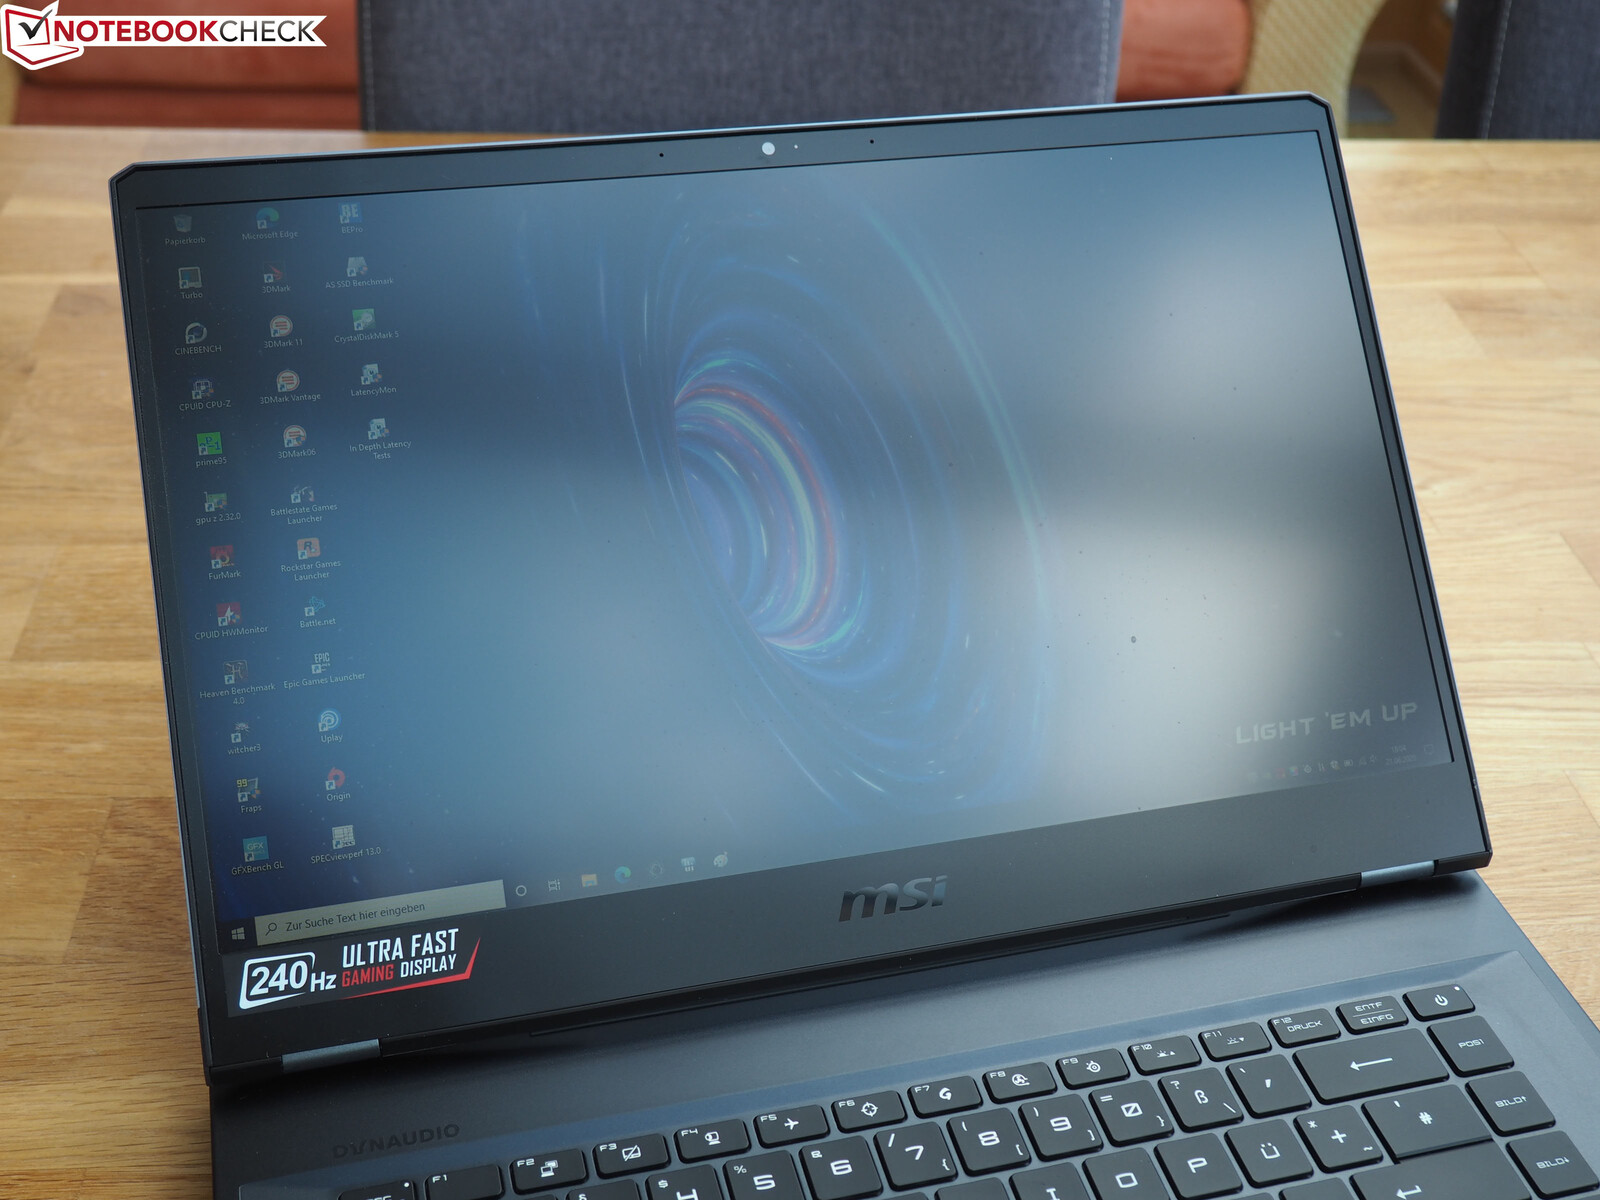
Görüntüle
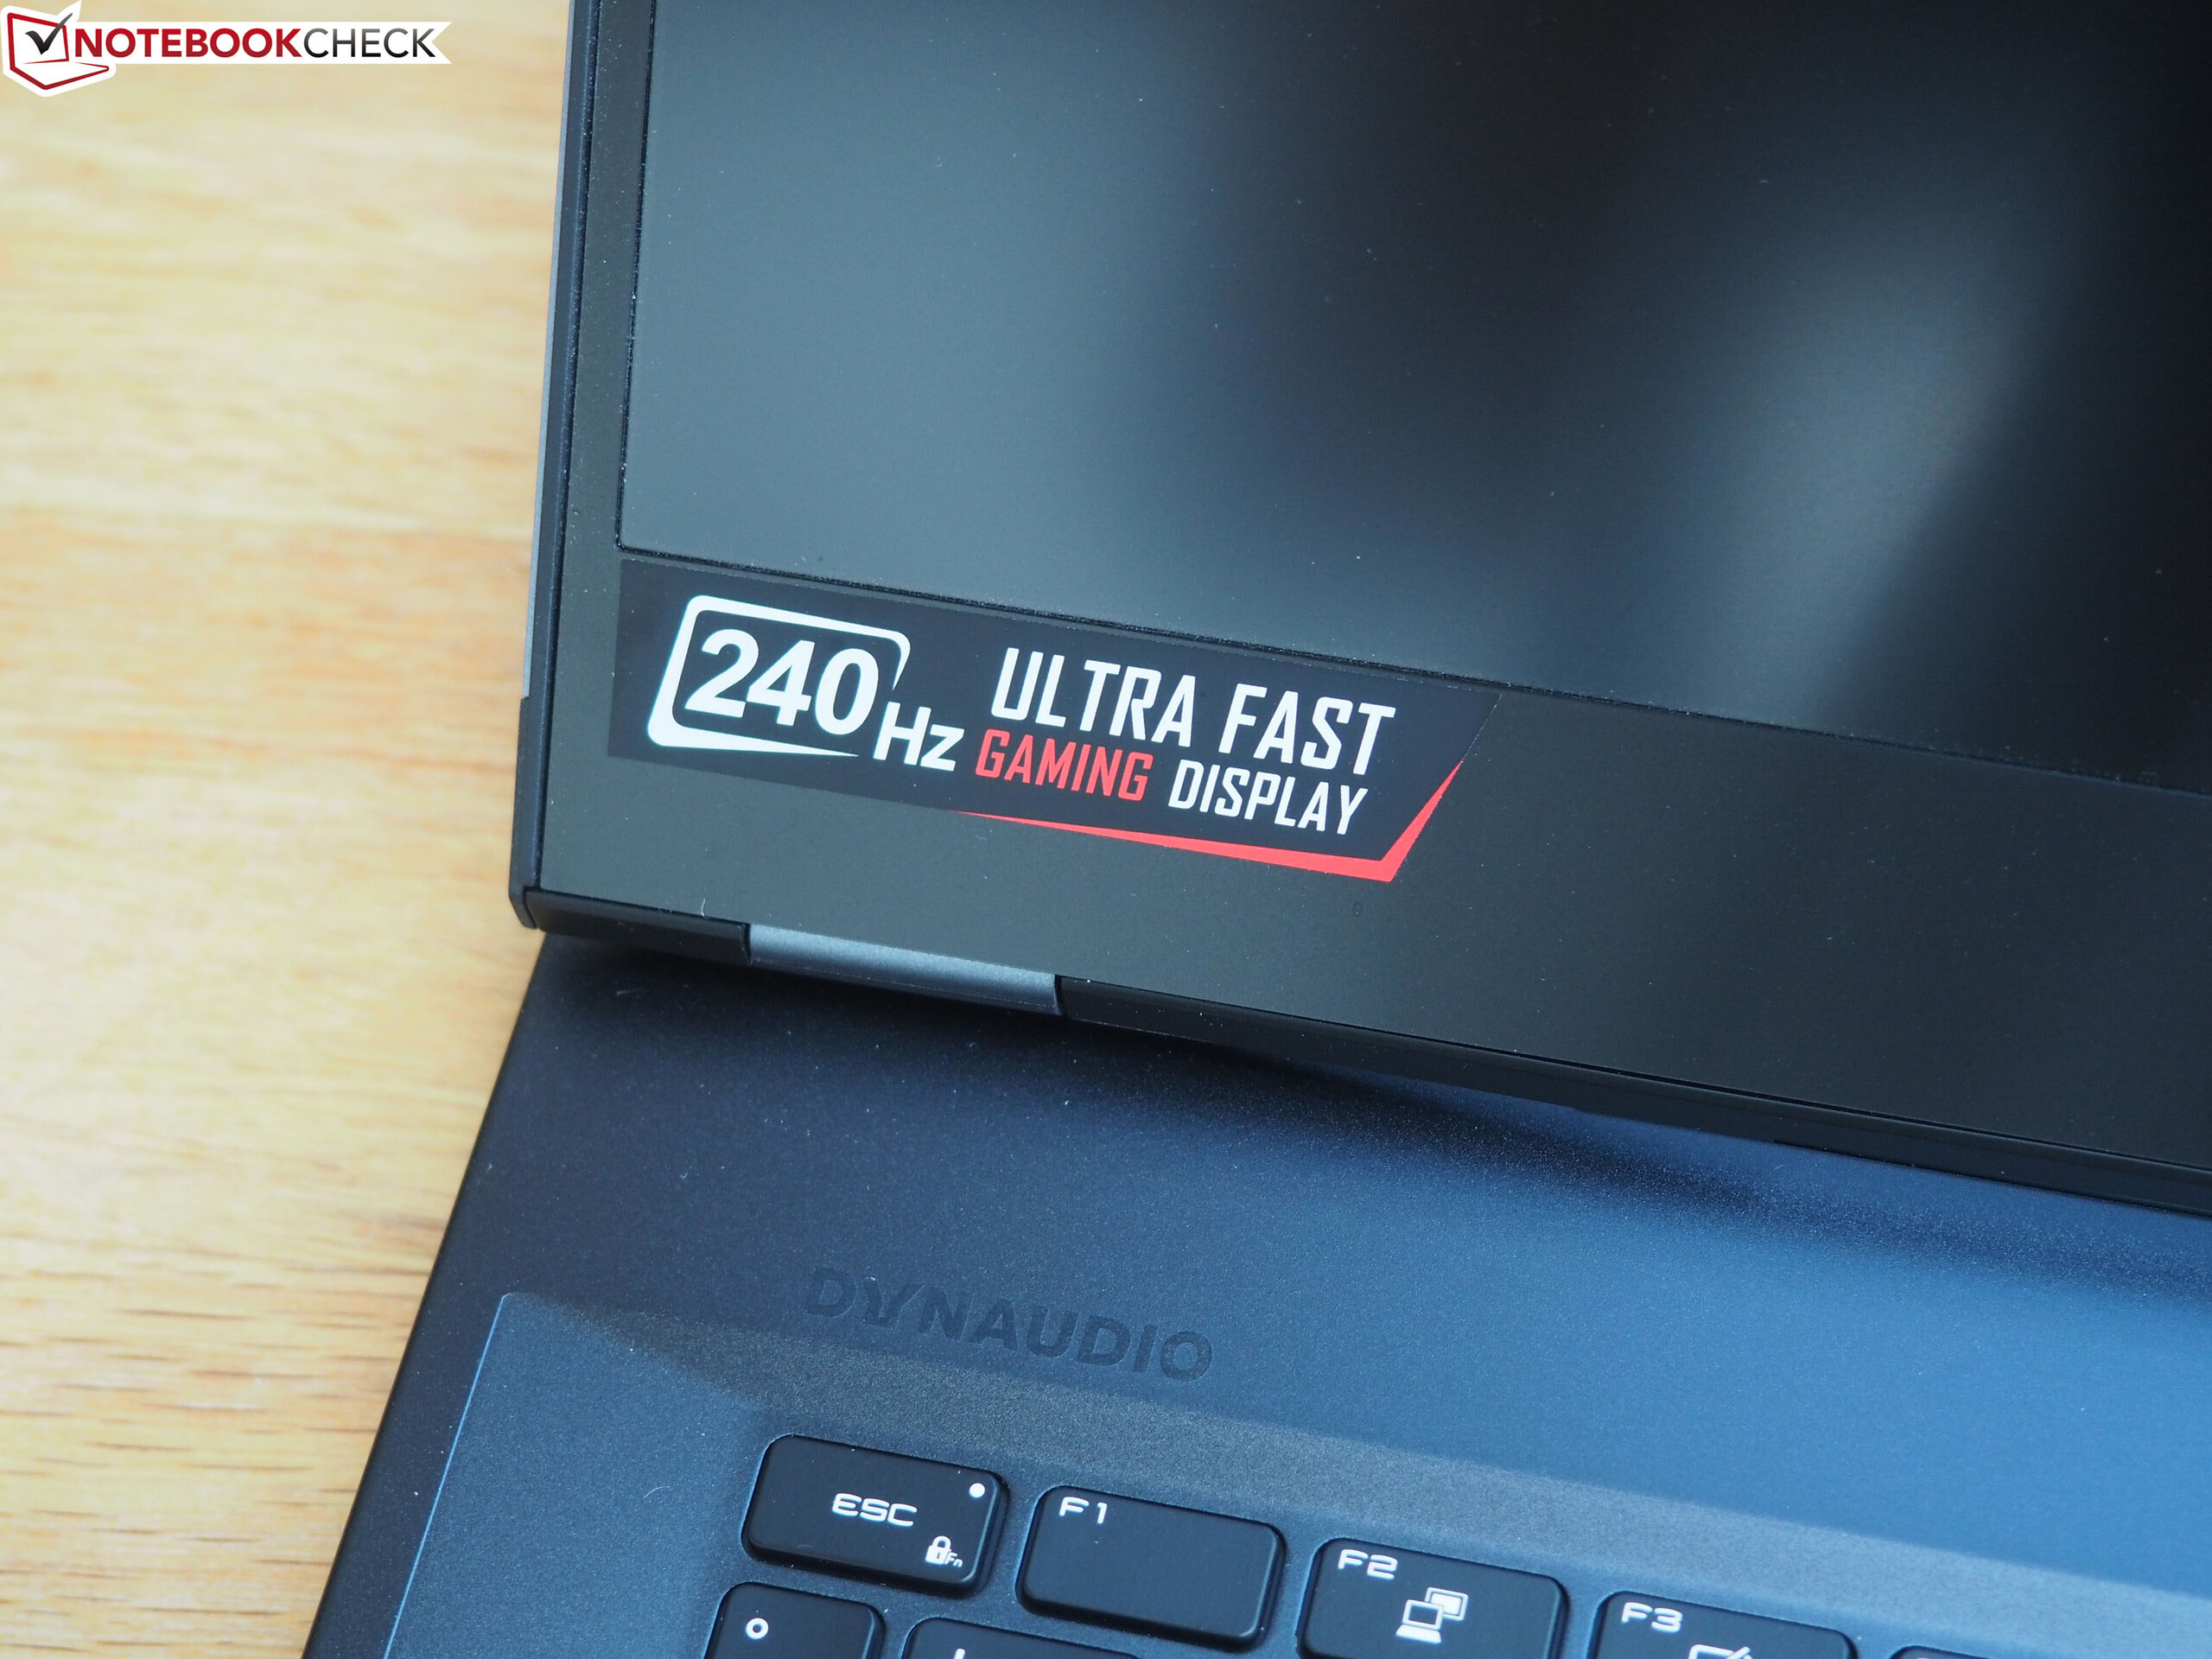
Başlangıçta belirtildiği gibi, test konfigürasyonu 240 Hz ekrana sahiptir. Bu durumda MSI, GE65'teki çalışmalarını da yapan ve orada iyi bir performansla zaten dikkat çeken Sharp LQ156M1JW03 paneline karar verdi.
| |||||||||||||||||||||||||
Aydınlatma: 91 %
Batarya modunda parlaklık: 291 cd/m²
Kontrast: 1164:1 (Siyah: 0.25 cd/m²)
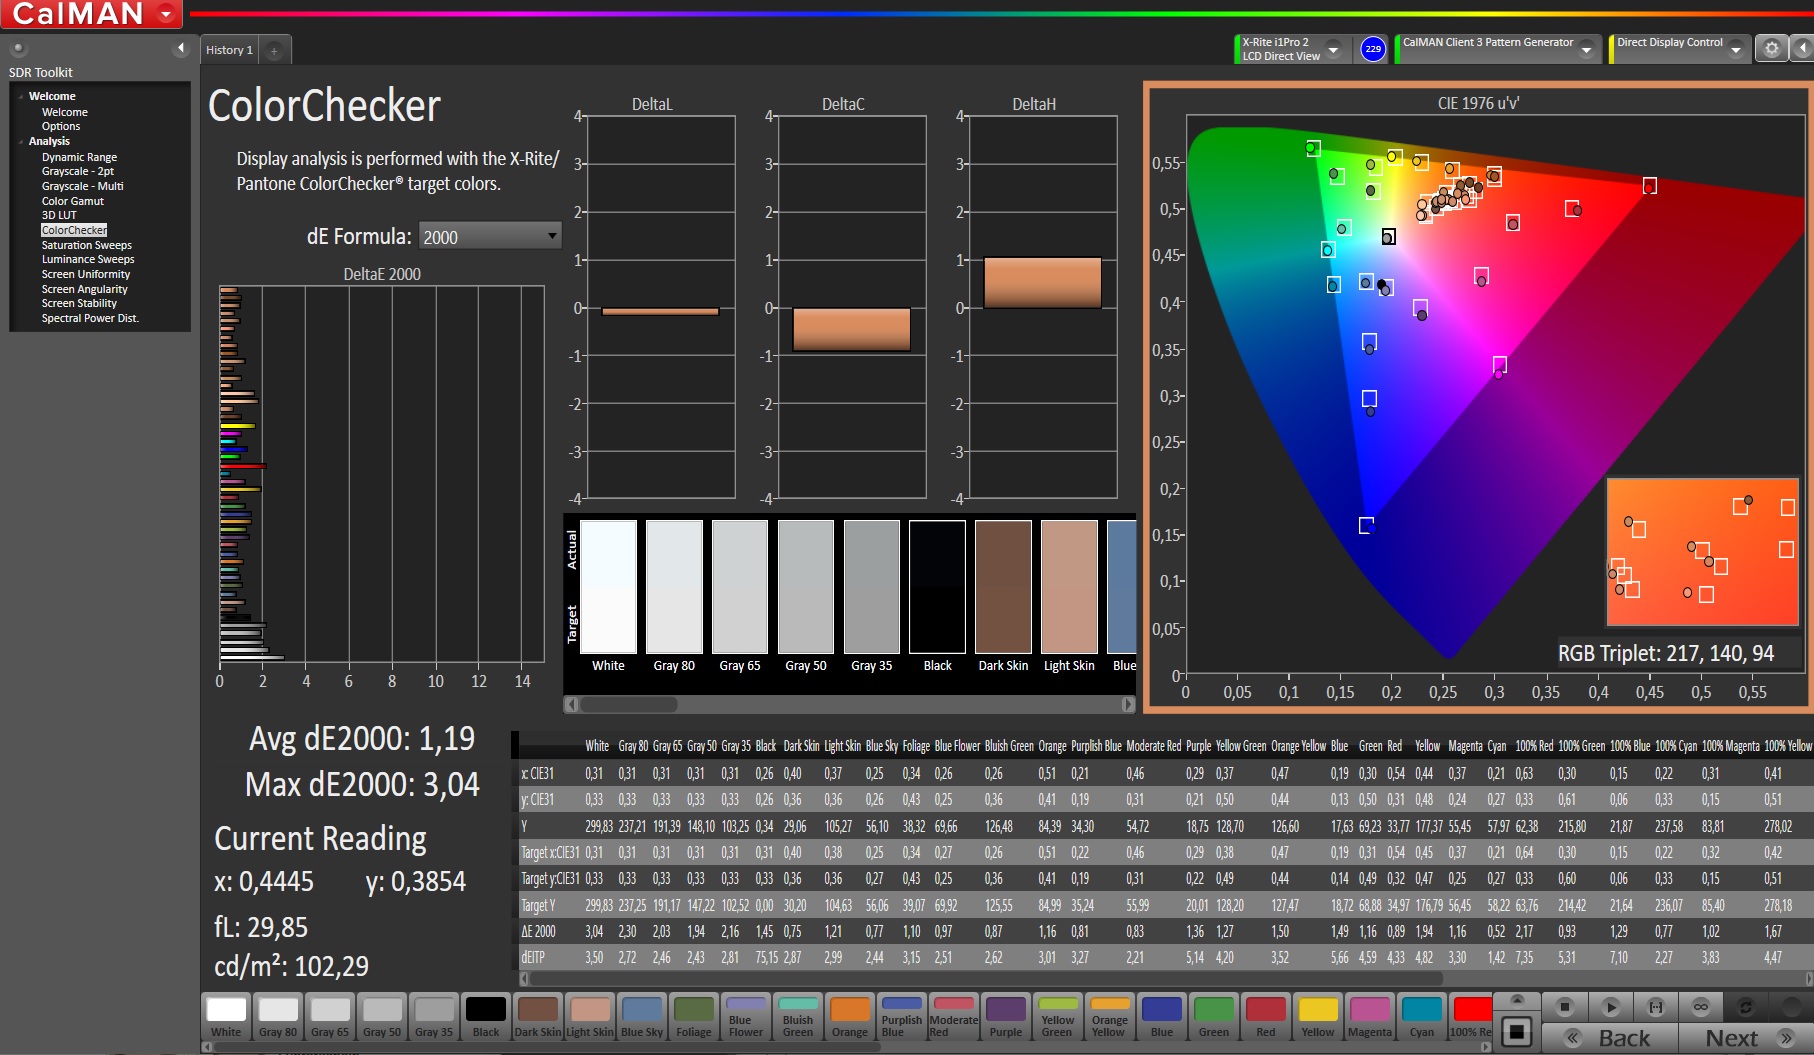
ΔE ColorChecker Calman: 1.19 | ∀{0.5-29.43 Ø4.71}
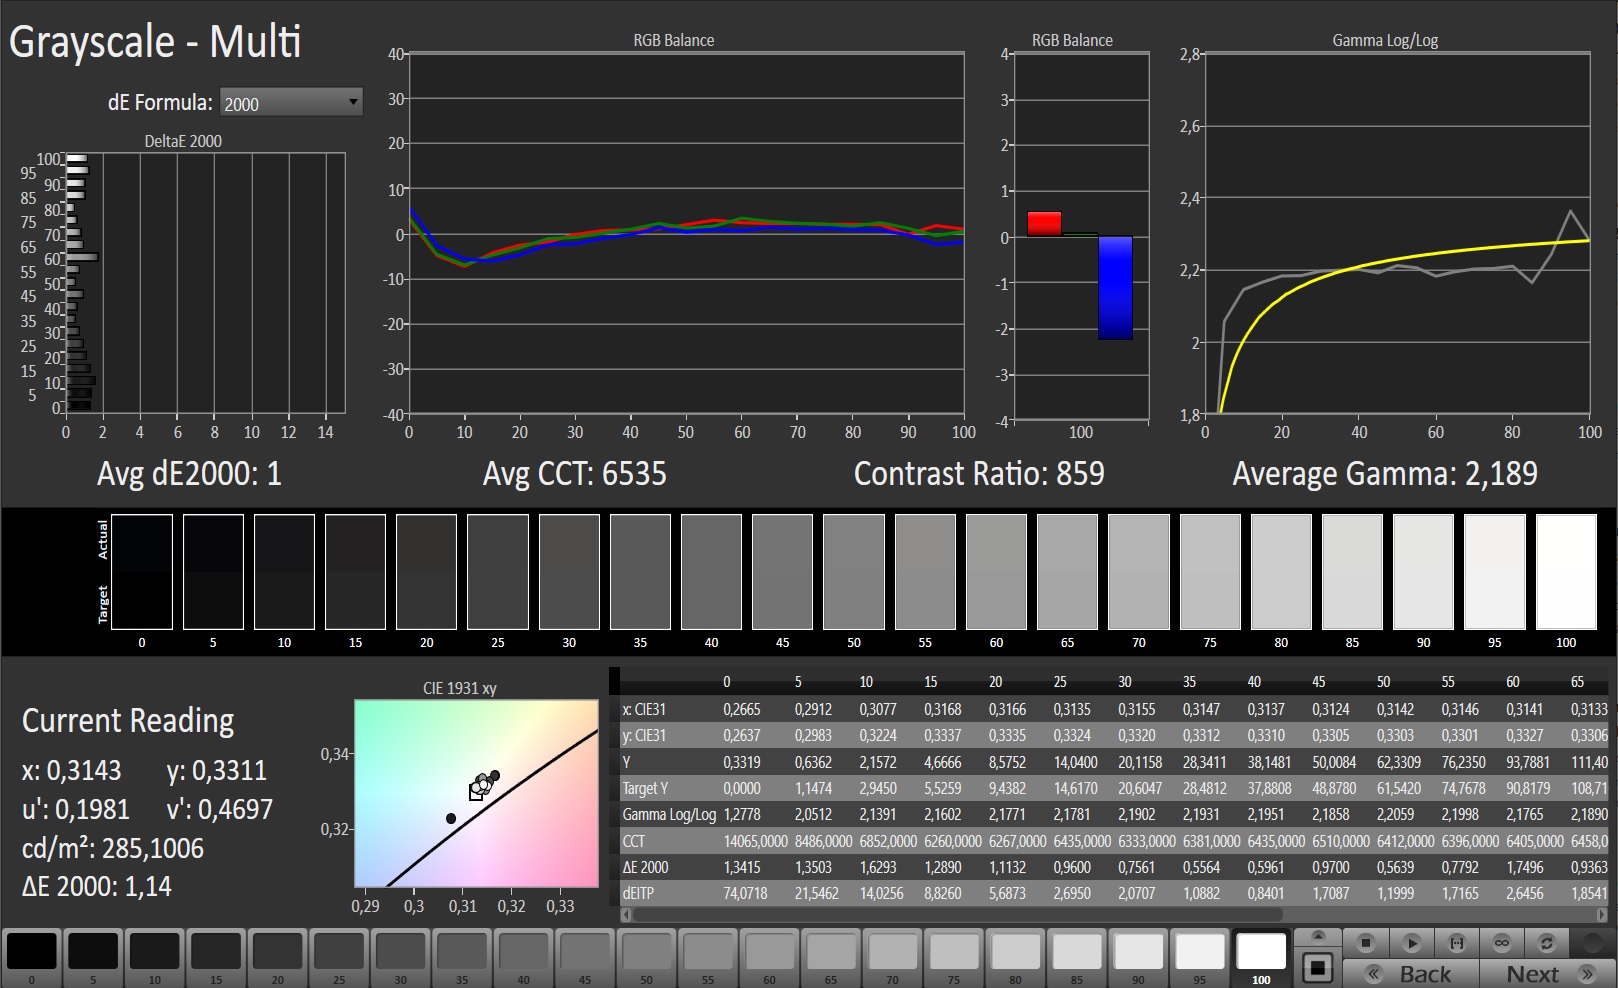
ΔE Greyscale Calman: 1.9 | ∀{0.09-98 Ø4.96}
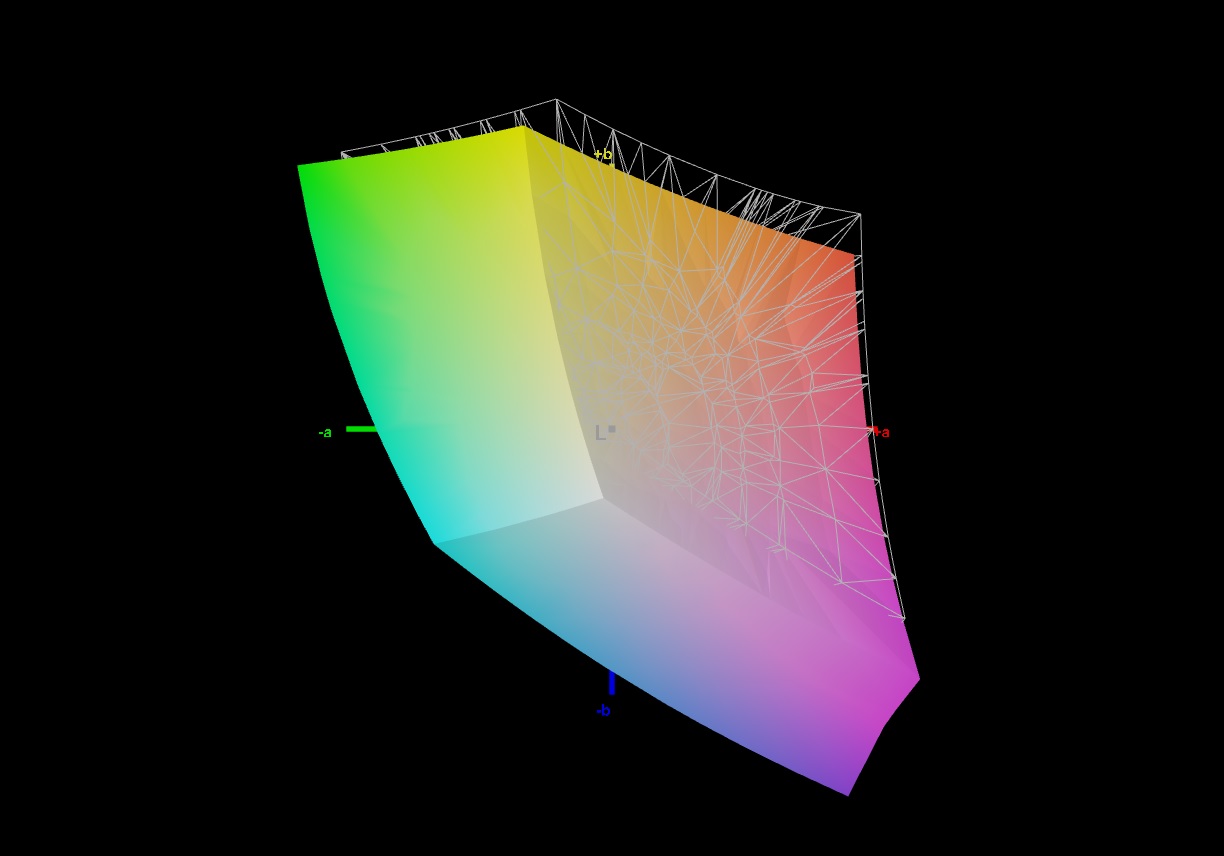
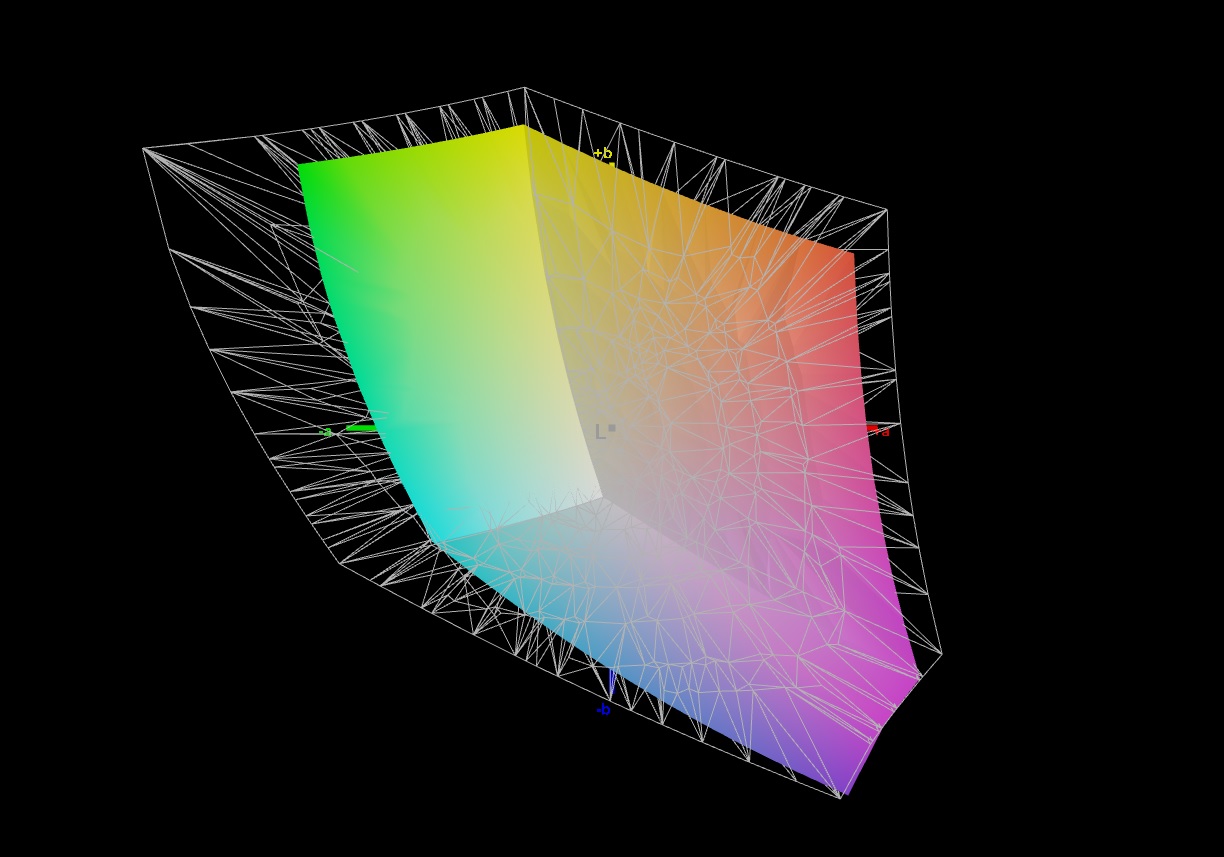
92% sRGB (Argyll 1.6.3 3D)
70% AdobeRGB 1998 (Argyll 1.6.3 3D)
69.8% AdobeRGB 1998 (Argyll 3D)
99% sRGB (Argyll 3D)
68% Display P3 (Argyll 3D)
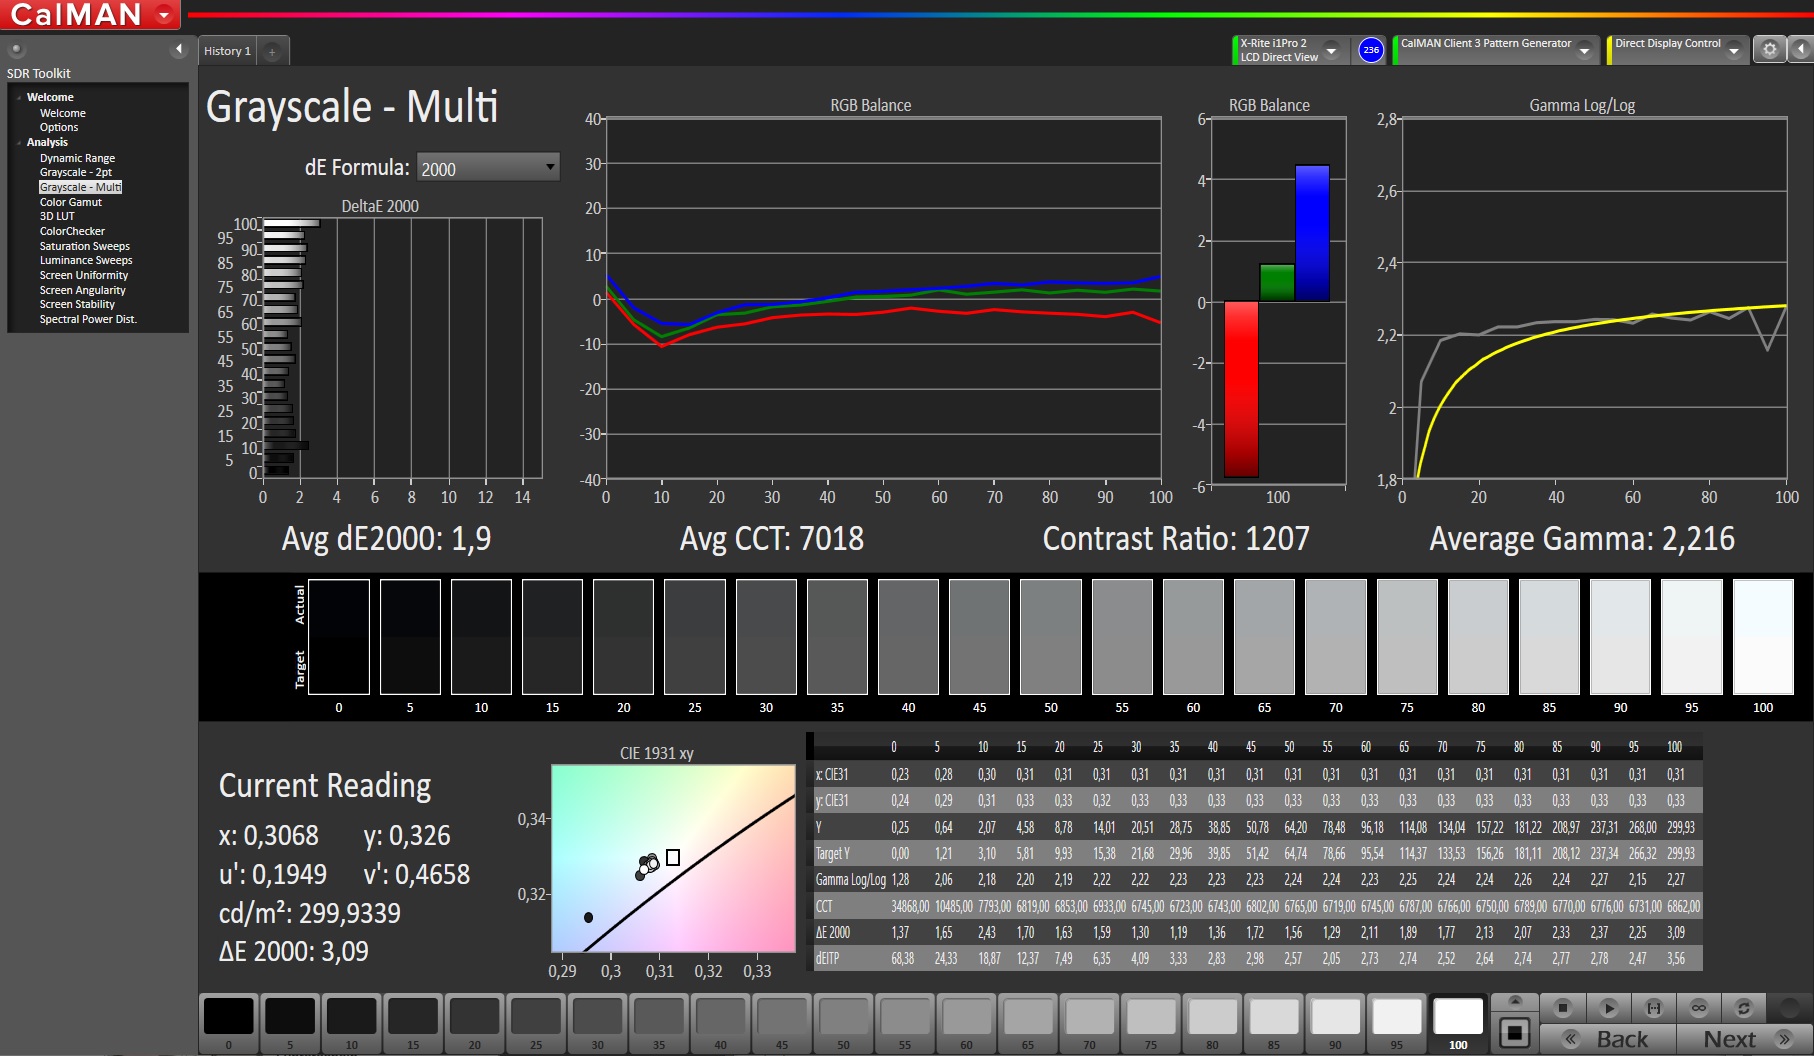
Gamma: 2.216
CCT: 7018 K
| MSI GE66 Raider 10SFS Sharp LQ156M1JW03 (SHP14C5), IPS-Level, 1920x1080 | MSI GE65 Raider 9SF-049US Sharp LQ156M1JW03, IPS, 1920x1080 | Asus Strix Scar III G531GW Sharp LQ156M1JW09 (SHP14D3), IPS, 1920x1080 | Eurocom Nightsky RX15 Samsung SDCA029, OLED, 3840x2160 | |
|---|---|---|---|---|
| Display | 1% | -3% | 30% | |
| Display P3 Coverage (%) | 68 | 69.3 2% | 66.2 -3% | 99.9 47% |
| sRGB Coverage (%) | 99 | 98.9 0% | 96.5 -3% | 100 1% |
| AdobeRGB 1998 Coverage (%) | 69.8 | 70.7 1% | 67.5 -3% | 99.1 42% |
| Response Times | 6% | -7% | 80% | |
| Response Time Grey 50% / Grey 80% * (ms) | 16.4 ? | 13.2 ? 20% | 17.2 ? -5% | 2.4 ? 85% |
| Response Time Black / White * (ms) | 10.4 ? | 11.2 ? -8% | 11.2 ? -8% | 2.6 ? 75% |
| PWM Frequency (Hz) | 23580 ? | 23150 ? | 24040 ? | 59.5 ? |
| Screen | -19% | -14% | -107% | |
| Brightness middle (cd/m²) | 291 | 277.4 -5% | 266 -9% | 414.9 43% |
| Brightness (cd/m²) | 278 | 264 -5% | 252 -9% | 404 45% |
| Brightness Distribution (%) | 91 | 90 -1% | 88 -3% | 88 -3% |
| Black Level * (cd/m²) | 0.25 | 0.24 4% | 0.27 -8% | |
| Contrast (:1) | 1164 | 1156 -1% | 985 -15% | |
| Colorchecker dE 2000 * | 1.19 | 1.51 -27% | 1.81 -52% | 7.58 -537% |
| Colorchecker dE 2000 max. * | 3.04 | 4.93 -62% | 3.23 -6% | 14.85 -388% |
| Greyscale dE 2000 * | 1.9 | 3.7 -95% | 2.44 -28% | 2.9 -53% |
| Gamma | 2.216 99% | 2.23 99% | 2.42 91% | 2.05 107% |
| CCT | 7018 93% | 7061 92% | 7005 93% | 6538 99% |
| Color Space (Percent of AdobeRGB 1998) (%) | 70 | 65.1 -7% | 62 -11% | 88.2 26% |
| Color Space (Percent of sRGB) (%) | 92 | 99.1 8% | 97 5% | 100 9% |
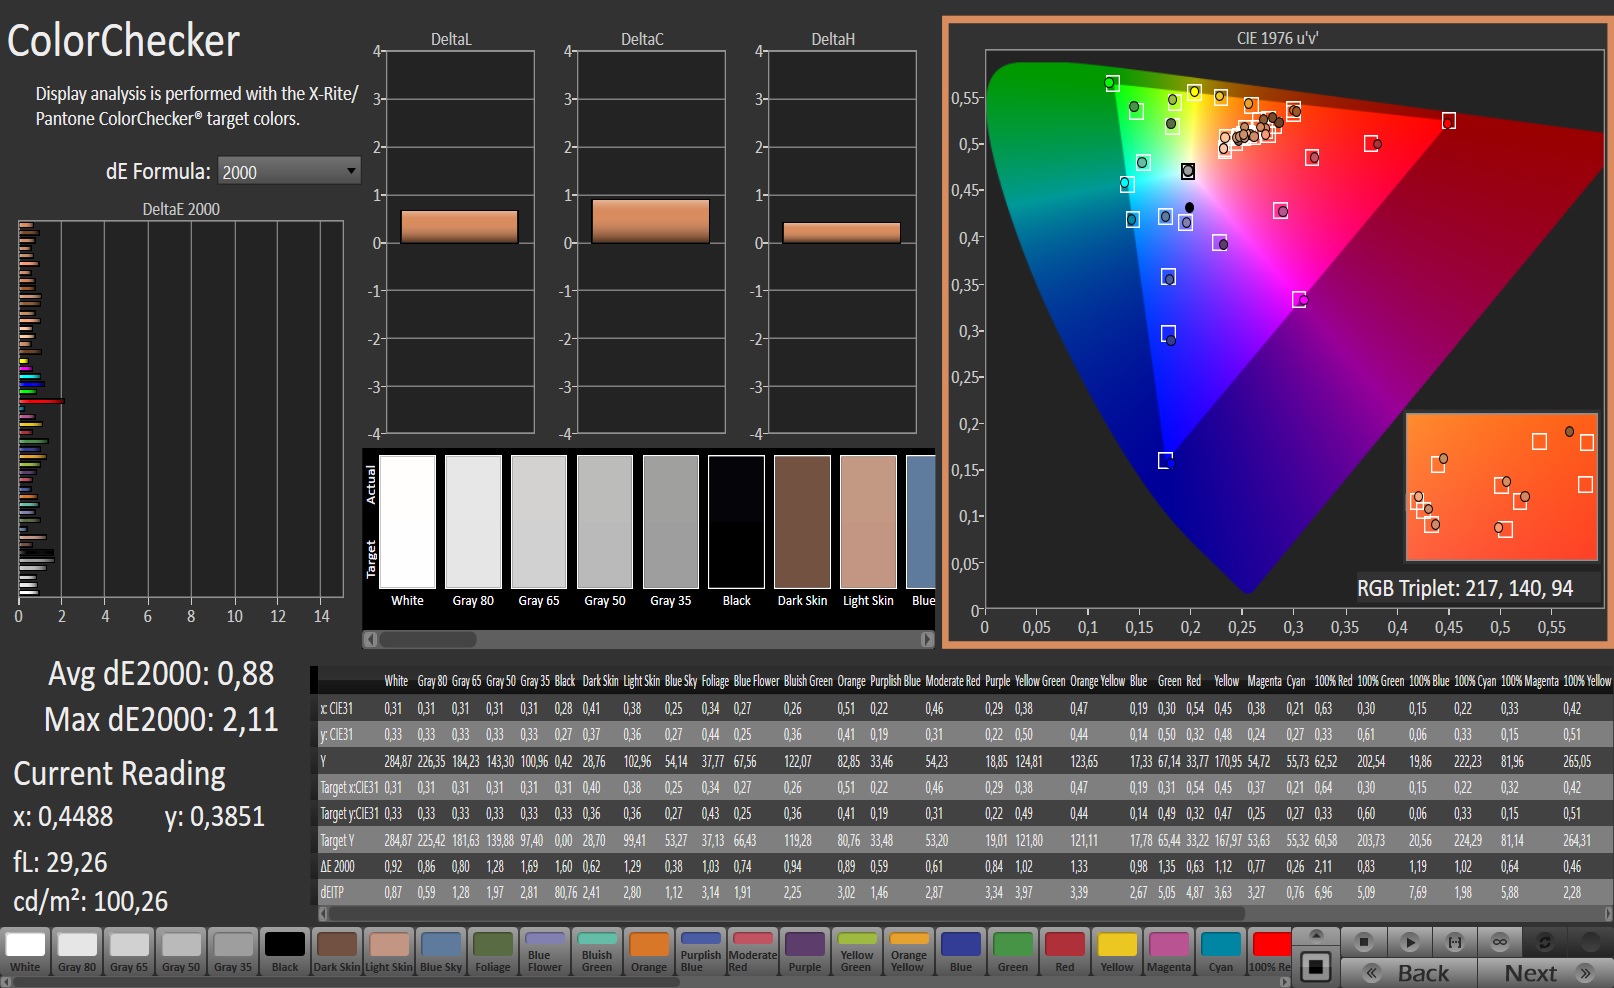
| Colorchecker dE 2000 calibrated * | 1.77 | 1.03 | ||
| Toplam Ortalama (Program / Ayarlar) | -4% /
-12% | -8% /
-11% | 1% /
-47% |
* ... daha küçük daha iyidir
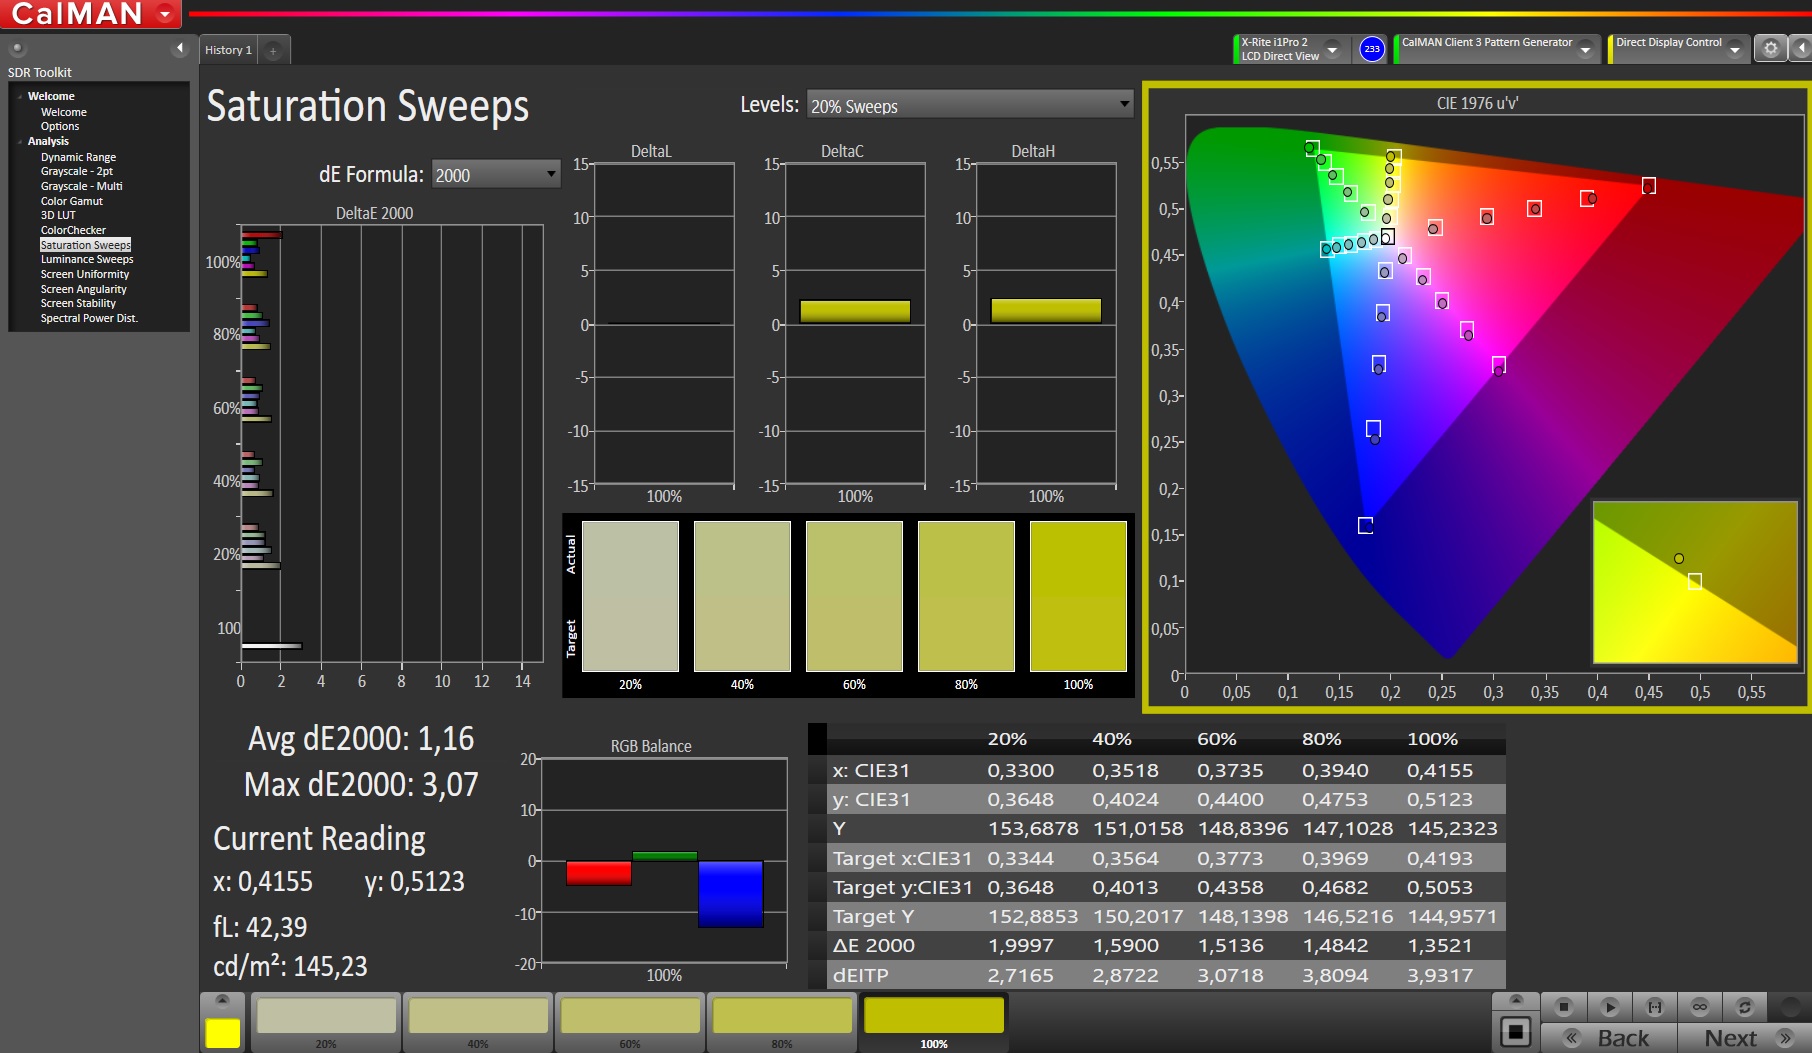
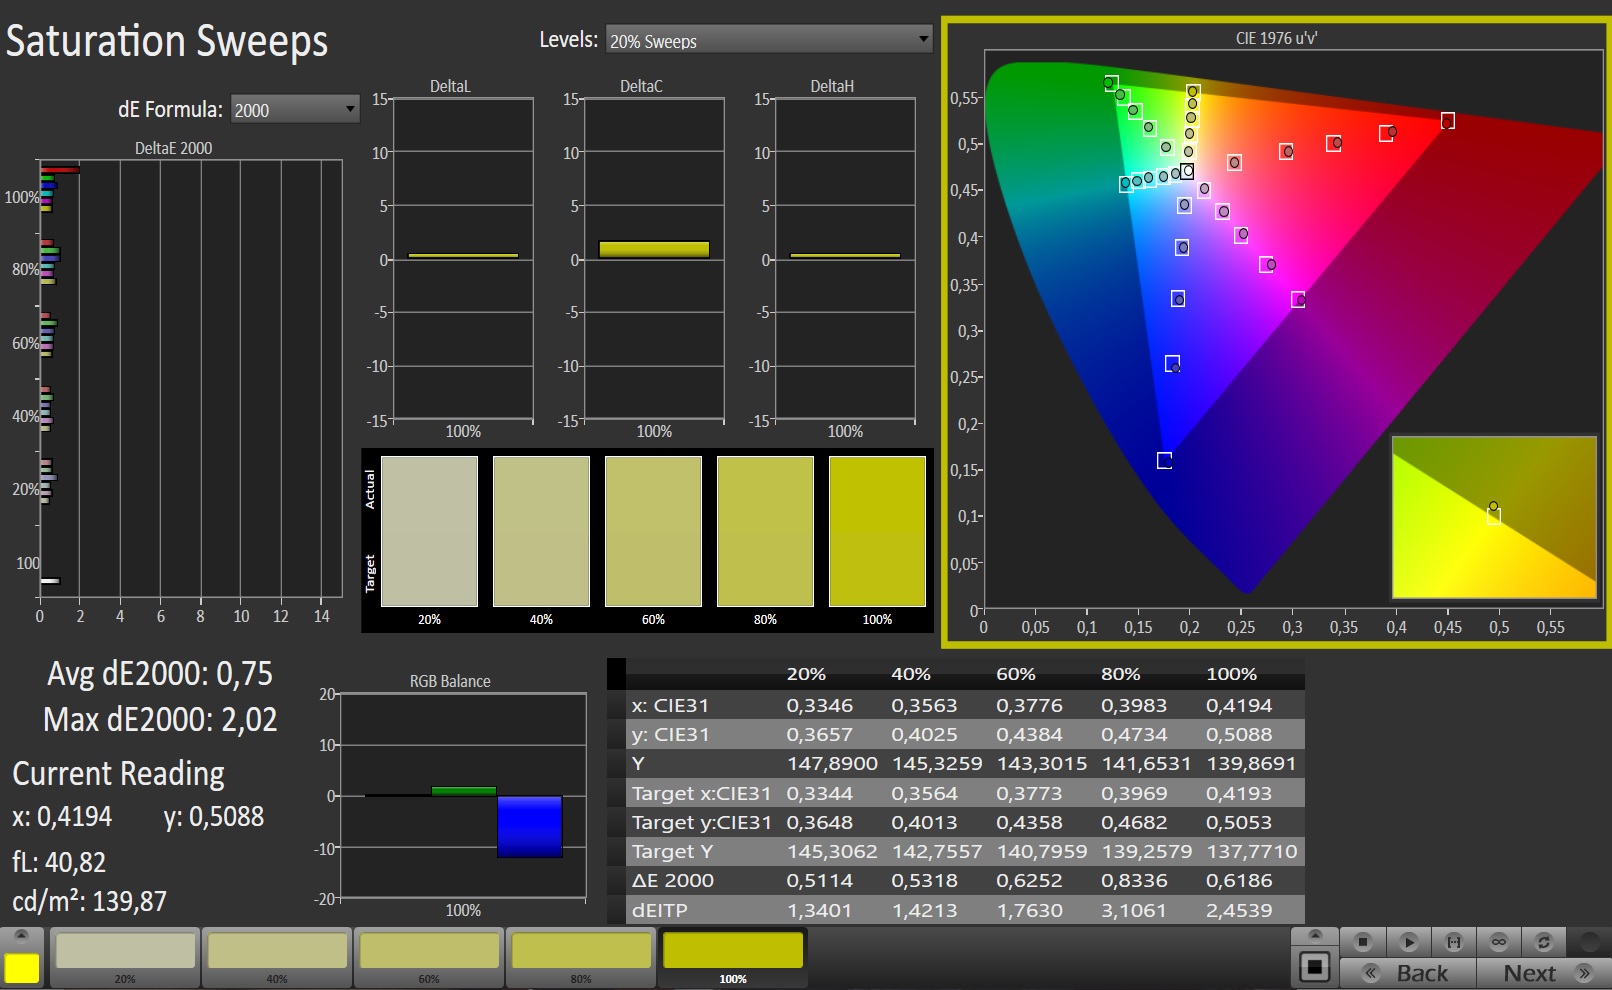
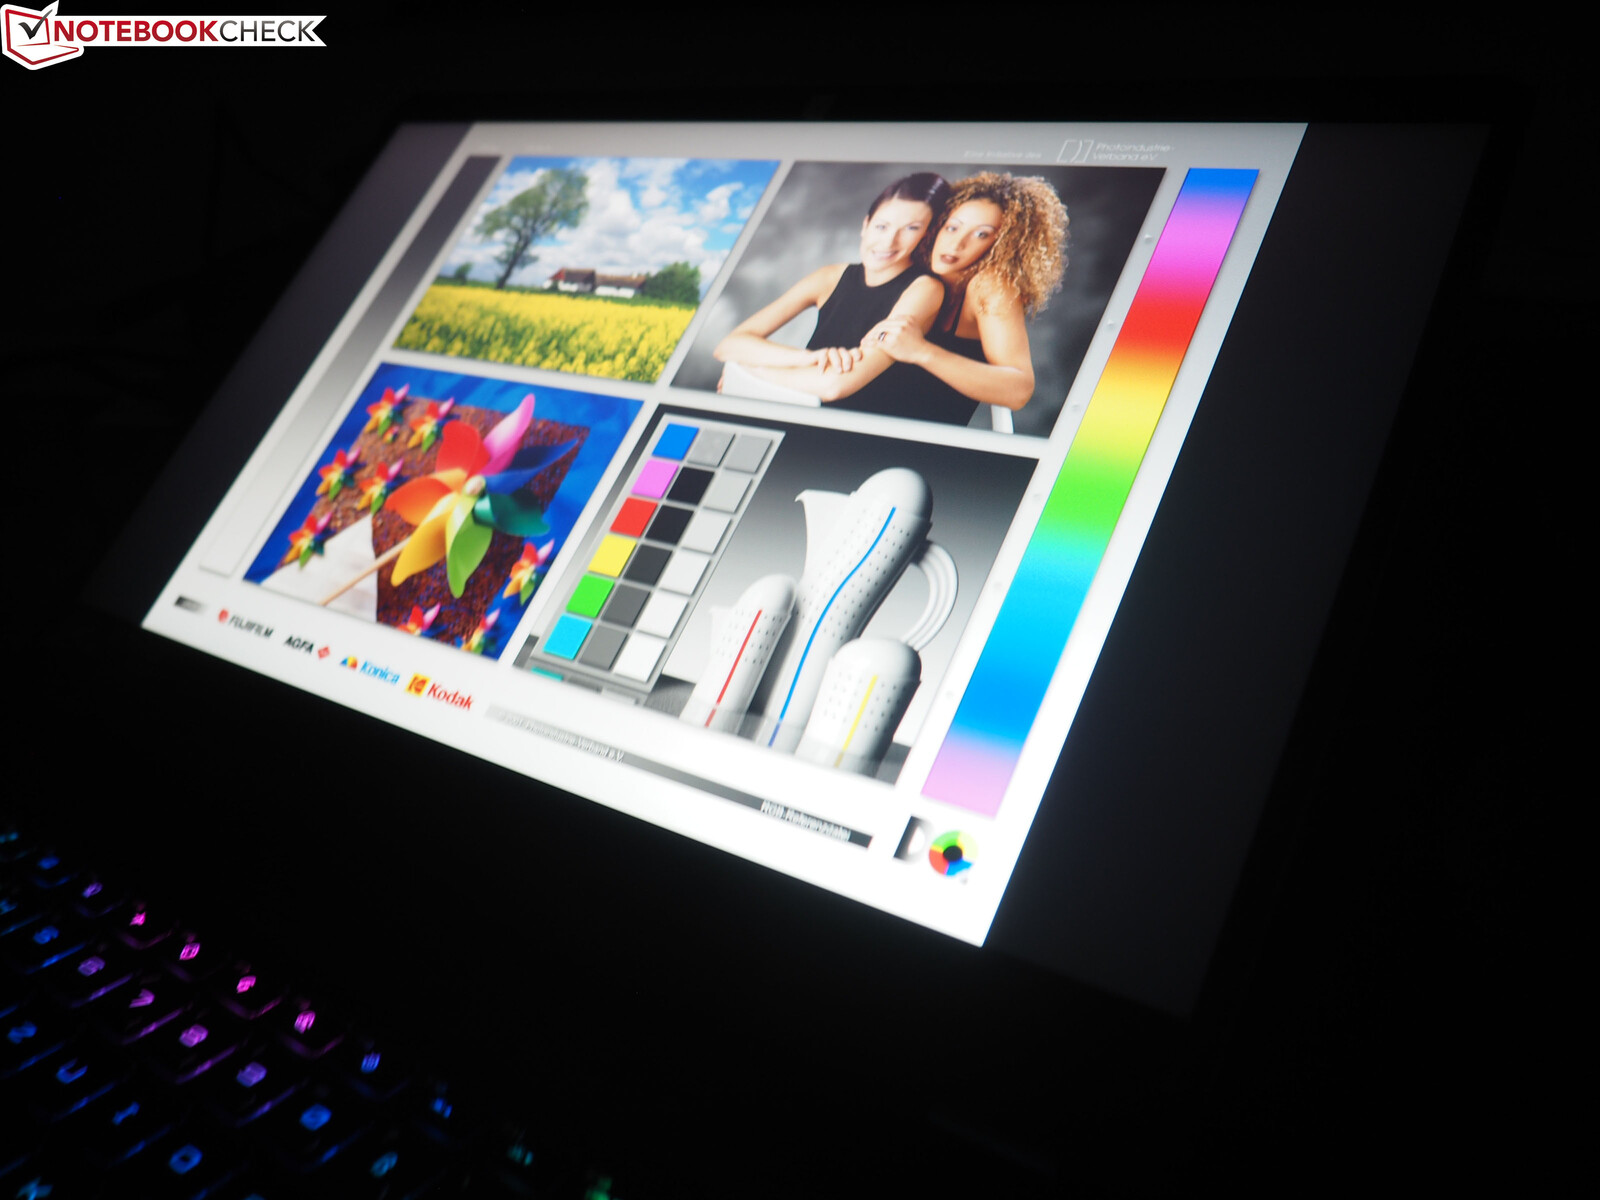
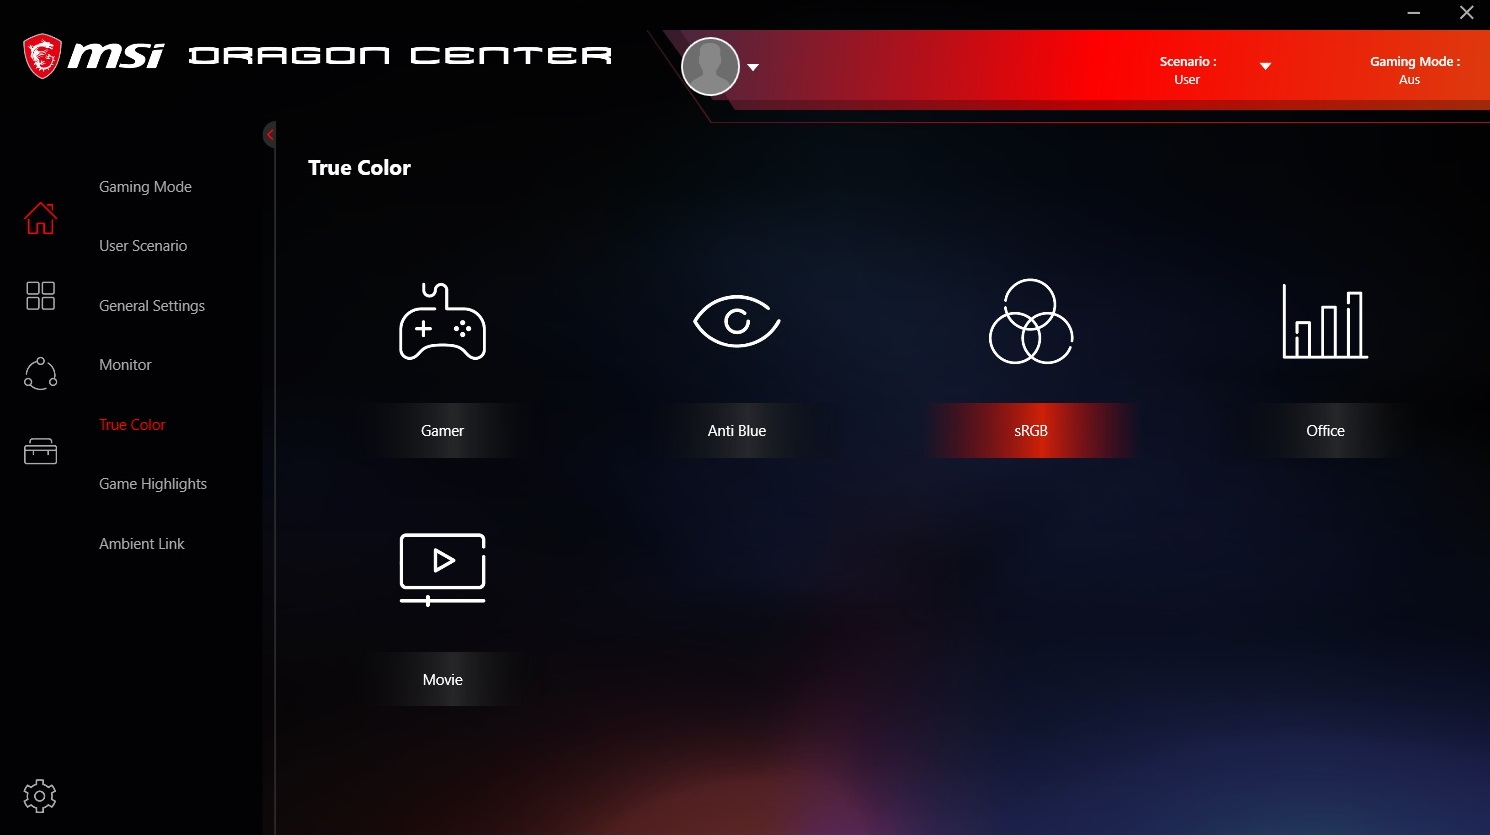
GE66, 15 inçlik ekranın güçlü ve zayıf yönlerini devralır. Parlaklık sadece 280 cd / m² civarında orta derecede etkileyici olsa da, kontrast nispeten düşük siyah değeri (0.25 cd / m²) nedeniyle 1.000: 1 işaretini kırıyor. Renk doğruluğu da rekabetin arkasına saklanmak zorunda değil. True Color yazılımı ("sRGB" modu test edildi) sayesinde gri tonlar ve renkler ideal aralıktadır. Böylece, sonraki kalibrasyon atlanabilir.
Görüş açıları söz konusu olduğunda, GE66 tipik IPS seviyelerine uygundur. Yüksek kare hızına ek olarak, tepki süresi de etkileyici. Ölçümlerimize göre, 15 inçlik 10 ms siyah-beyaz ve 16 ms griden griye kadar geliyor.
Ekranın% 19 parlaklığa kadar titremesi hassas kişiler için bile sorun olmamalı (aşağıdaki bilgi penceresine bakın). Ancak, alıcılar G-Sync görüntü iyileştirmesi olmadan yaşamak zorundadır. Daha uzun pil ömrü için GE66, Optimus teknolojisi sunar.
Yanıt Sürelerini Görüntüle
| ↔ Tepki Süresi Siyahtan Beyaza | ||
|---|---|---|
| 10.4 ms ... yükseliş ↗ ve sonbahar↘ birleşimi | ↗ 6 ms yükseliş | 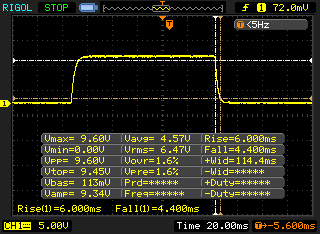 |
| ↘ 4.4 ms sonbahar | ||
| Ekran, testlerimizde iyi yanıt oranları gösteriyor ancak rekabetçi oyuncular için çok yavaş olabilir. Karşılaştırıldığında, test edilen tüm cihazlar 0.1 (minimum) ile 240 (maksimum) ms arasında değişir. » Tüm cihazların 28 %'si daha iyi. Bu, ölçülen yanıt süresinin test edilen tüm cihazların ortalamasından (19.8 ms) daha iyi olduğu anlamına gelir. | ||
| ↔ Tepki Süresi %50 Griden %80 Griye | ||
| 16.4 ms ... yükseliş ↗ ve sonbahar↘ birleşimi | ↗ 6.8 ms yükseliş | 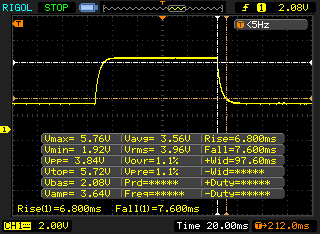 |
| ↘ 7.6 ms sonbahar | ||
| Ekran, testlerimizde iyi yanıt oranları gösteriyor ancak rekabetçi oyuncular için çok yavaş olabilir. Karşılaştırıldığında, test edilen tüm cihazlar 0.165 (minimum) ile 636 (maksimum) ms arasında değişir. » Tüm cihazların 31 %'si daha iyi. Bu, ölçülen yanıt süresinin test edilen tüm cihazların ortalamasından (31 ms) daha iyi olduğu anlamına gelir. | ||
Ekran Titremesi / PWM (Darbe Genişliği Modülasyonu)
| Ekran titriyor / PWM algılandı | 23580 Hz | ≤ 19 % parlaklık ayarı | 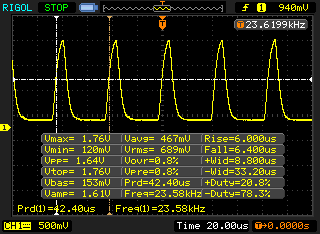 |
Ekran arka ışığı 23580 Hz'de titriyor (en kötü durum, örneğin PWM kullanılması) 19 % ve altındaki parlaklık ayarında titreme algılandı. Bu parlaklık ayarının üzerinde titreme veya PWM olmamalıdır. 23580 Hz frekansı oldukça yüksektir, bu nedenle PWM'ye duyarlı çoğu kullanıcı herhangi bir titremeyi fark etmemelidir. Karşılaştırıldığında: Test edilen tüm cihazların %52 %'si ekranı karartmak için PWM kullanmıyor. PWM tespit edilirse, ortalama 7757 (minimum: 5 - maksimum: 343500) Hz ölçüldü. | |||
Test koşulları
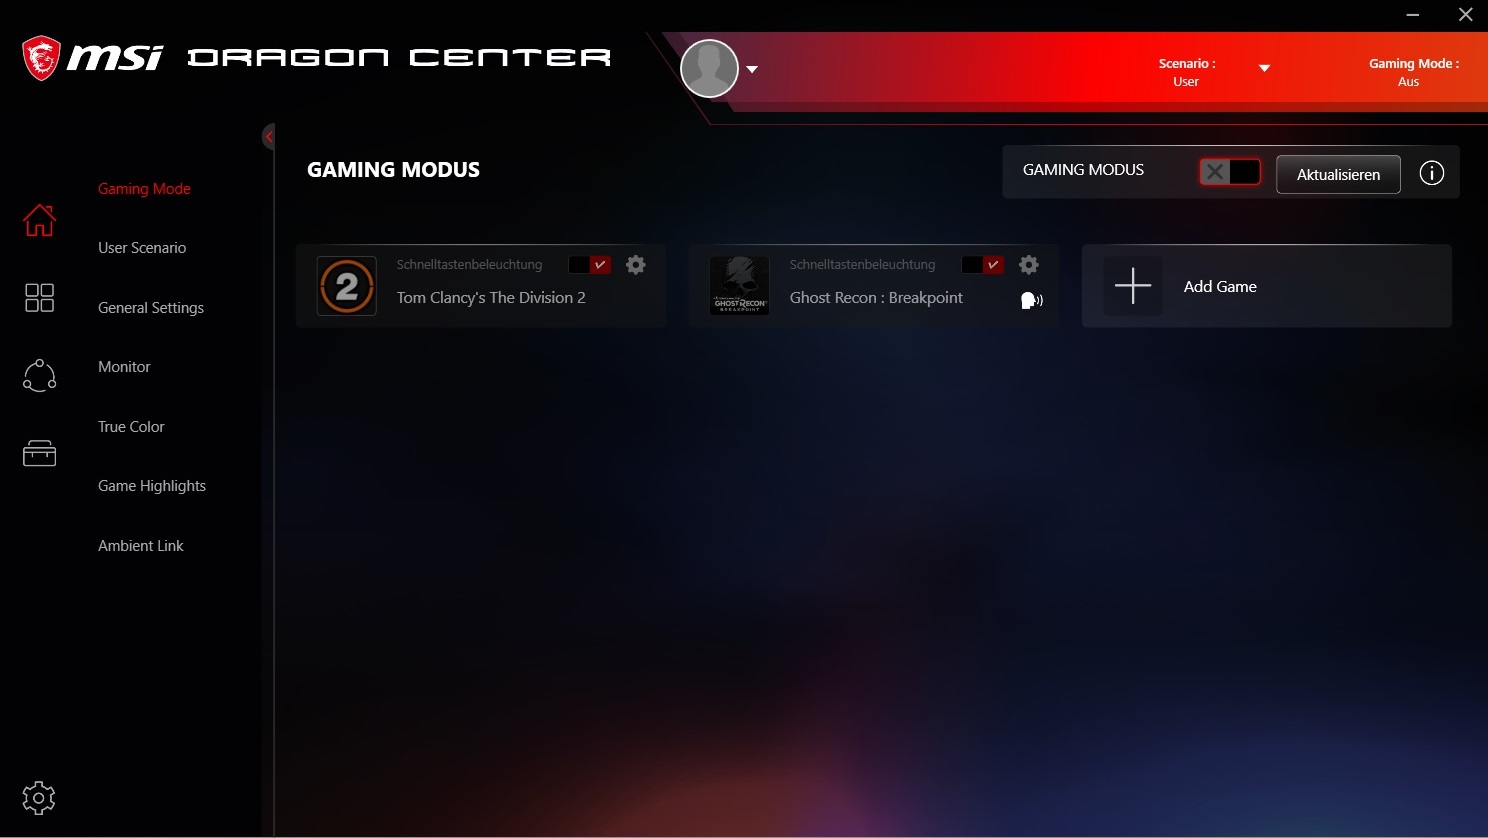
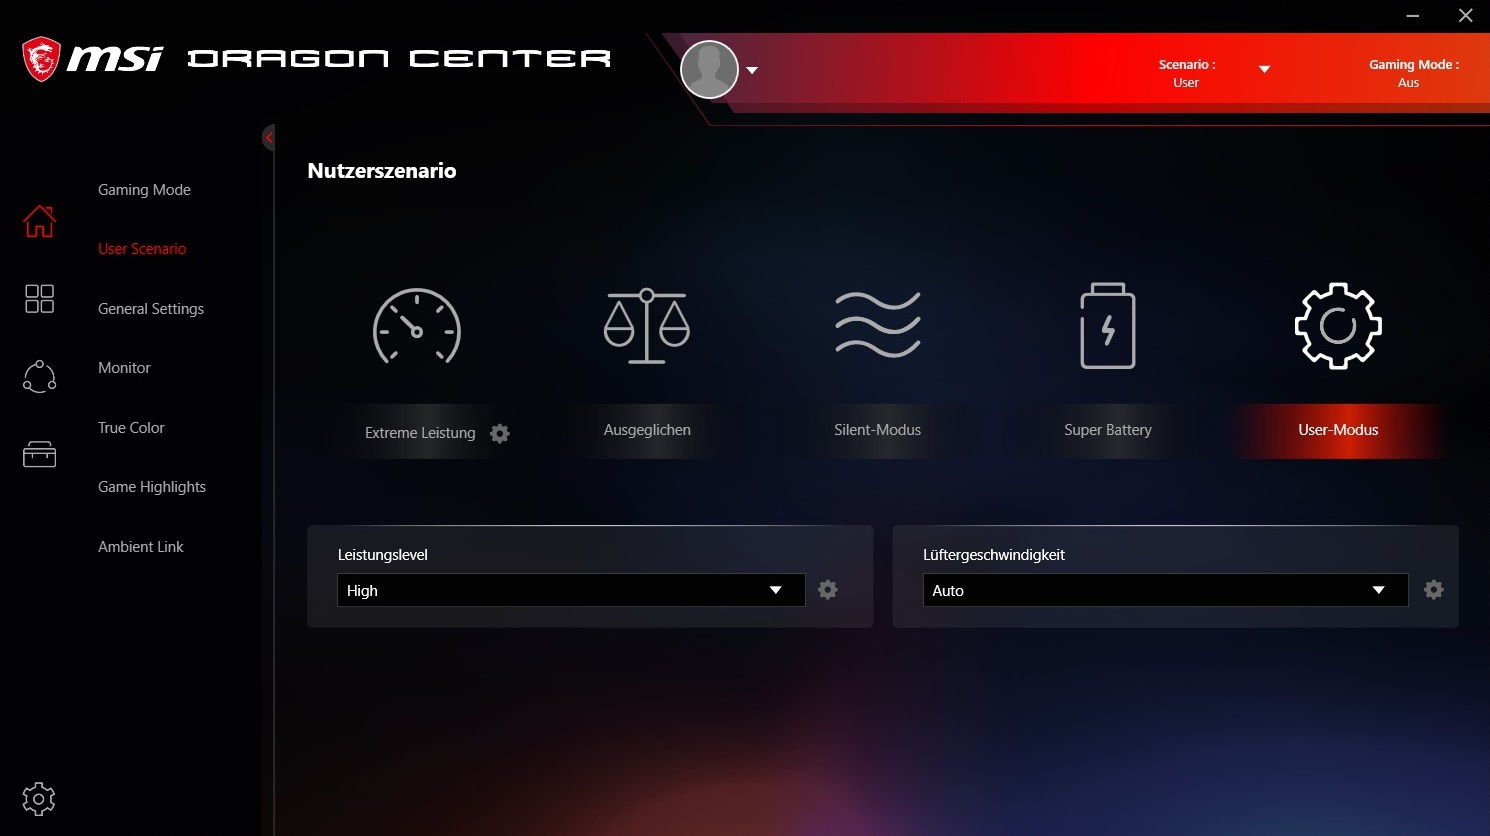
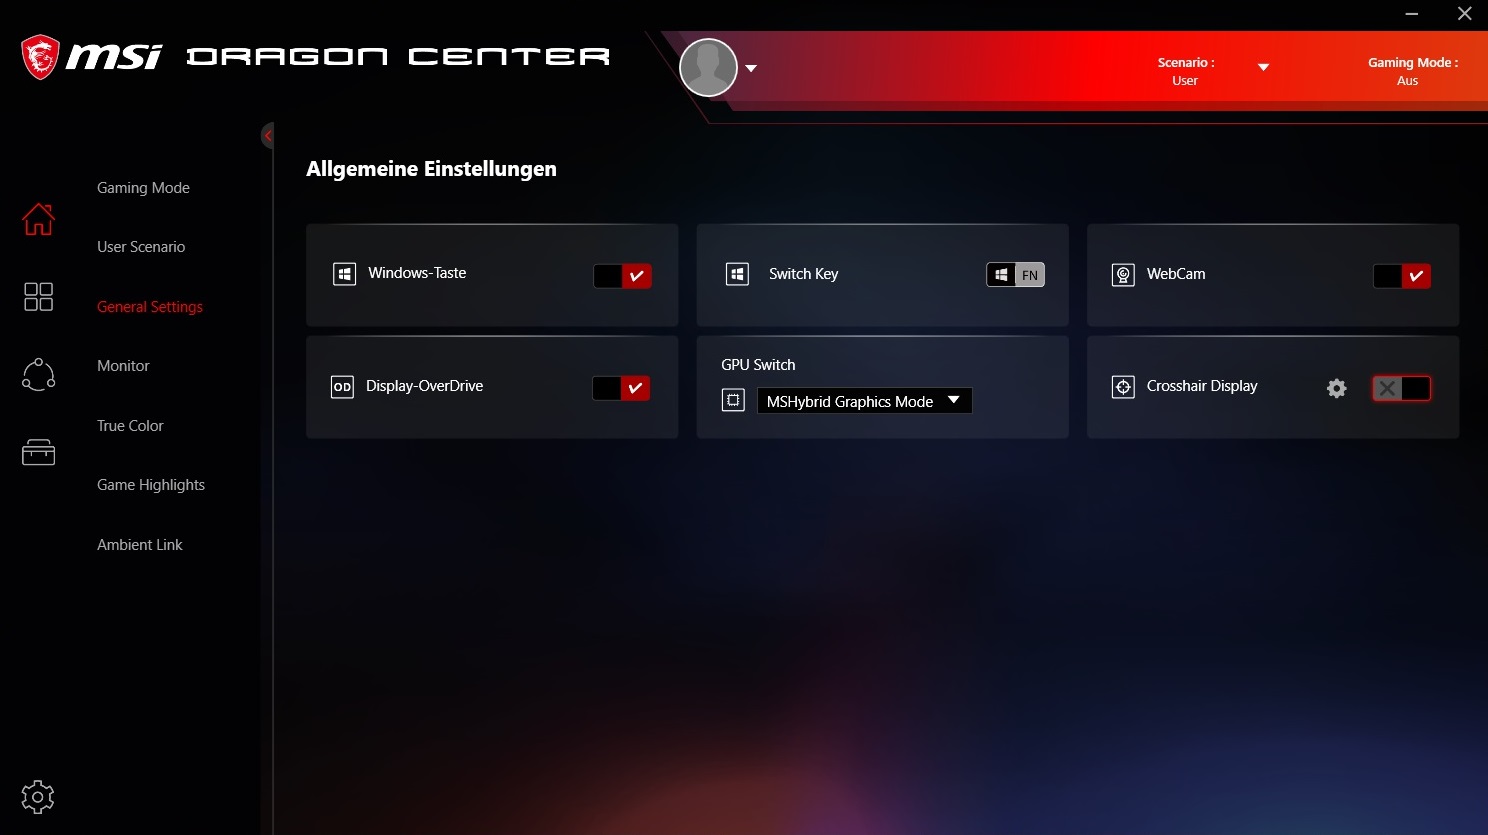
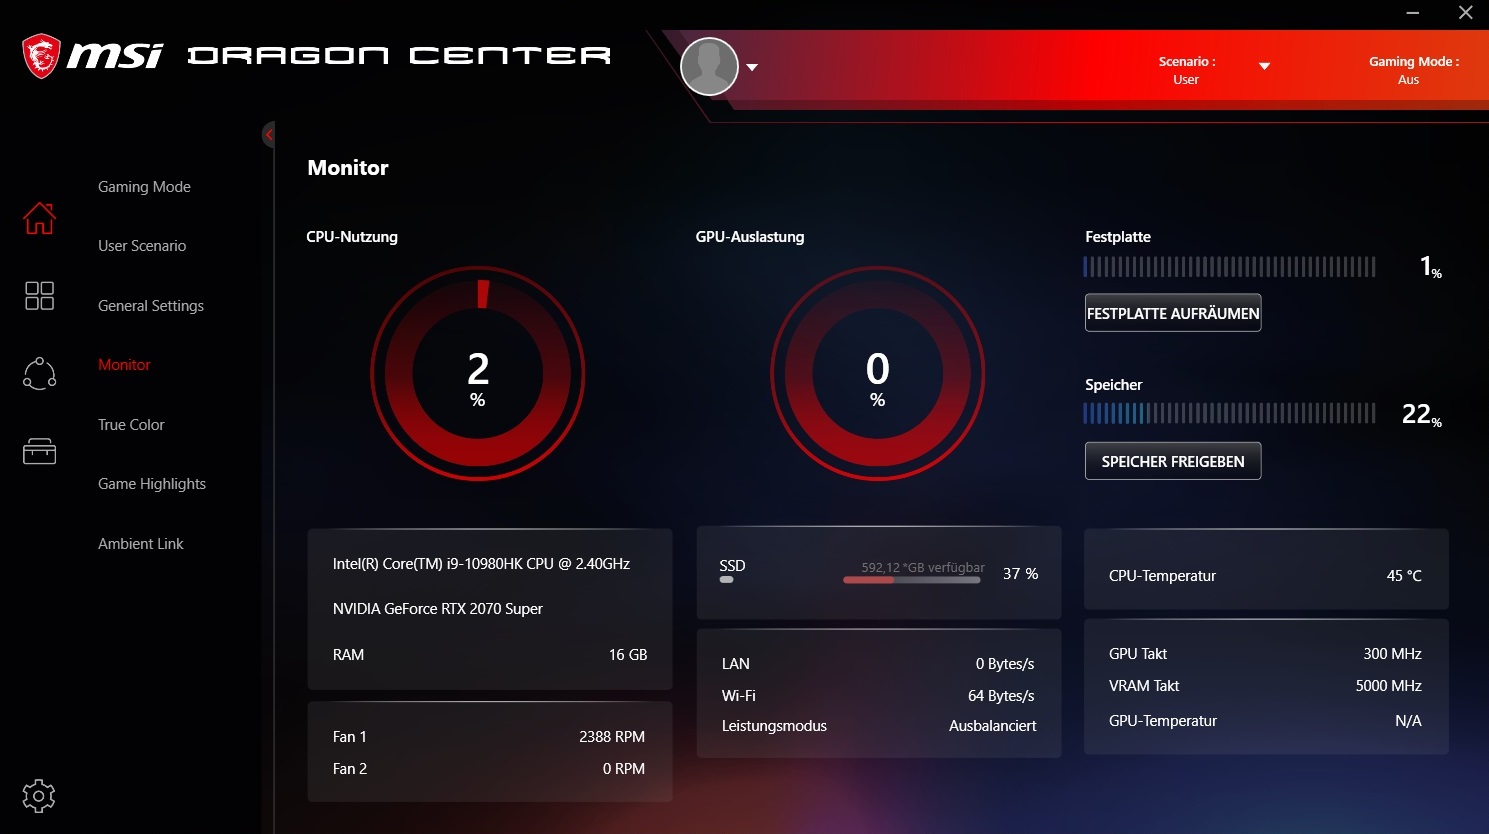
Tuning hayranları, MSI'nın oyun dizüstü bilgisayarlarına önceden yüklediği kapsamlı Dragon Center'dan memnun kalacaklar. Özellikle "Kullanıcı Senaryosu" sekmesinden bahsetmeye değer, ki bu da birkaç profil içeriyor. Testlerimiz, "Yüksek" performans seviyesi ve otomatik fan hızı ile "Kullanıcı" modunda gerçekleştirilmiştir. Belirlenen sonuçlar (performans, emisyonlar, vb.) Diğer modlarda önemli ölçüde sapma gösterebilir.
Verim
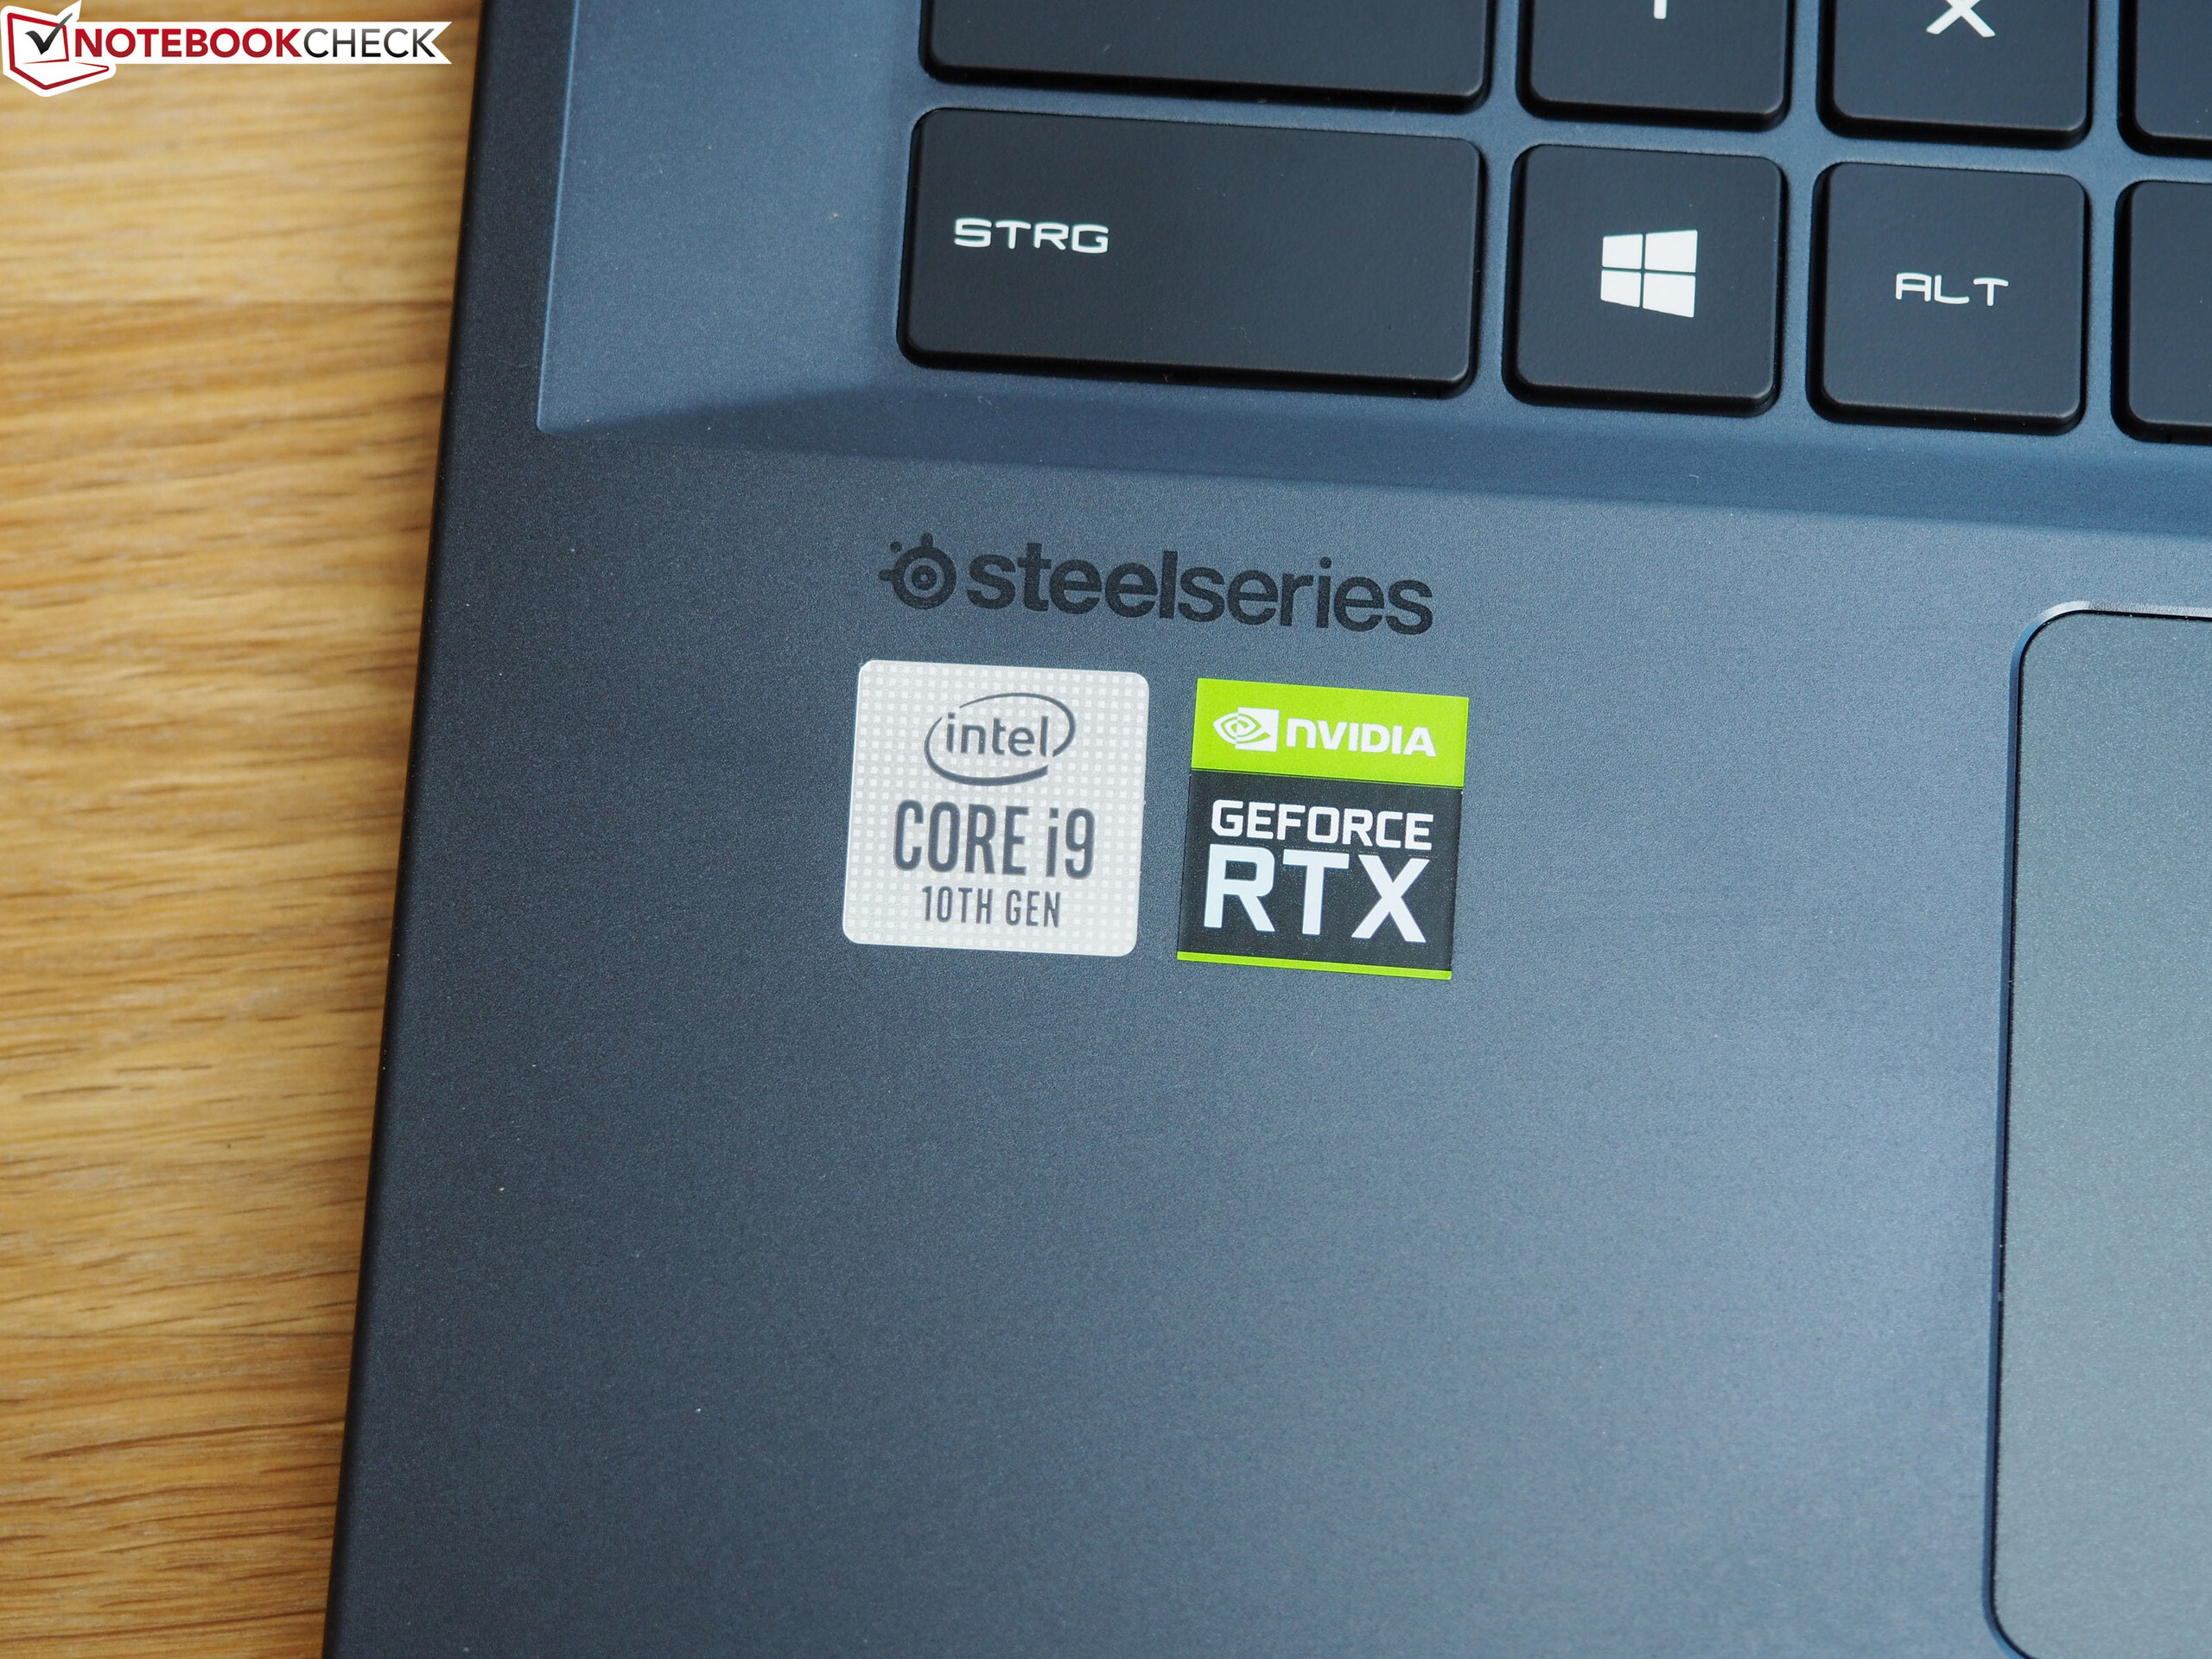
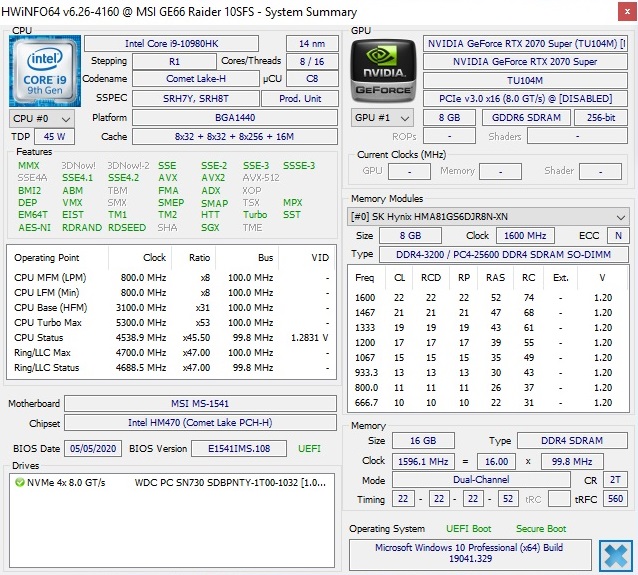
Kompakt boyutlarına rağmen, GE66 Raider'ı kesinlikle masaüstü yedek olarak kullanılabilecek gerçek bir üst düzey dizüstü bilgisayar olarak tanımlayacağız. Sekiz çekirdekli işlemci gibi, ne 16 GB RAM ne de NVMe SSD performans sınırlarına hızlı bir şekilde ulaşmamalıdır. GeForce RTX 2070 Super, oyuncular için son derece iyi bir seçenektir.
İşlemci
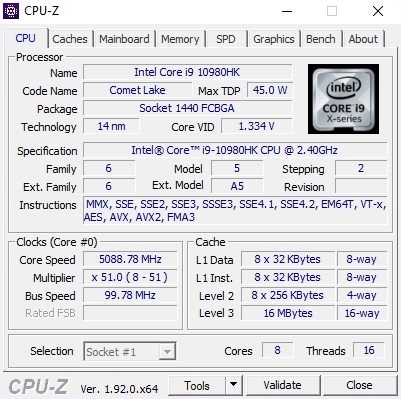
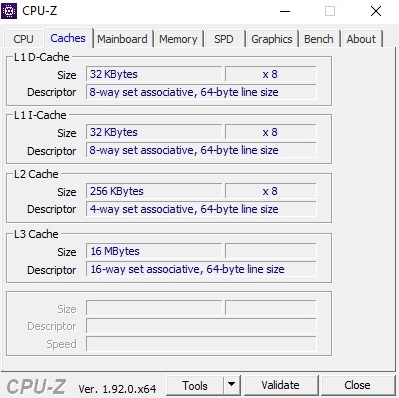
GE66'nın daha pahalı varyantları Intel'in şu anda en güçlü dizüstü bilgisayar işlemcisi olan Core i9-10980HK ile donatılmıştır. Comet Lake neslinin sekiz çekirdekli modeli, 16 MB L3 önbellek, açık bir çarpan sunuyor ve 7 nm işleminde yerleşik olan AMD sekiz çekirdekli Ryzen 7 4800H için tehlikeli hale geliyor (fiyat açısından çok daha çekici) 14 nm'lik işlem. SMT başına her iki yonga paralel olarak 16 adede kadar diş işleyebilir.
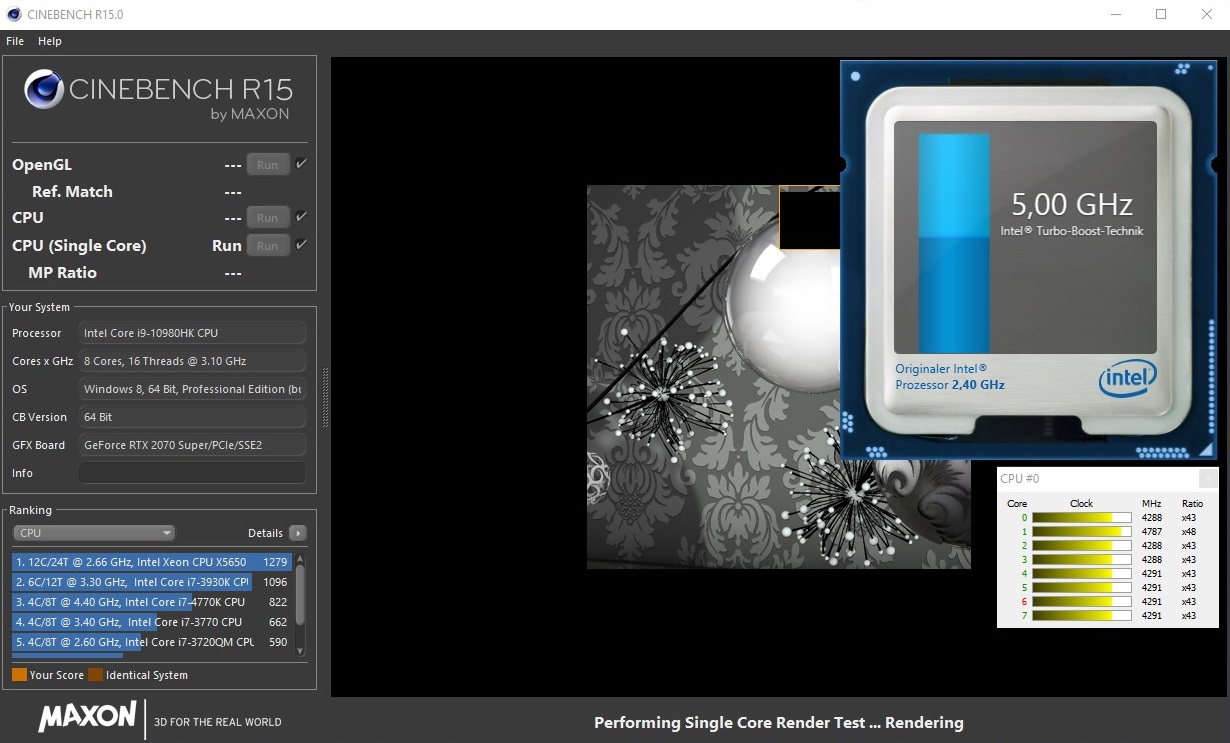
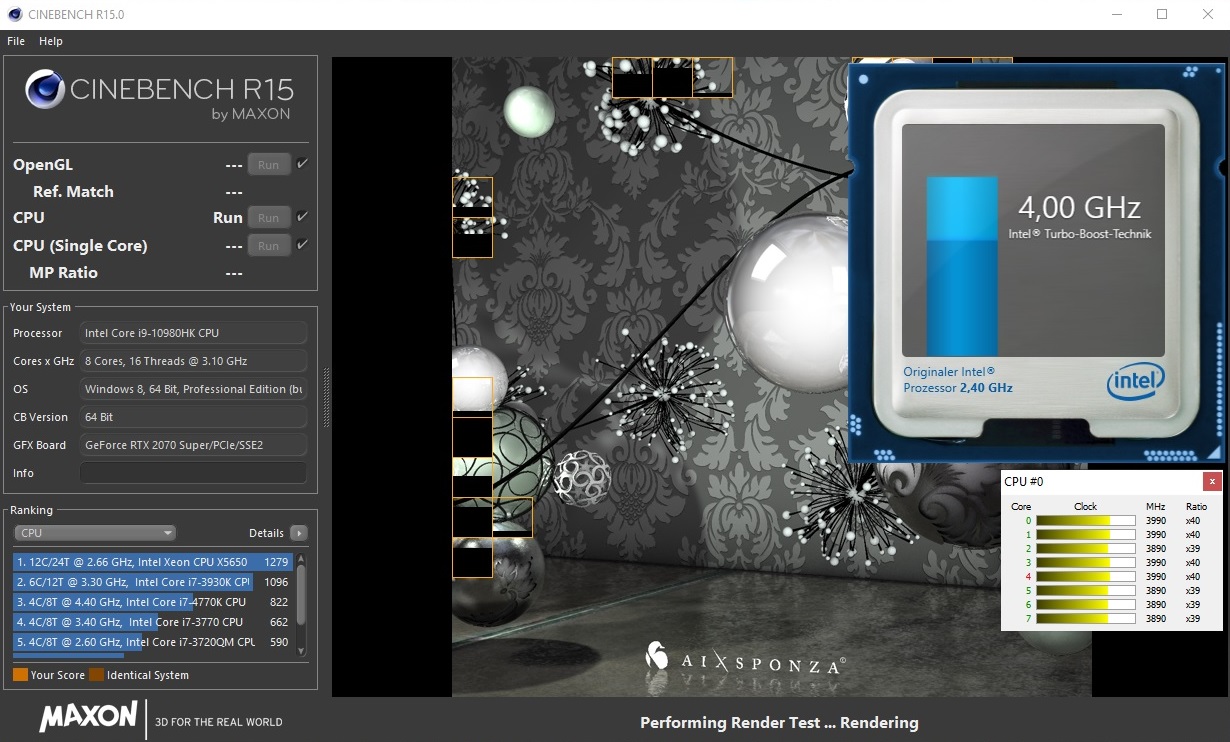
Intel, Core i9-10980HK için temel saat olarak 2,4 GHz'yi listeliyor. Bununla birlikte, Turbo Boost fonksiyonu sayesinde yük altında 5,3 GHz'e kadar mümkündür. GE66'nın mevcut saat hızı aralığından çıkardığı şey, Cinebench R15 ile test ettik. Tek çekirdekli test 4.2 ila 5.0 GHz'de gerçekleştirilirken, Comet Lake çipi tüm çekirdeklerde yük altında 3.8 ila 4.2 GHz arasında yönetir.
Her ne kadar dizüstü bilgisayarlar için ortak bir davranış olan Cinebench döngüsü sırasında performans biraz düşse de GE66, Core i9-9980HK veya Core i9-9880H işlemcilere sahip rakip cihazları uzun vadede geride bırakıyor. Genel olarak, i9-10980HK'nın turbo performansı ne iyi ne de özellikle kötü.
| Cinebench R15 | |
| CPU Single 64Bit | |
| Sınıf ortalaması Gaming (188.8 - 350, n=106, son 2 yıl) | |
| MSI GE66 Raider 10SFS | |
| Eurocom Nightsky RX15 | |
| MSI GE65 Raider 9SF-049US | |
| Asus Strix Scar III G531GW | |
| CPU Multi 64Bit | |
| Sınıf ortalaması Gaming (1578 - 6330, n=105, son 2 yıl) | |
| Eurocom Nightsky RX15 | |
| MSI GE66 Raider 10SFS | |
| MSI GE65 Raider 9SF-049US | |
| Asus Strix Scar III G531GW | |
| Blender - v2.79 BMW27 CPU | |
| Eurocom Nightsky RX15 | |
| MSI GE66 Raider 10SFS | |
| Sınıf ortalaması Gaming (79 - 330, n=104, son 2 yıl) | |
| 7-Zip 18.03 | |
| 7z b 4 -mmt1 | |
| Sınıf ortalaması Gaming (4199 - 7436, n=105, son 2 yıl) | |
| MSI GE66 Raider 10SFS | |
| Eurocom Nightsky RX15 | |
| 7z b 4 | |
| Sınıf ortalaması Gaming (33491 - 148086, n=105, son 2 yıl) | |
| MSI GE66 Raider 10SFS | |
| Eurocom Nightsky RX15 | |
| Cinebench R20 | |
| CPU (Single Core) | |
| Sınıf ortalaması Gaming (442 - 913, n=106, son 2 yıl) | |
| Eurocom Nightsky RX15 | |
| MSI GE66 Raider 10SFS | |
| MSI GE65 Raider 9SF-049US | |
| CPU (Multi Core) | |
| Sınıf ortalaması Gaming (4029 - 16433, n=106, son 2 yıl) | |
| MSI GE66 Raider 10SFS | |
| Eurocom Nightsky RX15 | |
| MSI GE65 Raider 9SF-049US | |
| Geekbench 5.5 | |
| Single-Core | |
| Sınıf ortalaması Gaming (986 - 2474, n=105, son 2 yıl) | |
| MSI GE66 Raider 10SFS | |
| Multi-Core | |
| Sınıf ortalaması Gaming (6460 - 28263, n=105, son 2 yıl) | |
| MSI GE66 Raider 10SFS | |
| HWBOT x265 Benchmark v2.2 - 4k Preset | |
| Sınıf ortalaması Gaming (11.5 - 44.4, n=105, son 2 yıl) | |
| MSI GE66 Raider 10SFS | |
| Eurocom Nightsky RX15 | |
| LibreOffice - 20 Documents To PDF | |
| MSI GE66 Raider 10SFS | |
| Sınıf ortalaması Gaming (33.2 - 88.8, n=105, son 2 yıl) | |
| R Benchmark 2.5 - Overall mean | |
| MSI GE66 Raider 10SFS | |
| Sınıf ortalaması Gaming (0.3439 - 0.759, n=106, son 2 yıl) | |
* ... daha küçük daha iyidir
Sistem performansı
Sistem performansı beklentileri tam olarak karşılar. Özellikle çok hızlı katı hal sürücüsü nedeniyle, işletim sistemi (Windows 10) çok hızlı yanıt verir.
| PCMark 10 - Score | |
| Sınıf ortalaması Gaming (5828 - 12414, n=93, son 2 yıl) | |
| MSI GE65 Raider 9SF-049US | |
| Eurocom Nightsky RX15 | |
| MSI GE66 Raider 10SFS | |
| Asus Strix Scar III G531GW | |
DPC Gecikmeleri
MSI gecikmeler konusunda biraz iyileşebilir. LatencyMon'a göre değerler yetersizdir. 4K YouTube videomuz ise mükemmel bir şekilde yayınlandı.
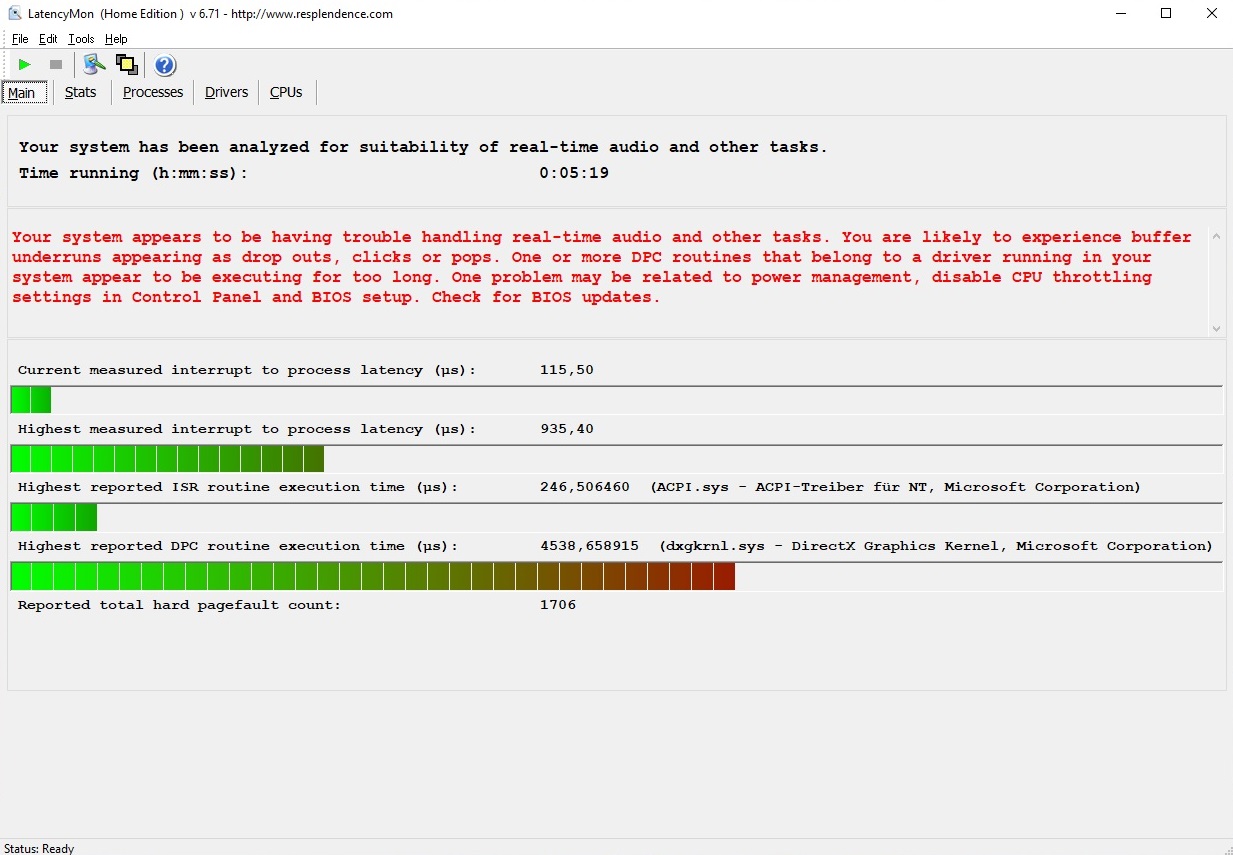
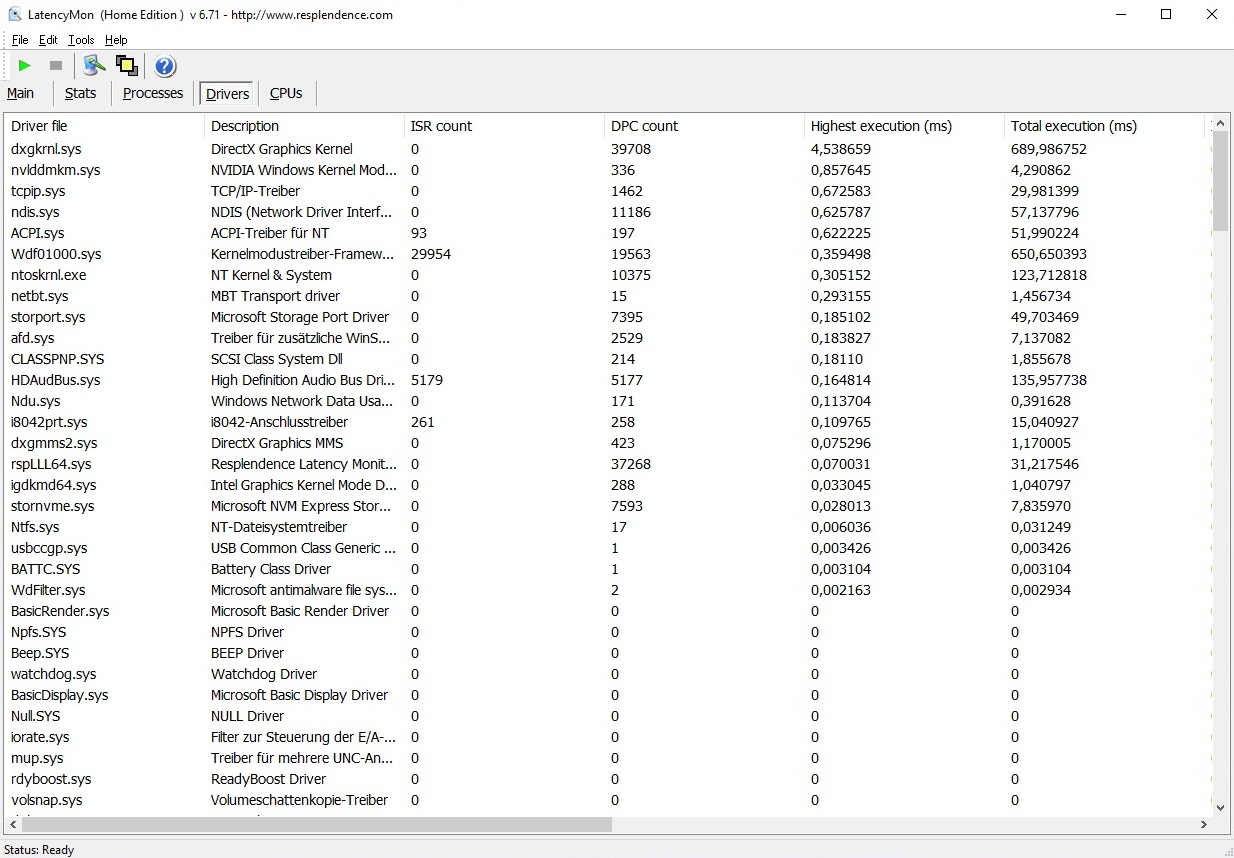
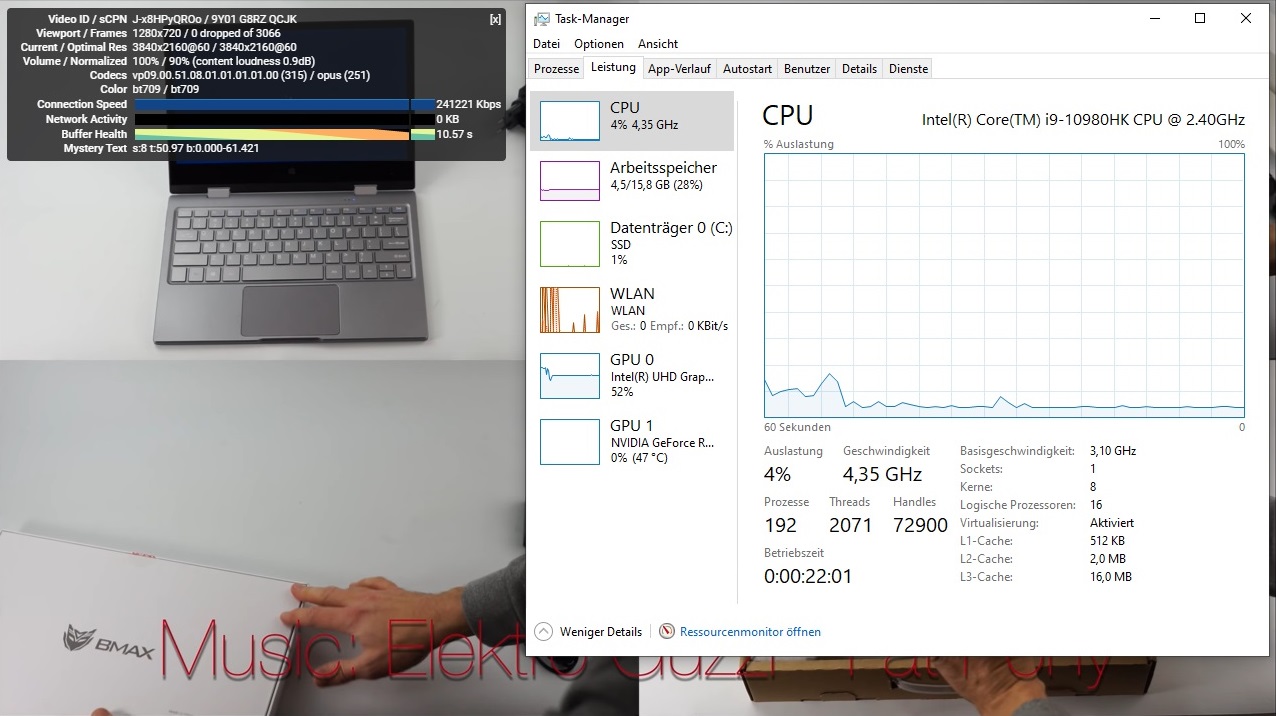
| DPC Latencies / LatencyMon - interrupt to process latency (max), Web, Youtube, Prime95 | |
| MSI GE66 Raider 10SFS | |
* ... daha küçük daha iyidir
Yığın Bellek
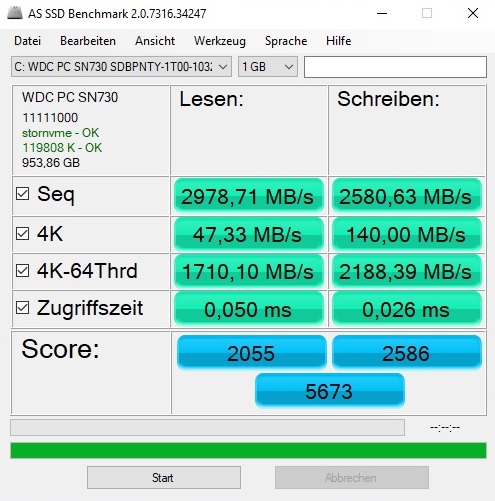
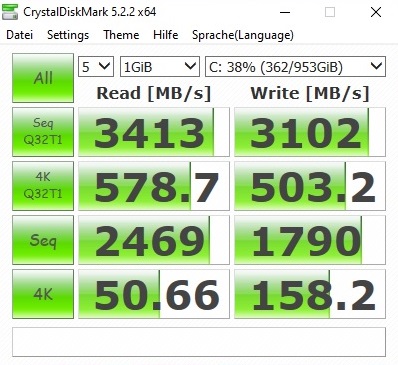
PCIe veya NVMe tabanlı SSD'ler artık oyun dizüstü bilgisayarları için neredeyse bir zorunluluktur. GE66'da yerleşik WDC'nin 1 TB sürücüsü, CrystalDiskMark'taki Samsung ve Intel yarışmasına karşı çok iyi bir performans sergileyebilir. İster okuma ister yazma, büyük veya küçük dosyalar: PC SN730 paketi yönetir.
| MSI GE66 Raider 10SFS WDC PC SN730 SDBPNTY-1T00 | MSI GE65 Raider 9SF-049US Samsung SSD PM981 MZVLB1T0HALR | Asus Strix Scar III G531GW Intel SSD 660p 1TB SSDPEKNW010T8 | Eurocom Nightsky RX15 Samsung SSD 970 Pro 512GB | |
|---|---|---|---|---|
| CrystalDiskMark 5.2 / 6 | -9% | -18% | -3% | |
| Write 4K (MB/s) | 158.2 | 125.7 -21% | 135 -15% | 153 -3% |
| Read 4K (MB/s) | 50.7 | 45.04 -11% | 54.9 8% | 60.5 19% |
| Write Seq (MB/s) | 1790 | 2361 32% | 1649 -8% | 1938 8% |
| Read Seq (MB/s) | 2469 | 1987 -20% | 1449 -41% | 1932 -22% |
| Write 4K Q32T1 (MB/s) | 503 | 407.1 -19% | 508 1% | 482.5 -4% |
| Read 4K Q32T1 (MB/s) | 579 | 537 -7% | 559 -3% | 594 3% |
| Write Seq Q32T1 (MB/s) | 3102 | 2398 -23% | 1759 -43% | 2324 -25% |
| Read Seq Q32T1 (MB/s) | 3413 | 3309 -3% | 1826 -46% | 3539 4% |

Continuous load read: DiskSpd Read Loop, Queue Depth 8
Grafik kartı
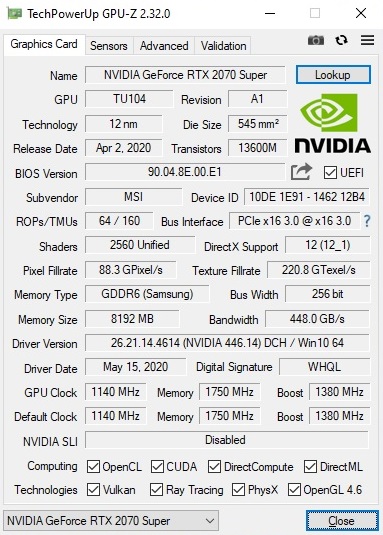
Şimdiye kadar test edilen "Süper" dizüstü bilgisayarların çoğu güç tasarruflu bir Max-Q çipine dayanırken, GE66 10SFS tam teşekküllü bir GeForce RTX 2070 Super ile birlikte geliyor. Eski standart modele kıyasla, Nvidia, diğer şeylerin yanı sıra gölgelendirici birimlerinin sayısını artırdı. Dolayısıyla, 2,304 yerine, belirli bir performans artı vaat eden 2.560 CUDA çekirdeği var. GDDR6 video belleği bir kez daha 8 GB boyutunda ve 256 bit arayüz üzerinden bağlanıyor.
| 3DMark 06 Standard Score | 43041 puan | |
| 3DMark Vantage P Result | 70601 puan | |
| 3DMark 11 Performance | 24989 puan | |
| 3DMark Cloud Gate Standard Score | 50695 puan | |
| 3DMark Fire Strike Score | 19884 puan | |
| 3DMark Time Spy Score | 8419 puan | |
Yardım | ||
Kıyaslama parkurunda GE66, biraz daha hızlı GPU'su sayesinde alanın en üstünde yer alıyor. Kıyaslama ve cihaza bağlı olarak, Süper varyantın öncüsü% 4 ila 30 arasındadır.
| 3DMark | |
| 1920x1080 Fire Strike Graphics | |
| Sınıf ortalaması Gaming (12242 - 62849, n=115, son 2 yıl) | |
| MSI GE66 Raider 10SFS | |
| MSI GE65 Raider 9SF-049US | |
| Eurocom Nightsky RX15 | |
| Asus Strix Scar III G531GW | |
| 2560x1440 Time Spy Graphics | |
| Sınıf ortalaması Gaming (5012 - 26212, n=115, son 2 yıl) | |
| MSI GE66 Raider 10SFS | |
| MSI GE65 Raider 9SF-049US | |
| Eurocom Nightsky RX15 | |
| Asus Strix Scar III G531GW | |
| 2560x1440 Port Royal Graphics | |
| Sınıf ortalaması Gaming (4395 - 17286, n=71, son 2 yıl) | |
| MSI GE66 Raider 10SFS | |
| MSI GE65 Raider 9SF-049US | |
| Eurocom Nightsky RX15 | |
| 3DMark 11 - 1280x720 Performance GPU | |
| Sınıf ortalaması Gaming (21841 - 80022, n=104, son 2 yıl) | |
| MSI GE66 Raider 10SFS | |
| Eurocom Nightsky RX15 | |
| MSI GE65 Raider 9SF-049US | |
| Asus Strix Scar III G531GW | |
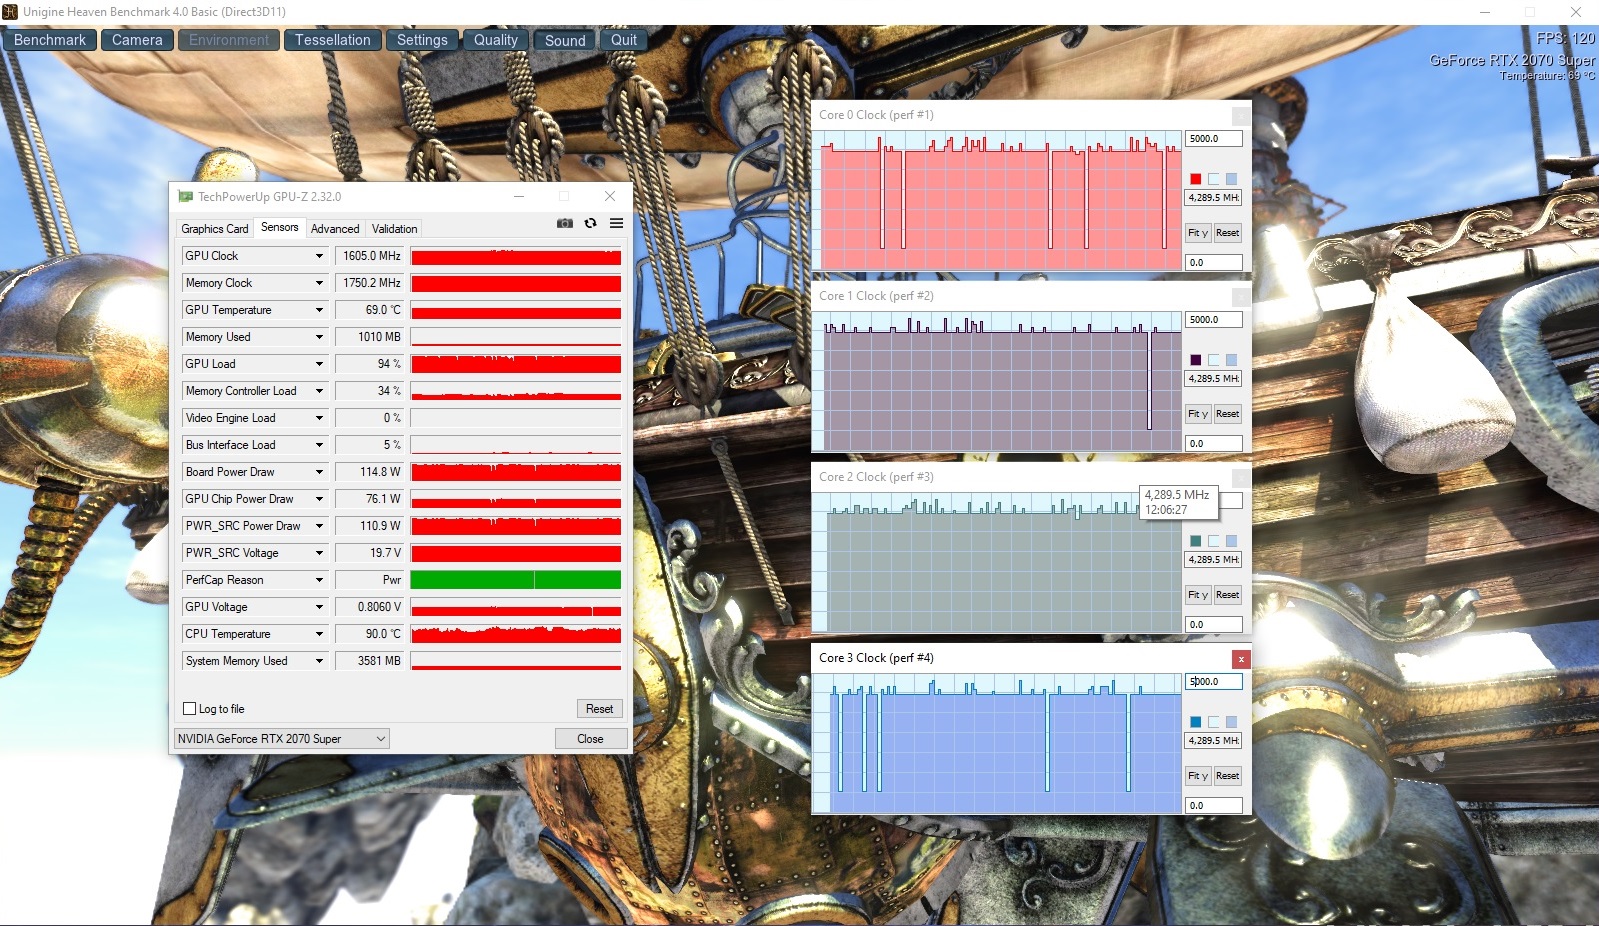
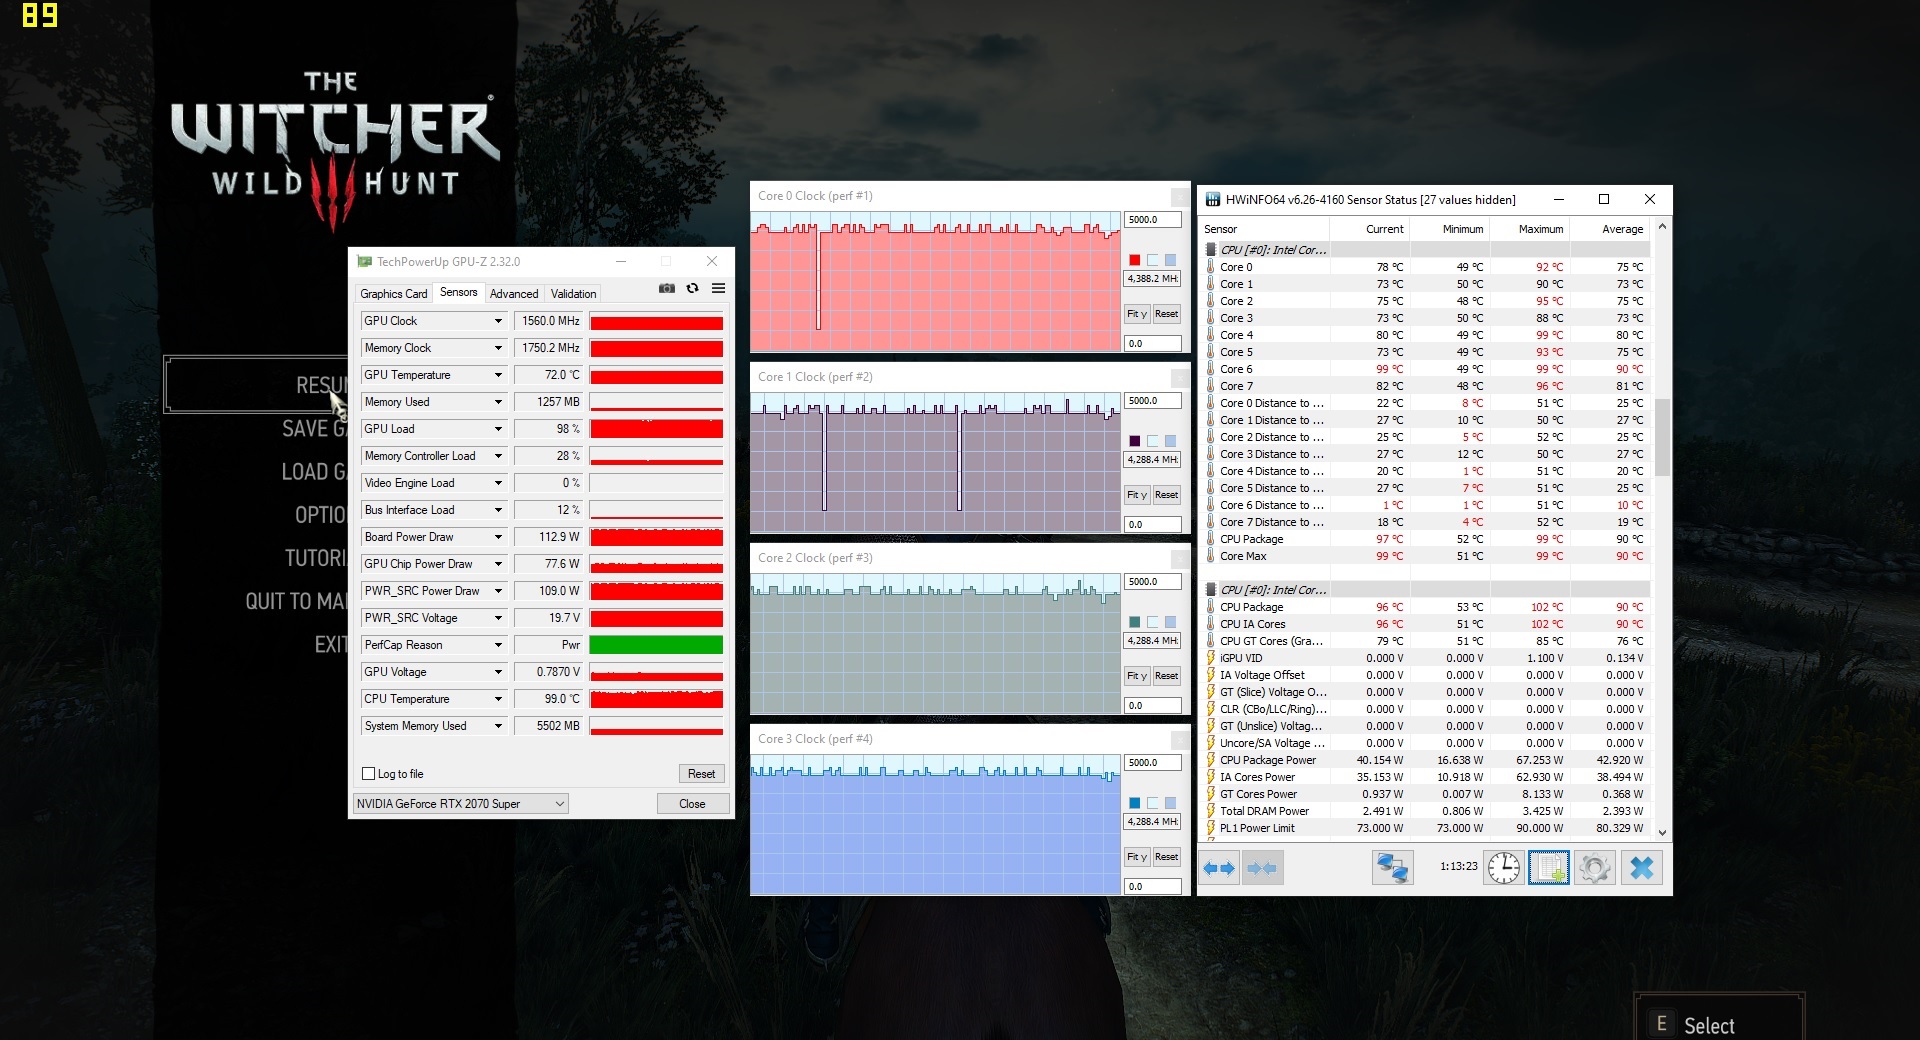
Aşağıdaki grafikte de görebileceğiniz gibi, 3D performansı zaman içinde oldukça sabit kalır. The Witcher 3 ile yapılan 60 dakikalık test sırasında hiçbir performans düşüşü veya benzeri yoktu. RTX 2070 Super'in çekirdek saat hızı ortalama 1.560 MHz seviyesinde (temel saat: 1.140 MHz).
Oyun Performansı
GE66 Raider, en son tüm oyunları yerel Full HD çözünürlükte (1920x1080) maksimum ayrıntıyla çalıştırmak için yeterince hızlıdır. Red Dead Redemption 2 gibi son derece zorlu oyunlar bile 40'tan fazla FPS ile görüntülenir.
| The Witcher 3 - 1920x1080 Ultra Graphics & Postprocessing (HBAO+) | |
| Sınıf ortalaması Gaming (104.7 - 240, n=7, son 2 yıl) | |
| MSI GE66 Raider 10SFS | |
| Eurocom Nightsky RX15 | |
| MSI GE65 Raider 9SF-049US | |
| Asus Strix Scar III G531GW | |
2560x1440 piksel ile RTX 2070 Super'in genellikle sorunu olmaz. Yalnızca 4K aralığında sıkılaşır, yani 3840x2160 piksel kullanırken. Genel olarak, RTX 2070'ten performans sıçraması oyunlarda ölçülebilir, ancak her zaman fark edilmez.
| düşük | orta | yüksek | ultra | QHD | 4K | |
|---|---|---|---|---|---|---|
| GTA V (2015) | 182 | 177 | 163 | 94 | ||
| The Witcher 3 (2015) | 268 | 161 | 85.1 | 57.6 | ||
| Dota 2 Reborn (2015) | 155 | 141 | 133 | 126 | ||
| Fortnite (2018) | 164 | 156 | 129 | 93.4 | 47.9 | |
| Final Fantasy XV Benchmark (2018) | 121 | 91.1 | 37.7 | |||
| Kingdom Come: Deliverance (2018) | 146 | 119 | 82.5 | 59.7 | 31.1 | |
| X-Plane 11.11 (2018) | 117 | 103 | 87 | |||
| Monster Hunter World (2018) | 130 | 120 | 98.9 | 63.9 | 32.1 | |
| Shadow of the Tomb Raider (2018) | 123 | 118 | 108 | 73 | 37 | |
| Assassin´s Creed Odyssey (2018) | 104 | 90 | 63 | 56 | 36 | |
| Hitman 2 (2018) | 98.8 | 89.7 | 82.5 | 78.8 | 46.4 | |
| Battlefield V (2018) | 166 | 152 | 141 | 110 | 62.7 | |
| Darksiders III (2018) | 166 | 141 | 127 | 88.3 | 44 | |
| Just Cause 4 (2018) | 162 | 119 | 105 | 75 | 41.2 | |
| Apex Legends (2019) | 144 | 144 | 144 | 121 | 66.6 | |
| Far Cry New Dawn (2019) | 111 | 104 | 94 | 89 | 50 | |
| Metro Exodus (2019) | 112 | 82.7 | 65.5 | 54.4 | 31.9 | |
| Dirt Rally 2.0 (2019) | 211 | 178 | 97.7 | 72.4 | ||
| The Division 2 (2019) | 150 | 124 | 87 | 61 | 32 | |
| Anno 1800 (2019) | 116 | 90.4 | 51 | 44 | 23.9 | |
| Rage 2 (2019) | 143 | 121 | 119 | 74.2 | 36.7 | |
| F1 2019 (2019) | 203 | 178 | 170 | 116 | 73 | |
| Control (2019) | 107 | 80.8 | 52.6 | 25.6 | ||
| Borderlands 3 (2019) | 127 | 92.1 | 70.6 | 49.8 | 26.8 | |
| FIFA 20 (2019) | 280 | 267 | 264 | 262 | 211 | |
| Ghost Recon Breakpoint (2019) | 115 | 101 | 75 | 55 | 32 | |
| GRID 2019 (2019) | 160 | 119 | 80.7 | 70.2 | 47.2 | |
| Call of Duty Modern Warfare 2019 (2019) | 141 | 134 | 107 | 75.3 | 41.6 | |
| Need for Speed Heat (2019) | 105 | 97 | 92.4 | 81.7 | 48.1 | |
| Star Wars Jedi Fallen Order (2019) | 119 | 114 | 108 | 84 | 42.5 | |
| Red Dead Redemption 2 (2019) | 110 | 73.1 | 47.6 | 38.1 | 24.8 | |
| Escape from Tarkov (2020) | 121 | 121 | 121 | 81 | 41.4 | |
| Hunt Showdown (2020) | 136 | 113 | 74 | 34.1 | ||
| Doom Eternal (2020) | 198 | 176 | 170 | 118 | 61.6 | |
| Gears Tactics (2020) | 215 | 144 | 103 | 64.5 | 33.3 |
Emisyonları
Gürültü emisyonları
GE66, yüksek gürültü seviyesi için eleştiri almak zorundadır. Sistem yerlerde sessizce çalışmasına rağmen, her zaman fanlar rölantideyken ağır bir şekilde (40 dB'nin üzerinde) çalışmaya başlar. Yük altında 53 ila 55 dB de bir ifadedir ve neredeyse sizi kulaklık kullanmaya zorlar. Bununla birlikte, MSI'nin savunmasında, Asus Strix G531GW ve Eurocom Nightsky RX15, 3D modunda benzer şekilde yüksek oluyor.
Ses yüksekliği
| Boşta |
| 30 / 35 / 44 dB |
| Çalışırken |
| 53 / 55 dB |
 | ||
30 dB sessiz 40 dB(A) duyulabilirlik 50 dB(A) gürültülü |
||
min: | ||
| MSI GE66 Raider 10SFS i9-10980HK, GeForce RTX 2070 Super Mobile | MSI GE65 Raider 9SF-049US i9-9880H, GeForce RTX 2070 Mobile | Asus Strix Scar III G531GW i9-9880H, GeForce RTX 2070 Mobile | Eurocom Nightsky RX15 i9-9980HK, GeForce RTX 2070 Mobile | Sınıf ortalaması Gaming | |
|---|---|---|---|---|---|
| Noise | 7% | 1% | 8% | 18% | |
| kapalı / ortam * (dB) | 30 | 28.8 4% | 29 3% | 28.2 6% | 24.1 ? 20% |
| Idle Minimum * (dB) | 30 | 33 -10% | 30 -0% | 28.2 6% | 26 ? 13% |
| Idle Average * (dB) | 35 | 33 6% | 37 -6% | 28.2 19% | 27.4 ? 22% |
| Idle Maximum * (dB) | 44 | 33.1 25% | 39 11% | 31.7 28% | 30.1 ? 32% |
| Load Average * (dB) | 53 | 38 28% | 54 -2% | 53.7 -1% | 43.6 ? 18% |
| Witcher 3 ultra * (dB) | 53 | 52.9 -0% | 54 -2% | 53.7 -1% | |
| Load Maximum * (dB) | 55 | 57.8 -5% | 54 2% | 53.7 2% | 54.2 ? 1% |
* ... daha küçük daha iyidir
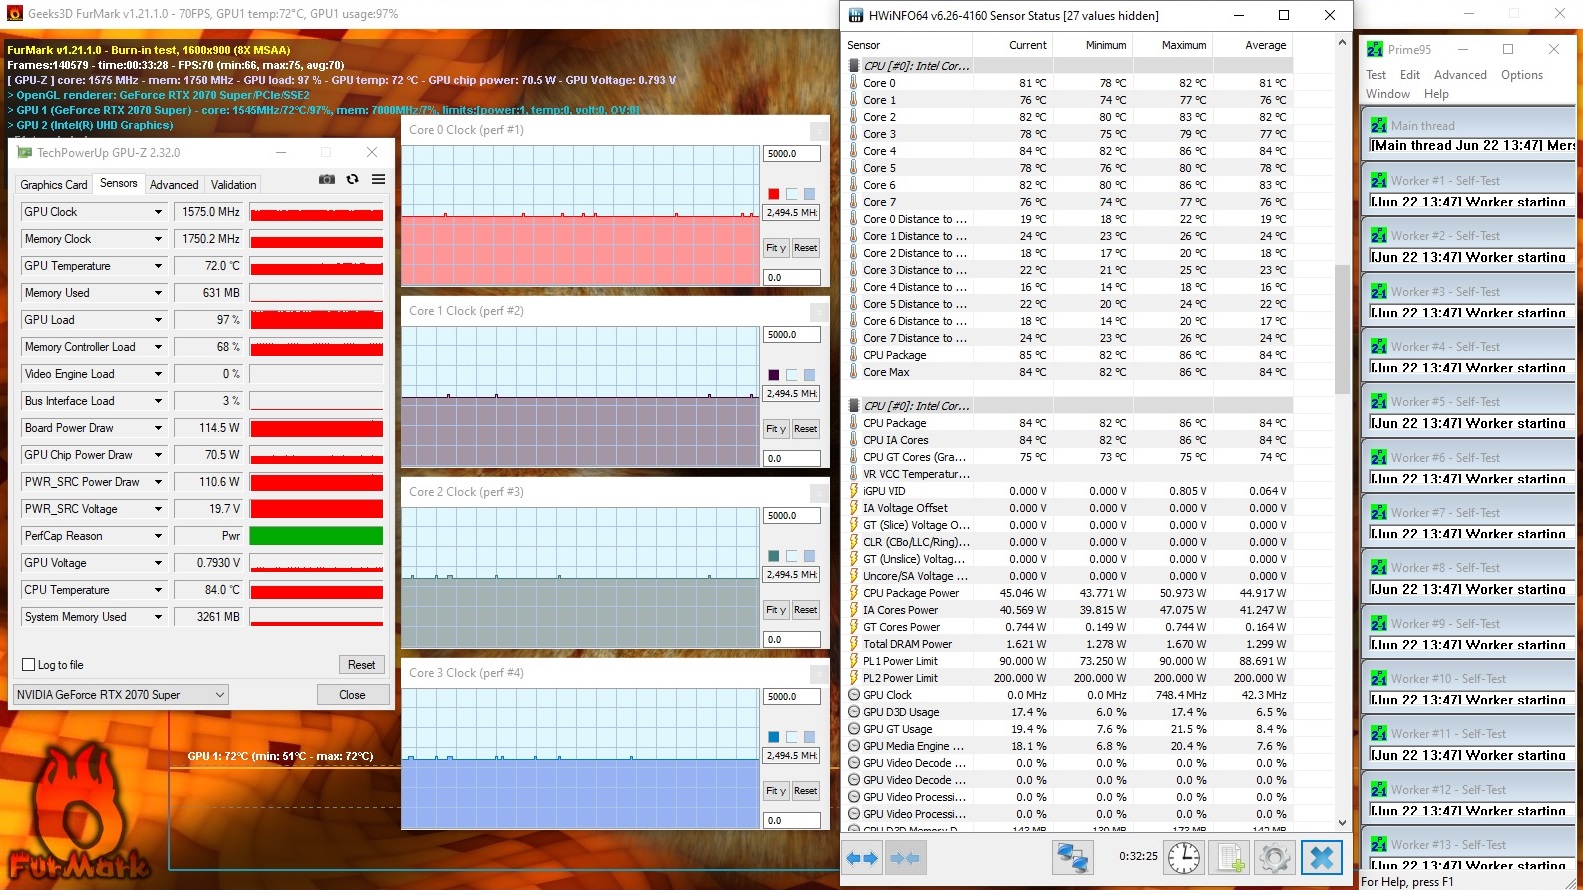
Temperature
The word "unspectacular" fits the temperature development of the GE66. Both in the stress test with Furmark and Prime95 and in The Witcher 3 test, the CPU and GPU made themselves comfortable at around 70 to 80 °C (with short deviations to the top). The case doesn't get excessively hot either, although a maximum of 52 °C on the case bottom tends to advise against gaming sessions on the lap. The wrist-rest area stays quite cool in any situation (less than 35 °C).
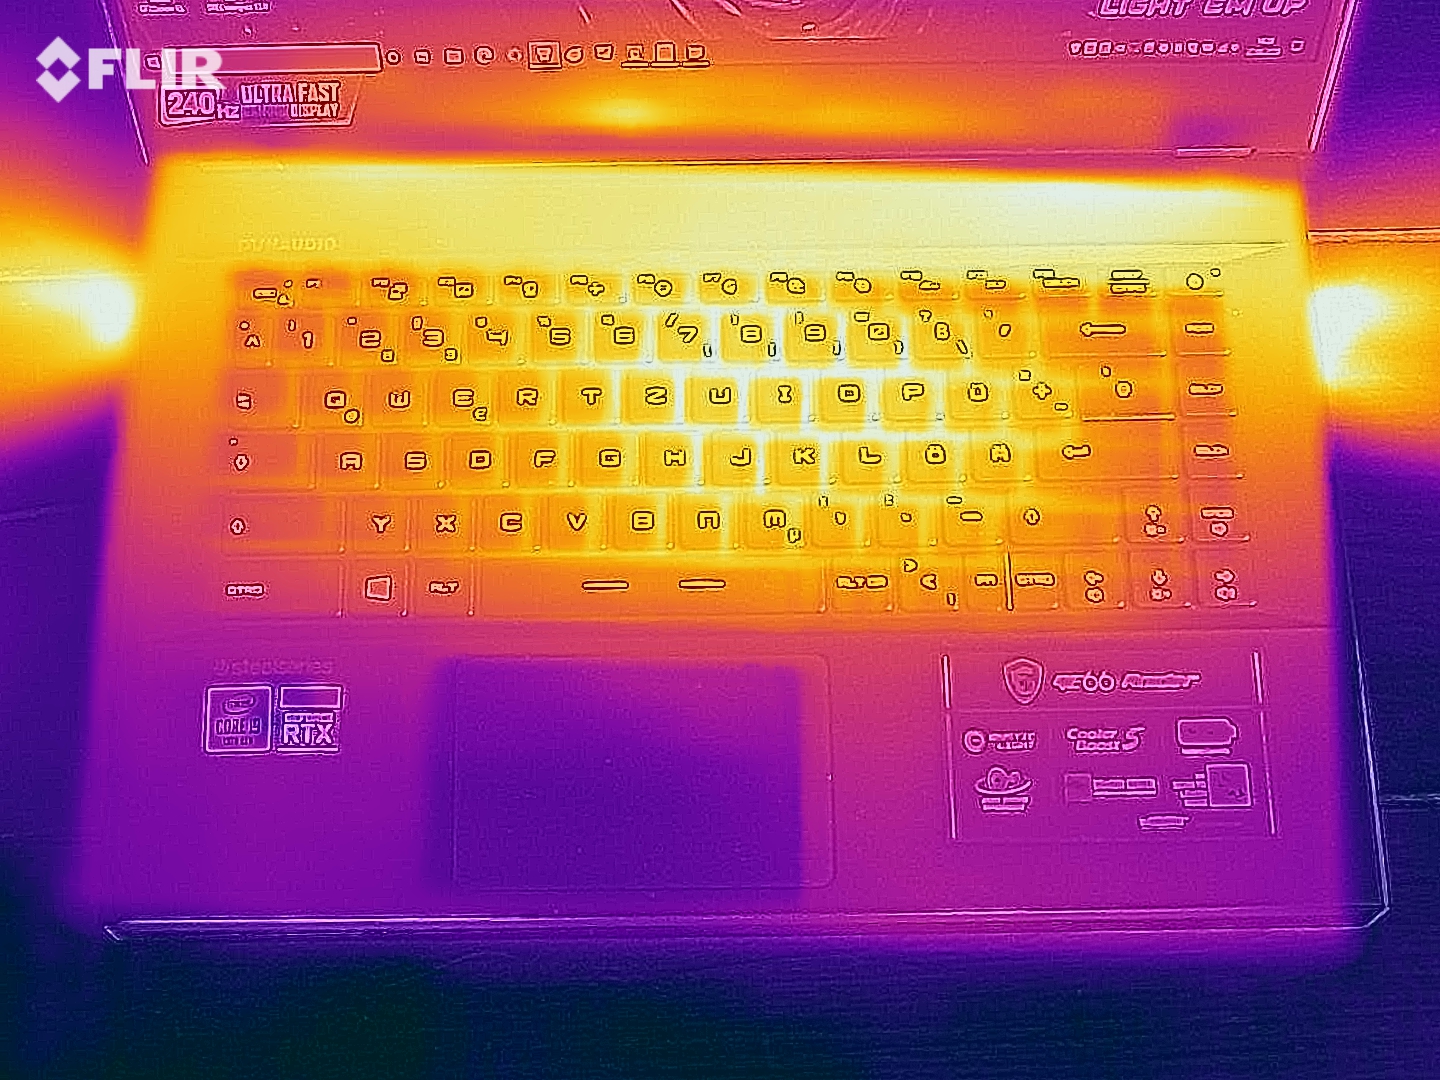
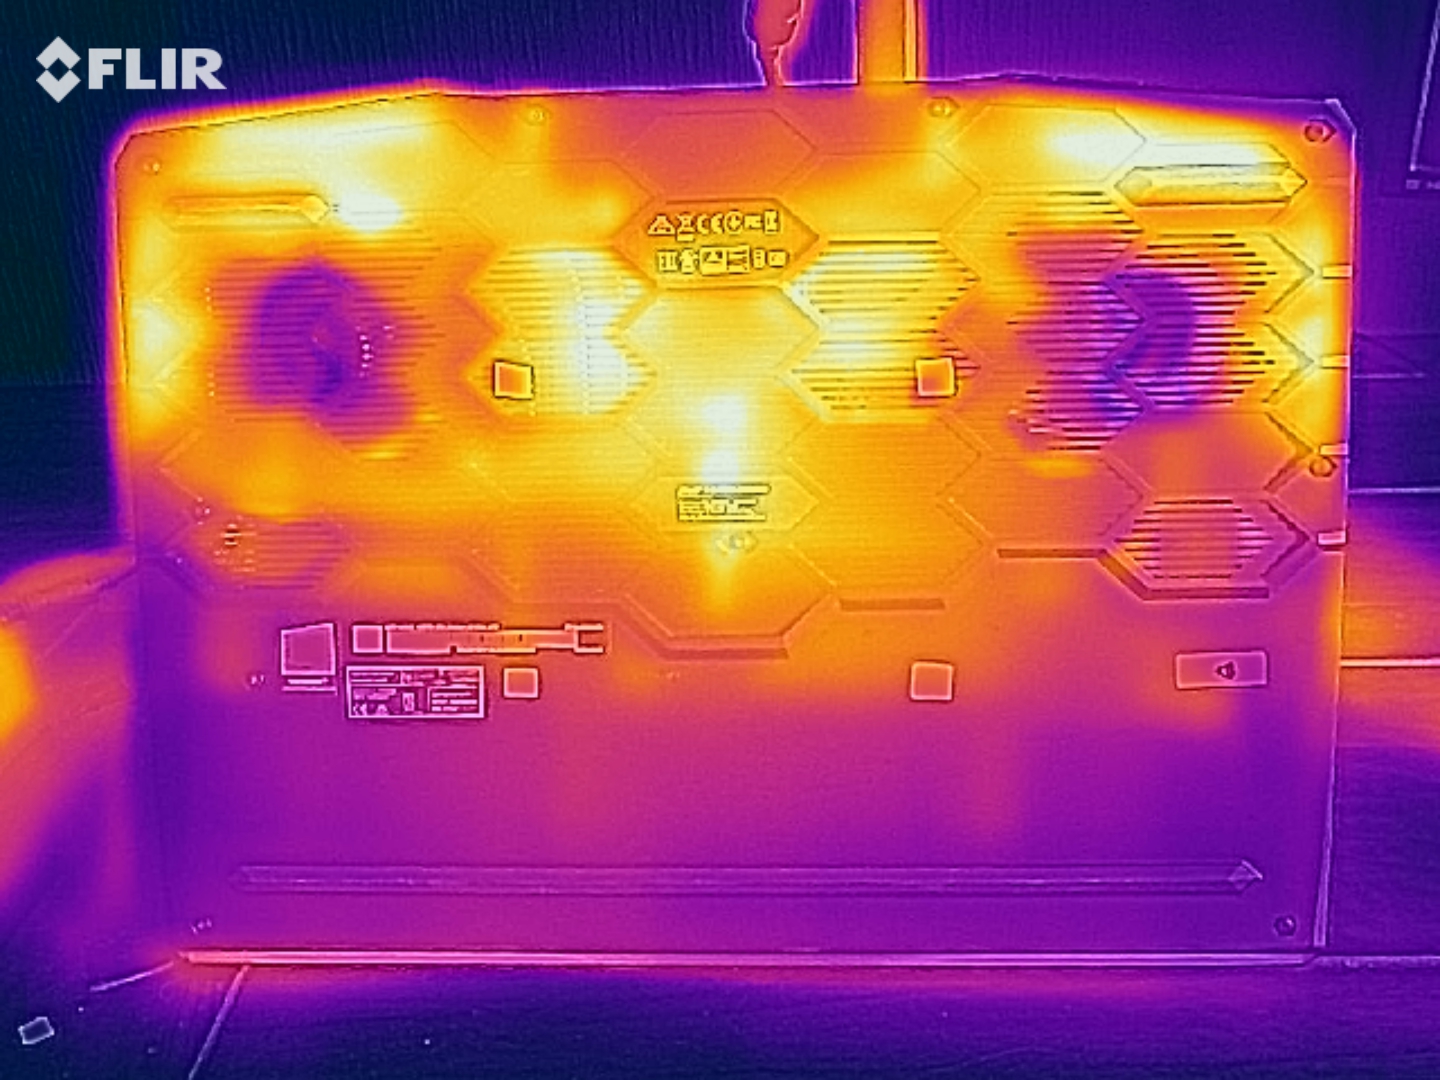
(-) Üst taraftaki maksimum sıcaklık, 40.4 °C / 105 F ortalamasına kıyasla 49 °C / 120 F'dir. , Gaming sınıfı için 21.2 ile 68.8 °C arasında değişir.
(-) Alt kısım, 43.2 °C / 110 F ortalamasına kıyasla maksimum 52 °C / 126 F'ye kadar ısınır
(+) Boşta kullanımda, üst tarafın ortalama sıcaklığı 29.1 °C / 84 F olup, cihazın 33.9 °C / 93 F.
(-) The Witcher 3 oynarken, üst tarafın ortalama sıcaklığı 41.1 °C / 106 F olup, cihazın 33.9 °C / 93 F.
(+) Avuç içi dayanakları ve dokunmatik yüzey maksimum (34 °C / 93.2 F) cilt sıcaklığına ulaşıyor ve bu nedenle sıcak değil.
(-) Benzer cihazların avuç içi dayanağı alanının ortalama sıcaklığı 28.8 °C / 83.8 F (-5.2 °C / -9.4 F) idi.
| MSI GE66 Raider 10SFS i9-10980HK, GeForce RTX 2070 Super Mobile | MSI GE65 Raider 9SF-049US i9-9880H, GeForce RTX 2070 Mobile | Asus Strix Scar III G531GW i9-9880H, GeForce RTX 2070 Mobile | Eurocom Nightsky RX15 i9-9980HK, GeForce RTX 2070 Mobile | Sınıf ortalaması Gaming | |
|---|---|---|---|---|---|
| Heat | -3% | -0% | -4% | 3% | |
| Maximum Upper Side * (°C) | 49 | 45 8% | 51 -4% | 40.2 18% | 45.2 ? 8% |
| Maximum Bottom * (°C) | 52 | 53 -2% | 49 6% | 53 -2% | 48.1 ? 7% |
| Idle Upper Side * (°C) | 30 | 31.2 -4% | 30 -0% | 34.2 -14% | 31 ? -3% |
| Idle Bottom * (°C) | 34 | 39 -15% | 35 -3% | 39.6 -16% | 34.2 ? -1% |
* ... daha küçük daha iyidir
Speakers
The sound quality is somewhat disappointing considering the laptop's price. Even cheap external solutions should provide a better sound. Our audio analysis sees room for improvement in almost every segment (lows, mids, highs). Especially at higher volumes, the speakers, which are placed behind the side surfaces, tend to fray and produce a tinny sound image.
MSI GE66 Raider 10SFS ses analizi
(+) | hoparlörler nispeten yüksek sesle çalabilir (84 dB)
Bas 100 - 315Hz
(-) | neredeyse hiç bas yok - ortalama olarak medyandan 32.4% daha düşük
(+) | bas doğrusaldır (5.9% delta ile önceki frekans)
Ortalar 400 - 2000 Hz
(±) | daha yüksek ortalar - ortalama olarak medyandan 7.4% daha yüksek
(±) | Ortaların doğrusallığı ortalamadır (8.9% delta - önceki frekans)
Yüksekler 2 - 16 kHz
(±) | daha yüksek en yüksekler - ortalama olarak medyandan 5.3% daha yüksek
(±) | Yükseklerin doğrusallığı ortalamadır (8.9% delta - önceki frekans)
Toplam 100 - 16.000 Hz
(±) | Genel sesin doğrusallığı ortalamadır (26.7% ortancaya göre fark)
Aynı sınıfla karşılaştırıldığında
» Bu sınıftaki tüm test edilen cihazların %93%'si daha iyi, 1% benzer, 6% daha kötüydü
» En iyisinin deltası 6% idi, ortalama 18% idi, en kötüsü 132% idi
Test edilen tüm cihazlarla karşılaştırıldığında
» Test edilen tüm cihazların %82'si daha iyi, 4 benzer, % 14 daha kötüydü
» En iyisinin deltası 4% idi, ortalama 23% idi, en kötüsü 134% idi
MSI GE65 Raider 9SF-049US ses analizi
(+) | hoparlörler nispeten yüksek sesle çalabilir (93 dB)
Bas 100 - 315Hz
(-) | neredeyse hiç bas yok - ortalama olarak medyandan 20.5% daha düşük
(±) | Bas doğrusallığı ortalamadır (8.8% delta - önceki frekans)
Ortalar 400 - 2000 Hz
(+) | dengeli ortalar - medyandan yalnızca 3.3% uzakta
(+) | orta frekanslar doğrusaldır (4.6% deltadan önceki frekansa)
Yüksekler 2 - 16 kHz
(+) | dengeli yüksekler - medyandan yalnızca 1.4% uzakta
(+) | yüksekler doğrusaldır (5% deltadan önceki frekansa)
Toplam 100 - 16.000 Hz
(±) | Genel sesin doğrusallığı ortalamadır (15.6% ortancaya göre fark)
Aynı sınıfla karşılaştırıldığında
» Bu sınıftaki tüm test edilen cihazların %36%'si daha iyi, 6% benzer, 58% daha kötüydü
» En iyisinin deltası 6% idi, ortalama 18% idi, en kötüsü 132% idi
Test edilen tüm cihazlarla karşılaştırıldığında
» Test edilen tüm cihazların %23'si daha iyi, 5 benzer, % 72 daha kötüydü
» En iyisinin deltası 4% idi, ortalama 23% idi, en kötüsü 134% idi
Power management
Power consumption
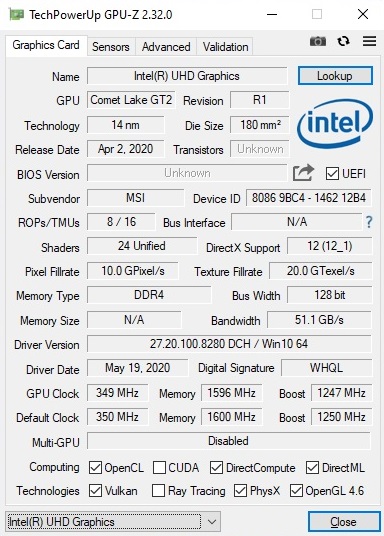
The graphics switching ensures low power consumption while idling. With 6 to 25 watts, the GE66 is more efficient than the competition, which in part exceeds 30 watts. Under load, the RTX-2070 laptops are closer together. Here the MSI needs between 108 and 280 watts. Thus, the power supply unit is sufficient.
| Kapalı / Bekleme modu | |
| Boşta | |
| Çalışırken |
|
Key:
min: | |
| MSI GE66 Raider 10SFS i9-10980HK, GeForce RTX 2070 Super Mobile | MSI GE65 Raider 9SF-049US i9-9880H, GeForce RTX 2070 Mobile | Asus Strix Scar III G531GW i9-9880H, GeForce RTX 2070 Mobile | Eurocom Nightsky RX15 i9-9980HK, GeForce RTX 2070 Mobile | Sınıf ortalaması Gaming | |
|---|---|---|---|---|---|
| Power Consumption | -26% | -95% | -34% | -29% | |
| Idle Minimum * (Watt) | 6 | 15 -150% | 29 -383% | 12.6 -110% | 13 ? -117% |
| Idle Average * (Watt) | 14 | 18.5 -32% | 32 -129% | 21.4 -53% | 19 ? -36% |
| Idle Maximum * (Watt) | 25 | 20.2 19% | 37 -48% | 34.4 -38% | 24.6 ? 2% |
| Load Average * (Watt) | 108 | 110.9 -3% | 157 -45% | 123.2 -14% | 110.7 ? -3% |
| Witcher 3 ultra * (Watt) | 195 | 187.3 4% | 173 11% | 192.4 1% | |
| Load Maximum * (Watt) | 280 | 260 7% | 217 22% | 246.6 12% | 259 ? 7% |
* ... daha küçük daha iyidir
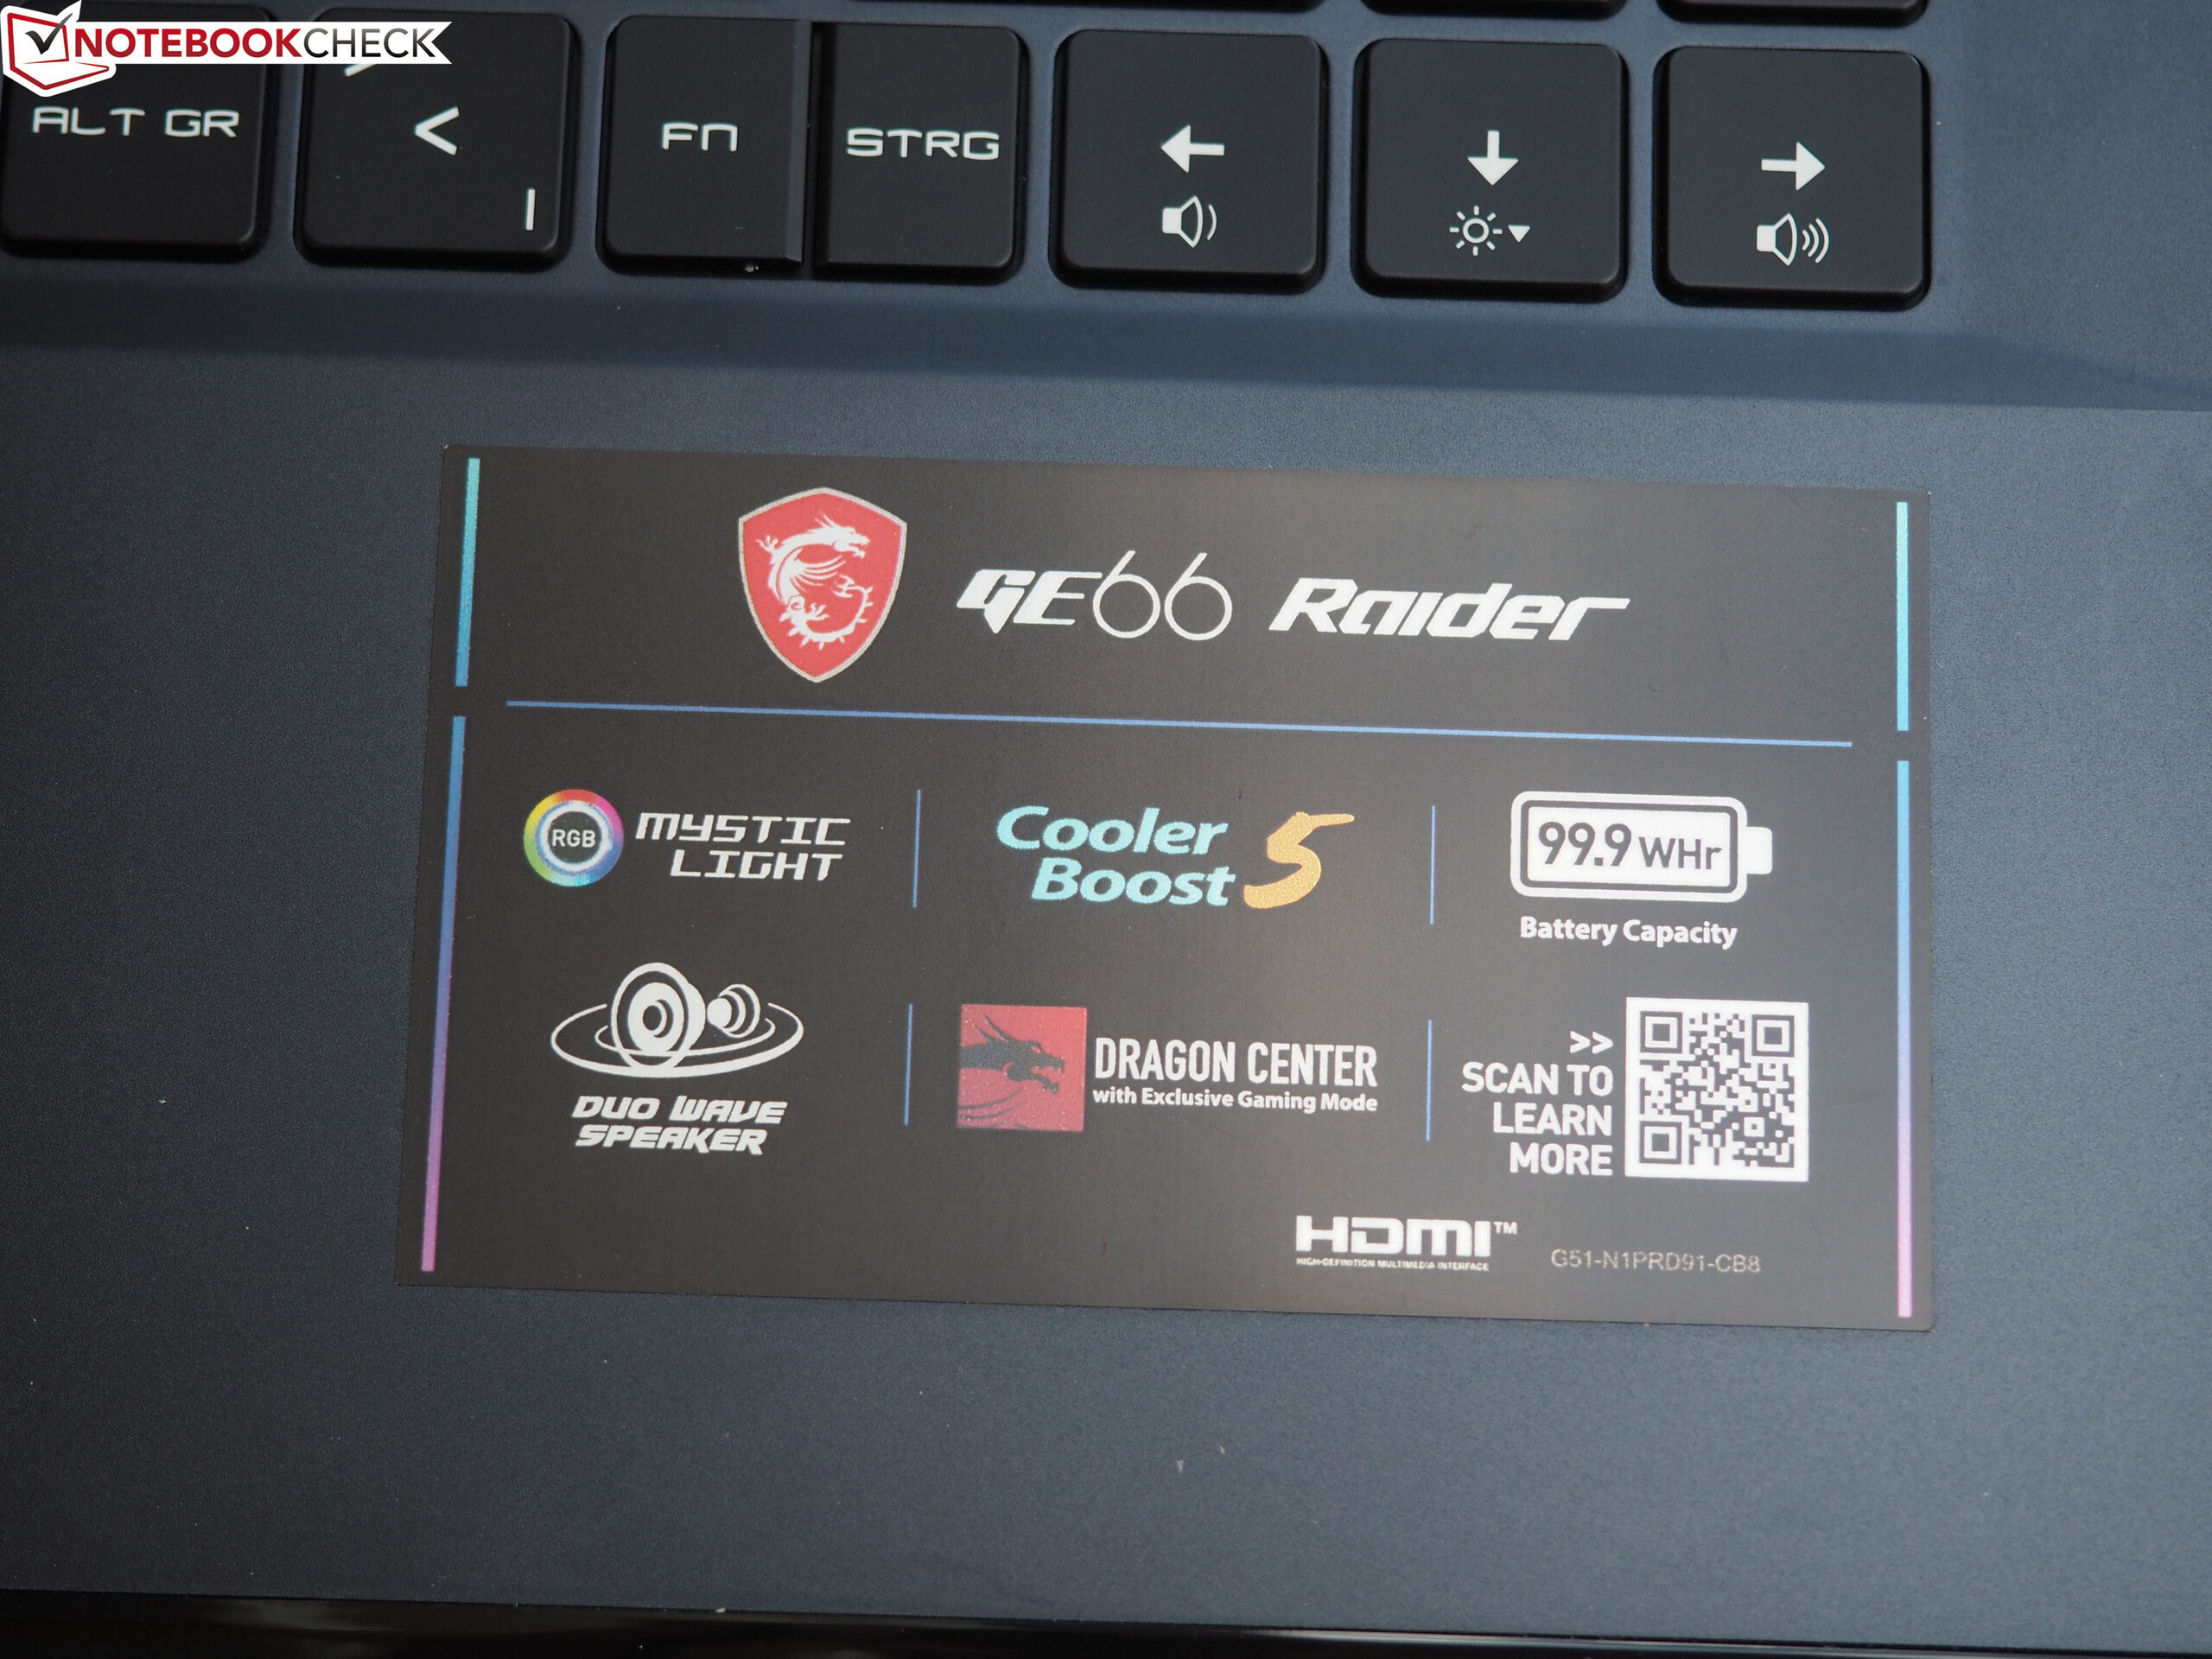
Battery life
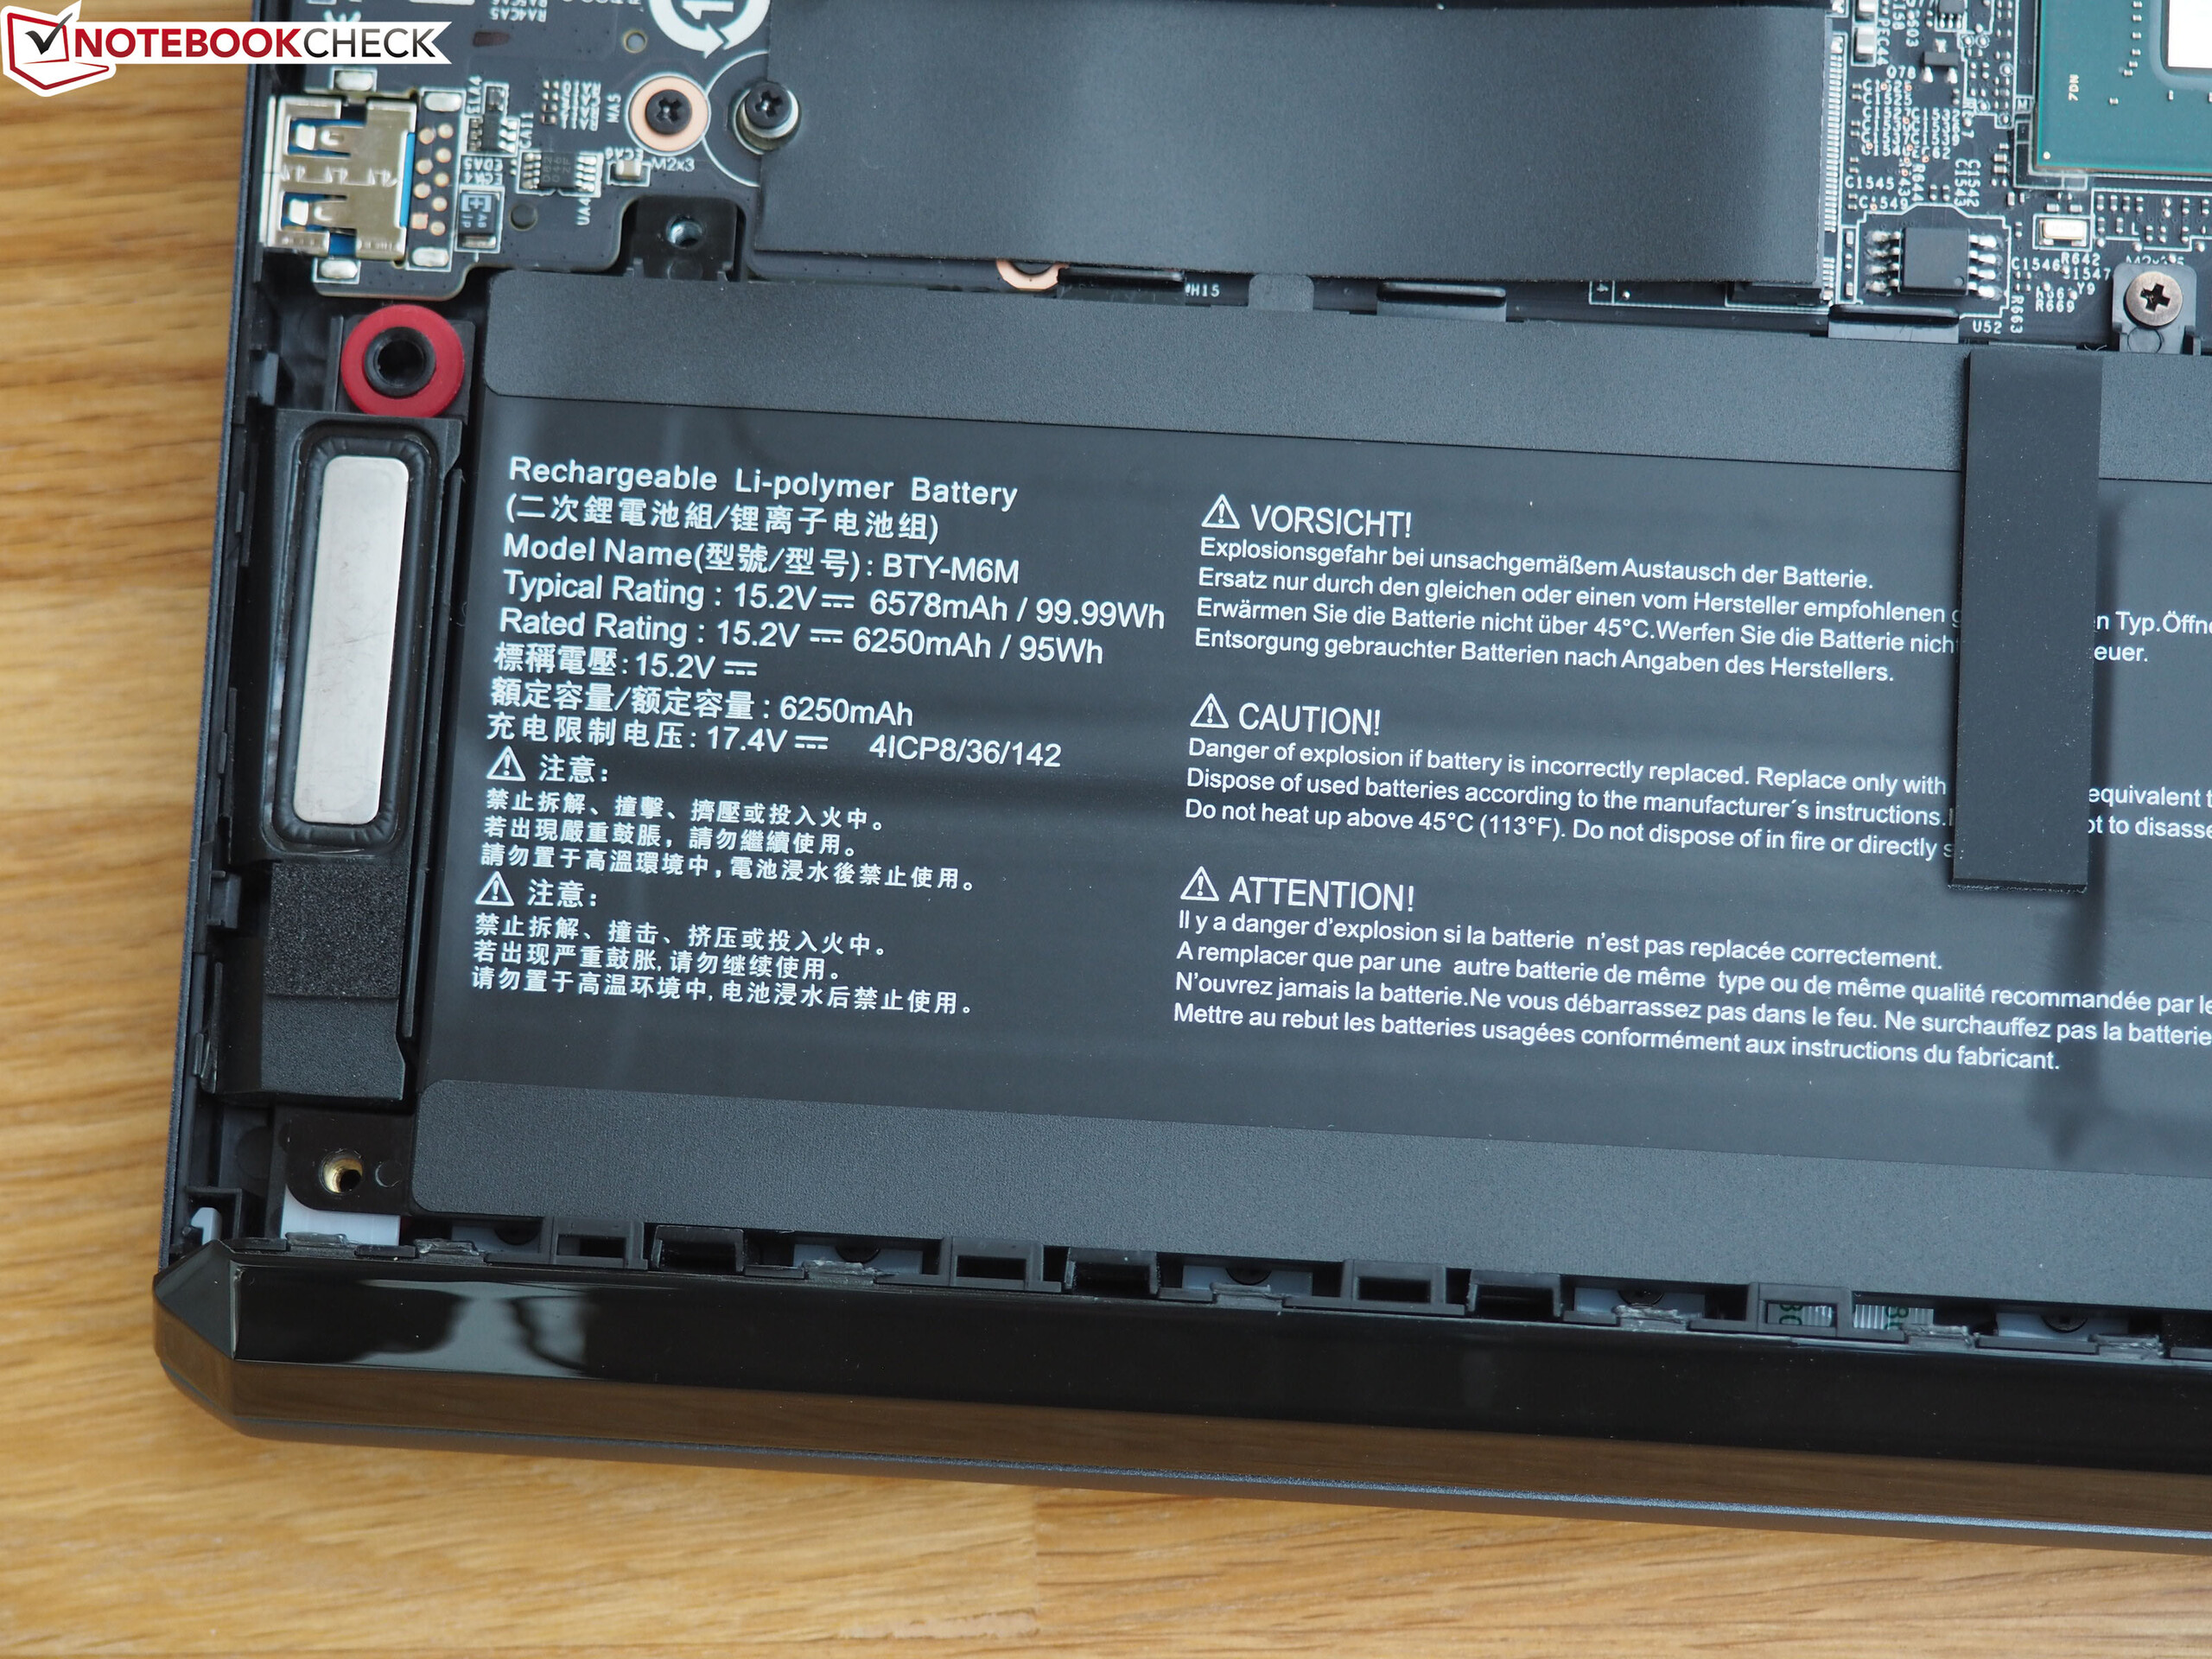
One of the biggest highlights of the laptop is the gigantic battery. With 99.9 Wh, the opponents can't even begin to compete (51 to 66 Wh). Despite the Optimus technology and the ample battery capacity, the GE66 is not an ultra long runner, though. More than 7.5 hours can hardly be squeezed out of the device. The system lasted about 6 hours without a power supply in our WLAN test with medium brightness. The 3D performance drops by a good 40% in battery mode (tested with The Witcher 3) - a typical value.
| MSI GE66 Raider 10SFS i9-10980HK, GeForce RTX 2070 Super Mobile, 99.99 Wh | MSI GE65 Raider 9SF-049US i9-9880H, GeForce RTX 2070 Mobile, 51 Wh | Asus Strix Scar III G531GW i9-9880H, GeForce RTX 2070 Mobile, 66 Wh | Eurocom Nightsky RX15 i9-9980HK, GeForce RTX 2070 Mobile, 62 Wh | Sınıf ortalaması Gaming | |
|---|---|---|---|---|---|
| Pil Çalışma Süresi | -42% | -34% | -44% | 3% | |
| Reader / Idle (h) | 7.6 | 6.2 -18% | 5.5 -28% | 8.27 ? 9% | |
| WiFi v1.3 (h) | 6.1 | 3.6 -41% | 3 -51% | 3.4 -44% | 7.11 ? 17% |
| Load (h) | 1.8 | 0.6 -67% | 1.4 -22% | 1.502 ? -17% |
Artılar
Eksiler
Verdict
With the GE66 Raider 10SFS, MSI offers a compact and very high-performance 15-inch gamer that not only appeals to lighting fans (LED strips on the front) but also supporters of fast displays.
The 240 Hz screen could be a bit brighter, but it otherwise convinces in almost all categories. You also don't have to worry about 3D power. The Super version of the GeForce RTX 2070 brings high levels of performance. Further selling points are the 99 Wh battery, the ample connectivity (whereby there is unfortunately no Thunderbolt 3 port), and the excellent chassis.
It's not quite enough for a "Very Good" as an overall mark due to the steep noise development, the modest webcam, and the poor speakers.
MSI GE66 Raider 10SFS
- 07/05/2020 v7 (old)
Florian Glaser
Price comparison
