MSI Raider GE68 HX 13VF dizüstü bilgisayar incelemesi: Tam bir tasarım değişikliği

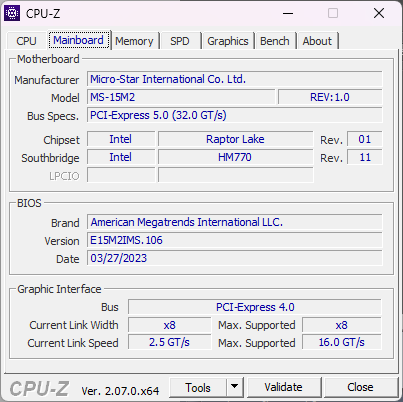
GE68HX, hem yenilenmiş iç aksamı hem de yeni kasa tasarımıyla geçen yılki GE67HX'in yerini alıyor. Eski 12. nesil Alder Lake-HX ve Ampere seçeneklerinin yerini alması beklenen 13. nesil Raptor Lake-HX CPU'lar ve Nvidia Ada Lovelace GPU'ların yanı sıra, yeni model ayrıca azalan 16:9 15.6 inç en boy oranından daha büyük bir 16:10 16 inç ekran boyutu sunuyor.
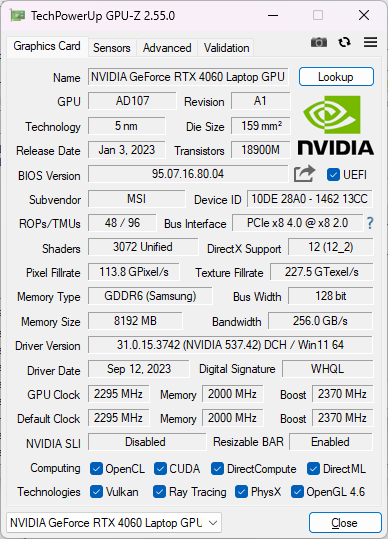
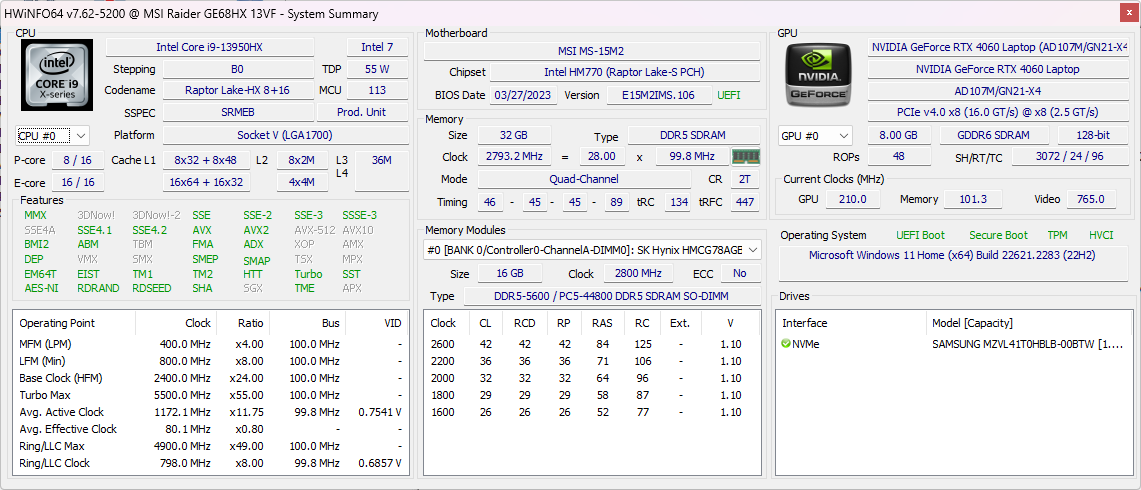
İnceleme ünitemiz Core i7-13950HX, 140 W GeForce RTX 4060 ve 1080p 144 Hz IPS ekranlı temel yapılandırma olup yaklaşık 1700 USD veya indirimdeyse 1300 USD'ye satılmaktadır. Daha üst seviye SKU'lar arasında Core i9-13980HX, RTX 4090 ve 1440p 240 Hz ekran 3500 doların üzerindedir.
GE68HX'in rakipleri arasında GE68HX gibi diğer üst düzey 16 inç oyun dizüstü bilgisayarları yer alıyor HP Omen 16,Alienware m16 R1, Lenovo Legion Slim 7i 16 Gen 8veya Asus ROG Zephyrus M16.
Daha fazla MSI incelemesi:
Karşılaştırmalı olarak olası rakipler
Derecelendirme | Tarih | Modeli | Ağırlık | Yükseklik | Boyut | Çözünürlük | Fiyat |
|---|---|---|---|---|---|---|---|
| 86.9 % v7 (old) | 10/2023 | MSI Raider GE68HX 13VF i9-13950HX, GeForce RTX 4060 Laptop GPU | 2.7 kg | 27.9 mm | 16.00" | 1900x1200 | |
| 87.7 % v7 (old) | MSI GE67 HX 12UGS i7-12800HX, GeForce RTX 3070 Ti Laptop GPU | 2.5 kg | 23.4 mm | 15.60" | 1920x1080 | ||
| 86.6 % v7 (old) | 09/2023 | HP Omen 16-xf0376ng R7 7840HS, GeForce RTX 4070 Laptop GPU | 2.4 kg | 23.5 mm | 16.10" | 1920x1080 | |
| 89.2 % v7 (old) | 09/2023 | Alienware m16 R1 AMD R9 7845HX, GeForce RTX 4080 Laptop GPU | 3.1 kg | 25.4 mm | 16.00" | 2560x1600 | |
| 90 % v7 (old) | 09/2023 | Lenovo Legion Slim 7i 16 Gen 8 i9-13900H, GeForce RTX 4070 Laptop GPU | 2.1 kg | 19.9 mm | 16.00" | 2560x1600 | |
| 89.4 % v7 (old) | 02/2023 | Asus ROG Zephyrus M16 GU604VY-NM042X i9-13900H, GeForce RTX 4090 Laptop GPU | 2.3 kg | 22.9 mm | 16.00" | 2560x1600 |
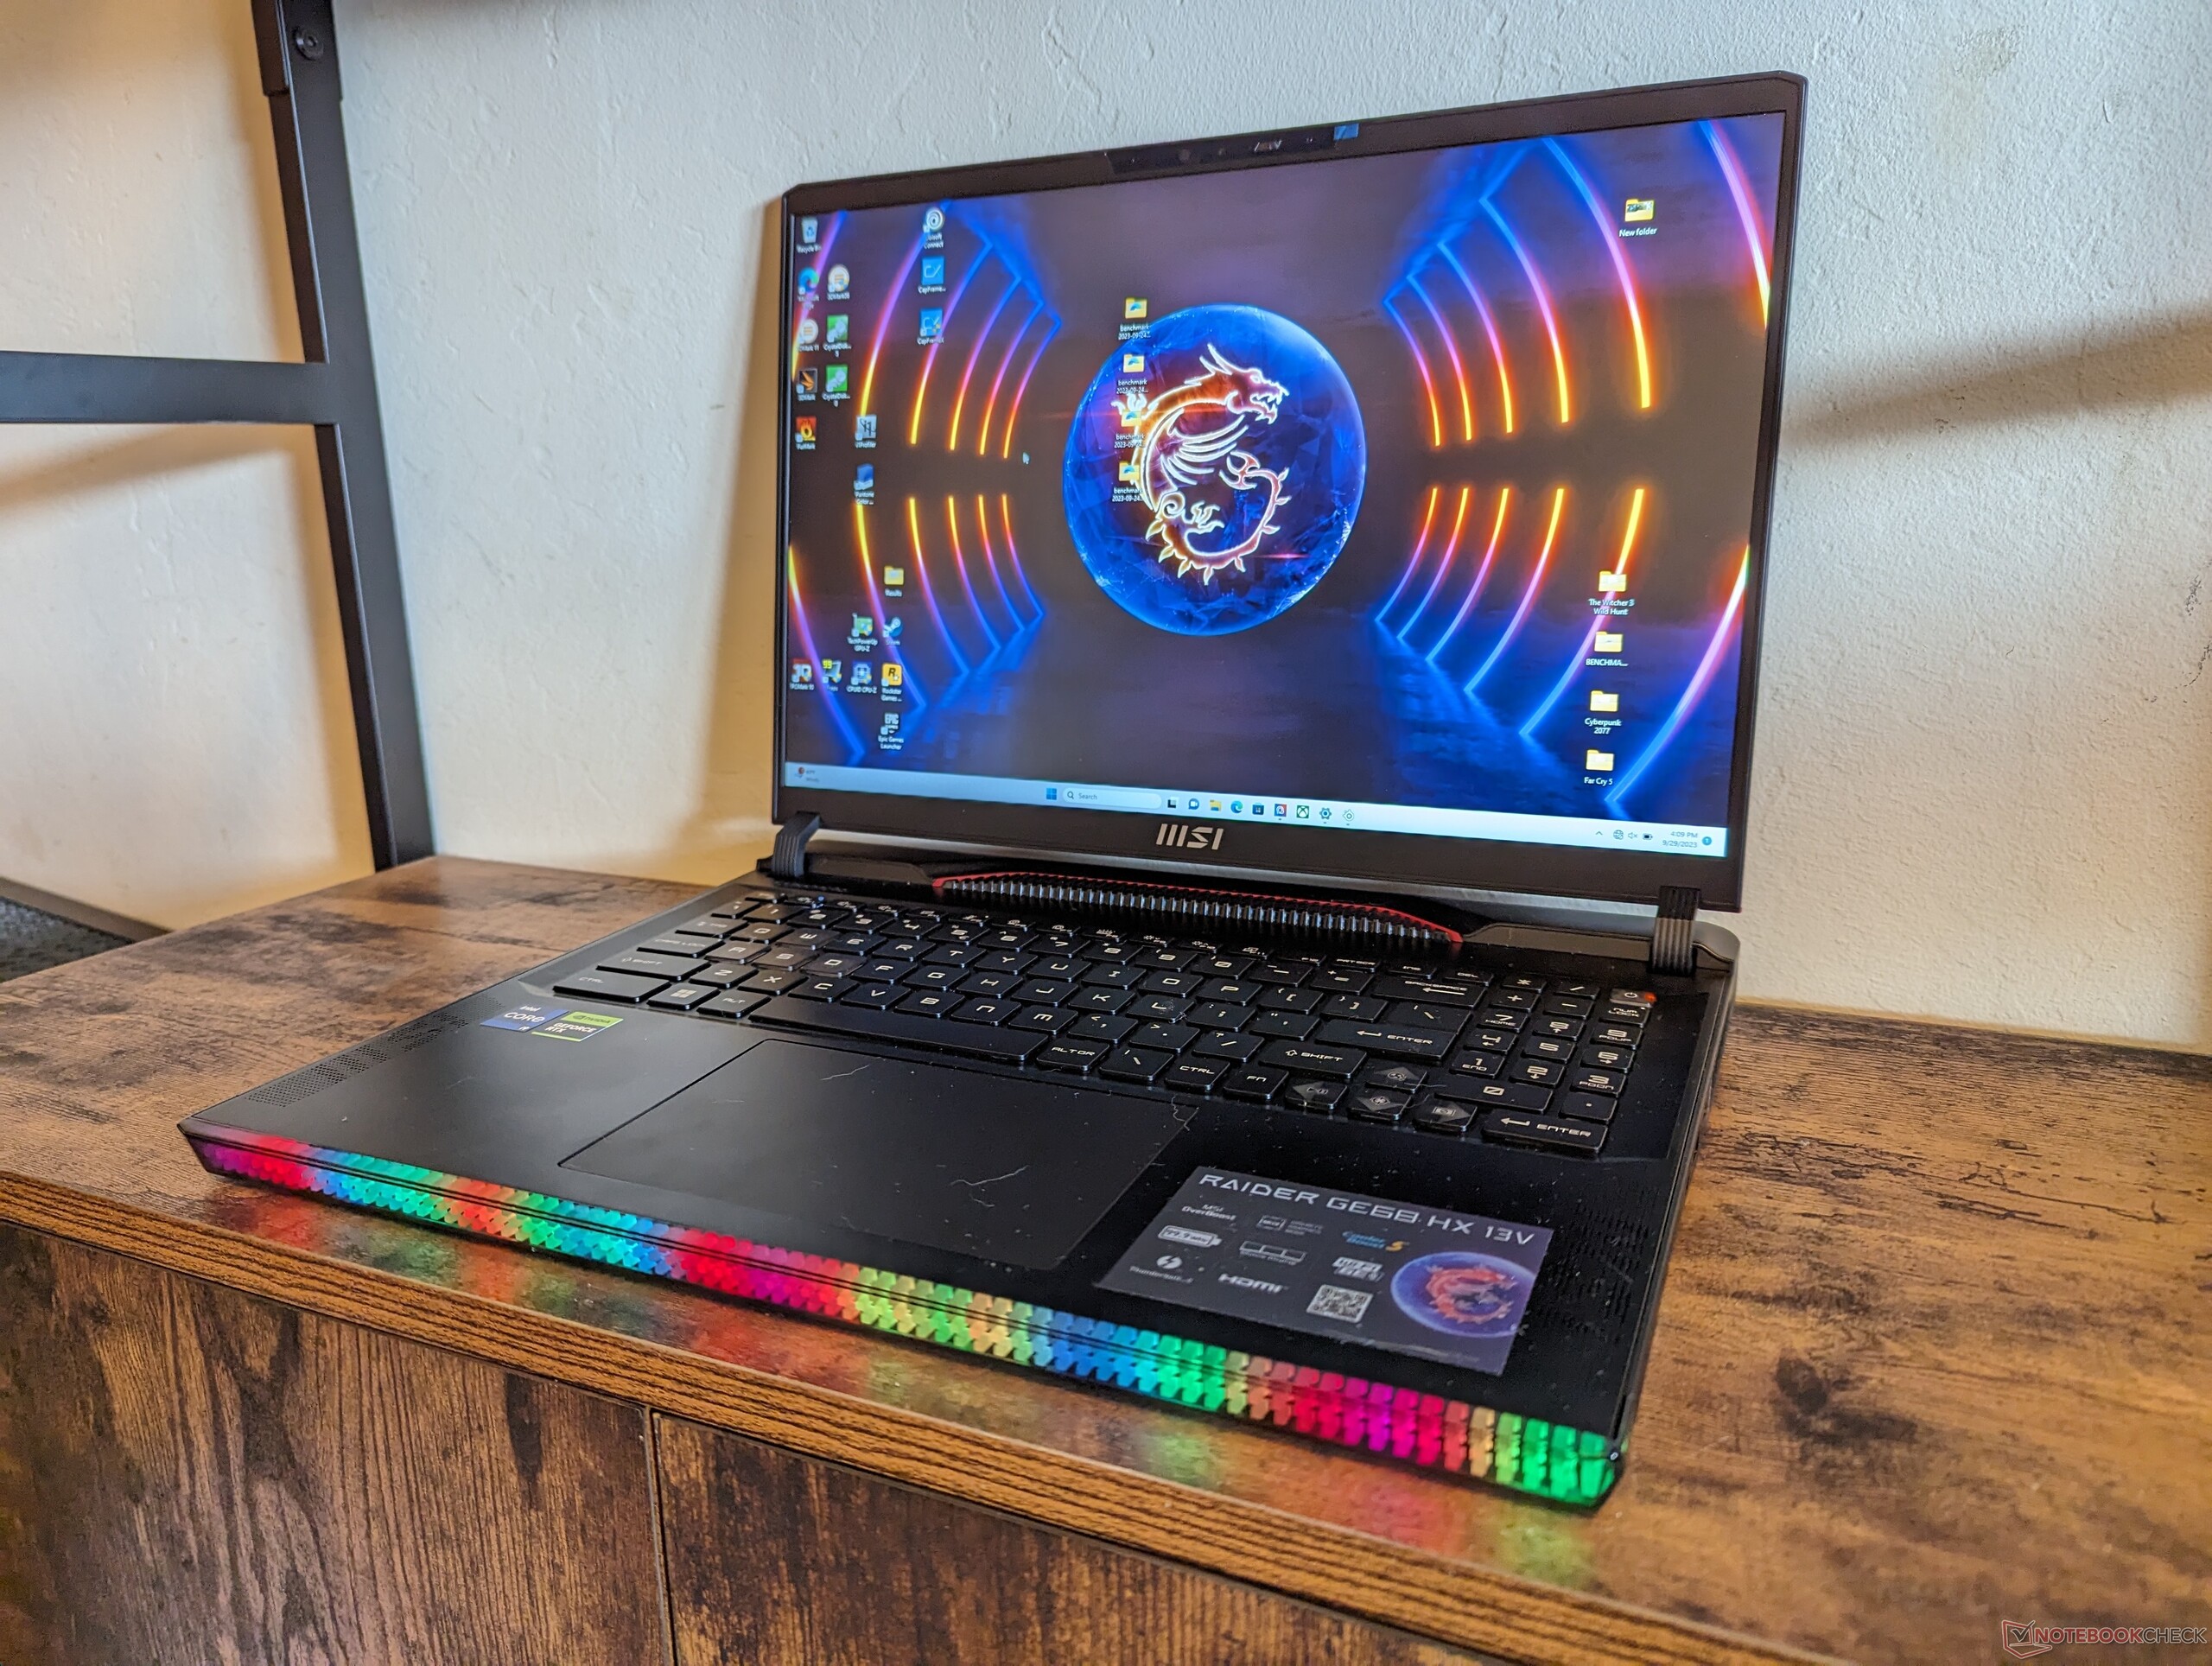
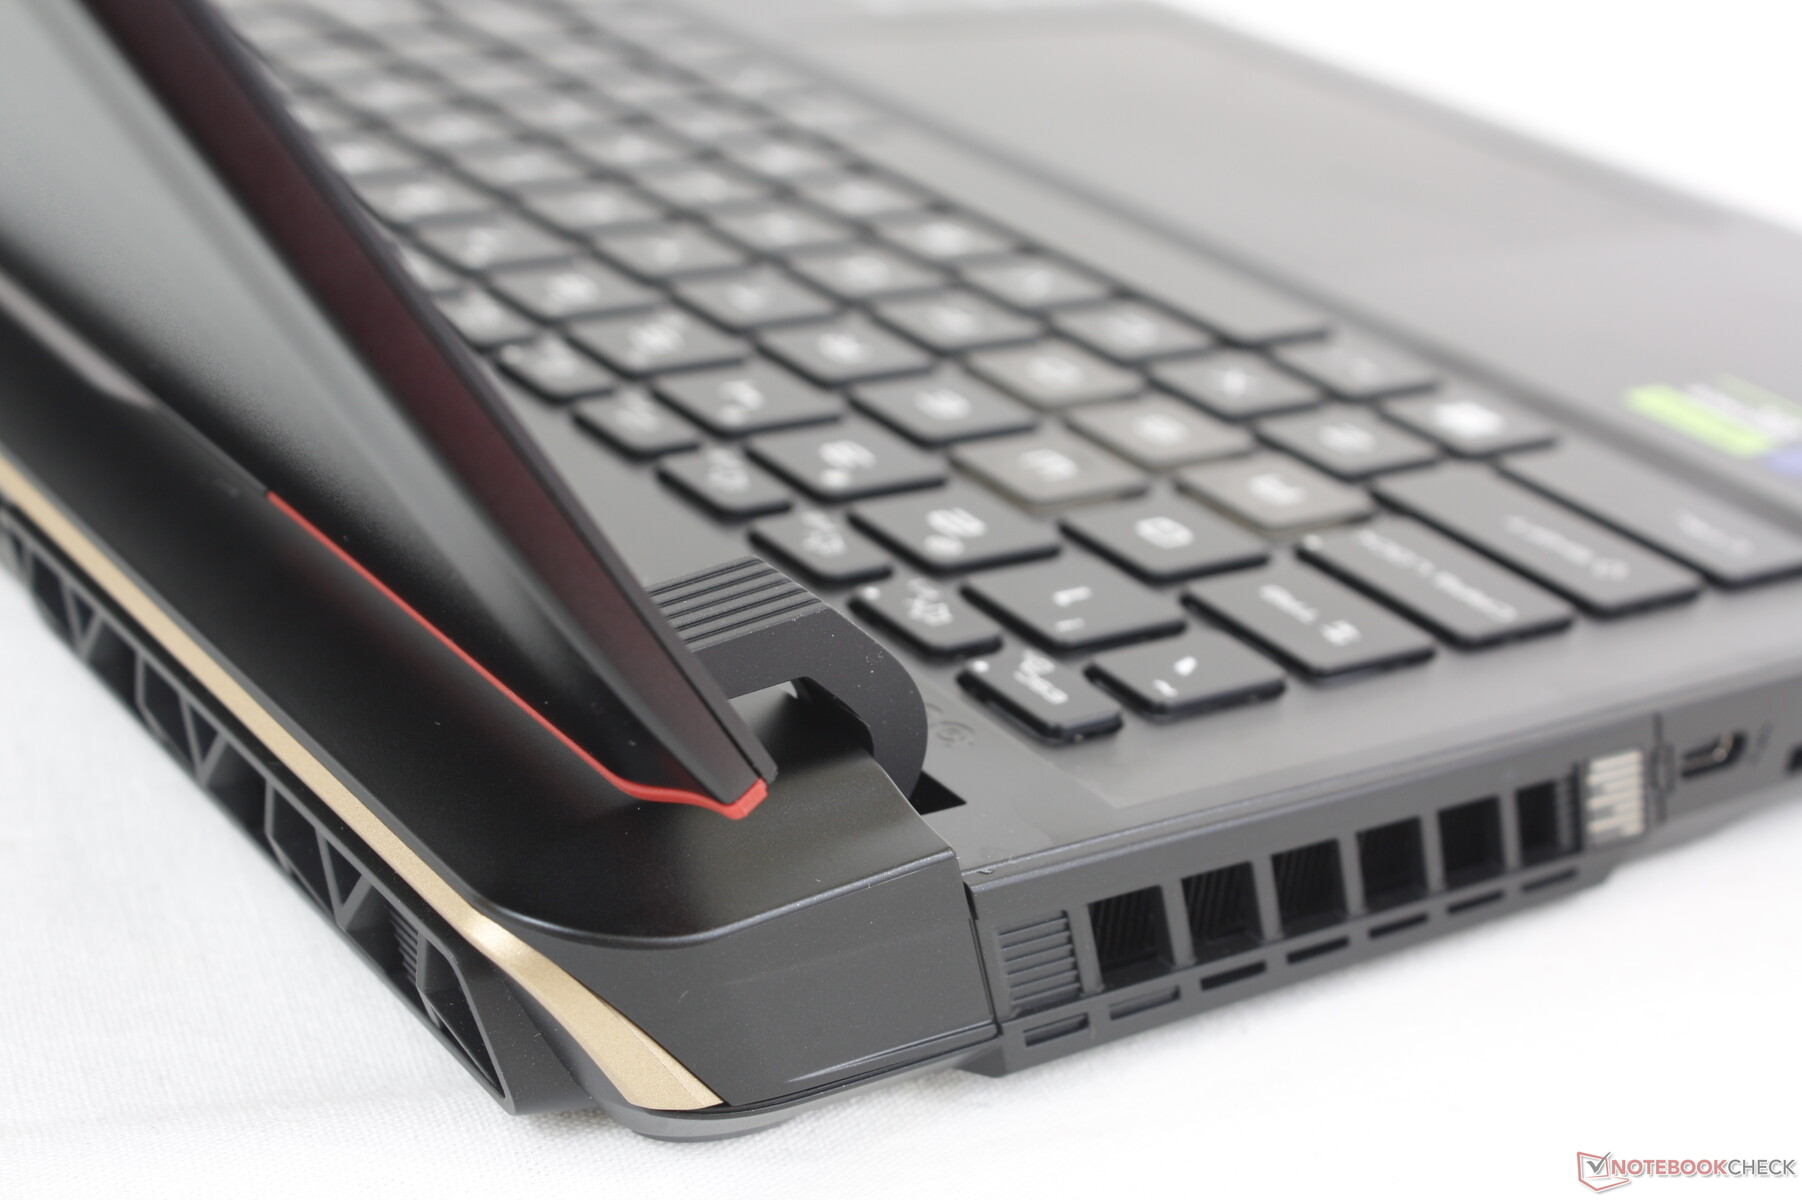
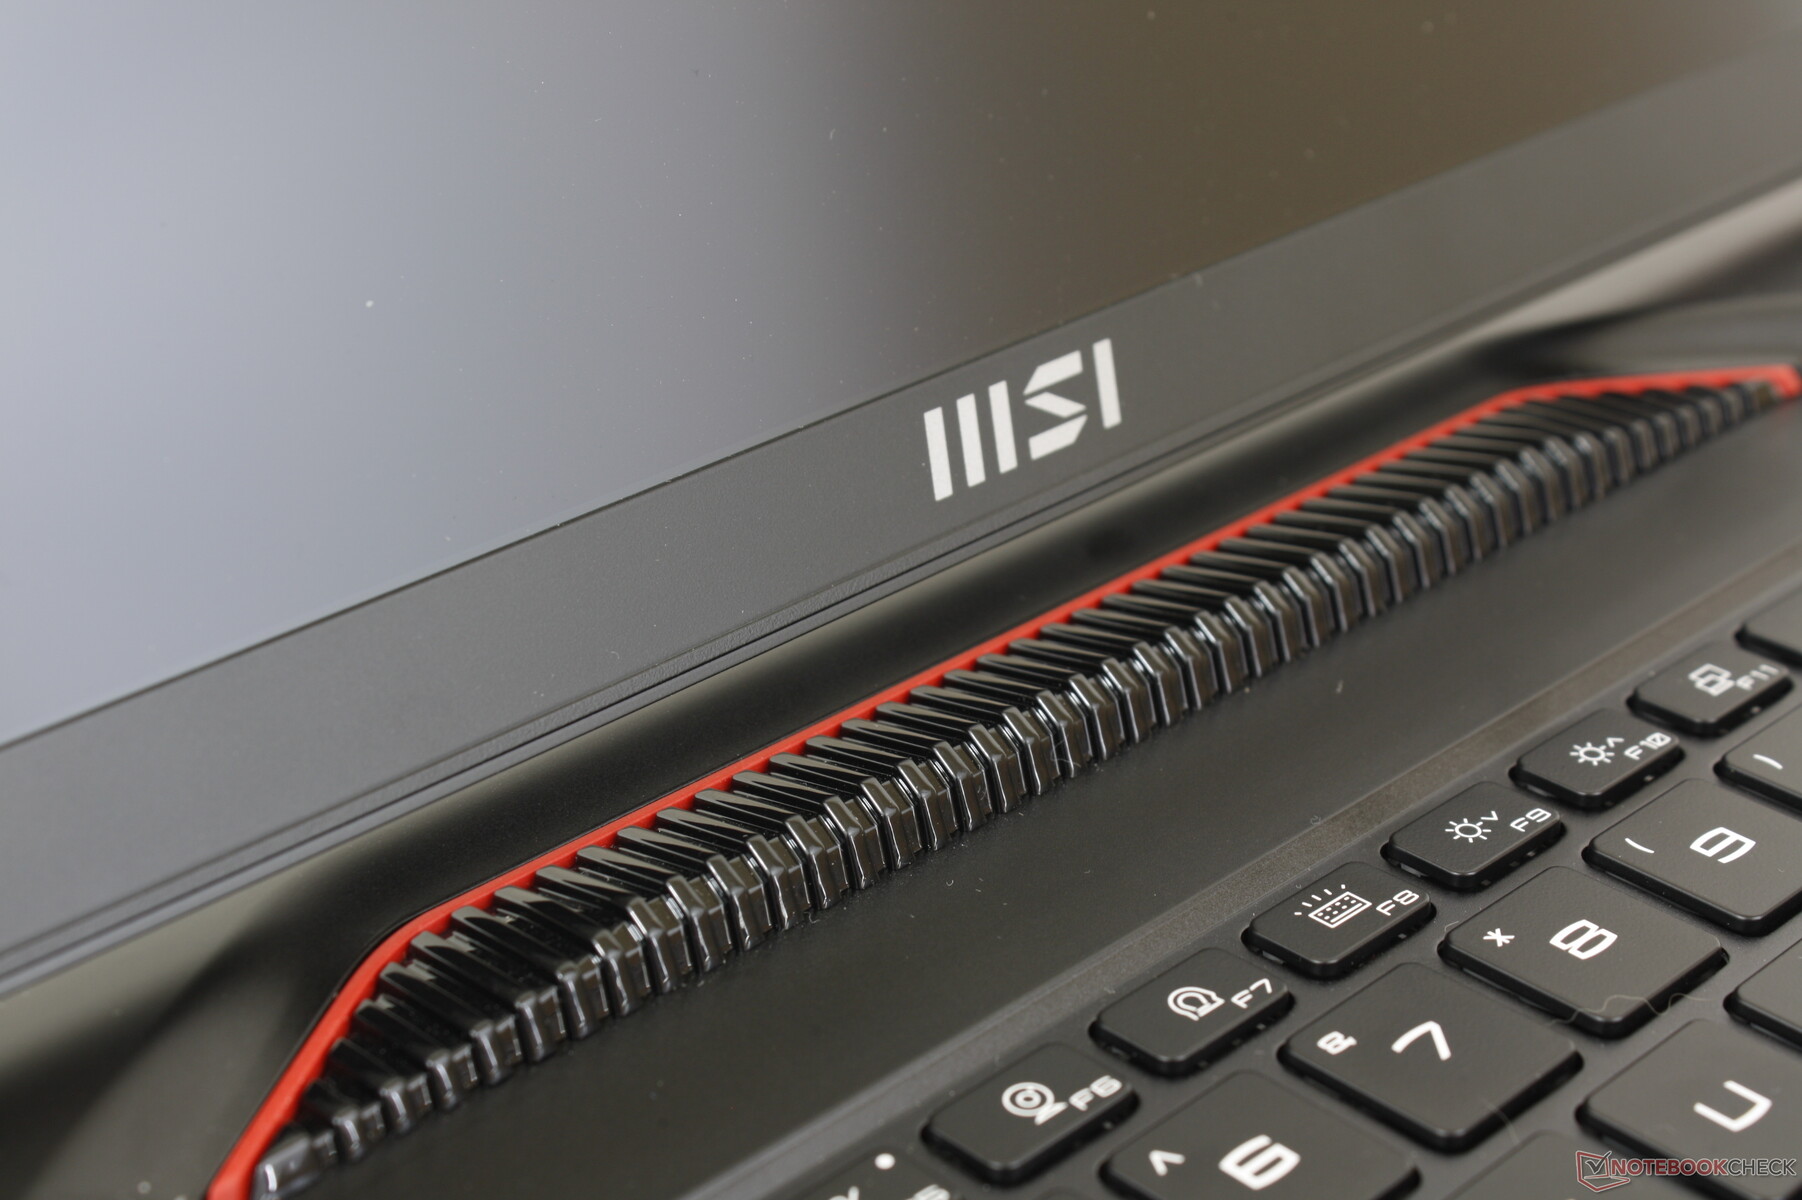
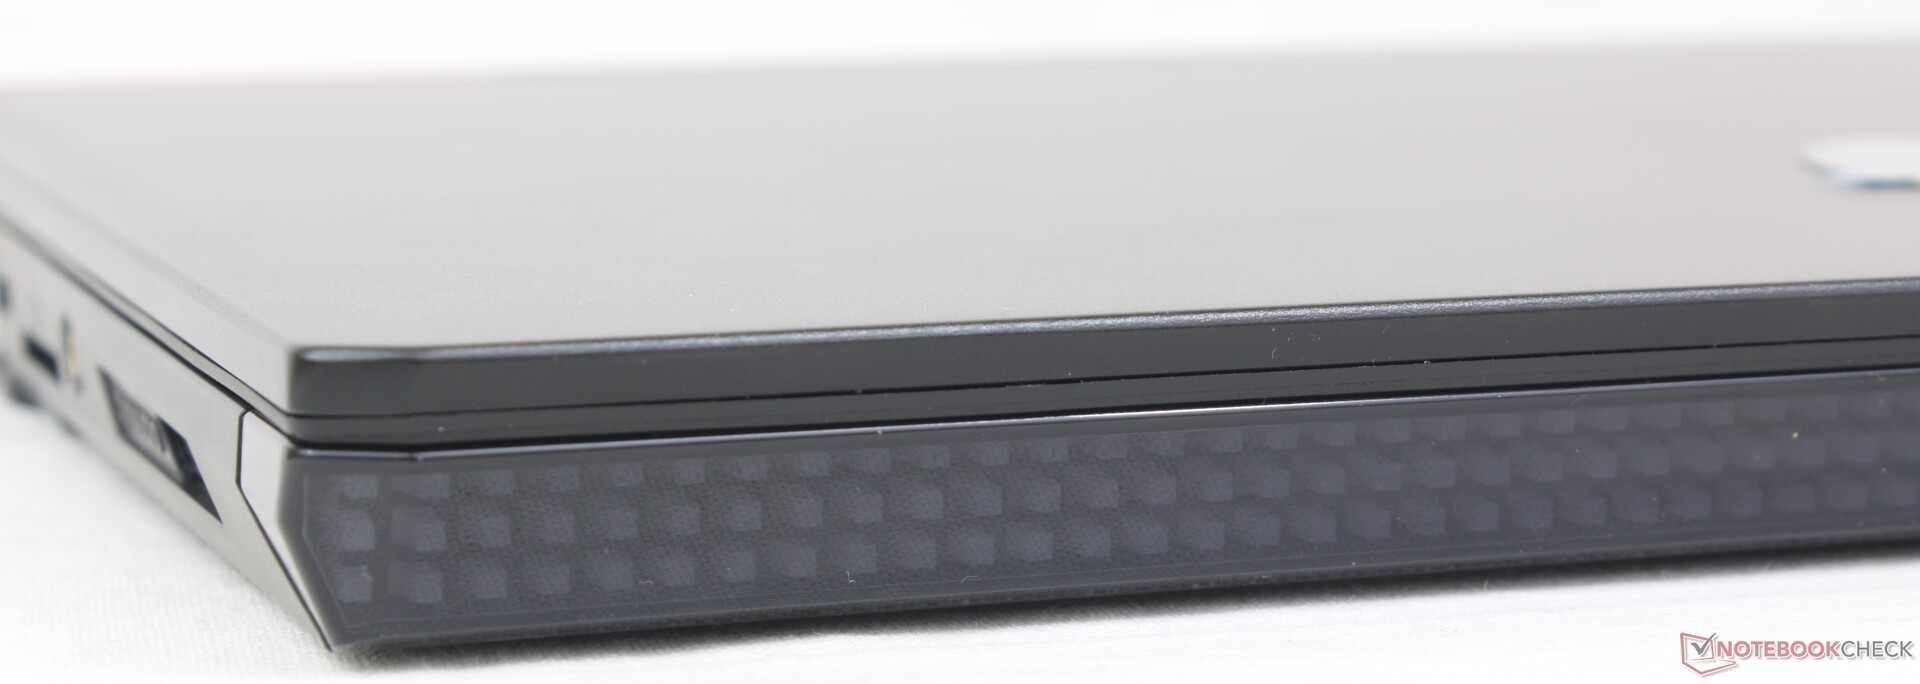
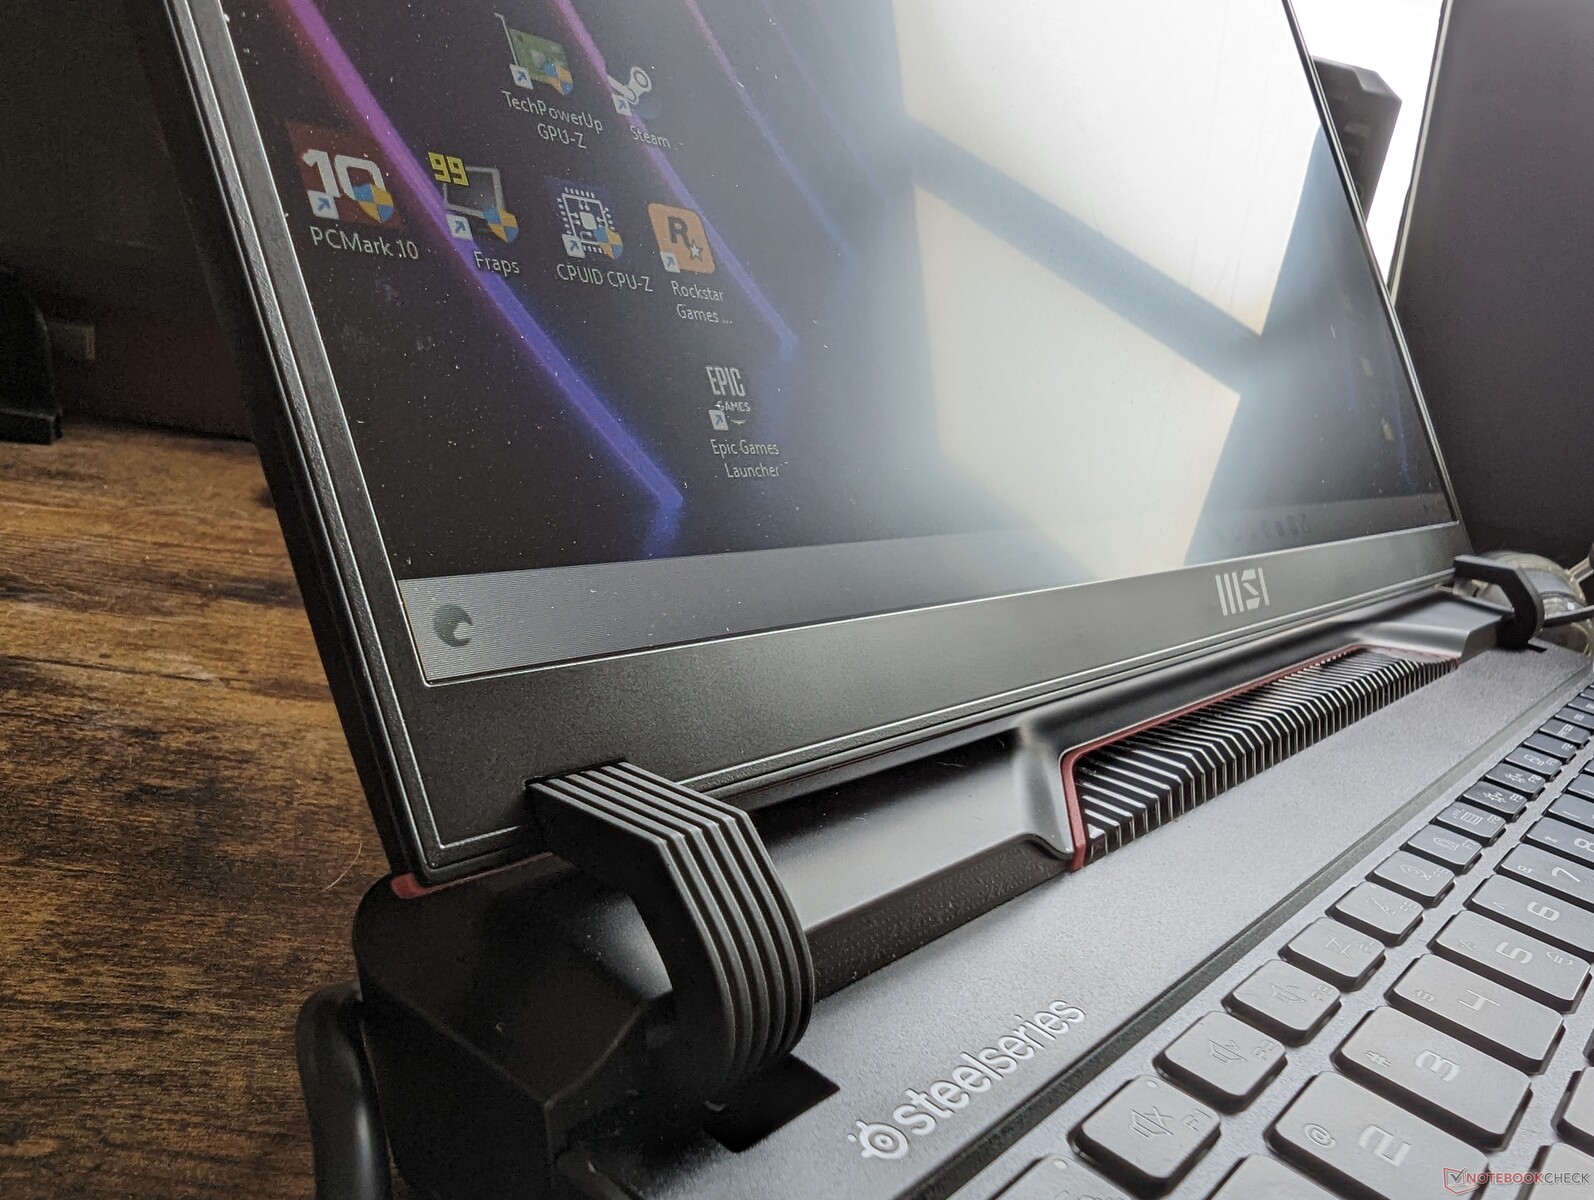
Vaka - Eskisinden Daha Büyük
Şasi en iyi şekilde 17 inç'in daha küçük bir versiyonu olarak tanımlanabilir Raider GE78HX. Ön taraftaki LED piksel çubuğu, geçen yılki modeldeki sürekli aydınlatmanın yerini alırken, arka kısım artık altın, kırmızı ve parlak kaplamalarla daha stilize. MSI'ın bu yılki hedeflerinden biri, giderek yaygınlaşan simsiyah ve minimalist estetik yerine görsel olarak daha ilginç dizüstü bilgisayar tasarımları yaratmaktı. GE68HX tasarımı rakiplerin diğer oyun dizüstü bilgisayarlarından çok farklı ve kesinlikle ayırt edilebilir olduğu için üretici bu konuda başarılı oldu.
Yekpare olmayan iskeleti oluşturan tüm kıvrımlara ve parçalara rağmen kasa sertliği mükemmel. Klavye merkezine baskı uygulamak veya köşeleri bükmeye çalışmak çok az esnemeye ve duyulabilir bir gıcırtıya neden olmaz. Özellikle geçen yılki GE67HX'e kıyasla daha büyük ve daha sağlam menteşeleri daha uzun ömürlülük açısından takdir ediyoruz.
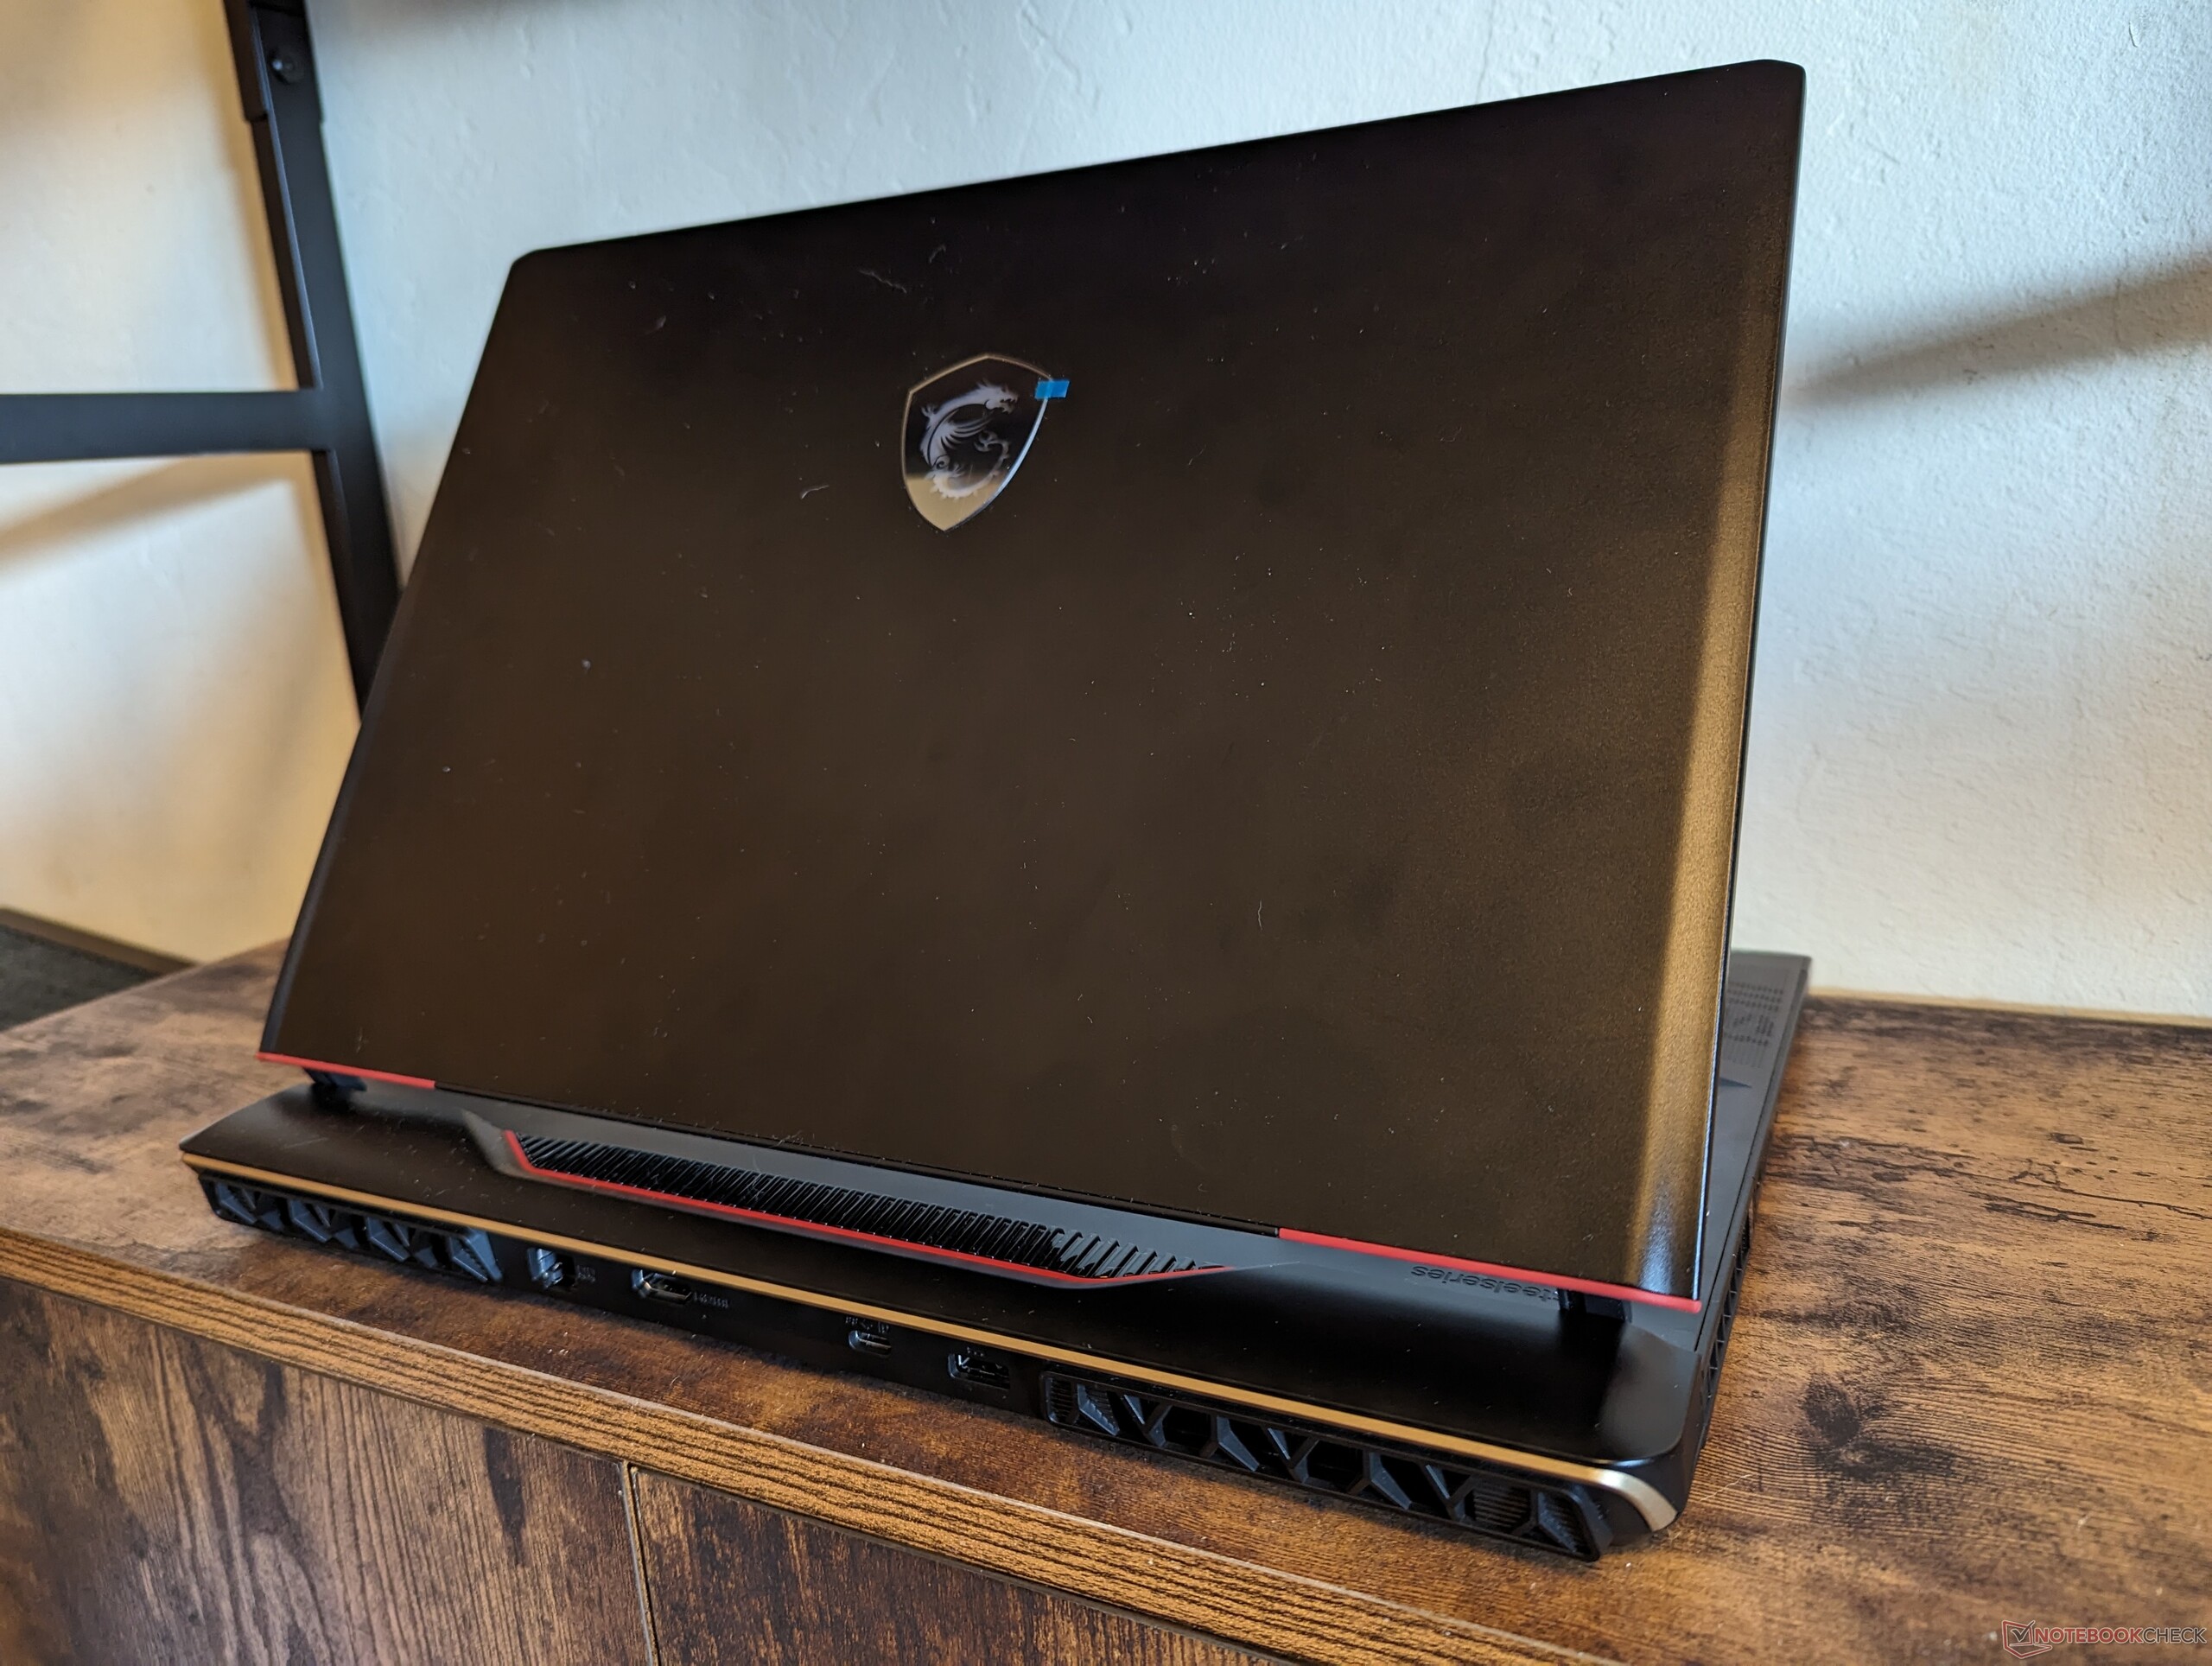
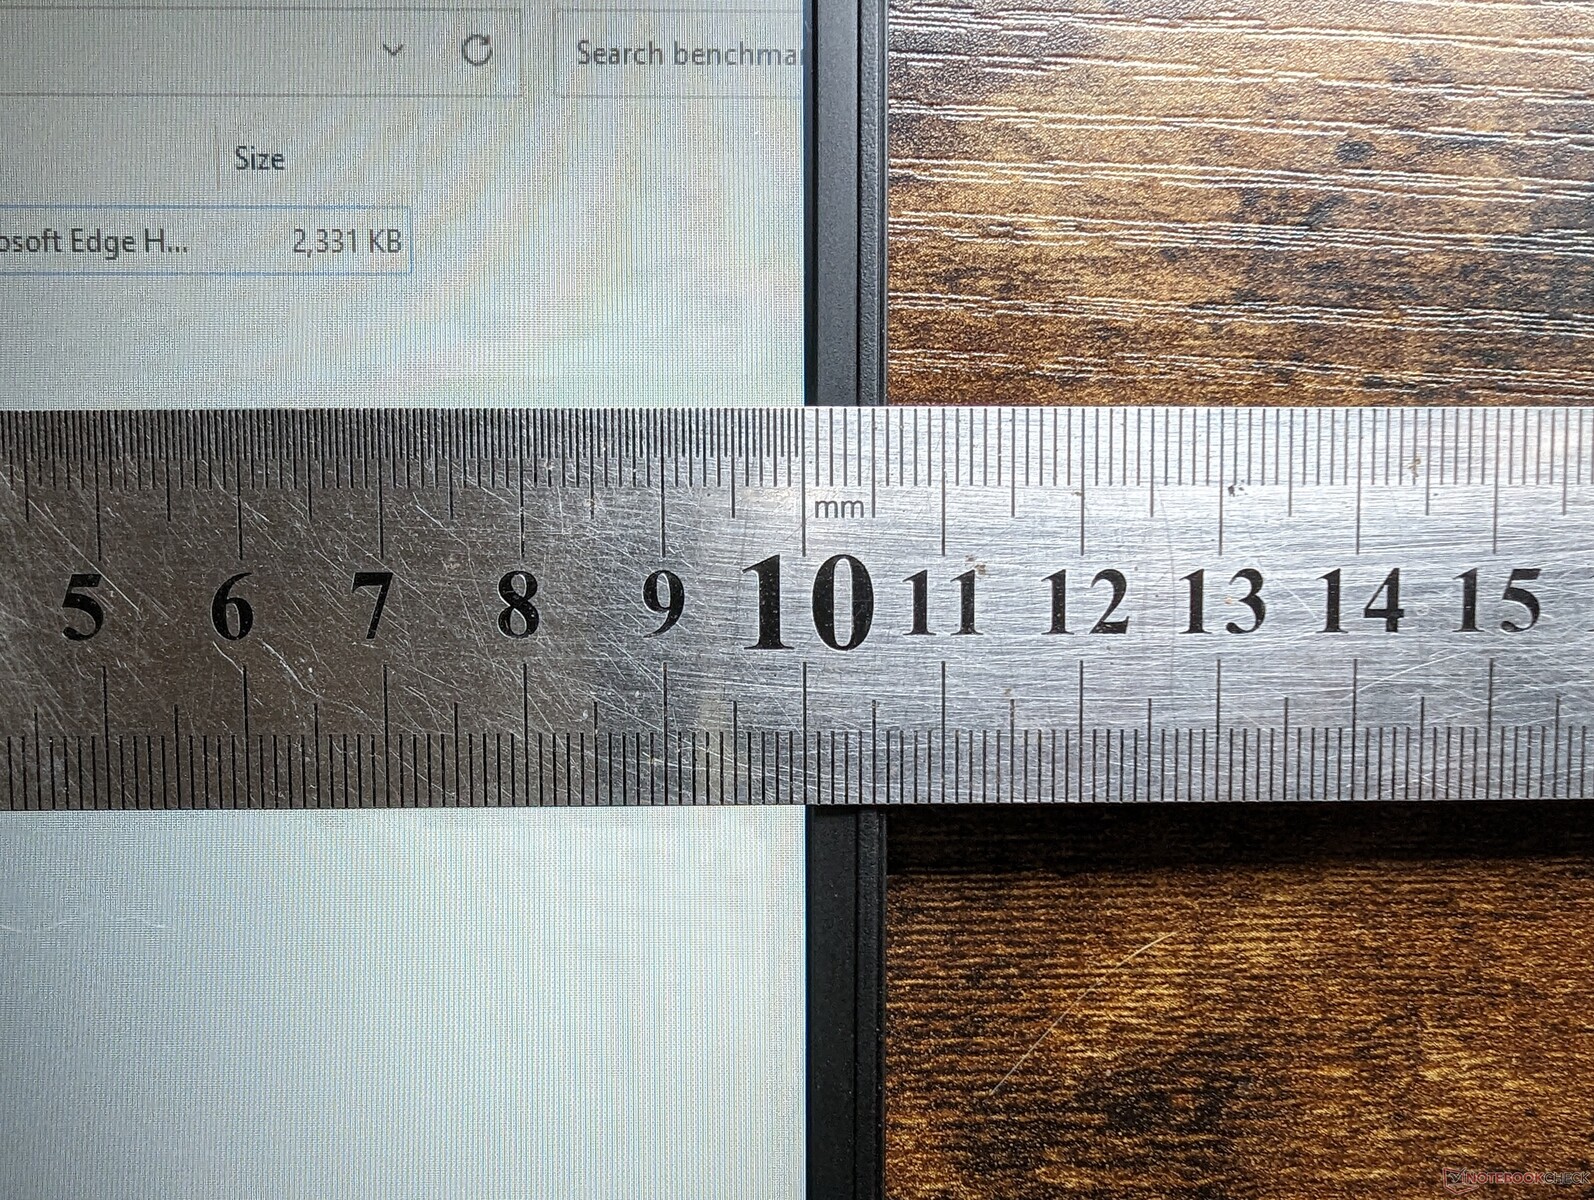
Yeni model, aşağıdaki boyut karşılaştırma tablomuzda gösterildiği gibi, giden GE67HX'ten hem daha büyük hem de daha ağırdır. Aslında GE68HX, mevcut 16 inçlik oyun dizüstü bilgisayarları arasında en büyük ve ağır olanlardan biri.
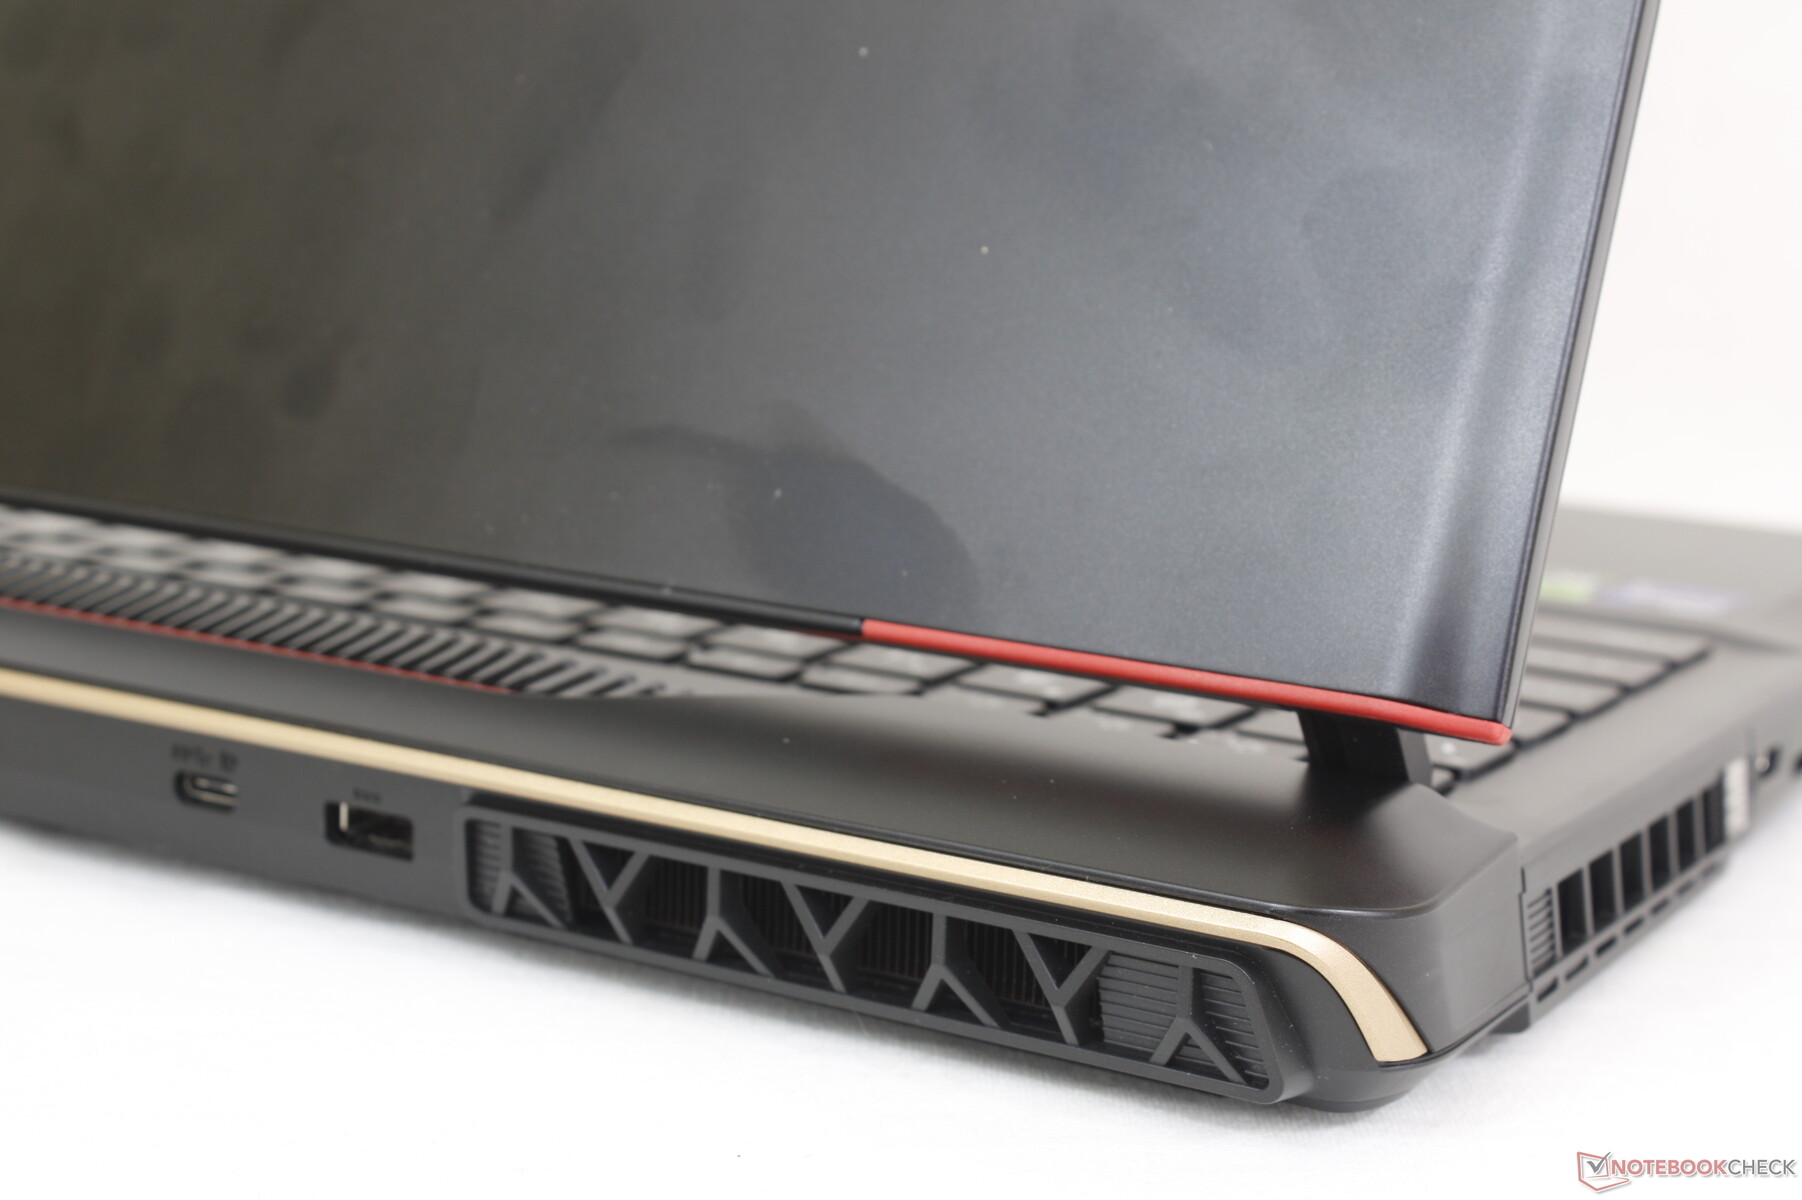
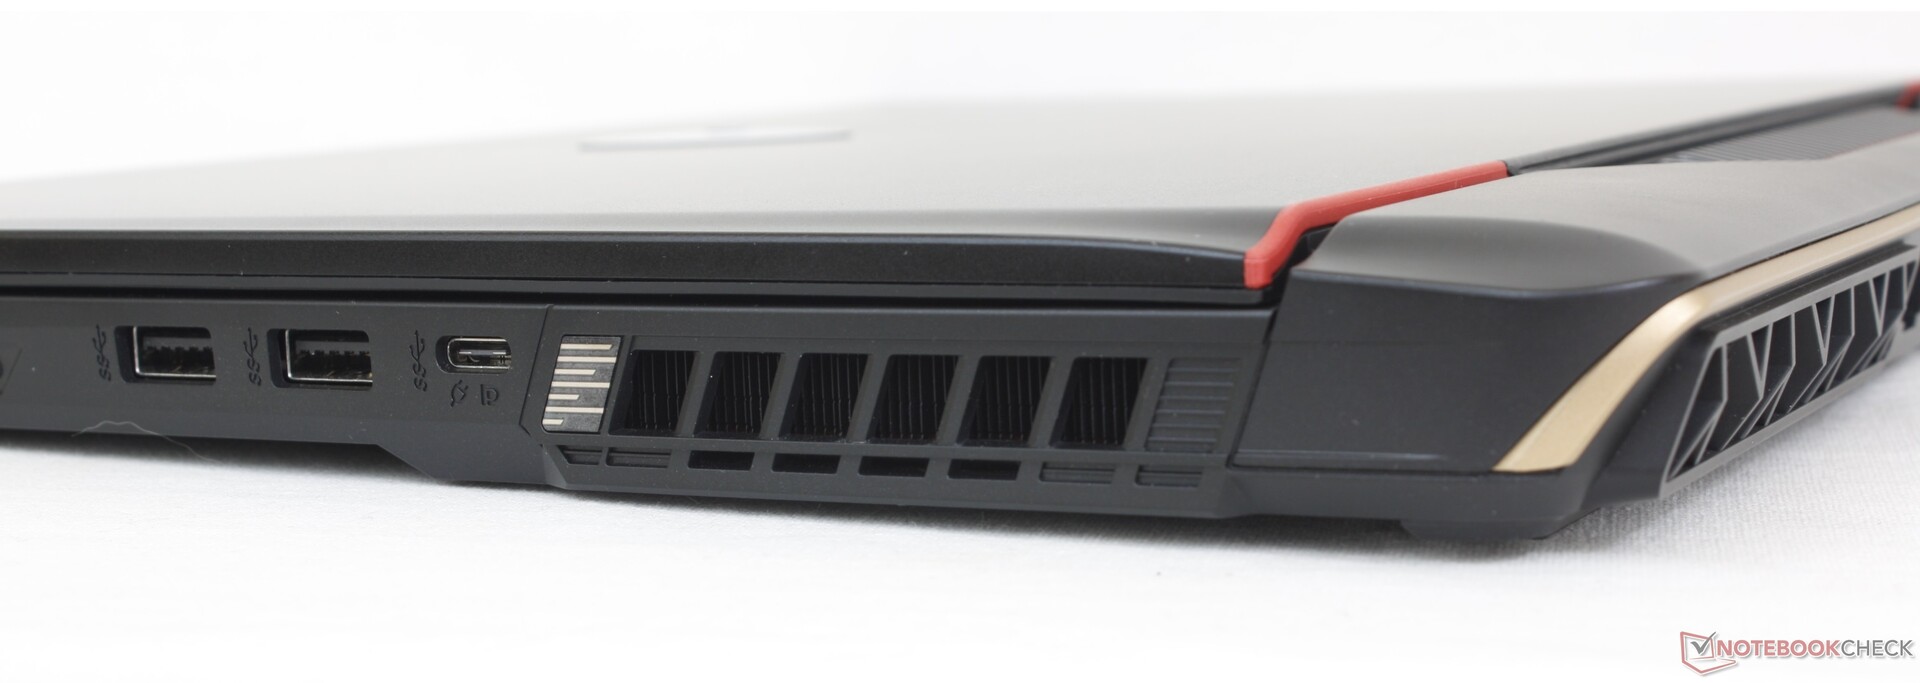
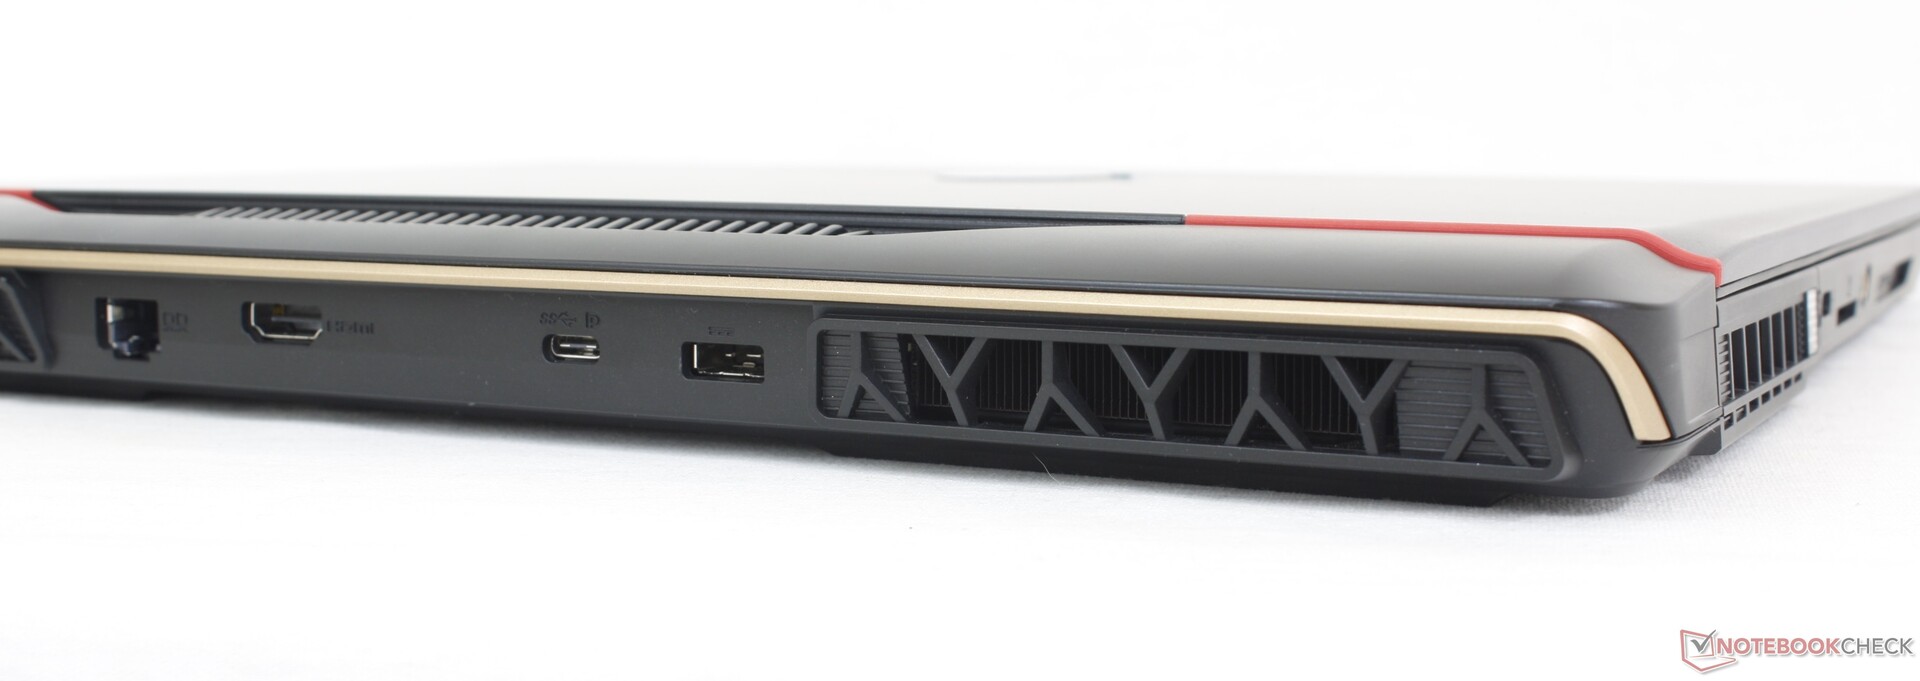
Bağlanabilirlik
Liman seçenekleri geçen yıla göre biraz değişti GE67HX. GE67HX'te 3x USB-A portu ve 2x USB-C portu bulunurken, GE68HX'te 2x USB-A portu ve 3x USB-C portu bulunuyor. Her üç USB-C bağlantı noktası da Displayport'u destekliyor, ancak yalnızca sol kenardaki bağlantı noktası Thunderbolt 4 ile uyumlu.
Garip bir şekilde MSI bu yılki tasarımında Kensington kilidini kullanmamayı tercih etmiş. MSI'ın bu yılki tasarımının aksine mini-DisplayPort da yok.Alienware m16 R1.
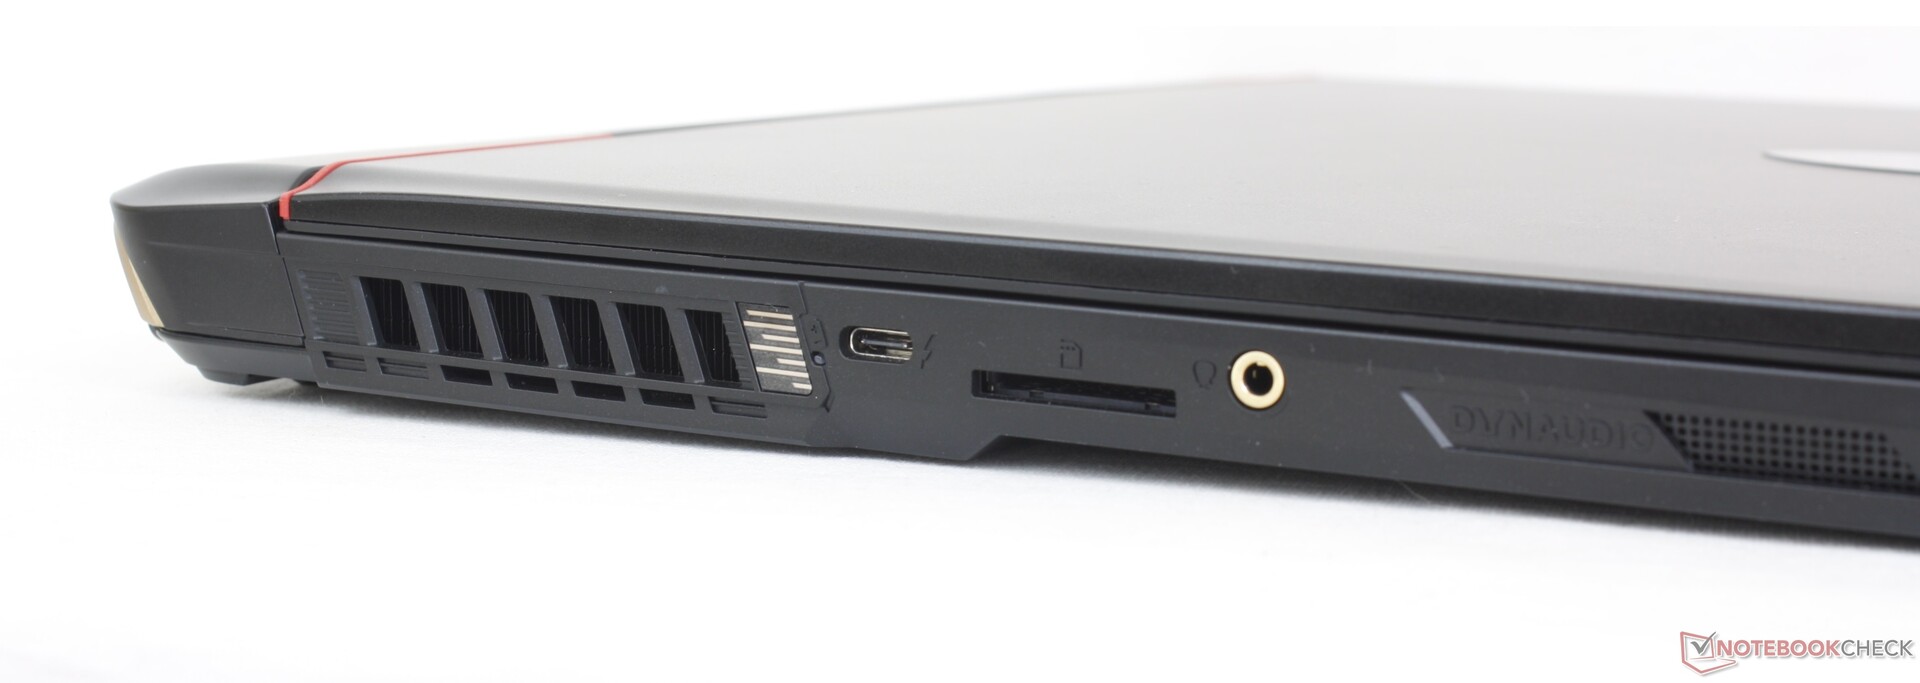
SD Kart Okuyucu
Entegre SD kart okuyucu, üst-orta seviye bir oyun modeli olması beklenen model için biraz yavaş. UHS-II test kartımızdan masaüstüne 1 GB resim aktarmak 12 saniyeden biraz fazla sürerken, aynı test Alienware m16 R1 2 kattan fazla daha hızlı olacaktır.
| SD Card Reader | |
| average JPG Copy Test (av. of 3 runs) | |
| Alienware m16 R1 AMD (Toshiba Exceria Pro SDXC 64 GB UHS-II) | |
| Asus ROG Zephyrus M16 GU604VY-NM042X | |
| Lenovo Legion Slim 7i 16 Gen 8 (Toshiba Exceria Pro SDXC 64 GB UHS-II) | |
| MSI GE67 HX 12UGS (Toshiba Exceria Pro SDXC 64 GB UHS-II) | |
| MSI Raider GE68HX 13VF (Toshiba Exceria Pro SDXC 64 GB UHS-II) | |
| maximum AS SSD Seq Read Test (1GB) | |
| Alienware m16 R1 AMD (Toshiba Exceria Pro SDXC 64 GB UHS-II) | |
| Asus ROG Zephyrus M16 GU604VY-NM042X | |
| Lenovo Legion Slim 7i 16 Gen 8 (Toshiba Exceria Pro SDXC 64 GB UHS-II) | |
| MSI Raider GE68HX 13VF (Toshiba Exceria Pro SDXC 64 GB UHS-II) | |
| MSI GE67 HX 12UGS (Toshiba Exceria Pro SDXC 64 GB UHS-II) | |
İletişim
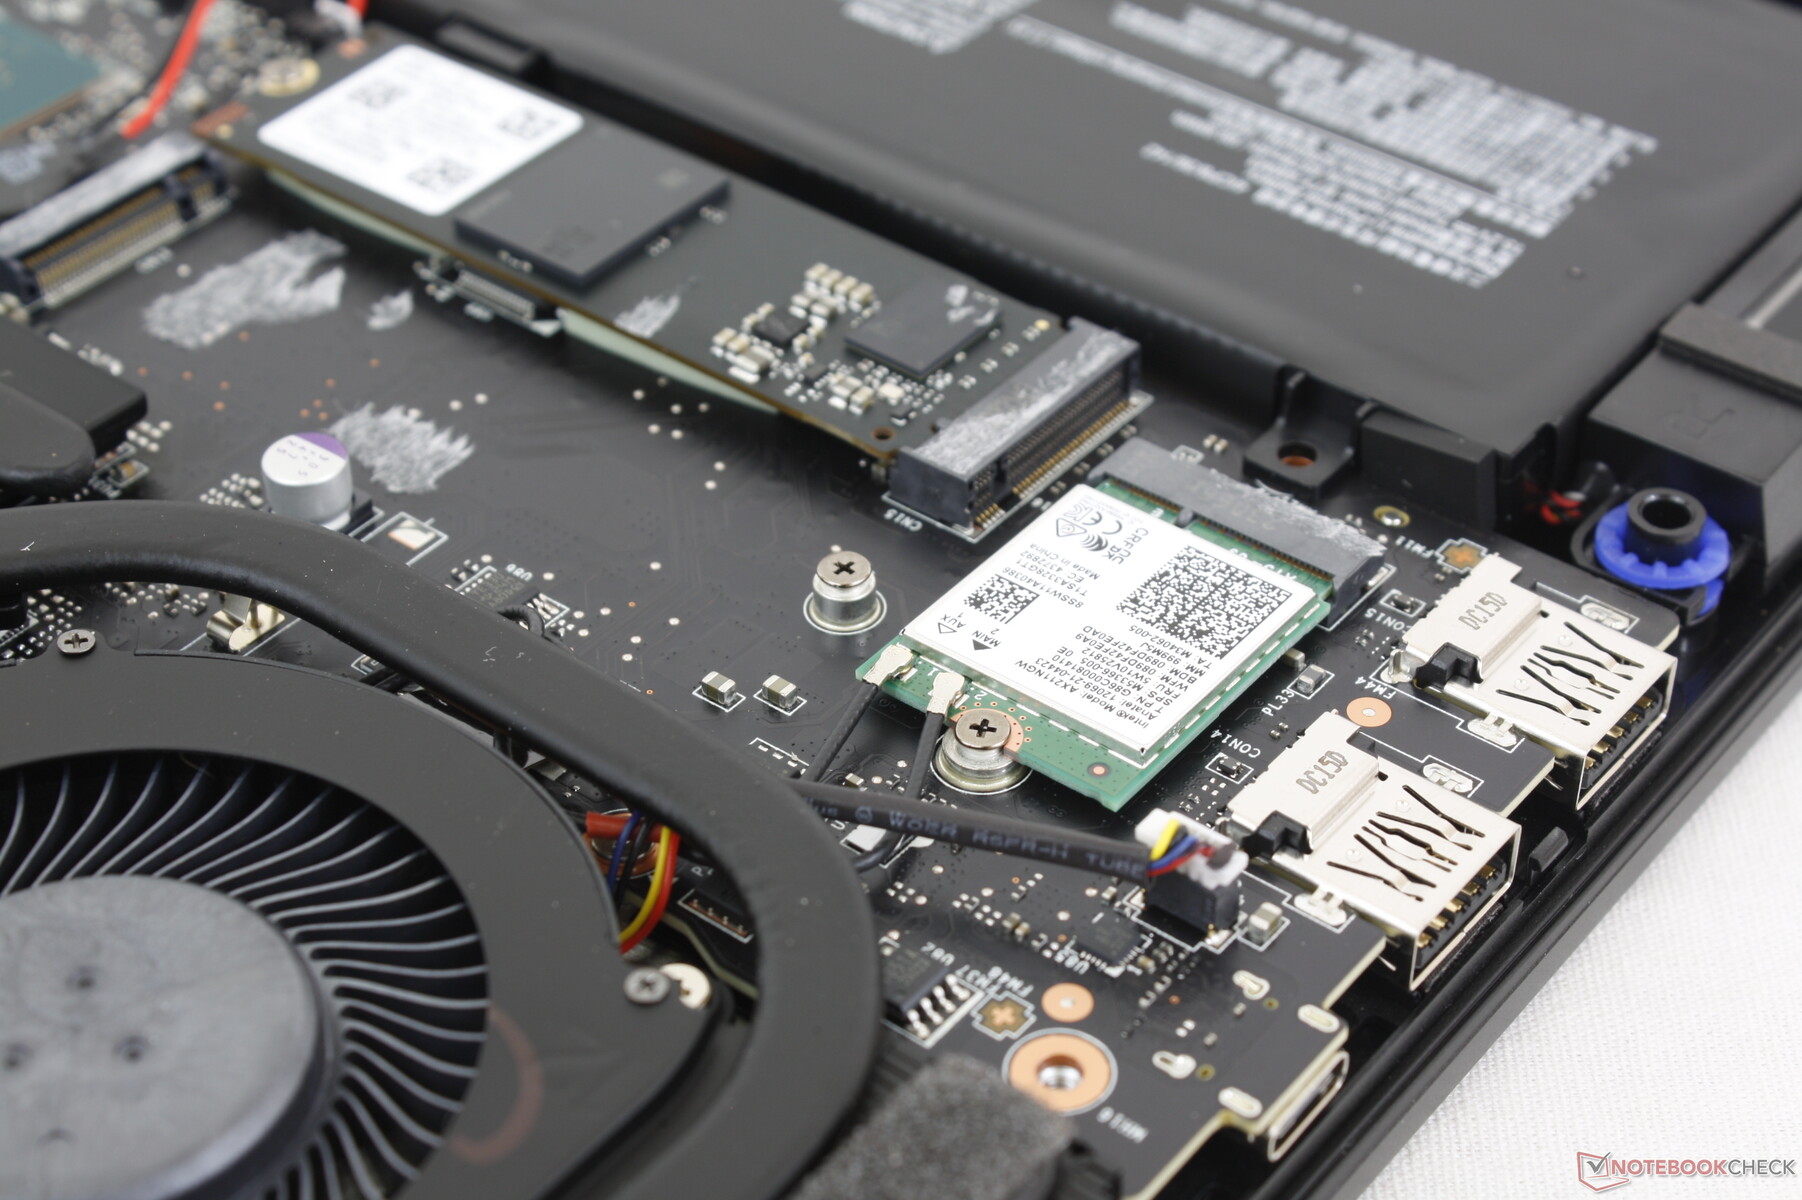
Wi-Fi 6E ve Bluetooth 5.3 desteği için Intel AX211 standart olarak gelmektedir. AXE11000 6 GHz test ağımızla eşleştirildiğinde hiçbir bağlantı sorunu yaşamadık.
| Networking | |
| iperf3 transmit AXE11000 | |
| Alienware m16 R1 AMD | |
| MSI Raider GE68HX 13VF | |
| HP Omen 16-xf0376ng | |
| Lenovo Legion Slim 7i 16 Gen 8 | |
| iperf3 receive AXE11000 | |
| HP Omen 16-xf0376ng | |
| Alienware m16 R1 AMD | |
| Lenovo Legion Slim 7i 16 Gen 8 | |
| MSI Raider GE68HX 13VF | |
| iperf3 transmit AXE11000 6GHz | |
| Alienware m16 R1 AMD | |
| Asus ROG Zephyrus M16 GU604VY-NM042X | |
| Lenovo Legion Slim 7i 16 Gen 8 | |
| MSI Raider GE68HX 13VF | |
| MSI GE67 HX 12UGS | |
| iperf3 receive AXE11000 6GHz | |
| Asus ROG Zephyrus M16 GU604VY-NM042X | |
| Alienware m16 R1 AMD | |
| Lenovo Legion Slim 7i 16 Gen 8 | |
| MSI Raider GE68HX 13VF | |
| MSI GE67 HX 12UGS | |
Web kamerası
2 MP kalitesi değişmemiş olsa da, web kamerasını çevreleyen birkaç farklılık var. Örneğin deklanşör artık klavyedeki elektronik bir anahtar yerine lensin yanındaki fiziksel bir kaydırıcı. İkinci olarak, Hello desteği için artık bir IR sensörü yerleşik.


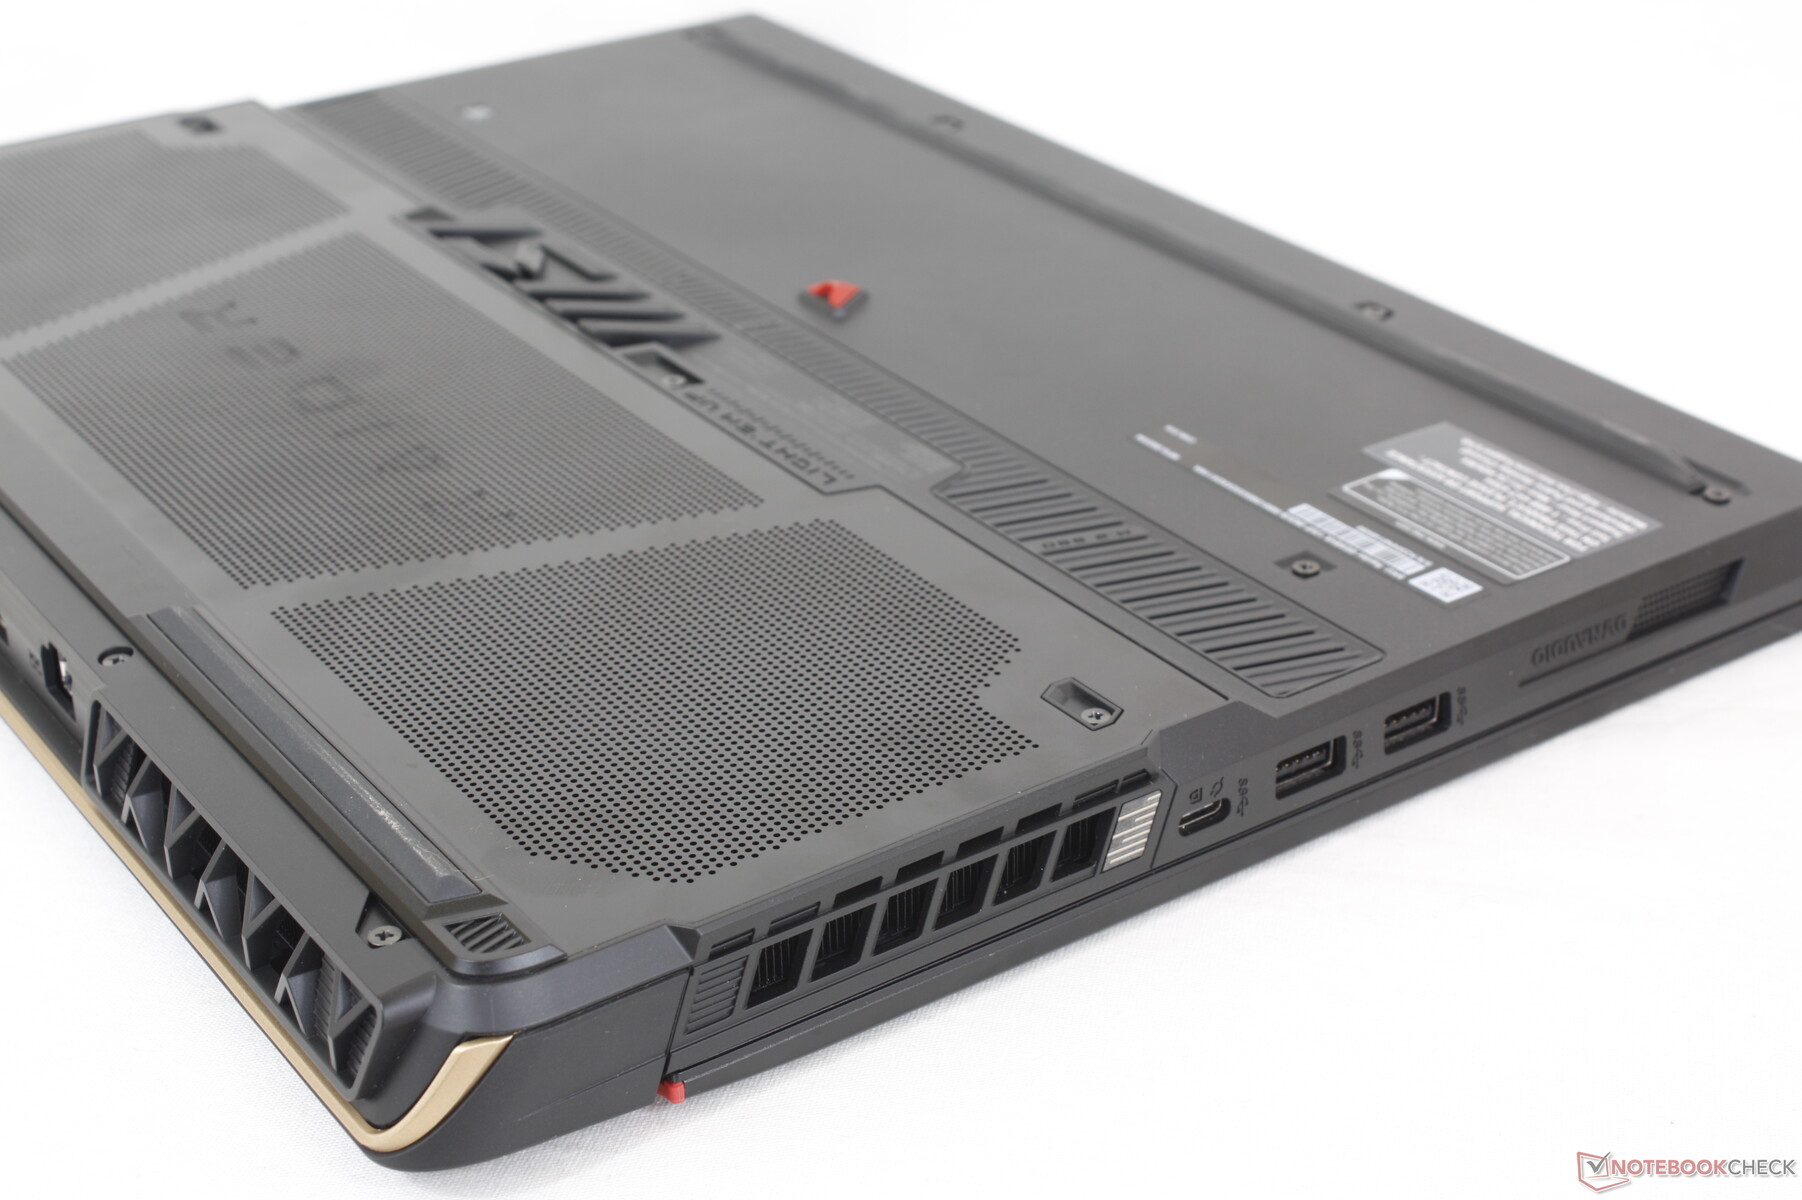
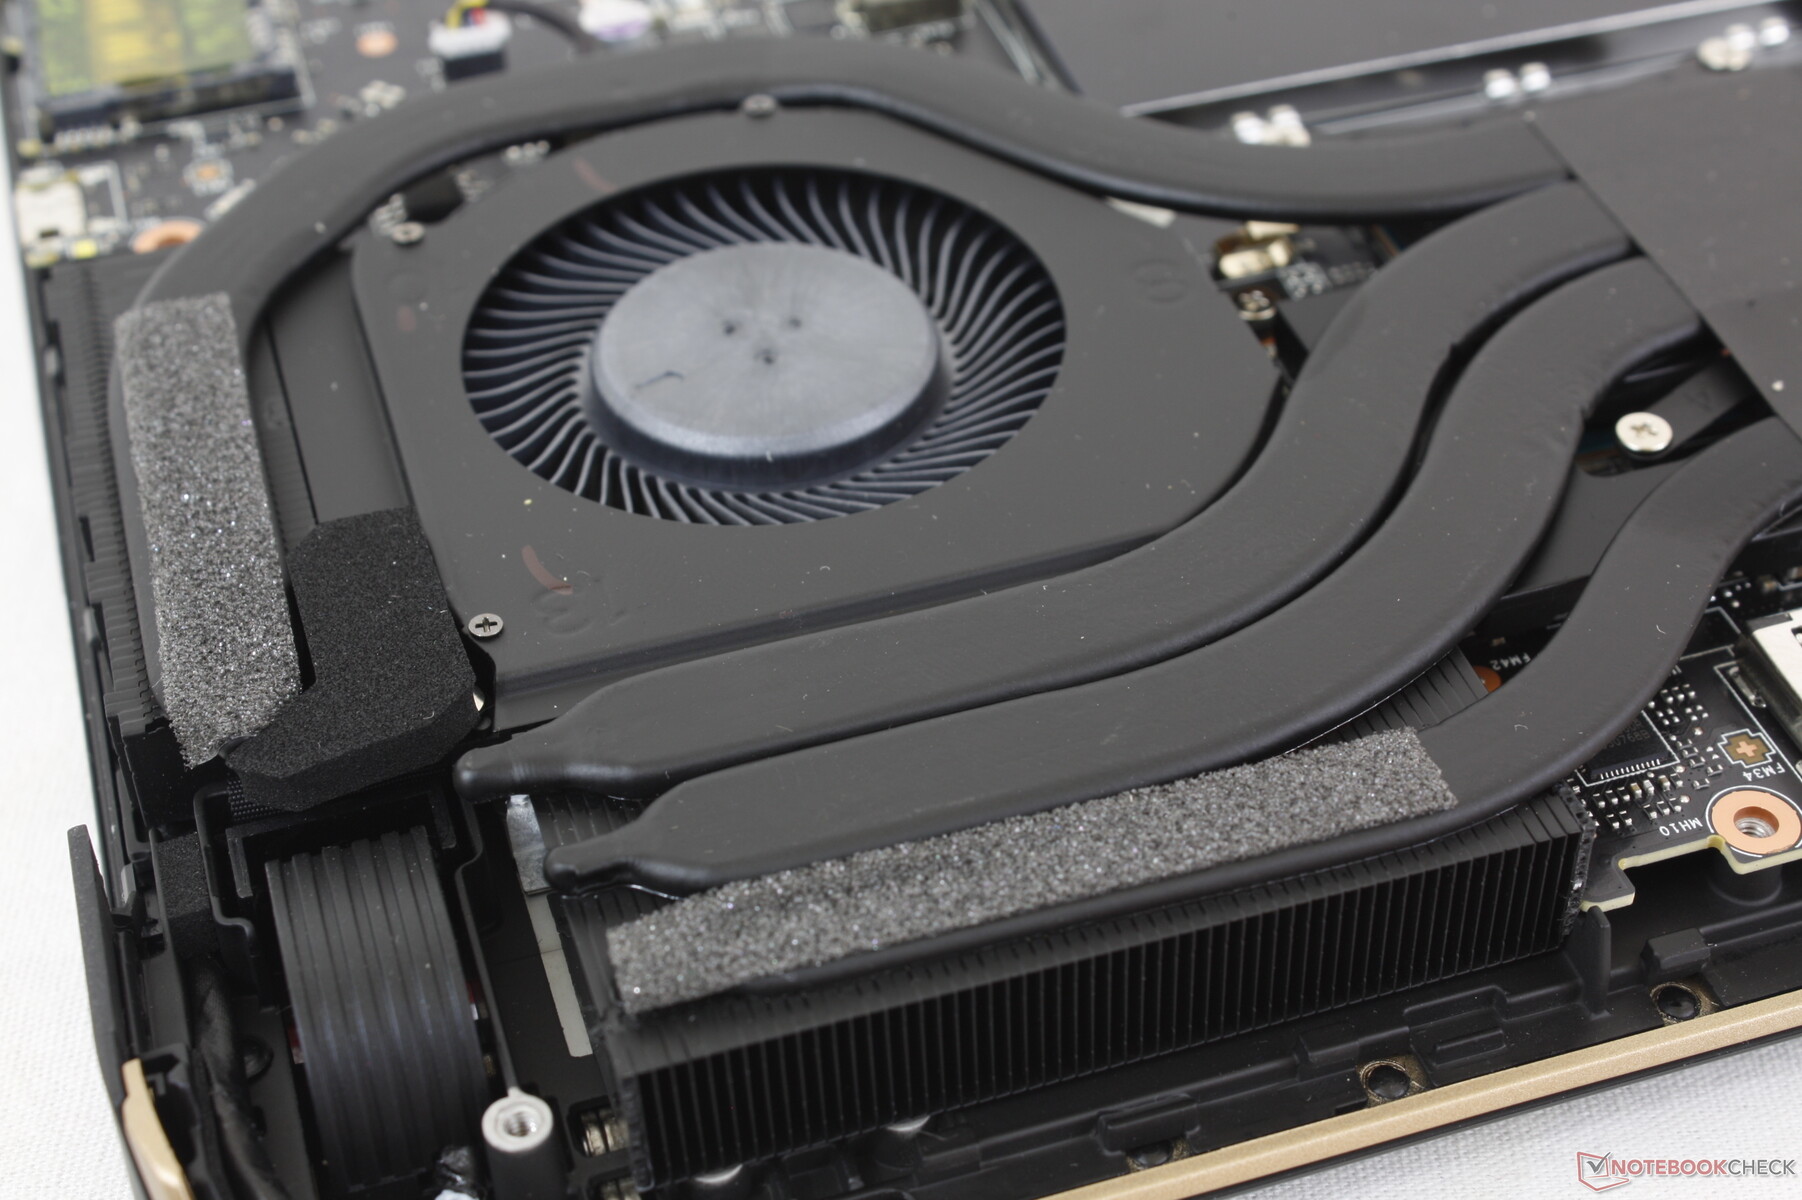
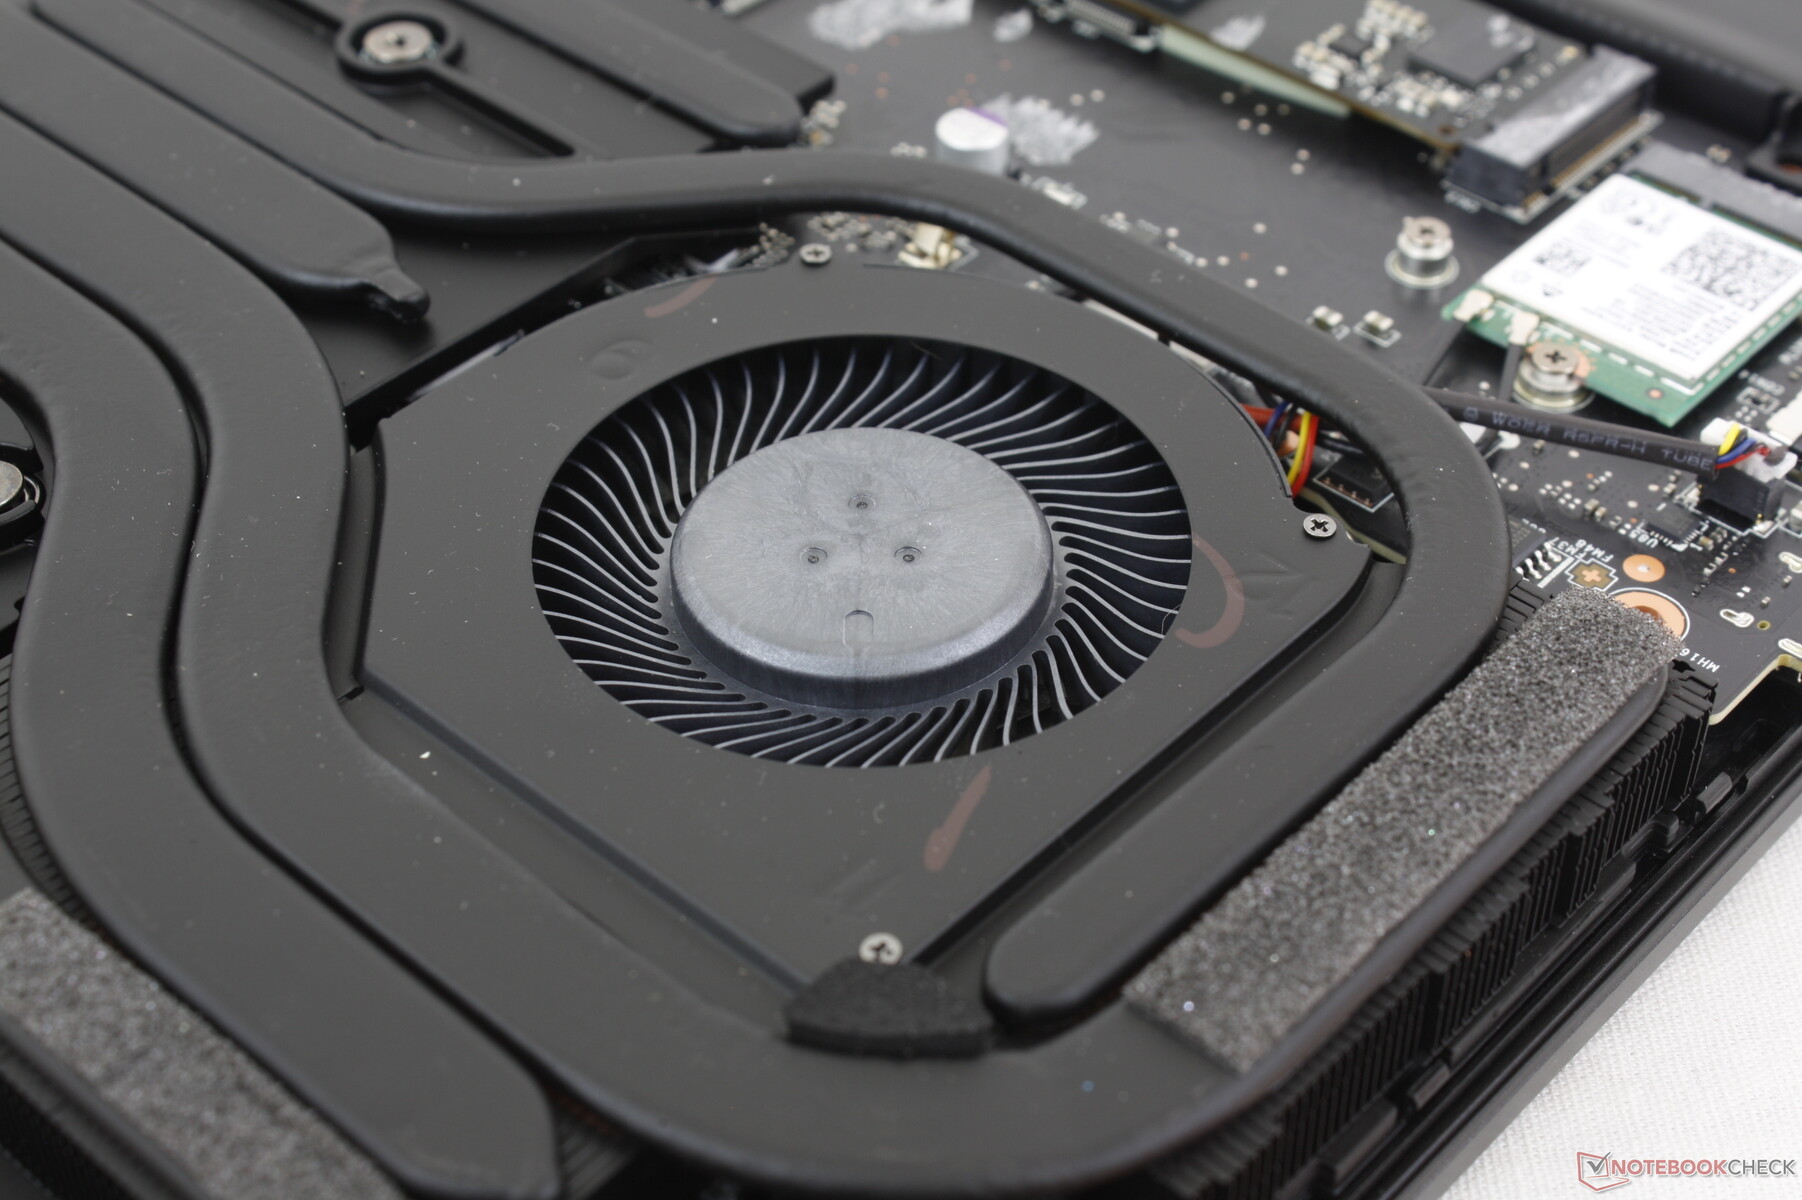
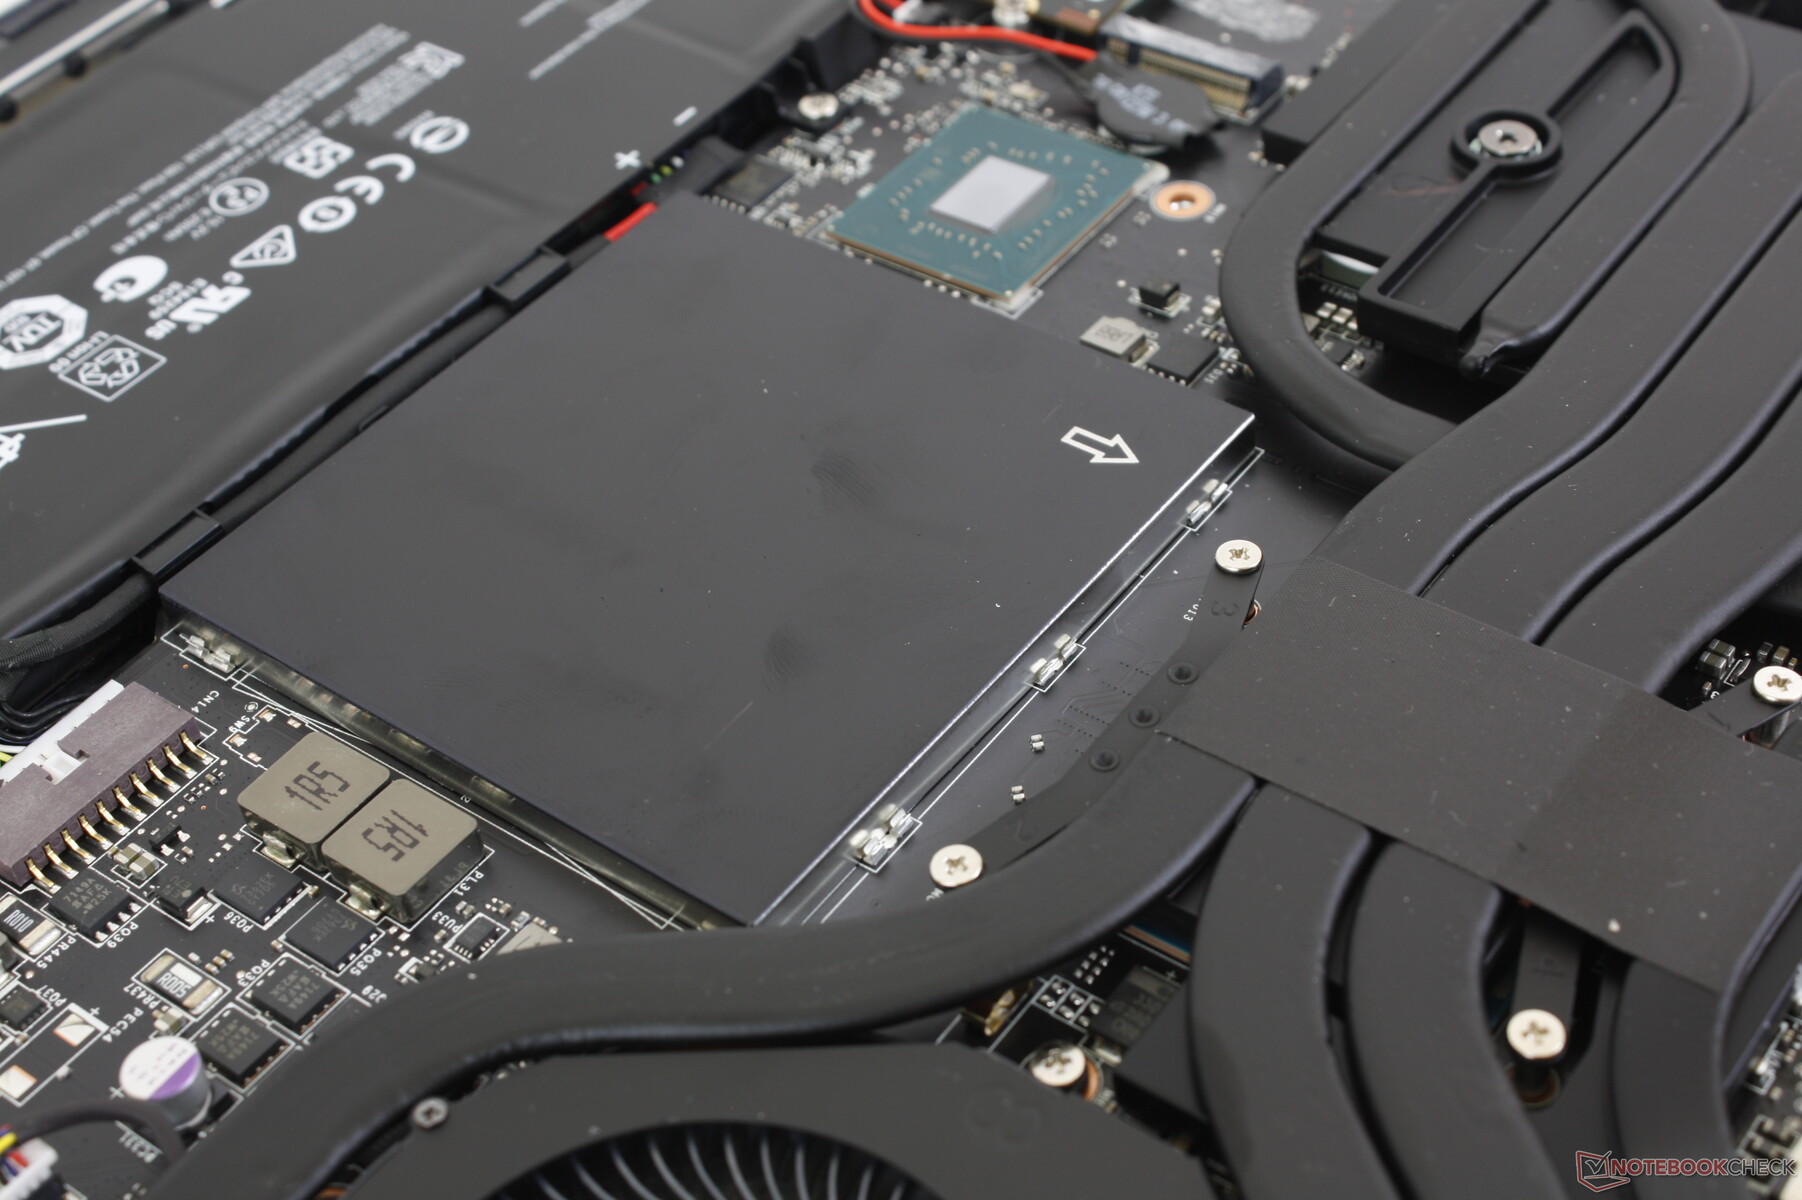
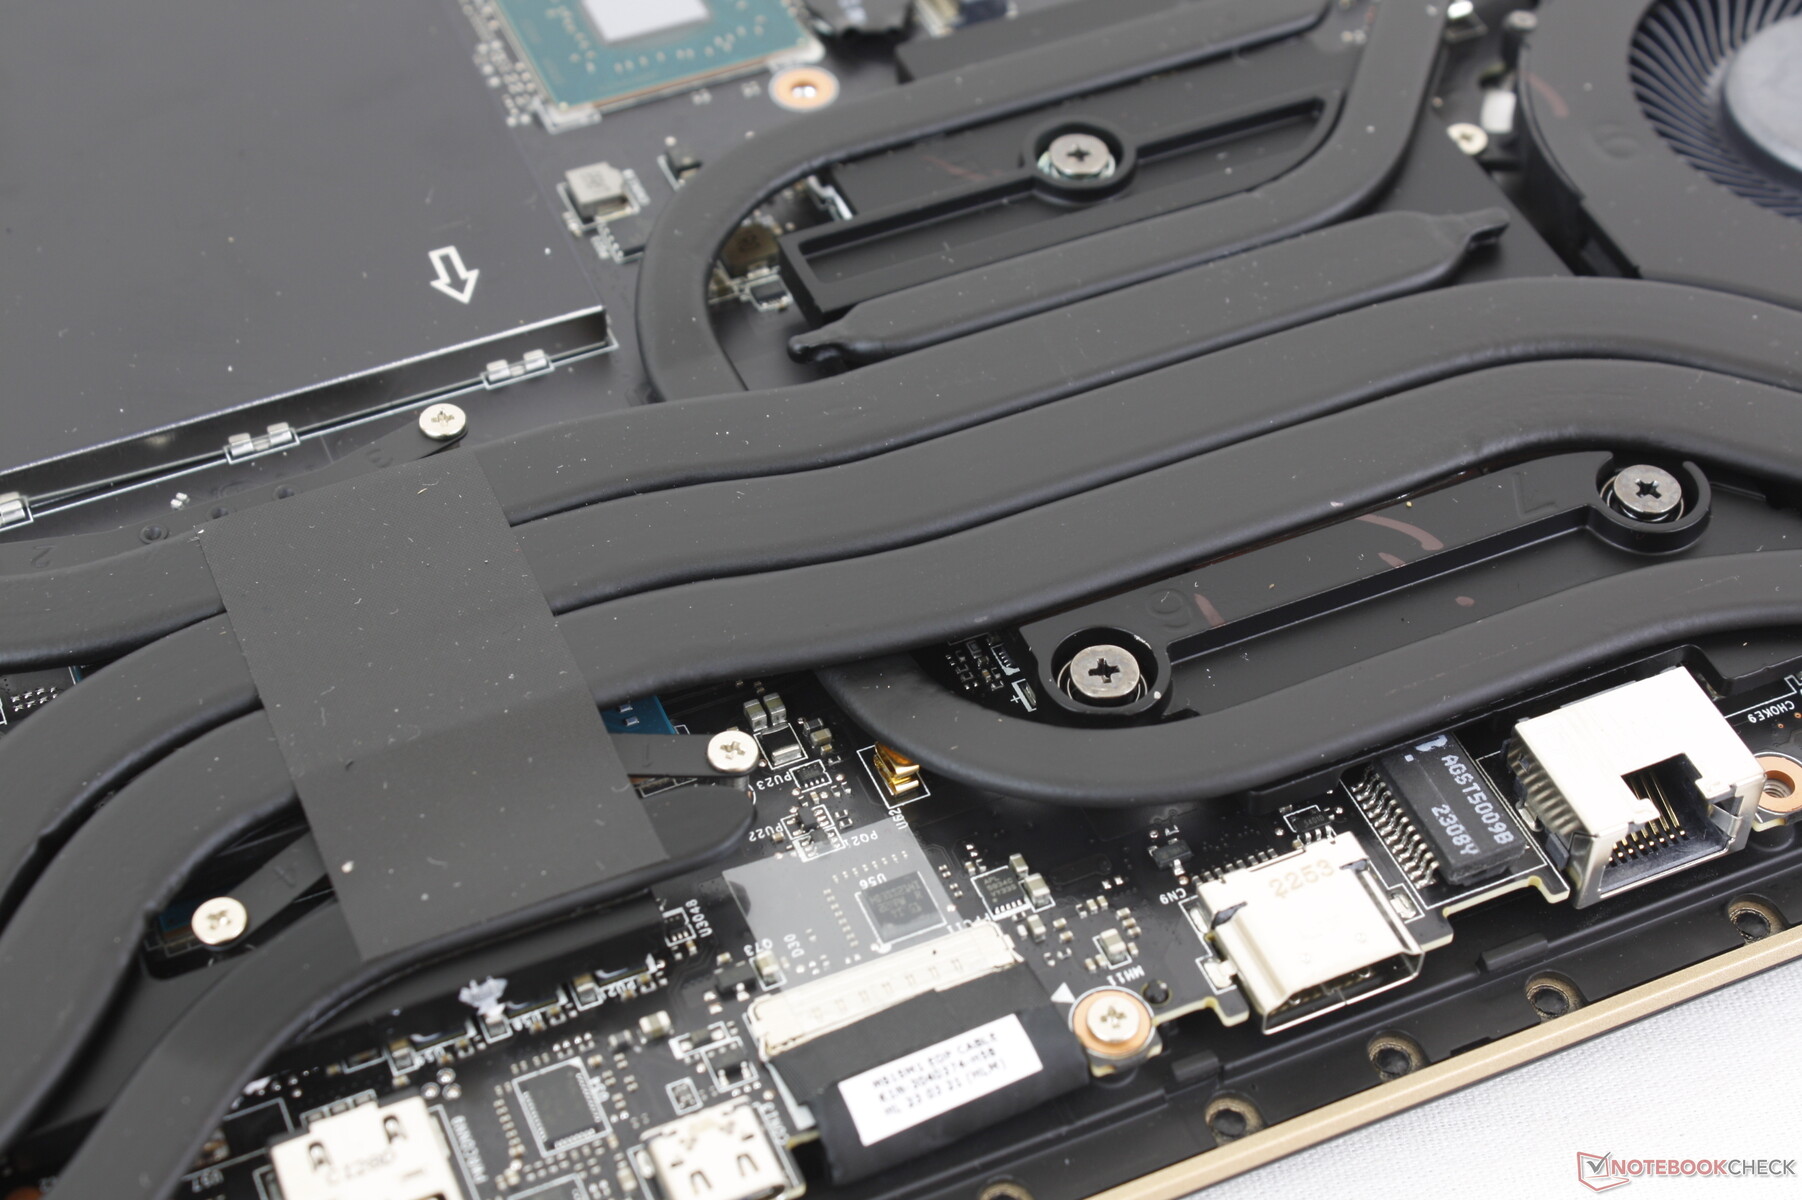
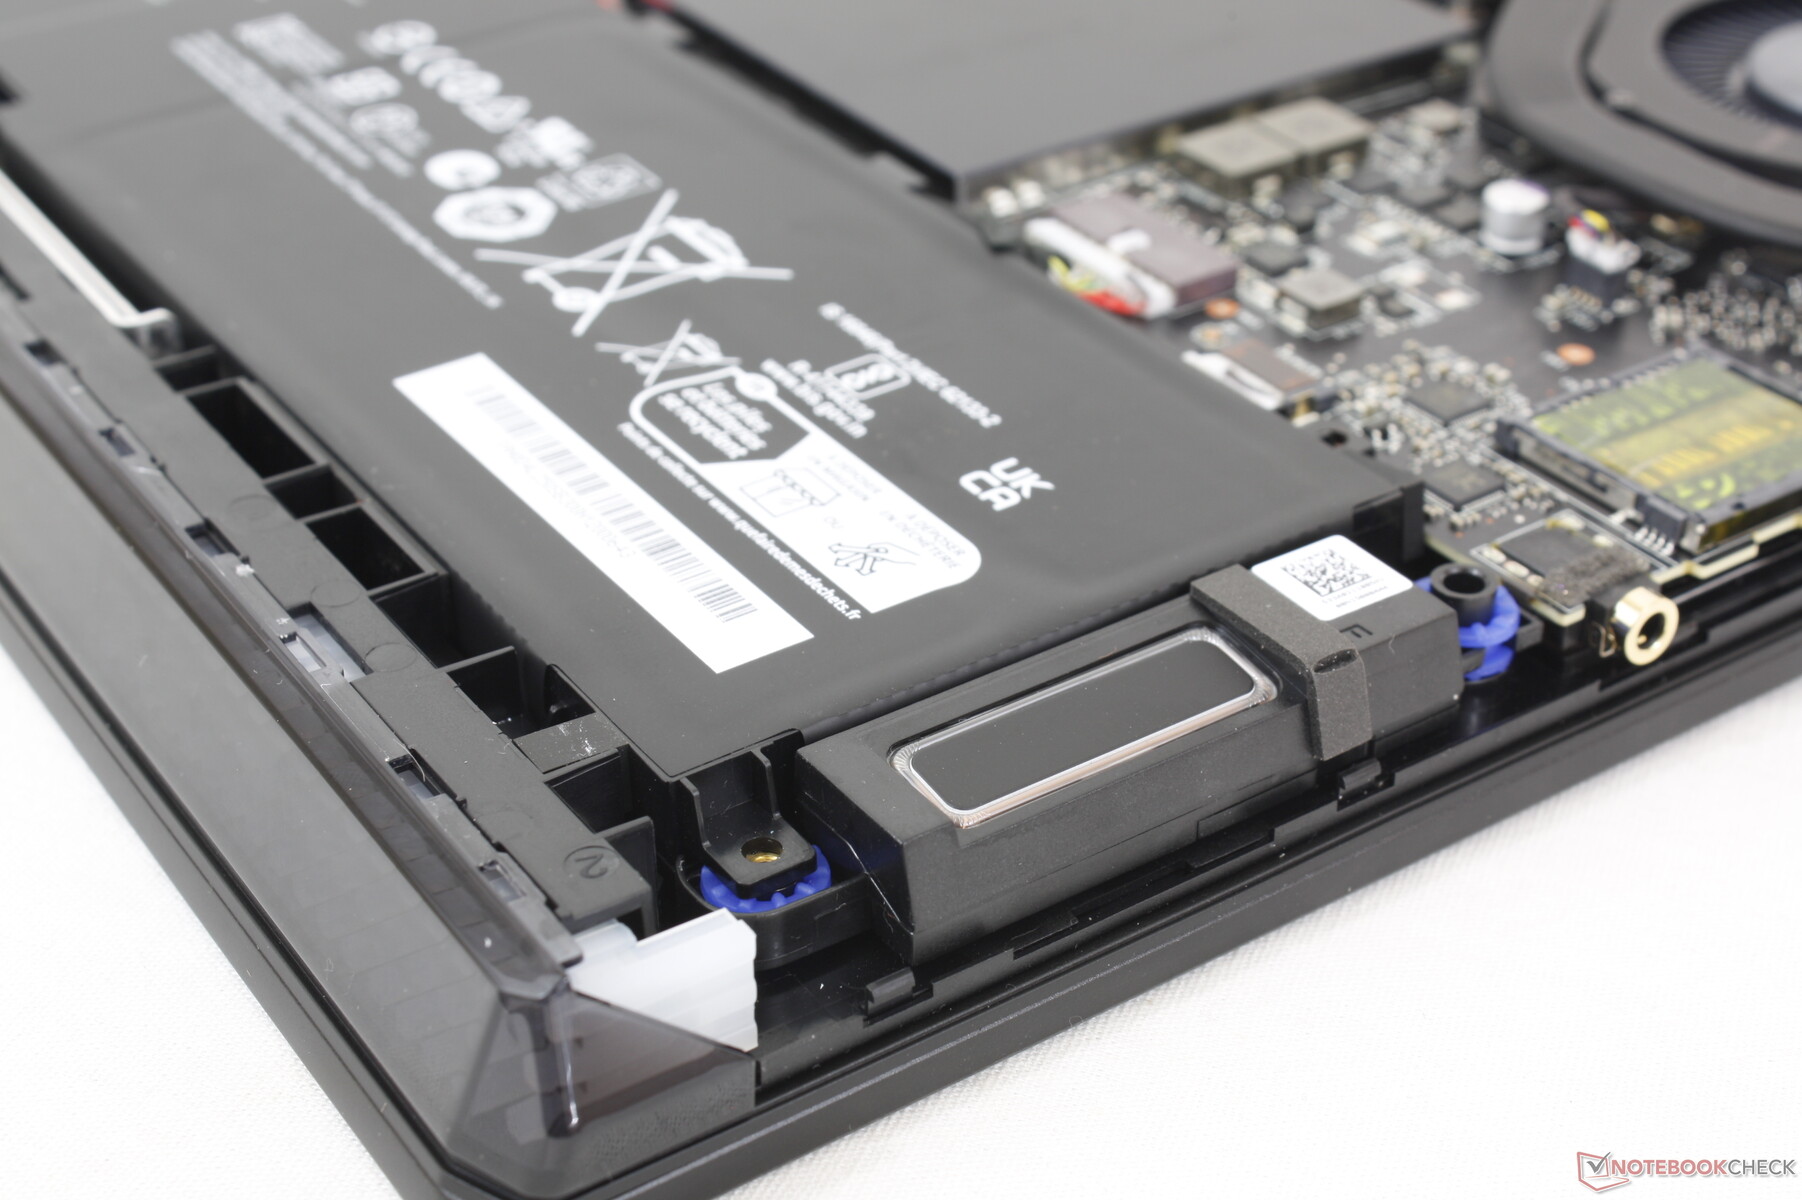
Bakım
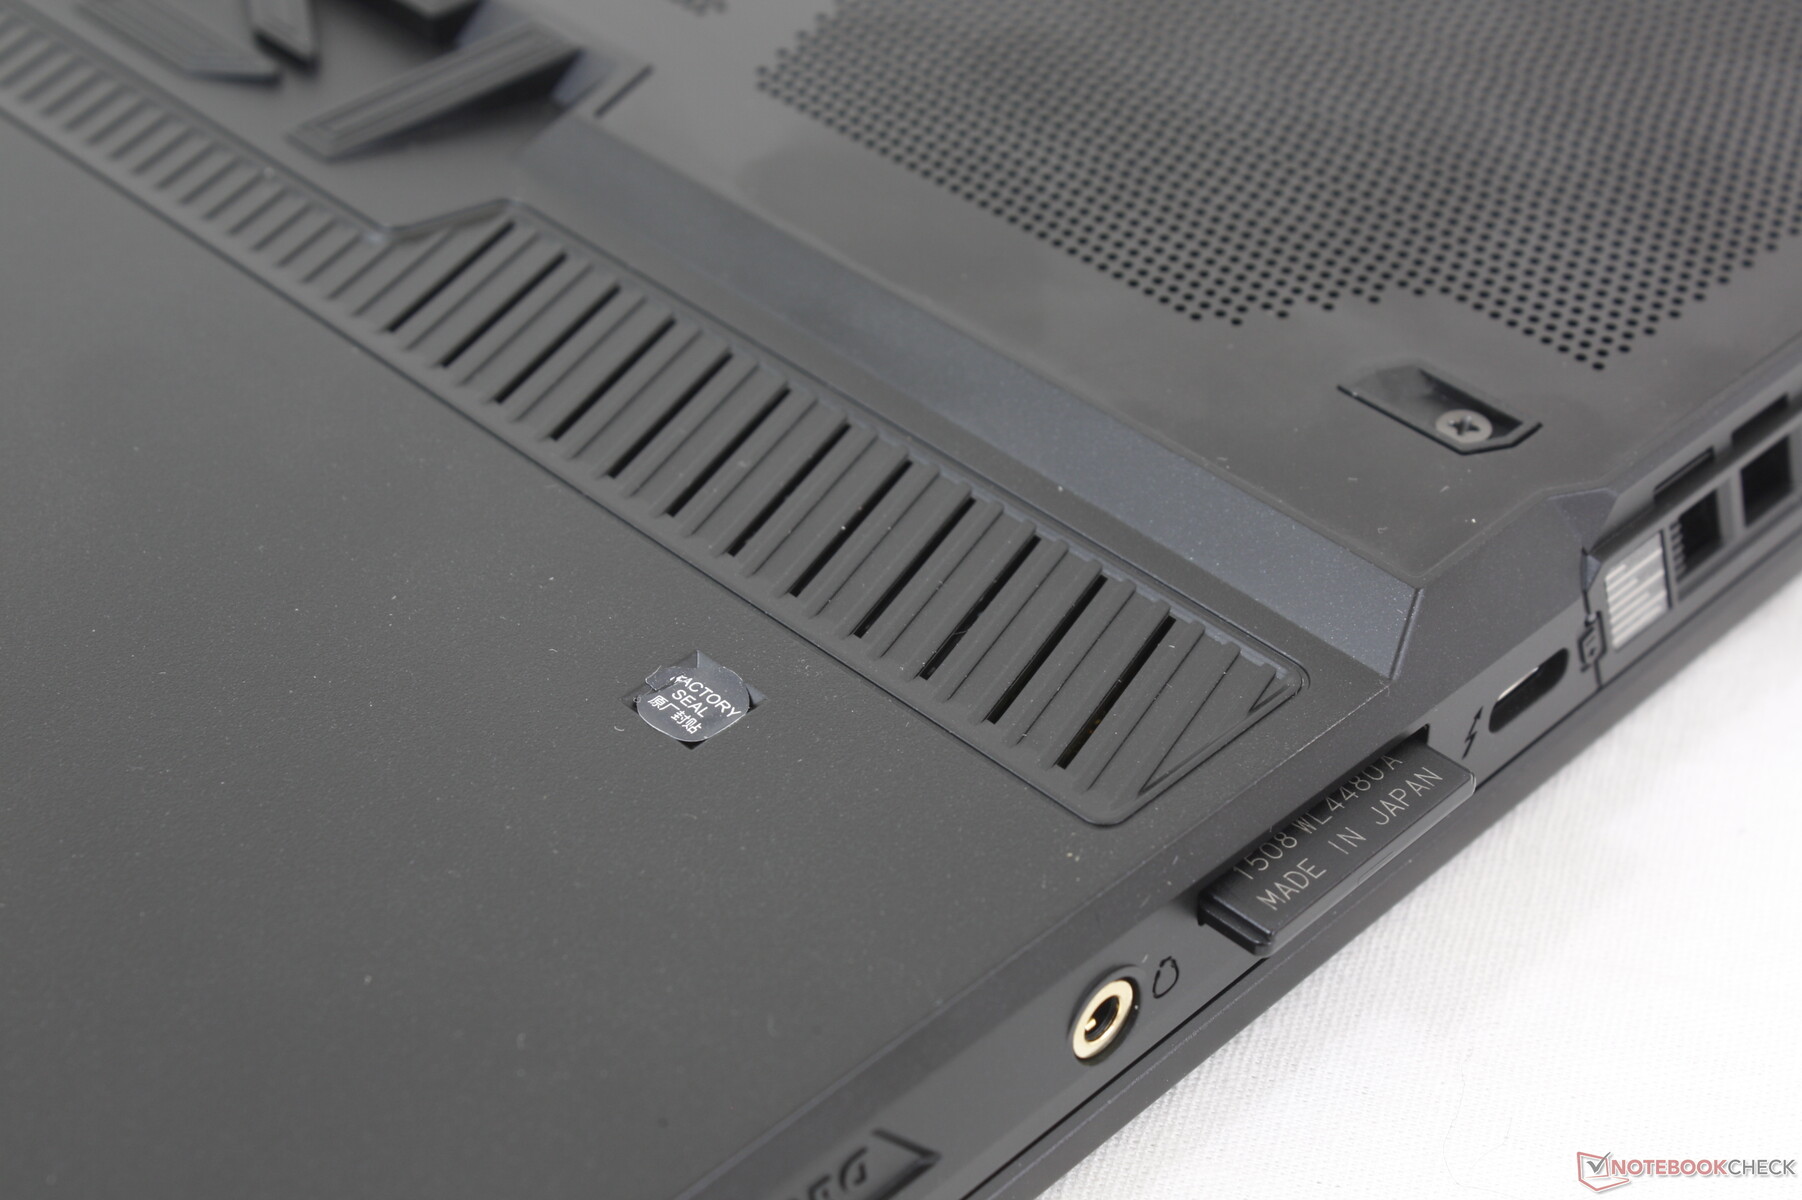
Ne yazık ki MSI dizüstü bilgisayarlara servis vermek günümüzde giderek zorlaşıyor. Alt panel 13 adet Phillips vida ile sabitlenmiştir ve bunlardan biri kurcalamaya karşı etiket son kullanıcı servisini caydırmak için. Asıl sorun, panelin kenarları boyunca uzanan plastik kancaların açılı olması ve özellikle arka kısım boyunca tabana sıkıca kilitlenmesidir. Bu kancaların çıkarılması zordur ve yeniden takılması daha da zordur.
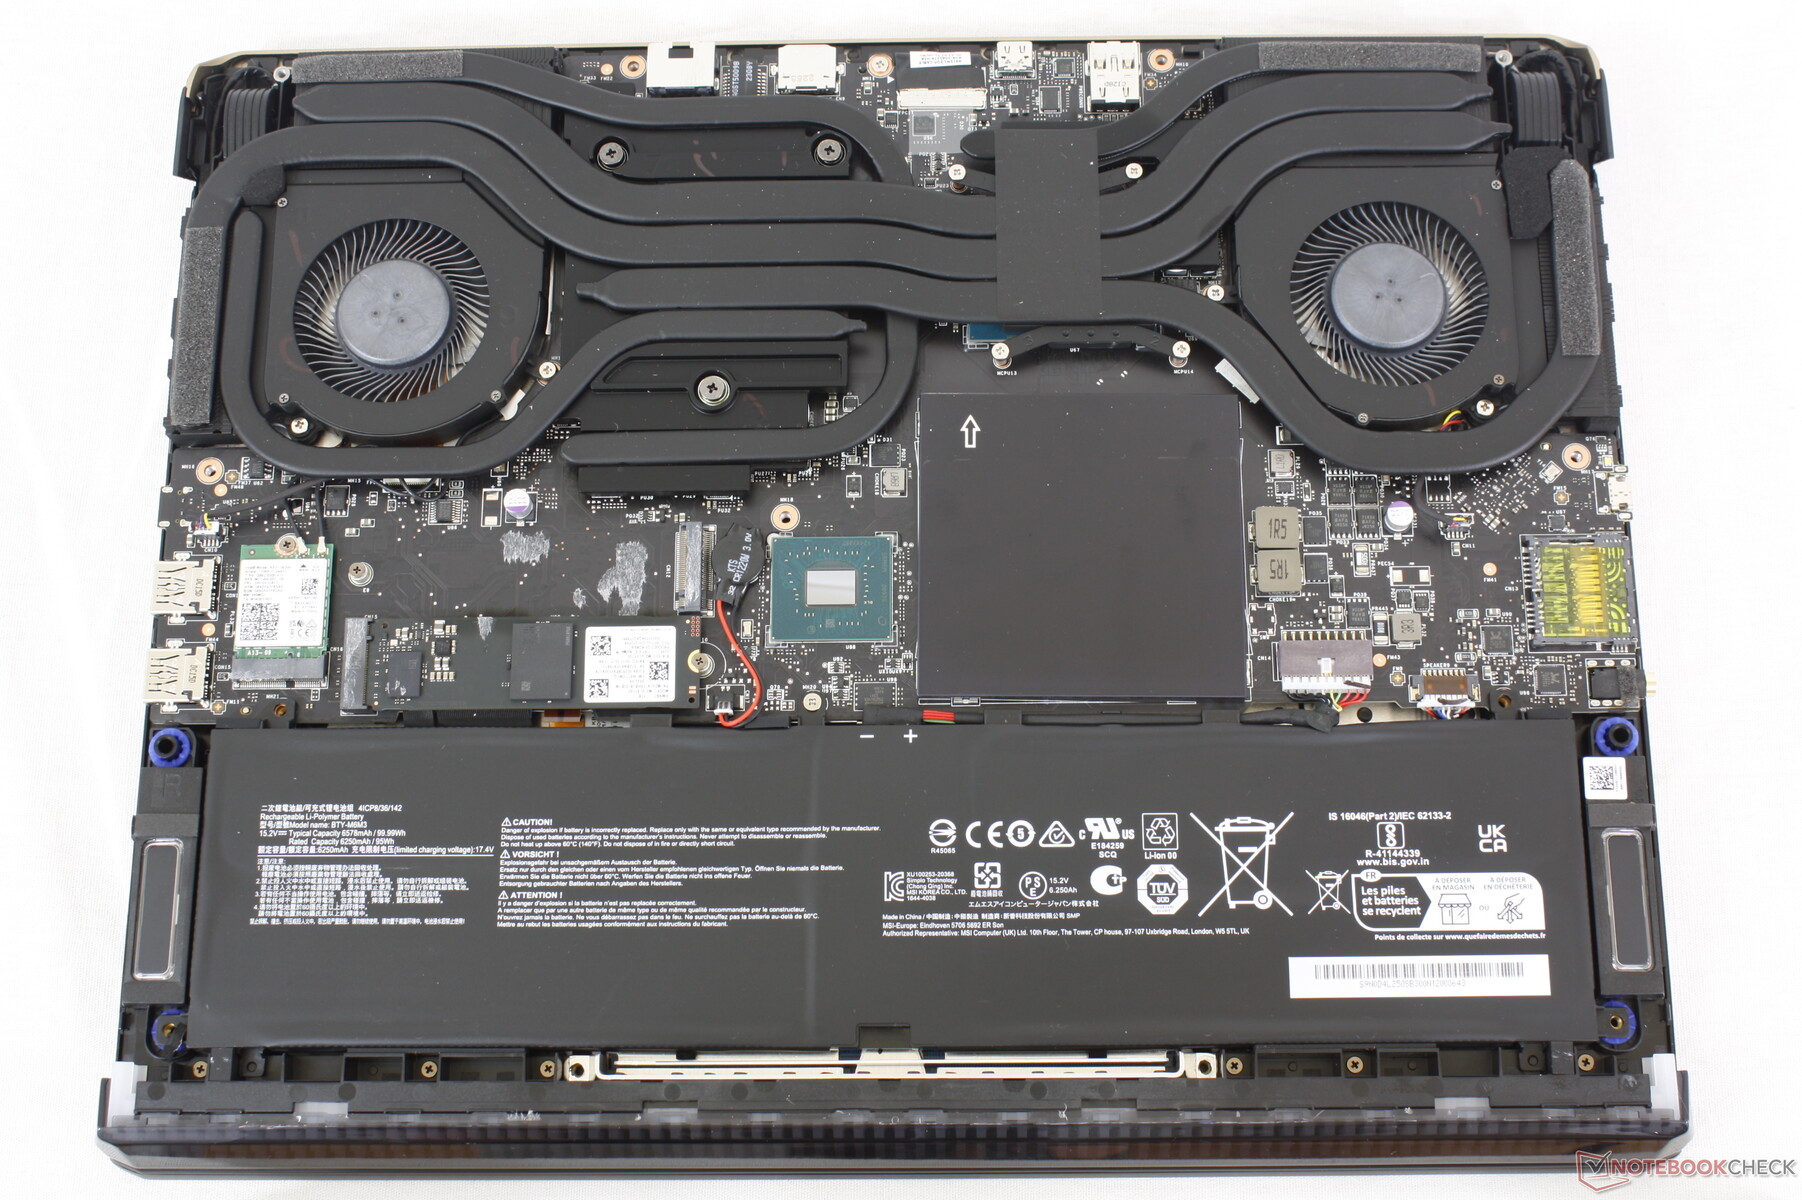
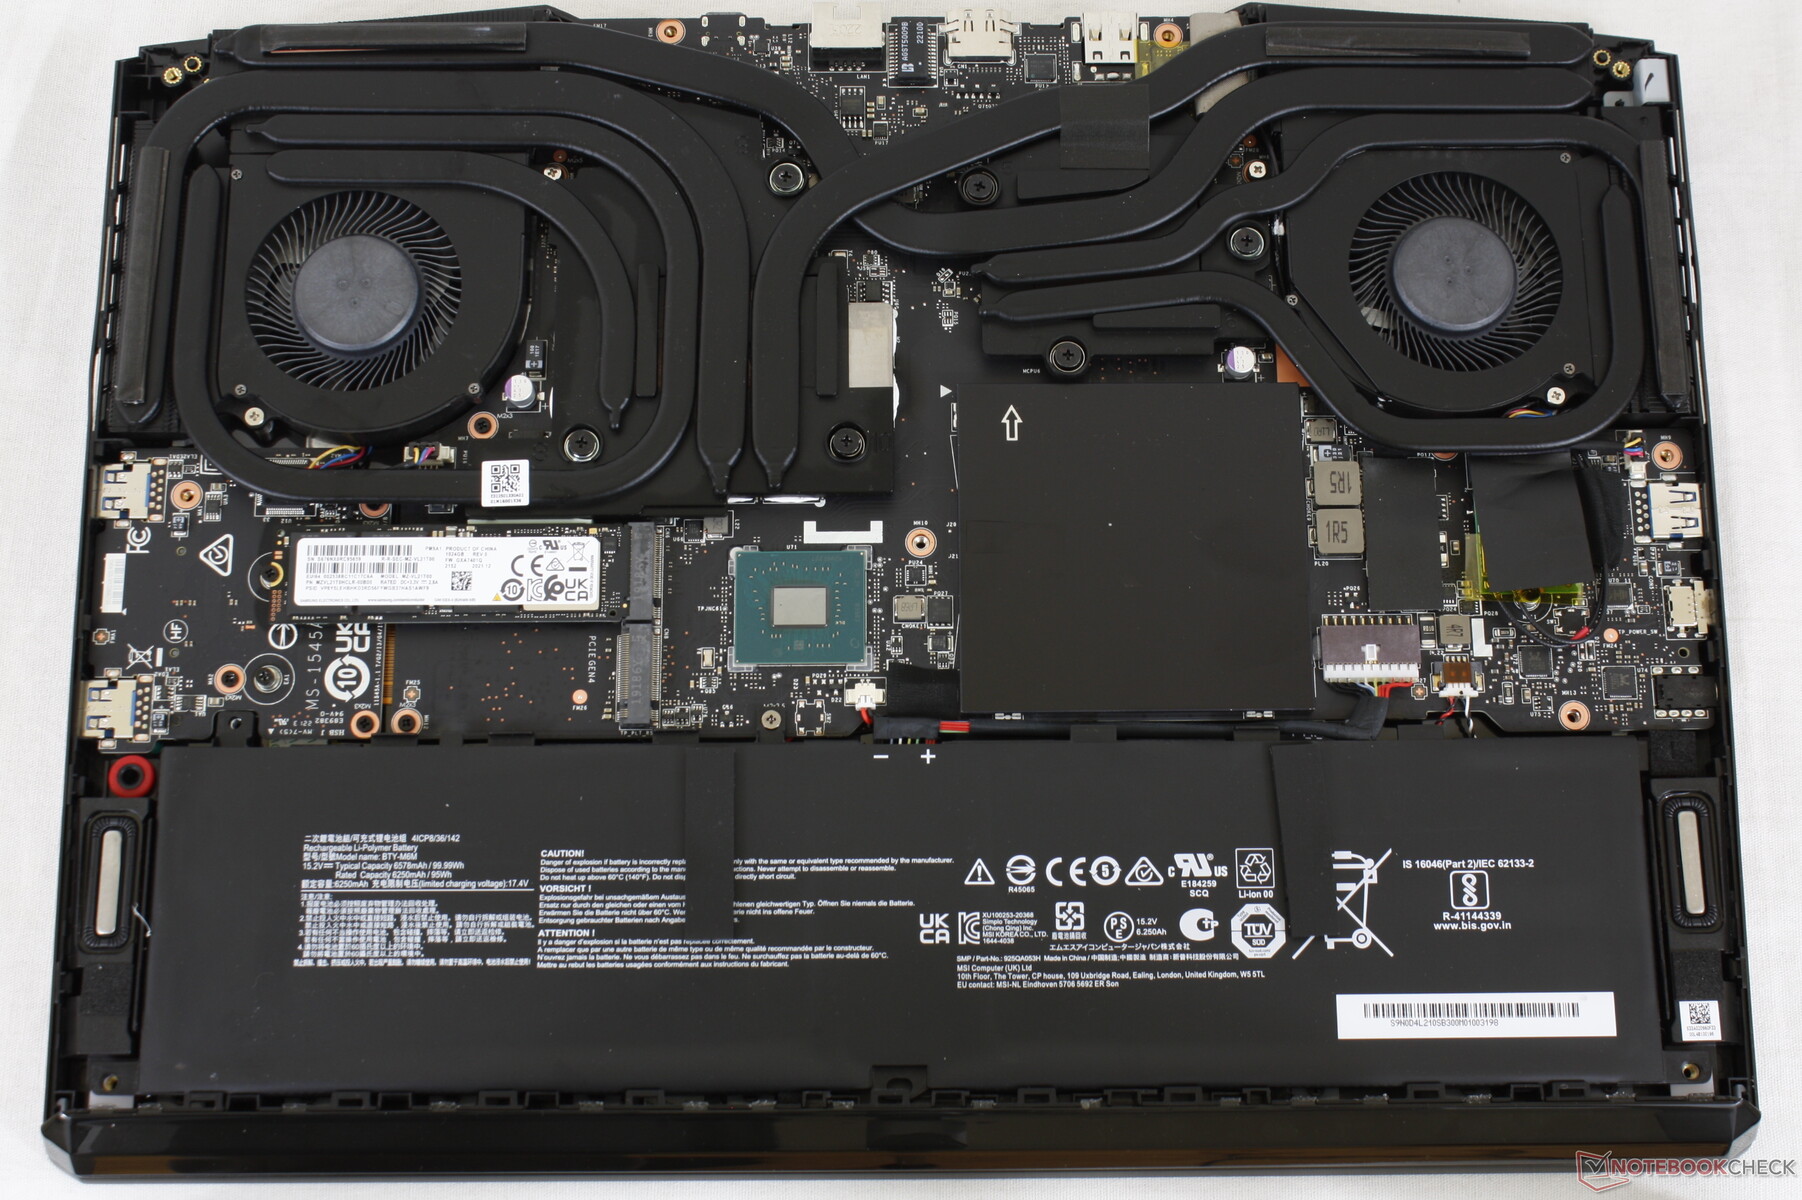
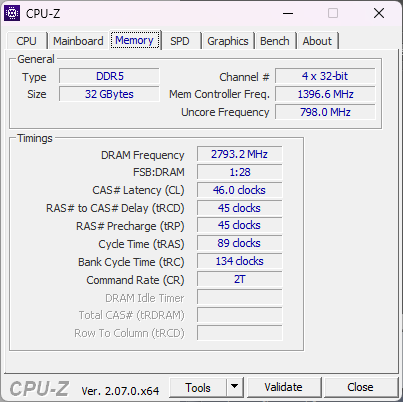
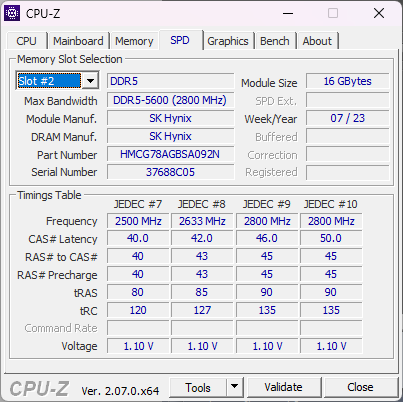
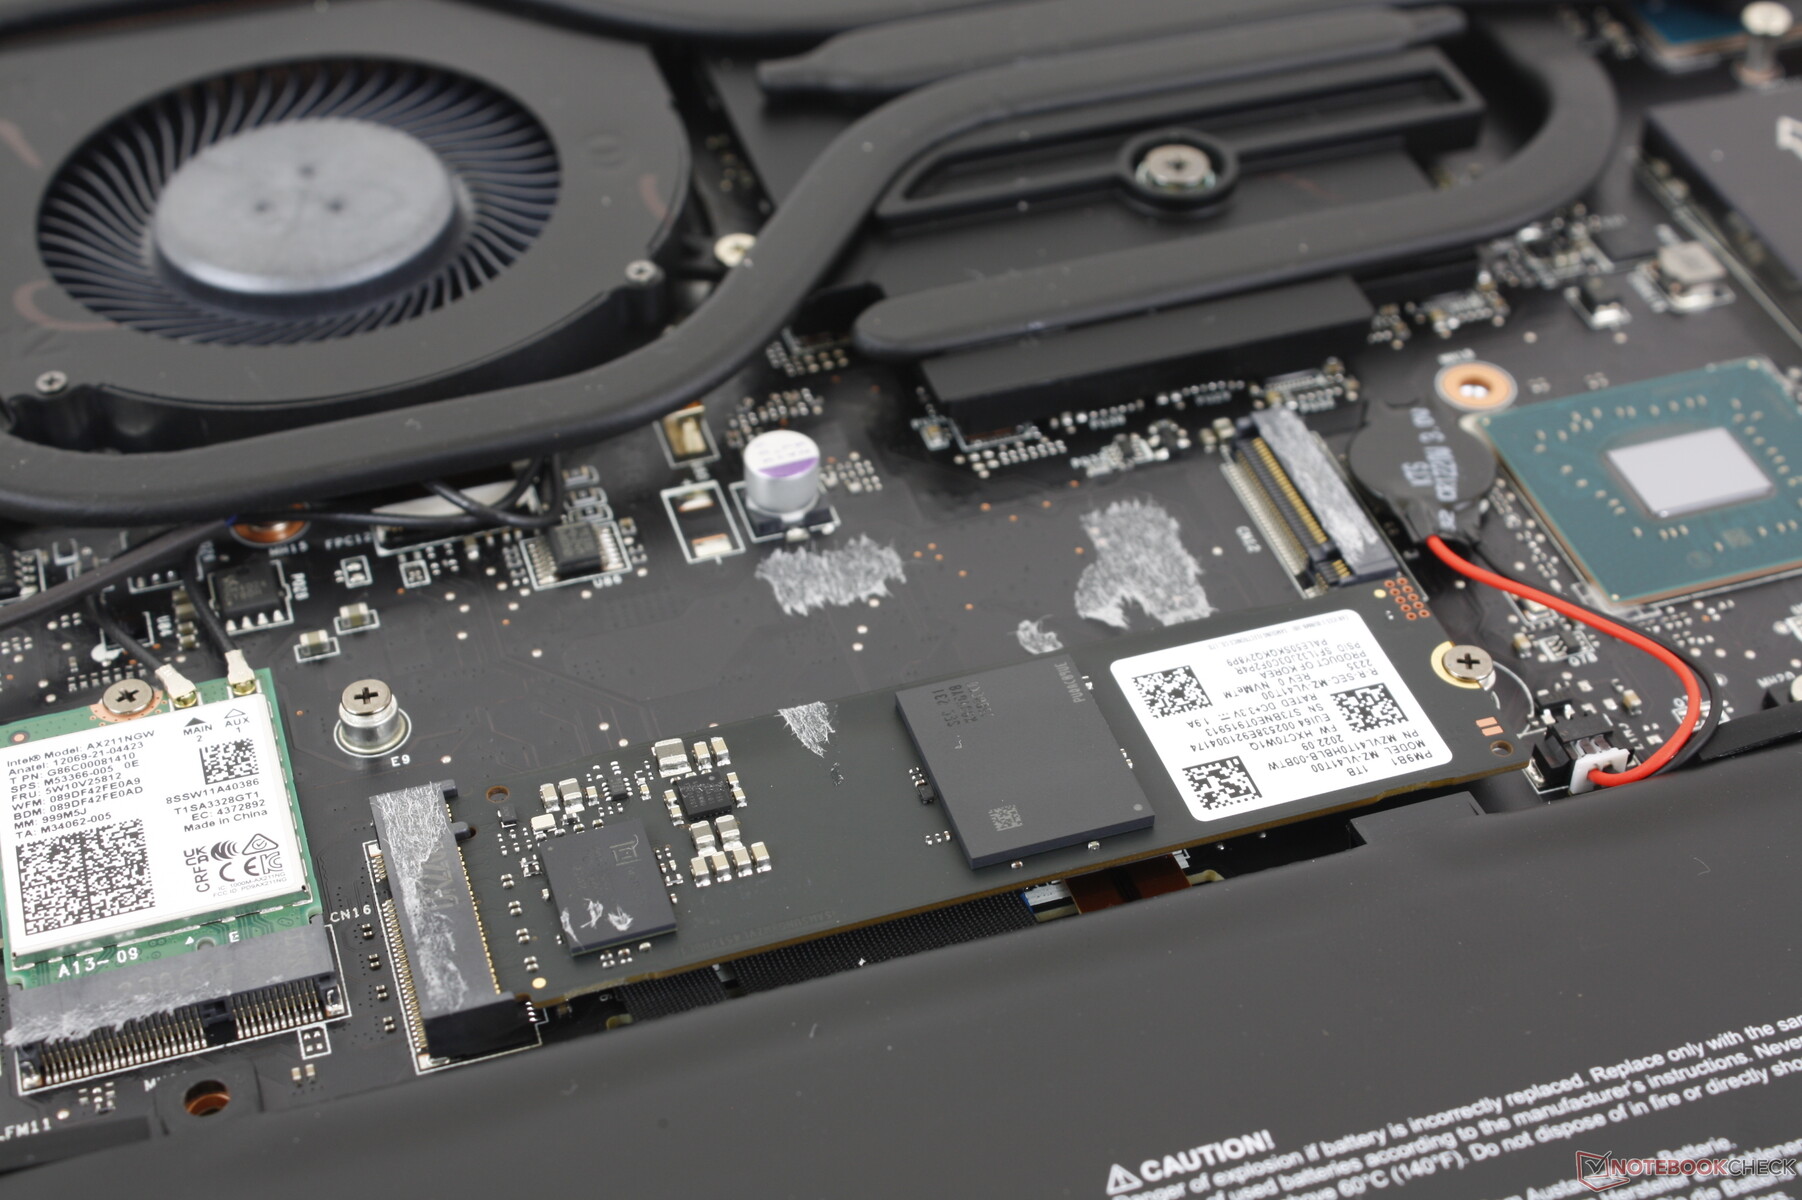
Kullanıcılar iki M.2 2280 depolama yuvasına, iki DDR5 SODIMM yuvasına, WLAN modülüne ve bataryaya içeriden doğrudan erişebilir.
Aksesuarlar ve Garanti
Perakende kutusunda AC adaptörü ve evraklara ek olarak bir temizleme bezi de bulunmaktadır. ABD'de satın alındığında bir yıllık sınırlı üretici garantisi geçerlidir.
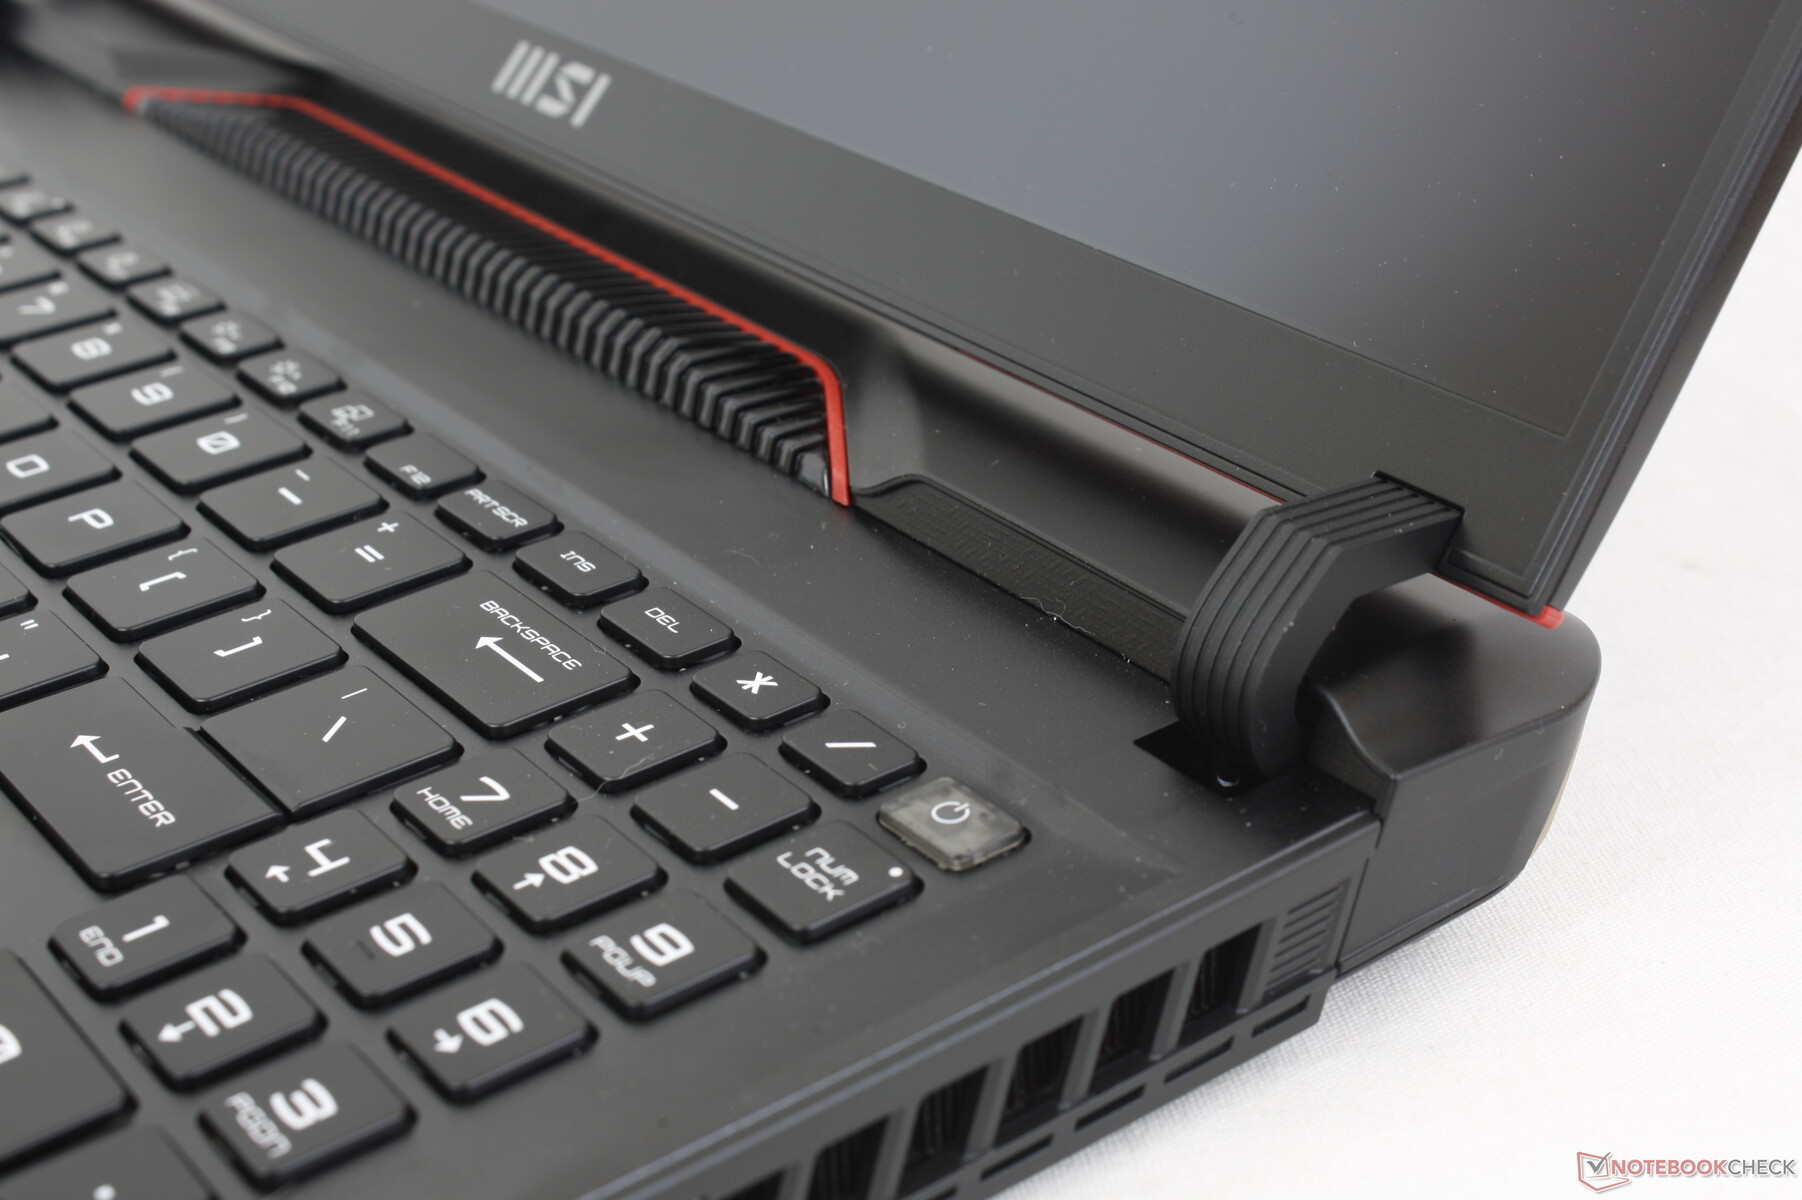
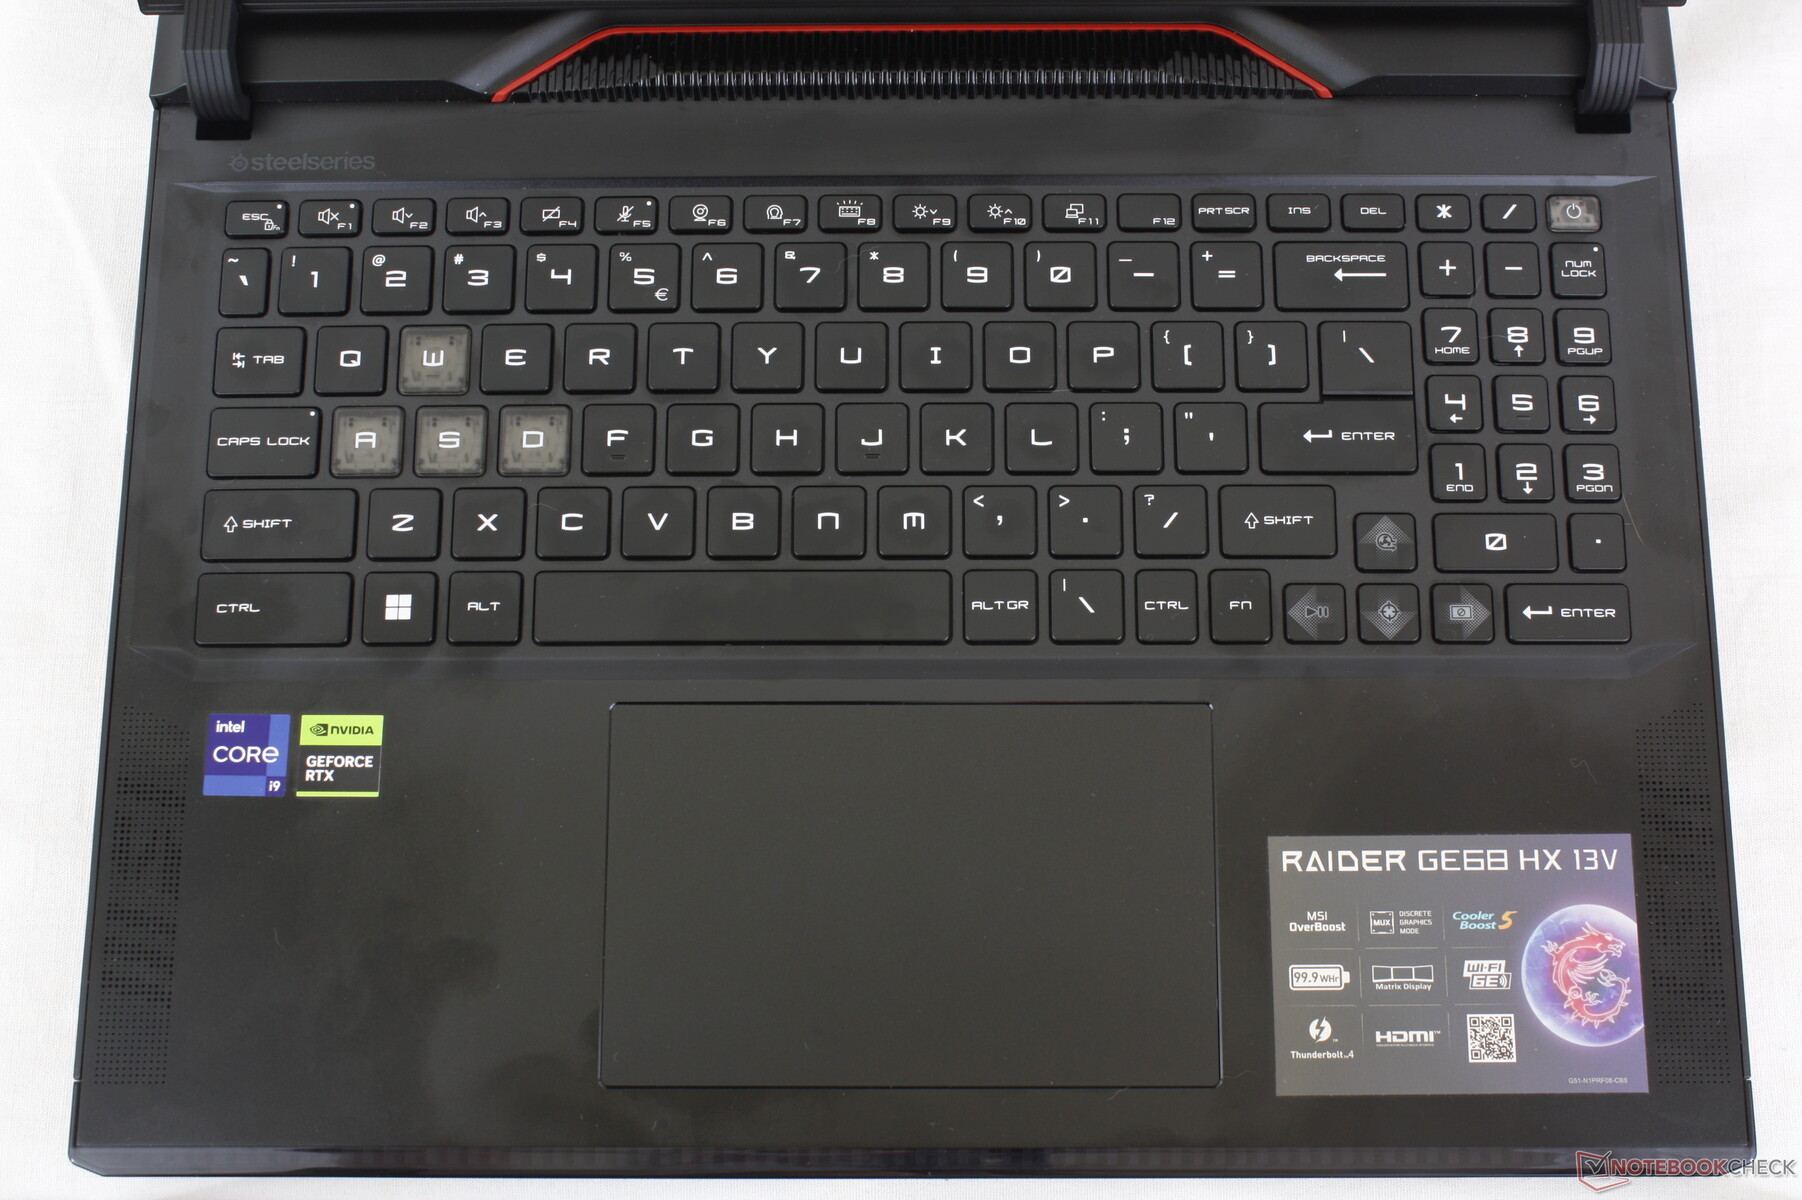
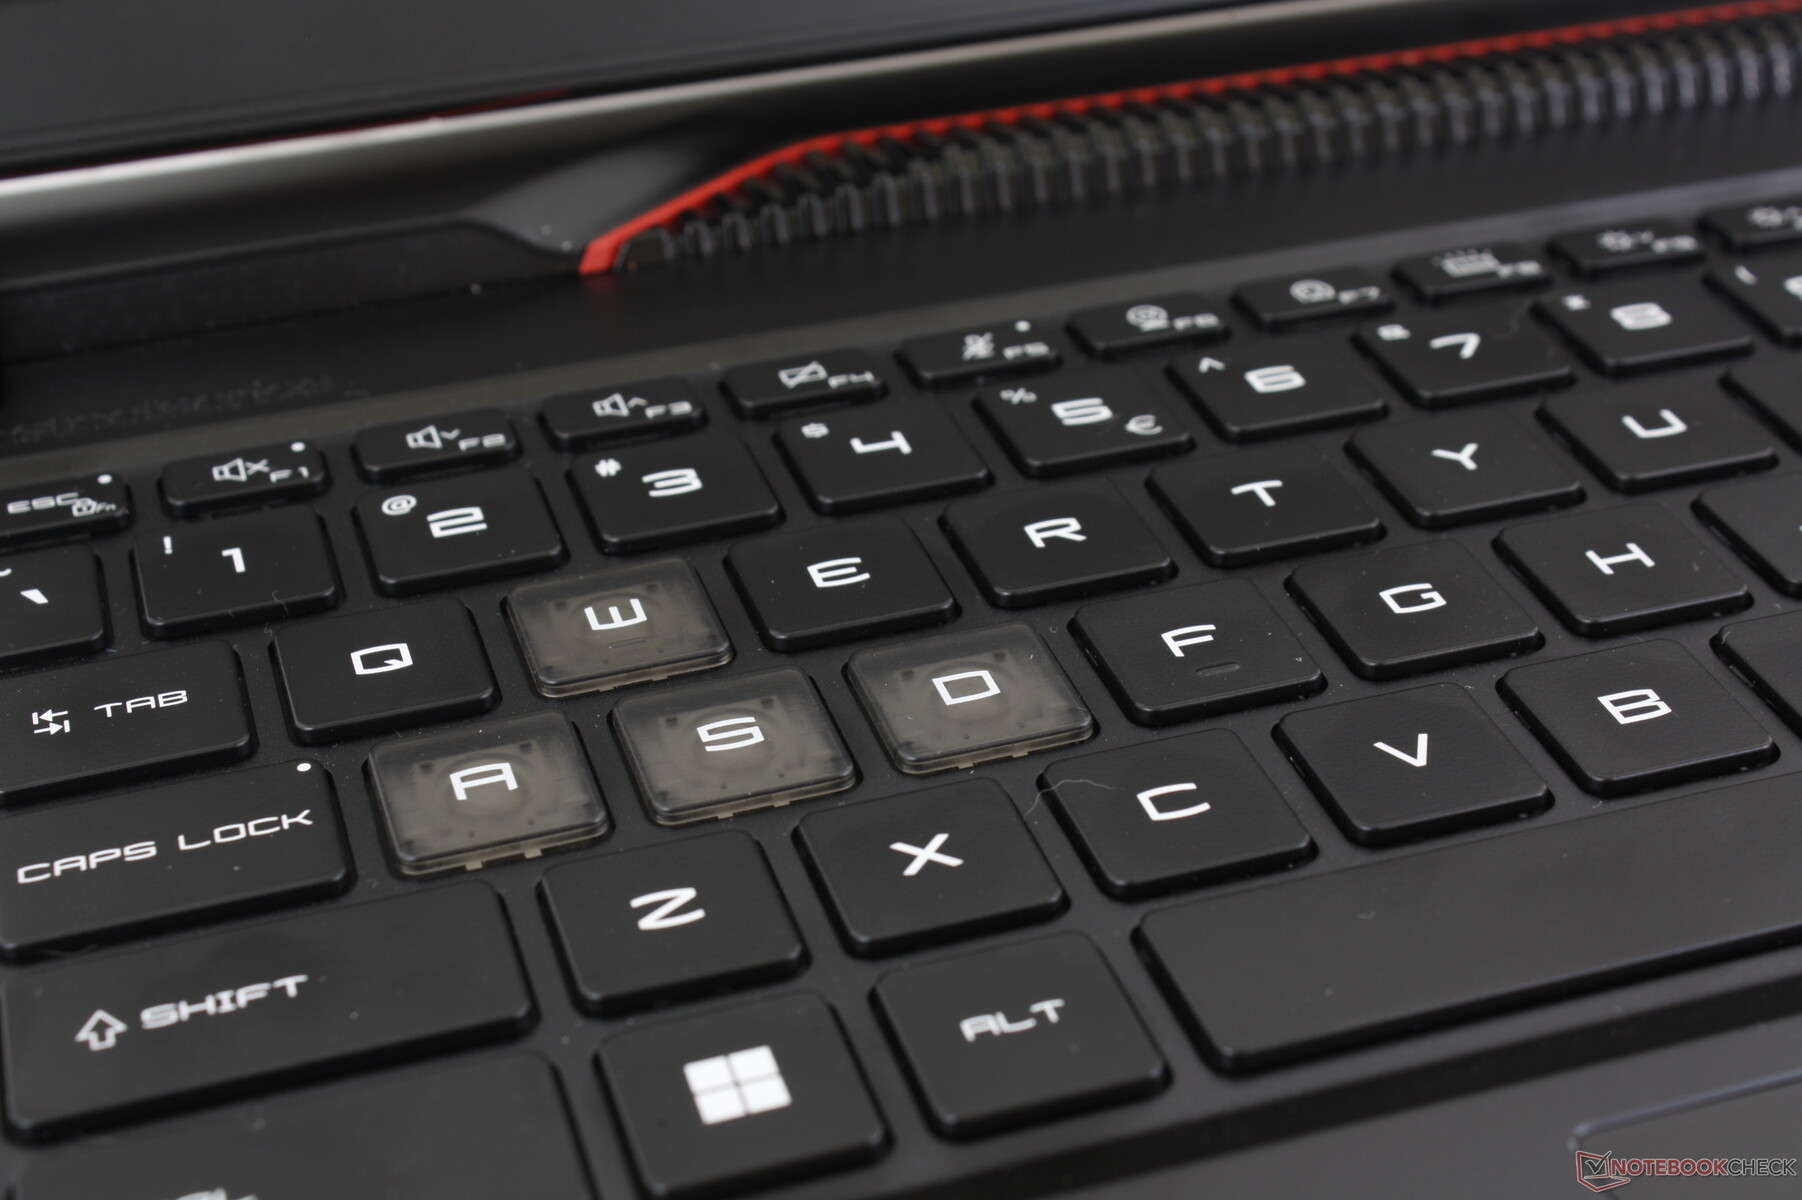
Giriş Aygıtları - Daha Büyük Clickpad ve Yeni Numpad
Klavye
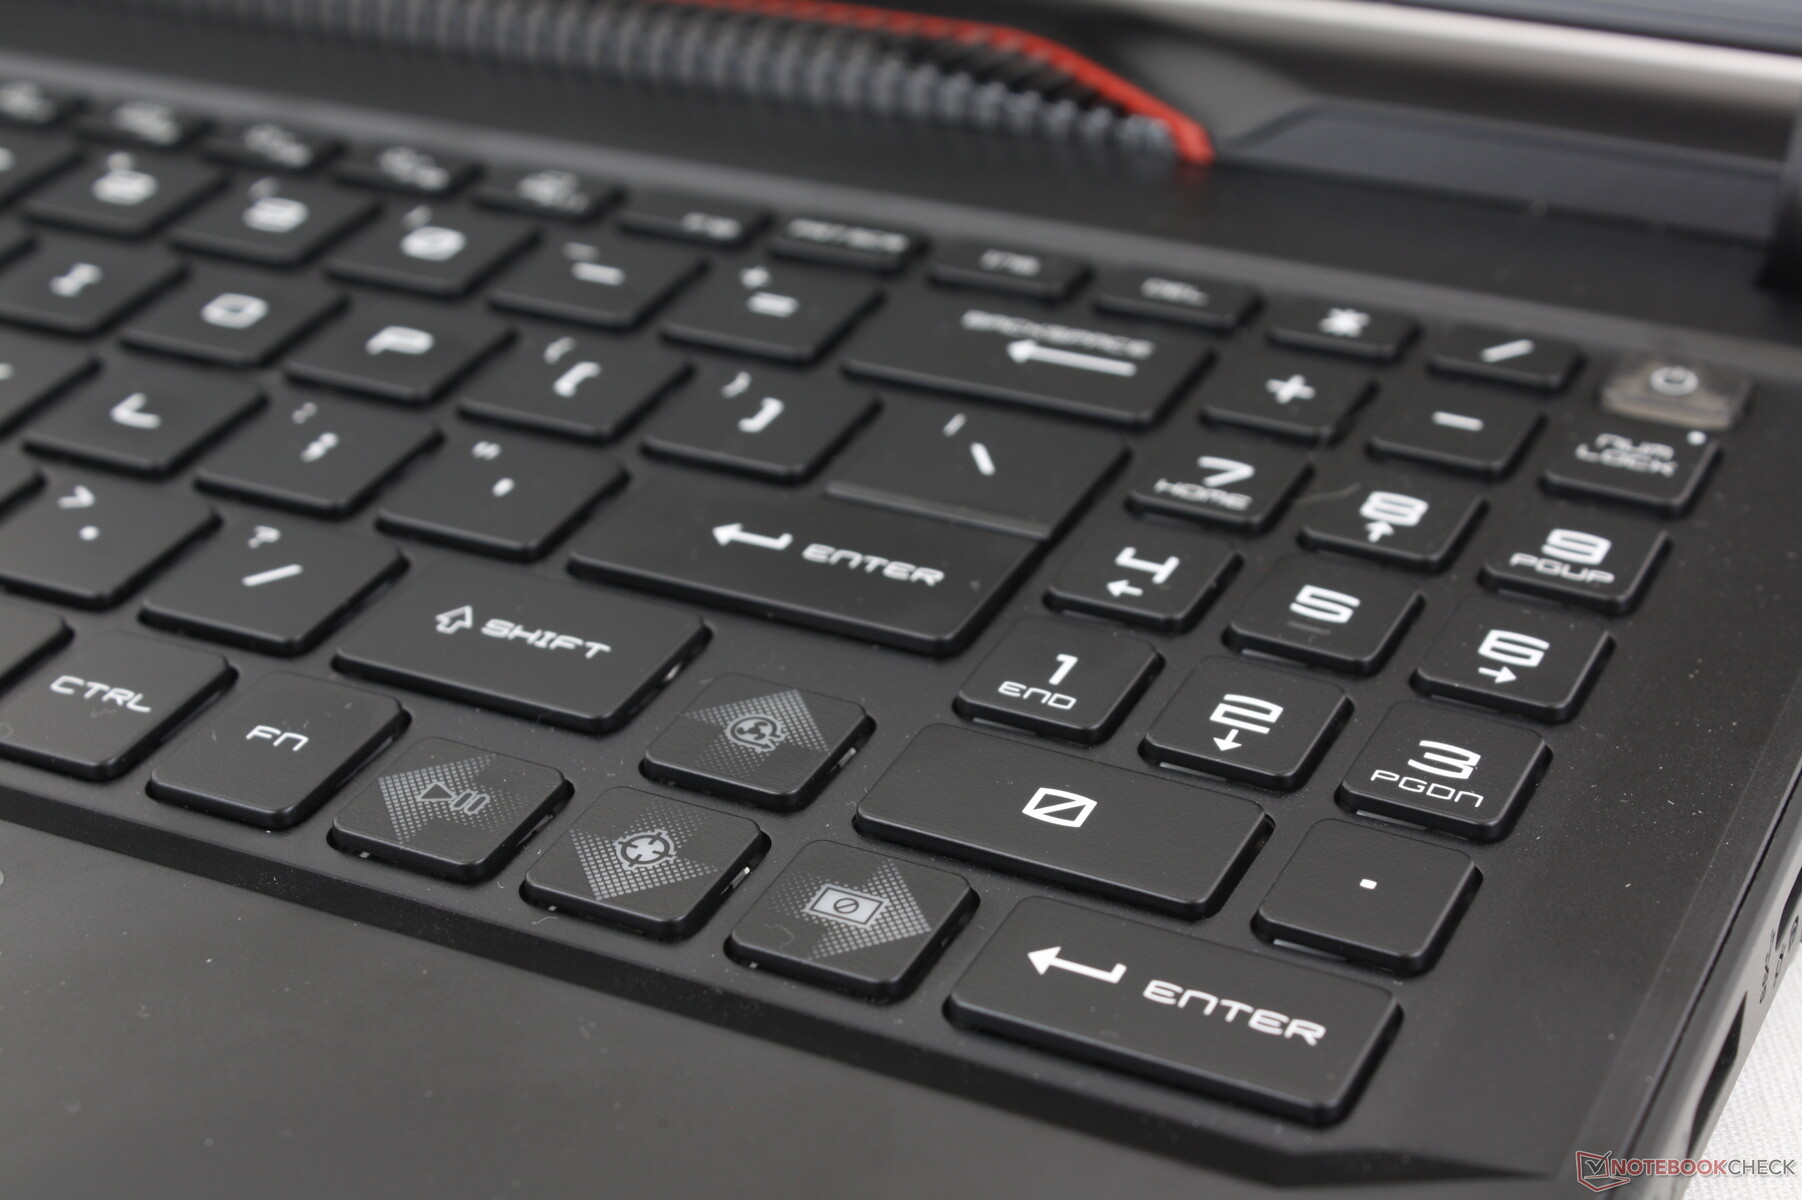
MSI, GE67HX ile karşılaştırıldığında klavye düzenini yeniledi. Artık entegre bir numpad bulunurken, Ctrl ve Fn tuşları artık garip bir şekilde birbirine sıkıştırılmamış. Ne yazık ki, yeni numpad'e yer açmak için ok tuşlarının boyutu küçültülmüş.
Tuş geri bildirimi, ana QWERTY tuşları arasında sağlam ve düzgün geri bildirim ile mükemmeldir. Özellikle Boşluk ve Enter tuşları daha tatmin edici bir his için fark edilir derecede daha yüksek.
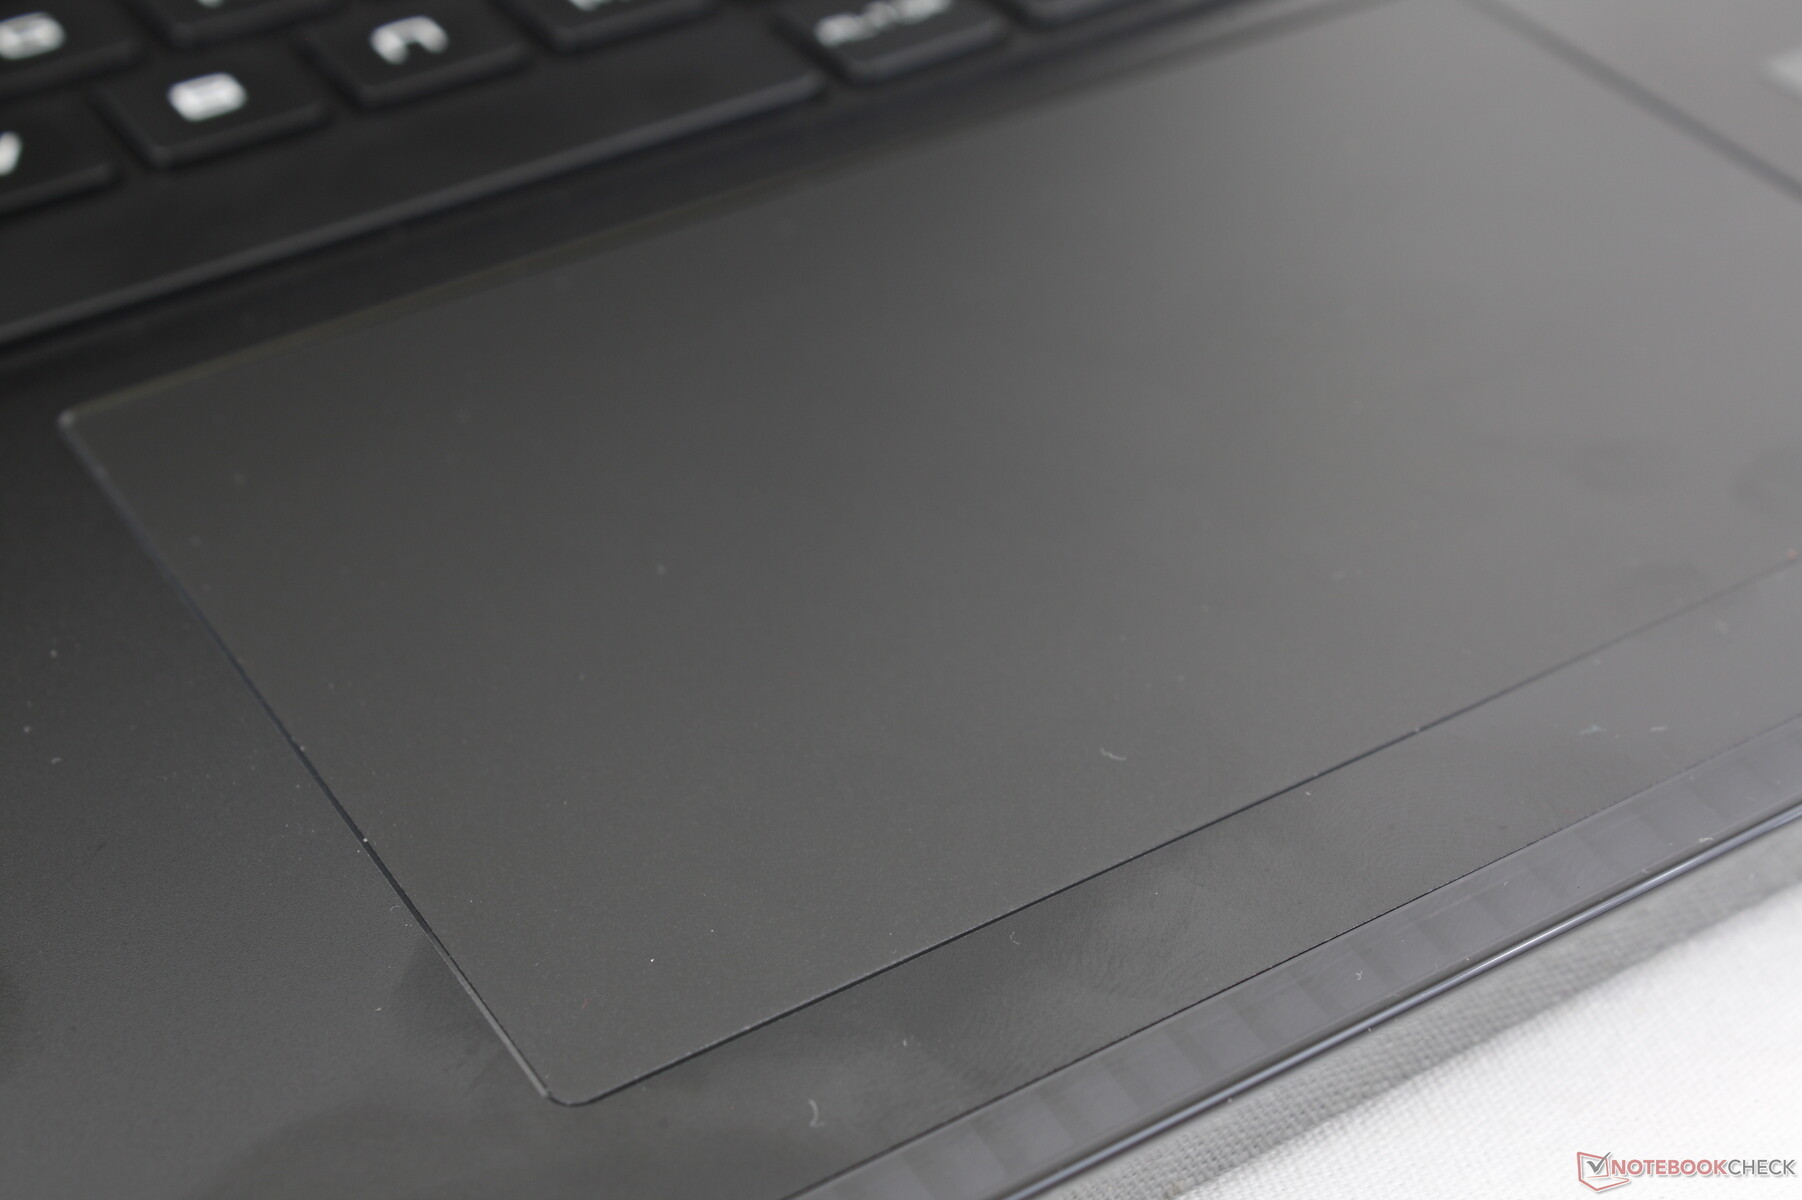
Dokunmatik yüzey
Clickpad boyutu, 10,5 x 6,5 cm'den önemli ölçüde artmıştır GE67HX gE68HX'te 13 x 8,3 cm. Kayma çok akıcı ve duyarlı ve düşük hızlarda hareket ederken bile neredeyse hiç takılma yok. Tıklama da tatmin edici, ancak merkeze doğru bastırıldığında daha fazla tıklama hissi verirken alt köşeler daha süngerimsi hissettirdiğinden geri bildirim tam olarak eşit değil.
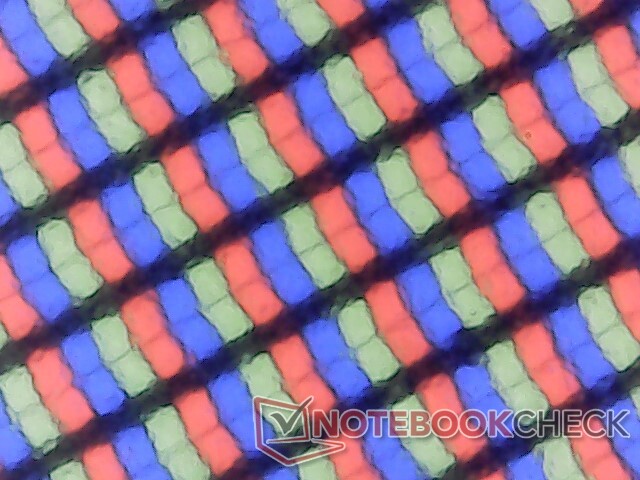
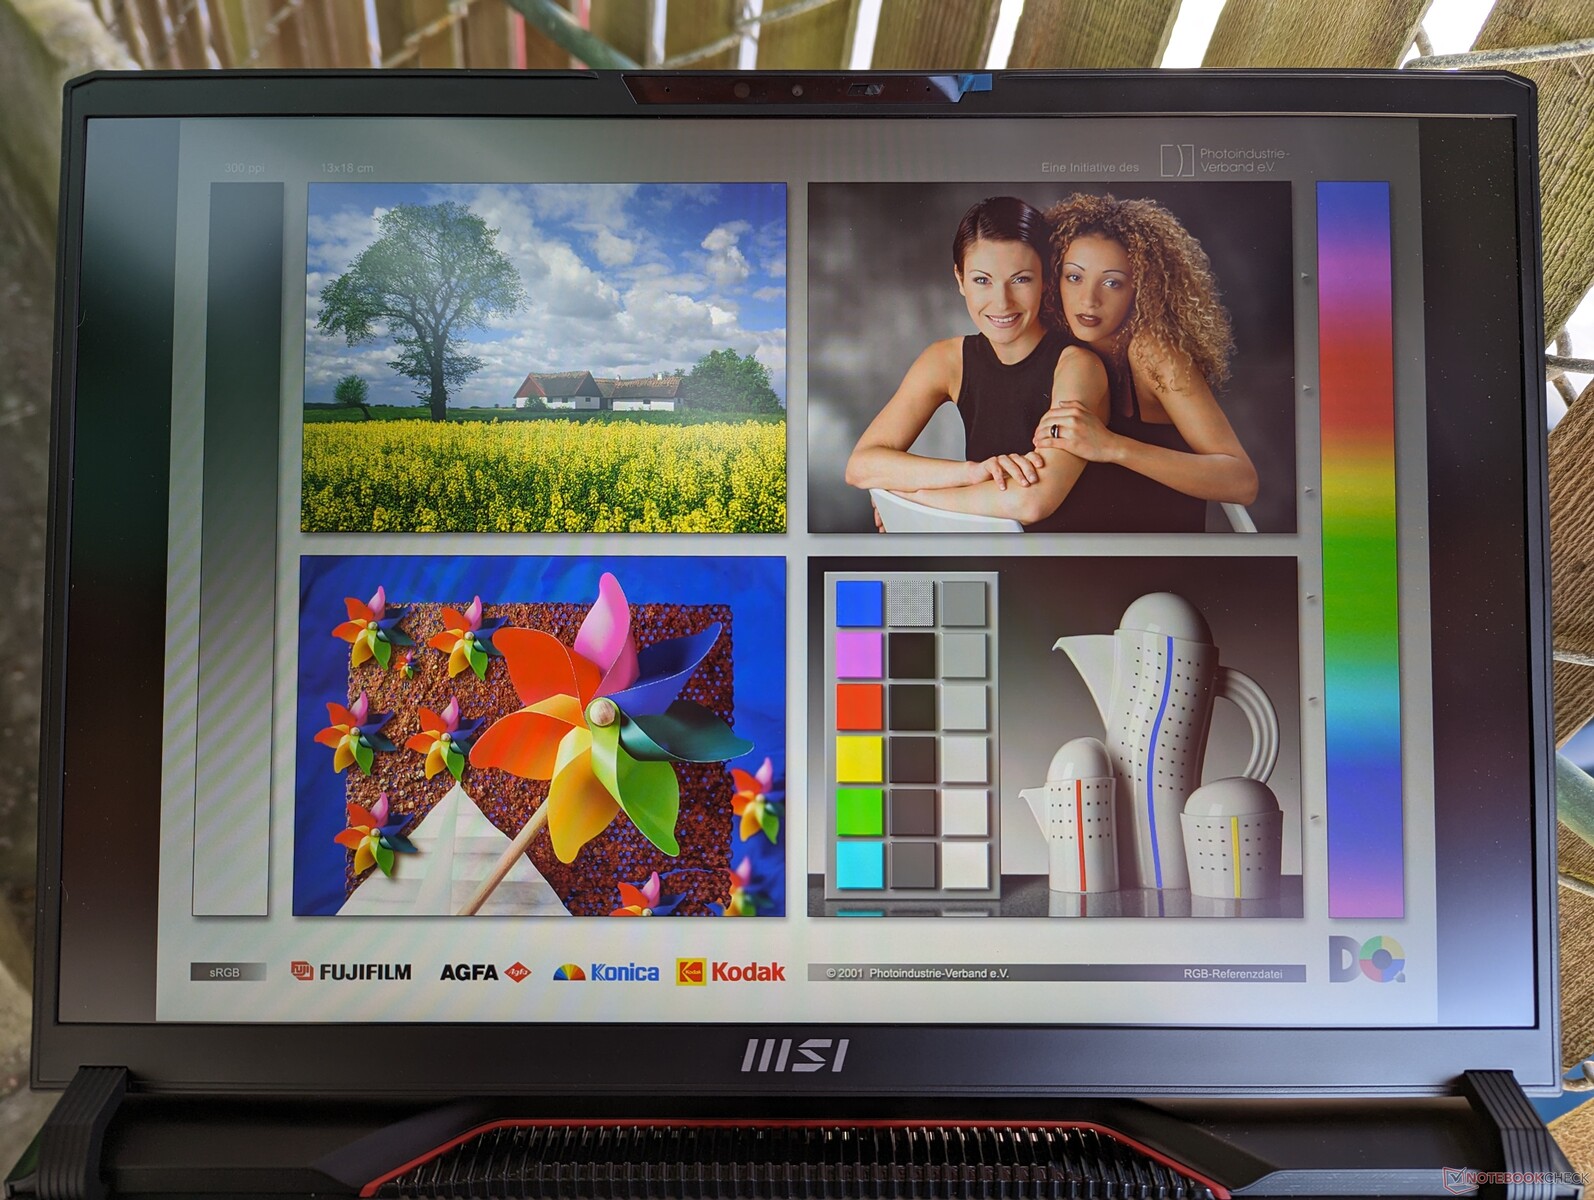
Ekran - Zayıf Renkler
Raider GE68HX iki farklı panel seçeneğiyle birlikte gelir. Bizim özel inceleme ünitemiz aşağıdaki kalınlaştırılmış seçenekle geliyor:
- 2560 x 1600, 240 Hz, %100 DCI-P3, 3 ms, IPS
- 1920 x 1200, 144 Hz, %60 sRGB, 11 ms, IPS
Daha ucuz olan 144 Hz seçeneği, daha dar renk kapsamı ve daha belirgin gölgelenme için daha yavaş tepki süreleri nedeniyle önerilmez. Çok fazla grafik düzenleme yapmasanız bile daha sığ renkleri göz ardı etmek zordur. Bu panel, aşağıdaki gibi daha ucuz oyun dizüstü bilgisayarları için daha uygundur MSI Pulse 17 dar renk aralıklarının yaygın olduğu yerlerde.
GE68HX'in mevcut tüm yapılandırmalarında G-Sync'in bulunmaması dikkat çekicidir.
| |||||||||||||||||||||||||
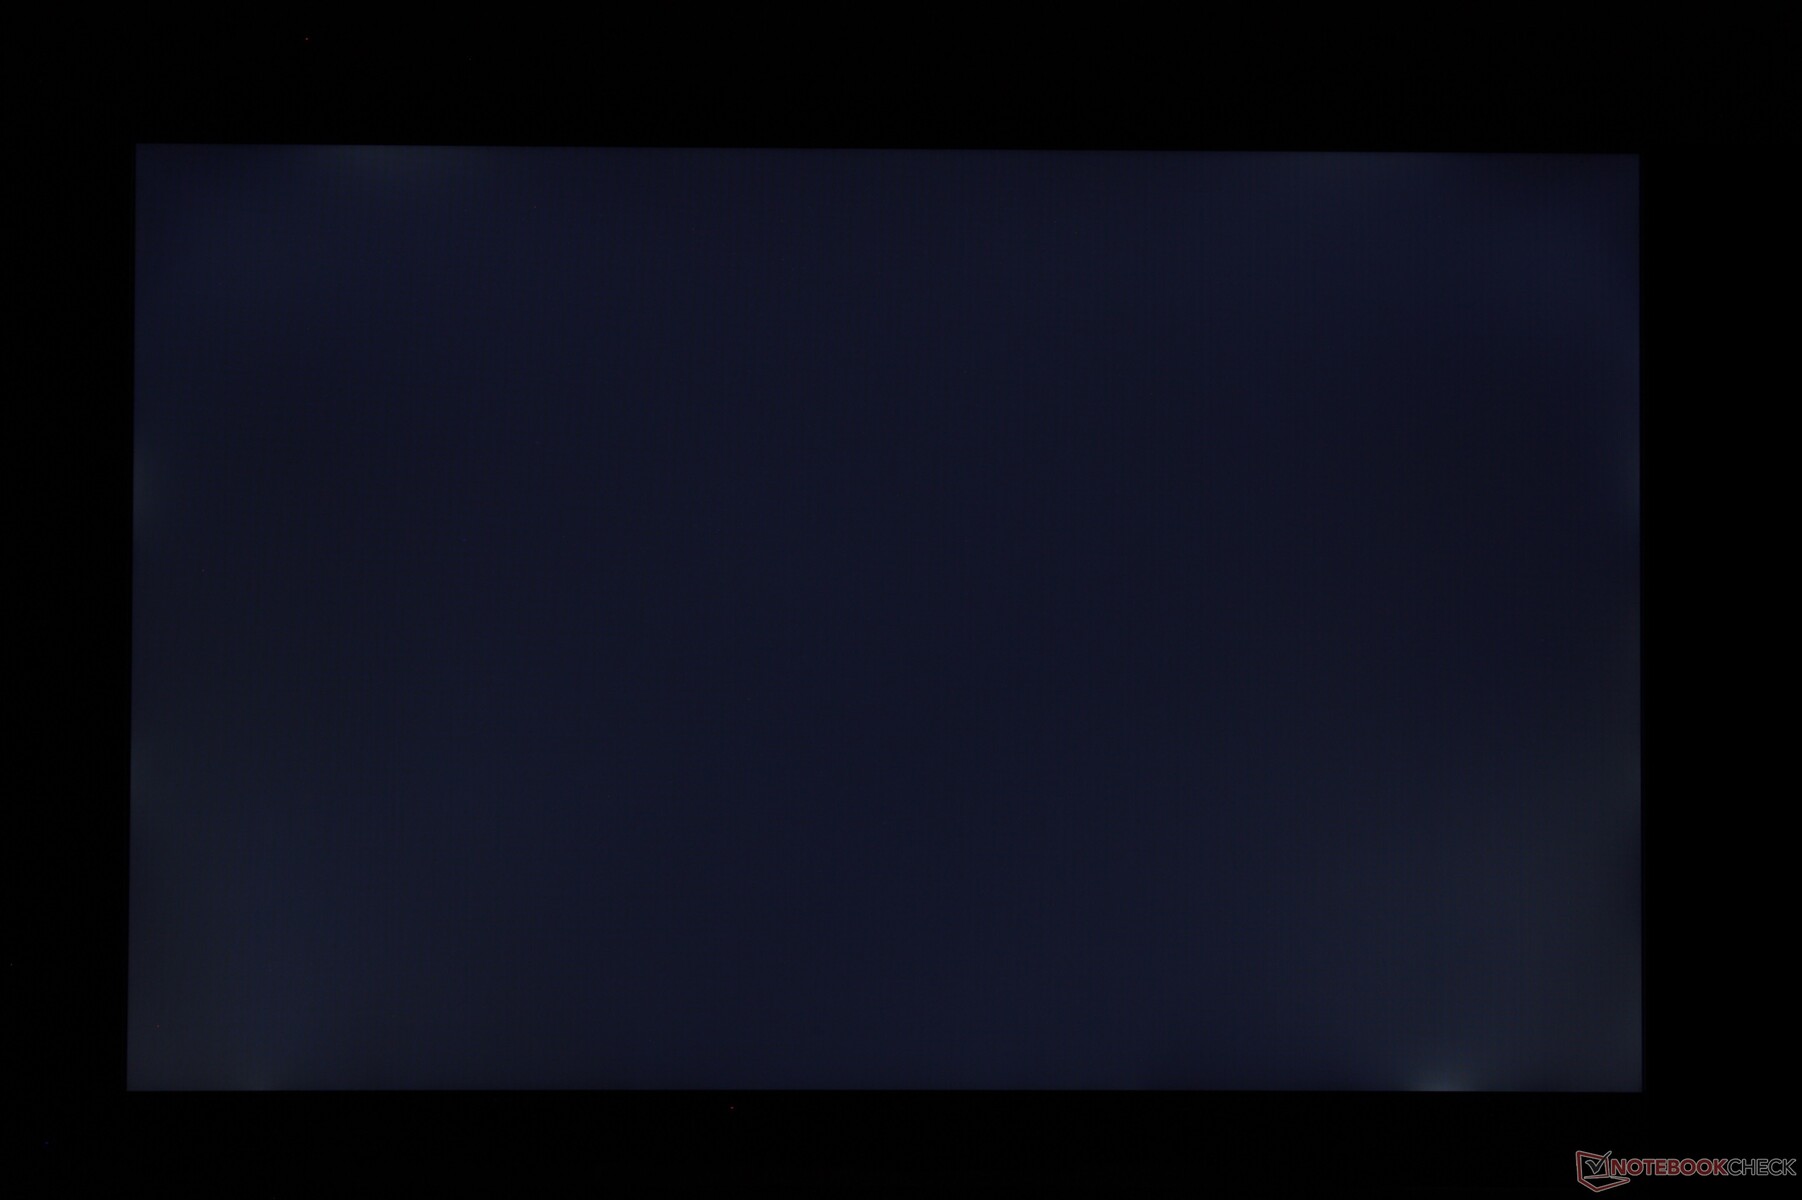
Aydınlatma: 93 %
Batarya modunda parlaklık: 300.9 cd/m²
Kontrast: 971:1 (Siyah: 0.31 cd/m²)
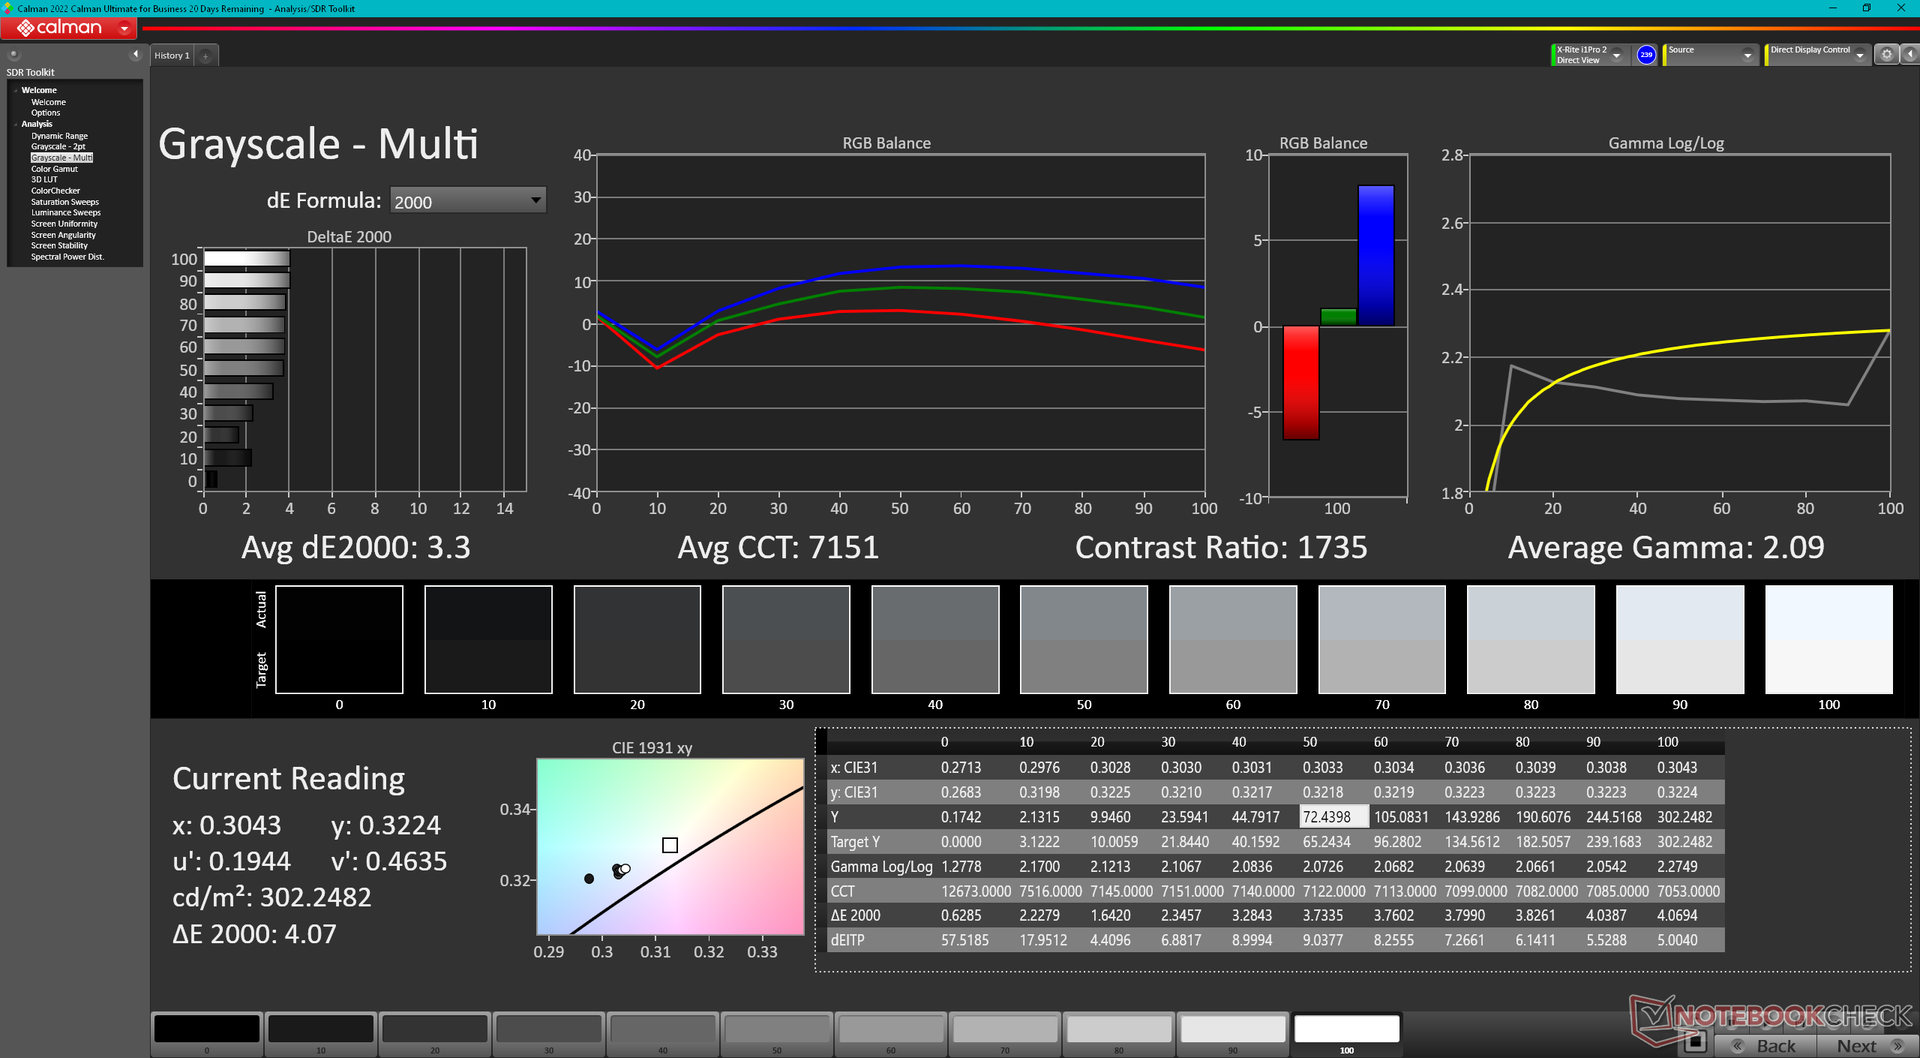
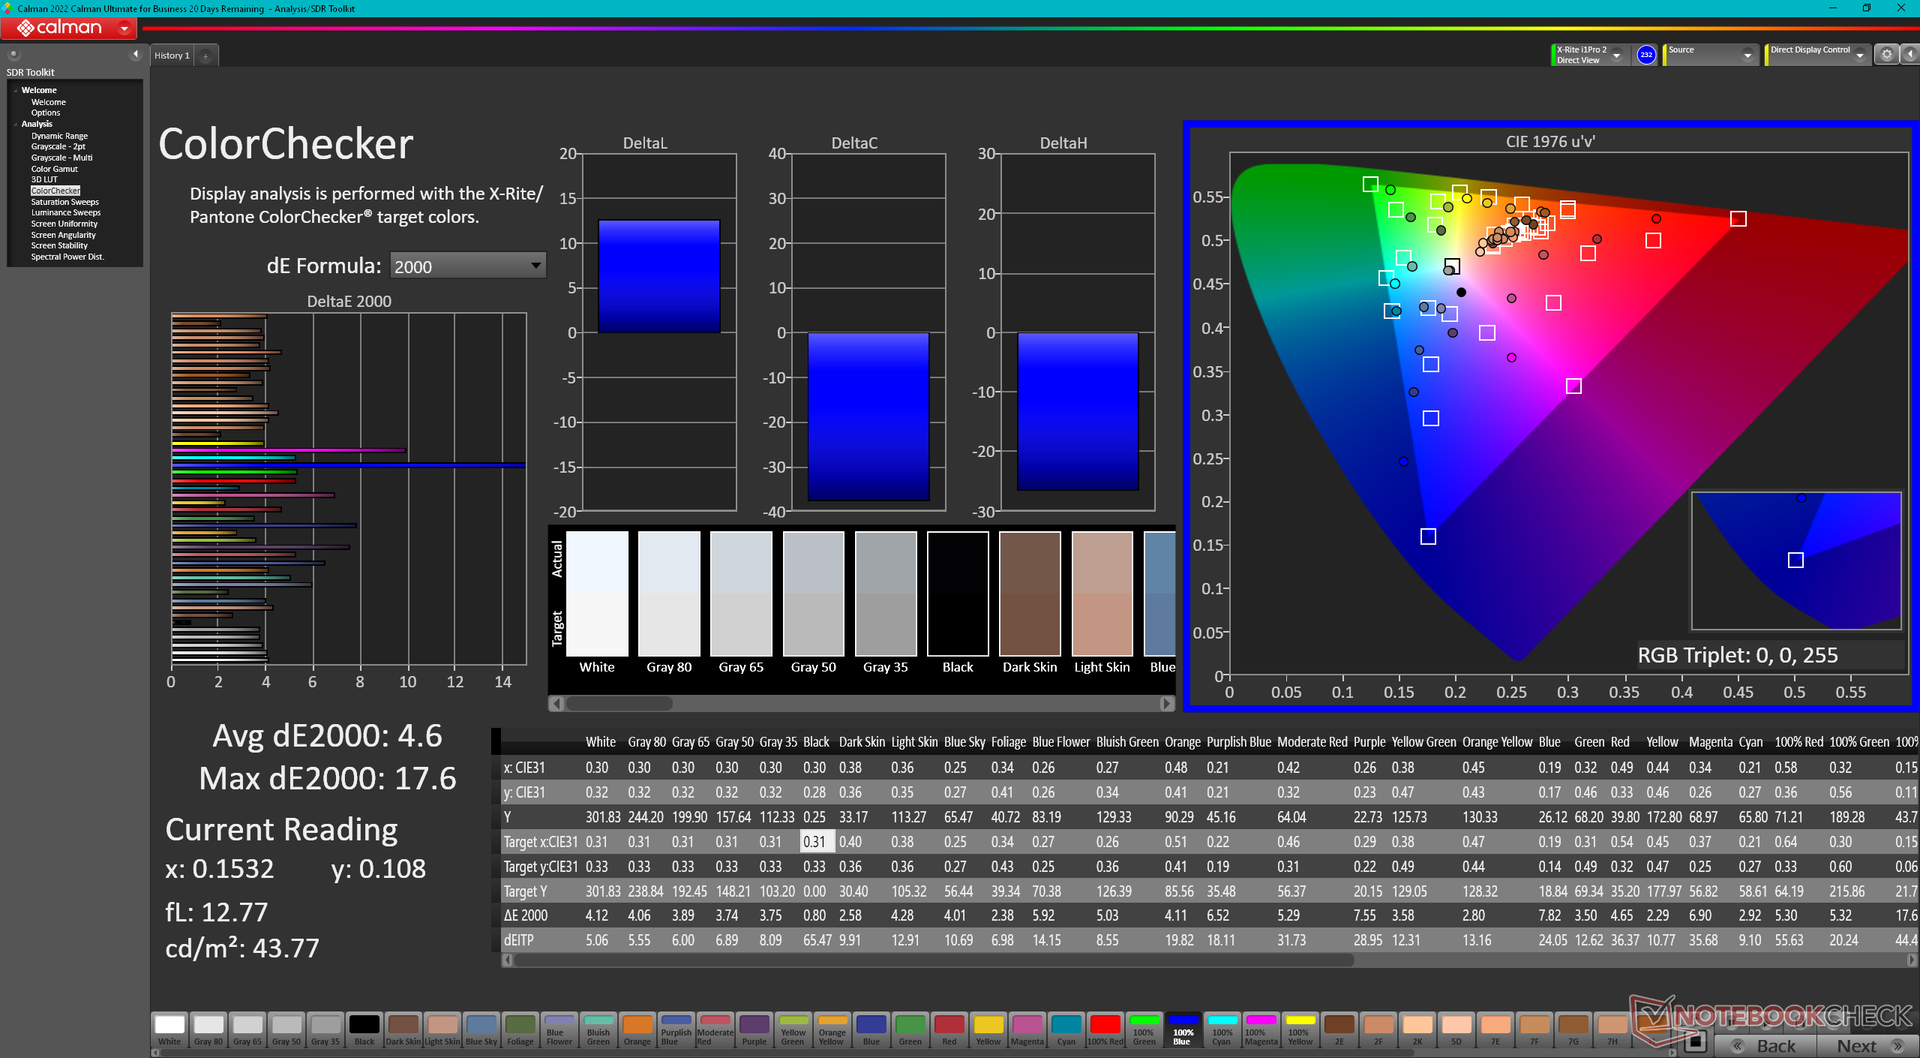
ΔE ColorChecker Calman: 4.6 | ∀{0.5-29.43 Ø4.72}
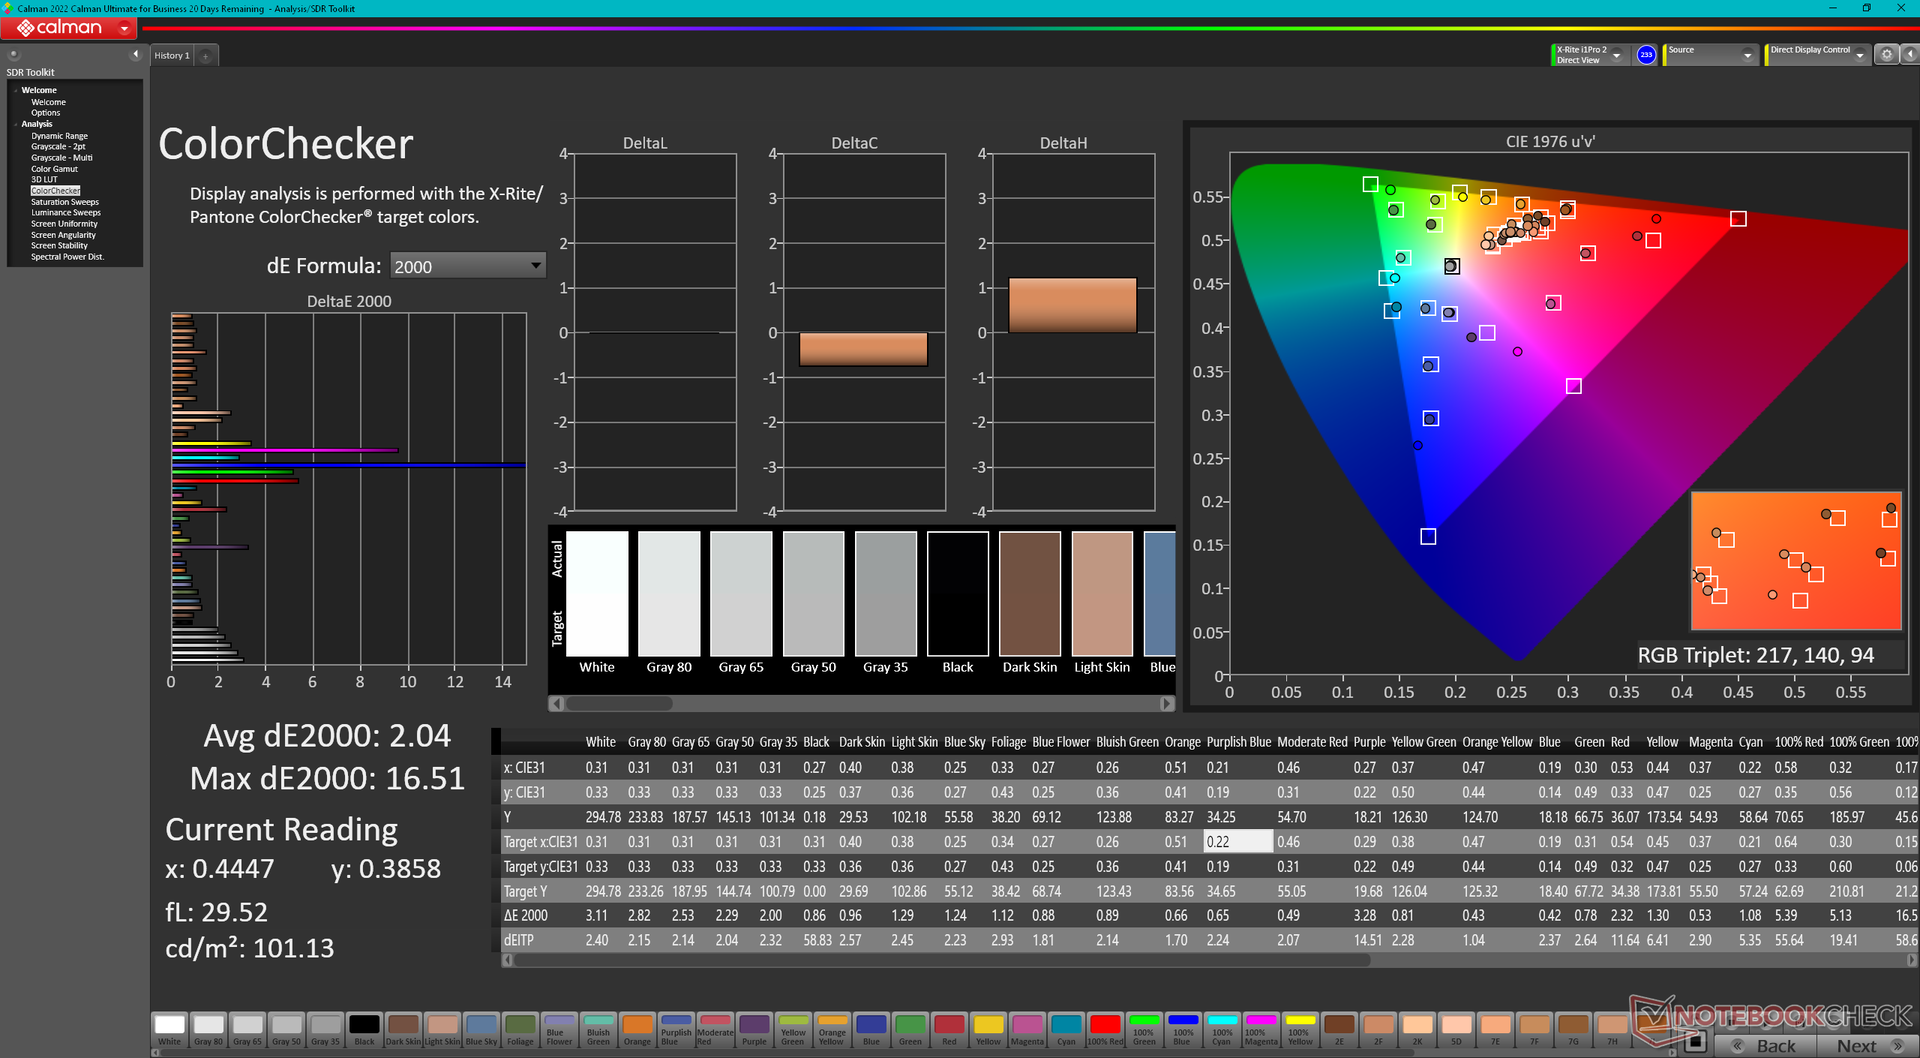
calibrated: 2.04
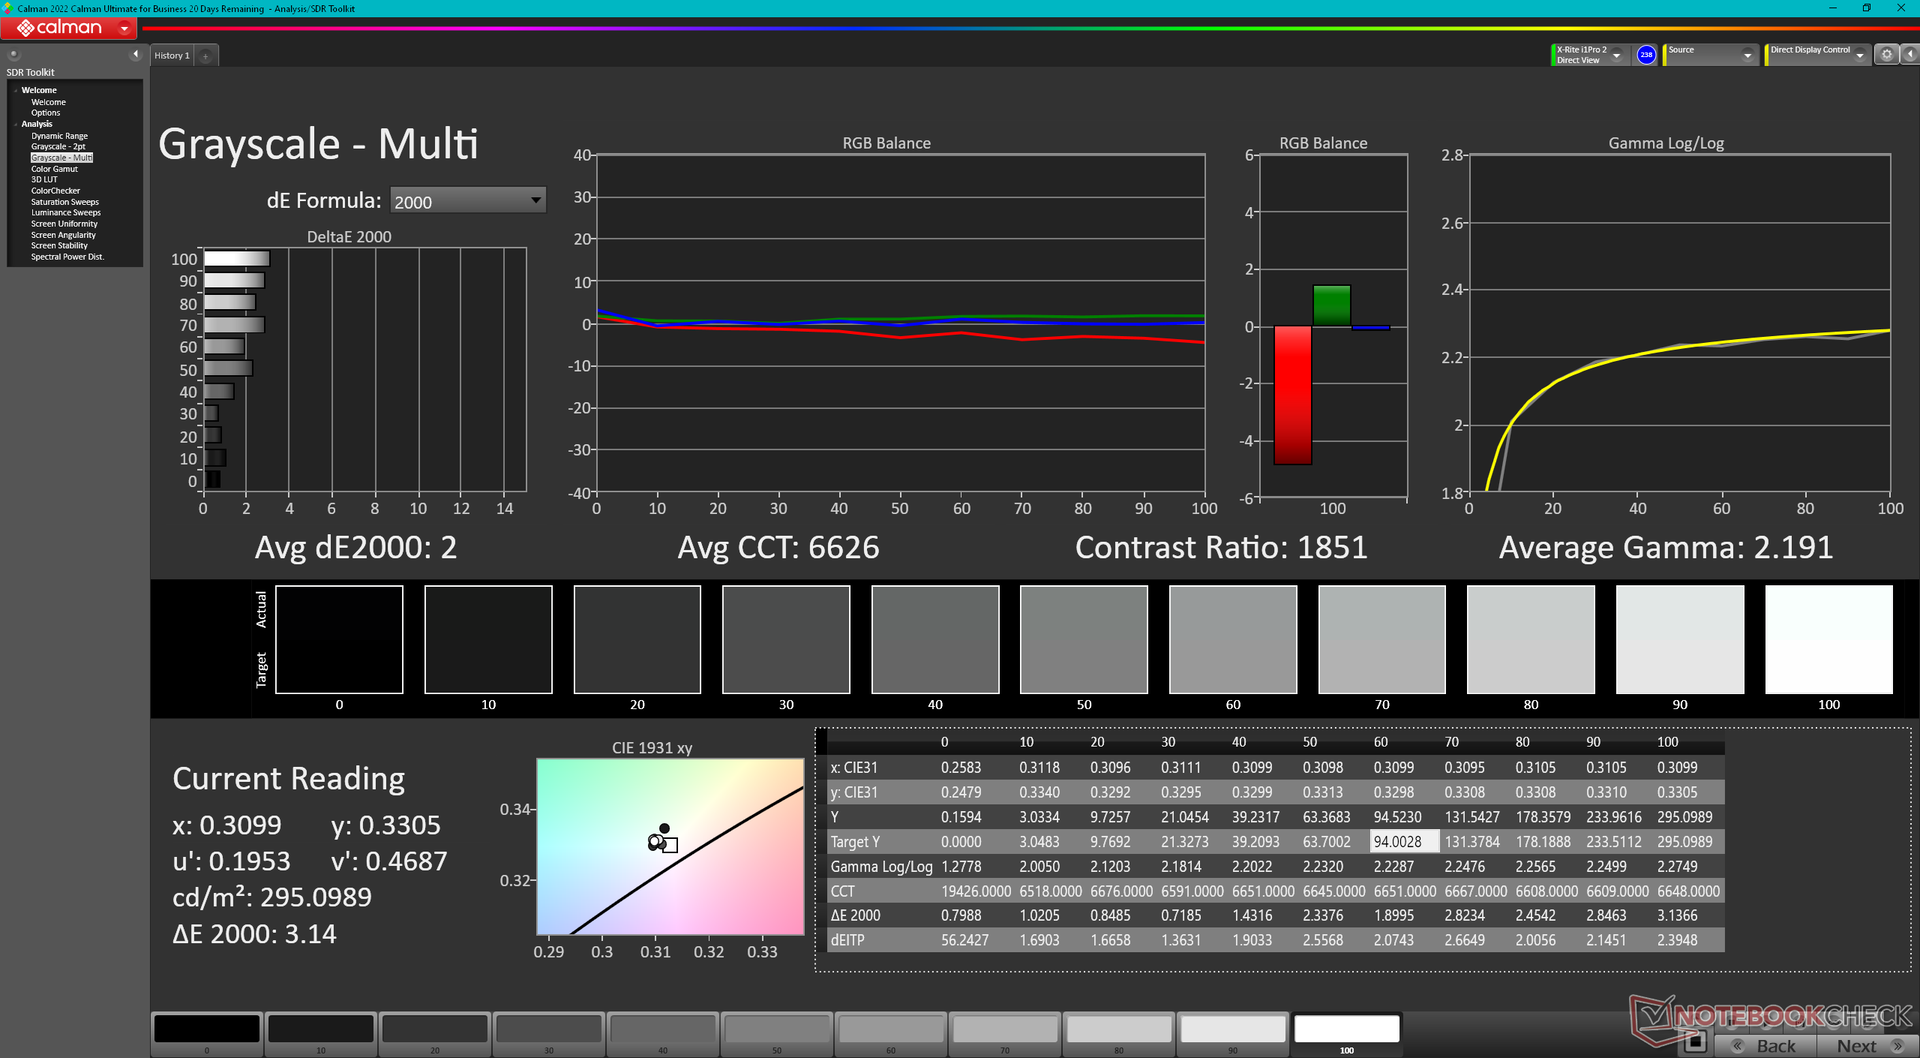
ΔE Greyscale Calman: 3.3 | ∀{0.09-98 Ø4.97}
43% AdobeRGB 1998 (Argyll 3D)
62.2% sRGB (Argyll 3D)
41.6% Display P3 (Argyll 3D)
Gamma: 2.09
CCT: 7151 K
| MSI Raider GE68HX 13VF Chi Mei N160JME-GTK, IPS, 1900x1200, 16" | MSI GE67 HX 12UGS Samsung ATNA562P02-0, OLED, 1920x1080, 15.6" | HP Omen 16-xf0376ng BOE0B81, IPS, 1920x1080, 16.1" | Alienware m16 R1 AMD BOE NE16NZ4, IPS, 2560x1600, 16" | Lenovo Legion Slim 7i 16 Gen 8 CSOT T3 MNG007DA2-3, IPS, 2560x1600, 16" | Asus ROG Zephyrus M16 GU604VY-NM042X BOE0B74 (NE160QDM-NM4, IPS, 2560x1600, 16" | |
|---|---|---|---|---|---|---|
| Display | 64% | 67% | 102% | 66% | 103% | |
| Display P3 Coverage (%) | 41.6 | 71.7 72% | 72.1 73% | 98.6 137% | 70.4 69% | 99.33 139% |
| sRGB Coverage (%) | 62.2 | 89.7 44% | 99.6 60% | 99.9 61% | 99.4 60% | 99.9 61% |
| AdobeRGB 1998 Coverage (%) | 43 | 75.2 75% | 72.3 68% | 88.9 107% | 72.5 69% | 90.01 109% |
| Response Times | 99% | 50% | 67% | 47% | -108% | |
| Response Time Grey 50% / Grey 80% * (ms) | 17.3 ? | 0.25 ? 99% | 12.3 ? 29% | 5.1 ? 71% | 12 ? 31% | 50.8 ? -194% |
| Response Time Black / White * (ms) | 24.2 ? | 0.4 ? 98% | 7.2 ? 70% | 9 ? 63% | 8.9 ? 63% | 29.6 ? -22% |
| PWM Frequency (Hz) | 480.4 ? | 12000 | ||||
| Screen | 17% | 10% | 10% | 34% | 297% | |
| Brightness middle (cd/m²) | 300.9 | 356.1 18% | 350 16% | 329 9% | 474.6 58% | 634 111% |
| Brightness (cd/m²) | 302 | 358 19% | 338 12% | 317 5% | 445 47% | 627 108% |
| Brightness Distribution (%) | 93 | 99 6% | 91 -2% | 89 -4% | 86 -8% | 92 -1% |
| Black Level * (cd/m²) | 0.31 | 0.35 -13% | 0.32 -3% | 0.39 -26% | 0.03 90% | |
| Contrast (:1) | 971 | 1000 3% | 1028 6% | 1217 25% | 21133 2076% | |
| Colorchecker dE 2000 * | 4.6 | 4.83 -5% | 3.29 28% | 3.71 19% | 2.12 54% | 0.89 81% |
| Colorchecker dE 2000 max. * | 17.6 | 7.94 55% | 8.47 52% | 7.23 59% | 4.73 73% | 1.79 90% |
| Colorchecker dE 2000 calibrated * | 2.04 | 2.23 -9% | 2.82 -38% | 0.57 72% | 0.91 55% | |
| Greyscale dE 2000 * | 3.3 | 3.1 6% | 3.2 3% | 2.2 33% | 2.8 15% | 1.13 66% |
| Gamma | 2.09 105% | 2.2 100% | 2.131 103% | 2.3 96% | 2.22 99% | 2.47 89% |
| CCT | 7151 91% | 5938 109% | 6317 103% | 6270 104% | 6542 99% | 6497 100% |
| Toplam Ortalama (Program / Ayarlar) | 60% /
44% | 42% /
28% | 60% /
38% | 49% /
43% | 97% /
198% |
* ... daha küçük daha iyidir
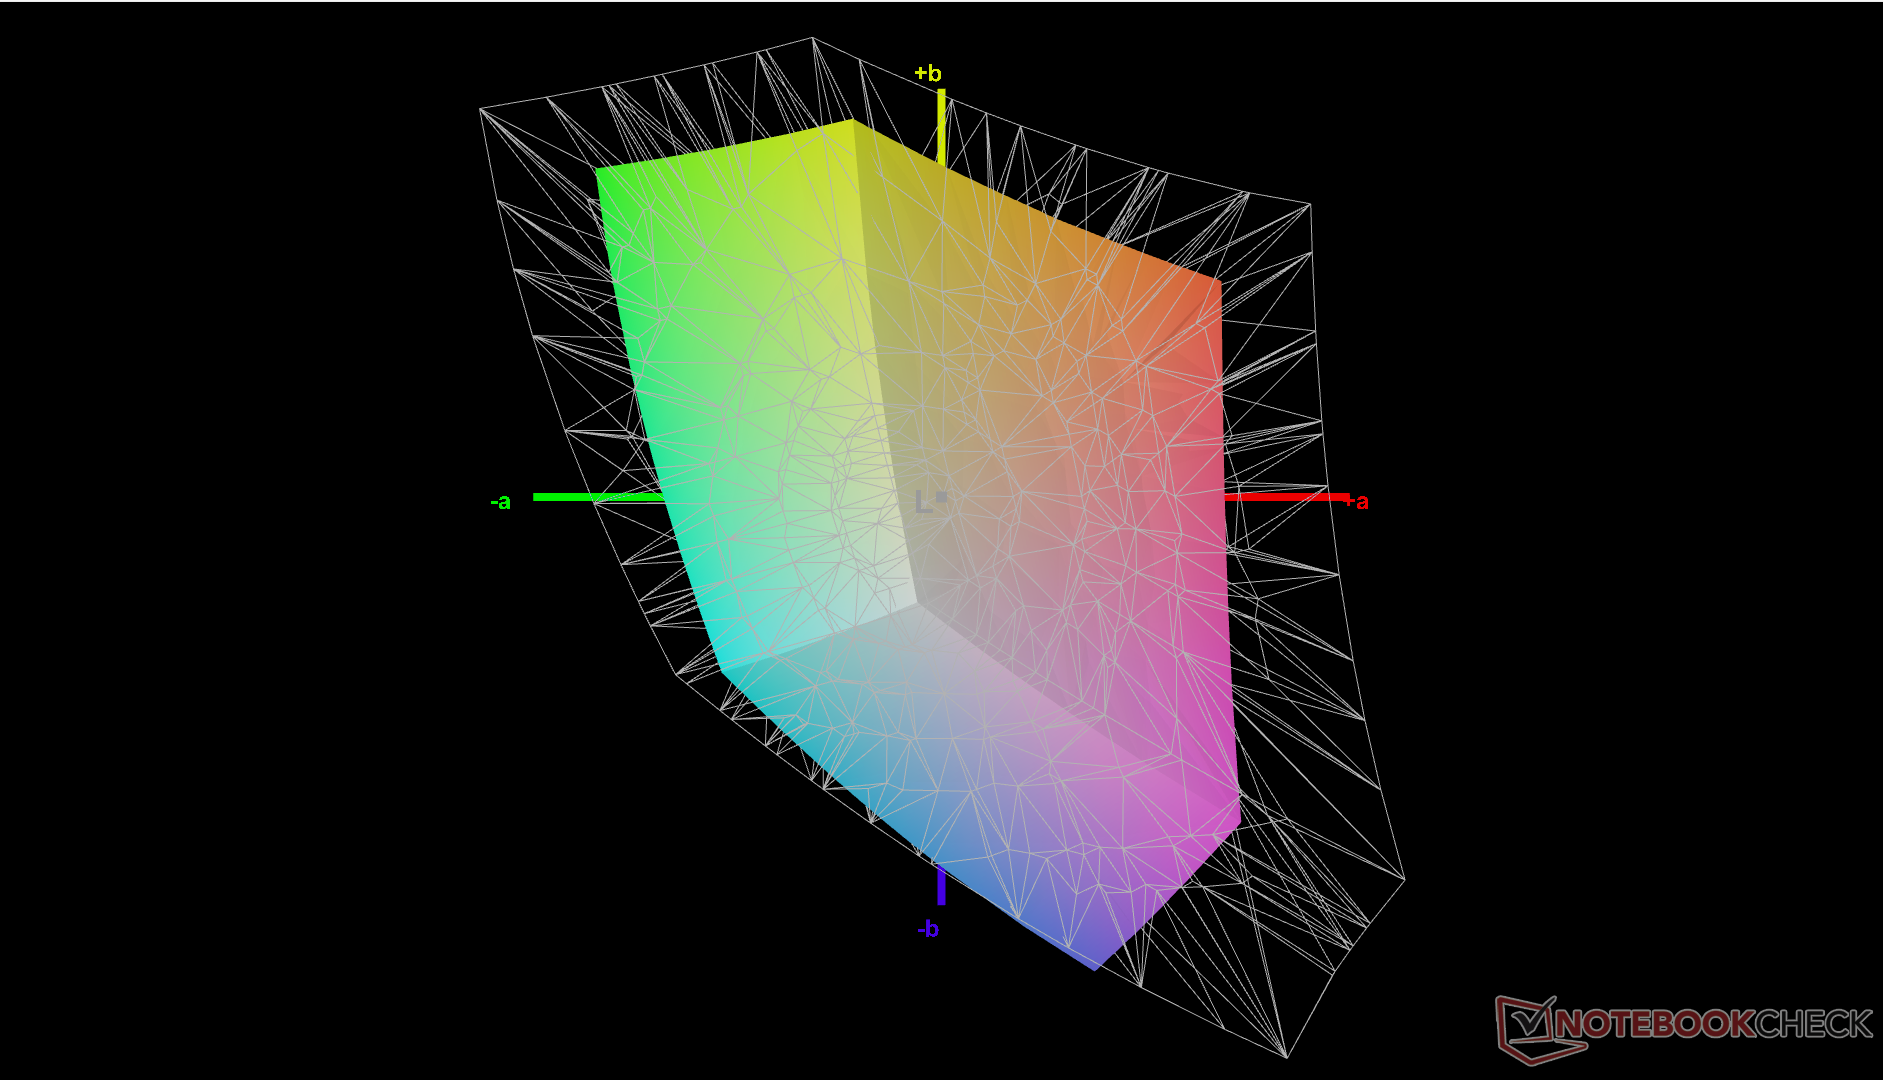
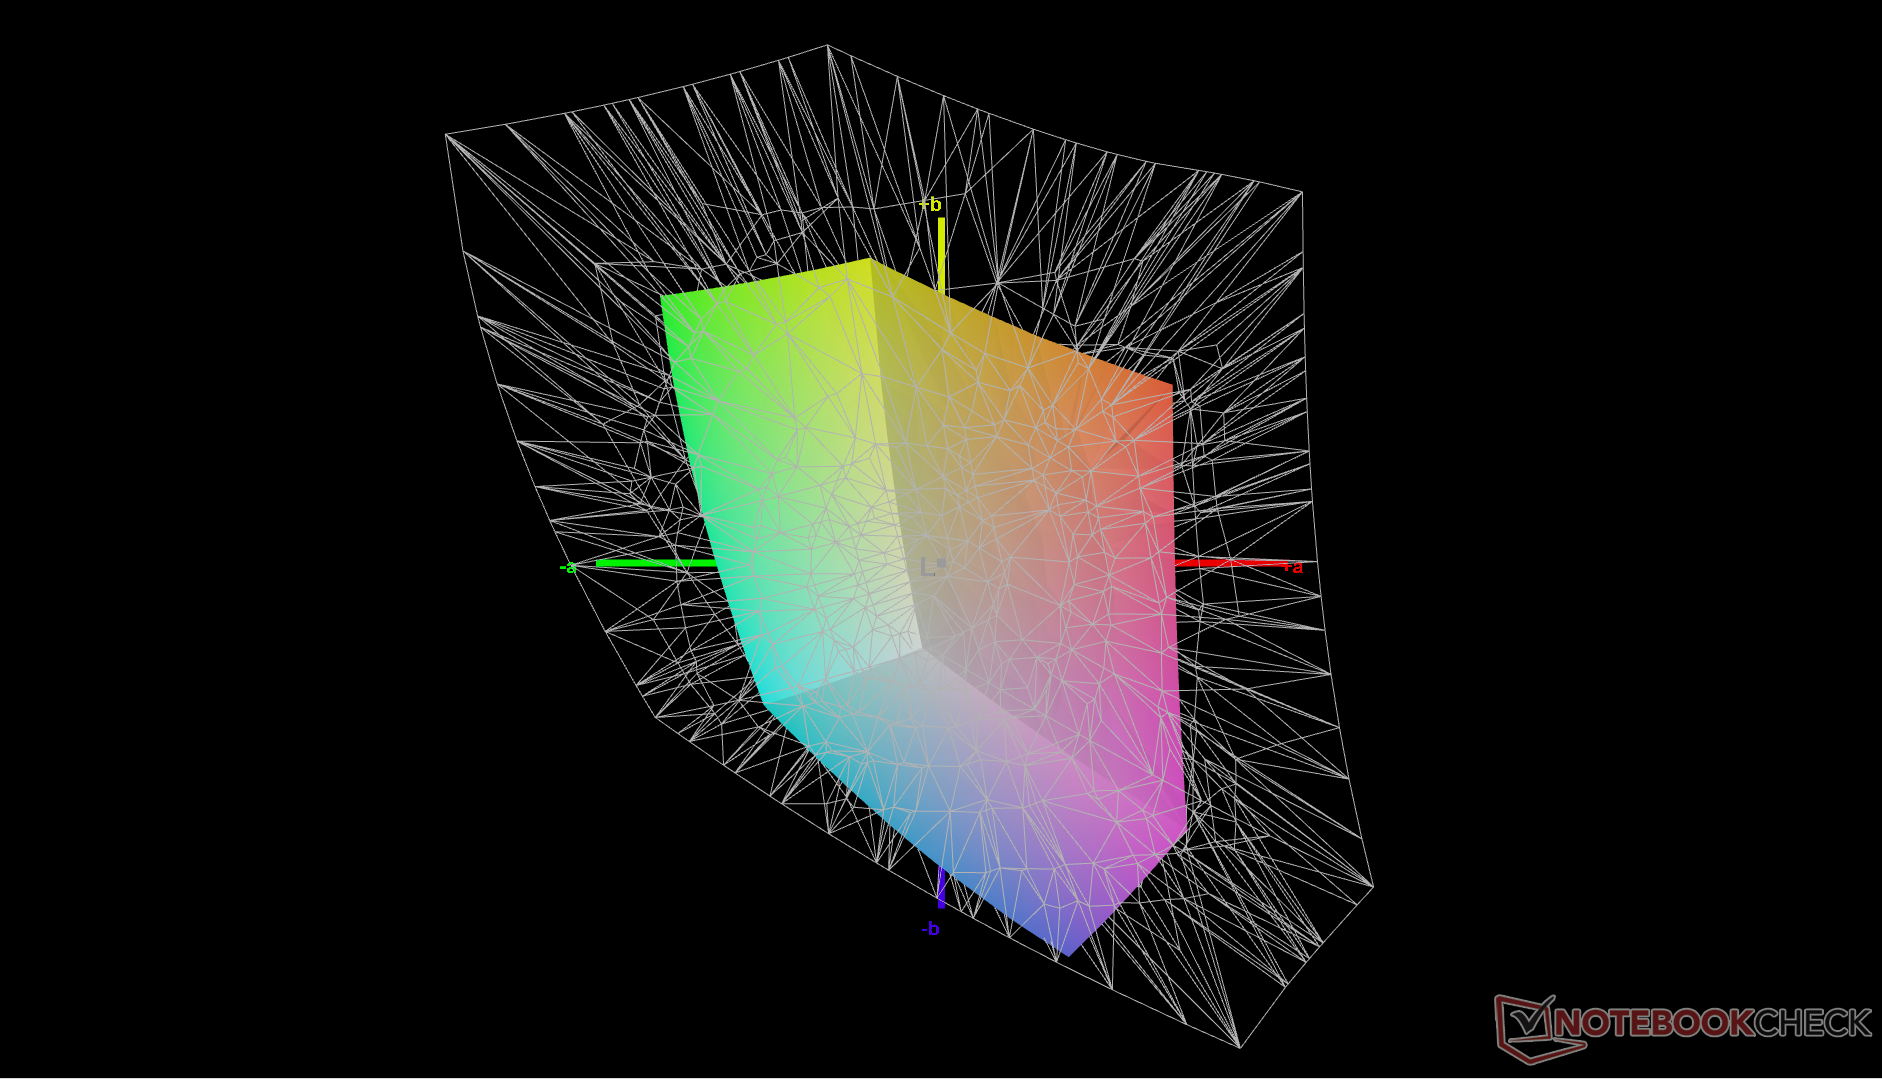
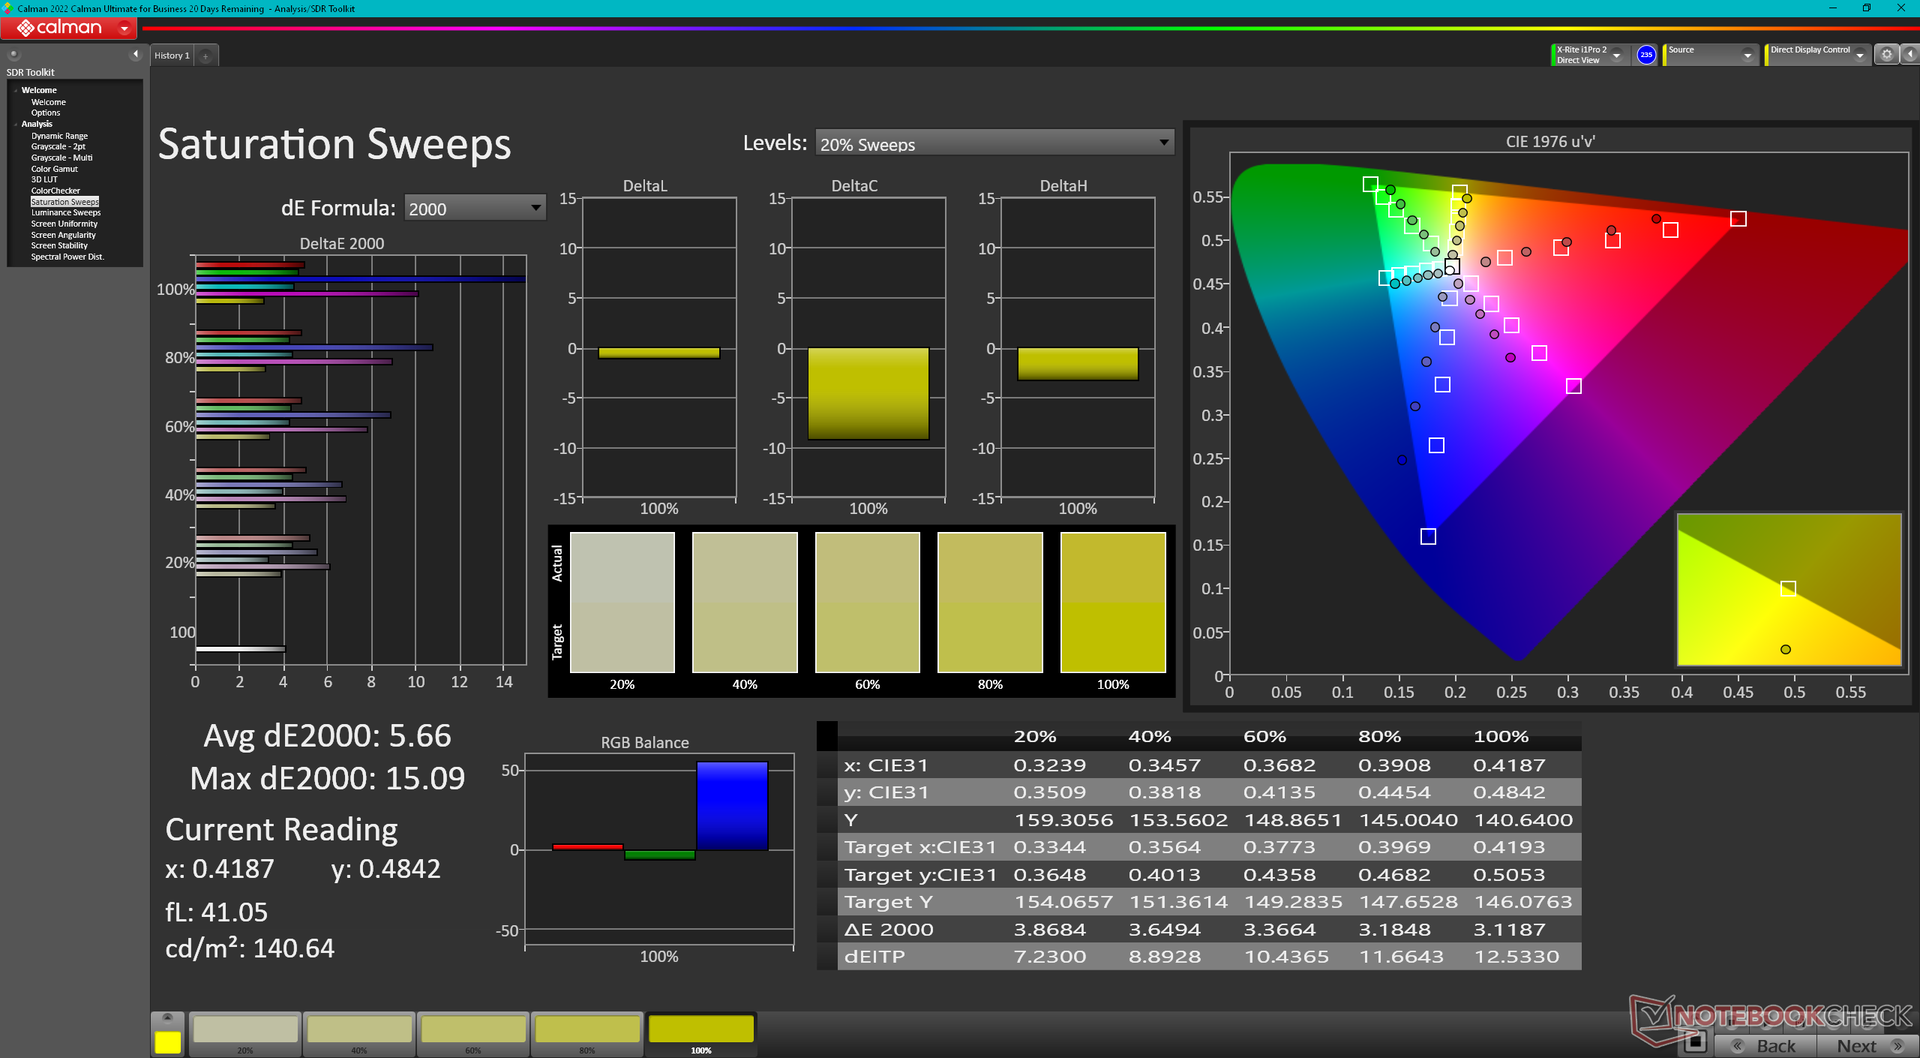
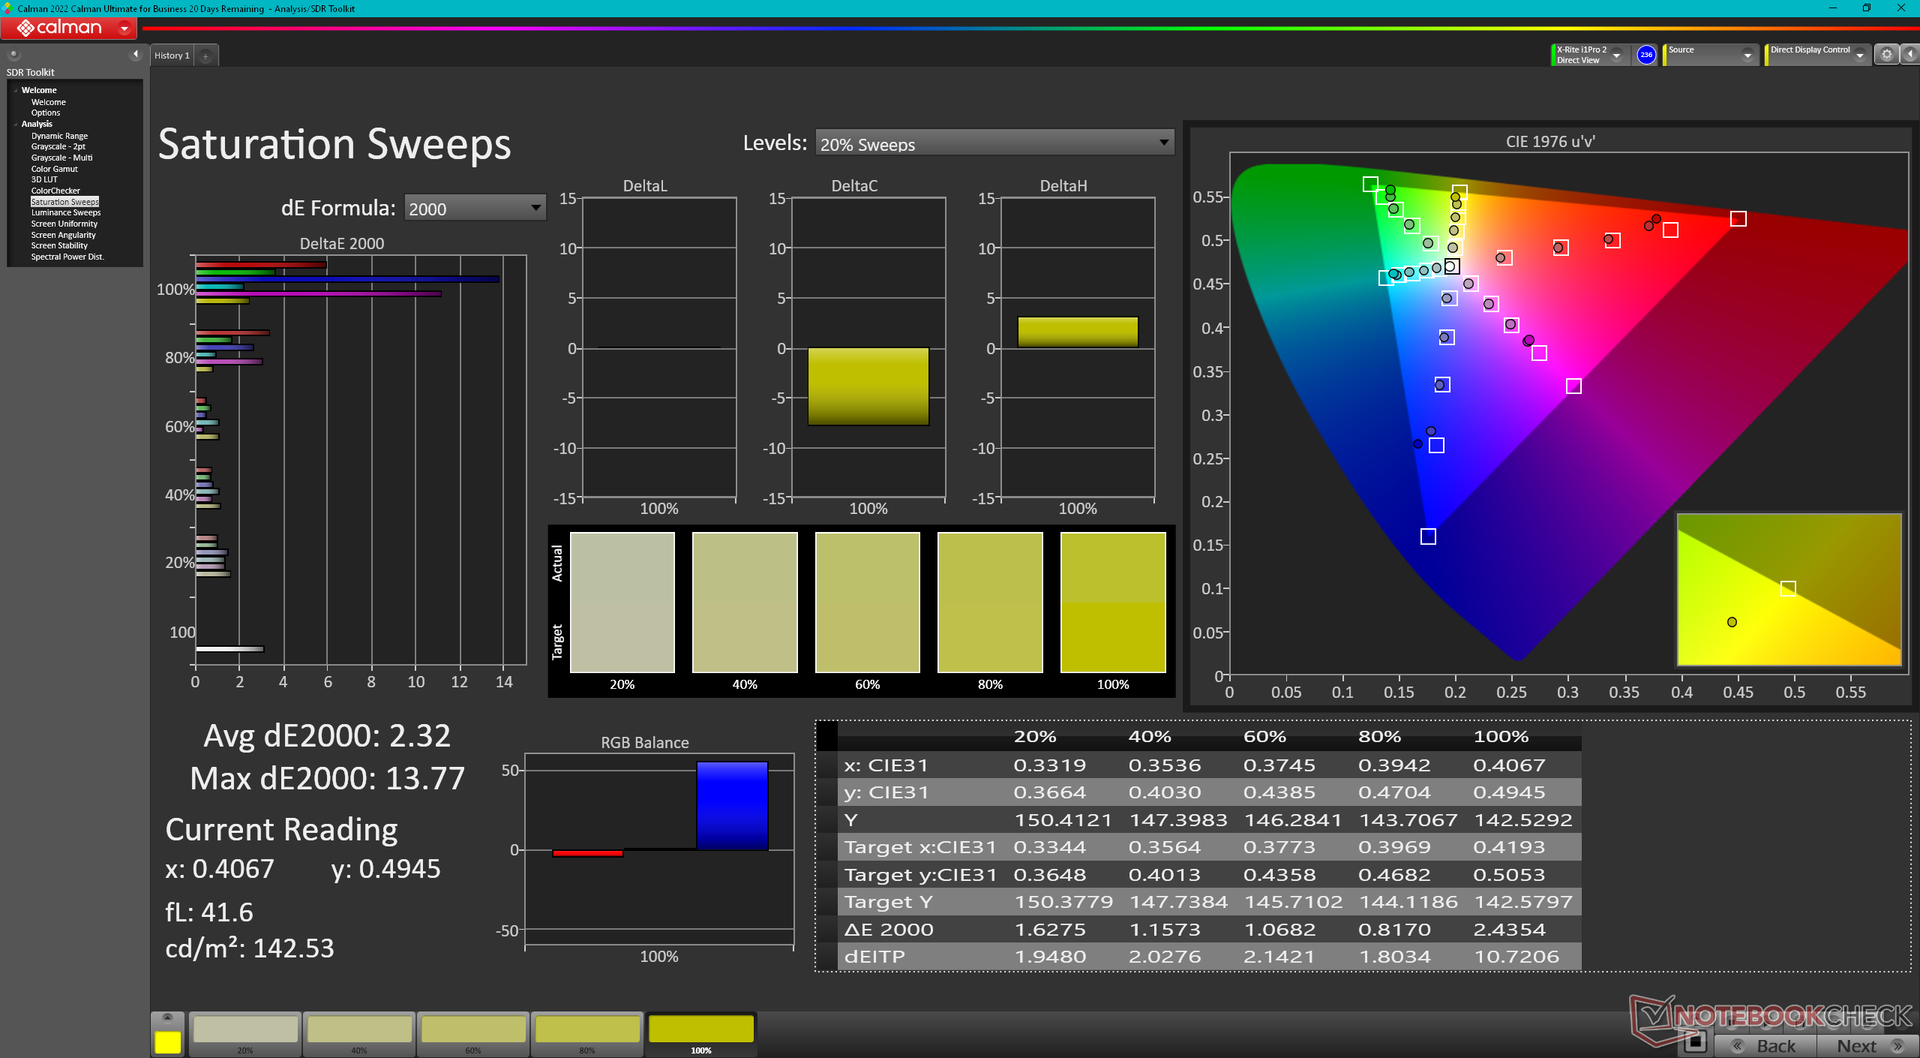
Ekran önceden kalibre edilmiş olarak gelmiyor, ancak ortalama renk doğruluğu her şey düşünüldüğünde fena değil. Paneli bir X-Rite renk ölçer ile kendimiz kalibre ettiğimizde ortalama gri tonlama ve renk DeltaE değerleri sırasıyla 3,3 ve 4,6'dan sadece 2 ve 2,04'e yükselecektir. Panelin sınırlı renk alanı nedeniyle ne kadar kalibre ederseniz edin, renkler daha yüksek doygunluk seviyelerinde giderek daha hatalı hale gelecektir. Mavi, bunun yerine hafif Mor görüneceğinden belki de en kötü suçludur. ICM profilimiz yukarıda ücretsiz olarak indirilebilir.
Yanıt Sürelerini Görüntüle
| ↔ Tepki Süresi Siyahtan Beyaza | ||
|---|---|---|
| 24.2 ms ... yükseliş ↗ ve sonbahar↘ birleşimi | ↗ 10.6 ms yükseliş | 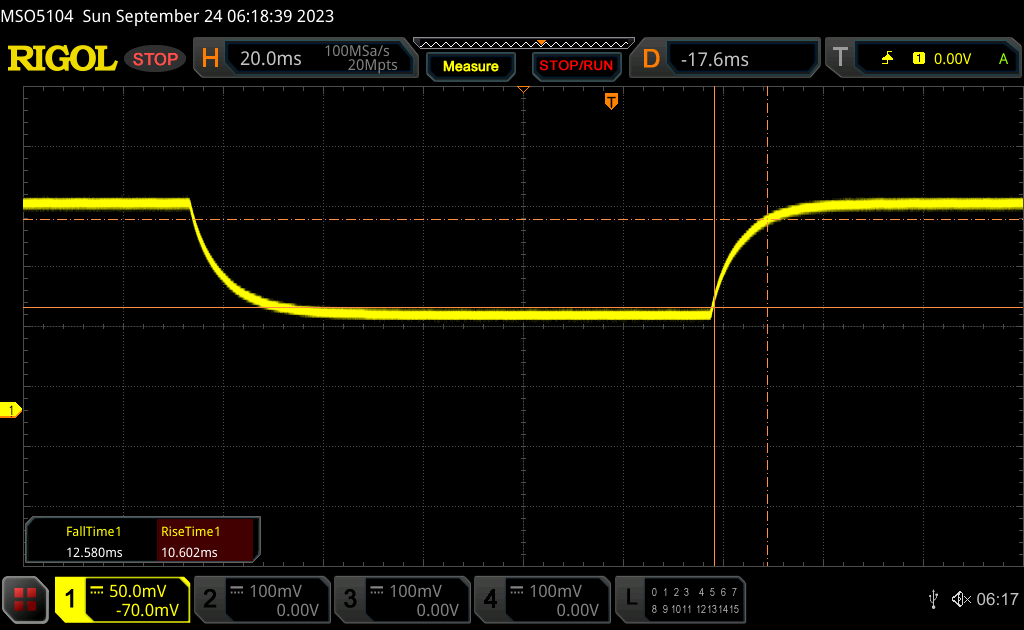 |
| ↘ 12.6 ms sonbahar | ||
| Ekran, testlerimizde iyi yanıt oranları gösteriyor ancak rekabetçi oyuncular için çok yavaş olabilir. Karşılaştırıldığında, test edilen tüm cihazlar 0.1 (minimum) ile 240 (maksimum) ms arasında değişir. » Tüm cihazların 57 %'si daha iyi. Bu, ölçülen yanıt süresinin test edilen tüm cihazların ortalamasından (19.8 ms) daha kötü olduğu anlamına gelir. | ||
| ↔ Tepki Süresi %50 Griden %80 Griye | ||
| 17.3 ms ... yükseliş ↗ ve sonbahar↘ birleşimi | ↗ 9.4 ms yükseliş | 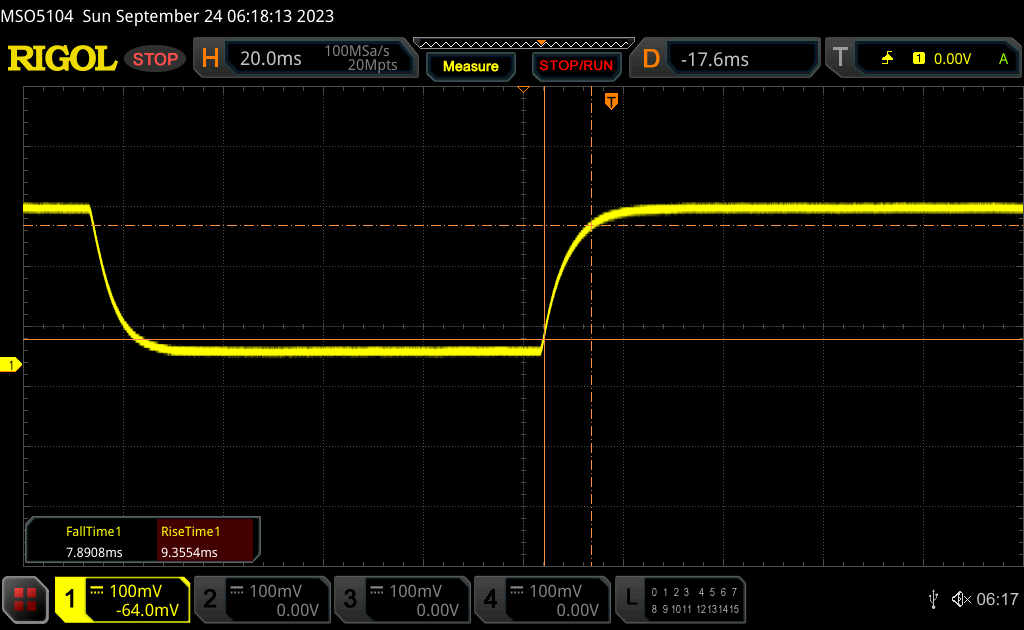 |
| ↘ 7.9 ms sonbahar | ||
| Ekran, testlerimizde iyi yanıt oranları gösteriyor ancak rekabetçi oyuncular için çok yavaş olabilir. Karşılaştırıldığında, test edilen tüm cihazlar 0.165 (minimum) ile 636 (maksimum) ms arasında değişir. » Tüm cihazların 32 %'si daha iyi. Bu, ölçülen yanıt süresinin test edilen tüm cihazların ortalamasından (31 ms) daha iyi olduğu anlamına gelir. | ||
Ekran Titremesi / PWM (Darbe Genişliği Modülasyonu)
| Ekran titriyor / PWM algılanmadı | 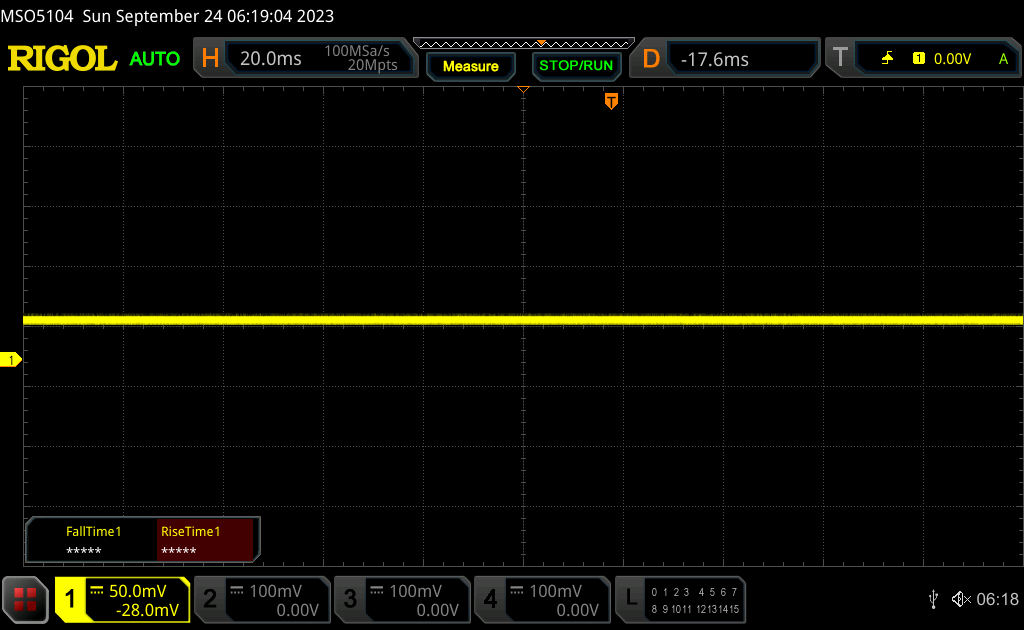 | ||
Karşılaştırıldığında: Test edilen tüm cihazların %52 %'si ekranı karartmak için PWM kullanmıyor. PWM tespit edilirse, ortalama 7747 (minimum: 5 - maksimum: 343500) Hz ölçüldü. | |||
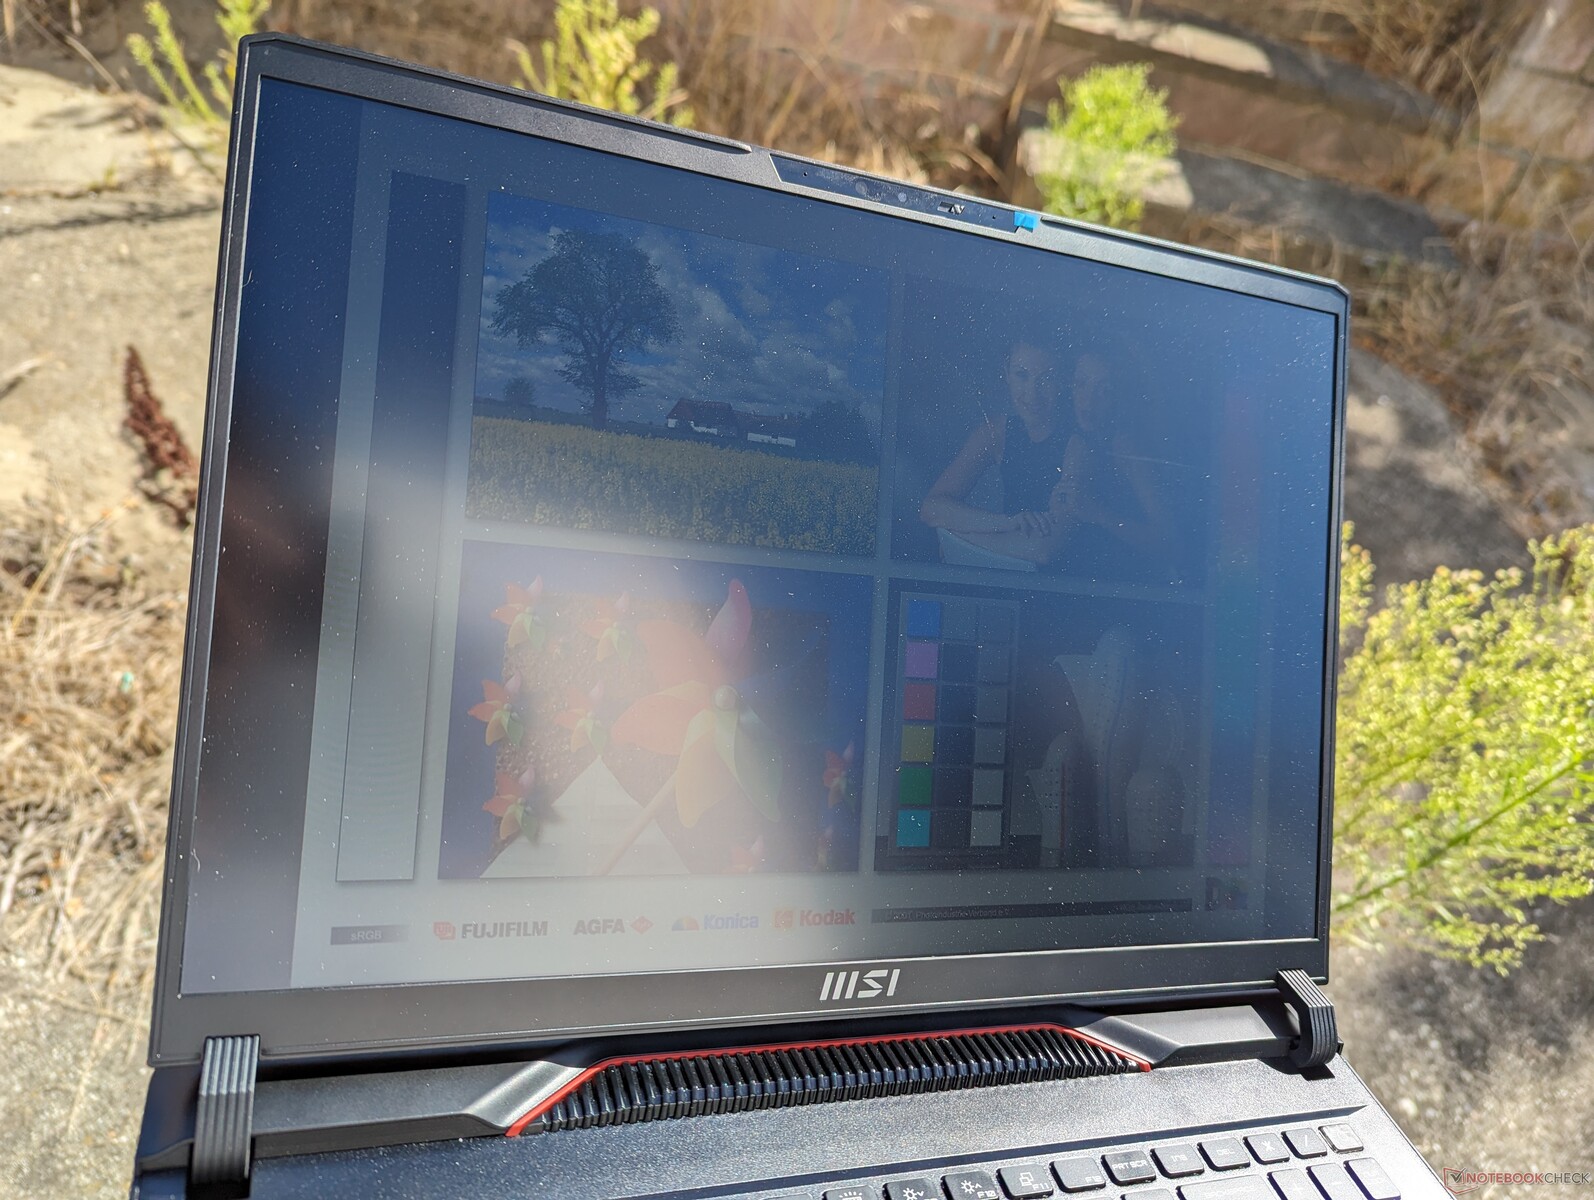
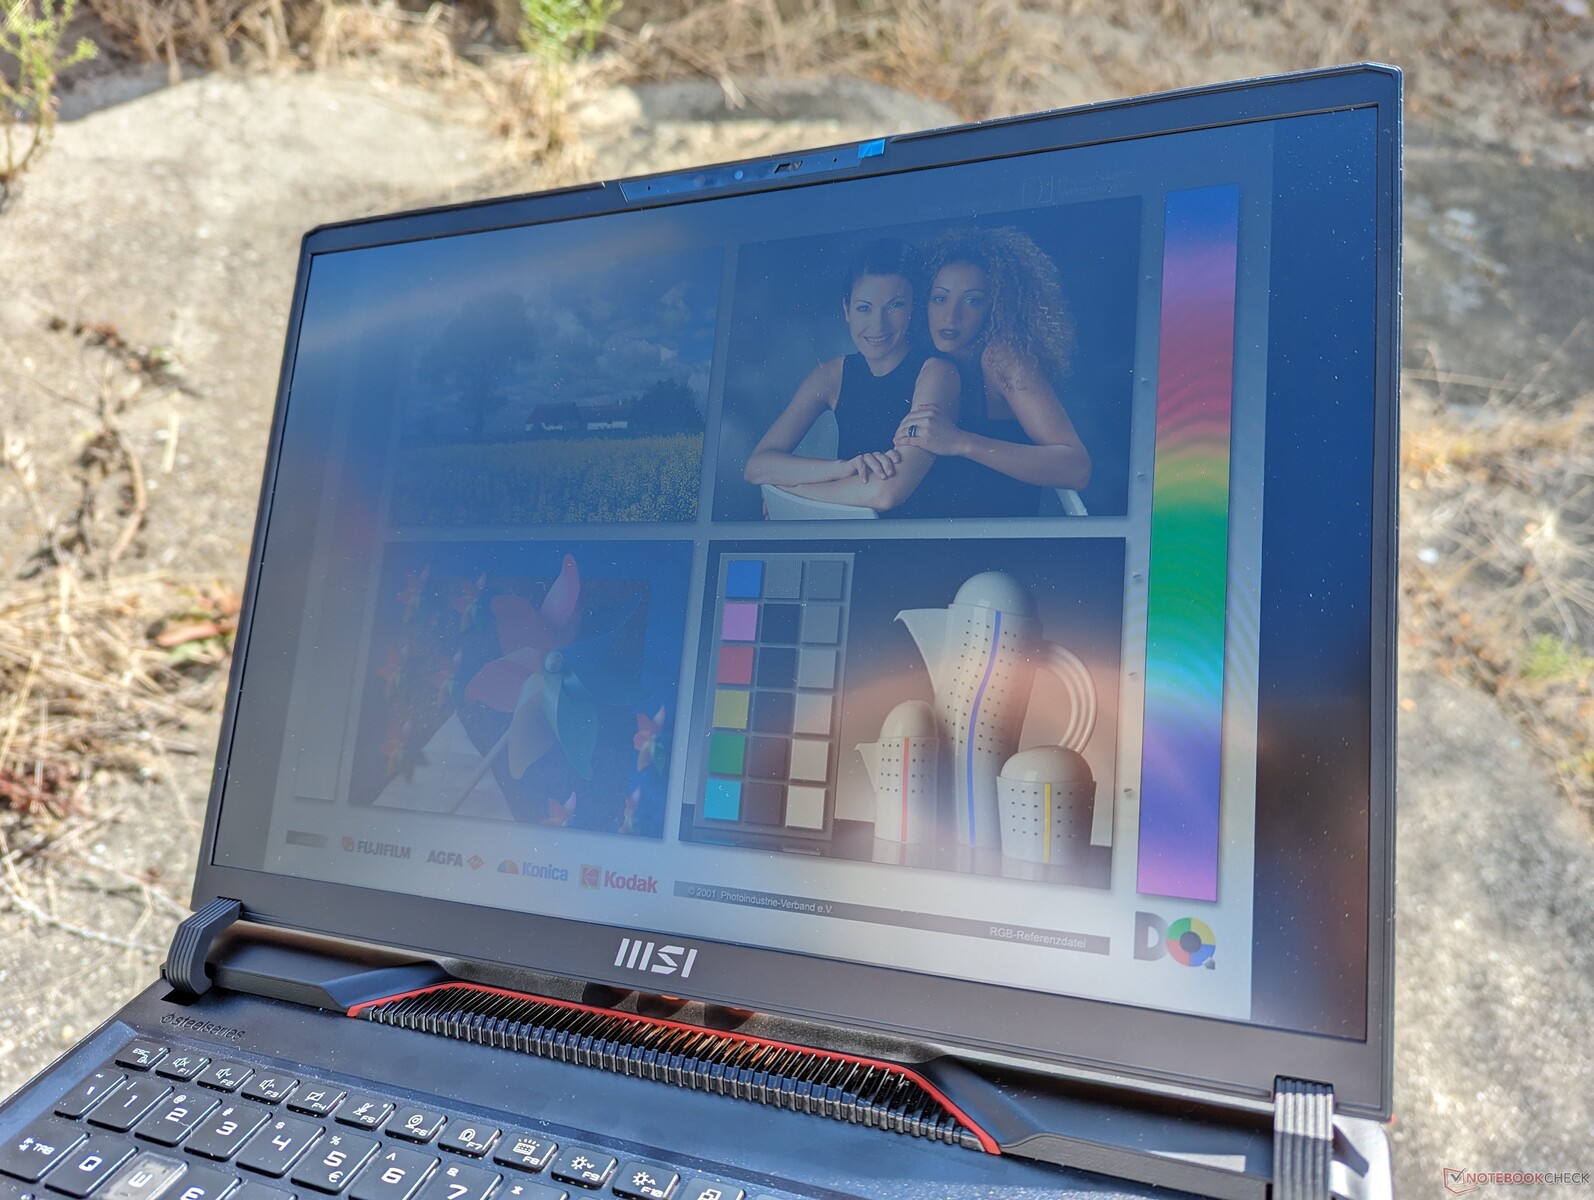
300 nit maksimum parlaklık çoğu oyun dizüstü bilgisayarı için tipiktir. Doğrudan güneş ışığından kaçınılmalıdır, aksi takdirde renkler soluklaşır. Daha iyi dış mekan görünürlüğü için kullanıcılar bunun yerine Zephyrus M16'yı ve 2 kat daha parlak ekranını düşünmek isteyebilir.
Performans - Bir Önceki Yıla Göre Etkileyici Artış
Test Koşulları
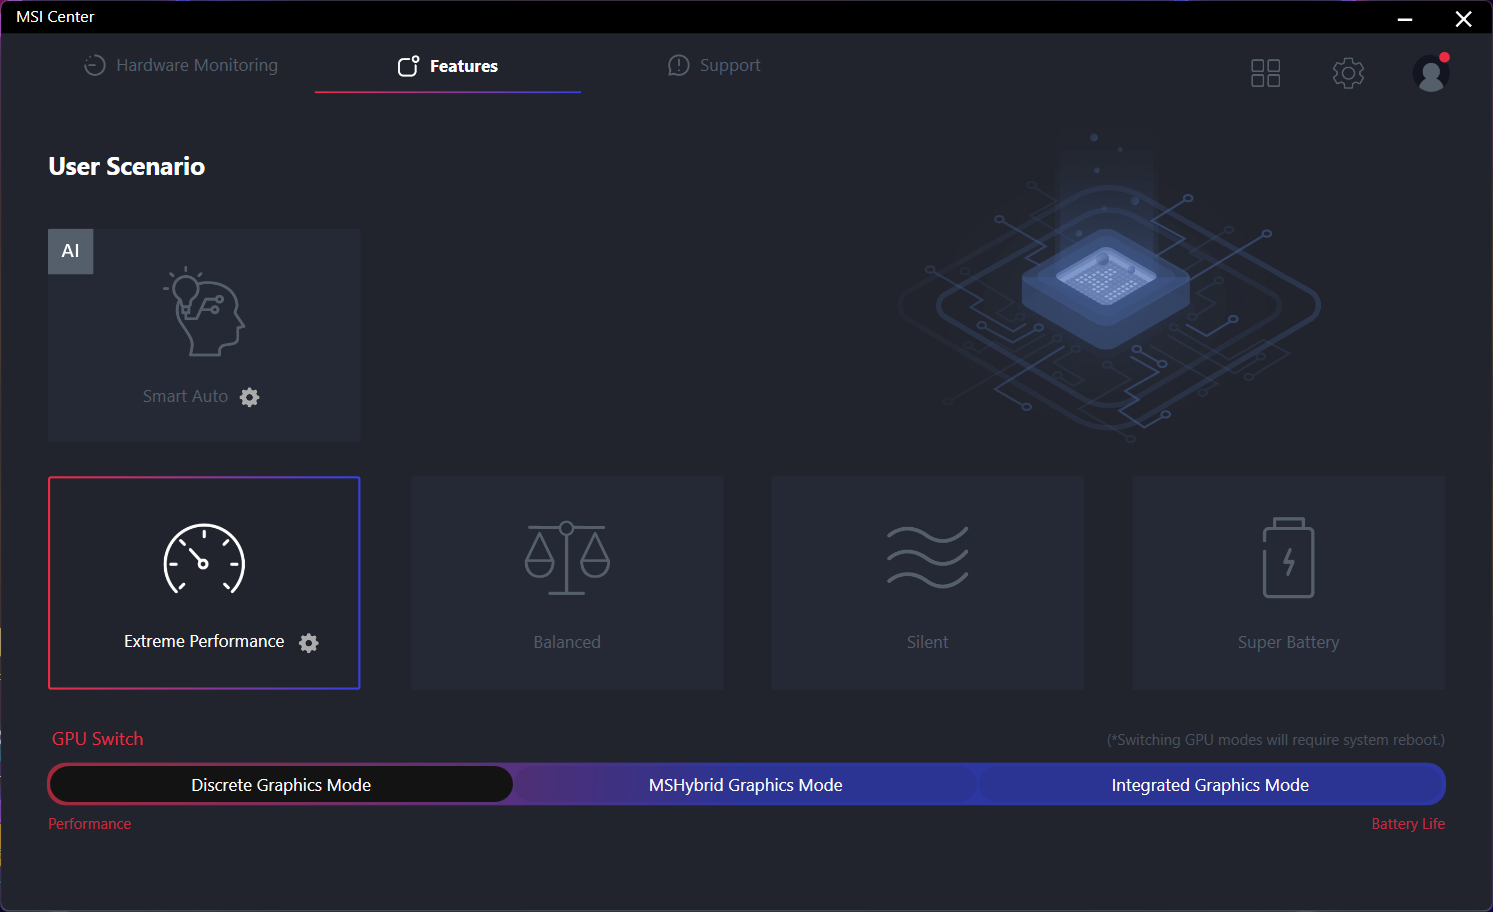
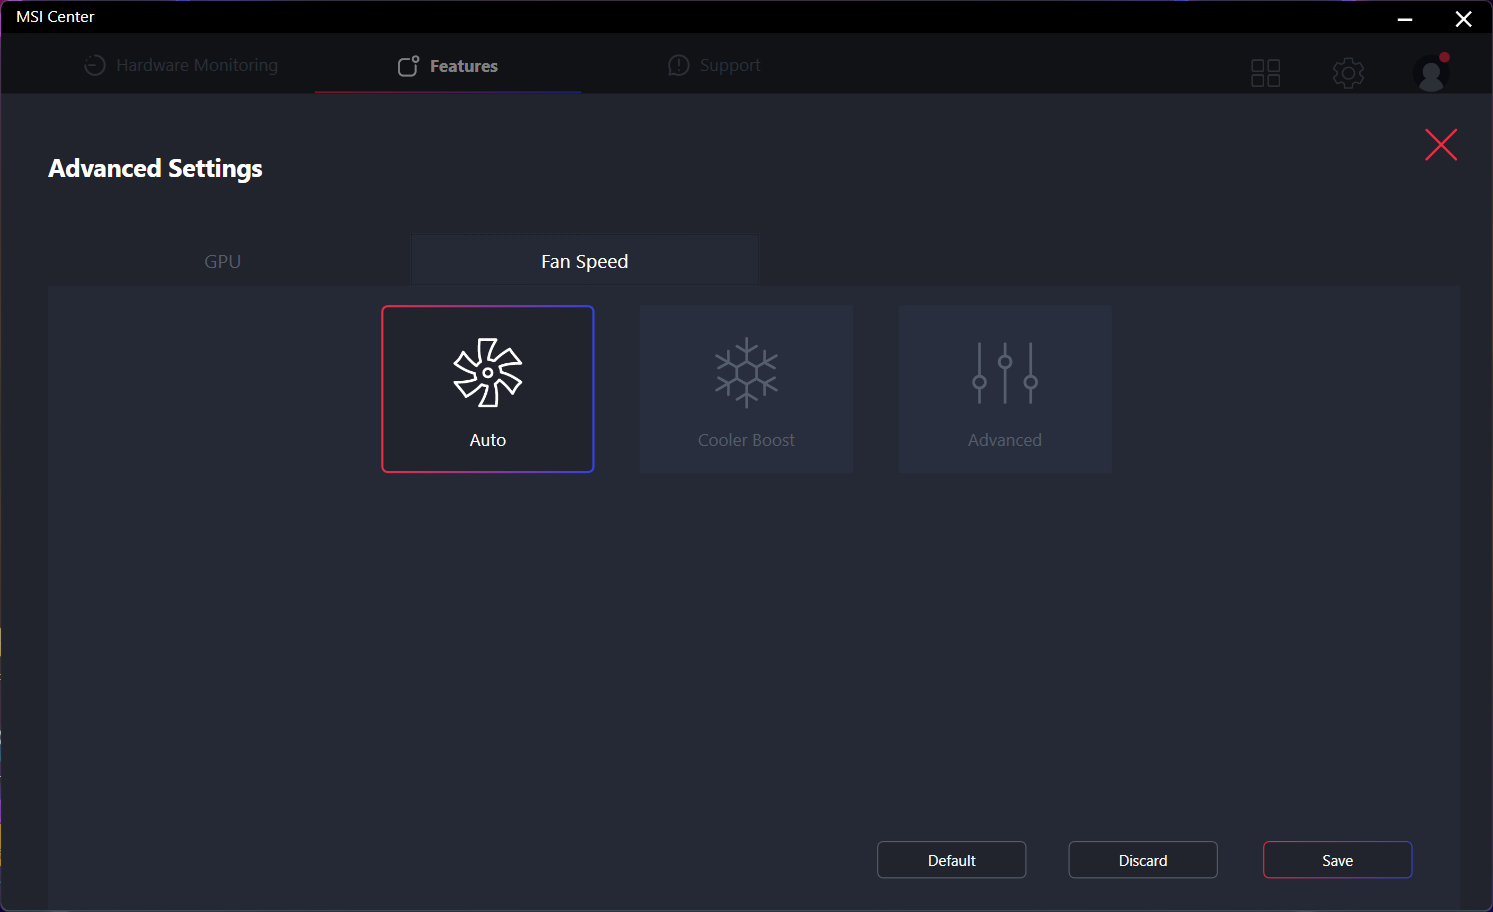
Aşağıdaki kıyaslamaları çalıştırmadan önce Windows'u Performans moduna ve MSI Center'ı hem Aşırı Performans moduna hem de dGPU moduna ayarladık. MSI Center sistem güncellemeleri, hayati değerler, güç profilleri, GPU modları ve daha fazlası için kontrol merkezidir. Bununla birlikte, RGB ayarları SteelSeries GG adlı ayrı bir uygulama tarafından ele alınır.
Cooler Boost, Extreme Performance modu içinde bir alt menü ayarıdır. Etkinleştirildiğinde, ekrandaki yük ne olursa olsun dahili fanlar maksimum RPM'lerinde çalışır.
RTX 4060 yapılandırması MUX'u destekler ancak Advanced Optimus'u desteklemez, yani dGPU, MSHybrid ve iGPU modları arasında geçiş yaparken yeniden başlatma gerekir.
İşlemci
CPU performansı ve saat hızı kararlılığı, ortalamadan yüzde 5 ila 10 daha hızlı sonuçlarla mükemmeldirCore i9-13950HX veritabanımızda veya neredeyse 2 kat daha hızlı Core i7-13700H genellikle diğer oyun dizüstü bilgisayarlarında bulunur. Bu, şu anda piyasadaki en hızlı mobil CPU'lardan biridir ve Zen 4 ile rekabet etmektedir Ryzen 9 7945HX ilk üç sıra için.
Daha pahalıya yükseltme Core i9-13980HX seçeneğinin, Alienware m18 R1 ile geçirdiğimiz süreye dayanarak performansı yalnızca yaklaşık yüzde 5 artırması bekleniyor. Avantajlar o kadar marjinal ki, birkaç yüz dolar tasarruf etmek için Core i9-13950HX ile devam etmenizi öneririz.
Cinebench R15 Multi Loop
Cinebench R23: Multi Core | Single Core
Cinebench R20: CPU (Multi Core) | CPU (Single Core)
Cinebench R15: CPU Multi 64Bit | CPU Single 64Bit
Blender: v2.79 BMW27 CPU
7-Zip 18.03: 7z b 4 | 7z b 4 -mmt1
Geekbench 5.5: Multi-Core | Single-Core
HWBOT x265 Benchmark v2.2: 4k Preset
LibreOffice : 20 Documents To PDF
R Benchmark 2.5: Overall mean
| CPU Performance rating | |
| Alienware m18 R1 | |
| Asus Zephyrus Duo 16 GX650PY-NM006W | |
| MSI Raider GE68HX 13VF | |
| Ortalama Intel Core i9-13950HX | |
| Alienware m16 R1 AMD | |
| Lenovo Legion Slim 7i 16 Gen 8 -1! | |
| MSI GE67 HX 12UGS | |
| Asus ROG Zephyrus M16 GU603Z | |
| HP Omen 16-xf0376ng | |
| Dell Inspiron 16 Plus 7630 | |
| Lenovo Legion 5 Pro 16ARH7H RTX 3070 Ti | |
| Lenovo Legion 7 16ARHA7 | |
| Dell Inspiron 16 Plus 7610-MHJ8F | |
| Lenovo Legion C7 15IMH05 82EH0030GE | |
| Cinebench R23 / Multi Core | |
| Asus Zephyrus Duo 16 GX650PY-NM006W | |
| Alienware m18 R1 | |
| MSI Raider GE68HX 13VF | |
| Ortalama Intel Core i9-13950HX (24560 - 33277, n=7) | |
| Alienware m16 R1 AMD | |
| MSI GE67 HX 12UGS | |
| Lenovo Legion Slim 7i 16 Gen 8 | |
| HP Omen 16-xf0376ng | |
| Dell Inspiron 16 Plus 7630 | |
| Asus ROG Zephyrus M16 GU603Z | |
| Lenovo Legion 5 Pro 16ARH7H RTX 3070 Ti | |
| Lenovo Legion 7 16ARHA7 | |
| Dell Inspiron 16 Plus 7610-MHJ8F | |
| Lenovo Legion C7 15IMH05 82EH0030GE | |
| Cinebench R23 / Single Core | |
| Alienware m18 R1 | |
| MSI Raider GE68HX 13VF | |
| Ortalama Intel Core i9-13950HX (1952 - 2113, n=7) | |
| Lenovo Legion Slim 7i 16 Gen 8 | |
| Asus Zephyrus Duo 16 GX650PY-NM006W | |
| Dell Inspiron 16 Plus 7630 | |
| Asus ROG Zephyrus M16 GU603Z | |
| Alienware m16 R1 AMD | |
| MSI GE67 HX 12UGS | |
| HP Omen 16-xf0376ng | |
| Lenovo Legion 7 16ARHA7 | |
| Lenovo Legion 5 Pro 16ARH7H RTX 3070 Ti | |
| Dell Inspiron 16 Plus 7610-MHJ8F | |
| Lenovo Legion C7 15IMH05 82EH0030GE | |
| Cinebench R20 / CPU (Multi Core) | |
| Asus Zephyrus Duo 16 GX650PY-NM006W | |
| Alienware m18 R1 | |
| MSI Raider GE68HX 13VF | |
| Ortalama Intel Core i9-13950HX (8697 - 12648, n=7) | |
| Alienware m16 R1 AMD | |
| MSI GE67 HX 12UGS | |
| Lenovo Legion Slim 7i 16 Gen 8 | |
| HP Omen 16-xf0376ng | |
| Dell Inspiron 16 Plus 7630 | |
| Asus ROG Zephyrus M16 GU603Z | |
| Lenovo Legion 5 Pro 16ARH7H RTX 3070 Ti | |
| Lenovo Legion 7 16ARHA7 | |
| Dell Inspiron 16 Plus 7610-MHJ8F | |
| Lenovo Legion C7 15IMH05 82EH0030GE | |
| Cinebench R20 / CPU (Single Core) | |
| Alienware m18 R1 | |
| MSI Raider GE68HX 13VF | |
| Ortalama Intel Core i9-13950HX (742 - 816, n=7) | |
| Lenovo Legion Slim 7i 16 Gen 8 | |
| Asus Zephyrus Duo 16 GX650PY-NM006W | |
| Dell Inspiron 16 Plus 7630 | |
| Alienware m16 R1 AMD | |
| Asus ROG Zephyrus M16 GU603Z | |
| HP Omen 16-xf0376ng | |
| MSI GE67 HX 12UGS | |
| Lenovo Legion 7 16ARHA7 | |
| Lenovo Legion 5 Pro 16ARH7H RTX 3070 Ti | |
| Dell Inspiron 16 Plus 7610-MHJ8F | |
| Lenovo Legion C7 15IMH05 82EH0030GE | |
| Cinebench R15 / CPU Multi 64Bit | |
| Asus Zephyrus Duo 16 GX650PY-NM006W | |
| Alienware m18 R1 | |
| MSI Raider GE68HX 13VF | |
| Ortalama Intel Core i9-13950HX (3625 - 5227, n=7) | |
| Alienware m16 R1 AMD | |
| MSI GE67 HX 12UGS | |
| Lenovo Legion Slim 7i 16 Gen 8 | |
| Asus ROG Zephyrus M16 GU603Z | |
| HP Omen 16-xf0376ng | |
| Dell Inspiron 16 Plus 7630 | |
| Lenovo Legion 5 Pro 16ARH7H RTX 3070 Ti | |
| Lenovo Legion 7 16ARHA7 | |
| Dell Inspiron 16 Plus 7610-MHJ8F | |
| Lenovo Legion C7 15IMH05 82EH0030GE | |
| Cinebench R15 / CPU Single 64Bit | |
| Asus Zephyrus Duo 16 GX650PY-NM006W | |
| Alienware m18 R1 | |
| MSI Raider GE68HX 13VF | |
| Alienware m16 R1 AMD | |
| Ortalama Intel Core i9-13950HX (274 - 303, n=7) | |
| HP Omen 16-xf0376ng | |
| Dell Inspiron 16 Plus 7630 | |
| Asus ROG Zephyrus M16 GU603Z | |
| MSI GE67 HX 12UGS | |
| Lenovo Legion 7 16ARHA7 | |
| Lenovo Legion 5 Pro 16ARH7H RTX 3070 Ti | |
| Lenovo Legion Slim 7i 16 Gen 8 | |
| Dell Inspiron 16 Plus 7610-MHJ8F | |
| Lenovo Legion C7 15IMH05 82EH0030GE | |
| Blender / v2.79 BMW27 CPU | |
| Lenovo Legion C7 15IMH05 82EH0030GE | |
| Dell Inspiron 16 Plus 7610-MHJ8F | |
| Dell Inspiron 16 Plus 7630 | |
| Lenovo Legion 7 16ARHA7 | |
| Lenovo Legion 5 Pro 16ARH7H RTX 3070 Ti | |
| HP Omen 16-xf0376ng | |
| Asus ROG Zephyrus M16 GU603Z | |
| MSI GE67 HX 12UGS | |
| Alienware m16 R1 AMD | |
| Ortalama Intel Core i9-13950HX (100 - 137, n=7) | |
| MSI Raider GE68HX 13VF | |
| Alienware m18 R1 | |
| Asus Zephyrus Duo 16 GX650PY-NM006W | |
| 7-Zip 18.03 / 7z b 4 | |
| Asus Zephyrus Duo 16 GX650PY-NM006W | |
| Alienware m18 R1 | |
| MSI Raider GE68HX 13VF | |
| Ortalama Intel Core i9-13950HX (99351 - 127295, n=7) | |
| Alienware m16 R1 AMD | |
| MSI GE67 HX 12UGS | |
| Lenovo Legion Slim 7i 16 Gen 8 | |
| HP Omen 16-xf0376ng | |
| Asus ROG Zephyrus M16 GU603Z | |
| Lenovo Legion 5 Pro 16ARH7H RTX 3070 Ti | |
| Lenovo Legion 7 16ARHA7 | |
| Dell Inspiron 16 Plus 7630 | |
| Lenovo Legion C7 15IMH05 82EH0030GE | |
| Dell Inspiron 16 Plus 7610-MHJ8F | |
| 7-Zip 18.03 / 7z b 4 -mmt1 | |
| Asus Zephyrus Duo 16 GX650PY-NM006W | |
| Alienware m16 R1 AMD | |
| Alienware m18 R1 | |
| Ortalama Intel Core i9-13950HX (6445 - 7064, n=7) | |
| MSI Raider GE68HX 13VF | |
| HP Omen 16-xf0376ng | |
| Lenovo Legion Slim 7i 16 Gen 8 | |
| Asus ROG Zephyrus M16 GU603Z | |
| Lenovo Legion 5 Pro 16ARH7H RTX 3070 Ti | |
| Dell Inspiron 16 Plus 7630 | |
| Lenovo Legion 7 16ARHA7 | |
| MSI GE67 HX 12UGS | |
| Lenovo Legion C7 15IMH05 82EH0030GE | |
| Dell Inspiron 16 Plus 7610-MHJ8F | |
| Geekbench 5.5 / Multi-Core | |
| Alienware m18 R1 | |
| MSI Raider GE68HX 13VF | |
| Asus Zephyrus Duo 16 GX650PY-NM006W | |
| Ortalama Intel Core i9-13950HX (16776 - 21853, n=7) | |
| Alienware m16 R1 AMD | |
| MSI GE67 HX 12UGS | |
| Dell Inspiron 16 Plus 7630 | |
| Lenovo Legion Slim 7i 16 Gen 8 | |
| Asus ROG Zephyrus M16 GU603Z | |
| HP Omen 16-xf0376ng | |
| Lenovo Legion 5 Pro 16ARH7H RTX 3070 Ti | |
| Lenovo Legion 7 16ARHA7 | |
| Lenovo Legion C7 15IMH05 82EH0030GE | |
| Dell Inspiron 16 Plus 7610-MHJ8F | |
| Dell Inspiron 16 Plus 7610-MHJ8F | |
| Dell Inspiron 16 Plus 7610-MHJ8F | |
| Geekbench 5.5 / Single-Core | |
| Asus Zephyrus Duo 16 GX650PY-NM006W | |
| Alienware m18 R1 | |
| MSI Raider GE68HX 13VF | |
| Ortalama Intel Core i9-13950HX (1805 - 2097, n=7) | |
| Alienware m16 R1 AMD | |
| HP Omen 16-xf0376ng | |
| Lenovo Legion Slim 7i 16 Gen 8 | |
| Dell Inspiron 16 Plus 7630 | |
| Asus ROG Zephyrus M16 GU603Z | |
| MSI GE67 HX 12UGS | |
| Lenovo Legion 7 16ARHA7 | |
| Dell Inspiron 16 Plus 7610-MHJ8F | |
| Dell Inspiron 16 Plus 7610-MHJ8F | |
| Dell Inspiron 16 Plus 7610-MHJ8F | |
| Lenovo Legion 5 Pro 16ARH7H RTX 3070 Ti | |
| Lenovo Legion C7 15IMH05 82EH0030GE | |
| HWBOT x265 Benchmark v2.2 / 4k Preset | |
| Asus Zephyrus Duo 16 GX650PY-NM006W | |
| Alienware m18 R1 | |
| MSI Raider GE68HX 13VF | |
| Ortalama Intel Core i9-13950HX (26 - 34.5, n=7) | |
| Alienware m16 R1 AMD | |
| MSI GE67 HX 12UGS | |
| Lenovo Legion Slim 7i 16 Gen 8 | |
| HP Omen 16-xf0376ng | |
| Asus ROG Zephyrus M16 GU603Z | |
| Lenovo Legion 5 Pro 16ARH7H RTX 3070 Ti | |
| Lenovo Legion 7 16ARHA7 | |
| Dell Inspiron 16 Plus 7630 | |
| Dell Inspiron 16 Plus 7610-MHJ8F | |
| Lenovo Legion C7 15IMH05 82EH0030GE | |
| LibreOffice / 20 Documents To PDF | |
| HP Omen 16-xf0376ng | |
| Asus Zephyrus Duo 16 GX650PY-NM006W | |
| Lenovo Legion C7 15IMH05 82EH0030GE | |
| Lenovo Legion 7 16ARHA7 | |
| Lenovo Legion 5 Pro 16ARH7H RTX 3070 Ti | |
| Alienware m18 R1 | |
| Dell Inspiron 16 Plus 7610-MHJ8F | |
| Dell Inspiron 16 Plus 7630 | |
| Ortalama Intel Core i9-13950HX (32.8 - 52.1, n=7) | |
| Asus ROG Zephyrus M16 GU603Z | |
| MSI GE67 HX 12UGS | |
| Alienware m16 R1 AMD | |
| Lenovo Legion Slim 7i 16 Gen 8 | |
| MSI Raider GE68HX 13VF | |
| R Benchmark 2.5 / Overall mean | |
| Lenovo Legion C7 15IMH05 82EH0030GE | |
| Dell Inspiron 16 Plus 7610-MHJ8F | |
| Lenovo Legion 7 16ARHA7 | |
| Lenovo Legion 5 Pro 16ARH7H RTX 3070 Ti | |
| MSI GE67 HX 12UGS | |
| Asus ROG Zephyrus M16 GU603Z | |
| Dell Inspiron 16 Plus 7630 | |
| HP Omen 16-xf0376ng | |
| Alienware m16 R1 AMD | |
| Lenovo Legion Slim 7i 16 Gen 8 | |
| Asus Zephyrus Duo 16 GX650PY-NM006W | |
| Ortalama Intel Core i9-13950HX (0.3823 - 0.4121, n=7) | |
| Alienware m18 R1 | |
| MSI Raider GE68HX 13VF | |
Cinebench R23: Multi Core | Single Core
Cinebench R20: CPU (Multi Core) | CPU (Single Core)
Cinebench R15: CPU Multi 64Bit | CPU Single 64Bit
Blender: v2.79 BMW27 CPU
7-Zip 18.03: 7z b 4 | 7z b 4 -mmt1
Geekbench 5.5: Multi-Core | Single-Core
HWBOT x265 Benchmark v2.2: 4k Preset
LibreOffice : 20 Documents To PDF
R Benchmark 2.5: Overall mean
* ... daha küçük daha iyidir
AIDA64: FP32 Ray-Trace | FPU Julia | CPU SHA3 | CPU Queen | FPU SinJulia | FPU Mandel | CPU AES | CPU ZLib | FP64 Ray-Trace | CPU PhotoWorxx
| Performance rating | |
| Alienware m16 R1 AMD | |
| MSI Raider GE68HX 13VF | |
| Ortalama Intel Core i9-13950HX | |
| HP Omen 16-xf0376ng | |
| Asus ROG Zephyrus M16 GU604VY-NM042X | |
| Lenovo Legion Slim 7i 16 Gen 8 | |
| MSI GE67 HX 12UGS | |
| AIDA64 / FP32 Ray-Trace | |
| Alienware m16 R1 AMD | |
| MSI Raider GE68HX 13VF | |
| HP Omen 16-xf0376ng | |
| Ortalama Intel Core i9-13950HX (17993 - 28957, n=9) | |
| Asus ROG Zephyrus M16 GU604VY-NM042X | |
| Lenovo Legion Slim 7i 16 Gen 8 | |
| MSI GE67 HX 12UGS | |
| AIDA64 / FPU Julia | |
| Alienware m16 R1 AMD | |
| MSI Raider GE68HX 13VF | |
| Ortalama Intel Core i9-13950HX (89362 - 144303, n=9) | |
| HP Omen 16-xf0376ng | |
| Asus ROG Zephyrus M16 GU604VY-NM042X | |
| Lenovo Legion Slim 7i 16 Gen 8 | |
| MSI GE67 HX 12UGS | |
| AIDA64 / CPU SHA3 | |
| Alienware m16 R1 AMD | |
| MSI Raider GE68HX 13VF | |
| Ortalama Intel Core i9-13950HX (4518 - 7093, n=9) | |
| HP Omen 16-xf0376ng | |
| Asus ROG Zephyrus M16 GU604VY-NM042X | |
| MSI GE67 HX 12UGS | |
| Lenovo Legion Slim 7i 16 Gen 8 | |
| AIDA64 / CPU Queen | |
| Alienware m16 R1 AMD | |
| MSI Raider GE68HX 13VF | |
| Ortalama Intel Core i9-13950HX (131931 - 140103, n=8) | |
| Lenovo Legion Slim 7i 16 Gen 8 | |
| Asus ROG Zephyrus M16 GU604VY-NM042X | |
| HP Omen 16-xf0376ng | |
| MSI GE67 HX 12UGS | |
| AIDA64 / FPU SinJulia | |
| Alienware m16 R1 AMD | |
| MSI Raider GE68HX 13VF | |
| HP Omen 16-xf0376ng | |
| Ortalama Intel Core i9-13950HX (12318 - 17057, n=9) | |
| MSI GE67 HX 12UGS | |
| Asus ROG Zephyrus M16 GU604VY-NM042X | |
| Lenovo Legion Slim 7i 16 Gen 8 | |
| AIDA64 / FPU Mandel | |
| Alienware m16 R1 AMD | |
| MSI Raider GE68HX 13VF | |
| HP Omen 16-xf0376ng | |
| Ortalama Intel Core i9-13950HX (44372 - 71038, n=9) | |
| Asus ROG Zephyrus M16 GU604VY-NM042X | |
| Lenovo Legion Slim 7i 16 Gen 8 | |
| MSI GE67 HX 12UGS | |
| AIDA64 / CPU AES | |
| Ortalama Intel Core i9-13950HX (99981 - 204491, n=9) | |
| MSI Raider GE68HX 13VF | |
| MSI GE67 HX 12UGS | |
| Alienware m16 R1 AMD | |
| Asus ROG Zephyrus M16 GU604VY-NM042X | |
| Lenovo Legion Slim 7i 16 Gen 8 | |
| HP Omen 16-xf0376ng | |
| AIDA64 / CPU ZLib | |
| MSI Raider GE68HX 13VF | |
| Alienware m16 R1 AMD | |
| Ortalama Intel Core i9-13950HX (1263 - 2069, n=9) | |
| MSI GE67 HX 12UGS | |
| Lenovo Legion Slim 7i 16 Gen 8 | |
| Asus ROG Zephyrus M16 GU604VY-NM042X | |
| HP Omen 16-xf0376ng | |
| AIDA64 / FP64 Ray-Trace | |
| Alienware m16 R1 AMD | |
| MSI Raider GE68HX 13VF | |
| HP Omen 16-xf0376ng | |
| Ortalama Intel Core i9-13950HX (9649 - 15573, n=9) | |
| Asus ROG Zephyrus M16 GU604VY-NM042X | |
| Lenovo Legion Slim 7i 16 Gen 8 | |
| MSI GE67 HX 12UGS | |
| AIDA64 / CPU PhotoWorxx | |
| MSI Raider GE68HX 13VF | |
| Asus ROG Zephyrus M16 GU604VY-NM042X | |
| Ortalama Intel Core i9-13950HX (40233 - 50864, n=9) | |
| HP Omen 16-xf0376ng | |
| MSI GE67 HX 12UGS | |
| Alienware m16 R1 AMD | |
| Lenovo Legion Slim 7i 16 Gen 8 | |
Sistem Performansı
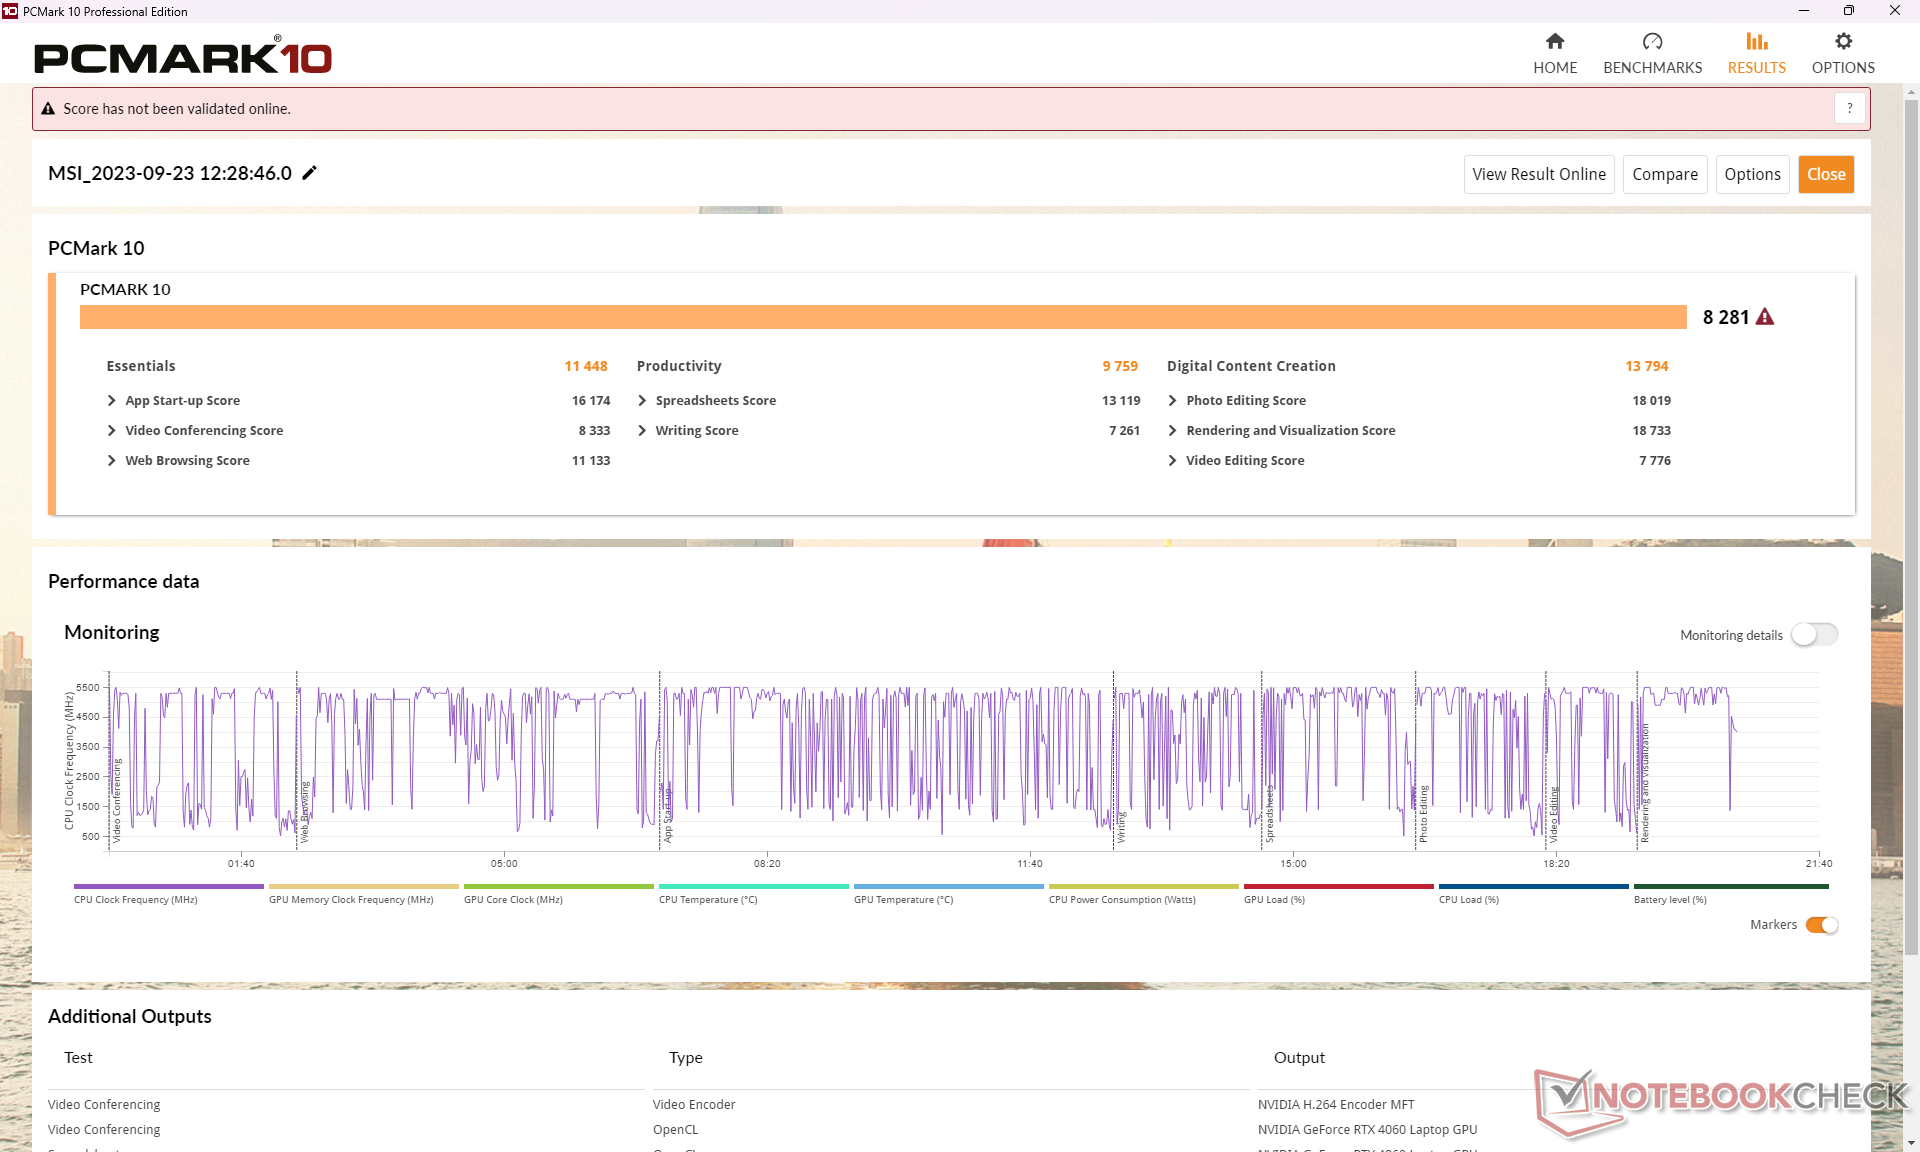
PCMark kıyaslamaları, Alienware m16 R1 gibi diğer 16 inçlik oyun dizüstü bilgisayarlarıyla karşılaştırılabilir veya Lenovo Legion Slim 7i 16 sadece birkaç yüzde puan farkla. Test sırasında test ünitemizde uykudan uyanma sorunu veya başka kayda değer bir sorun yaşamadık.
CrossMark: Overall | Productivity | Creativity | Responsiveness
| PCMark 10 / Score | |
| Alienware m16 R1 AMD | |
| Lenovo Legion Slim 7i 16 Gen 8 | |
| MSI Raider GE68HX 13VF | |
| Ortalama Intel Core i9-13950HX, NVIDIA GeForce RTX 4060 Laptop GPU (n=1) | |
| Asus ROG Zephyrus M16 GU604VY-NM042X | |
| HP Omen 16-xf0376ng | |
| MSI GE67 HX 12UGS | |
| PCMark 10 / Essentials | |
| Asus ROG Zephyrus M16 GU604VY-NM042X | |
| Alienware m16 R1 AMD | |
| MSI Raider GE68HX 13VF | |
| Ortalama Intel Core i9-13950HX, NVIDIA GeForce RTX 4060 Laptop GPU (n=1) | |
| Lenovo Legion Slim 7i 16 Gen 8 | |
| HP Omen 16-xf0376ng | |
| MSI GE67 HX 12UGS | |
| PCMark 10 / Productivity | |
| Asus ROG Zephyrus M16 GU604VY-NM042X | |
| Lenovo Legion Slim 7i 16 Gen 8 | |
| Alienware m16 R1 AMD | |
| HP Omen 16-xf0376ng | |
| MSI GE67 HX 12UGS | |
| MSI Raider GE68HX 13VF | |
| Ortalama Intel Core i9-13950HX, NVIDIA GeForce RTX 4060 Laptop GPU (n=1) | |
| PCMark 10 / Digital Content Creation | |
| Alienware m16 R1 AMD | |
| MSI Raider GE68HX 13VF | |
| Ortalama Intel Core i9-13950HX, NVIDIA GeForce RTX 4060 Laptop GPU (n=1) | |
| Lenovo Legion Slim 7i 16 Gen 8 | |
| HP Omen 16-xf0376ng | |
| MSI GE67 HX 12UGS | |
| Asus ROG Zephyrus M16 GU604VY-NM042X | |
| CrossMark / Overall | |
| Alienware m16 R1 AMD | |
| Lenovo Legion Slim 7i 16 Gen 8 | |
| MSI GE67 HX 12UGS | |
| Asus ROG Zephyrus M16 GU604VY-NM042X | |
| MSI Raider GE68HX 13VF | |
| Ortalama Intel Core i9-13950HX, NVIDIA GeForce RTX 4060 Laptop GPU (n=1) | |
| CrossMark / Productivity | |
| Lenovo Legion Slim 7i 16 Gen 8 | |
| Alienware m16 R1 AMD | |
| MSI GE67 HX 12UGS | |
| Asus ROG Zephyrus M16 GU604VY-NM042X | |
| MSI Raider GE68HX 13VF | |
| Ortalama Intel Core i9-13950HX, NVIDIA GeForce RTX 4060 Laptop GPU (n=1) | |
| CrossMark / Creativity | |
| MSI Raider GE68HX 13VF | |
| Ortalama Intel Core i9-13950HX, NVIDIA GeForce RTX 4060 Laptop GPU (n=1) | |
| Asus ROG Zephyrus M16 GU604VY-NM042X | |
| Alienware m16 R1 AMD | |
| MSI GE67 HX 12UGS | |
| Lenovo Legion Slim 7i 16 Gen 8 | |
| CrossMark / Responsiveness | |
| MSI GE67 HX 12UGS | |
| Lenovo Legion Slim 7i 16 Gen 8 | |
| Alienware m16 R1 AMD | |
| Asus ROG Zephyrus M16 GU604VY-NM042X | |
| MSI Raider GE68HX 13VF | |
| Ortalama Intel Core i9-13950HX, NVIDIA GeForce RTX 4060 Laptop GPU (n=1) | |
| PCMark 10 Score | 8281 puan | |
Yardım | ||
| AIDA64 / Memory Copy | |
| MSI Raider GE68HX 13VF | |
| Ortalama Intel Core i9-13950HX (61938 - 78813, n=9) | |
| Asus ROG Zephyrus M16 GU604VY-NM042X | |
| HP Omen 16-xf0376ng | |
| MSI GE67 HX 12UGS | |
| Alienware m16 R1 AMD | |
| Lenovo Legion Slim 7i 16 Gen 8 | |
| AIDA64 / Memory Read | |
| MSI Raider GE68HX 13VF | |
| Ortalama Intel Core i9-13950HX (62368 - 86831, n=9) | |
| Asus ROG Zephyrus M16 GU604VY-NM042X | |
| HP Omen 16-xf0376ng | |
| MSI GE67 HX 12UGS | |
| Alienware m16 R1 AMD | |
| Lenovo Legion Slim 7i 16 Gen 8 | |
| AIDA64 / Memory Write | |
| HP Omen 16-xf0376ng | |
| MSI Raider GE68HX 13VF | |
| Ortalama Intel Core i9-13950HX (59501 - 80441, n=9) | |
| Asus ROG Zephyrus M16 GU604VY-NM042X | |
| MSI GE67 HX 12UGS | |
| Alienware m16 R1 AMD | |
| Lenovo Legion Slim 7i 16 Gen 8 | |
| AIDA64 / Memory Latency | |
| MSI GE67 HX 12UGS | |
| Alienware m16 R1 AMD | |
| HP Omen 16-xf0376ng | |
| Ortalama Intel Core i9-13950HX (84.4 - 99.5, n=9) | |
| Asus ROG Zephyrus M16 GU604VY-NM042X | |
| MSI Raider GE68HX 13VF | |
| Lenovo Legion Slim 7i 16 Gen 8 | |
* ... daha küçük daha iyidir
DPC Gecikme Süresi
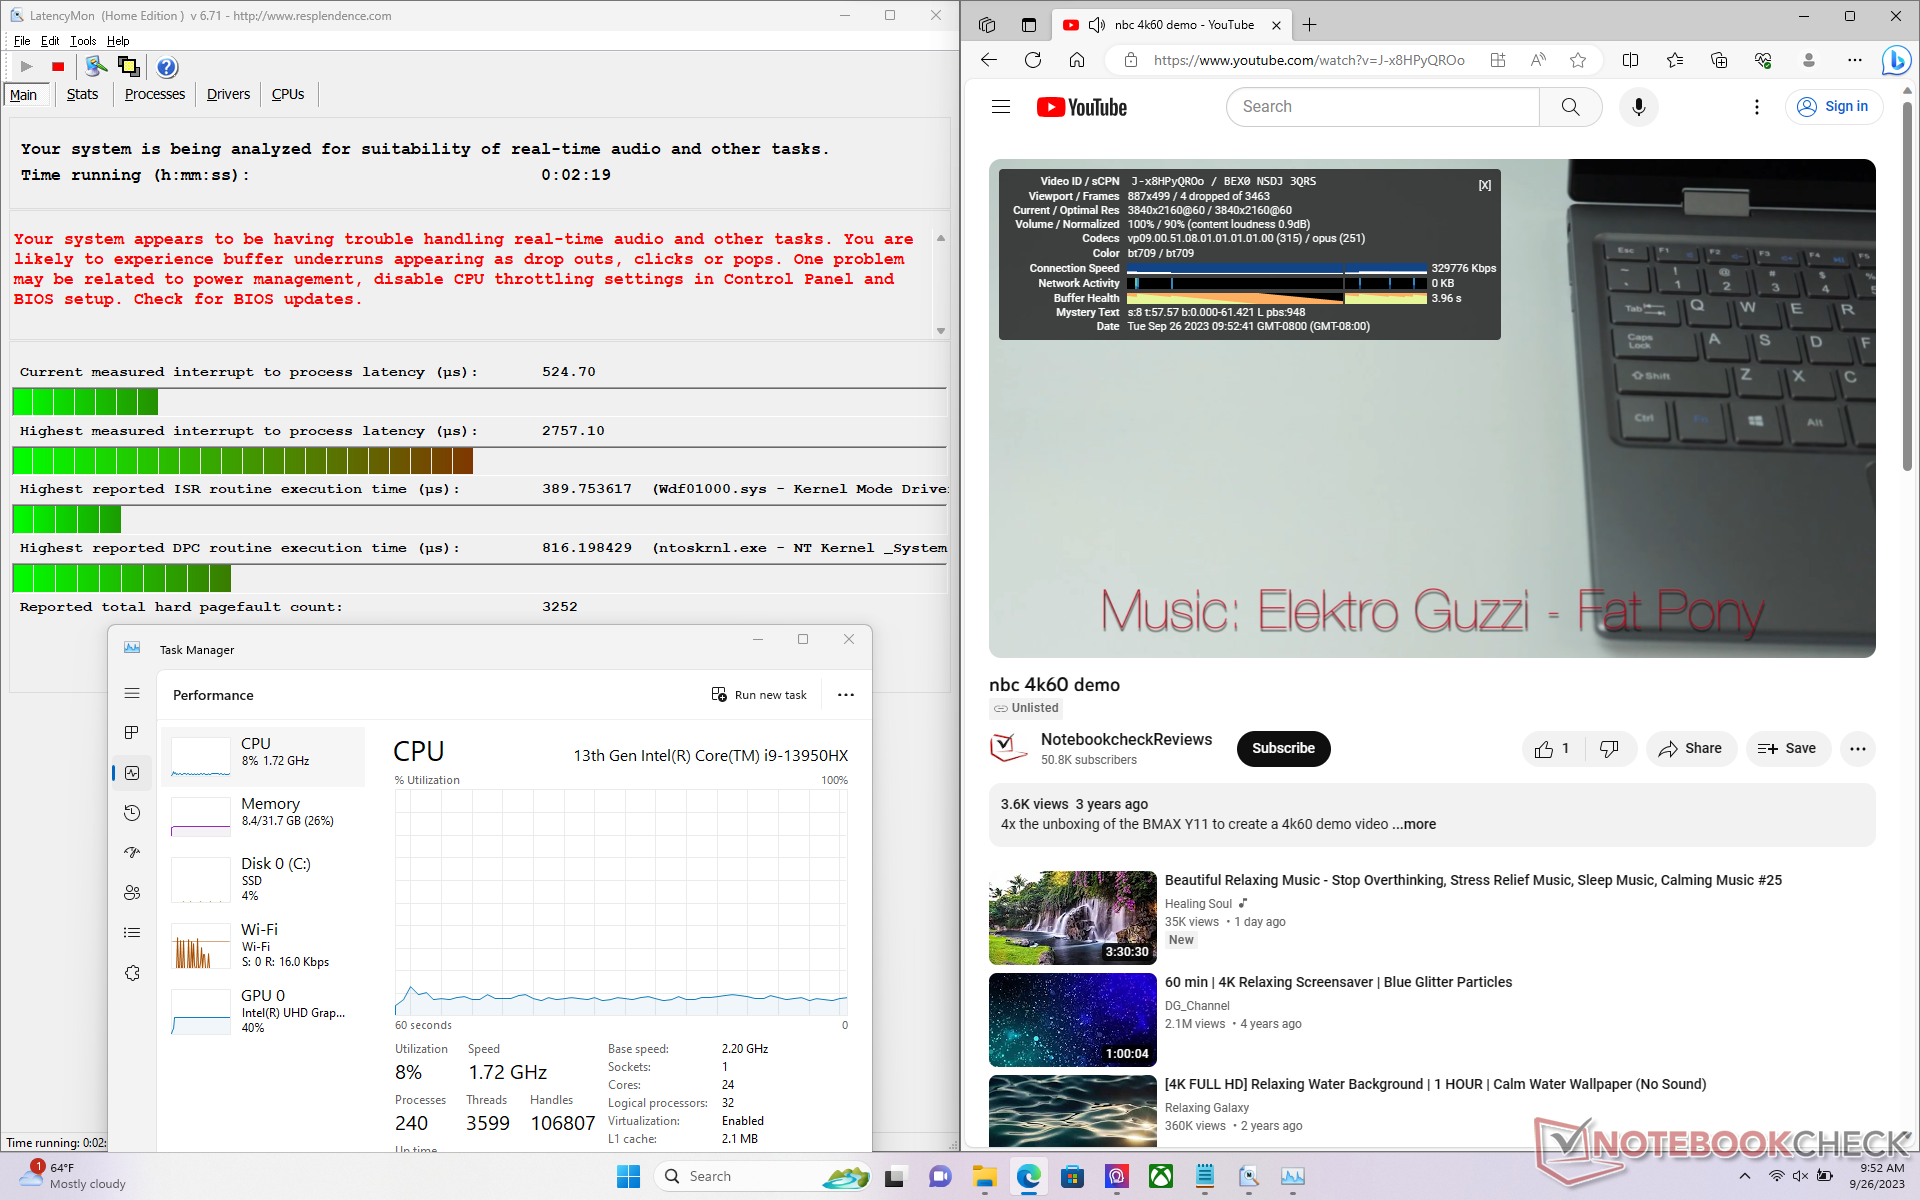
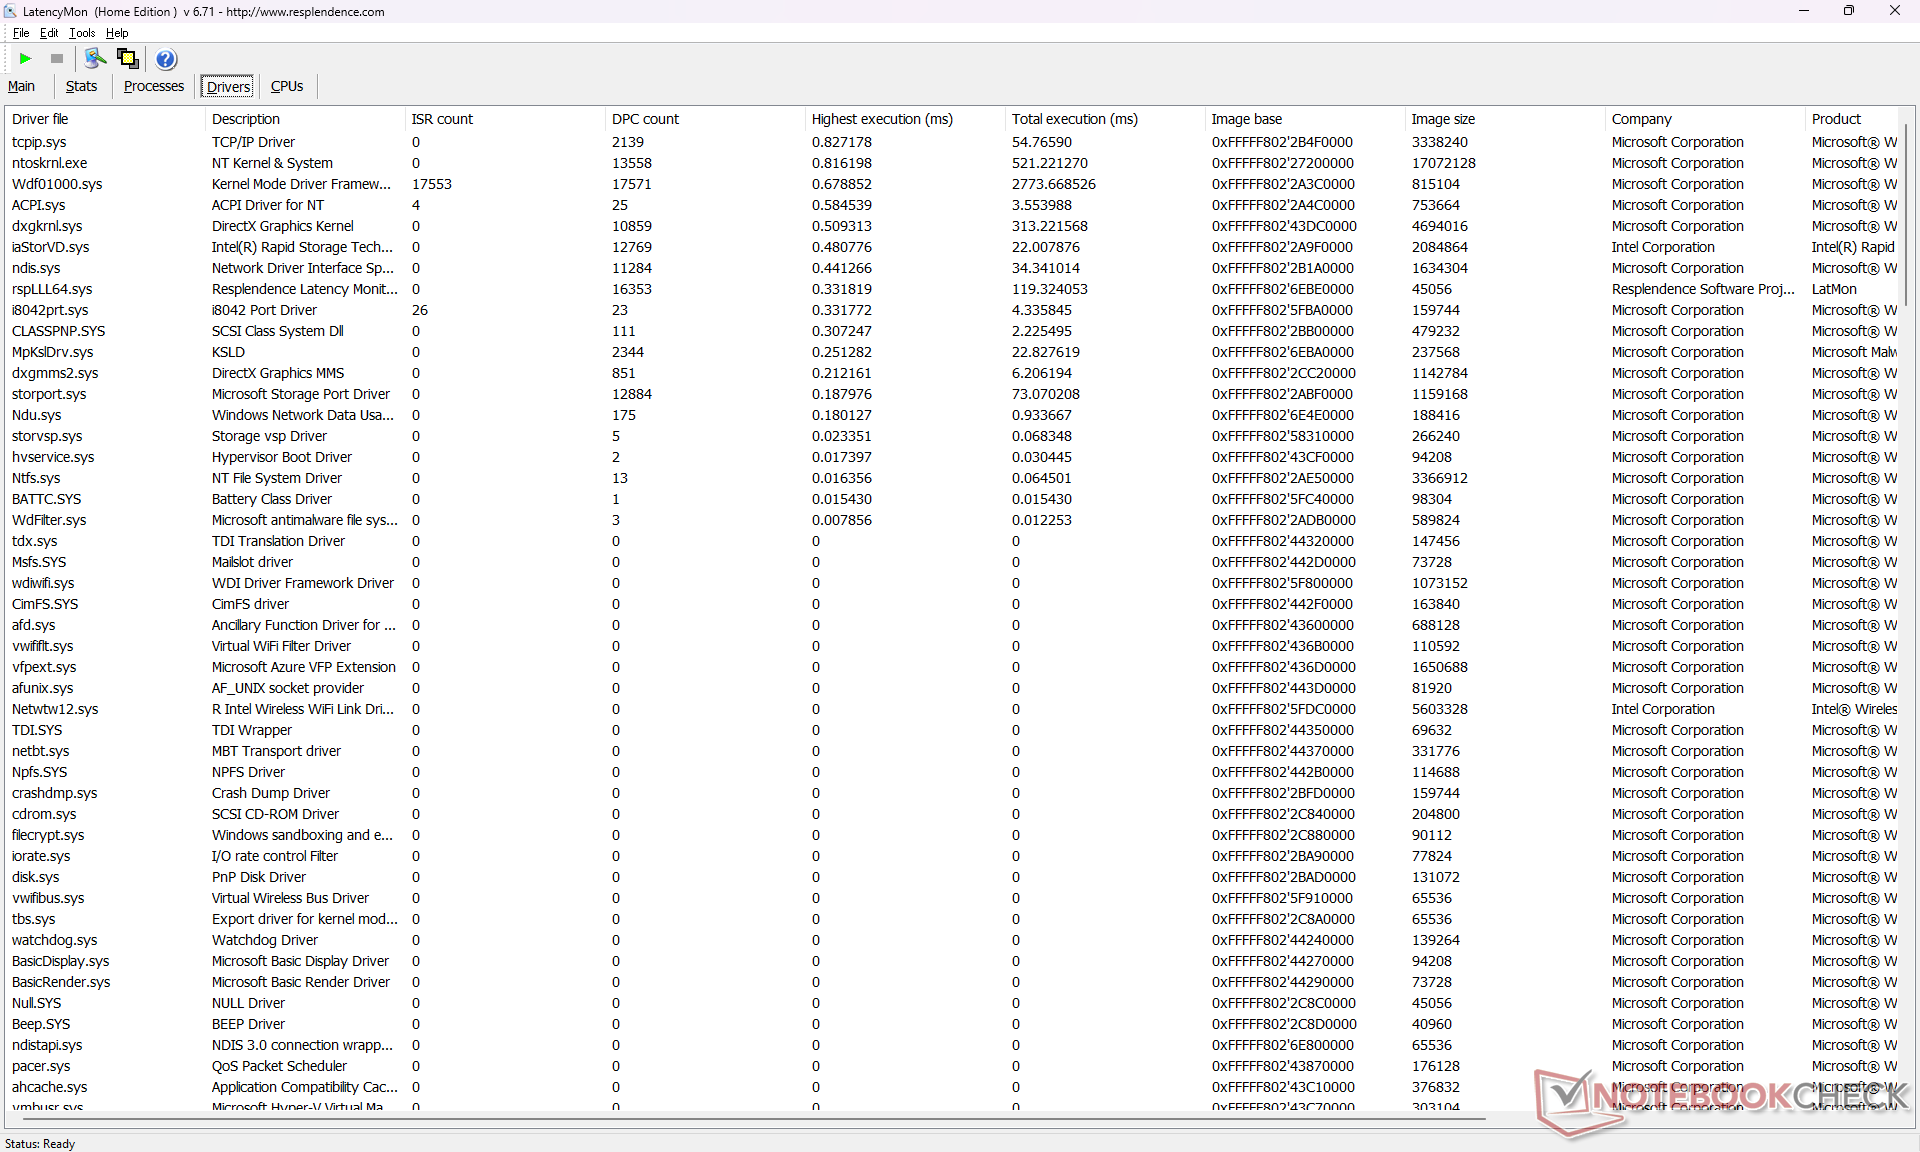
LatencyMon, ana sayfamızın birden fazla tarayıcı sekmesini açarken DPC sorunlarını ortaya çıkarıyor. 60 FPS'de 4K video oynatma, 60 saniyelik bir pencere boyunca kaydedilen 4 karenin düşmesiyle kusurludur.
| DPC Latencies / LatencyMon - interrupt to process latency (max), Web, Youtube, Prime95 | |
| Lenovo Legion Slim 7i 16 Gen 8 | |
| Asus ROG Zephyrus M16 GU604VY-NM042X | |
| MSI Raider GE68HX 13VF | |
| HP Omen 16-xf0376ng | |
| Alienware m16 R1 AMD | |
| MSI GE67 HX 12UGS | |
* ... daha küçük daha iyidir
Depolama Cihazları
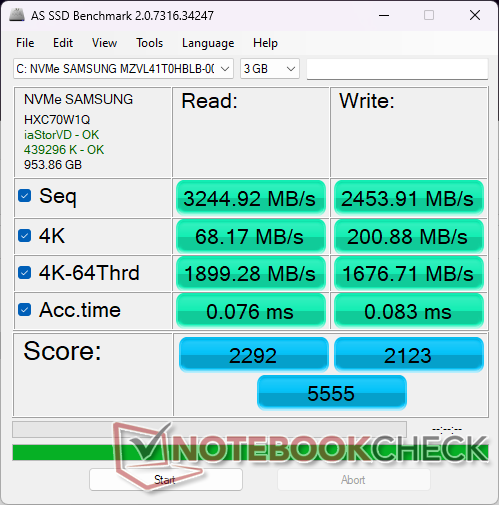
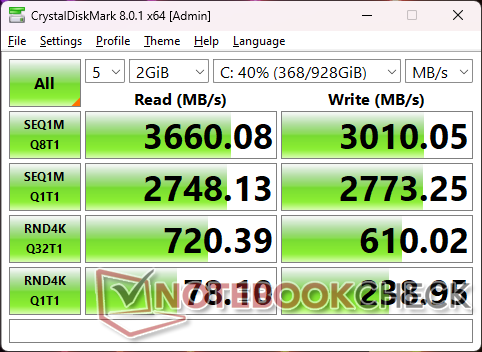
Ünitemiz daha ucuz olan 1 TB ile birlikte gönderilir Samsung PM9B1 daha pahalı olan Samsung PM9A1 yerine muhtemelen maliyetten tasarruf etmek için. PM9B1, PM9A1'deki ~7000 MB/s'ye kıyasla yaklaşık 3600 MB/s'lik maksimum sıralı okuma hızlarıyla neredeyse yarı yarıya daha hızlıdır. SSD performansı yine de istikrarlıdır ve herhangi bir yavaşlama söz konusu değildir.

| Drive Performance rating - Percent | |
| MSI GE67 HX 12UGS | |
| Lenovo Legion Slim 7i 16 Gen 8 | |
| Alienware m16 R1 AMD | |
| Asus ROG Zephyrus M16 GU604VY-NM042X | |
| HP Omen 16-xf0376ng | |
| MSI Raider GE68HX 13VF -11! | |
* ... daha küçük daha iyidir
Disk Throttling: DiskSpd Read Loop, Queue Depth 8
GPU Performansı
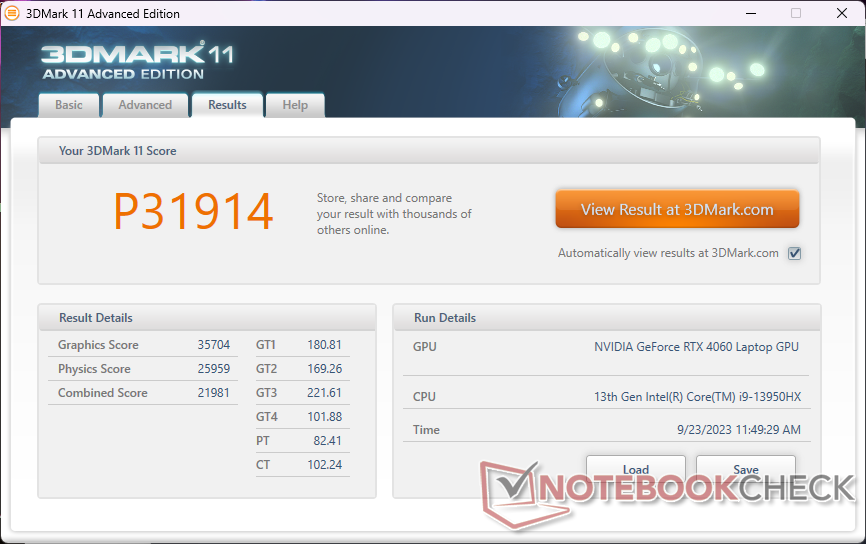
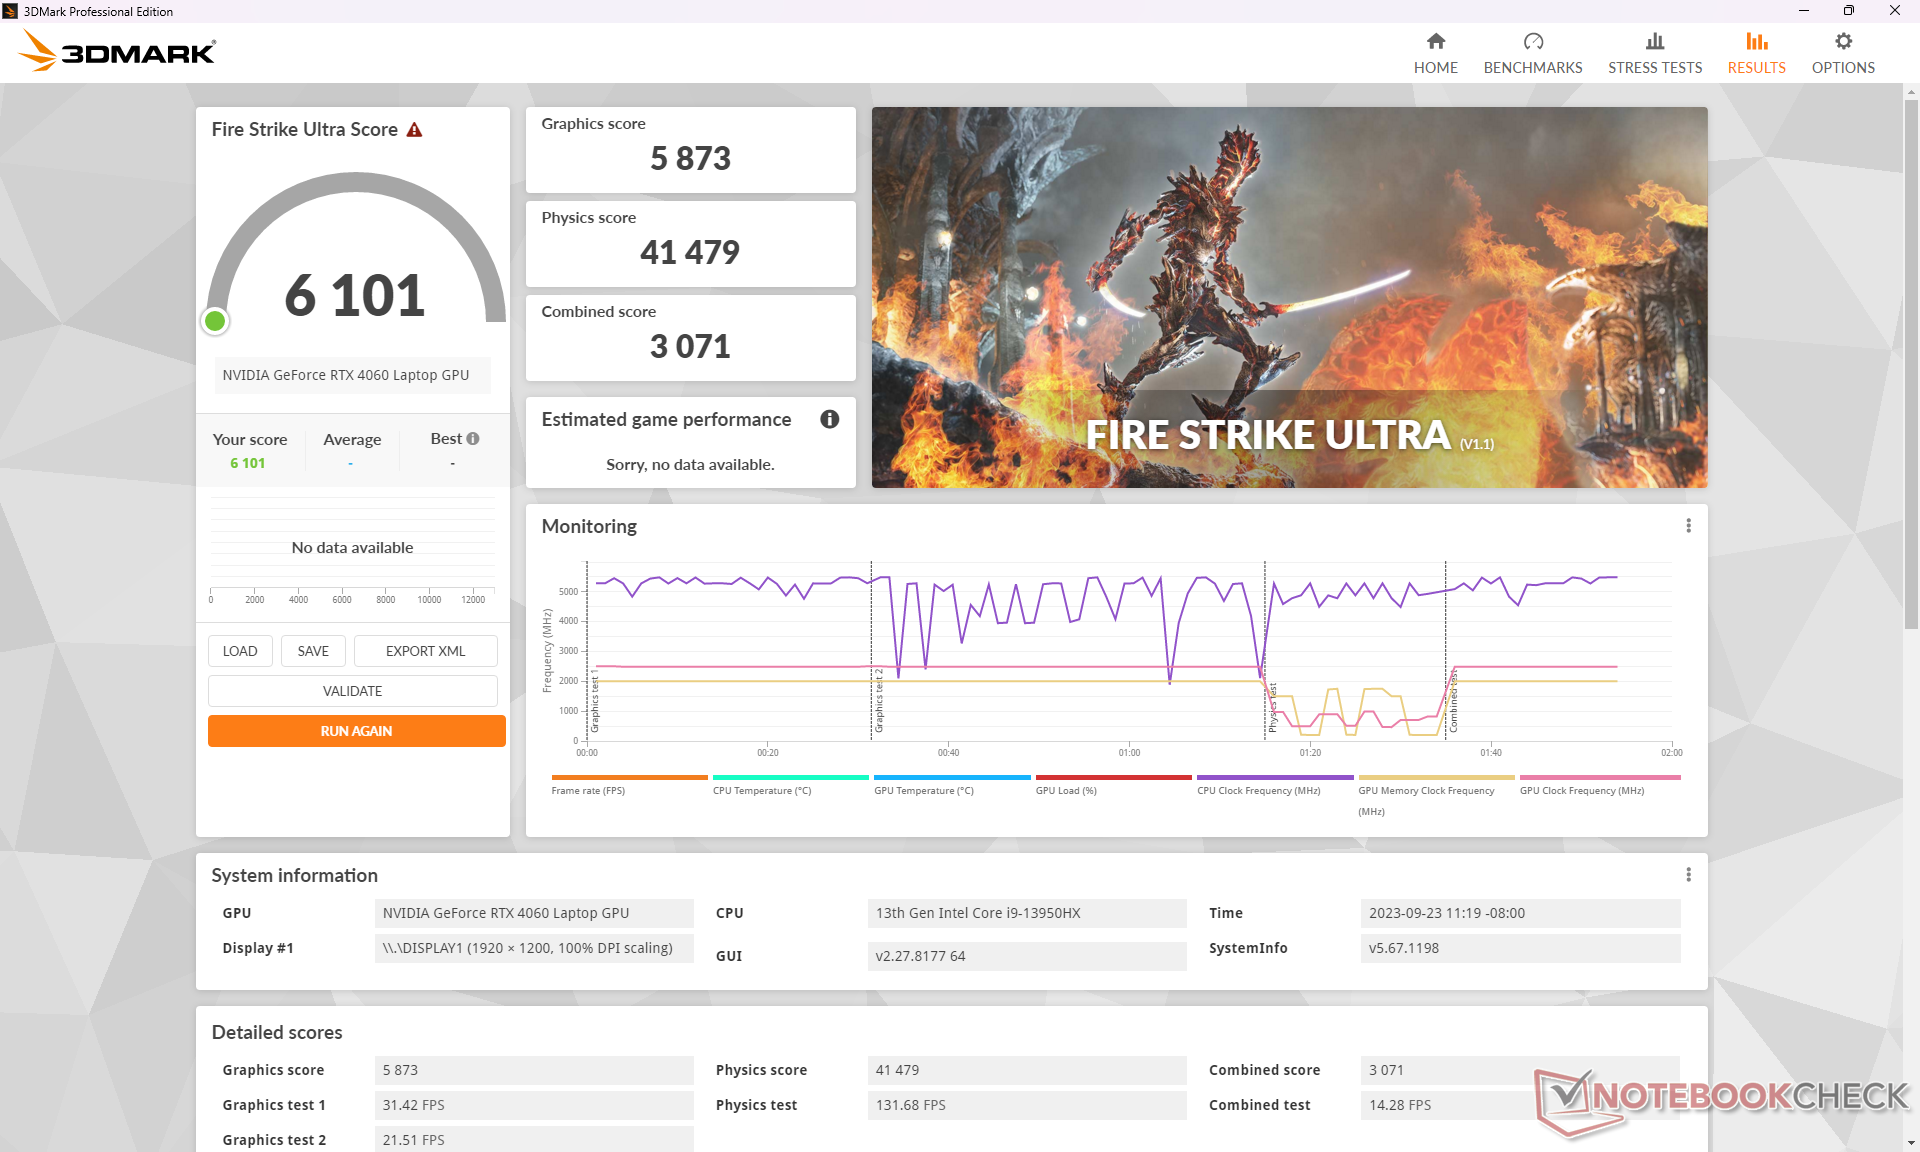
Bizim RTX 4060 aynı GPU ile donatılmış veritabanımızdaki ortalama oyun dizüstü bilgisayarının biraz üzerinde sonuçlarla iyi bir performans sergiliyor. RTX 4070, 4080 veya 4090 rTX 4060'a göre performansı sırasıyla yüzde 10 ila 20, yüzde 60 ila 80 ve yüzde 80 ila 100 oranında artırması bekleniyor. Performans farkı en fazla RTX 4070 ve 4080 arasında.
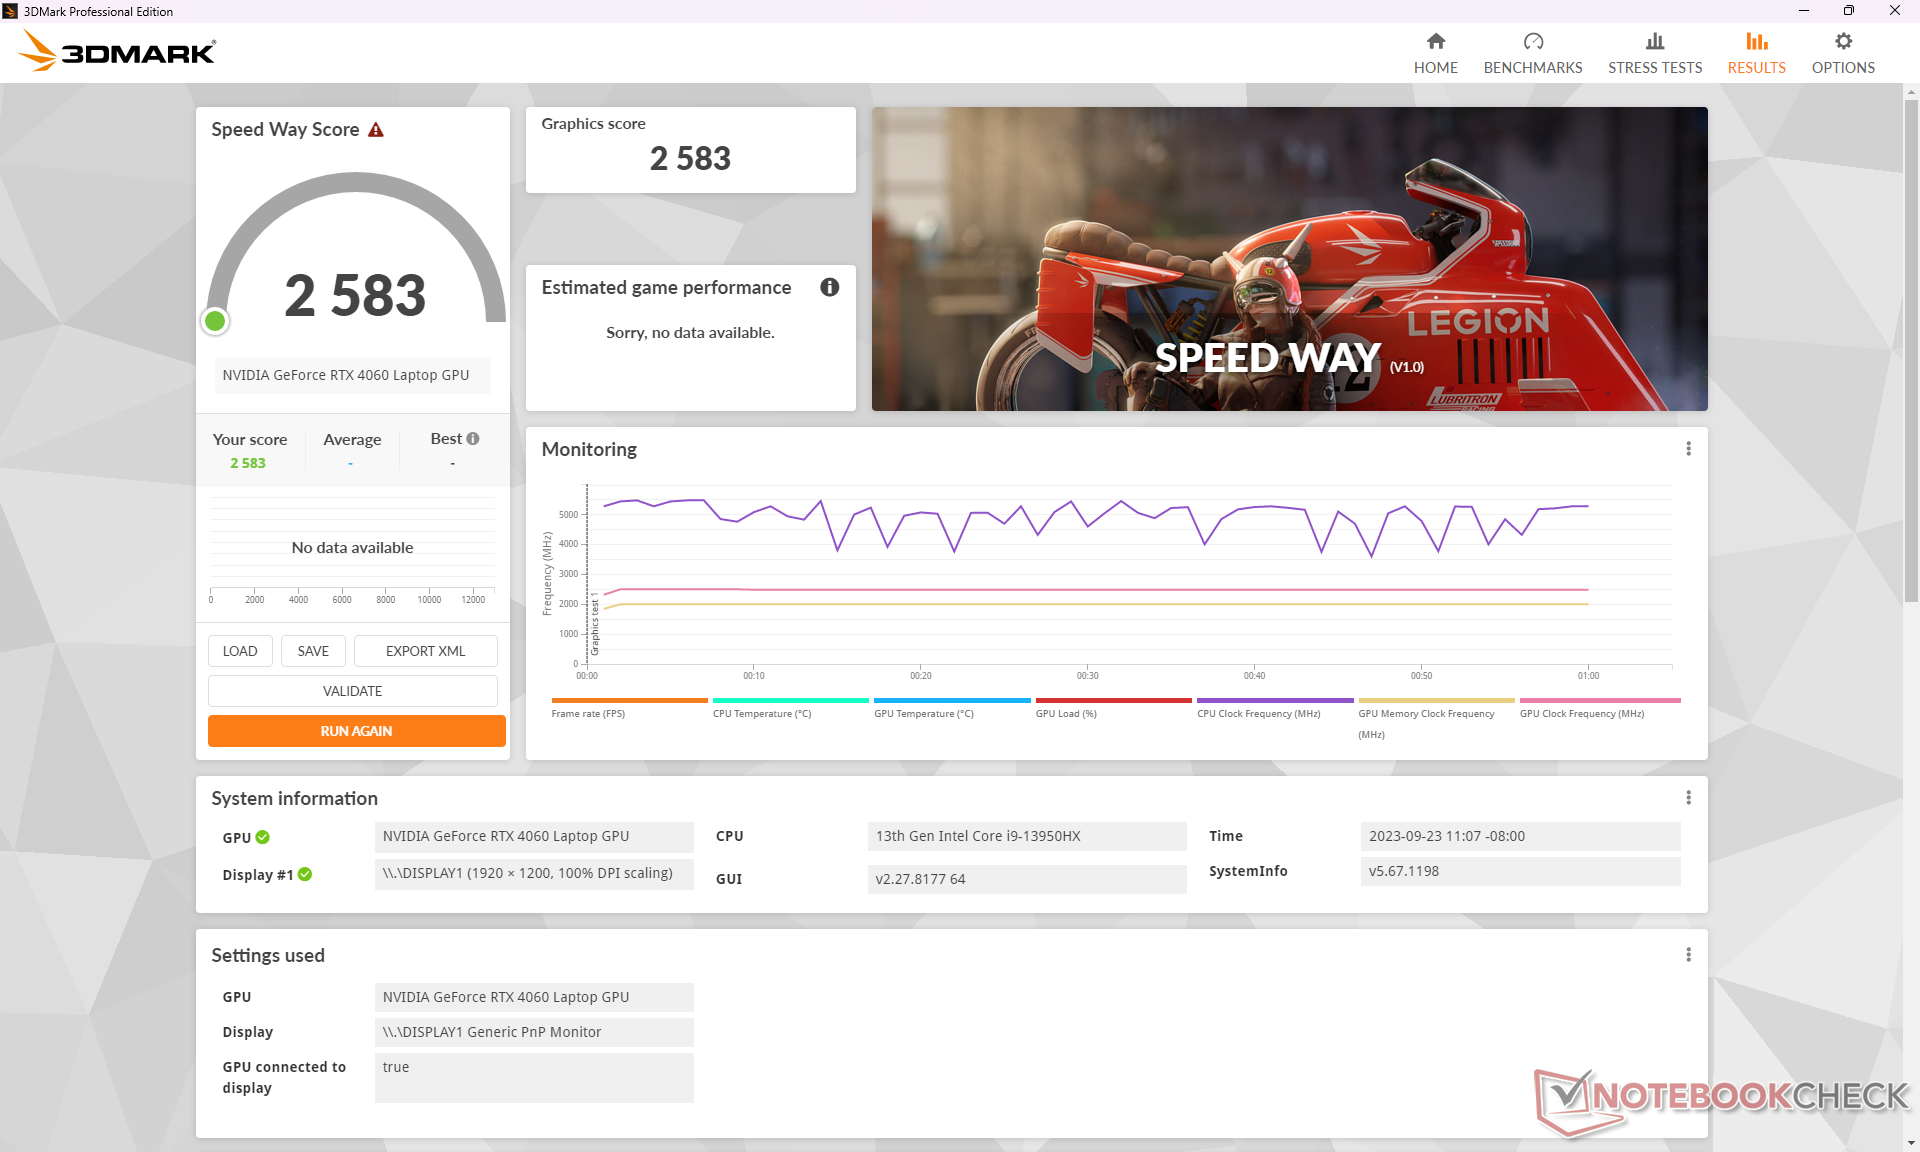
Can sıkıcı bir şekilde MSI, MSI Center'ı 3DMark'ın çalıştığını algıladığında otomatik olarak Aşırı Performans moduna geçecek şekilde programlamıştır ve ne yazık ki bunu devre dışı bırakmanın kolay bir yolu yoktur. Kontrolü son kullanıcının elinden aldığı için bunu sinir bozucu buluyoruz. Oyun çalıştırırken otomatik geçiş gerçekleşmez.
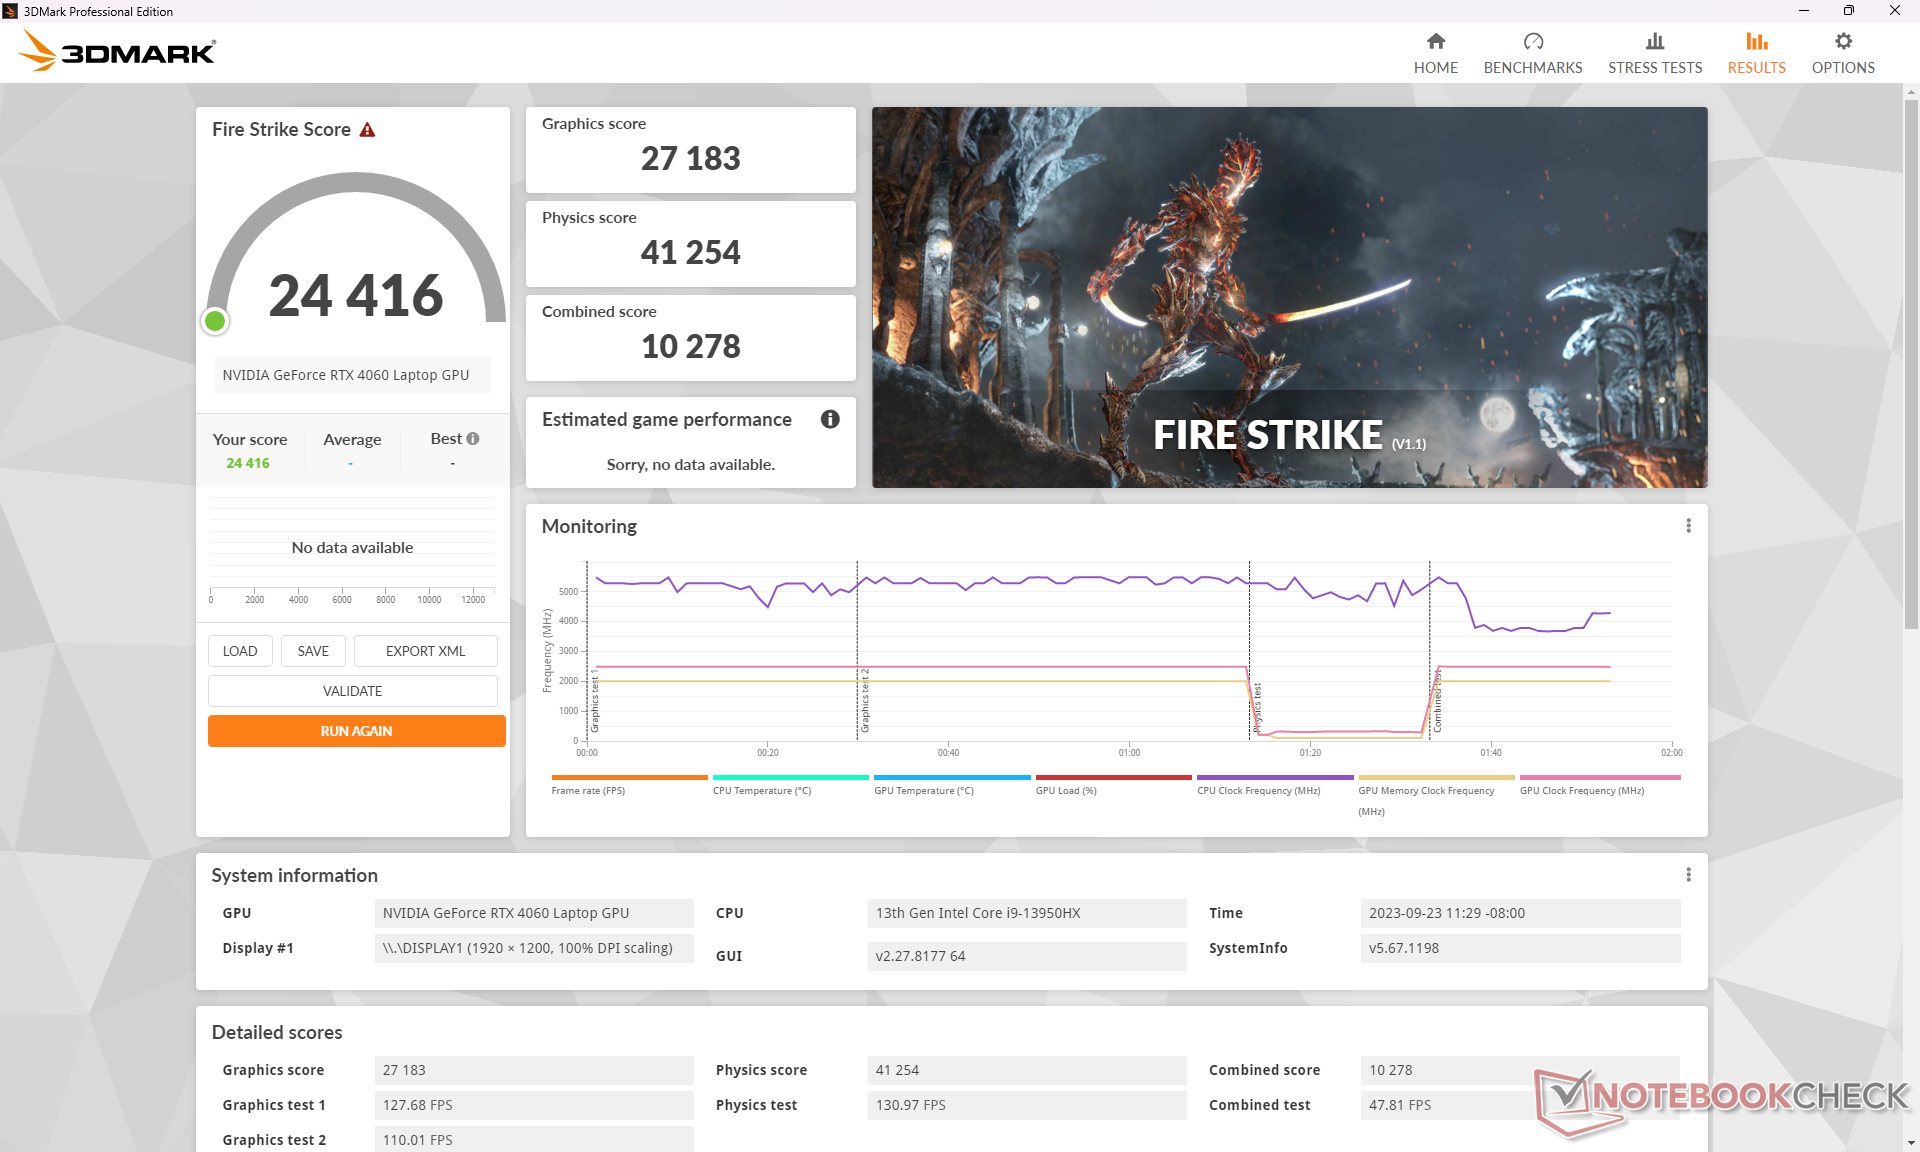
Cooler Boost'un etkinleştirilmesi, aşağıdaki Fire Strike sonuçlarımızda gösterildiği gibi CPU veya GPU performansını önemli ölçüde etkilemiyor gibi görünüyor. Bu nedenle, bu özellik maksimum performans için hayati öneme sahip değildir ve yalnızca daha düşük çalışma sıcaklıkları isteniyorsa önerilir.
| Güç Profili | Fire Strike Grafikler | Fire Strike Fizik | Birleşik Puan |
| Aşırı Performans modu (Cooler Boost açık) | 27127 | 41525 | 11480 |
| Aşırı Performans modu (Cooler Boost kapalı) | 27183 (0%) | 41254 (-1%) | 10278 (-10%) |
| Akü Gücü | 19528 (-28%) | 18623 (-55%) | 5986 (-48%) |
| 3DMark Performance rating - Percent | |
| Asus Zephyrus Duo 16 GX650PY-NM006W | |
| Alienware m16 R1 AMD | |
| Lenovo Legion 7 16IAX7-82TD004SGE -1! | |
| Lenovo Legion Slim 7i 16 Gen 8 | |
| MSI GE67 HX 12UGS -1! | |
| Lenovo Legion 7 16ARHA7 -1! | |
| MSI Raider GE68HX 13VF | |
| Ortalama NVIDIA GeForce RTX 4060 Laptop GPU | |
| HP Victus 16-r0076TX | |
| Lenovo Legion C7 15IMH05 82EH0030GE -1! | |
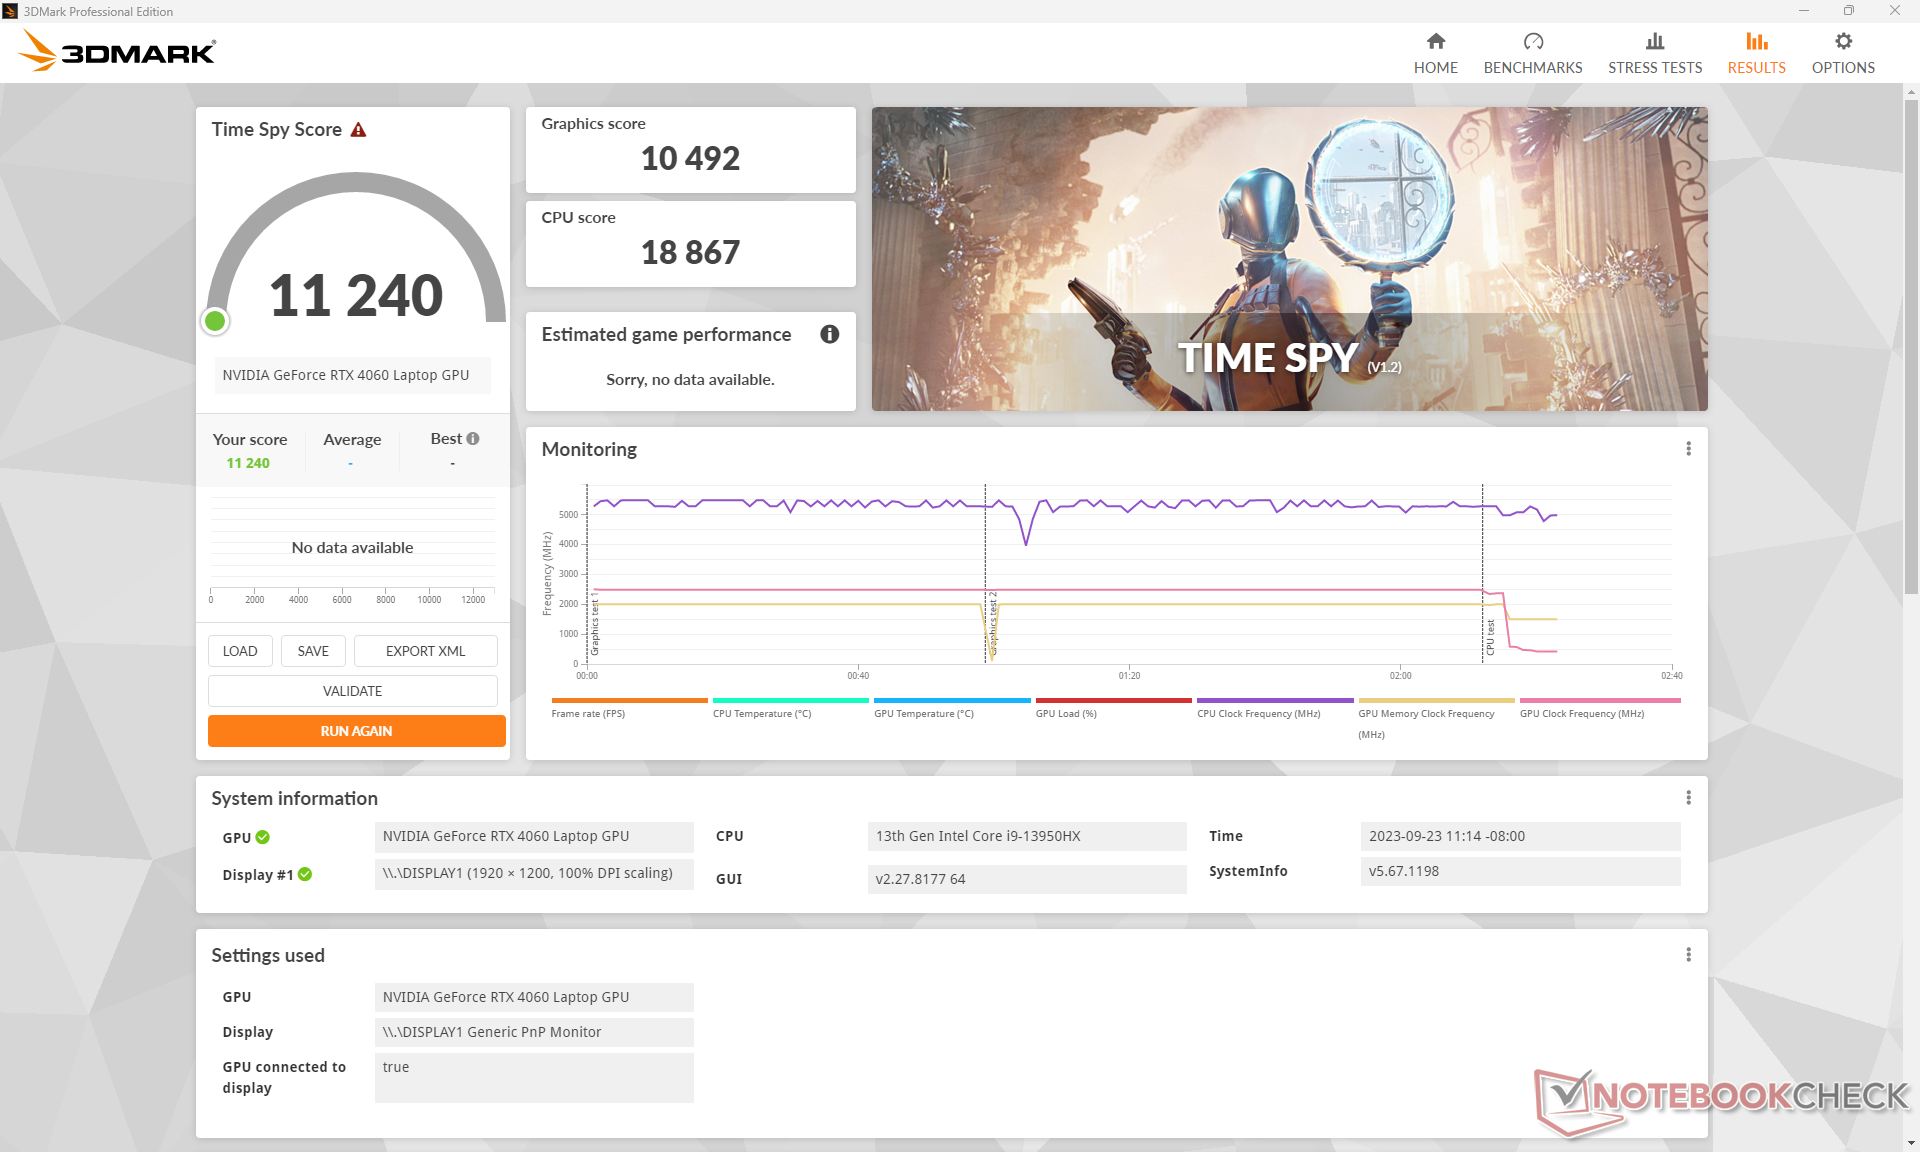
| 3DMark 11 Performance | 31914 puan | |
| 3DMark Fire Strike Score | 24416 puan | |
| 3DMark Time Spy Score | 11240 puan | |
Yardım | ||
* ... daha küçük daha iyidir
Oyun Performansı
Çok gibi RTX 2060 ve RTX 3060'tan önce, RTX 4060 1080p60 oyun için mükemmeldir. Test edilen tüm oyunlar 1080p maksimum ayarlarda çok iyi çalışıyor, ancak Ratchet and Clank Rift Apart gibi daha yeni ve daha zorlu oyunlar 60 FPS'nin altına düşme eğiliminde. Özellikle ana ekran G-Sync desteğinden yoksun olduğu için bu gibi durumlarda daha düşük ayarlar veya DLSS önerilir.
| Tiny Tina's Wonderlands | |
| 1920x1080 Low Preset (DX12) | |
| Alienware m16 R1 AMD | |
| Lenovo Legion Slim 7i 16 Gen 8 | |
| MSI Raider GE68HX 13VF | |
| Ortalama NVIDIA GeForce RTX 4060 Laptop GPU (164.4 - 235, n=9) | |
| 1920x1080 Medium Preset (DX12) | |
| Alienware m16 R1 AMD | |
| Lenovo Legion Slim 7i 16 Gen 8 | |
| MSI Raider GE68HX 13VF | |
| Ortalama NVIDIA GeForce RTX 4060 Laptop GPU (116 - 192.3, n=9) | |
| 1920x1080 High Preset (DX12) | |
| Alienware m16 R1 AMD | |
| Lenovo Legion Slim 7i 16 Gen 8 | |
| MSI Raider GE68HX 13VF | |
| Ortalama NVIDIA GeForce RTX 4060 Laptop GPU (86.6 - 121.2, n=10) | |
| 1920x1080 Badass Preset (DX12) | |
| Asus Zephyrus Duo 16 GX650PY-NM006W | |
| Alienware m16 R1 AMD | |
| Lenovo Legion Slim 7i 16 Gen 8 | |
| MSI Raider GE68HX 13VF | |
| Ortalama NVIDIA GeForce RTX 4060 Laptop GPU (67.5 - 92.7, n=11) | |
| Ratchet & Clank Rift Apart | |
| 1920x1080 Low Preset | |
| Ortalama NVIDIA GeForce RTX 4060 Laptop GPU (84.7 - 86, n=3) | |
| MSI Raider GE68HX 13VF | |
| 1920x1080 Medium Preset AA:T | |
| MSI Raider GE68HX 13VF | |
| Ortalama NVIDIA GeForce RTX 4060 Laptop GPU (73.4 - 75, n=4) | |
| 1920x1080 High Preset AA:T | |
| Ortalama NVIDIA GeForce RTX 4060 Laptop GPU (59 - 60.6, n=4) | |
| MSI Raider GE68HX 13VF | |
| 1920x1080 Very High Preset AA:T | |
| Ortalama NVIDIA GeForce RTX 4060 Laptop GPU (51.6 - 54.8, n=4) | |
| MSI Raider GE68HX 13VF | |
Witcher 3 FPS Chart
| düşük | orta | yüksek | ultra | |
|---|---|---|---|---|
| The Witcher 3 (2015) | 556.3 | 364.9 | 213.1 | 103.5 |
| Dota 2 Reborn (2015) | 232 | 207 | 199 | 182.2 |
| Final Fantasy XV Benchmark (2018) | 223 | 151.3 | 103.2 | |
| X-Plane 11.11 (2018) | 209 | 184 | 141.1 | |
| Far Cry 5 (2018) | 191 | 158 | 147 | 138 |
| Strange Brigade (2018) | 487 | 291 | 232 | 194 |
| Cyberpunk 2077 1.6 (2022) | 129.1 | 103 | 88.3 | 80.4 |
| Tiny Tina's Wonderlands (2022) | 233.9 | 184.6 | 116.5 | 88.3 |
| F1 22 (2022) | 288 | 271 | 206 | 65.5 |
| Ratchet & Clank Rift Apart (2023) | 84.7 | 75 | 59 | 51.6 |
Emisyonlar
Sistem Gürültüsü - Dengeli Mod Çoğu Senaryo İçin Tavsiye Edilir
Fan gürültüsü karışık bir durum. İki fan ekrandaki yüklere karşı çok hassastır, yani Dengeli güç profiline ayarlandığında bile sadece uygulamaları başlatırken veya web'de gezinirken keskin ve hızlı bir şekilde yükselirler. Sessiz modda da duyulabilir fan gürültüsü var, ancak titreşim çok daha az sıklıkta. Genel olarak, kullanıcılar Sessiz modda olsalar bile internette gezinirken veya video izlerken 25 ila 38 dB(A) aralığında bir gürültü seviyesi bekleyebilirler.
Oyun oynarken fan gürültüsü, seçilen güç profiline bağlı olarak çılgınca değişebilir. Çalışıyor Witcher 3 dengeli veya Aşırı Performans modlarında sırasıyla 46,2 dB(A) veya 57 dB(A) gürültü seviyesine neden olur. Cooler Boost etkinleştirilirse, maksimum değer daha da yükselerek 60,1 dB(A) olur ve en gürültülü 16 inç oyun dizüstü bilgisayarlarından biri haline gelir. Neyse ki, Dengeli modda oyun oynarken grafik performansı kaybı çok marjinaldir ve bu nedenle Extreme Performance ve Cooler Boost ayarları yalnızca daha düşük çalışma sıcaklıkları istiyorsanız veya GPU'ya manuel olarak hız aşırtma yapıyorsanız önerilir.
Ses yüksekliği
| Boşta |
| 25 / 31.3 / 37.5 dB |
| Çalışırken |
| 44 / 60.1 dB |
 | ||
30 dB sessiz 40 dB(A) duyulabilirlik 50 dB(A) gürültülü |
||
min: | ||
| MSI Raider GE68HX 13VF GeForce RTX 4060 Laptop GPU, i9-13950HX, Samsung PM9B1 1024GB MZVL41T0HBLB | MSI GE67 HX 12UGS GeForce RTX 3070 Ti Laptop GPU, i7-12800HX, Samsung PM9A1 MZVL21T0HCLR | HP Omen 16-xf0376ng GeForce RTX 4070 Laptop GPU, R7 7840HS, WDC PC SN810 512GB | Alienware m16 R1 AMD GeForce RTX 4080 Laptop GPU, R9 7845HX, Kioxia XG8 KXG80ZNV1T02 | Lenovo Legion Slim 7i 16 Gen 8 GeForce RTX 4070 Laptop GPU, i9-13900H, Samsung PM9A1 MZVL21T0HCLR | Asus ROG Zephyrus M16 GU604VY-NM042X GeForce RTX 4090 Laptop GPU, i9-13900H, Samsung PM9A1 MZVL22T0HBLB | |
|---|---|---|---|---|---|---|
| Noise | 12% | 9% | 12% | 16% | 5% | |
| kapalı / ortam * (dB) | 23.3 | 22.7 3% | 24 -3% | 22.9 2% | 22.8 2% | 24 -3% |
| Idle Minimum * (dB) | 25 | 22.9 8% | 25 -0% | 22.9 8% | 23.6 6% | 24 4% |
| Idle Average * (dB) | 31.3 | 22.9 27% | 29 7% | 29.7 5% | 23.6 25% | 29.96 4% |
| Idle Maximum * (dB) | 37.5 | 22.9 39% | 32 15% | 29.7 21% | 25.7 31% | 34.27 9% |
| Load Average * (dB) | 44 | 44.4 -1% | 44 -0% | 29.8 32% | 27.6 37% | 35.89 18% |
| Witcher 3 ultra * (dB) | 57 | 55.7 2% | 44 23% | 54.7 4% | 54.4 5% | 57.5 -1% |
| Load Maximum * (dB) | 60.1 | 57.4 4% | 46 23% | 54.7 9% | 54.4 9% | 57.54 4% |
* ... daha küçük daha iyidir
Sıcaklık
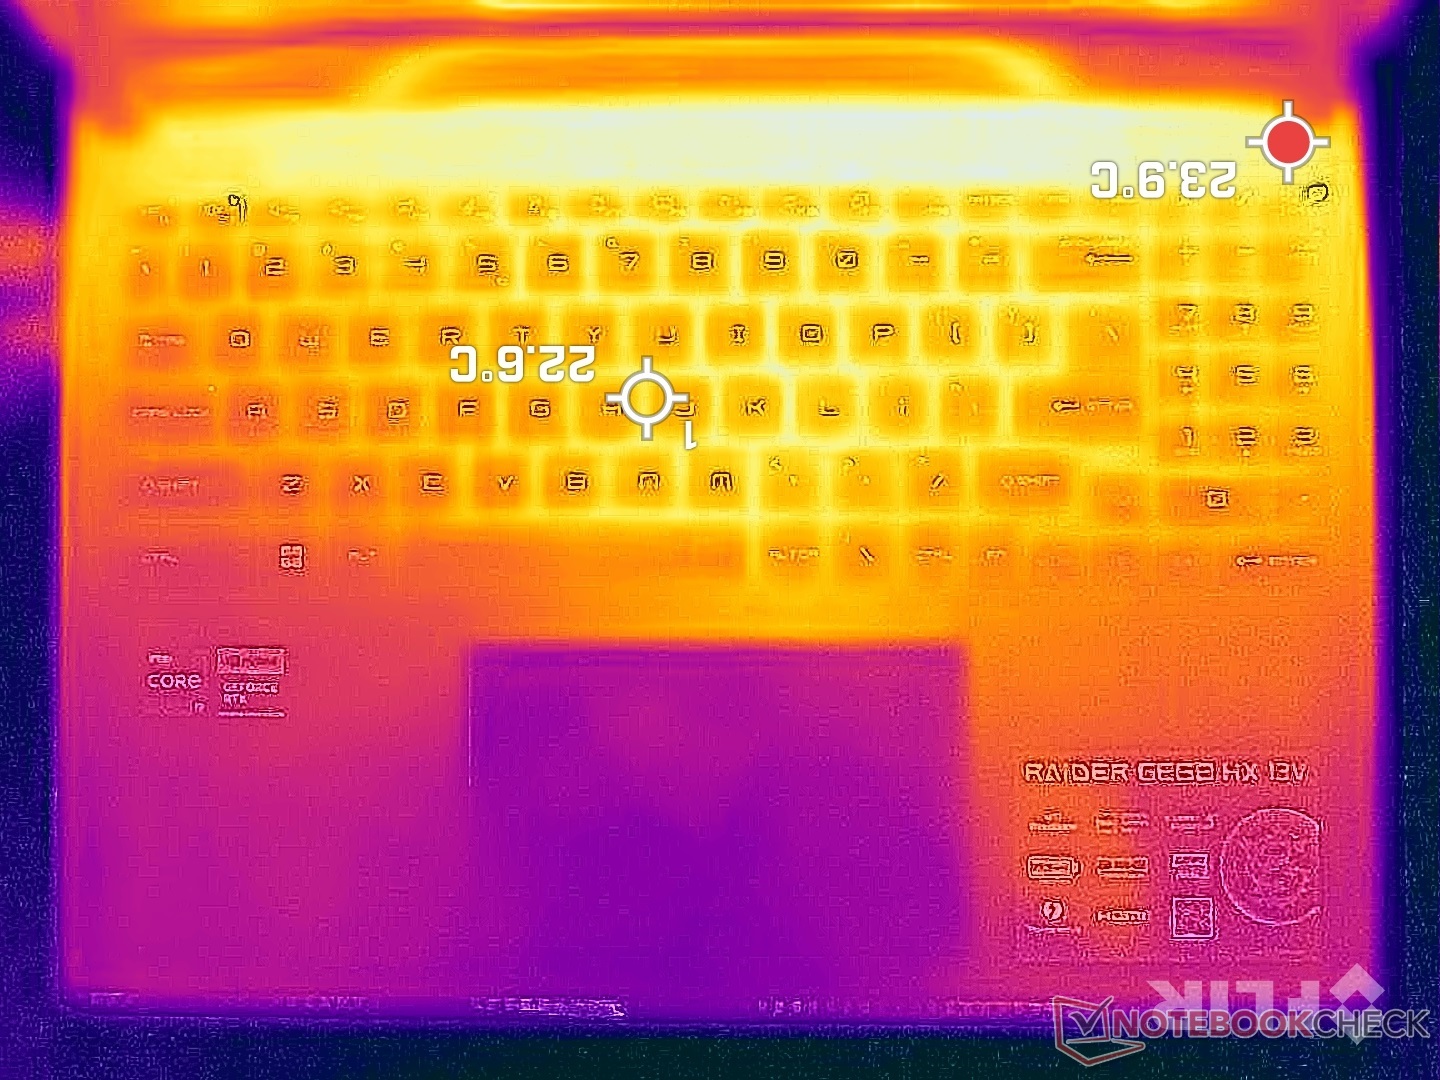
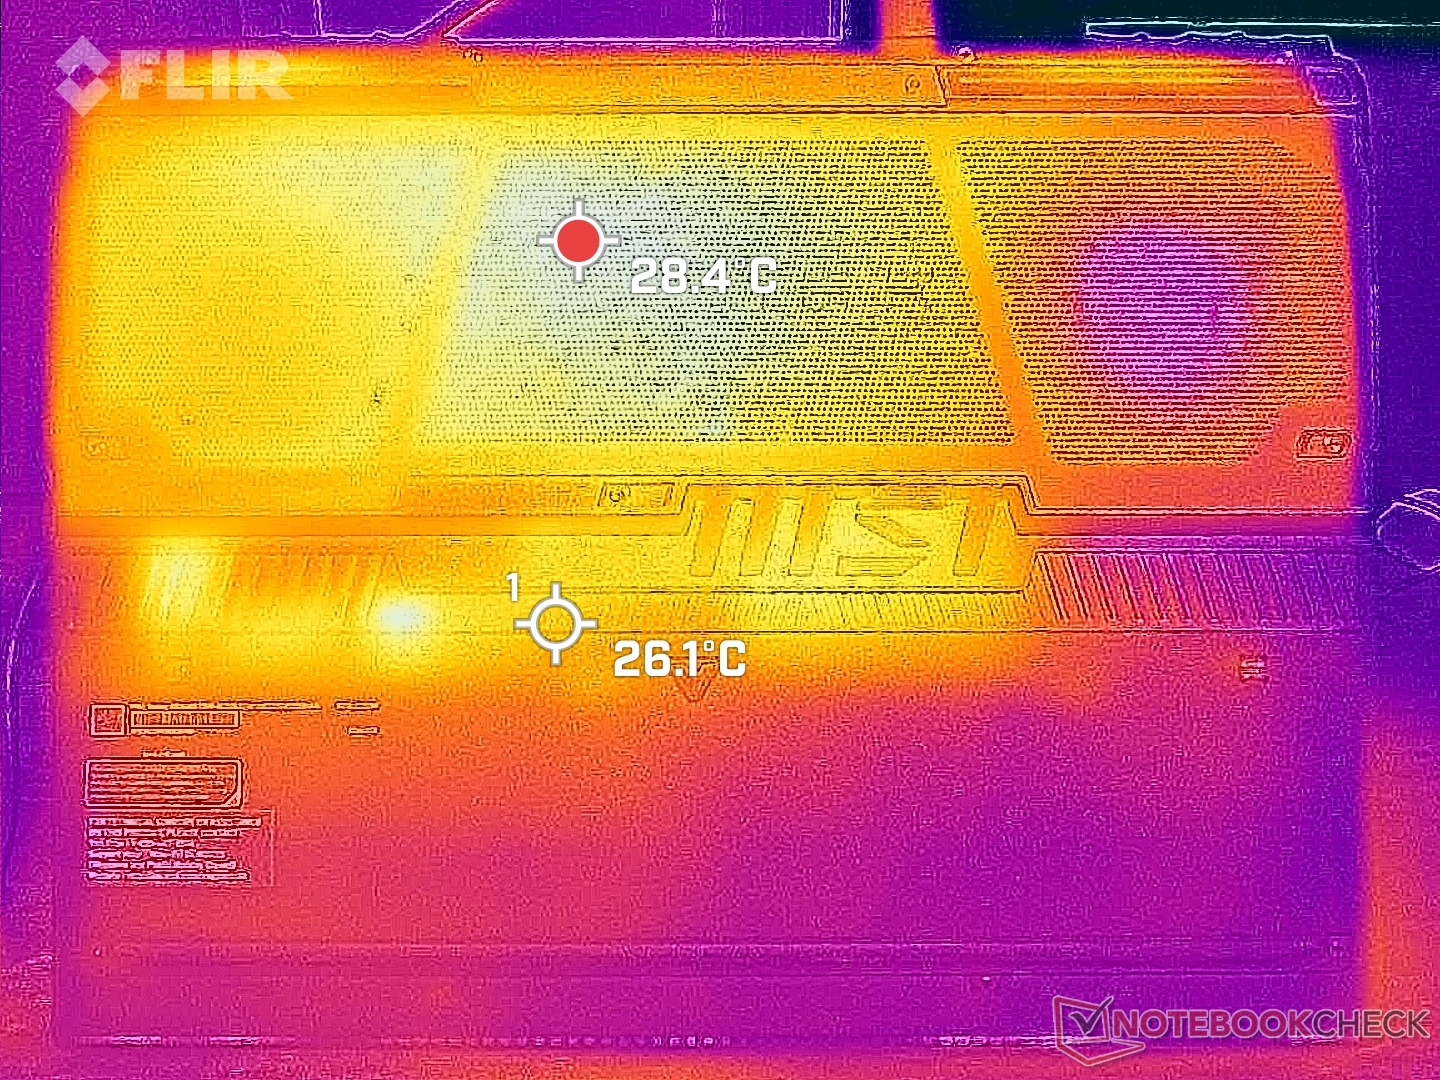
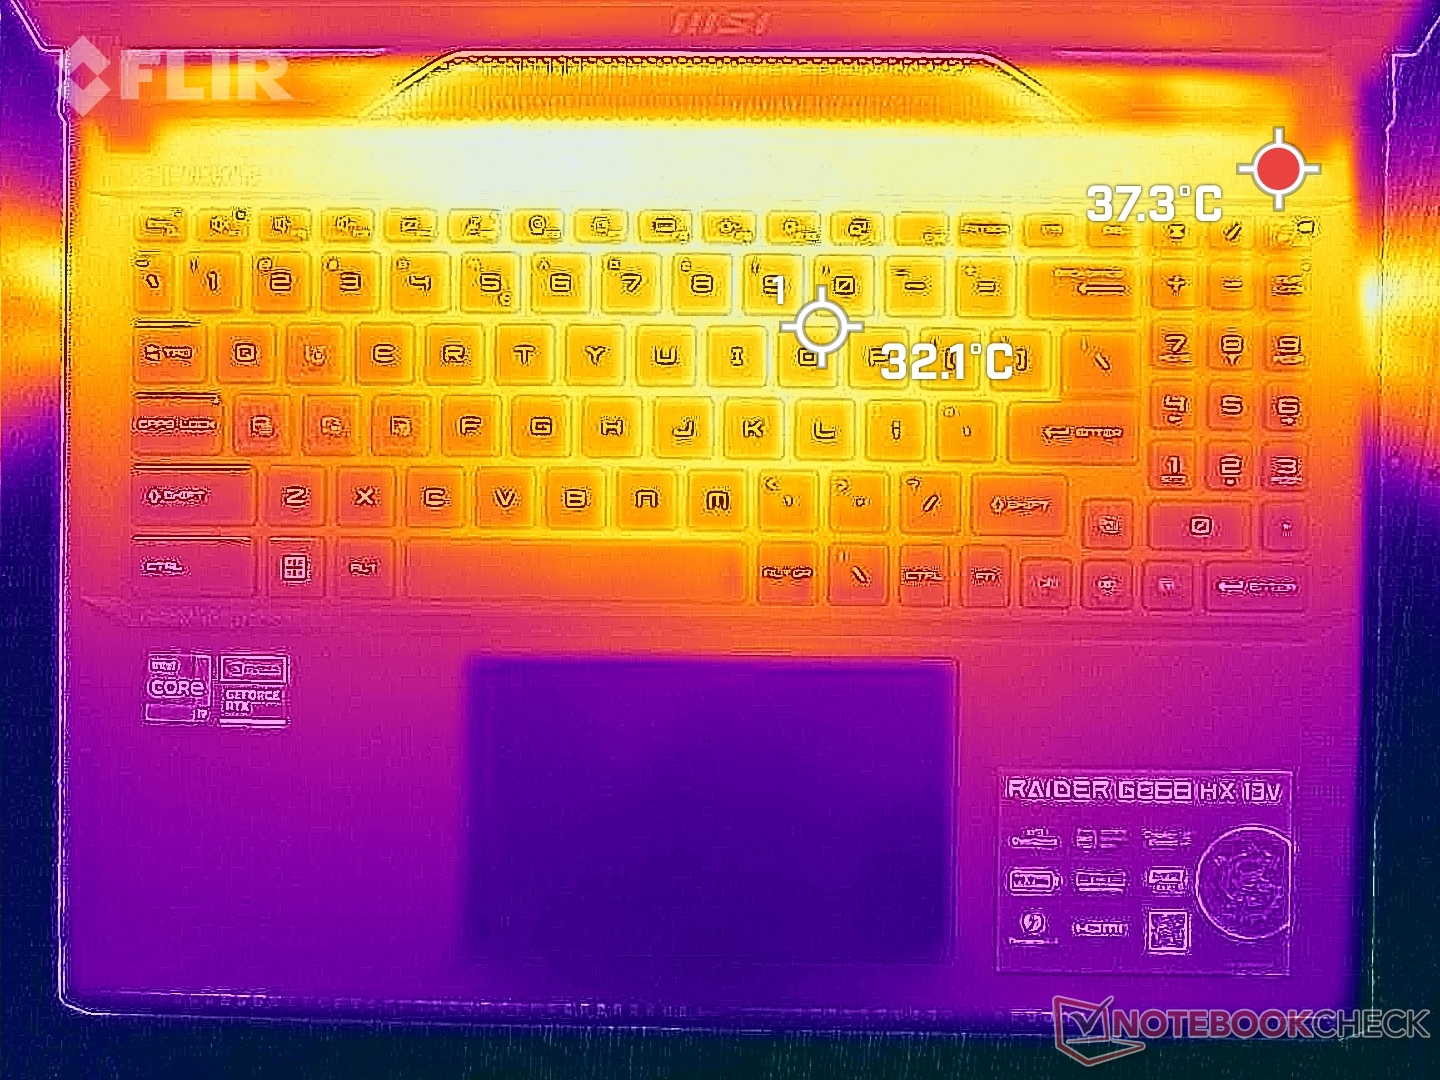
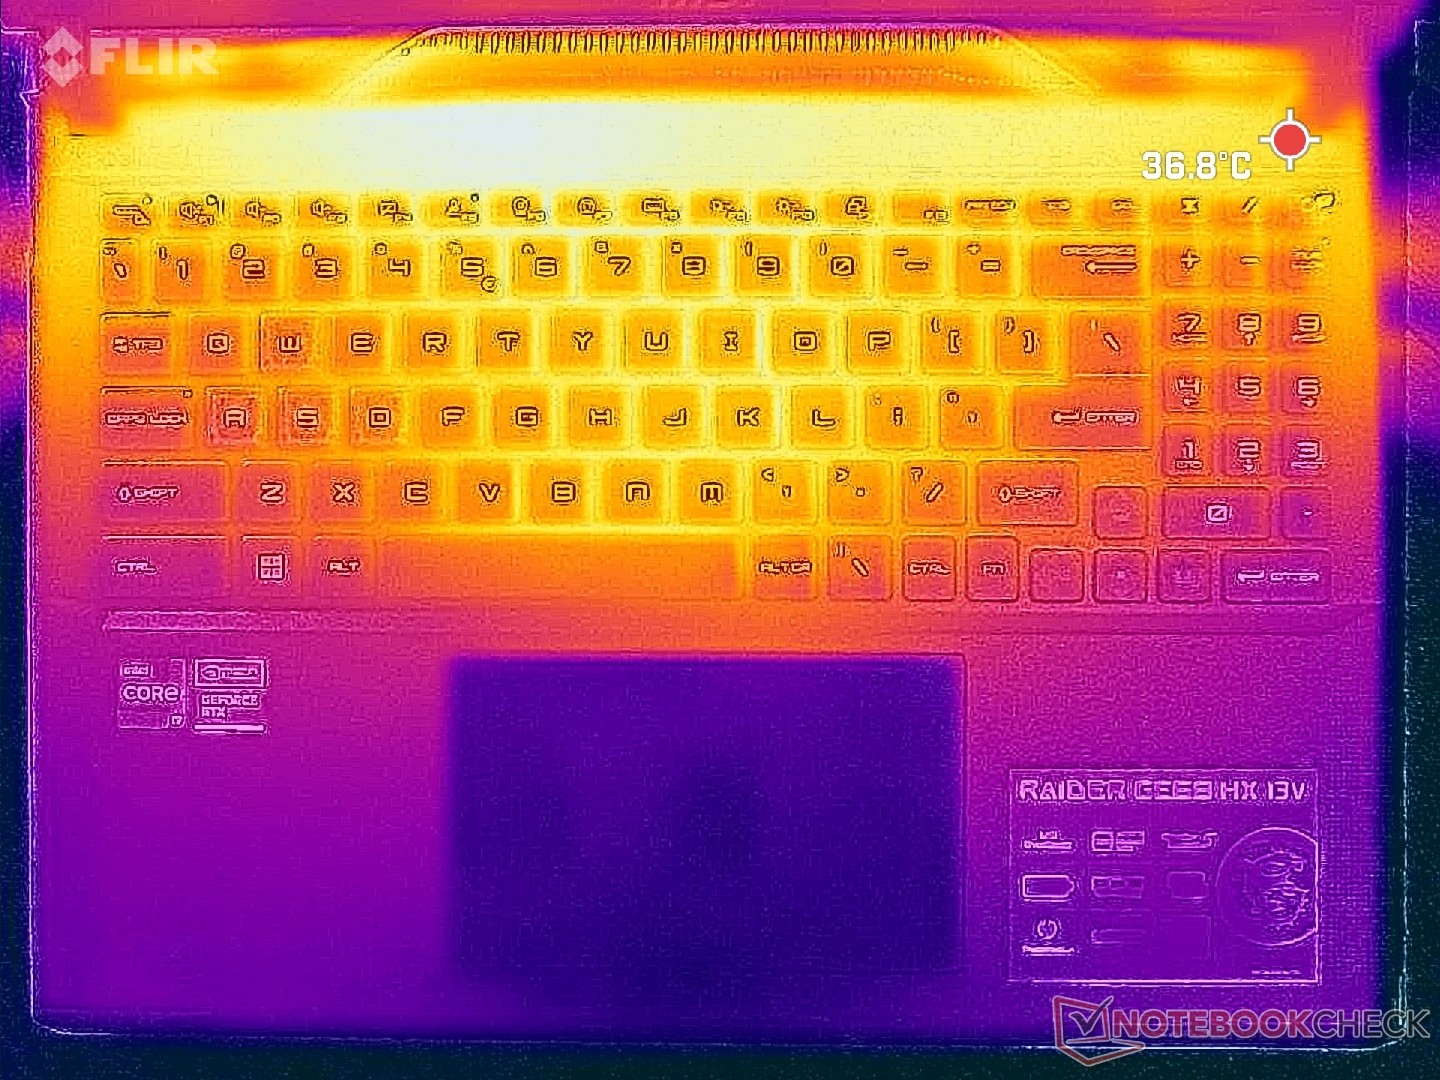
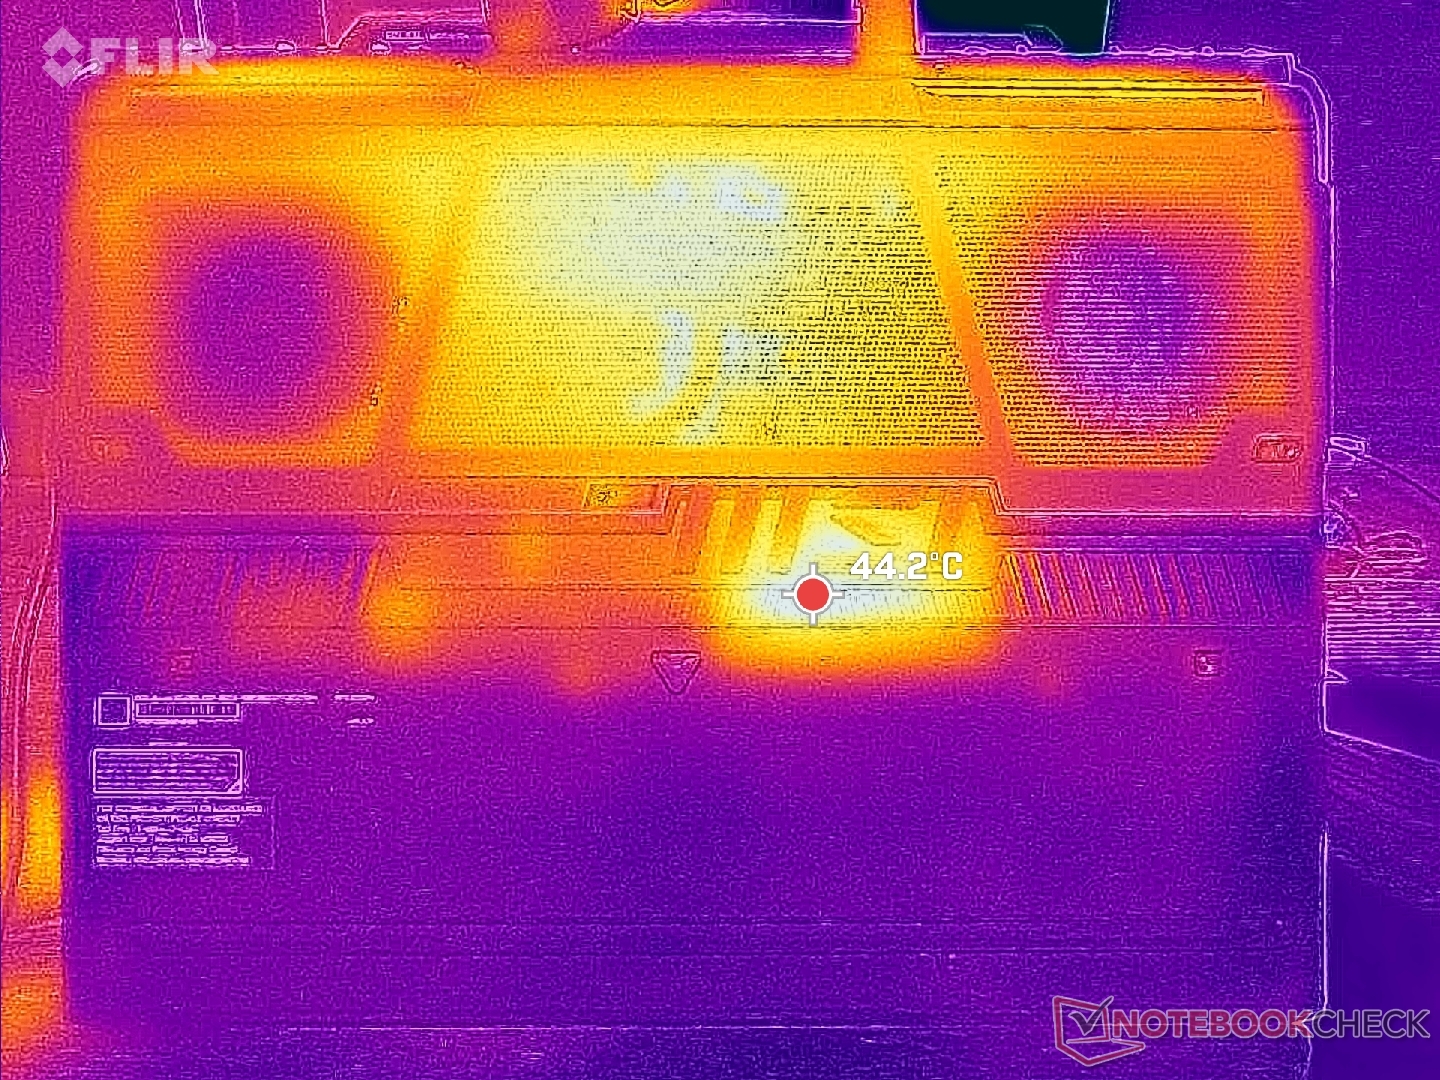
Soğutma çözümünün tasarlanma şekli nedeniyle yüzey sıcaklığı gelişimi simetriktir. Klavye merkezi 40 C'ye kadar ulaşabiliyor ki bu da HP Omen 16'da kaydettiğimizden çok daha soğuk veya Legion Slim 7i 16 G8 sıcak noktaların her biri 45 ila 50 C'ye kadar çıkabilir. GE68HX'in genellikle daha yüksek sesli fanları ve daha kalın yapısı bu açıdan MSI'ın lehine çalışıyor.
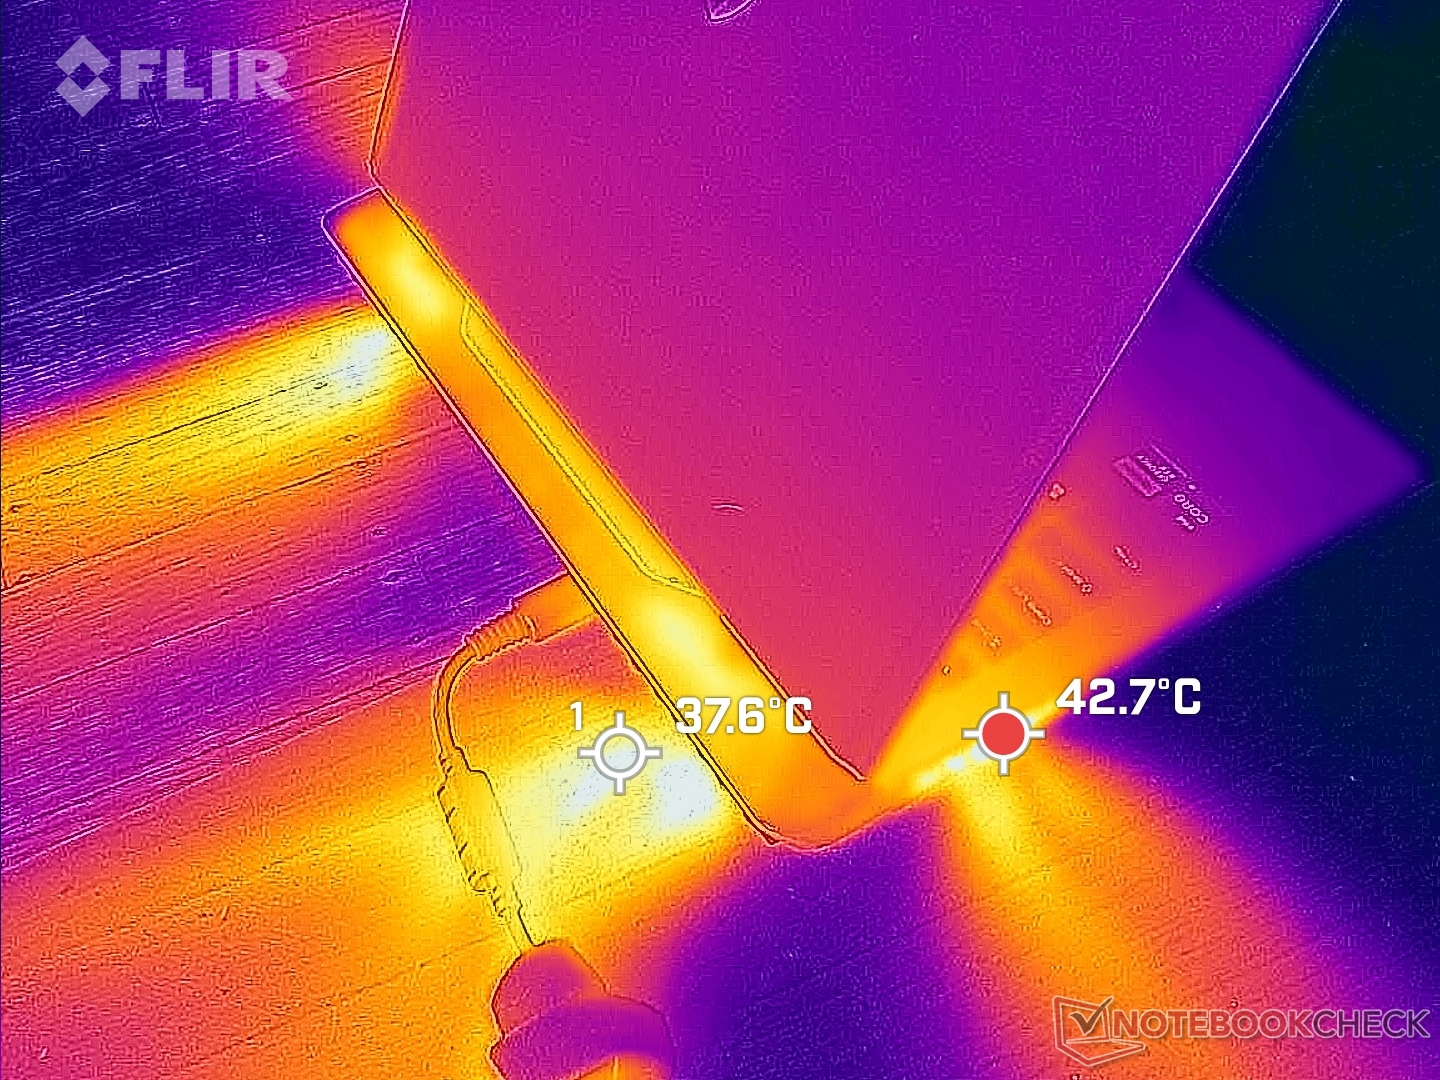
(±) Üst taraftaki maksimum sıcaklık, 40.4 °C / 105 F ortalamasına kıyasla 41.4 °C / 107 F'dir. , Gaming sınıfı için 21.2 ile 68.8 °C arasında değişir.
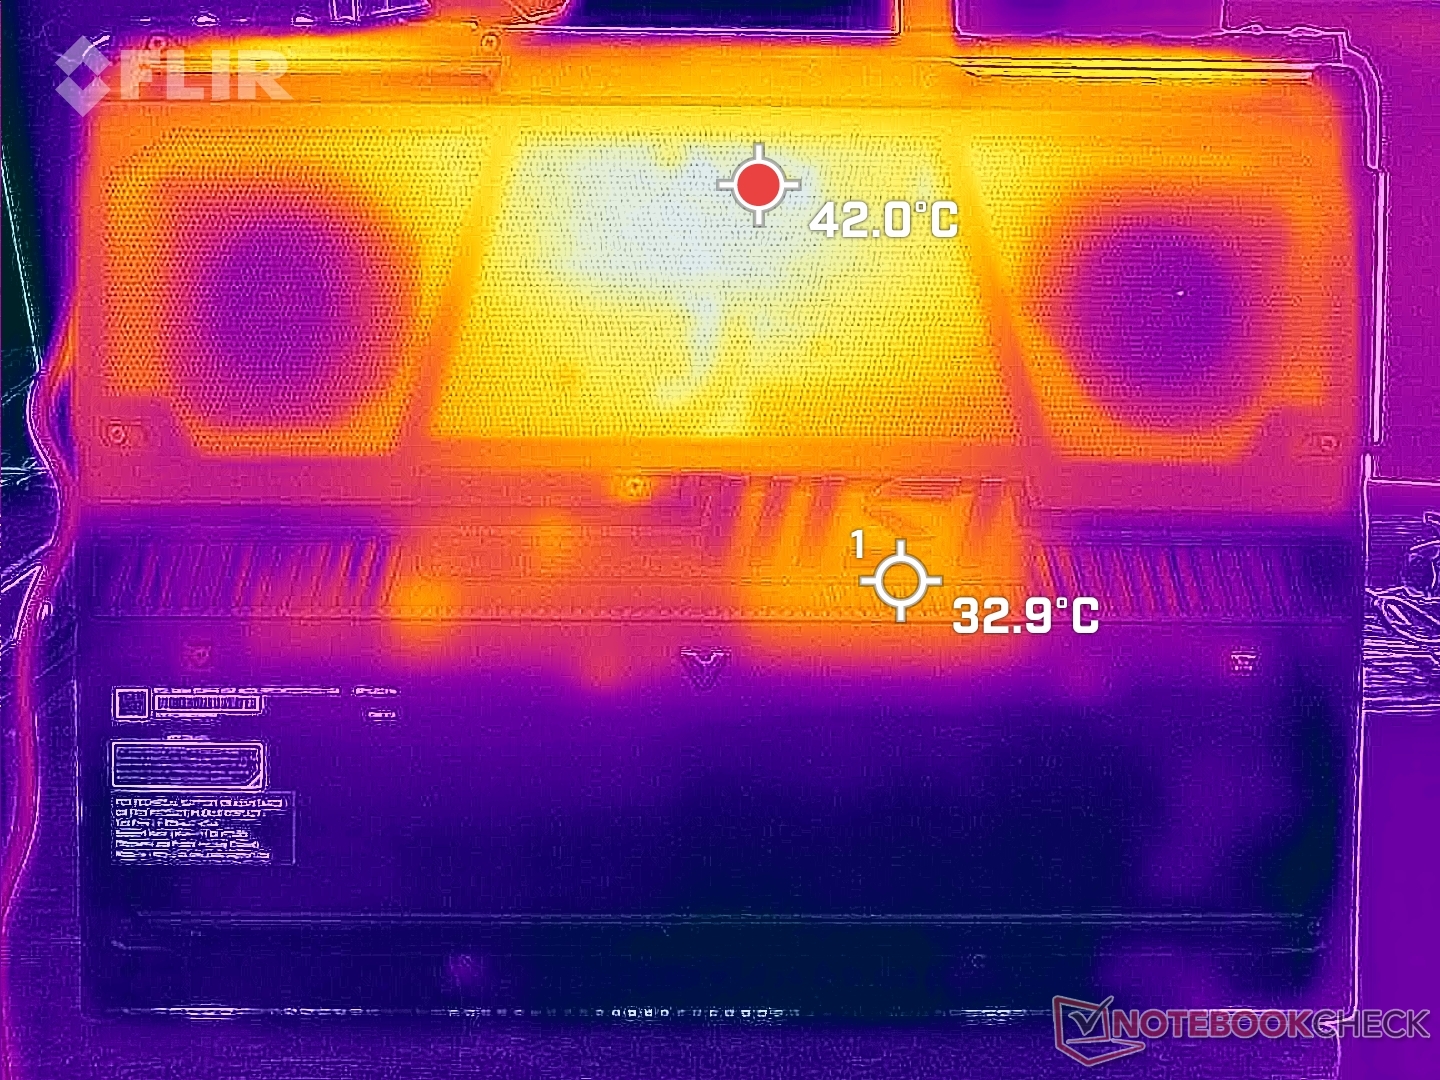
(-) Alt kısım, 43.2 °C / 110 F ortalamasına kıyasla maksimum 45.4 °C / 114 F'ye kadar ısınır
(+) Boşta kullanımda, üst tarafın ortalama sıcaklığı 27.7 °C / 82 F olup, cihazın 33.9 °C / 93 F.
(±) The Witcher 3 oynarken, üst tarafın ortalama sıcaklığı 34 °C / 93 F olup, cihazın 33.9 °C / 93 F.
(+) Avuç içi dayanakları ve dokunmatik yüzey, maksimum 29.6 °C / 85.3 F ile cilt sıcaklığından daha soğuktur ve bu nedenle dokunulduğunda soğuktur.
(±) Benzer cihazların avuç içi dayanağı alanının ortalama sıcaklığı 28.8 °C / 83.8 F (-0.8 °C / -1.5 F) idi.
| MSI Raider GE68HX 13VF Intel Core i9-13950HX, NVIDIA GeForce RTX 4060 Laptop GPU | MSI GE67 HX 12UGS Intel Core i7-12800HX, NVIDIA GeForce RTX 3070 Ti Laptop GPU | HP Omen 16-xf0376ng AMD Ryzen 7 7840HS, NVIDIA GeForce RTX 4070 Laptop GPU | Alienware m16 R1 AMD AMD Ryzen 9 7845HX, NVIDIA GeForce RTX 4080 Laptop GPU | Lenovo Legion Slim 7i 16 Gen 8 Intel Core i9-13900H, NVIDIA GeForce RTX 4070 Laptop GPU | Asus ROG Zephyrus M16 GU604VY-NM042X Intel Core i9-13900H, NVIDIA GeForce RTX 4090 Laptop GPU | |
|---|---|---|---|---|---|---|
| Heat | 9% | -12% | -10% | -6% | -6% | |
| Maximum Upper Side * (°C) | 41.4 | 34.4 17% | 49 -18% | 48 -16% | 49.8 -20% | 50 -21% |
| Maximum Bottom * (°C) | 45.4 | 42 7% | 57 -26% | 39 14% | 48.8 -7% | 58 -28% |
| Idle Upper Side * (°C) | 29.8 | 24 19% | 31 -4% | 37 -24% | 29.4 1% | 26 13% |
| Idle Bottom * (°C) | 31.4 | 33.2 -6% | 31 1% | 36.2 -15% | 30 4% | 28 11% |
* ... daha küçük daha iyidir
Stres Testi
CPU, birkaç saniye sonra 3,6 GHz, 134 W ve 93 C'ye yerleşmeden önce Prime95 stresini başlatırken 4,1 GHz ve 183 W'a yükselir. Bu testin eski 12. nesil Core i7-12800HX ile geçen yılın modelinde tekrarlanması, yeni 13. nesil CPU'nun ne kadar daha talepkar olabileceğini göstermek için sadece 55 W'lık çok daha düşük bir CPU paket gücü ile sonuçlanacaktır.
GPU saat hızı ve sıcaklığı çalıştırıldığında 2475 MHz ve 84 C'de sabitlenecektir Witcher 3 dengeli modda. İlginç bir şekilde, Extreme Performance modunda çalıştırıldığında saat hızı çok az bir artışla 2490 MHz'e yükselirken, aşağıdaki ekran görüntüleri ve tabloda gösterildiği gibi Cooler Boost etkin olduğunda GPU sıcaklığı daha belirgin bir şekilde 70 C'ye hatta sadece 63 C'ye düşmektedir. Diğer MSI oyun dizüstü bilgisayarlarının çoğu da benzer sonuçlar sergileyecektir. Bu nedenle, önceden ayarlanmış güç profilleri arasındaki muazzam fan gürültüsü farklarına göre GPU performansına yapılan darbe çok marjinal olduğu için Dengeli modda oyun oynamanız önerilir. Dengeli ve Performans modları arasındaki performans farkları genellikle Asus Zephyrus serisi gibi diğer oyun dizüstü bilgisayarlarında daha önemlidir.
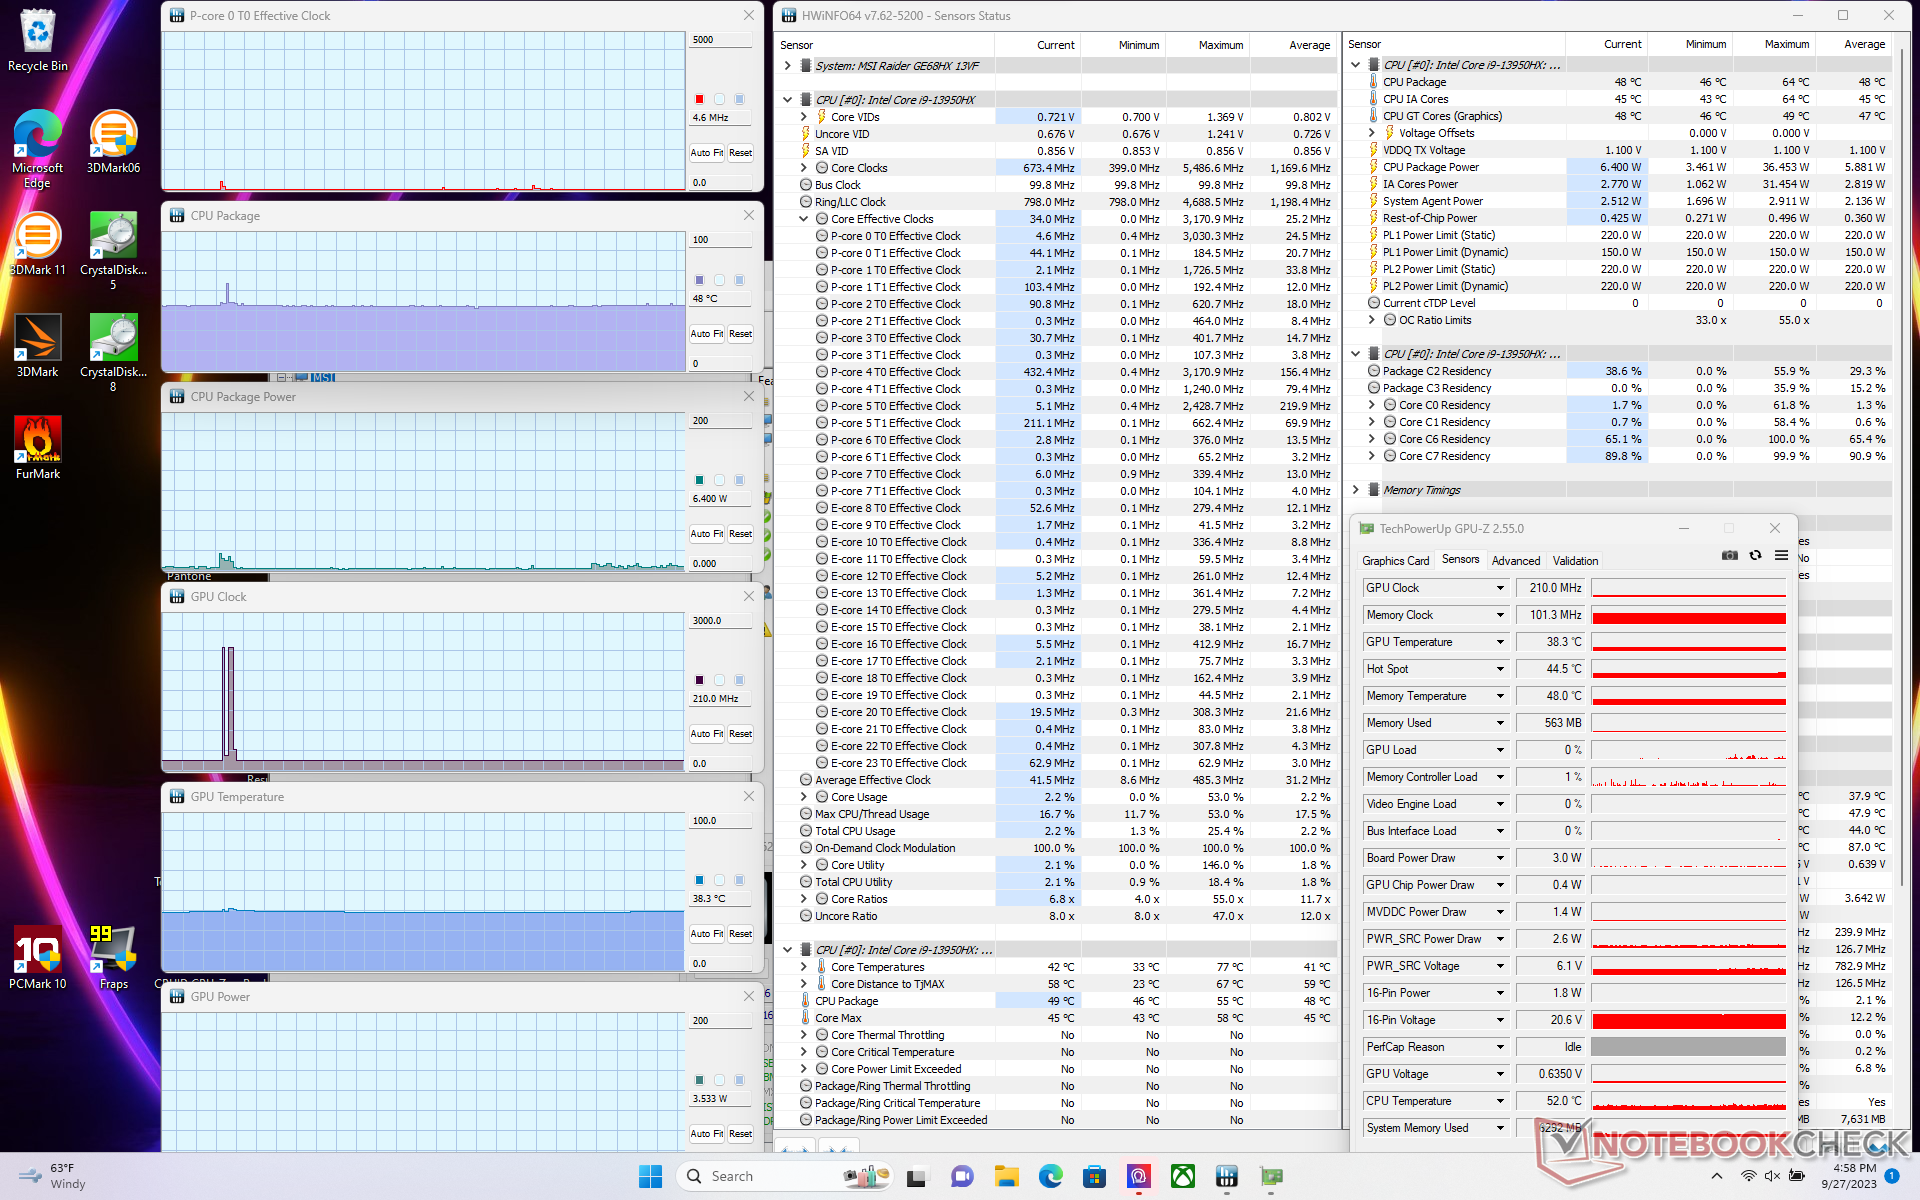
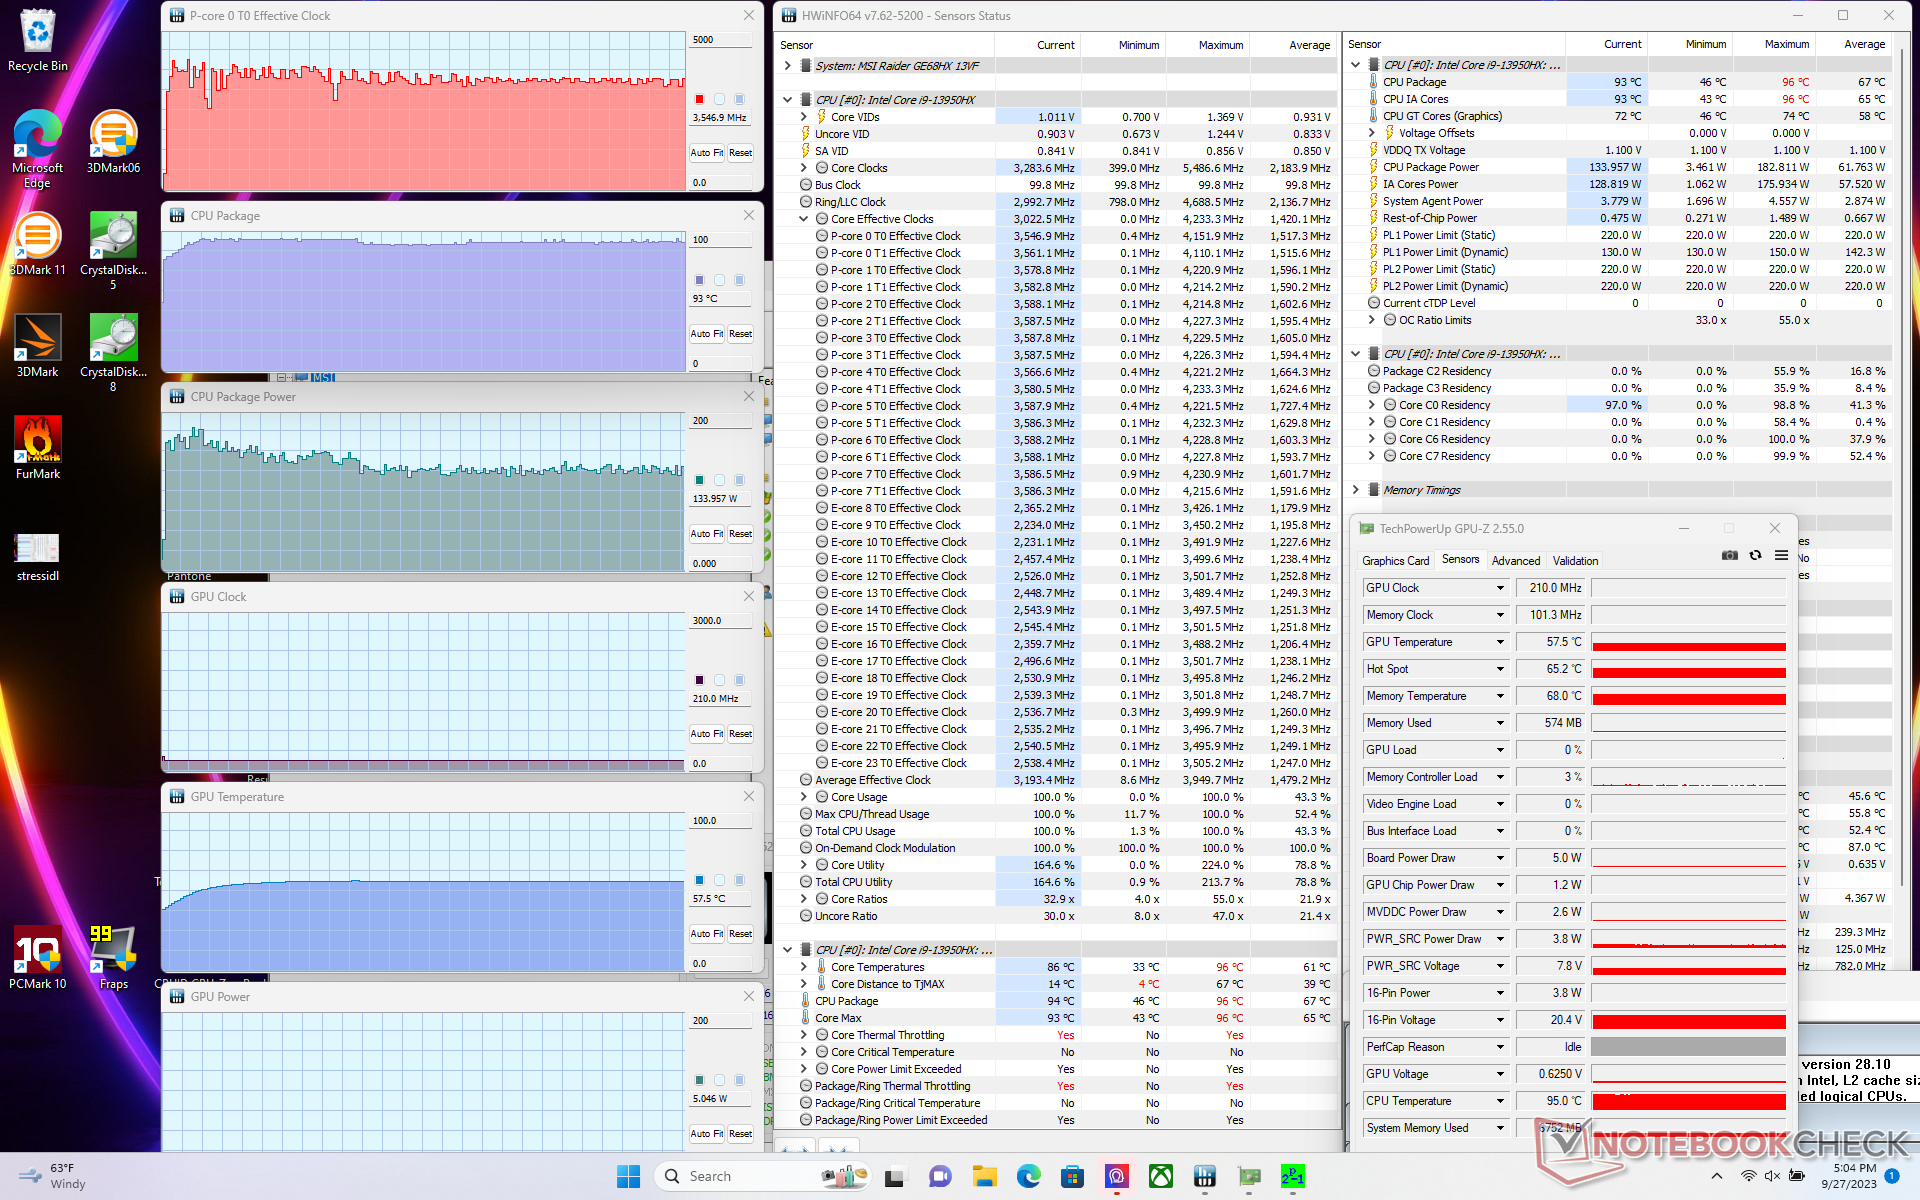
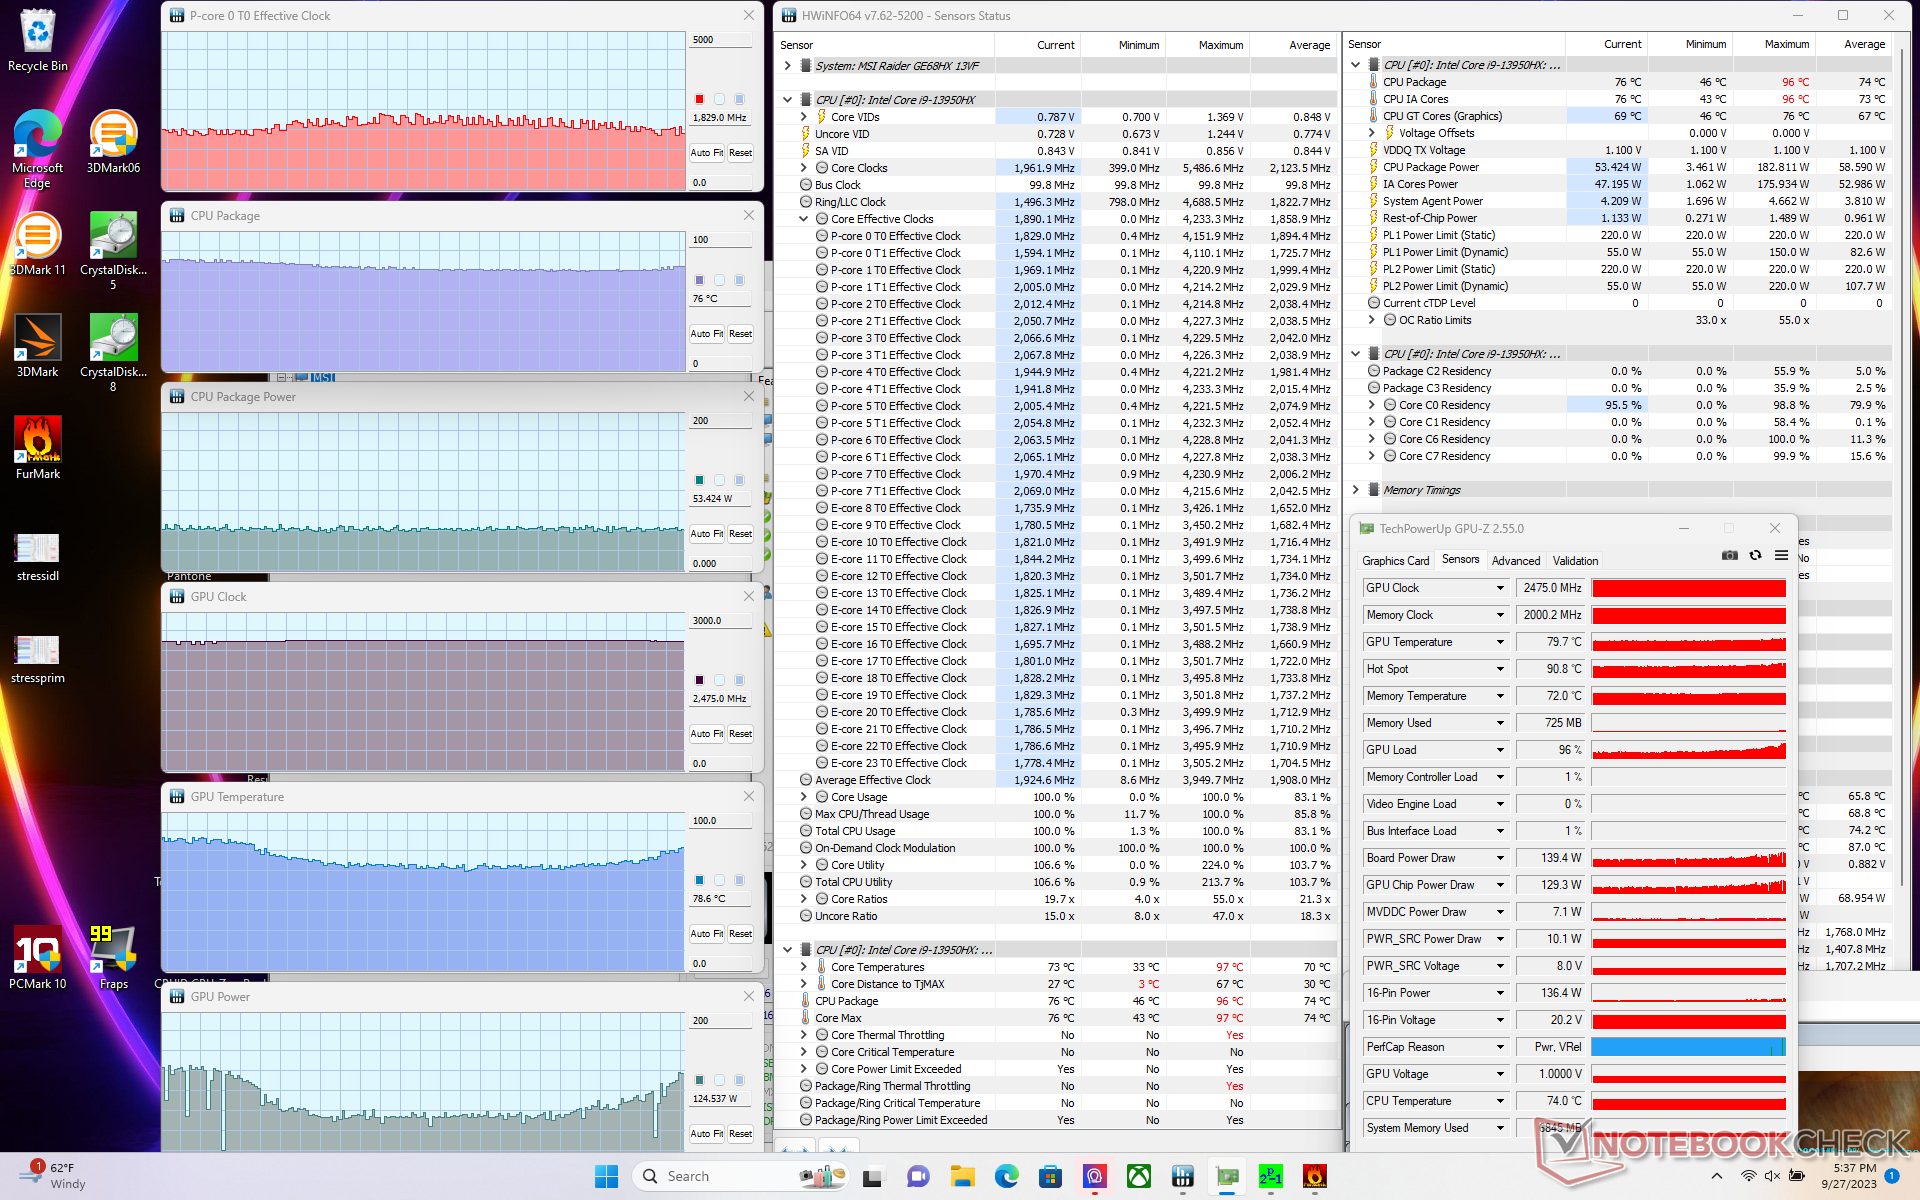
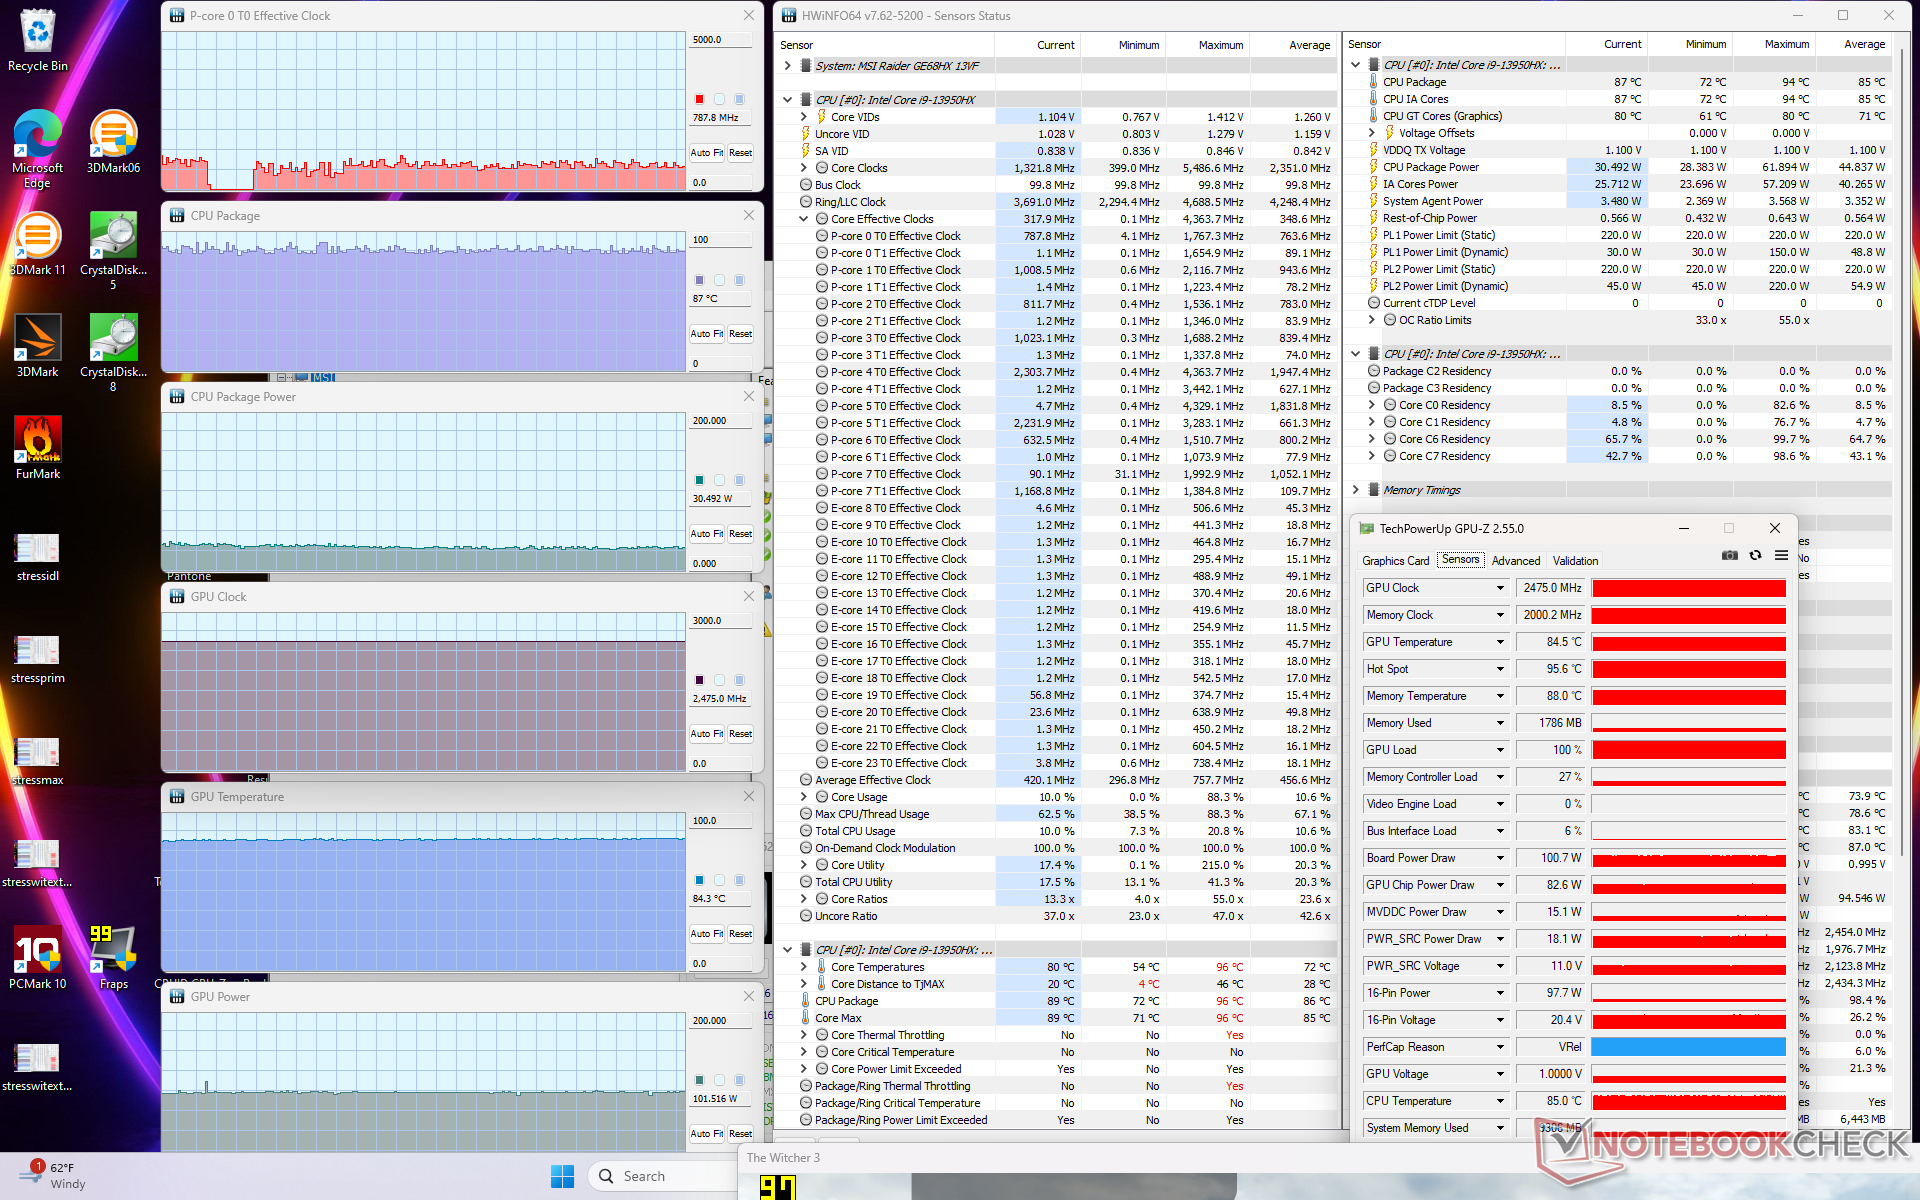
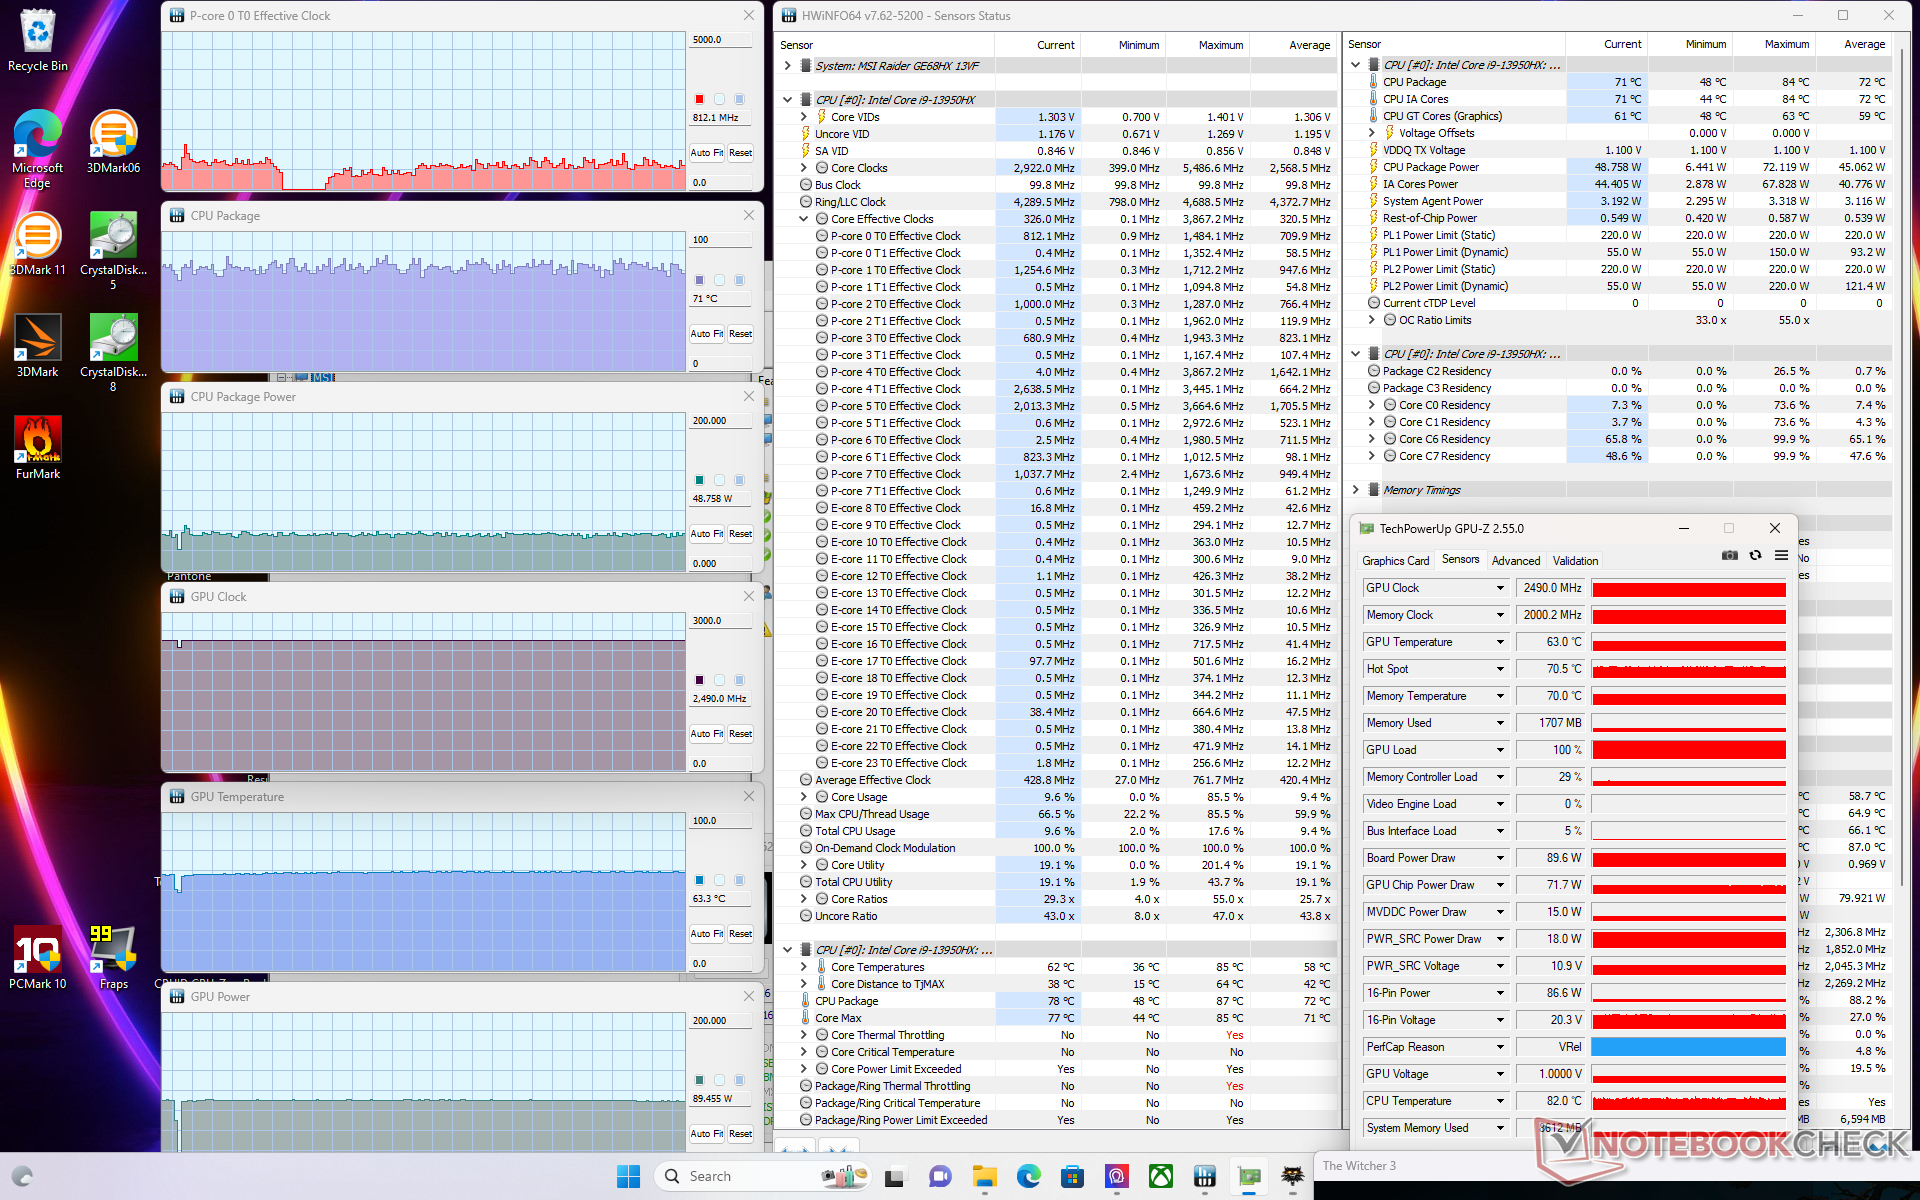
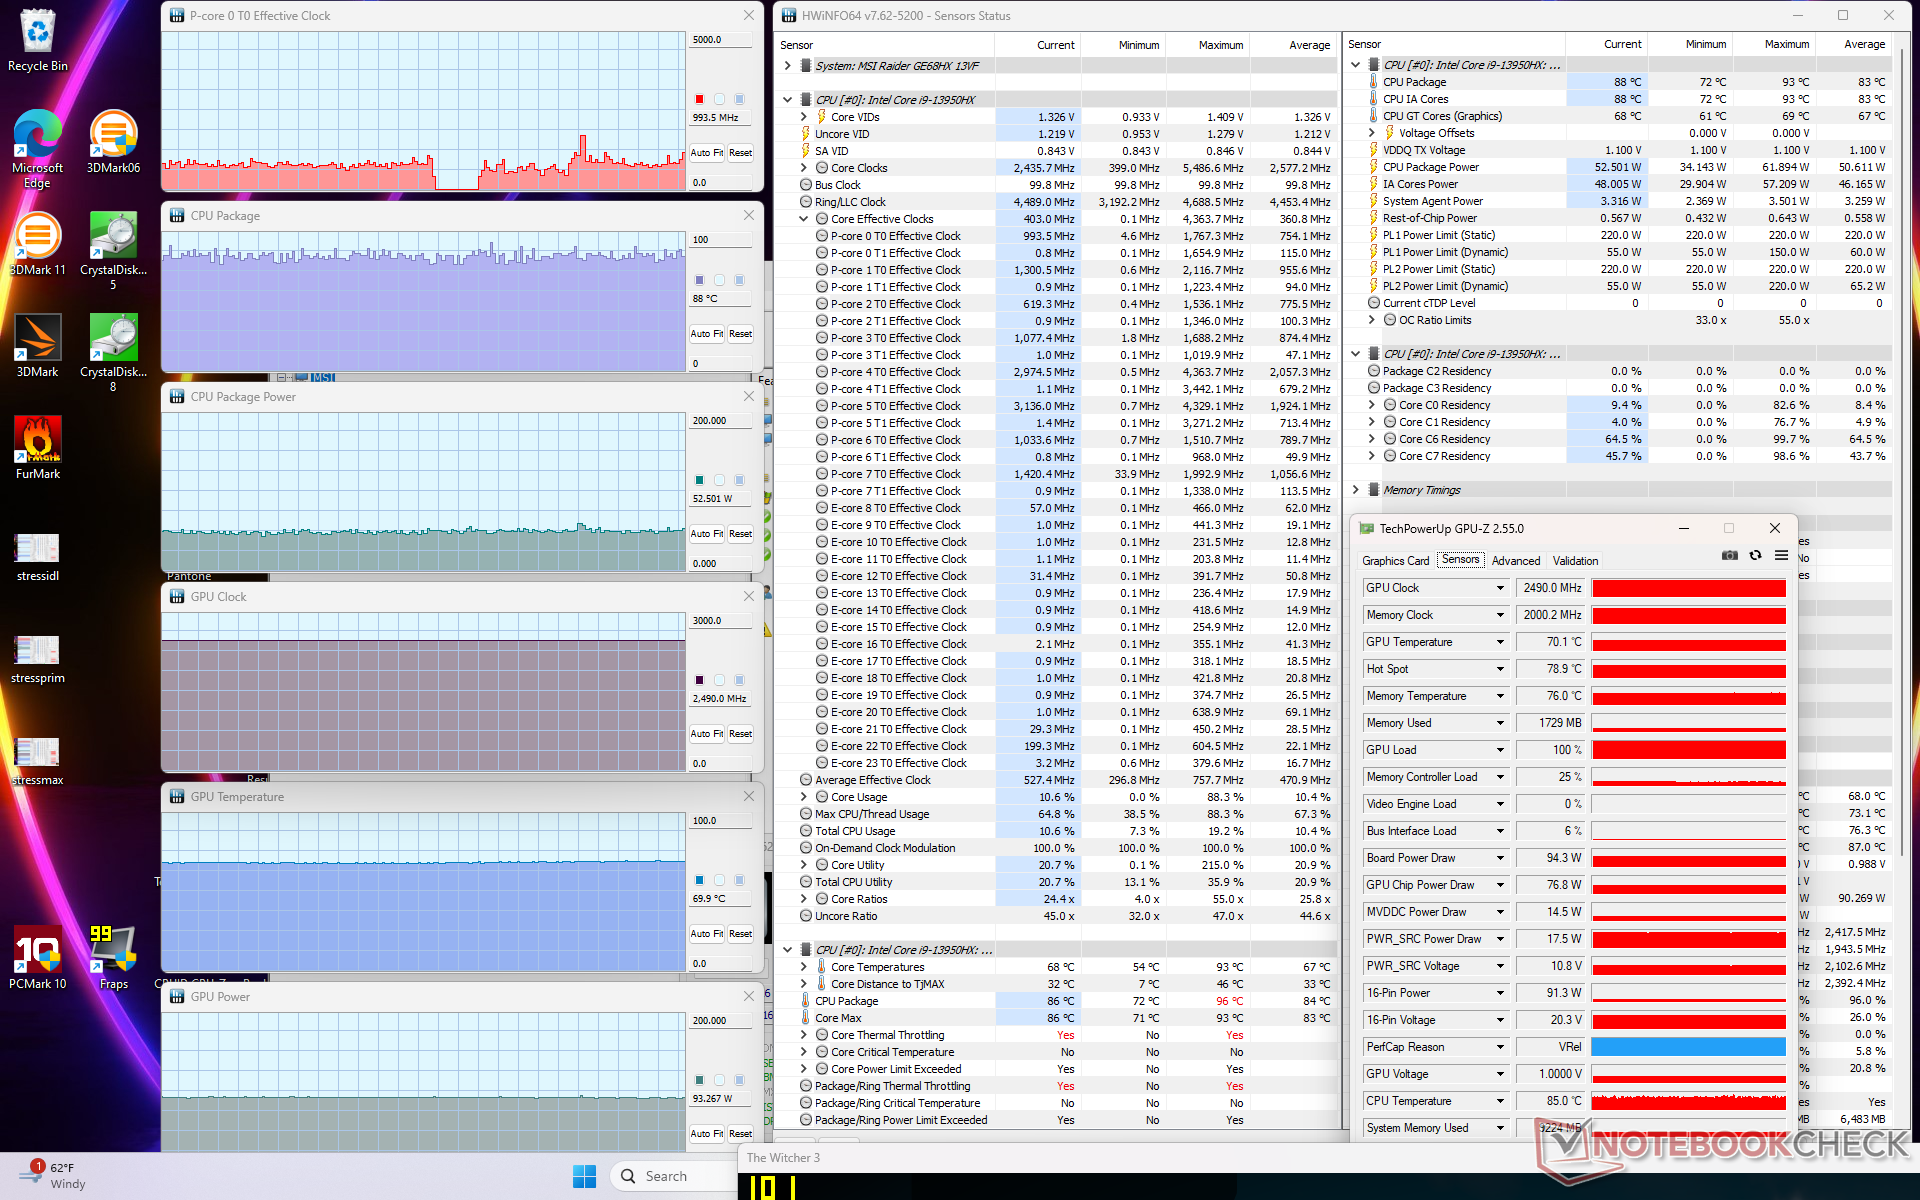
| CPU Saati (GHz) | GPU Saati (MHz) | Ortalama CPU Sıcaklığı (°C) | Ortalama GPU Sıcaklığı (°C) | |
| Sistem Boşta | -- | -- | 48 | 38 |
| Prime95 Stres (Cooler Boost kapalıyken Aşırı Performans modu) | ~3.6 | -- | 93 | 58 |
| Prime95 + FurMark Stress (Cooler Boost kapalıyken Aşırı Performans modu) | ~1.9 | 2475 | 73 - 78 | 63 - 81 |
| Witcher 3 Stres (Dengeli mod) | ~0,8 | 2475 | 87 | 84 |
| Witcher 3 Stres (Cooler Boost kapalıyken Aşırı Performans modu) | ~0,8 | 2490 | 88 | 70 |
| Witcher 3 Stres (Cooler Boost açıkken Aşırı Performans modu) | ~0.8 | 2490 | 71 | 63 |
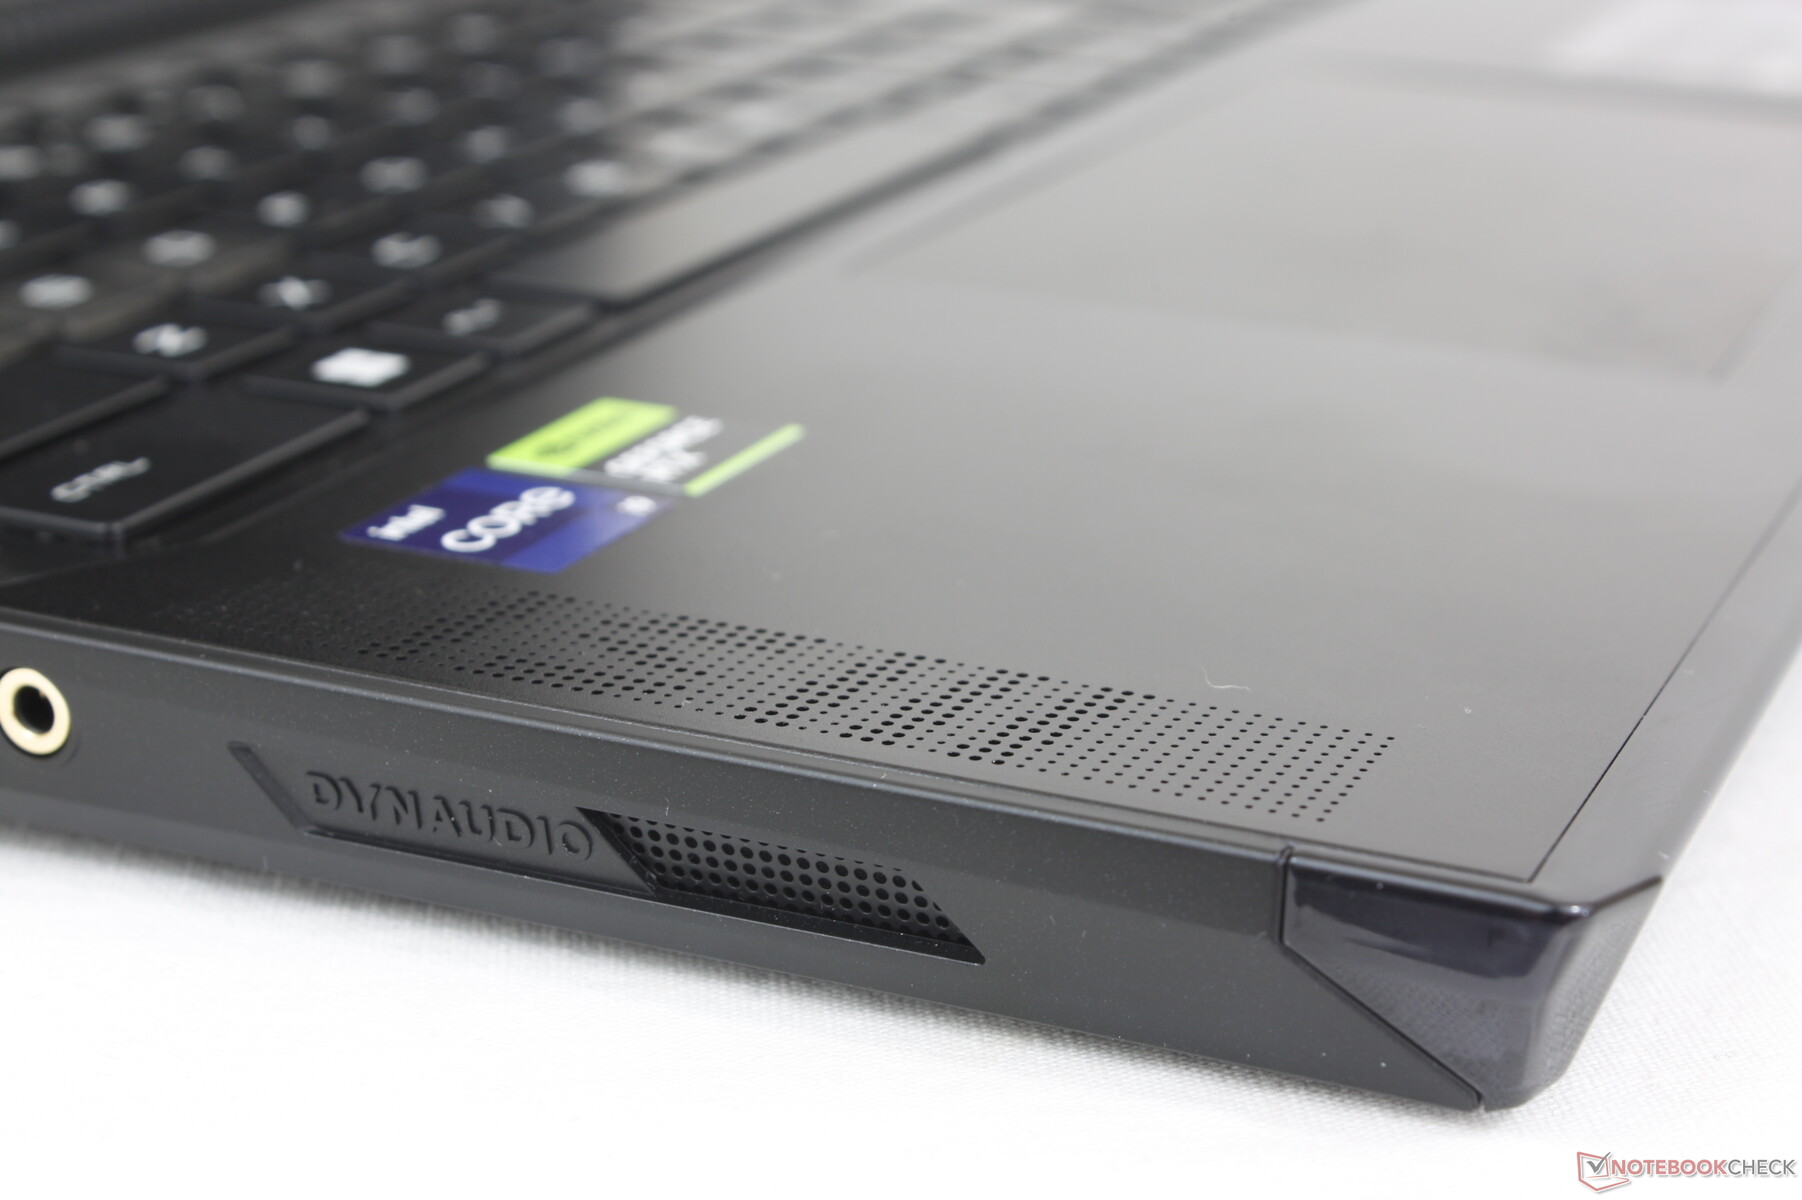
Konuşmacılar
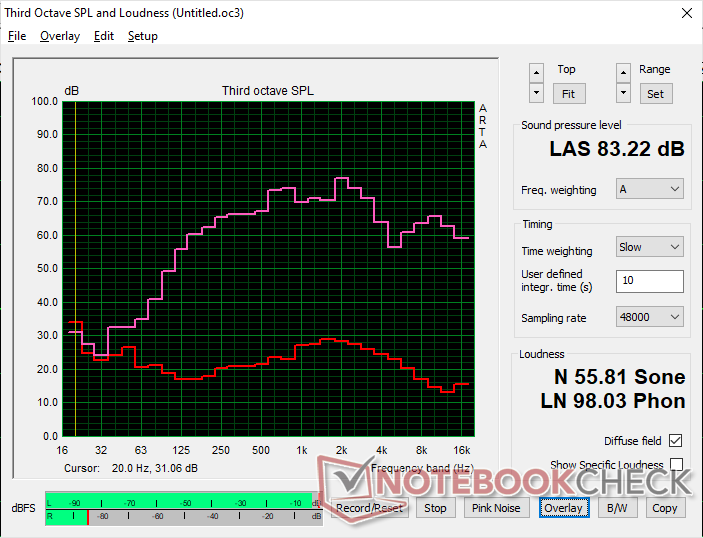
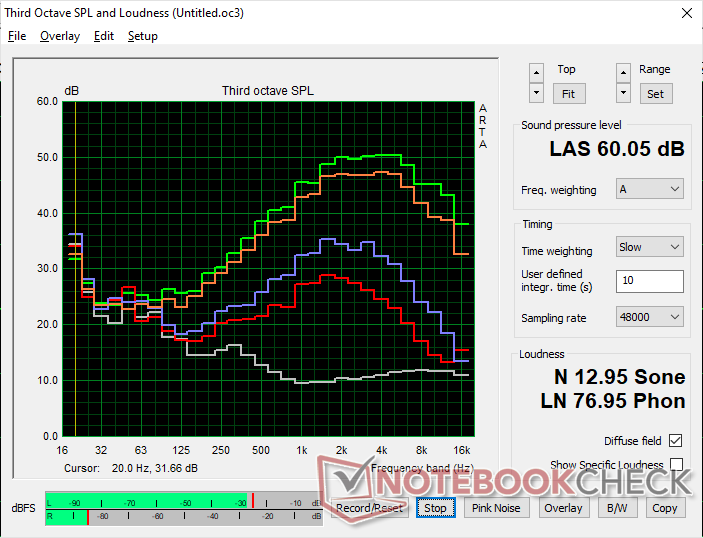
MSI Raider GE68HX 13VF ses analizi
(+) | hoparlörler nispeten yüksek sesle çalabilir (83.2 dB)
Bas 100 - 315Hz
(±) | azaltılmış bas - ortalama olarak medyandan 6% daha düşük
(±) | Bas doğrusallığı ortalamadır (9.5% delta - önceki frekans)
Ortalar 400 - 2000 Hz
(±) | daha yüksek ortalar - ortalama olarak medyandan 5.6% daha yüksek
(+) | orta frekanslar doğrusaldır (5.8% deltadan önceki frekansa)
Yüksekler 2 - 16 kHz
(+) | dengeli yüksekler - medyandan yalnızca 4.5% uzakta
(±) | Yükseklerin doğrusallığı ortalamadır (9.5% delta - önceki frekans)
Toplam 100 - 16.000 Hz
(+) | genel ses doğrusaldır (13.3% ortancaya göre fark)
Aynı sınıfla karşılaştırıldığında
» Bu sınıftaki tüm test edilen cihazların %19%'si daha iyi, 5% benzer, 76% daha kötüydü
» En iyisinin deltası 6% idi, ortalama 18% idi, en kötüsü 132% idi
Test edilen tüm cihazlarla karşılaştırıldığında
» Test edilen tüm cihazların %14'si daha iyi, 3 benzer, % 83 daha kötüydü
» En iyisinin deltası 4% idi, ortalama 23% idi, en kötüsü 134% idi
Apple MacBook Pro 16 2021 M1 Pro ses analizi
(+) | hoparlörler nispeten yüksek sesle çalabilir (84.7 dB)
Bas 100 - 315Hz
(+) | iyi bas - medyandan yalnızca 3.8% uzakta
(+) | bas doğrusaldır (5.2% delta ile önceki frekans)
Ortalar 400 - 2000 Hz
(+) | dengeli ortalar - medyandan yalnızca 1.3% uzakta
(+) | orta frekanslar doğrusaldır (2.1% deltadan önceki frekansa)
Yüksekler 2 - 16 kHz
(+) | dengeli yüksekler - medyandan yalnızca 1.9% uzakta
(+) | yüksekler doğrusaldır (2.7% deltadan önceki frekansa)
Toplam 100 - 16.000 Hz
(+) | genel ses doğrusaldır (4.6% ortancaya göre fark)
Aynı sınıfla karşılaştırıldığında
» Bu sınıftaki tüm test edilen cihazların %0%'si daha iyi, 0% benzer, 100% daha kötüydü
» En iyisinin deltası 5% idi, ortalama 17% idi, en kötüsü 45% idi
Test edilen tüm cihazlarla karşılaştırıldığında
» Test edilen tüm cihazların %0'si daha iyi, 0 benzer, % 100 daha kötüydü
» En iyisinin deltası 4% idi, ortalama 23% idi, en kötüsü 134% idi
Enerji Yönetimi - Daha Yüksek Performans, Daha Yüksek Tüketim
Güç Tüketimi
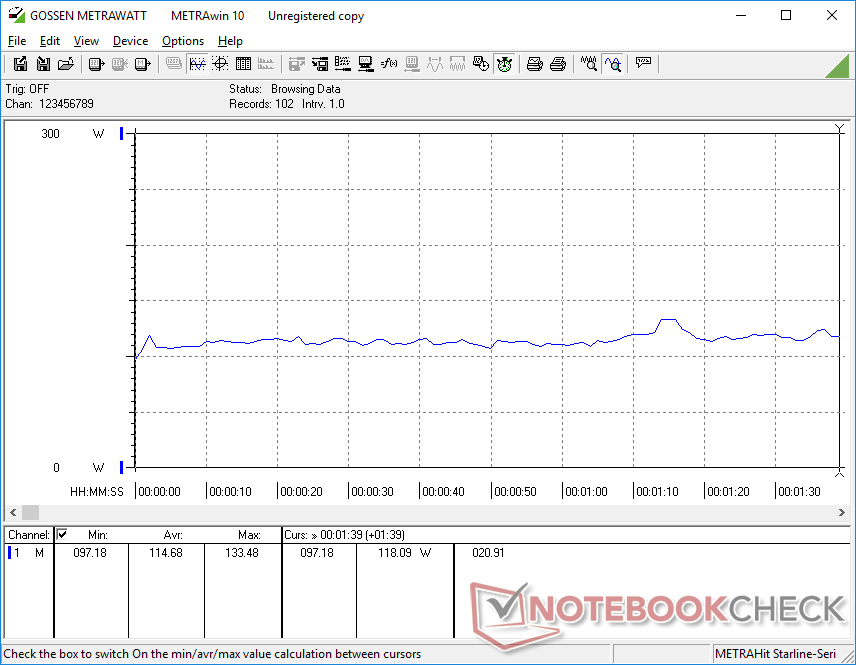
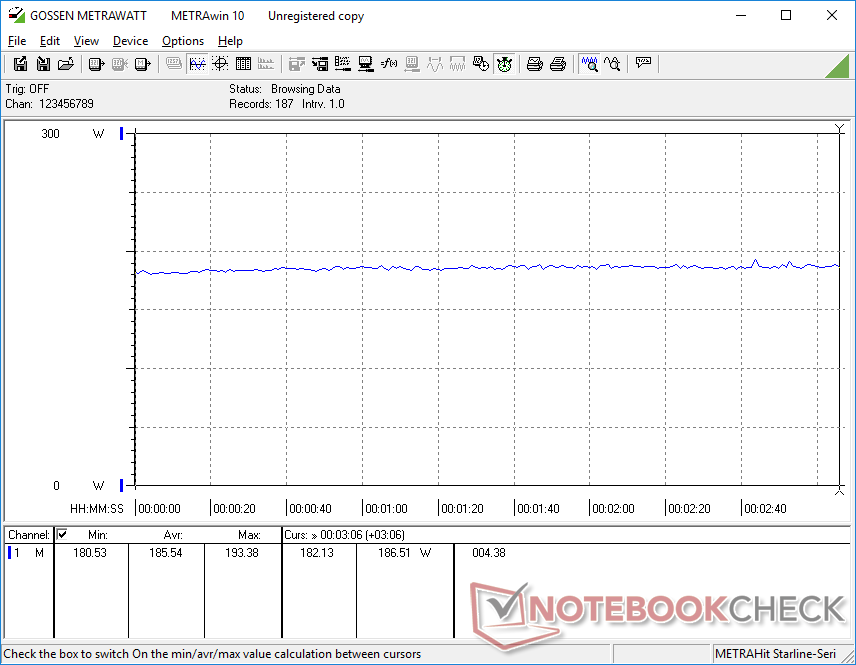
Masaüstünde rölantide çalışırken güç tüketimi geçen yılki modelle hemen hemen aynı. LED'ler kapalıyken iGPU modunda rölantide çalışmak, ön LED'ler aktifken dGPU modunda rölantide çalışmaya kıyasla 8 W kadar tasarruf sağlayacaktır.
Çalışıyor Witcher 3 geçen yılki RTX 3070 Ti ile çalışan GE67HX'e kıyasla yüzde 22 daha az güç gerektirecektir ki bu da RTX 4060'ımızın 10 ila 15 daha yavaş ham grafik performansıyla ilişkilidir. Tersine, Prime95'i çalıştırmak, çoklu iş parçacığı performansında yüzde 35 ila 40'lık bir artış için eskisinden yüzde 21 daha fazla güç gerektirecektir.
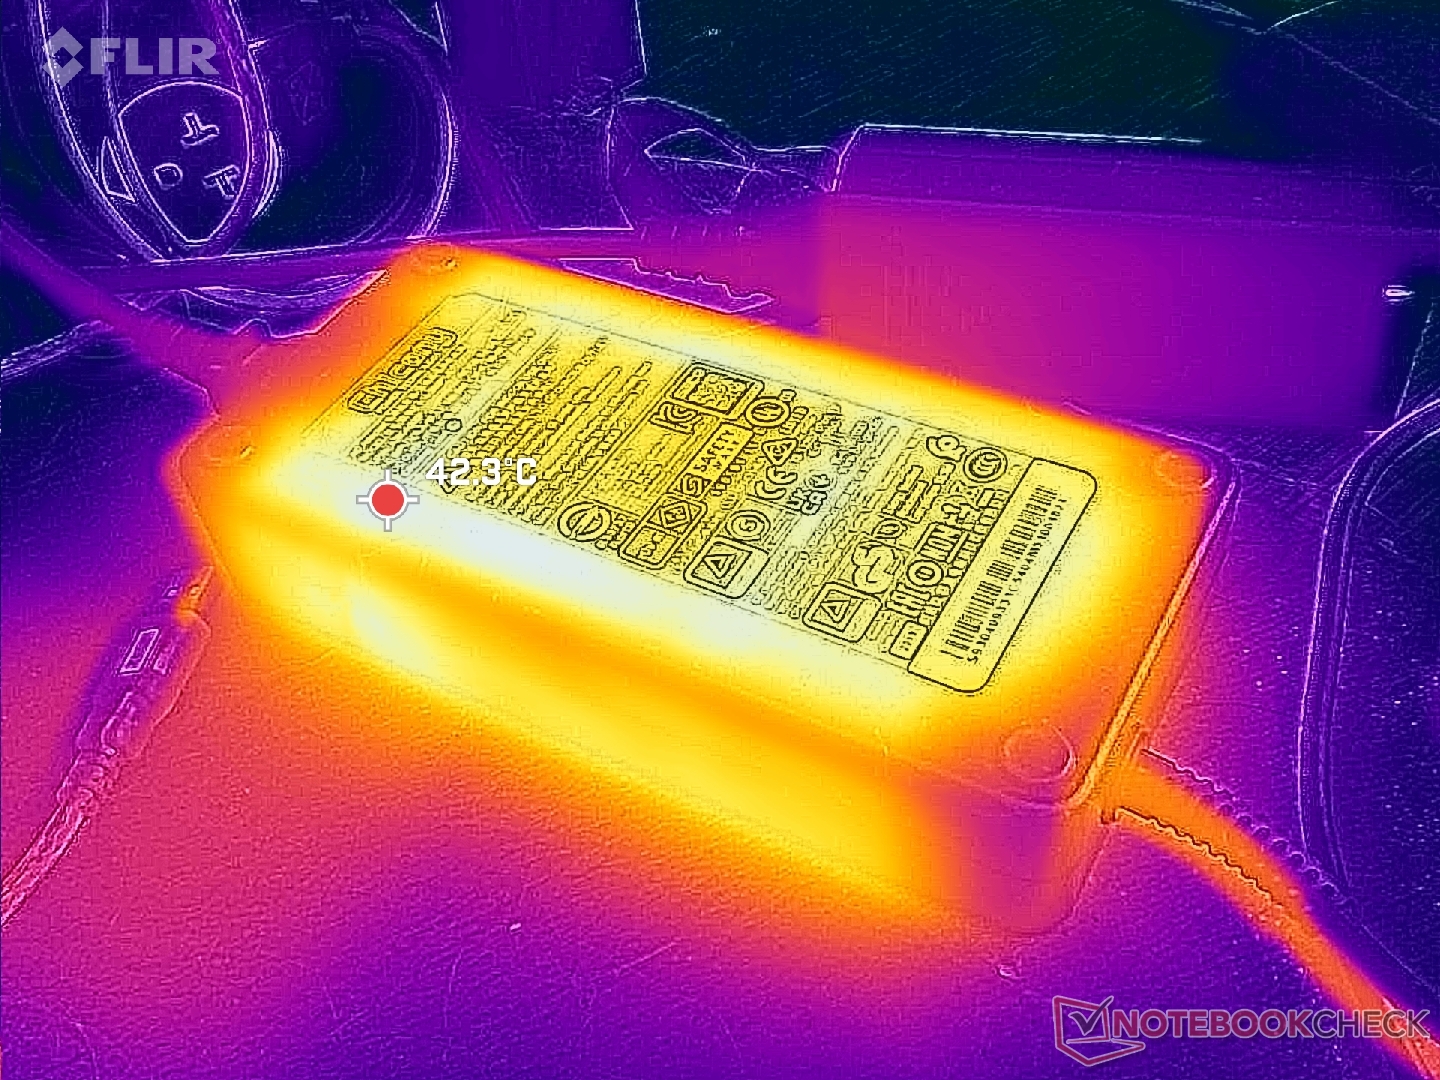
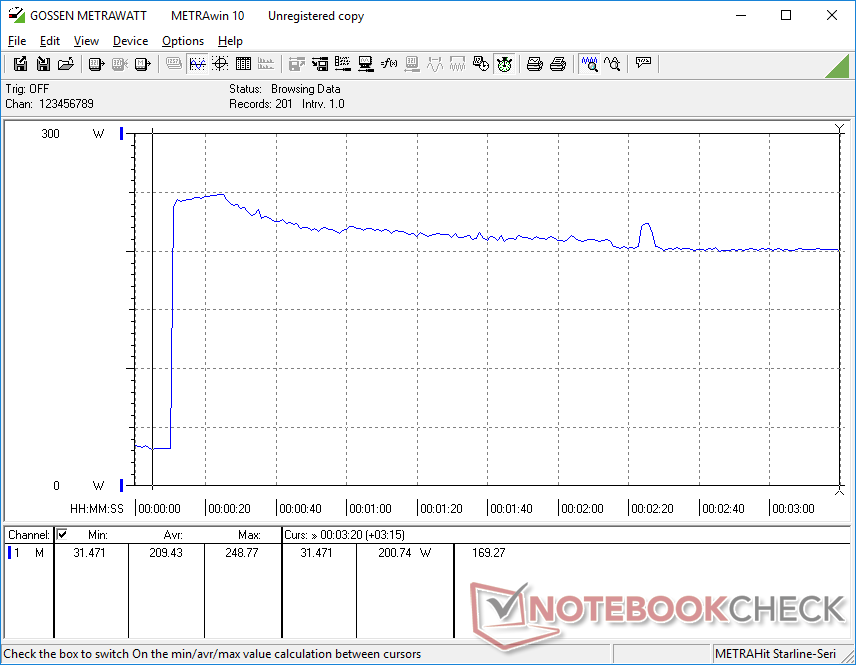
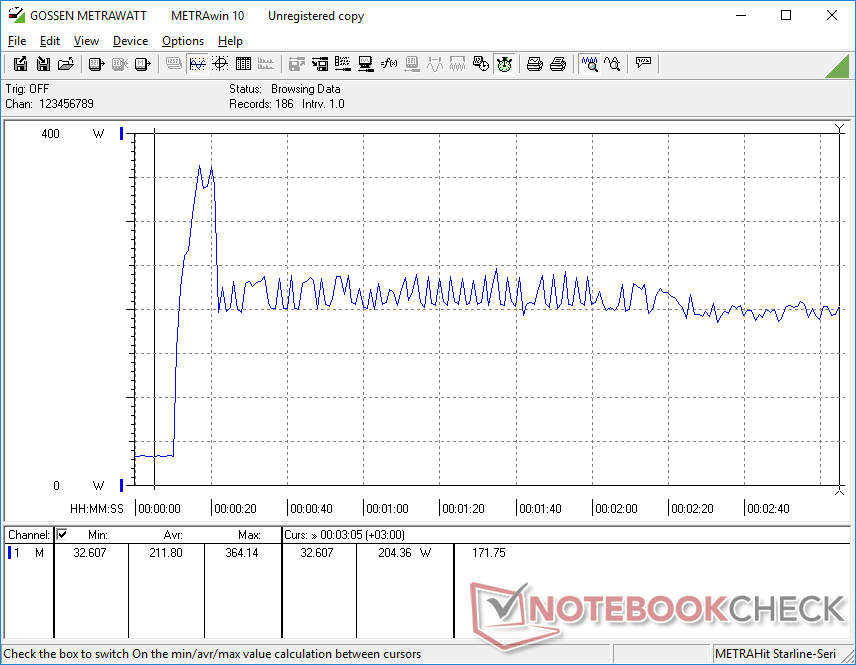
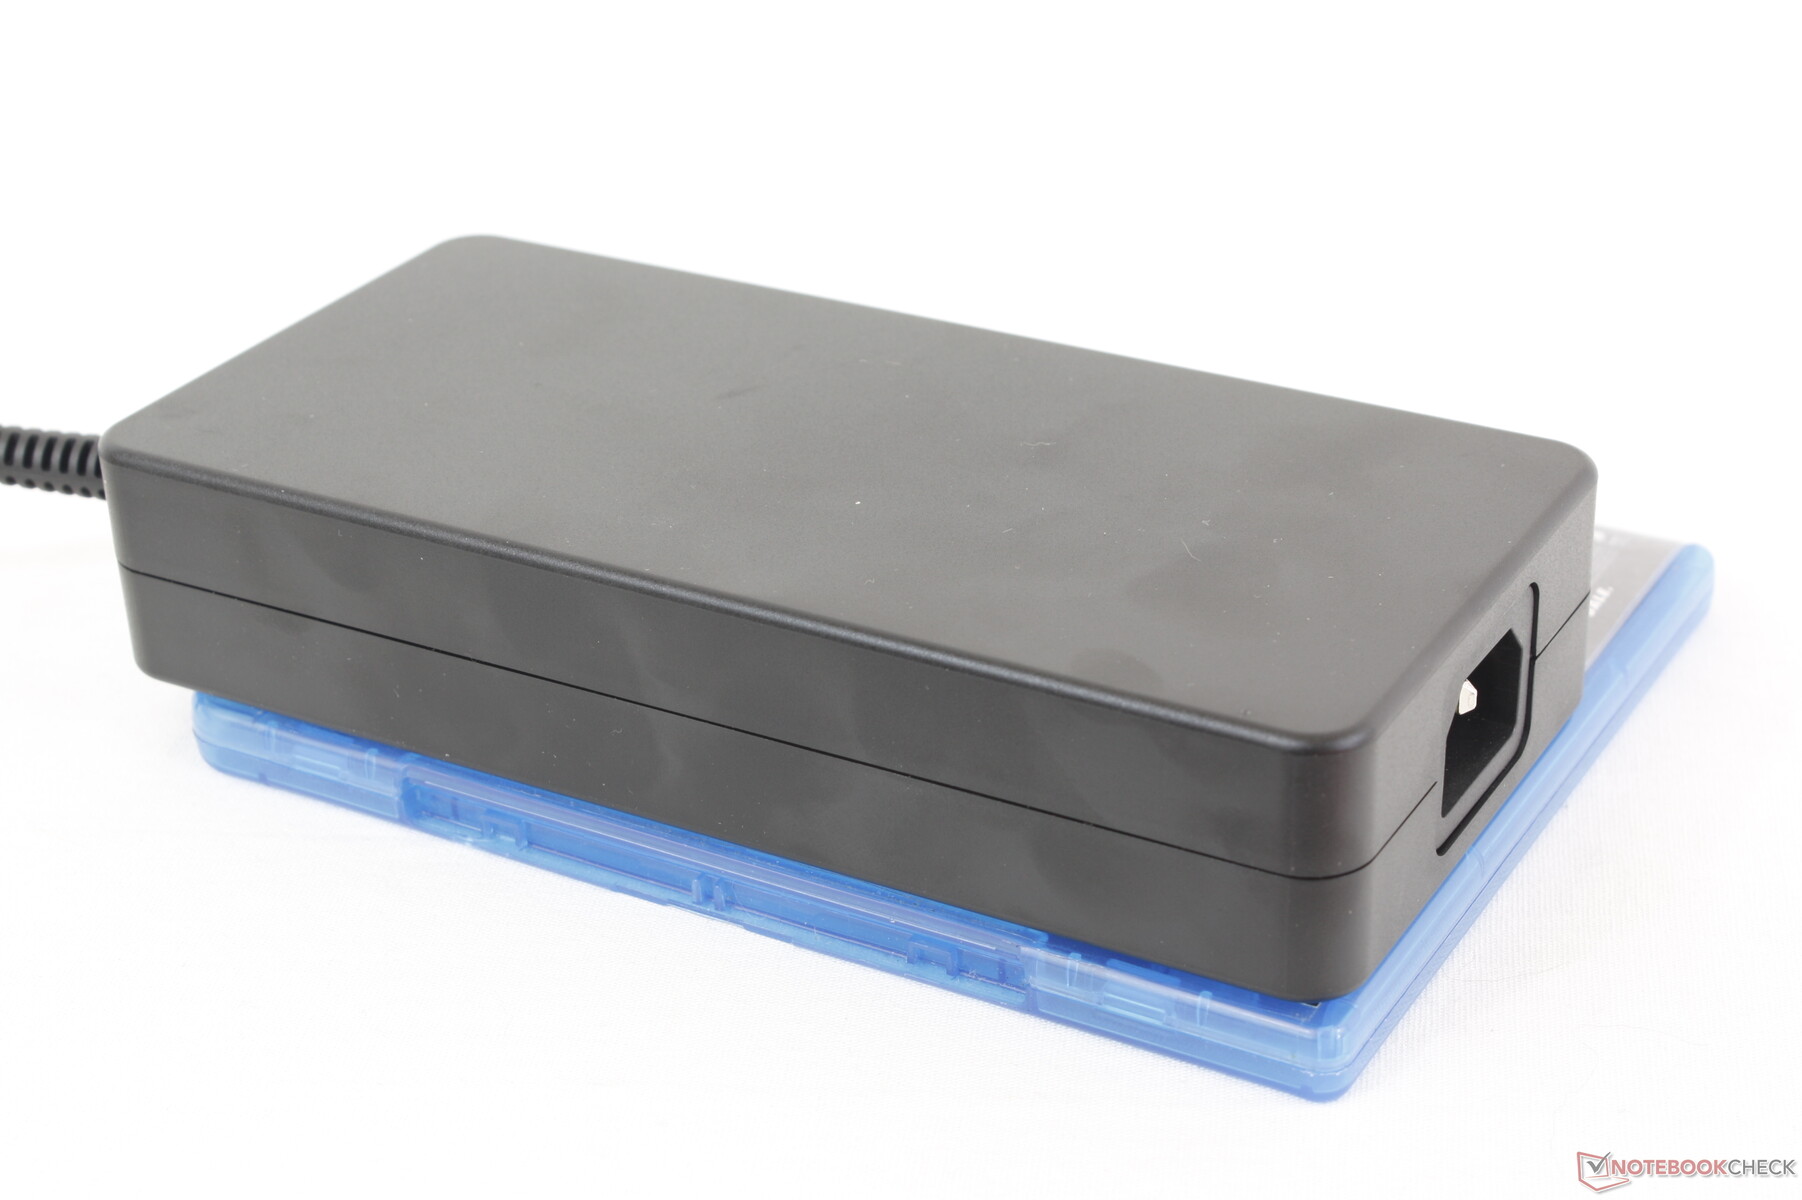
Hem Prime95 hem de FurMark stresini başlatırken büyük (~18 x 8,5 x 3,5 cm) 280 W AC adaptörden 365 W'lık geçici bir maksimum çekim kaydedebildik. Bu oran, aşağıdaki grafiklerde gösterildiği gibi sadece birkaç saniye sonra düşerek 204 W civarında sabitleniyor. MSI, en yeni Razer Blade dizüstü bilgisayarların aksine GaN şarjı henüz benimsemedi.
| Kapalı / Bekleme modu | |
| Boşta | |
| Çalışırken |
|
Key:
min: | |
| MSI Raider GE68HX 13VF i9-13950HX, GeForce RTX 4060 Laptop GPU, Samsung PM9B1 1024GB MZVL41T0HBLB, IPS, 1900x1200, 16" | MSI GE67 HX 12UGS i7-12800HX, GeForce RTX 3070 Ti Laptop GPU, Samsung PM9A1 MZVL21T0HCLR, OLED, 1920x1080, 15.6" | HP Omen 16-xf0376ng R7 7840HS, GeForce RTX 4070 Laptop GPU, WDC PC SN810 512GB, IPS, 1920x1080, 16.1" | Alienware m16 R1 AMD R9 7845HX, GeForce RTX 4080 Laptop GPU, Kioxia XG8 KXG80ZNV1T02, IPS, 2560x1600, 16" | Lenovo Legion Slim 7i 16 Gen 8 i9-13900H, GeForce RTX 4070 Laptop GPU, Samsung PM9A1 MZVL21T0HCLR, IPS, 2560x1600, 16" | Asus ROG Zephyrus M16 GU604VY-NM042X i9-13900H, GeForce RTX 4090 Laptop GPU, Samsung PM9A1 MZVL22T0HBLB, IPS, 2560x1600, 16" | |
|---|---|---|---|---|---|---|
| Power Consumption | 1% | 34% | -81% | -12% | -4% | |
| Idle Minimum * (Watt) | 15.8 | 16.1 -2% | 9 43% | 39 -147% | 22 -39% | 20 -27% |
| Idle Average * (Watt) | 19.4 | 17.1 12% | 14 28% | 44.6 -130% | 29 -49% | 24 -24% |
| Idle Maximum * (Watt) | 27.3 | 26.6 3% | 20 27% | 68.1 -149% | 39.5 -45% | 25 8% |
| Load Average * (Watt) | 114.7 | 116.3 -1% | 84 27% | 129.8 -13% | 98.7 14% | 107 7% |
| Witcher 3 ultra * (Watt) | 185.5 | 237 -28% | 140.9 24% | 285 -54% | 171.8 7% | 208 -12% |
| Load Maximum * (Watt) | 364.2 | 291.1 20% | 176 52% | 327.3 10% | 213.2 41% | 267 27% |
* ... daha küçük daha iyidir
Power Consumption Witcher 3 / Stresstest
Power Consumption external Monitor
Pil Ömrü
Pil kapasitesi 99,9 Wh ile yasal olarak olabildiğince yüksek. Çalışma süreleri, iGPU aktifken Dengeli güç profilinde 6,5 saatin biraz üzerinde gerçek dünya WLAN taramasıyla 16 inçlik bir oyun dizüstü bilgisayarı için çok iyi. Bu, bugüne kadar test ettiğimiz en uzun ömürlü 16 inç oyun dizüstü bilgisayarlarından biri.
Ne yazık ki, boş kapasiteden tam kapasiteye şarj, diğer dizüstü bilgisayarların çoğundaki 1,5 saate kıyasla 2,5 saat gibi nispeten yavaş bir sürede gerçekleşiyor. Ayrıca, MSI Power Delivery'nin reklamını yapsa da USB-C AC adaptörlerimizin hiçbiri dizüstü bilgisayarı üç USB-C bağlantı noktasından herhangi biriyle şarj etmedi.
| MSI Raider GE68HX 13VF i9-13950HX, GeForce RTX 4060 Laptop GPU, 99.9 Wh | MSI GE67 HX 12UGS i7-12800HX, GeForce RTX 3070 Ti Laptop GPU, 99.9 Wh | HP Omen 16-xf0376ng R7 7840HS, GeForce RTX 4070 Laptop GPU, 83 Wh | Alienware m16 R1 AMD R9 7845HX, GeForce RTX 4080 Laptop GPU, 86 Wh | Lenovo Legion Slim 7i 16 Gen 8 i9-13900H, GeForce RTX 4070 Laptop GPU, 99.9 Wh | Asus ROG Zephyrus M16 GU604VY-NM042X i9-13900H, GeForce RTX 4090 Laptop GPU, 90 Wh | |
|---|---|---|---|---|---|---|
| Pil Çalışma Süresi | -2% | -16% | -52% | -42% | 12% | |
| Reader / Idle (h) | 8.8 | 8.4 -5% | 4 -55% | 5.1 -42% | ||
| WiFi v1.3 (h) | 6.8 | 5.6 -18% | 5.7 -16% | 3.7 -46% | 4.4 -35% | 4.3 -37% |
| Load (h) | 1.8 | 2.1 17% | 0.8 -56% | 0.9 -50% | 2.9 61% | |
| H.264 (h) | 4.8 |
Artılar
Eksiler
Karar - Fena Değil, Ama Hedefi Iskalıyor
Üreticiyi oyun dizüstü bilgisayar tasarımlarıyla farklı bir yöne gittiği için takdir etsek de, değişikliklerin son kullanıcı servis kolaylığı pahasına gelmemesi gerektiğine inanıyoruz. GE68HX'i açmak geçen yılki tasarıma göre daha zordur ve bu, sahiplerinin kendilerinin ek RAM ve depolama alanı ekleme olasılığının daha yüksek olduğu bir oyun dizüstü bilgisayarında özellikle sorunlu olabilir. İkinci olarak, yeni tasarım GE67HX'in "daha temiz" görünümünden belirgin bir şekilde daha kalın ve daha ağırdır, bu da birçok kullanıcı için iyi olmayabilir.
Yeni şasinin hala birkaç avantajı var. İlk olarak, menteşeler eskisinden daha sağlam hissedilirken, kasanın geri kalanı da aynı derecede güçlü. İkinci olarak, daha iyi hız aşırtma potansiyeli için çekirdek sıcaklıkları GE67HX'e göre daha düşük. Performans, varsayılan güç profili ve ayarlarında beklenenden biraz daha hızlı. Ve son olarak, bazı kullanıcılar oyun dışındaki uygulamalar için daha büyük clickpad ve yeni numpad'i takdir edebilir.
Performans ve sıcaklıklar daha kalın kasa tasarımından faydalanıyor, ancak yüksek başlangıç fiyatı göz önüne alındığında daha ağır ağırlık, daha zor servis edilebilirlik ve düşük kaliteli ekran seçeneklerinden herkes memnun olmayacaktır.
Bununla birlikte, 1700 USD ve üstü için, ekran renkleri, G-Sync ve SSD performansından yapılan kesintiler, üst düzey GE serisindeki bir model için gereksiz görünüyor. Bunun yerine daha alt seviye MSI Sword veya Katana serisindeki modeller için bu tür ödünler daha beklenir. Üretici aynı zamanda şarj teknolojisinde de geride kalıyor; Razer'ın daha küçük ve daha taşınabilir GaN şarj cihazları da aynı gücü sağlayabilirken GE68HX'teki USB-C şarj desteği güvenilmez görünüyor.
Gibi alternatiflerLenovo Legion Slim 7i 16 Gen 8, Asus ROG Zephyrus M16veya Razer Blade 16 her zaman Core-HX CPU'lar sunmayabilir, ancak benzer grafik seçenekleri ve daha iyi ekranlar taşırken çok daha taşınabilirdirler.
Fiyat ve Bulunabilirlik
MSI Raider GE68HX 13VF
- 09/30/2023 v7 (old)
Allen Ngo
Şeffaflık
İncelenecek cihazların seçimi editör ekibimiz tarafından yapılır. Test örneği yazar tarafından masrafları kendisine ait olmak üzere serbestçe satın alınmıştır. Borç verenin bu inceleme üzerinde herhangi bir etkisi olmadığı gibi, üretici de yayınlanmadan önce bu incelemenin bir kopyasını almamıştır. Bu incelemeyi yayınlama zorunluluğu yoktu. Bağımsız bir medya şirketi olarak Notebookcheck, üreticilerin, perakendecilerin veya yayıncıların otoritesine tabi değildir.
Notebookcheck bu şekilde test yapıyor
Notebookcheck, tüm sonuçların karşılaştırılabilir olmasını sağlamak için her yıl yüzlerce dizüstü bilgisayarı ve akıllı telefonu standart prosedürler kullanarak bağımsız olarak inceliyor. Yaklaşık 20 yıldır test yöntemlerimizi sürekli olarak geliştirdik ve bu süreçte endüstri standartlarını belirledik. Test laboratuvarlarımızda deneyimli teknisyenler ve editörler tarafından yüksek kaliteli ölçüm ekipmanları kullanılmaktadır. Bu testler çok aşamalı bir doğrulama sürecini içerir. Karmaşık derecelendirme sistemimiz, nesnelliği koruyan yüzlerce sağlam temellere dayanan ölçüm ve kıyaslamaya dayanmaktadır.Price comparison

