Uygun Fiyatlı MSI GP66 Leopard 11UH İncelemede: 2.000 €'nun altındaki RTX 3080'li dizüstü oyuncu bilgisayarı
Nisan ayında, Comet Lake CPU'lu önceki modeli MSI GP66 Leopard 10UG'yi inceledik ve yeniden tasarlanan kasayı övdük. Daha yeni GP66 Leopard 11UH artık Tiger Lake CPU ile donatıldı ve kasa da değişti. Ancak en iyi şey, güçlü oyuncunun RTX 3080 ile konfigürasyonda 2.000 Euro'dan daha düşük bir fiyata satın alınabilmesidir!
GP66 11UH ayrıca alternatif olarak bir QHD ekran veya RTX 3070 ile birlikte gelir; test modelimiz hızlı bir Full HD ekrana sahiptir.
MSI, görünüşe göre RTX 3080 ile en ucuz oyun dizüstü bilgisayarlarından biri, bu yüzden bu fiyat aralığında uygun bir rakip bulmak kolay değil. Bu nedenle, burada karşılaştırma için biraz daha pahalı (+500 Euro'ya kadar) modelleri de kullandık: Aorus 15P YD, ASUS ROG Strix Scar 15, Schenker XMG Neo 15 ve oldukça pahalı Alienware m15 R6.
Karşılaştırmada muhtemel rakipleri
Derece | Tarih | Model | Ağırlık | Yükseklik | Boyut | Çözünürlük | En iyi fiyat |
|---|---|---|---|---|---|---|---|
| 85.4 % v7 (old) | 03/2022 | MSI GP66 Leopard 11UH-028 i7-11800H, GeForce RTX 3080 Laptop GPU | 2.3 kg | 23.4 mm | 15.60" | 1920x1080 | |
| 84.2 % v7 (old) | 03/2021 | MSI GP66 Leopard 10UG i7-10870H, GeForce RTX 3070 Laptop GPU | 2.3 kg | 23.4 mm | 15.60" | 1920x1080 | |
| 86.4 % v7 (old) | 09/2021 | Aorus 15P YD i7-11800H, GeForce RTX 3080 Laptop GPU | 2.2 kg | 27 mm | 15.60" | 1920x1080 | |
| 86.3 % v7 (old) | 09/2021 | Asus ROG Strix Scar 15 G533QS R9 5900HX, GeForce RTX 3080 Laptop GPU | 2.3 kg | 27.2 mm | 15.60" | 2560x1440 | |
| 87 % v7 (old) | Schenker XMG Neo 15 Tiger Lake i7-11800H, GeForce RTX 3080 Laptop GPU | 2.2 kg | 26 mm | 15.60" | 2560x1440 | ||
| 86.1 % v7 (old) | 08/2025 | Alienware m15 R6, i7-11800H RTX 3080 i7-11800H, GeForce RTX 3080 Laptop GPU | 2.5 kg | 22.85 mm | 15.60" | 1920x1080 |
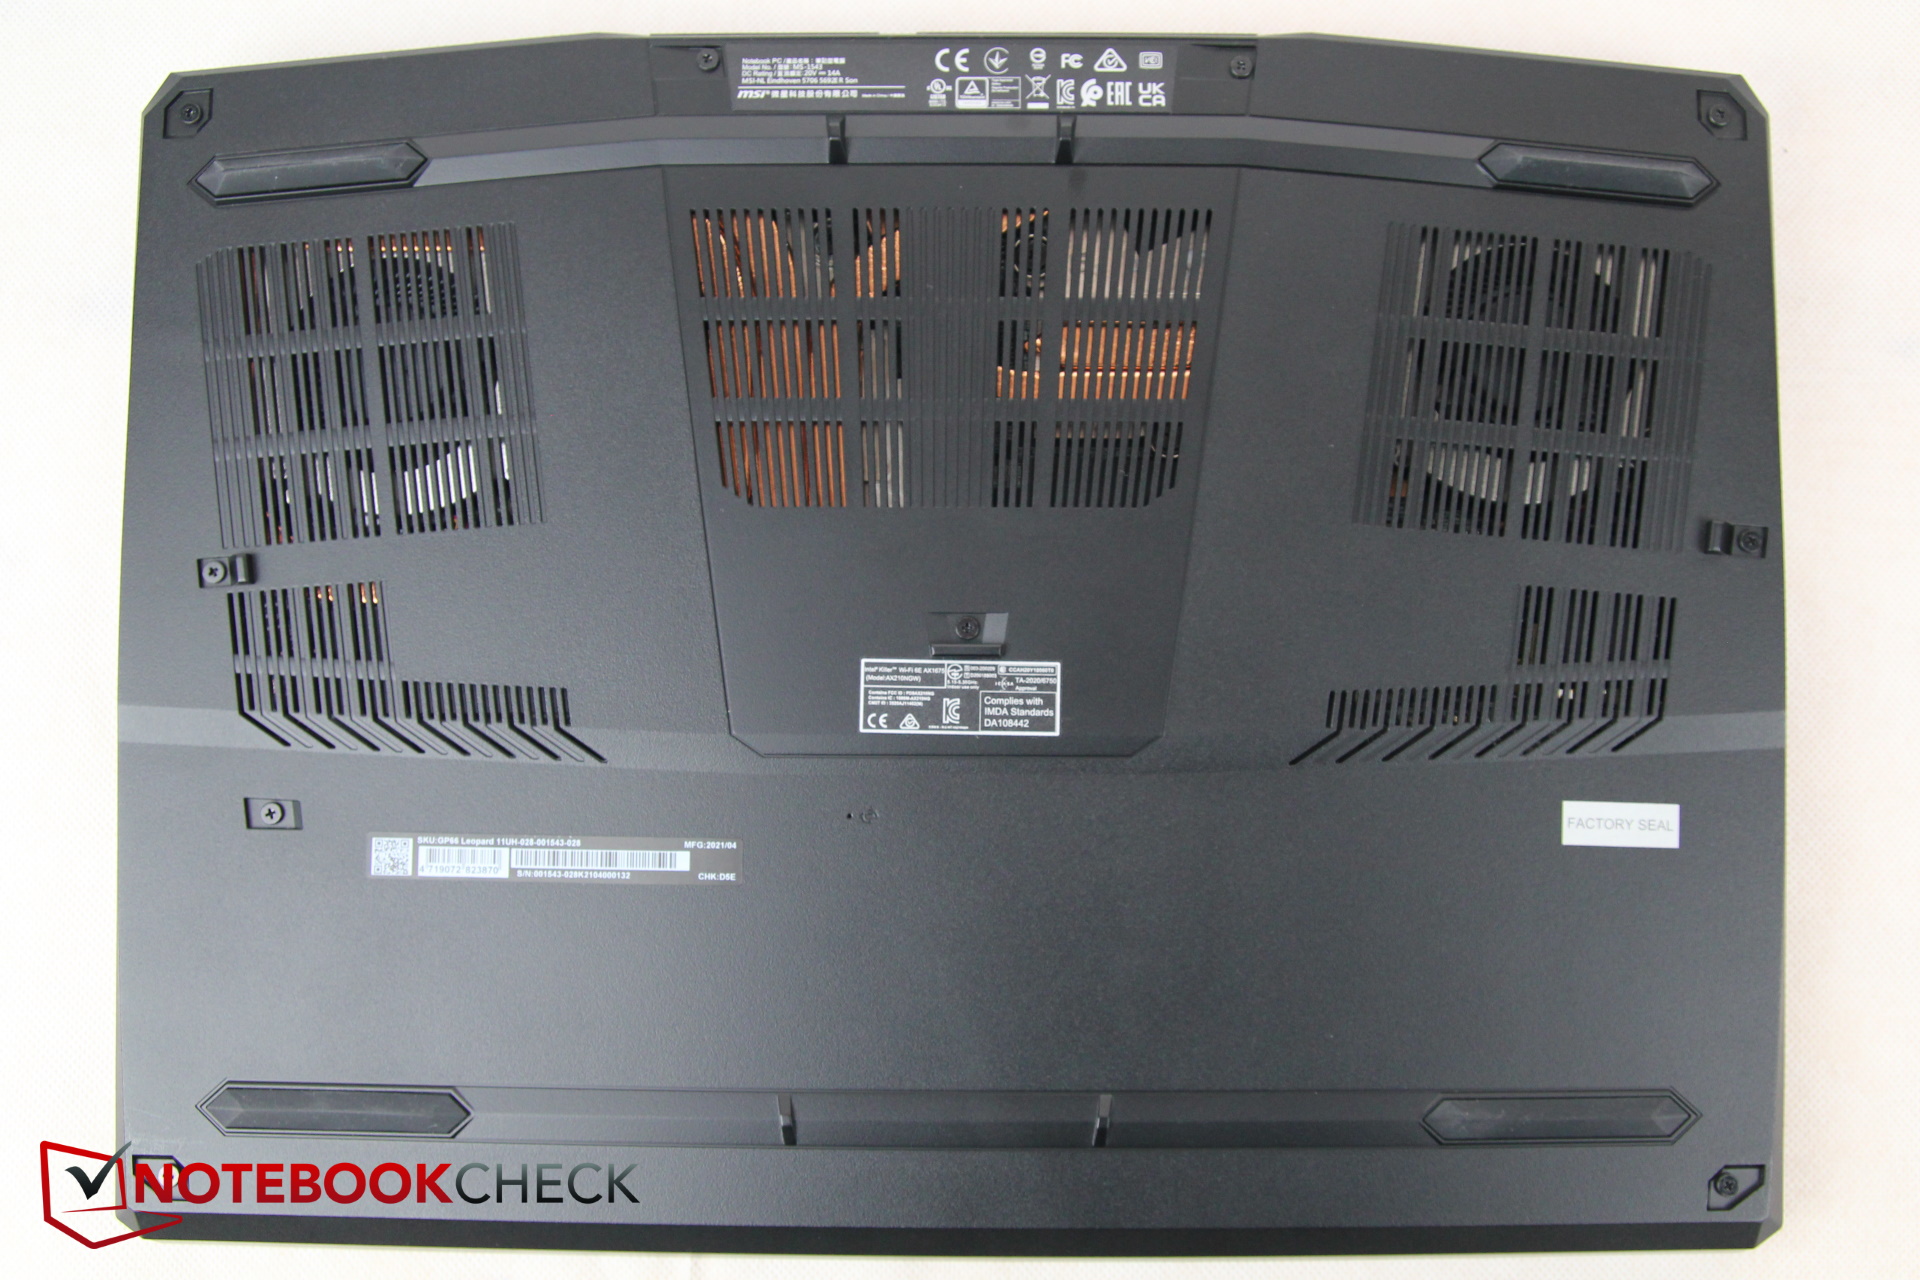
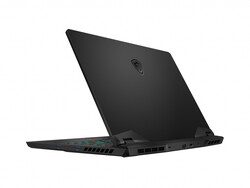
Kasa - MSI'ın hafif üretim kusurları
Kasanın kendisi oldukça benzer kalır, ancak bağlantı noktalarında bazı önemli değişiklikler vardır (aşağıya bakın). Ekran kapağı ve tabanı koyu renkli, pürüzsüz metalden, alt kısmı ise plastikten yapılmıştır. Arkada, soğutma sistemi, Alienware'e benzer şekilde dizüstü bilgisayarın derinliğini artırarak genişliyor.
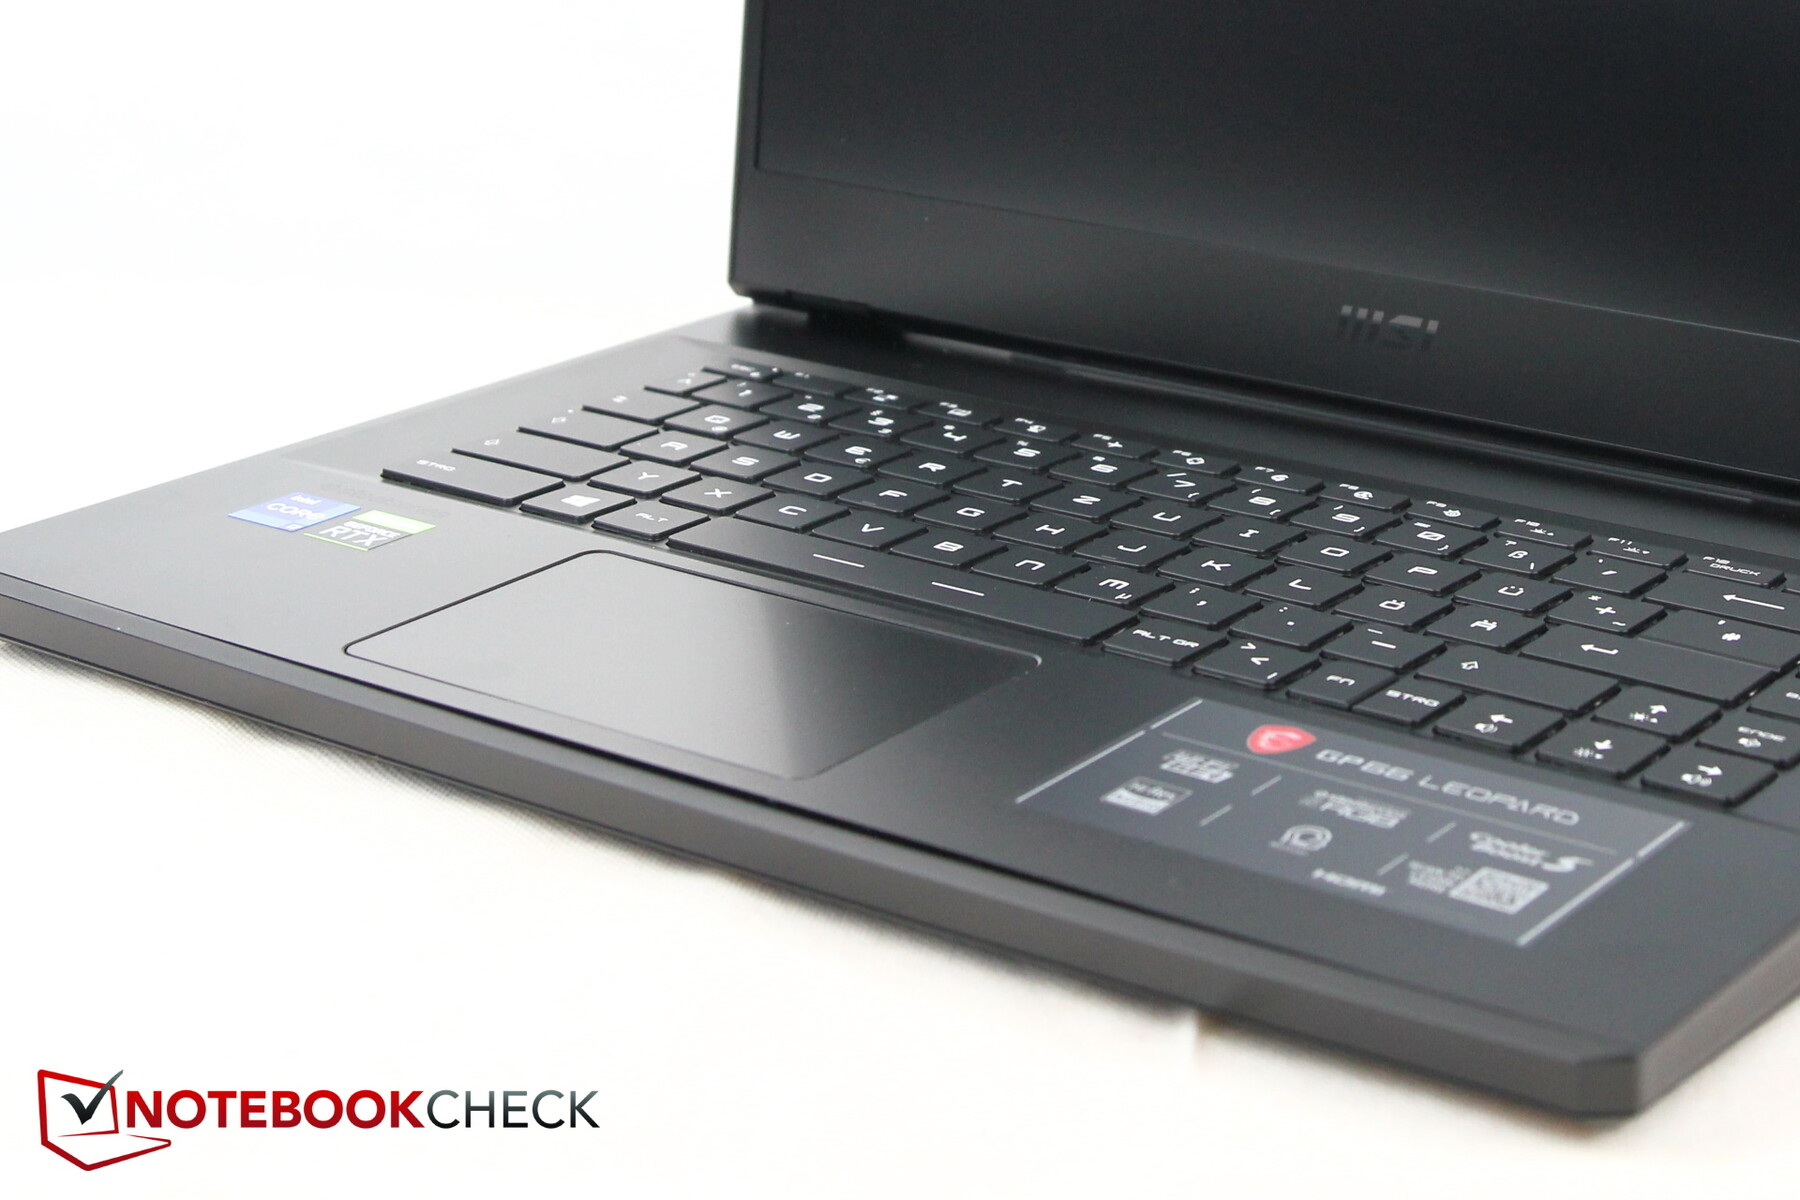
Kapak, teoride olduğu gibi şaşırtıcı derecede sağlamdır. Ancak, test örneğimizde bir sorun var: dokunmatik yüzeyin solundaki tabana bastığımızda, dokunmatik yüzey dokunmatik yüzeyden uzaklaşıyor ve büyük boşluklar oluşuyor - muhtemelen dokunmatik yüzeyin tıkırdamasının nedeni budur.
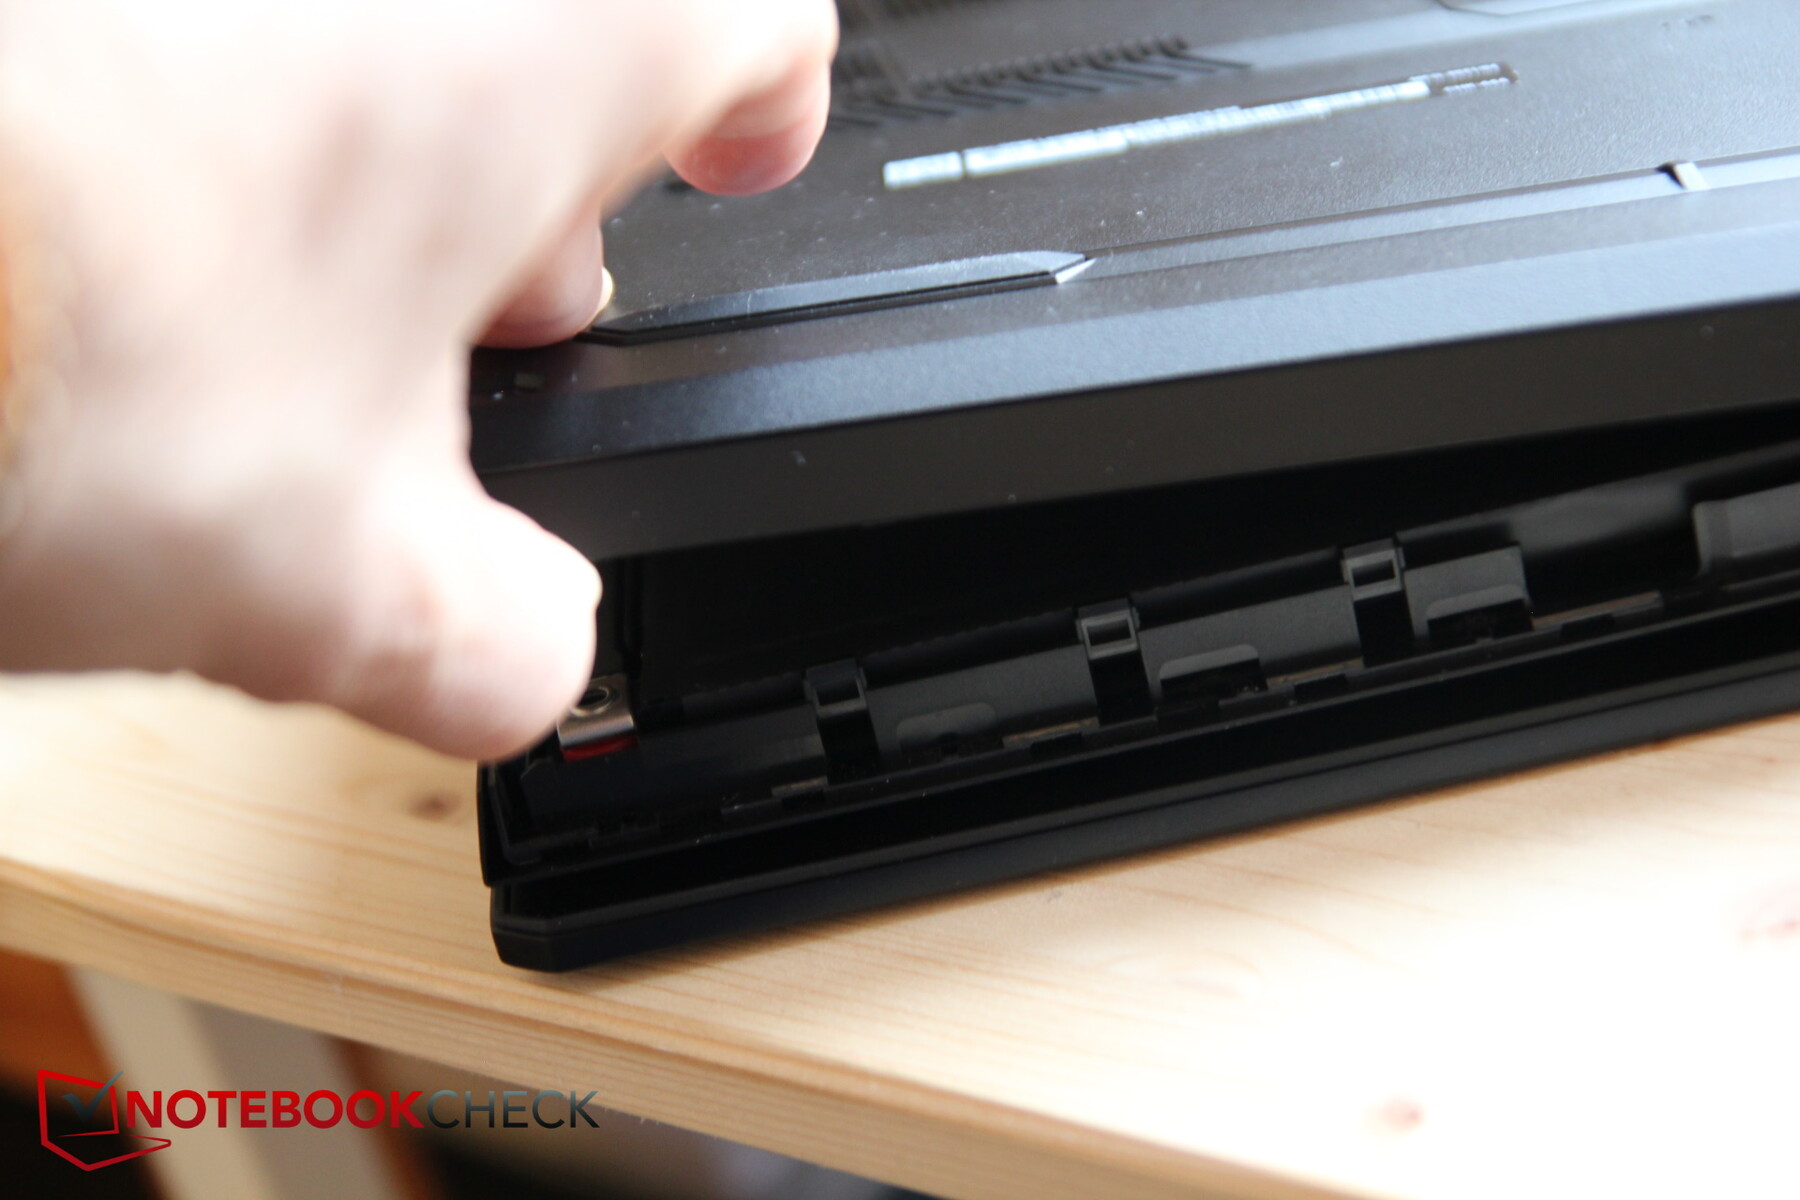
Genel olarak, taban sadece yüzeye oldukça gevşek bir şekilde bağlanmış gibi görünüyor ve fotoğrafta da görebileceğiniz gibi ön kenar da çok hızlı bir şekilde çıkıyor. Bu, bakıma fayda sağlamalıdır, ancak diğer yandan yapı kalitesi açısından gerçekten iyi bir izlenim bırakmaz. Yapının kendisi çok sağlam görünüyor, bu yüzden kusurlu olmayan ünitede sorun yok.
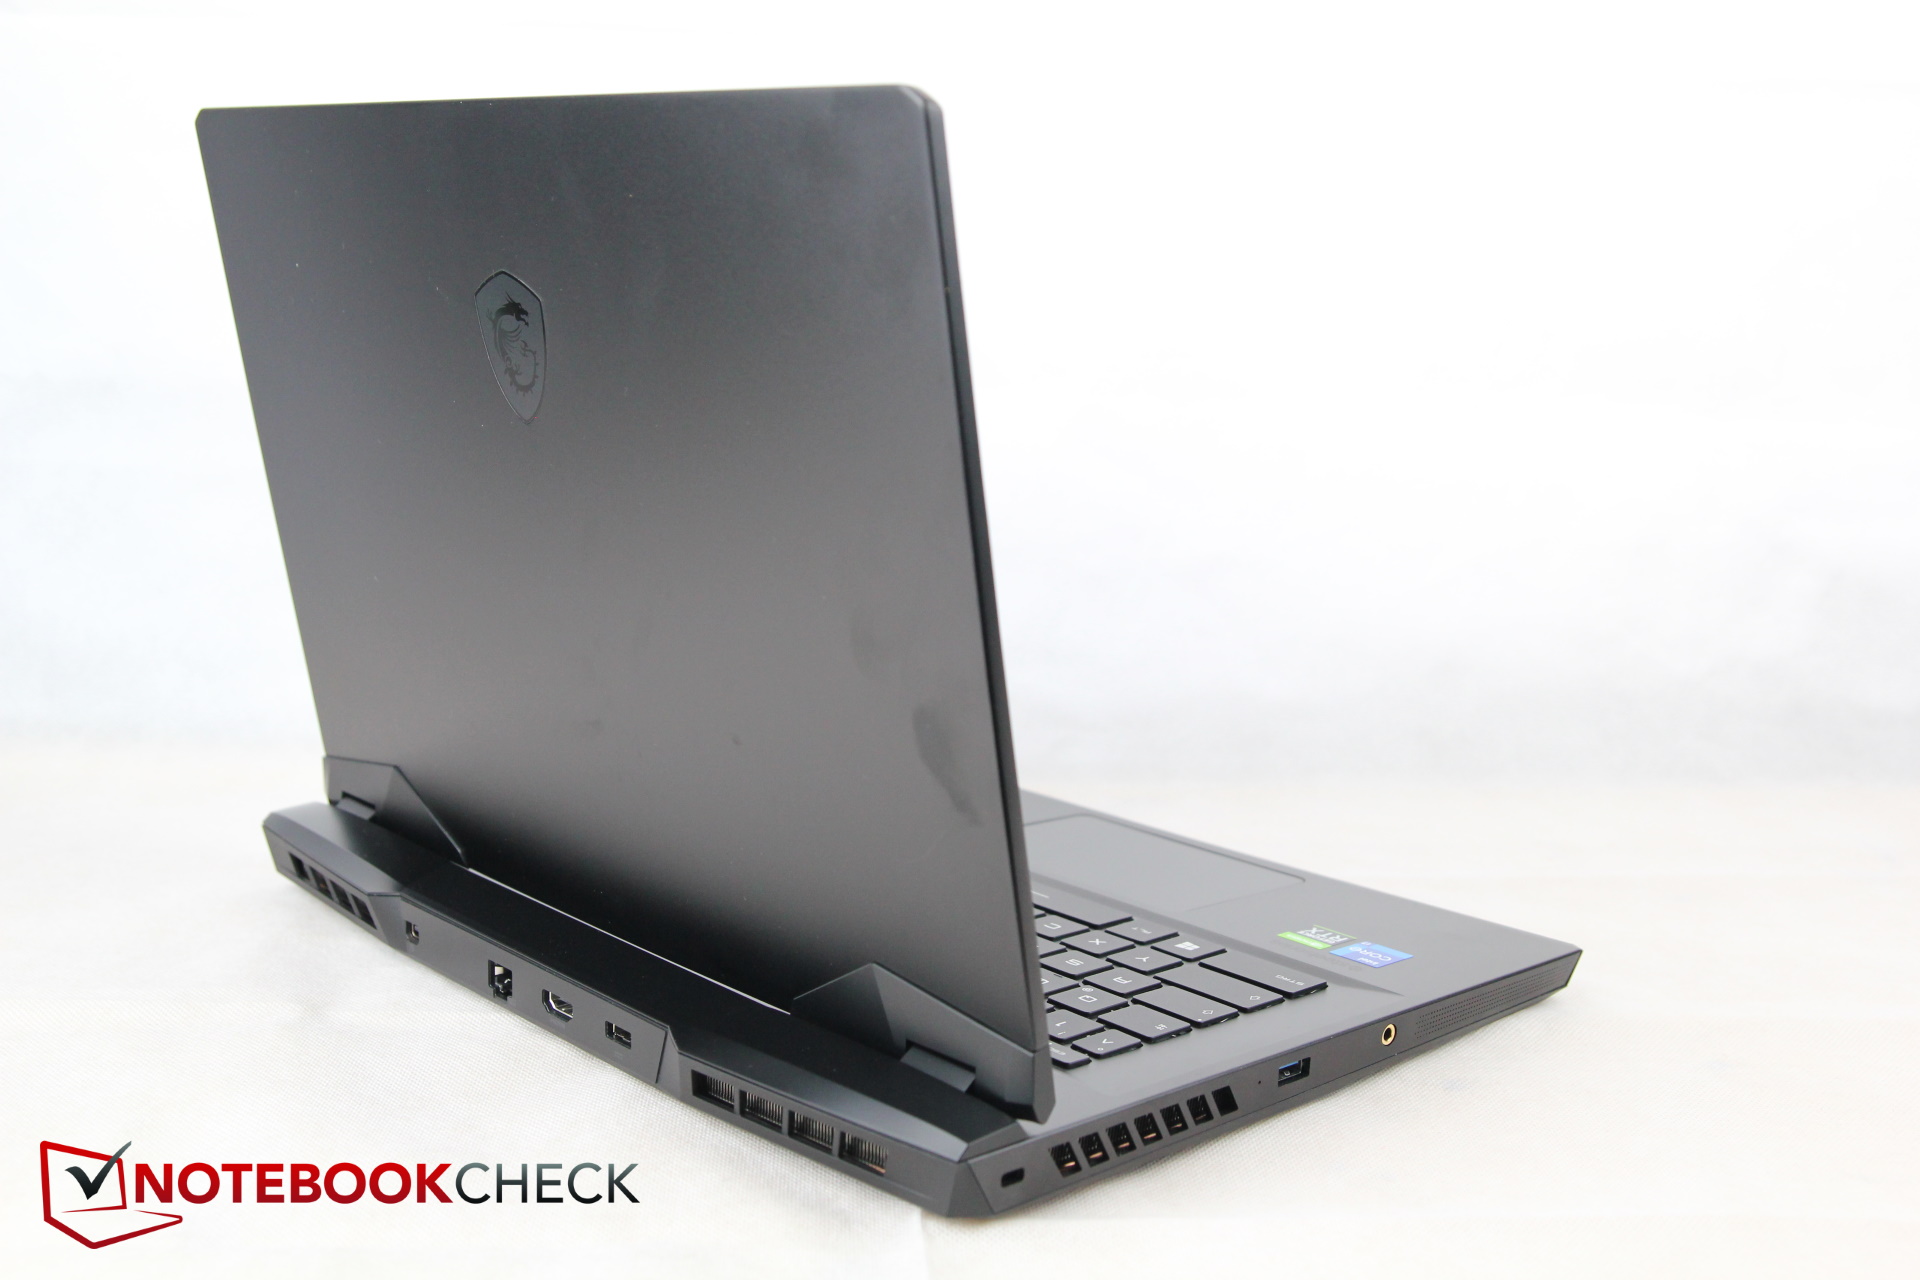
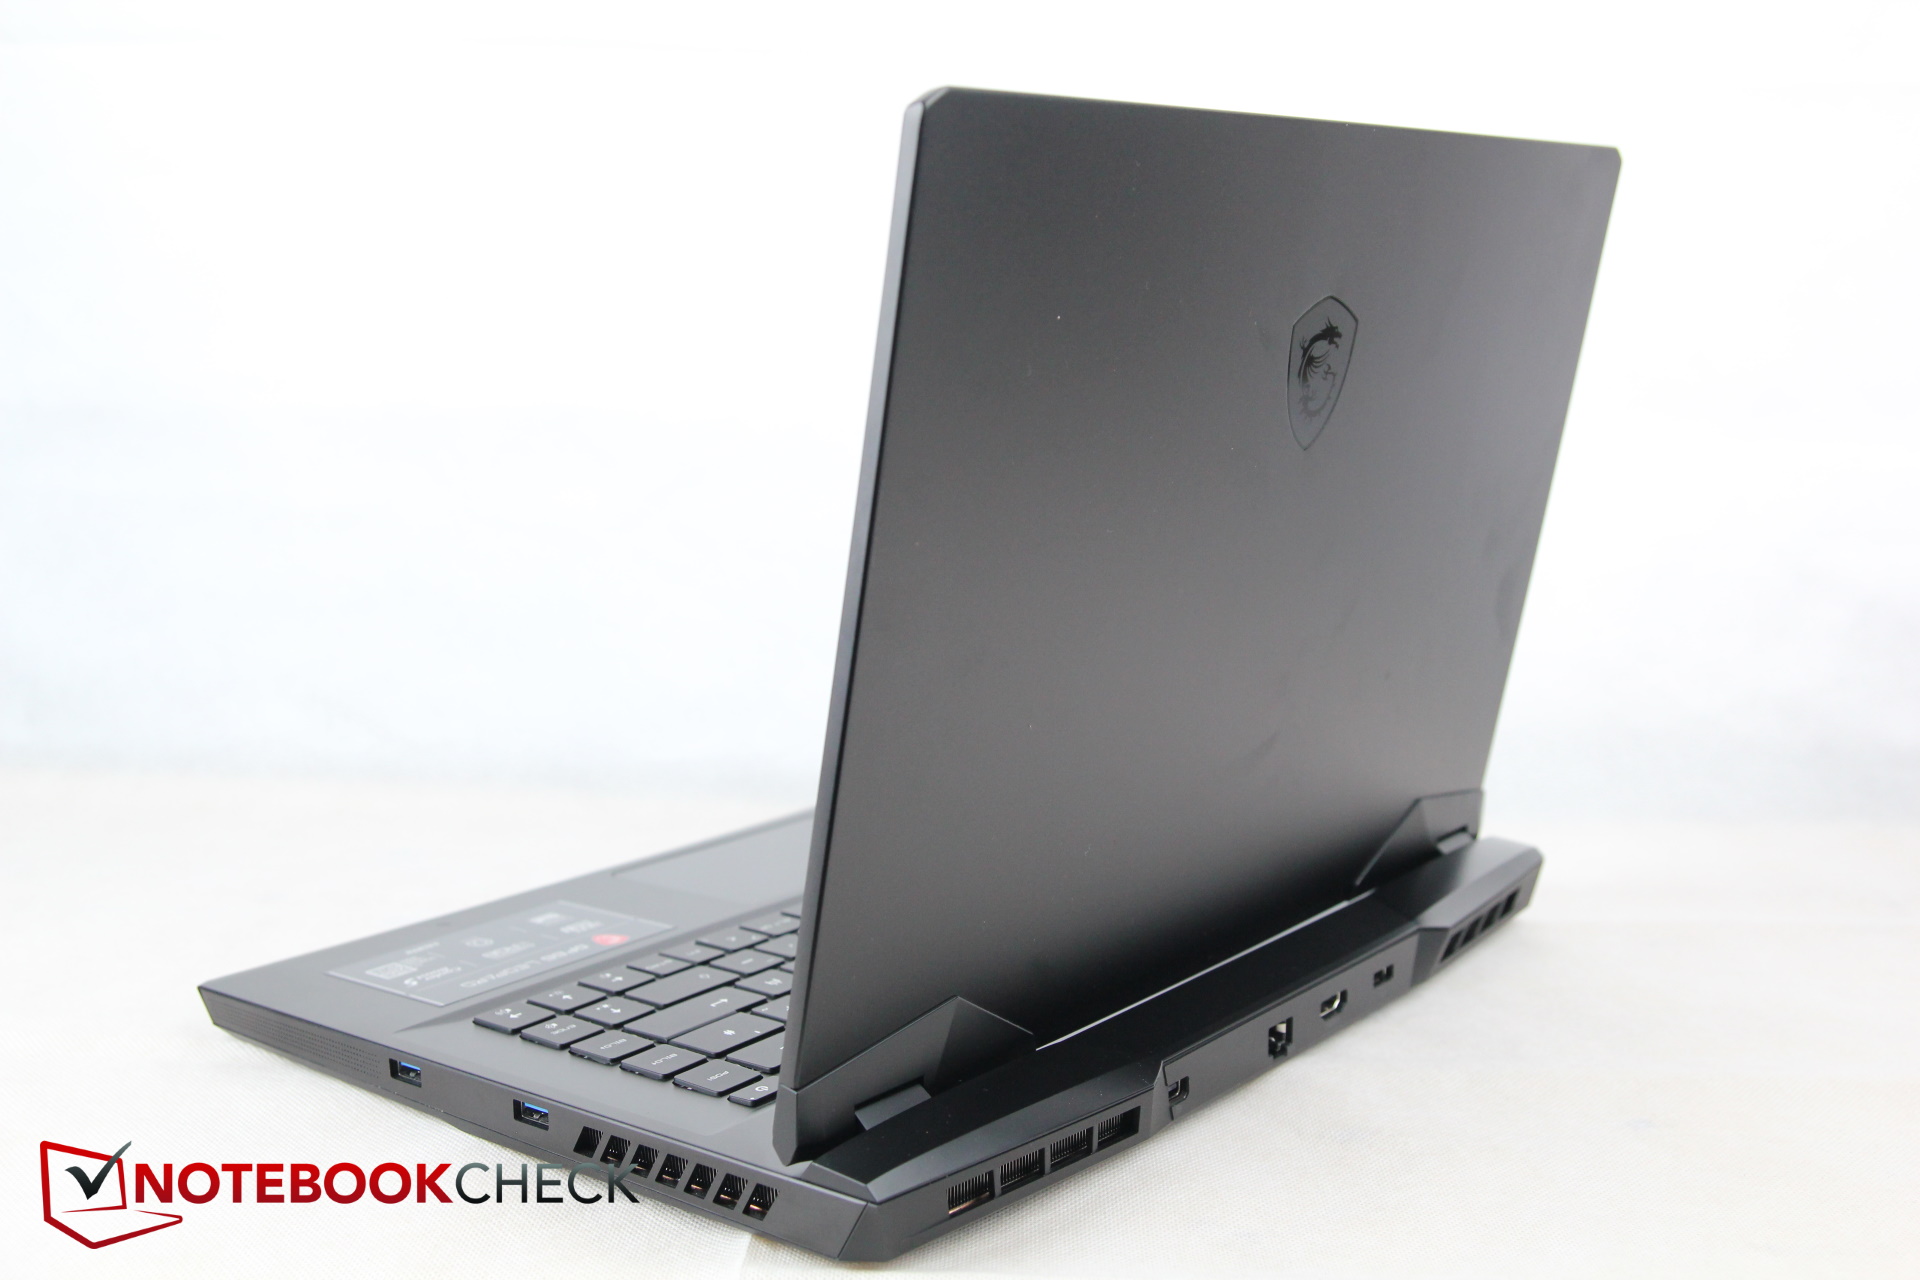
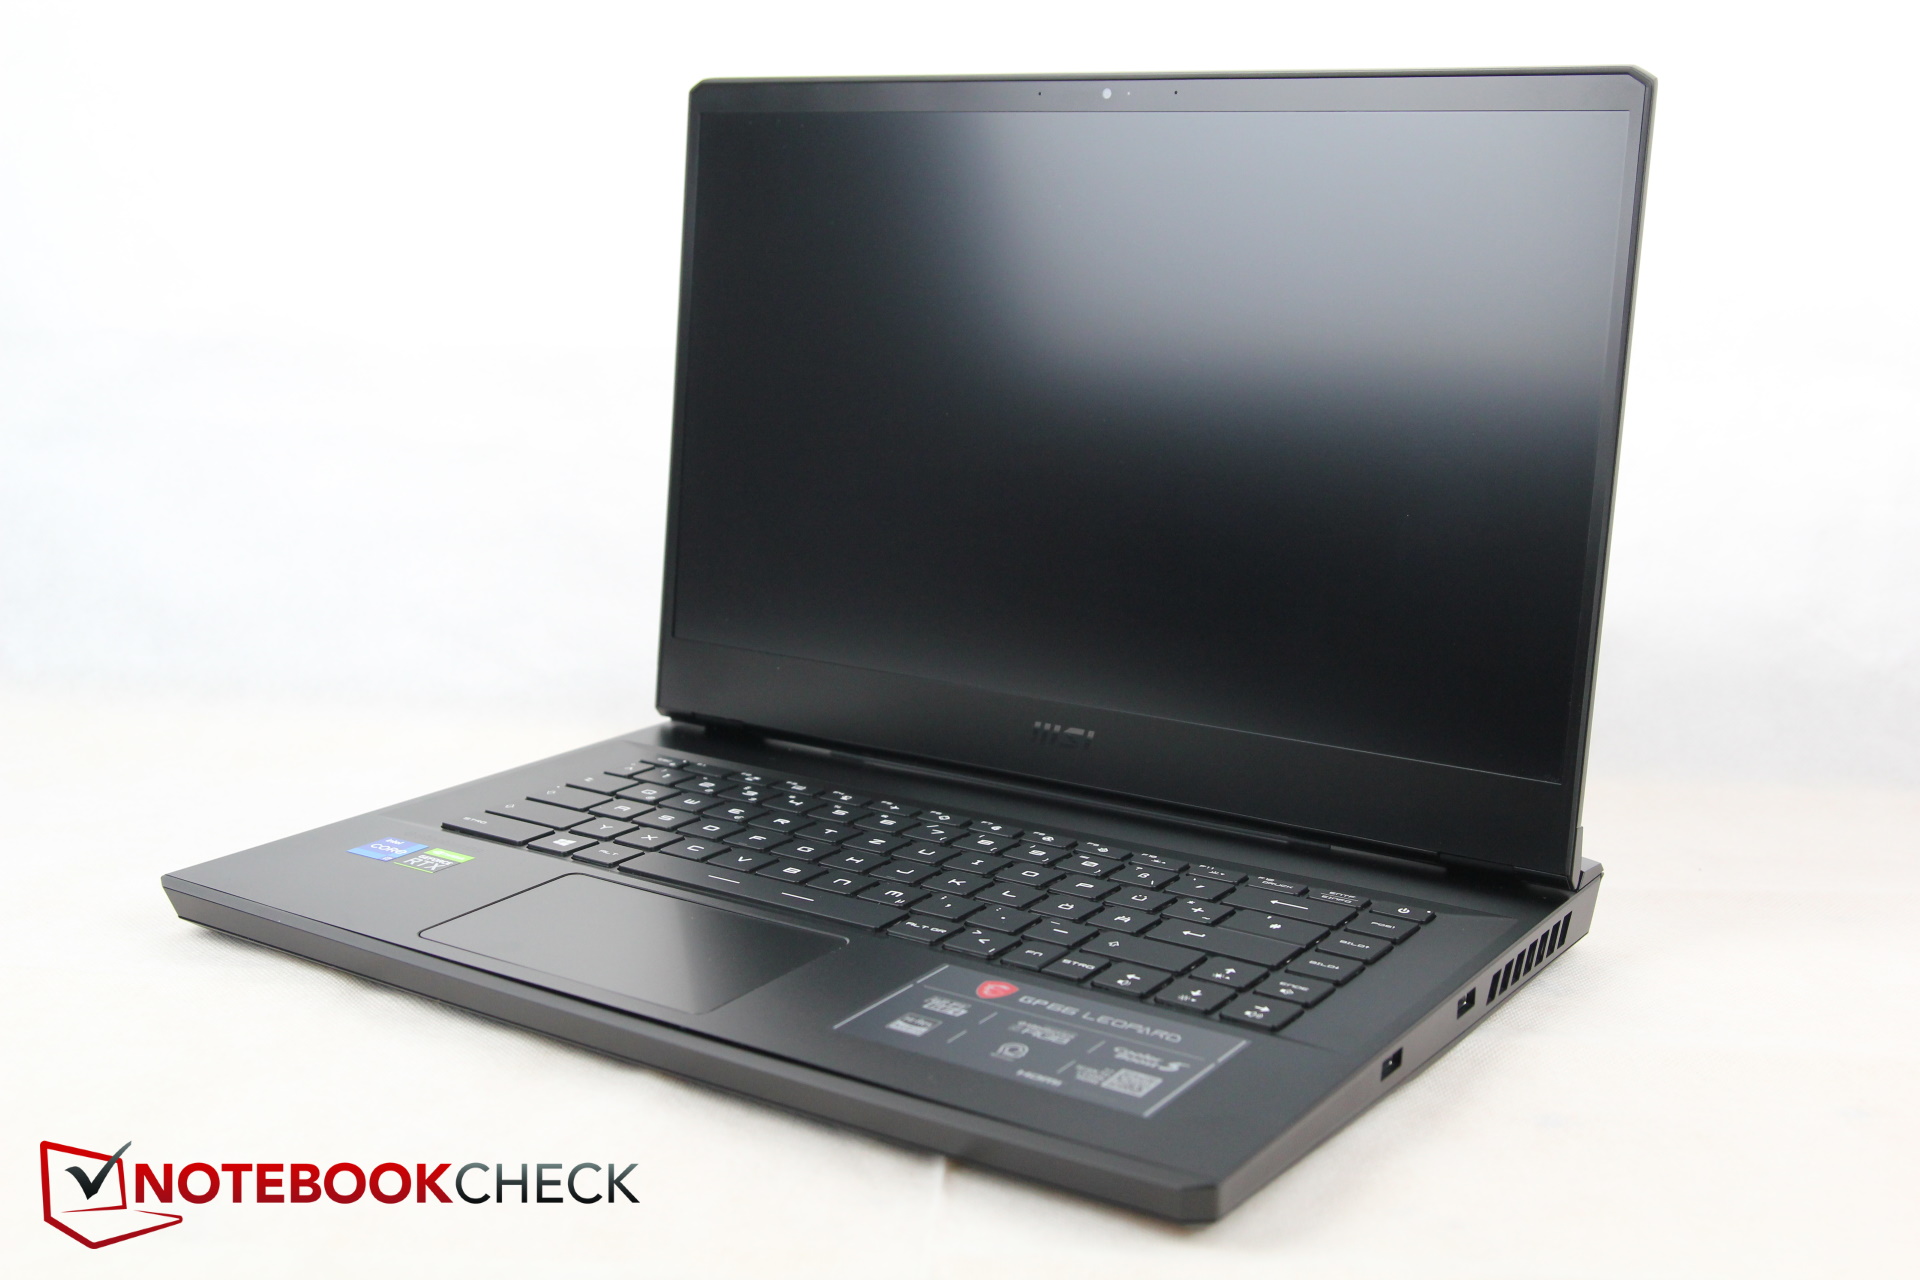
GP66, çıkıntılı soğutma sistemi nedeniyle rakiplerinin çoğundan daha derindir. Bu nedenle, 5 mm daha derin olan Alienware'e çok benzer. Neyse ki, ikincisi kadar ağır değil, ancak rekabetin geri kalanıyla eşit. Bunun dışında karşılaştırmadaki en ince cihazlardan biridir. Yine, yalnızca yeni Alienware biraz daha incedir.
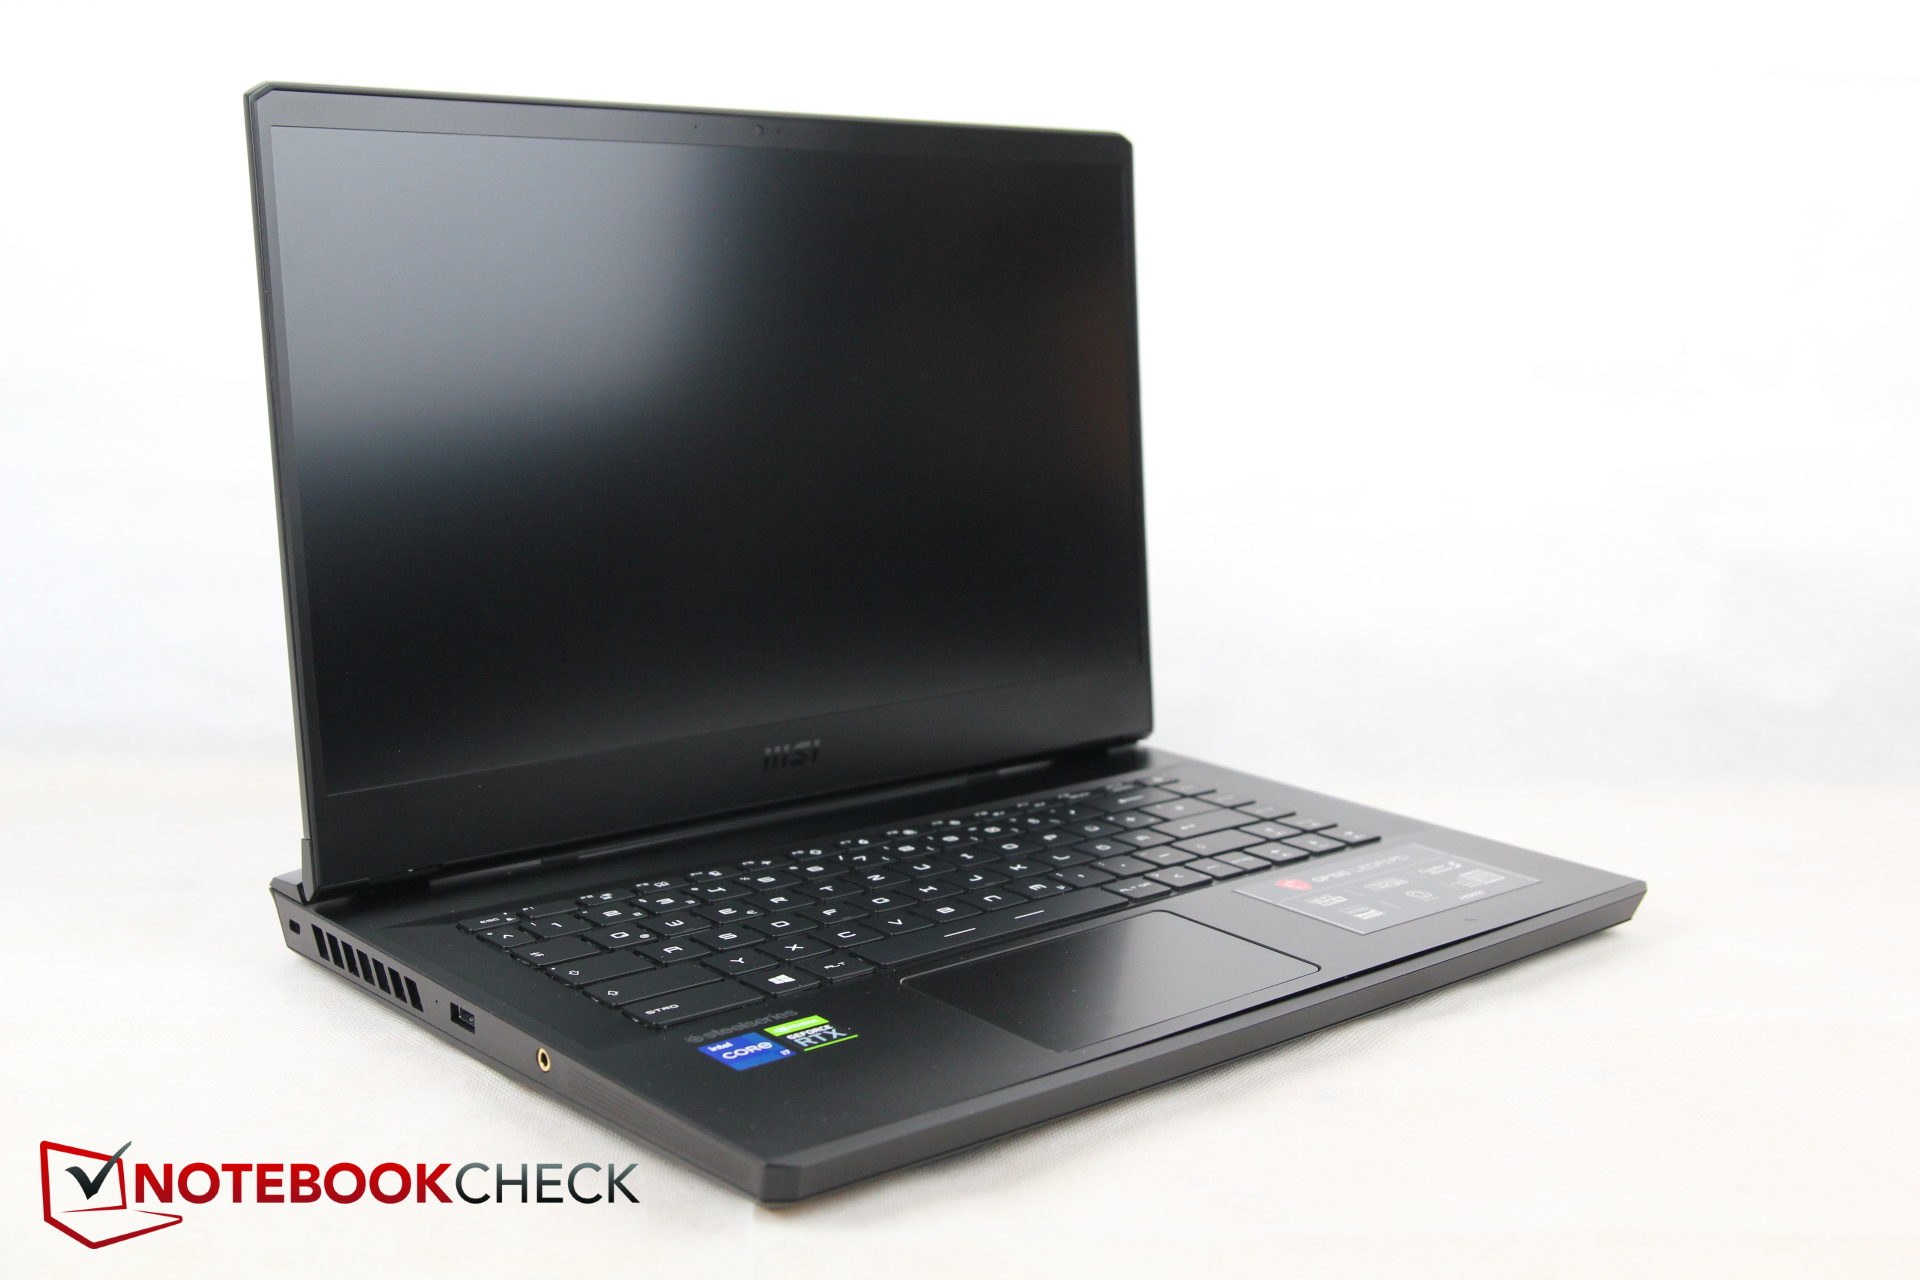
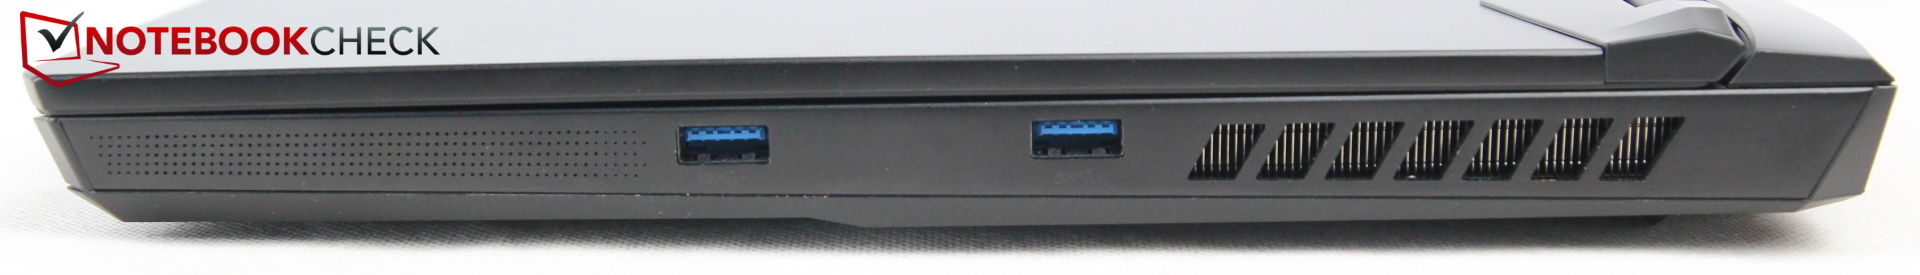
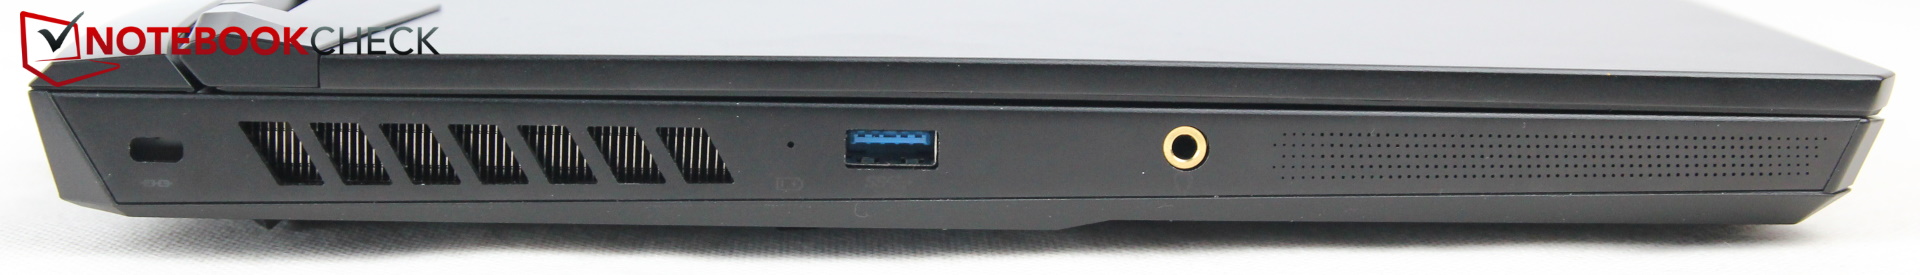
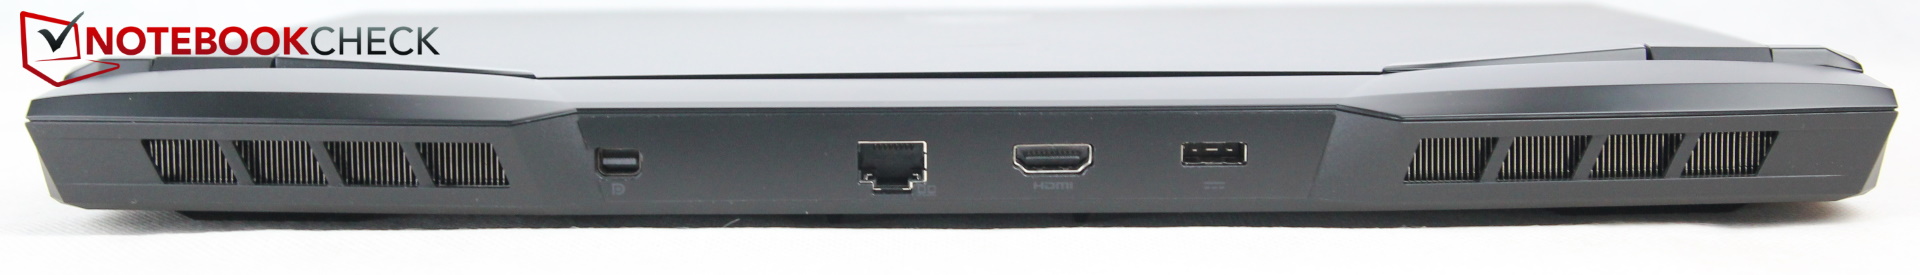
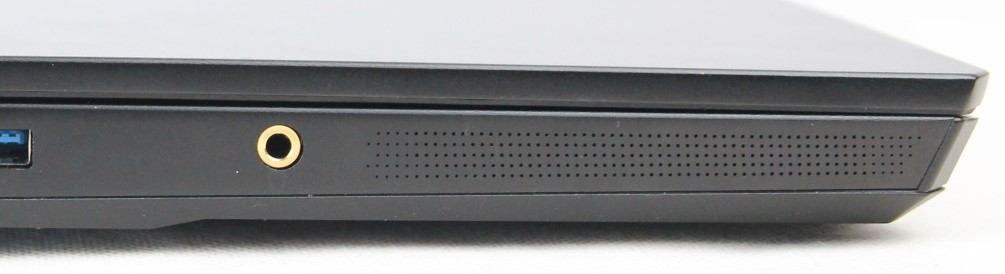
Özellikler – Cidden MSI, USB-C yok mu?
Bir önceki model olan GP66 10UG ile karşılaştırıldığında MSI, MiniDP bağlantı noktasını bir USB-C bağlantı noktası lehine düşürdü. Mevcut GP66 11UH ile MSI bir adım geri atıyor ve hoş bir hareket olan Mini DisplayPort'u geri getiriyor. Ancak üretici, USB-C bağlantı noktasını da ortadan kaldırıyor! Böylece, GP66 Leopard, USB-C bağlantı noktası olmayan tek modern dizüstü bilgisayardır! USB-C bağlantı noktası günümüzde mutlak standart haline geldiğinden, MSI'ın bunu neden yaptığını bilmiyoruz. Bir yan etki olarak, dizüstü bilgisayarda yalnızca üç USB bağlantı noktası vardır. SD okuyucu da yok.
Kalan birkaç bağlantı noktası, kasanın üç tarafında, yani sol, sağ ve arka tarafta iyi bir şekilde dağıtılmıştır. MSI burada gerçekten övülmelidir, çünkü çeşitli bağlantı noktaları arasında çok fazla boşluk vardır, bu da seçeneklerin yetersiz çeşitliliği göz önüne alındığında en azından işleri biraz perspektife sokar. Tüm olası kalın kablolar (HDMI, DP, LAN, güç) arkaya yönlendirilir ve yanlarda yalnızca USB-A ve kulaklık bağlantı noktası vardır - çok iyi.
İletişim
MSI, Intel AX201'i Bluetooth 5.2 destekli Killer Wi-Fi 6E AX1675 ile değiştiriyor. Bu, Wi-Fi'yi çok daha hızlı yapmaz. Gigabit aralığında olmasına rağmen modülün potansiyelinin gerisinde kalıyor. Özellikle alım eğrisi aşağı doğru eğimlidir ancak iletim gücü oldukça sabittir.
| Networking | |
| iperf3 transmit AX12 | |
| Schenker XMG Neo 15 Tiger Lake | |
| Ortalama Intel Killer Wi-Fi 6E AX1675x (210NGW) (1066 - 1499, n=8) | |
| Aorus 15P YD | |
| MSI GP66 Leopard 10UG | |
| MSI GP66 Leopard 11UH-028 | |
| Alienware m15 R6, i7-11800H RTX 3080 | |
| Asus ROG Strix Scar 15 G533QS | |
| iperf3 receive AX12 | |
| Schenker XMG Neo 15 Tiger Lake | |
| Ortalama Intel Killer Wi-Fi 6E AX1675x (210NGW) (1037 - 1469, n=8) | |
| MSI GP66 Leopard 10UG | |
| MSI GP66 Leopard 11UH-028 | |
| Alienware m15 R6, i7-11800H RTX 3080 | |
| Aorus 15P YD | |
| Asus ROG Strix Scar 15 G533QS | |
Web kamerası
Standart bir HD web kamerası, Zoom, Teams ve diğer konferans uygulamalarında en iyi ihtimalle kabul edilebilir görüntü sağlar. Resim iyi ışıkta bile soluk görünüyor ve özellikle kırmızı ve yeşil renk aralıklarında renk sapmaları oldukça belirgin.


Güvenlik
TPM gibi bir Kensington bağlantı noktası da gemide. Ancak, bir oyun dizüstü bilgisayarı için kabul edilebilir olan parmak izi tarayıcısı veya başka bir güvenlik teknolojisi yoktur.
Bakım ve Erişilebilirlik
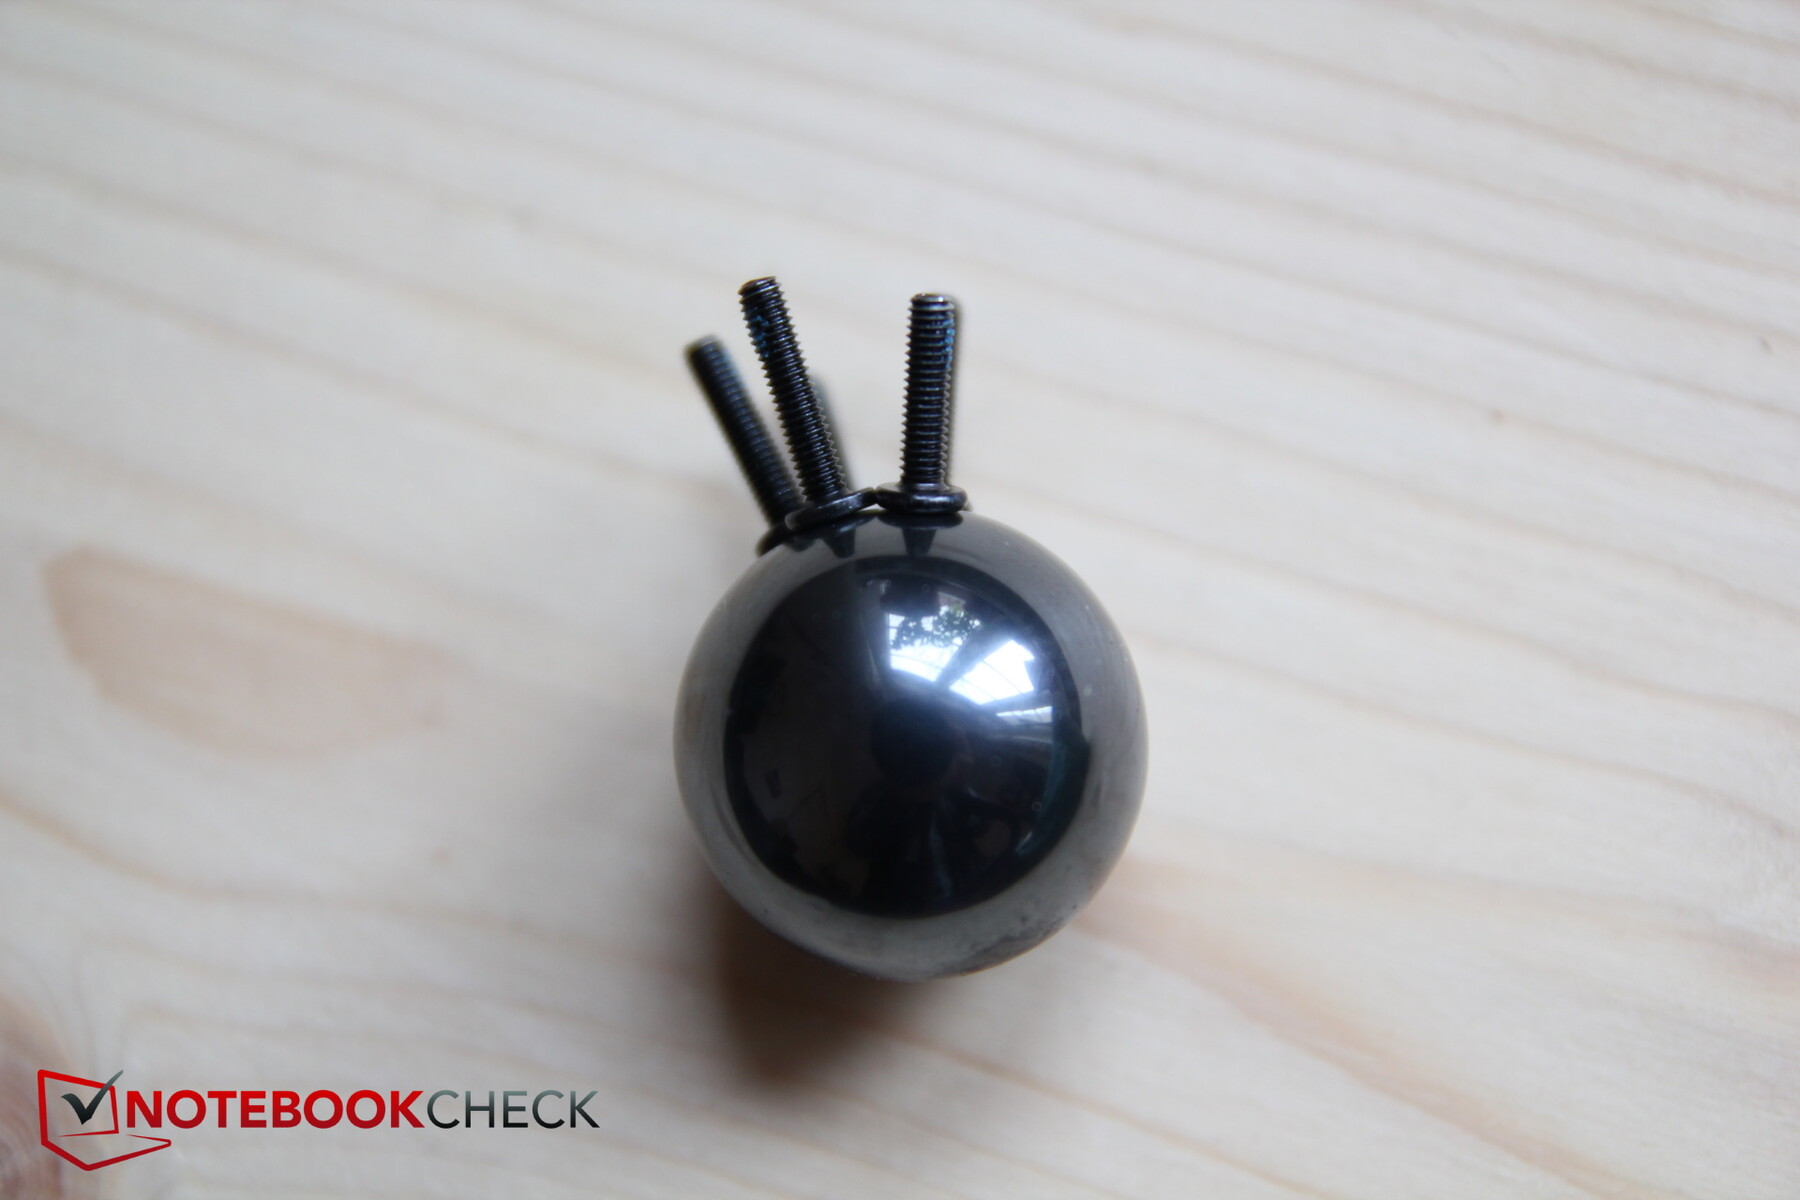
Taban plakası en az 10 Phillips vida (diğerlerinden 1'i daha kısa) ve çeşitli mandallarla sabitlenmiştir. Modelimizin ön kenarı daha önce kısmen ayrılmış olmasına rağmen, bakımın beklenenden daha karmaşık olduğu ortaya çıktı.
Ön kenar iyi çıktı, ancak yanlar ve arka kenar hiç olmadı. Özellikle kulaklık soketi alanında, taban plakası hala o kadar sıkı kilitliydi ki (doğrudan kenarda değil, içeride), ince plastik plakaya zarar verme korkusundan dolayı manivela aletine rağmen açma girişimini iptal etmek zorunda kaldık. Arka kenar da eğilmedi. Gizli vidalar sorun olmamalıydı, en azından yandan.
İç yapı MSI GP66 Leopard 10UG'a benzer olmalıdır (bakım bölümüne bakın), ancak açılması da sorunluydu.
Aksesuarlar ve Garanti
Güç kaynağı dışında kutuda başka bir aksesuar yok. Not: MSI, GP66 Leopard'ı işletim sistemi olmadan gönderir, ancak çeşitli mağazalarda bir Windows lisansı bulunmalıdır.
MSI, teslim alma ve iade hizmeti ile 2 yıl garanti sunar.
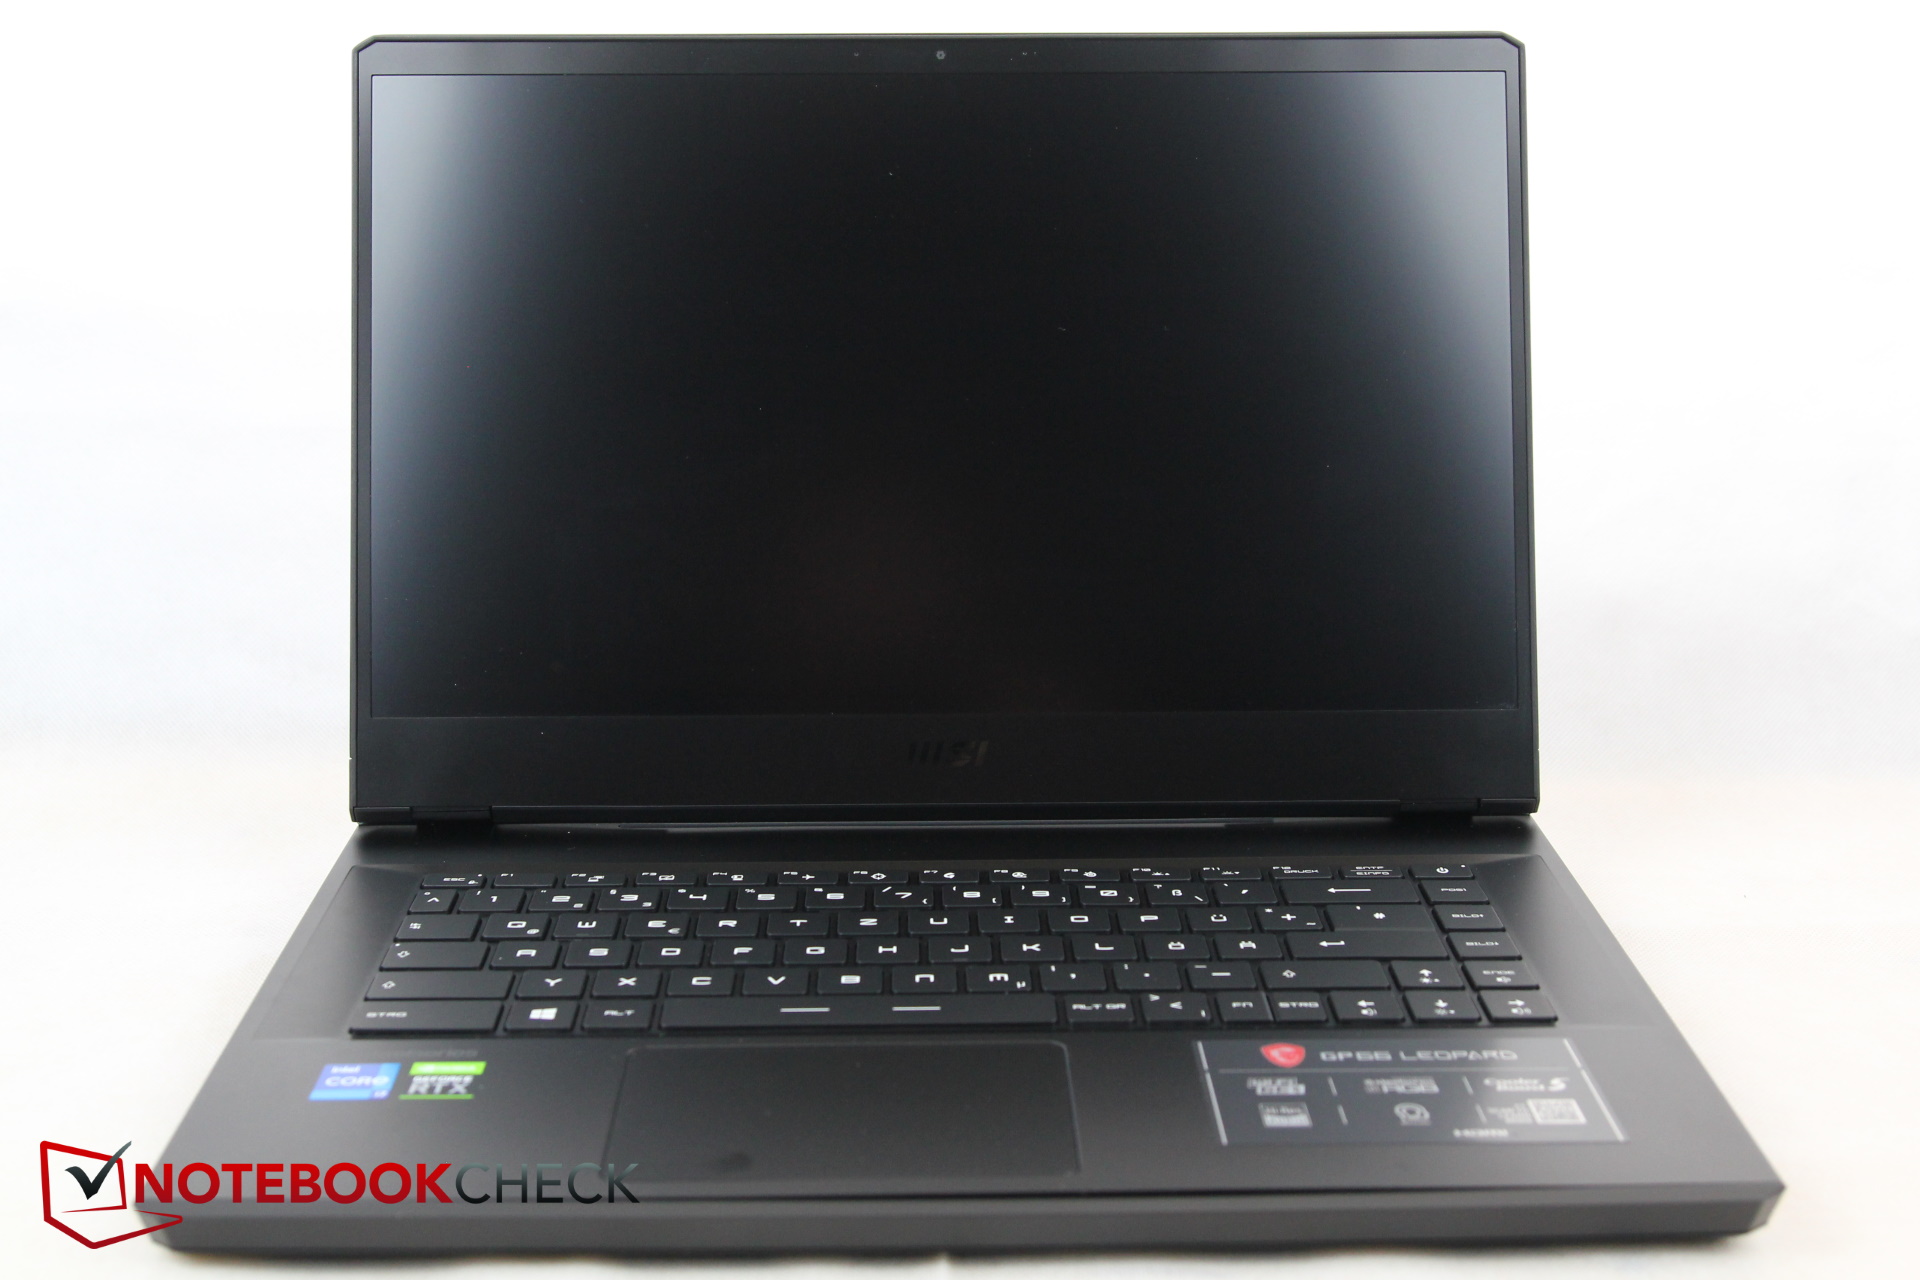
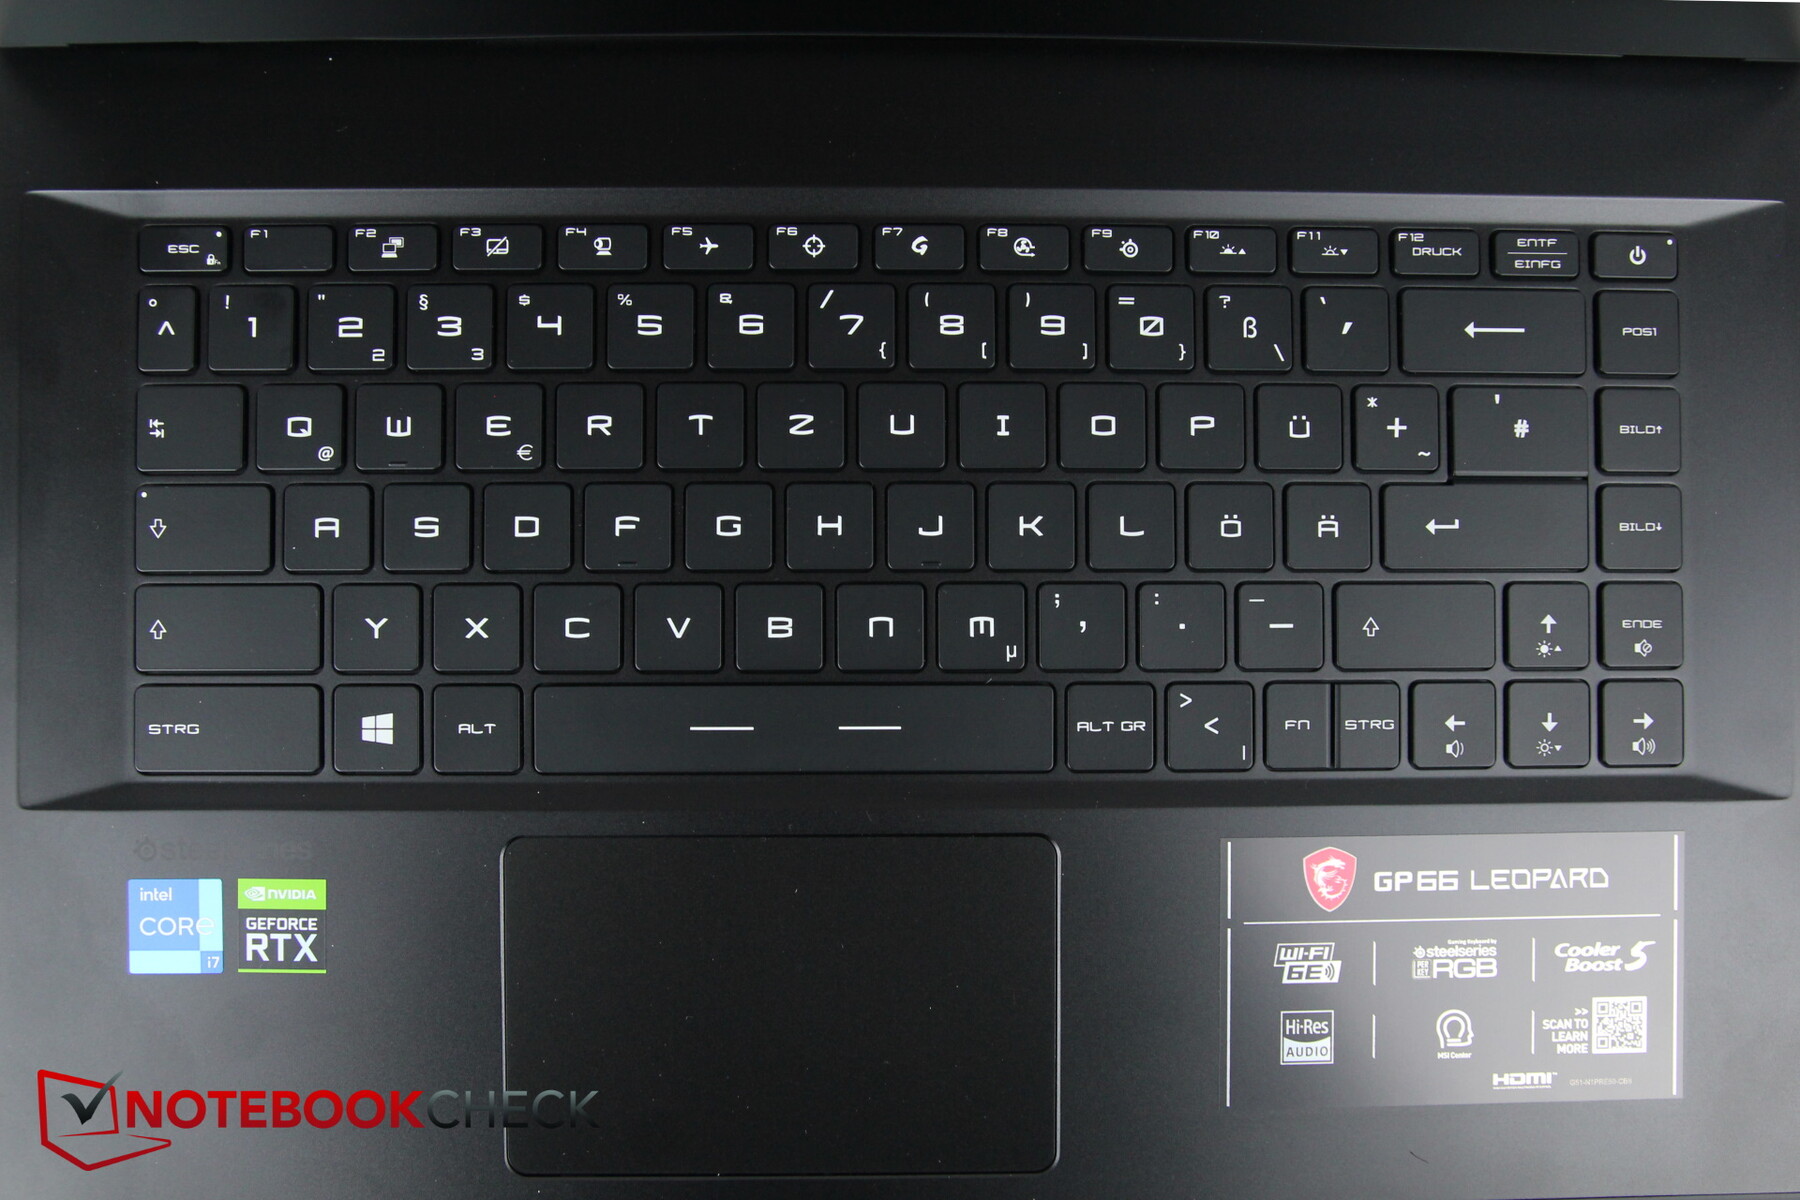
Giriş Birimleri - İyi klavye, dokunmatik yüzey tıkırdıyor
Klavye
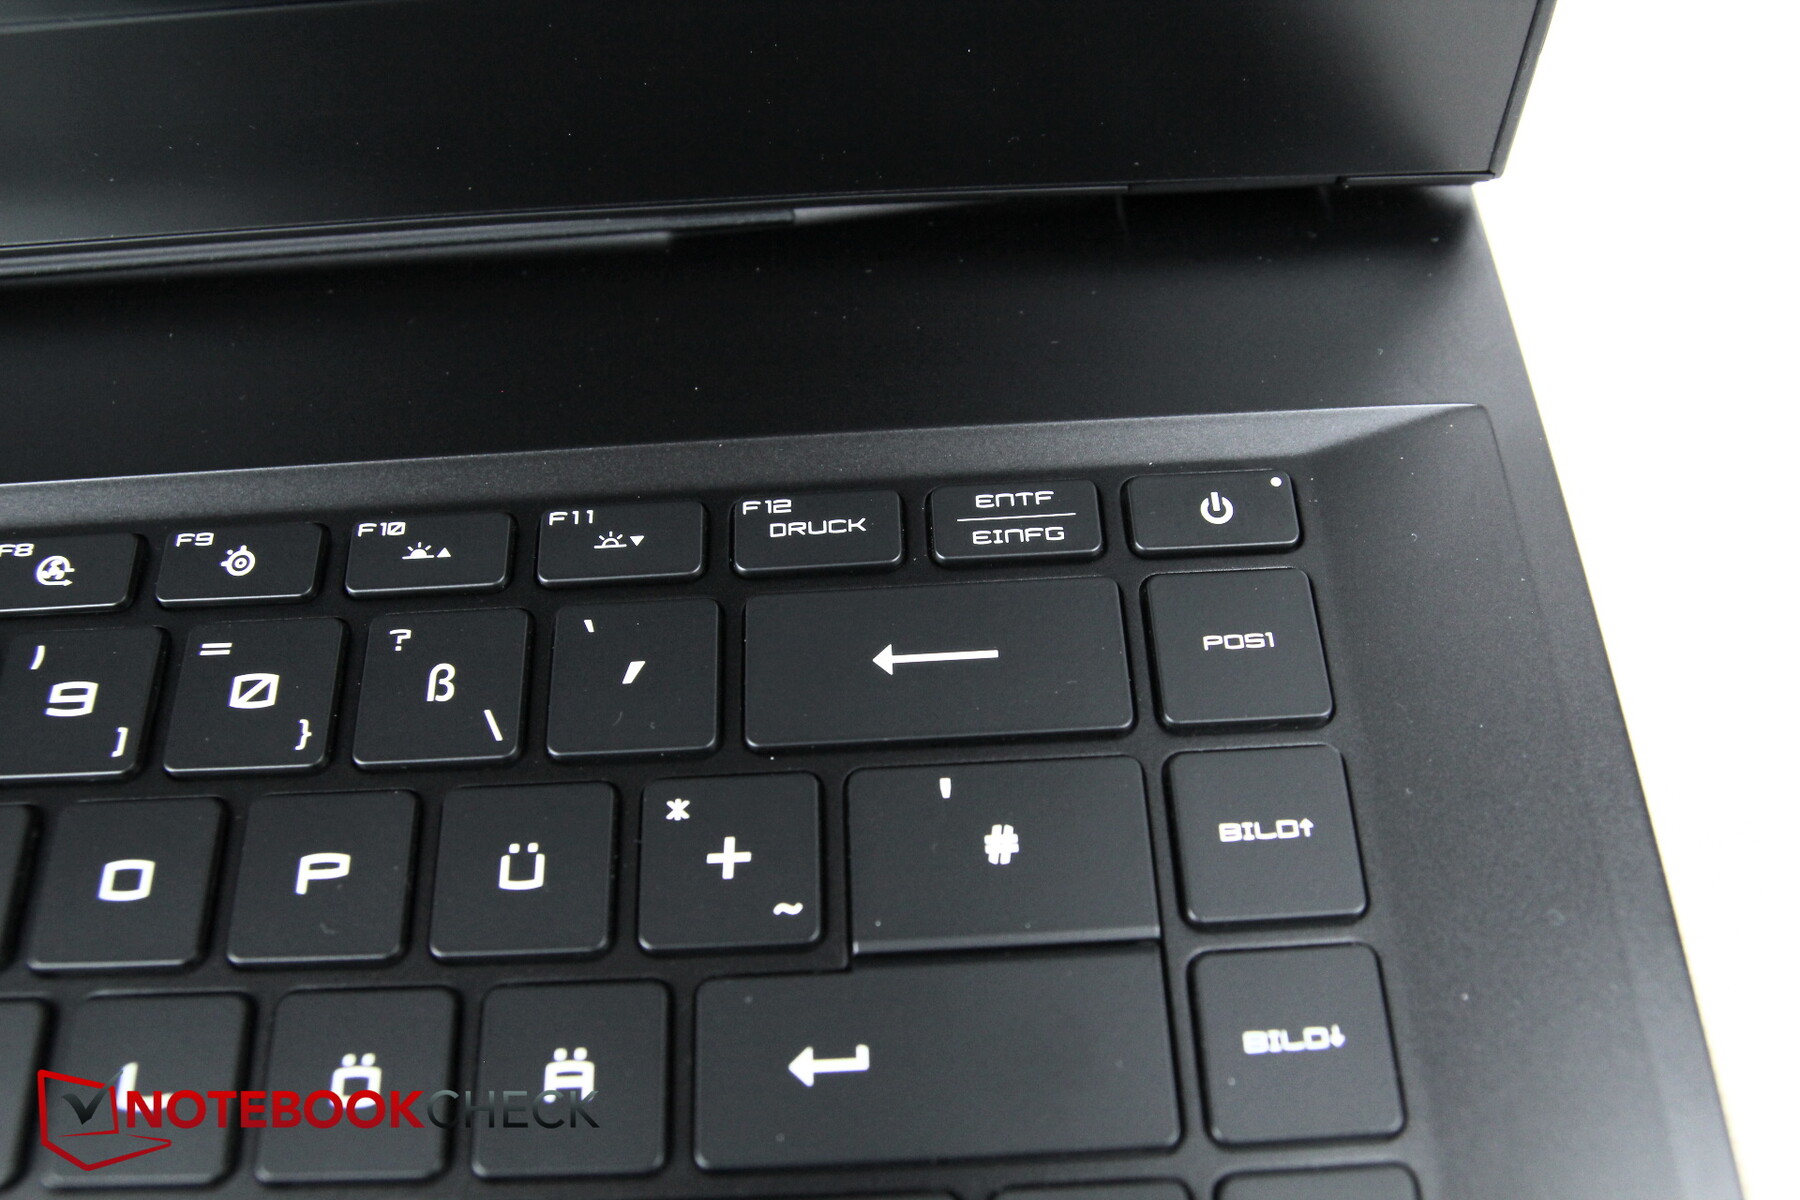
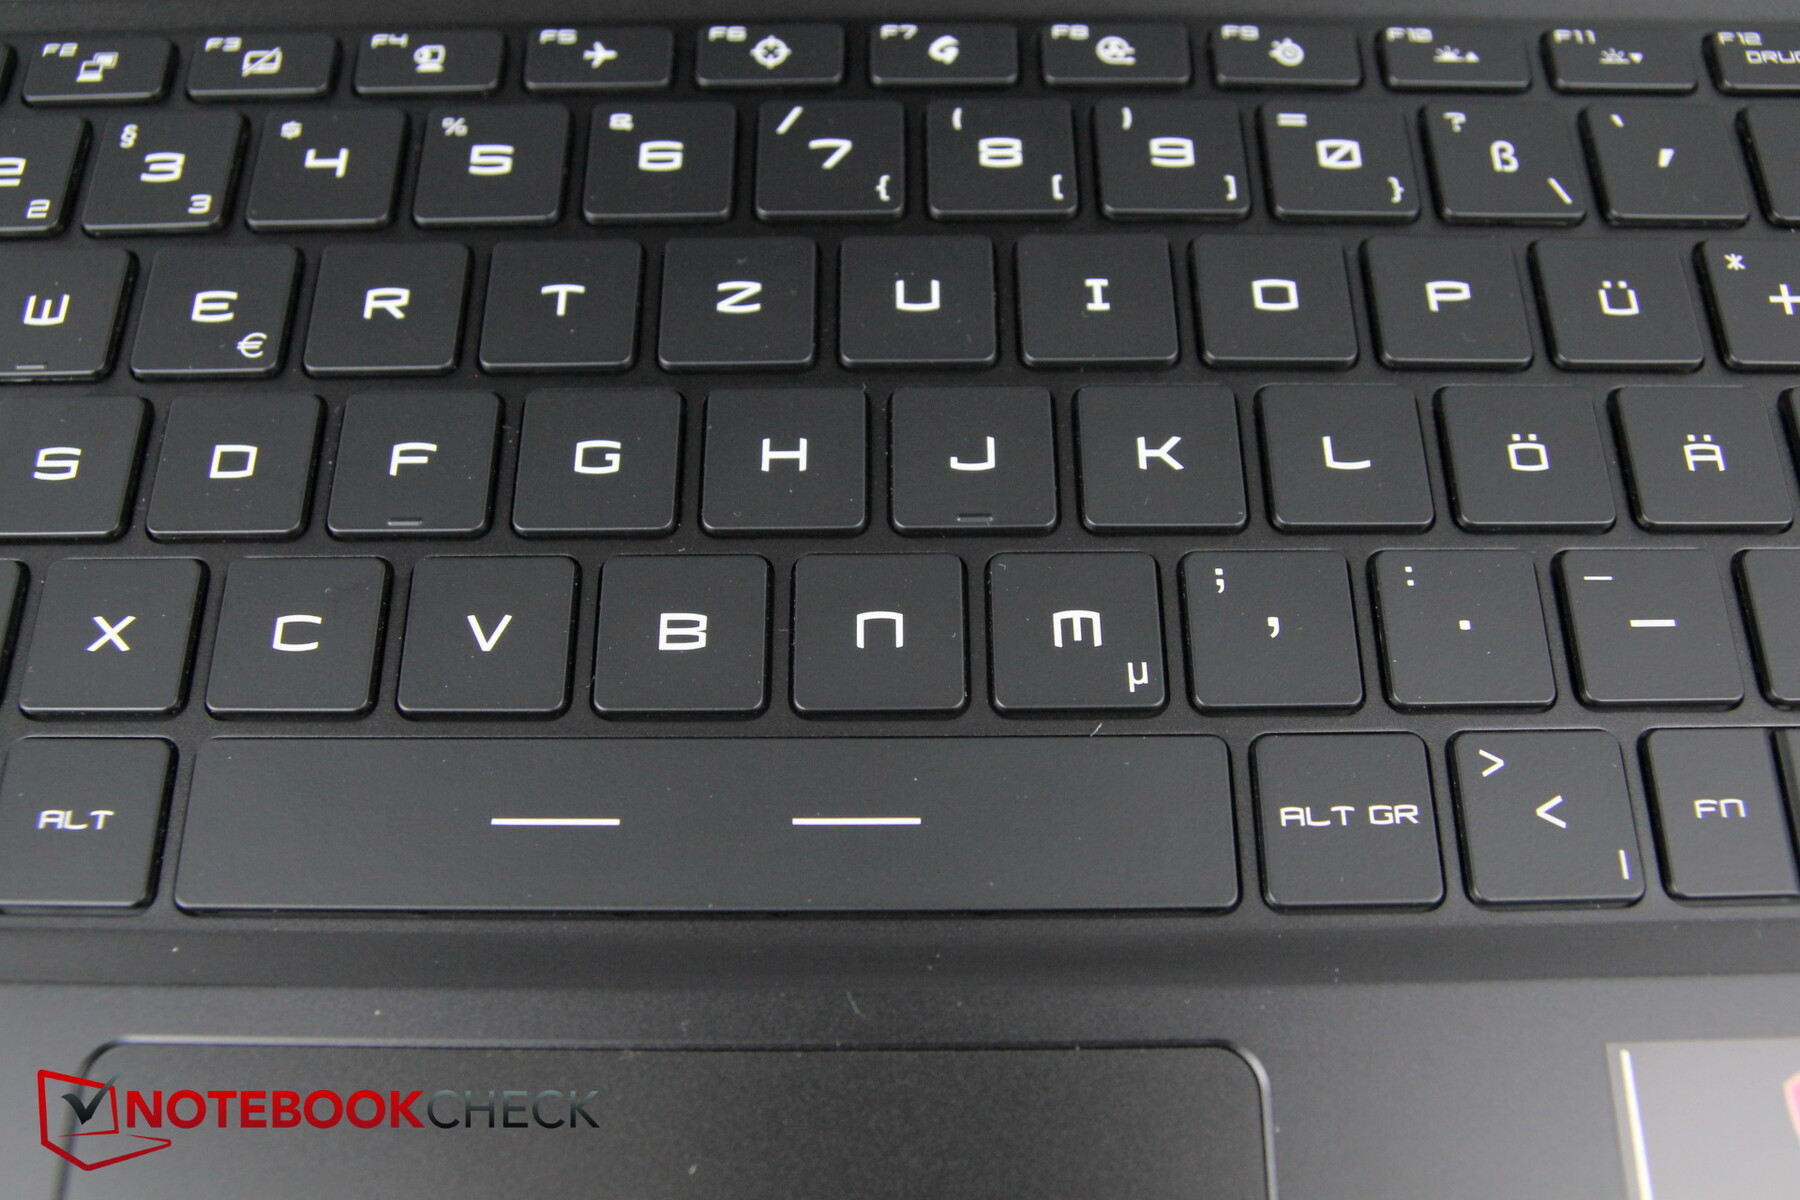
15.6 inç boyutuna rağmen Leopard'ın NumPad'i yok. Öte yandan, bu, tüm tuşların oldukça büyük ve aynı zamanda iyi aralıklı olmasını sağlar. Seçilen yazı tipi biraz sıra dışı olsa bile, harfler büyük ve okunması kolay, bu da oyunculara açıkça hitap etmelidir. Güç tuşu klavyenin bir parçasıdır ve sağ üst köşede bulunur. "insert" ve "pos1" arasındaki yakınlık nedeniyle metin işleme sırasında istemeden tetiklenebilir.
Vuruş oldukça kısa, ancak geri bildirim hala net. Yazma sesi çok ılımlı, yalnızca boşluk çubuğu minimum düzeyde daha yüksek. Genel olarak, GP66'da yazmak eğlenceli ve hızlıdır.
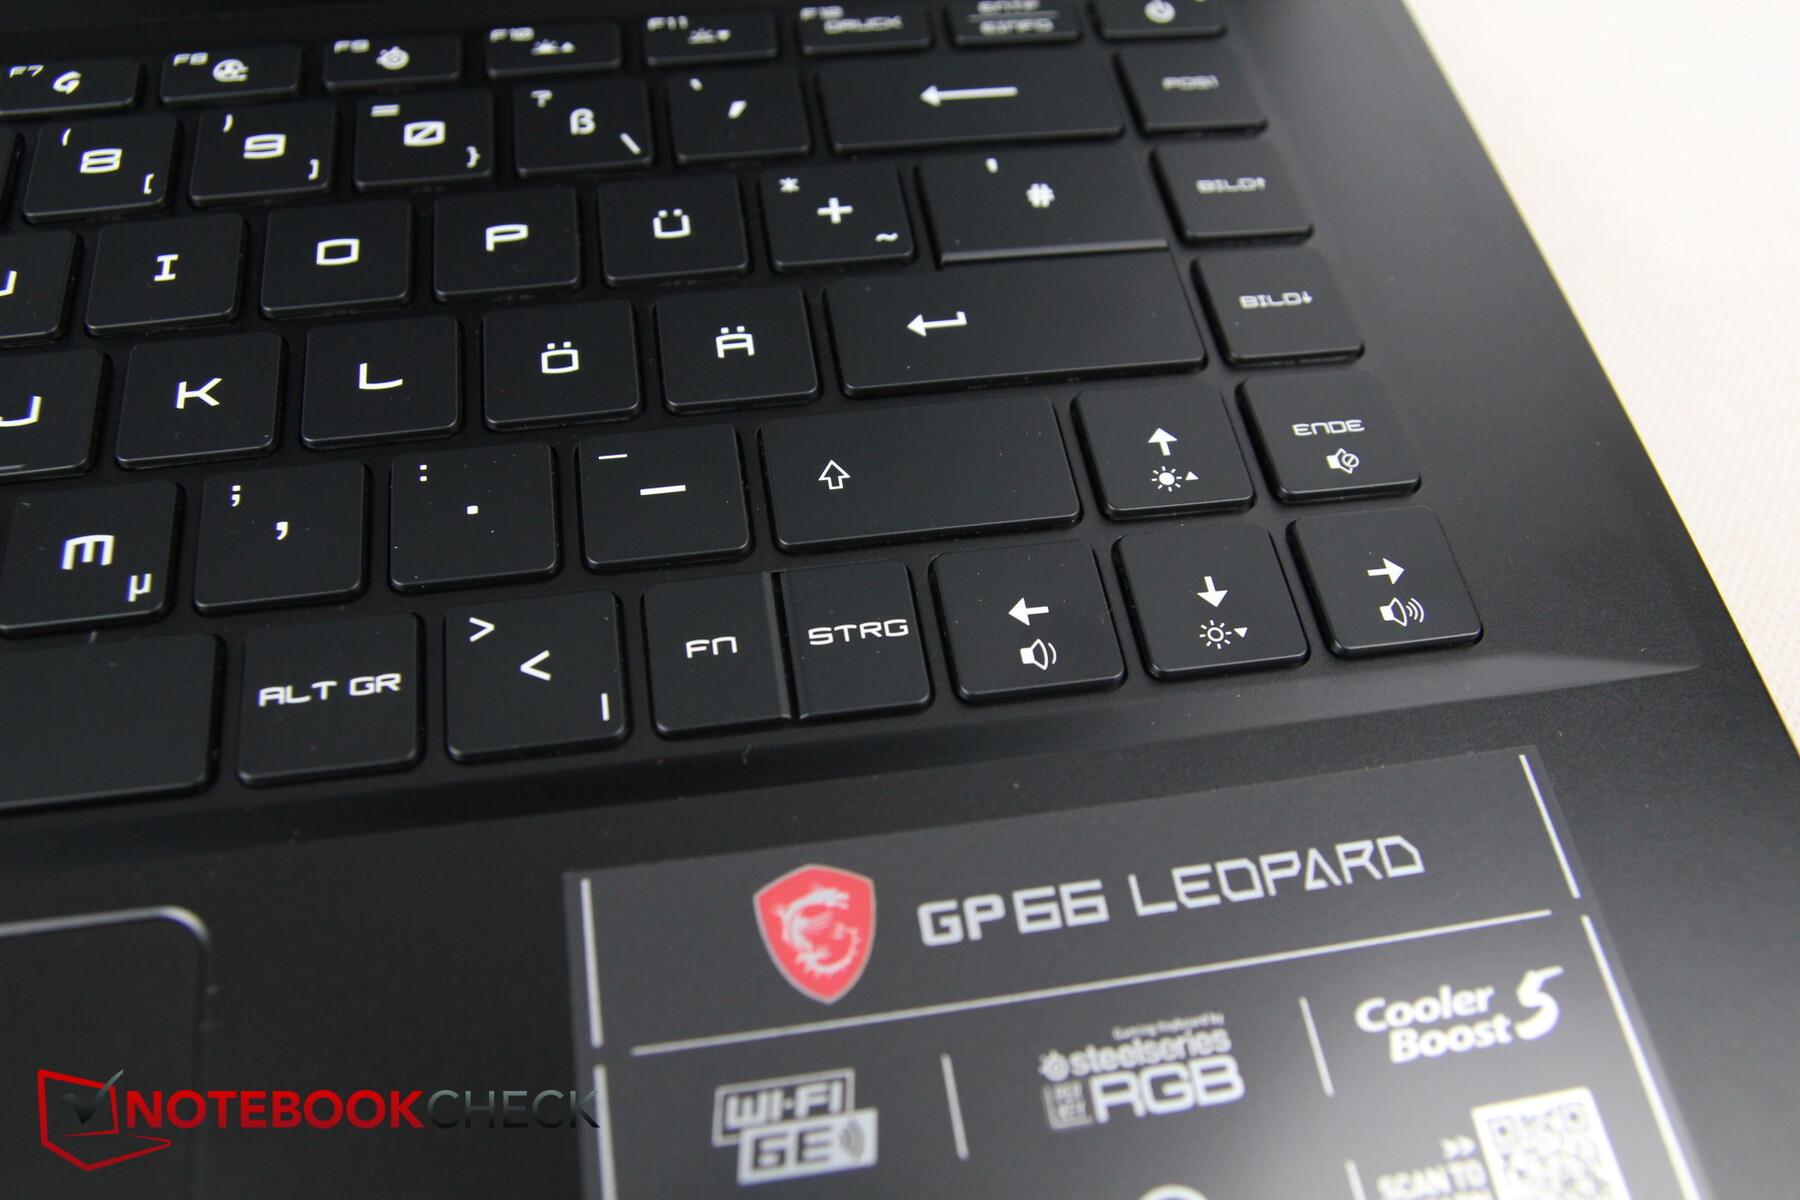
MSI bir şeyi çok alışılmadık bir şekilde çözüyor: o kadar önemli ki "fn" tuşu solda değil sağda ve yerini sağ Ctrl tuşuyla paylaşıyor. Bir yandan, bu, iki kez düşünmeniz gerektiği ve tuş kombinasyonlarının bazen oldukça garip olduğu anlamına gelir, çünkü ya iki elinizi geniş bir şekilde ayrılmış tuş kombinasyonları için kullanamazsınız ya da sol elinizle ikinci tuşa basmanız gerekir. Tuş da çok dardır ve genellikle sağ başparmakla basıldığından özellikle elverişsizdir. En azından MSI Center'da fn tuşunun işlevini Windows tuşuyla da değiştirebilirsiniz.
Bu bağlamda, bir zayıf noktası olan harika bir özellik var: klavyede 3 kademeli arka ışık var. fn tuşuna basıldığında, diğer tüm tuşların aydınlatması geçici olarak kapatılır ve yalnızca F tuşlarının özel işlevleri, yani artık fn tuşunun birleştirilebildiği tuşlar kırmızı renkte yanar. Ancak bu özelliğin bir dezavantajı vardır çünkü arka ışığın aydınlatma seviyesini değiştirirsek bu değişikliğin etkisini hemen görmeyiz çünkü kırmızı renkte yanan özel tuşlar diğer tuşların aksine aydınlatma seviyesini değiştirmez.
Dokunmatik yüzey
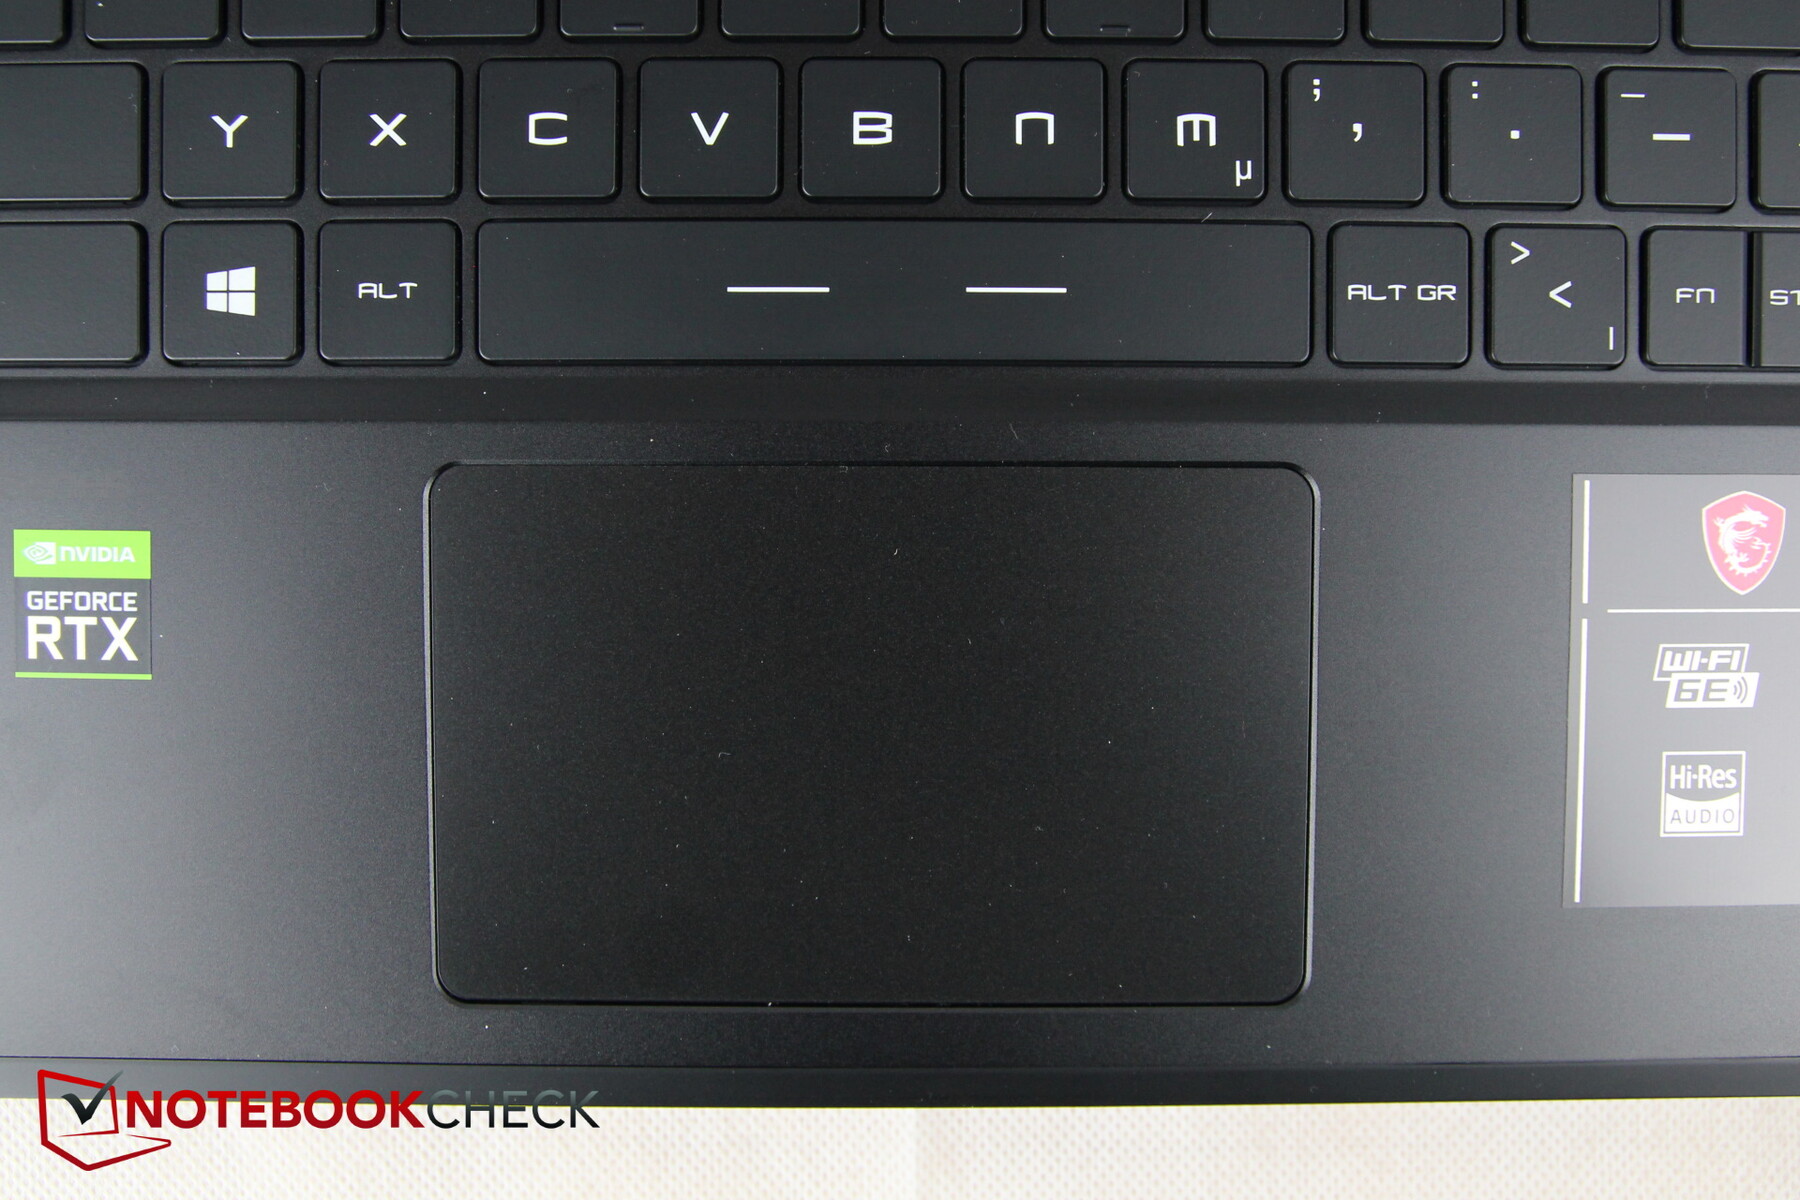
Dokunmatik yüzey yaklaşık 10,5 x 6,5 cm boyutlarındadır ve dahili tıklama düğmelerine sahiptir. Yüzeyin kayma yetenekleri iyidir, ancak yavaş hareketler veya ıslak parmaklar sırasında açıkça bocalıyor. Ped ayrıca alt köşelerde oldukça belirsizdir.
Başta da belirtildiği gibi, test modelimizin dokunmatik yüzeyi, parmağınızla hafifçe dokunduğunuzda tıkırdıyor. Bu, tıklamaları bir parmak dokunuşuyla tetiklemek istediğinizde oldukça can sıkıcı ve aynı zamanda oldukça yüksek.
Entegre tuşların tıklanması oldukça yavaş, özellikle çift tıklamalar gereksiz yere yorucu geliyor, bu da tıkırtı sesinin tekrar ortaya çıktığı bir parmak dokunuşuyla tetiklemeyi tercih edersiniz. Genel olarak, dokunmatik yüzey, klavyenin aksine, en iyi rakamı kesmiyor.
Ekran
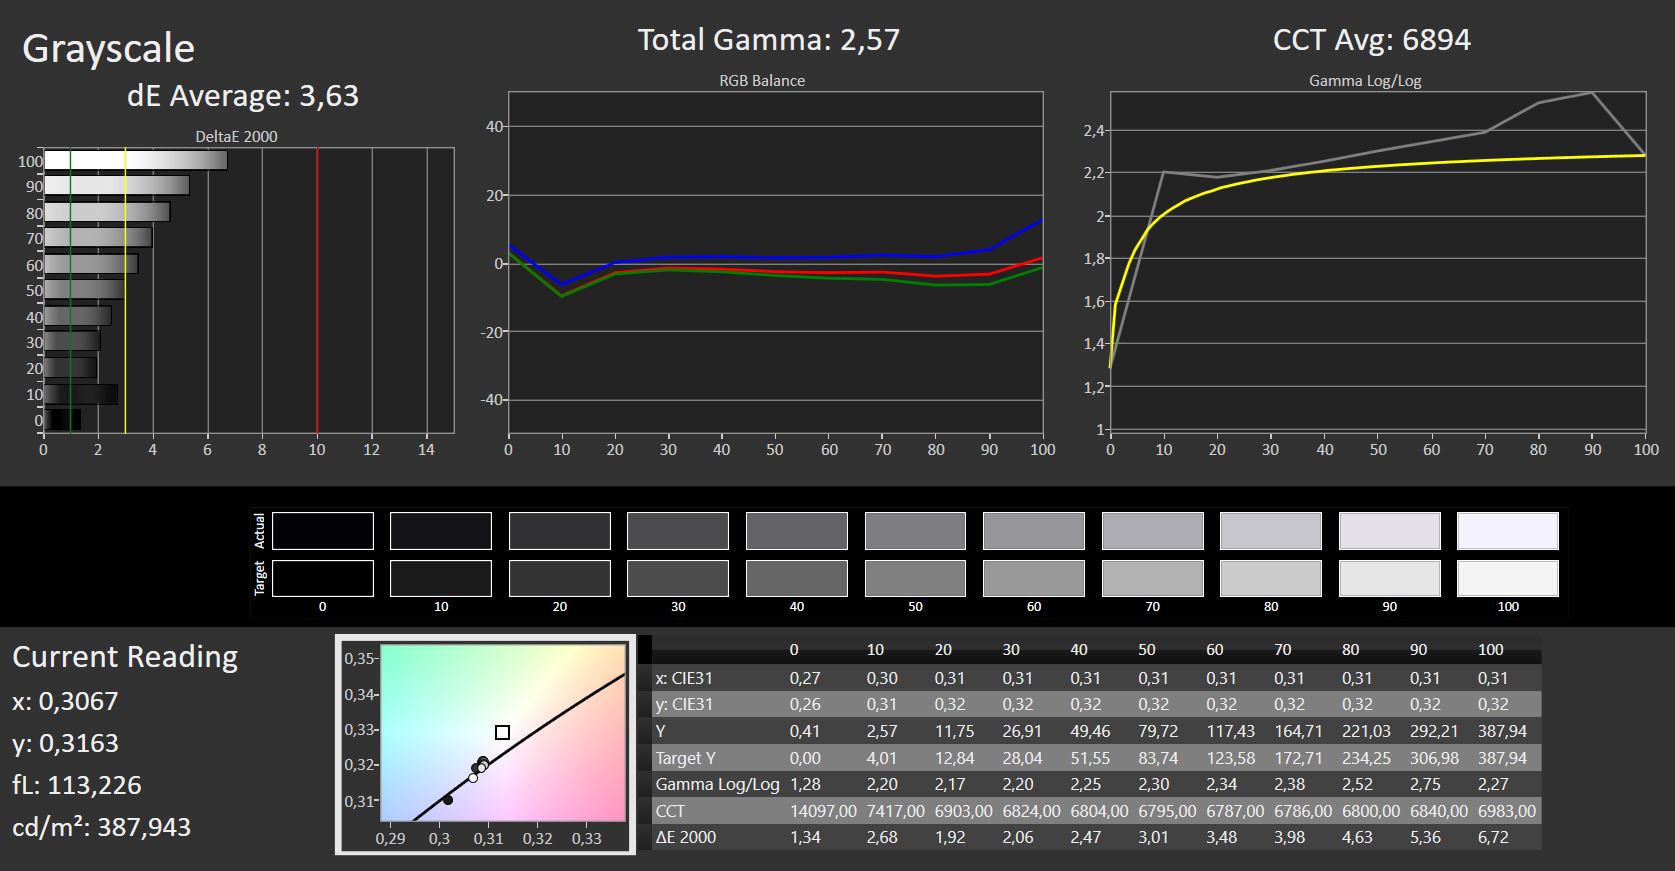
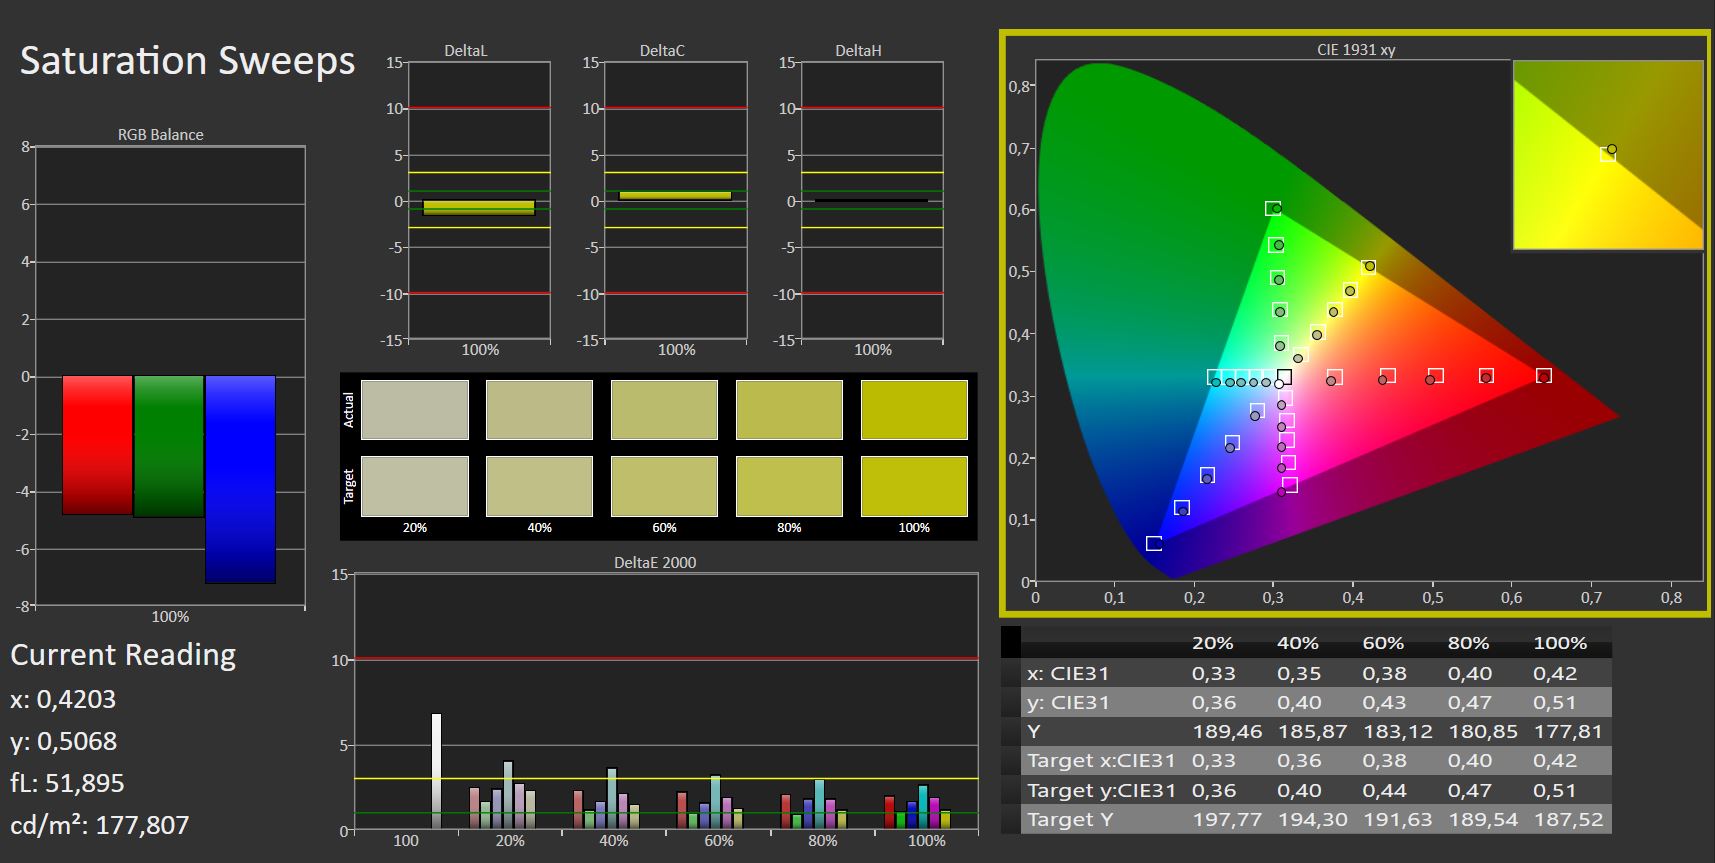
MSI, LG Display'den 144 Hz ile mat bir Full HD IPS paneli kullanır. Schenker XMG Apex 15 NH57E'deki ile aynı paneldir. Yaklaşık 360 nitlik ortalama parlaklığı, karşılaştırmalar arasında en yüksek olanıdır ve yüzde 87'lik dağılımı iyi. Alternatif olarak, GP66 bir QHD panel (2560 x 1440 piksel) ile de mevcuttur.
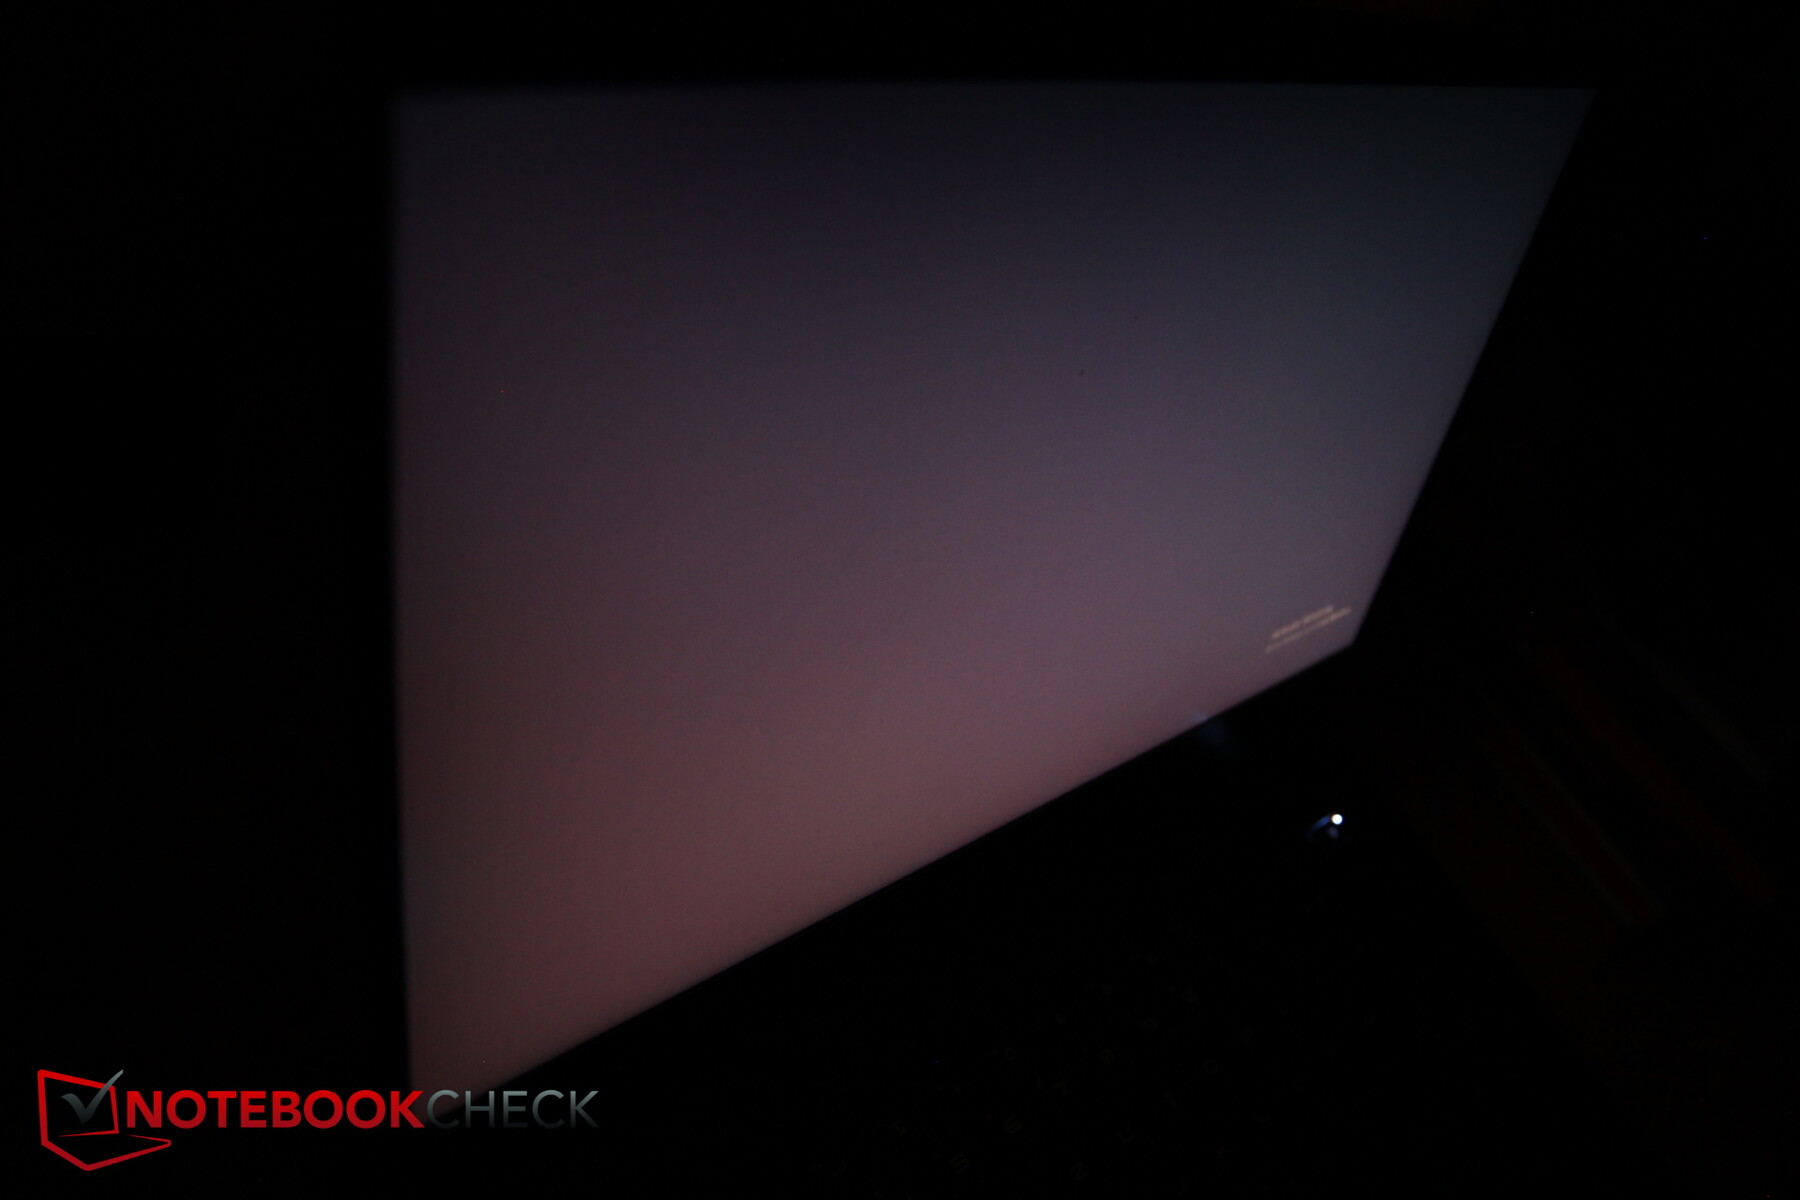
Siyah değeri çok yüksek, bu yüzden kontrast en yüksek oranları üretmiyor, ancak yine de rekabetle karşılaştırılabilir. Burada sadece Schenker XMG Neo açıkça daha iyi. Ekrana siyah bir görüntü ile yandan baktığınızda, güçlü arka plan parıltısını net bir şekilde görebilirsiniz. Siyah değeri, azaltılmış parlaklıkla doğal olarak iyileşir.
Test modelimizde ekran kanaması pek önemli değil, piksel ızgarası mat yüzey nedeniyle biraz grenli. Panelin tepki süreleri normal, PWM kullanılmıyor.
| |||||||||||||||||||||||||
Aydınlatma: 87 %
Batarya modunda parlaklık: 390 cd/m²
Kontrast: 951:1 (Siyah: 0.41 cd/m²)
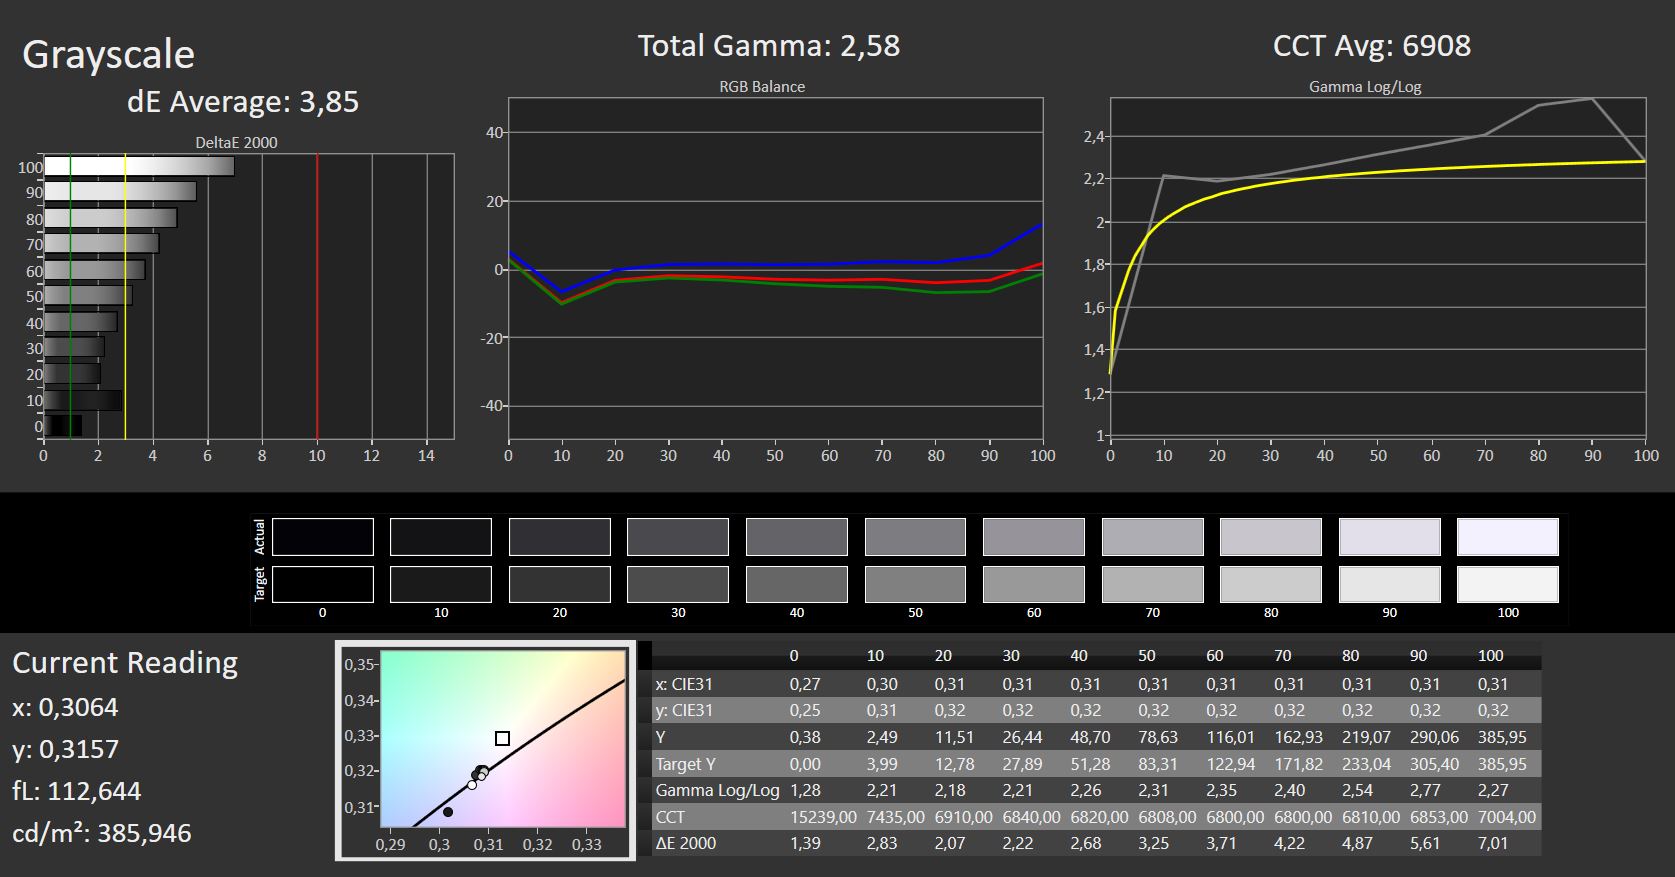
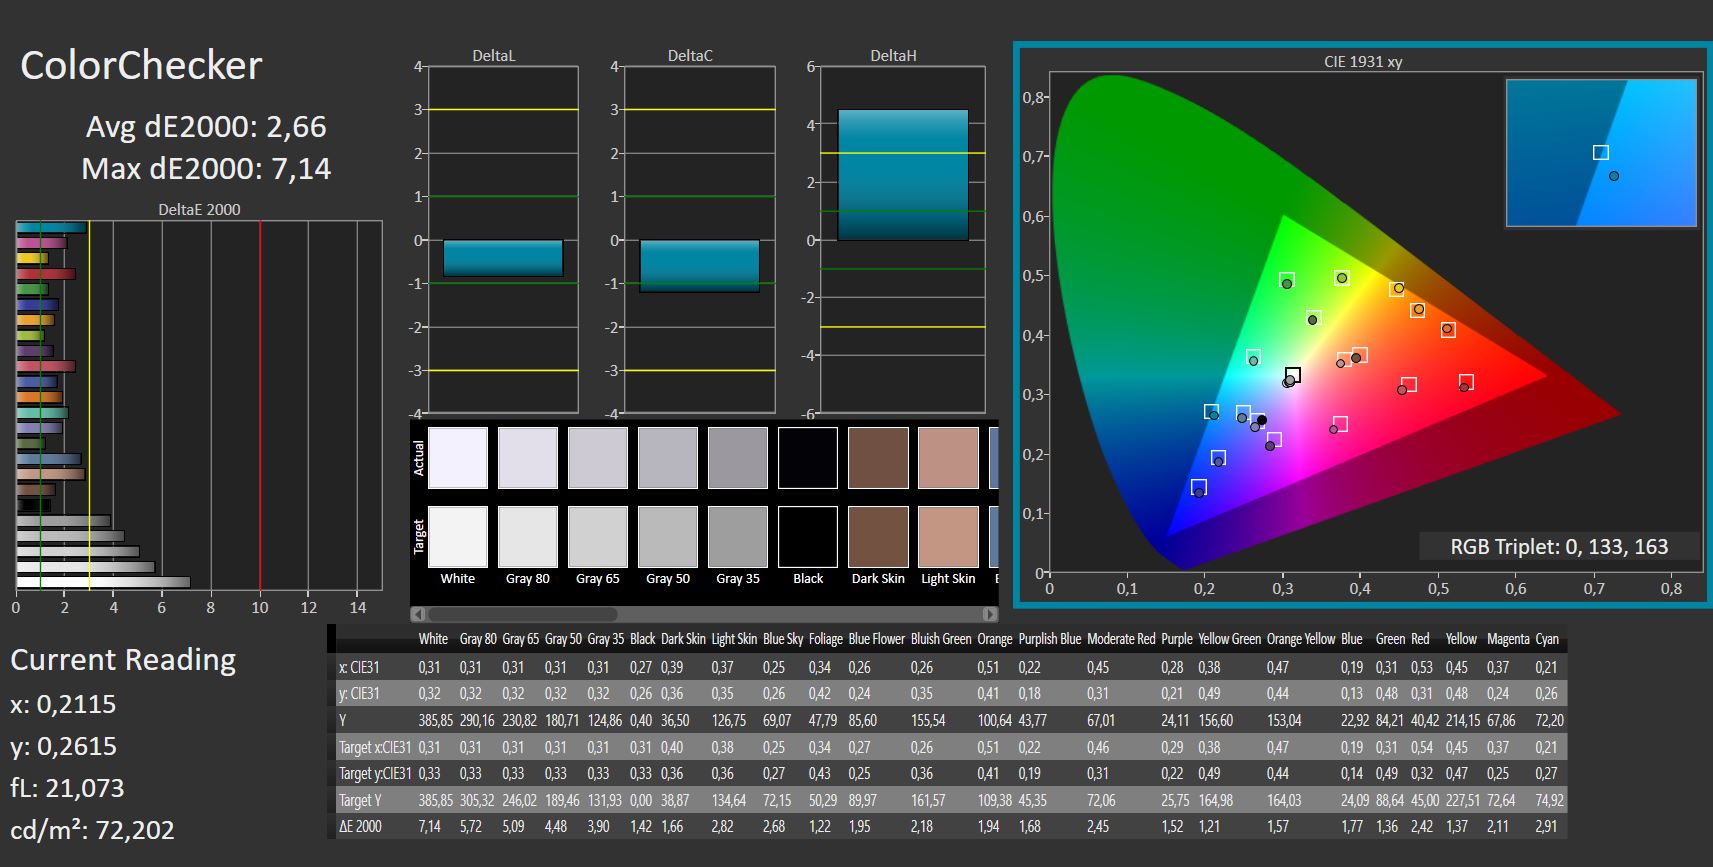
ΔE ColorChecker Calman: 2.66 | ∀{0.5-29.43 Ø4.71}
calibrated: 2.56
ΔE Greyscale Calman: 3.63 | ∀{0.09-98 Ø4.96}
66% AdobeRGB 1998 (Argyll 3D)
95.8% sRGB (Argyll 3D)
65.2% Display P3 (Argyll 3D)
Gamma: 2.57
CCT: 6894 K
| MSI GP66 Leopard 11UH-028 LGD0625 (LP156WFG-SPB3), IPS, 1920x1080, 15.6" | MSI GP66 Leopard 10UG Sharp LQ156M1JW03, IPS, 1920x1080, 15.6" | Aorus 15P YD BOE09B9, IPS, 1920x1080, 15.6" | Asus ROG Strix Scar 15 G533QS BOE CQ NE156QHM-NY1, IPS, 2560x1440, 15.6" | Schenker XMG Neo 15 Tiger Lake BOE CQ NE156QHM-NY2, IPS, 2560x1440, 15.6" | Alienware m15 R6, i7-11800H RTX 3080 AU Optronics AUO9092 (B156HAN), IPS, 1920x1080, 15.6" | |
|---|---|---|---|---|---|---|
| Display | 5% | 7% | 28% | 4% | 11% | |
| Display P3 Coverage (%) | 65.2 | 68.3 5% | 70.2 8% | 97.6 50% | 68.6 5% | 74.1 14% |
| sRGB Coverage (%) | 95.8 | 99.2 4% | 98.5 3% | 99.9 4% | 98.6 3% | 99.5 4% |
| AdobeRGB 1998 Coverage (%) | 66 | 70.4 7% | 72.4 10% | 85.3 29% | 69.3 5% | 75.7 15% |
| Response Times | 7% | 6% | -8% | -13% | 64% | |
| Response Time Grey 50% / Grey 80% * (ms) | 14 ? | 13.6 ? 3% | 14 ? -0% | 14 ? -0% | 16 ? -14% | 2.8 80% |
| Response Time Black / White * (ms) | 10.8 ? | 9.6 ? 11% | 9.6 ? 11% | 12.4 ? -15% | 12 ? -11% | 5.6 48% |
| PWM Frequency (Hz) | 23580 ? | |||||
| Screen | -15% | -7% | -3% | -4% | -1% | |
| Brightness middle (cd/m²) | 390 | 225.9 -42% | 337 -14% | 304.3 -22% | 324 -17% | 359 -8% |
| Brightness (cd/m²) | 362 | 211 -42% | 316 -13% | 286 -21% | 307 -15% | 344 -5% |
| Brightness Distribution (%) | 87 | 83 -5% | 85 -2% | 76 -13% | 91 5% | 85 -2% |
| Black Level * (cd/m²) | 0.41 | 0.23 44% | 0.31 24% | 0.33 20% | 0.27 34% | 0.35 15% |
| Contrast (:1) | 951 | 982 3% | 1087 14% | 922 -3% | 1200 26% | 1026 8% |
| Colorchecker dE 2000 * | 2.66 | 3.98 -50% | 3.87 -45% | 2.76 -4% | 3.36 -26% | 3.3 -24% |
| Colorchecker dE 2000 max. * | 7.14 | 8.95 -25% | 8.09 -13% | 5.57 22% | 9.87 -38% | 4.84 32% |
| Colorchecker dE 2000 calibrated * | 2.56 | 1.15 55% | 1.15 55% | 2.38 7% | 1.23 52% | 3.28 -28% |
| Greyscale dE 2000 * | 3.63 | 6.4 -76% | 6.1 -68% | 4 -10% | 5.8 -60% | 3.66 -1% |
| Gamma | 2.57 86% | 2.25 98% | 2.132 103% | 2.14 103% | 2.311 95% | 2.43 91% |
| CCT | 6894 94% | 6991 93% | 6891 94% | 6844 95% | 7087 92% | 5896 110% |
| Color Space (Percent of AdobeRGB 1998) (%) | 64.5 | 72 | 69 | |||
| Color Space (Percent of sRGB) (%) | 99.3 | 94 | 93 | |||
| Toplam Ortalama (Program / Ayarlar) | -1% /
-8% | 2% /
-2% | 6% /
3% | -4% /
-4% | 25% /
11% |
* ... daha küçük daha iyidir
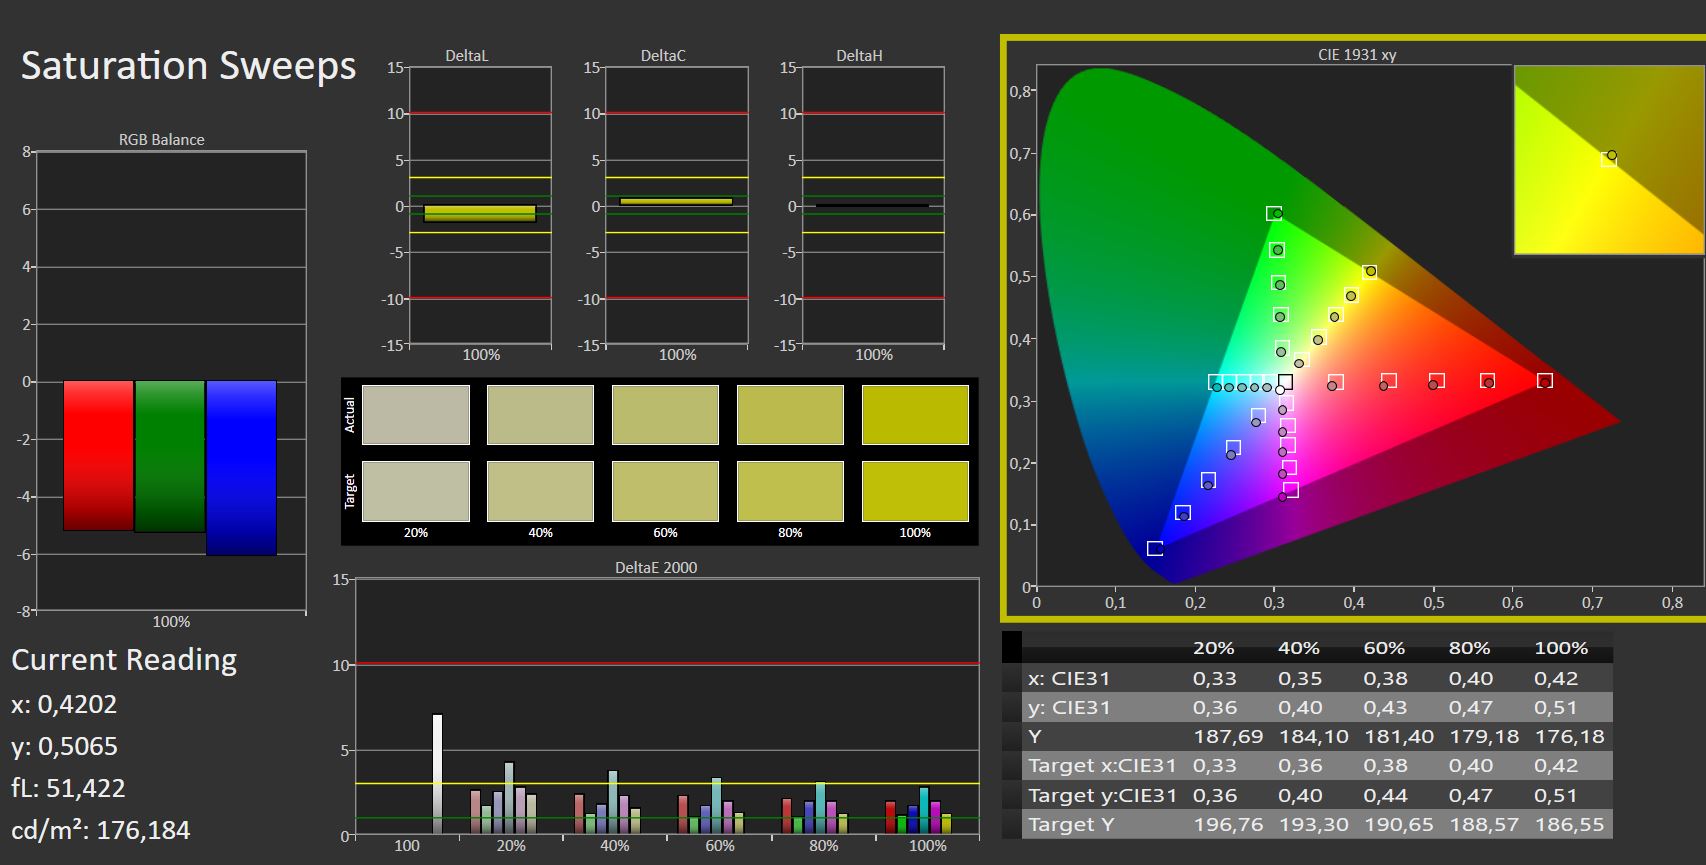
Rekabet, renk alanı kapsamı açısından sadece biraz daha iyidir. AdobeRGB'yi neredeyse tamamen kapsadığı için burada yalnızca Asus ROG açıkça öndedir, oysa MSI'ımız bunun yalnızca %66'sını kapsıyor. Bu nedenle, görüntü düzenleme için Asus tercih edilir.
Ekran fabrika çıkışında iyi yapılandırılmıştır ve manuel kalibrasyon onu pek iyileştirmez.

Yanıt Sürelerini Görüntüle
| ↔ Tepki Süresi Siyahtan Beyaza | ||
|---|---|---|
| 10.8 ms ... yükseliş ↗ ve sonbahar↘ birleşimi | ↗ 6.2 ms yükseliş | 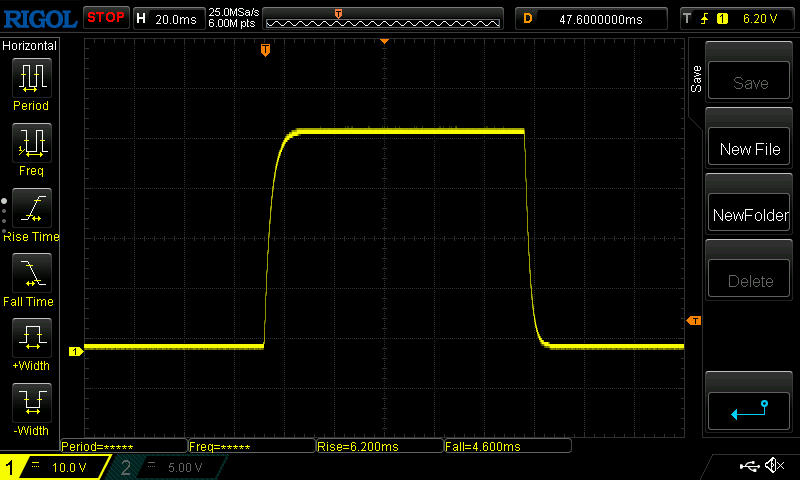 |
| ↘ 4.6 ms sonbahar | ||
| Ekran, testlerimizde iyi yanıt oranları gösteriyor ancak rekabetçi oyuncular için çok yavaş olabilir. Karşılaştırıldığında, test edilen tüm cihazlar 0.1 (minimum) ile 240 (maksimum) ms arasında değişir. » Tüm cihazların 29 %'si daha iyi. Bu, ölçülen yanıt süresinin test edilen tüm cihazların ortalamasından (19.8 ms) daha iyi olduğu anlamına gelir. | ||
| ↔ Tepki Süresi %50 Griden %80 Griye | ||
| 14 ms ... yükseliş ↗ ve sonbahar↘ birleşimi | ↗ 7 ms yükseliş | 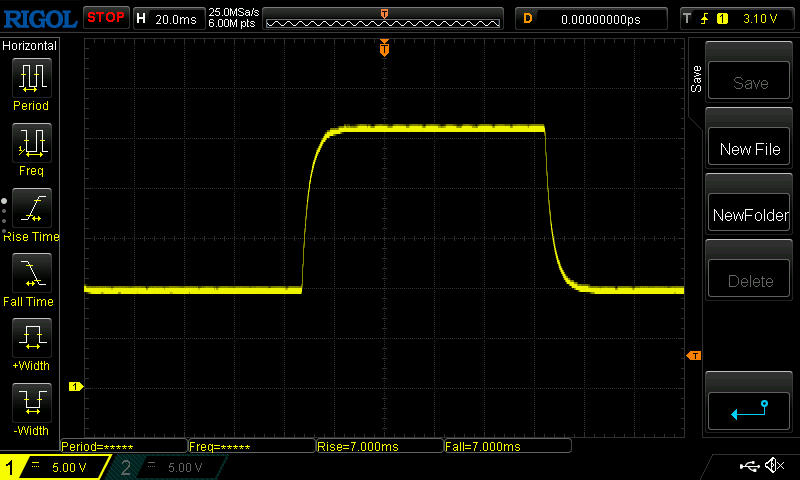 |
| ↘ 7 ms sonbahar | ||
| Ekran, testlerimizde iyi yanıt oranları gösteriyor ancak rekabetçi oyuncular için çok yavaş olabilir. Karşılaştırıldığında, test edilen tüm cihazlar 0.165 (minimum) ile 636 (maksimum) ms arasında değişir. » Tüm cihazların 28 %'si daha iyi. Bu, ölçülen yanıt süresinin test edilen tüm cihazların ortalamasından (31 ms) daha iyi olduğu anlamına gelir. | ||
Ekran Titremesi / PWM (Darbe Genişliği Modülasyonu)
| Ekran titriyor / PWM algılanmadı |  | ||
Karşılaştırıldığında: Test edilen tüm cihazların %52 %'si ekranı karartmak için PWM kullanmıyor. PWM tespit edilirse, ortalama 7754 (minimum: 5 - maksimum: 343500) Hz ölçüldü. | |||
İyi parlaklık ve mat yüzey sayesinde, dış mekanda görünürlük iyidir - en azından gölgede ve doğrudan üstten görünümde. Doğrudan güneş ışığından ve eğik görüş açılarından kaçınılmalıdır.
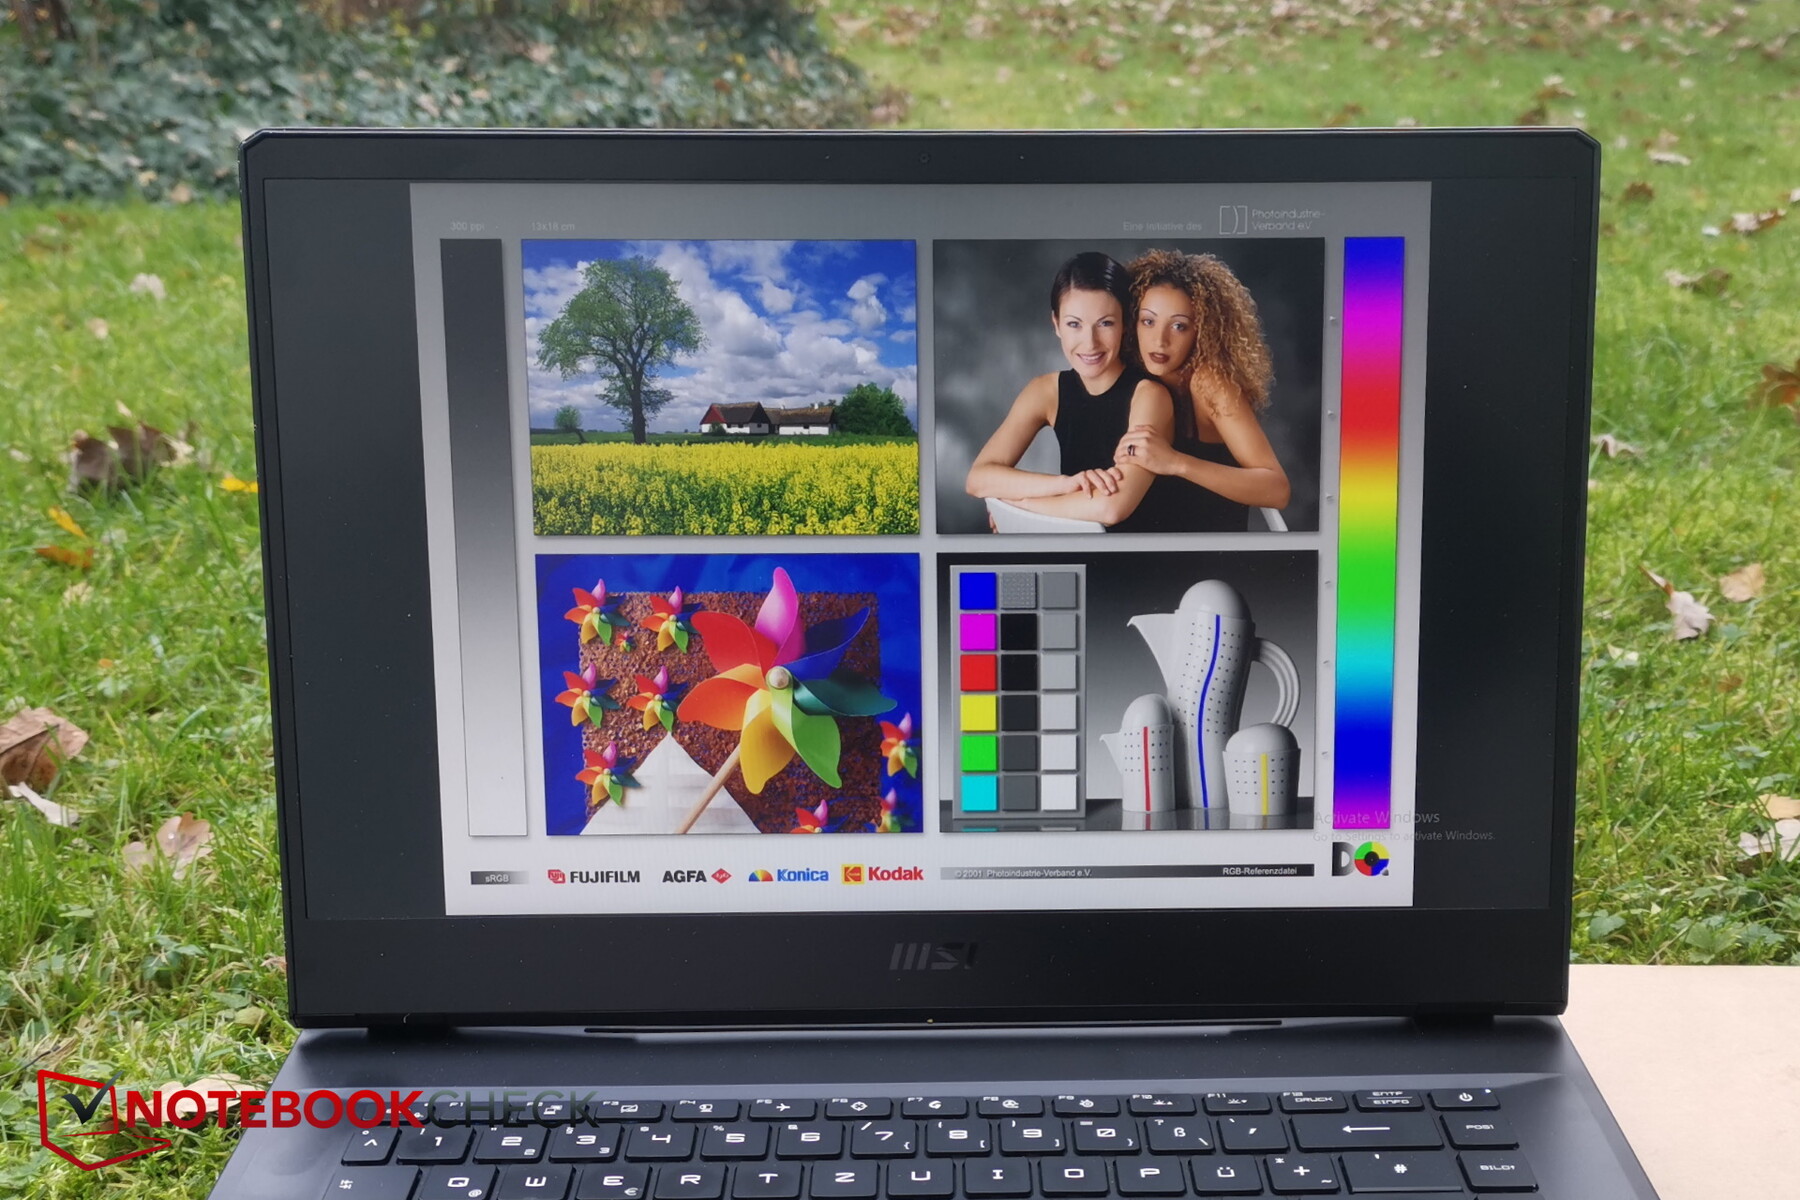
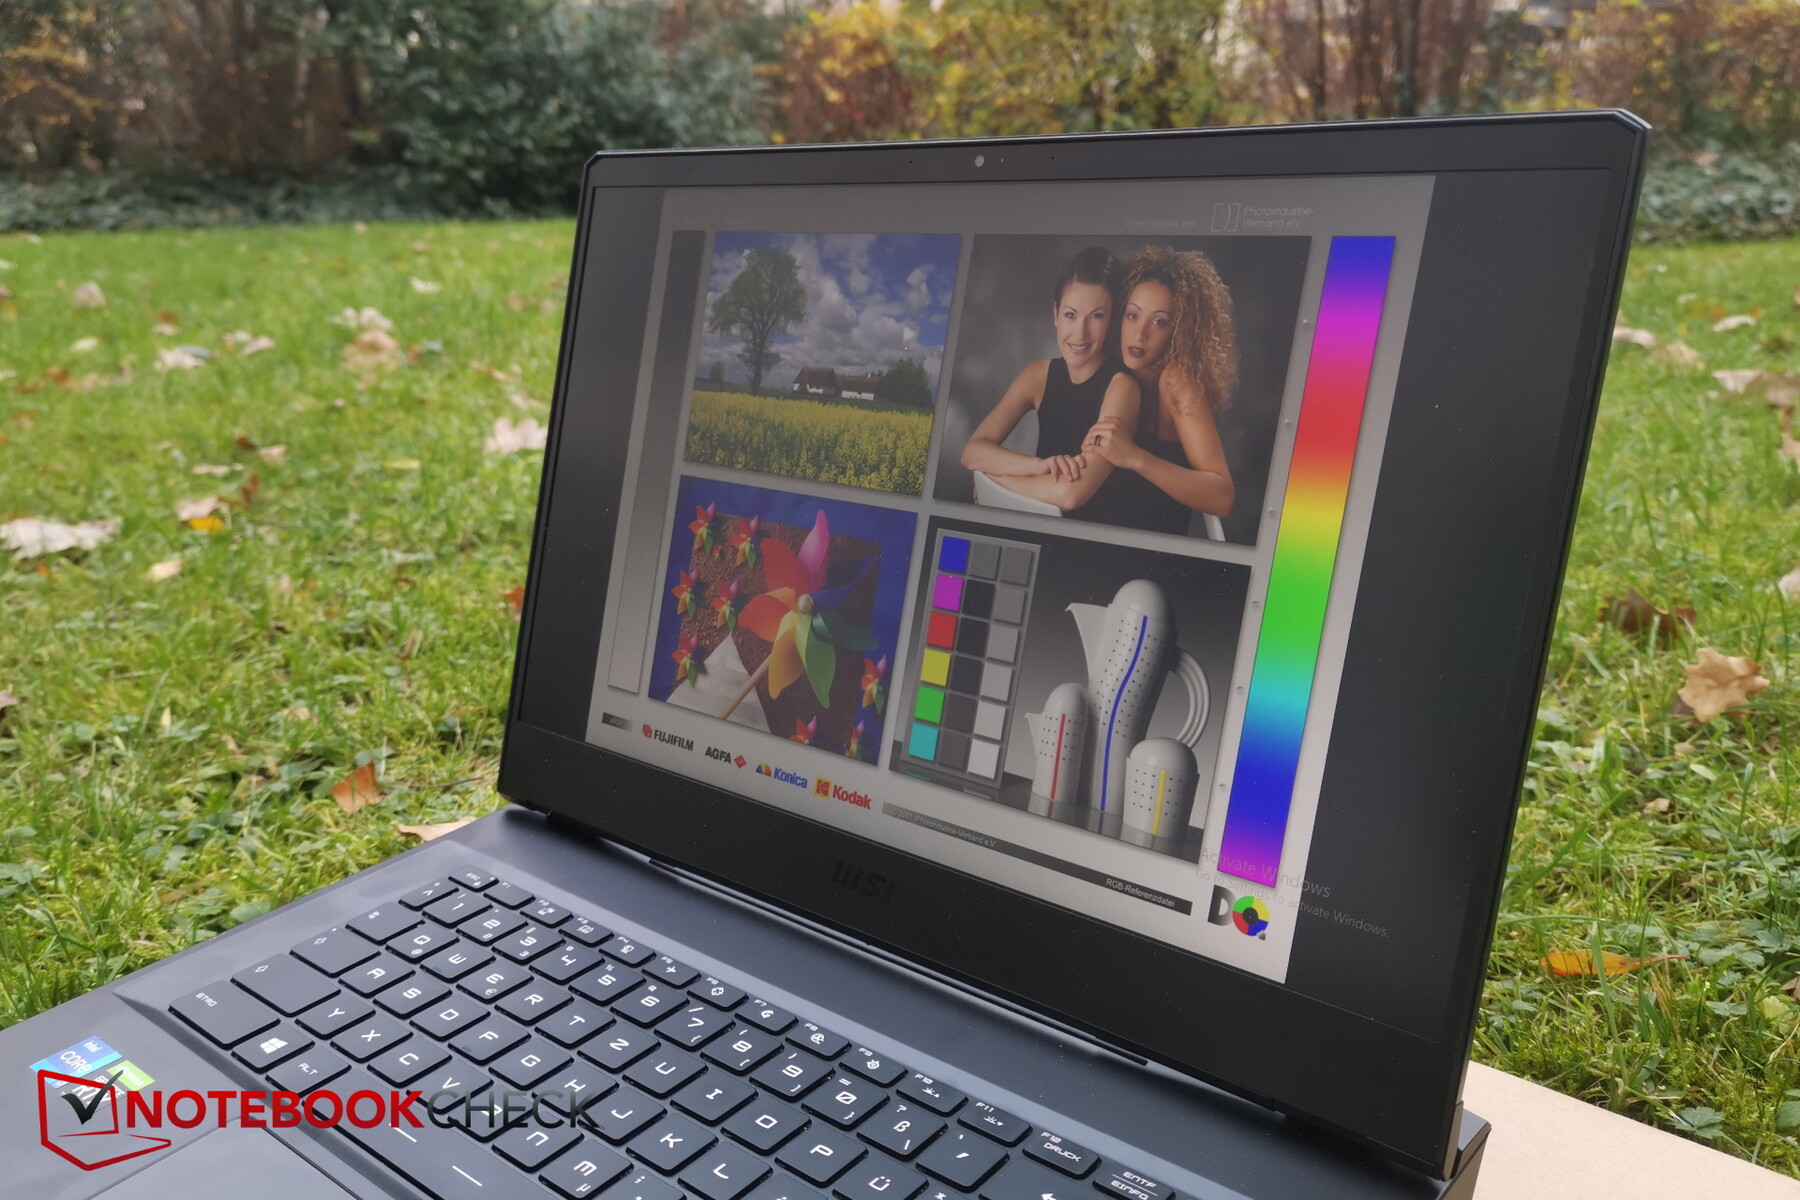
Aşırı açılardan bakıldığında, özellikle bir miktar parlaklık kaybolur, ancak IPS için tipik olduğu kadar çok azdır ve içerik yine de iyi bir şekilde tanınabilir.

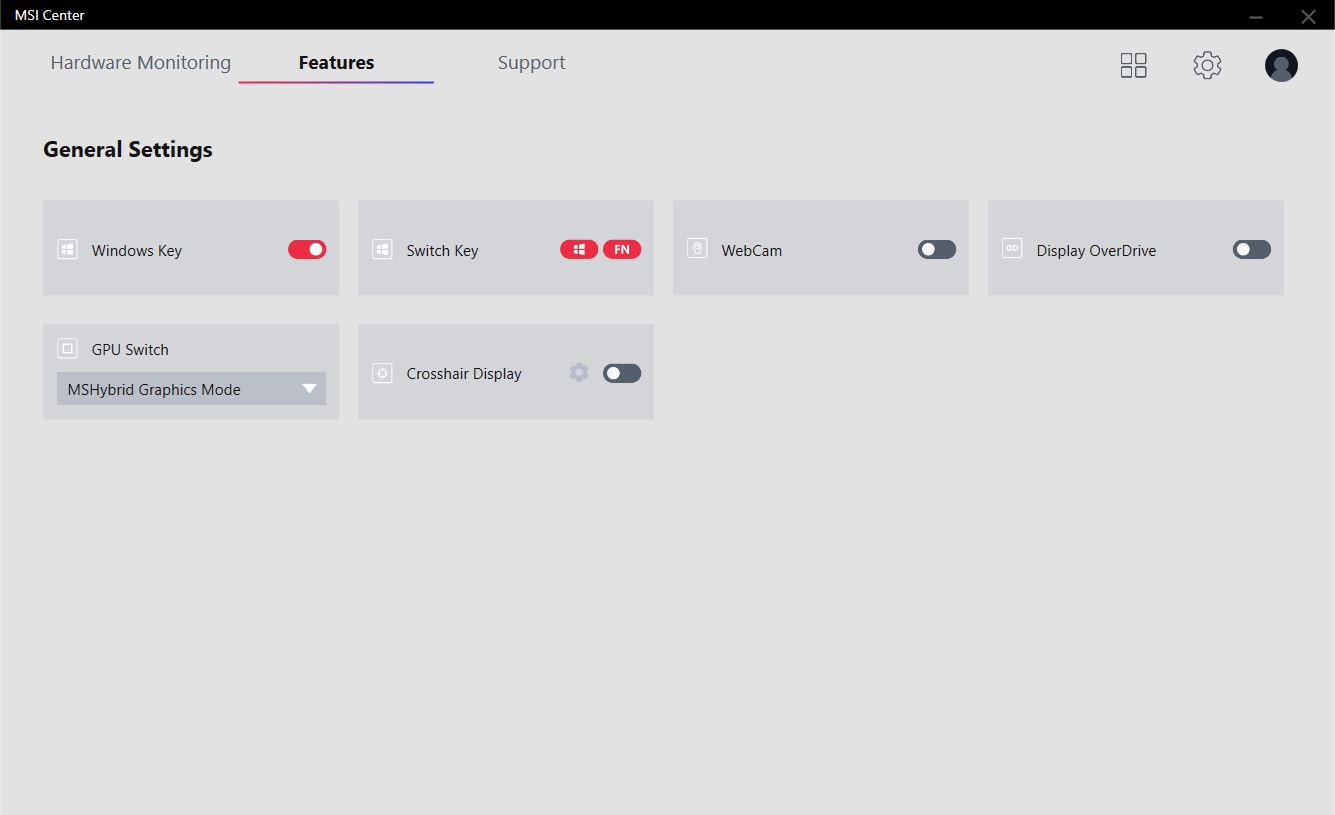
Performans - MSI Center'dan sadece İşlemci yararlanıyor
MSI'ın Leopard'ı, RTX 3080 tarafından belirtilen bir oyun dizüstü bilgisayarıdır. Teorik olarak, dizüstü bilgisayarın mevcut tüm oyunları doğal çözünürlükte sorunsuz bir şekilde oluşturabilmesi ve ayrıca 4K çözünürlükler için yeterli rezerve sahip olması gerekir.

Test koşulları
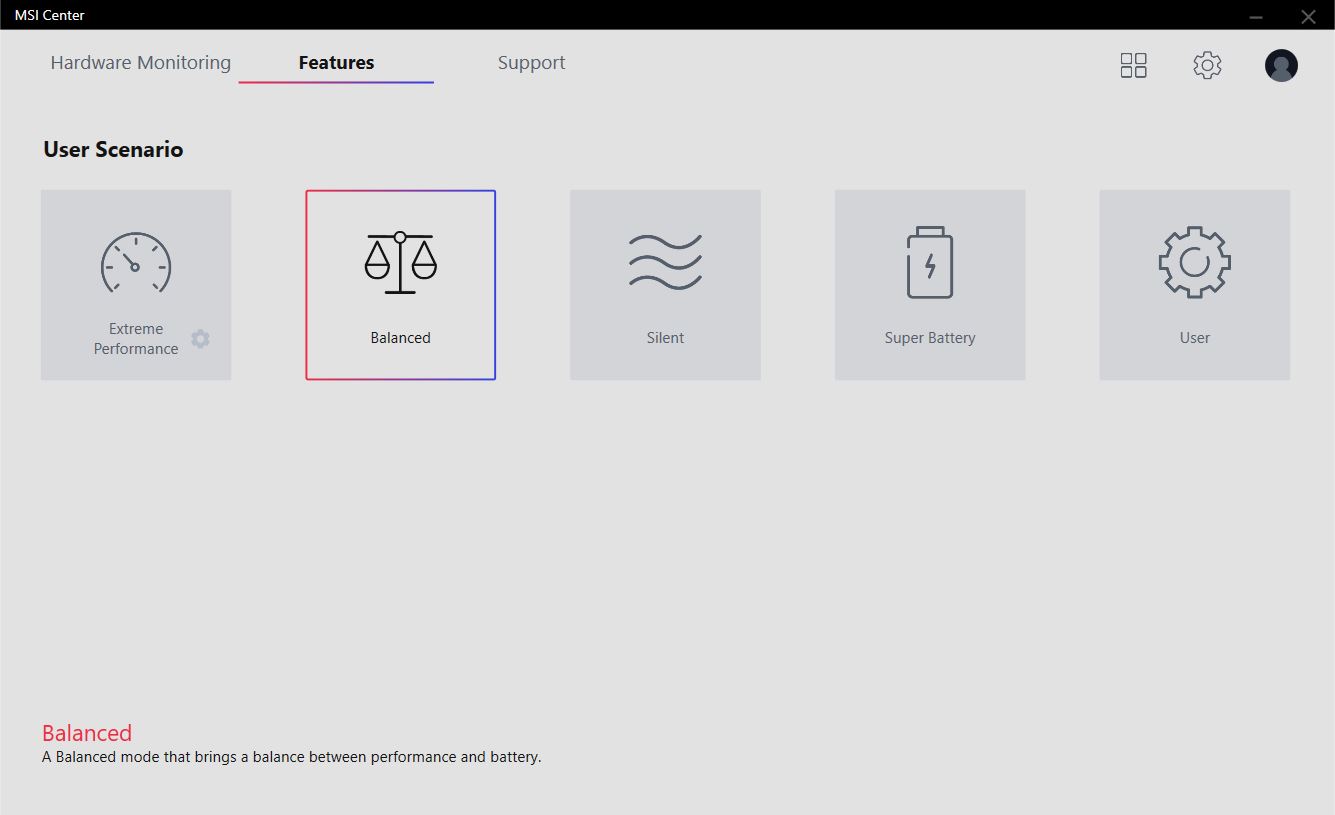
Tüm testleri MSI Center henüz kurulmamışken gerçekleştirdik. Sonuçta, GP66 bir Windows lisansı ile değil, yalnızca resmi olarak FreeDOS ile gönderilir. Test ünitemizin Windows performans kaydırıcısı, performans karşılaştırmaları için her zaman "En İyi Performans" olarak ayarlandı.
MSI Center ise "Kullanıcı Senaryosu" altında gizlenen diğer performans modlarını kullanıyor. Performans bölümlerinde Windows modunun farklılıklarına gireceğiz. MSI ayarlarında ayrıca hibrit grafik modu veya yalnızca ayrı GPU arasında seçim yapabilirsiniz.
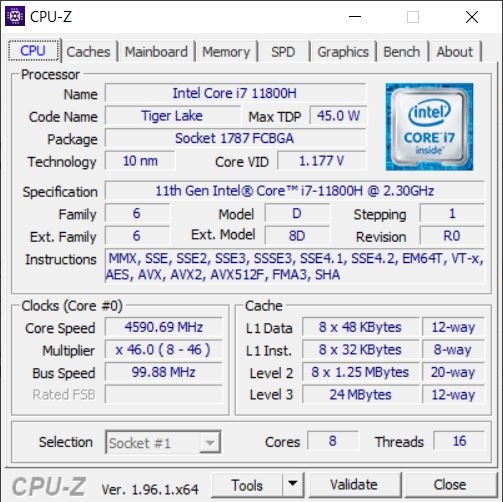
İşlemci
Mevcut Intel oyun dizüstü bilgisayarlarının çoğu gibi, MSI Leopard da bir Intel Core i7-11800H işlemci ile donatılmıştır. Ayrı ayrı 2.3 ila 4.6 GHz arasında çalışan sekiz çekirdeğe sahiptir. Tüm çekirdekler yük altındayken maksimum 4,2 GHz saat hızı mümkündür.
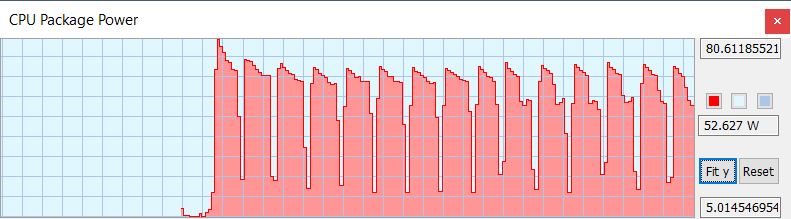
Cinebench döngü performansımızda yalnızca minimum düzeyde ve genel olarak azalır, GP 66 11UH öncekinden yaklaşık %25 daha hızlıdır. HWinfo aracılığıyla, CPU'nun başlangıçta 80 W'a izin verdiğini görebiliriz, ancak sonraki çalışmalar 75 W'ta başlar ve 53 W ile biter. Yine de, sonuçlar aynı CPU'ya sahip Aorus'un sonuçlarını geride bırakıyor.
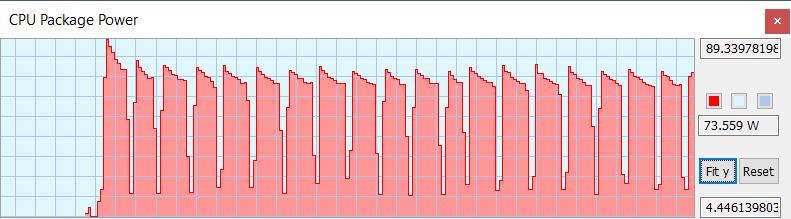
"Extreme Performance" modu, özellikle CPU gücüne fayda sağlar. Daha önce 75 W yerine, CPU kısa bir süre için 90 W'a bile izin verebilir, bu da tek seferde 53 W yerine hızla 74 W'a geri döner. Ancak, Extreme modunda bile GP66, AMD CPU'lu dizginsiz XMG Neo veya Asus ROG'nin performansına tam olarak ulaşamıyor.
Performans, pil gücüyle önemli ölçüde düşüyor: daha önce yaklaşık 2.000 puan, yalnızca 1.178 puan kaldı.
Cinebench R15 Multi endurance test
Cinebench R23: Multi Core | Single Core
Cinebench R20: CPU (Multi Core) | CPU (Single Core)
Cinebench R15: CPU Multi 64Bit | CPU Single 64Bit
Blender: v2.79 BMW27 CPU
7-Zip 18.03: 7z b 4 | 7z b 4 -mmt1
Geekbench 5.5: Multi-Core | Single-Core
HWBOT x265 Benchmark v2.2: 4k Preset
LibreOffice : 20 Documents To PDF
R Benchmark 2.5: Overall mean
| CPU Performance rating | |
| Sınıf ortalaması Gaming | |
| Schenker XMG Neo 15 Tiger Lake | |
| MSI GP66 Leopard 11UH-028 | |
| Asus ROG Strix Scar 15 G533QS -2! | |
| Alienware m15 R6, i7-11800H RTX 3080 | |
| Ortalama Intel Core i7-11800H | |
| Aorus 15P YD -2! | |
| MSI GP66 Leopard 10UG | |
| Cinebench R23 / Multi Core | |
| Sınıf ortalaması Gaming (10488 - 42661, n=107, son 2 yıl) | |
| Schenker XMG Neo 15 Tiger Lake | |
| Asus ROG Strix Scar 15 G533QS | |
| Alienware m15 R6, i7-11800H RTX 3080 | |
| MSI GP66 Leopard 11UH-028 | |
| Ortalama Intel Core i7-11800H (6508 - 14088, n=48) | |
| MSI GP66 Leopard 10UG | |
| Cinebench R23 / Single Core | |
| Sınıf ortalaması Gaming (1166 - 2415, n=107, son 2 yıl) | |
| MSI GP66 Leopard 11UH-028 | |
| Schenker XMG Neo 15 Tiger Lake | |
| Ortalama Intel Core i7-11800H (1386 - 1522, n=45) | |
| Alienware m15 R6, i7-11800H RTX 3080 | |
| Asus ROG Strix Scar 15 G533QS | |
| MSI GP66 Leopard 10UG | |
| Cinebench R20 / CPU (Multi Core) | |
| Sınıf ortalaması Gaming (4029 - 16433, n=106, son 2 yıl) | |
| Schenker XMG Neo 15 Tiger Lake | |
| Asus ROG Strix Scar 15 G533QS | |
| Aorus 15P YD | |
| MSI GP66 Leopard 11UH-028 | |
| Alienware m15 R6, i7-11800H RTX 3080 | |
| Ortalama Intel Core i7-11800H (2498 - 5408, n=50) | |
| MSI GP66 Leopard 10UG | |
| Cinebench R20 / CPU (Single Core) | |
| Sınıf ortalaması Gaming (442 - 913, n=106, son 2 yıl) | |
| Aorus 15P YD | |
| MSI GP66 Leopard 11UH-028 | |
| Schenker XMG Neo 15 Tiger Lake | |
| Alienware m15 R6, i7-11800H RTX 3080 | |
| Ortalama Intel Core i7-11800H (520 - 586, n=47) | |
| Asus ROG Strix Scar 15 G533QS | |
| MSI GP66 Leopard 10UG | |
| Cinebench R15 / CPU Multi 64Bit | |
| Sınıf ortalaması Gaming (1578 - 6330, n=105, son 2 yıl) | |
| Asus ROG Strix Scar 15 G533QS | |
| Schenker XMG Neo 15 Tiger Lake | |
| Alienware m15 R6, i7-11800H RTX 3080 | |
| MSI GP66 Leopard 11UH-028 | |
| Aorus 15P YD | |
| Ortalama Intel Core i7-11800H (1342 - 2173, n=50) | |
| MSI GP66 Leopard 10UG | |
| Cinebench R15 / CPU Single 64Bit | |
| Sınıf ortalaması Gaming (188.8 - 350, n=106, son 2 yıl) | |
| Asus ROG Strix Scar 15 G533QS | |
| Aorus 15P YD | |
| Schenker XMG Neo 15 Tiger Lake | |
| MSI GP66 Leopard 11UH-028 | |
| Alienware m15 R6, i7-11800H RTX 3080 | |
| Ortalama Intel Core i7-11800H (201 - 231, n=46) | |
| MSI GP66 Leopard 10UG | |
| Blender / v2.79 BMW27 CPU | |
| Aorus 15P YD | |
| MSI GP66 Leopard 10UG | |
| Ortalama Intel Core i7-11800H (217 - 454, n=46) | |
| Alienware m15 R6, i7-11800H RTX 3080 | |
| MSI GP66 Leopard 11UH-028 | |
| Asus ROG Strix Scar 15 G533QS | |
| Schenker XMG Neo 15 Tiger Lake | |
| Sınıf ortalaması Gaming (79 - 330, n=104, son 2 yıl) | |
| 7-Zip 18.03 / 7z b 4 | |
| Sınıf ortalaması Gaming (33491 - 148086, n=105, son 2 yıl) | |
| Asus ROG Strix Scar 15 G533QS | |
| Schenker XMG Neo 15 Tiger Lake | |
| MSI GP66 Leopard 11UH-028 | |
| Alienware m15 R6, i7-11800H RTX 3080 | |
| Ortalama Intel Core i7-11800H (33718 - 56758, n=46) | |
| Aorus 15P YD | |
| MSI GP66 Leopard 10UG | |
| 7-Zip 18.03 / 7z b 4 -mmt1 | |
| Sınıf ortalaması Gaming (4199 - 7436, n=105, son 2 yıl) | |
| Schenker XMG Neo 15 Tiger Lake | |
| Aorus 15P YD | |
| MSI GP66 Leopard 11UH-028 | |
| Asus ROG Strix Scar 15 G533QS | |
| Ortalama Intel Core i7-11800H (5138 - 5732, n=46) | |
| Alienware m15 R6, i7-11800H RTX 3080 | |
| MSI GP66 Leopard 10UG | |
| Geekbench 5.5 / Multi-Core | |
| Sınıf ortalaması Gaming (6460 - 28263, n=105, son 2 yıl) | |
| Schenker XMG Neo 15 Tiger Lake | |
| Alienware m15 R6, i7-11800H RTX 3080 | |
| MSI GP66 Leopard 11UH-028 | |
| Aorus 15P YD | |
| Ortalama Intel Core i7-11800H (4655 - 9851, n=40) | |
| MSI GP66 Leopard 10UG | |
| Geekbench 5.5 / Single-Core | |
| Sınıf ortalaması Gaming (986 - 2474, n=105, son 2 yıl) | |
| Schenker XMG Neo 15 Tiger Lake | |
| Aorus 15P YD | |
| MSI GP66 Leopard 11UH-028 | |
| Alienware m15 R6, i7-11800H RTX 3080 | |
| Ortalama Intel Core i7-11800H (1429 - 1625, n=40) | |
| MSI GP66 Leopard 10UG | |
| HWBOT x265 Benchmark v2.2 / 4k Preset | |
| Sınıf ortalaması Gaming (11.5 - 44.4, n=105, son 2 yıl) | |
| Schenker XMG Neo 15 Tiger Lake | |
| Asus ROG Strix Scar 15 G533QS | |
| MSI GP66 Leopard 11UH-028 | |
| Ortalama Intel Core i7-11800H (7.38 - 17.4, n=46) | |
| Alienware m15 R6, i7-11800H RTX 3080 | |
| MSI GP66 Leopard 10UG | |
| Aorus 15P YD | |
| LibreOffice / 20 Documents To PDF | |
| Asus ROG Strix Scar 15 G533QS | |
| Sınıf ortalaması Gaming (33.2 - 88.8, n=105, son 2 yıl) | |
| MSI GP66 Leopard 10UG | |
| MSI GP66 Leopard 11UH-028 | |
| Schenker XMG Neo 15 Tiger Lake | |
| Ortalama Intel Core i7-11800H (38.6 - 59.9, n=45) | |
| Alienware m15 R6, i7-11800H RTX 3080 | |
| Aorus 15P YD | |
| R Benchmark 2.5 / Overall mean | |
| MSI GP66 Leopard 10UG | |
| MSI GP66 Leopard 11UH-028 | |
| Ortalama Intel Core i7-11800H (0.548 - 0.615, n=46) | |
| Aorus 15P YD | |
| Alienware m15 R6, i7-11800H RTX 3080 | |
| Schenker XMG Neo 15 Tiger Lake | |
| Asus ROG Strix Scar 15 G533QS | |
| Sınıf ortalaması Gaming (0.3439 - 0.759, n=106, son 2 yıl) | |
* ... daha küçük daha iyidir
AIDA64: FP32 Ray-Trace | FPU Julia | CPU SHA3 | CPU Queen | FPU SinJulia | FPU Mandel | CPU AES | CPU ZLib | FP64 Ray-Trace | CPU PhotoWorxx
| Performance rating | |
| Sınıf ortalaması Gaming | |
| Asus ROG Strix Scar 15 G533QS | |
| Alienware m15 R6, i7-11800H RTX 3080 | |
| MSI GP66 Leopard 11UH-028 | |
| Ortalama Intel Core i7-11800H | |
| MSI GP66 Leopard 10UG | |
| AIDA64 / FP32 Ray-Trace | |
| Sınıf ortalaması Gaming (10227 - 85542, n=105, son 2 yıl) | |
| Alienware m15 R6, i7-11800H RTX 3080 | |
| Asus ROG Strix Scar 15 G533QS | |
| MSI GP66 Leopard 11UH-028 | |
| Ortalama Intel Core i7-11800H (8772 - 15961, n=20) | |
| MSI GP66 Leopard 10UG | |
| AIDA64 / FPU Julia | |
| Sınıf ortalaması Gaming (51376 - 238426, n=105, son 2 yıl) | |
| Asus ROG Strix Scar 15 G533QS | |
| Alienware m15 R6, i7-11800H RTX 3080 | |
| MSI GP66 Leopard 11UH-028 | |
| MSI GP66 Leopard 10UG | |
| Ortalama Intel Core i7-11800H (39404 - 65636, n=20) | |
| AIDA64 / CPU SHA3 | |
| Sınıf ortalaması Gaming (2180 - 10115, n=105, son 2 yıl) | |
| Alienware m15 R6, i7-11800H RTX 3080 | |
| MSI GP66 Leopard 11UH-028 | |
| Ortalama Intel Core i7-11800H (2599 - 4439, n=20) | |
| Asus ROG Strix Scar 15 G533QS | |
| MSI GP66 Leopard 10UG | |
| AIDA64 / CPU Queen | |
| Sınıf ortalaması Gaming (49785 - 173351, n=90, son 2 yıl) | |
| Asus ROG Strix Scar 15 G533QS | |
| MSI GP66 Leopard 11UH-028 | |
| Alienware m15 R6, i7-11800H RTX 3080 | |
| Ortalama Intel Core i7-11800H (85233 - 91941, n=20) | |
| MSI GP66 Leopard 10UG | |
| AIDA64 / FPU SinJulia | |
| Sınıf ortalaması Gaming (4424 - 33636, n=105, son 2 yıl) | |
| Asus ROG Strix Scar 15 G533QS | |
| MSI GP66 Leopard 11UH-028 | |
| Alienware m15 R6, i7-11800H RTX 3080 | |
| MSI GP66 Leopard 10UG | |
| Ortalama Intel Core i7-11800H (6420 - 9792, n=20) | |
| AIDA64 / FPU Mandel | |
| Sınıf ortalaması Gaming (25115 - 128721, n=105, son 2 yıl) | |
| Asus ROG Strix Scar 15 G533QS | |
| Alienware m15 R6, i7-11800H RTX 3080 | |
| MSI GP66 Leopard 11UH-028 | |
| Ortalama Intel Core i7-11800H (23365 - 39464, n=20) | |
| MSI GP66 Leopard 10UG | |
| AIDA64 / CPU AES | |
| Alienware m15 R6, i7-11800H RTX 3080 | |
| MSI GP66 Leopard 11UH-028 | |
| Asus ROG Strix Scar 15 G533QS | |
| Ortalama Intel Core i7-11800H (74617 - 149388, n=20) | |
| Sınıf ortalaması Gaming (39258 - 247074, n=105, son 2 yıl) | |
| MSI GP66 Leopard 10UG | |
| AIDA64 / CPU ZLib | |
| Sınıf ortalaması Gaming (574 - 2531, n=105, son 2 yıl) | |
| Asus ROG Strix Scar 15 G533QS | |
| Alienware m15 R6, i7-11800H RTX 3080 | |
| MSI GP66 Leopard 11UH-028 | |
| MSI GP66 Leopard 10UG | |
| Ortalama Intel Core i7-11800H (461 - 830, n=43) | |
| AIDA64 / FP64 Ray-Trace | |
| Sınıf ortalaması Gaming (5509 - 45446, n=105, son 2 yıl) | |
| Alienware m15 R6, i7-11800H RTX 3080 | |
| Asus ROG Strix Scar 15 G533QS | |
| MSI GP66 Leopard 11UH-028 | |
| Ortalama Intel Core i7-11800H (4545 - 8717, n=21) | |
| MSI GP66 Leopard 10UG | |
| AIDA64 / CPU PhotoWorxx | |
| Sınıf ortalaması Gaming (12271 - 89891, n=105, son 2 yıl) | |
| Asus ROG Strix Scar 15 G533QS | |
| Alienware m15 R6, i7-11800H RTX 3080 | |
| MSI GP66 Leopard 11UH-028 | |
| MSI GP66 Leopard 10UG | |
| Ortalama Intel Core i7-11800H (11898 - 26757, n=21) | |
Sistem performansı
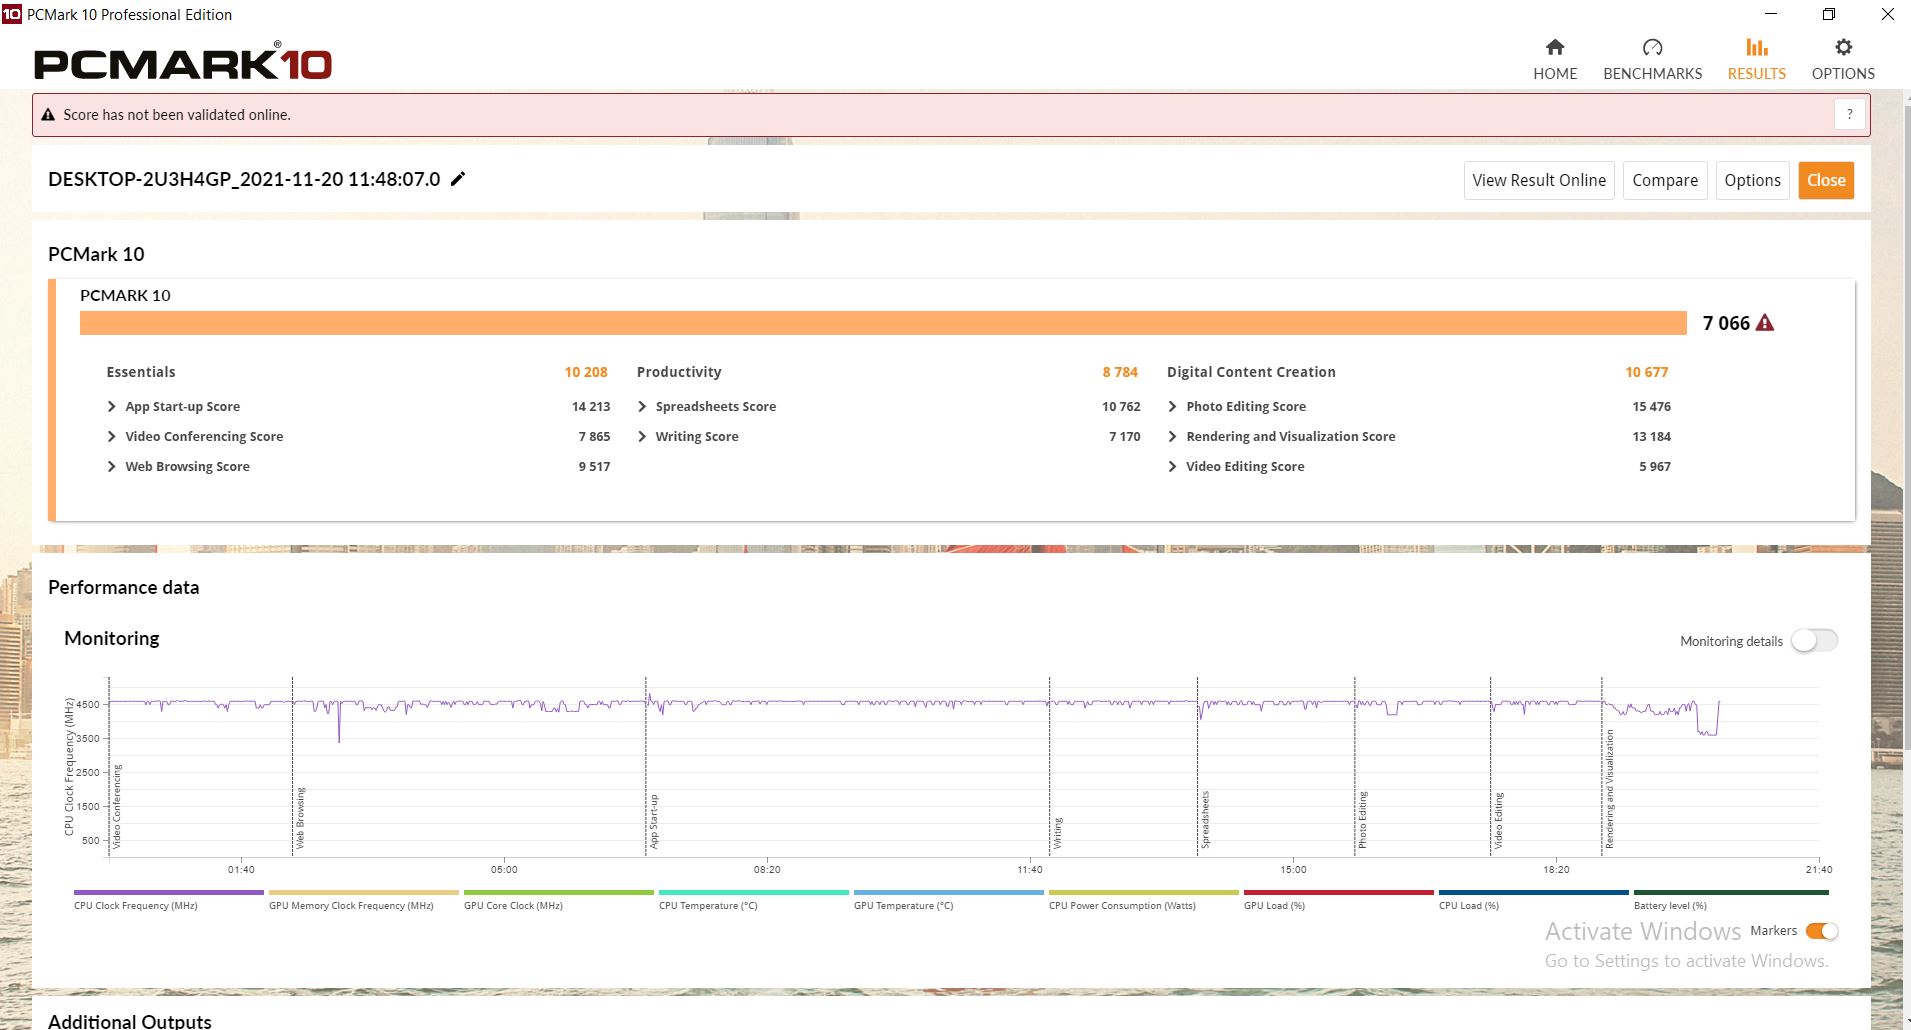
Leopard, PCMark 10'da kabaca beklenen seviyede bir performans sergiliyor. Bununla birlikte, rakipler genellikle biraz daha iyi, ancak bu daha çok ölçüm doğruluğundan kaynaklanıyor.
| PCMark 10 / Score | |
| Sınıf ortalaması Gaming (5828 - 12414, n=93, son 2 yıl) | |
| Asus ROG Strix Scar 15 G533QS | |
| Aorus 15P YD | |
| Schenker XMG Neo 15 Tiger Lake | |
| Alienware m15 R6, i7-11800H RTX 3080 | |
| Ortalama Intel Core i7-11800H, NVIDIA GeForce RTX 3080 Laptop GPU (6673 - 7470, n=11) | |
| MSI GP66 Leopard 11UH-028 | |
| MSI GP66 Leopard 10UG | |
| PCMark 10 / Essentials | |
| Sınıf ortalaması Gaming (8810 - 11935, n=97, son 2 yıl) | |
| Aorus 15P YD | |
| Ortalama Intel Core i7-11800H, NVIDIA GeForce RTX 3080 Laptop GPU (9862 - 11064, n=11) | |
| Schenker XMG Neo 15 Tiger Lake | |
| Asus ROG Strix Scar 15 G533QS | |
| MSI GP66 Leopard 11UH-028 | |
| Alienware m15 R6, i7-11800H RTX 3080 | |
| MSI GP66 Leopard 10UG | |
| PCMark 10 / Productivity | |
| Sınıf ortalaması Gaming (6845 - 25323, n=95, son 2 yıl) | |
| Asus ROG Strix Scar 15 G533QS | |
| Alienware m15 R6, i7-11800H RTX 3080 | |
| Aorus 15P YD | |
| Ortalama Intel Core i7-11800H, NVIDIA GeForce RTX 3080 Laptop GPU (8278 - 9803, n=11) | |
| Schenker XMG Neo 15 Tiger Lake | |
| MSI GP66 Leopard 11UH-028 | |
| MSI GP66 Leopard 10UG | |
| PCMark 10 / Digital Content Creation | |
| Sınıf ortalaması Gaming (7602 - 19954, n=95, son 2 yıl) | |
| Schenker XMG Neo 15 Tiger Lake | |
| Alienware m15 R6, i7-11800H RTX 3080 | |
| MSI GP66 Leopard 11UH-028 | |
| Ortalama Intel Core i7-11800H, NVIDIA GeForce RTX 3080 Laptop GPU (9881 - 11323, n=11) | |
| Aorus 15P YD | |
| MSI GP66 Leopard 10UG | |
| Asus ROG Strix Scar 15 G533QS | |
| PCMark 10 Score | 7066 puan | |
Yardım | ||
| AIDA64 / Memory Copy | |
| Sınıf ortalaması Gaming (21750 - 129946, n=105, son 2 yıl) | |
| MSI GP66 Leopard 11UH-028 | |
| Alienware m15 R6, i7-11800H RTX 3080 | |
| Asus ROG Strix Scar 15 G533QS | |
| Ortalama Intel Core i7-11800H (24508 - 48144, n=21) | |
| MSI GP66 Leopard 10UG | |
| AIDA64 / Memory Read | |
| Sınıf ortalaması Gaming (22956 - 118858, n=105, son 2 yıl) | |
| MSI GP66 Leopard 11UH-028 | |
| Alienware m15 R6, i7-11800H RTX 3080 | |
| Asus ROG Strix Scar 15 G533QS | |
| Ortalama Intel Core i7-11800H (25882 - 50365, n=20) | |
| MSI GP66 Leopard 10UG | |
| AIDA64 / Memory Write | |
| Sınıf ortalaması Gaming (22297 - 135096, n=105, son 2 yıl) | |
| MSI GP66 Leopard 10UG | |
| Asus ROG Strix Scar 15 G533QS | |
| MSI GP66 Leopard 11UH-028 | |
| Alienware m15 R6, i7-11800H RTX 3080 | |
| Ortalama Intel Core i7-11800H (22240 - 46214, n=20) | |
| AIDA64 / Memory Latency | |
| Sınıf ortalaması Gaming (75.3 - 259, n=105, son 2 yıl) | |
| Alienware m15 R6, i7-11800H RTX 3080 | |
| MSI GP66 Leopard 11UH-028 | |
| Asus ROG Strix Scar 15 G533QS | |
| MSI GP66 Leopard 10UG | |
| Ortalama Intel Core i7-11800H (71.9 - 104.1, n=44) | |
| Aorus 15P YD | |
| Schenker XMG Neo 15 Tiger Lake | |
* ... daha küçük daha iyidir
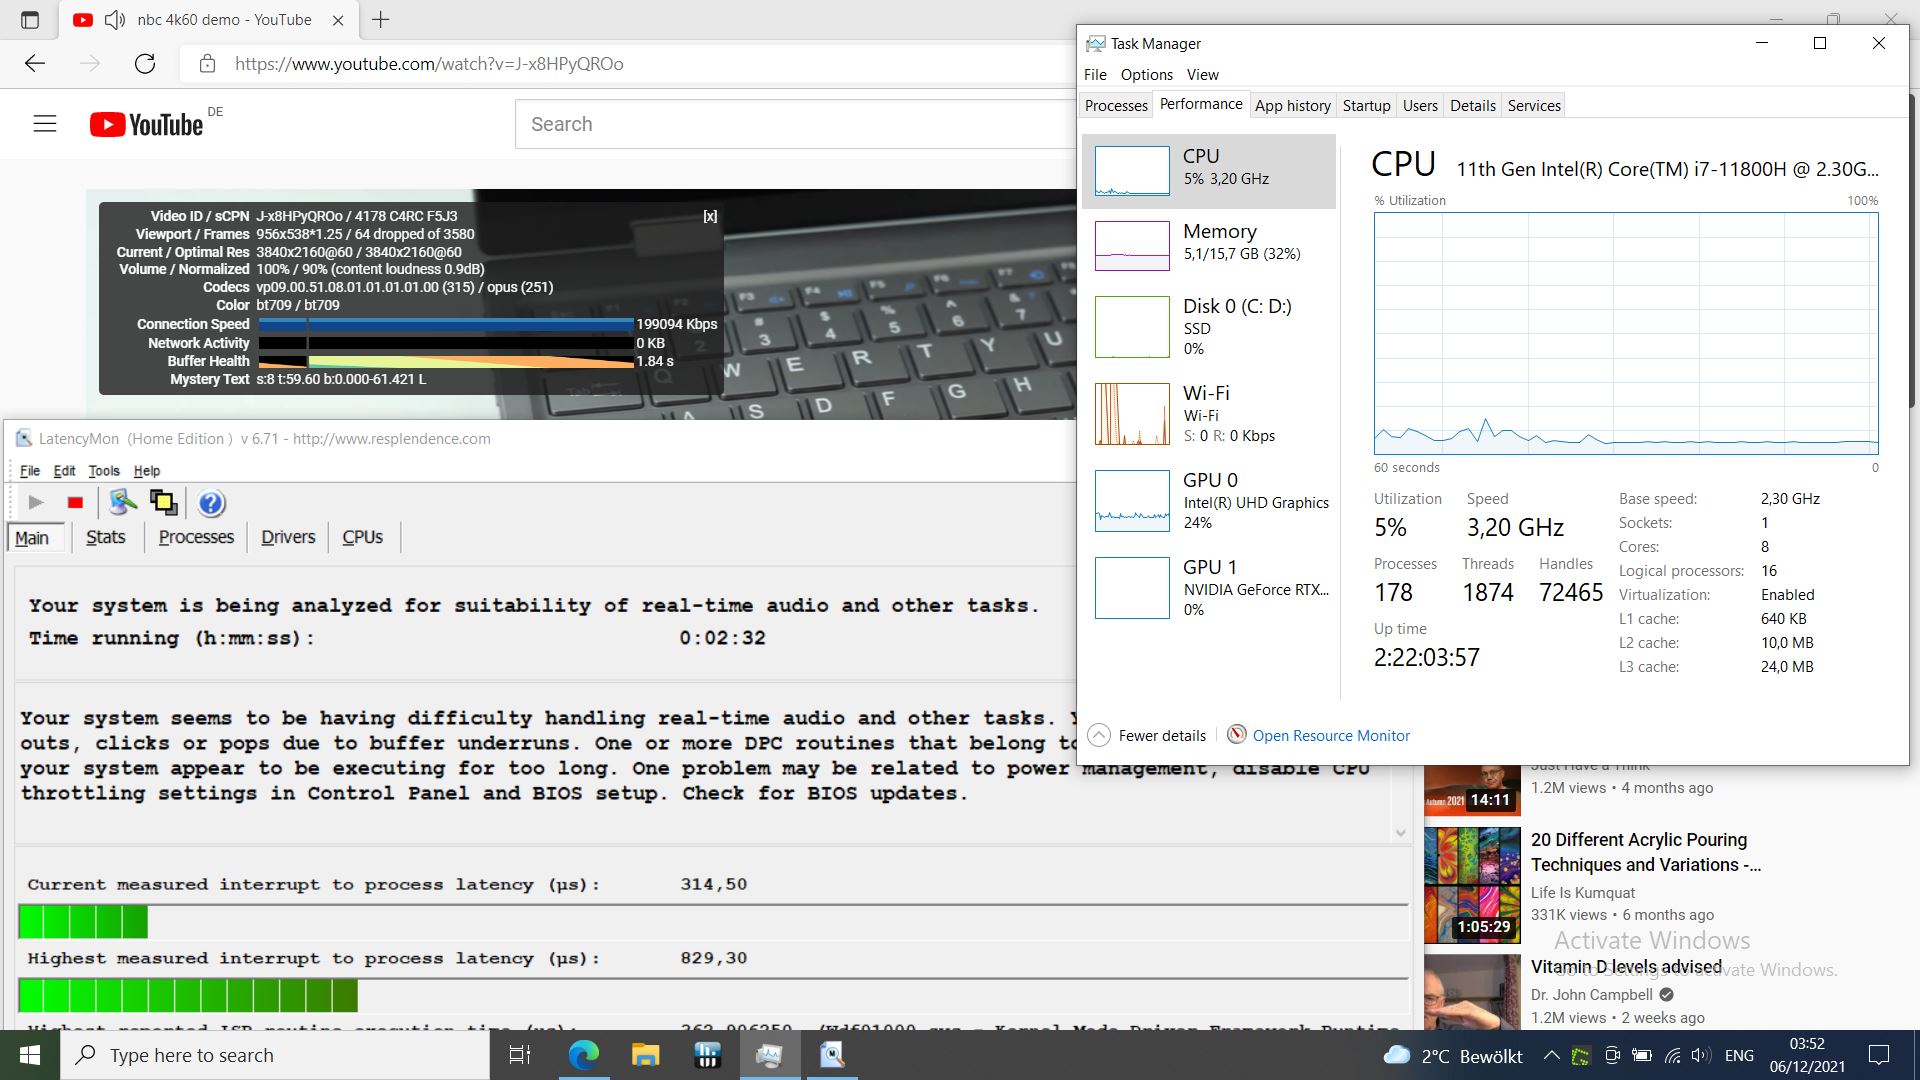
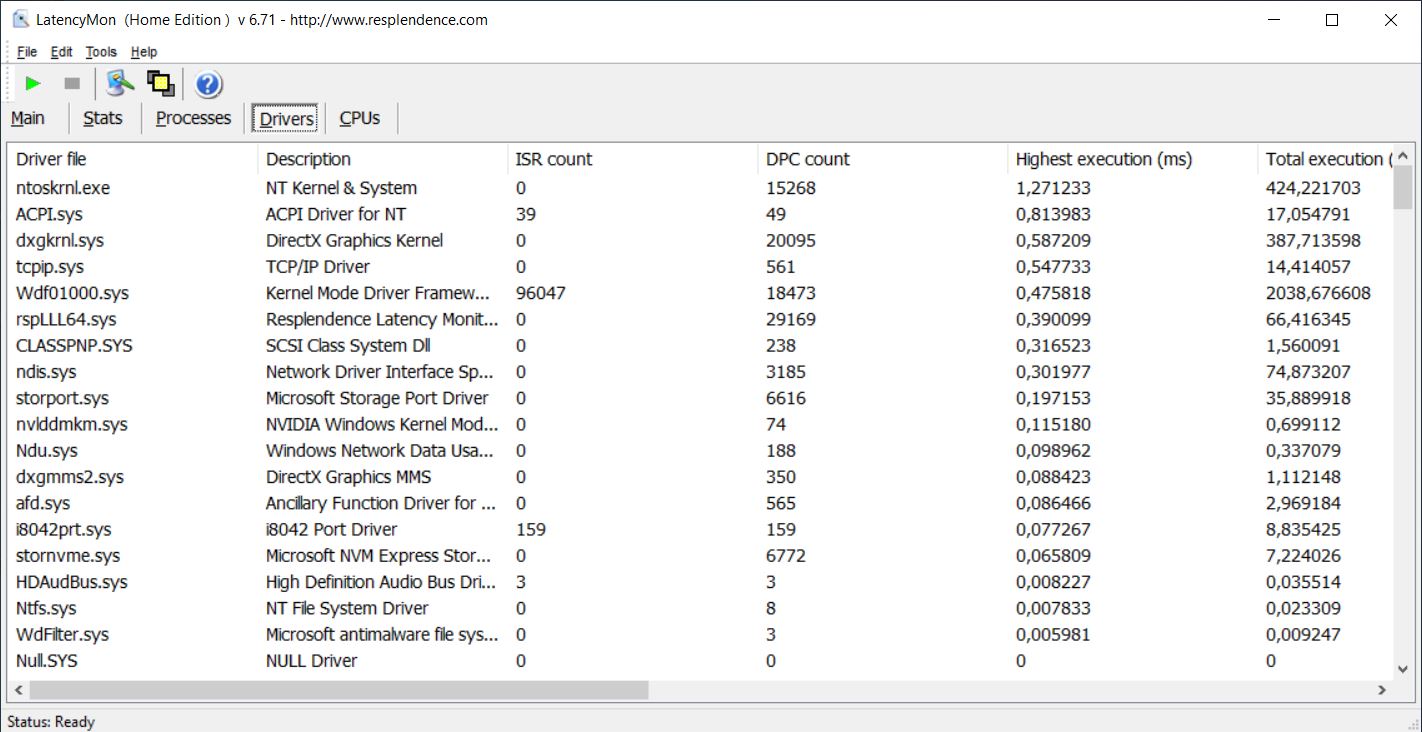
DPC gecikmeleri
GP66'nın birkaç açık tarayıcı sekmesinde veya 4K/60 fps YouTube videomuzda gecikme sorunları var. Leopard, test videosunda her saniye, sonunda 64 kare düştü. Diğer şeylerin yanı sıra, NT çekirdeği ve sistem sürücüsü suçludur. Rekabet benzer şekilde yüksek gecikme oranlarına sahip, ancak Alienware dışında video oynatma ile daha iyi yönetiliyor.

| DPC Latencies / LatencyMon - interrupt to process latency (max), Web, Youtube, Prime95 | |
| Asus ROG Strix Scar 15 G533QS | |
| Alienware m15 R6, i7-11800H RTX 3080 | |
| MSI GP66 Leopard 11UH-028 | |
| Aorus 15P YD | |
| Schenker XMG Neo 15 Tiger Lake | |
| MSI GP66 Leopard 10UG | |
* ... daha küçük daha iyidir
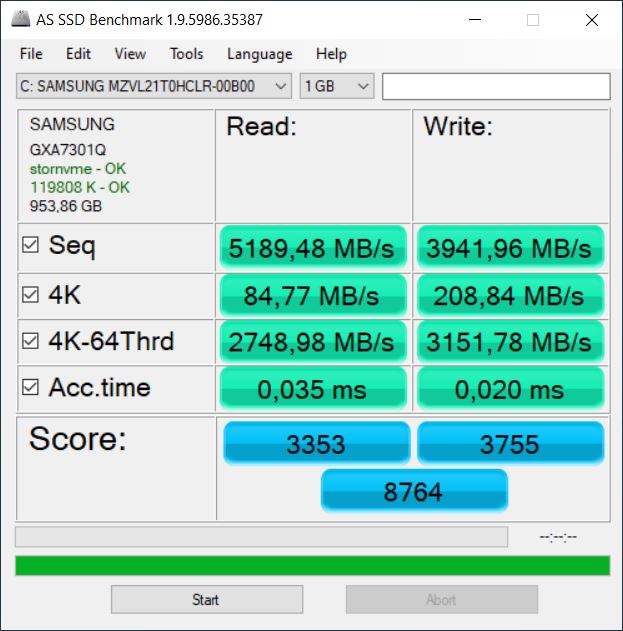
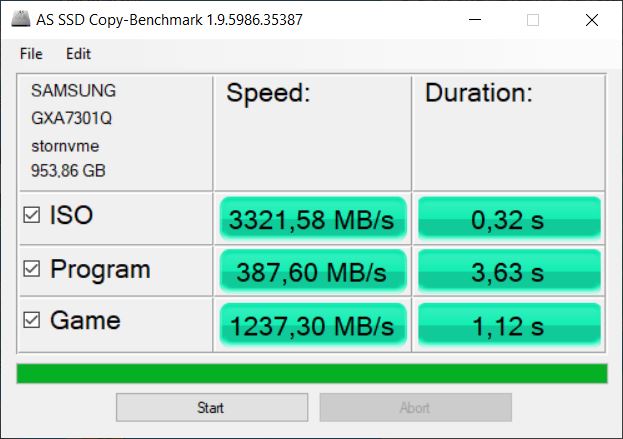
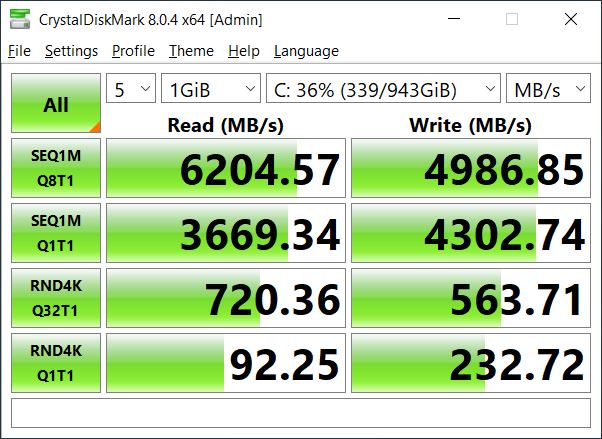
Depolama
Samsung'un 1 TB depolama alanına sahip kurulu NVMe SSD'si çok hızlıdır (en iyi SSD/HDD listesi), ancak en yüksek performansı dayanıklılık testinde yarıdan fazla düşer. Bu, günlük kullanımda pek fark edilmemelidir ve kalan dayanıklılık performansı hala nispeten yüksektir.

| Drive Performance rating - Percent | |
| MSI GP66 Leopard 11UH-028 | |
| Aorus 15P YD | |
| Sınıf ortalaması Gaming | |
| Ortalama Samsung PM9A1 MZVL21T0HCLR | |
| Schenker XMG Neo 15 Tiger Lake | |
| Alienware m15 R6, i7-11800H RTX 3080 | |
| MSI GP66 Leopard 10UG | |
| Asus ROG Strix Scar 15 G533QS | |
* ... daha küçük daha iyidir
Sürekli yük okuması: DiskSpd Okuma Döngüsü, Kuyruk Derinliği 8
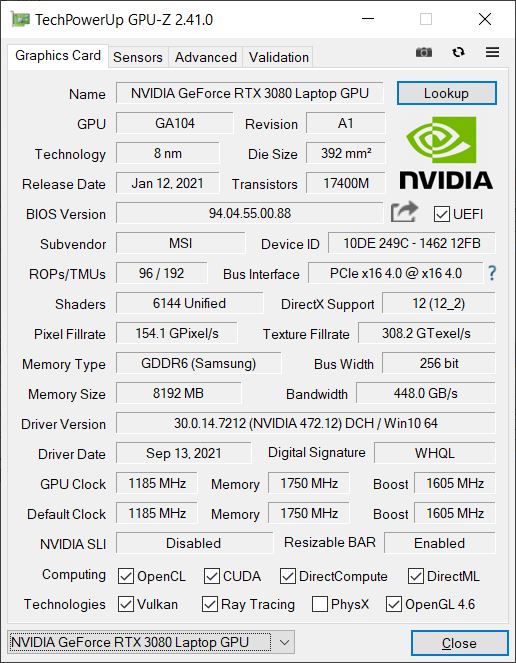
Ekran Kartı
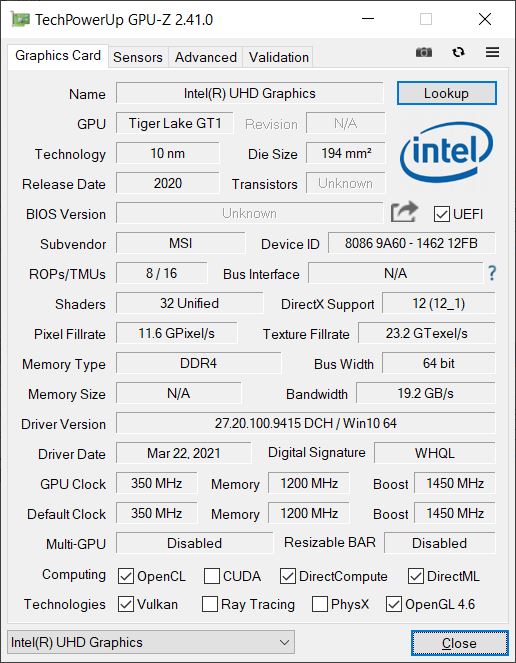
İşlemci ile tümleşik Intel UHD Graphics Xe (32EUs) yanı sıra, dizüstü bilgisayarda sorunsuz kare hızları sağlayan ayrı NVIDIA GeForce RTX 3080dizüstü bilgisayar GPU'su bulunur. GPU'nun Dynamic Boost dahil 140 W tüketmesine izin verilirken, Schenker XMG Neo'daki aynı kart tam 165 W'a izin veriyor. Diğer GP66 çeşitleri de RTX 3070 donanımlı olarak mevcuttur.
Bu nedenle, Schenker genellikle 3DMarks'ta birkaç puan öndedir, ancak Leopard rekabetin geri kalanını yönetebilir.
Grafik performansı pil gücüyle önemli ölçüde düşüyor, 3DMark 11'de tamamen %65 oranında düşüyor. The Witcher 3'te (Ultra), kare hızı 120 fps'den kendiliğinden 11 fps'ye düştü! Bu nedenle mobil oyun ancak çok büyük fedakarlıklar ile mümkündür.
| 3DMark Performance rating - Percent | |
| Sınıf ortalaması Gaming | |
| MSI GP66 Leopard 10UG | |
| MSI GP66 Leopard 11UH-028 | |
| Aorus 15P YD | |
| Schenker XMG Neo 15 Tiger Lake | |
| Alienware m15 R6, i7-11800H RTX 3080 | |
| Ortalama NVIDIA GeForce RTX 3080 Laptop GPU | |
| Asus ROG Strix Scar 15 G533QS | |
| 3DMark 11 - 1280x720 Performance GPU | |
| Sınıf ortalaması Gaming (21841 - 80022, n=104, son 2 yıl) | |
| Schenker XMG Neo 15 Tiger Lake | |
| MSI GP66 Leopard 11UH-028 | |
| Asus ROG Strix Scar 15 G533QS | |
| Alienware m15 R6, i7-11800H RTX 3080 | |
| Aorus 15P YD | |
| Ortalama NVIDIA GeForce RTX 3080 Laptop GPU (31288 - 43744, n=40) | |
| MSI GP66 Leopard 10UG | |
| 3DMark | |
| 1280x720 Cloud Gate Standard Graphics | |
| MSI GP66 Leopard 10UG | |
| Sınıf ortalaması Gaming (86886 - 223650, n=60, son 2 yıl) | |
| MSI GP66 Leopard 11UH-028 | |
| Aorus 15P YD | |
| Alienware m15 R6, i7-11800H RTX 3080 | |
| Ortalama NVIDIA GeForce RTX 3080 Laptop GPU (38816 - 192950, n=35) | |
| Schenker XMG Neo 15 Tiger Lake | |
| Asus ROG Strix Scar 15 G533QS | |
| 1920x1080 Fire Strike Graphics | |
| Sınıf ortalaması Gaming (12242 - 62849, n=115, son 2 yıl) | |
| Schenker XMG Neo 15 Tiger Lake | |
| MSI GP66 Leopard 11UH-028 | |
| Aorus 15P YD | |
| Alienware m15 R6, i7-11800H RTX 3080 | |
| MSI GP66 Leopard 10UG | |
| Ortalama NVIDIA GeForce RTX 3080 Laptop GPU (16455 - 32366, n=46) | |
| Asus ROG Strix Scar 15 G533QS | |
| 2560x1440 Time Spy Graphics | |
| Sınıf ortalaması Gaming (5012 - 26212, n=115, son 2 yıl) | |
| Schenker XMG Neo 15 Tiger Lake | |
| Asus ROG Strix Scar 15 G533QS | |
| MSI GP66 Leopard 11UH-028 | |
| Aorus 15P YD | |
| Alienware m15 R6, i7-11800H RTX 3080 | |
| MSI GP66 Leopard 10UG | |
| Ortalama NVIDIA GeForce RTX 3080 Laptop GPU (6407 - 13210, n=45) | |
| 3DMark 11 Performance | 30689 puan | |
| 3DMark Cloud Gate Standard Score | 51452 puan | |
| 3DMark Fire Strike Score | 24909 puan | |
| 3DMark Time Spy Score | 11030 puan | |
Yardım | ||
Oyun performansı
MSI, test edilen tüm oyunları yaklaşık 100 fps'de ultra ayarlarda bile Full HD olarak görüntüler. Bu nedenle, 4K içeriği görüntülemek için hala yeterli alan var.
Leopard, kıyaslandığında oldukça iyi durumda, ancak RTX 3080 ile rakipler arasındaki farklar oldukça küçük. Sadece 165 W RTX'li XMG Neo, oyuna bağlı olarak MSI'dan biraz daha iyi performans gösterebilir.
Extreme Performance Mode'da The Witcher 3'te (Ultra) %5'in biraz altında bir kazanç elde ettik . GPU, moddan yararlanan CPU'dan açıkça daha belirleyicidir.
| Far Cry 5 | |
| 1920x1080 Medium Preset AA:T | |
| Schenker XMG Neo 15 Tiger Lake | |
| Sınıf ortalaması Gaming (84 - 173, n=6, son 2 yıl) | |
| Aorus 15P YD | |
| Ortalama NVIDIA GeForce RTX 3080 Laptop GPU (84 - 162, n=26) | |
| Alienware m15 R6, i7-11800H RTX 3080 | |
| MSI GP66 Leopard 11UH-028 | |
| 1920x1080 High Preset AA:T | |
| Schenker XMG Neo 15 Tiger Lake | |
| Sınıf ortalaması Gaming (82 - 163, n=6, son 2 yıl) | |
| Aorus 15P YD | |
| Ortalama NVIDIA GeForce RTX 3080 Laptop GPU (79 - 155, n=28) | |
| Alienware m15 R6, i7-11800H RTX 3080 | |
| MSI GP66 Leopard 11UH-028 | |
| 1920x1080 Ultra Preset AA:T | |
| Aorus 15P YD | |
| Schenker XMG Neo 15 Tiger Lake | |
| Sınıf ortalaması Gaming (70 - 151, n=6, son 2 yıl) | |
| Ortalama NVIDIA GeForce RTX 3080 Laptop GPU (75 - 146, n=33) | |
| Alienware m15 R6, i7-11800H RTX 3080 | |
| MSI GP66 Leopard 11UH-028 | |
| New World | |
| 1920x1080 Medium Video Quality | |
| MSI GP66 Leopard 11UH-028 | |
| Alienware m15 R6, i7-11800H RTX 3080 | |
| Ortalama NVIDIA GeForce RTX 3080 Laptop GPU (80.8 - 105.4, n=4) | |
| 1920x1080 High Video Quality | |
| MSI GP66 Leopard 11UH-028 | |
| Alienware m15 R6, i7-11800H RTX 3080 | |
| Ortalama NVIDIA GeForce RTX 3080 Laptop GPU (75.1 - 96.7, n=4) | |
| 1920x1080 Very High Video Quality | |
| MSI GP66 Leopard 11UH-028 | |
| Alienware m15 R6, i7-11800H RTX 3080 | |
| Ortalama NVIDIA GeForce RTX 3080 Laptop GPU (71.5 - 90.4, n=4) | |
| GTA V | |
| 1920x1080 Normal/Off AF:4x | |
| Sınıf ortalaması Gaming (121.4 - 191.2, n=32, son 2 yıl) | |
| MSI GP66 Leopard 10UG | |
| Schenker XMG Neo 15 Tiger Lake | |
| MSI GP66 Leopard 11UH-028 | |
| Alienware m15 R6, i7-11800H RTX 3080 | |
| Ortalama NVIDIA GeForce RTX 3080 Laptop GPU (160 - 182, n=29) | |
| Aorus 15P YD | |
| Asus ROG Strix Scar 15 G533QS | |
| 1920x1080 High/On (Advanced Graphics Off) AA:2xMSAA + FX AF:8x | |
| Schenker XMG Neo 15 Tiger Lake | |
| Sınıf ortalaması Gaming (110.7 - 189, n=64, son 2 yıl) | |
| MSI GP66 Leopard 10UG | |
| Alienware m15 R6, i7-11800H RTX 3080 | |
| MSI GP66 Leopard 11UH-028 | |
| Ortalama NVIDIA GeForce RTX 3080 Laptop GPU (137 - 176, n=30) | |
| Aorus 15P YD | |
| Asus ROG Strix Scar 15 G533QS | |
| 1920x1080 Highest AA:4xMSAA + FX AF:16x | |
| Sınıf ortalaması Gaming (48.3 - 186.9, n=94, son 2 yıl) | |
| Schenker XMG Neo 15 Tiger Lake | |
| MSI GP66 Leopard 11UH-028 | |
| Alienware m15 R6, i7-11800H RTX 3080 | |
| Ortalama NVIDIA GeForce RTX 3080 Laptop GPU (68.6 - 114.6, n=34) | |
| Aorus 15P YD | |
| MSI GP66 Leopard 10UG | |
| Asus ROG Strix Scar 15 G533QS | |
| Dota 2 Reborn | |
| 1920x1080 high (2/3) | |
| Sınıf ortalaması Gaming (82.8 - 275, n=106, son 2 yıl) | |
| Schenker XMG Neo 15 Tiger Lake | |
| Alienware m15 R6, i7-11800H RTX 3080 | |
| MSI GP66 Leopard 11UH-028 | |
| MSI GP66 Leopard 10UG | |
| Aorus 15P YD | |
| Ortalama NVIDIA GeForce RTX 3080 Laptop GPU (108.1 - 161, n=45) | |
| Asus ROG Strix Scar 15 G533QS | |
| 1920x1080 ultra (3/3) best looking | |
| Sınıf ortalaması Gaming (84.8 - 248, n=107, son 2 yıl) | |
| Schenker XMG Neo 15 Tiger Lake | |
| MSI GP66 Leopard 10UG | |
| Alienware m15 R6, i7-11800H RTX 3080 | |
| MSI GP66 Leopard 11UH-028 | |
| Aorus 15P YD | |
| Ortalama NVIDIA GeForce RTX 3080 Laptop GPU (98 - 156, n=45) | |
| Asus ROG Strix Scar 15 G533QS | |
| Strange Brigade | |
| 1920x1080 medium AA:medium AF:4 | |
| Sınıf ortalaması Gaming (160.9 - 509, n=72, son 2 yıl) | |
| MSI GP66 Leopard 10UG | |
| Schenker XMG Neo 15 Tiger Lake | |
| MSI GP66 Leopard 11UH-028 | |
| Alienware m15 R6, i7-11800H RTX 3080 | |
| Aorus 15P YD | |
| Ortalama NVIDIA GeForce RTX 3080 Laptop GPU (186 - 306, n=29) | |
| Asus ROG Strix Scar 15 G533QS | |
| 1920x1080 high AA:high AF:8 | |
| Sınıf ortalaması Gaming (129.5 - 494, n=75, son 2 yıl) | |
| MSI GP66 Leopard 10UG | |
| MSI GP66 Leopard 11UH-028 | |
| Schenker XMG Neo 15 Tiger Lake | |
| Alienware m15 R6, i7-11800H RTX 3080 | |
| Aorus 15P YD | |
| Ortalama NVIDIA GeForce RTX 3080 Laptop GPU (165 - 248, n=30) | |
| Asus ROG Strix Scar 15 G533QS | |
| 1920x1080 ultra AA:ultra AF:16 | |
| Sınıf ortalaması Gaming (76.3 - 458, n=87, son 2 yıl) | |
| Schenker XMG Neo 15 Tiger Lake | |
| MSI GP66 Leopard 11UH-028 | |
| MSI GP66 Leopard 10UG | |
| Alienware m15 R6, i7-11800H RTX 3080 | |
| Aorus 15P YD | |
| Ortalama NVIDIA GeForce RTX 3080 Laptop GPU (117 - 219, n=34) | |
| Asus ROG Strix Scar 15 G533QS | |
| Final Fantasy XV Benchmark | |
| 1280x720 Lite Quality | |
| Sınıf ortalaması Gaming (117.4 - 235, n=64, son 2 yıl) | |
| Schenker XMG Neo 15 Tiger Lake | |
| Asus ROG Strix Scar 15 G533QS | |
| Ortalama NVIDIA GeForce RTX 3080 Laptop GPU (123 - 199, n=27) | |
| Aorus 15P YD | |
| MSI GP66 Leopard 10UG | |
| 1920x1080 Standard Quality | |
| Sınıf ortalaması Gaming (85.7 - 236, n=82, son 2 yıl) | |
| MSI GP66 Leopard 10UG | |
| Schenker XMG Neo 15 Tiger Lake | |
| Asus ROG Strix Scar 15 G533QS | |
| MSI GP66 Leopard 11UH-028 | |
| Ortalama NVIDIA GeForce RTX 3080 Laptop GPU (97 - 154, n=29) | |
| Aorus 15P YD | |
| 1920x1080 High Quality | |
| Sınıf ortalaması Gaming (41 - 215, n=95, son 2 yıl) | |
| Aorus 15P YD | |
| Schenker XMG Neo 15 Tiger Lake | |
| Asus ROG Strix Scar 15 G533QS | |
| MSI GP66 Leopard 10UG | |
| Ortalama NVIDIA GeForce RTX 3080 Laptop GPU (55.5 - 115, n=34) | |
Witcher 3 , GP66'da yaklaşık 120 fps'de başlar. İlk birkaç dakikadan sonra, bu değer oldukça sabit bir 110 fps'de düşer ve düzleşir ve bu değer bir saat sonra hala korunur. Bu bağlamda, dizüstü bilgisayar zamanla performansının sadece önemsiz bir kısmını kaybeder.
Witcher 3 FPS Diagramm
| düşük | orta | yüksek | ultra | |
|---|---|---|---|---|
| GTA V (2015) | 184 | 177 | 166 | 103 |
| The Witcher 3 (2015) | 344.8 | 300 | 196.5 | 110.2 |
| Dota 2 Reborn (2015) | 168 | 151 | 143 | 135 |
| Final Fantasy XV Benchmark (2018) | 136 | |||
| X-Plane 11.11 (2018) | 121 | 107 | 85.7 | |
| Far Cry 5 (2018) | 152 | 123 | 119 | 111 |
| Strange Brigade (2018) | 492 | 267 | 223 | 197 |
| New World (2021) | 132.7 | 105.4 | 96.7 | 90.4 |
Emisyonlar – Örnek fan davranışı
Gürültü yayılımı
Fanlar rölantideyken genellikle sessizdir ve genellikle uyarlanabilir fan davranışını severiz çünkü fanlar ağır yüklerden sonra bile çok çabuk sakinleşir. The Witcher 3'te tam bir saatten sonra bile , hayranlar yaklaşık 30 saniye sonra oldukça sessizleşti ve rölantideyken oldukça sessiz bir şekilde mırladı.
Fanlar ayrıca, Aşırı Performans Modunda boştayken çoğunlukla kapalı kalır ve ağır yüklerden sonra bile oldukça hızlı bir şekilde sakinleşir. Ancak ek olarak "Cooler Boost"u etkinleştirirseniz, fanlar aniden 58 dB'lik gürültü ile maksimum hıza çıkar.
Balanced, Extreme Performance ve Extreme Performance artı Cooler Boost arasındaki performans farkı ilginçtir - neredeyse hiç yoktur veya neredeyse yoktur! Öte yandan, gürültü seviyesinde önemli farklılıklar vardır. Balanced altında yaklaşık 47 dB, Extreme Performance altında yaklaşık 53 dB (buraya maksimum değer olarak girilmiştir) ve yukarıda bahsedilen 58 dB'yi Cooler Boost ile ölçtük!
Böylece GP66, dengeli modda en sessiz dizüstü bilgisayarlardan ve Cooler Boost ile en gürültülü dizüstü bilgisayarlardan biridir. Herhangi bir elektronik gürültü tespit etmedik.
Ses yüksekliği
| Boşta |
| 23 / 23 / 30.11 dB |
| Çalışırken |
| 41.86 / 53 dB |
 | ||
30 dB sessiz 40 dB(A) duyulabilirlik 50 dB(A) gürültülü |
||
min: | ||
| MSI GP66 Leopard 11UH-028 GeForce RTX 3080 Laptop GPU, i7-11800H, Samsung PM9A1 MZVL21T0HCLR | MSI GP66 Leopard 10UG GeForce RTX 3070 Laptop GPU, i7-10870H, Kingston OM8PCP31024F | Aorus 15P YD GeForce RTX 3080 Laptop GPU, i7-11800H, Samsung PM9A1 MZVL21T0HCLR | Asus ROG Strix Scar 15 G533QS GeForce RTX 3080 Laptop GPU, R9 5900HX, ADATA Swordfish 2 TB | Schenker XMG Neo 15 Tiger Lake GeForce RTX 3080 Laptop GPU, i7-11800H, Samsung SSD 980 Pro 1TB MZ-V8P1T0BW | Alienware m15 R6, i7-11800H RTX 3080 GeForce RTX 3080 Laptop GPU, i7-11800H, Samsung PM9A1 MZVL21T0HCLR | |
|---|---|---|---|---|---|---|
| Noise | -5% | -12% | -8% | -12% | -2% | |
| kapalı / ortam * (dB) | 23 | 24.7 -7% | 25 -9% | 25.5 -11% | 25 -9% | 23 -0% |
| Idle Minimum * (dB) | 23 | 26.8 -17% | 26 -13% | 25.5 -11% | 27 -17% | 23 -0% |
| Idle Average * (dB) | 23 | 26.8 -17% | 30 -30% | 25.5 -11% | 30 -30% | 23 -0% |
| Idle Maximum * (dB) | 30.11 | 26.8 11% | 34 -13% | 37.1 -23% | 32 -6% | 30 -0% |
| Load Average * (dB) | 41.86 | 40.4 3% | 43 -3% | 39.2 6% | 46 -10% | 41.26 1% |
| Witcher 3 ultra * (dB) | 47.79 | 48.8 -2% | 50 -5% | 50.5 -6% | 52 -9% | 53.4 -12% |
| Load Maximum * (dB) | 53 | 57.2 -8% | 57 -8% | 51.8 2% | 55 -4% | 53.37 -1% |
* ... daha küçük daha iyidir
Sıcaklıklar
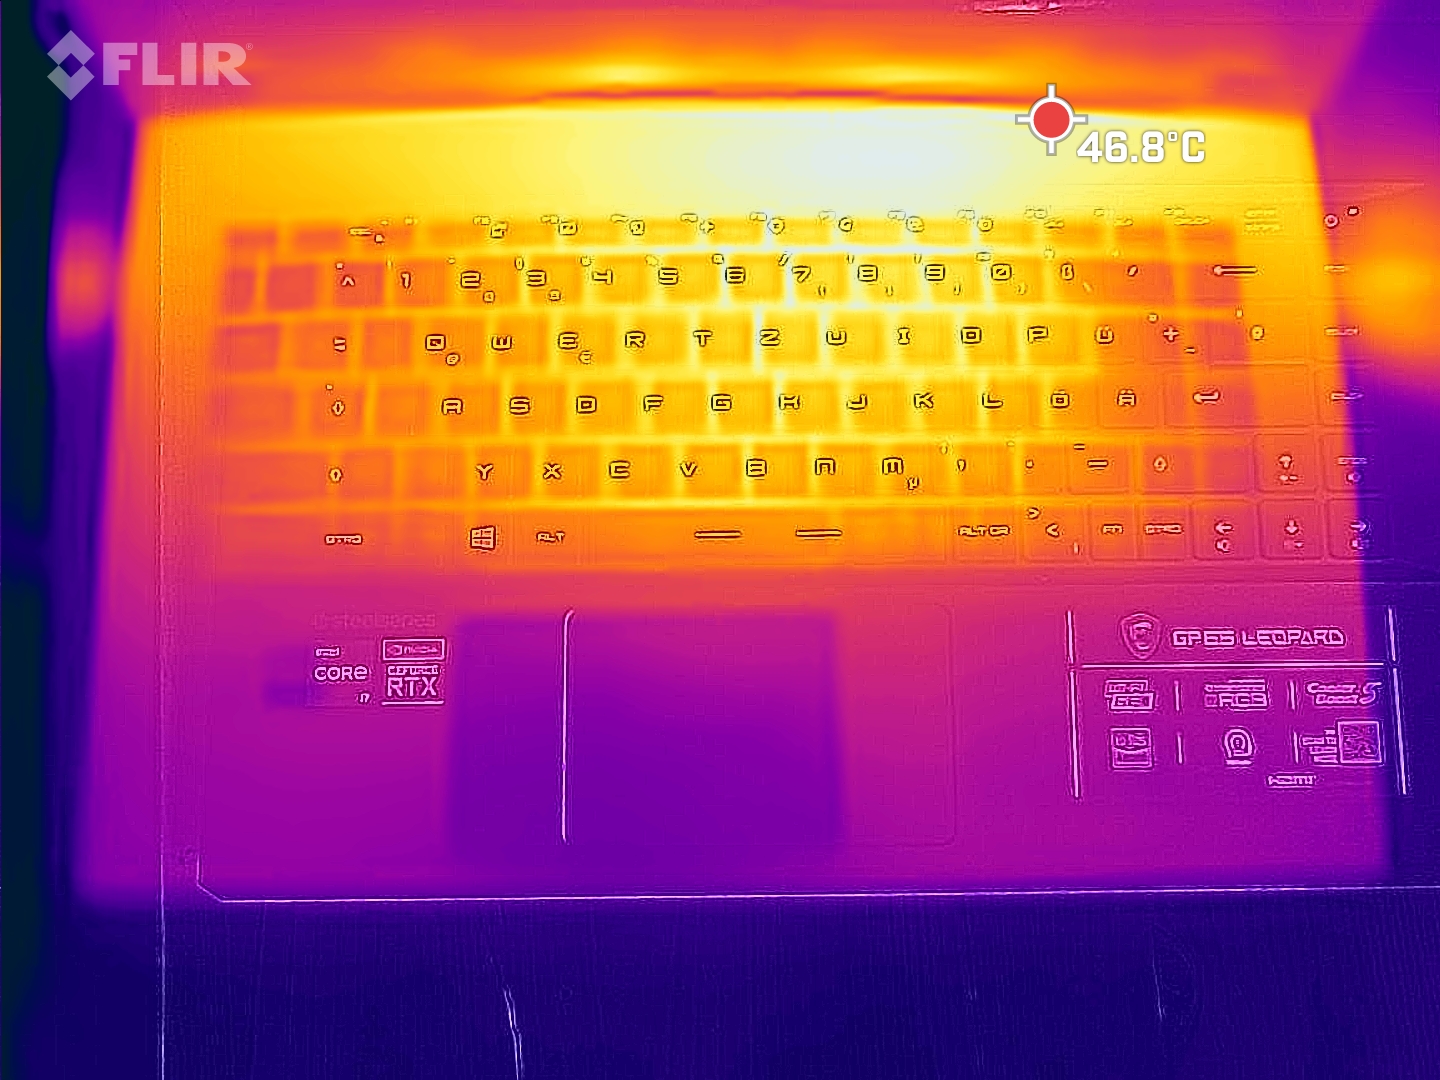
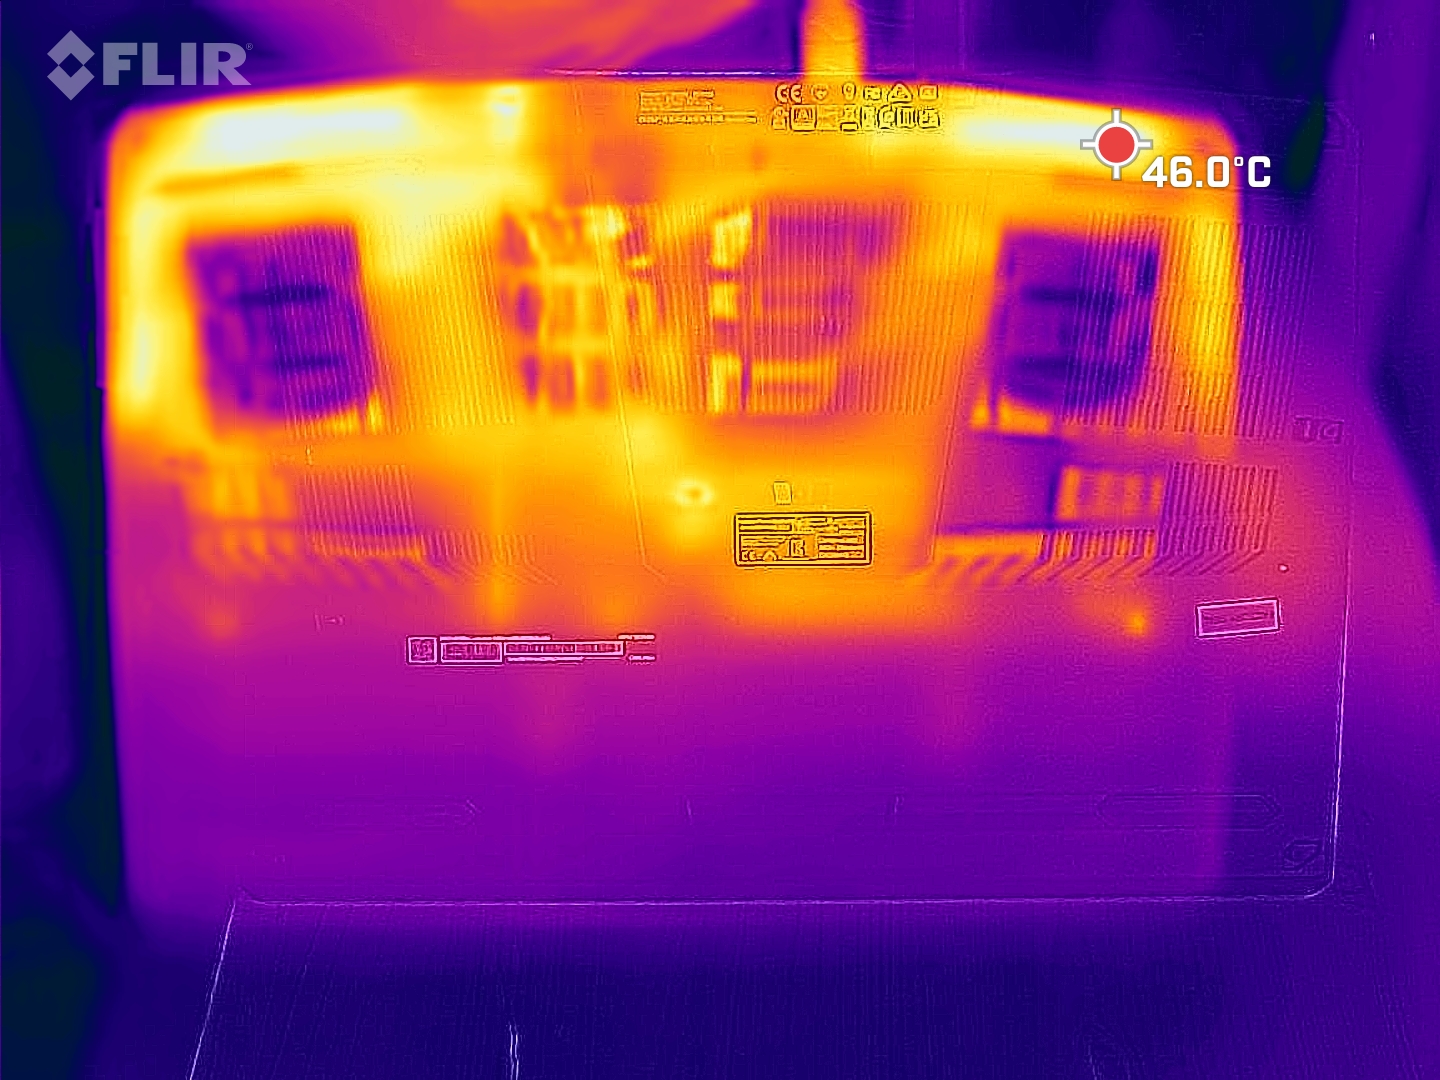
Oyun sırasında üst ve alt kısımdaki sıcak noktalar 54 °C'ye kadar çıkıyor ve bu da oyuncuyu rekabetin ortasında tutuyor. Alienware ve Aorus daha da ısınırken, Asus ve XMG daha serin kalıyor ancak daha yüksek soğutma sistemine sahip.
Yukarıda belirtilen tüm ölçümler Dengeli modda yapılmıştır. Performans daha yüksek modlarda, en azından oyunlarda fazla artmadığı için, daha hızlı dönen fanlar nedeniyle sıcaklıklar muhtemelen daha da düşecek.
(-) Üst taraftaki maksimum sıcaklık, 40.4 °C / 105 F ortalamasına kıyasla 49 °C / 120 F'dir. , Gaming sınıfı için 21.2 ile 68.8 °C arasında değişir.
(-) Alt kısım, 43.2 °C / 110 F ortalamasına kıyasla maksimum 47 °C / 117 F'ye kadar ısınır
(+) Boşta kullanımda, üst tarafın ortalama sıcaklığı 26.7 °C / 80 F olup, cihazın 33.9 °C / 93 F.
(-) The Witcher 3 oynarken, üst tarafın ortalama sıcaklığı 43.9 °C / 111 F olup, cihazın 33.9 °C / 93 F.
(+) Avuç içi dayanakları ve dokunmatik yüzey maksimum (32 °C / 89.6 F) cilt sıcaklığına ulaşıyor ve bu nedenle sıcak değil.
(-) Benzer cihazların avuç içi dayanağı alanının ortalama sıcaklığı 28.8 °C / 83.8 F (-3.2 °C / -5.8 F) idi.
| MSI GP66 Leopard 11UH-028 Intel Core i7-11800H, NVIDIA GeForce RTX 3080 Laptop GPU | MSI GP66 Leopard 10UG Intel Core i7-10870H, NVIDIA GeForce RTX 3070 Laptop GPU | Aorus 15P YD Intel Core i7-11800H, NVIDIA GeForce RTX 3080 Laptop GPU | Asus ROG Strix Scar 15 G533QS AMD Ryzen 9 5900HX, NVIDIA GeForce RTX 3080 Laptop GPU | Schenker XMG Neo 15 Tiger Lake Intel Core i7-11800H, NVIDIA GeForce RTX 3080 Laptop GPU | Alienware m15 R6, i7-11800H RTX 3080 Intel Core i7-11800H, NVIDIA GeForce RTX 3080 Laptop GPU | |
|---|---|---|---|---|---|---|
| Heat | 3% | -9% | -5% | -2% | -20% | |
| Maximum Upper Side * (°C) | 49 | 42.8 13% | 49 -0% | 43.4 11% | 39 20% | 61 -24% |
| Maximum Bottom * (°C) | 47 | 50 -6% | 57 -21% | 48.2 -3% | 50 -6% | 58 -23% |
| Idle Upper Side * (°C) | 31 | 33 -6% | 33 -6% | 35.2 -14% | 34 -10% | 38 -23% |
| Idle Bottom * (°C) | 33 | 29 12% | 36 -9% | 37 -12% | 37 -12% | 36 -9% |
* ... daha küçük daha iyidir
Stres testi
İşlemci’nin 8 çekirdeği, stres testimize yaklaşık 4,2 GHz ile başlıyor. Ancak, çekirdek sıcaklığı yaklaşık bir dakika içinde 96 °C'ye ulaştıktan sonra saat hızı kısılır. Kısa süreliğine 3 GHz'in altına düşer, ancak daha sonra bu sınırı tekrar aşar. Bir saat sonra yaklaşık 3,3 GHz ölçtük ve sıcaklık seviyeleri saat hızlarına bağlı olarak 82 ile 86 °C arasında değişiyor.
GPU saati, tüm test süresi boyunca 1,3 ile 1,7 GHz arasında dalgalanır. GPU çekirdekleri 76 °C'ye kadar sıcaklıklara ulaşır.
Stres testinden sonra sistem hızla tekrar sakinleşir. Stres testinin bitiminden hemen sonra çalıştırılan başka bir 3DMark 11, öncekiyle kabaca aynı puanı verdi.
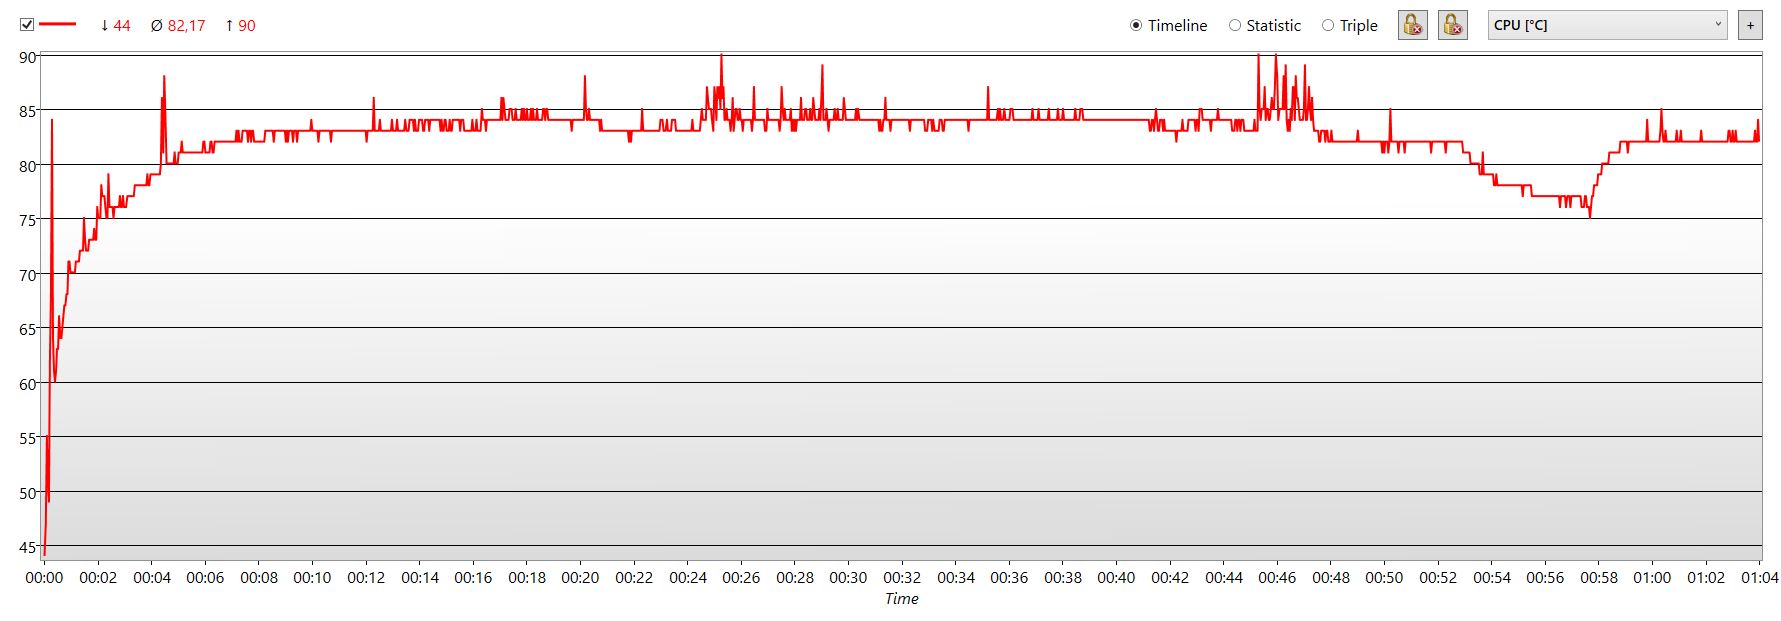
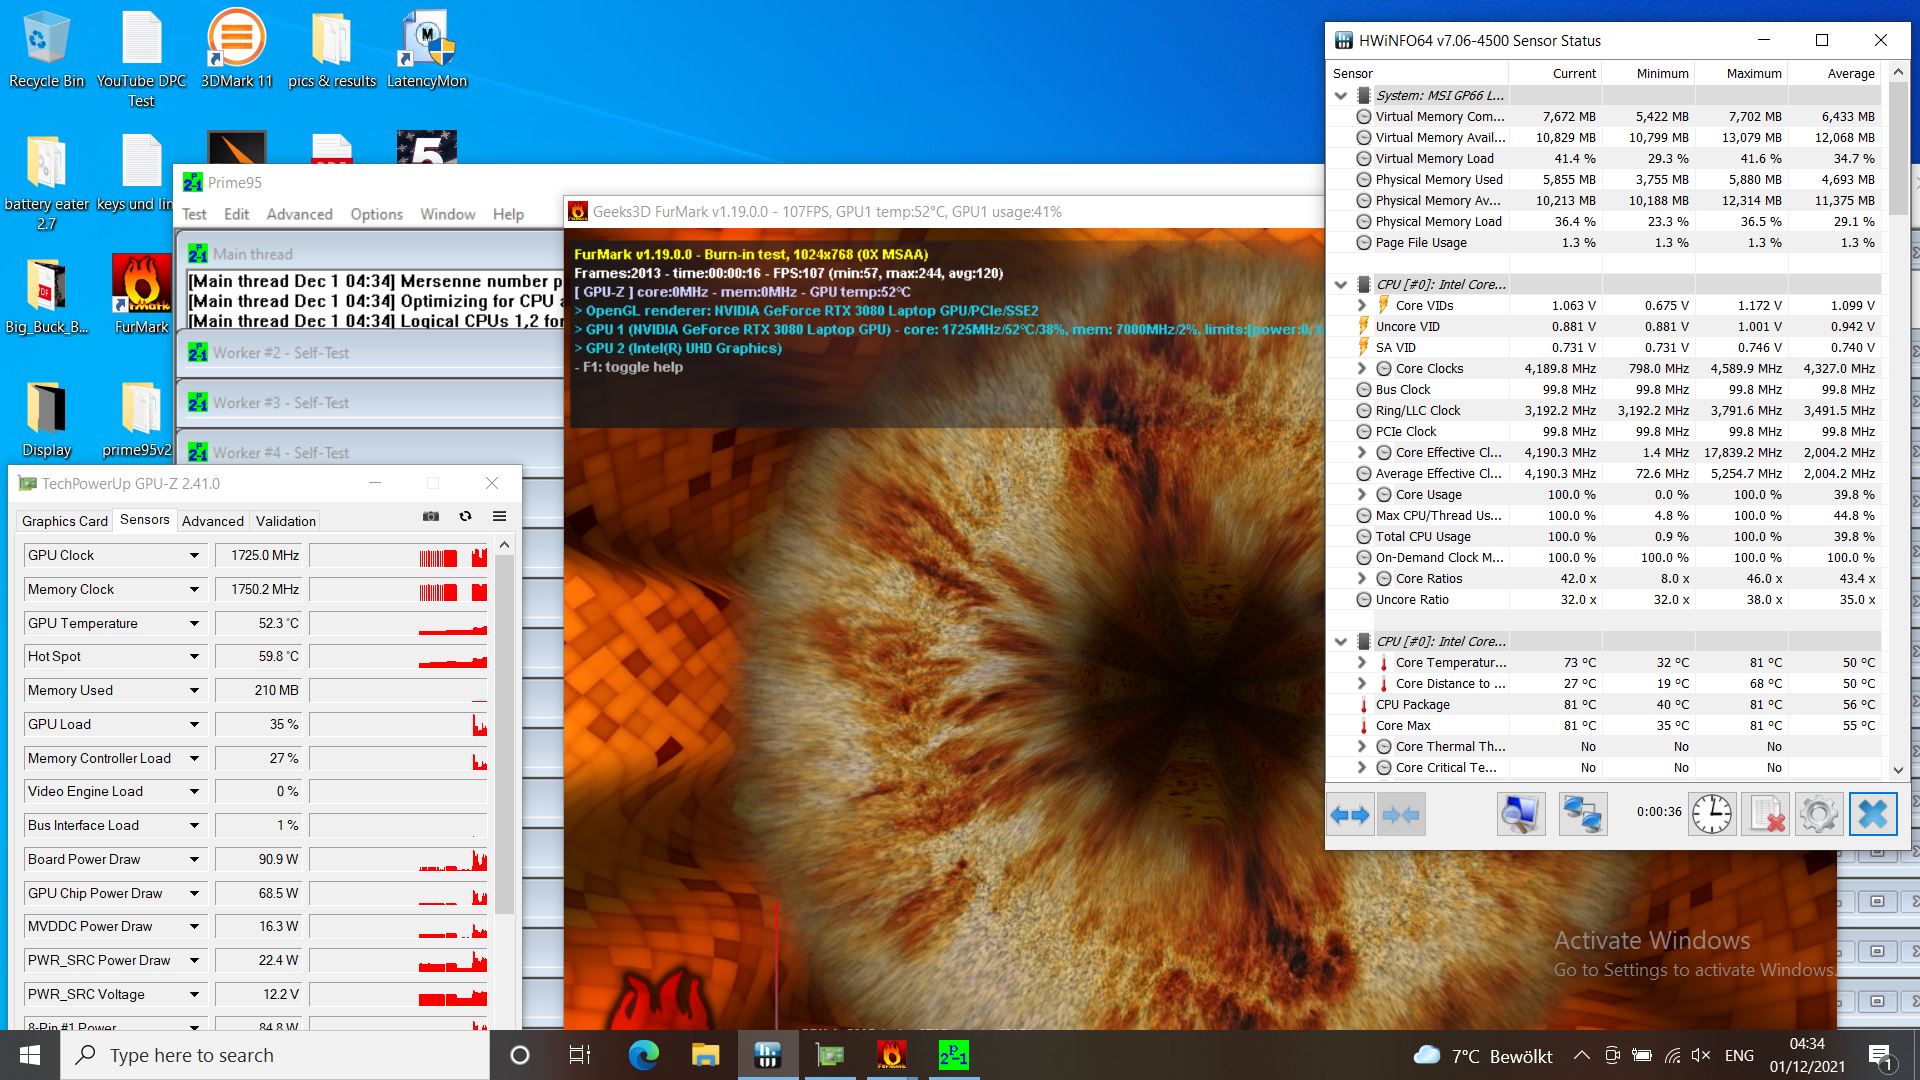
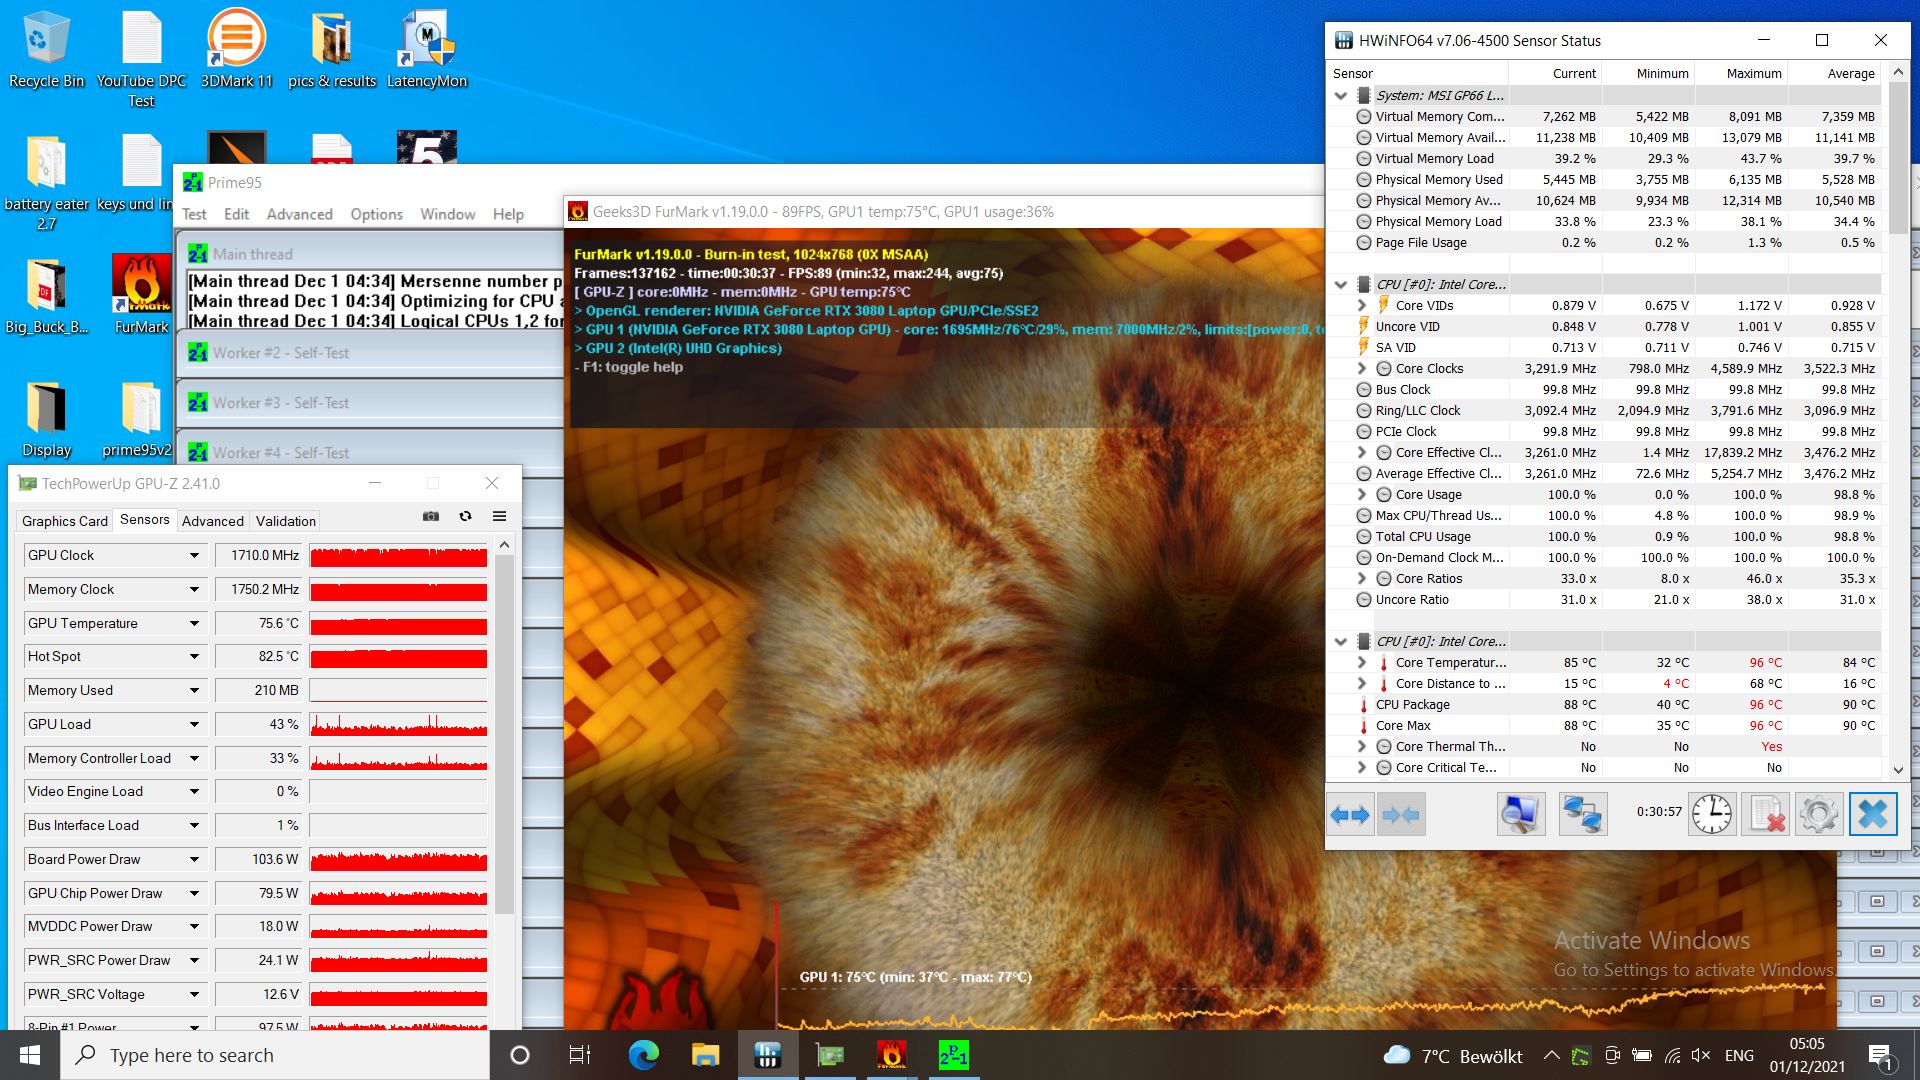
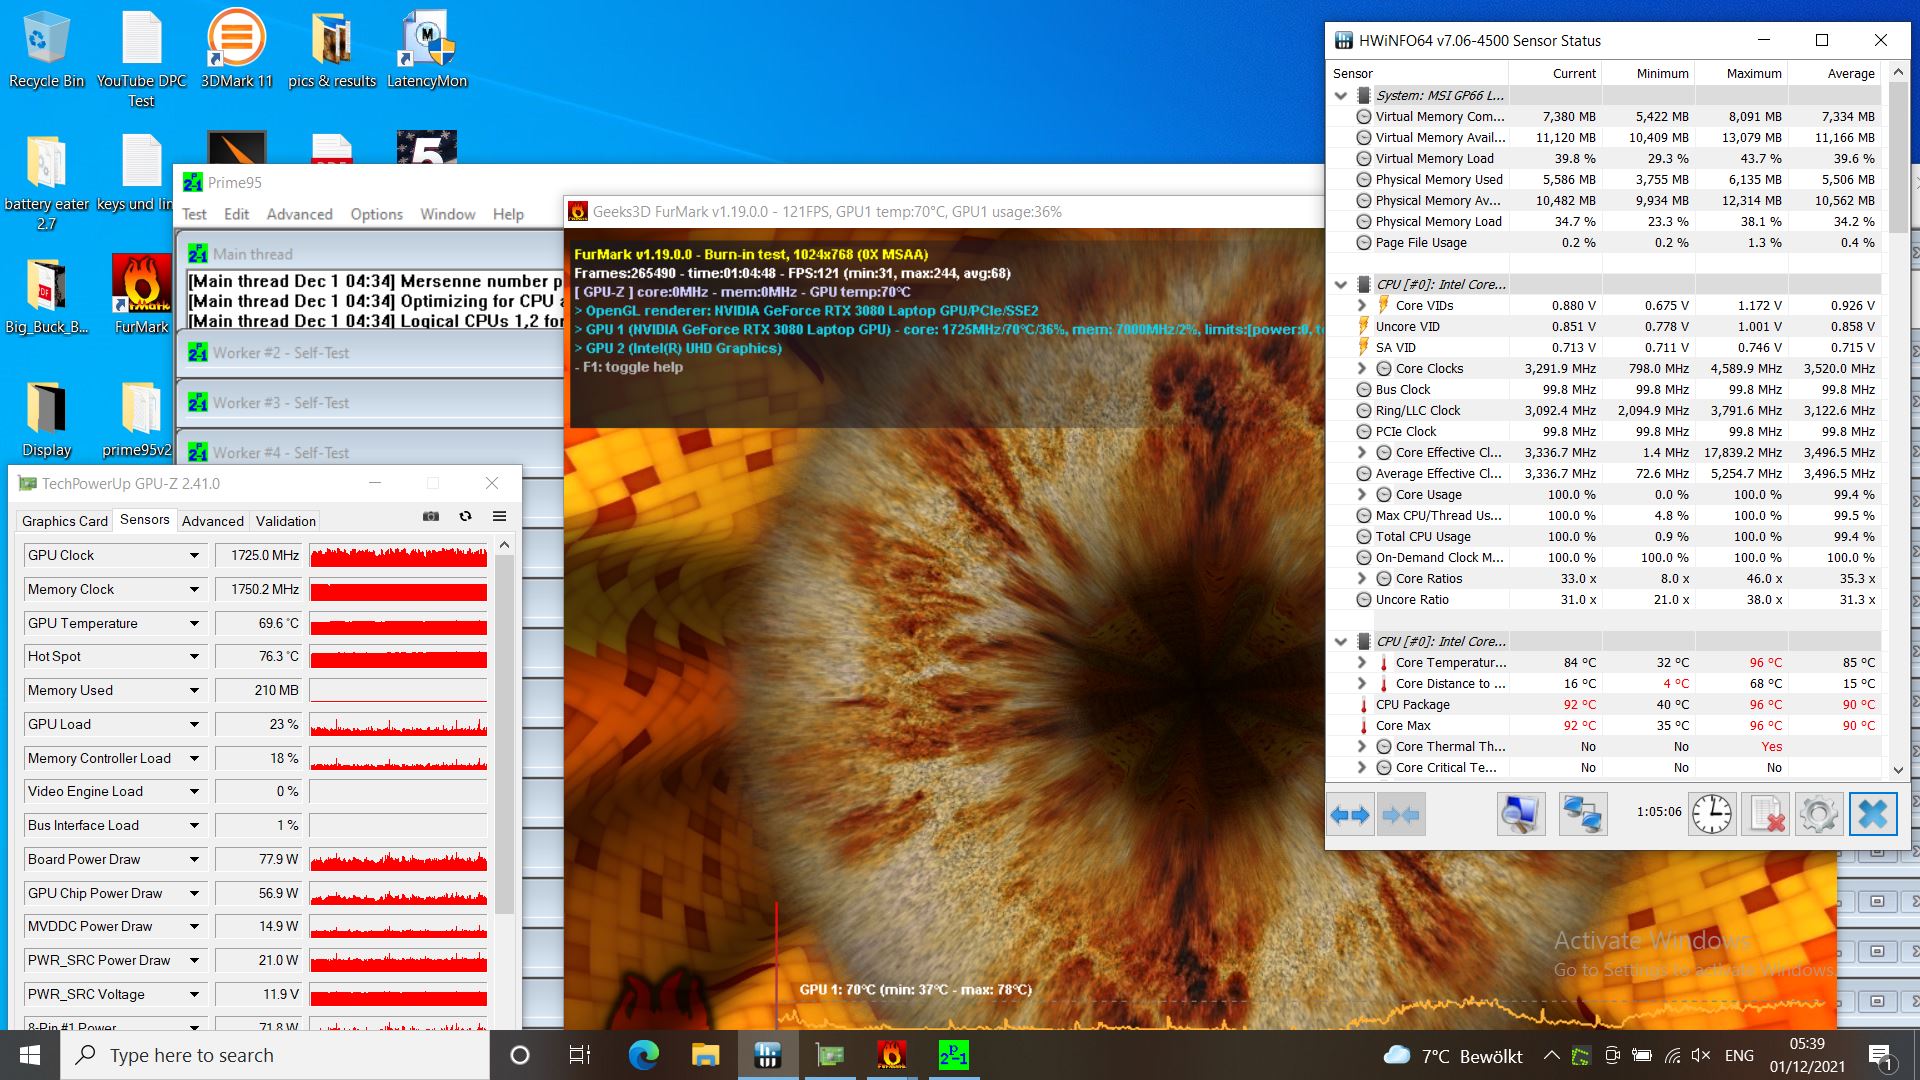
| İşlemci Saati(GHz) | Ekran Kartı Saati Ortalama | İşlemci Sıcaklığı (°C) | Ortalama Ekran Kartı Sıcaklığı (°C)) | |
| Sistem Boşta | 4.5 GHz | 350 MHz | 35 | 32 |
| Prime95 + FurMark Stres Testi | 2.8 - 3.3 GHz | 1.3 - 1.7 GHz | 85 | 76 |
| Witcher 3 Stres | 4.2 GHz | 1.3 - 1.7 GHz | 85 | 76 |
Hoparlör
Olumlu tarafı, hoparlörler oldukça yüksek sesle çalabiliyor ve orta ve tizler oldukça dengeli görünüyor. Bununla birlikte, doğal olarak, tüm geleneksel dizüstü bilgisayar hoparlörlerinin ortak şikayeti olan bas eksikliğinden muzdariptirler. Kulaklıklar gibi harici ses cihazları, analog altın kaplama mini jak kulaklık bağlantı noktası aracılığıyla bağlanabilir.
MSI GP66 Leopard 11UH-028 ses analizi
(+) | hoparlörler nispeten yüksek sesle çalabilir (85.6 dB)
Bas 100 - 315Hz
(-) | neredeyse hiç bas yok - ortalama olarak medyandan 22.9% daha düşük
(±) | Bas doğrusallığı ortalamadır (8.9% delta - önceki frekans)
Ortalar 400 - 2000 Hz
(+) | dengeli ortalar - medyandan yalnızca 2.8% uzakta
(+) | orta frekanslar doğrusaldır (3.9% deltadan önceki frekansa)
Yüksekler 2 - 16 kHz
(+) | dengeli yüksekler - medyandan yalnızca 4.6% uzakta
(+) | yüksekler doğrusaldır (6.6% deltadan önceki frekansa)
Toplam 100 - 16.000 Hz
(±) | Genel sesin doğrusallığı ortalamadır (16.9% ortancaya göre fark)
Aynı sınıfla karşılaştırıldığında
» Bu sınıftaki tüm test edilen cihazların %44%'si daha iyi, 11% benzer, 44% daha kötüydü
» En iyisinin deltası 6% idi, ortalama 18% idi, en kötüsü 132% idi
Test edilen tüm cihazlarla karşılaştırıldığında
» Test edilen tüm cihazların %30'si daha iyi, 8 benzer, % 62 daha kötüydü
» En iyisinin deltası 4% idi, ortalama 23% idi, en kötüsü 134% idi
Schenker XMG Neo 15 Tiger Lake ses analizi
(±) | hoparlör ses yüksekliği ortalama ama iyi (79 dB)
Bas 100 - 315Hz
(-) | neredeyse hiç bas yok - ortalama olarak medyandan 22.6% daha düşük
(±) | Bas doğrusallığı ortalamadır (9.5% delta - önceki frekans)
Ortalar 400 - 2000 Hz
(+) | dengeli ortalar - medyandan yalnızca 4.7% uzakta
(±) | Ortaların doğrusallığı ortalamadır (9.1% delta - önceki frekans)
Yüksekler 2 - 16 kHz
(+) | dengeli yüksekler - medyandan yalnızca 4.1% uzakta
(+) | yüksekler doğrusaldır (5.3% deltadan önceki frekansa)
Toplam 100 - 16.000 Hz
(±) | Genel sesin doğrusallığı ortalamadır (19.4% ortancaya göre fark)
Aynı sınıfla karşılaştırıldığında
» Bu sınıftaki tüm test edilen cihazların %67%'si daha iyi, 7% benzer, 26% daha kötüydü
» En iyisinin deltası 6% idi, ortalama 18% idi, en kötüsü 132% idi
Test edilen tüm cihazlarla karşılaştırıldığında
» Test edilen tüm cihazların %48'si daha iyi, 7 benzer, % 45 daha kötüydü
» En iyisinin deltası 4% idi, ortalama 23% idi, en kötüsü 134% idi
Güç yönetimi - Küçük pilli leopar
Enerji tüketimi
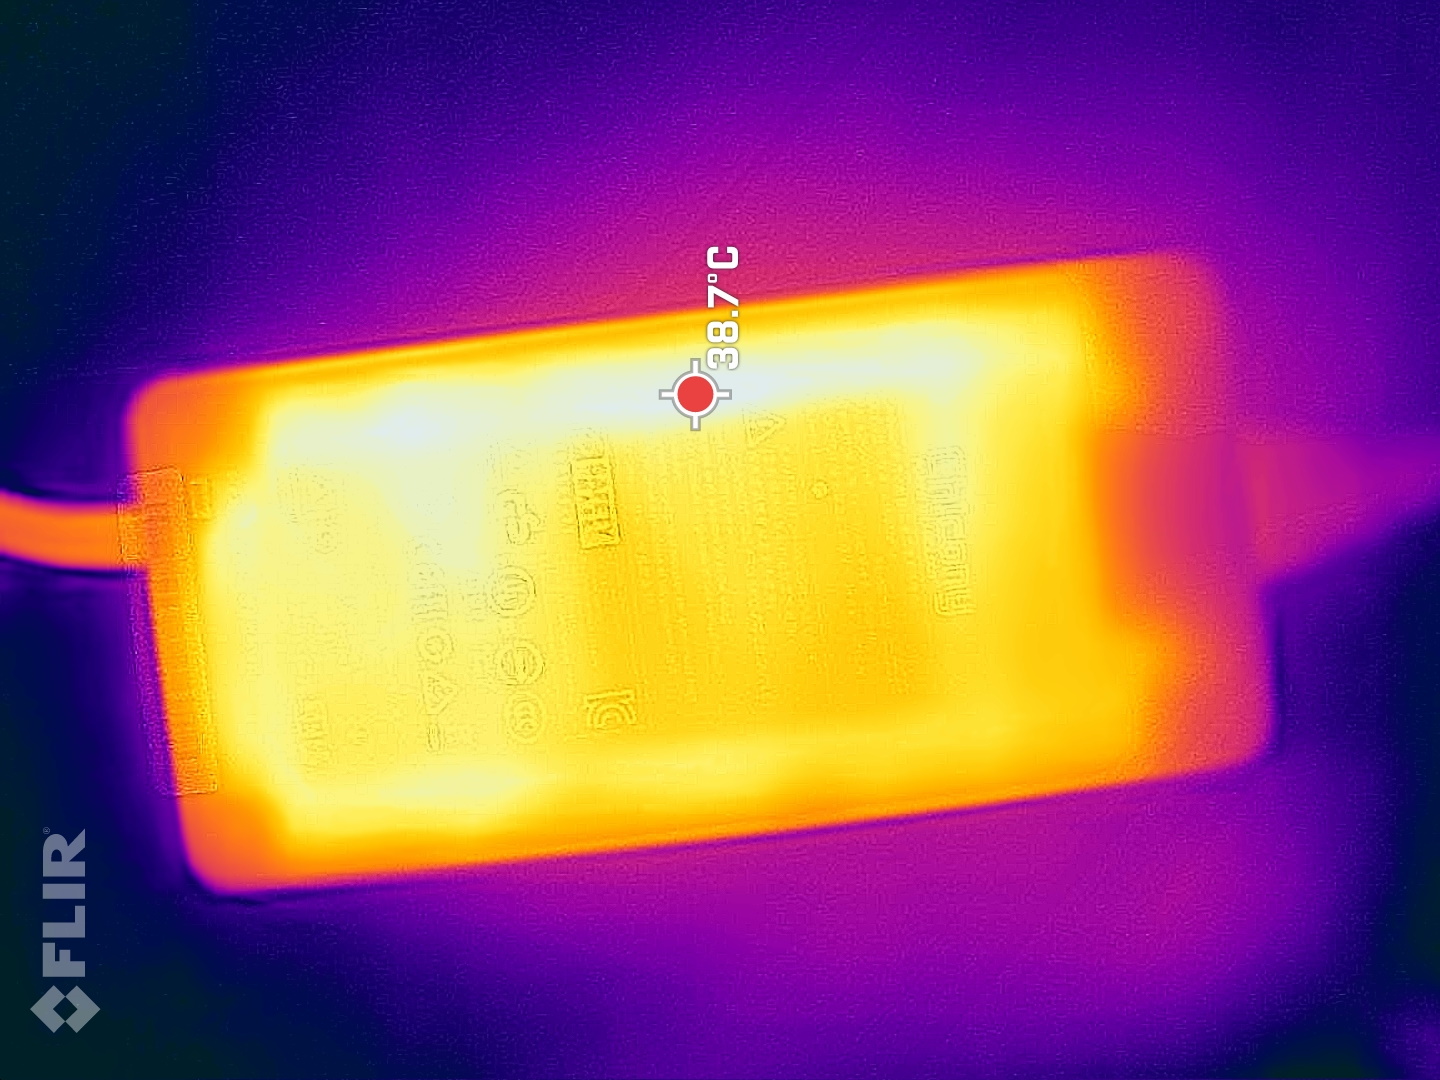
The Witcher 3'ü oynarken ortalama 207 W'lık bir tüketim ölçtük , bu da rekabetin ihtiyacından biraz daha fazla. Maksimum 223 W, en iyi tüketiciler Aorus ve Alienware ile daha tutumlu diğer rakipler arasındadır.
Güç kaynağı 280 W ile cömertçe boyutlandırılmıştır ve şarj ile ilgili herhangi bir sorun yaşamamalıdır
| Boşta | |
| Çalışırken |
|
Key:
min: | |
| MSI GP66 Leopard 11UH-028 i7-11800H, GeForce RTX 3080 Laptop GPU, Samsung PM9A1 MZVL21T0HCLR, IPS, 1920x1080, 15.6" | MSI GP66 Leopard 10UG i7-10870H, GeForce RTX 3070 Laptop GPU, Kingston OM8PCP31024F, IPS, 1920x1080, 15.6" | Aorus 15P YD i7-11800H, GeForce RTX 3080 Laptop GPU, Samsung PM9A1 MZVL21T0HCLR, IPS, 1920x1080, 15.6" | Asus ROG Strix Scar 15 G533QS R9 5900HX, GeForce RTX 3080 Laptop GPU, ADATA Swordfish 2 TB, IPS, 2560x1440, 15.6" | Schenker XMG Neo 15 Tiger Lake i7-11800H, GeForce RTX 3080 Laptop GPU, Samsung SSD 980 Pro 1TB MZ-V8P1T0BW, IPS, 2560x1440, 15.6" | Alienware m15 R6, i7-11800H RTX 3080 i7-11800H, GeForce RTX 3080 Laptop GPU, Samsung PM9A1 MZVL21T0HCLR, IPS, 1920x1080, 15.6" | Ortalama NVIDIA GeForce RTX 3080 Laptop GPU | Sınıf ortalaması Gaming | |
|---|---|---|---|---|---|---|---|---|
| Power Consumption | -7% | -40% | -7% | -7% | -9% | -39% | -16% | |
| Idle Minimum * (Watt) | 13 | 15.3 -18% | 23 -77% | 11.2 14% | 15 -15% | 14 -8% | 19.8 ? -52% | 13 ? -0% |
| Idle Average * (Watt) | 17 | 21.2 -25% | 25 -47% | 16.4 4% | 17 -0% | 18 -6% | 24.3 ? -43% | 19 ? -12% |
| Idle Maximum * (Watt) | 18 | 22.3 -24% | 35 -94% | 29.4 -63% | 22 -22% | 29 -61% | 33.3 ? -85% | 24.6 ? -37% |
| Load Average * (Watt) | 96 | 82.3 14% | 101 -5% | 106.2 -11% | 101 -5% | 93 3% | 108.1 ? -13% | 110.7 ? -15% |
| Witcher 3 ultra * (Watt) | 207 | 191.2 8% | 190 8% | 189 9% | 195 6% | 190 8% | ||
| Load Maximum * (Watt) | 223 | 216.6 3% | 280 -26% | 213.6 4% | 230 -3% | 203 9% | 230 ? -3% | 259 ? -16% |
* ... daha küçük daha iyidir
Power consumption Witcher 3 / Stress test
Pil ömrü
MSI, RTX 3080'li bir oyun dizüstü bilgisayarı için çok küçük olan 65 Wh'lik bir pil kullanıyor. Rekabette 84 veya 90 Wh ve üzeri piller var!
Buna göre, çalışma süreleri soketten uzakta zayıf ve Leopard'ın bütçe fiyatı burada fark ediliyor. Yalnızca 3,5 saatlik gezinme veya video izleme hayal kırıklığı yaratacak kadar düşük, rekabet yüzde 40 ila 100 daha uzun sürüyor (Asus ROG). Dizüstü bilgisayar, oyun oynamak için yalnızca dörtte üçü bir saat sunabilir ( The Witcher 3 ).
| MSI GP66 Leopard 11UH-028 i7-11800H, GeForce RTX 3080 Laptop GPU, 65 Wh | MSI GP66 Leopard 10UG i7-10870H, GeForce RTX 3070 Laptop GPU, 65 Wh | Aorus 15P YD i7-11800H, GeForce RTX 3080 Laptop GPU, 99 Wh | Asus ROG Strix Scar 15 G533QS R9 5900HX, GeForce RTX 3080 Laptop GPU, 90 Wh | Schenker XMG Neo 15 Tiger Lake i7-11800H, GeForce RTX 3080 Laptop GPU, 93 Wh | Alienware m15 R6, i7-11800H RTX 3080 i7-11800H, GeForce RTX 3080 Laptop GPU, 84 Wh | Sınıf ortalaması Gaming | |
|---|---|---|---|---|---|---|---|
| Pil Çalışma Süresi | 13% | 61% | 60% | 83% | 44% | 87% | |
| H.264 (h) | 3.5 | 5.9 69% | 5.6 60% | 8.32 ? 138% | |||
| WiFi v1.3 (h) | 3.6 | 5.1 42% | 5.3 47% | 7.3 103% | 5.6 56% | 5 39% | 7.11 ? 98% |
| Witcher 3 ultra (h) | 0.8 | ||||||
| Load (h) | 1.2 | 1 -17% | 2.1 75% | 1.4 17% | 2.7 125% | 1.6 33% | 1.502 ? 25% |
| Reader / Idle (h) | 6.6 | 7.5 | 11.1 | 8.27 ? |
Artılar
Eksiler
Son Görüş – Uygun bütçeli, yüksek performanslı dizüstü oyuncu bilgisayarı
Nvidia RTX 3080 ve buna bağlı olarak 2.000 Euro'dan daha düşük bir fiyata yüksek, rekabetçi performansa sahip modern bir oyun dizüstü bilgisayarı bugünlerde muhtemelen nadirdir. MSI, düşük fiyatına rağmen saf performansının hemen dışında da pek çok şey yapıyor. Örneğin, uyarlanabilir soğutma sistemi, Extreme Performance Mode'da bile bizi gerçekten şaşırttı - Alienwares gibi çok daha pahalı rakipler bu kitaptan bir yaprak çıkarabilir. Ve ekran da bir bütçe paneli değil, en azından parlaklık açısından rekabeti geride bırakıyor.
Tabii ki, bu fiyat kategorisinde birkaç tavizi de kabul etmeniz gerekiyor. Bunlar, Leopard'ın zayıf pil çalışma sürelerini ve daha karmaşık bakımda da fark edilen optimum yapı kalitesinden daha azını içerir. Yeni GP66 modelinde 2021'in sonunda güncel olmayan USB-C bağlantı noktasının kalmamasına neredeyse şok oluyoruz! Bunu aşabilirseniz, şu anda aynı anda çok fazla şey yapan daha ucuz bir RTX 3080 oyuncusu bulamazsınız.
Leopard GP66 11UH, bazı yerlerde üst düzey modellerin bile solgun görünmesini sağlayan ekonomik bir oyun dizüstü bilgisayarıdır. Tabii ki, USB-C'nin olmaması veya düşük pil çalışma süreleri gibi dezavantajlar var, ancak performans, soğutma ve ekran da daha yüksek kategorilere giriyor.
Bu fiyat aralığında bu özelliklerle rekabet nadirdir. Ve daha pahalı rakipler bile her şeyi daha iyi yapmıyor, bkz. soğutma sistemi. Testteki karşılaştırma cihazlarının tümü daha pahalıdır, ancak performans, görüntü ve özellikle soğutma sistemi açısından her şeyden üstündürler. Ancak, USB-C veya daha uzun pil kullanım süreleri için daha fazla ödeme yapmanız gerekir. Alternatif olarak, en iyi ucuz oyun dizüstü bilgisayarları listemize bir göz atmanızı öneririz.
Fiyat ve Bulunabilirlik
Test modelimiz şu anda Computeruniverse,'deki en ucuz modeldir, burada dizüstü bilgisayar şu anda 1.899 € (~ 2.140 $) tutarındadır. Ancak yapılandırmamız Cyberport'ta 2.000 €' nun (~2.253 $) hemen altında bir fiyatla elde edilebilir.
MSI GP66 Leopard 11UH-028
- 12/08/2021 v7 (old)
Christian Hintze
Price comparison
