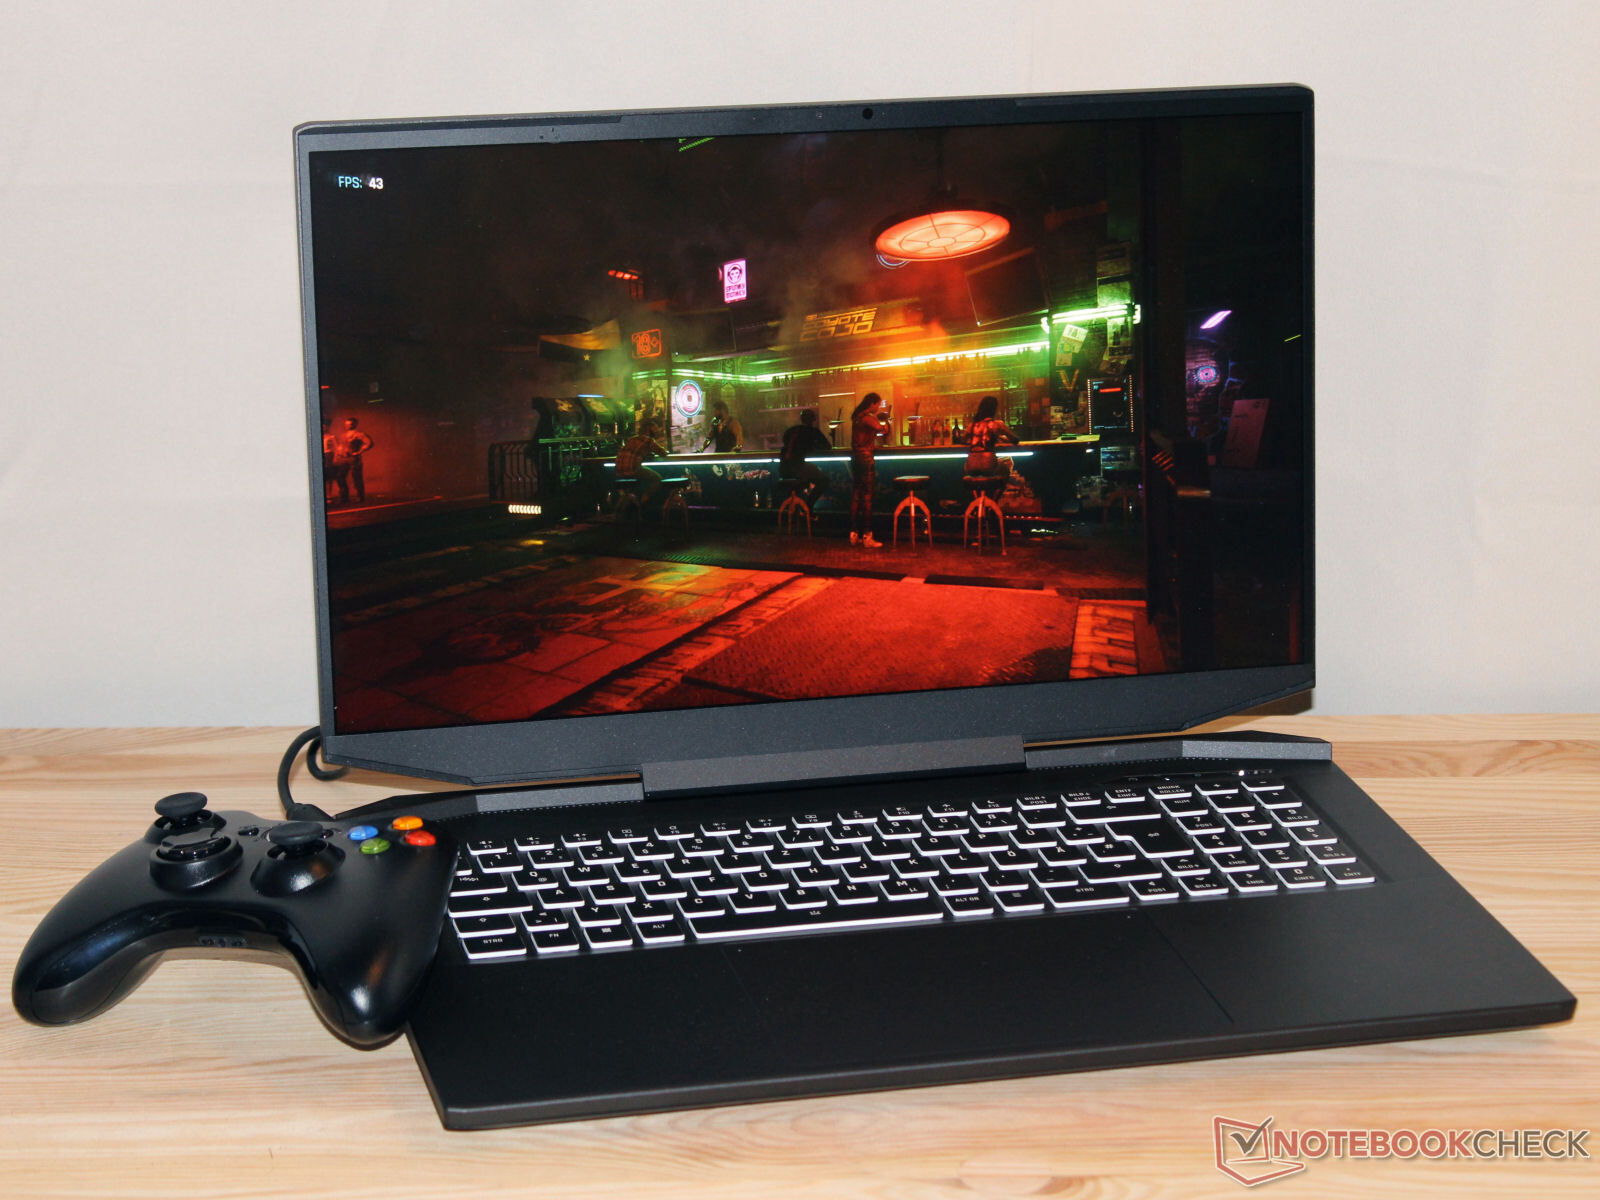
XMG Apex 17 (geç 23) incelemesi: RTX 4060'a sahip bir QHD oyun dizüstü bilgisayarı
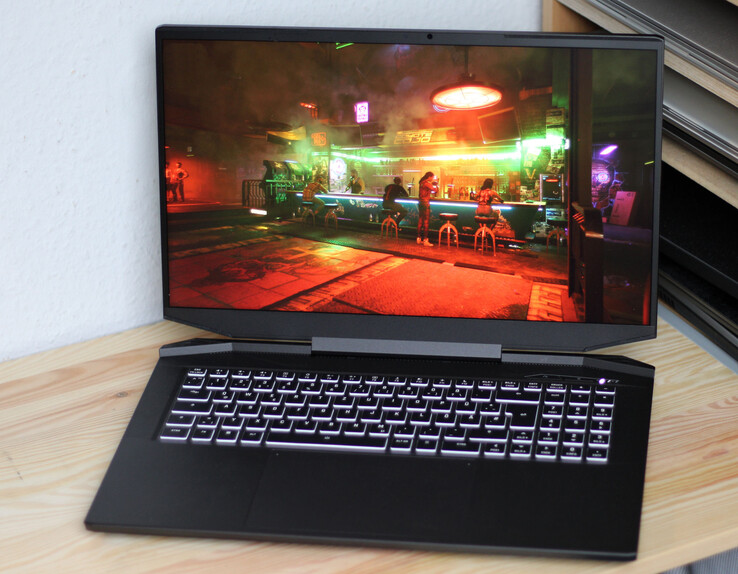
XMG Apex 17 (geç 23), TongFang barebone (GM7XG0) tabanlı orta sınıf, QHD bir oyun dizüstü bilgisayarıdır ve bu varyantta 1.800 Euro'nun biraz altında bir fiyata mevcuttur. Paket şunlardan oluşmaktadır Ryzen 7 7840HS, GeForce RTX 4060 (alternatif olarak: RTX 4050), 32 GB RAM ve 1 TB SSD ile donatılmıştır. Rekabet şu şekilde bulunabilirAcer Nitro 17 AN17-51, theAlienware m16 R1, theLenovo Legion Pro 5 16IRX8, theMSI Katana 17 B13VFKveMedion Erazer Defender P40.
Karşılaştırmalı olarak olası rakipler
Derecelendirme | Tarih | Modeli | Ağırlık | Yükseklik | Boyut | Çözünürlük | Fiyat |
|---|---|---|---|---|---|---|---|
| 87.1 % v7 (old) | 10/2023 | Schenker XMG Apex 17 (Late 23) R7 7840HS, GeForce RTX 4060 Laptop GPU | 2.5 kg | 24.9 mm | 17.30" | 2560x1440 | |
| 88.3 % v7 (old) | 07/2023 | Alienware m16 R1 Intel i7-13700HX, GeForce RTX 4060 Laptop GPU | 3 kg | 25.4 mm | 16.00" | 2560x1600 | |
| 87.9 % v7 (old) | 05/2023 | Lenovo Legion Pro 5 16IRX8 i7-13700HX, GeForce RTX 4060 Laptop GPU | 2.5 kg | 26.8 mm | 16.00" | 2560x1600 | |
| 87.2 % v7 (old) | 12/2023 | Acer Nitro 17 AN17-51-71ER i7-13700H, GeForce RTX 4060 Laptop GPU | 3 kg | 30.3 mm | 17.30" | 2560x1440 | |
| 84.6 % v7 (old) | 08/2023 | Medion Erazer Defender P40 i7-13700HX, GeForce RTX 4060 Laptop GPU | 2.9 kg | 33 mm | 17.30" | 2560x1440 | |
| 82.1 % v7 (old) | 06/2023 | MSI Katana 17 B13VFK i7-13620H, GeForce RTX 4060 Laptop GPU | 2.8 kg | 25.2 mm | 17.30" | 1920x1080 |
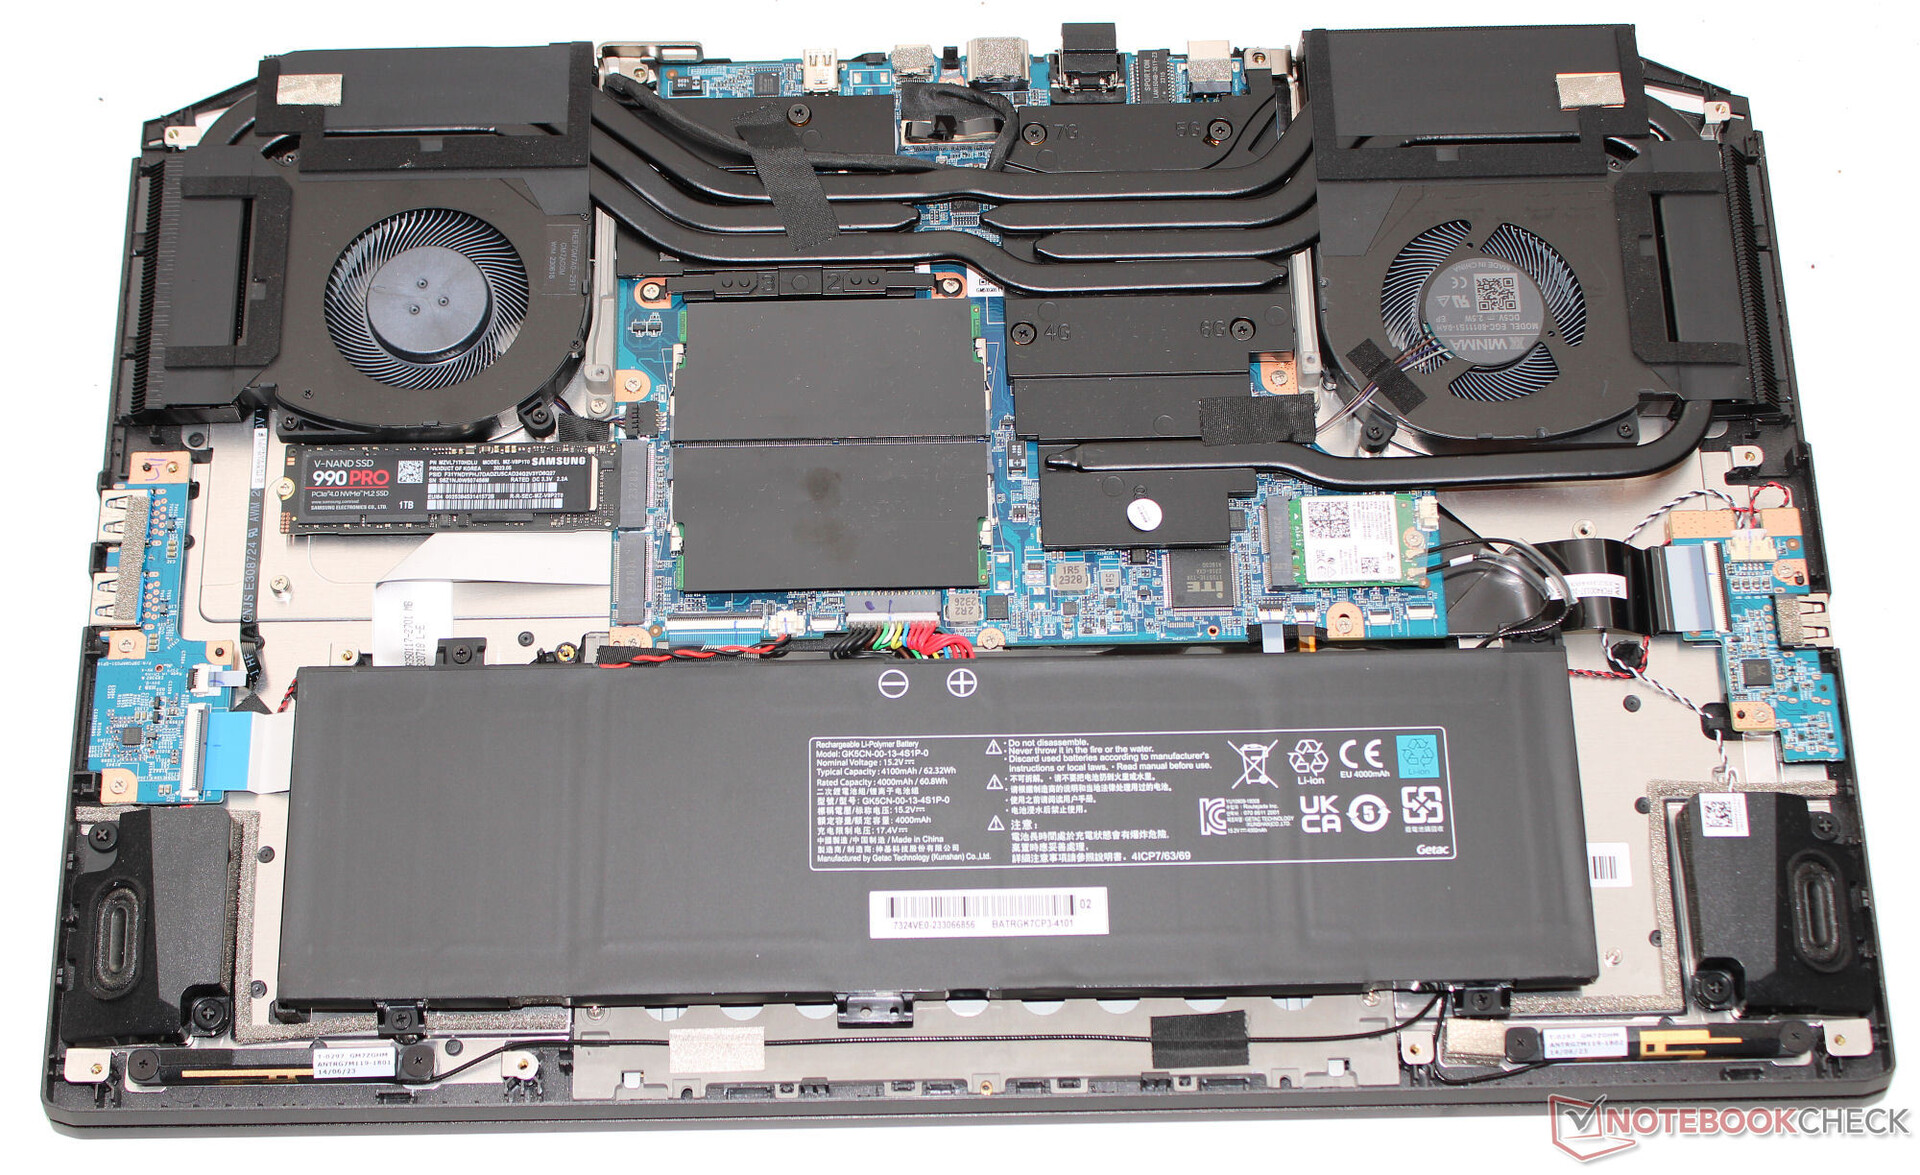
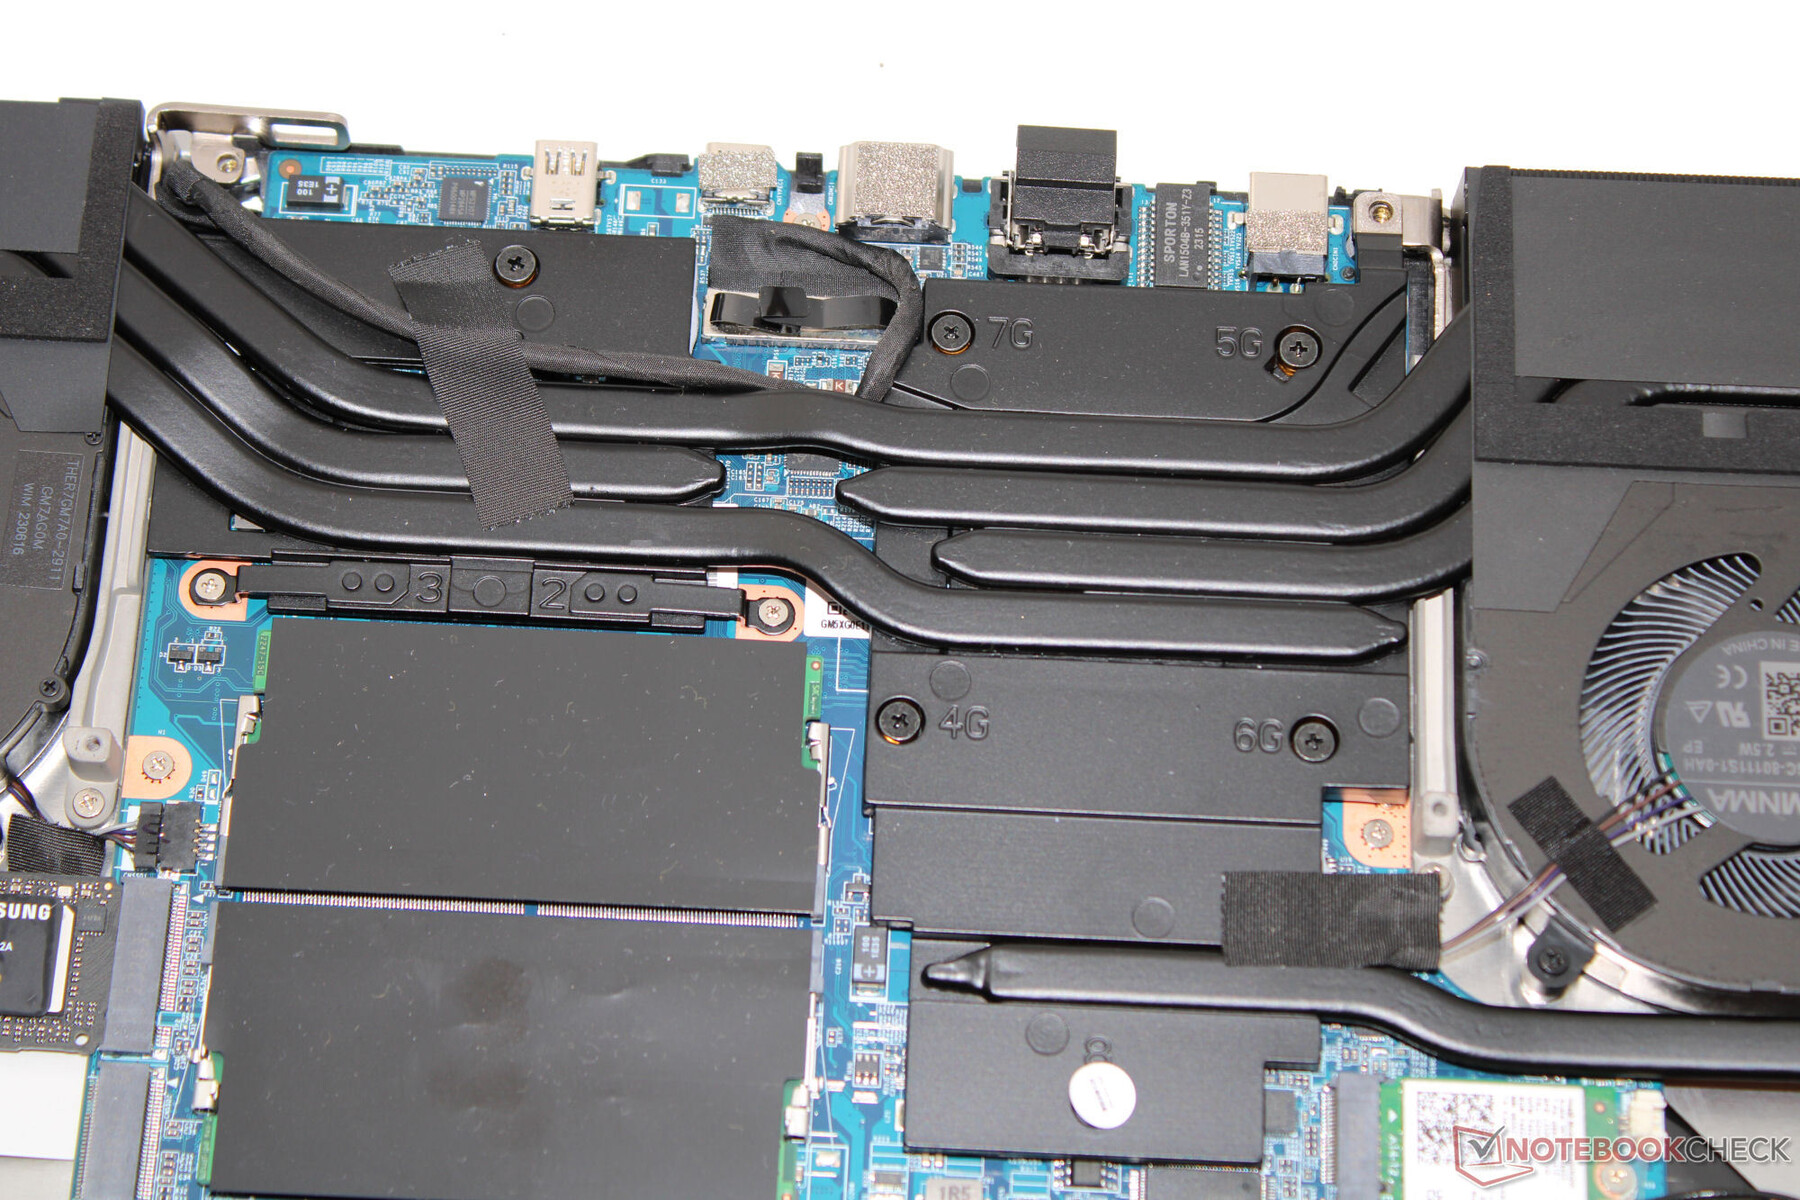
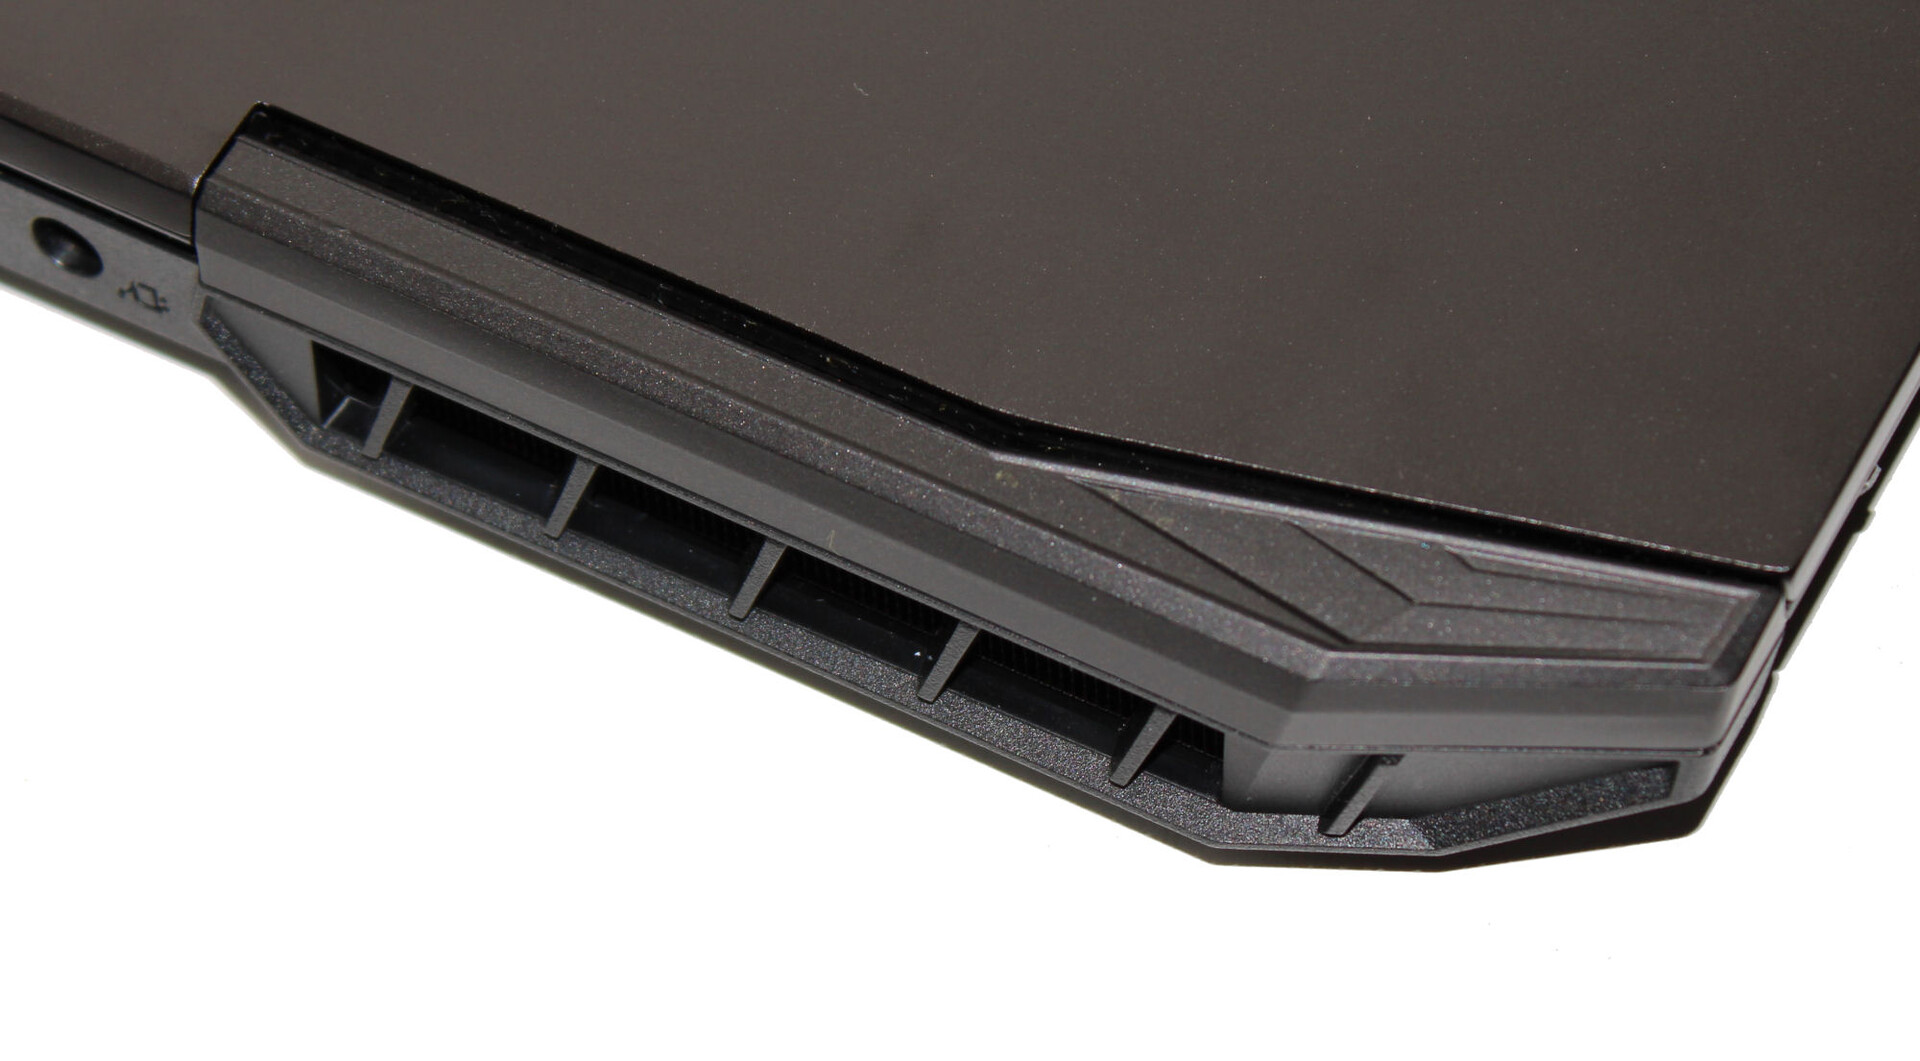
Kasa - Kasanın arka kısmı alüminyumdan yapılmıştır
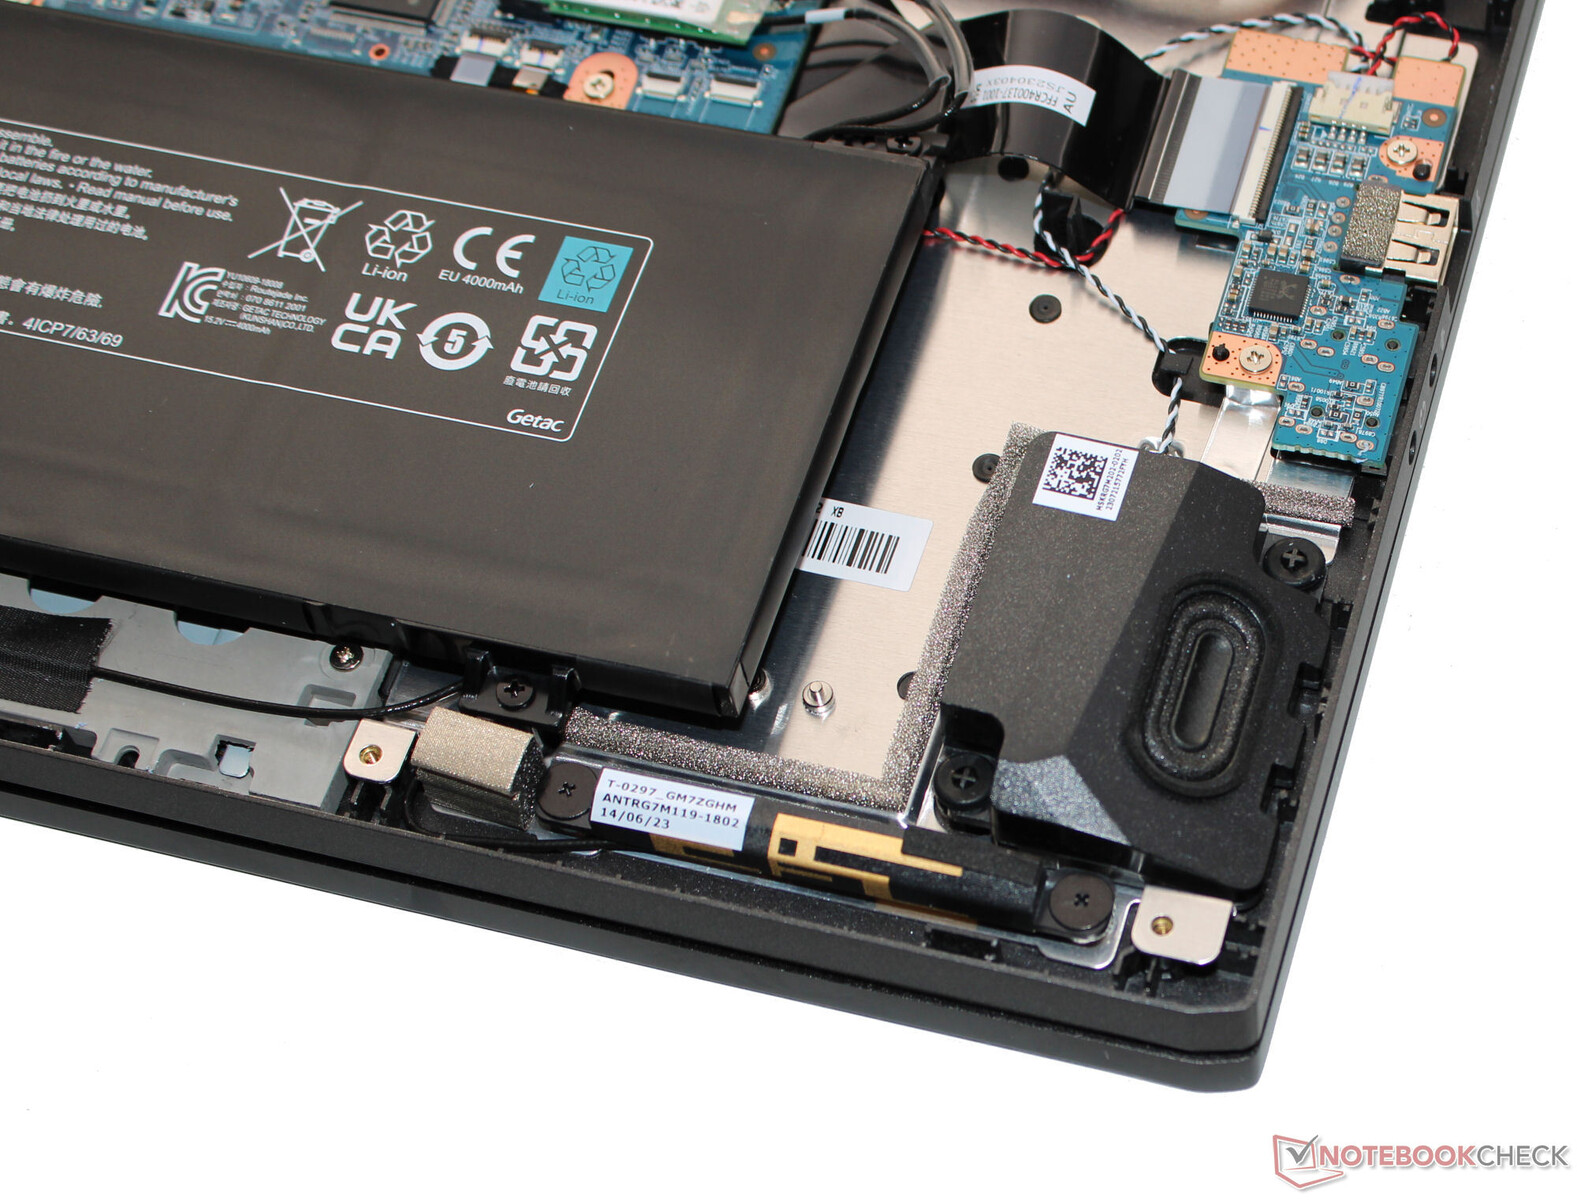
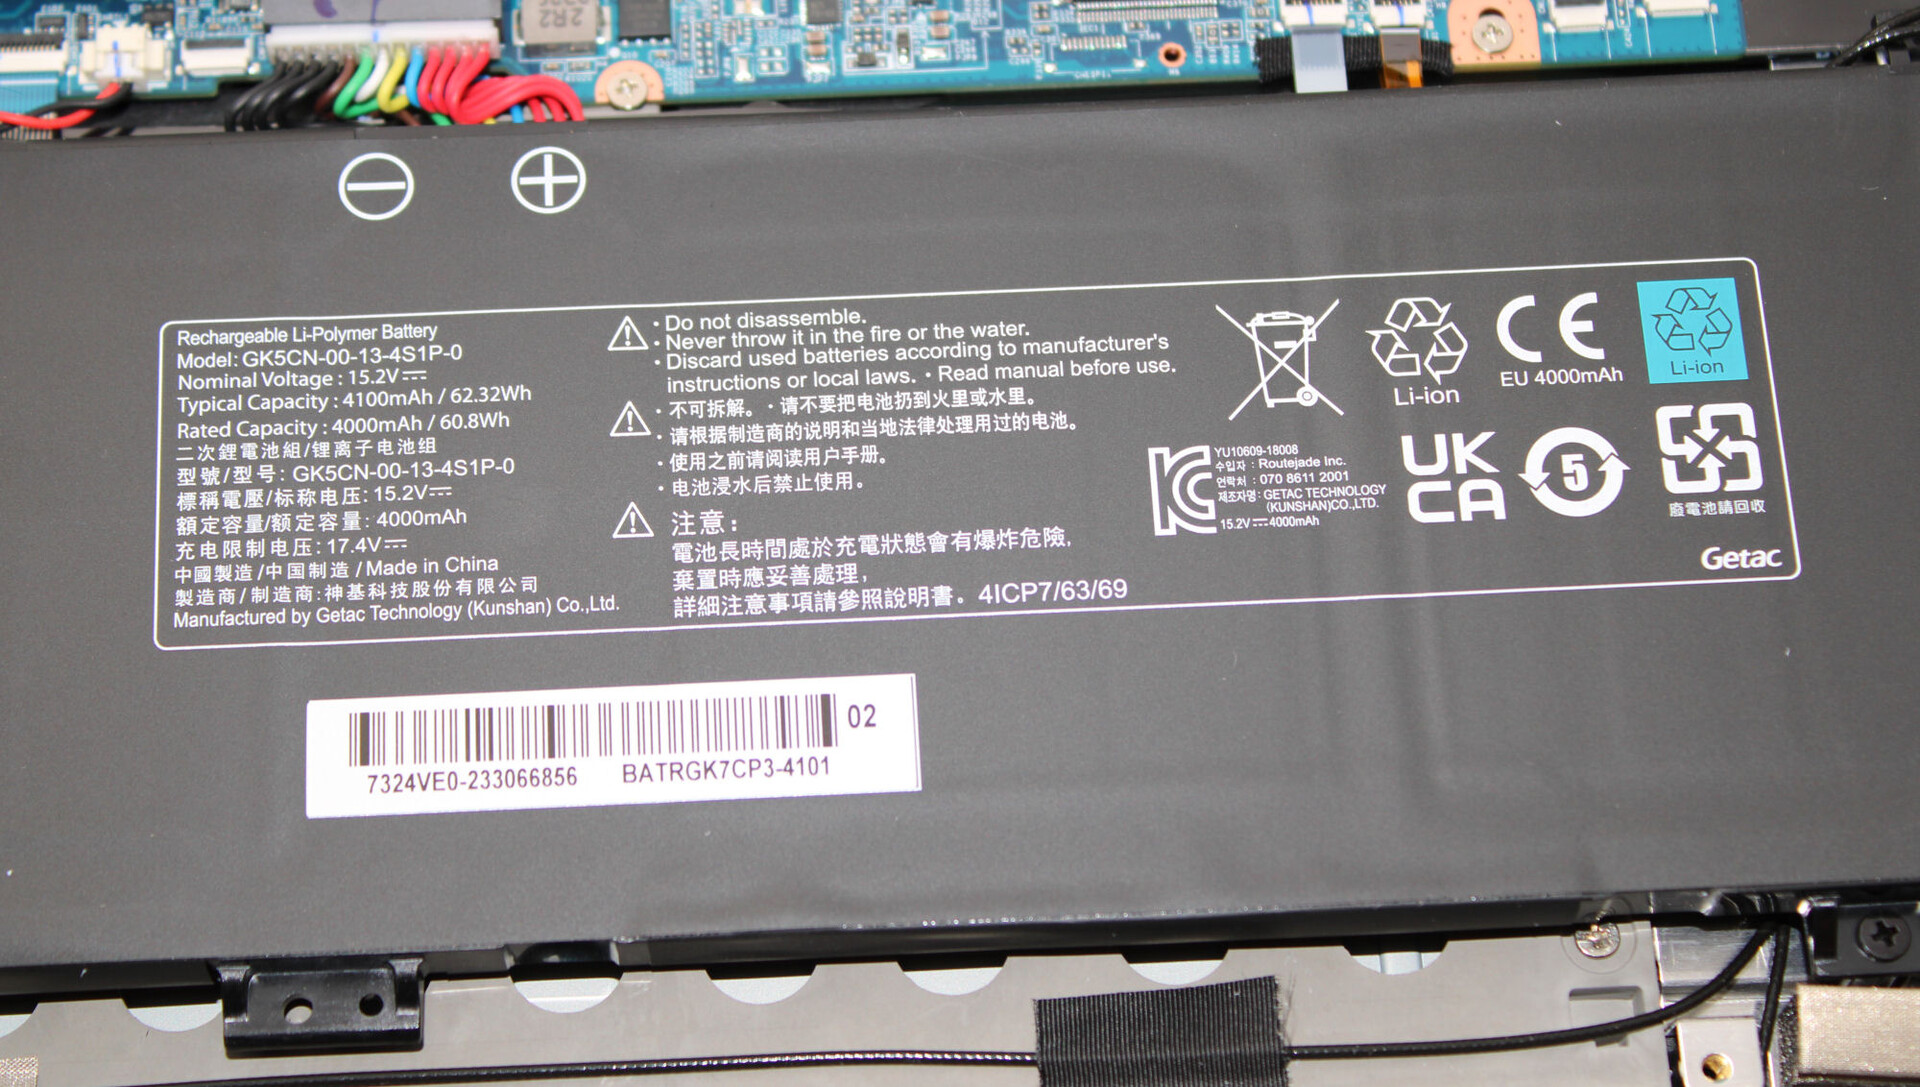
Mat siyah kasa pürüzsüz yüzeylere sahiptir (ana ünite hariç) ve gösterişli tasarım özellikleri yoktur. Tuş aydınlatması haricinde LED ışık unsurları mevcut değil. Schenker bir malzeme karışımı tercih etmiş: Alüminyum kapağın arkası da plastik bileşenlerle tamamlanıyor. Ana üniteyi söktükten sonra, batarya (vidalı, yapıştırılmamış) ve olağan donanımın tümü ortaya çıkıyor.
İmalat kusurları fark edilmez ve boşluk boyutları iyidir. Kapak ve taban ünitesi hafifçe bükülebiliyor ancak hepsi kabul edilebilir bir aralıkta. Kapağa uygulanan herhangi bir basınç görüntü bozulmalarına yol açmıyor. Menteşeler kapağı güvenli bir şekilde yerinde tutuyor ancak biraz sallanıyor. Maksimum açılma açısı 140 derecedir. Dizüstü bilgisayarı tek elle açmak mümkün.

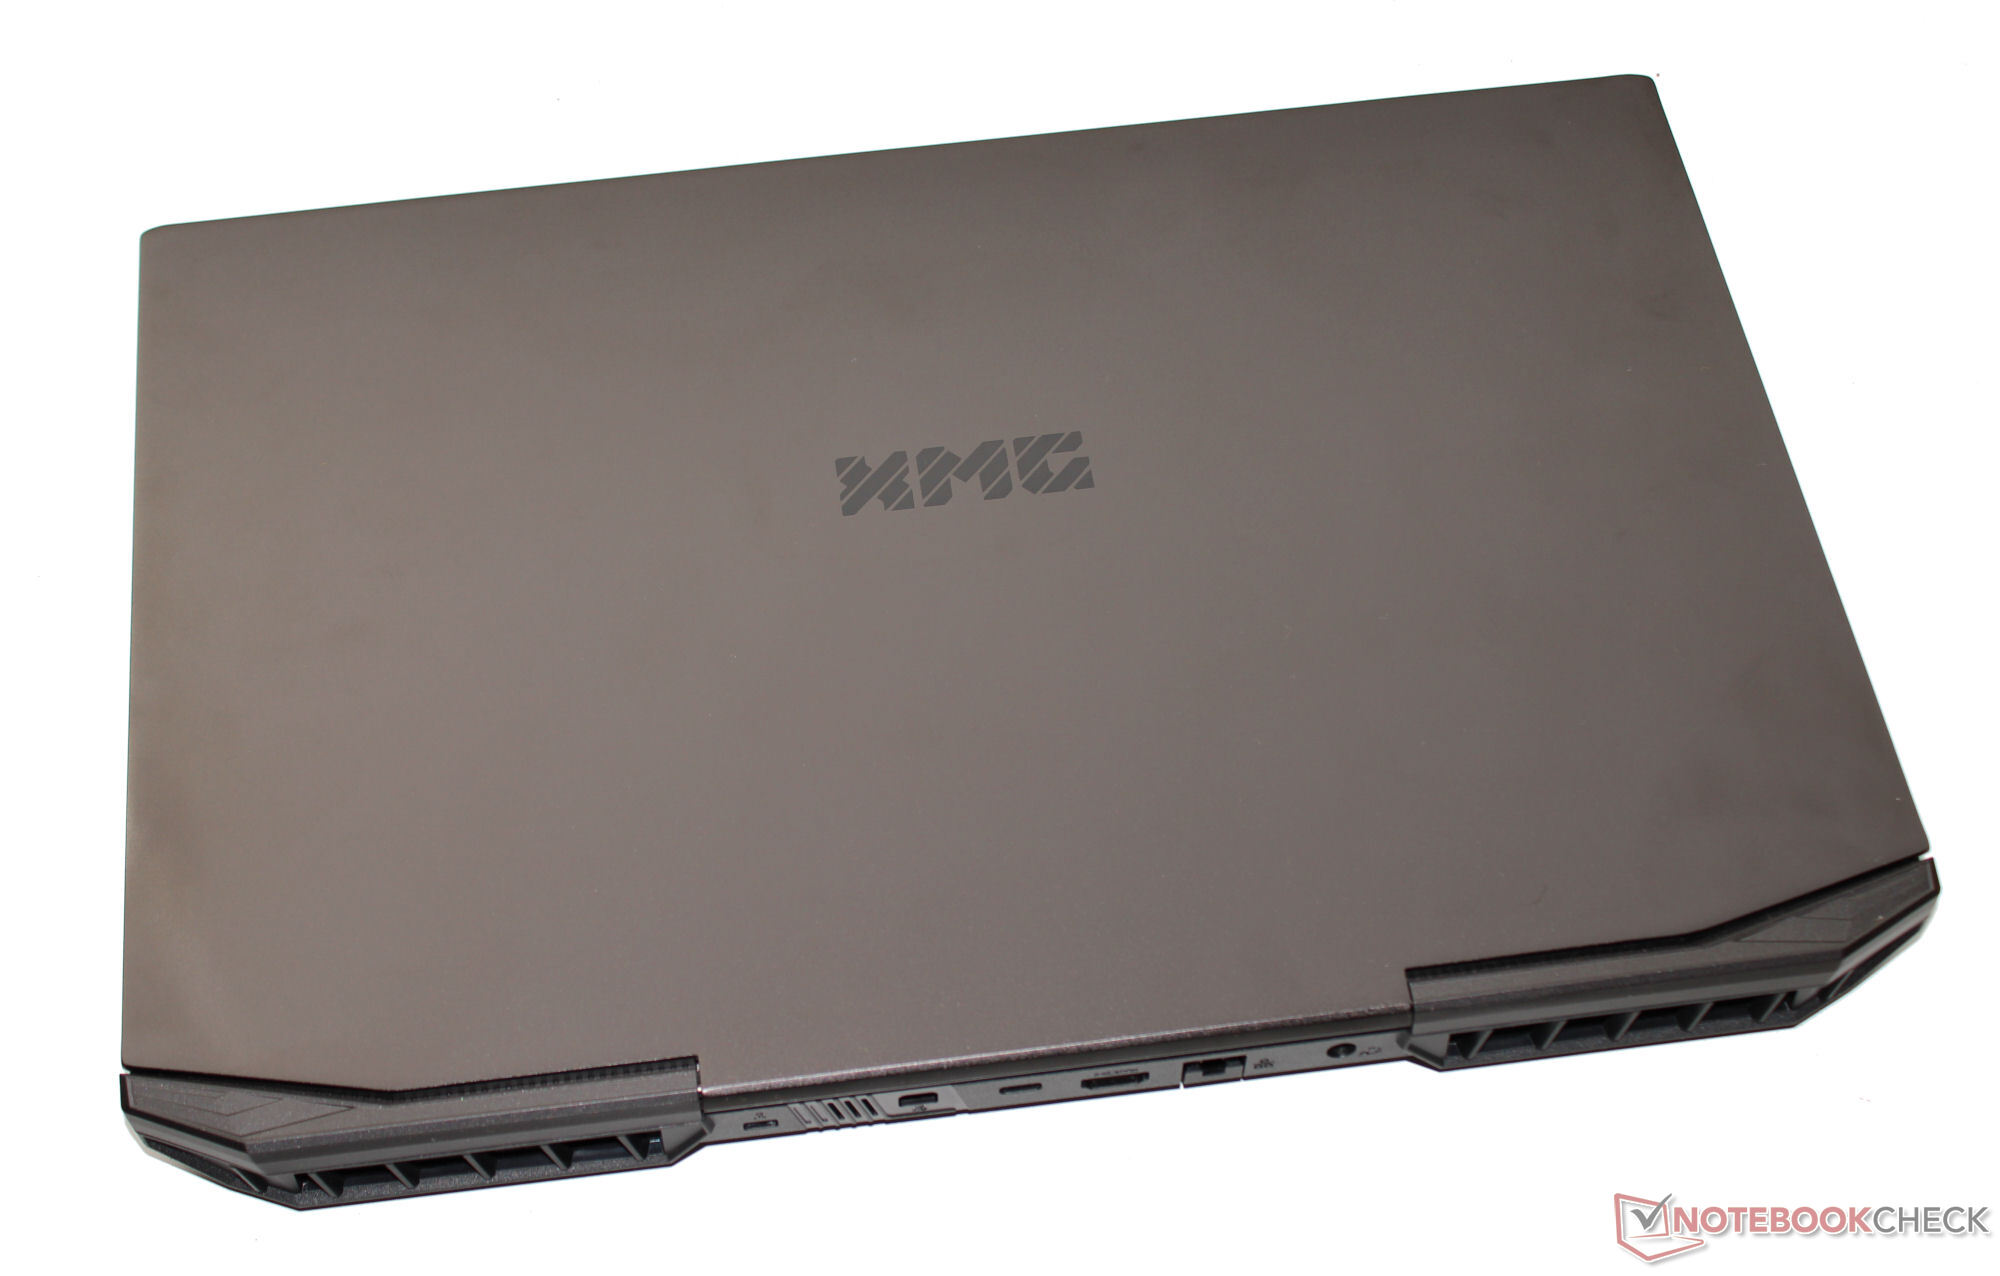
XMG bilgisayar, rakip 17,3 inç dizüstü bilgisayarlar arasında en hafif ve en kompakt olanıdır. Yaklaşık 2,5 kg ağırlığıyla genellikle türünün en hafif temsilcileri arasında yer alır.
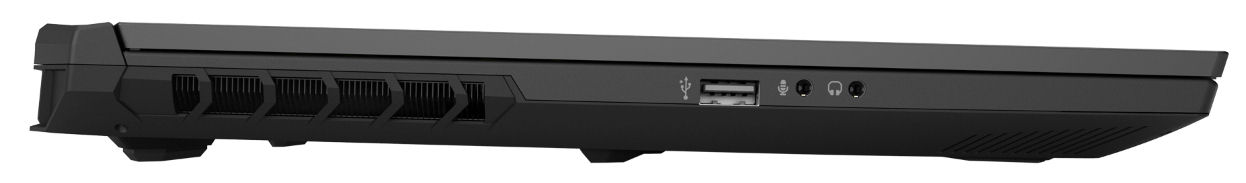
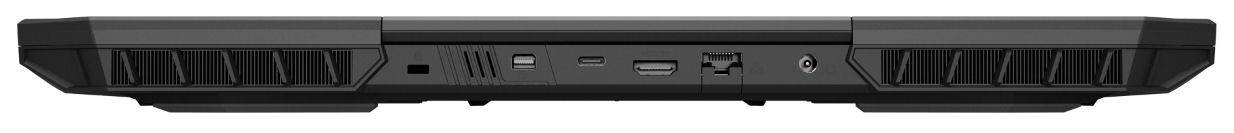
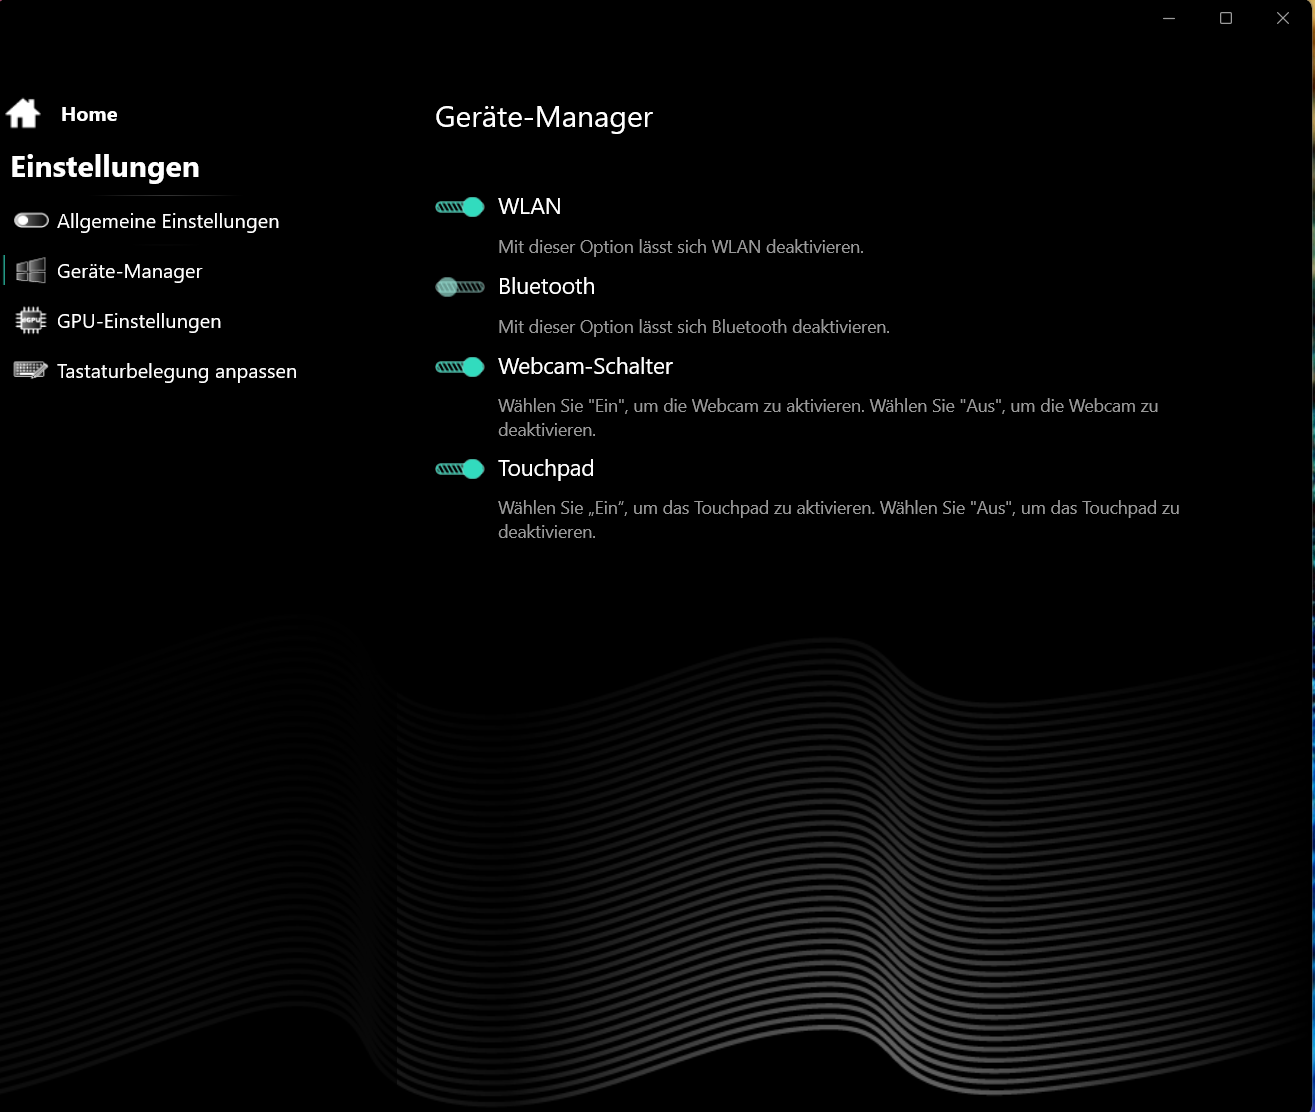
Özellikler - XMG dizüstü bilgisayar Thunderbolt olmadan gelir
Apex'te üç USB-A portu (1x USB 2.0, 2x USB 3.2 Gen 1) ve bir USB-C portu (USB 3.2 Gen 2) hazır bulunmaktadır. İkincisi ne Displayport sinyali çıkışı verebiliyor ne de Power Delivery desteği sunuyor. İki video çıkışı (HDMI 2.1, DP 1.4a), ses jakları ve bir Gigabit Ethernet portu paketi tamamlıyor.
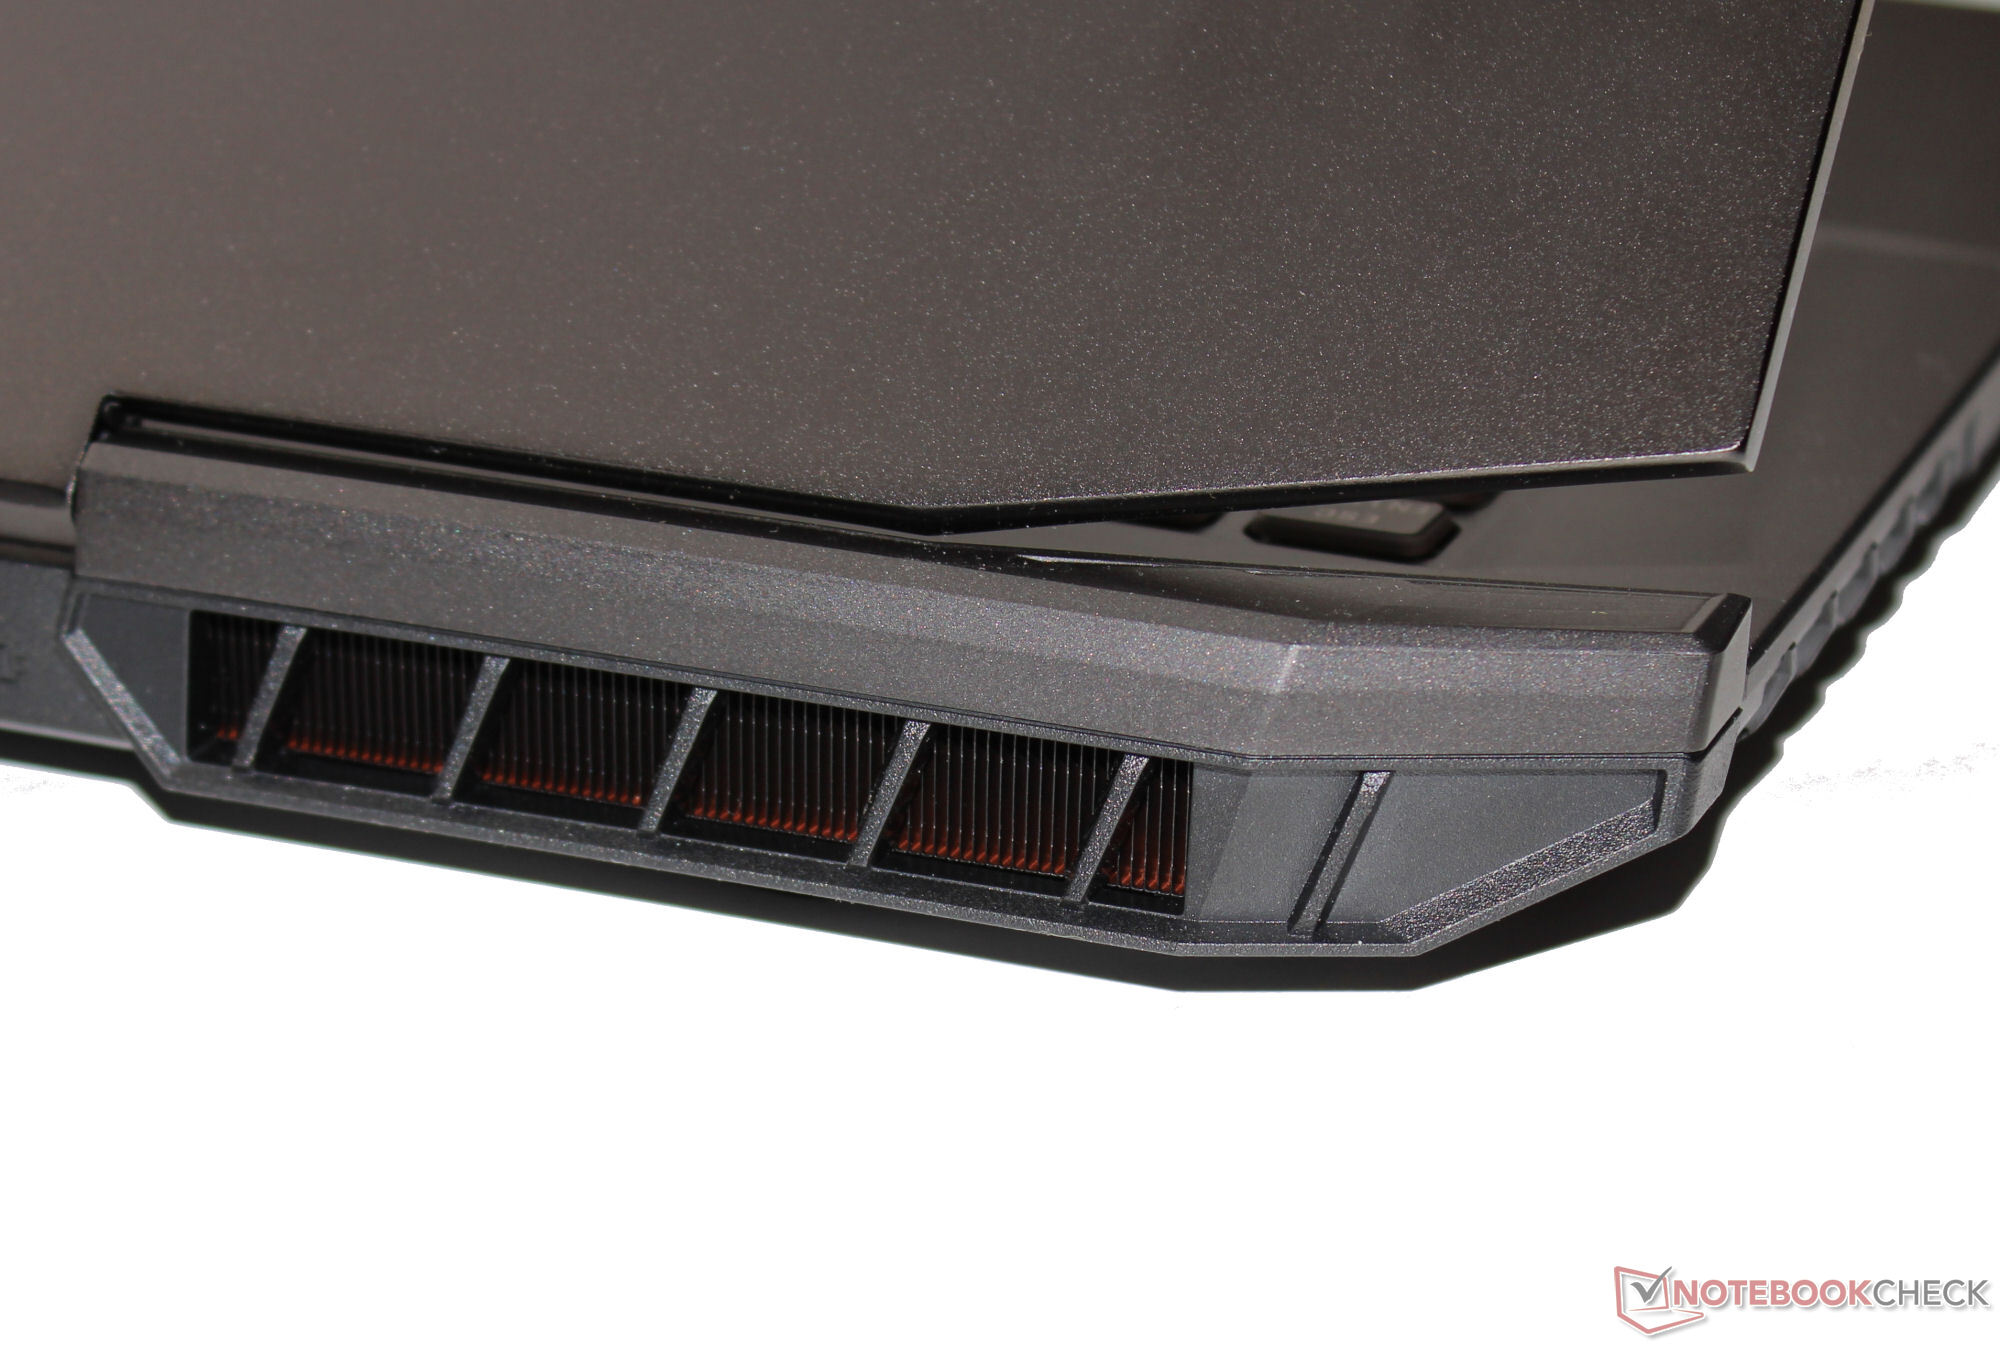
Video çıkışları, güç konektörü ve LAN bağlantı noktası cihazın arkasında bulunabilir. Bunlara karşılık gelen kablolar arkaya doğru uzanır ve bu nedenle araya girmez.
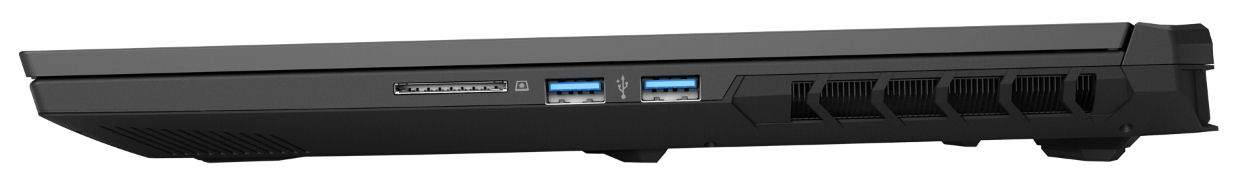
SD Kart Okuyucu
Maksimum aktarım hızı 35 MB/s (her biri yaklaşık 5 MB olan 250 jpg görüntü dosyasını aktarma) ve 36 MB/s (büyük veri bloklarını kopyalama) olan bellek kartı okuyucusu (referans kart: AV PRO microSD 128 GB V60) yavaş modeller arasında yer alıyor. Bu konuda rakipler daha fazlasını sunuyor.
| SD Card Reader | |
| average JPG Copy Test (av. of 3 runs) | |
| Alienware m16 R1 Intel (AV PRO microSD 128 GB V60) | |
| Sınıf ortalaması Gaming (20.9 - 210, n=54, son 2 yıl) | |
| Medion Erazer Defender P40 (AV PRO microSD 128 GB V60) | |
| Acer Nitro 17 AN17-51-71ER | |
| Schenker XMG Apex 17 (Late 23) (AV PRO microSD 128 GB V60) | |
| maximum AS SSD Seq Read Test (1GB) | |
| Alienware m16 R1 Intel (AV PRO microSD 128 GB V60) | |
| Sınıf ortalaması Gaming (25.5 - 261, n=51, son 2 yıl) | |
| Medion Erazer Defender P40 (AV PRO microSD 128 GB V60) | |
| Acer Nitro 17 AN17-51-71ER | |
| Schenker XMG Apex 17 (Late 23) (AV PRO microSD 128 GB V60) | |
İletişim
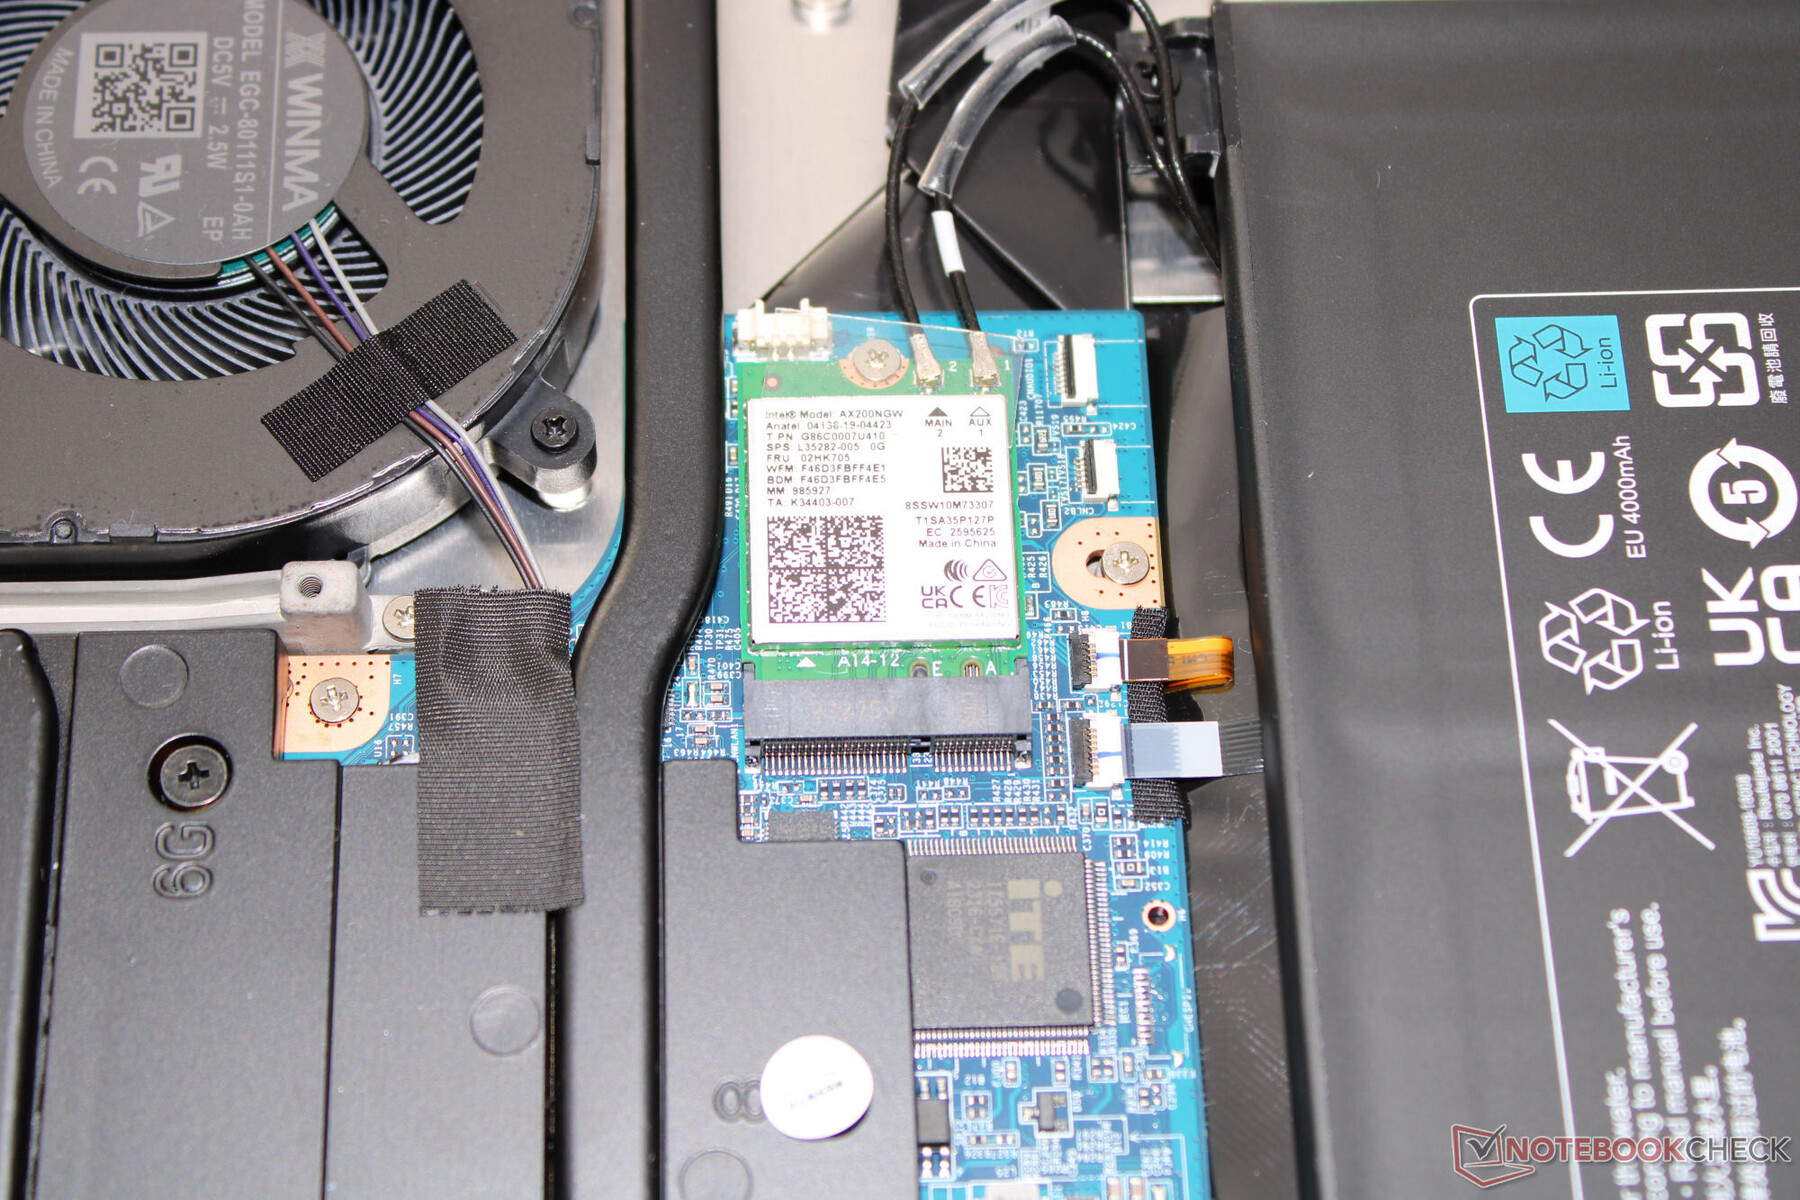
Optimum koşullar altında (yakınlarda Wi-Fi cihazı olmaması, dizüstü bilgisayar ile sunucu bilgisayar arasında kısa bir mesafe olması) iyi ila çok iyi Wi-Fi veri hızlarına ulaşmak mümkündür. Schenker dizüstü bilgisayarı bir Wi-Fi 6E çipi (Intel AX200) kullanmaktadır. Bir Realtek denetleyici (RTL8168/8111; 1 GBit/s) kablolu bağlantılarla ilgilenir.
Web kamerası
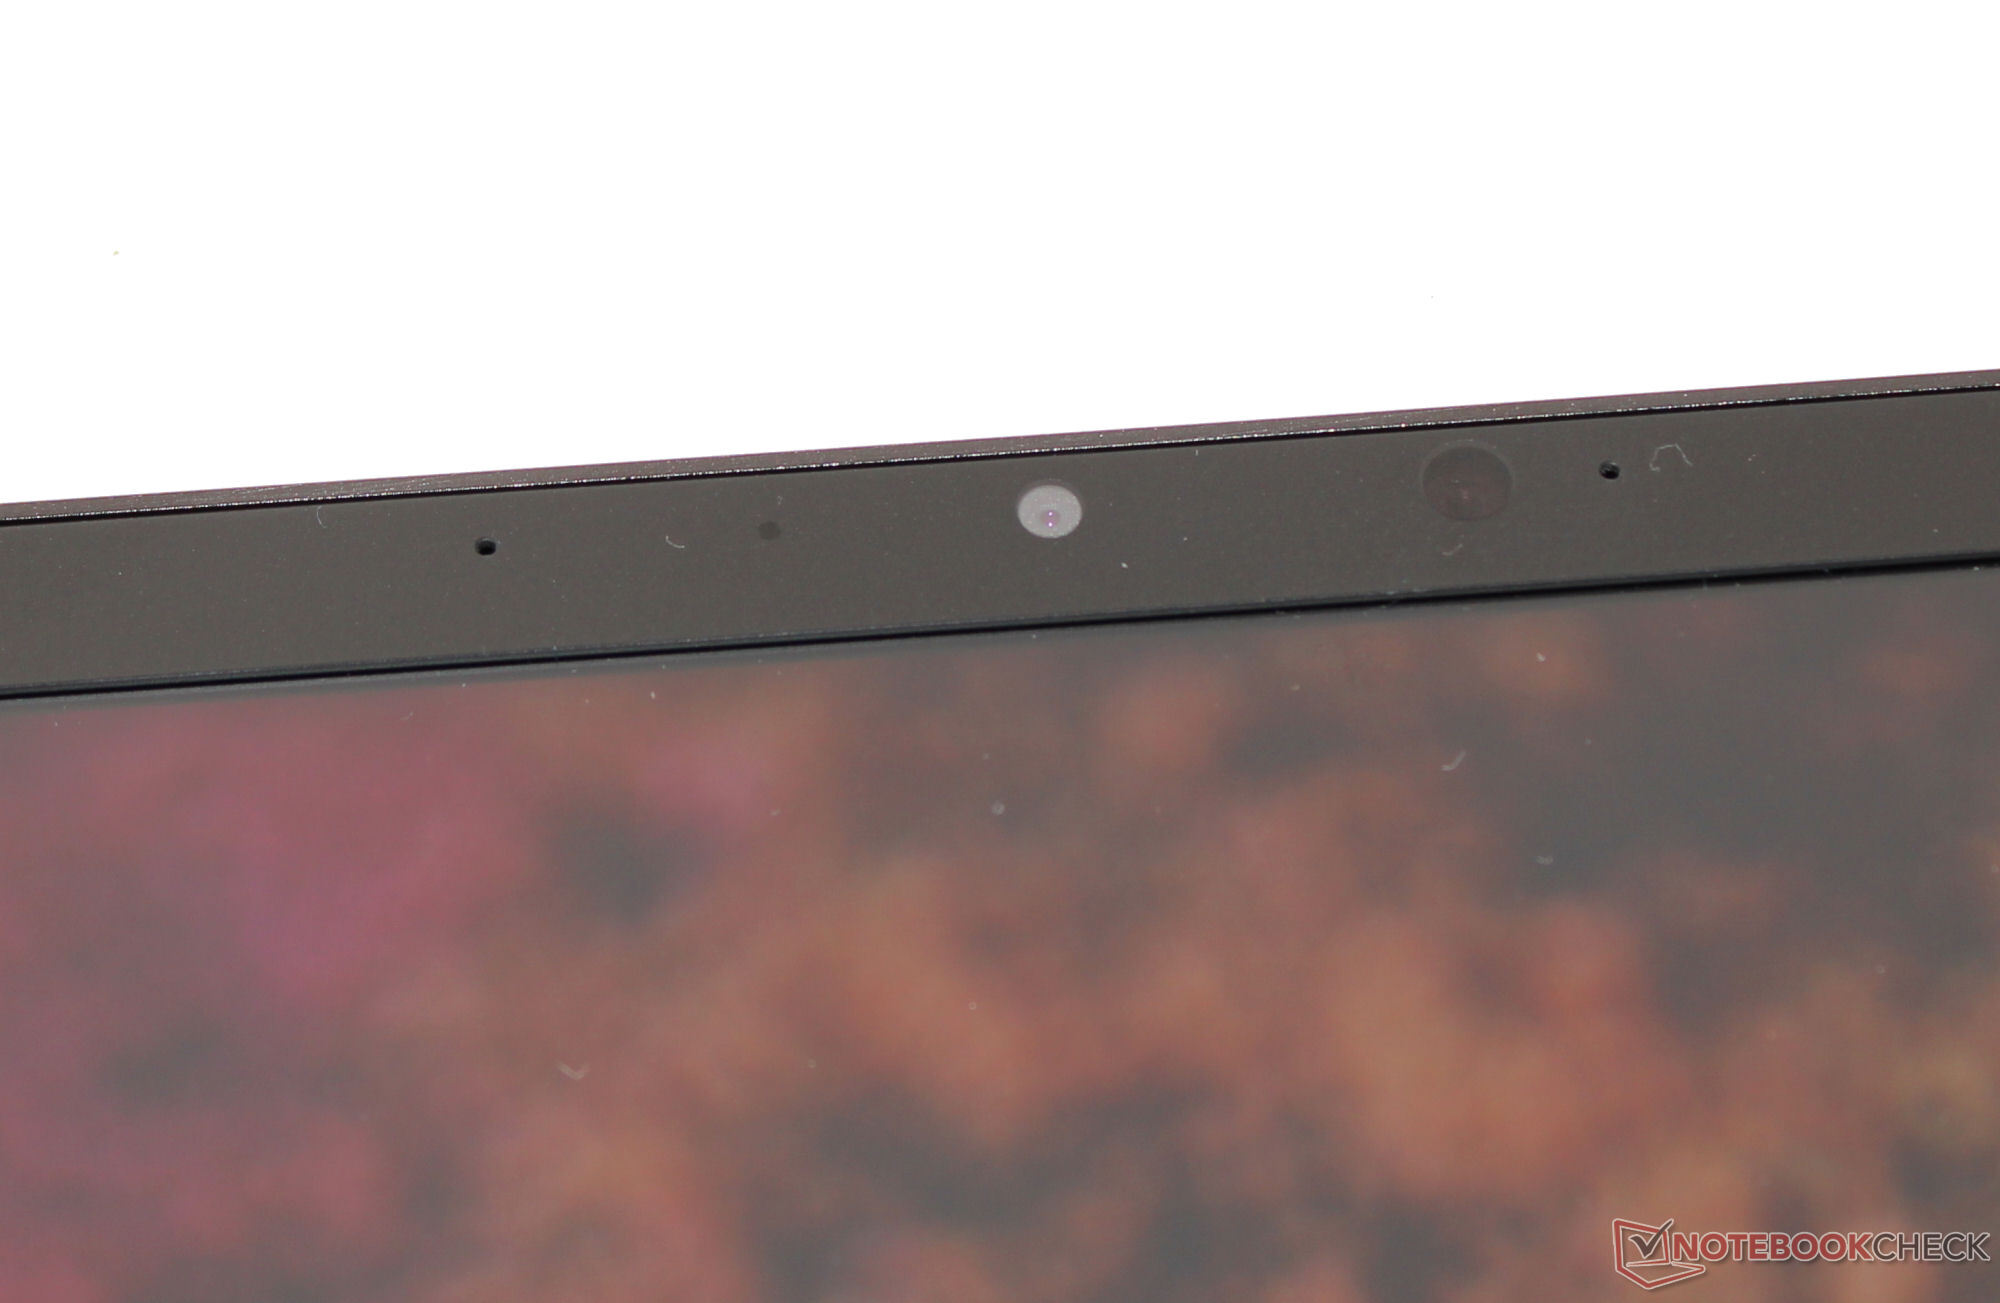
Kalite açısından, web kamerası (2,1 MP, maks. 1.920 x 1.080 piksel) standart ücret sunar. Yaklaşık 8,7'lik bir renk sapması (hedef: DeltaE < 3) oldukça iyi. Kamera mekanik bir deklanşör sunmuyor.

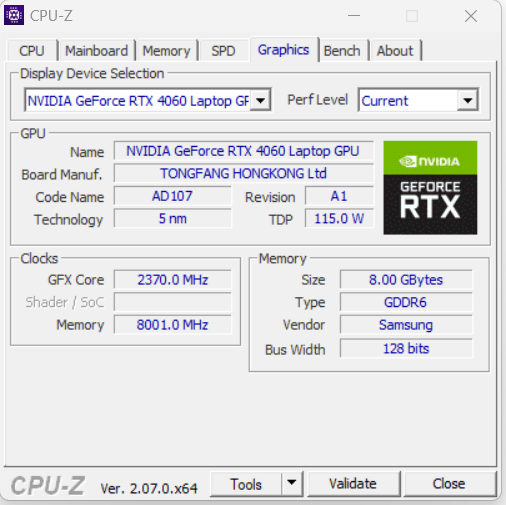
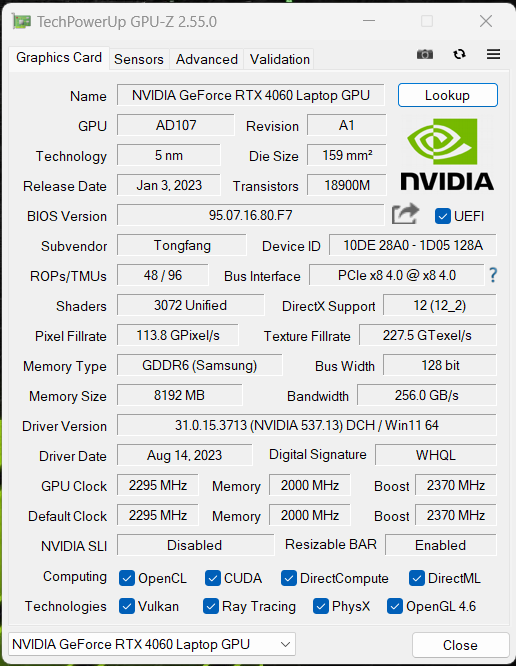
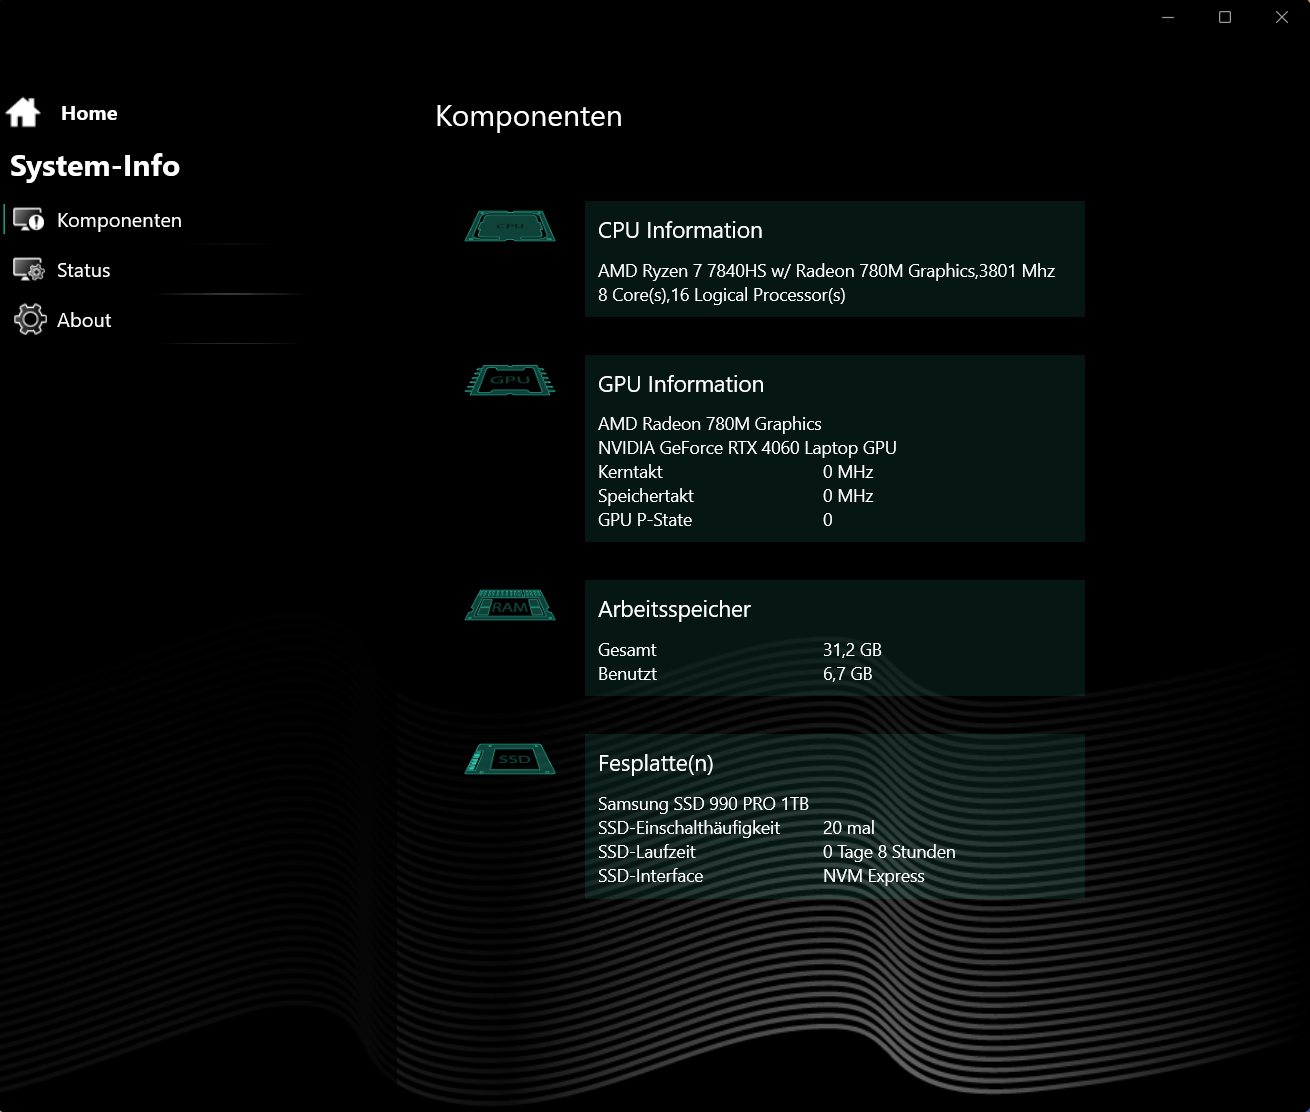
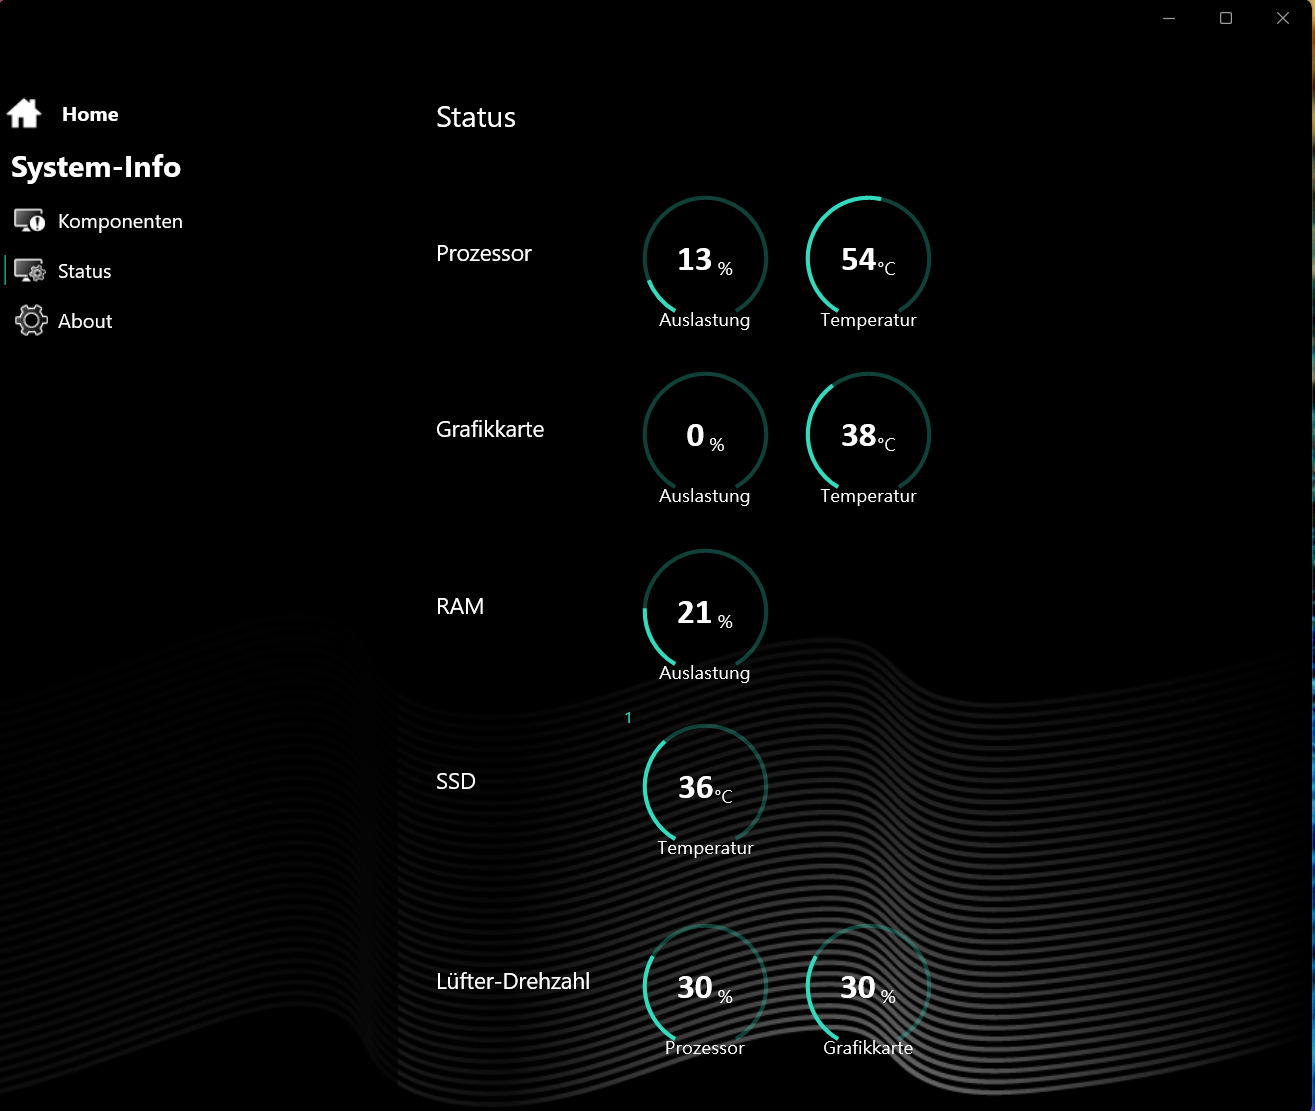
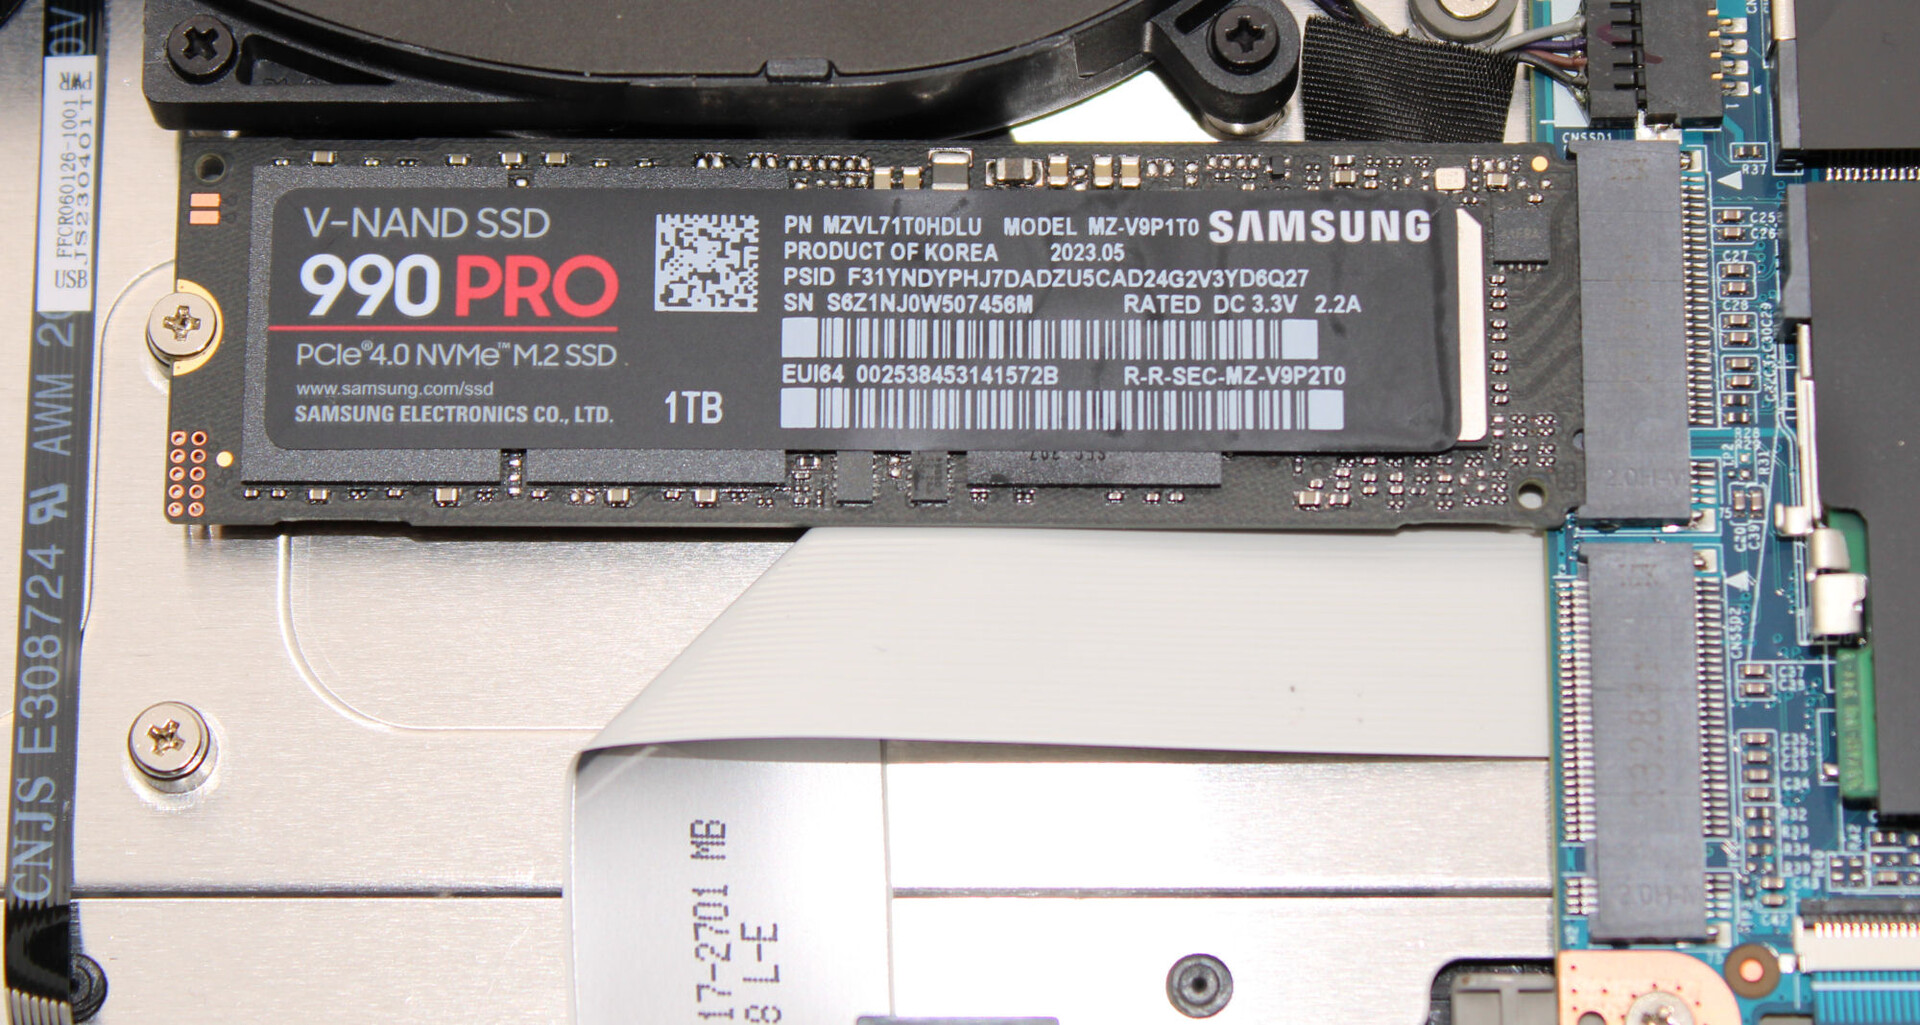
 GeForce RTX 4060 Laptop GPU, R7 7840HS, Samsung 990 Pro 1 TB")
 GeForce RTX 4060 Laptop GPU, R7 7840HS, Samsung 990 Pro 1 TB")
Aksesuarlar
Dizüstü bilgisayar, olağan belgelere ek olarak bir USB bellek (sürücüler, yazılım), şişe açacağı içeren bir anahtarlık ve büyük bir mousepad ile birlikte geliyor.
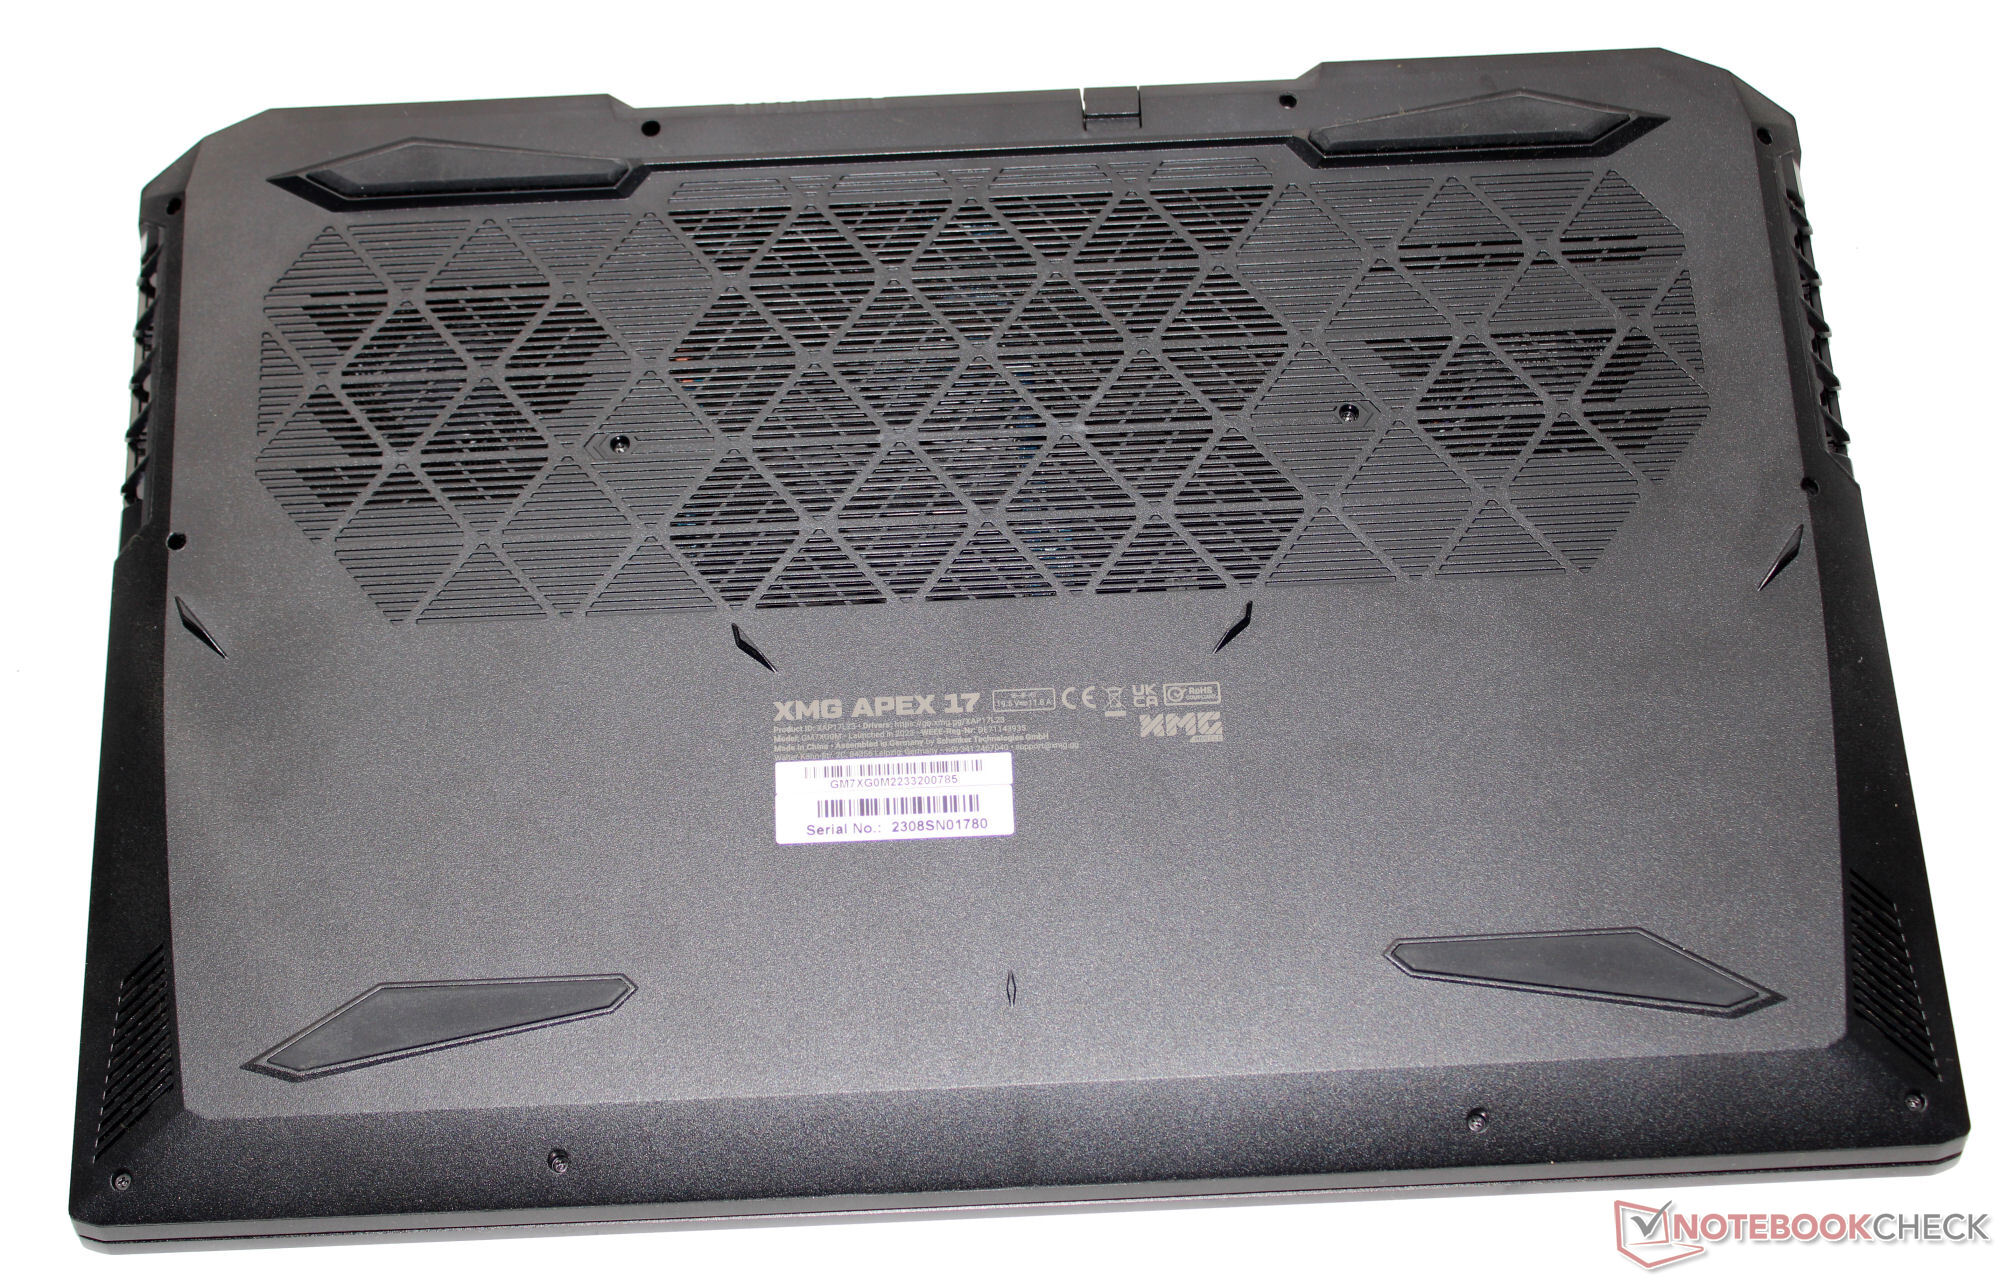
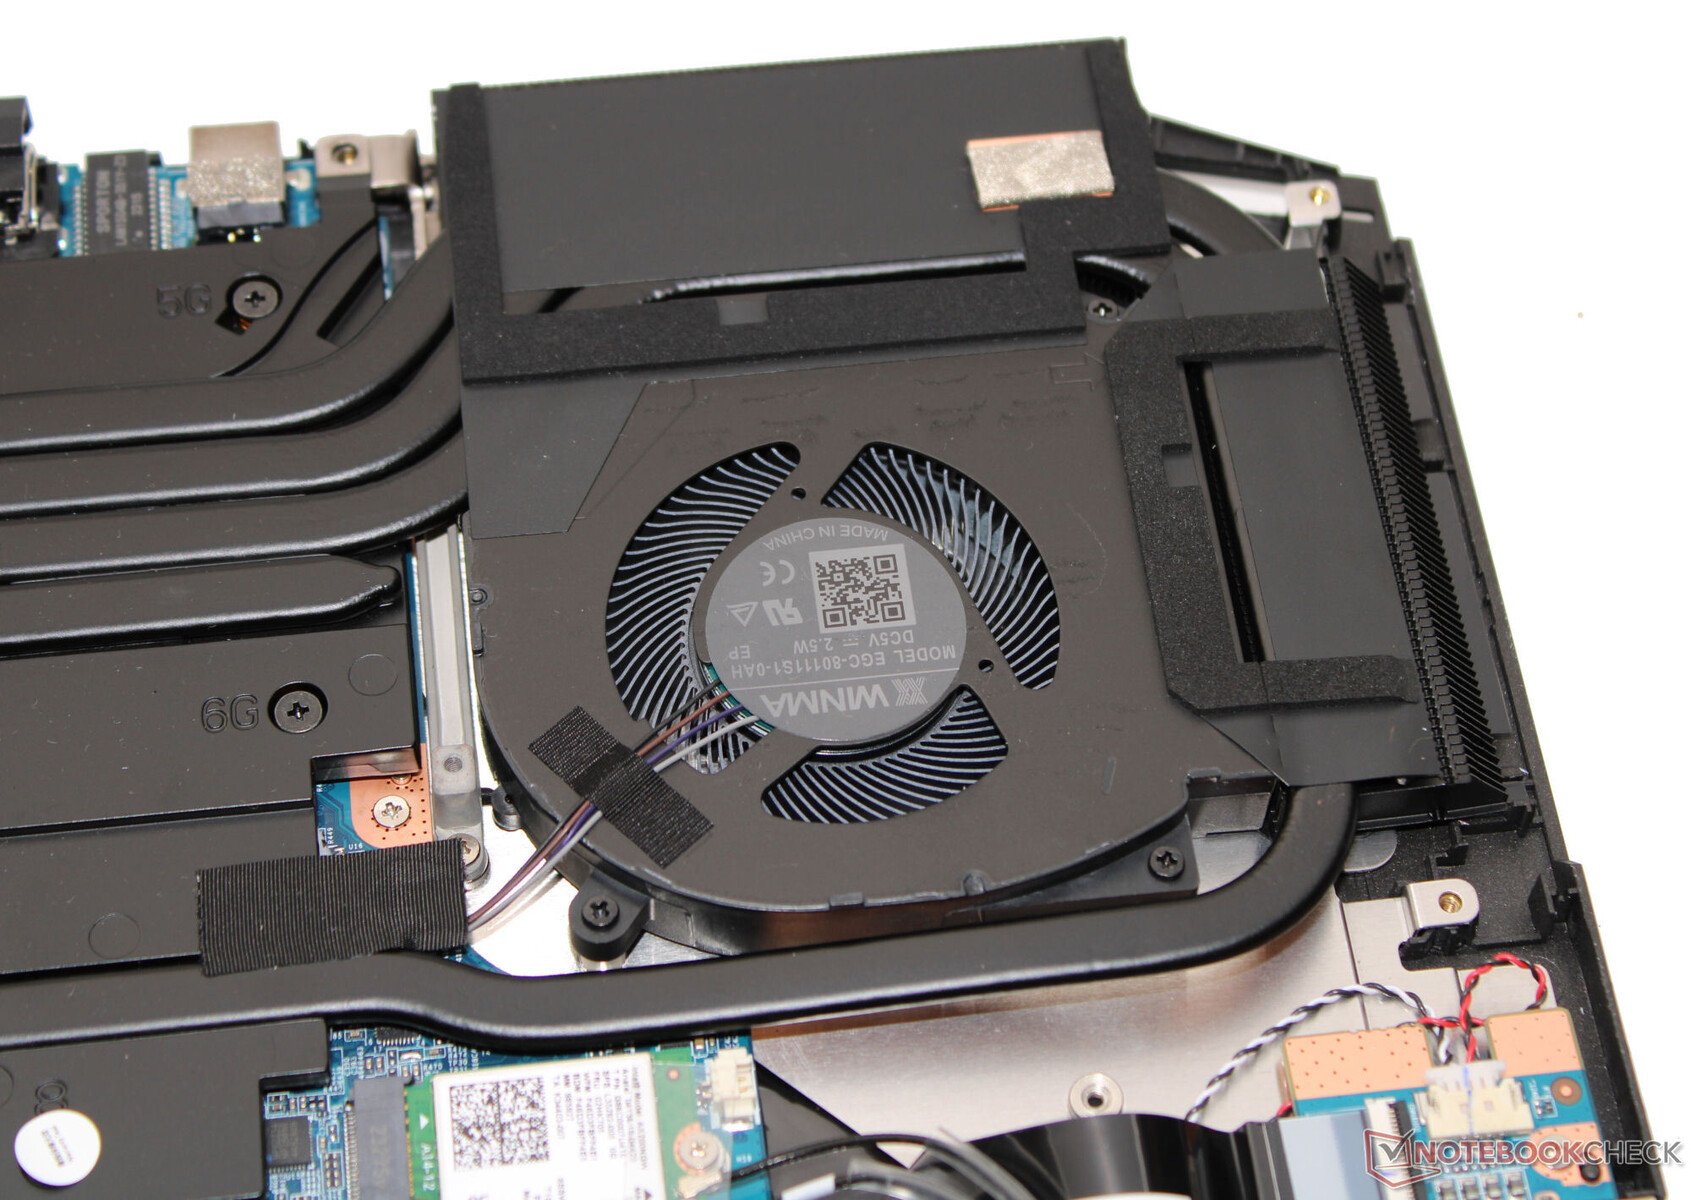
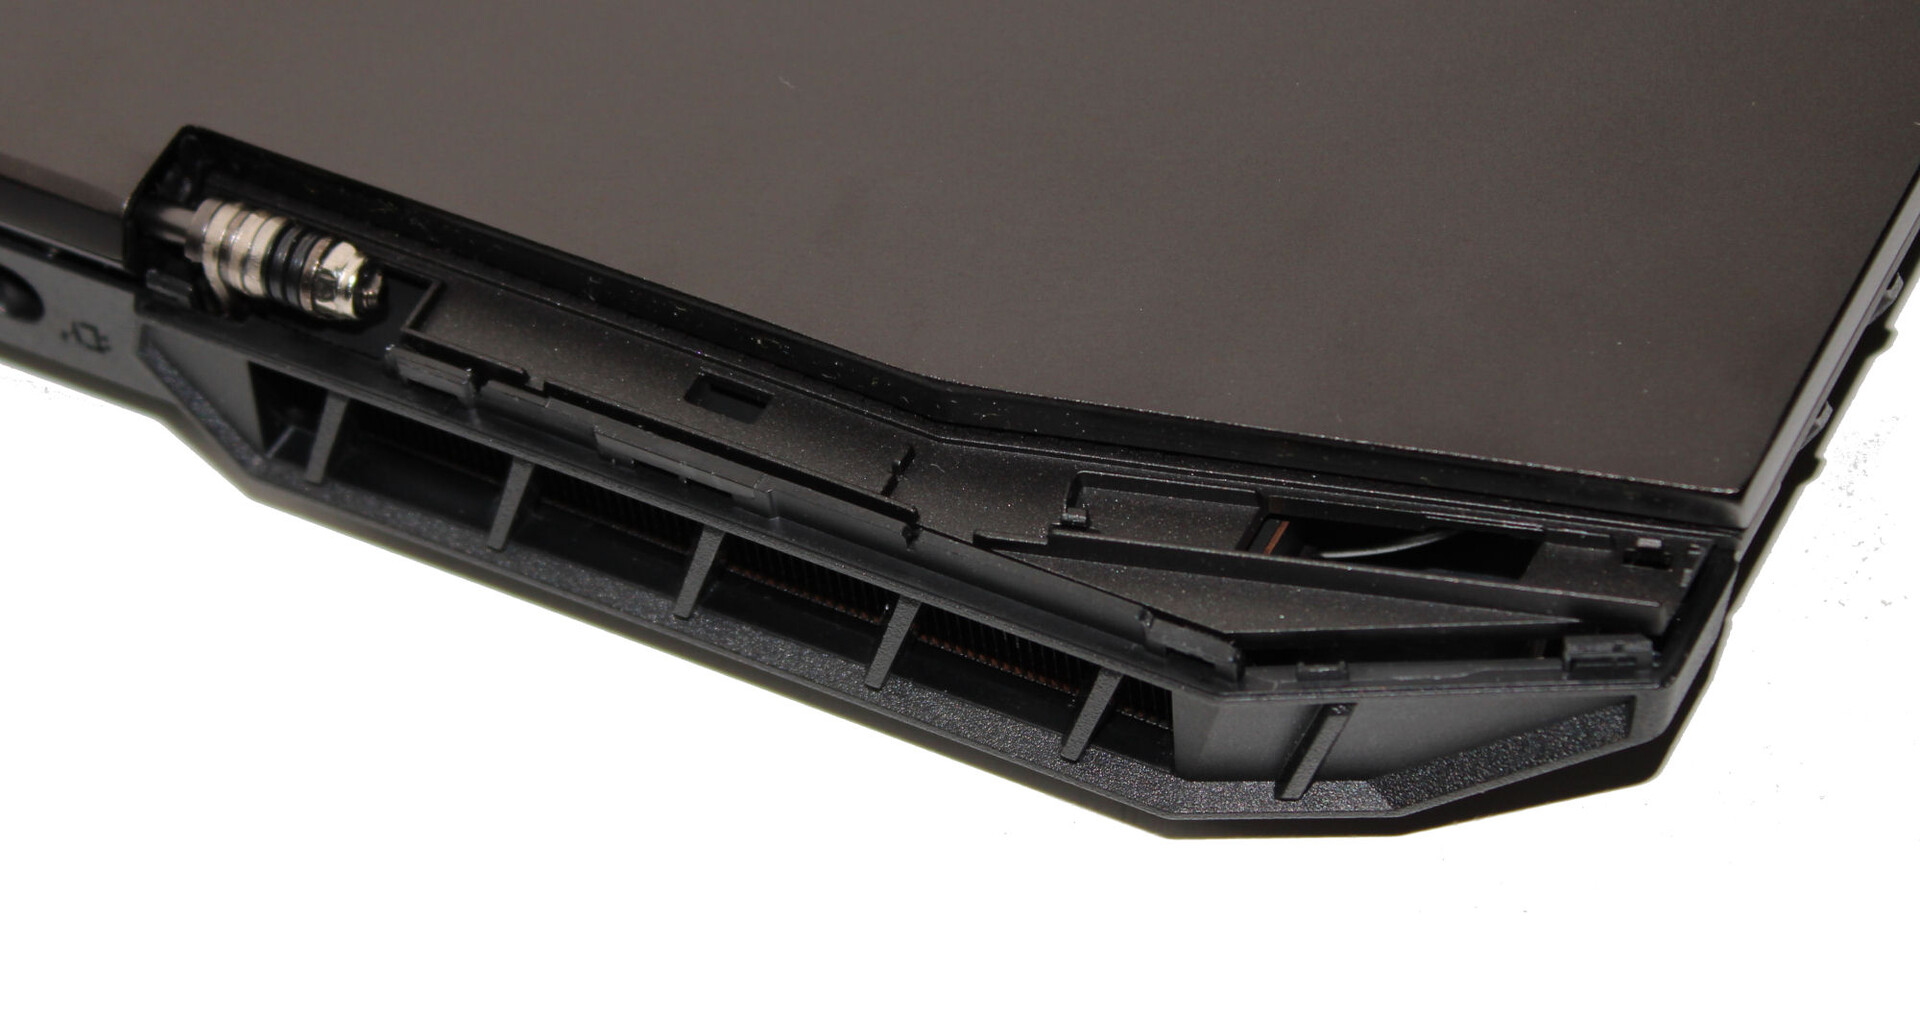
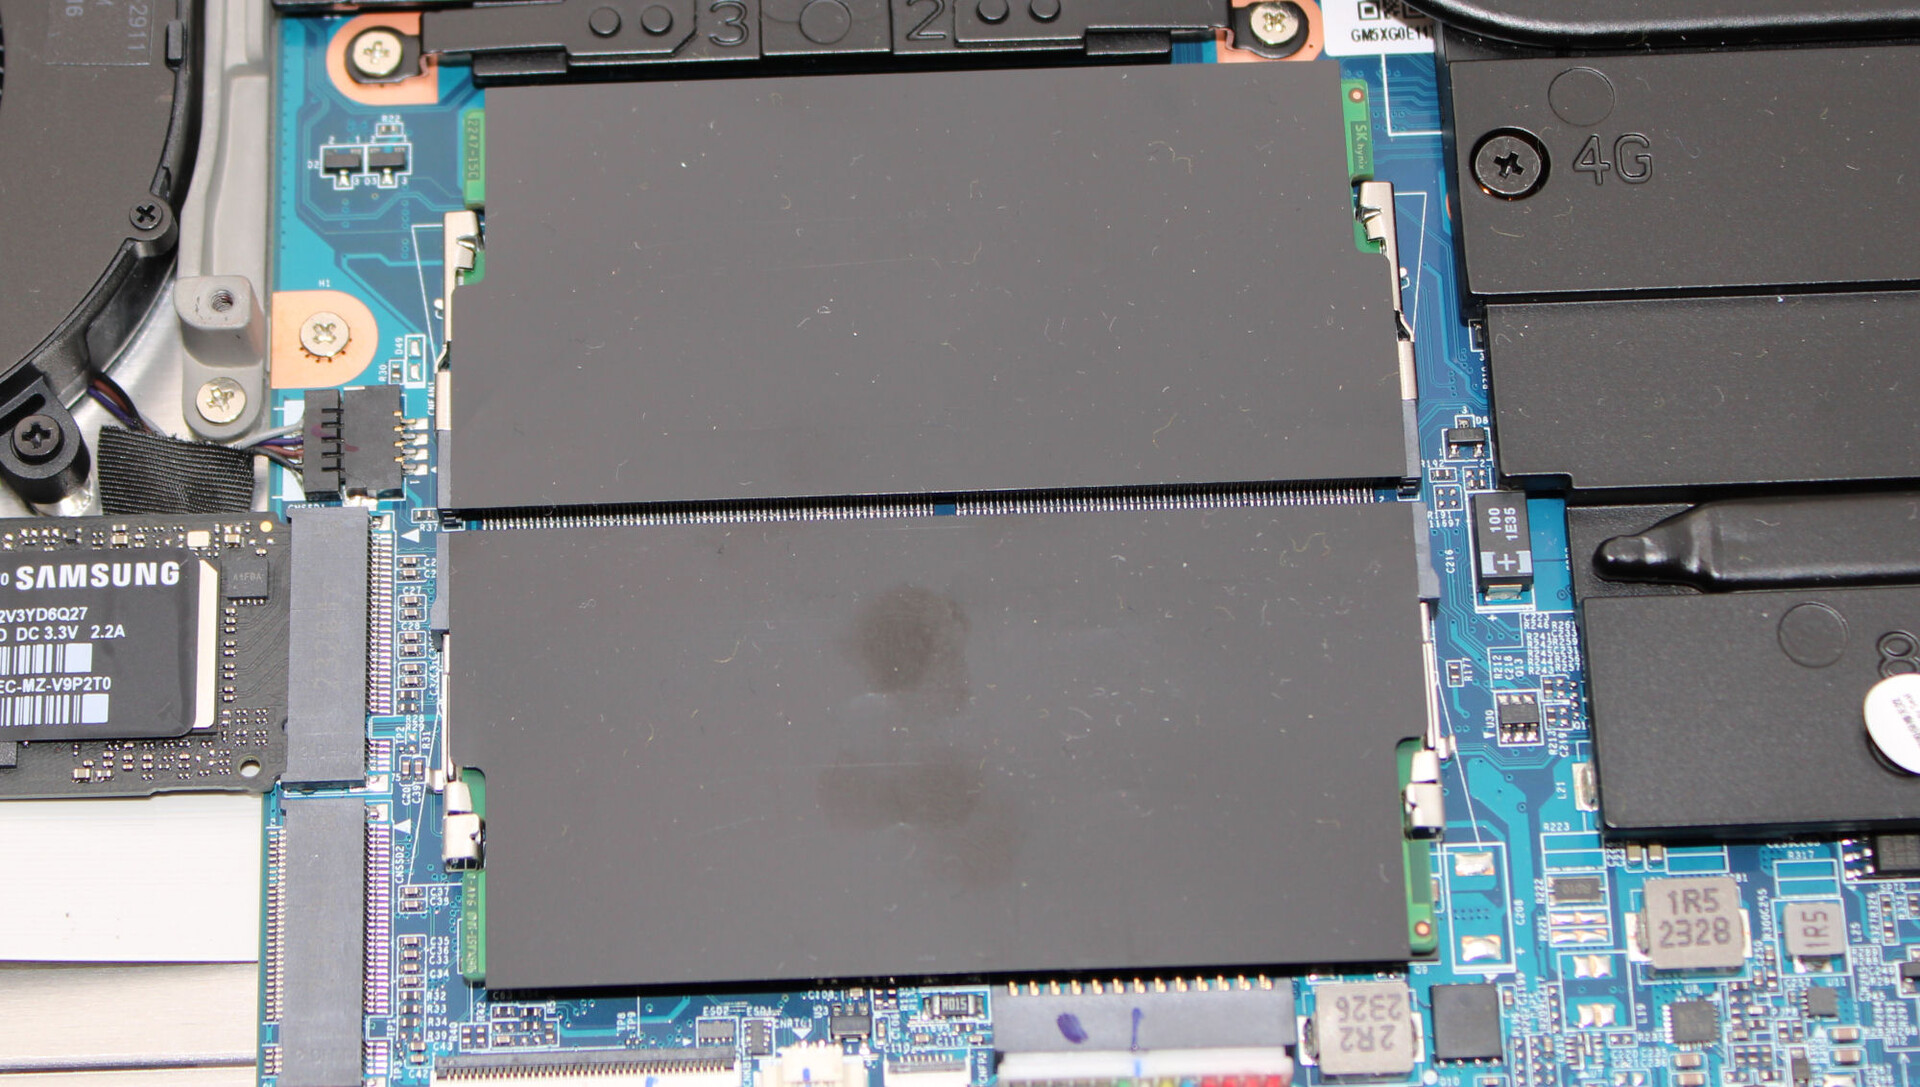
Bakım
Taban plakası söküldükten sonra donanım erişilebilir hale gelir. Bu yolculuktaki ilk adım menteşe kapaklarının (hava deliklerinin üstünde) çıkarılmasıdır. Bunlar sadece olukludur ve vidalanmamıştır. Bunu takiben, cihazın altındaki tüm vidaların çıkarılması, ince bir spatula veya bir mızrap kullanılarak ana kabuğun cihazın geri kalanından ayrılabileceği anlamına gelir. Bu sayede bellek yuvalarına (her ikisi de dolu), SSD'ye (PCIe 4, M.2 2280), ikinci SSD yuvasına (PCIe 4, M.2 2280), Wi-Fi modülüne, BIOS piline, fanlara ve pile erişim sağlanabilir.
Garanti
Temel garanti, teslim alma hizmeti ve altı aylık hızlı onarım (48 saat içinde onarım) dahil olmak üzere iki yıldır. Almanya'da 36 aylık garanti için istenen fiyat, seçilen hızlı onarım süresine bağlı olarak 80 ila 119 Euro arasındadır.
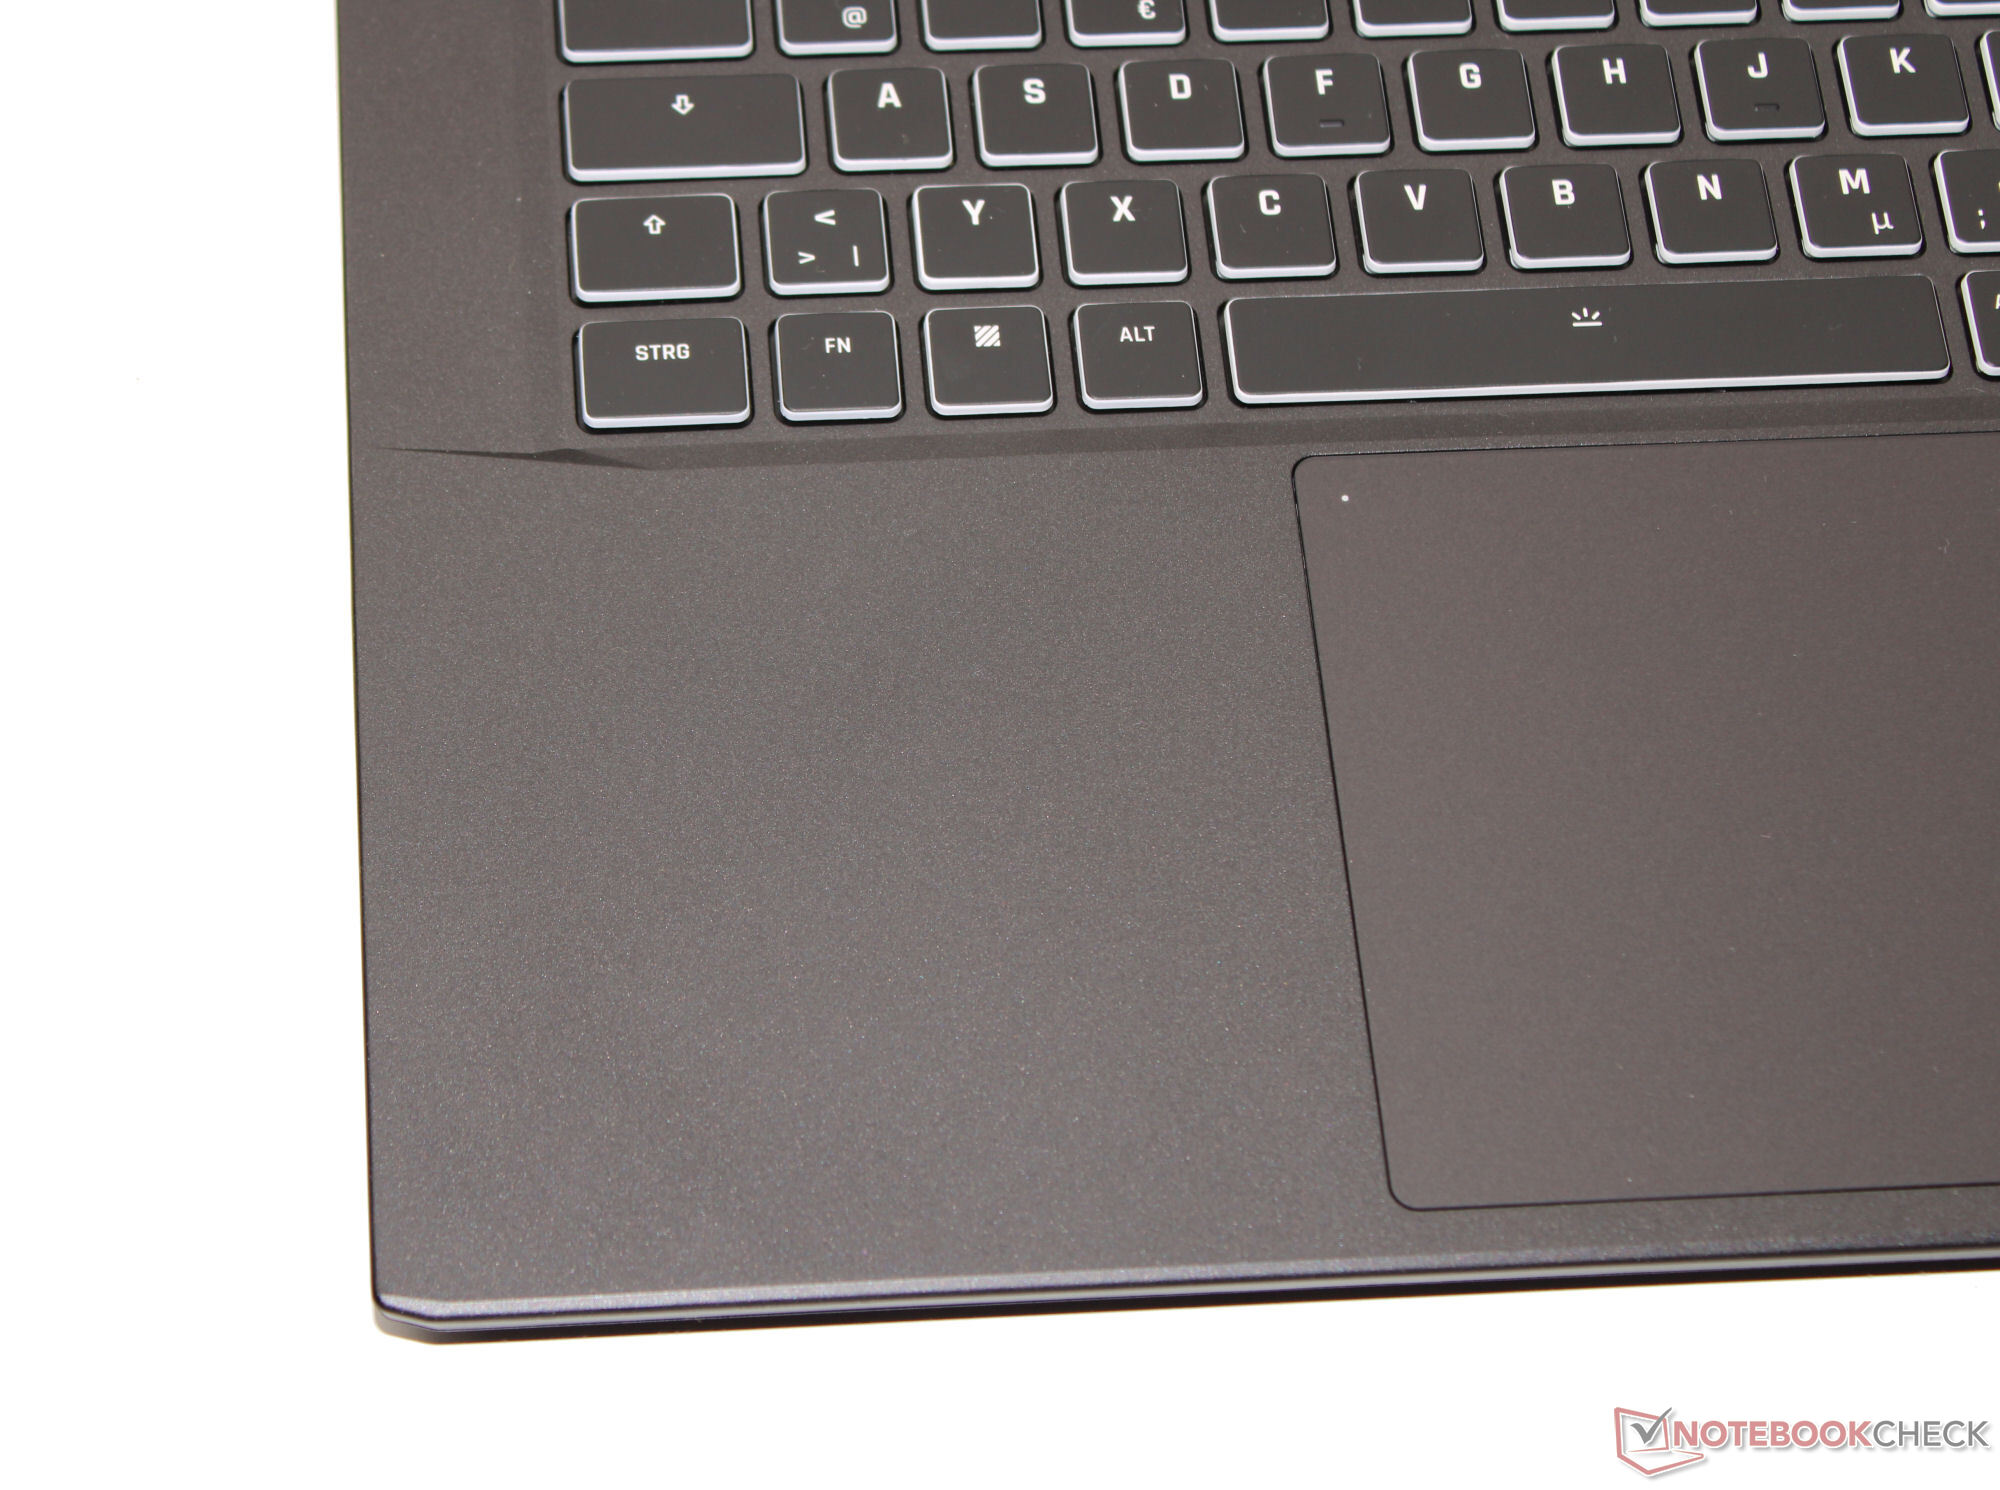
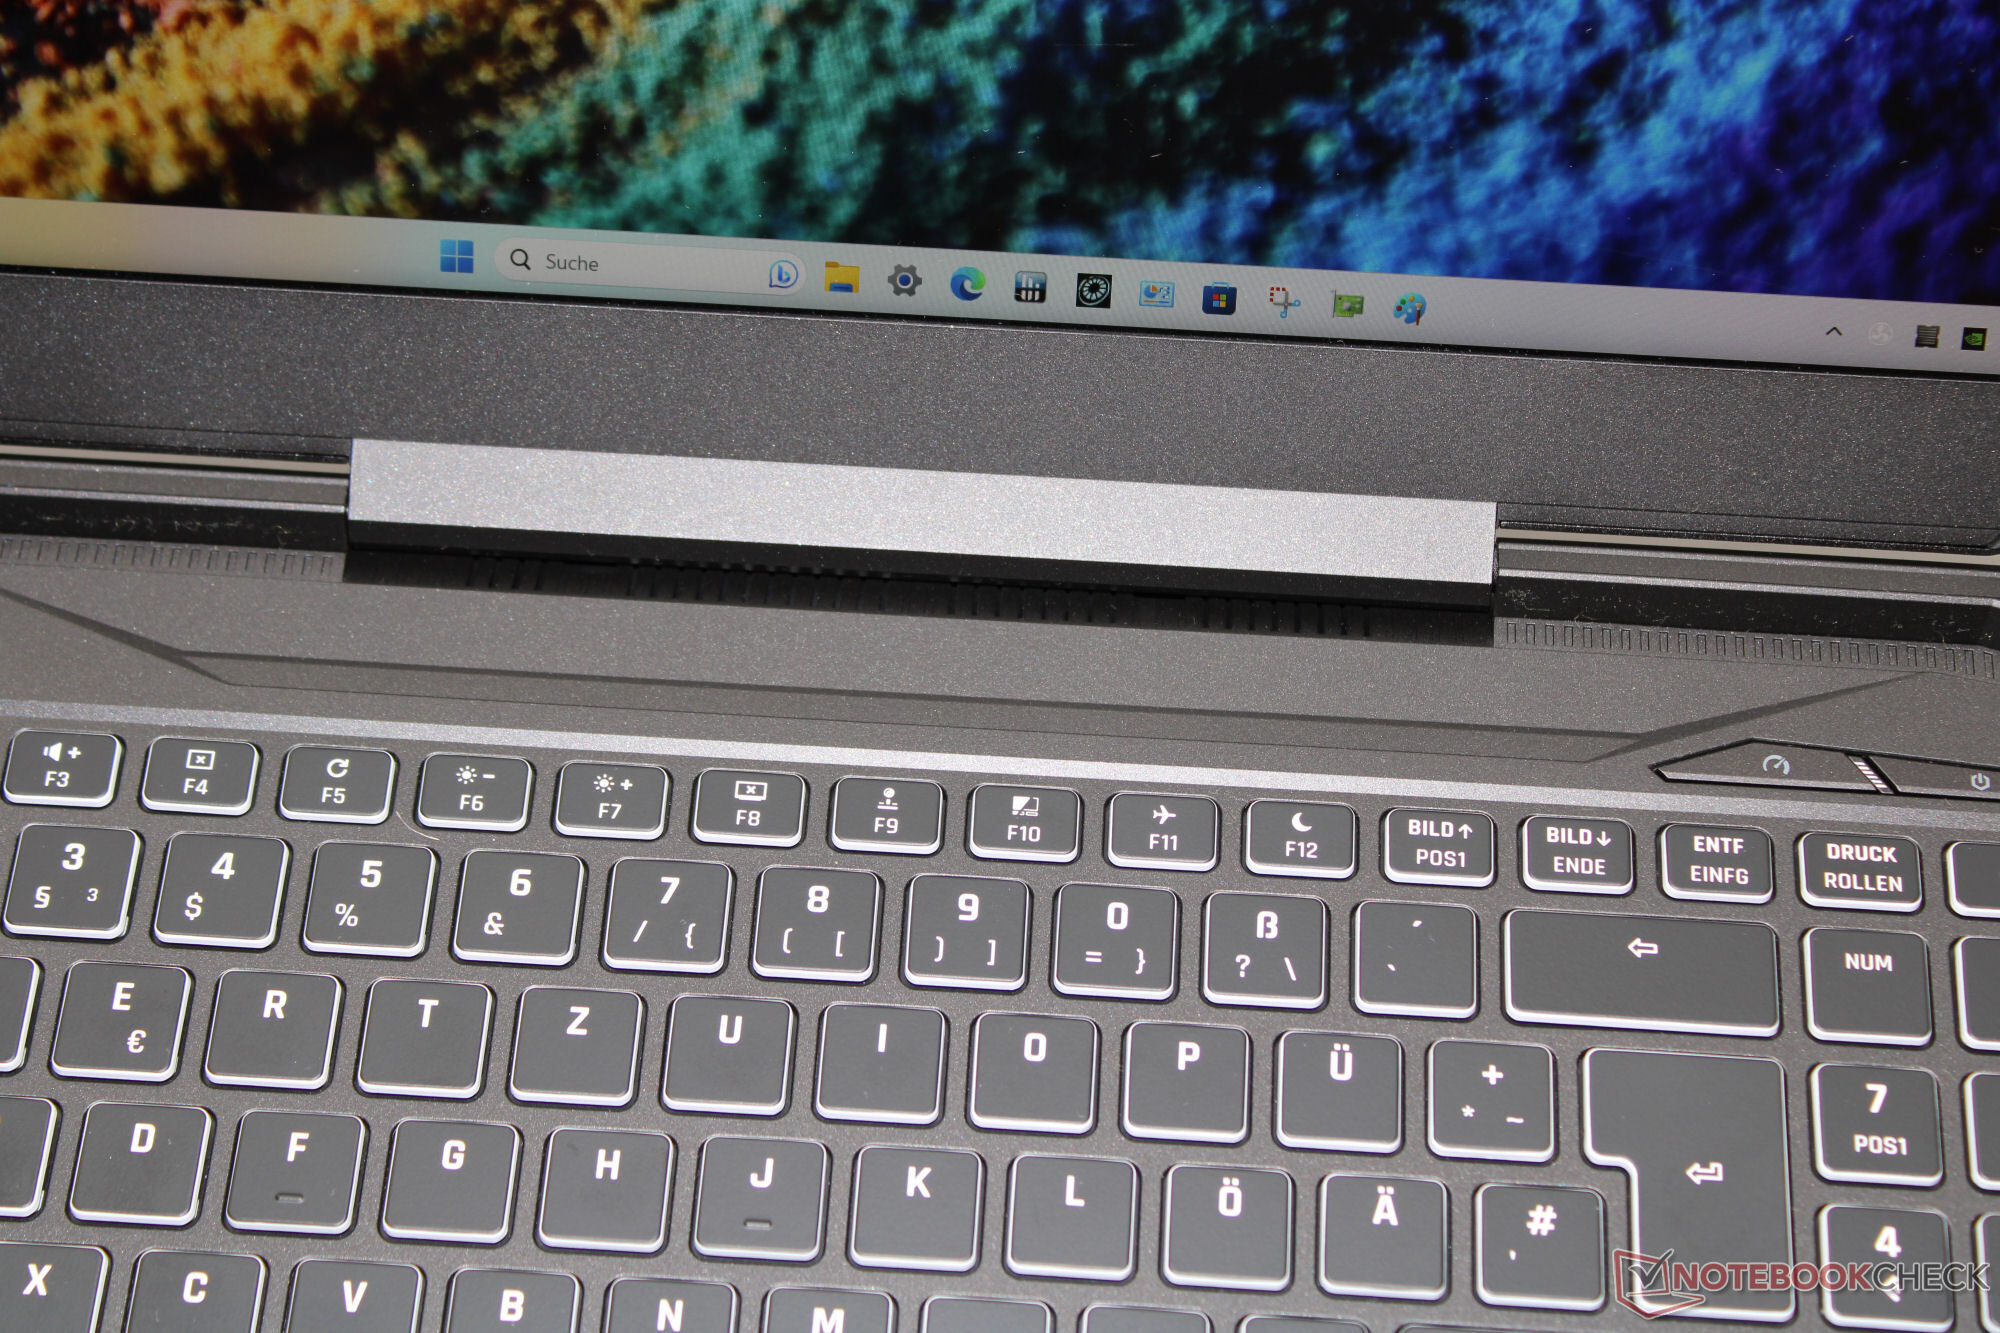
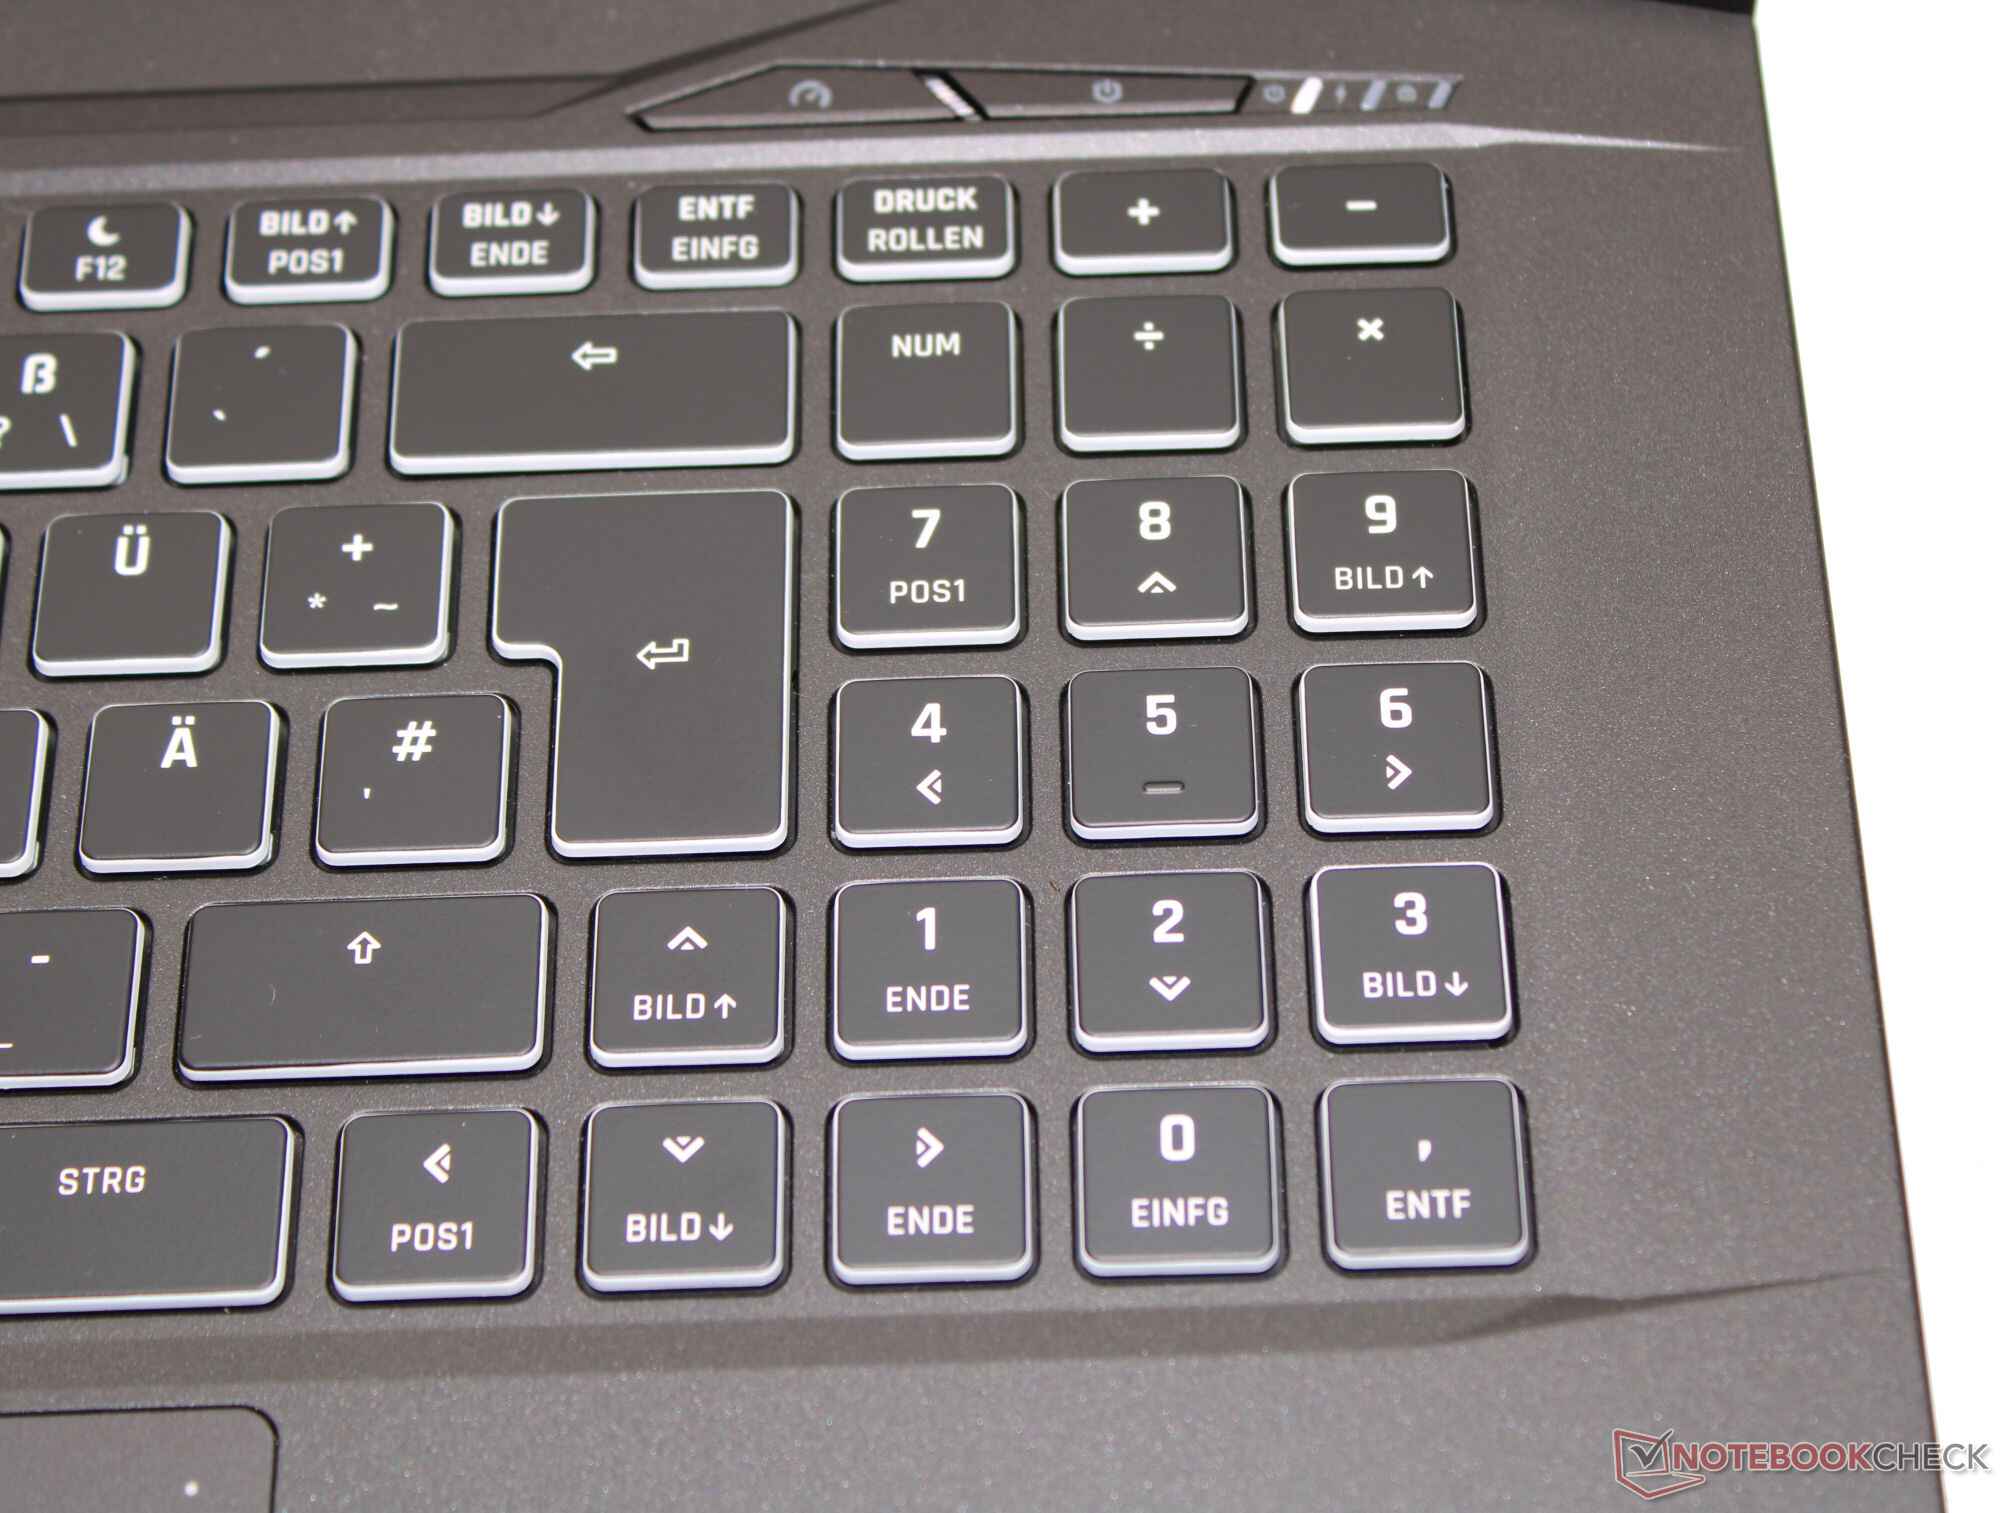
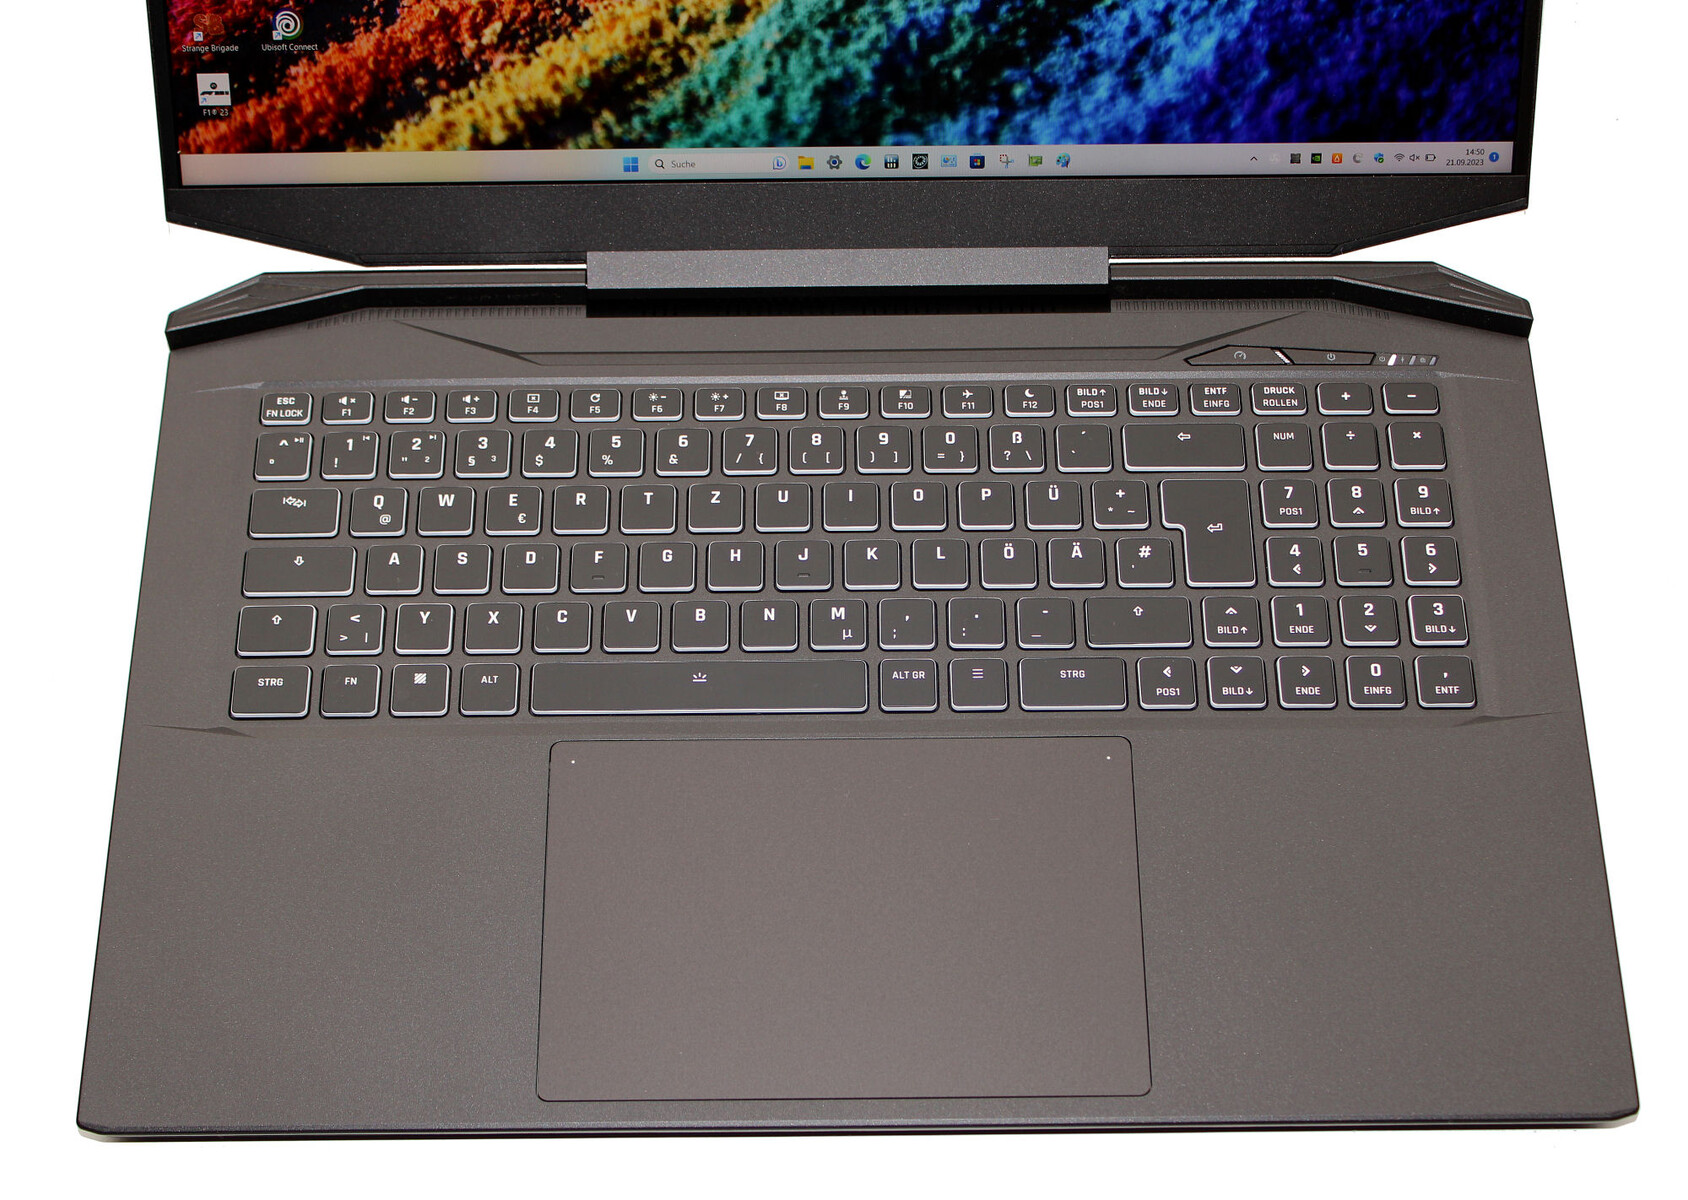
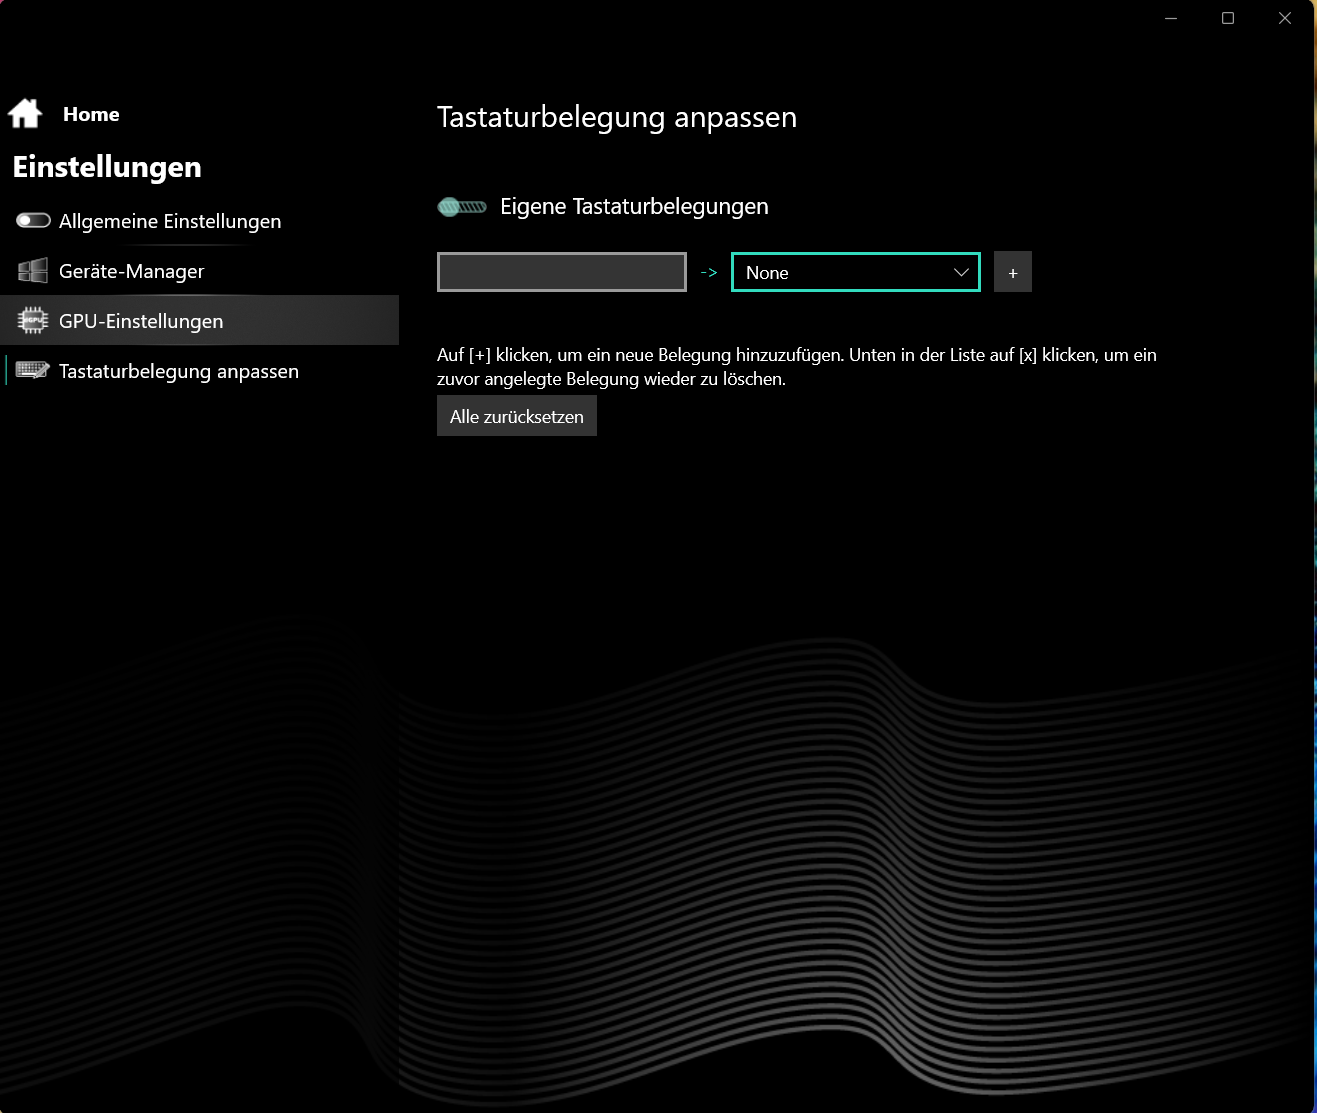
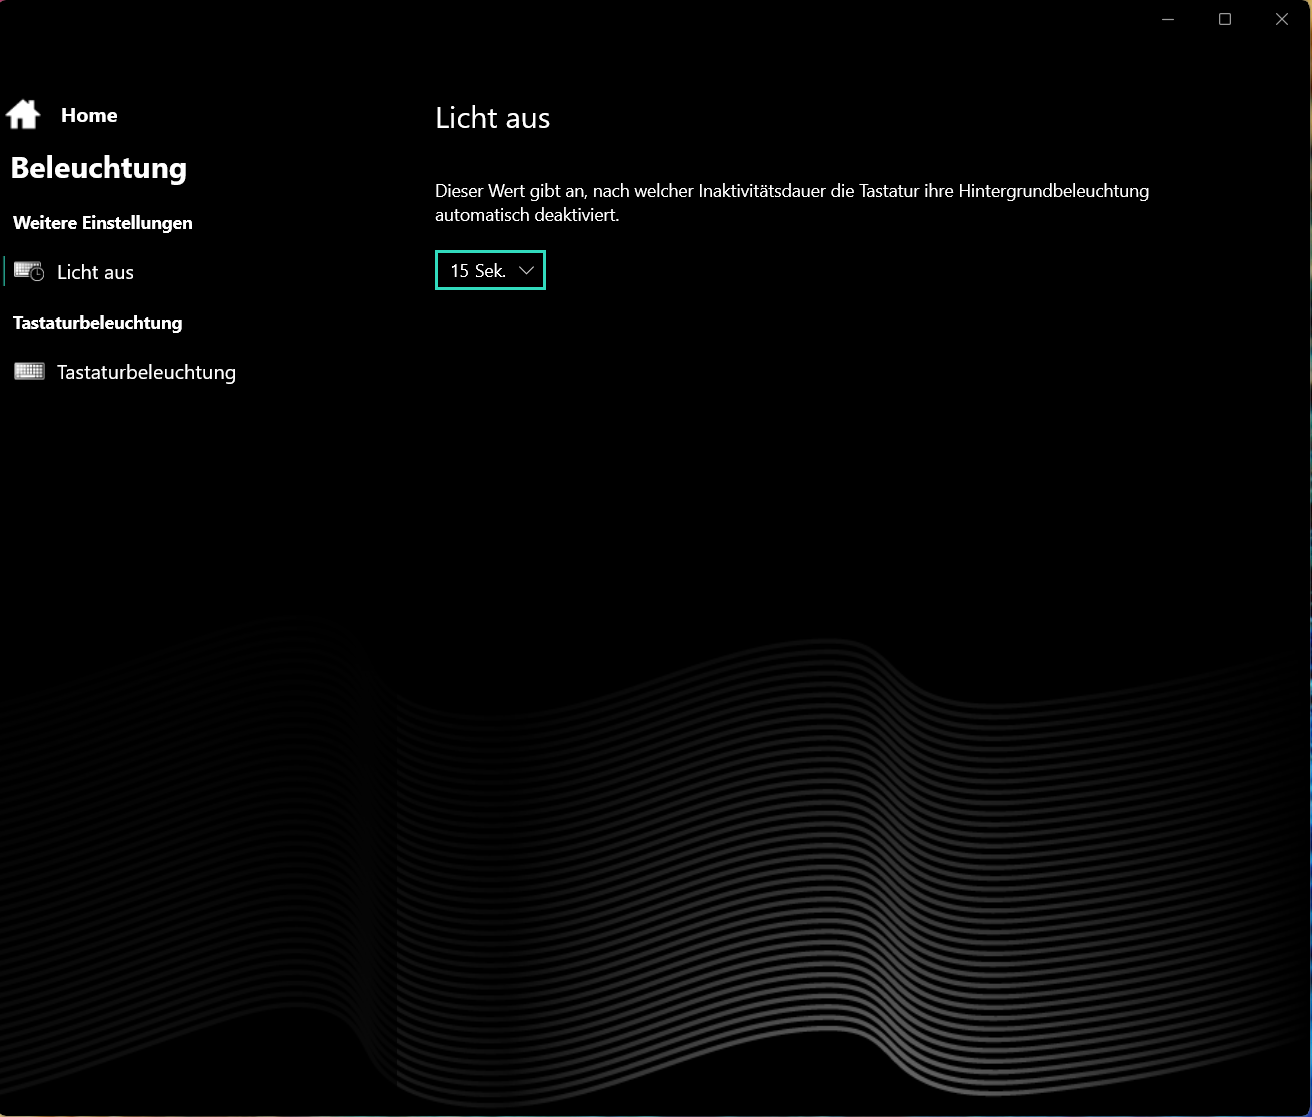
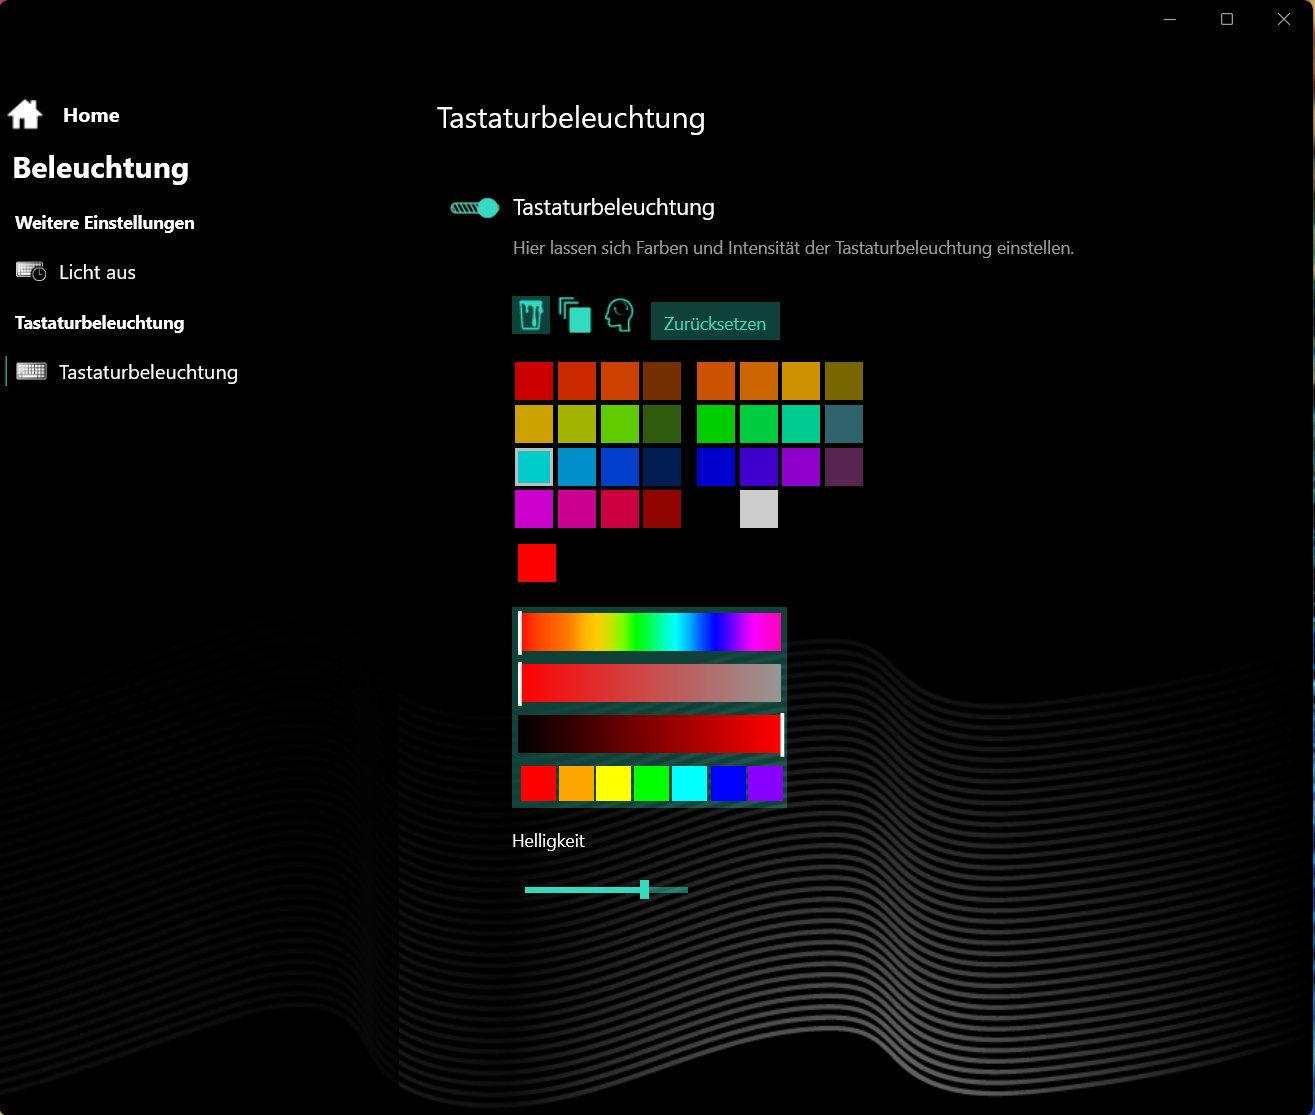
Giriş cihazları - Apex 17 RGB tuş aydınlatmasına sahiptir
Klavye
Arkadan aydınlatmalı, chiclet klavyenin (RGB) düz, pürüzsüz tuşları, orta tuş hareketinin yanı sıra belirgin bir basınç noktasına ve hoş bir dirence sahiptir. Yazarken klavye eğilmiyor. Sonuç olarak, günlük kullanıma uygun bir klavye elde edersiniz.
Dokunmatik yüzey
Kısa hareket mesafesine ve net bir basınç noktasına sahip Clickpad (yaklaşık 15,4 x 10 cm), farenin yerini alıyor. Sol üst köşedeki LED'e dokunulduğunda tüm ped kapatılır ya da açılır. Sağ üst köşedeki LED'e dokunulduğunda pedin sağ tarafı kapatılır veya açılır.
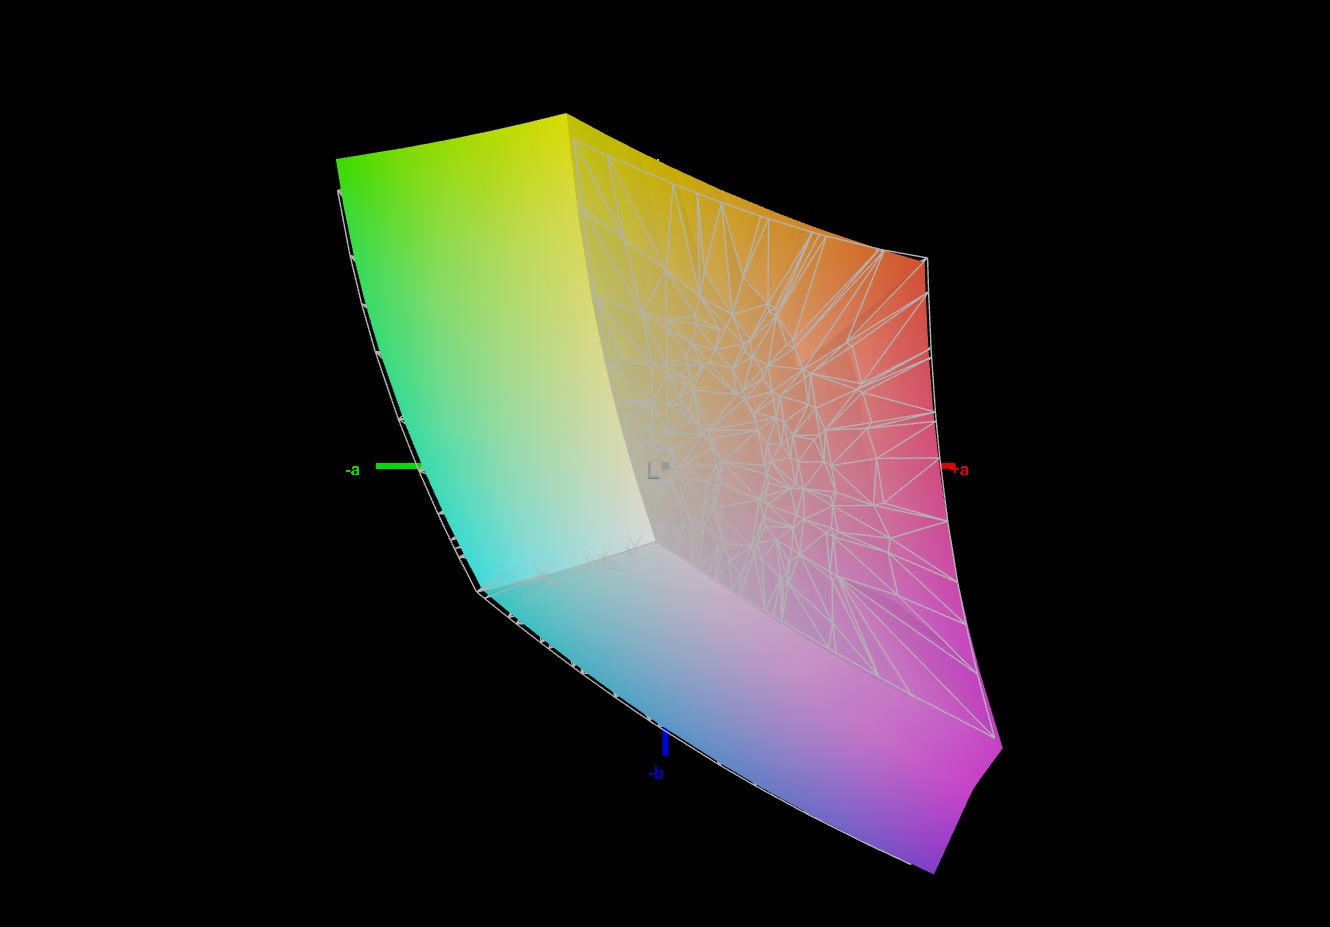
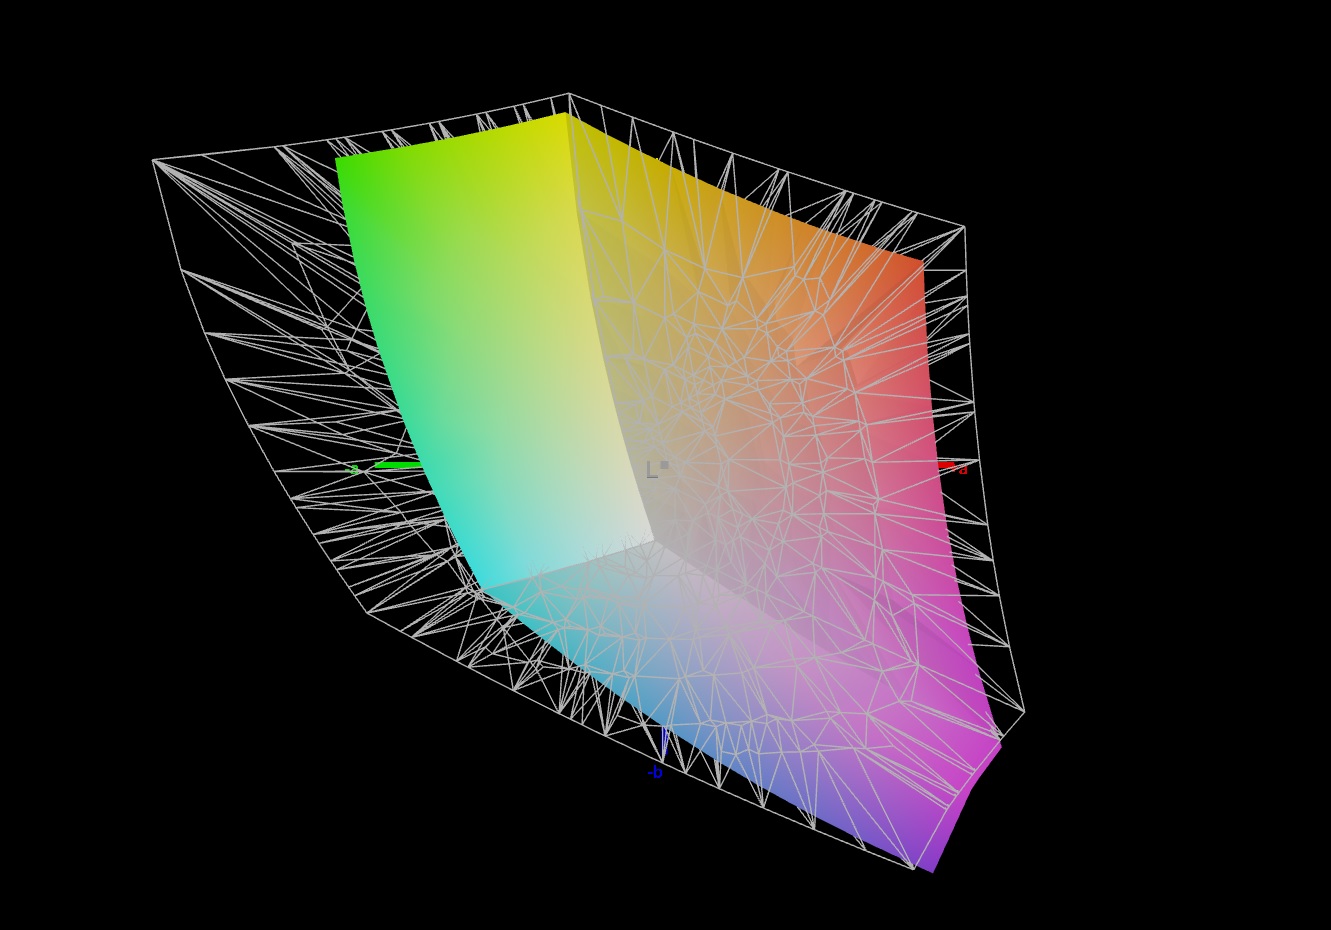
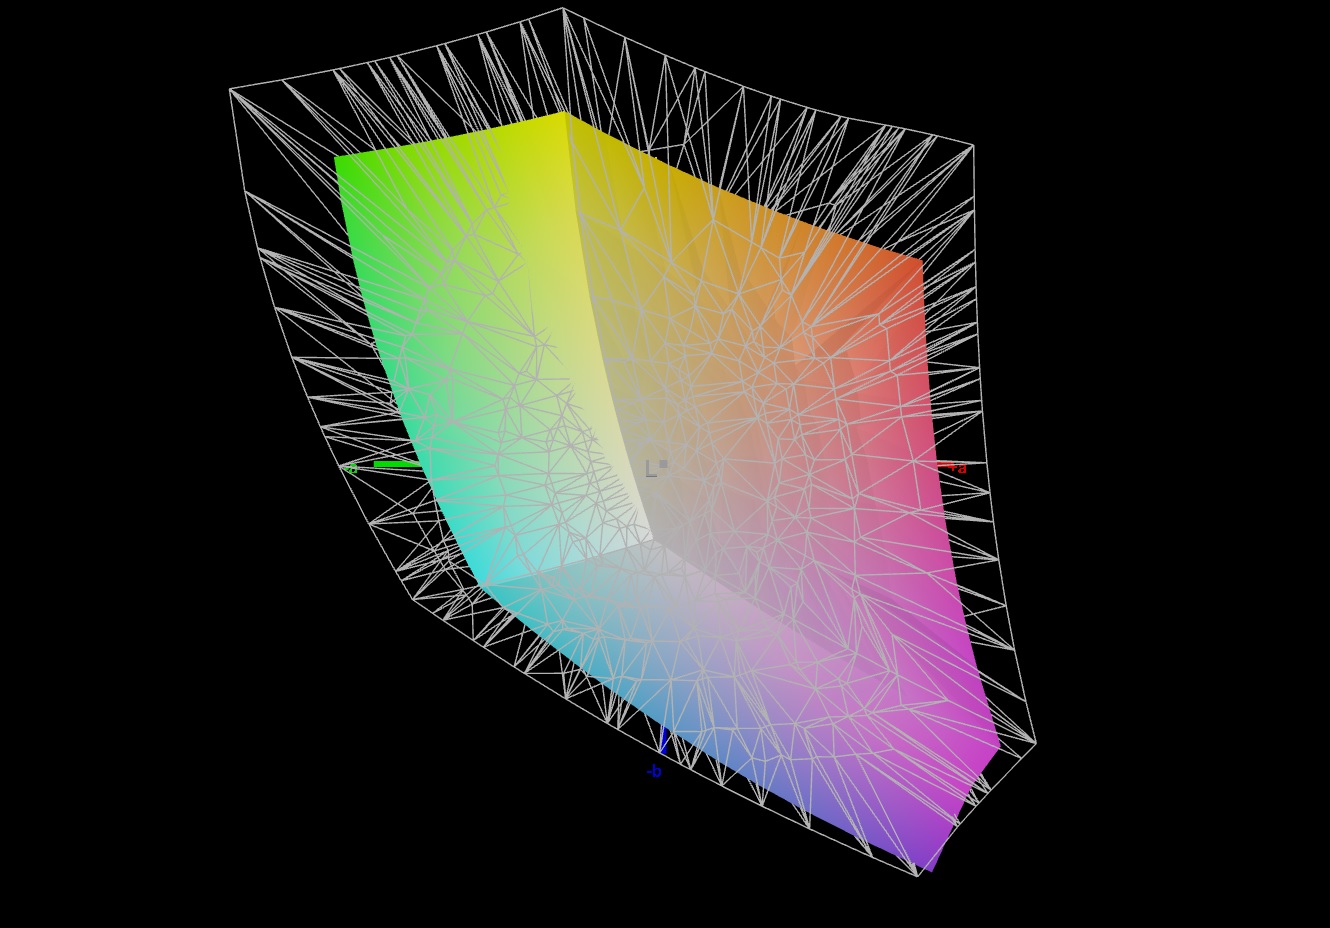
Ekran - sRGB kapsamına sahip bir QHD panel
Duyarlı, 16:9 en boy oranlı 240 Hz panel, parlaklık ayarından bağımsız olarak PWM titremesi göstermez. Mat, 17,3 inç ekranın parlaklığı ve kontrastı (2.560 x 1.440 piksel) ilgili hedeflerini karşılıyor (> 300 cd/m² ve 1.000:1).
İnceleme cihazının QHD ekranına ek olarak Schenker, Apex 17'yi alternatif bir FHD (1.920 x 1.080 piksel, 144 Hz, IPS) panel ile sunuyor.
| |||||||||||||||||||||||||
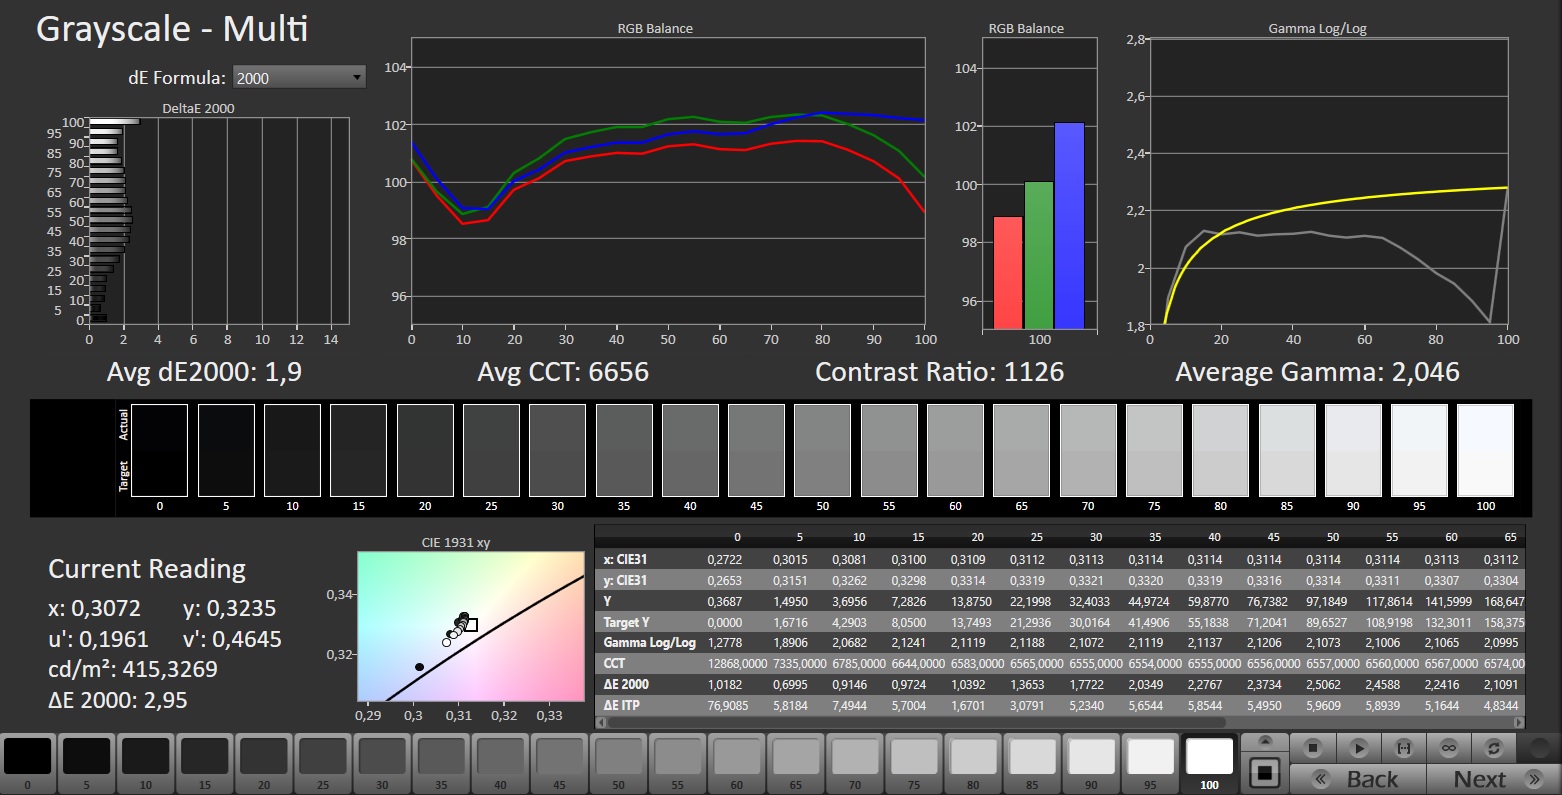
Aydınlatma: 90 %
Batarya modunda parlaklık: 403 cd/m²
Kontrast: 1089:1 (Siyah: 0.37 cd/m²)
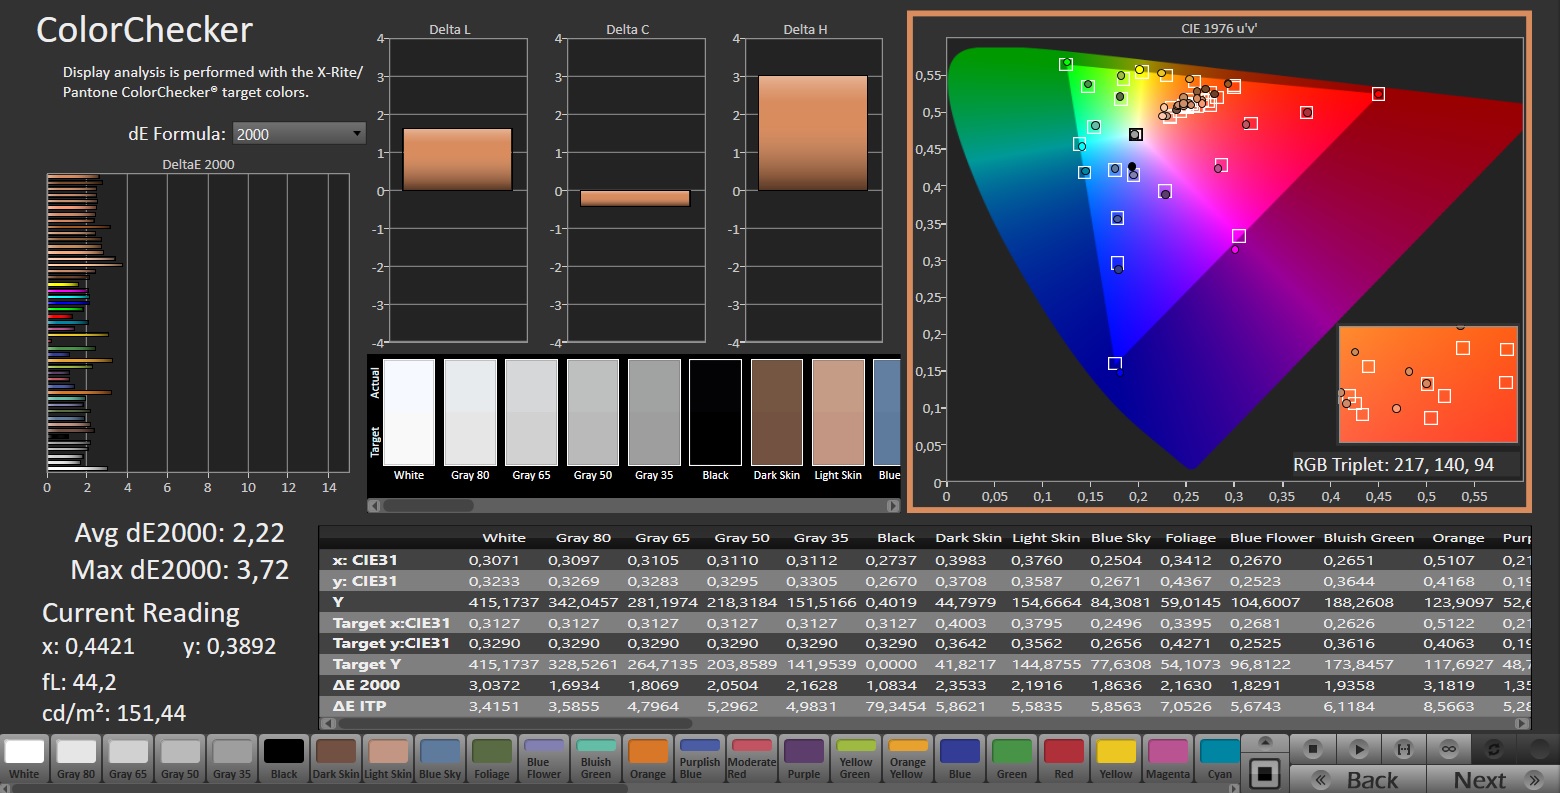
ΔE ColorChecker Calman: 2.22 | ∀{0.5-29.43 Ø4.71}
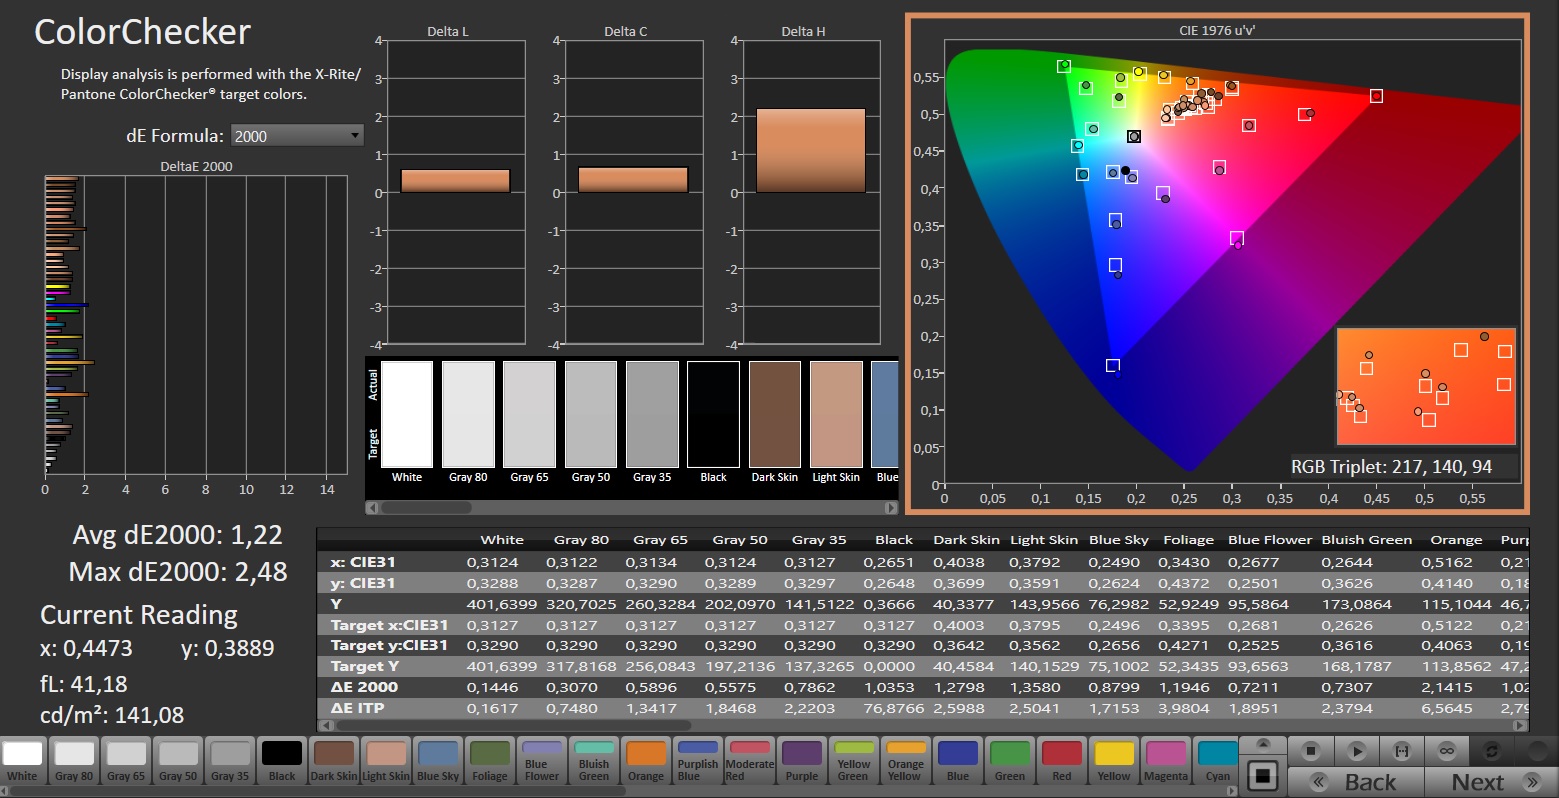
calibrated: 1.22
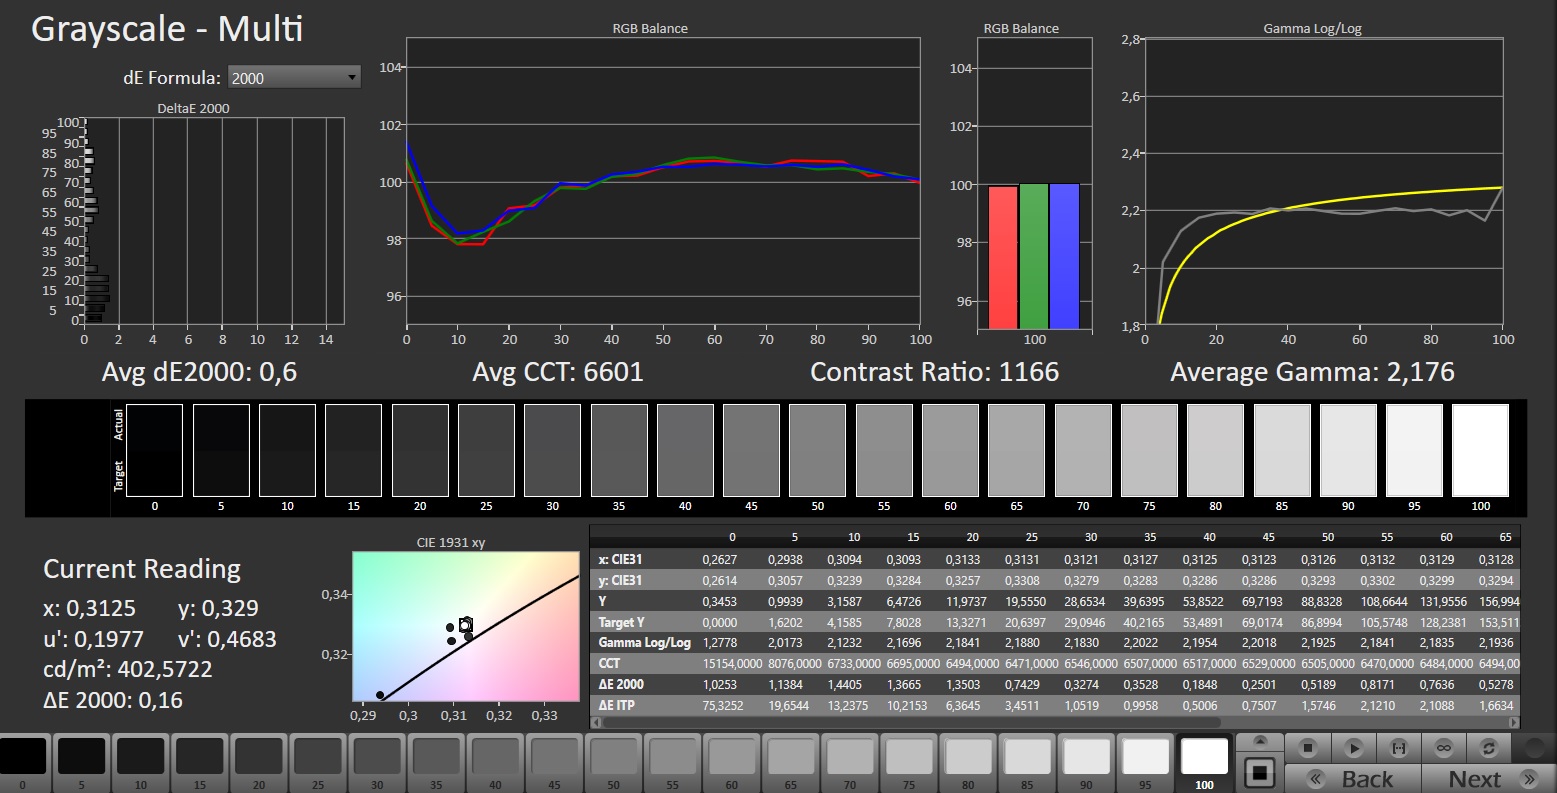
ΔE Greyscale Calman: 1.9 | ∀{0.09-98 Ø4.96}
69.5% AdobeRGB 1998 (Argyll 3D)
97.7% sRGB (Argyll 3D)
68.1% Display P3 (Argyll 3D)
Gamma: 2.046
CCT: 6656 K
| Schenker XMG Apex 17 (Late 23) BOE CQ NE173QHM-NZ3, IPS, 2560x1440, 17.3" | Alienware m16 R1 Intel BOE NE16NYB, IPS, 2560x1600, 16" | Lenovo Legion Pro 5 16IRX8 AU Optronics B160QAN03.1, IPS, 2560x1600, 16" | Acer Nitro 17 AN17-51-71ER BOE0B7C NE173QHM-NY6, , 2560x1440, 17.3" | Medion Erazer Defender P40 BOE CQ NE173QHM-NZ3, IPS, 2560x1440, 17.3" | MSI Katana 17 B13VFK B173HAN04.9, IPS LED, 1920x1080, 17.3" | |
|---|---|---|---|---|---|---|
| Display | -0% | 4% | 23% | 0% | -39% | |
| Display P3 Coverage (%) | 68.1 | 67.7 -1% | 71.2 5% | 98.3 44% | 68.3 0% | 40.8 -40% |
| sRGB Coverage (%) | 97.7 | 97.2 -1% | 98.8 1% | 100 2% | 98.1 0% | 61 -38% |
| AdobeRGB 1998 Coverage (%) | 69.5 | 70 1% | 73.3 5% | 85.7 23% | 69.8 0% | 42.2 -39% |
| Response Times | 39% | -20% | -6% | -9% | -187% | |
| Response Time Grey 50% / Grey 80% * (ms) | 13.5 ? | 4 ? 70% | 14.5 ? -7% | 14.8 ? -10% | 14.6 ? -8% | 33 ? -144% |
| Response Time Black / White * (ms) | 7.9 ? | 7.3 ? 8% | 10.4 ? -32% | 8 ? -1% | 8.7 ? -10% | 26 ? -229% |
| PWM Frequency (Hz) | ||||||
| Screen | -12% | 11% | -57% | 11% | -90% | |
| Brightness middle (cd/m²) | 403 | 306 -24% | 405.7 1% | 361 -10% | 364 -10% | 267 -34% |
| Brightness (cd/m²) | 381 | 302 -21% | 368 -3% | 326 -14% | 343 -10% | 256 -33% |
| Brightness Distribution (%) | 90 | 89 -1% | 87 -3% | 87 -3% | 86 -4% | 93 3% |
| Black Level * (cd/m²) | 0.37 | 0.3 19% | 0.38 -3% | 0.6 -62% | 0.28 24% | 0.21 43% |
| Contrast (:1) | 1089 | 1020 -6% | 1068 -2% | 602 -45% | 1300 19% | 1271 17% |
| Colorchecker dE 2000 * | 2.22 | 2.57 -16% | 1.65 26% | 3.83 -73% | 1.67 25% | 4.7 -112% |
| Colorchecker dE 2000 max. * | 3.76 | 4.26 -13% | 4.2 -12% | 5.71 -52% | 2.78 26% | 20.4 -443% |
| Colorchecker dE 2000 calibrated * | 1.22 | 0.85 30% | 0.53 57% | 3.48 -185% | 1.14 7% | 4.5 -269% |
| Greyscale dE 2000 * | 1.9 | 3.3 -74% | 1.2 37% | 3.29 -73% | 1.4 26% | 1.5 21% |
| Gamma | 2.046 108% | 1.997 110% | 2.3 96% | 2.29 96% | 2.091 105% | 2.12 104% |
| CCT | 6656 98% | 6895 94% | 6453 101% | 6679 97% | 6568 99% | 6552 99% |
| Toplam Ortalama (Program / Ayarlar) | 9% /
-2% | -2% /
5% | -13% /
-33% | 1% /
6% | -105% /
-93% |
* ... daha küçük daha iyidir
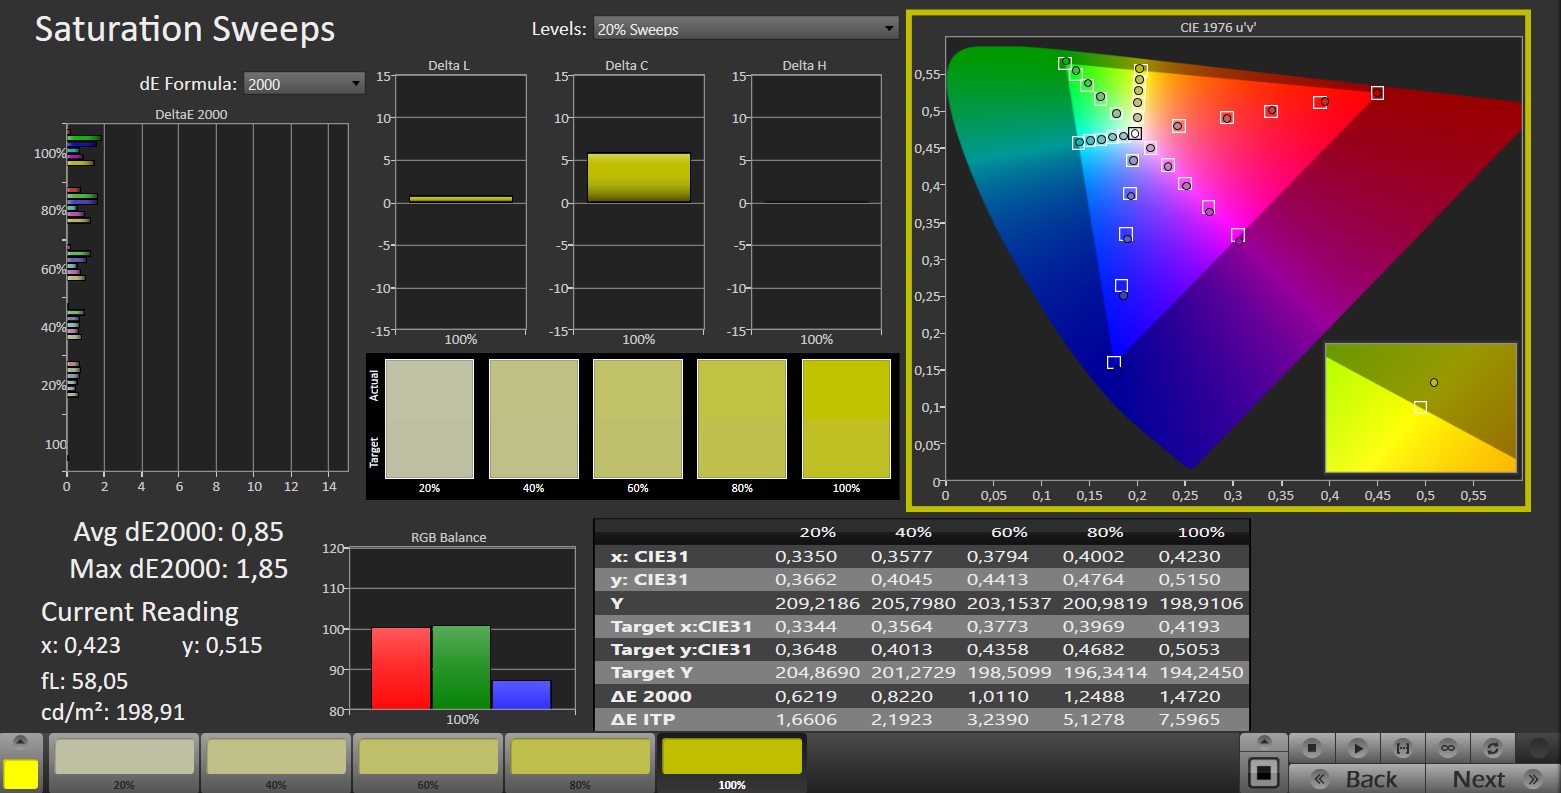
Kutudan çıkar çıkmaz ekran iyi bir renk üretimi sergiliyor. Yaklaşık 2,2'lik bir sapma ile hedef değere (DeltaE < 3) ulaşılır. Kalibrasyon, sapmayı 1,2'ye düşürür ve dengeli gri ölçekler sağlar. Panel, sRGB renk alanını neredeyse tamamen kapsıyor ancak AdobeRGB ve DCI P3 renk alanlarını kapsamıyor. Rakip cihazların ekranlarının çoğu benzer bir tablo çiziyor. YalnızcaNitro 17'nin ekranı P3 renk uzayını kapsar.

Yanıt Sürelerini Görüntüle
| ↔ Tepki Süresi Siyahtan Beyaza | ||
|---|---|---|
| 7.9 ms ... yükseliş ↗ ve sonbahar↘ birleşimi | ↗ 3 ms yükseliş | 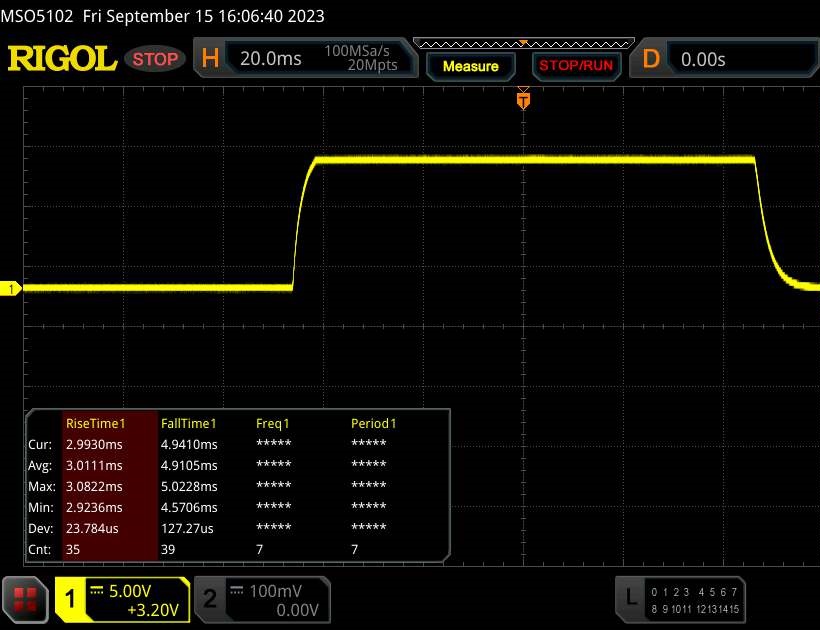 |
| ↘ 4.9 ms sonbahar | ||
| Ekran, testlerimizde çok hızlı yanıt oranları gösteriyor ve hızlı oyun oynamaya çok uygun olmalı. Karşılaştırıldığında, test edilen tüm cihazlar 0.1 (minimum) ile 240 (maksimum) ms arasında değişir. » Tüm cihazların 22 %'si daha iyi. Bu, ölçülen yanıt süresinin test edilen tüm cihazların ortalamasından (19.8 ms) daha iyi olduğu anlamına gelir. | ||
| ↔ Tepki Süresi %50 Griden %80 Griye | ||
| 13.5 ms ... yükseliş ↗ ve sonbahar↘ birleşimi | ↗ 6.4 ms yükseliş | 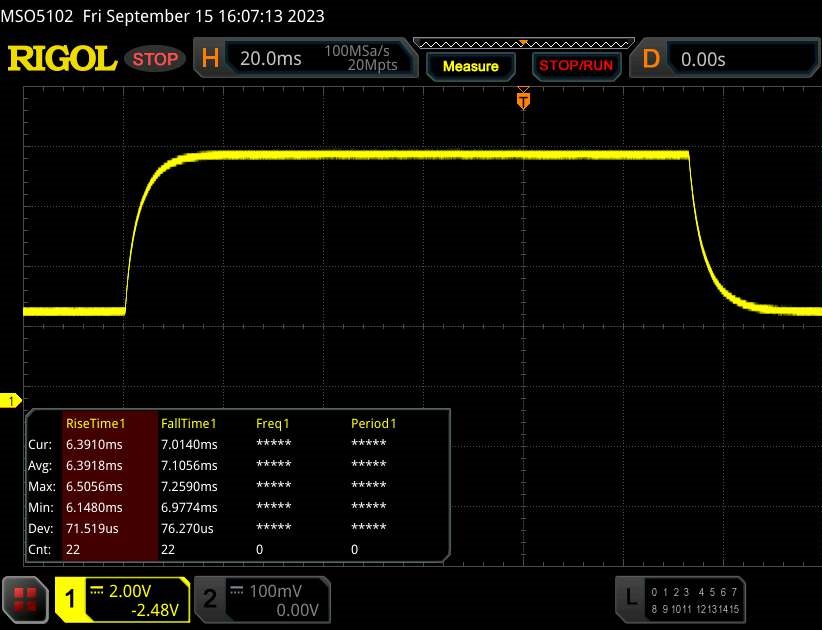 |
| ↘ 7.1 ms sonbahar | ||
| Ekran, testlerimizde iyi yanıt oranları gösteriyor ancak rekabetçi oyuncular için çok yavaş olabilir. Karşılaştırıldığında, test edilen tüm cihazlar 0.165 (minimum) ile 636 (maksimum) ms arasında değişir. » Tüm cihazların 27 %'si daha iyi. Bu, ölçülen yanıt süresinin test edilen tüm cihazların ortalamasından (31 ms) daha iyi olduğu anlamına gelir. | ||
Ekran Titremesi / PWM (Darbe Genişliği Modülasyonu)
| Ekran titriyor / PWM algılanmadı | 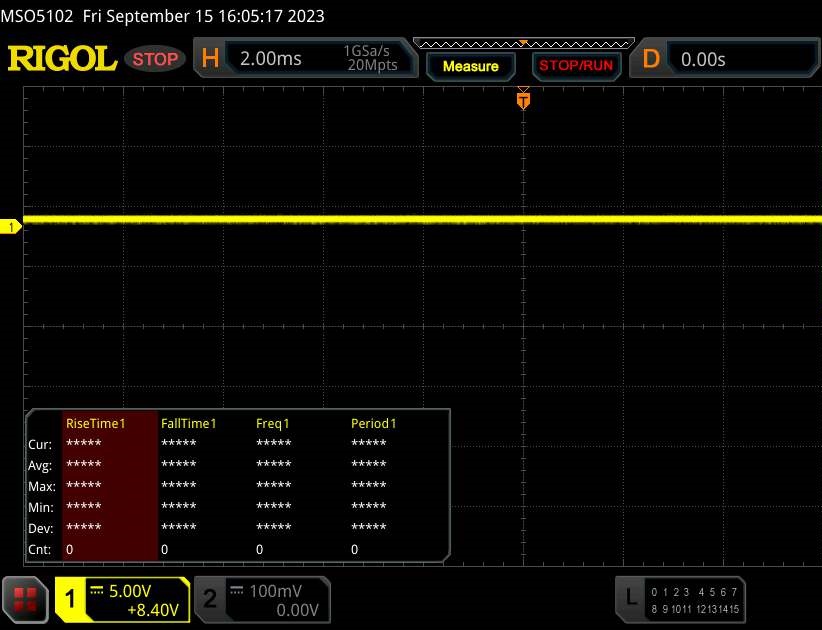 | ||
Karşılaştırıldığında: Test edilen tüm cihazların %52 %'si ekranı karartmak için PWM kullanmıyor. PWM tespit edilirse, ortalama 7754 (minimum: 5 - maksimum: 343500) Hz ölçüldü. | |||
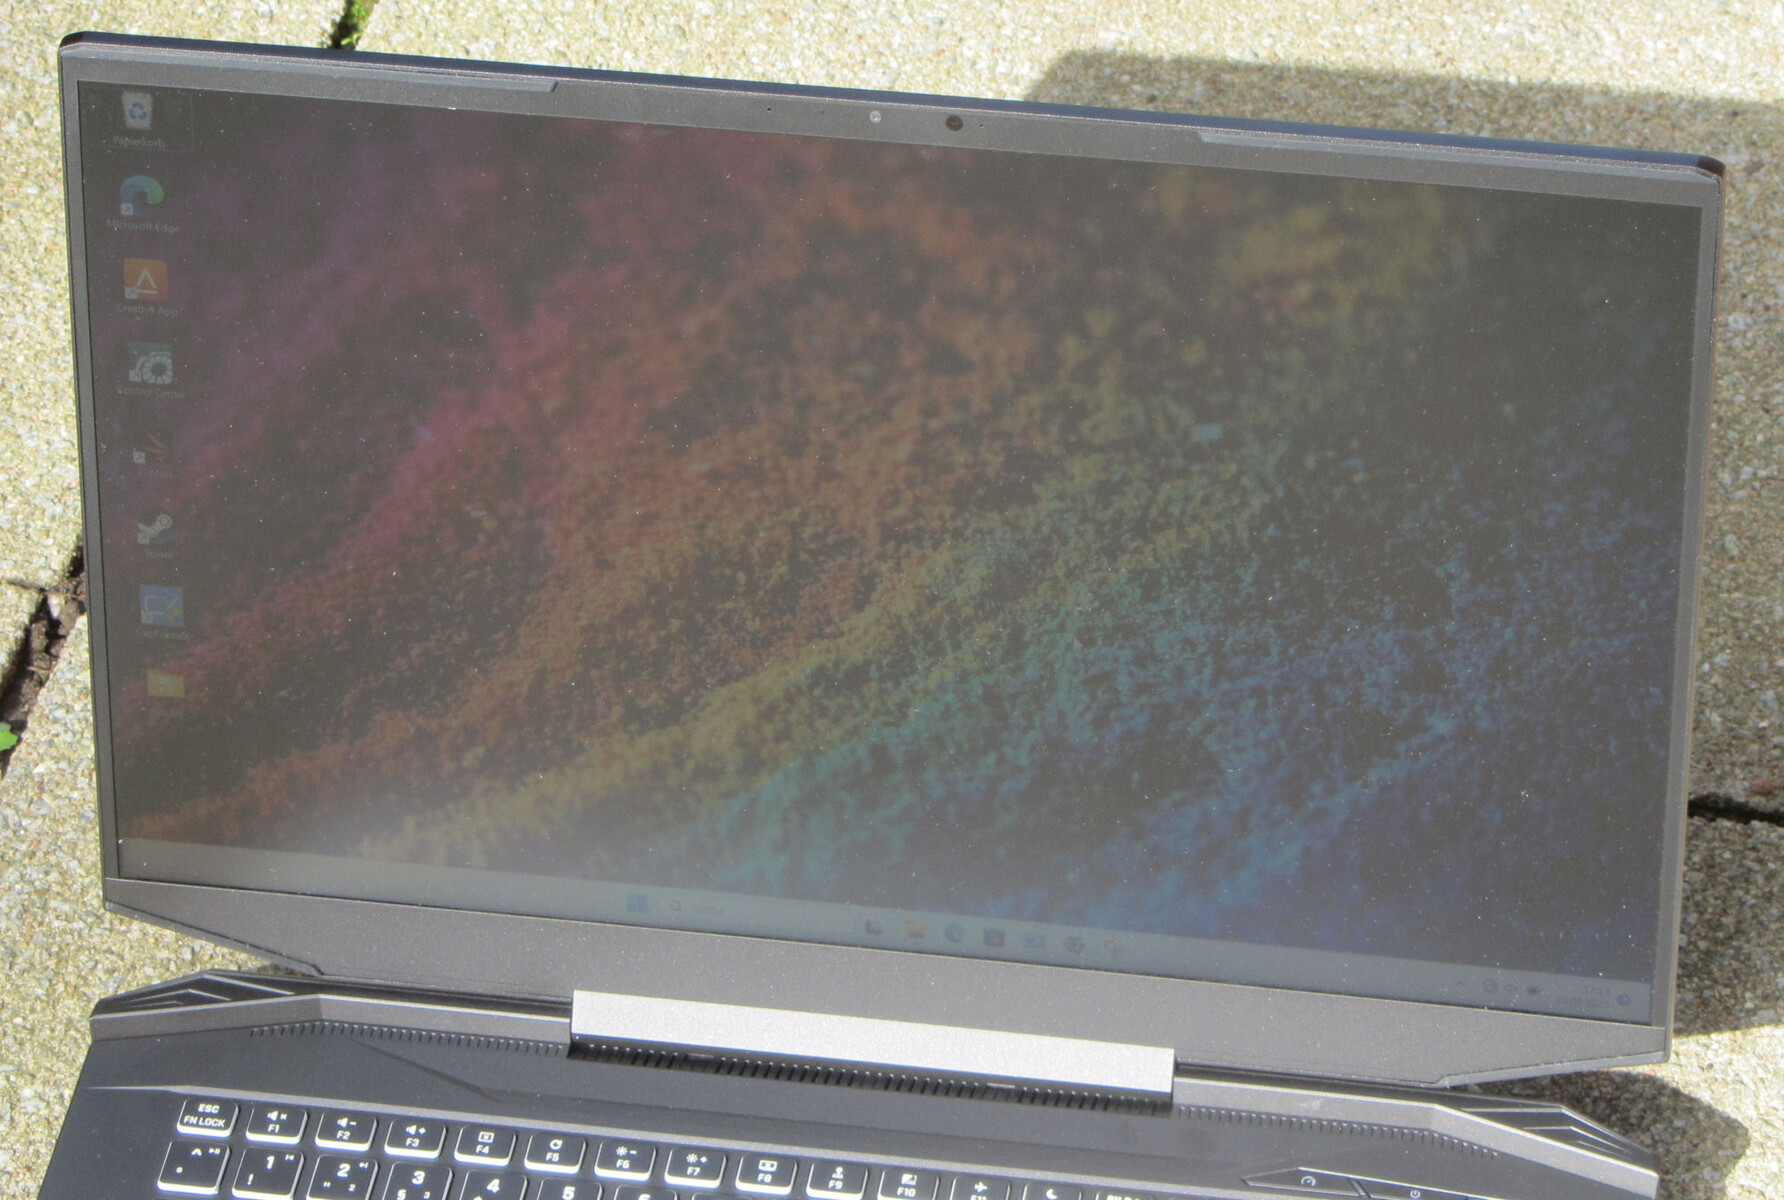
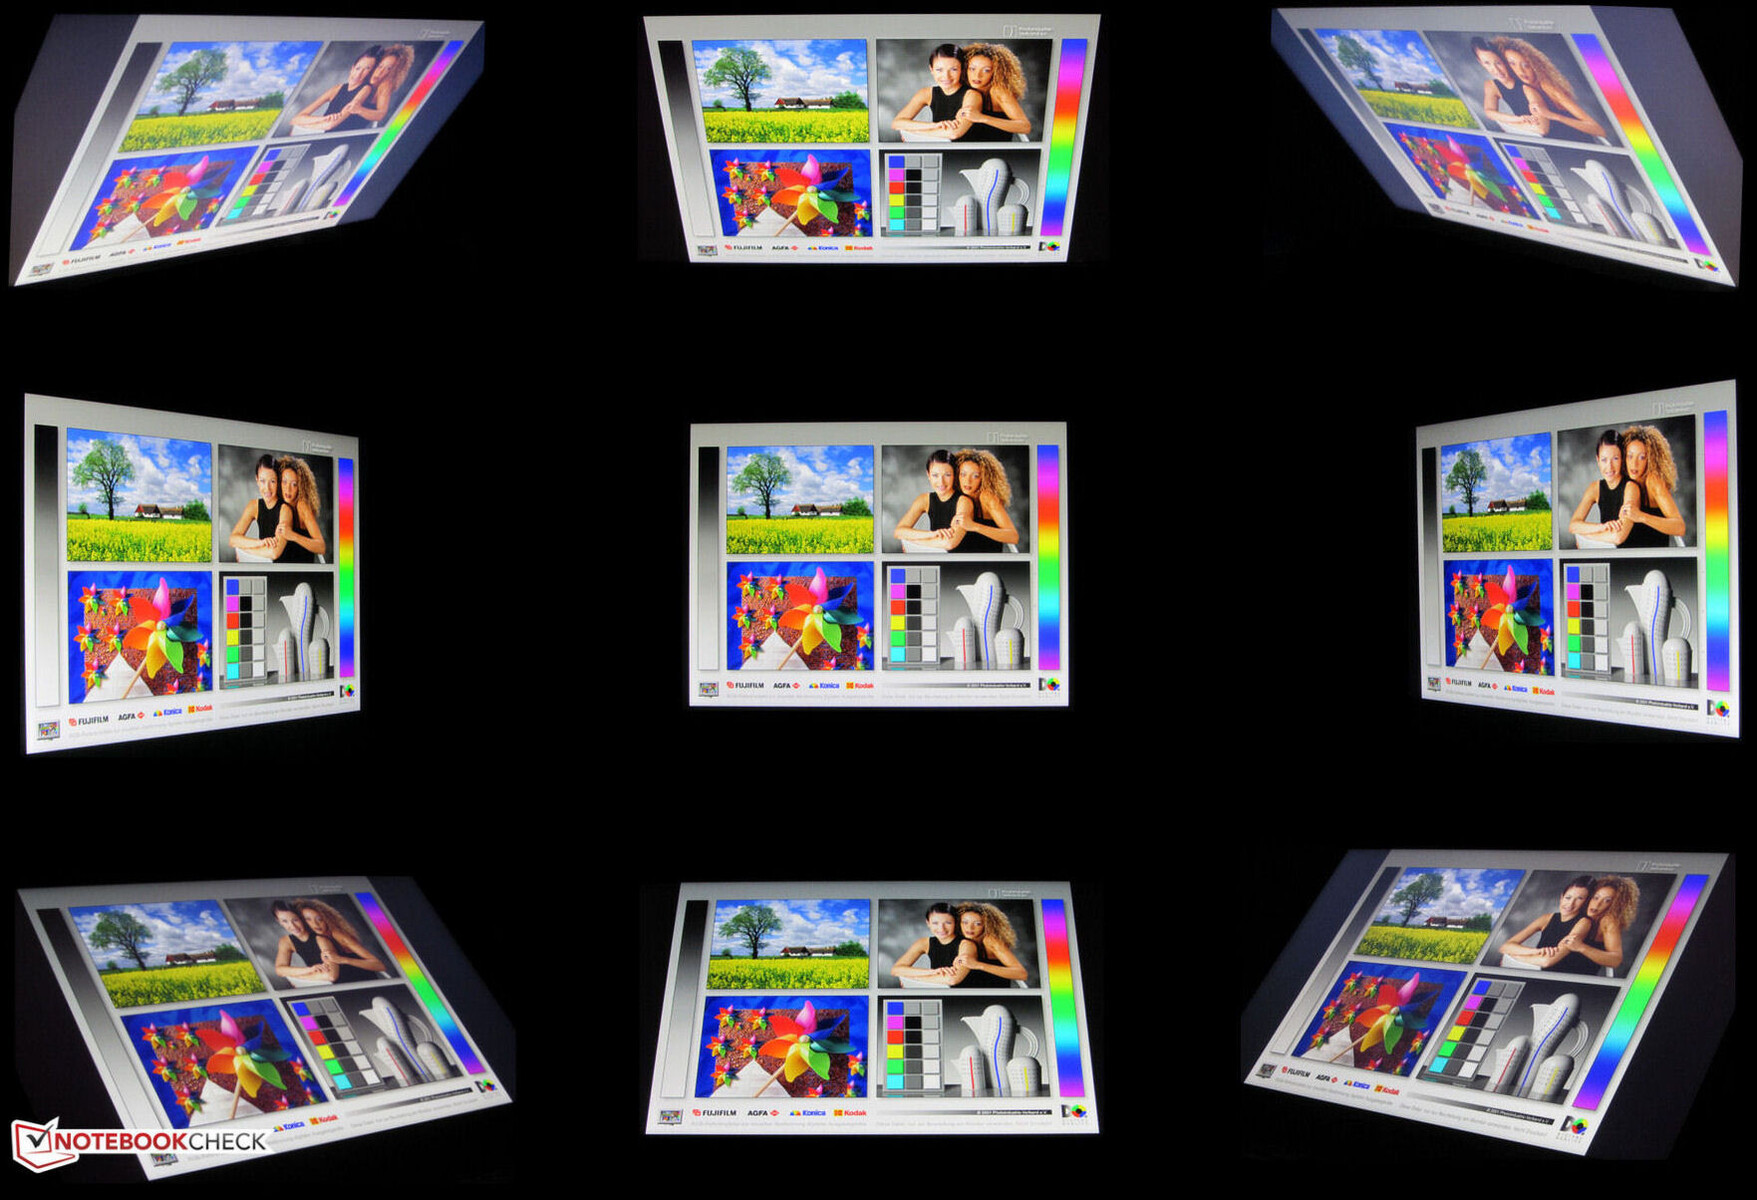
IPS panel iyi bir görüş açısı stabilitesine sahiptir ve her pozisyondan okunabilir. Dışarıda, güneş ışığı çok parlak olmadığı sürece ekran okunaklıdır.
Performans - Phoenix ve Ada Lovelace Schenker dizüstü bilgisayara güç veriyor
Schenker Apex 17, Phoenix ve Ada Lovelace tarafından sağlanan hesaplama gücüne sahip orta sınıf bir QHD oyun dizüstü bilgisayarıdır. Dizüstü bilgisayar özel olarak yapılandırılabilir ve Bestware.com'dan satın alınabilir. İnceleme cihazımız 1.200 Euro'dan başlayan fiyatlarla 1.750 Euro'ya alınabilir.
Test koşulları
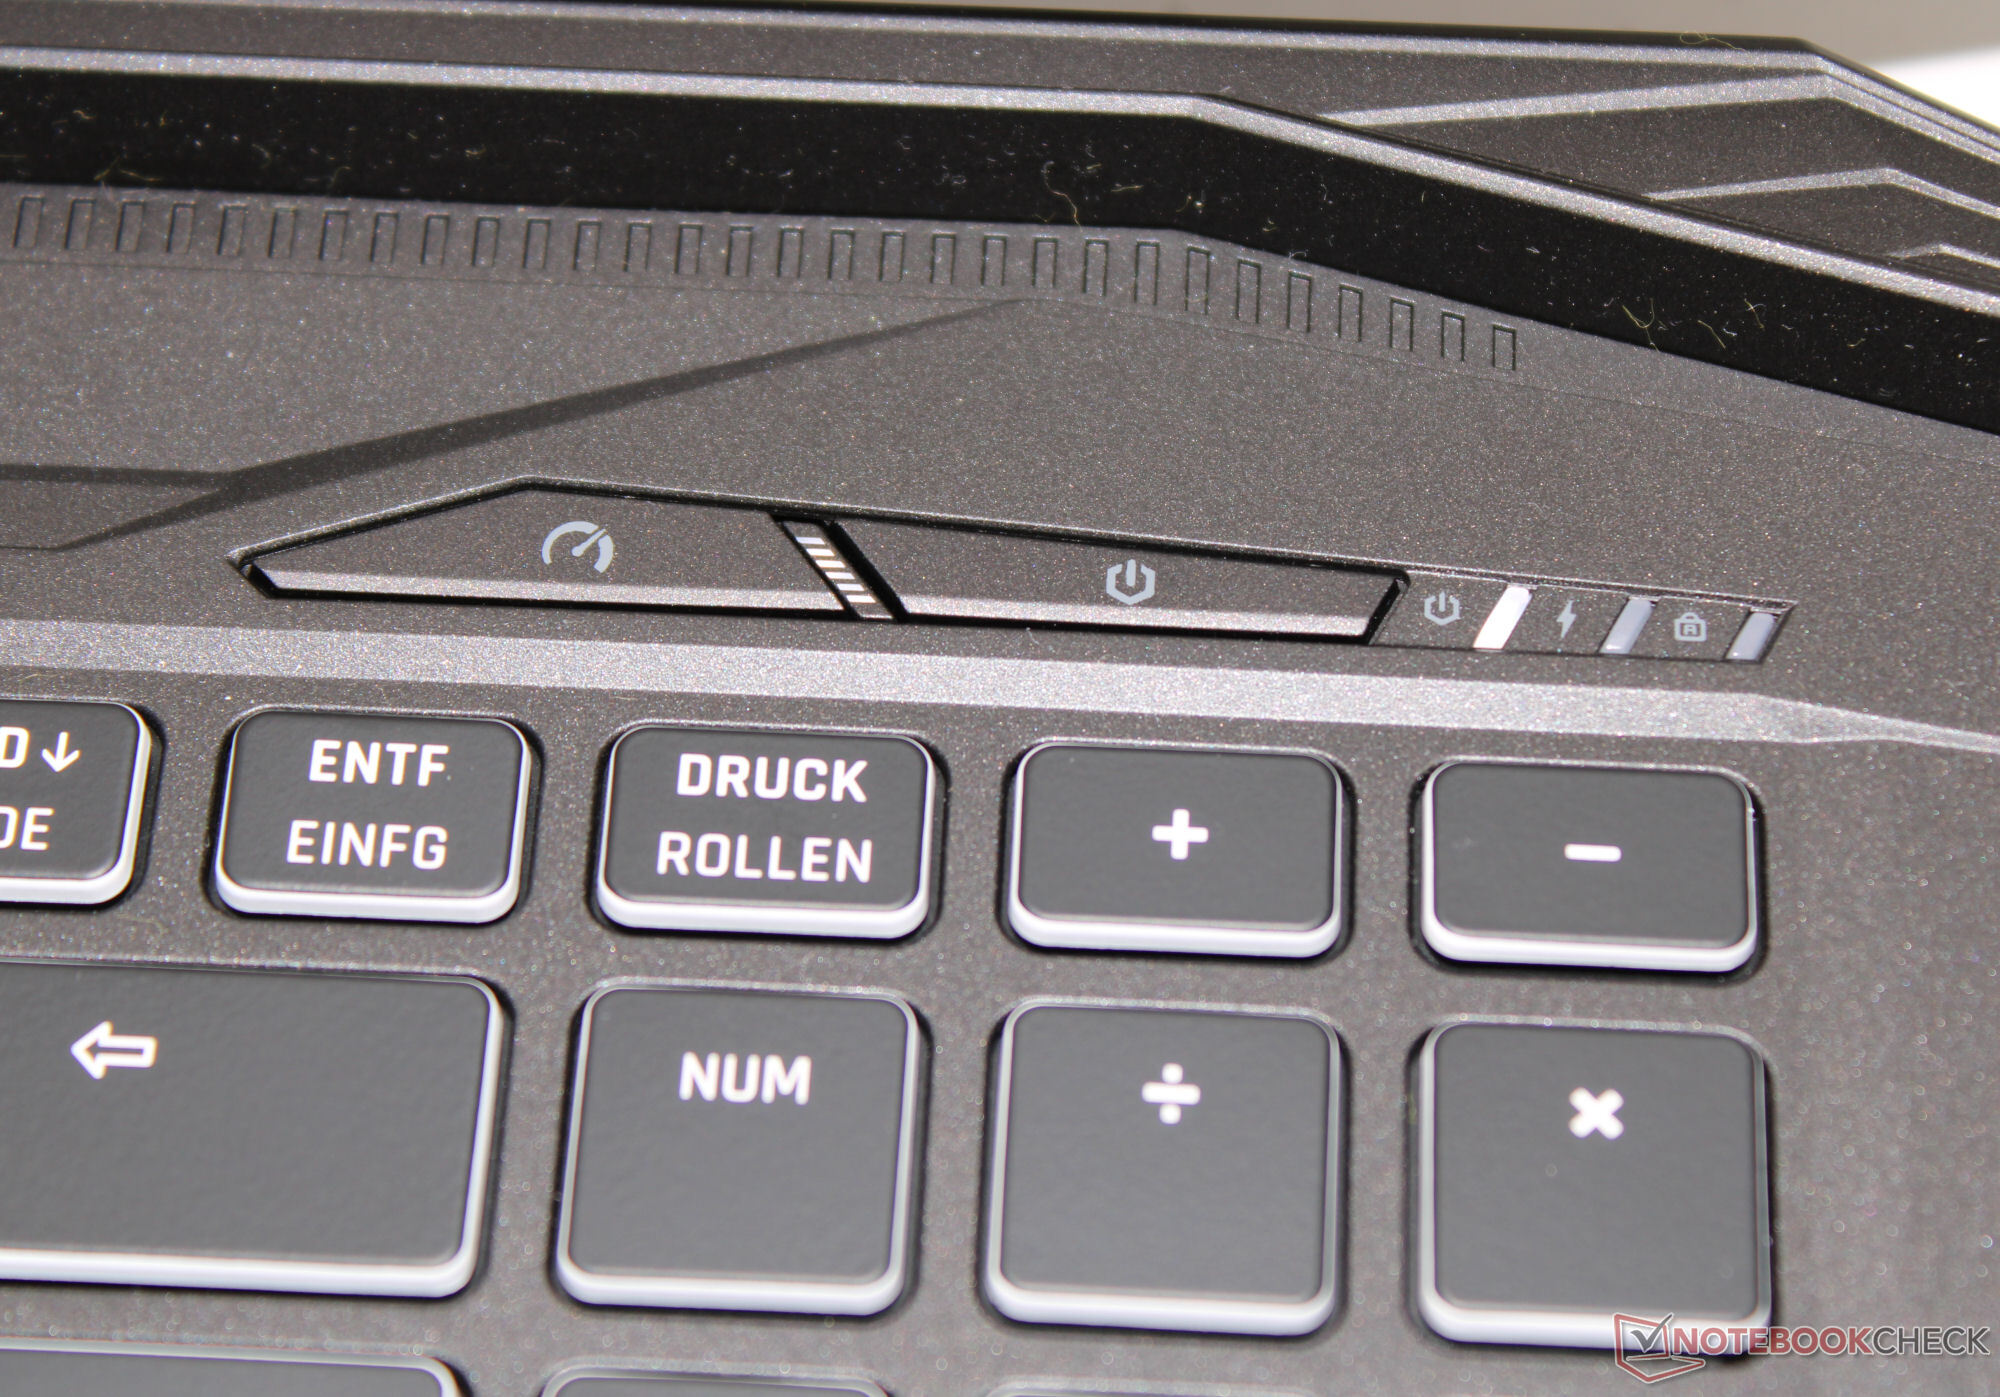
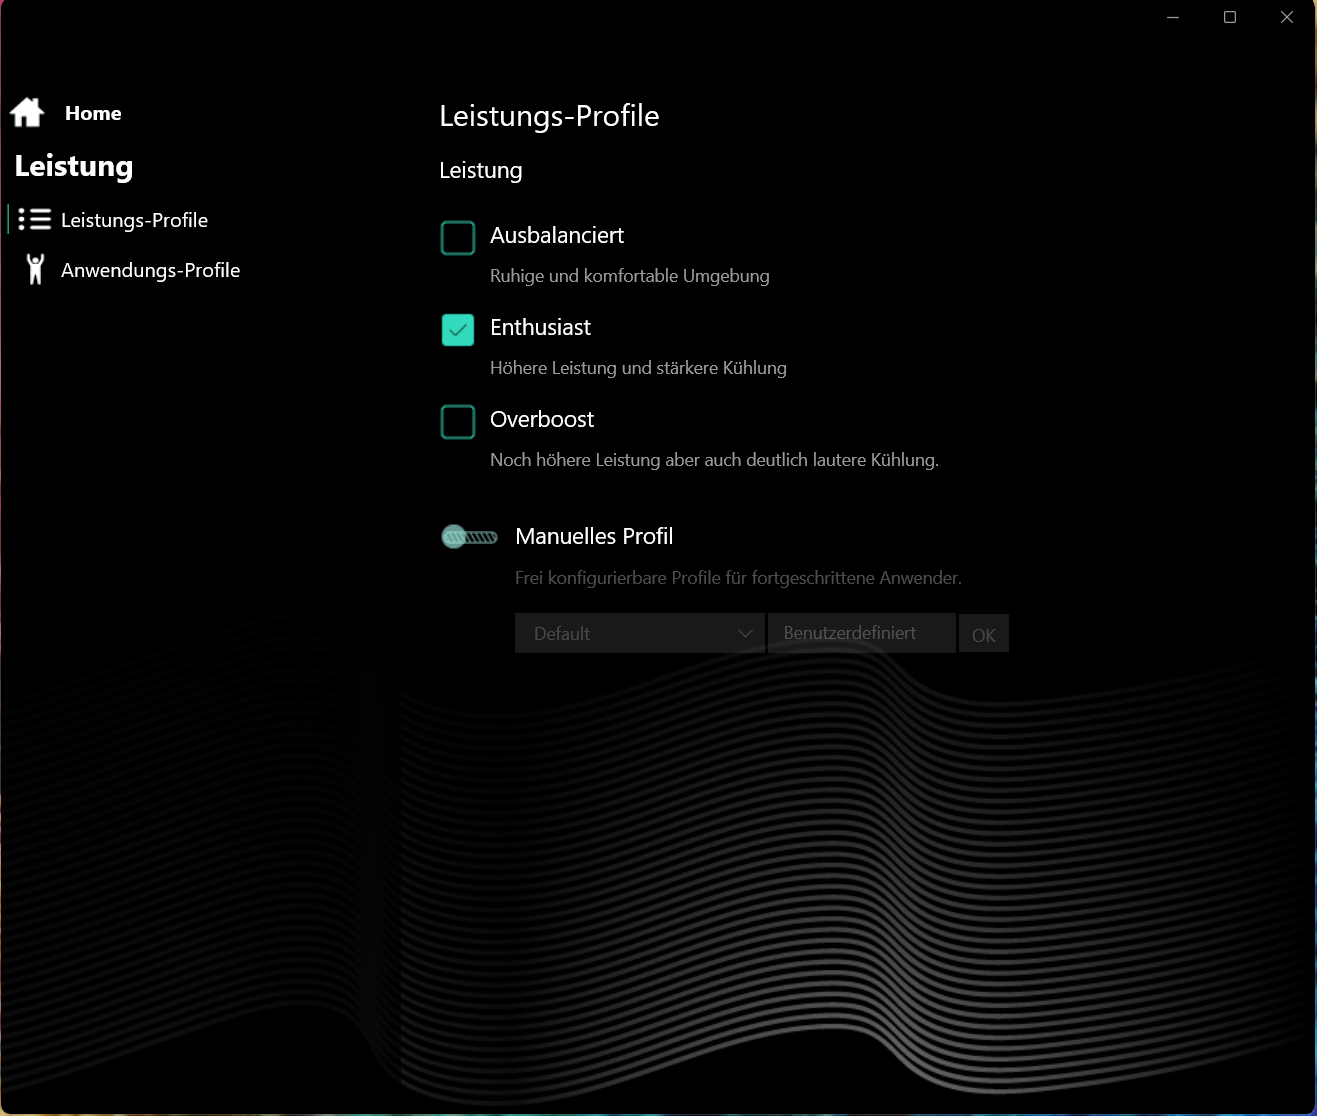
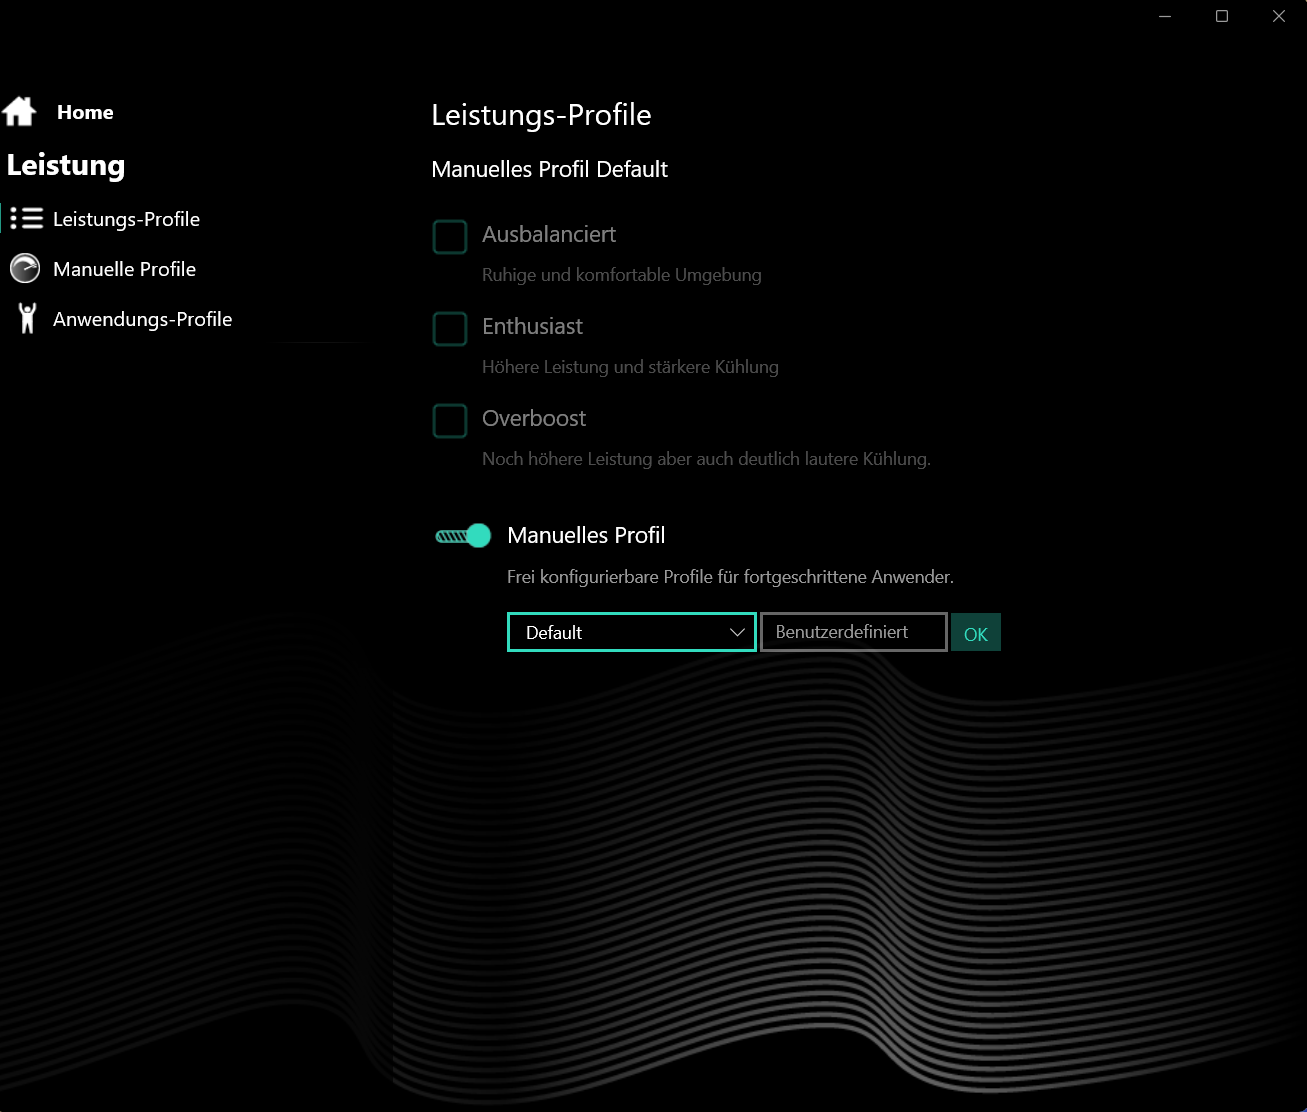
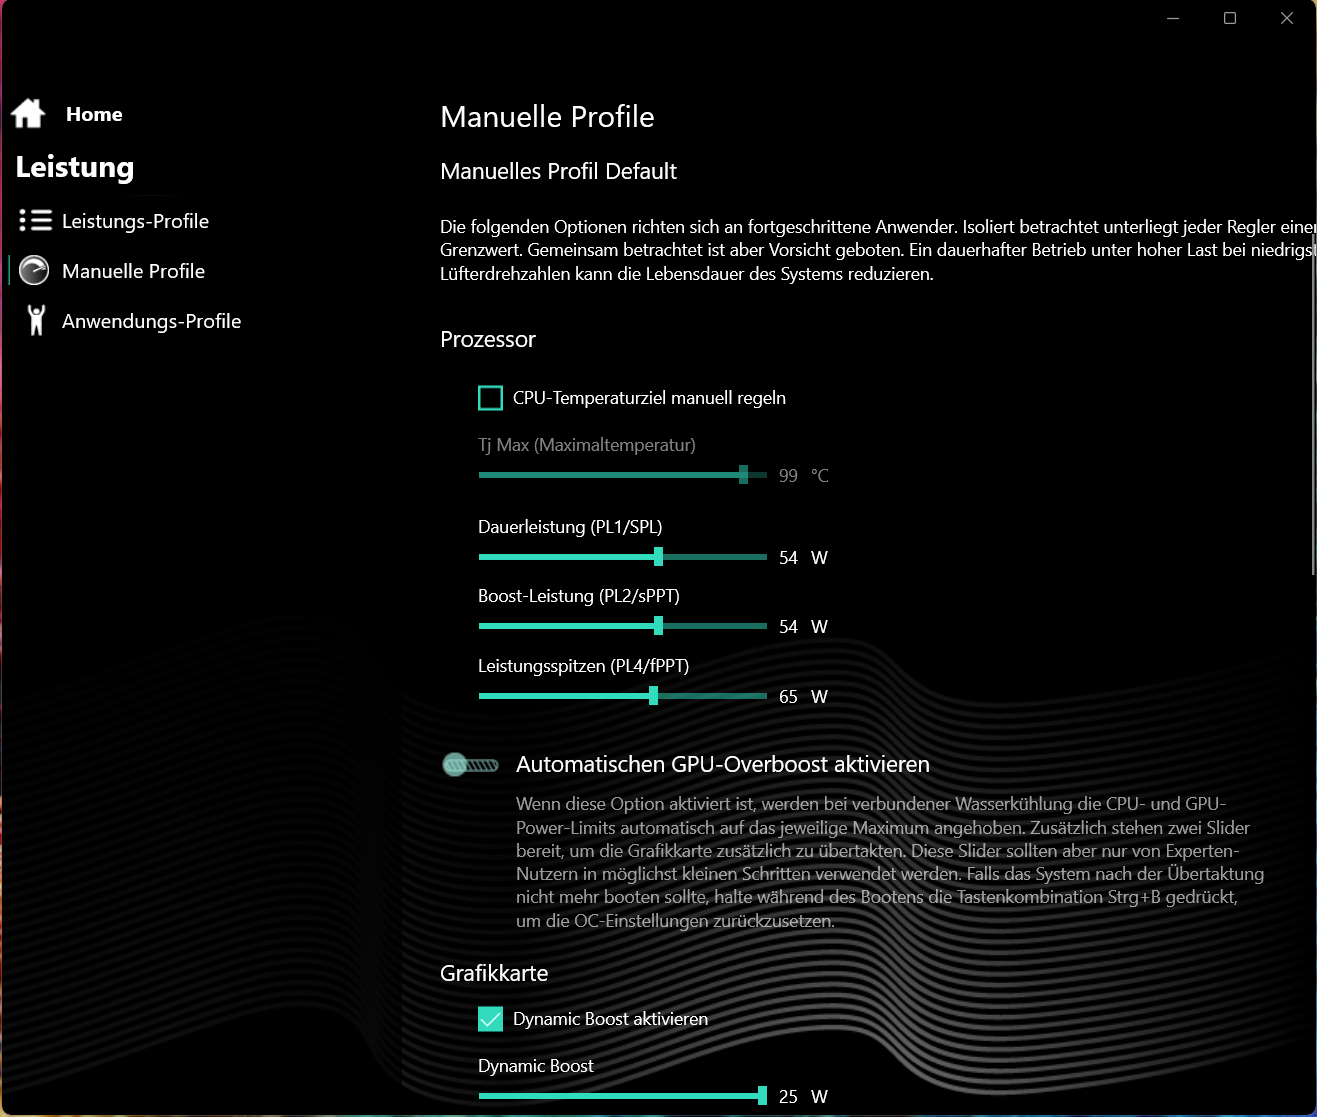
Apex, ayrı bir tuşla (güç düğmesinin yanında) arasında geçiş yapabileceğiniz üreticiye özel üç performans modu (tabloya bakın) sunar. Bir durum LED'i hangi modun aktif olduğunu gösterir. Biz "enthusiast" (benchmark) ve "balanced" (pil testleri) modlarını kullandık. Optimus aktifti.
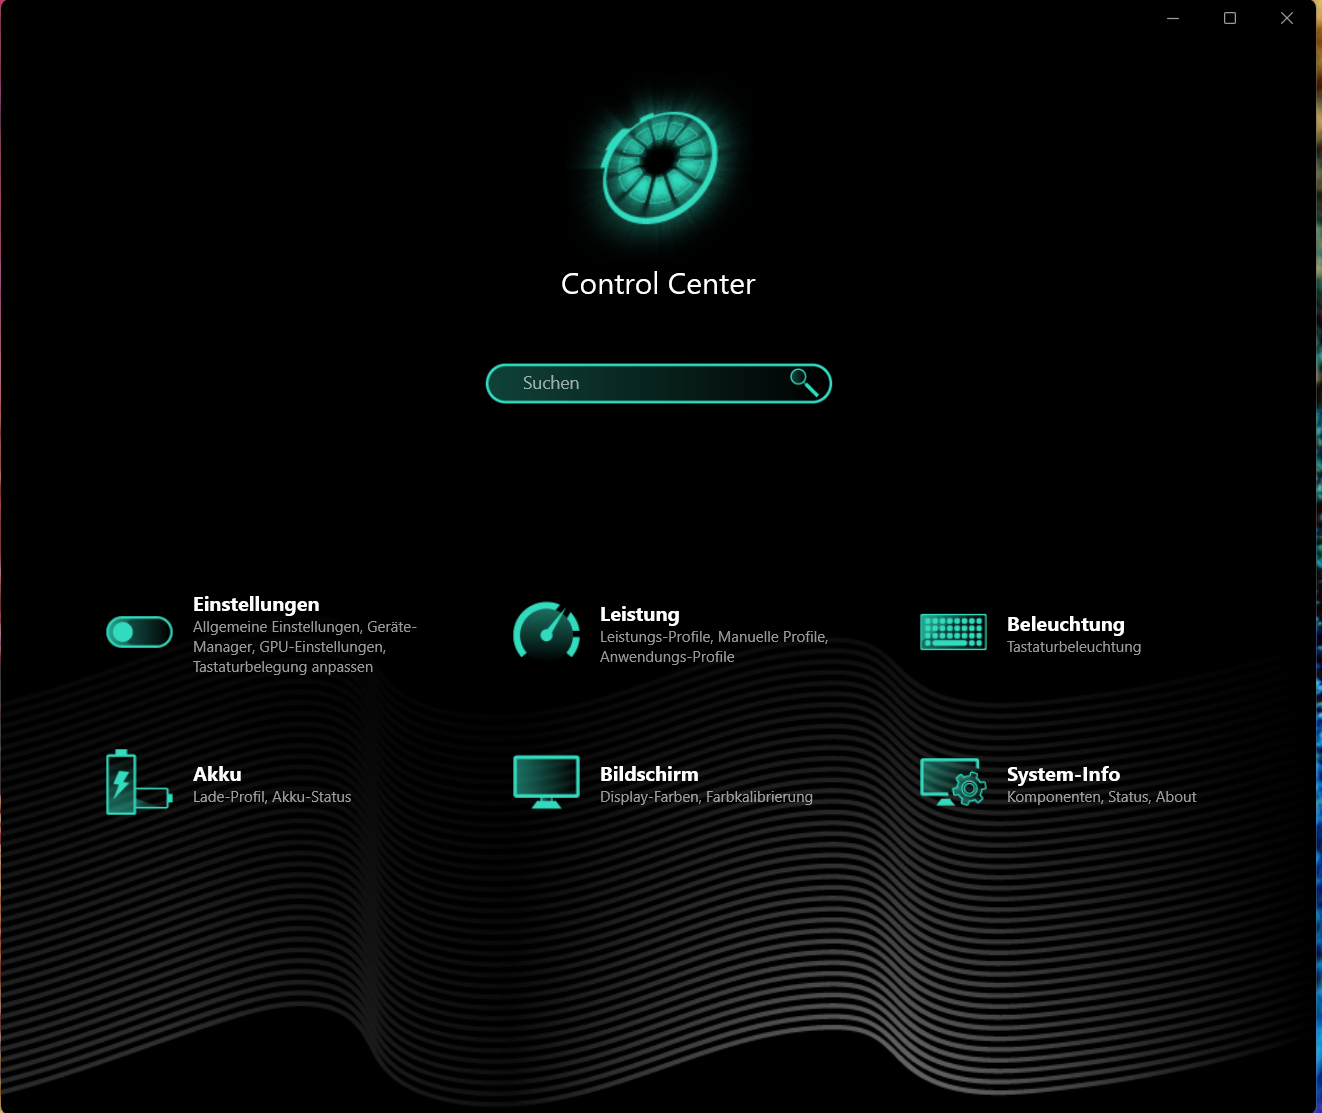
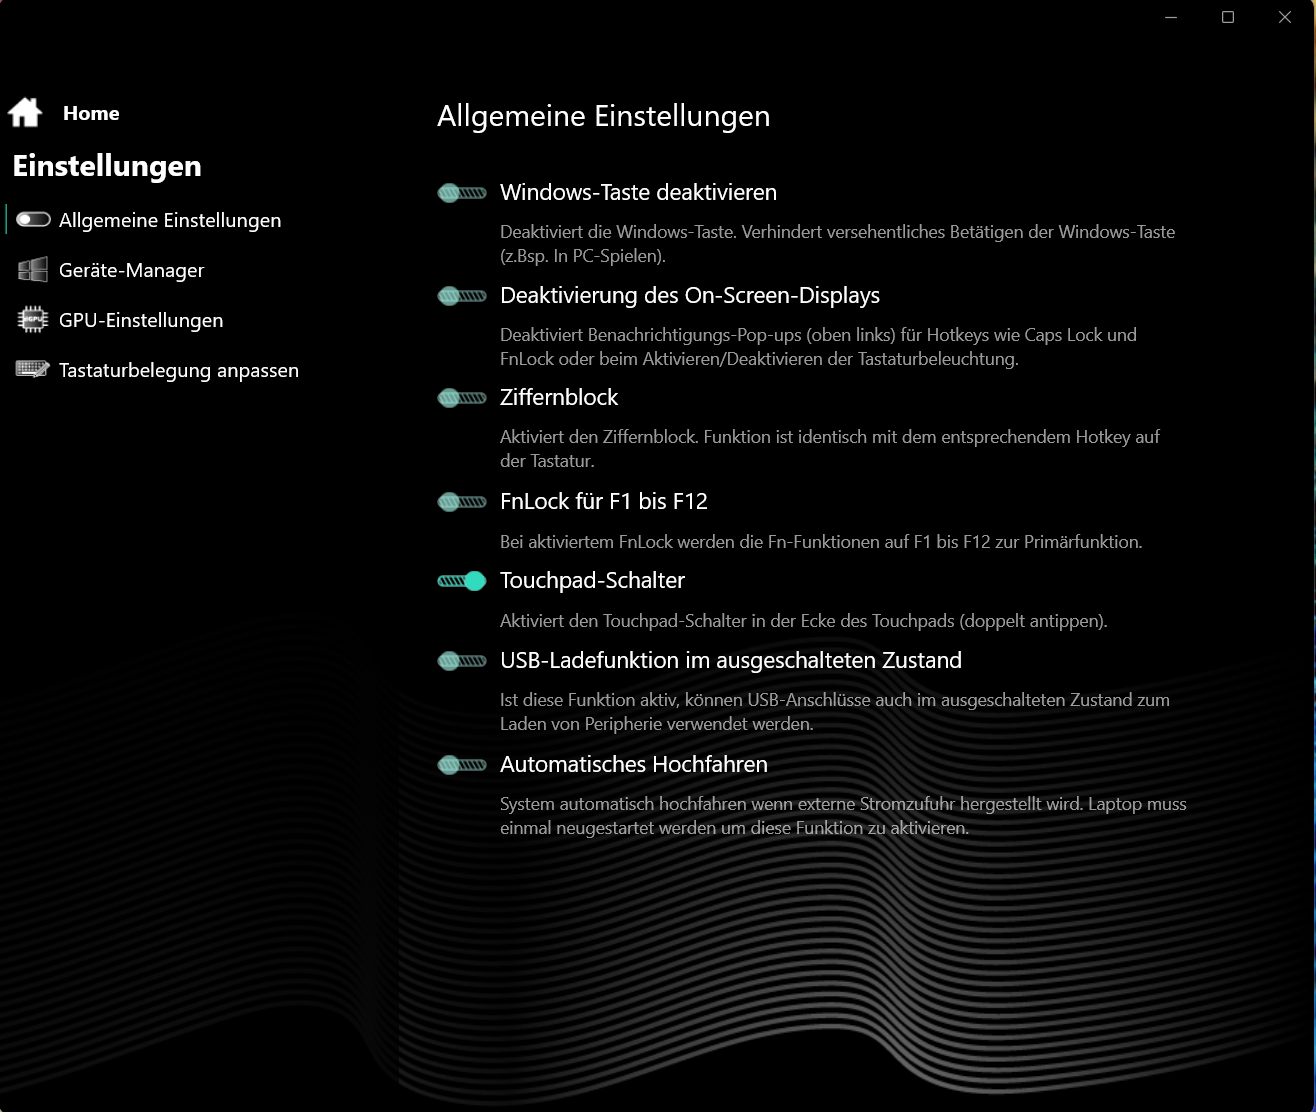
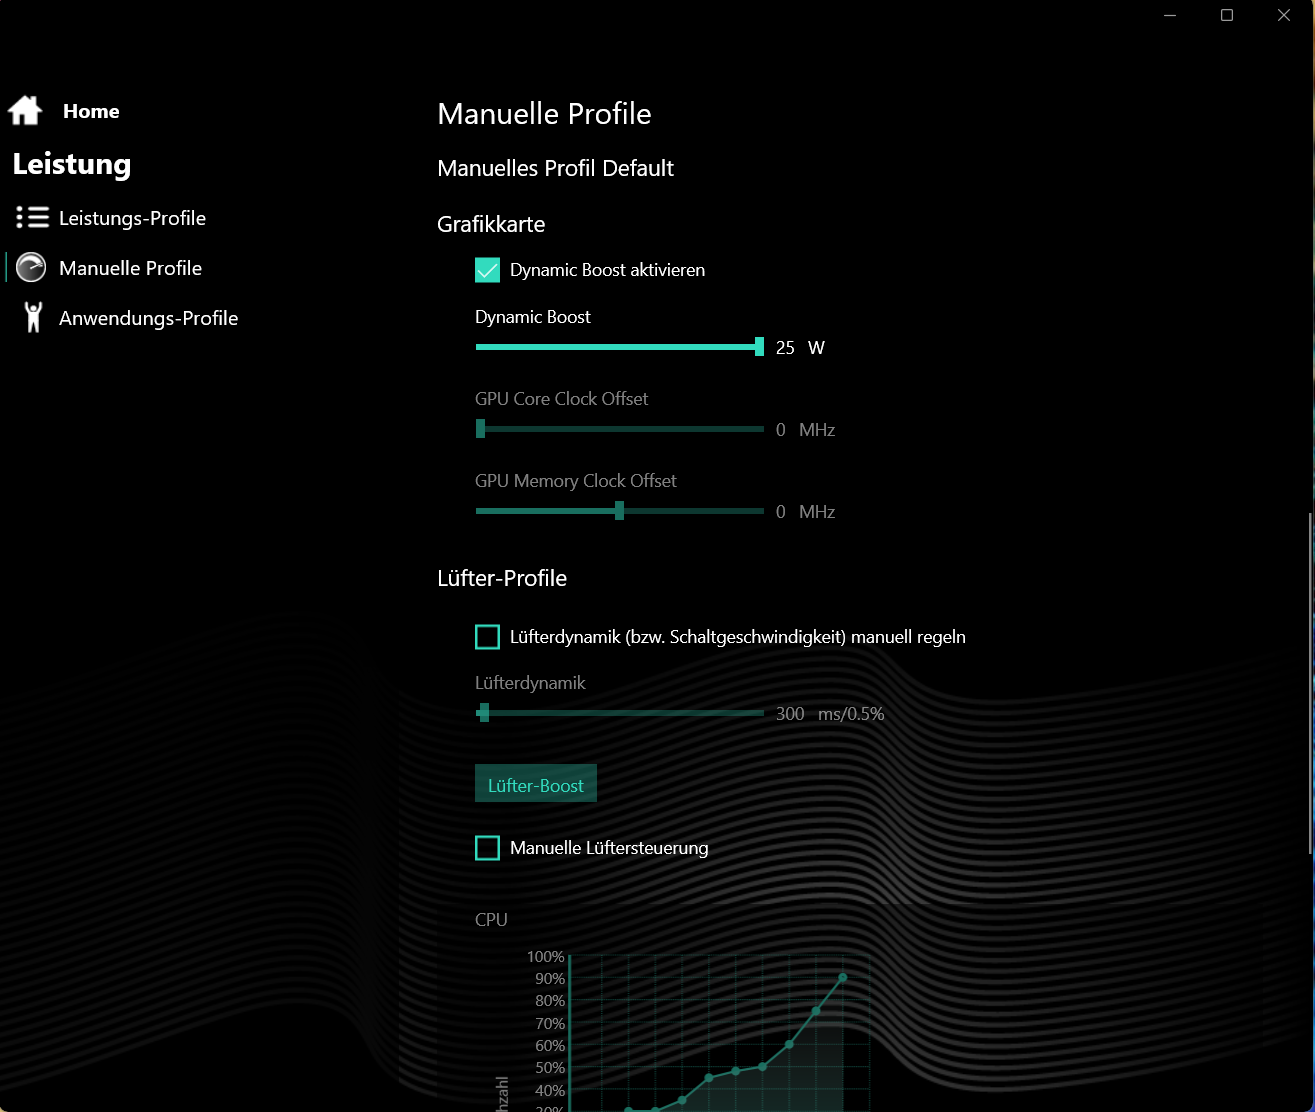
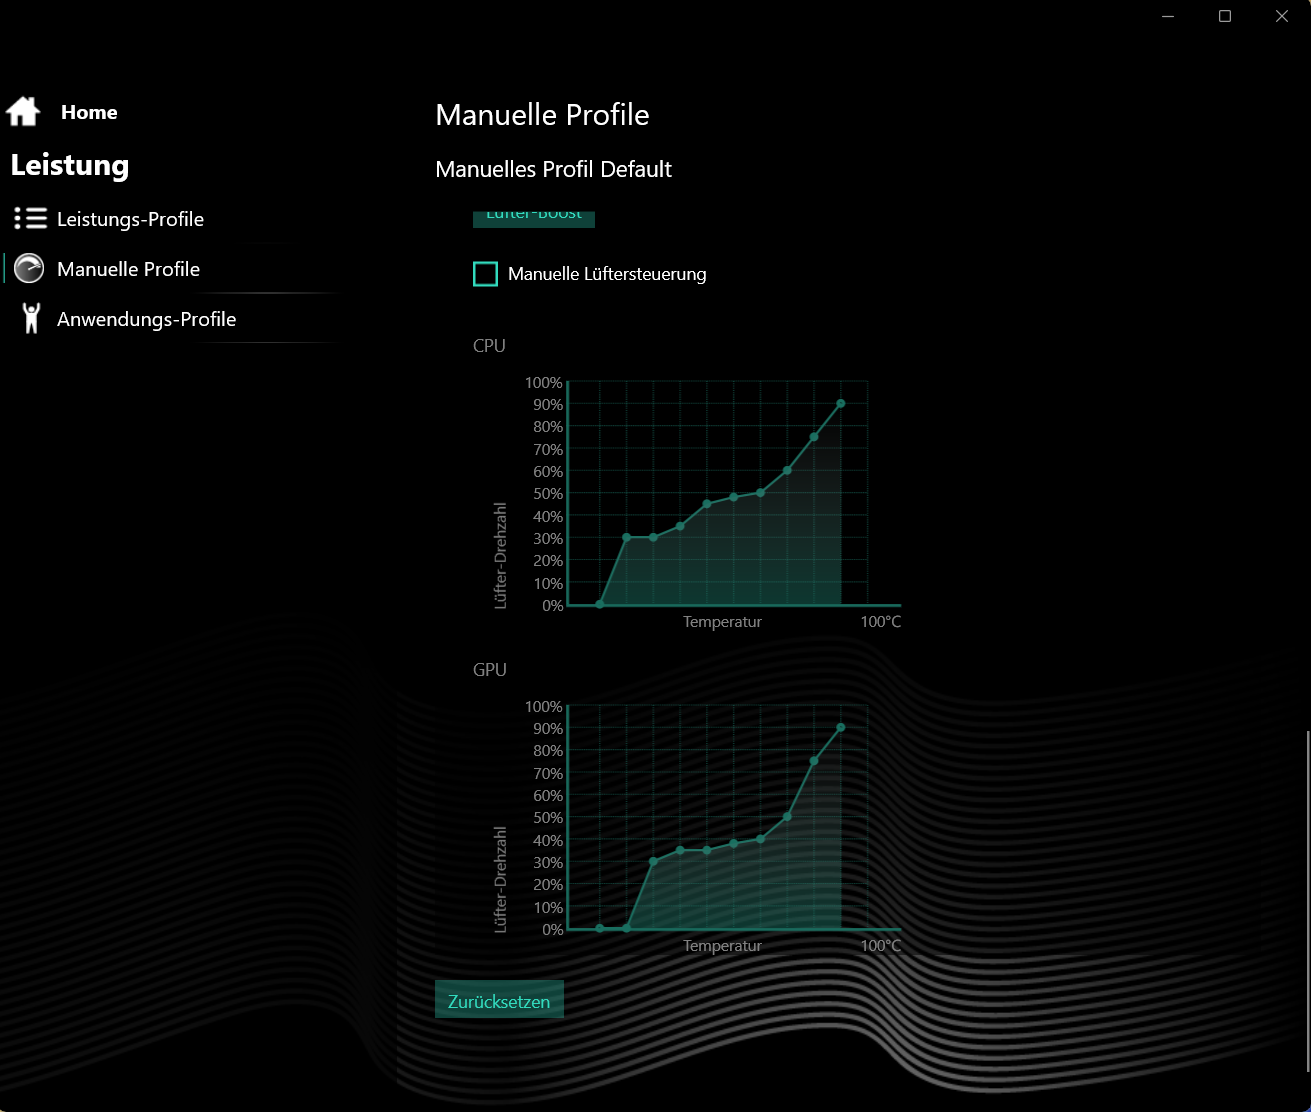
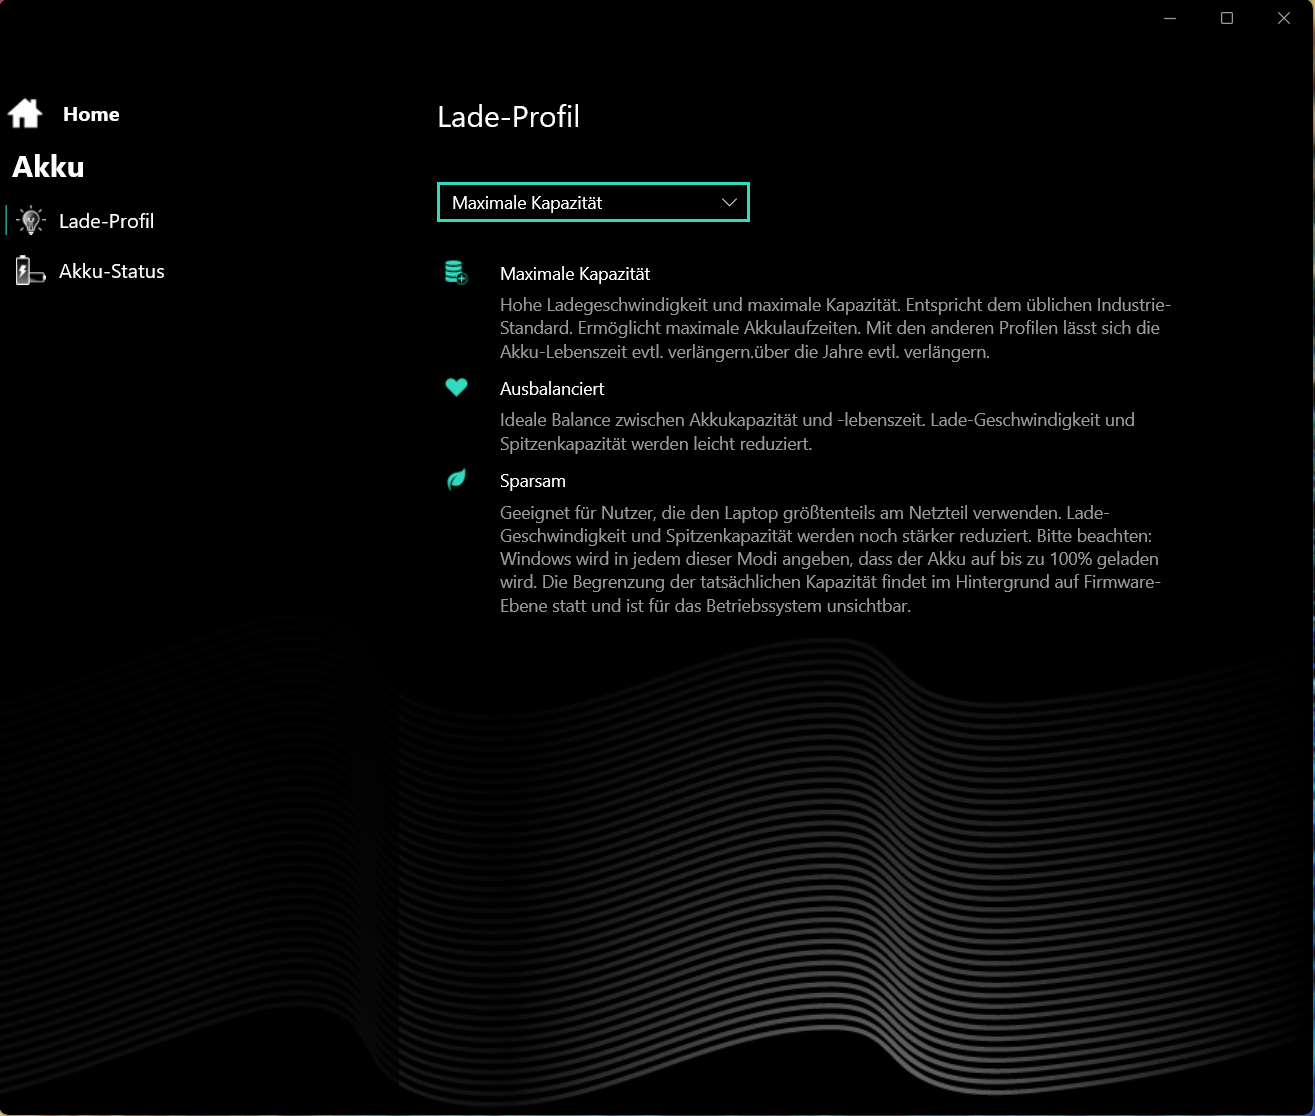
Önceden yüklenmiş Kontrol Merkezi, bireysel profilleri etkinleştirir: Bu, örneğin CPU'nun güç limitlerini, GPU'nun TGP'sini ve/veya fan kontrolünü ayarlamayı mümkün kılar.
| Meraklısı | Overboost | Dengeli | |
|---|---|---|---|
| Güç Sınırı 1 (HWInfo) | 54 watt | 80 watt | 35 watt |
| Güç Sınırı 2 (HWInfo) | 65 watt | 80 watt | 65 watt |
| Gürültü (Witcher 3) | ~50 dB(A) | ~54 dB(A) | ~34 dB(A) |
| Performans (Witcher 3) | ~102 fps | ~105 fps | ~60 fps |
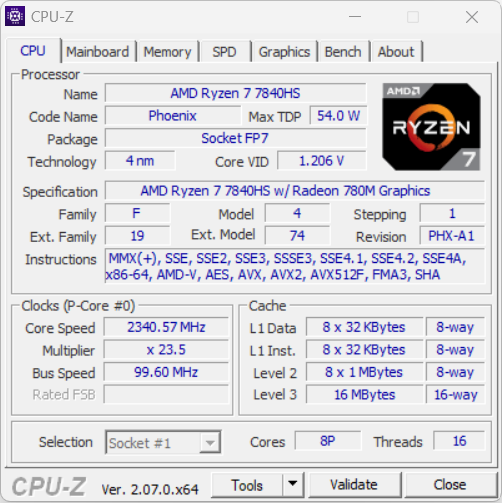
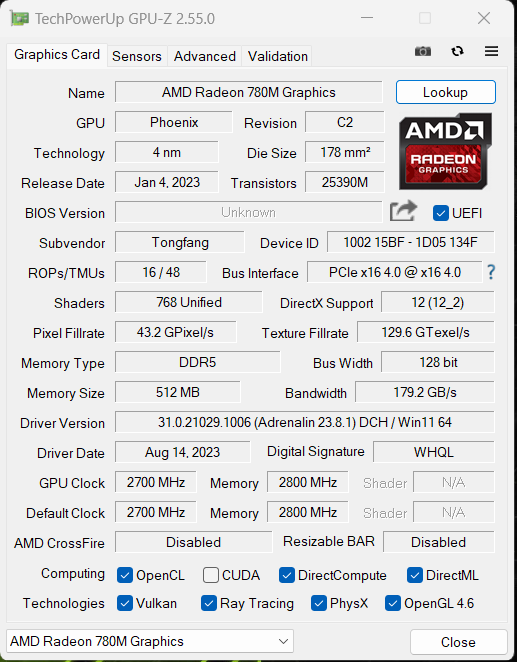
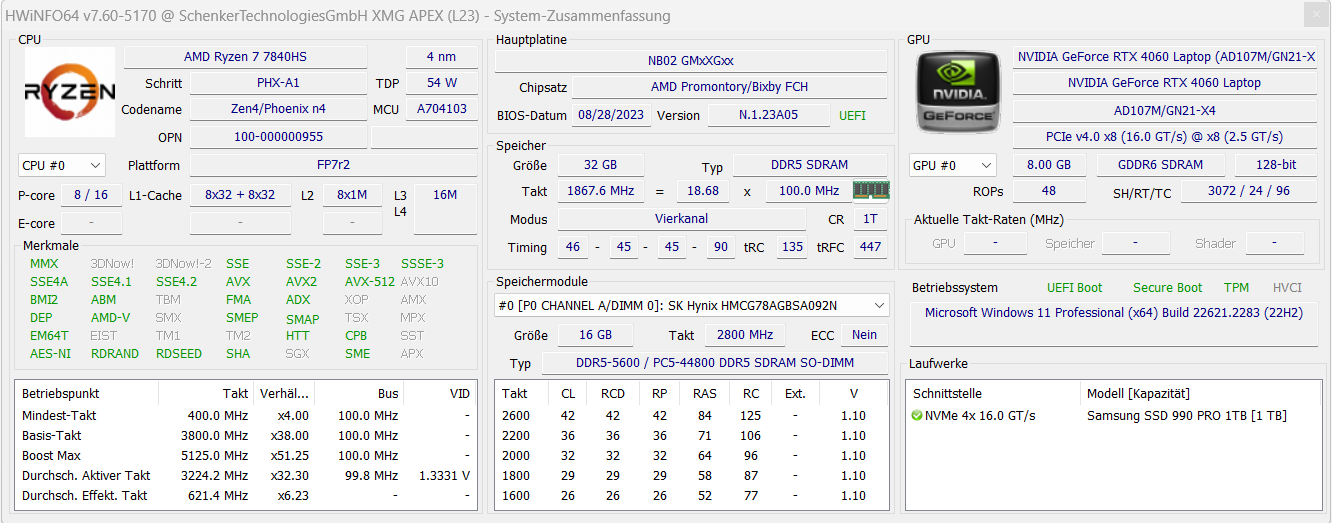
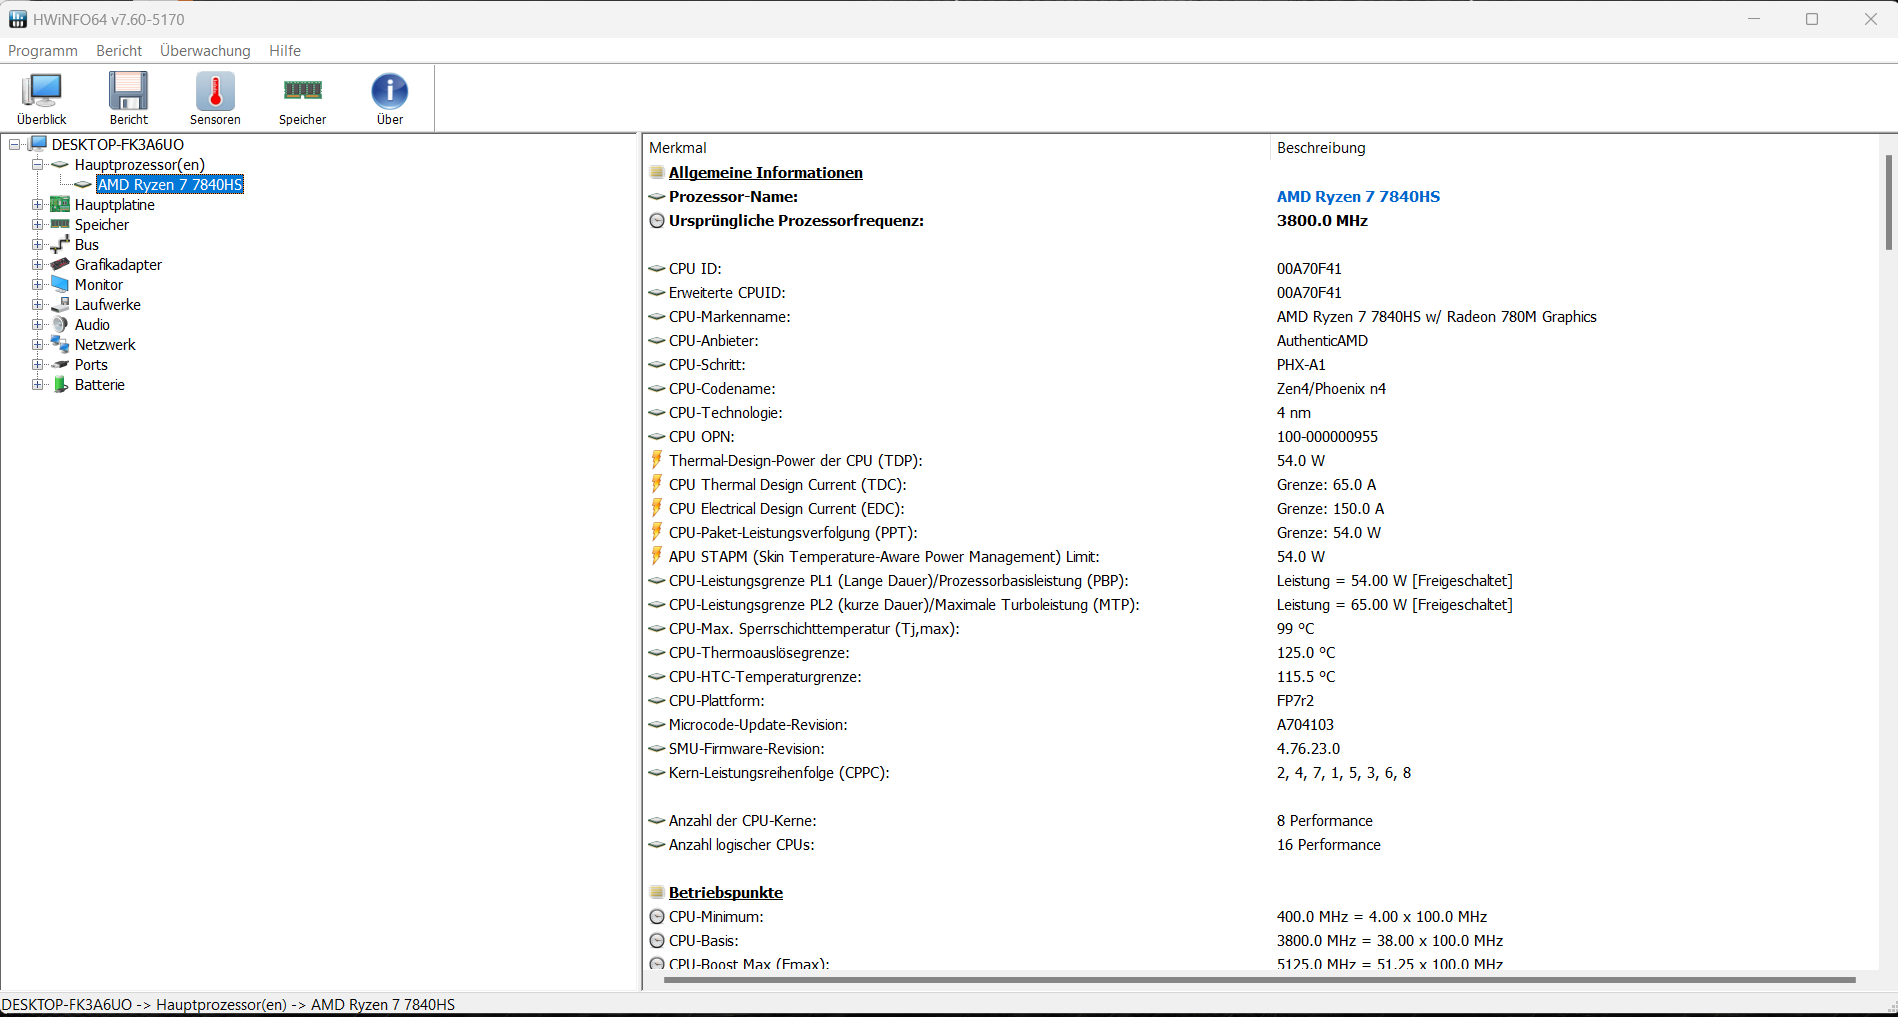
İşlemci
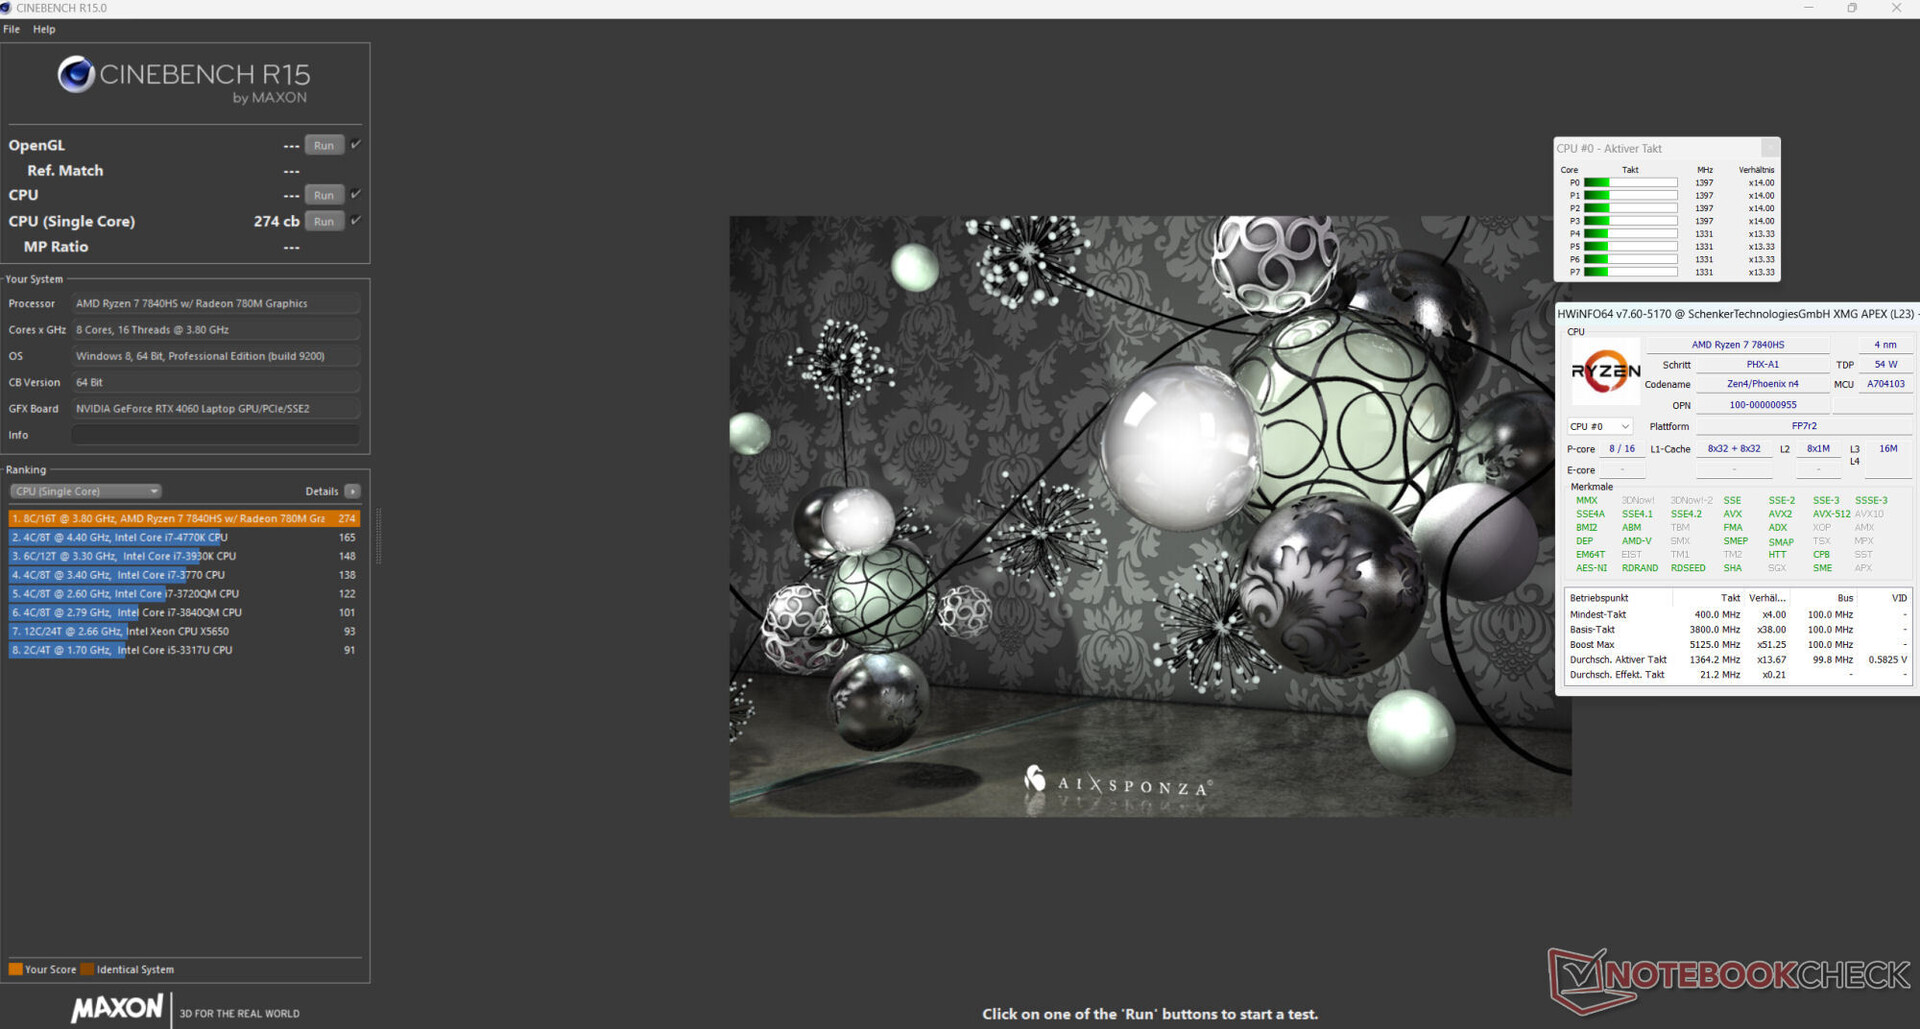
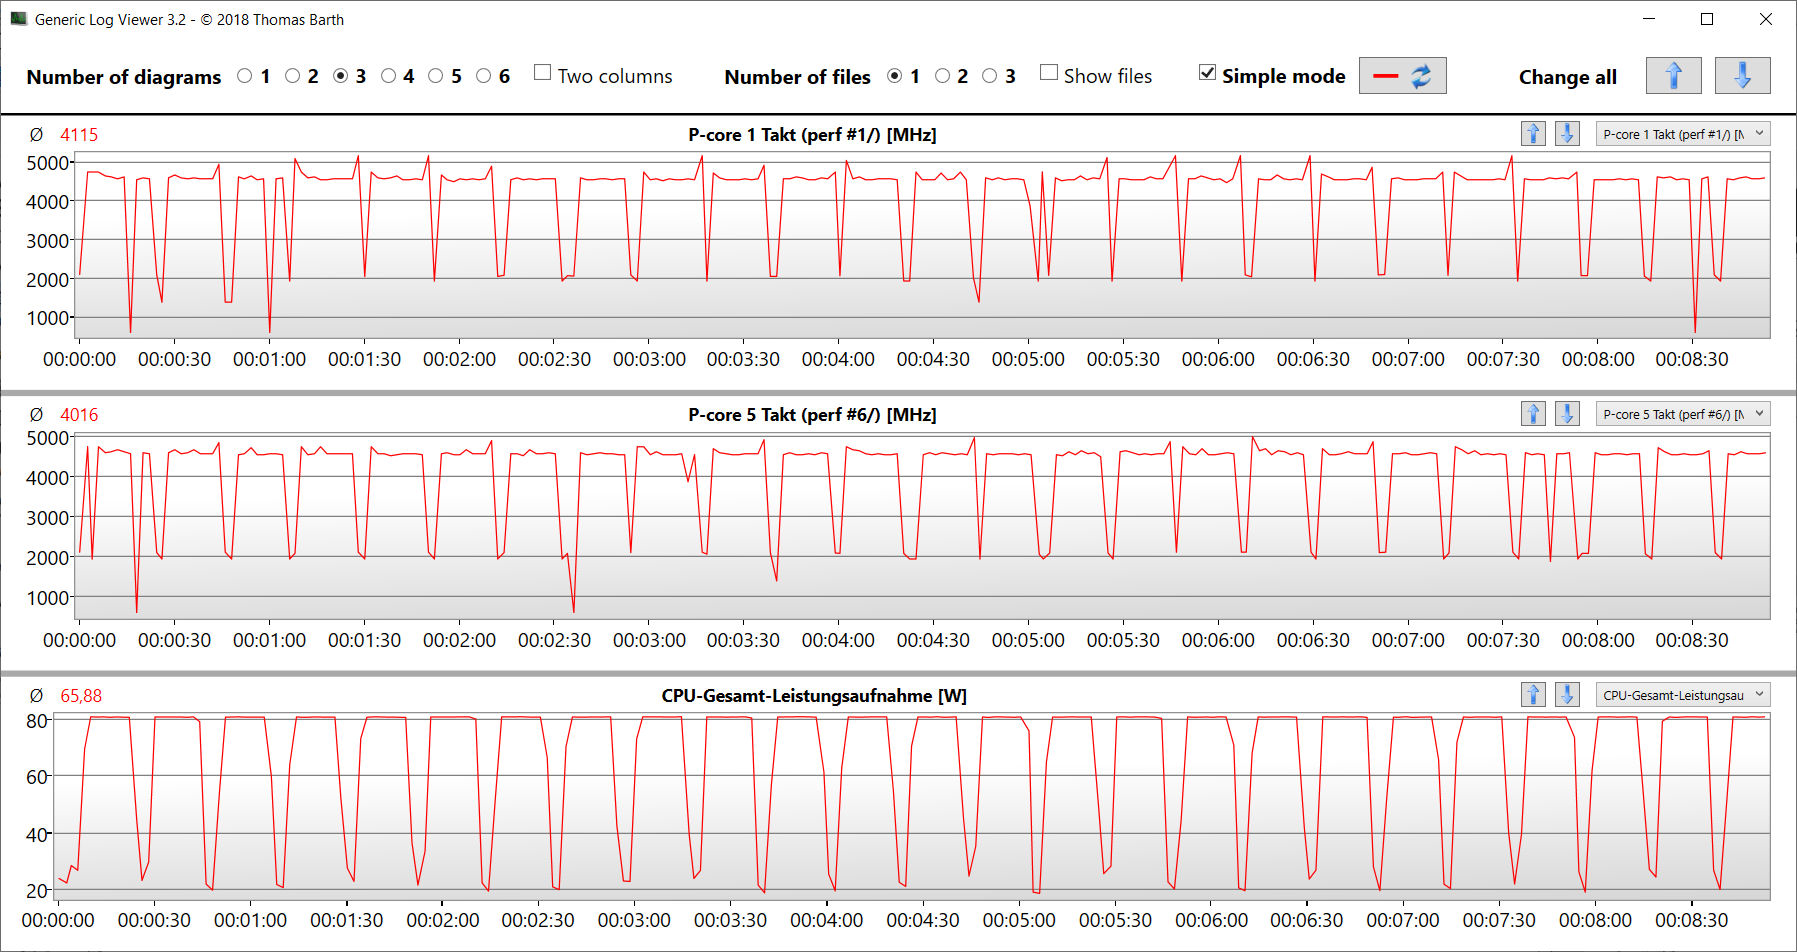
BuRyzen 7 7840HSaPU (Phoenix, Zen 4), maksimum 5,1 GHz saat hızında (bir çekirdek) toplam 16 iş parçacığına sahip 8 CPU çekirdeği sunar. CPU, seçilen performans modundan bağımsız olarak sürekli çoklu iş parçacığı yükünü (CB15 döngüsü) sürekli olarak yüksek bir turbo hızıyla kabul eder.
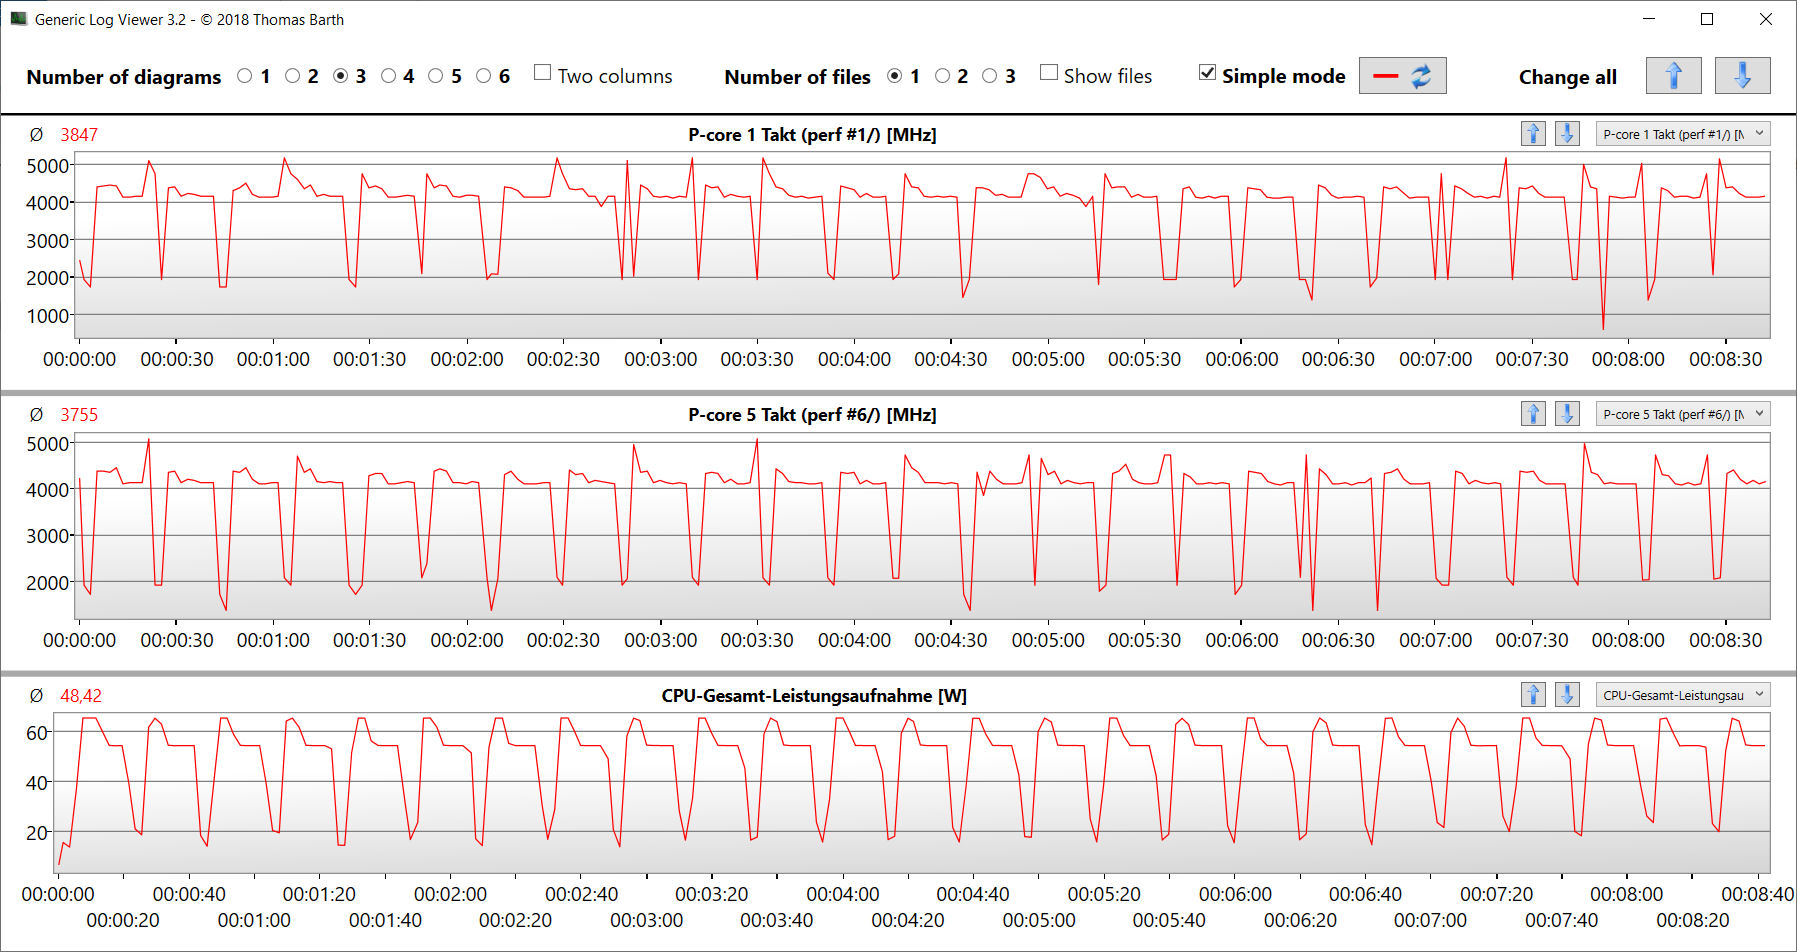
Şebeke işletiminde, kıyaslama sonuçları CPU ortalaması civarındadır. Pil modunda, daha alakalı olan tek iş parçacıklı performans (216 puan), çok iş parçacıklı performansa (1.715 puan) göre daha az düşmektedir.
Not: Zen 4 mimarisi ile ilgili daha ayrıntılı bilgi analiz makalesi adresinde bulunabilir.
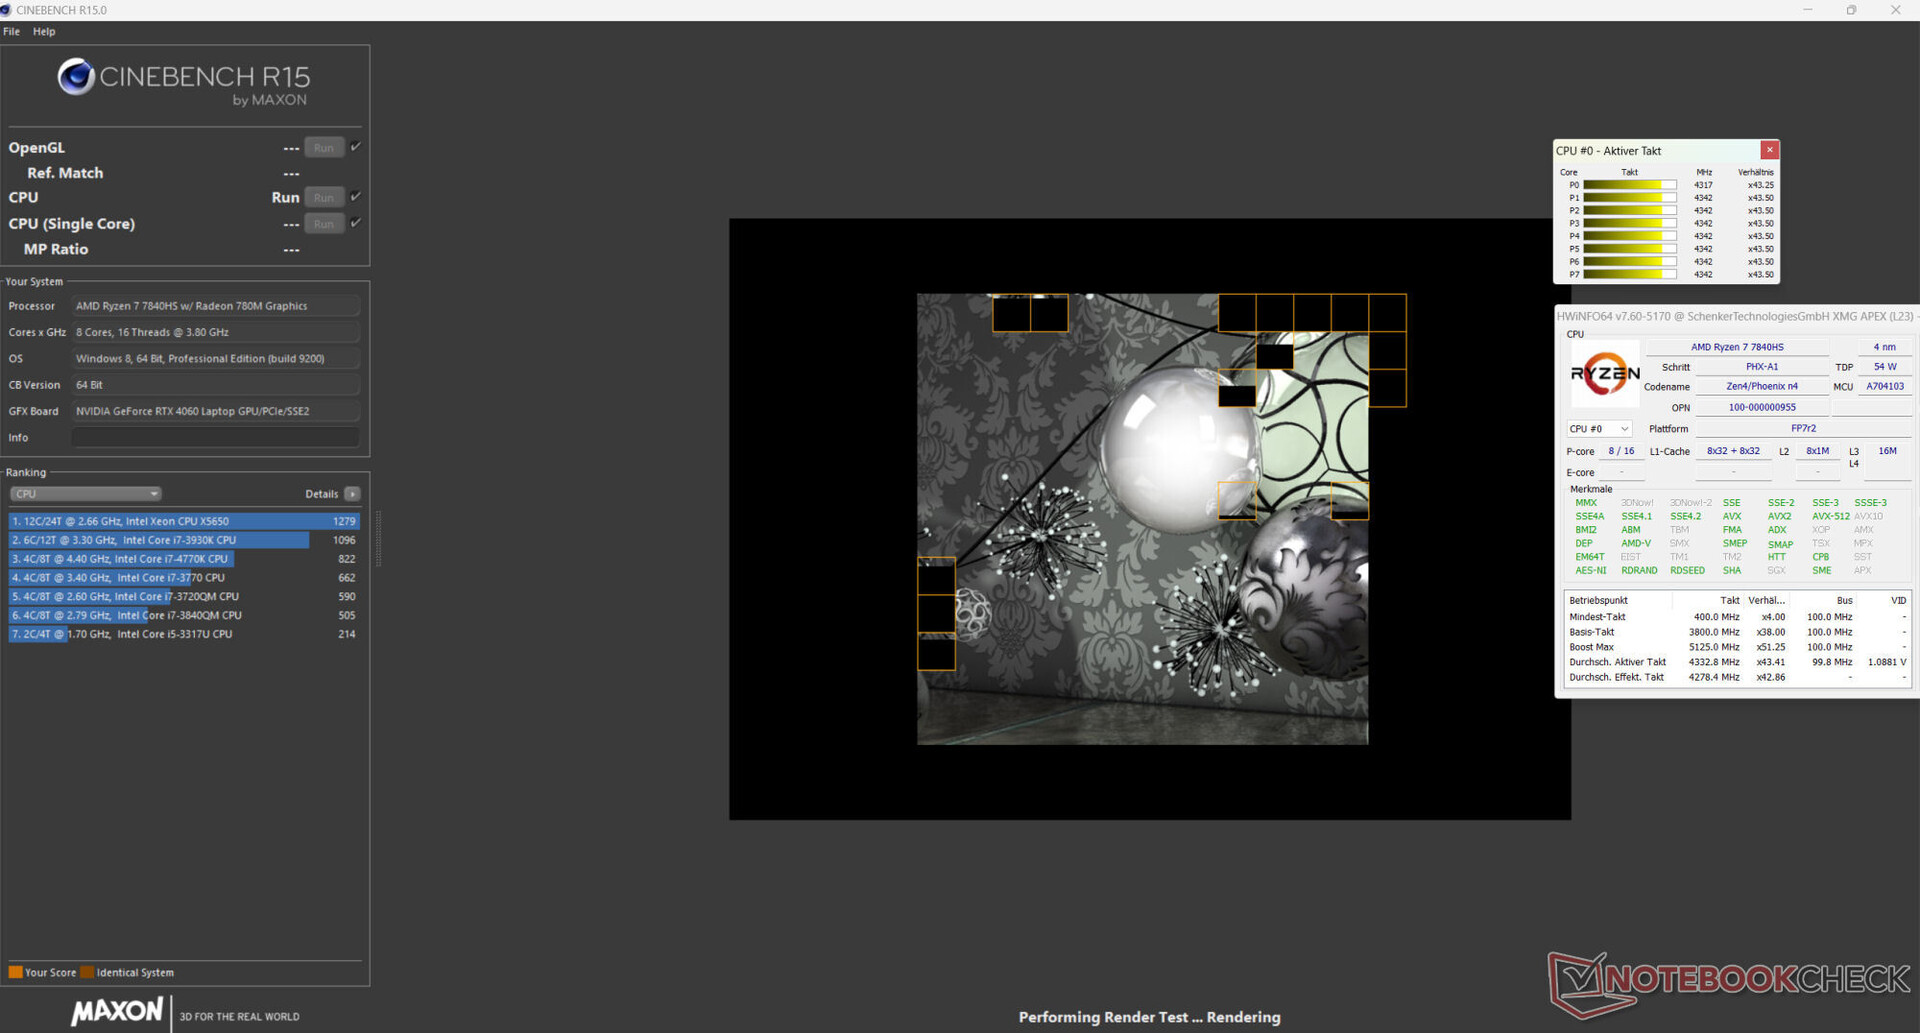
Cinebench R15 Multi Continuous Test
* ... daha küçük daha iyidir
AIDA64: FP32 Ray-Trace | FPU Julia | CPU SHA3 | CPU Queen | FPU SinJulia | FPU Mandel | CPU AES | CPU ZLib | FP64 Ray-Trace | CPU PhotoWorxx
| Performance rating | |
| Sınıf ortalaması Gaming | |
| Schenker XMG Apex 17 (Late 23) | |
| Ortalama AMD Ryzen 7 7840HS | |
| Alienware m16 R1 Intel | |
| Lenovo Legion Pro 5 16IRX8 | |
| Acer Nitro 17 AN17-51-71ER | |
| Medion Erazer Defender P40 | |
| MSI Katana 17 B13VFK | |
| AIDA64 / FP32 Ray-Trace | |
| Sınıf ortalaması Gaming (10227 - 85542, n=105, son 2 yıl) | |
| Ortalama AMD Ryzen 7 7840HS (22845 - 28921, n=21) | |
| Schenker XMG Apex 17 (Late 23) | |
| Lenovo Legion Pro 5 16IRX8 | |
| Alienware m16 R1 Intel | |
| Acer Nitro 17 AN17-51-71ER | |
| Medion Erazer Defender P40 | |
| MSI Katana 17 B13VFK | |
| AIDA64 / FPU Julia | |
| Sınıf ortalaması Gaming (51376 - 238426, n=105, son 2 yıl) | |
| Ortalama AMD Ryzen 7 7840HS (97164 - 123167, n=21) | |
| Schenker XMG Apex 17 (Late 23) | |
| Lenovo Legion Pro 5 16IRX8 | |
| Alienware m16 R1 Intel | |
| Acer Nitro 17 AN17-51-71ER | |
| Medion Erazer Defender P40 | |
| MSI Katana 17 B13VFK | |
| AIDA64 / CPU SHA3 | |
| Sınıf ortalaması Gaming (2180 - 10115, n=105, son 2 yıl) | |
| Alienware m16 R1 Intel | |
| Ortalama AMD Ryzen 7 7840HS (4293 - 5155, n=21) | |
| Lenovo Legion Pro 5 16IRX8 | |
| Schenker XMG Apex 17 (Late 23) | |
| Acer Nitro 17 AN17-51-71ER | |
| Medion Erazer Defender P40 | |
| MSI Katana 17 B13VFK | |
| AIDA64 / CPU Queen | |
| Sınıf ortalaması Gaming (49785 - 173351, n=90, son 2 yıl) | |
| Ortalama AMD Ryzen 7 7840HS (102271 - 125820, n=21) | |
| Schenker XMG Apex 17 (Late 23) | |
| Alienware m16 R1 Intel | |
| Lenovo Legion Pro 5 16IRX8 | |
| Medion Erazer Defender P40 | |
| Acer Nitro 17 AN17-51-71ER | |
| MSI Katana 17 B13VFK | |
| AIDA64 / FPU SinJulia | |
| Ortalama AMD Ryzen 7 7840HS (13767 - 15525, n=21) | |
| Schenker XMG Apex 17 (Late 23) | |
| Sınıf ortalaması Gaming (4424 - 33636, n=105, son 2 yıl) | |
| Alienware m16 R1 Intel | |
| Lenovo Legion Pro 5 16IRX8 | |
| Acer Nitro 17 AN17-51-71ER | |
| Medion Erazer Defender P40 | |
| MSI Katana 17 B13VFK | |
| AIDA64 / FPU Mandel | |
| Sınıf ortalaması Gaming (25115 - 128721, n=105, son 2 yıl) | |
| Ortalama AMD Ryzen 7 7840HS (52084 - 65812, n=21) | |
| Schenker XMG Apex 17 (Late 23) | |
| Lenovo Legion Pro 5 16IRX8 | |
| Alienware m16 R1 Intel | |
| Acer Nitro 17 AN17-51-71ER | |
| Medion Erazer Defender P40 | |
| MSI Katana 17 B13VFK | |
| AIDA64 / CPU AES | |
| Alienware m16 R1 Intel | |
| Schenker XMG Apex 17 (Late 23) | |
| Acer Nitro 17 AN17-51-71ER | |
| Ortalama AMD Ryzen 7 7840HS (67389 - 177158, n=21) | |
| Sınıf ortalaması Gaming (39258 - 247074, n=105, son 2 yıl) | |
| Lenovo Legion Pro 5 16IRX8 | |
| Medion Erazer Defender P40 | |
| MSI Katana 17 B13VFK | |
| AIDA64 / CPU ZLib | |
| Sınıf ortalaması Gaming (574 - 2531, n=105, son 2 yıl) | |
| Alienware m16 R1 Intel | |
| Lenovo Legion Pro 5 16IRX8 | |
| Acer Nitro 17 AN17-51-71ER | |
| Ortalama AMD Ryzen 7 7840HS (944 - 1123, n=21) | |
| Schenker XMG Apex 17 (Late 23) | |
| Medion Erazer Defender P40 | |
| MSI Katana 17 B13VFK | |
| AIDA64 / FP64 Ray-Trace | |
| Sınıf ortalaması Gaming (5509 - 45446, n=105, son 2 yıl) | |
| Ortalama AMD Ryzen 7 7840HS (12248 - 15599, n=21) | |
| Schenker XMG Apex 17 (Late 23) | |
| Lenovo Legion Pro 5 16IRX8 | |
| Alienware m16 R1 Intel | |
| Acer Nitro 17 AN17-51-71ER | |
| Medion Erazer Defender P40 | |
| MSI Katana 17 B13VFK | |
| AIDA64 / CPU PhotoWorxx | |
| Sınıf ortalaması Gaming (12271 - 89891, n=105, son 2 yıl) | |
| Acer Nitro 17 AN17-51-71ER | |
| Ortalama AMD Ryzen 7 7840HS (17615 - 41516, n=21) | |
| Lenovo Legion Pro 5 16IRX8 | |
| Schenker XMG Apex 17 (Late 23) | |
| Medion Erazer Defender P40 | |
| Alienware m16 R1 Intel | |
| MSI Katana 17 B13VFK | |
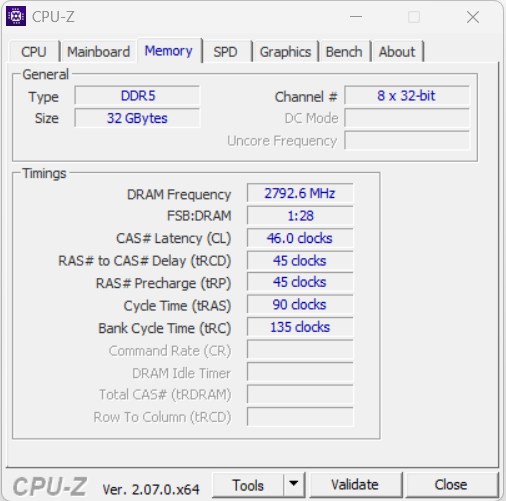
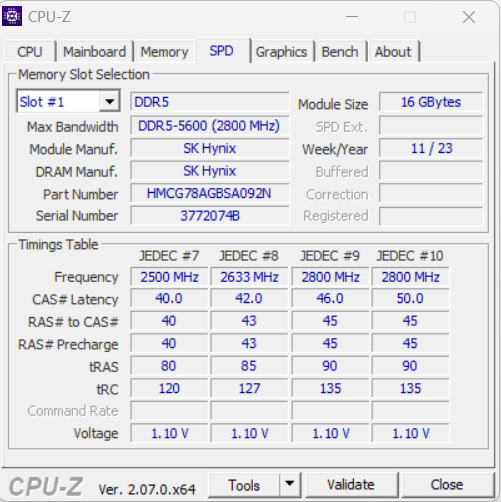
Sistem performansı
Sorunsuz çalışan sistem, render ve oyun gibi performans gerektiren kullanım senaryolarının üstesinden gelmek için tasarlanmıştır - iyi PC Mark sonuçları bunu doğrulamaktadır. RAM'in aktarım hızları DDR5 5600 RAM için normal seviyede.
CrossMark: Overall | Productivity | Creativity | Responsiveness
| PCMark 10 / Score | |
| Sınıf ortalaması Gaming (5828 - 12414, n=93, son 2 yıl) | |
| Schenker XMG Apex 17 (Late 23) | |
| Ortalama AMD Ryzen 7 7840HS, NVIDIA GeForce RTX 4060 Laptop GPU (7502 - 7946, n=4) | |
| Lenovo Legion Pro 5 16IRX8 | |
| Alienware m16 R1 Intel | |
| MSI Katana 17 B13VFK | |
| Acer Nitro 17 AN17-51-71ER | |
| Medion Erazer Defender P40 | |
| PCMark 10 / Essentials | |
| Lenovo Legion Pro 5 16IRX8 | |
| Ortalama AMD Ryzen 7 7840HS, NVIDIA GeForce RTX 4060 Laptop GPU (10441 - 11169, n=4) | |
| MSI Katana 17 B13VFK | |
| Alienware m16 R1 Intel | |
| Schenker XMG Apex 17 (Late 23) | |
| Sınıf ortalaması Gaming (8810 - 11935, n=97, son 2 yıl) | |
| Acer Nitro 17 AN17-51-71ER | |
| Medion Erazer Defender P40 | |
| PCMark 10 / Productivity | |
| Sınıf ortalaması Gaming (6845 - 25323, n=95, son 2 yıl) | |
| Schenker XMG Apex 17 (Late 23) | |
| Ortalama AMD Ryzen 7 7840HS, NVIDIA GeForce RTX 4060 Laptop GPU (9575 - 10273, n=4) | |
| Medion Erazer Defender P40 | |
| Alienware m16 R1 Intel | |
| MSI Katana 17 B13VFK | |
| Lenovo Legion Pro 5 16IRX8 | |
| Acer Nitro 17 AN17-51-71ER | |
| PCMark 10 / Digital Content Creation | |
| Sınıf ortalaması Gaming (7602 - 19954, n=95, son 2 yıl) | |
| Lenovo Legion Pro 5 16IRX8 | |
| Schenker XMG Apex 17 (Late 23) | |
| Ortalama AMD Ryzen 7 7840HS, NVIDIA GeForce RTX 4060 Laptop GPU (11464 - 12418, n=4) | |
| Acer Nitro 17 AN17-51-71ER | |
| Alienware m16 R1 Intel | |
| MSI Katana 17 B13VFK | |
| Medion Erazer Defender P40 | |
| CrossMark / Overall | |
| Alienware m16 R1 Intel | |
| Sınıf ortalaması Gaming (1366 - 2409, n=94, son 2 yıl) | |
| MSI Katana 17 B13VFK | |
| Ortalama AMD Ryzen 7 7840HS, NVIDIA GeForce RTX 4060 Laptop GPU (1800 - 1866, n=3) | |
| Schenker XMG Apex 17 (Late 23) | |
| Medion Erazer Defender P40 | |
| Lenovo Legion Pro 5 16IRX8 | |
| Acer Nitro 17 AN17-51-71ER | |
| CrossMark / Productivity | |
| Alienware m16 R1 Intel | |
| Sınıf ortalaması Gaming (1386 - 2254, n=94, son 2 yıl) | |
| Ortalama AMD Ryzen 7 7840HS, NVIDIA GeForce RTX 4060 Laptop GPU (1743 - 1821, n=3) | |
| MSI Katana 17 B13VFK | |
| Schenker XMG Apex 17 (Late 23) | |
| Medion Erazer Defender P40 | |
| Lenovo Legion Pro 5 16IRX8 | |
| Acer Nitro 17 AN17-51-71ER | |
| CrossMark / Creativity | |
| Sınıf ortalaması Gaming (1343 - 2786, n=94, son 2 yıl) | |
| Alienware m16 R1 Intel | |
| MSI Katana 17 B13VFK | |
| Medion Erazer Defender P40 | |
| Ortalama AMD Ryzen 7 7840HS, NVIDIA GeForce RTX 4060 Laptop GPU (1908 - 1966, n=3) | |
| Schenker XMG Apex 17 (Late 23) | |
| Lenovo Legion Pro 5 16IRX8 | |
| Acer Nitro 17 AN17-51-71ER | |
| CrossMark / Responsiveness | |
| Alienware m16 R1 Intel | |
| MSI Katana 17 B13VFK | |
| Sınıf ortalaması Gaming (1226 - 2334, n=94, son 2 yıl) | |
| Schenker XMG Apex 17 (Late 23) | |
| Lenovo Legion Pro 5 16IRX8 | |
| Ortalama AMD Ryzen 7 7840HS, NVIDIA GeForce RTX 4060 Laptop GPU (1522 - 1776, n=3) | |
| Acer Nitro 17 AN17-51-71ER | |
| Medion Erazer Defender P40 | |
| PCMark 10 Score | 7854 puan | |
Yardım | ||
| AIDA64 / Memory Copy | |
| Sınıf ortalaması Gaming (21750 - 129946, n=105, son 2 yıl) | |
| Schenker XMG Apex 17 (Late 23) | |
| Ortalama AMD Ryzen 7 7840HS (30937 - 72158, n=21) | |
| Lenovo Legion Pro 5 16IRX8 | |
| Acer Nitro 17 AN17-51-71ER | |
| Medion Erazer Defender P40 | |
| Alienware m16 R1 Intel | |
| MSI Katana 17 B13VFK | |
| AIDA64 / Memory Read | |
| Sınıf ortalaması Gaming (22956 - 118858, n=105, son 2 yıl) | |
| Lenovo Legion Pro 5 16IRX8 | |
| Medion Erazer Defender P40 | |
| Alienware m16 R1 Intel | |
| Acer Nitro 17 AN17-51-71ER | |
| Schenker XMG Apex 17 (Late 23) | |
| MSI Katana 17 B13VFK | |
| Ortalama AMD Ryzen 7 7840HS (30497 - 62147, n=21) | |
| AIDA64 / Memory Write | |
| Schenker XMG Apex 17 (Late 23) | |
| Ortalama AMD Ryzen 7 7840HS (34590 - 93323, n=21) | |
| Sınıf ortalaması Gaming (22297 - 135096, n=105, son 2 yıl) | |
| Lenovo Legion Pro 5 16IRX8 | |
| Acer Nitro 17 AN17-51-71ER | |
| Alienware m16 R1 Intel | |
| Medion Erazer Defender P40 | |
| MSI Katana 17 B13VFK | |
| AIDA64 / Memory Latency | |
| Acer Nitro 17 AN17-51-71ER | |
| Sınıf ortalaması Gaming (75.3 - 259, n=105, son 2 yıl) | |
| MSI Katana 17 B13VFK | |
| Medion Erazer Defender P40 | |
| Ortalama AMD Ryzen 7 7840HS (85.1 - 112, n=21) | |
| Alienware m16 R1 Intel | |
| Schenker XMG Apex 17 (Late 23) | |
| Lenovo Legion Pro 5 16IRX8 | |
* ... daha küçük daha iyidir
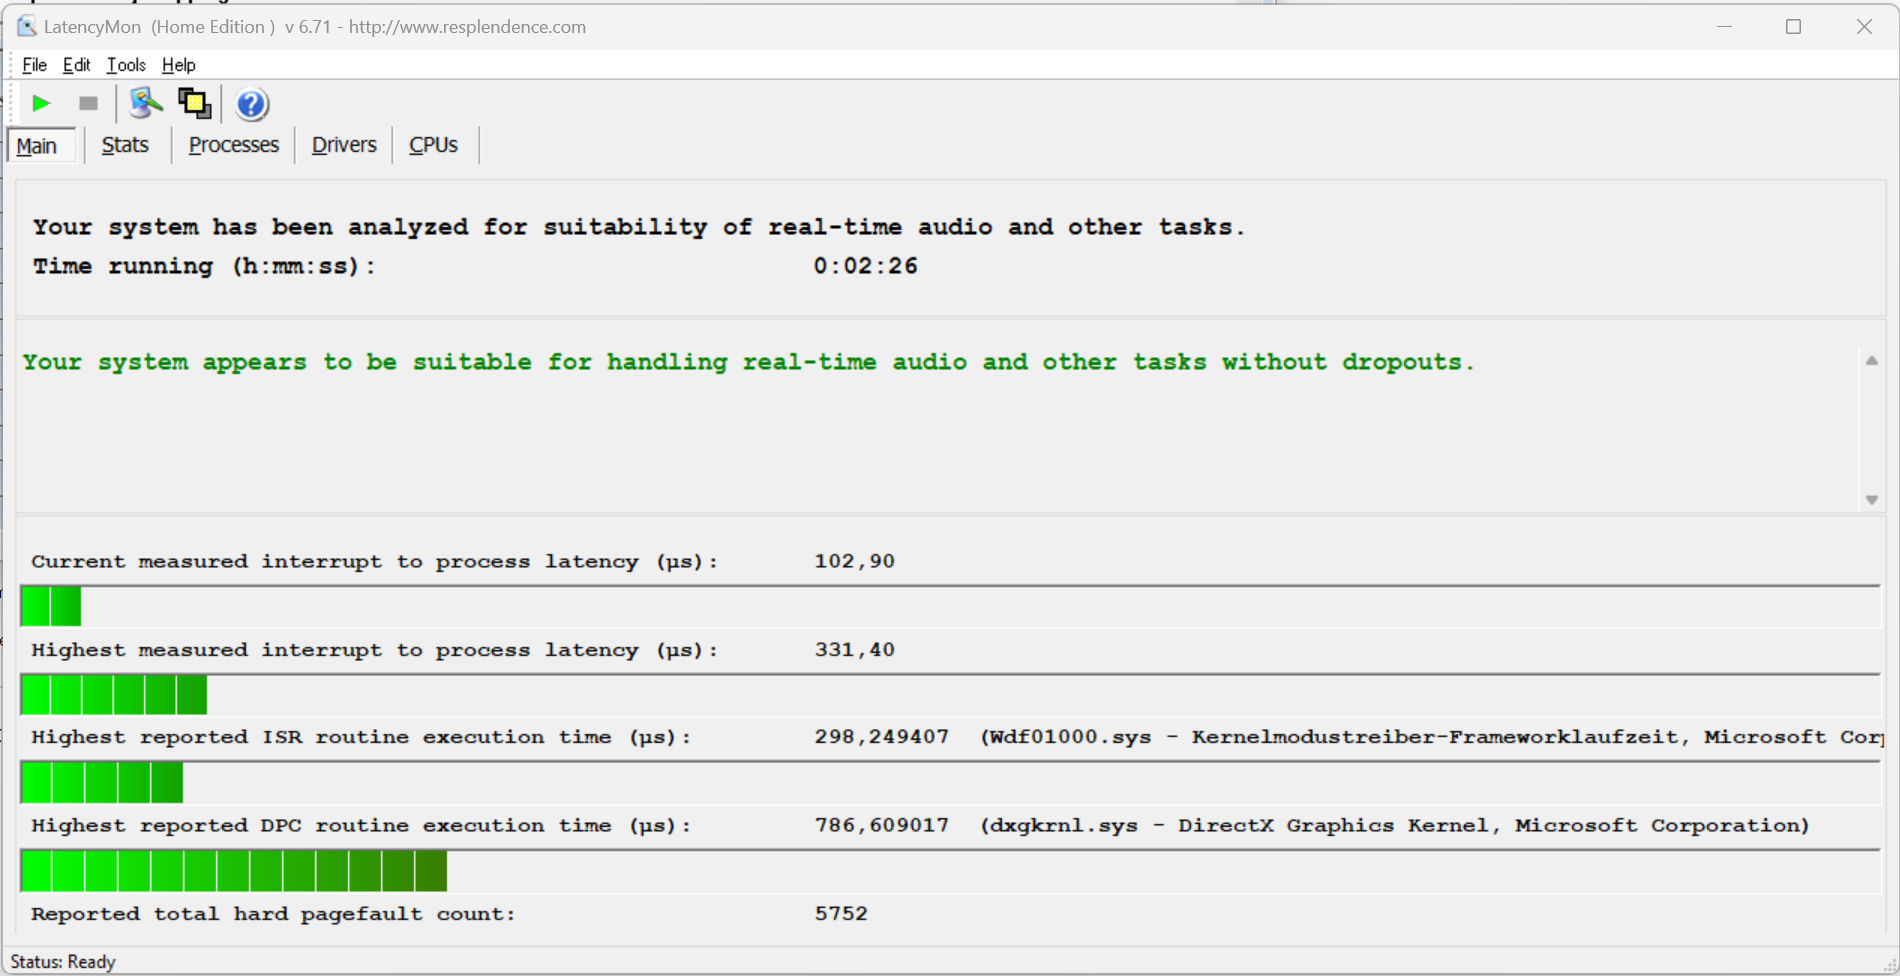
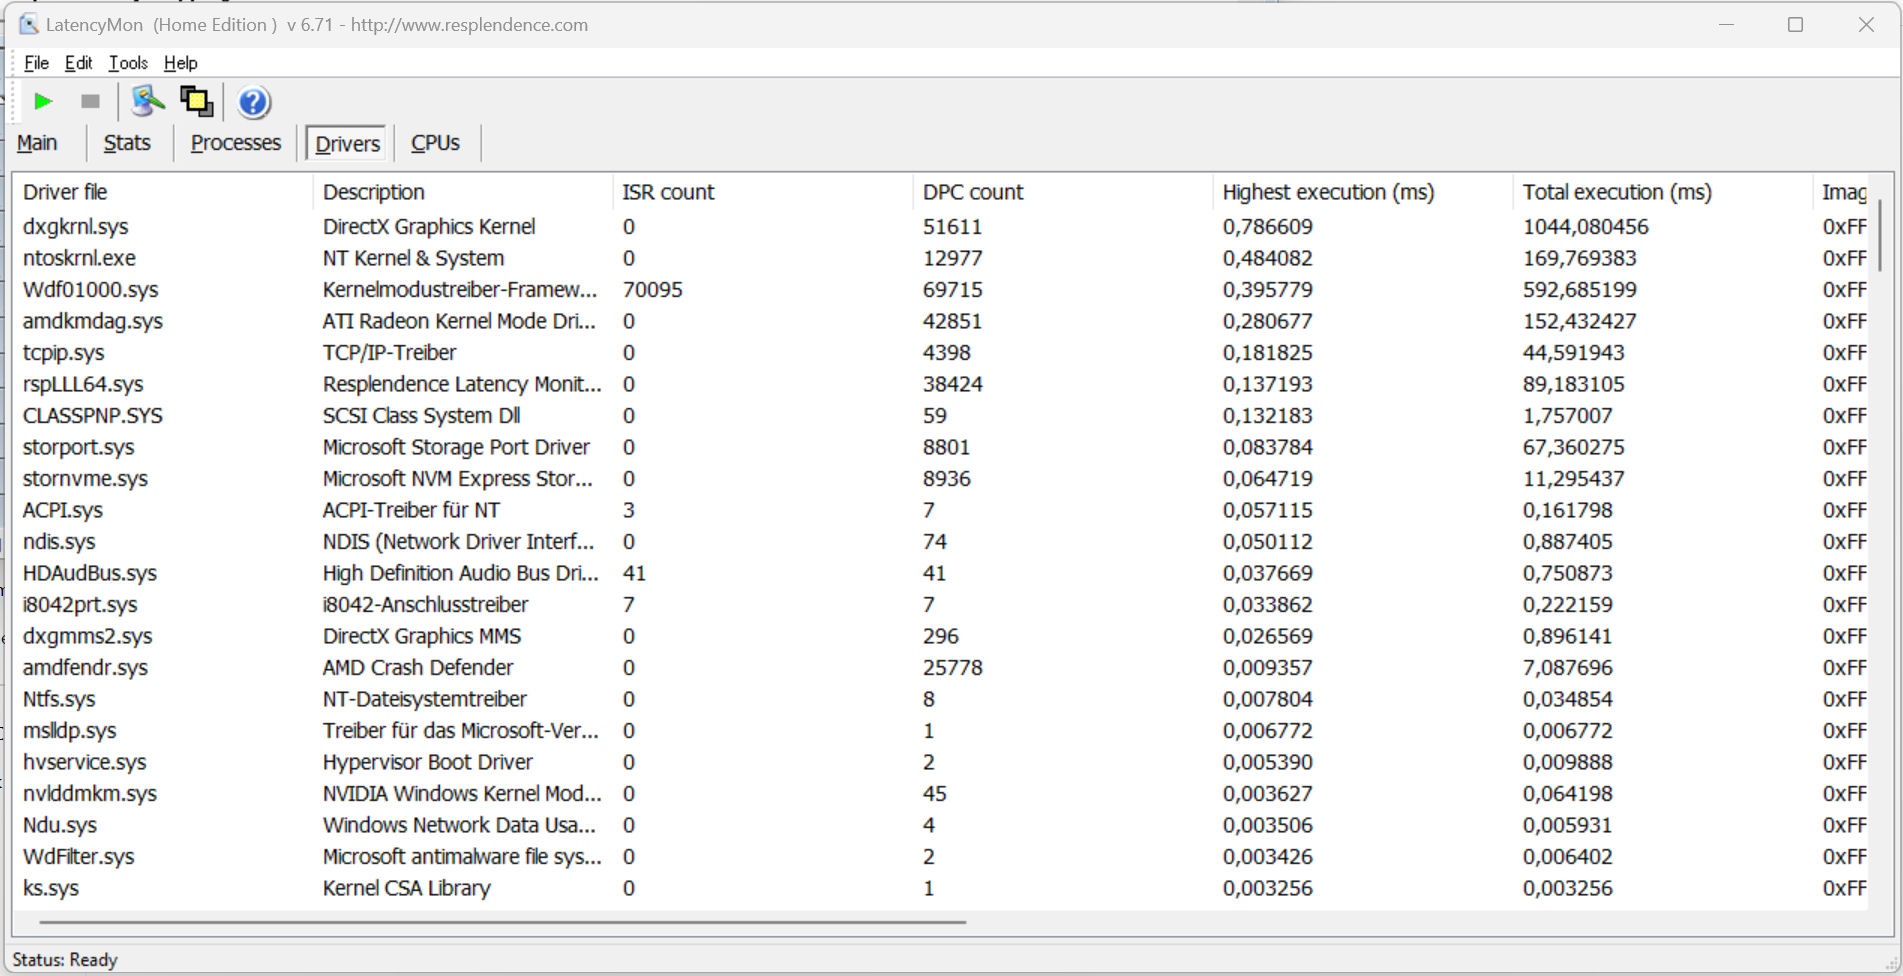
DPC gecikme süreleri
Standartlaştırılmış Latency Monitor testi (internette gezinme, 4k video oynatma, Prime95 yüksek yük) herhangi bir anormallik ortaya çıkarmadı. Sistem gerçek zamanlı video ve ses düzenleme için uygun görünüyor. Gelecekteki yazılım güncellemeleri bu performans alanını iyileştirebilir ya da kötüleştirebilir.
| DPC Latencies / LatencyMon - interrupt to process latency (max), Web, Youtube, Prime95 | |
| Medion Erazer Defender P40 | |
| Alienware m16 R1 Intel | |
| MSI Katana 17 B13VFK | |
| Acer Nitro 17 AN17-51-71ER | |
| Lenovo Legion Pro 5 16IRX8 | |
| Schenker XMG Apex 17 (Late 23) | |
* ... daha küçük daha iyidir
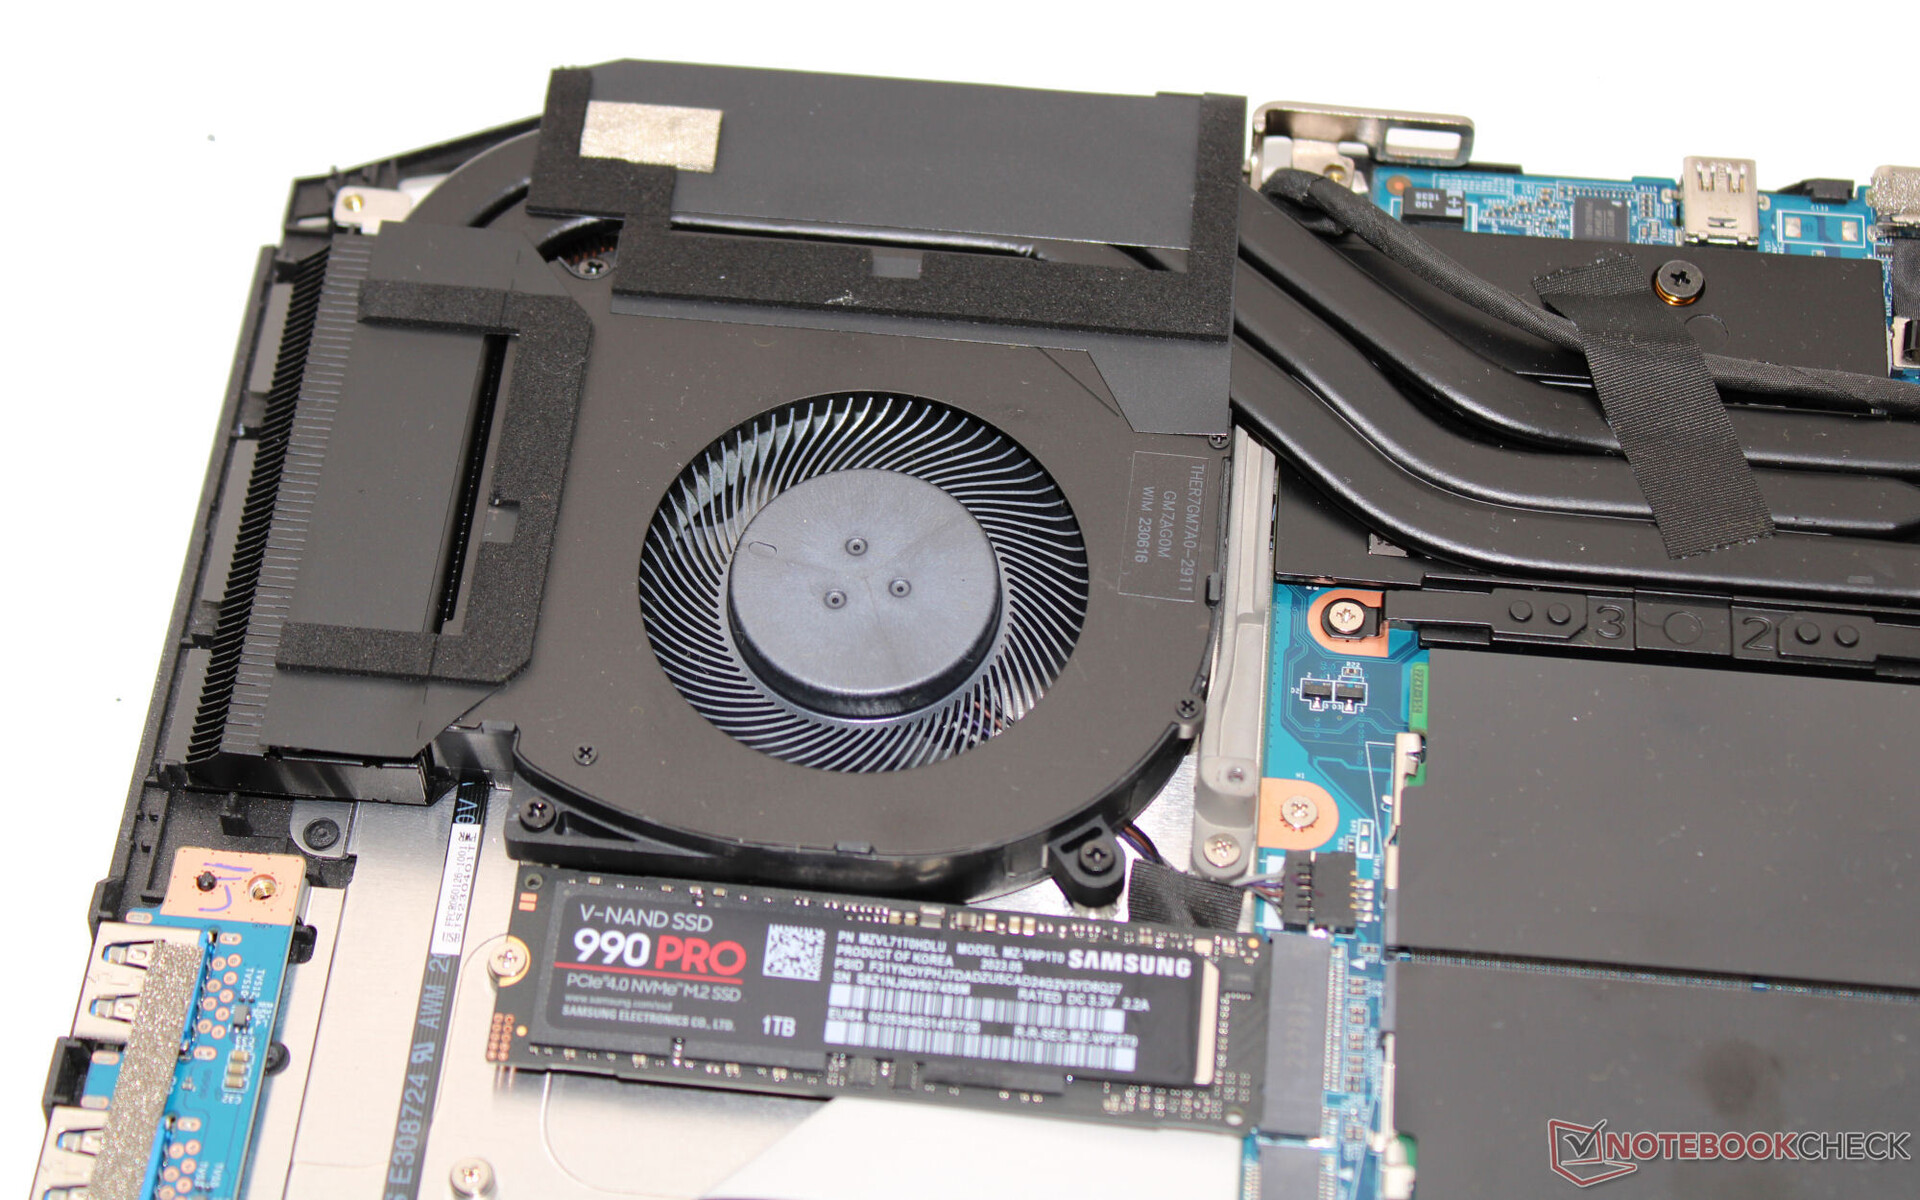
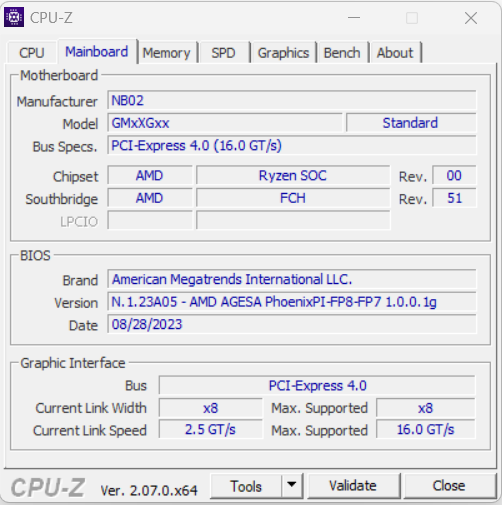
Yığın depolama
Apex, M.2 2280 formatında toplam iki PCIe 4 SSD'yi barındırabilir. RAID-0/1 desteklenmektedir. Bize sağlanan inceleme cihazında, mükemmel aktarım hızları sunan bir Samsung 1 TB SSD (PCIe 4, M.2 2280) bulunmaktadır. Olumlu: Isıl nedenlere bağlı yavaşlama meydana gelmedi.

* ... daha küçük daha iyidir
Continuous Performance Read: DiskSpd Read Loop, Queue Depth 8
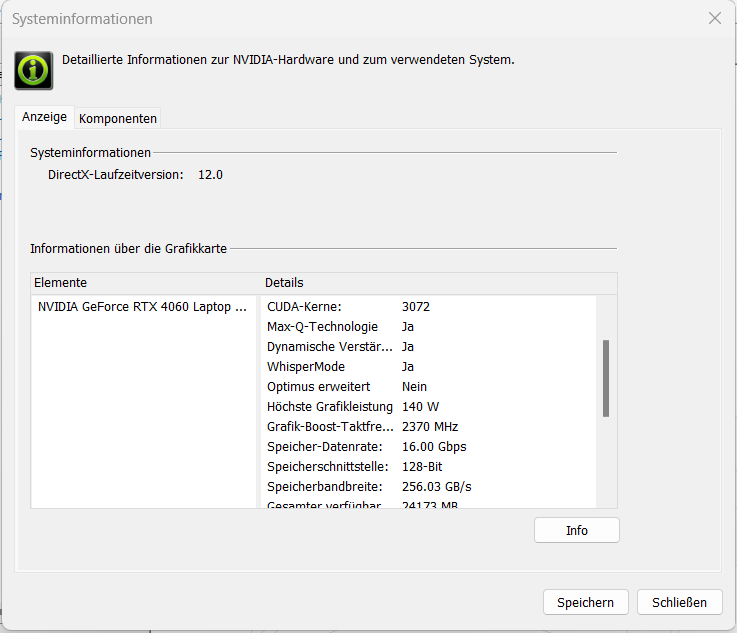
Grafik kartı
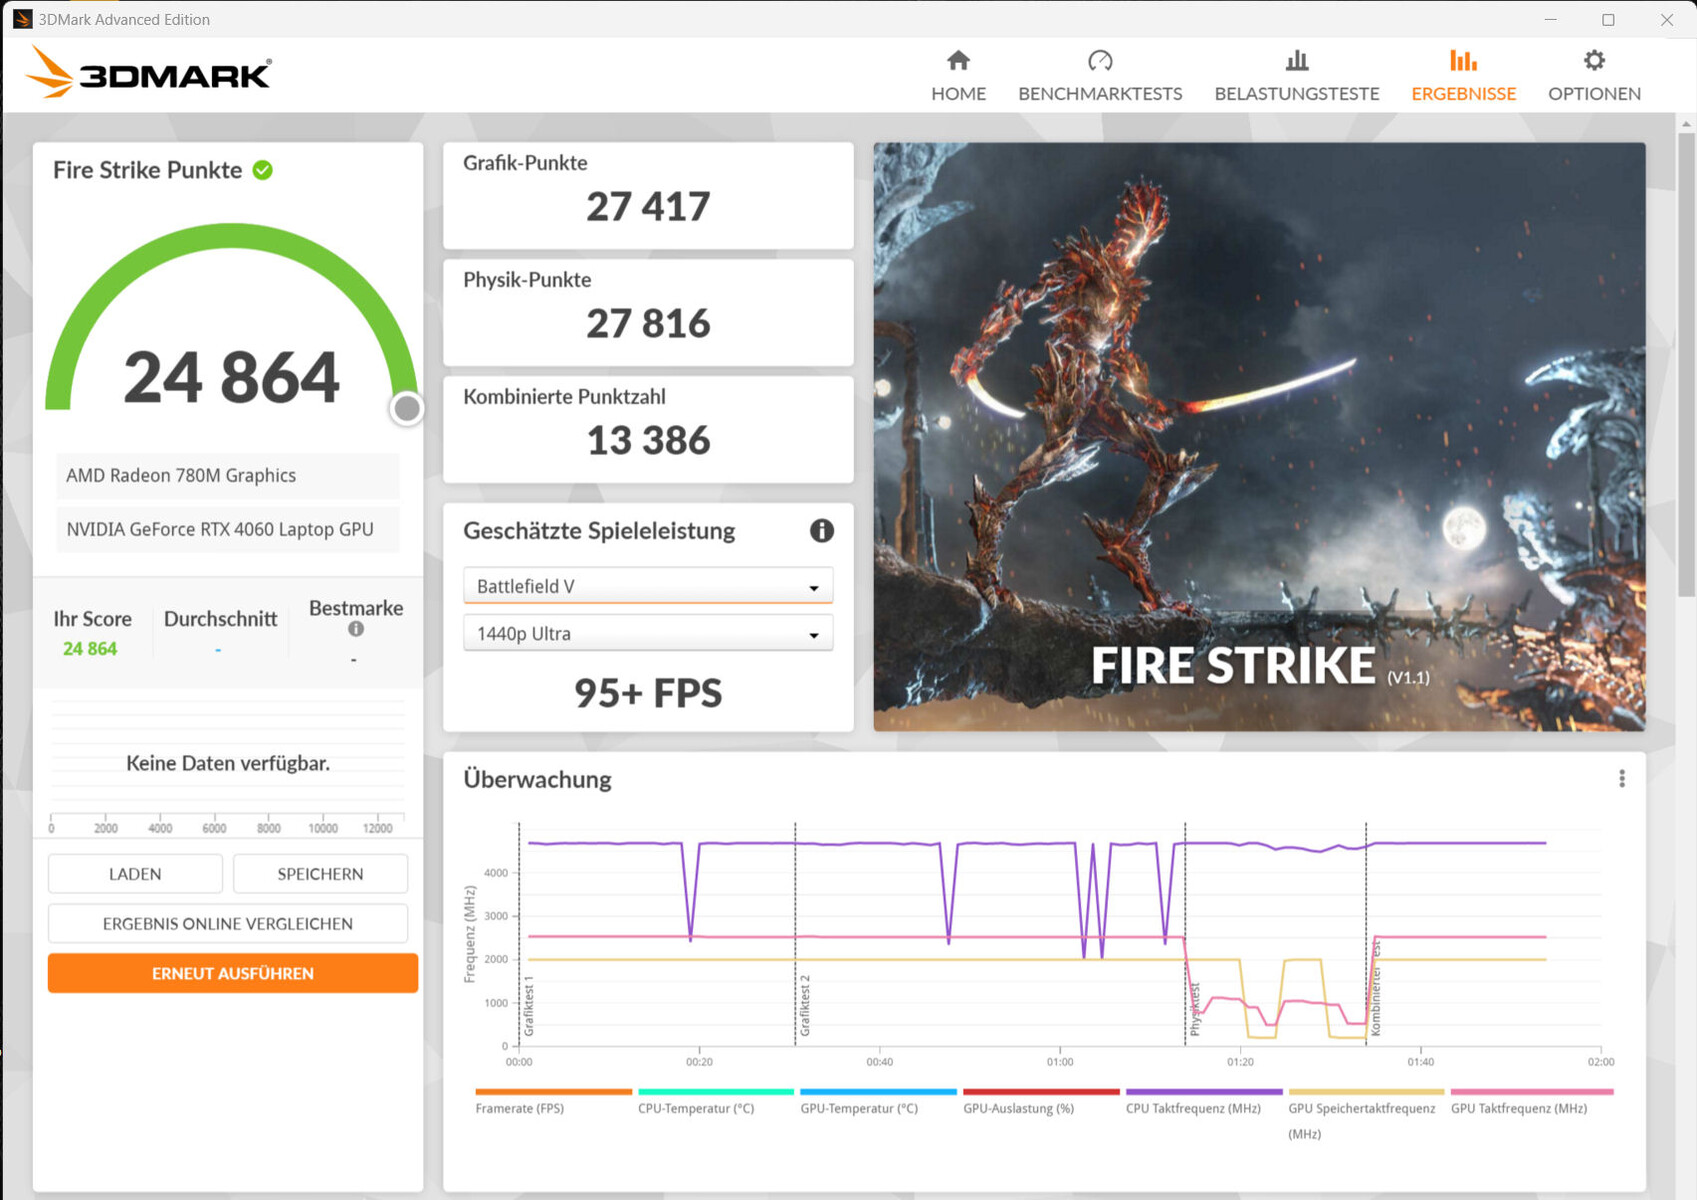
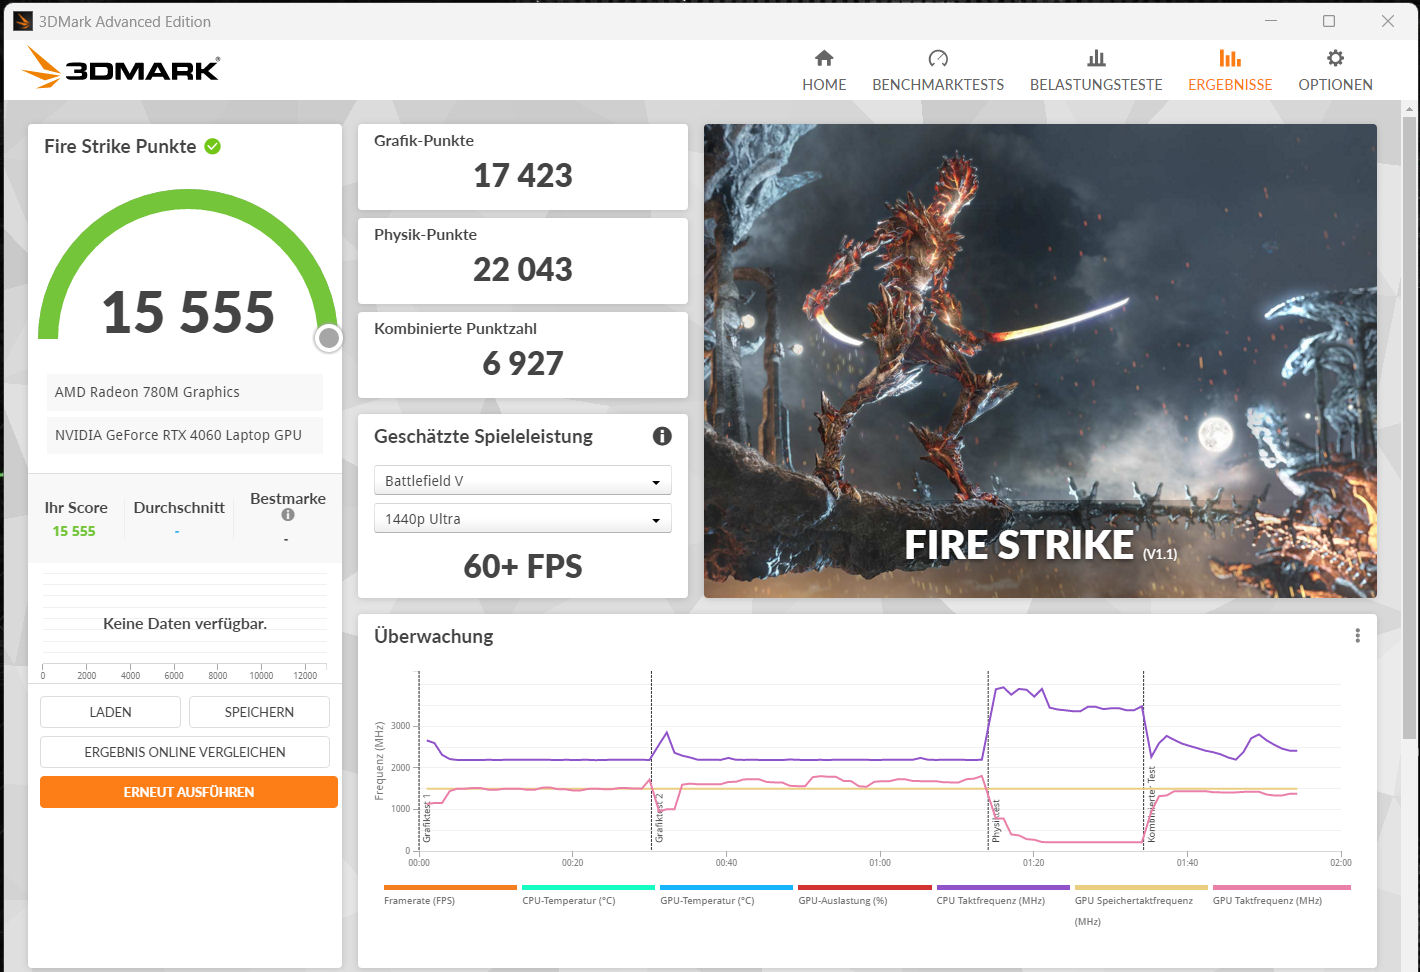
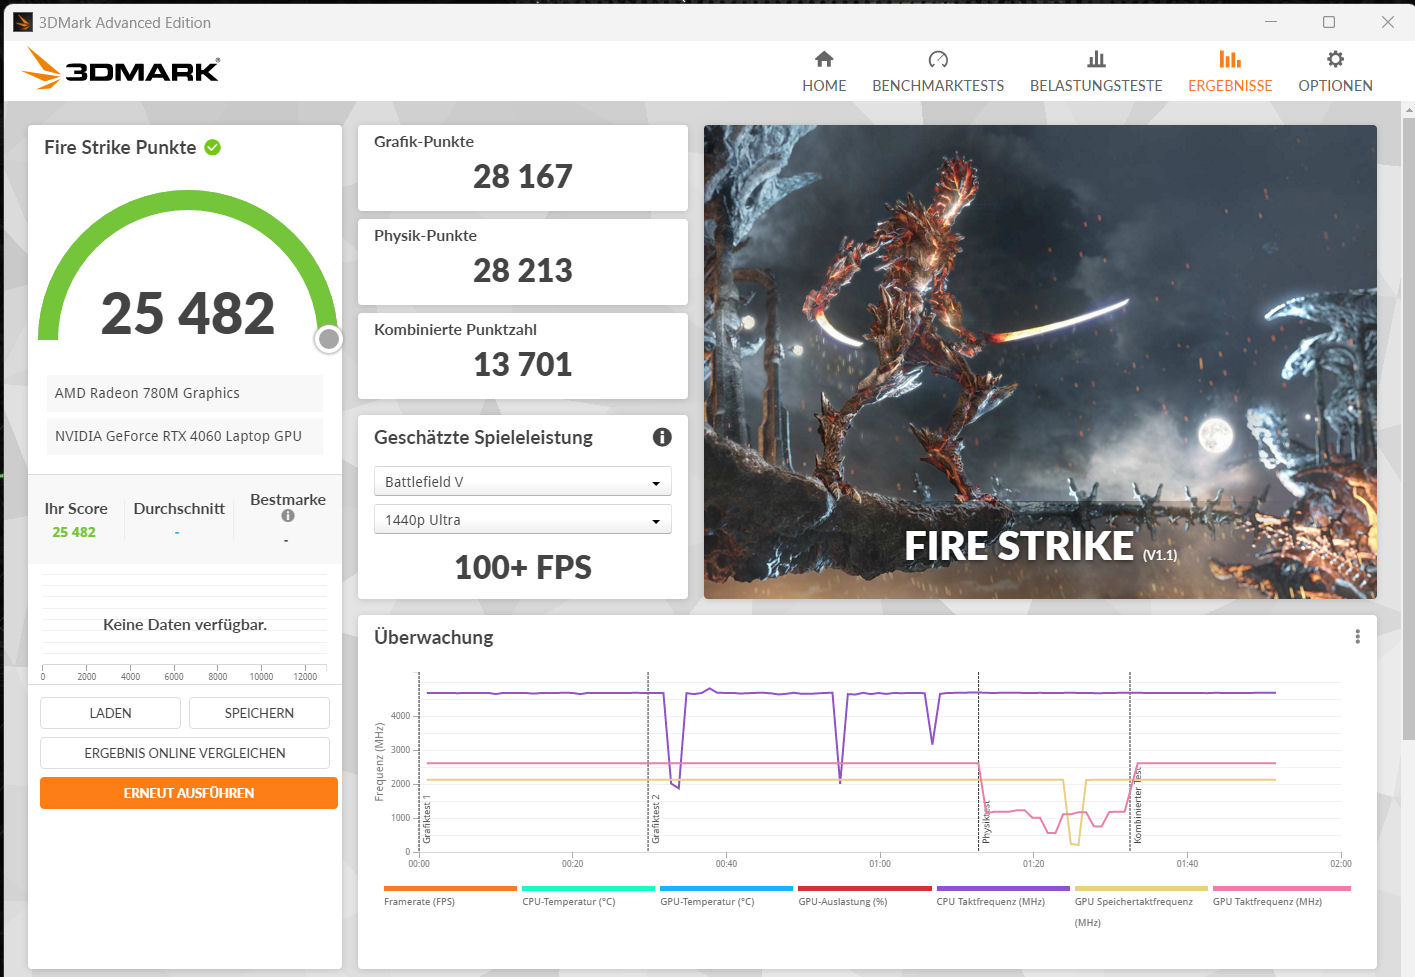
BuGeForce RTX 4060 3.072 shader, 128 bit genişliğinde veri yolu ve hızlı GDDR6 RAM (8.192 MB) sunmaktadır. Schenker maksimum TGP değerini 140 watt (115 watt + 25 watt dinamik güçlendirme) olarak belirlemiştir - daha fazlası mümkün değildir. Witcher 3 testine göre, TGP maksimize edilmemiştir.
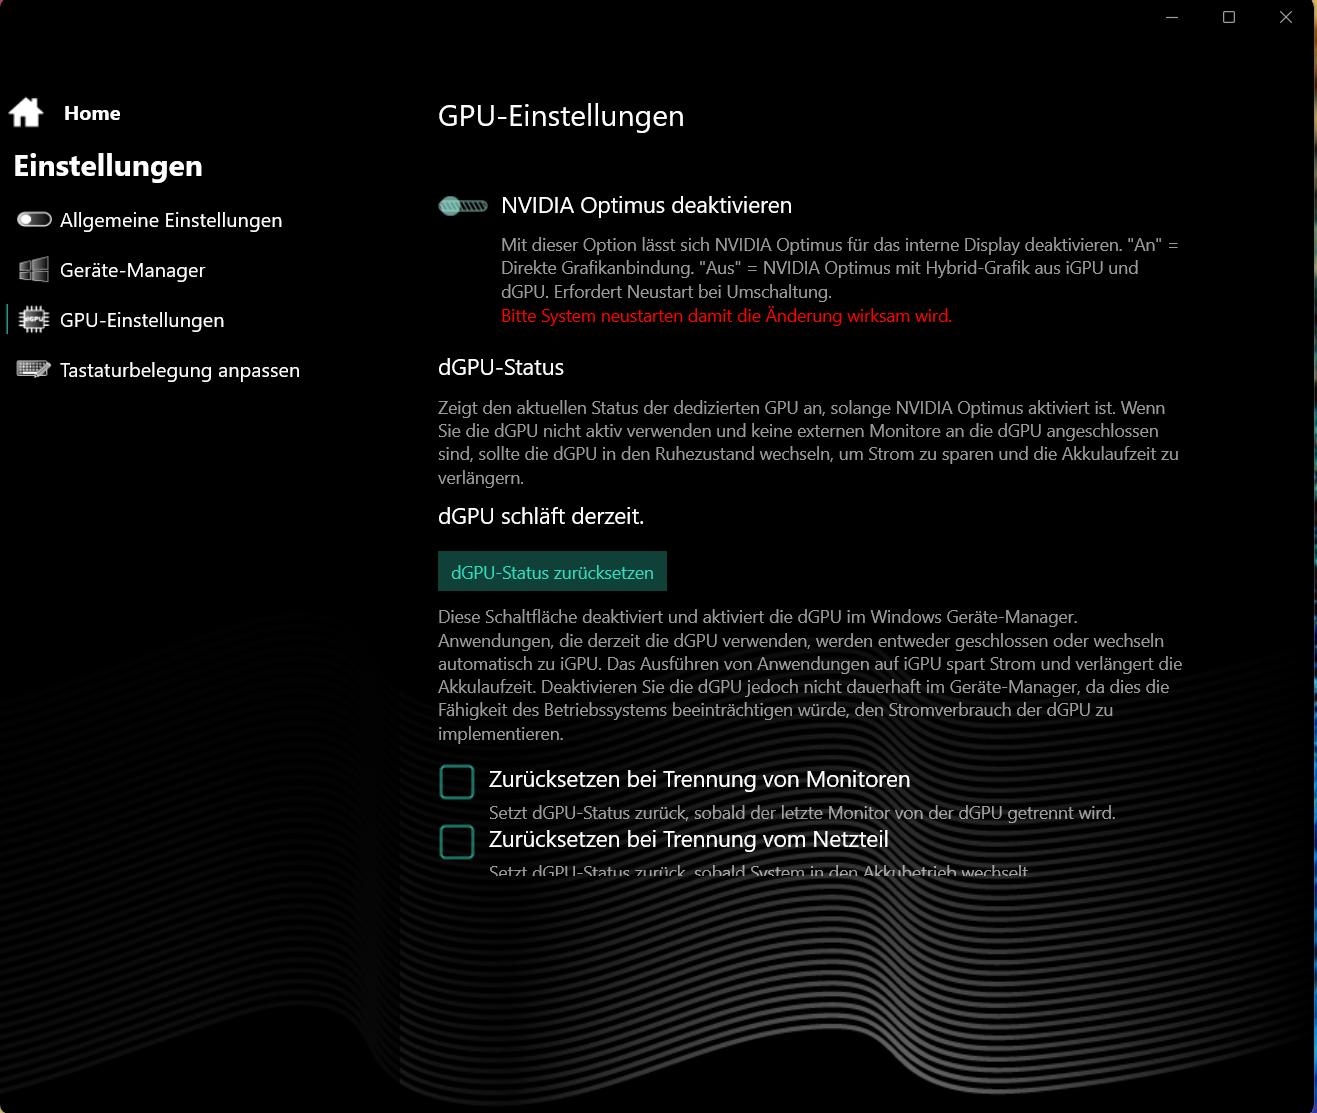
Kıyaslama sonuçları önceki RTX 4060 ortalamasından daha yüksektir. DGPU modu performansta herhangi bir artışa neden olmaz. DGPU ve Optimus arasında geçiş yapmak için yeniden başlatma gerekir - Gelişmiş Optimus desteklenmez.
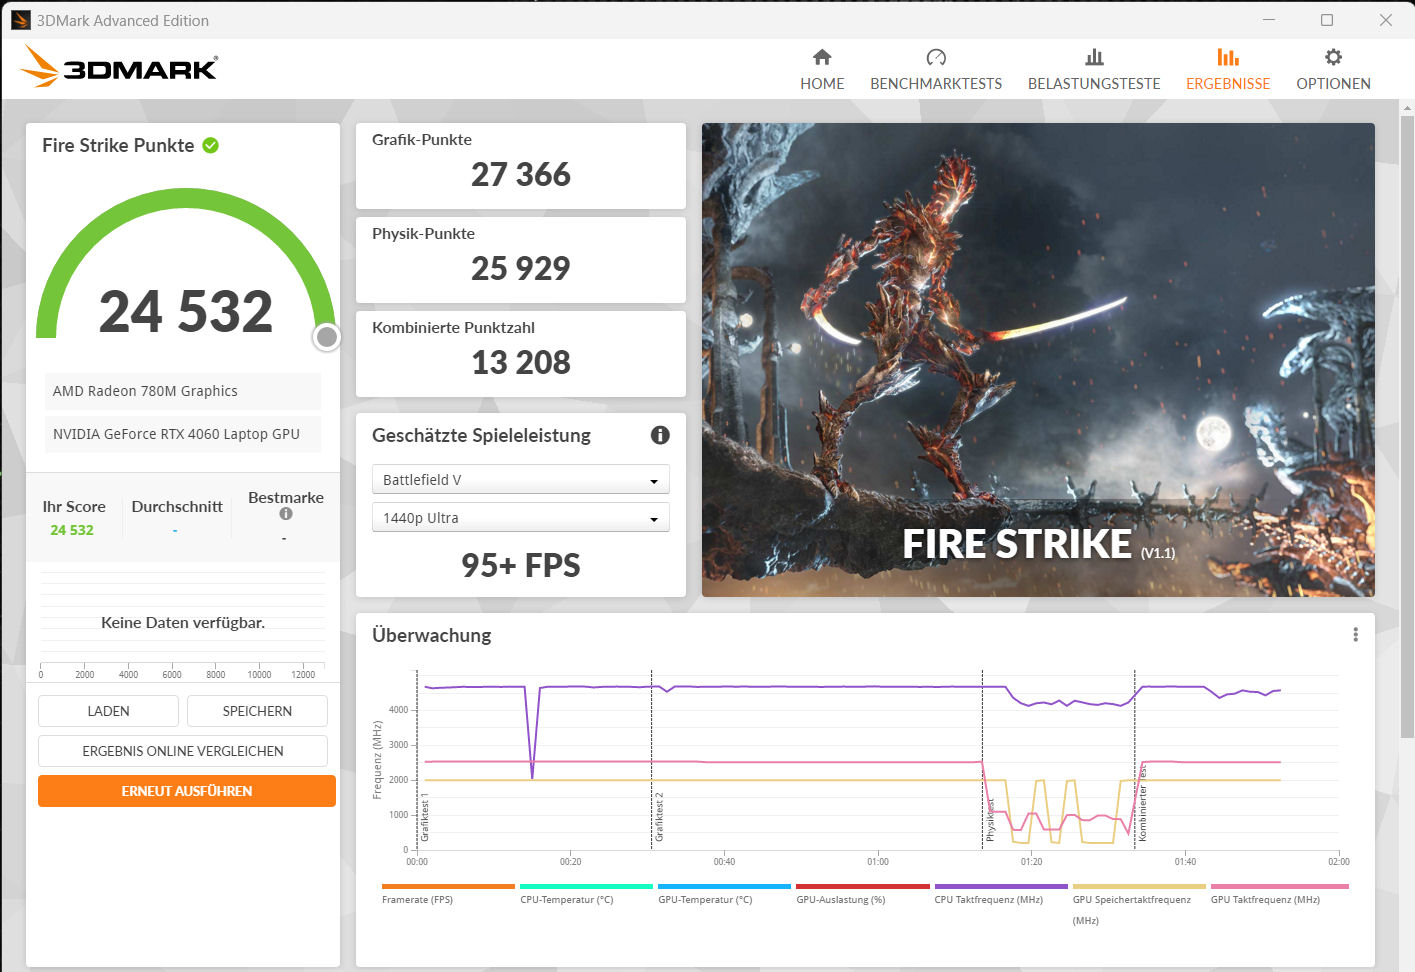
| 3DMark 06 Standard Score | 49011 puan | |
| 3DMark 11 Performance | 32639 puan | |
| 3DMark Cloud Gate Standard Score | 64881 puan | |
| 3DMark Fire Strike Score | 24864 puan | |
| 3DMark Time Spy Score | 10640 puan | |
Yardım | ||
* ... daha küçük daha iyidir
Oyun performansı
Schenker bilgisayar, yüksek ila maksimum ayarlarda QHD oyun için tasarlanmıştır. Daha yüksek çözünürlükler, uygun bir monitöre bağlandığında bazen daha düşük ayarlarda kullanılabilir. RTX 4060 ortalaması için tipik kare hızları elde edilebilir. Genel olarak, dGP modu performansta bir artışa neden olmaz. Sadece "X Plane 11" oyununda yüzde 10 ila 20 kare hızı artışı kaydedildi.
| The Witcher 3 - 1920x1080 Ultra Graphics & Postprocessing (HBAO+) | |
| Sınıf ortalaması Gaming (104.7 - 240, n=7, son 2 yıl) | |
| Lenovo Legion Pro 5 16IRX8 | |
| Alienware m16 R1 Intel | |
| Acer Nitro 17 AN17-51-71ER | |
| MSI Katana 17 B13VFK | |
| Schenker XMG Apex 17 (Late 23) | |
| Medion Erazer Defender P40 | |
| Ortalama NVIDIA GeForce RTX 4060 Laptop GPU (77 - 159.7, n=42) | |
| Cyberpunk 2077 1.6 - 1920x1080 Ultra Preset | |
| Lenovo Legion Pro 5 16IRX8 | |
| Alienware m16 R1 Intel | |
| Schenker XMG Apex 17 (Late 23) | |
| Acer Nitro 17 AN17-51-71ER | |
| Ortalama NVIDIA GeForce RTX 4060 Laptop GPU (57.9 - 93.2, n=18) | |
| MSI Katana 17 B13VFK | |
| Ratchet & Clank Rift Apart | |
| 1920x1080 Very High Preset AA:T | |
| Alienware m16 R1 Intel | |
| Schenker XMG Apex 17 (Late 23) | |
| Ortalama NVIDIA GeForce RTX 4060 Laptop GPU (51.6 - 54.8, n=4) | |
| 2560x1440 Very High Preset AA:T | |
| Alienware m16 R1 Intel | |
| Ortalama NVIDIA GeForce RTX 4060 Laptop GPU (45.6 - 46.6, n=3) | |
| Schenker XMG Apex 17 (Late 23) | |
| 1920x1080 Very High Preset + Very High Raytracing AA:T | |
| Alienware m16 R1 Intel | |
| Ortalama NVIDIA GeForce RTX 4060 Laptop GPU (39.1 - 44.5, n=3) | |
| Schenker XMG Apex 17 (Late 23) | |
| Atlas Fallen | |
| 1920x1080 High Preset | |
| Schenker XMG Apex 17 (Late 23) | |
| Alienware m16 R1 Intel | |
| Ortalama NVIDIA GeForce RTX 4060 Laptop GPU (88.8 - 133.3, n=3) | |
| 2560x1440 Very High Preset | |
| Alienware m16 R1 Intel | |
| Schenker XMG Apex 17 (Late 23) | |
| Ortalama NVIDIA GeForce RTX 4060 Laptop GPU (75 - 79.2, n=3) | |
| Immortals of Aveum | |
| 1920x1080 Ultra AF:16x | |
| Alienware m16 R1 Intel | |
| Schenker XMG Apex 17 (Late 23) | |
| Ortalama NVIDIA GeForce RTX 4060 Laptop GPU (33 - 48.9, n=4) | |
| 2560x1440 Ultra AF:16x | |
| Alienware m16 R1 Intel | |
| Schenker XMG Apex 17 (Late 23) | |
| Ortalama NVIDIA GeForce RTX 4060 Laptop GPU (20.5 - 32.8, n=4) | |
| Armored Core 6 | |
| 1920x1080 Maximum Preset | |
| Schenker XMG Apex 17 (Late 23) | |
| Ortalama NVIDIA GeForce RTX 4060 Laptop GPU (95.6 - 100.8, n=3) | |
| Sınıf ortalaması Gaming (n=1son 2 yıl) | |
| 2560x1440 Maximum Preset | |
| Schenker XMG Apex 17 (Late 23) | |
| Ortalama NVIDIA GeForce RTX 4060 Laptop GPU (73.2 - 74.6, n=3) | |
| Sınıf ortalaması Gaming (n=1son 2 yıl) | |
| Starfield | |
| 1920x1080 Ultra Preset | |
| Sınıf ortalaması Gaming (n=1son 2 yıl) | |
| Ortalama NVIDIA GeForce RTX 4060 Laptop GPU (39.7 - 41, n=3) | |
| Schenker XMG Apex 17 (Late 23) | |
| 2560x1440 Ultra Preset | |
| Sınıf ortalaması Gaming (n=1son 2 yıl) | |
| Schenker XMG Apex 17 (Late 23) | |
| Ortalama NVIDIA GeForce RTX 4060 Laptop GPU (32.5 - 32.6, n=2) | |
| Lies of P | |
| 1920x1080 Best Preset | |
| Schenker XMG Apex 17 (Late 23) | |
| Ortalama NVIDIA GeForce RTX 4060 Laptop GPU (106.2 - 126.6, n=3) | |
| 2560x1440 Best Preset | |
| Schenker XMG Apex 17 (Late 23) | |
| Ortalama NVIDIA GeForce RTX 4060 Laptop GPU (83.6 - 85.6, n=2) | |
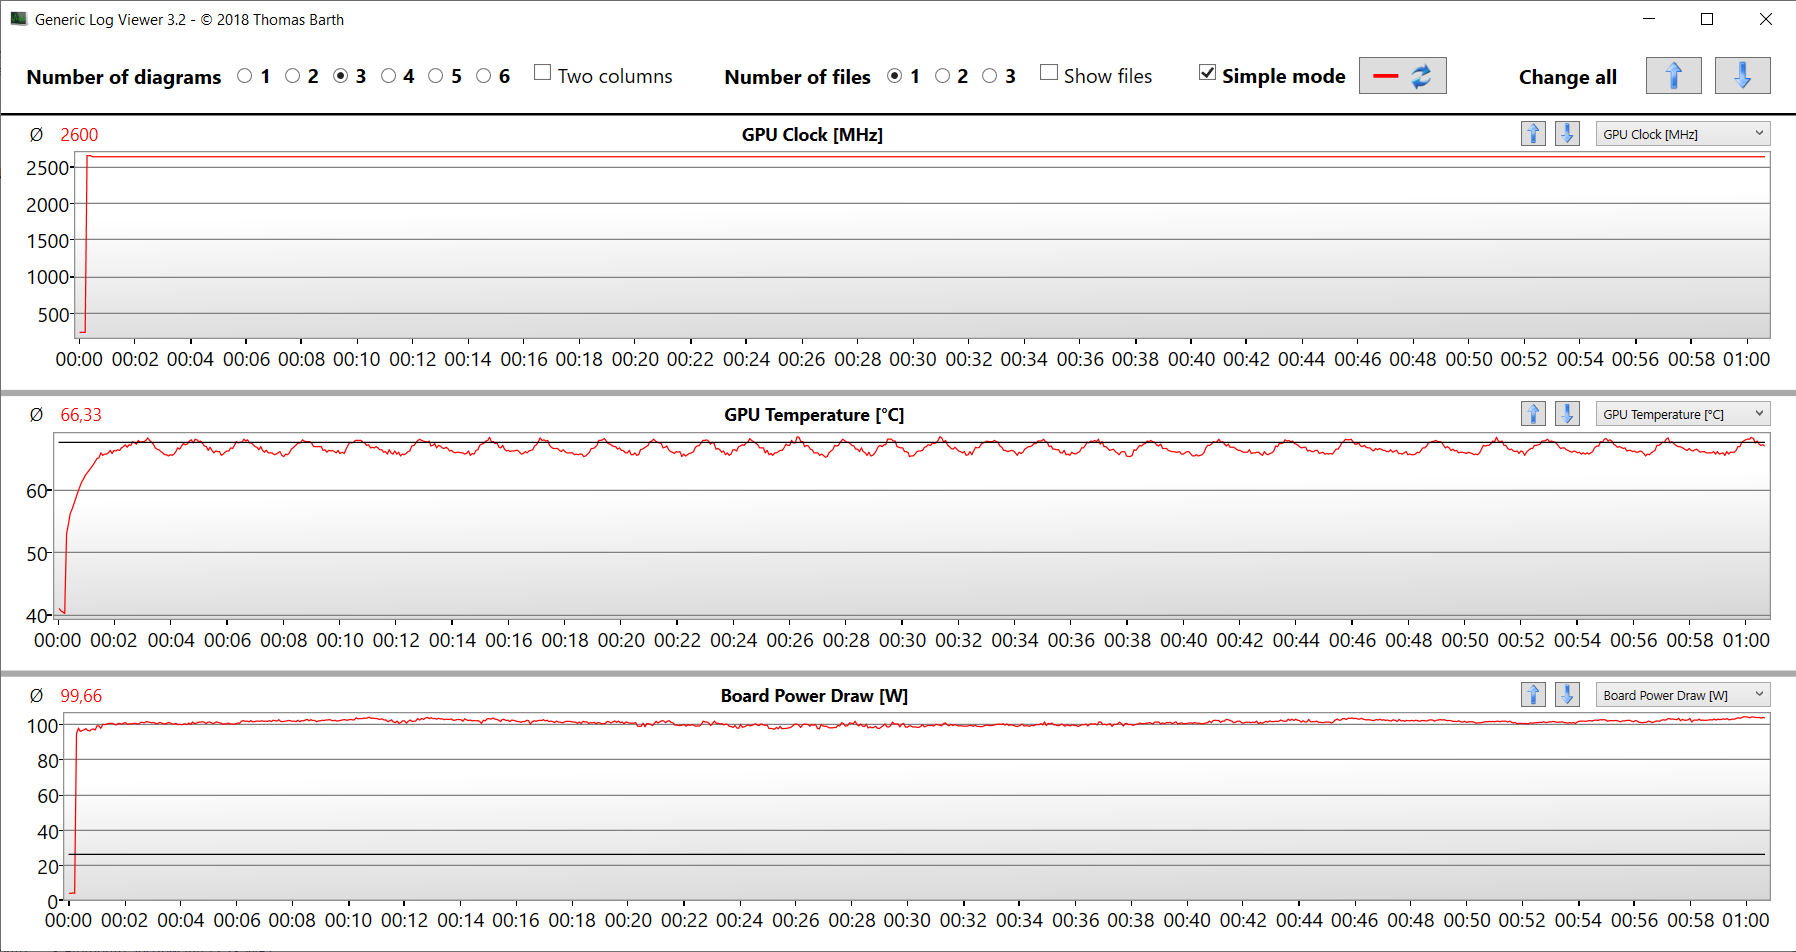
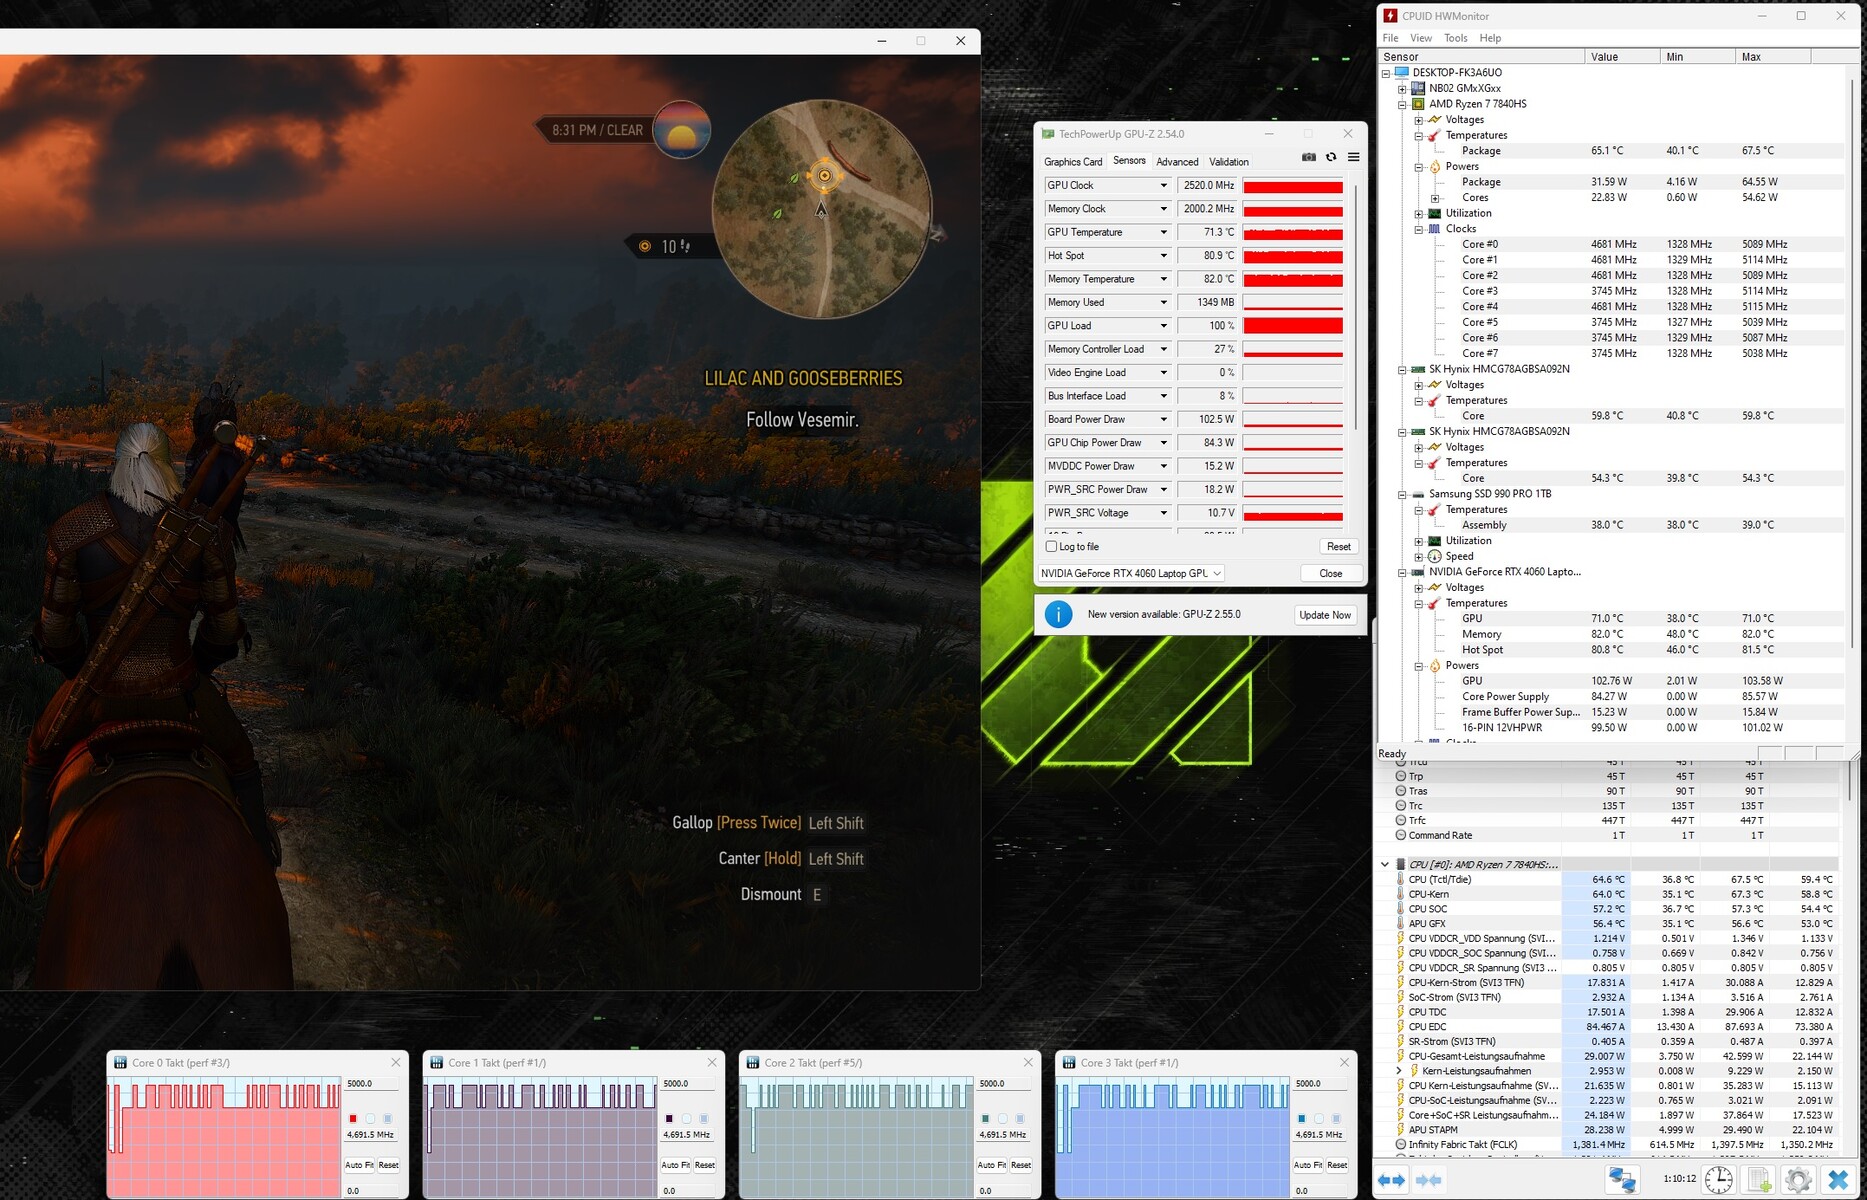
Kare hızlarının daha uzun bir süre boyunca çoğunlukla tutarlı kalıp kalmadığını kontrol etmek için, "The Witcher 3" oyununu Full HD çözünürlükte ve maksimum kalite ayarlarında yaklaşık 60 dakika boyunca çalıştırdık. Oyun karakteri hareket ettirilmedi. Kare hızında bir düşüş fark etmedik.
Witcher 3 FPS diagram
| düşük | orta | yüksek | ultra | QHD | |
|---|---|---|---|---|---|
| The Witcher 3 (2015) | 401.8 | 316.1 | 198.2 | 103.4 | 76.3 |
| Dota 2 Reborn (2015) | 169.4 | 154.1 | 147.6 | 139.8 | |
| Final Fantasy XV Benchmark (2018) | 223 | 148.4 | 103.4 | 76.8 | |
| X-Plane 11.11 (2018) | 127.3 | 110.9 | 88.2 | ||
| Far Cry 5 (2018) | 163 | 145 | 139 | 130 | 106 |
| Strange Brigade (2018) | 399 | 279 | 221 | 190.1 | 126.9 |
| Gears Tactics (2020) | 320.2 | 255 | 180.5 | 125.9 | 85.8 |
| GRID Legends (2022) | 152.8 | 141.6 | 132.4 | 120.6 | 103.2 |
| Cyberpunk 2077 1.6 (2022) | 129.9 | 101 | 87.5 | 79.8 | 49.1 |
| Spider-Man Miles Morales (2022) | 123.7 | 115.9 | 110.3 | 103.8 | 77.8 |
| F1 23 (2023) | 249 | 244 | 186.2 | 60.1 | 37.8 |
| Ratchet & Clank Rift Apart (2023) | 85.4 | 74.7 | 60.6 | 54.6 | 45.6 |
| Atlas Fallen (2023) | 146 | 143.2 | 133.3 | 112.6 | 79.1 |
| Immortals of Aveum (2023) | 65.7 | 53.1 | 44 | 30.2 | |
| Armored Core 6 (2023) | 111.1 | 108.7 | 109.4 | 100.8 | 74.6 |
| Starfield (2023) | 70.3 | 62.5 | 47.1 | 39.7 | 32.6 |
| The Crew Motorfest (2023) | 60 | 60 | 60 | 60 | 54 |
| Lies of P (2023) | 186.6 | 163.8 | 141.9 | 126.6 | 85.6 |
Emisyonlar - Oyun dizüstü bilgisayarı sessiz çalışabilir
Gürültü emisyonları
Genel olarak, Apex'i düşük ila orta gürültü seviyelerine sahip olarak değerlendiriyoruz. Günlük kullanımda (ofis, internet, bankacılık, ...) fanlar genellikle yavaş dönüyor ve hatta sabit duruyor. Orta yük altında da düşük seviyededirler. Bu durum oyun alanında farklıdır: Ses basıncı seviyeleri 54 dB(A)'ya kadar çıkabilir ("overboost"). "Meraklı" modunda, 50 dB(A)'da, gürültü seviyeleri oldukça düşük olarak tanımlanabilir. "Dengeli" mod oldukça sessizdir: ancak 34 dB(A) seviyesi GPU performansında önemli bir kayba neden olur.
Fanlar öncelikle gürültülü bir ses yayar. Rahatsız edici arka plan sesleri algılanamaz.
Ses yüksekliği
| Boşta |
| 25 / 29 / 33 dB |
| Çalışırken |
| 37 / 54 dB |
 | ||
30 dB sessiz 40 dB(A) duyulabilirlik 50 dB(A) gürültülü |
||
min: | ||
| Schenker XMG Apex 17 (Late 23) R7 7840HS, GeForce RTX 4060 Laptop GPU | Alienware m16 R1 Intel i7-13700HX, GeForce RTX 4060 Laptop GPU | Lenovo Legion Pro 5 16IRX8 i7-13700HX, GeForce RTX 4060 Laptop GPU | Acer Nitro 17 AN17-51-71ER i7-13700H, GeForce RTX 4060 Laptop GPU | Medion Erazer Defender P40 i7-13700HX, GeForce RTX 4060 Laptop GPU | MSI Katana 17 B13VFK i7-13620H, GeForce RTX 4060 Laptop GPU | |
|---|---|---|---|---|---|---|
| Noise | -2% | 9% | 2% | -10% | -8% | |
| kapalı / ortam * (dB) | 24 | 25 -4% | 23 4% | 24 -0% | 25 -4% | 24.5 -2% |
| Idle Minimum * (dB) | 25 | 25 -0% | 23.1 8% | 24 4% | 26 -4% | 24.5 2% |
| Idle Average * (dB) | 29 | 26 10% | 23.1 20% | 24 17% | 27 7% | 24.5 16% |
| Idle Maximum * (dB) | 33 | 27 18% | 26.6 19% | 32.32 2% | 32 3% | 40 -21% |
| Load Average * (dB) | 37 | 52 -41% | 34.7 6% | 35.18 5% | 53 -43% | 48.3 -31% |
| Witcher 3 ultra * (dB) | 50 | 51 -2% | 47.6 5% | 54.78 -10% | 56 -12% | 56 -12% |
| Load Maximum * (dB) | 54 | 53 2% | 54.8 -1% | 54.78 -1% | 64 -19% | 59.1 -9% |
* ... daha küçük daha iyidir
Sıcaklık
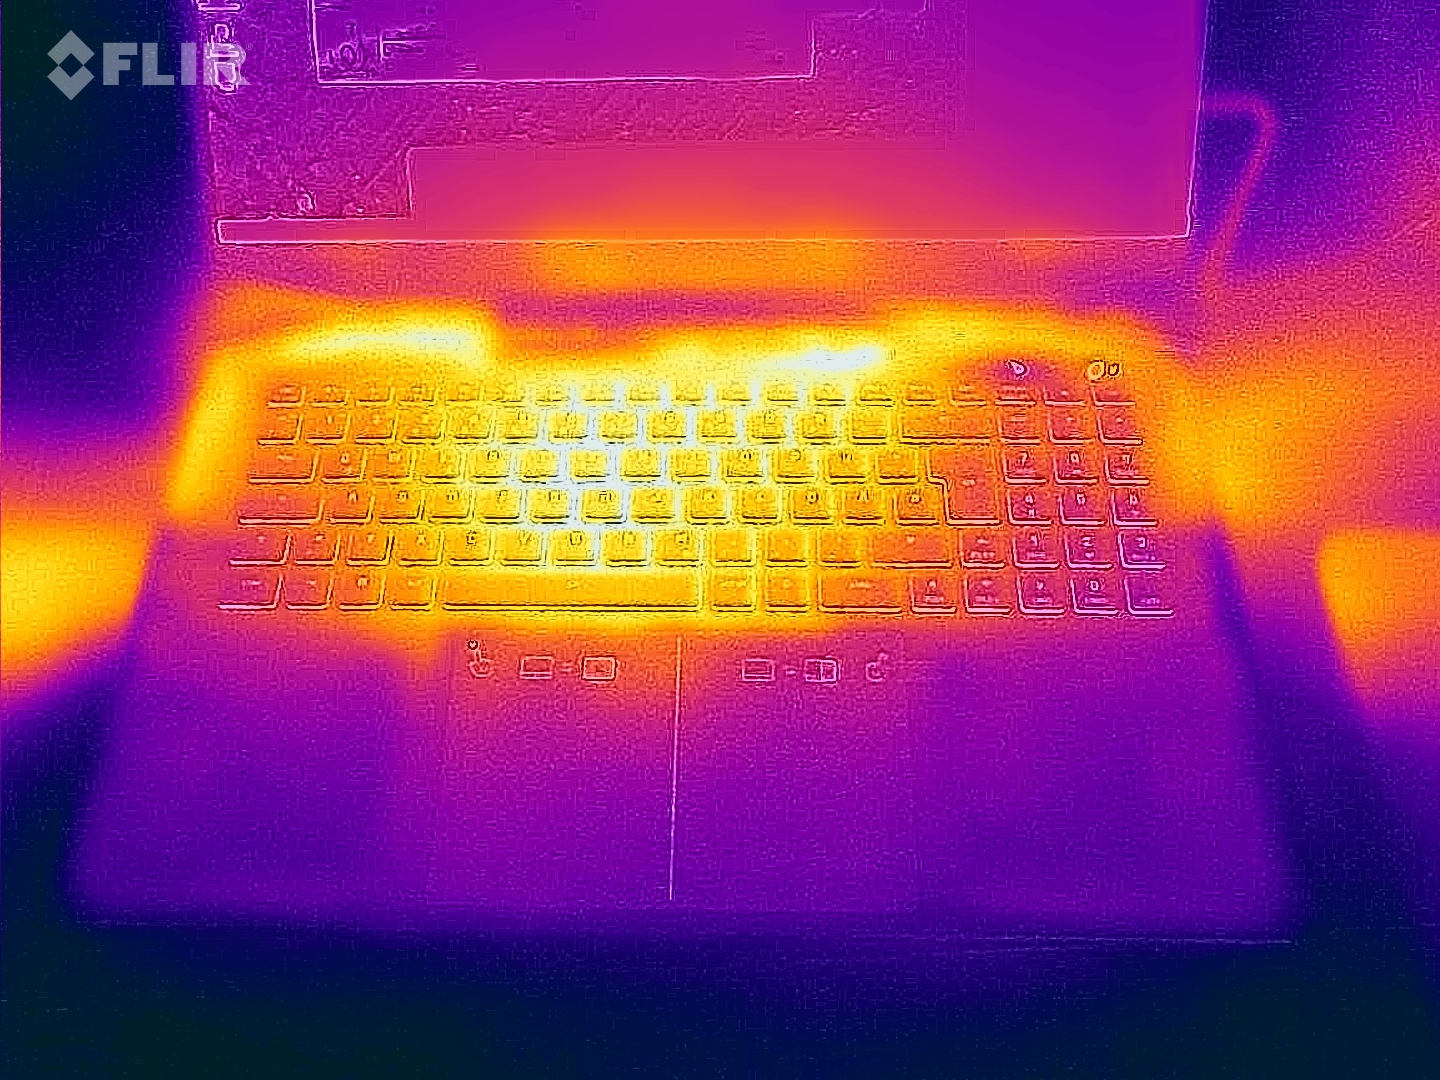
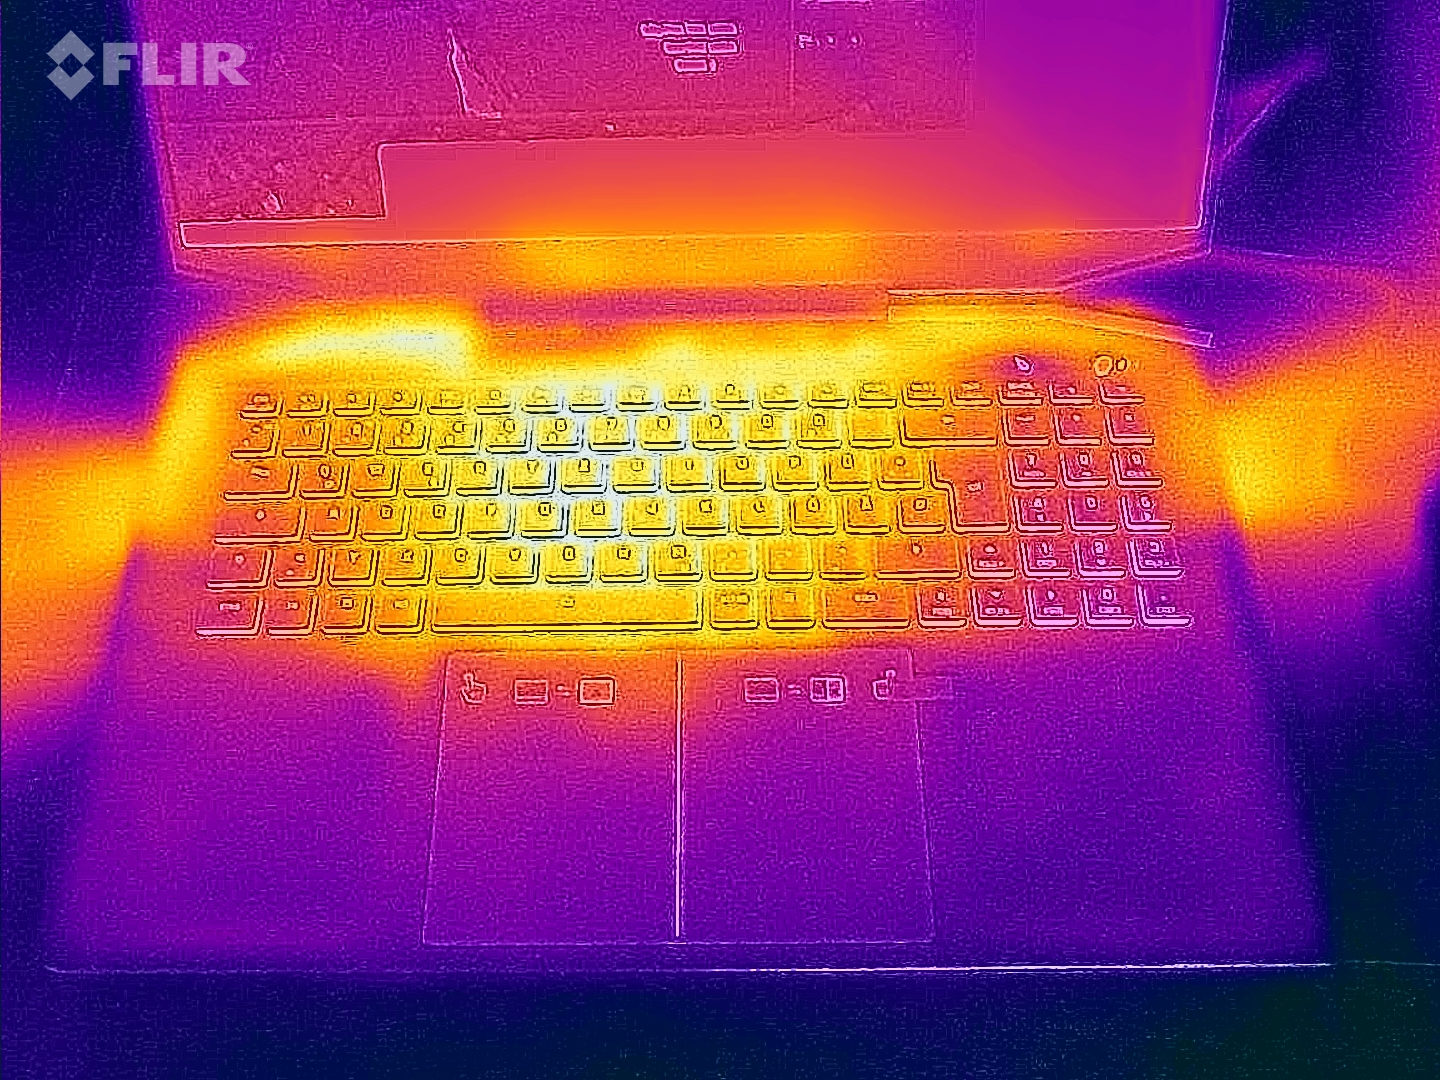
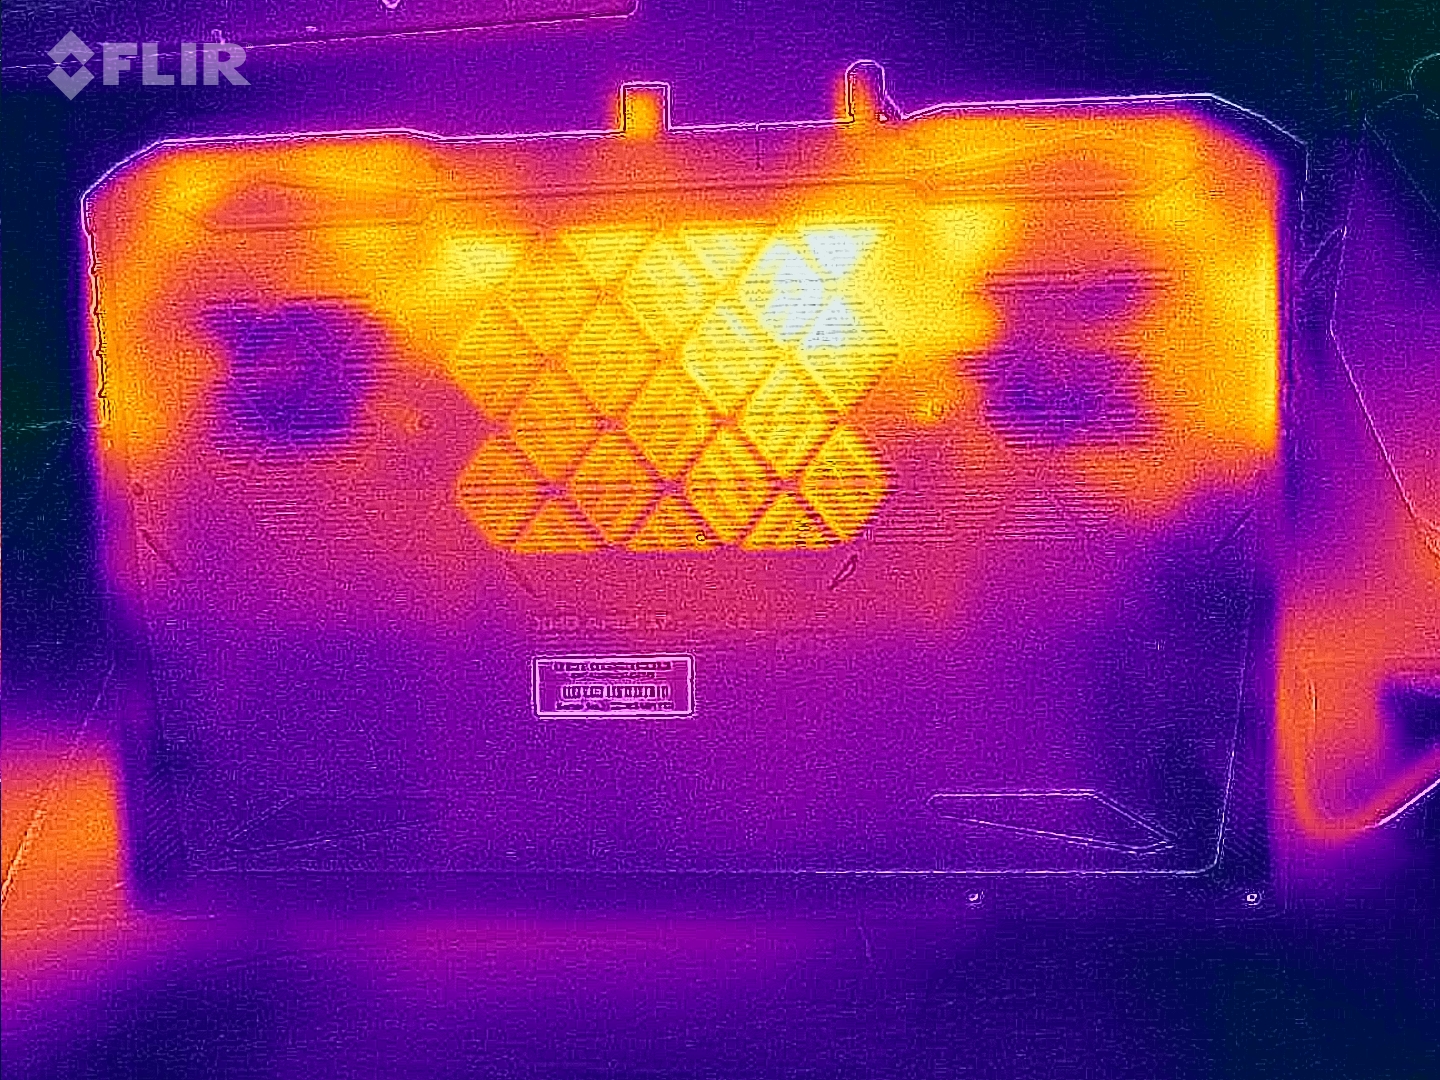
Stres testi ve Witcher 3 testi dizüstü bilgisayarın belirli yerlerde belirgin şekilde ısınmasına neden oldu. Ancak, her şey hala kabul edilebilir boyutlarda. Günlük kullanımda (ofis, internet) kasa sıcaklıkları yeşil bölgede kalıyor.
(-) Üst taraftaki maksimum sıcaklık, 40.4 °C / 105 F ortalamasına kıyasla 51 °C / 124 F'dir. , Gaming sınıfı için 21.2 ile 68.8 °C arasında değişir.
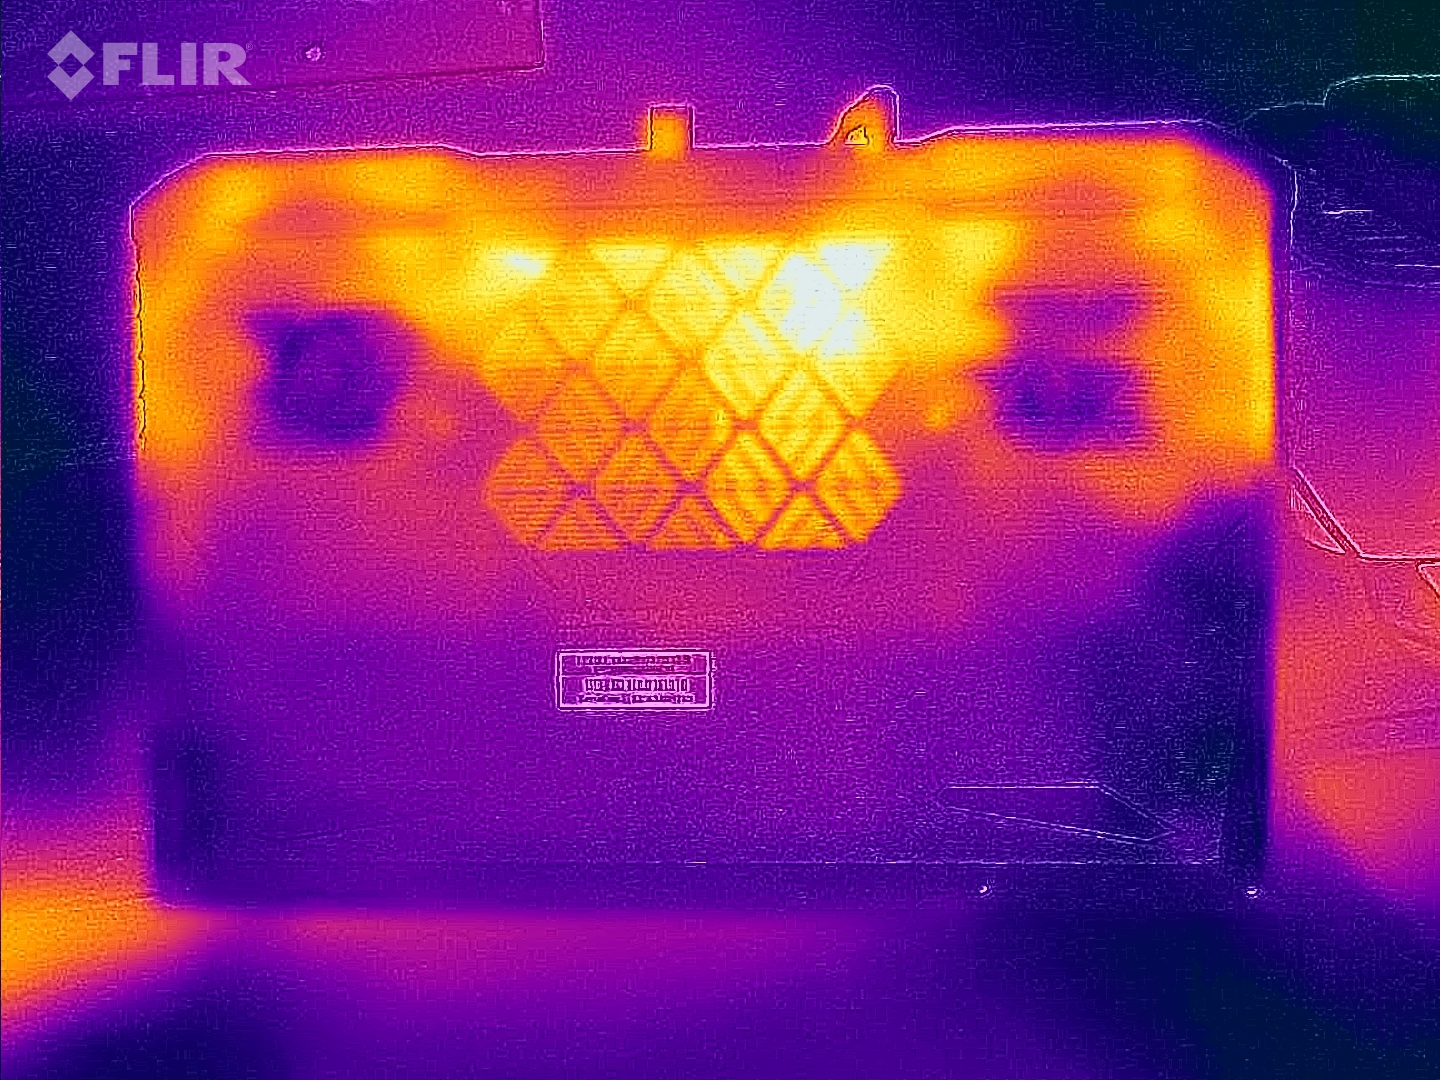
(-) Alt kısım, 43.2 °C / 110 F ortalamasına kıyasla maksimum 54 °C / 129 F'ye kadar ısınır
(+) Boşta kullanımda, üst tarafın ortalama sıcaklığı 30.3 °C / 87 F olup, cihazın 33.9 °C / 93 F.
(-) The Witcher 3 oynarken, üst tarafın ortalama sıcaklığı 38.2 °C / 101 F olup, cihazın 33.9 °C / 93 F.
(+) Avuç içi dayanakları ve dokunmatik yüzey, maksimum 31 °C / 87.8 F ile cilt sıcaklığından daha soğuktur ve bu nedenle dokunulduğunda soğuktur.
(-) Benzer cihazların avuç içi dayanağı alanının ortalama sıcaklığı 28.8 °C / 83.8 F (-2.2 °C / -4 F) idi.
| Schenker XMG Apex 17 (Late 23) AMD Ryzen 7 7840HS, NVIDIA GeForce RTX 4060 Laptop GPU | Alienware m16 R1 Intel Intel Core i7-13700HX, NVIDIA GeForce RTX 4060 Laptop GPU | Lenovo Legion Pro 5 16IRX8 Intel Core i7-13700HX, NVIDIA GeForce RTX 4060 Laptop GPU | Acer Nitro 17 AN17-51-71ER Intel Core i7-13700H, NVIDIA GeForce RTX 4060 Laptop GPU | Medion Erazer Defender P40 Intel Core i7-13700HX, NVIDIA GeForce RTX 4060 Laptop GPU | MSI Katana 17 B13VFK Intel Core i7-13620H, NVIDIA GeForce RTX 4060 Laptop GPU | |
|---|---|---|---|---|---|---|
| Heat | -5% | 8% | 4% | 16% | 9% | |
| Maximum Upper Side * (°C) | 51 | 49 4% | 42.8 16% | 46 10% | 42 18% | 41.6 18% |
| Maximum Bottom * (°C) | 54 | 48 11% | 50 7% | 51 6% | 45 17% | 43.1 20% |
| Idle Upper Side * (°C) | 33 | 40 -21% | 29.6 10% | 34 -3% | 28 15% | 32 3% |
| Idle Bottom * (°C) | 34 | 39 -15% | 34 -0% | 33 3% | 30 12% | 35.8 -5% |
* ... daha küçük daha iyidir
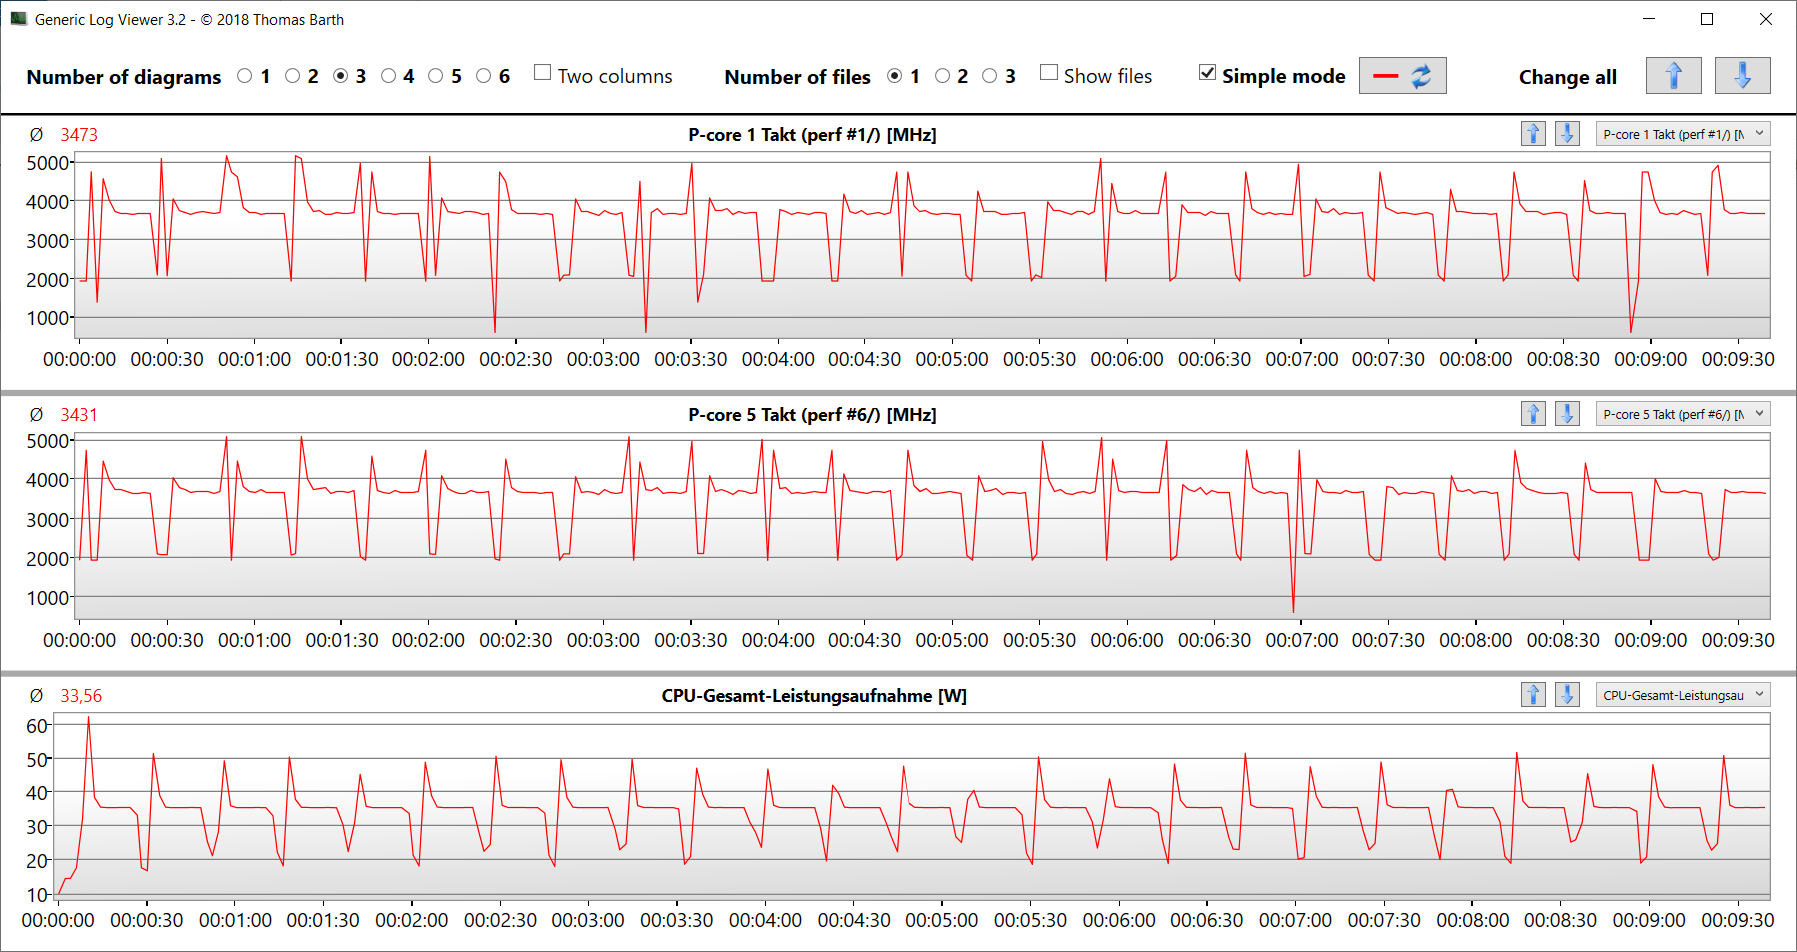
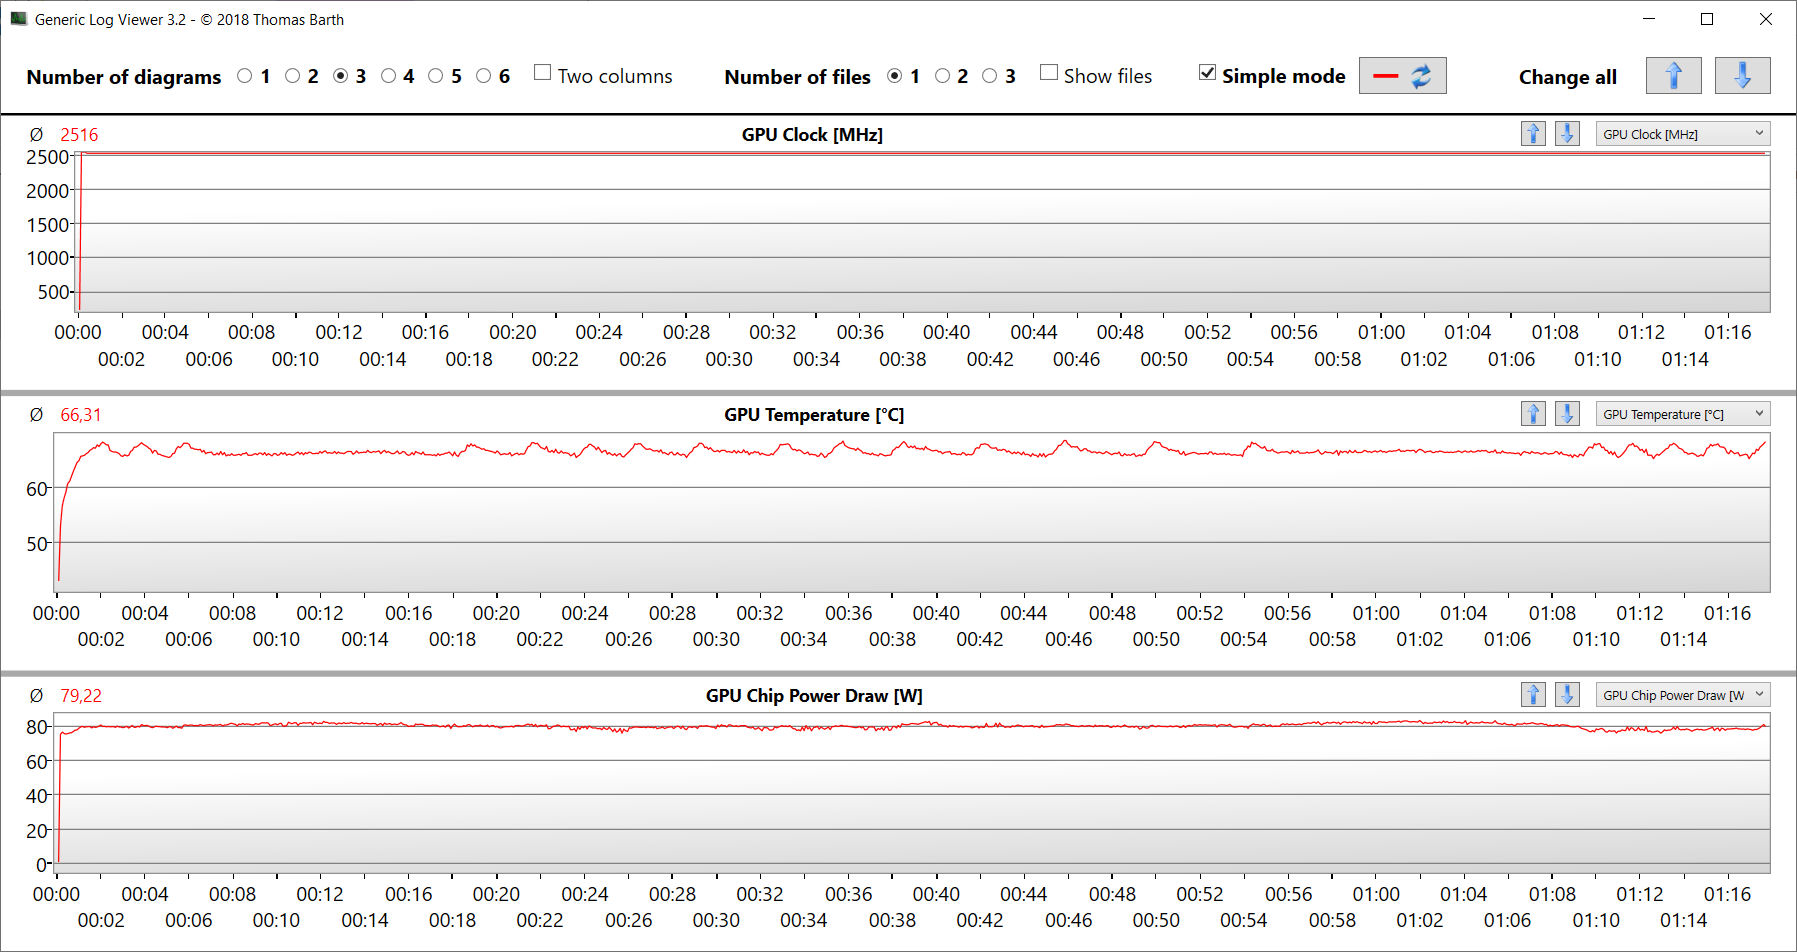
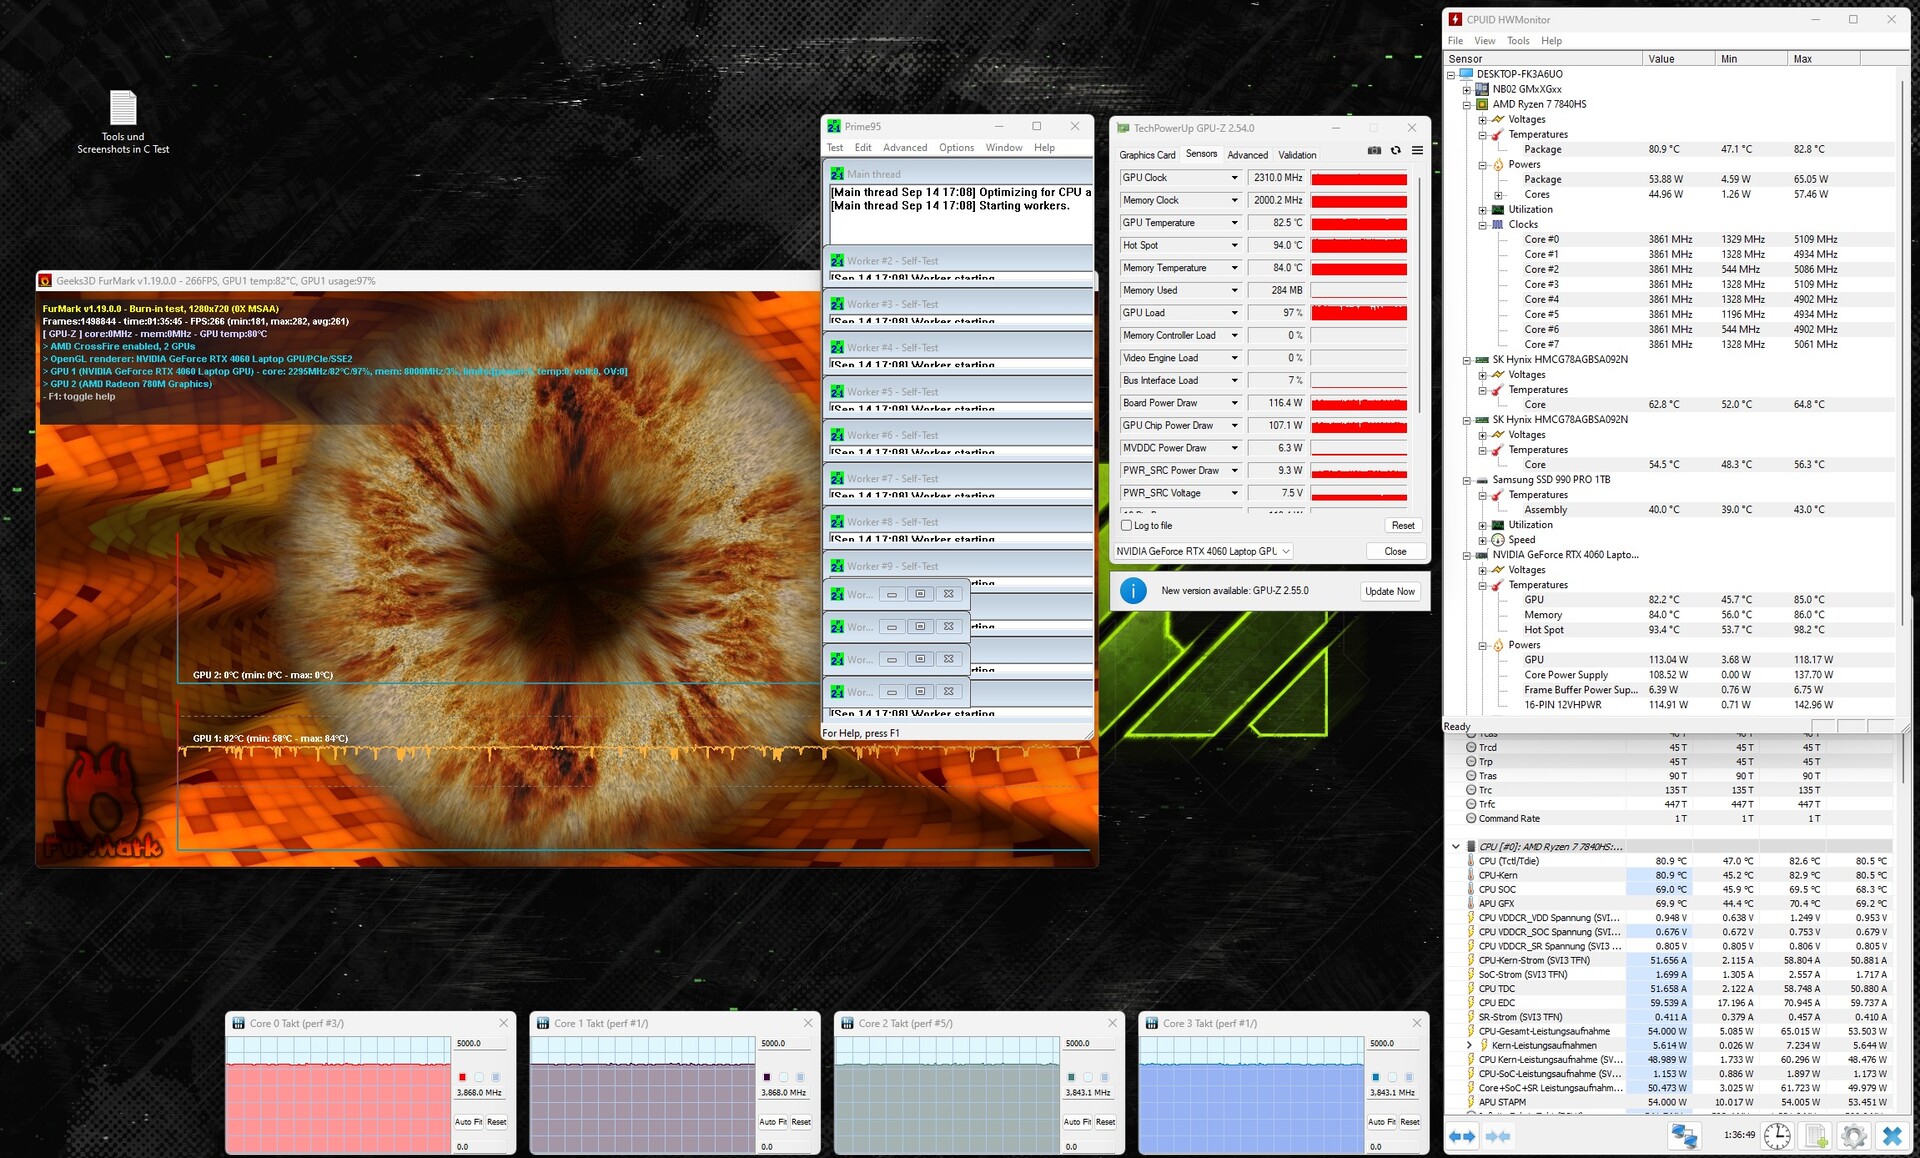
Stres testi
Stres testi (sürekli çalışmada Prime95 ve Furmark), sistemin tam yük altındaki kararlılığını kontrol etmemizi sağlayan aşırı bir senaryoyu temsil etmektedir. CPU test boyunca 3,8 ila 3,9 GHz saat hızlarında çalışmış ve grafik çekirdekleri 2,2 ila 2,4 GHz arasında çalışmıştır.
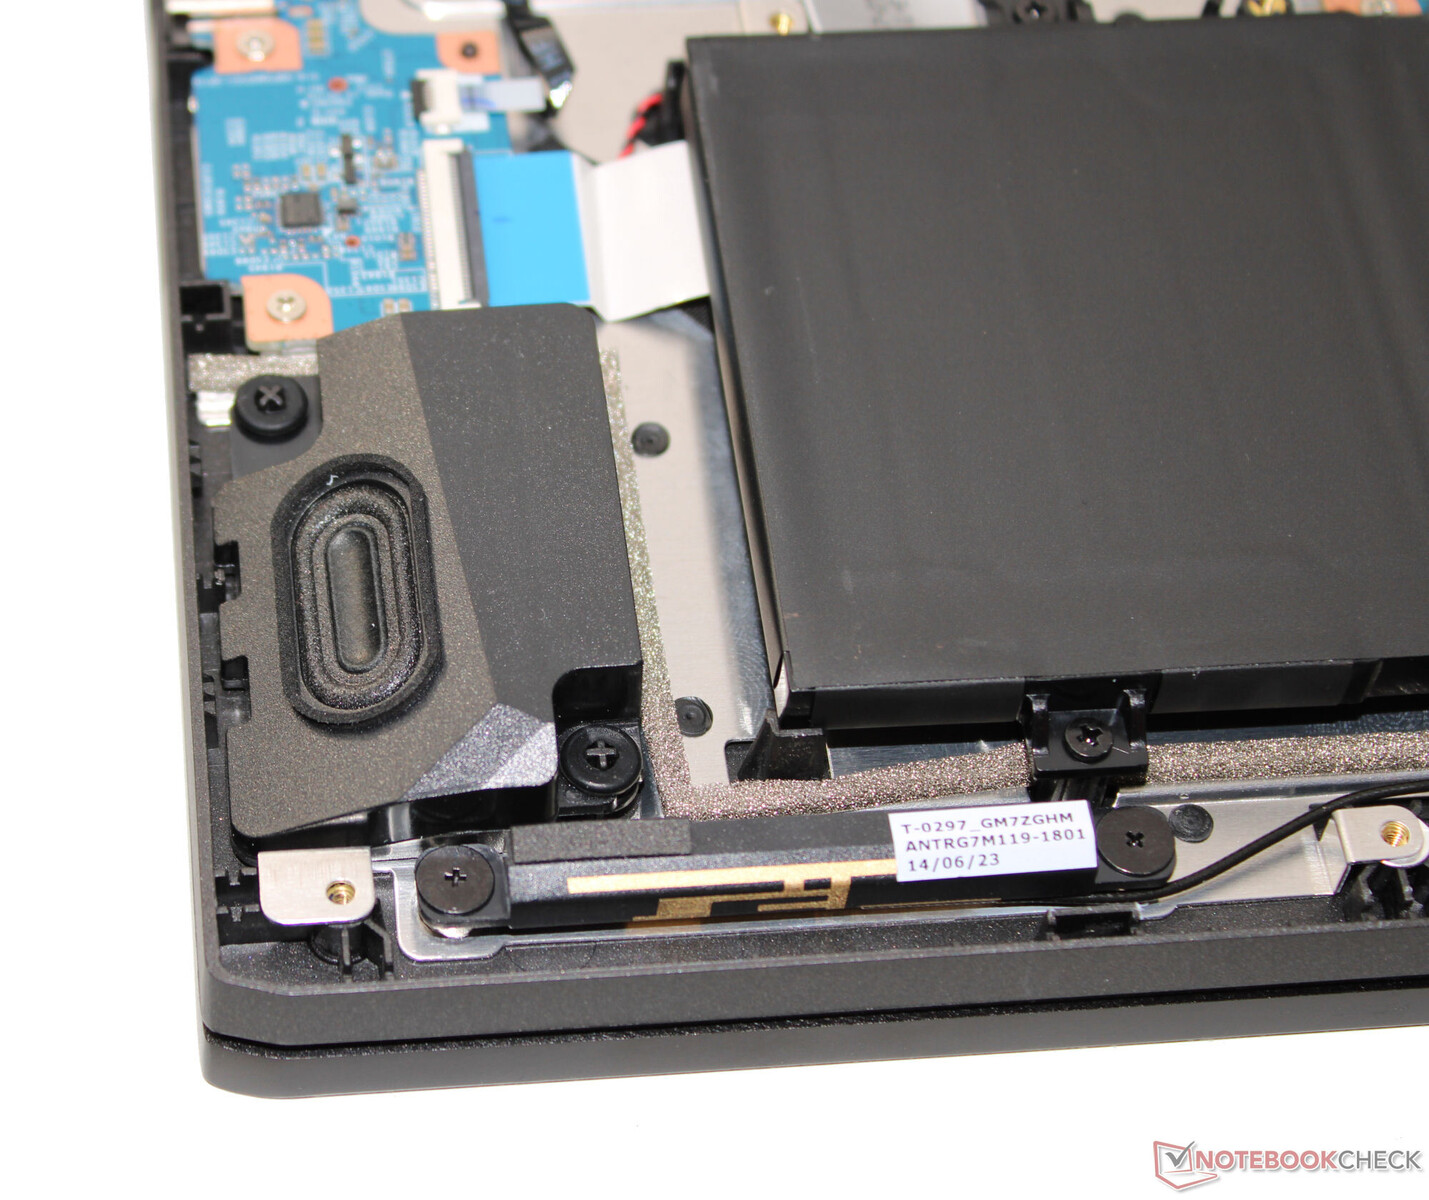
Konuşmacılar
Stereo hoparlörler iyi ses üretir ancak bas sesleri yetersizdir. Daha iyi bir ses deneyimi için kulaklık veya harici hoparlör kullanmanızı öneririz.
Schenker XMG Apex 17 (Late 23) ses analizi
(±) | hoparlör ses yüksekliği ortalama ama iyi (80 dB)
Bas 100 - 315Hz
(-) | neredeyse hiç bas yok - ortalama olarak medyandan 29% daha düşük
(±) | Bas doğrusallığı ortalamadır (10.4% delta - önceki frekans)
Ortalar 400 - 2000 Hz
(+) | dengeli ortalar - medyandan yalnızca 2.7% uzakta
(+) | orta frekanslar doğrusaldır (4.7% deltadan önceki frekansa)
Yüksekler 2 - 16 kHz
(+) | dengeli yüksekler - medyandan yalnızca 2.1% uzakta
(+) | yüksekler doğrusaldır (4.9% deltadan önceki frekansa)
Toplam 100 - 16.000 Hz
(±) | Genel sesin doğrusallığı ortalamadır (18.3% ortancaya göre fark)
Aynı sınıfla karşılaştırıldığında
» Bu sınıftaki tüm test edilen cihazların %58%'si daha iyi, 9% benzer, 33% daha kötüydü
» En iyisinin deltası 6% idi, ortalama 18% idi, en kötüsü 132% idi
Test edilen tüm cihazlarla karşılaştırıldığında
» Test edilen tüm cihazların %40'si daha iyi, 8 benzer, % 52 daha kötüydü
» En iyisinin deltası 4% idi, ortalama 23% idi, en kötüsü 134% idi
Alienware m16 R1 Intel ses analizi
(+) | hoparlörler nispeten yüksek sesle çalabilir (87 dB)
Bas 100 - 315Hz
(-) | neredeyse hiç bas yok - ortalama olarak medyandan 24% daha düşük
(±) | Bas doğrusallığı ortalamadır (13.5% delta - önceki frekans)
Ortalar 400 - 2000 Hz
(+) | dengeli ortalar - medyandan yalnızca 1.4% uzakta
(+) | orta frekanslar doğrusaldır (3.3% deltadan önceki frekansa)
Yüksekler 2 - 16 kHz
(+) | dengeli yüksekler - medyandan yalnızca 3.5% uzakta
(+) | yüksekler doğrusaldır (4.6% deltadan önceki frekansa)
Toplam 100 - 16.000 Hz
(+) | genel ses doğrusaldır (13.4% ortancaya göre fark)
Aynı sınıfla karşılaştırıldığında
» Bu sınıftaki tüm test edilen cihazların %19%'si daha iyi, 7% benzer, 74% daha kötüydü
» En iyisinin deltası 6% idi, ortalama 18% idi, en kötüsü 132% idi
Test edilen tüm cihazlarla karşılaştırıldığında
» Test edilen tüm cihazların %14'si daha iyi, 4 benzer, % 82 daha kötüydü
» En iyisinin deltası 4% idi, ortalama 23% idi, en kötüsü 134% idi
Enerji yönetimi - Schenker XMG iyi bir pil ömrü sunar
Güç tüketimi
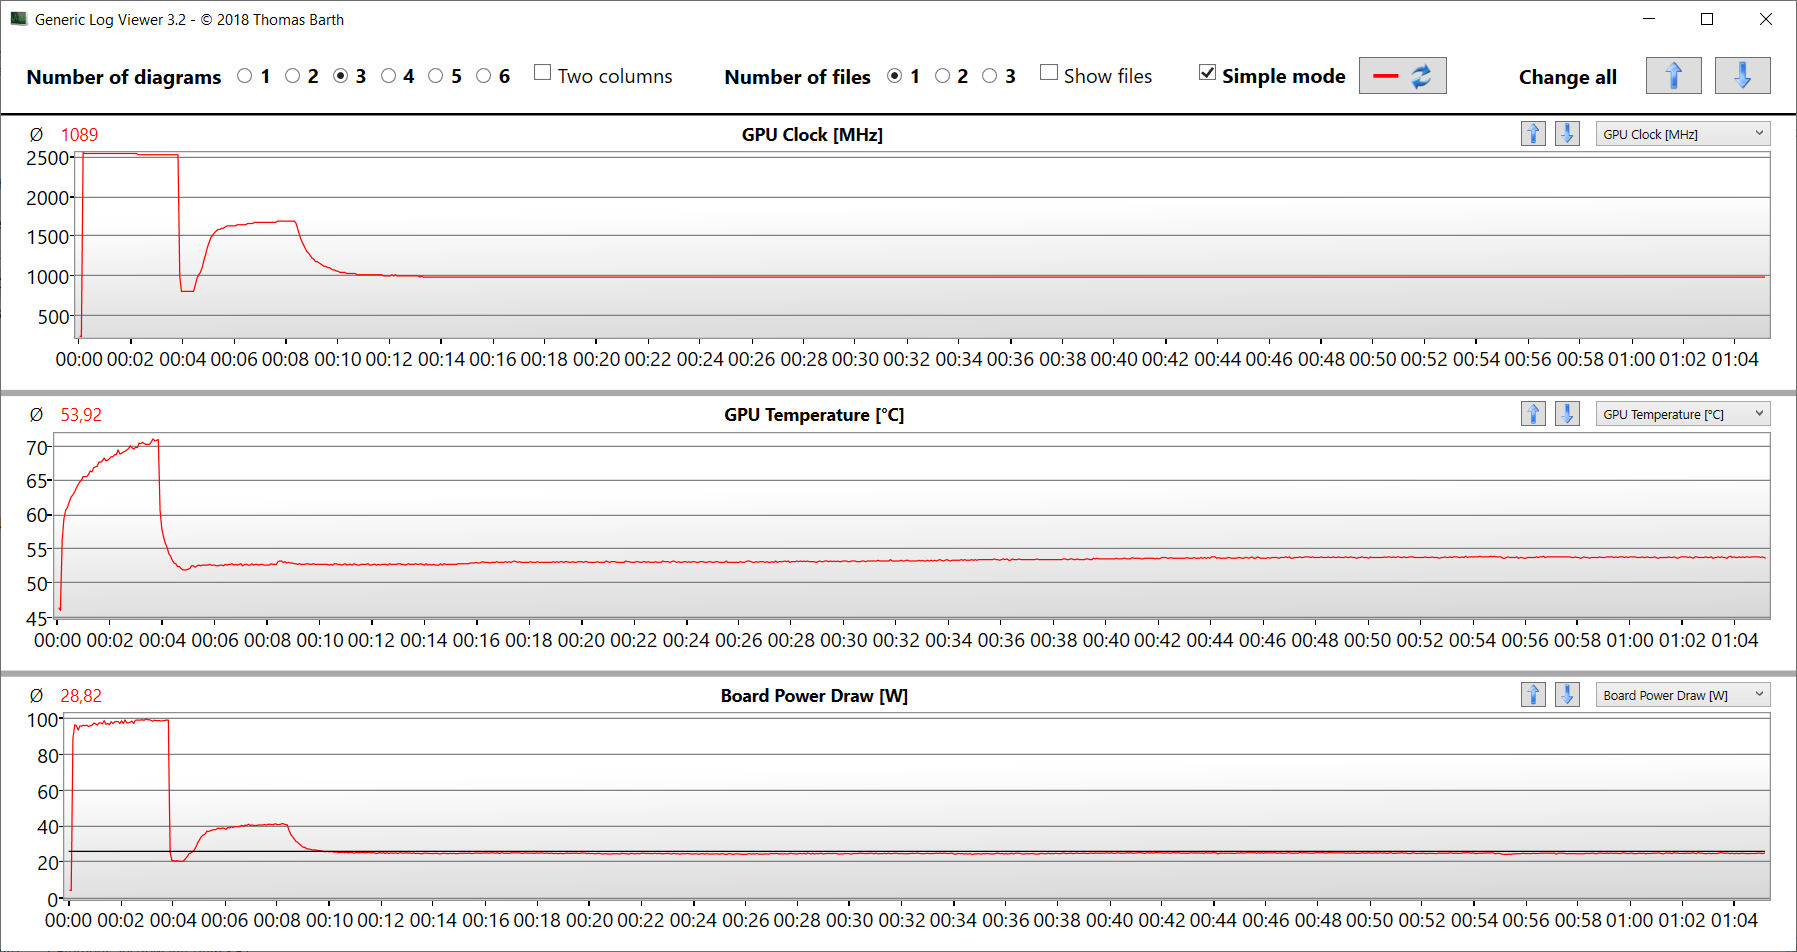
Övgüye değer: Apex 17, karşılaştırıldığı cihazlar arasında en ekonomik dizüstü bilgisayar. Sonuç olarak, rakiplerin çok daha fazla güç gereksinimleri var. Stres testi ve Witcher 3 tutarlı güç tüketimiyle çalıştı. PSU (230 watt) uygun büyüklükte.
| Kapalı / Bekleme modu | |
| Boşta | |
| Çalışırken |
|
Key:
min: | |
| Schenker XMG Apex 17 (Late 23) R7 7840HS, GeForce RTX 4060 Laptop GPU | Alienware m16 R1 Intel i7-13700HX, GeForce RTX 4060 Laptop GPU | Lenovo Legion Pro 5 16IRX8 i7-13700HX, GeForce RTX 4060 Laptop GPU | Acer Nitro 17 AN17-51-71ER i7-13700H, GeForce RTX 4060 Laptop GPU | Medion Erazer Defender P40 i7-13700HX, GeForce RTX 4060 Laptop GPU | MSI Katana 17 B13VFK i7-13620H, GeForce RTX 4060 Laptop GPU | Ortalama NVIDIA GeForce RTX 4060 Laptop GPU | Sınıf ortalaması Gaming | |
|---|---|---|---|---|---|---|---|---|
| Power Consumption | -38% | -90% | -8% | -20% | -16% | -28% | -52% | |
| Idle Minimum * (Watt) | 9 | 10 -11% | 24.5 -172% | 8.3 8% | 8 11% | 12.2 -36% | 11.5 ? -28% | 13 ? -44% |
| Idle Average * (Watt) | 12 | 14 -17% | 29.2 -143% | 13.5 -13% | 12 -0% | 14.9 -24% | 16 ? -33% | 19 ? -58% |
| Idle Maximum * (Watt) | 14 | 21 -50% | 34.3 -145% | 14.8 -6% | 18 -29% | 15.8 -13% | 20.3 ? -45% | 24.6 ? -76% |
| Load Average * (Watt) | 67 | 119 -78% | 98.7 -47% | 77 -15% | 101 -51% | 85.22 -27% | 92.9 ? -39% | 110.7 ? -65% |
| Witcher 3 ultra * (Watt) | 147.6 | 186.7 -26% | 178.6 -21% | 154 -4% | 180.8 -22% | 151.1 -2% | ||
| Load Maximum * (Watt) | 223 | 323 -45% | 249.6 -12% | 263 -18% | 284 -27% | 212.8 5% | 210 ? 6% | 259 ? -16% |
* ... daha küçük daha iyidir
Power consumption Witcher 3 / stress test
Power consumption with an external monitor
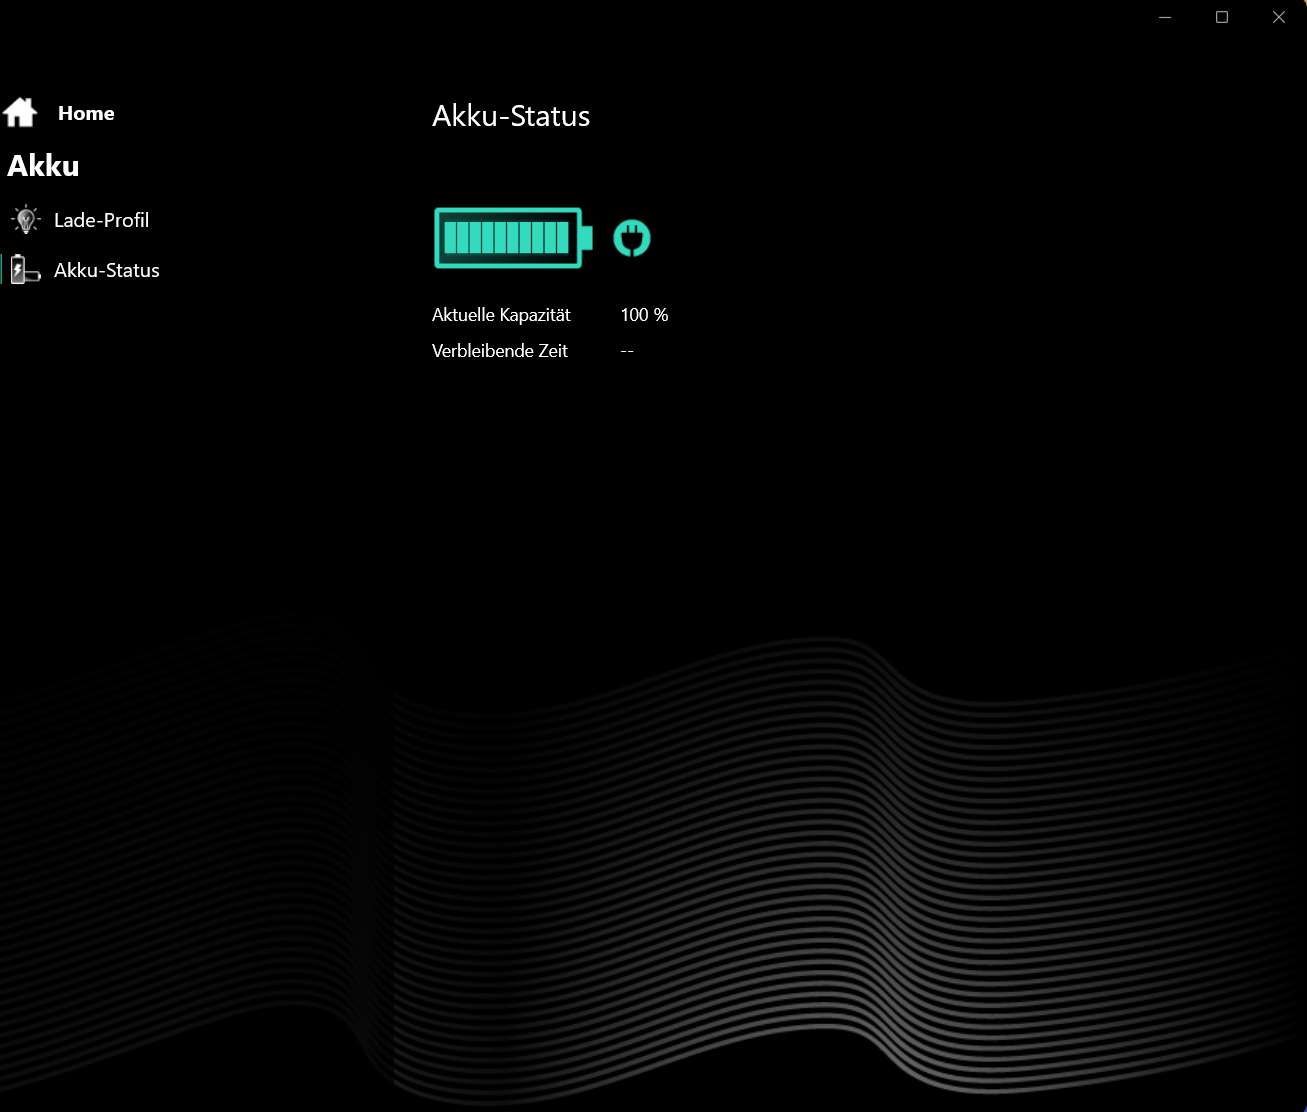
Pil ömrü
Wi-Fi testinde (web sitelerini yüklemek için bir komut dosyası kullanarak) ve video testinde (Big Buck Bunny kısa filmi (H.264 kodlama, FHD), 17,3 inçlik cihaz sırasıyla 5,06 ve 6,51 saatlik çalışma sürelerine ulaştı. Testler sırasında dizüstü bilgisayarın enerji tasarrufu işlevleri devre dışı bırakıldı ve ekran parlaklığı yaklaşık 150 cd/m²'ye ayarlandı. Ayrıca, video testi radyo modülleri kapalıyken gerçekleştirilmiştir.
Apex nispeten düşük bir pil kapasitesine sahip olmasına rağmen, oldukça saygın çalışma sürelerini başarıyor. Bilgisayar, daha büyük bataryalı rakiplerinden bazılarını geride bırakıyor.
| Schenker XMG Apex 17 (Late 23) R7 7840HS, GeForce RTX 4060 Laptop GPU, 62.32 Wh | Alienware m16 R1 Intel i7-13700HX, GeForce RTX 4060 Laptop GPU, 86 Wh | Lenovo Legion Pro 5 16IRX8 i7-13700HX, GeForce RTX 4060 Laptop GPU, 80 Wh | Acer Nitro 17 AN17-51-71ER i7-13700H, GeForce RTX 4060 Laptop GPU, 90 Wh | Medion Erazer Defender P40 i7-13700HX, GeForce RTX 4060 Laptop GPU, 73 Wh | MSI Katana 17 B13VFK i7-13620H, GeForce RTX 4060 Laptop GPU, 53.5 Wh | Sınıf ortalaması Gaming | |
|---|---|---|---|---|---|---|---|
| Pil Çalışma Süresi | -20% | -34% | 31% | -0% | -40% | 15% | |
| Reader / Idle (h) | 7.8 | 6.4 -18% | 6.7 -14% | 8.8 13% | 8.27 ? 6% | ||
| H.264 (h) | 6.9 | 5.6 -19% | 6.9 0% | 5.7 -17% | 8.32 ? 21% | ||
| WiFi v1.3 (h) | 5.1 | 4.8 -6% | 3.4 -33% | 8.2 61% | 6.2 22% | 2.9 -43% | 7.11 ? 39% |
| Load (h) | 1.6 | 1 -37% | 0.7 -56% | 1.3 -19% | 1 -37% | 1.502 ? -6% | |
| Witcher 3 ultra (h) | 2.5 |
Artılar
Eksiler
Karar - Mütevazı, orta sınıf bir oyun makinesi
Das Apex 17 amaçlanan görevleri (QHD oyun, render, video düzenleme) zorlanmadan yerine getiriyor - TheRyzen 7 7840HSve GeForce RTX 4060 mümkün kılmaktadır. Her iki yonga da sürekli olarak yüksek saat hızlarında çalışabilir.
Schenker, XMG Apex 17 (geç 23) ile çok yönlü, orta sınıf, QHD bir dizüstü bilgisayar sunmuştur.
Bilgisayar günlük kullanımda fazla gürültü üretmiyor, ancak oyun oynarken uygun profili seçerek performans ve gürültü arasında bir uzlaşma sağlamak mümkün. Pil kapasitesine göre ölçüldüğünde 5 ila 7 saatlik bir gerçek hayat pil çalışma süresi mükemmel kabul edilebilir. Pil, USB-C bağlantı noktası (USB 3.2 Gen 2) üzerinden şarj edilemez.
Dizüstü bilgisayar iki PCIe 4 SSD (M.2 2280) için alan sunar. RAID 0/1 desteklenmektedir. Schenker çevrimiçi mağazası, tercih ettiğiniz SSD'yi veya SSD'leri seçmenize olanak tanır. İnceleme cihazı, son derece hızlı bir PCIe 4 SSD (1 TB) ile donatılmıştır. Genel olarak, kurulu QHD ekran (17,3 inç, 2.560 x 1.440 piksel, sRGB, IPS, 240 Hz) iyi bir izlenim bıraktı. Alternatif olarak daha ucuz bir FHD panel de mevcut.
BuMedion Erazer Defender P40 karşılaştırılabilir performans ve özelliklere sahip bir alternatif olacaktır. Apex'in aksine P40'ın üzerinde Thunderbolt 4 bağlantı noktası bulunuyor.
Notebookcheck.com yakında Ryzen 7 7840HS ve GeForce RTX 4050 içeren 15,6 inçlik kardeş model XMG Apex 15'in (geç 23) bir incelemesini yayınlayacak.
Fiyat ve bulunabilirlik
İnceleme cihazımıza benzer bir varyant (32 GB RAM yerine 16) Notebooksbilliger.de'de 1.739 Euro'ya mevcuttur. Ayrıca GeForce RTX 4050 ile 1.399 Euro'ya daha ucuz, giriş seviyesi bir model sunuyorlar. Alternatif olarak, Schenker çevrimiçi mağazasında kendi cihazınızı özel olarak yapılandırmanız da mümkün.
Schenker XMG Apex 17 (Late 23)
- 10/04/2023 v7 (old)
Sascha Mölck
Şeffaflık
İncelenecek cihazların seçimi editör ekibimiz tarafından yapılır. Test örneği, bu incelemenin amacı doğrultusunda üretici veya perakendeci tarafından yazara ödünç olarak sağlanmıştır. Borç verenin bu inceleme üzerinde herhangi bir etkisi olmadığı gibi, üretici de yayınlanmadan önce bu incelemenin bir kopyasını almamıştır. Bu incelemeyi yayınlama zorunluluğu yoktu. Bağımsız bir medya şirketi olarak Notebookcheck, üreticilerin, perakendecilerin veya yayıncıların otoritesine tabi değildir.
Notebookcheck bu şekilde test yapıyor
Notebookcheck, tüm sonuçların karşılaştırılabilir olmasını sağlamak için her yıl yüzlerce dizüstü bilgisayarı ve akıllı telefonu standart prosedürler kullanarak bağımsız olarak inceliyor. Yaklaşık 20 yıldır test yöntemlerimizi sürekli olarak geliştirdik ve bu süreçte endüstri standartlarını belirledik. Test laboratuvarlarımızda deneyimli teknisyenler ve editörler tarafından yüksek kaliteli ölçüm ekipmanları kullanılmaktadır. Bu testler çok aşamalı bir doğrulama sürecini içerir. Karmaşık derecelendirme sistemimiz, nesnelliği koruyan yüzlerce sağlam temellere dayanan ölçüm ve kıyaslamaya dayanmaktadır.Price comparison