 Deutsch
 English
 Español
 Français
 Italiano
 Nederlands
 Polski
 Português
 Русский
 Türkçe
 Svenska
 Chinese
 Magyar
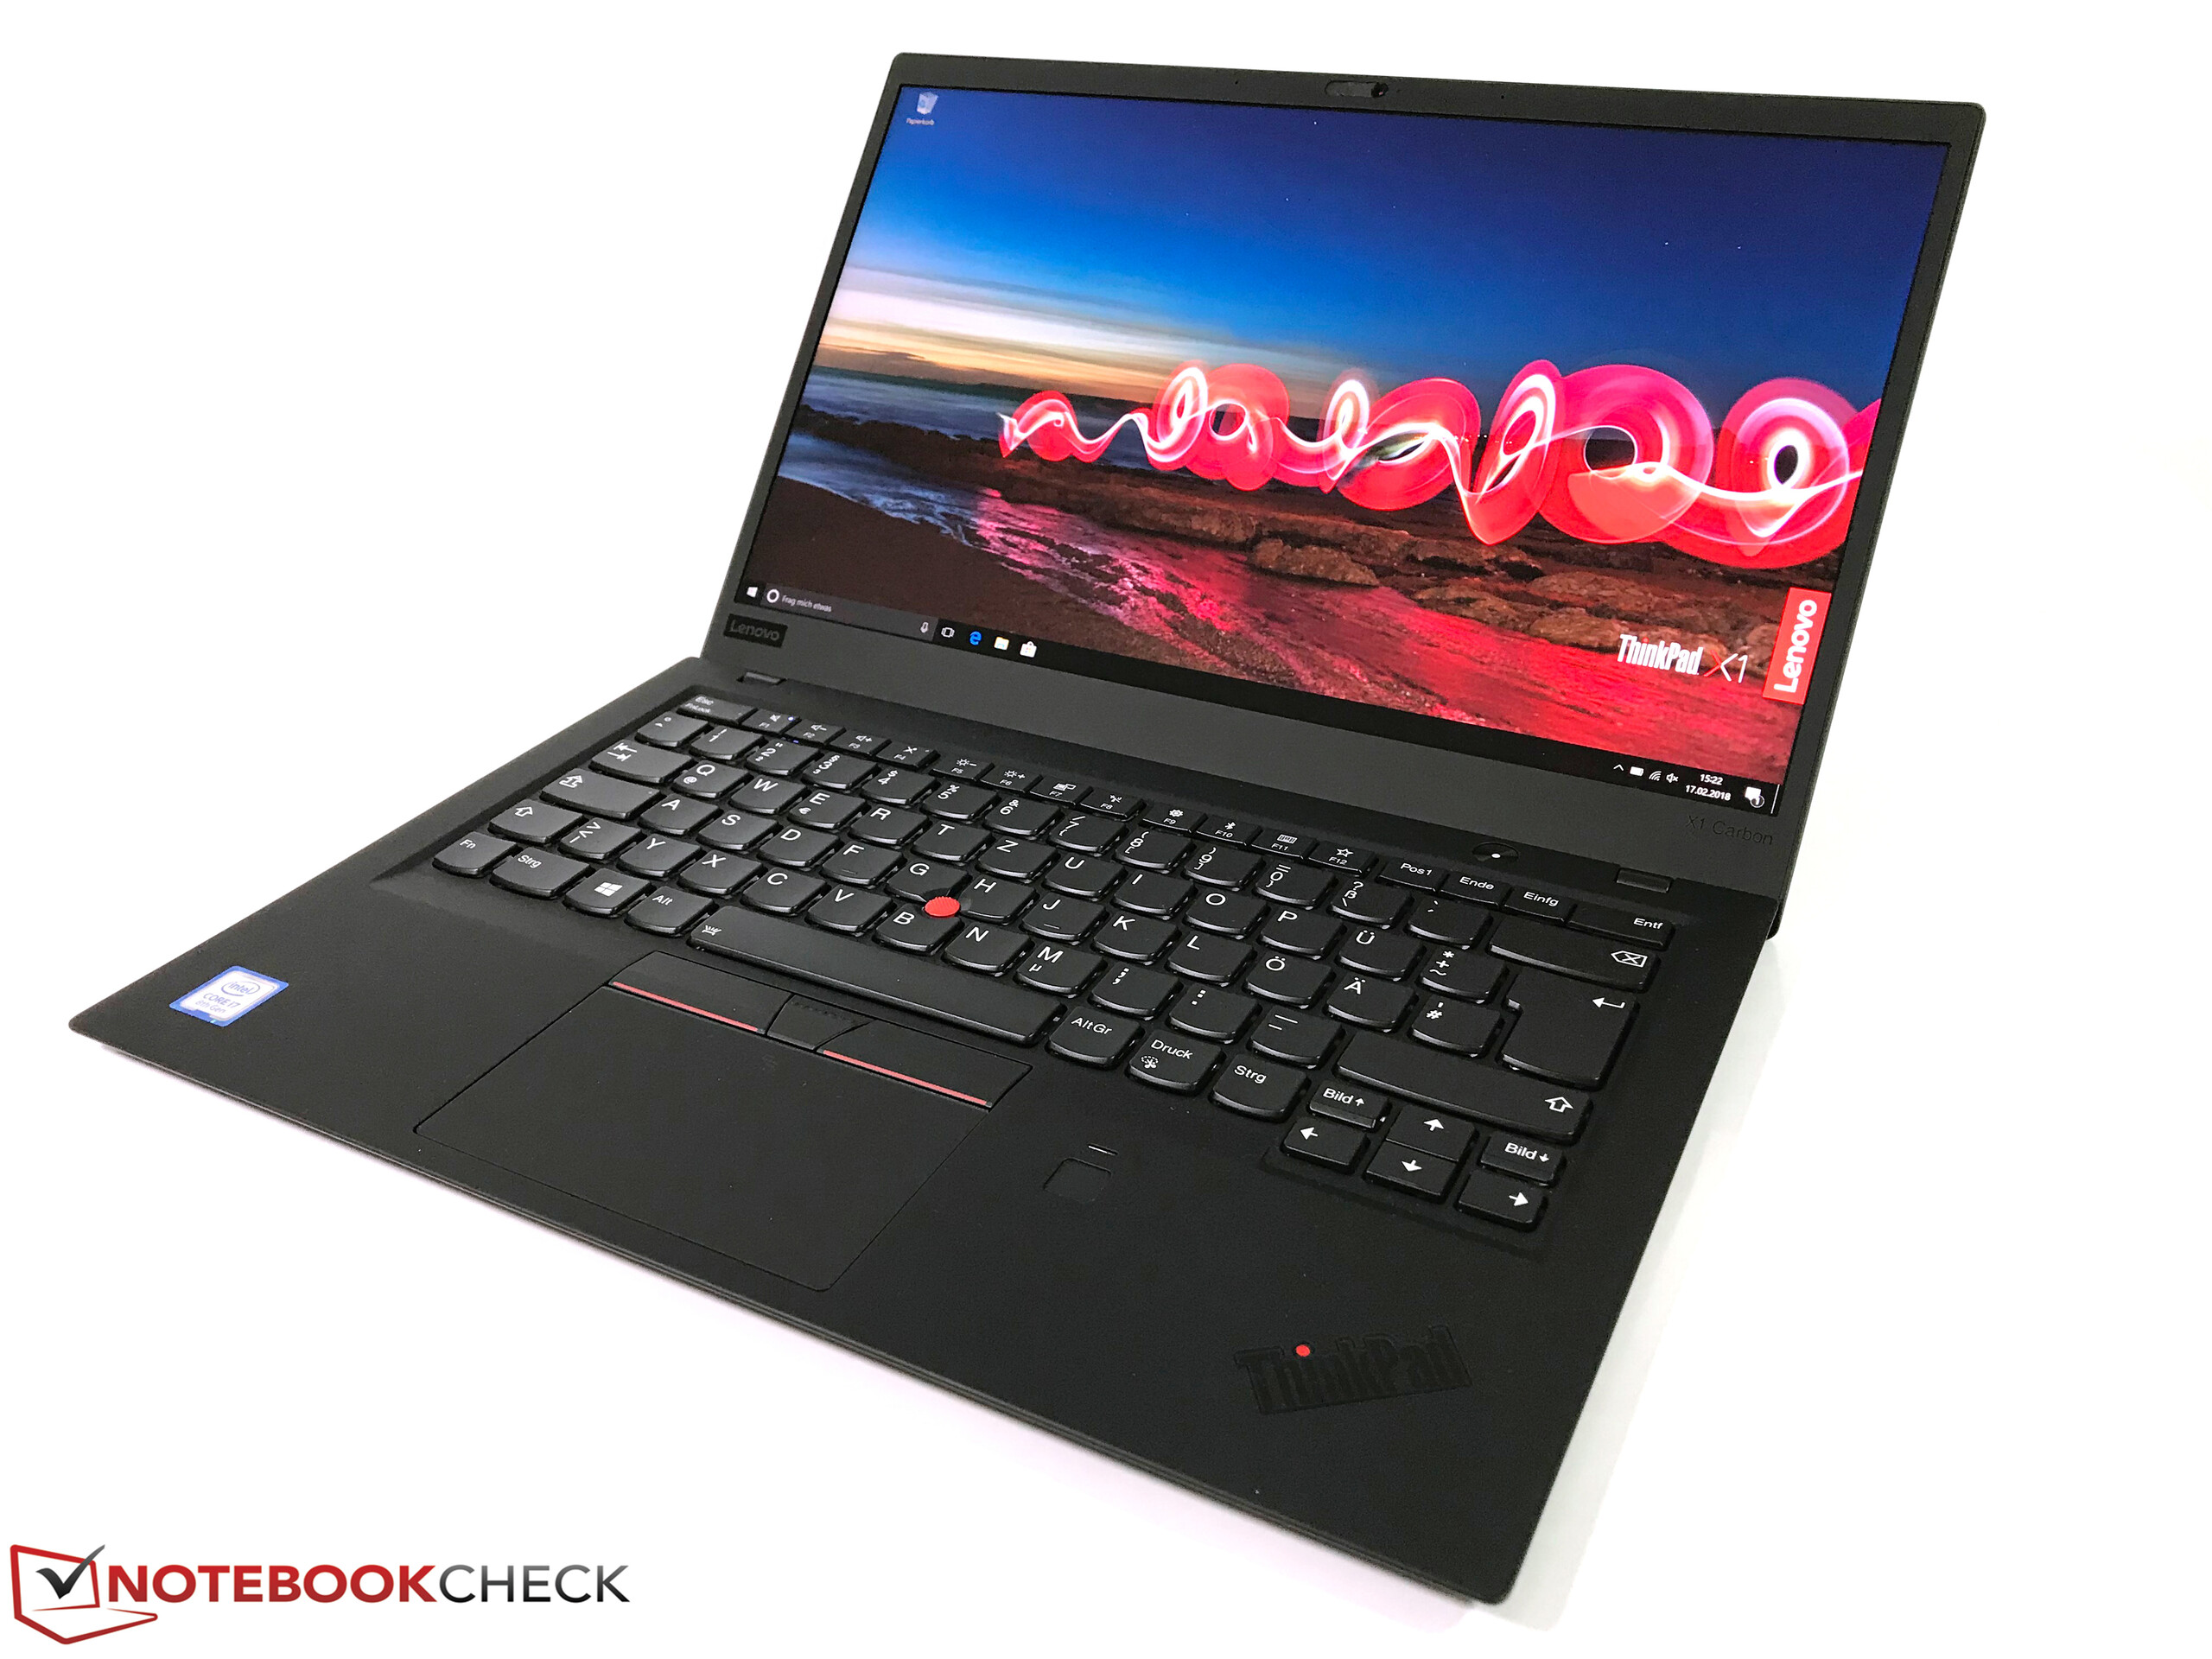
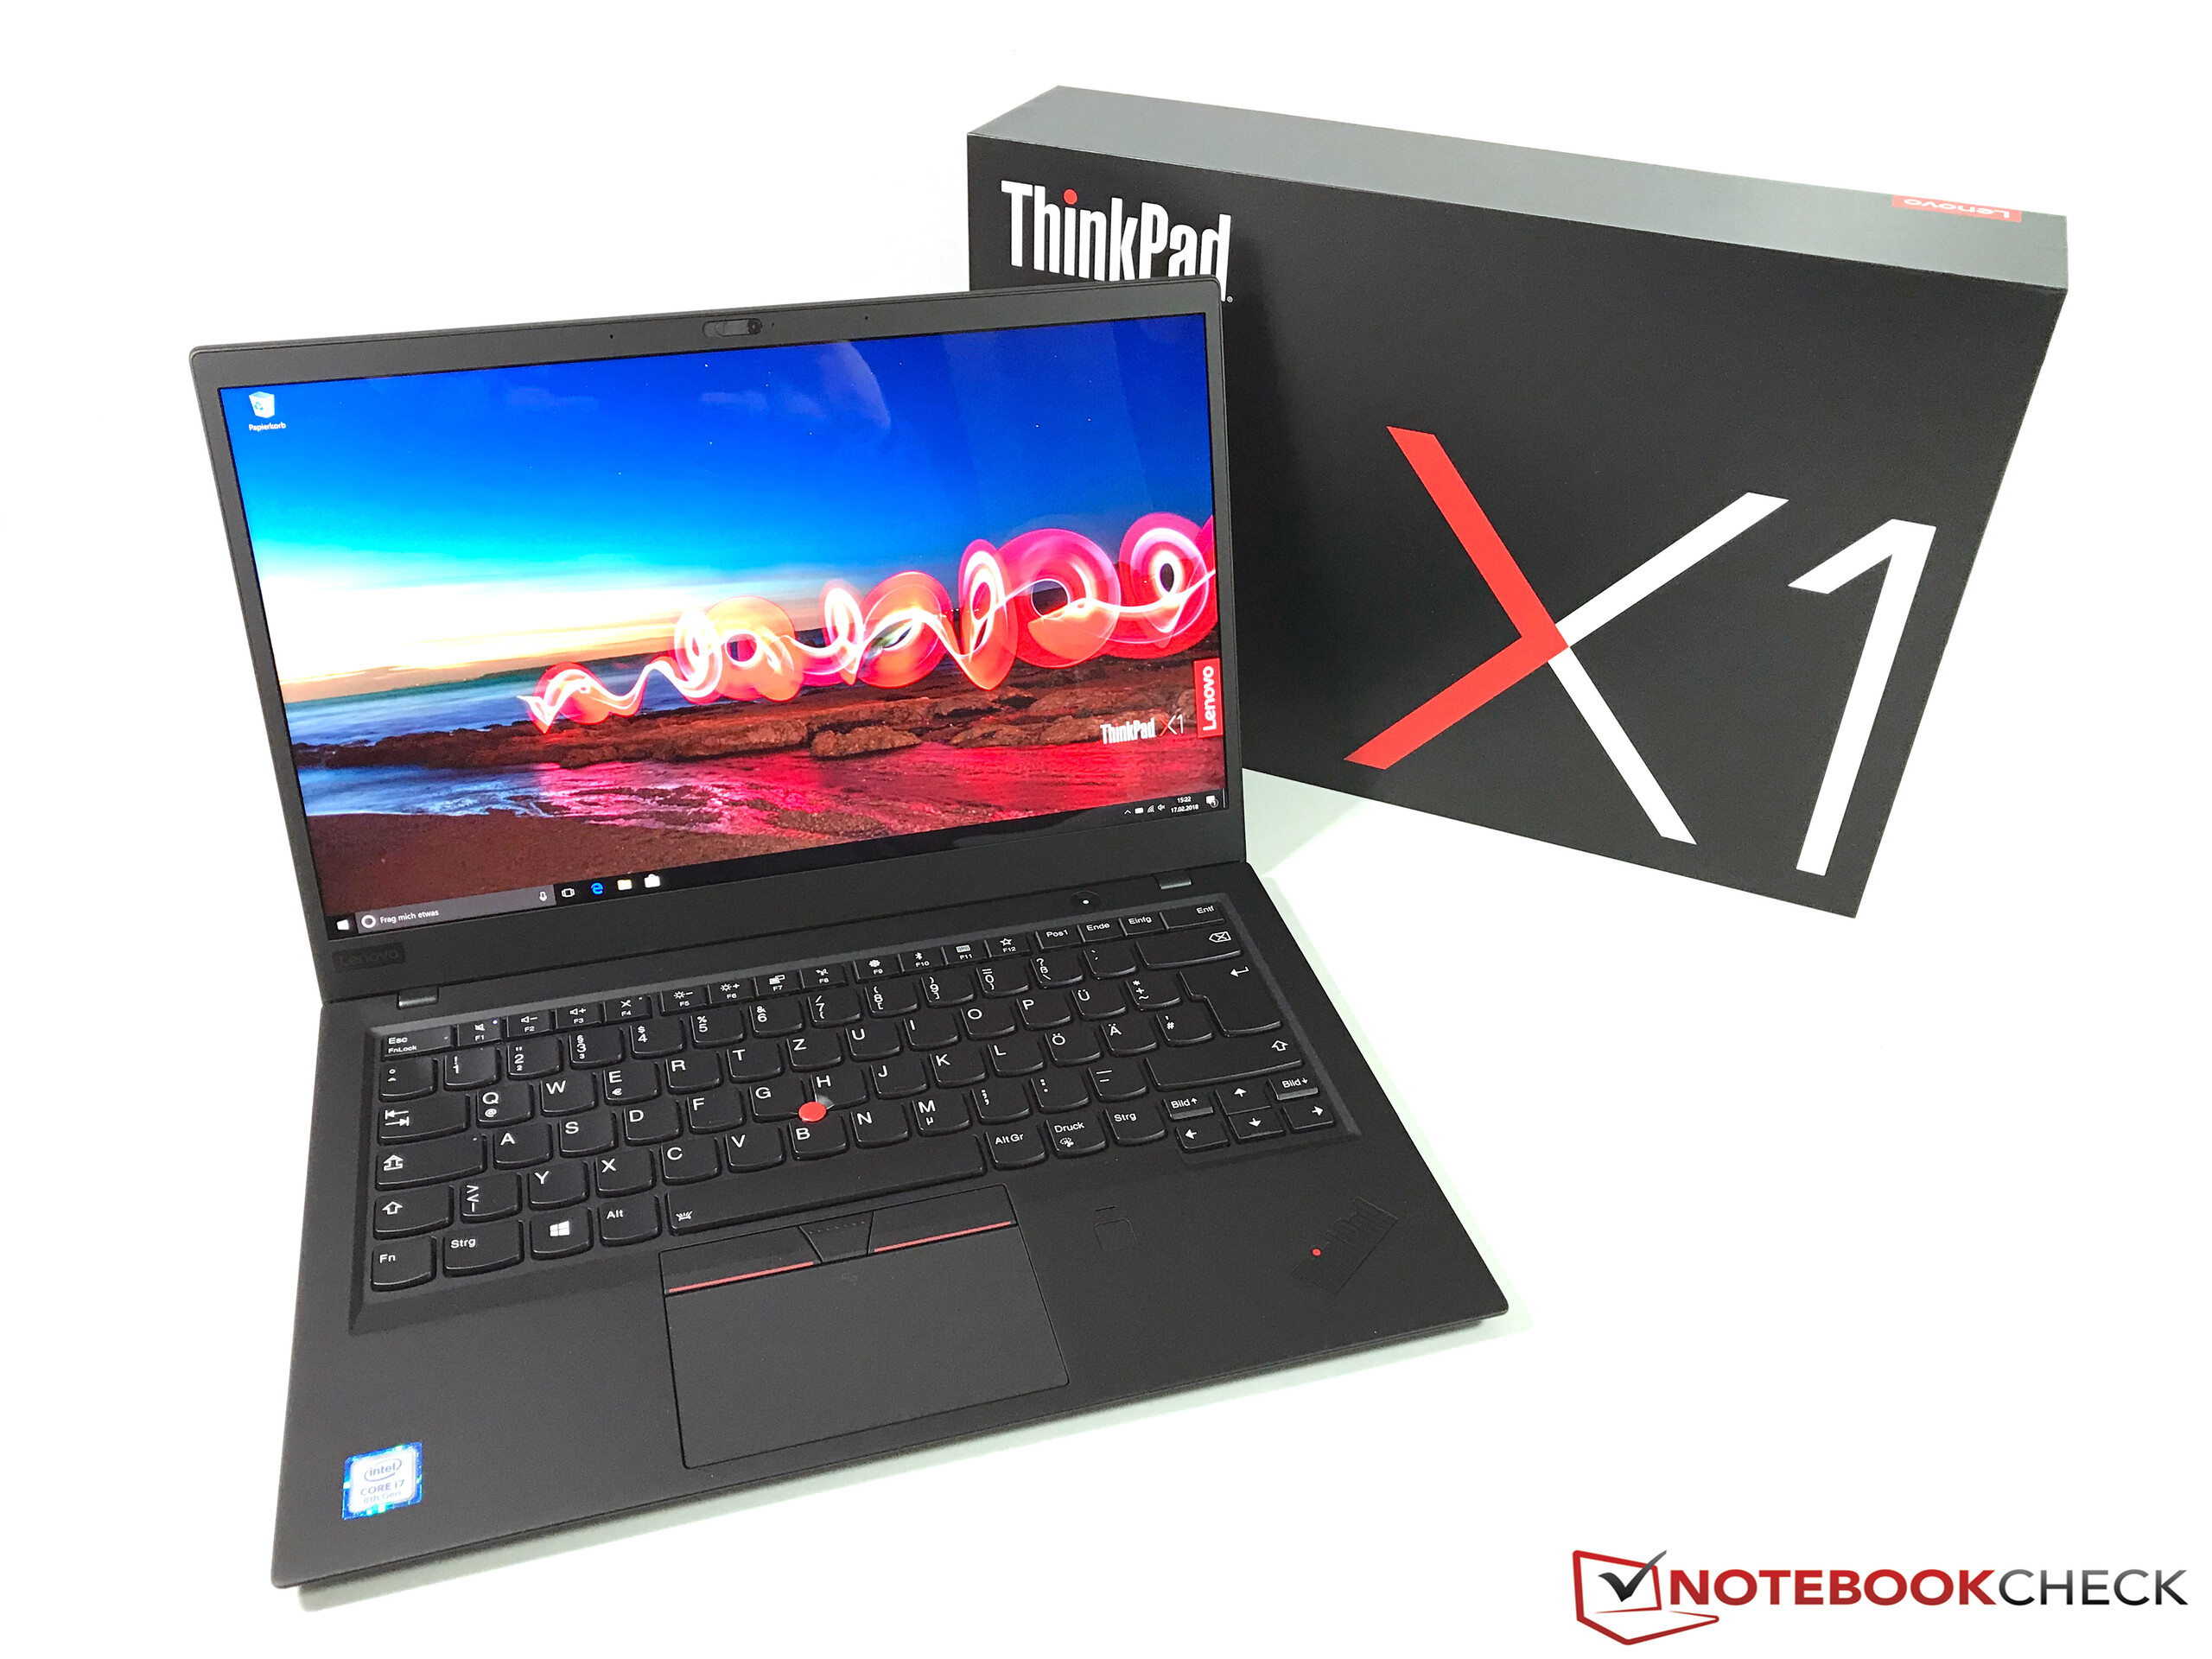
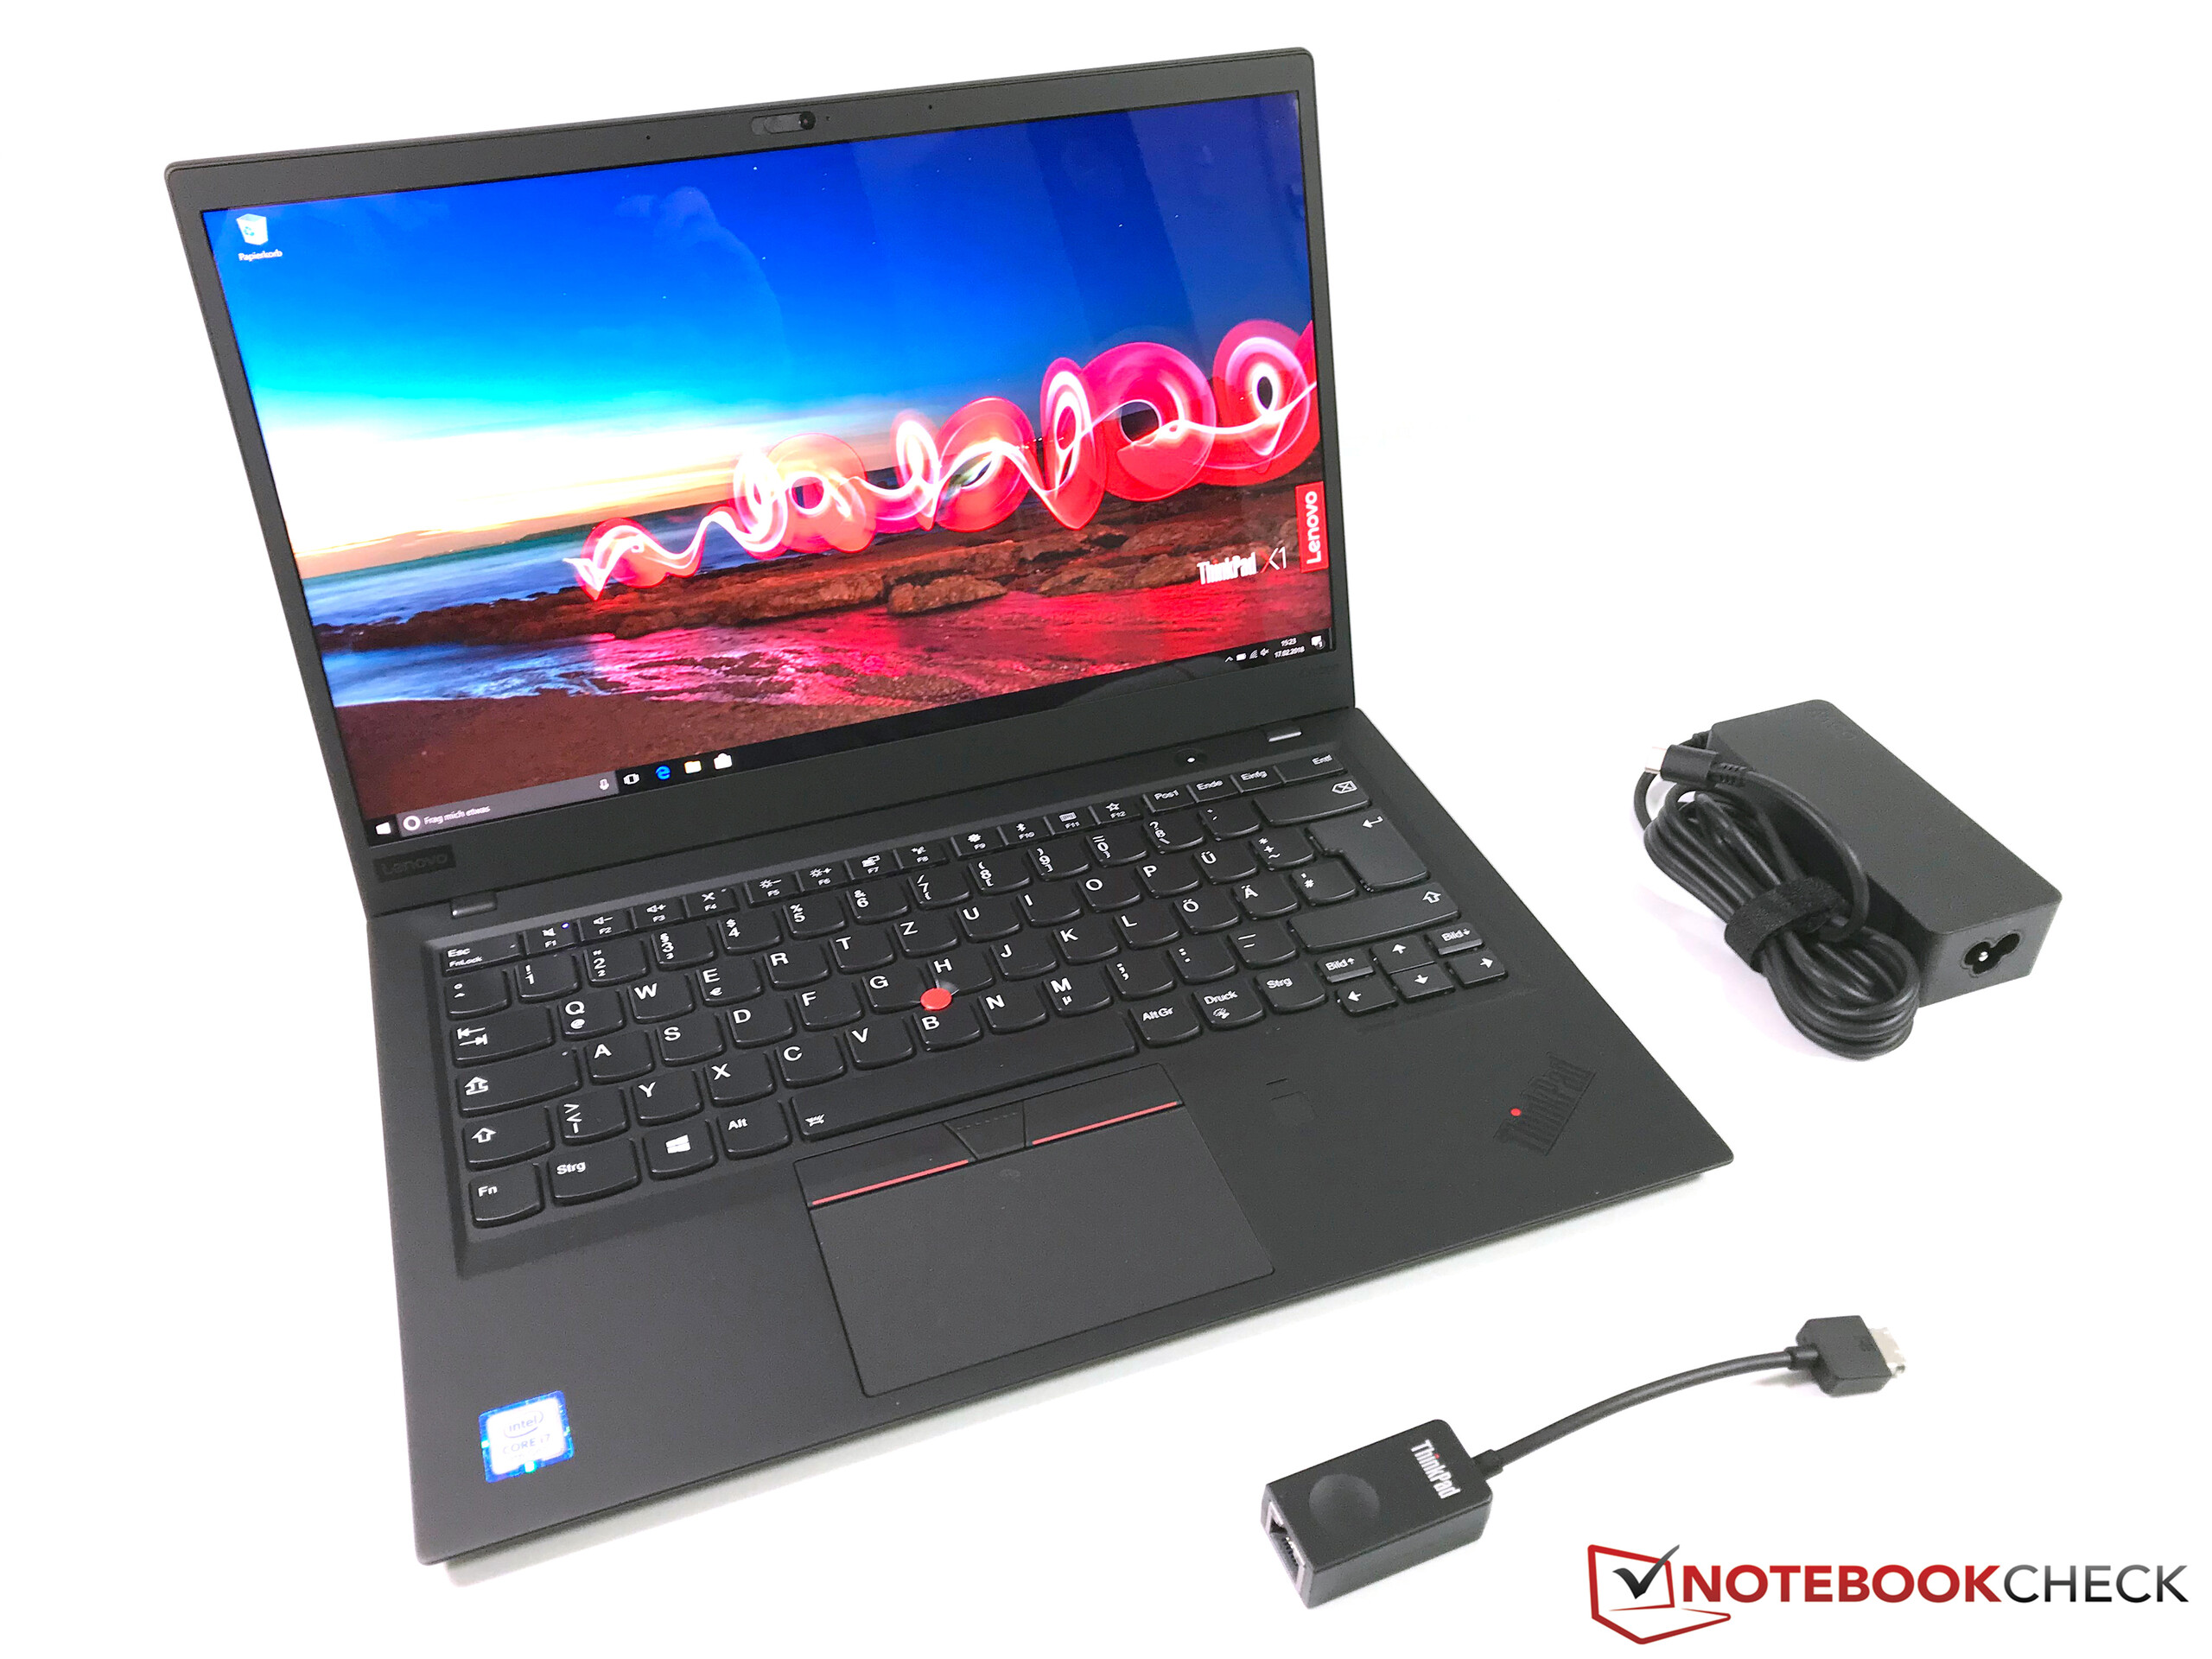
Kısa inceleme: Lenovo ThinkPad X1 Carbon 2018 (WQHD HDR, i7) Laptop
| SD Card Reader | |
| average JPG Copy Test (av. of 3 runs) | |
| Lenovo ThinkPad X1 Carbon 2018-20KGS03900 (Toshiba Exceria Pro M501) | |
| Lenovo ThinkPad T480s-20L8S02D00 (Toshiba Exceria Pro SDXC 64 GB UHS-II) | |
| Lenovo ThinkPad X280-20KES01S00 (Toshiba Excerie Pro M501) | |
| Dell Latitude 7480 (Toshiba (Exceria Pro SDXC UHS-II 64 GB) | |
| HP EliteBook 840 G4-Z2V49ET ABD (Toshiba Exceria Pro SDXC 64 GB UHS-II) | |
| Average of class Office (8 - 82.7, n=49, last 2 years) | |
| maximum AS SSD Seq Read Test (1GB) | |
| Lenovo ThinkPad X1 Carbon 2018-20KGS03900 (Toshiba Exceria Pro M501) | |
| Dell Latitude 7480 (Toshiba (Exceria Pro SDXC UHS-II 64 GB) | |
| Lenovo ThinkPad T480s-20L8S02D00 (Toshiba Exceria Pro SDXC 64 GB UHS-II) | |
| Lenovo ThinkPad X280-20KES01S00 (Toshiba Excerie Pro M501) | |
| HP EliteBook 840 G4-Z2V49ET ABD (Toshiba Exceria Pro SDXC 64 GB UHS-II) | |
| Average of class Office (25 - 90.5, n=43, last 2 years) | |
| |||||||||||||||||||||||||
Aydınlatma: 84 %
Batarya modunda parlaklık: 579 cd/m²
Kontrast: 1521:1 (Siyah: 0.38 cd/m²)
ΔE Color 1.9 | 0.5-29.43 Ø5, calibrated: 0.8
ΔE Greyscale 3 | 0.57-98 Ø5.3
100% sRGB (Argyll 1.6.3 3D)
88.8% AdobeRGB 1998 (Argyll 1.6.3 3D)
99.9% AdobeRGB 1998 (Argyll 2.2.0 3D)
100% sRGB (Argyll 2.2.0 3D)
87.7% Display P3 (Argyll 2.2.0 3D)
Gamma: 2.14
| Lenovo ThinkPad X1 Carbon 2018-20KGS03900 B140QAN02.0, , 2560x1440, 14.00 | Lenovo ThinkPad X1 Carbon 2017-20HR006FGE LEN40AA (LP140QH2-SPB1), , 2560x1440, 14.00 | Lenovo ThinkPad X1 Carbon 2017-20HQS03P00 B140HAN03_1, , 1920x1080, 14.00 | HP EliteBook 840 G4-Z2V49ET ABD AUO123D, , 1920x1080, 14.00 | Dell Latitude 13 7380 LGD0589, , 1920x1080, 13.30 | Apple MacBook Pro 13 2017 Touchbar i5 APPA034, , 2560x1600, 13.30 | Dell Latitude 7480 LG Philips LGD0557, , 1920x1080, 14.00 | Fujitsu LifeBook U747 LG LP140WF3, , 1920x1080, 14.00 | |
|---|---|---|---|---|---|---|---|---|
| Display | -14% | -27% | -32% | -22% | -0% | -22% | -26% | |
| Display P3 Coverage | 87.7 | 73.5 -16% | 61.4 -30% | 55.8 -36% | 65.5 -25% | 98.6 12% | 65.4 -25% | 66.1 -25% |
| sRGB Coverage | 100 | 98.4 -2% | 85.9 -14% | 80.7 -19% | 91.8 -8% | 100 0% | 92.3 -8% | 84.8 -15% |
| AdobeRGB 1998 Coverage | 99.9 | 74.5 -25% | 62.4 -38% | 57.7 -42% | 65.8 -34% | 86.5 -13% | 65.8 -34% | 62 -38% |
| Response Times | 38% | 19% | 34% | 29% | 11% | 20% | 36% | |
| Response Time Grey 50% / Grey 80% * | 59.2 ? | 35.6 ? 40% | 41.6 ? 30% | 39 ? 34% | 34 ? 43% | 48 ? 19% | 40.8 ? 31% | 36 ? 39% |
| Response Time Black / White * | 34.4 ? | 22.4 ? 35% | 31.6 ? 8% | 23 ? 33% | 29.6 ? 14% | 33.6 ? 2% | 31.2 ? 9% | 23.2 ? 33% |
| PWM Frequency | 119000 ? | |||||||
| Screen | -42% | -55% | -123% | -70% | 17% | -26% | -44% | |
| Brightness middle | 578 | 342 -41% | 311 -46% | 346 -40% | 317 -45% | 551 -5% | 344 -40% | 291 -50% |
| Brightness | 533 | 337 -37% | 288 -46% | 317 -41% | 295 -45% | 514 -4% | 321 -40% | 296 -44% |
| Brightness Distribution | 84 | 87 4% | 85 1% | 86 2% | 87 4% | 88 5% | 85 1% | 84 0% |
| Black Level * | 0.38 | 0.37 3% | 0.24 37% | 0.86 -126% | 0.3 21% | 0.48 -26% | 0.32 16% | 0.32 16% |
| Contrast | 1521 | 924 -39% | 1296 -15% | 402 -74% | 1057 -31% | 1148 -25% | 1075 -29% | 909 -40% |
| Colorchecker dE 2000 * | 1.9 | 3.6 -89% | 5.5 -189% | 8.64 -355% | 6.3 -232% | 0.8 58% | 2.6 -37% | 4.3 -126% |
| Colorchecker dE 2000 max. * | 3.8 | 7.7 -103% | 9 -137% | 13.58 -257% | 10.4 -174% | 1.4 63% | 7.8 -105% | 7.5 -97% |
| Colorchecker dE 2000 calibrated * | 0.8 | |||||||
| Greyscale dE 2000 * | 3 | 5.8 -93% | 6.2 -107% | 11.24 -275% | 7.8 -160% | 1 67% | 2.6 13% | 4.3 -43% |
| Gamma | 2.14 103% | 2.2 100% | 2.02 109% | 2.62 84% | 1.81 122% | 2.16 102% | 2.28 96% | 2.31 95% |
| CCT | 6377 102% | 6693 97% | 5950 109% | 12530 52% | 7120 91% | 6672 97% | 7050 92% | 6529 100% |
| Color Space (Percent of AdobeRGB 1998) | 88.8 | 68.8 -23% | 55.96 -37% | 52 -41% | 61 -31% | 65.82 -26% | 55.46 -38% | |
| Color Space (Percent of sRGB) | 100 | 98.5 -1% | 85.77 -14% | 80 -20% | 92 -8% | 92.27 -8% | 84.77 -15% | |
| Total Average (Program / Settings) | -6% /
-26% | -21% /
-40% | -40% /
-84% | -21% /
-47% | 9% /
12% | -9% /
-19% | -11% /
-30% |
* ... smaller is better
Display Response Times
| ↔ Response Time Black to White | ||
|---|---|---|
| 34.4 ms ... rise ↗ and fall ↘ combined | ↗ 16.4 ms rise | 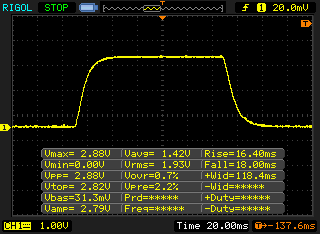 |
| ↘ 18 ms fall | ||
| The screen shows slow response rates in our tests and will be unsatisfactory for gamers. In comparison, all tested devices range from 0.1 (minimum) to 240 (maximum) ms. » 91 % of all devices are better. This means that the measured response time is worse than the average of all tested devices (21.5 ms). | ||
| ↔ Response Time 50% Grey to 80% Grey | ||
| 59.2 ms ... rise ↗ and fall ↘ combined | ↗ 28.4 ms rise | 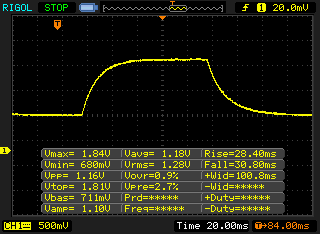 |
| ↘ 30.8 ms fall | ||
| The screen shows slow response rates in our tests and will be unsatisfactory for gamers. In comparison, all tested devices range from 0.2 (minimum) to 636 (maximum) ms. » 95 % of all devices are better. This means that the measured response time is worse than the average of all tested devices (33.7 ms). | ||
Screen Flickering / PWM (Pulse-Width Modulation)
| Screen flickering / PWM not detected | 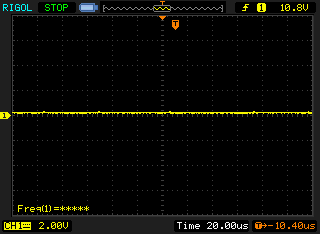 | ||
In comparison: 53 % of all tested devices do not use PWM to dim the display. If PWM was detected, an average of 17900 (minimum: 5 - maximum: 3846000) Hz was measured. | |||

Ses yüksekliği
| Boşta |
| 28.9 / 28.9 / 32.5 dB |
| Çalışırken |
| 35.1 / 35.1 dB |
 | ||
30 dB sessiz 40 dB(A) duyulabilirlik 50 dB(A) gürültülü |
||
min: | ||
(-) The maximum temperature on the upper side is 52.6 °C / 127 F, compared to the average of 34.2 °C / 94 F, ranging from 21.2 to 62.5 °C for the class Office.
(-) The bottom heats up to a maximum of 48.2 °C / 119 F, compared to the average of 36.7 °C / 98 F
(+) In idle usage, the average temperature for the upper side is 22.8 °C / 73 F, compared to the device average of 29.5 °C / 85 F.
(±) The palmrests and touchpad can get very hot to the touch with a maximum of 37.5 °C / 99.5 F.
(-) The average temperature of the palmrest area of similar devices was 27.7 °C / 81.9 F (-9.8 °C / -17.6 F).
| Kapalı / Bekleme modu | |
| Boşta | |
| Çalışırken |
|
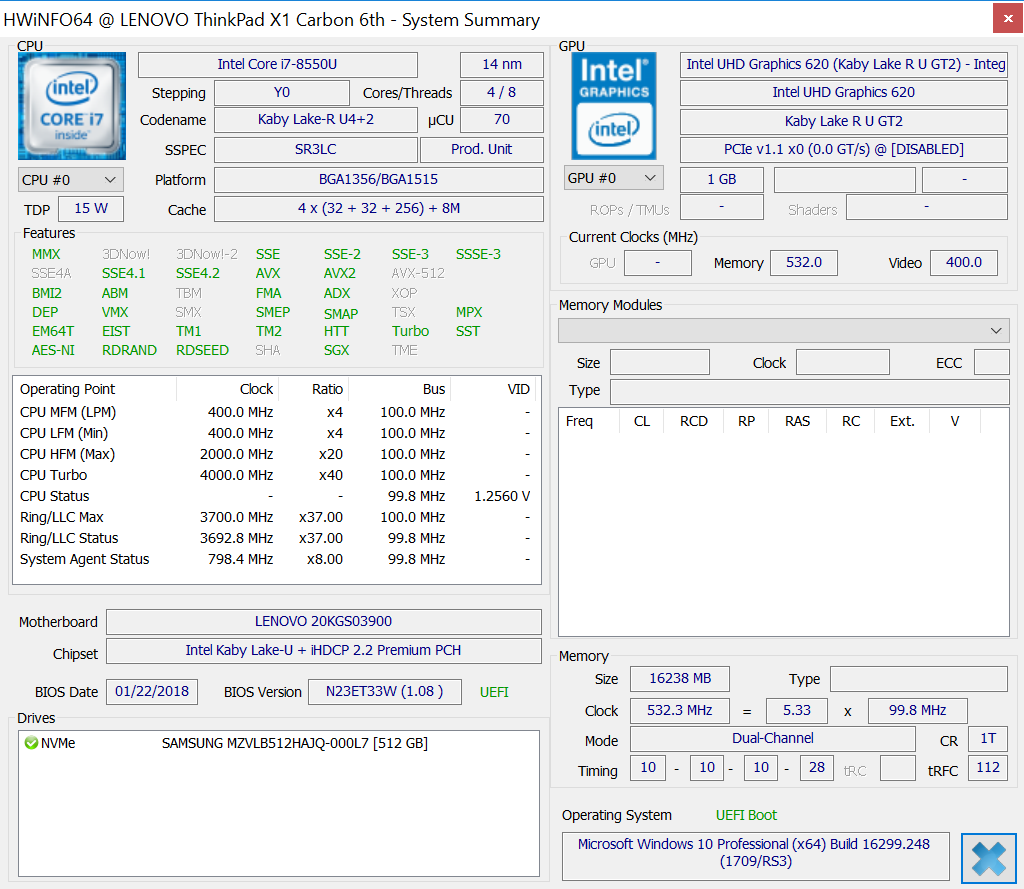
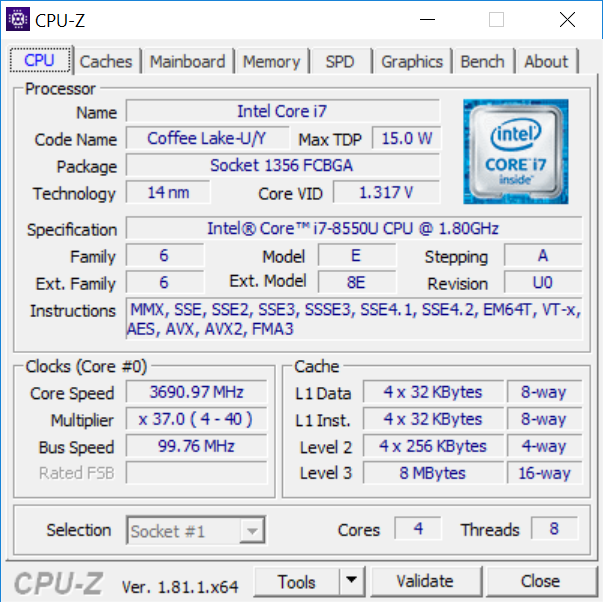
| Lenovo ThinkPad X1 Carbon 2018-20KGS03900 i5-8550U, UHD Graphics 620, Samsung SSD PM981 MZVLB512HAJQ, IPS, 2560x1440, 14.00 | HP EliteBook 840 G4-Z2V49ET ABD i5-7200U, HD Graphics 620, Samsung PM961 MZVLW256HEHP, TN, 1920x1080, 14.00 | Dell Latitude 13 7380 i7-7600U, HD Graphics 620, Samsung PM961 MZVLW256HEHP, IPS, 1920x1080, 13.30 | Apple MacBook Pro 13 2017 Touchbar i5 i5-7267U, Iris Plus Graphics 650, Apple SSD AP0256, IPS, 2560x1600, 13.30 | Dell Latitude 7480 i7-7600U, HD Graphics 620, Intel SSDSCKKF256H6, IPS, 1920x1080, 14.00 | Fujitsu LifeBook U747 i5-7200U, HD Graphics 620, Samsung MZYTY256HDHP, IPS LED, 1920x1080, 14.00 | |
|---|---|---|---|---|---|---|
| Power Consumption | 34% | 36% | -4% | 28% | 21% | |
| Idle Minimum * | 3.8 | 2.9 24% | 3.2 16% | 2.8 26% | 4.32 -14% | 4.11 -8% |
| Idle Average * | 8.9 | 5.6 37% | 5.5 38% | 10.9 -22% | 6.27 30% | 7.87 12% |
| Idle Maximum * | 11.9 | 8.15 32% | 6.1 49% | 11.4 4% | 6.35 47% | 8.74 27% |
| Load Average * | 47.5 | 30.6 36% | 29.5 38% | 55.4 -17% | 29.82 37% | 30.2 36% |
| Load Maximum * | 52.5 | 31 41% | 32 39% | 57.5 -10% | 30.64 42% | 32.4 38% |
* ... smaller is better
| Lenovo ThinkPad X1 Carbon 2018-20KGS03900 i5-8550U, UHD Graphics 620, 57 Wh | Lenovo ThinkPad X1 Carbon 2017-20HQS03P00 i7-7500U, HD Graphics 620, 57 Wh | Lenovo ThinkPad X1 Carbon 2017-20HR006FGE i5-7200U, HD Graphics 620, 57 Wh | Lenovo ThinkPad T480s-20L8S02D00 i5-8250U, UHD Graphics 620, 57 Wh | Dell Latitude 7480 i7-7600U, HD Graphics 620, 60 Wh | HP EliteBook 840 G4-Z2V49ET ABD i5-7200U, HD Graphics 620, 51 Wh | Fujitsu LifeBook U747 i5-7200U, HD Graphics 620, 50 Wh | Apple MacBook Pro 13 2017 Touchbar i5 i5-7267U, Iris Plus Graphics 650, 49.2 Wh | |
|---|---|---|---|---|---|---|---|---|
| Battery Runtime | 9% | 16% | 16% | 50% | 29% | -7% | -20% | |
| H.264 | 566 | 711 26% | 721 27% | 591 4% | 490 -13% | 415 -27% | ||
| WiFi v1.3 | 519 | 496 -4% | 604 16% | 537 3% | 719 39% | 571 10% | 430 -17% | 519 0% |
| Load | 106 | 110 4% | 124 17% | 171 61% | 184 74% | 117 10% | 70 -34% |
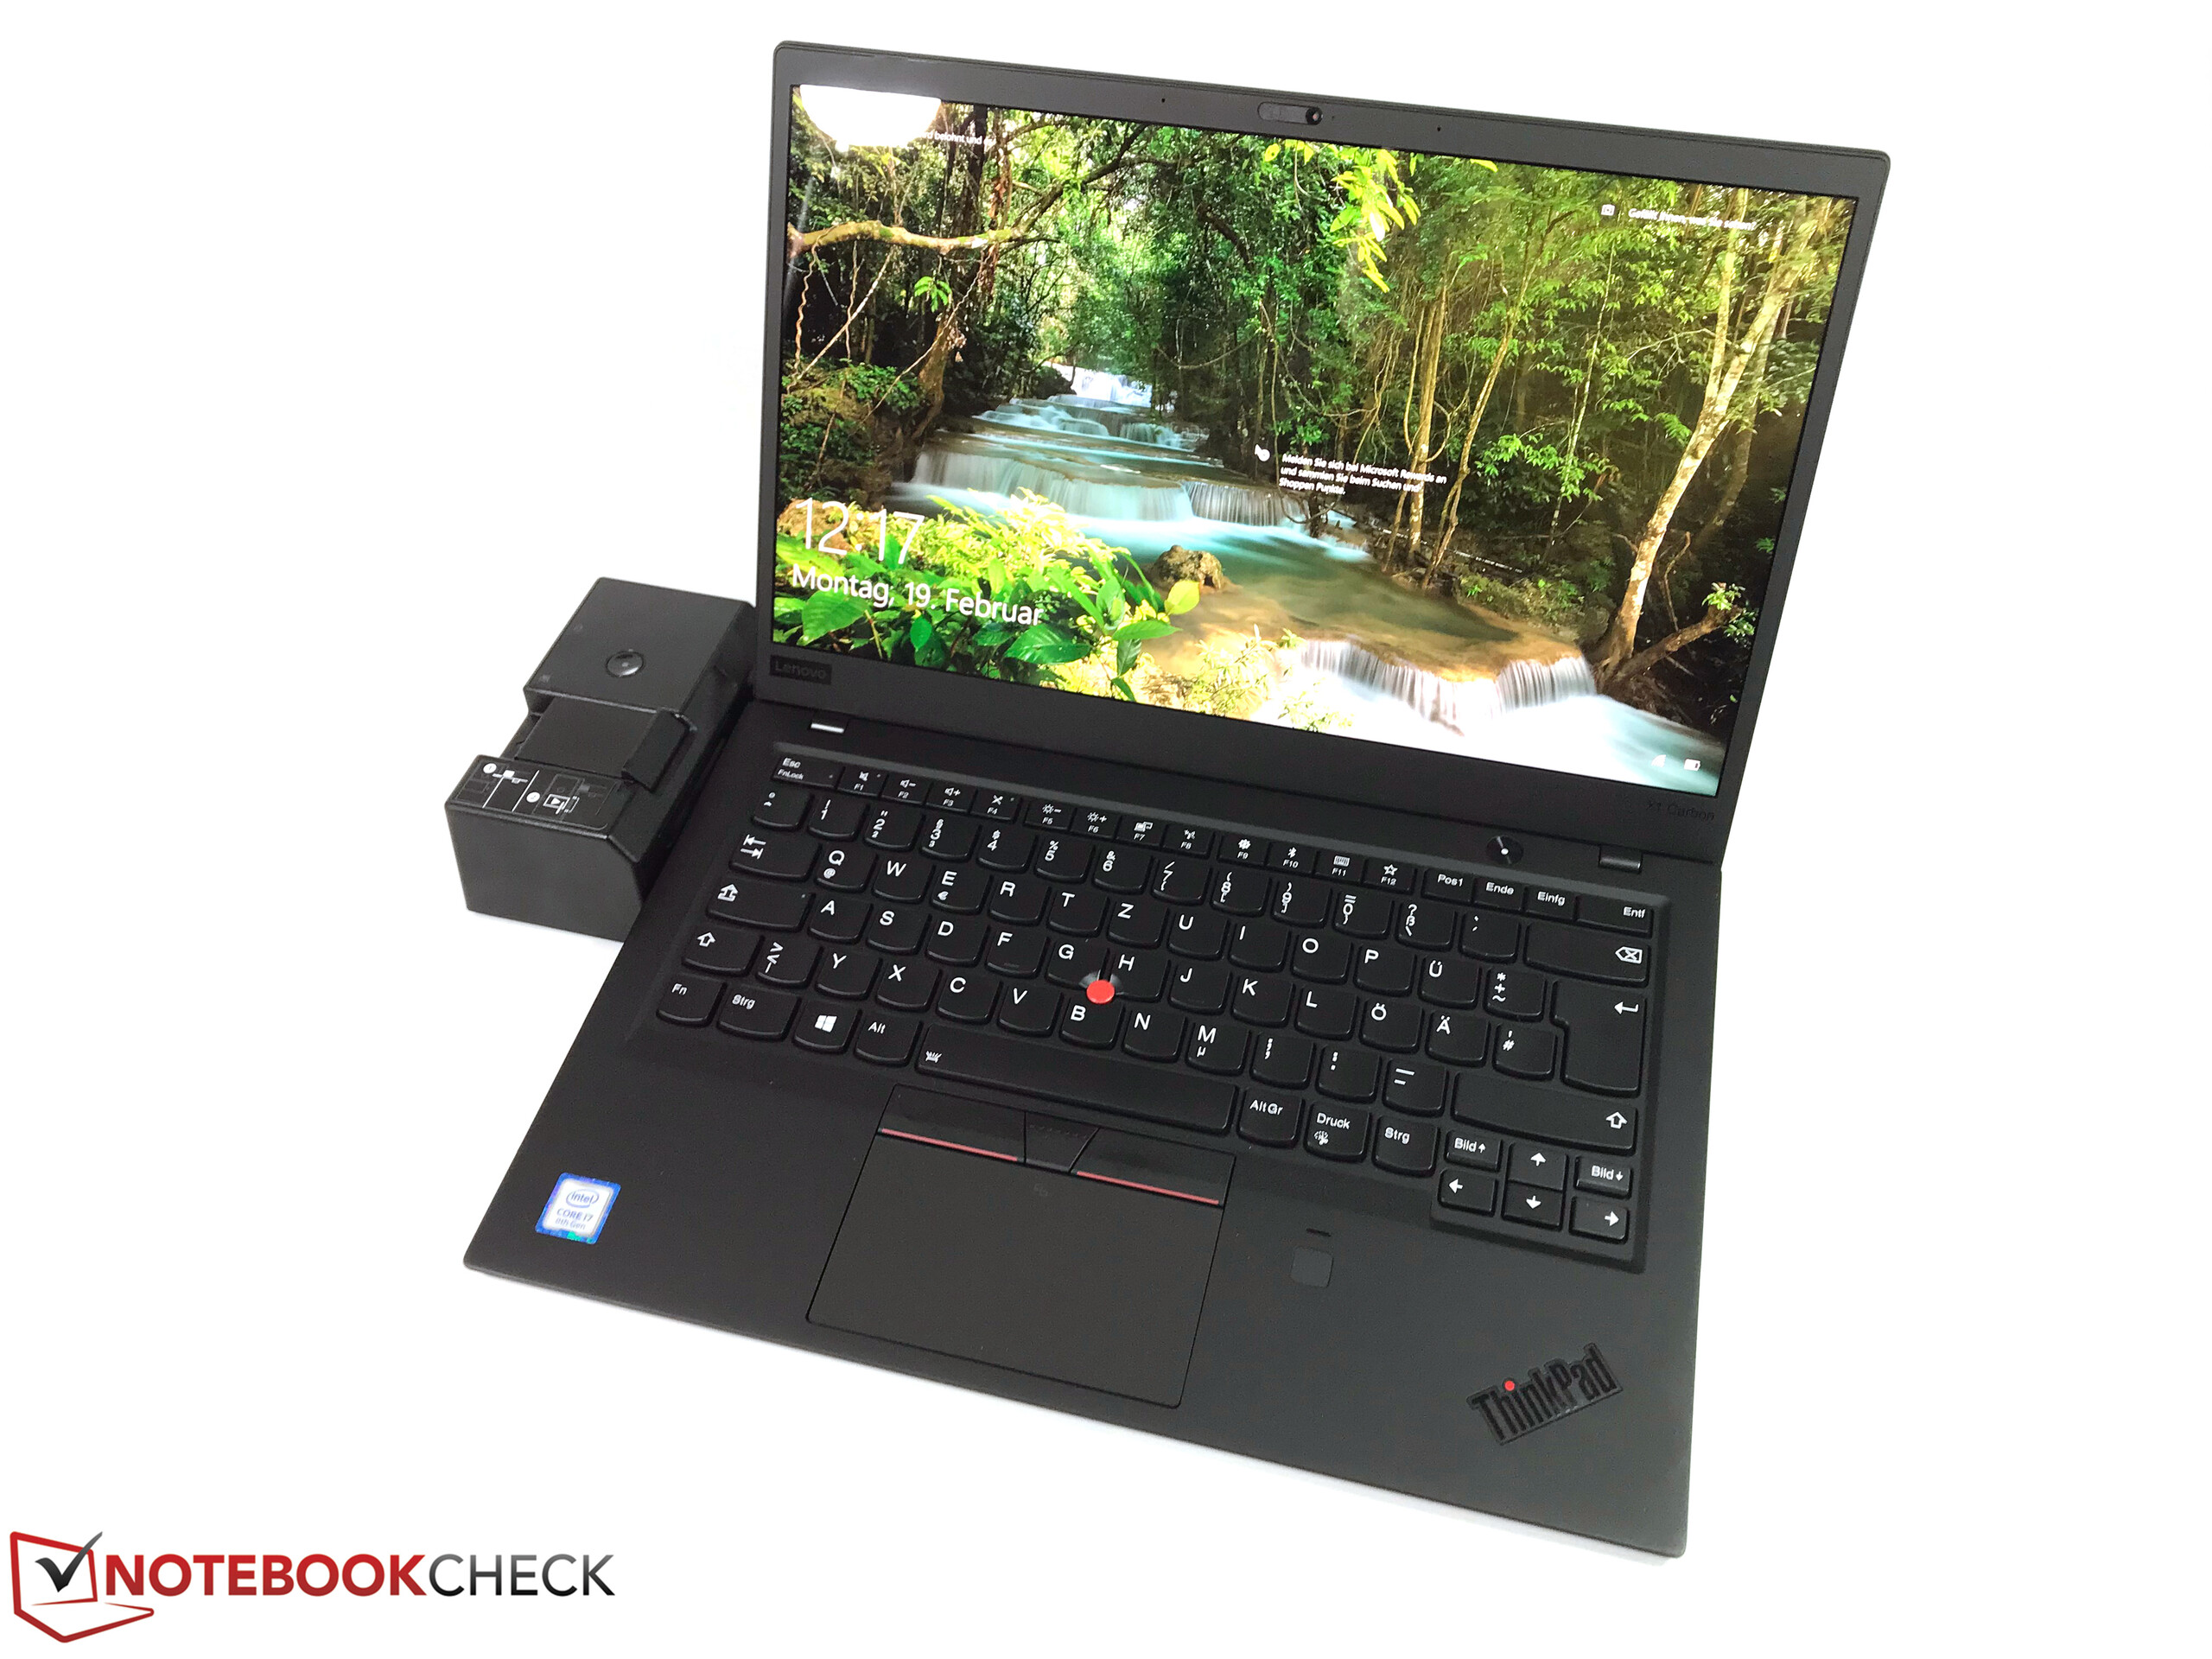
Ekranın renk kapsamının etkileyici olduğunu söylemek gerek. Nihayet diğer alanlarda da hayal kırıklığına uğratmayan ve mükemmel bir ekrana sahip ThinkPad modelini görebiliyoruz. X1 Carbon modelinin WQHD HDR ekranı TnikPad P71 modelindeki 4K ekrandan bile daha iyi. Yansıtmalı yüzey elbette ilk dezavantajı, ama geçen yılın modelinde mat WQHD ekran seçeneğini bulmak mümkün.
Sıcaklık üretimi halen kafa karıştırıcı. Yoğun kullanımda yüzey sıcaklıkları 50 dereceye kadar çıkabiliyor.
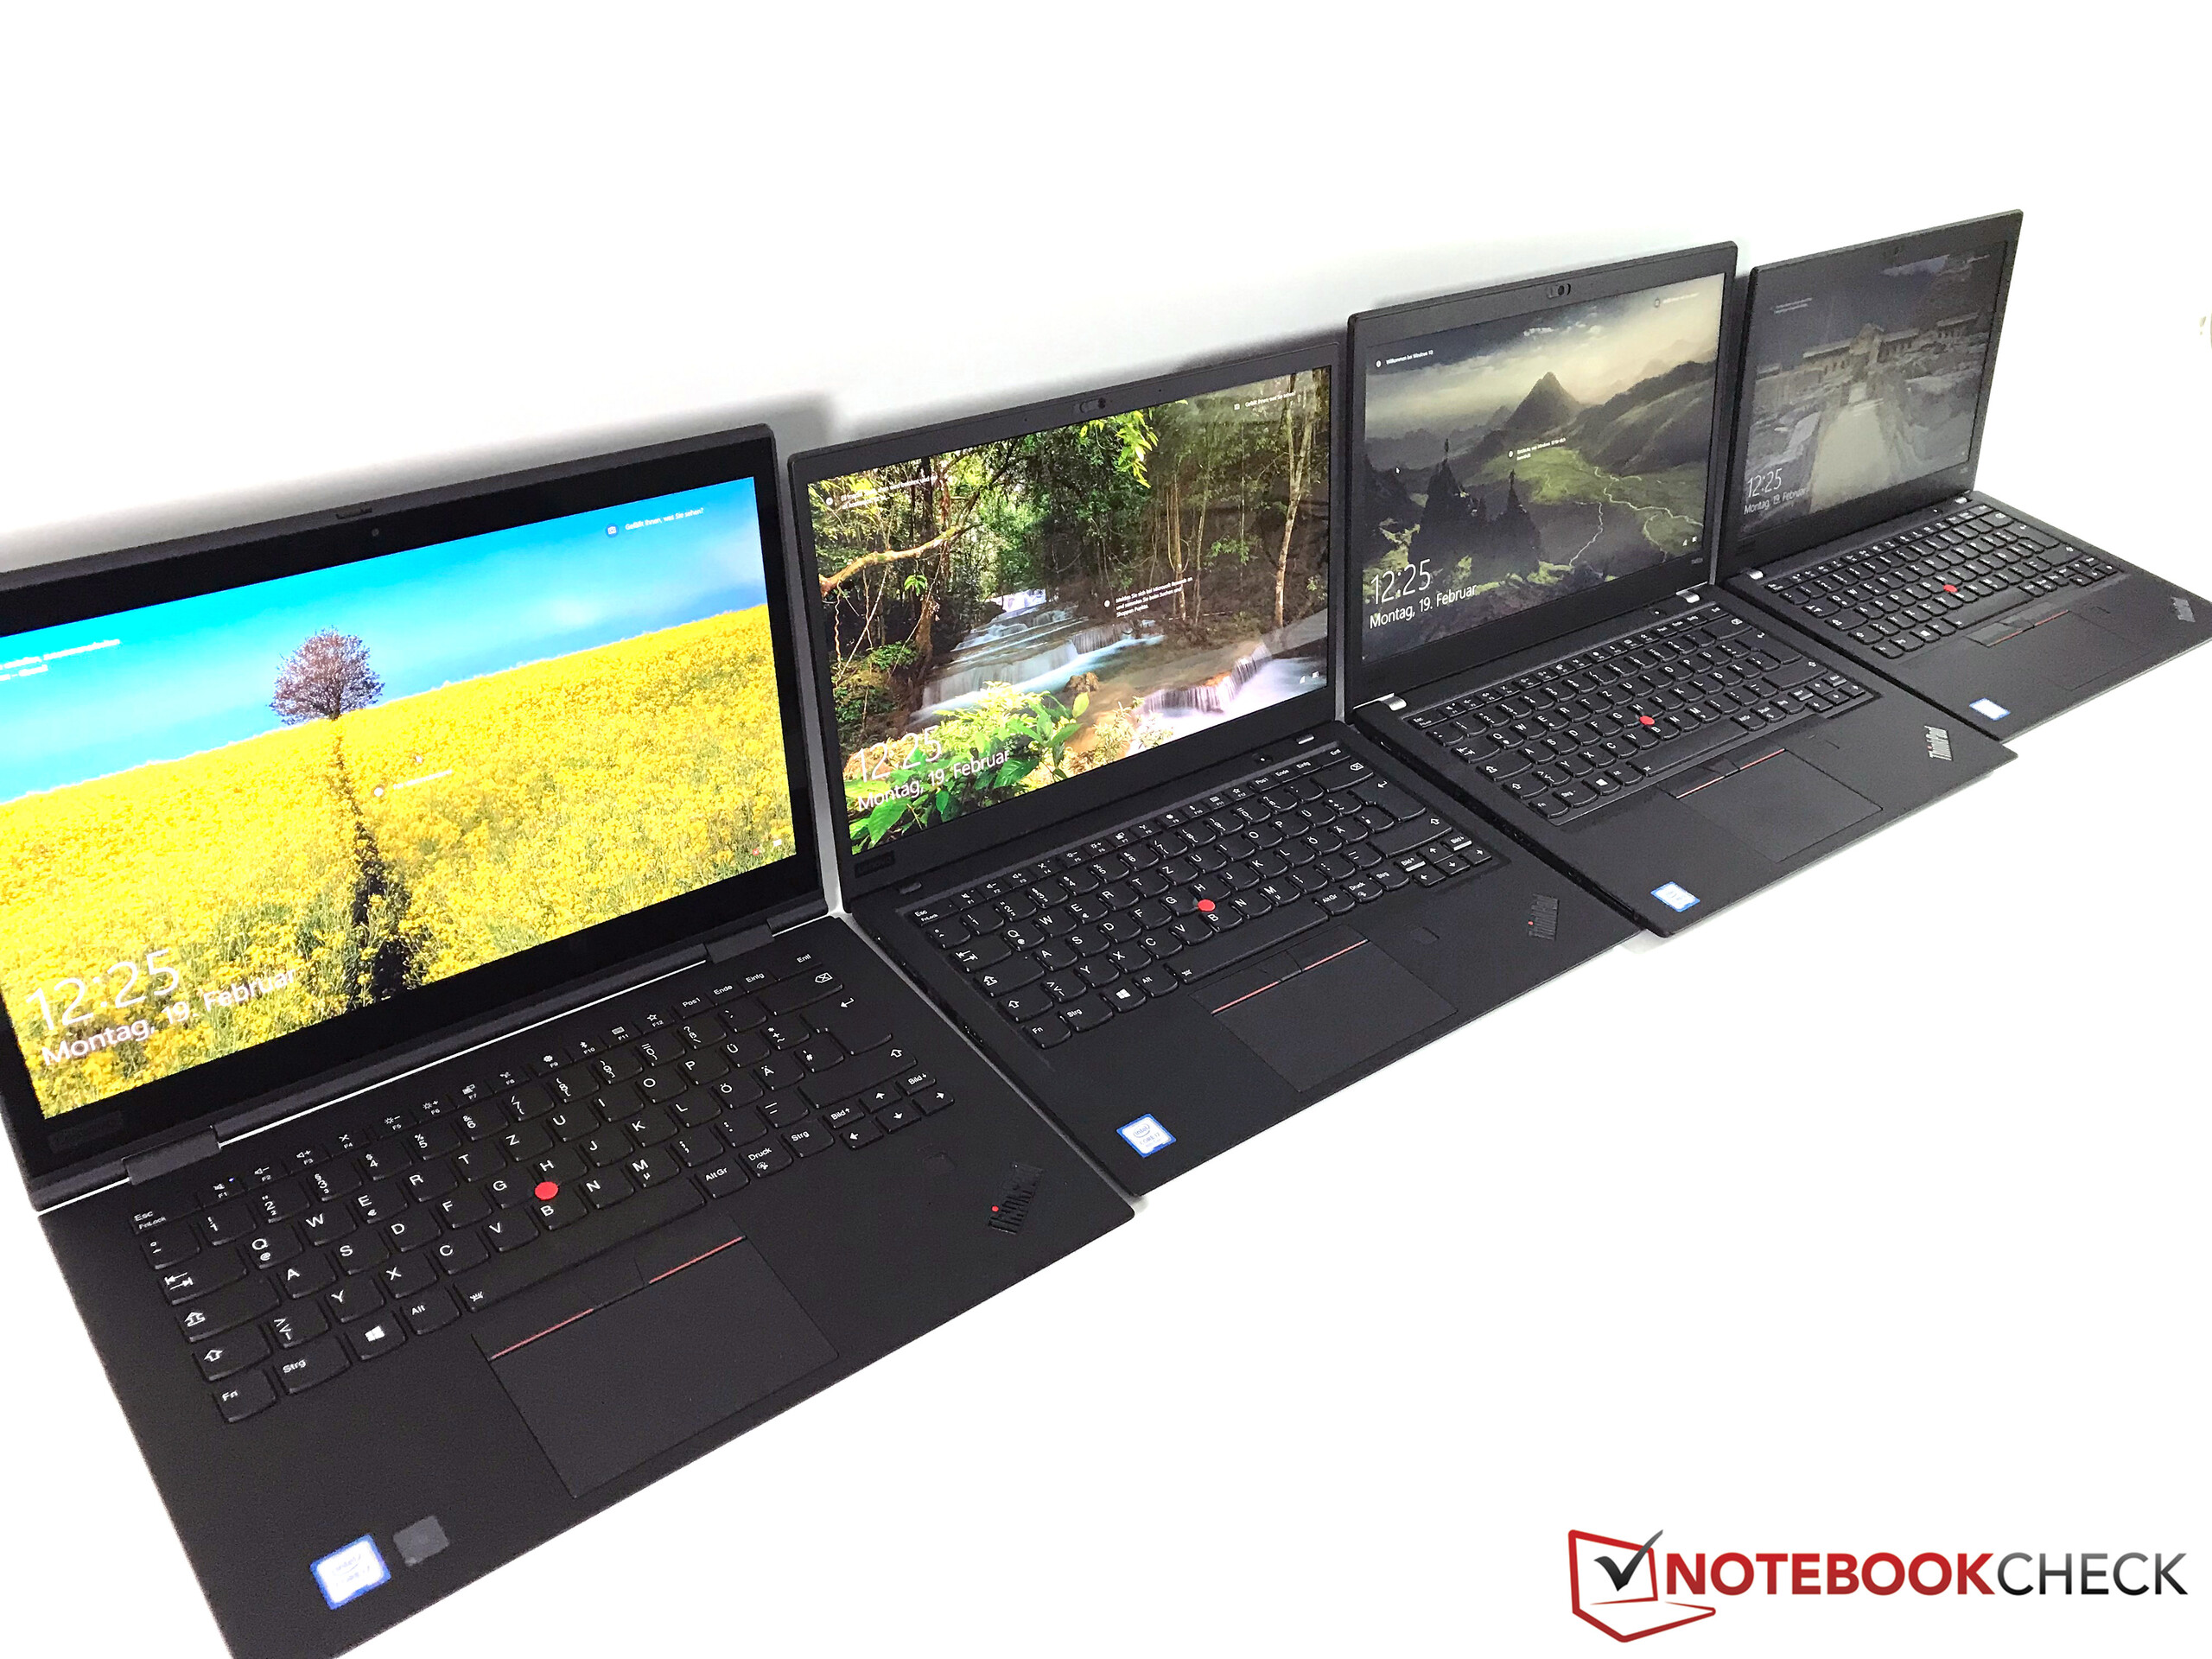
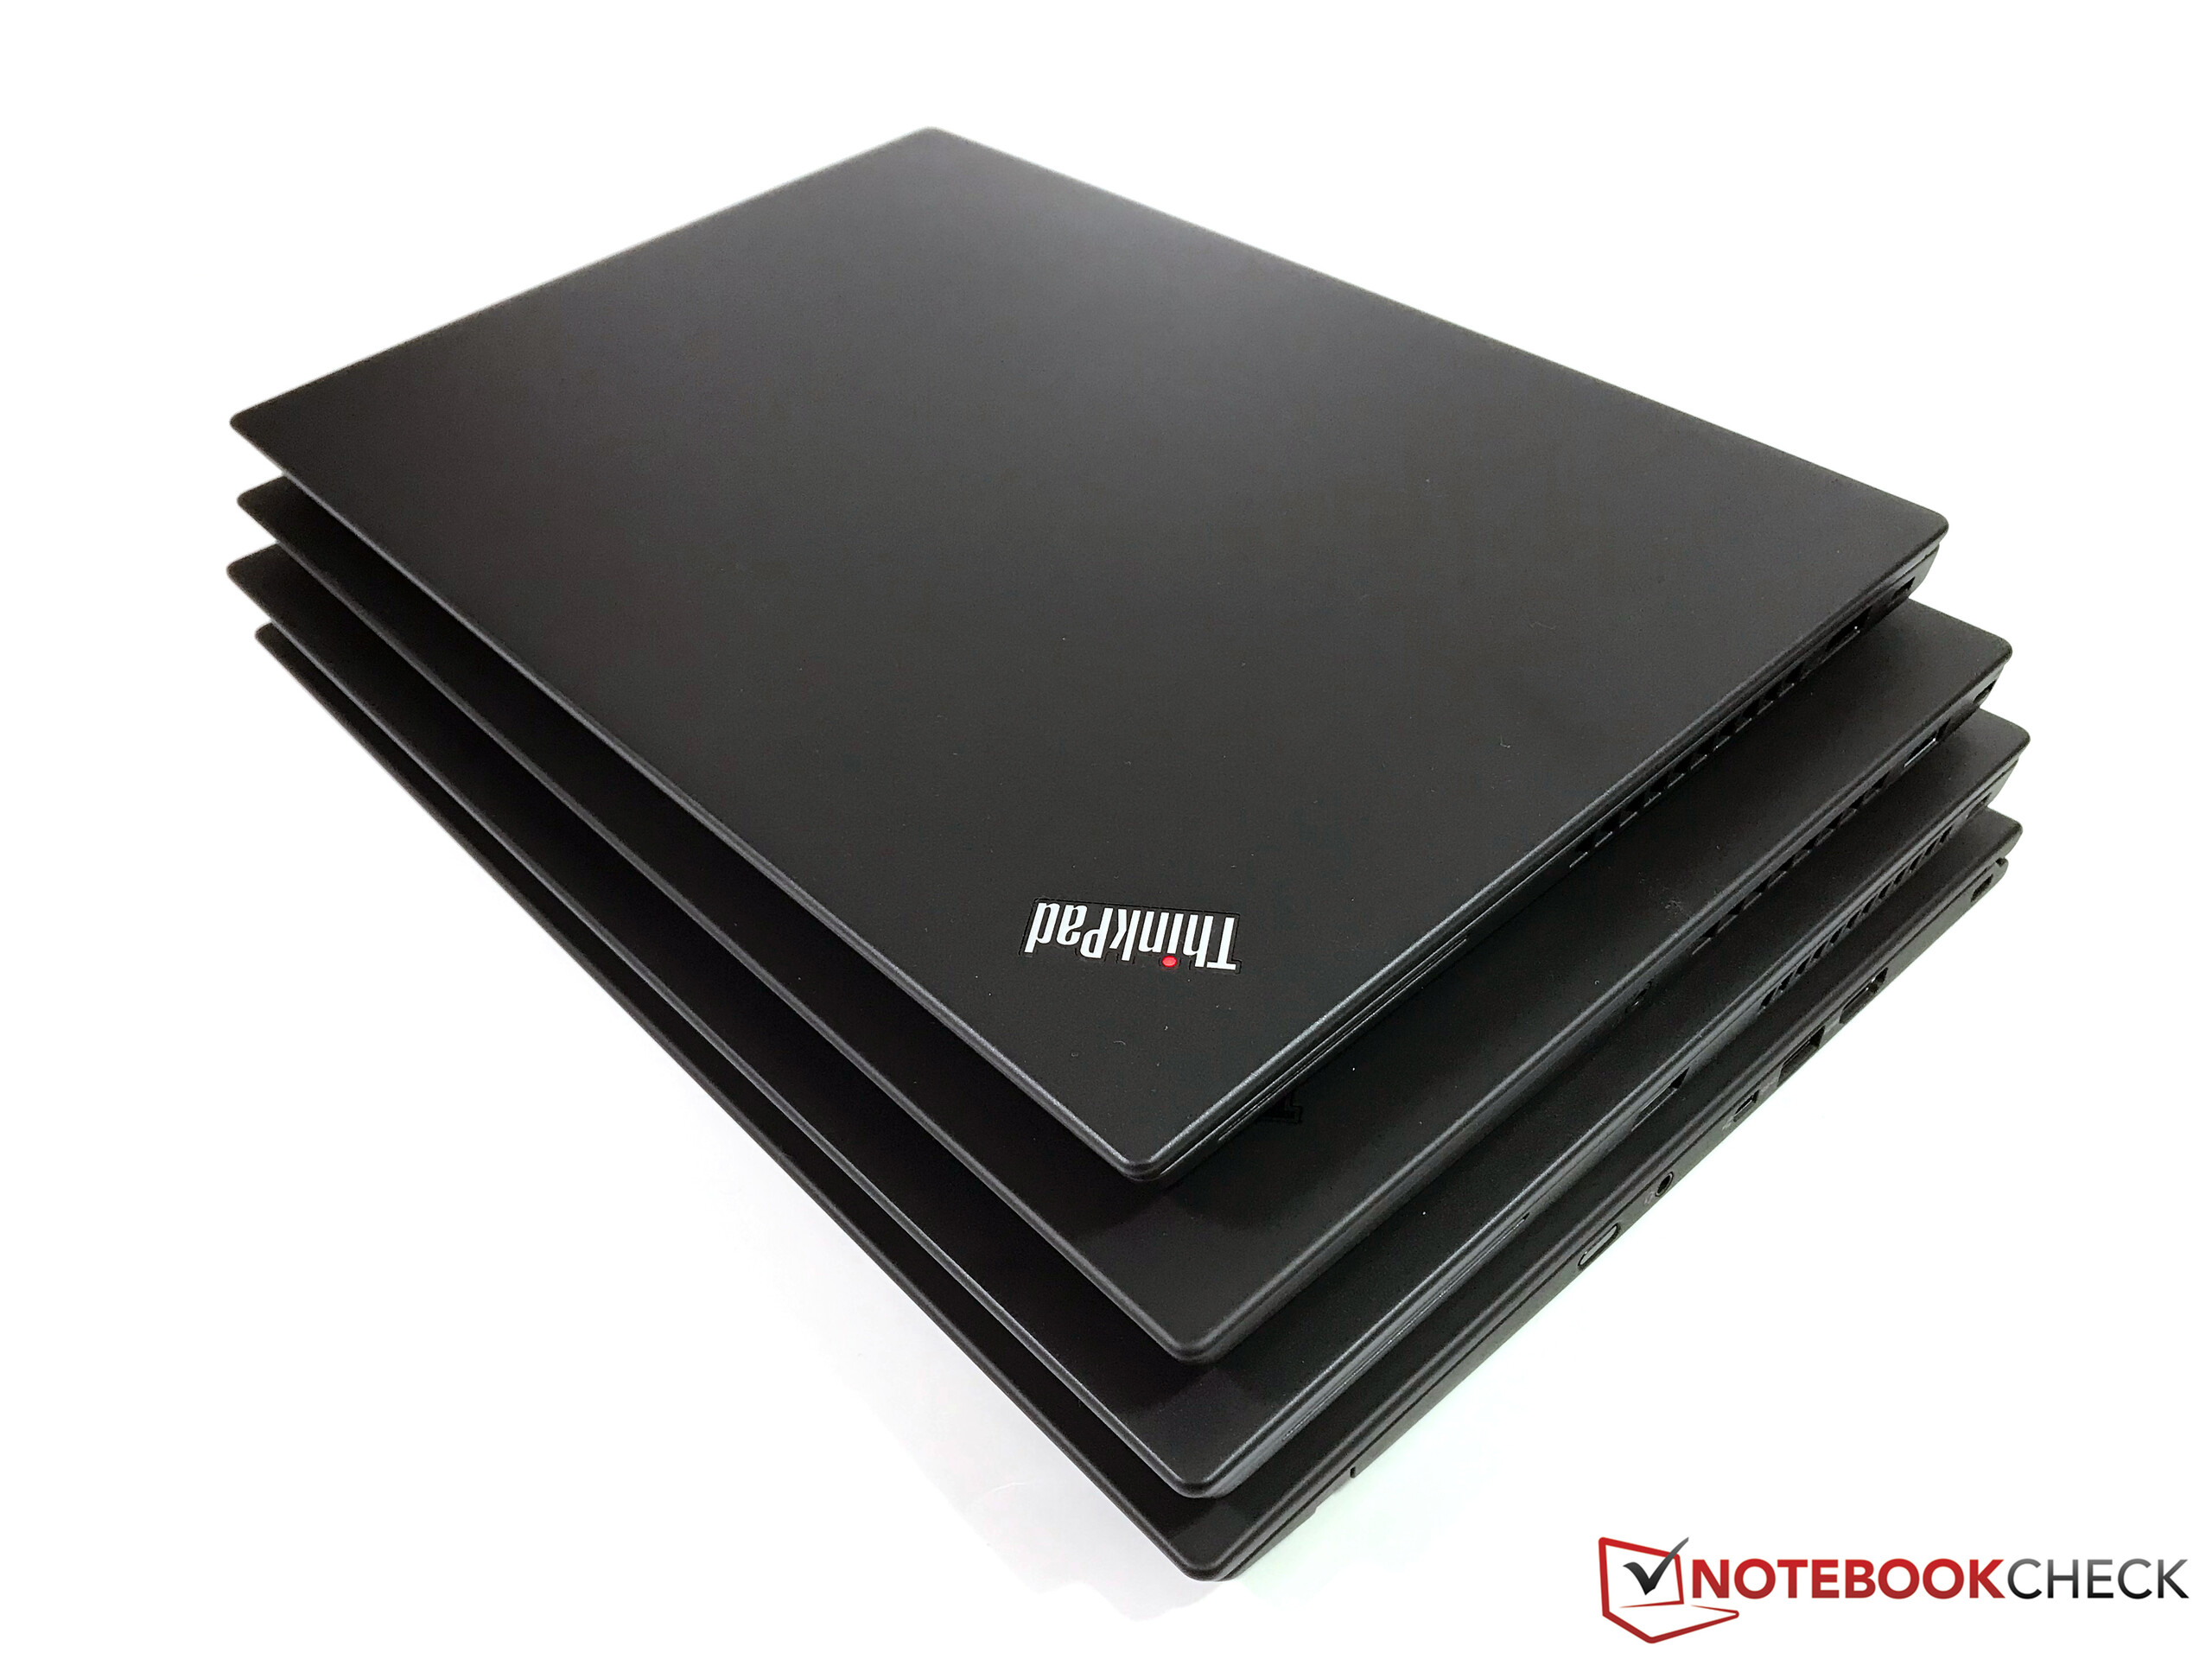
Elden geçirilen X280 ve T480s modellerine kıyasla X1 Carbon nasıl bir sonuç verecek merakla bekliyoruz.
Pricecompare
