Aorus 15P WB incelemede: Kompakt oyun güç merkezi çok iyi pil ömrü sunuyor

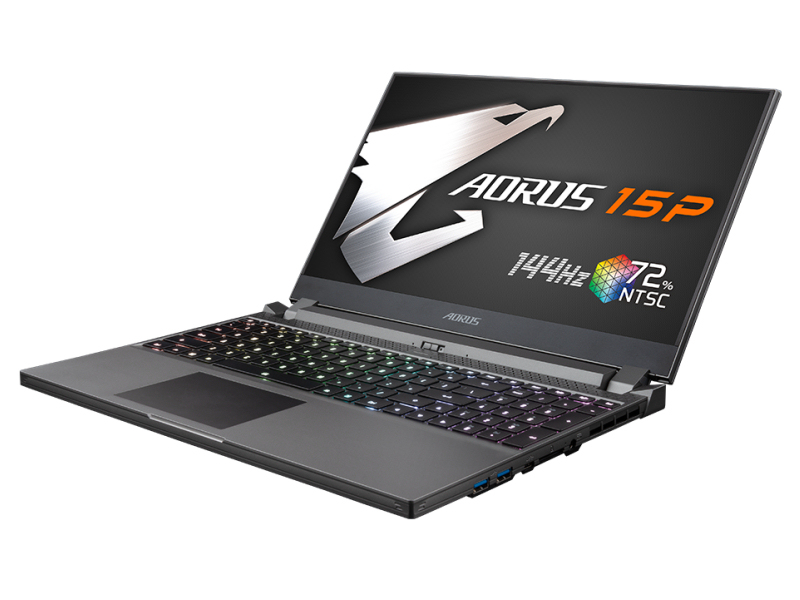
Aorus 15P WB, 15,6 inç formatında ince, kompakt bir dizüstü oyun bilgisayarıdır. Cihaz kesinlikle önceden gözden geçirilmiş Aorus 15G XB'nin sulandırılmış, daha düşük fiyatlı bir versiyonu olarak düşünülebilir. Bize sağlanan test modelinde bir Core i7-10750H işlemci ve bir GeForce RTX 2070 Max-Q grafik çekirdeği bulunuyor. Rakipler arasında Acer Predator Triton 300 PT315-52, Dell G5 15 SE 5505 ve Asus ROG Strix G15 G512LW gibi cihazlar yer alıyor.
Derecelendirme | Tarih | Modeli | Ağırlık | Yükseklik | Boyut | Çözünürlük | Fiyat |
|---|---|---|---|---|---|---|---|
| 84.5 % v7 (old) | 02/2021 | Aorus 15P WB i7-10750H, GeForce RTX 2070 Max-Q | 2.1 kg | 23 mm | 15.60" | 1920x1080 | |
| 82.1 % v7 (old) | Acer Predator Triton 300 PT315-52-79LP i7-10750H, GeForce RTX 2060 Mobile | 2.1 kg | 19.9 mm | 15.60" | 1920x1080 | ||
| 83.4 % v7 (old) | 02/2021 | Asus ROG Strix G15 G512LW i7-10750H, GeForce RTX 2070 Mobile | 2.3 kg | 25.8 mm | 15.60" | 1920x1080 | |
| 83.7 % v7 (old) | 06/2020 | Dell G5 15 SE 5505 P89F R7 4800H, Radeon RX 5600M | 2.4 kg | 21.6 mm | 15.60" | 1920x1080 |
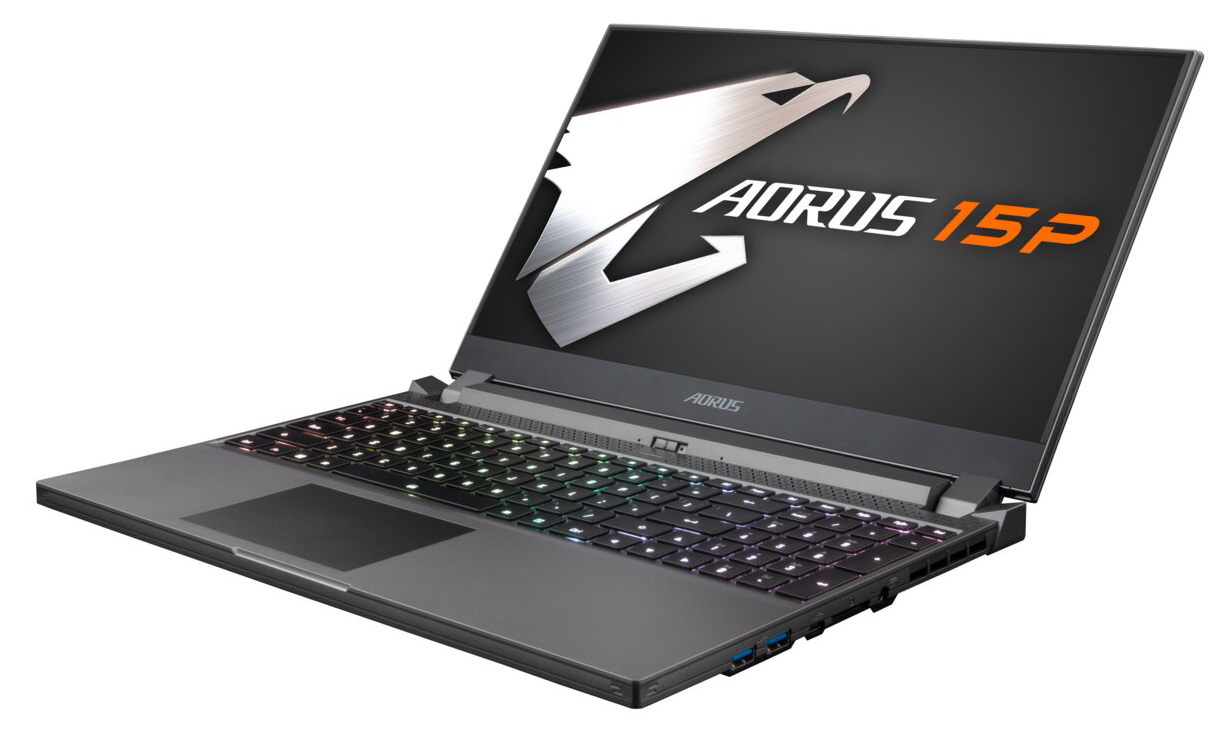
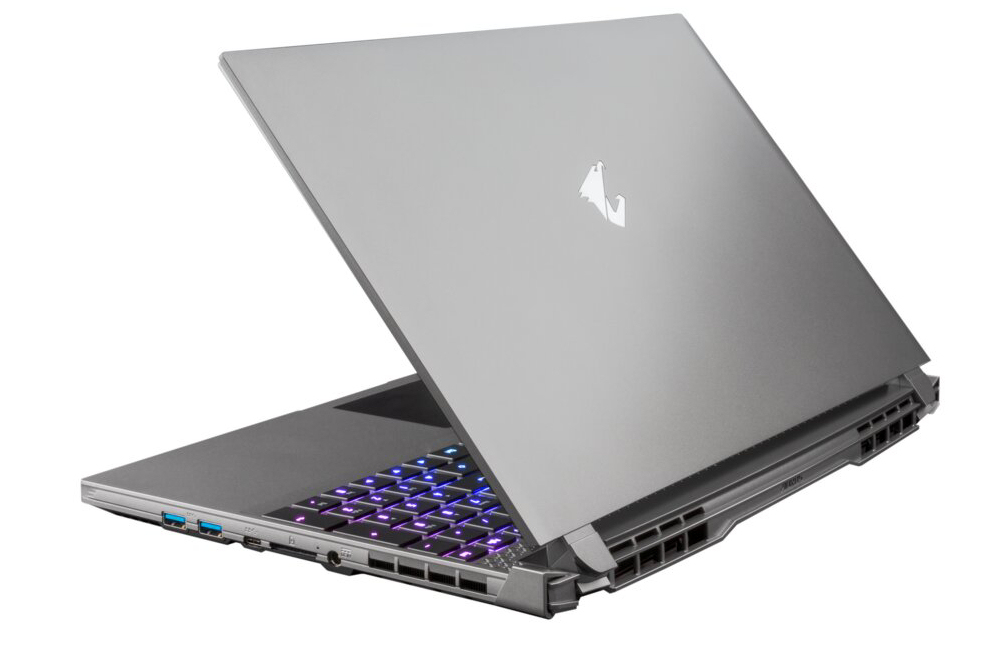
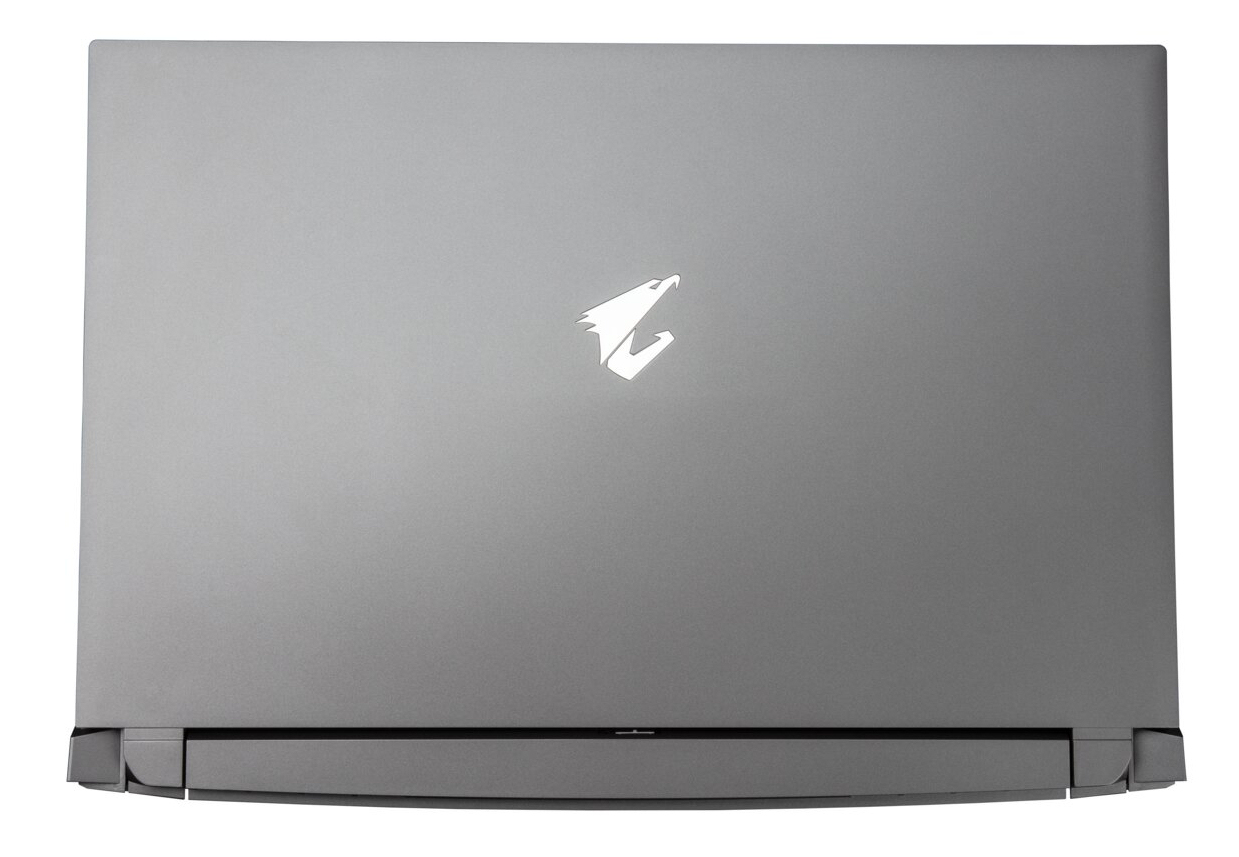
Kasa - 15P için plastik bir kasa
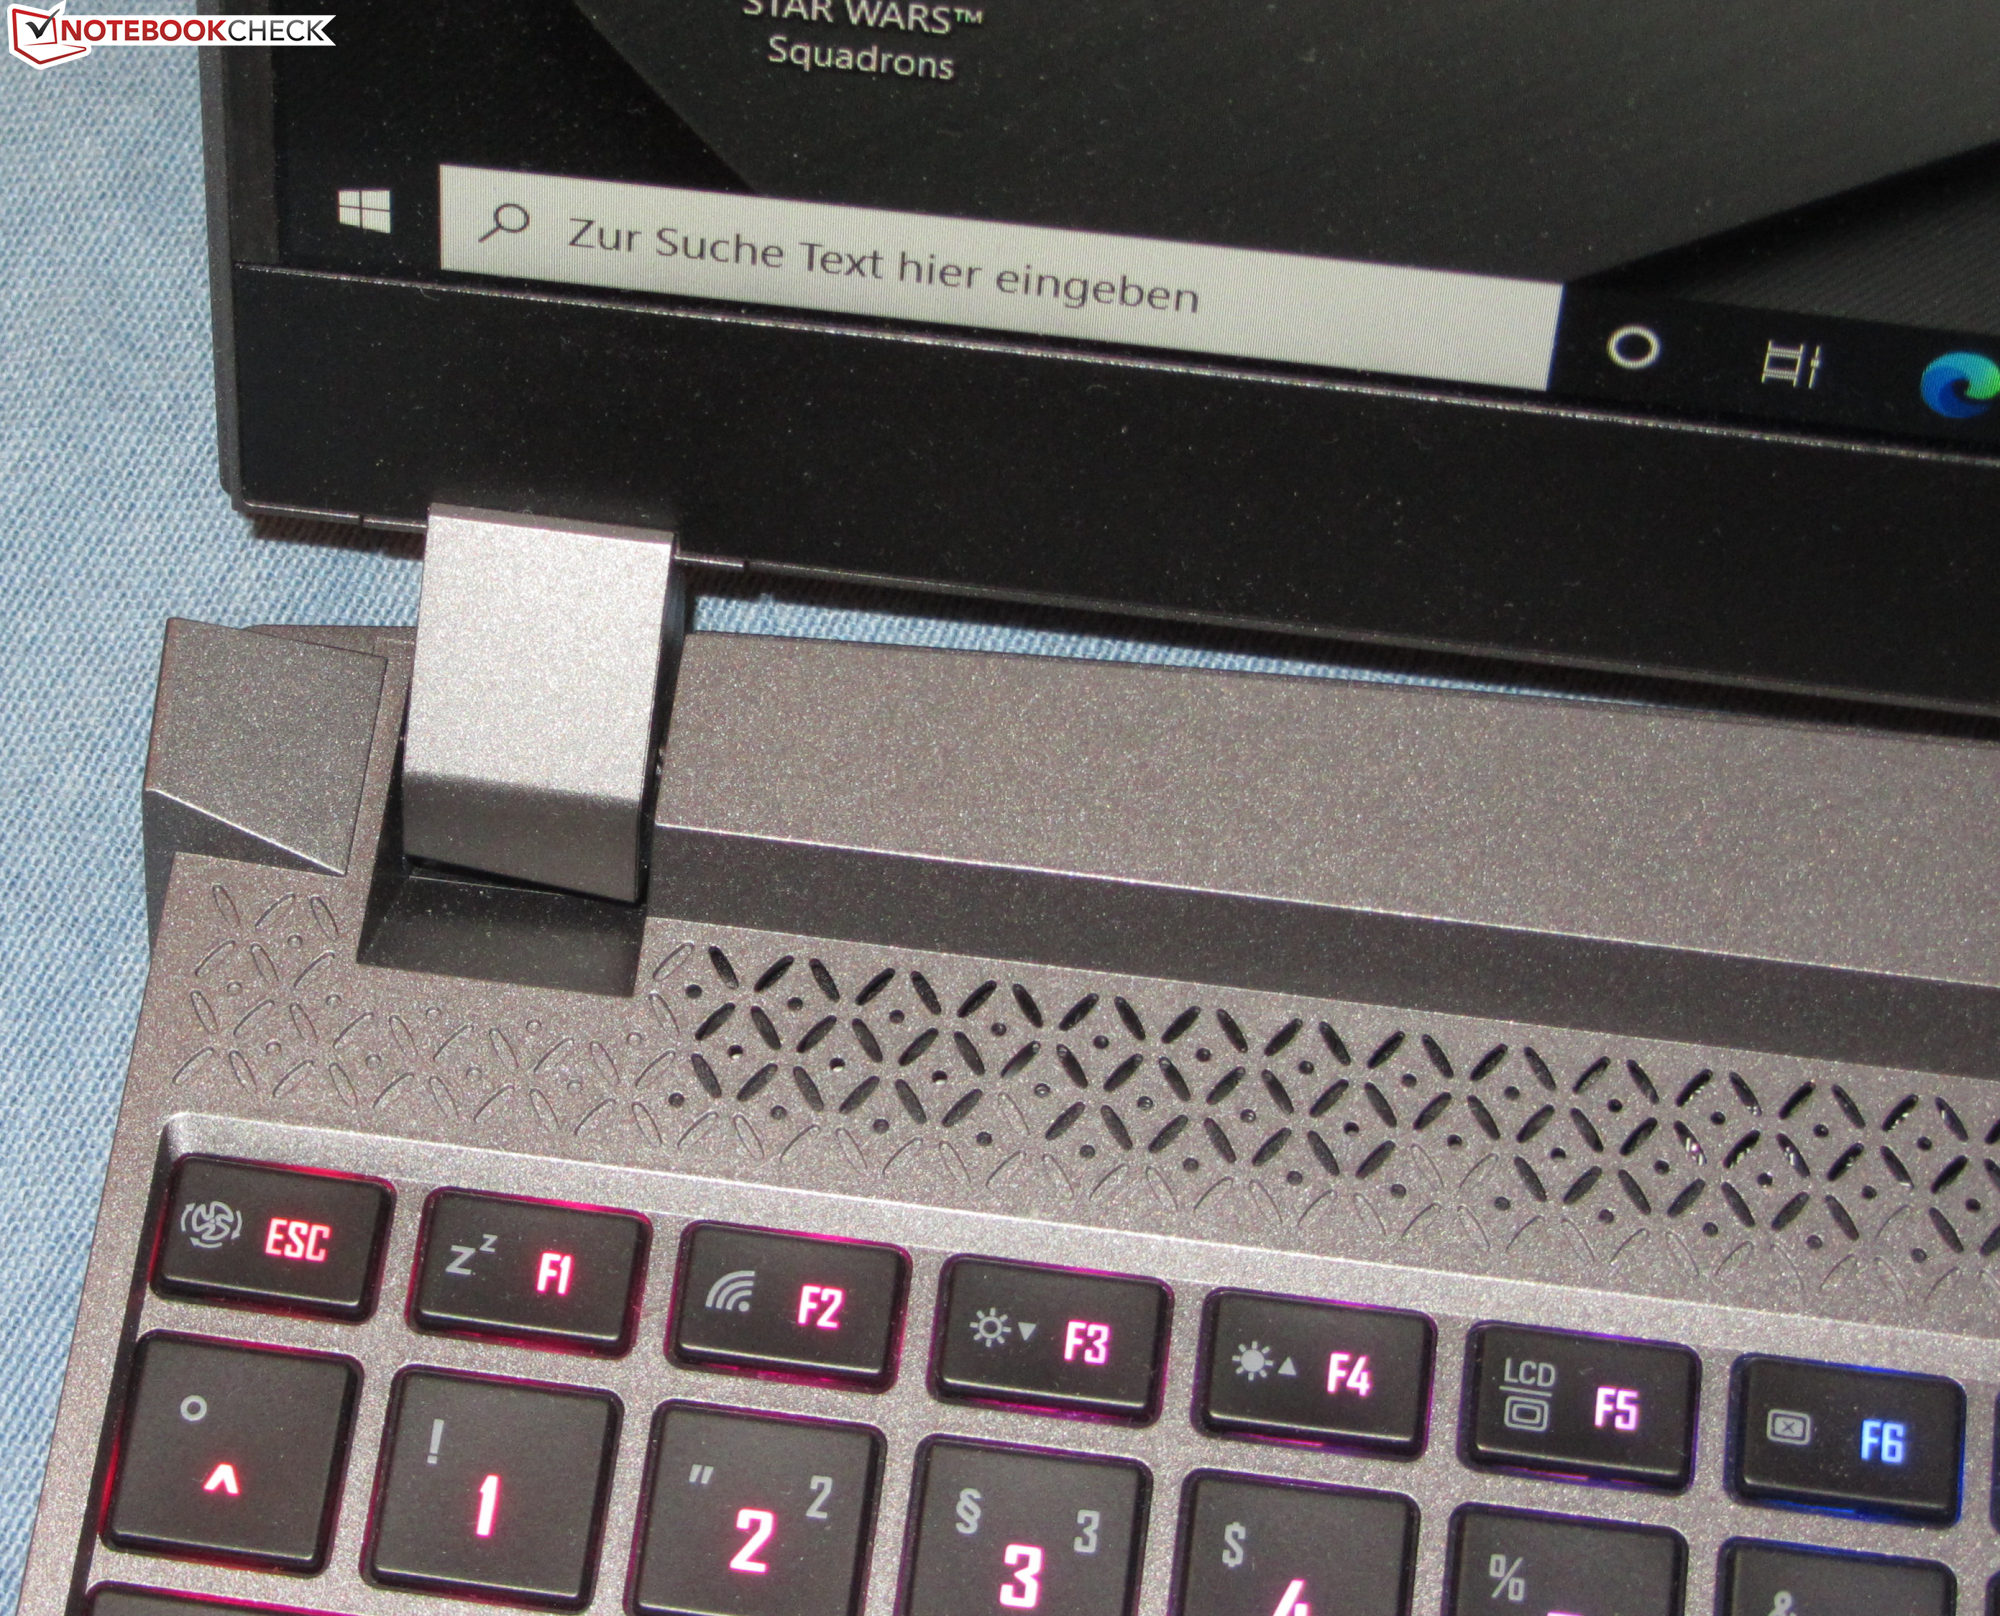
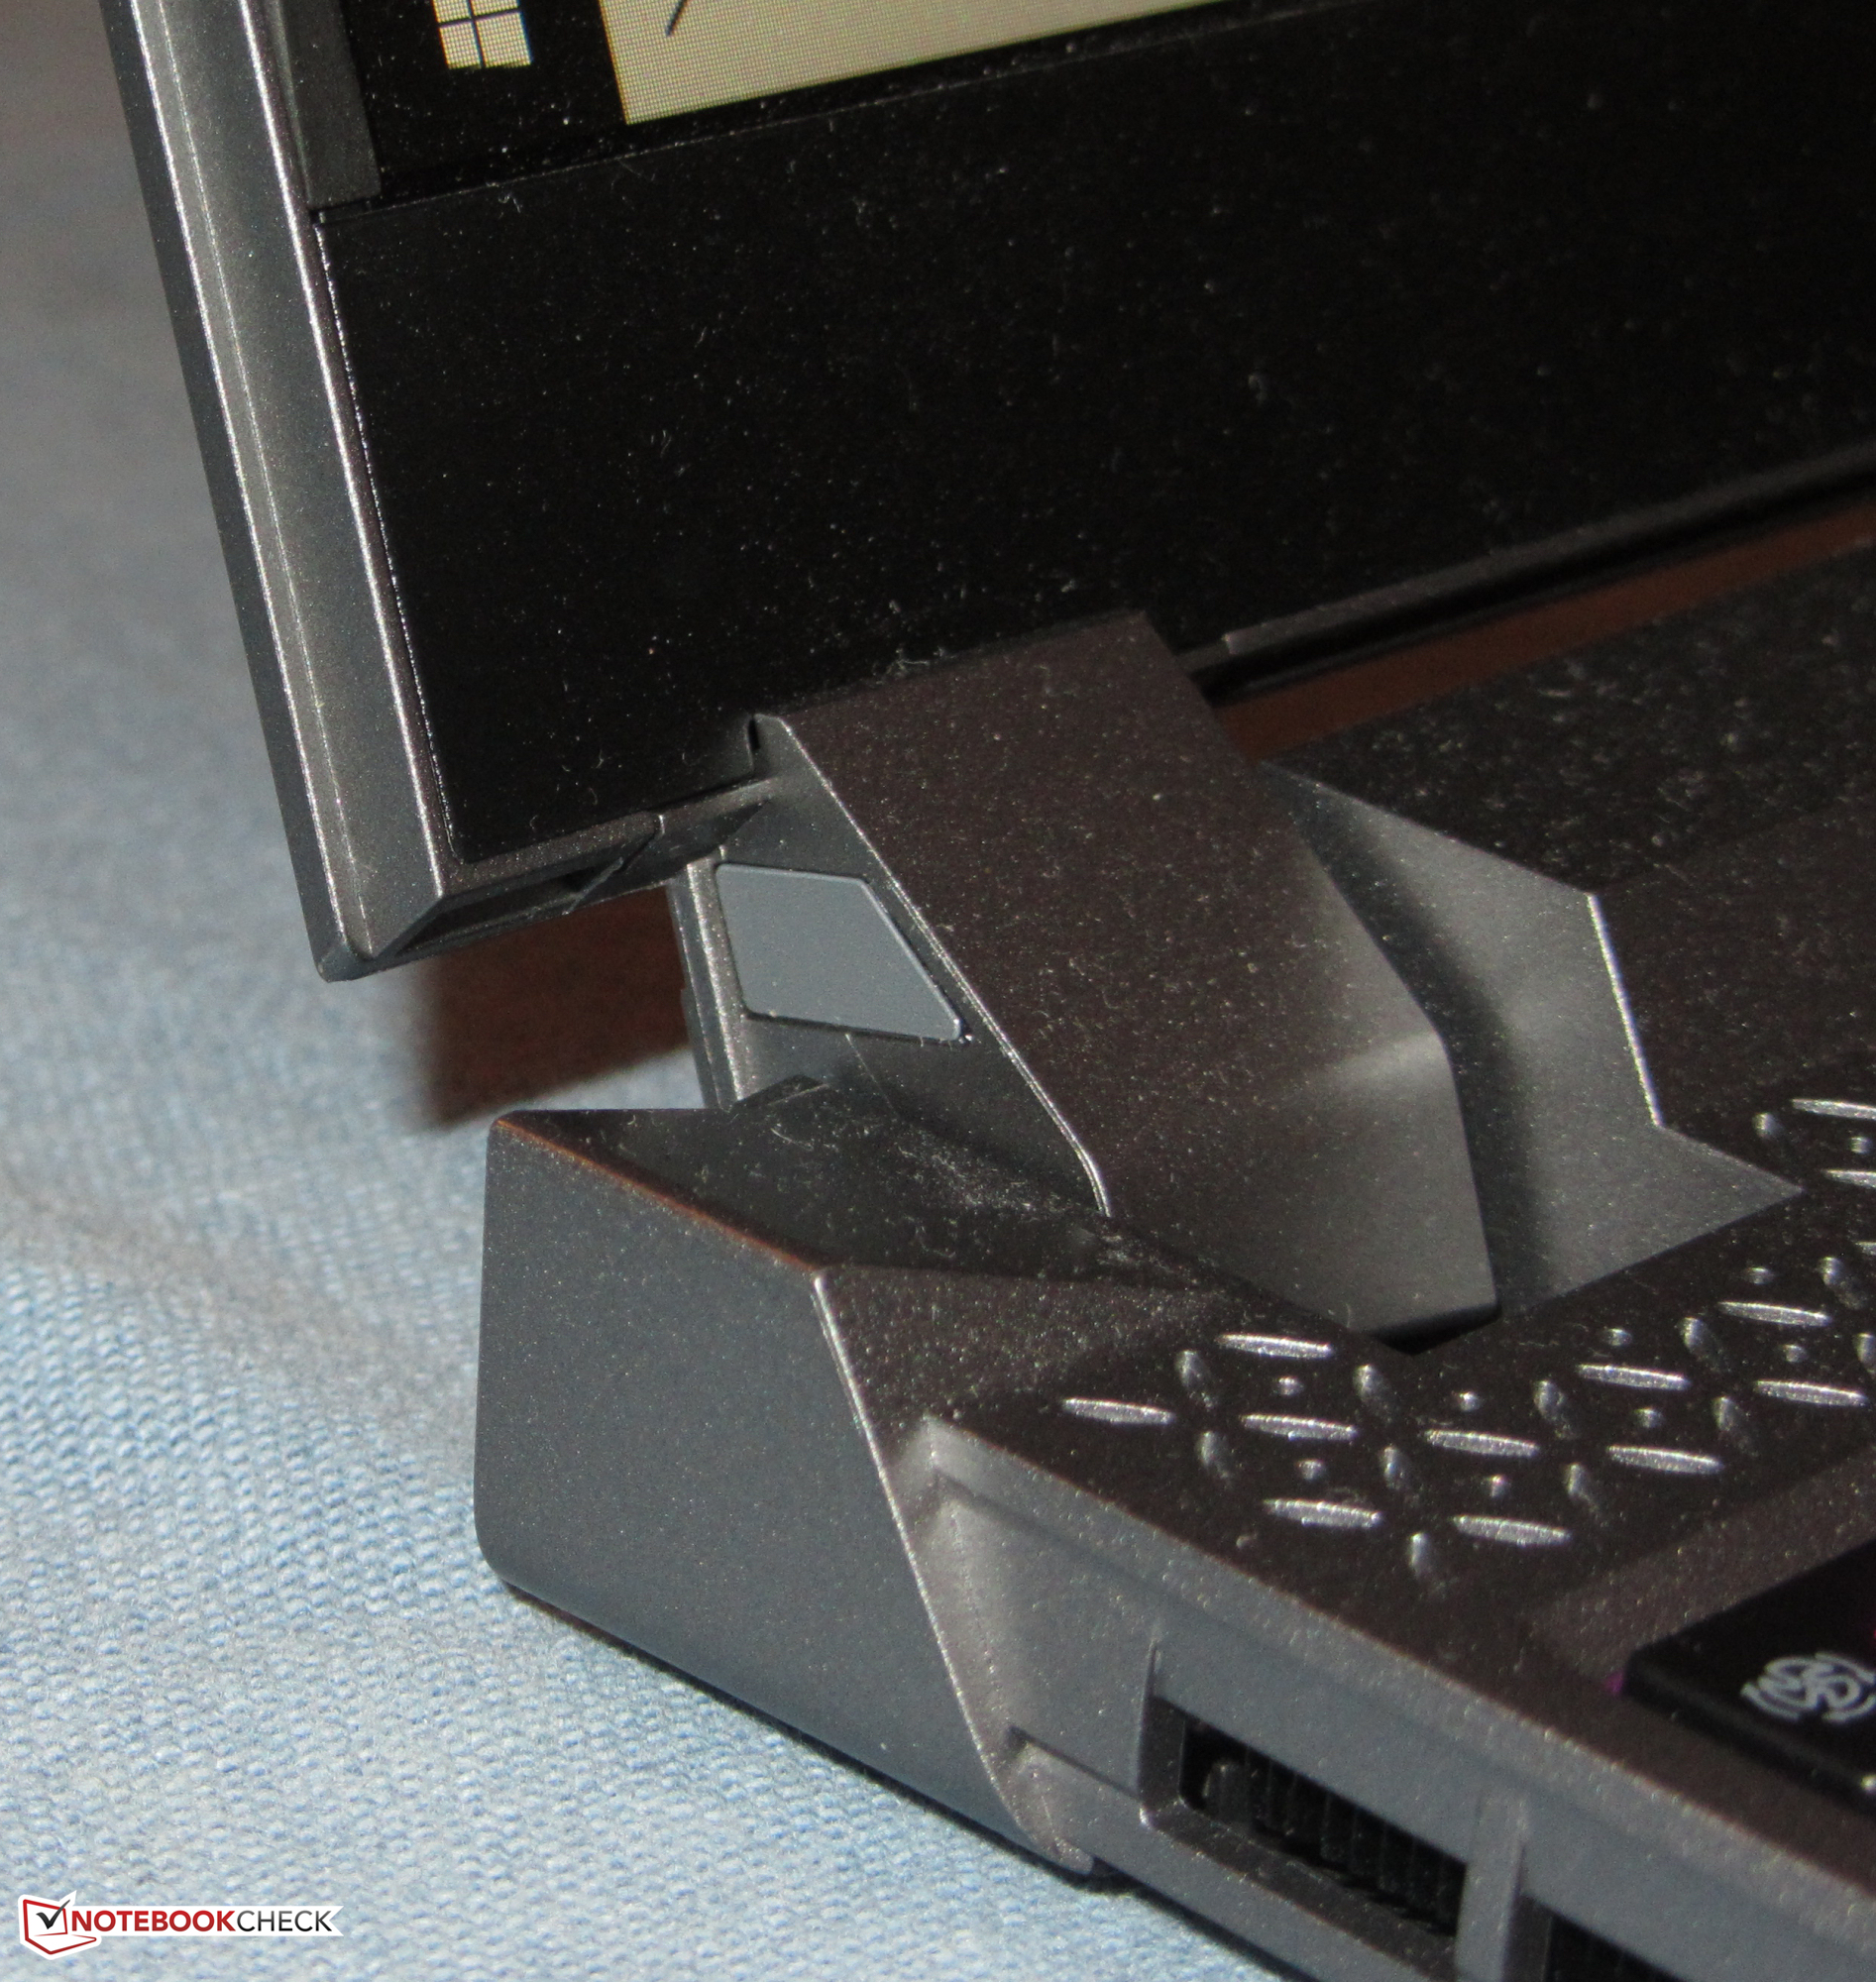
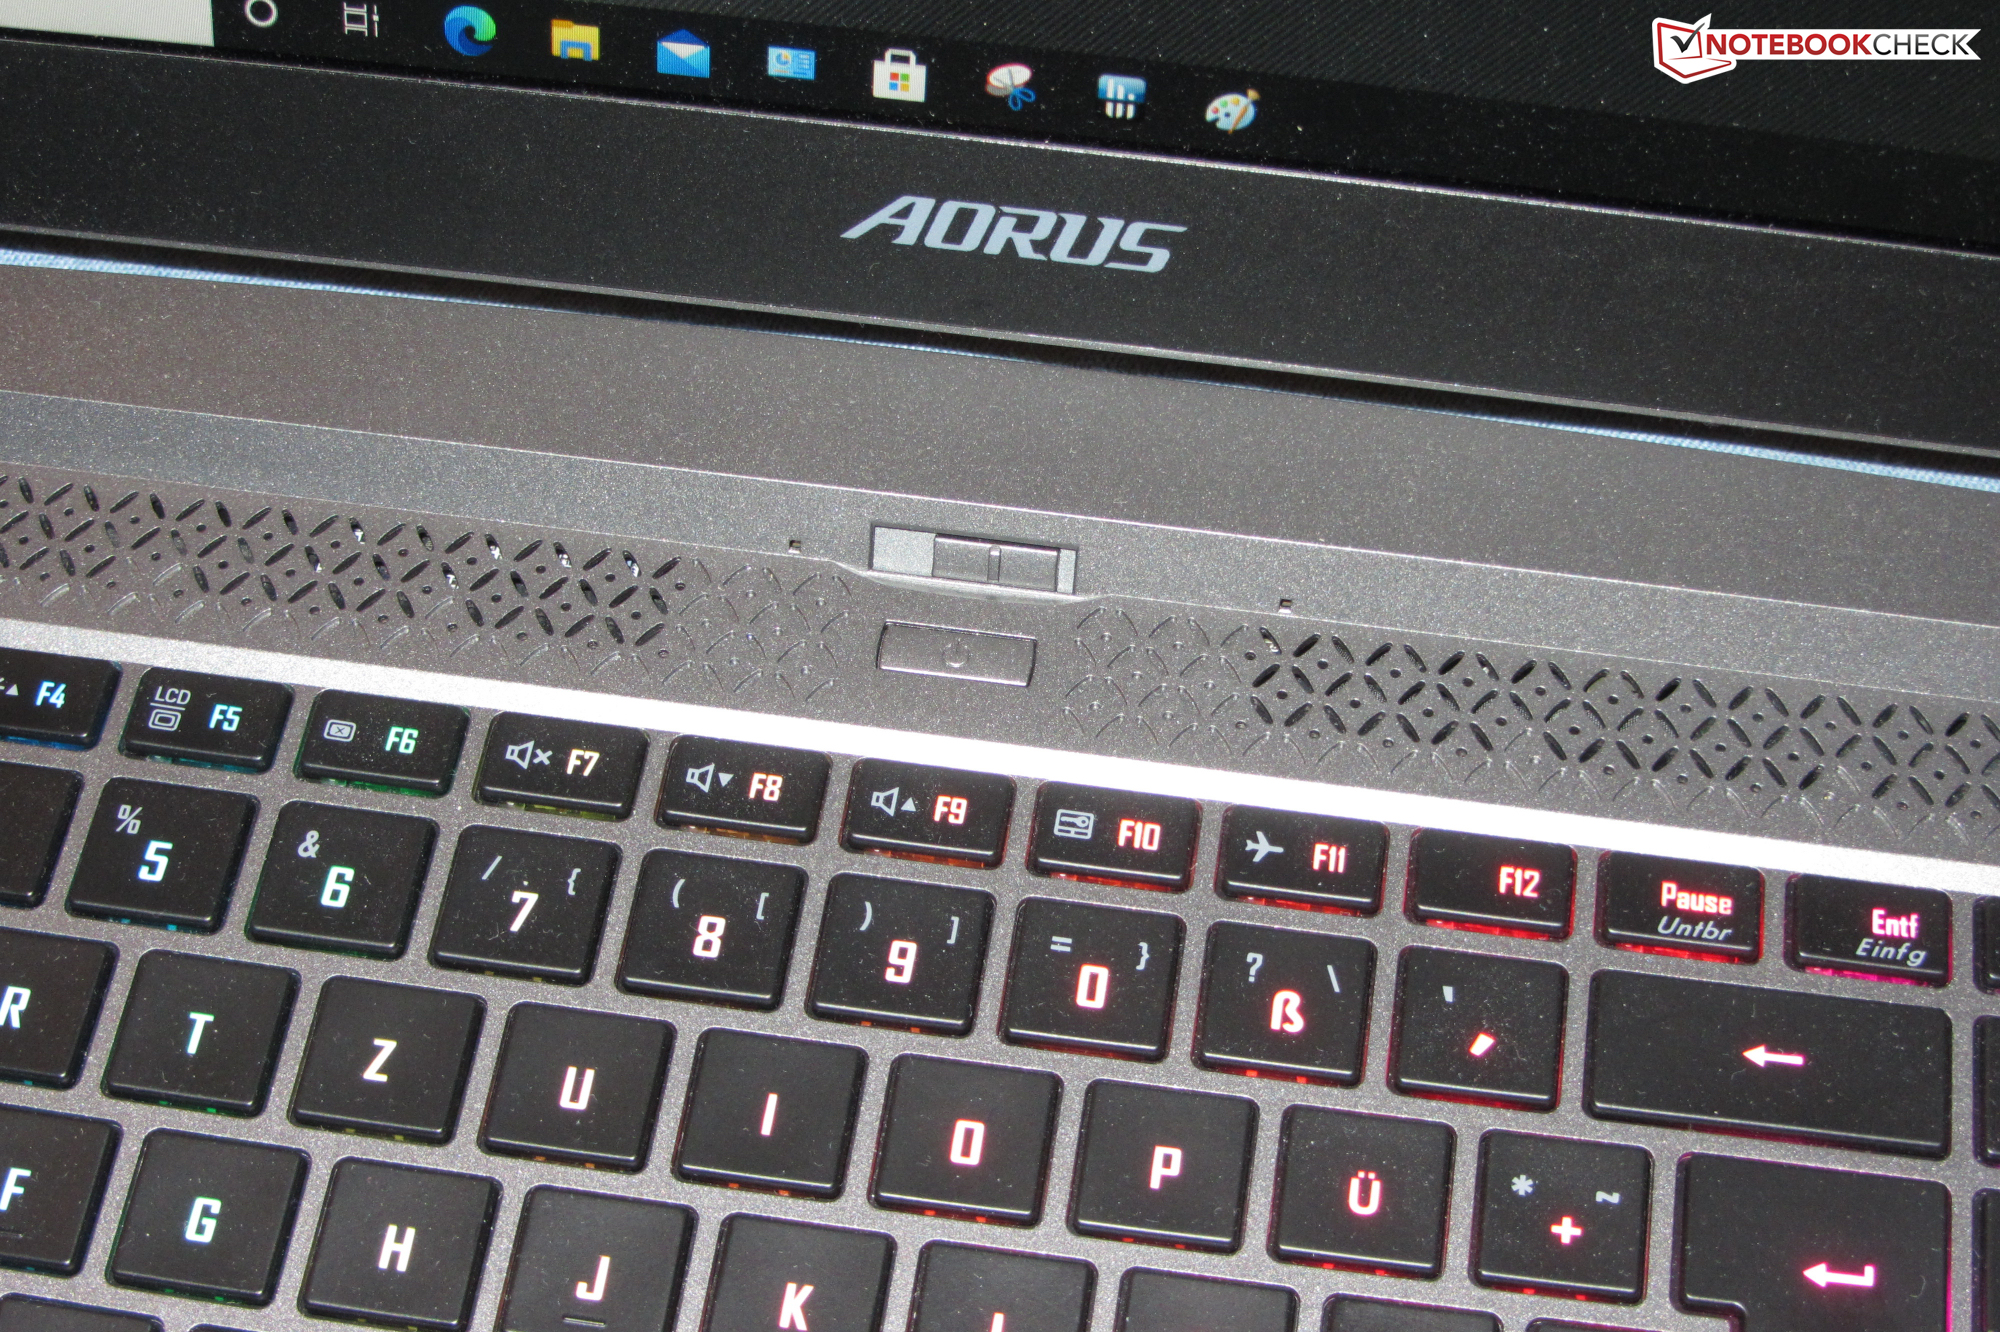
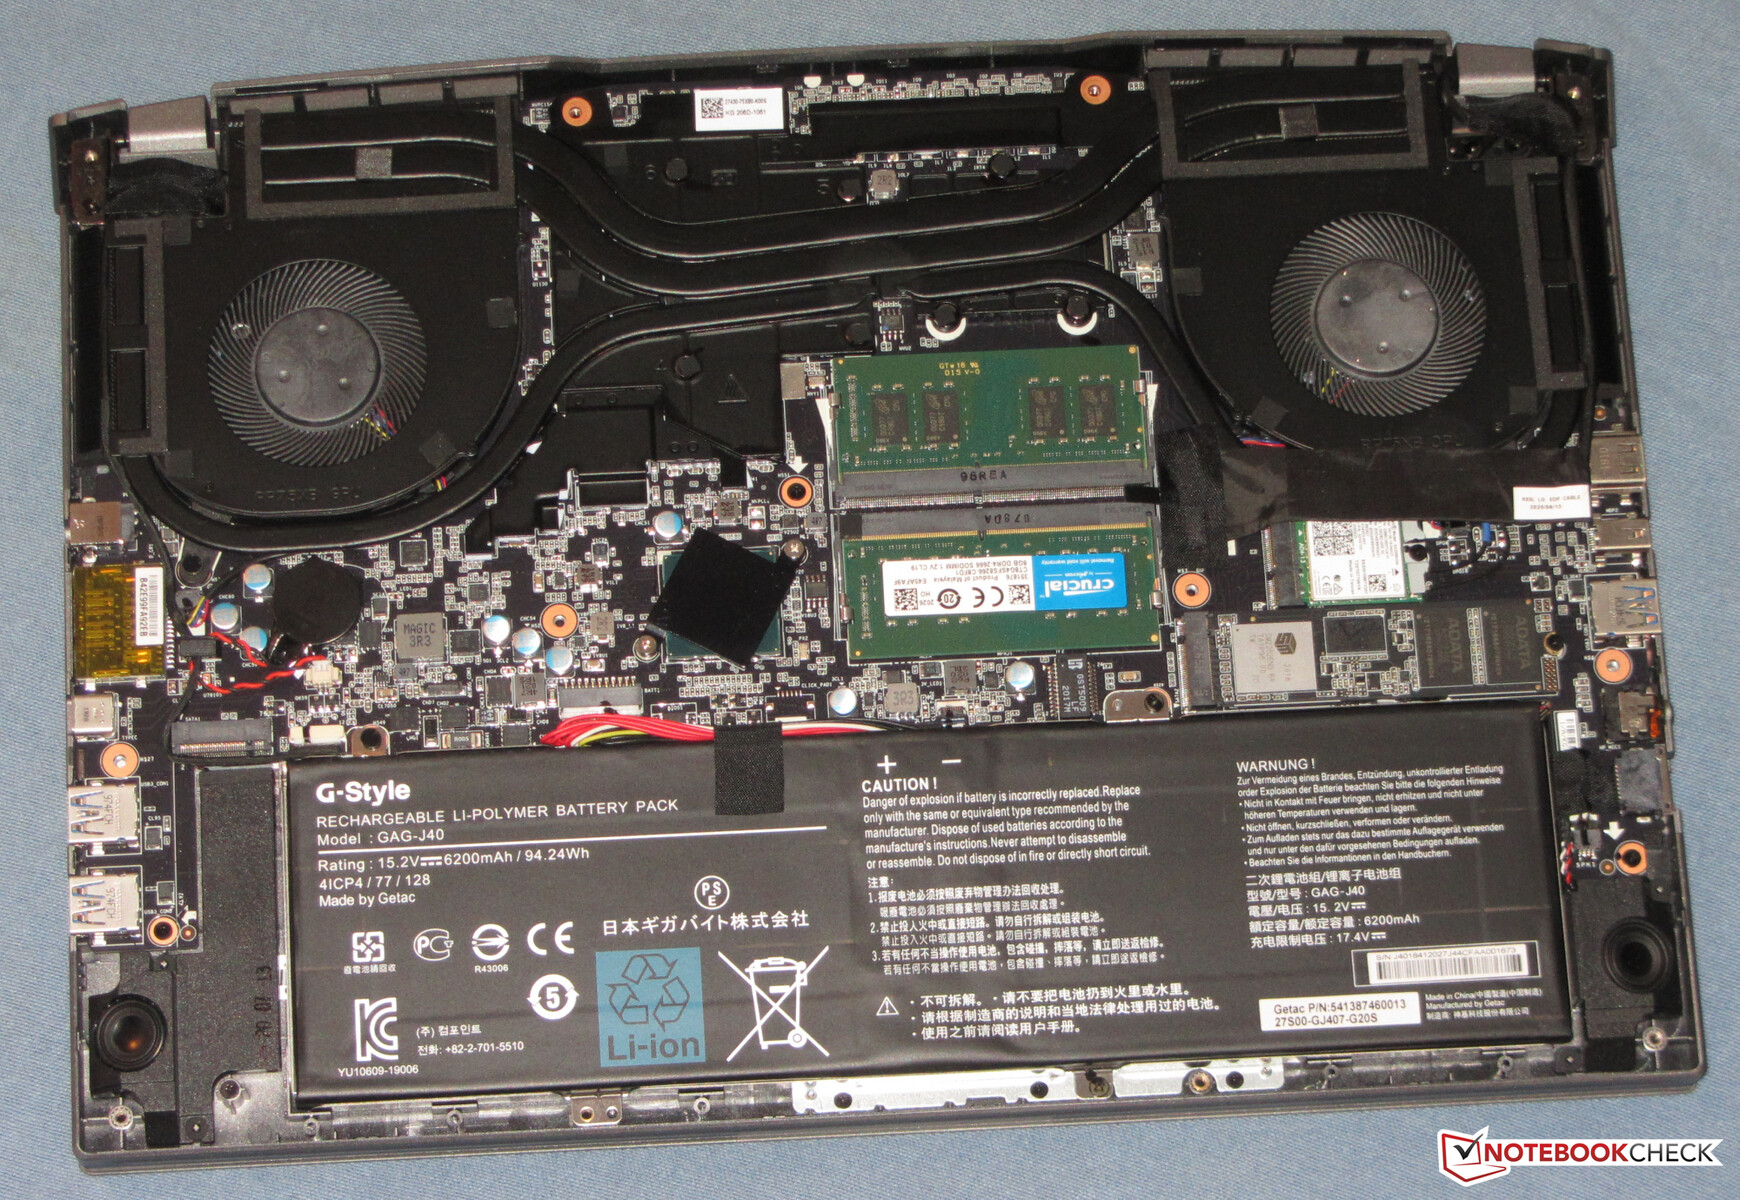
15P, Aorus 15G XB ile oldukça güçlü benzerliğini gizleyemez, ancak iki cihaz yapım açısından aynı değildir. 15G'nin kasası metalden yapılırken, Gigabyte 15P için gümüş gri plastik kullanıyor. Cihazlar, çekiciliğine katkıda bulunan çok dar ekran çerçevesine sahip. Avuç içi dayanağı ve kapağın arkası pürüzsüz yüzeylere sahiptir. Dizüstü bilgisayarın bakım kapağı yok. Dahası, pil sağlam bir şekilde yerleştirilmiş. Dizüstü bilgisayar çoğunlukla iyi üretildiğini kanıtlıyor. Kapağın alt köşeleri ve taban ünitesinin arka tarafında bulunan iki "boynuzun" arka köşeleri eleştiriyi hak ediyor. Bunlar çok keskindir. Burada kesinlikle yaralanma riski vardır. Dahası, kasa genel olarak daha büyük bir sertliğe sahip olmalıdır. Menteşeler, kapağı sıkıca yerinde tutuyor, ancak biraz sallanmasına izin veriyorlar. Kapağı tek elle açmak mümkündür. Maksimum diyafram açısı yaklaşık 135 derecedir.
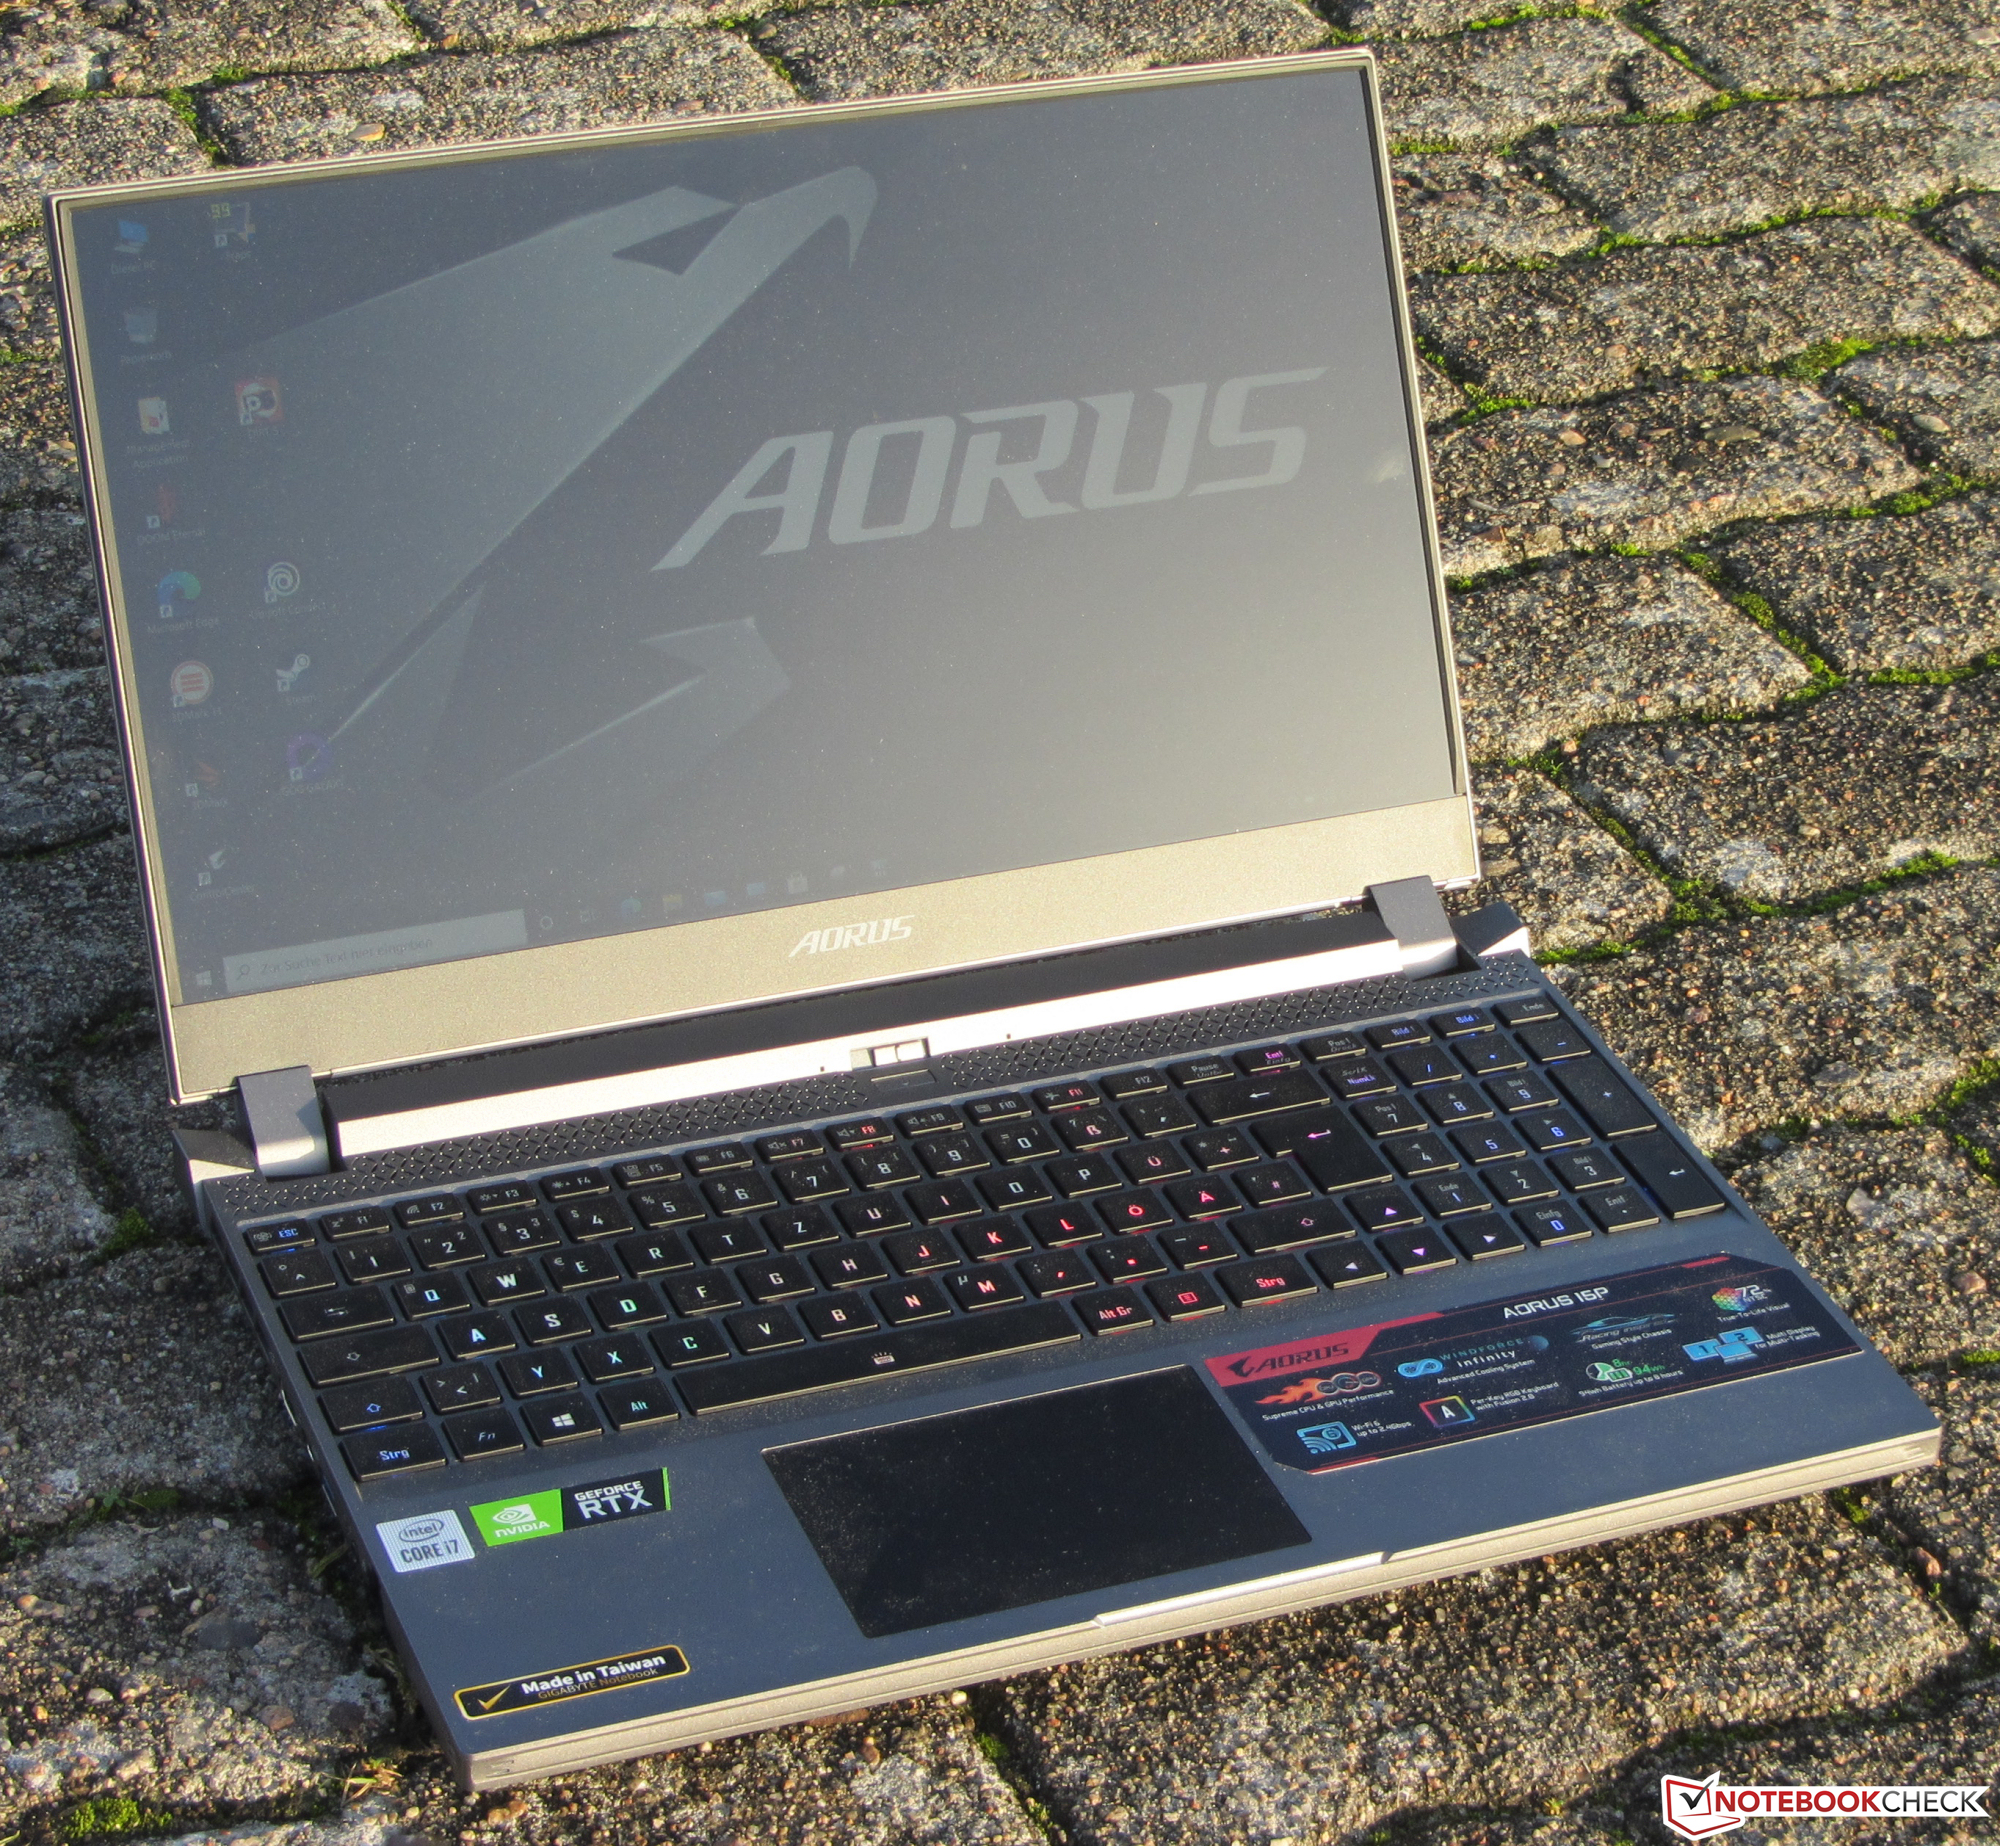
Karşılaştırma alanımızda, Aorus 15P, Acer Predator Triton 300 ile birlikte en kompakt ve en hafif cihazı temsil ediyor.
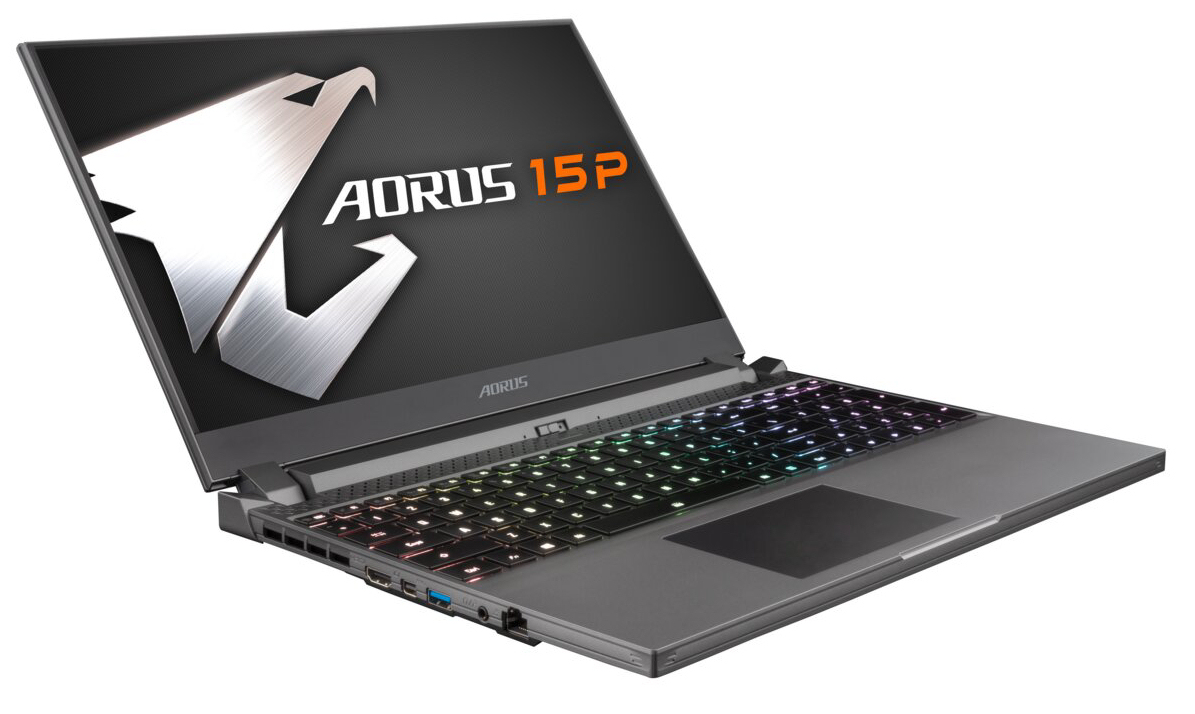
Bağlantı - Dahili Thunderbolt yok
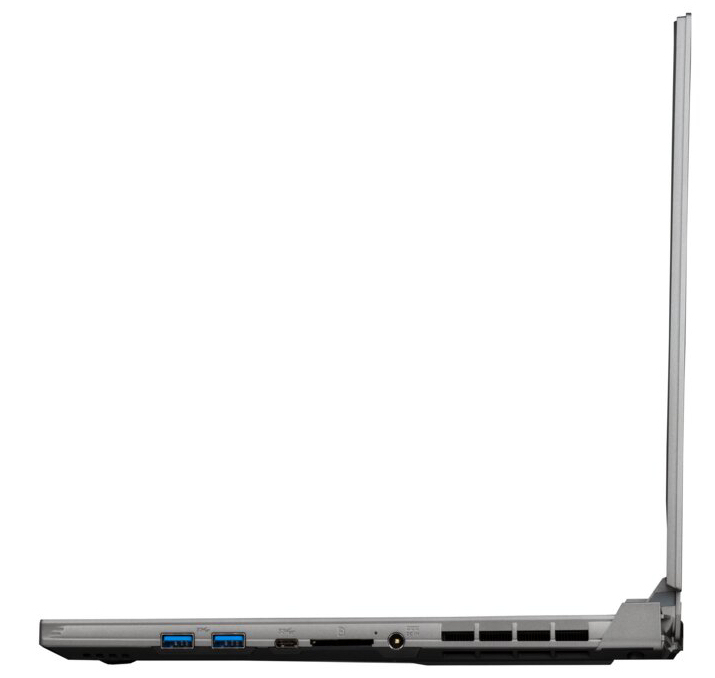
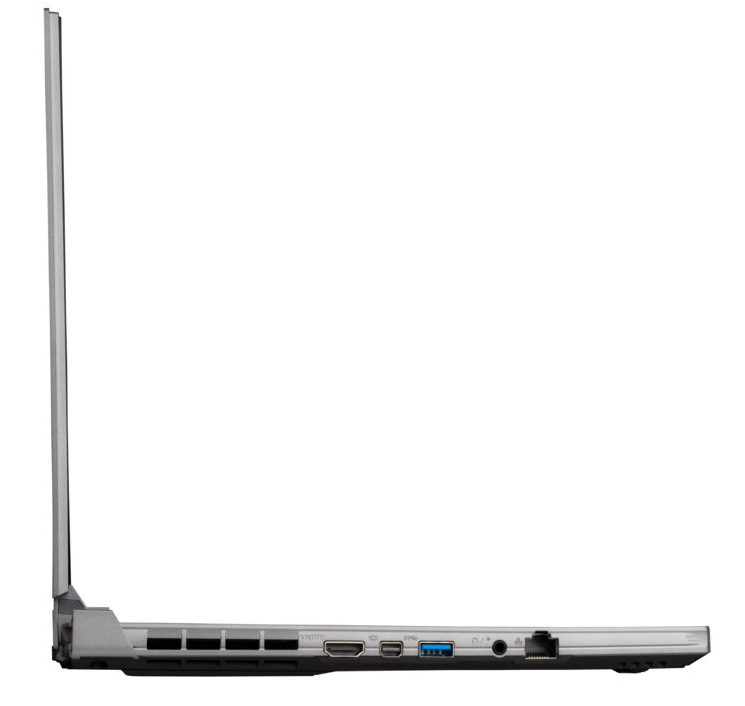
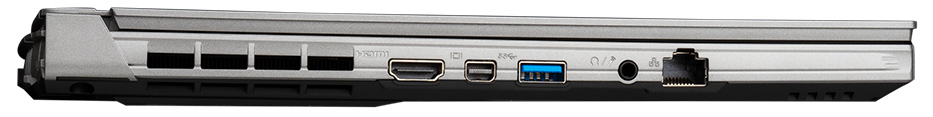
15,6 inçlik çok yönlü bir arayüz yelpazesi sağlar. Dört USB bağlantı noktası (3x Tip-A, 1x Tip-C) USB 3.2 Gen 1 standardına göre çalışır. Ek olarak, iki video çıkışı (HDMI 2.0, Mini DisplayPort 1.4), birleşik ses bağlantı noktası ve bir Gigabit Ethernet bağlantı noktası vardır. Dizüstü bilgisayar Thunderbolt sunmuyor.
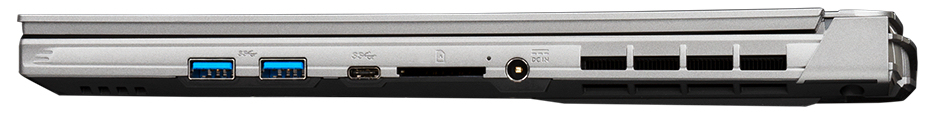
SD kart okuyucu
SD bellek kartı okuyucusu (referans kartı: Toshiba Exceria Pro SDXC 64 GB UHS-II) maksimum 208 MB / sn (her biri 5 MB 250 jpg görüntü dosyası aktaran) ve 243 MB / sn ( büyük veri bloklarının kopyalanması). Hafıza kartlarını tam olarak barındırmaz; iyi bir 14 mm çıkıntı yaparlar.
| SD Card Reader | |
| average JPG Copy Test (av. of 3 runs) | |
| Aorus 15P WB (Toshiba Exceria Pro SDXC 64 GB UHS-II) | |
| Sınıf ortalaması Gaming (20.9 - 210, n=55, son 2 yıl) | |
| Dell G5 15 SE 5505 P89F (Toshiba Exceria Pro SDXC 64 GB UHS-II) | |
| maximum AS SSD Seq Read Test (1GB) | |
| Aorus 15P WB (Toshiba Exceria Pro SDXC 64 GB UHS-II) | |
| Sınıf ortalaması Gaming (25.5 - 261, n=52, son 2 yıl) | |
| Dell G5 15 SE 5505 P89F (Toshiba Exceria Pro SDXC 64 GB UHS-II) | |
İletişim
WLAN yongası (Intel AX200), 802.11a / b / g / n / ac / ax standartlarını destekler ve Bluetooth 5 işlevselliği sunar. Optimum koşullar altında belirlenen veri hızları (yakınlarda başka WLAN cihazları yok, dizüstü bilgisayar ve sunucu PC arasında kısa mesafe) çok iyidir. Kablolu ağ bağlantıları, Realtek'in RTL8168 / 8111 ailesinden bir Gigabit Ethernet denetleyicisi tarafından yönetilir. Görevlerini sorunsuz yerine getirir.
| Networking | |
| iperf3 transmit AX12 | |
| Dell G5 15 SE 5505 P89F | |
| Acer Predator Triton 300 PT315-52-79LP | |
| Aorus 15P WB | |
| Ortalama Intel Wi-Fi 6 AX200 (447 - 1645, n=127) | |
| Asus ROG Strix G15 G512LW | |
| iperf3 receive AX12 | |
| Dell G5 15 SE 5505 P89F | |
| Acer Predator Triton 300 PT315-52-79LP | |
| Aorus 15P WB | |
| Ortalama Intel Wi-Fi 6 AX200 (523 - 1684, n=128) | |
| Asus ROG Strix G15 G512LW | |
Web kamerası
Web kamerası (0,9 MP), maksimum 1280x720 piksel çözünürlüğe sahip görüntüler üretir. Dahası, renk doğruluğuyla ilgili sorunlar var. Neredeyse 18'lik bir renk sapması ile hedef (Delta E 3'ten küçük) kaçırılır. Kamera, ekran çerçevesinde değil, bunun yerine ana ünitede, klavyenin üzerinde bulunur.


")
")
Aksesuarlar
Dizüstü bilgisayar, normal belgelerle birlikte gelir: Hızlı başlangıç kılavuzu ve garanti bilgileri. Ayrıca, kutuda ikinci bir M.2 SSD için bir termal ped bulunur.
Bakım
Dizüstü bilgisayarın bakım kapağı yok. İçeriye erişmek için alt kapağın çıkarılması gerekiyor. Cihazın alt tarafındaki tüm vidaları çıkardıktan sonra, alt kapak çıkarılabilir - en azından test cihazımızda durum böyleydi. Her ihtimale karşı bir harç bitirme aleti veya düz bir spatula hazır bulundurulmalıdır.
Garanti
Gigabyte, dizüstü bilgisayara iki yıllık garanti verir. Herhangi bir garanti uzantısı bulamadık.
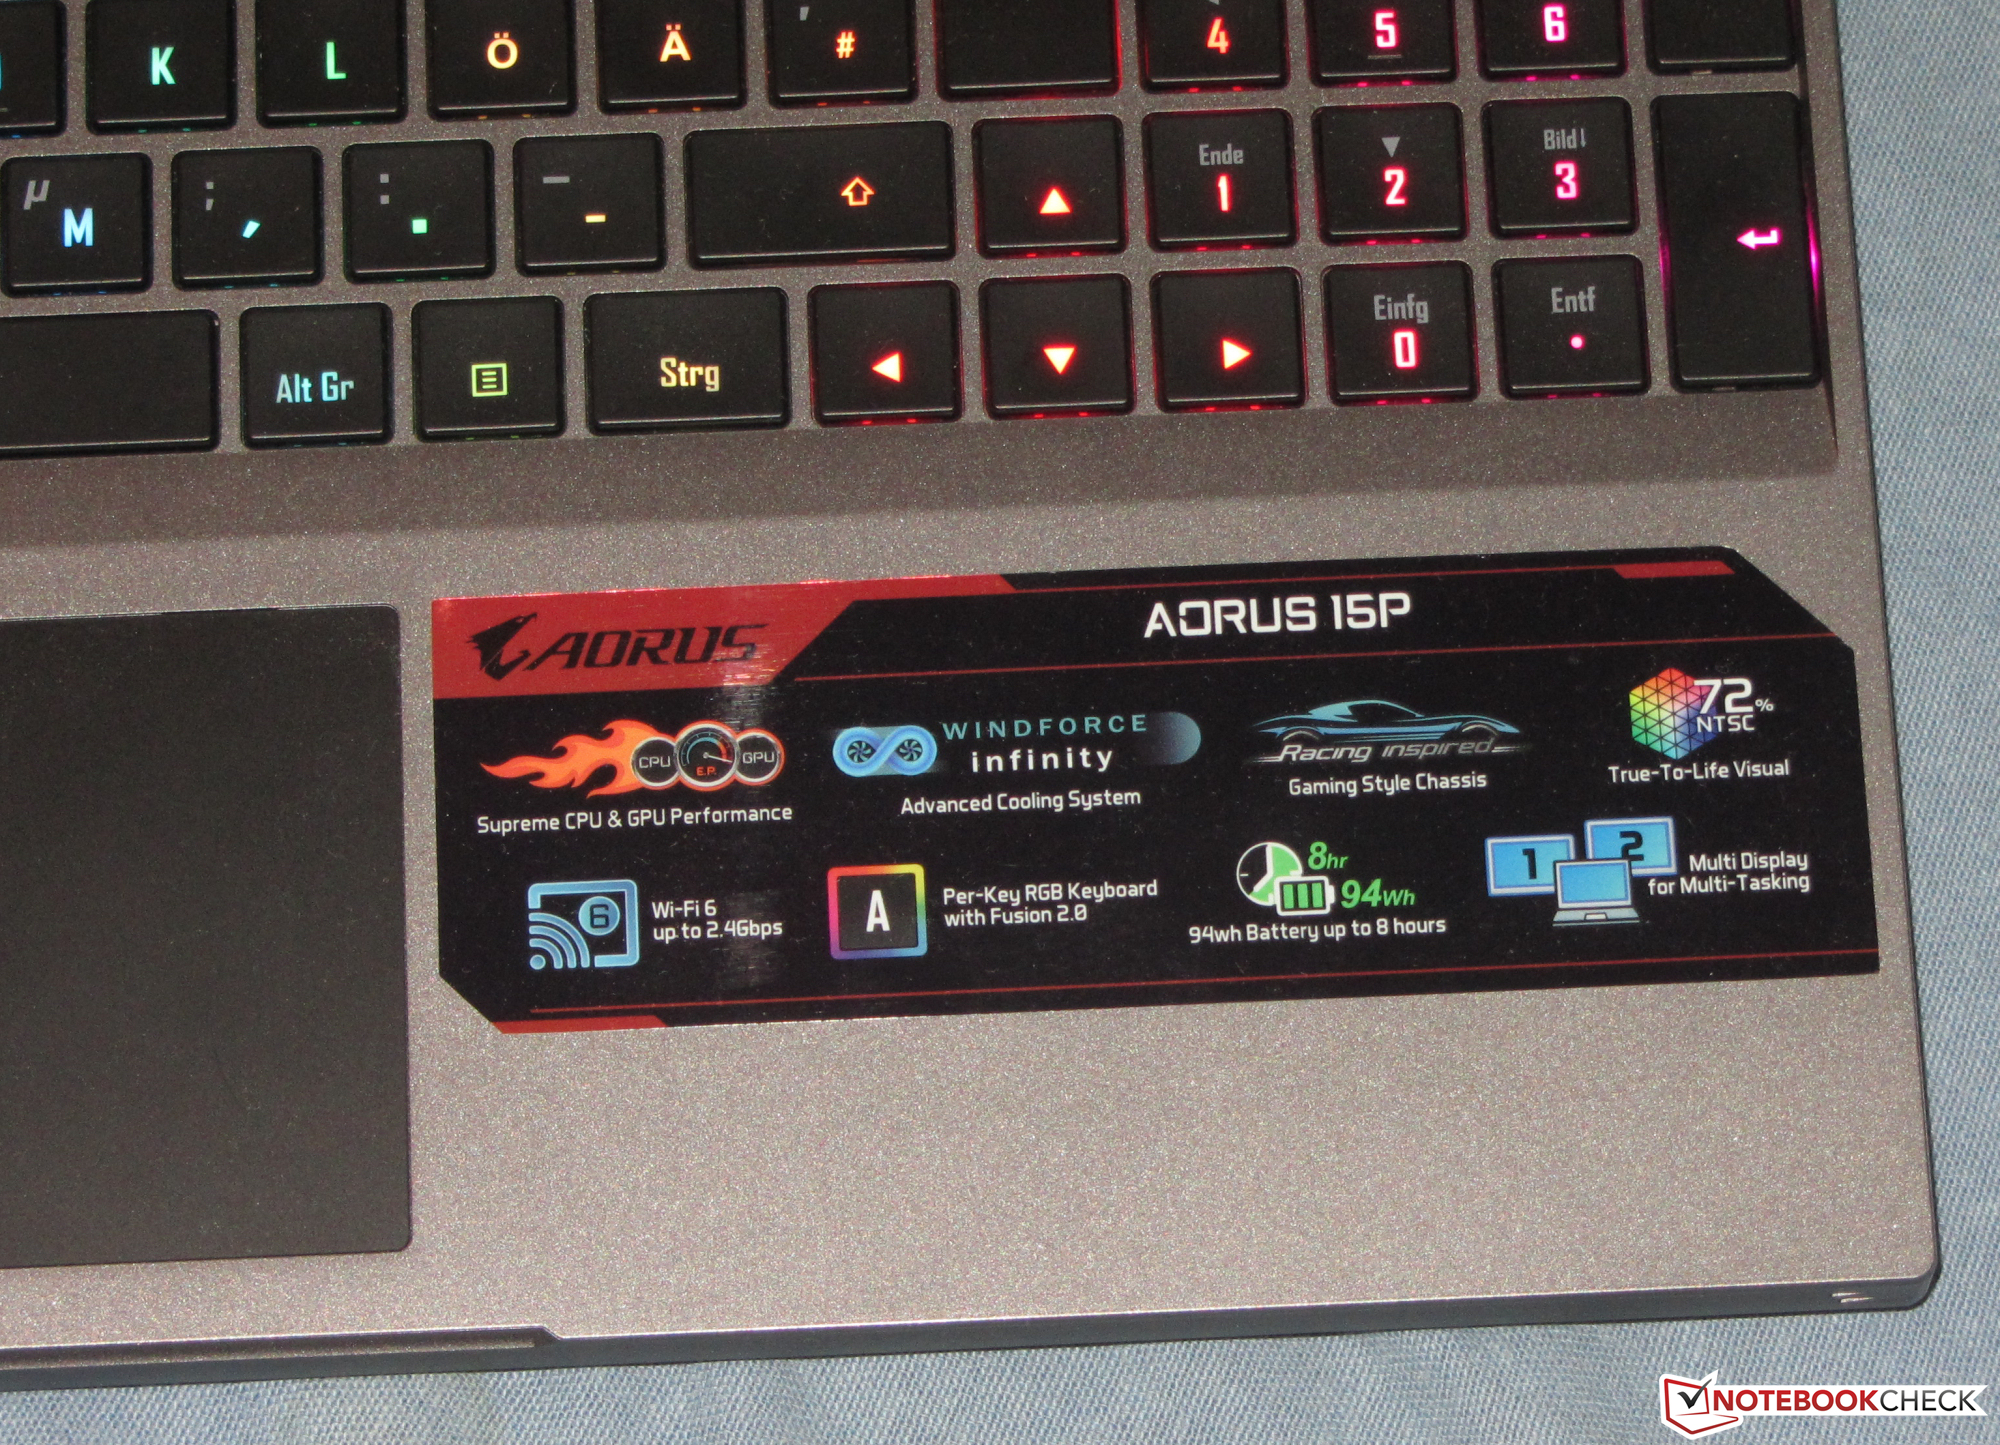
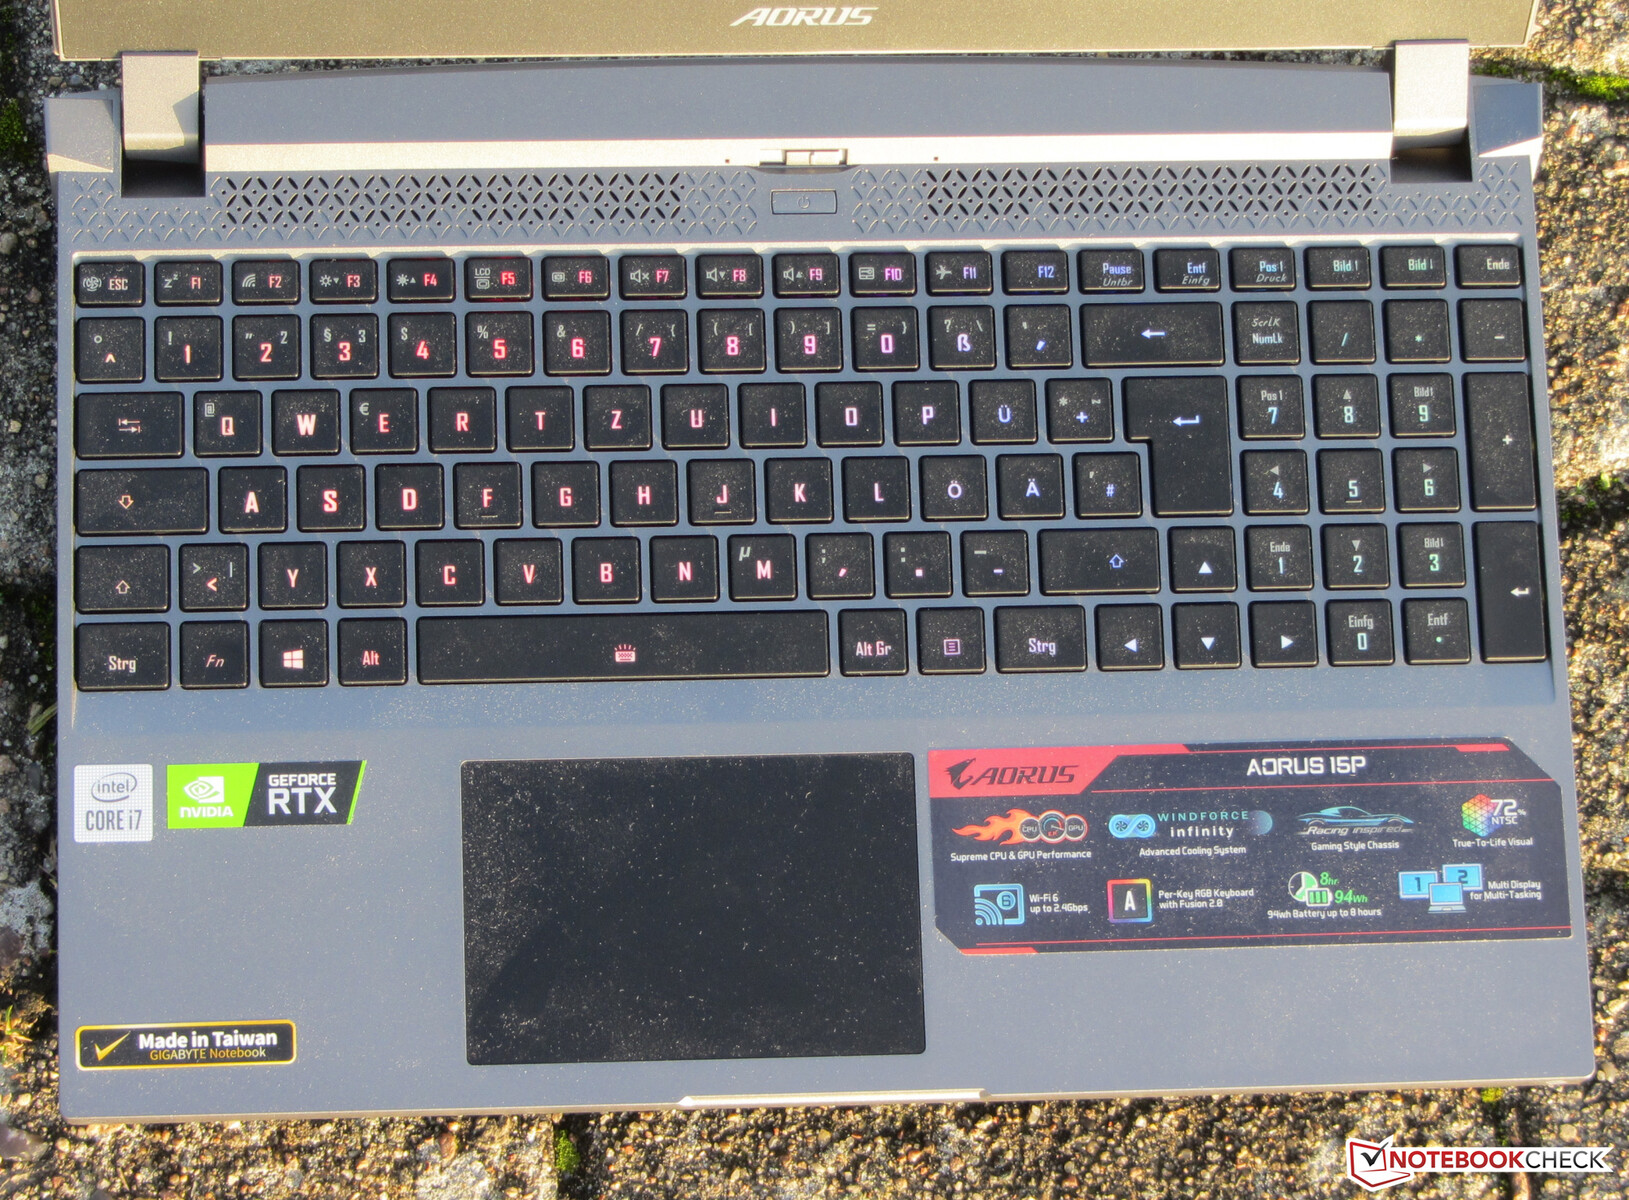
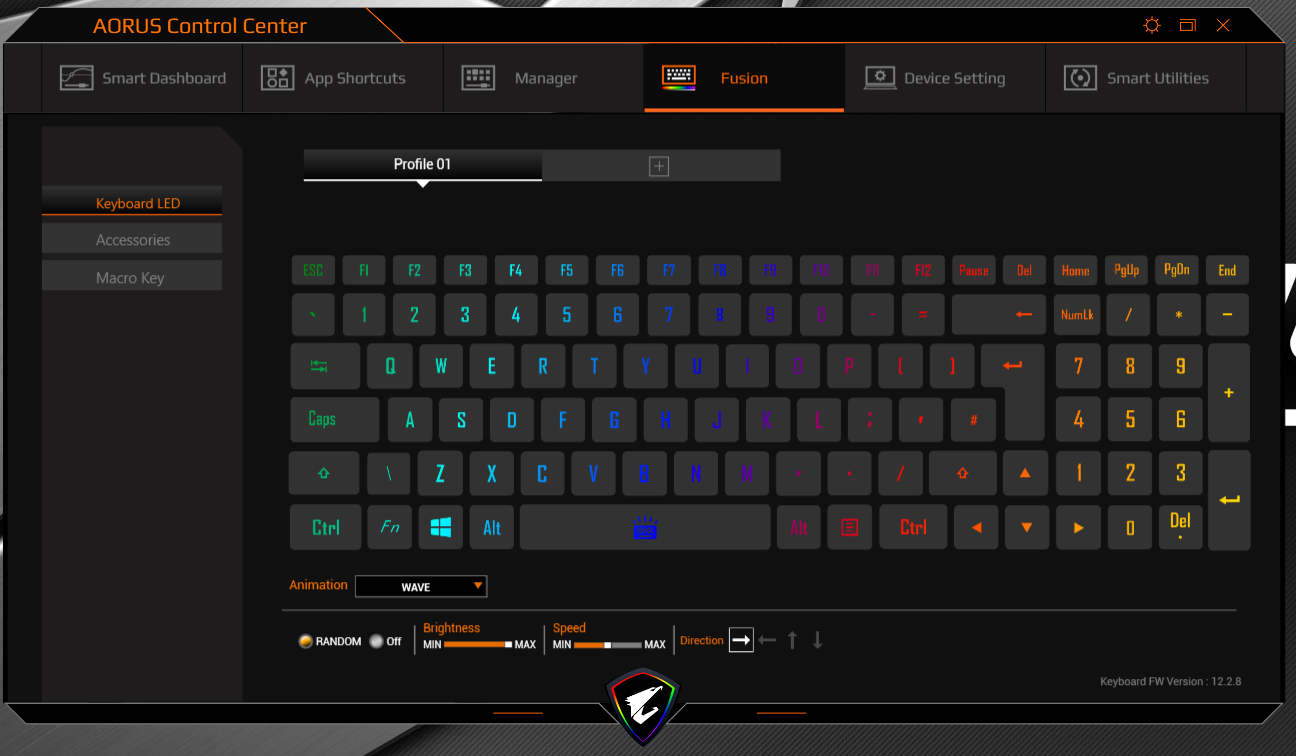
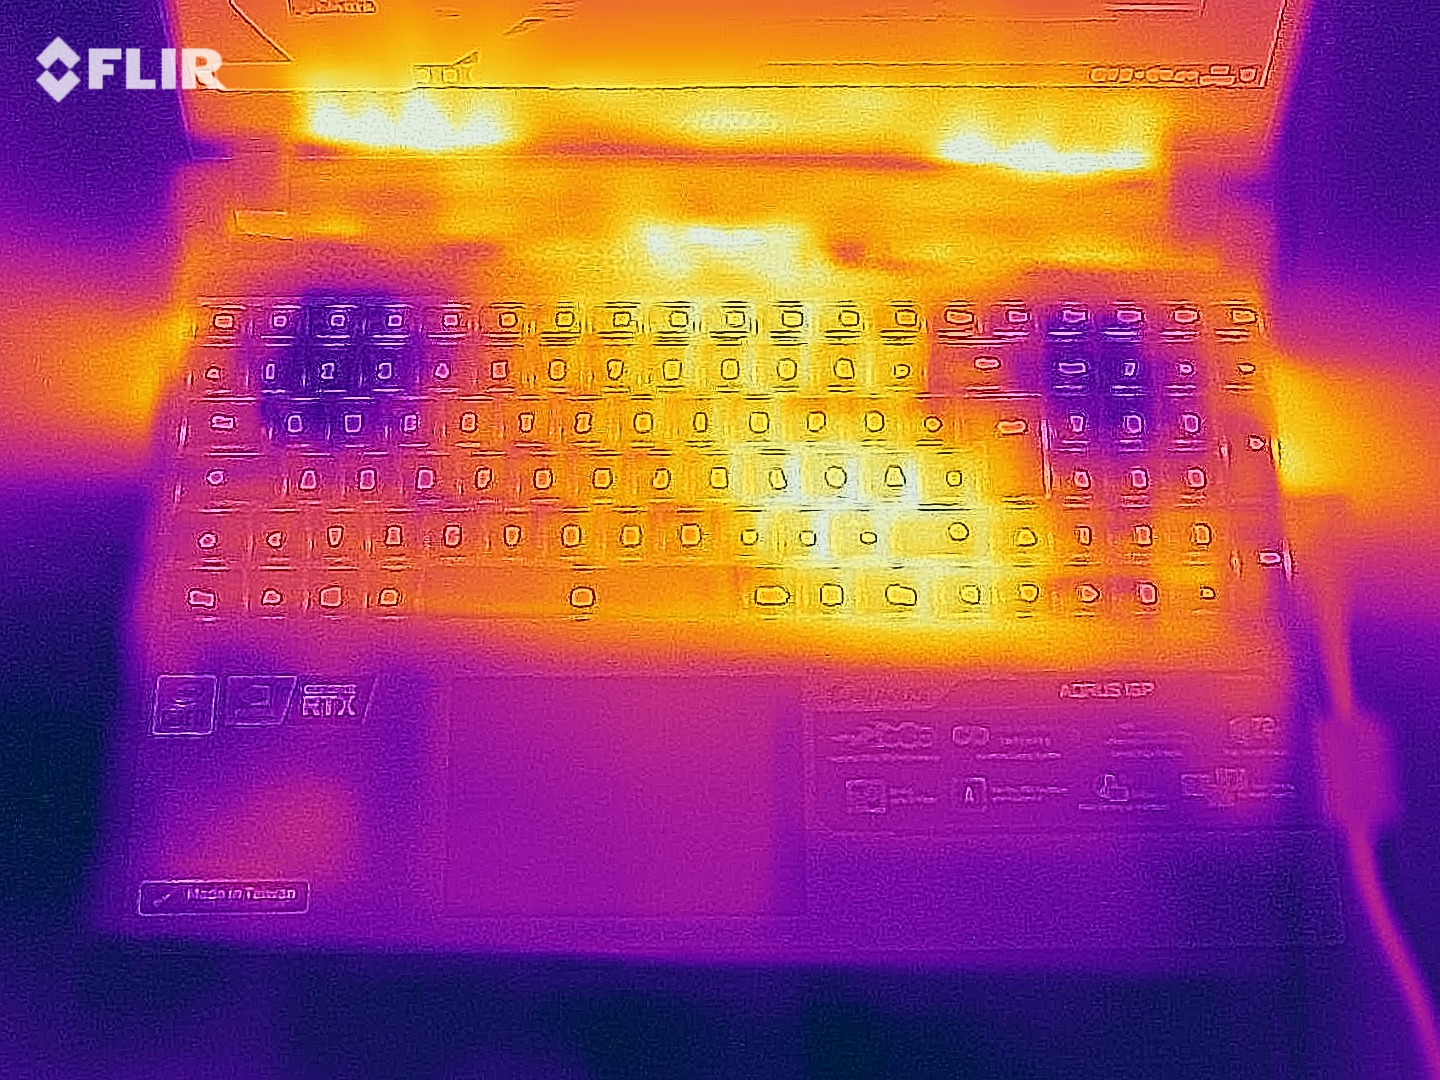
Giriş aygıtları - Arkadan aydınlatmalı klavyeye sahip Aorus dizüstü bilgisayar
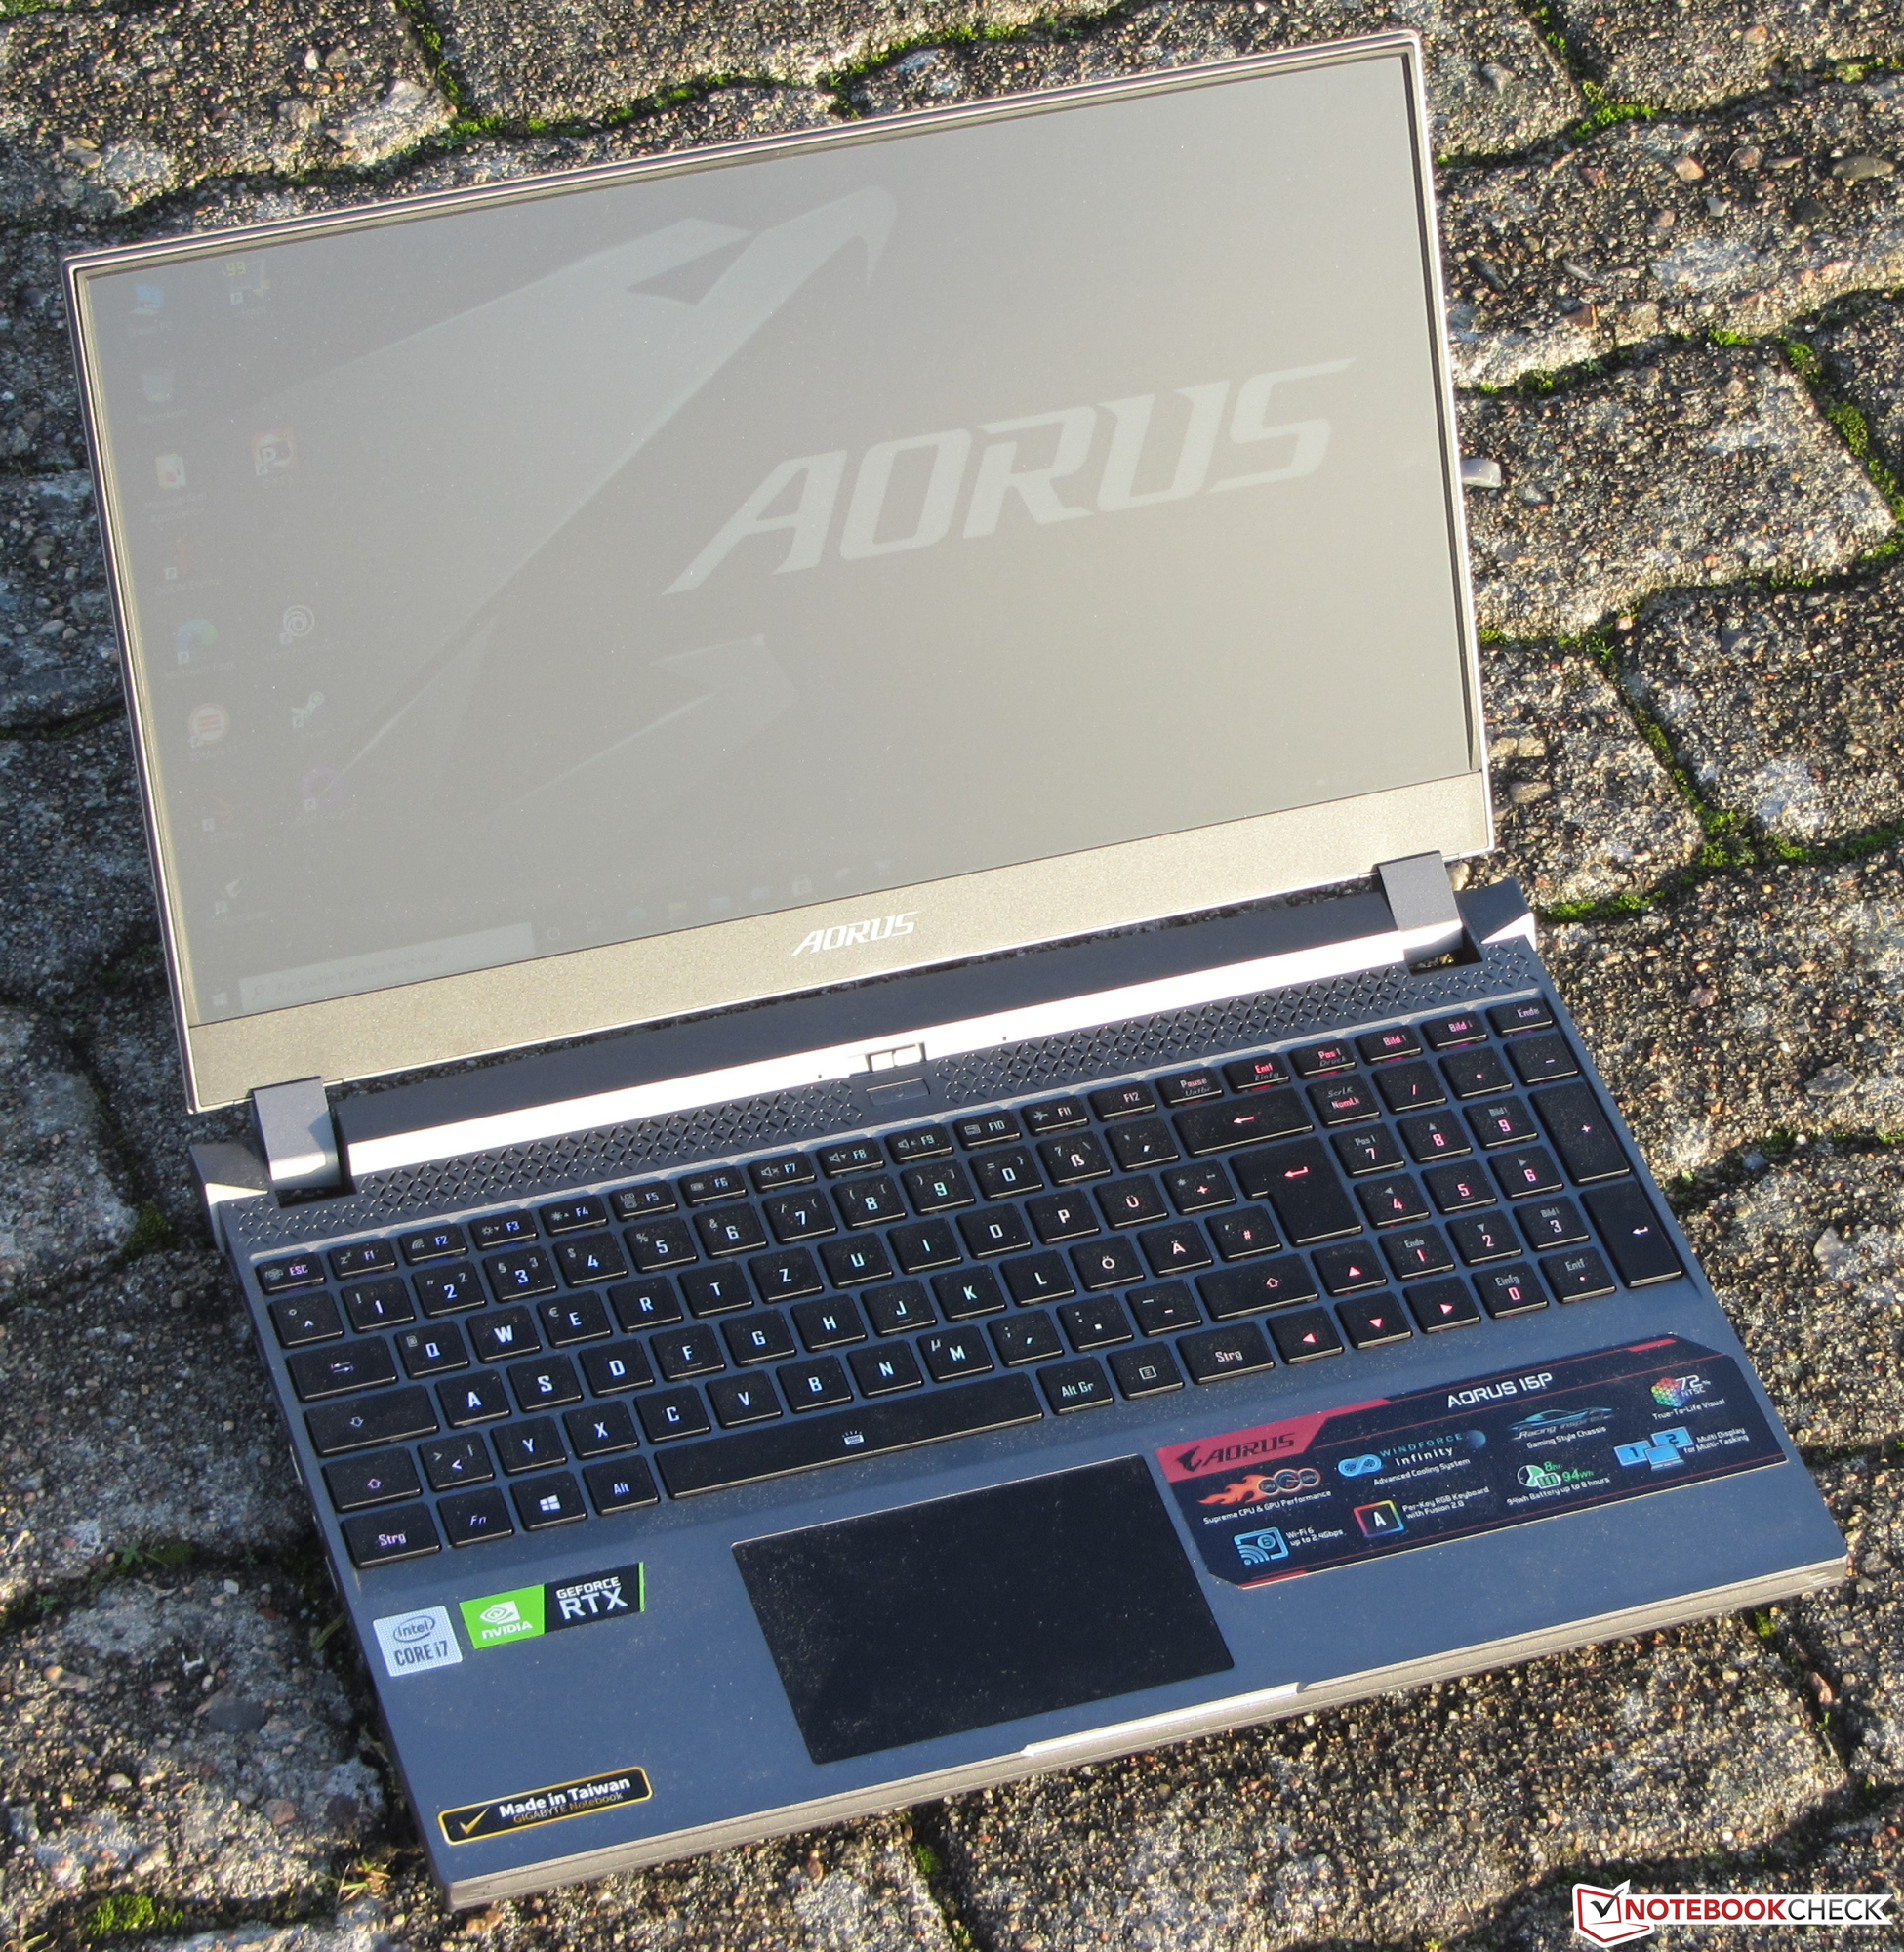
Klavye 15P, sayısal tuş takımı içeren arkadan aydınlatmalı bir çiklet klavyeyle birlikte gelir. Yumuşak tuşlar, orta bir hareket ve net bir basınç noktası sunar. Oldukça net tuş direnci sevindirici. Dahası, klavye yazarken biraz eğiliyor. Yine de aşırı derecede sinir bozucu olduğu kanıtlanmadı. Genel olarak, Gigabyte burada günlük kullanım için uygun bir klavye sunar.
Dokunmatik yüzey
Çoklu dokunma özellikli bir ClickPad (10,6 x 7,1 cm), fare yerine geçme işlevi görür. Pürüzsüz yüzeyi parmakların üzerinde kaymasını kolaylaştırır. Ayrıca köşelerdeki girdilere de yanıt verir. Ped, kısa bir hareket ve net bir basınç noktası sunar.
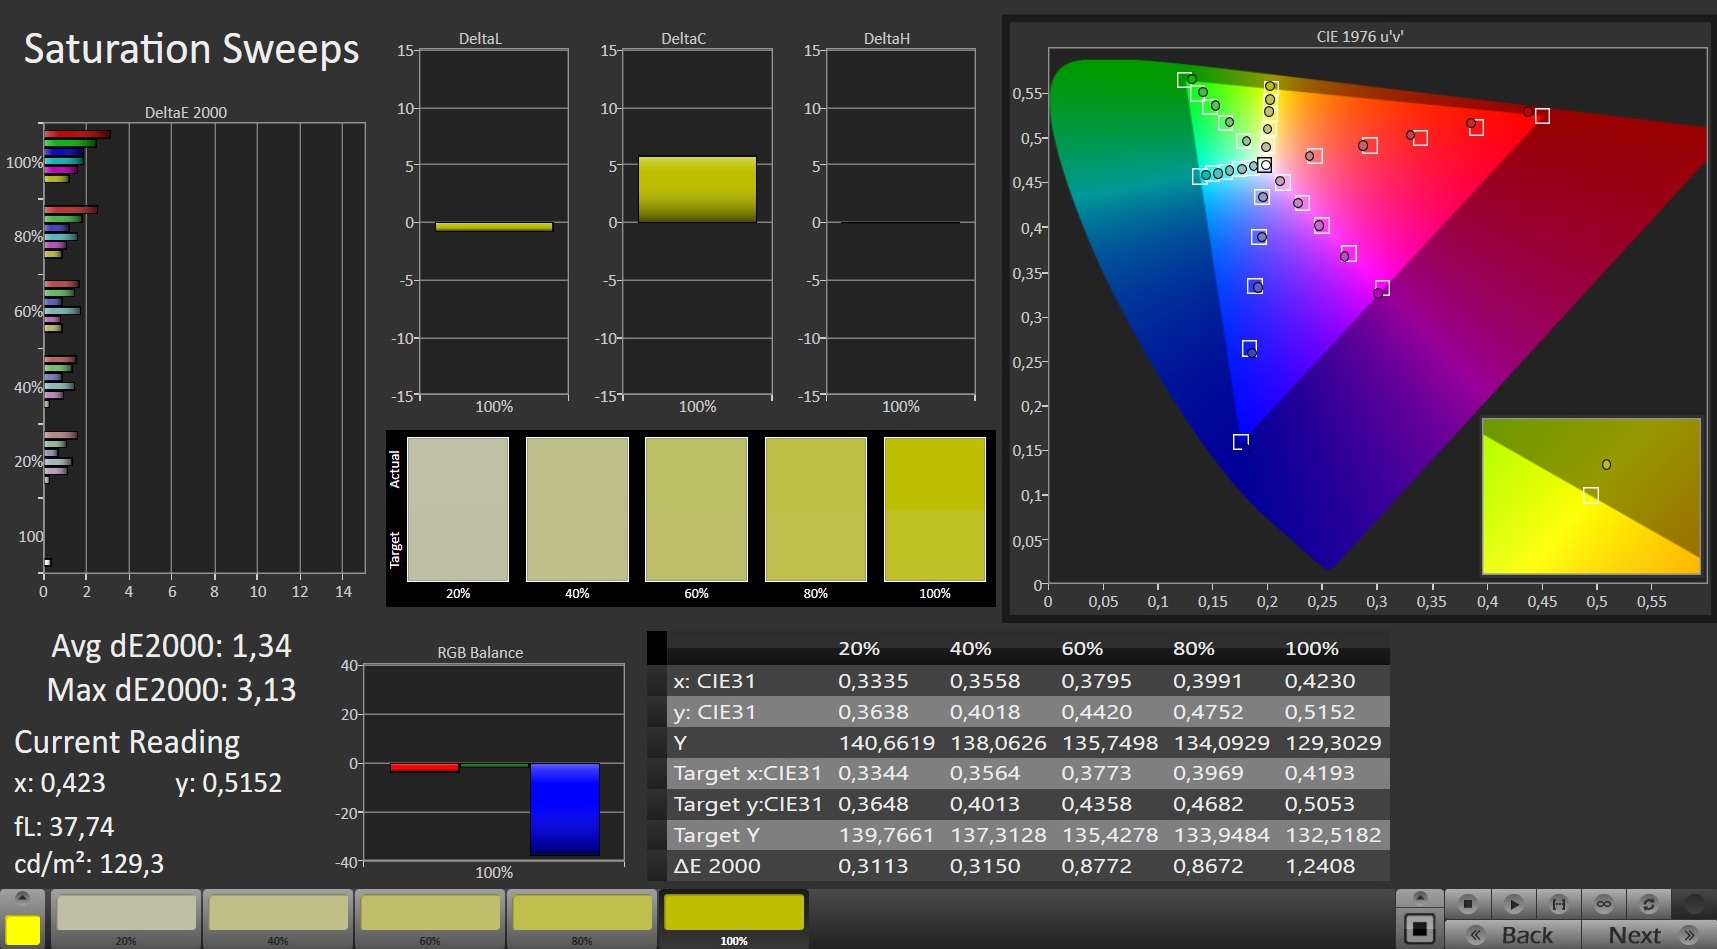
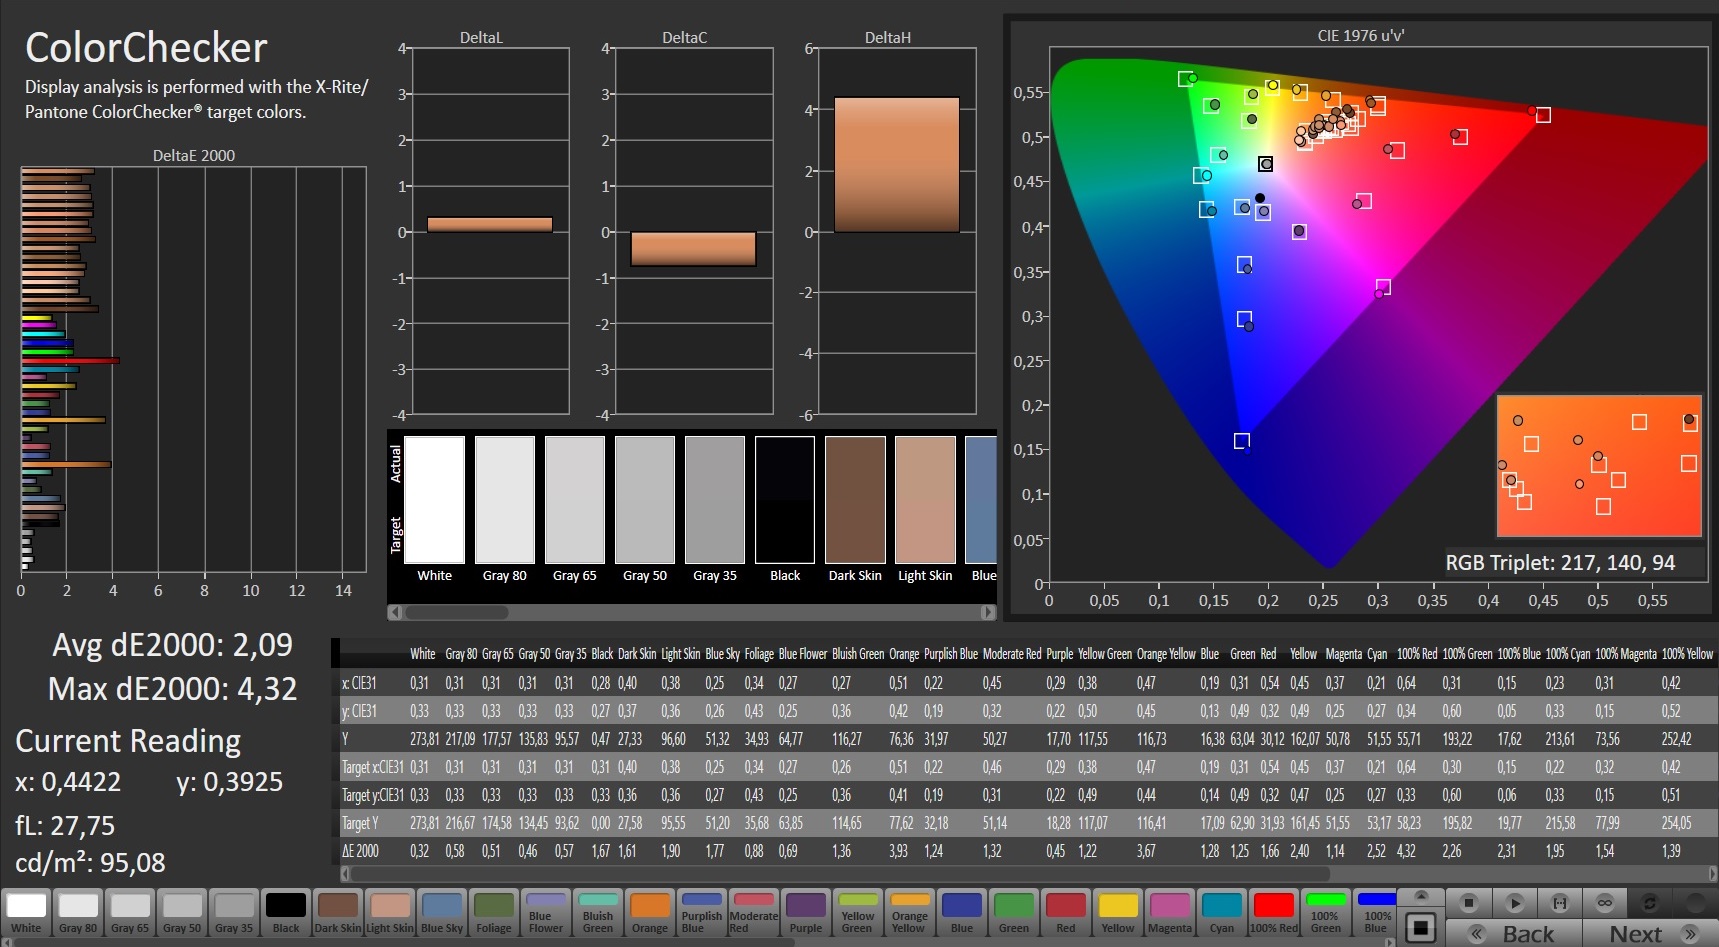
Ekran - 144 Hz IPS
Mat 15,6 inç ekran, 1920x1080 piksel doğal çözünürlüğe sahiptir. Kontrast (833: 1) ve parlaklık (267,7 cd / m²) çok düşük. Sırasıyla 1.000: 1 ve 300 cd / m²'nin ötesindeki değerlerin iyi olduğunu düşünüyoruz. Burada kullanılan 144 Hz panel, hızlı tepki sürelerine sahip puanlar.
| |||||||||||||||||||||||||
Aydınlatma: 91 %
Batarya modunda parlaklık: 275 cd/m²
Kontrast: 833:1 (Siyah: 0.33 cd/m²)
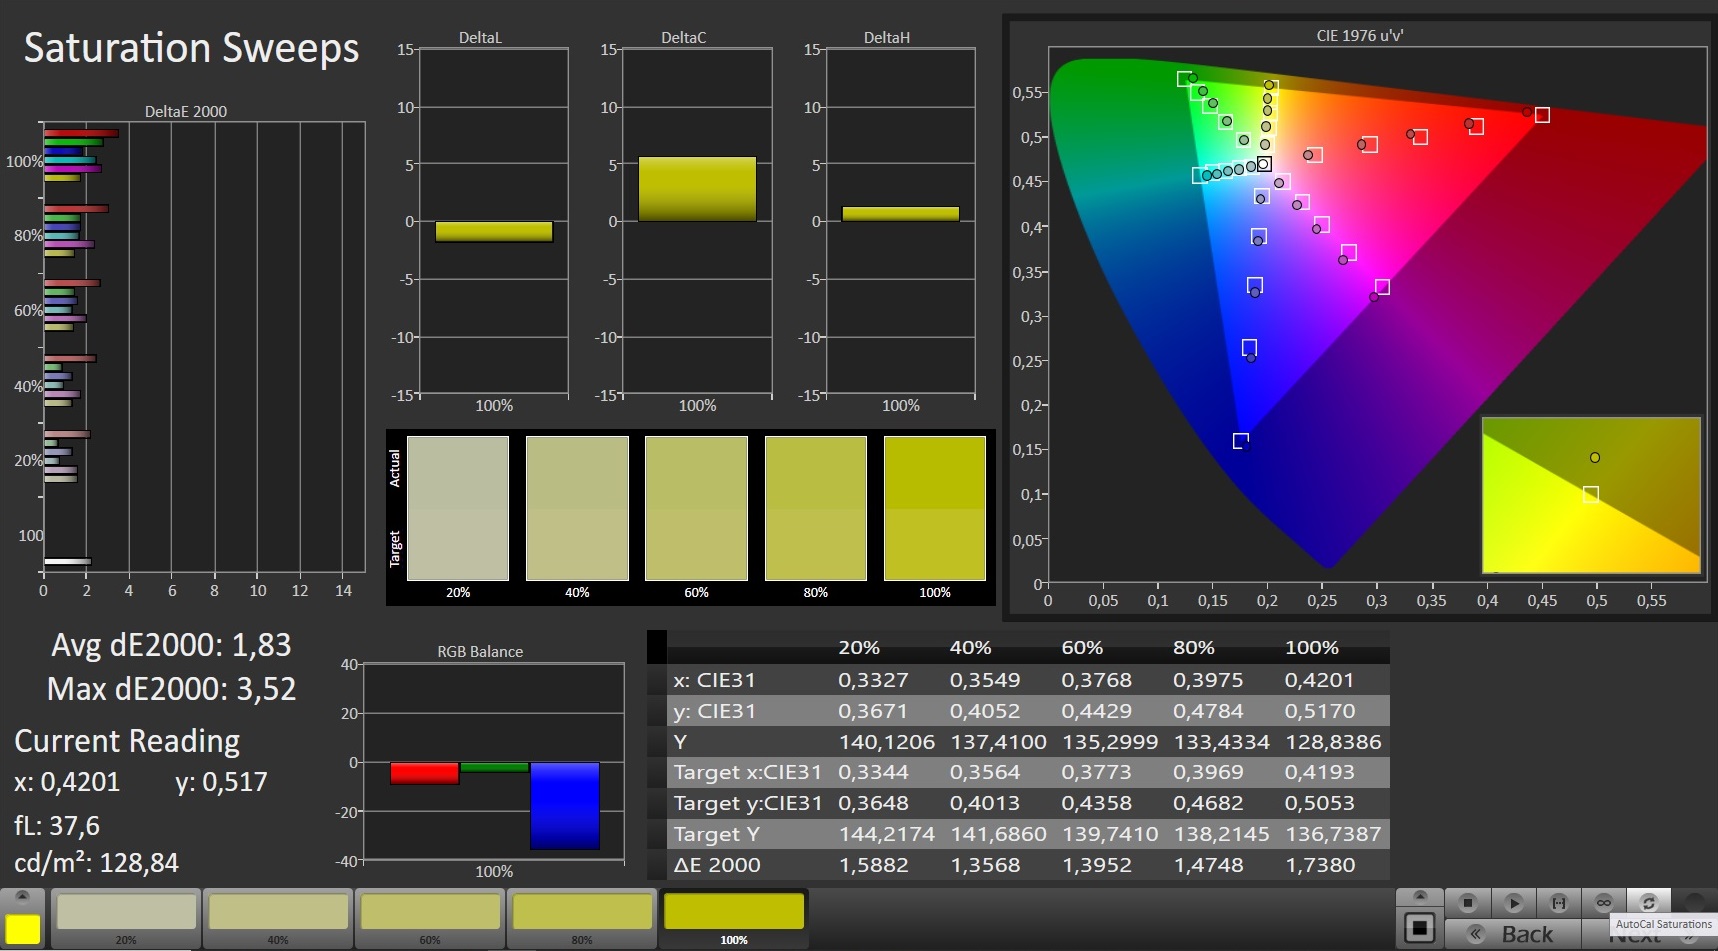
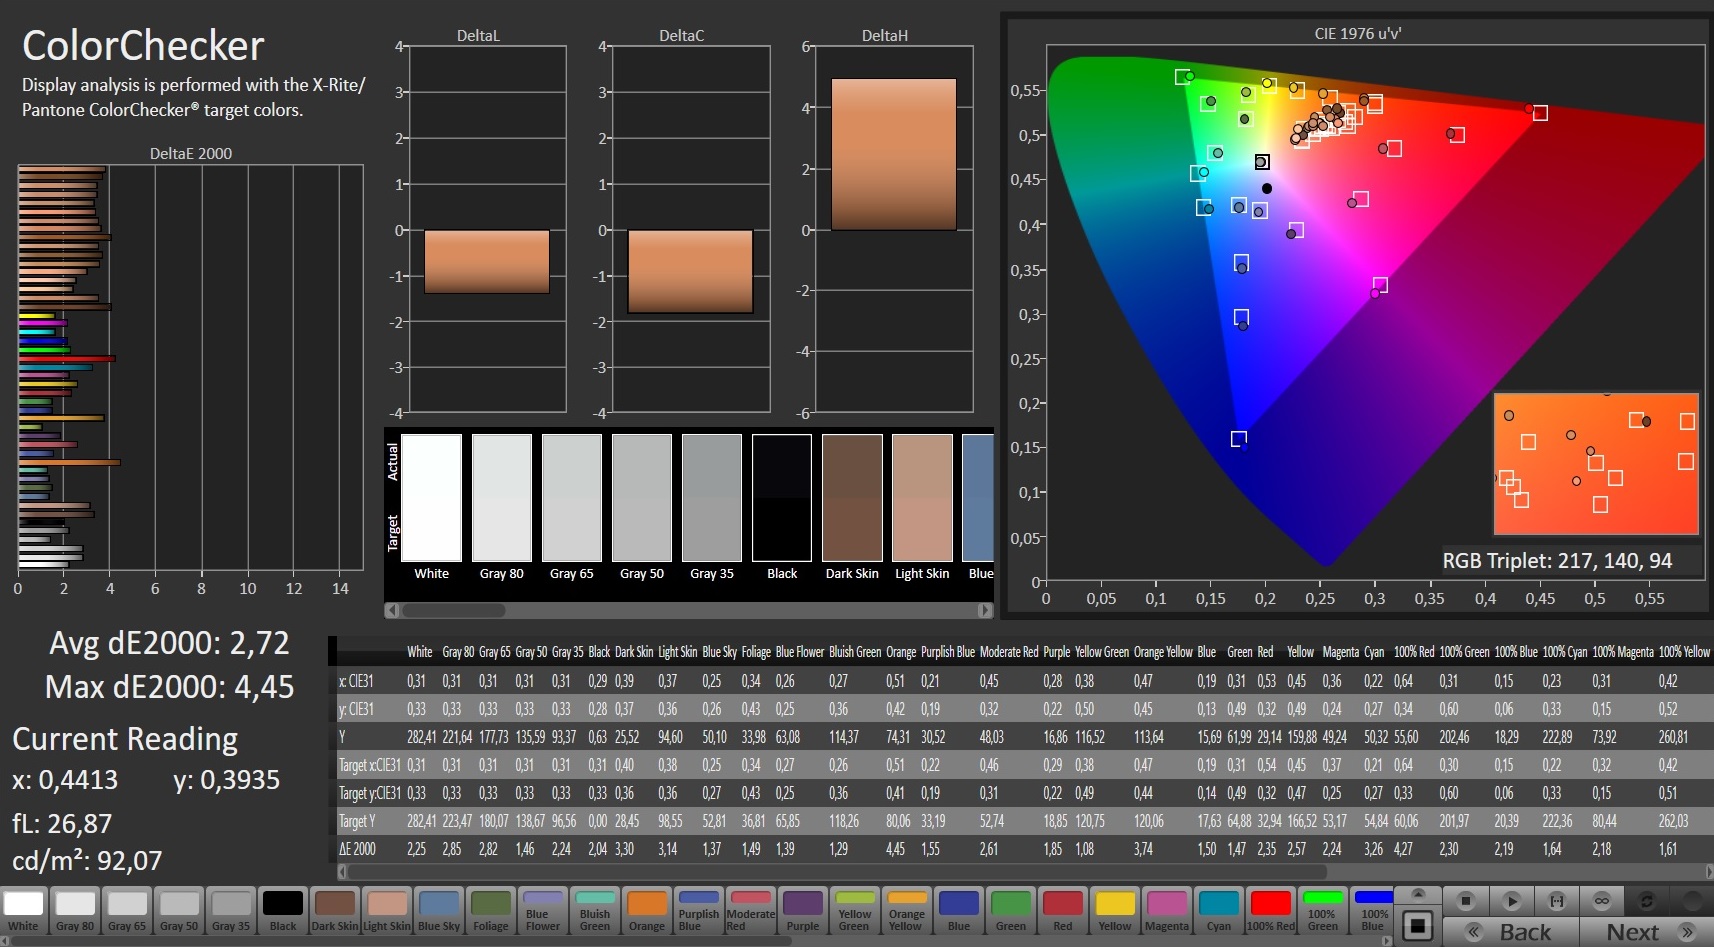
ΔE ColorChecker Calman: 2.72 | ∀{0.5-29.43 Ø4.73}
calibrated: 2.09
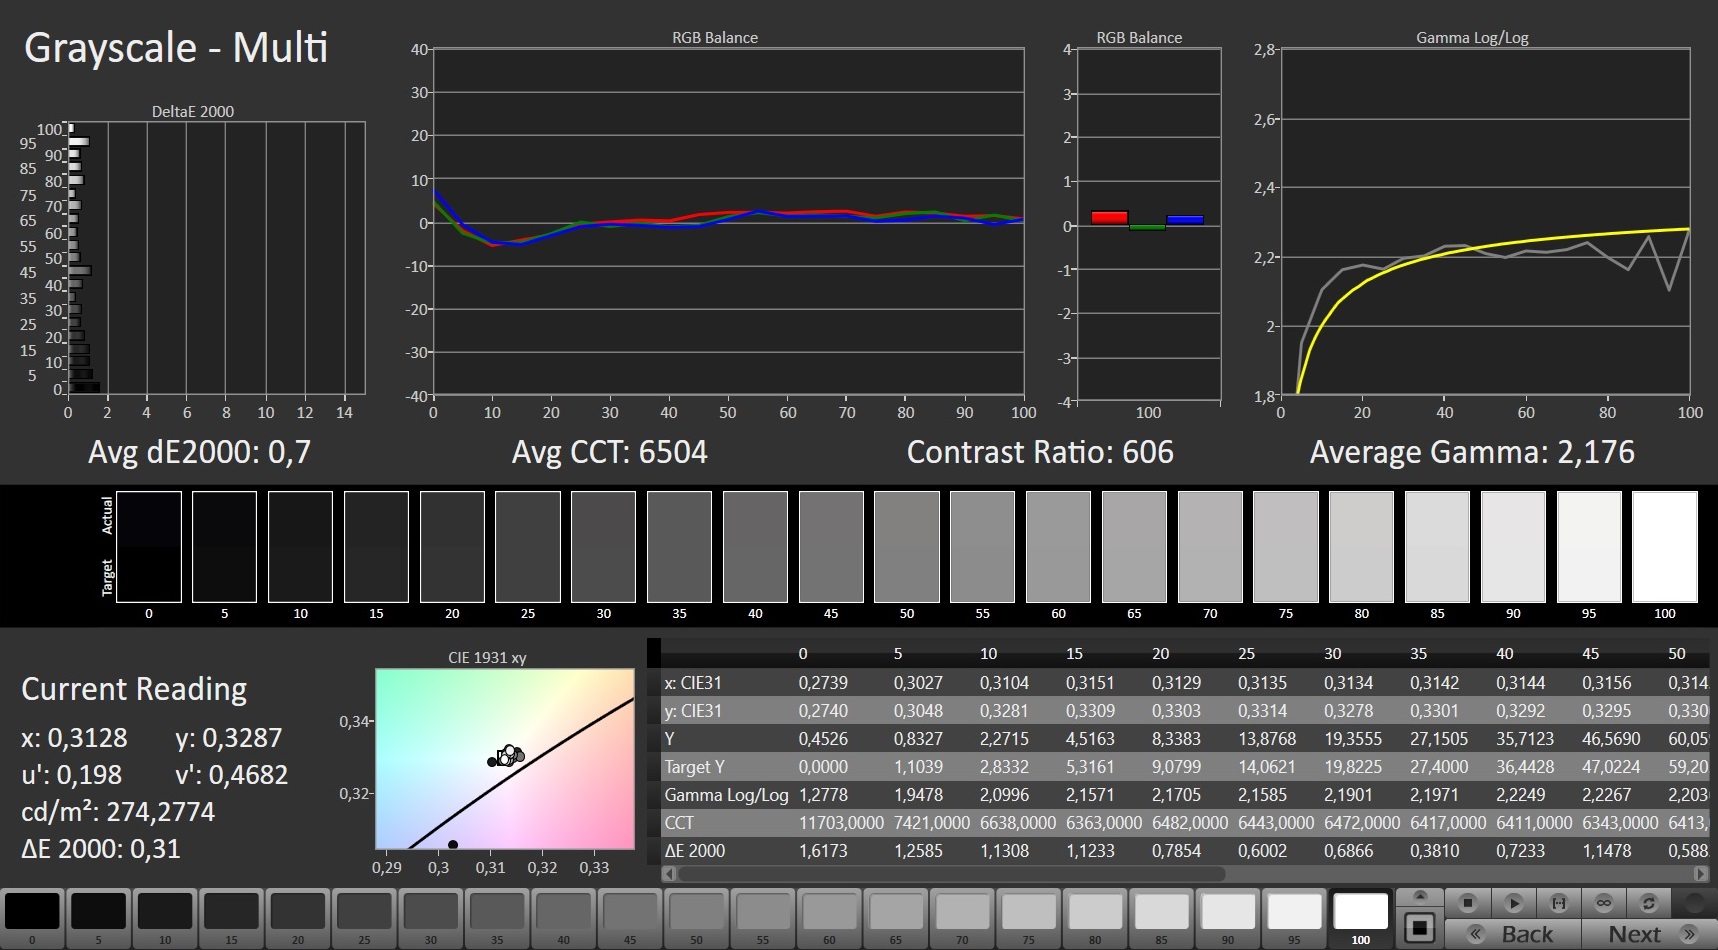
ΔE Greyscale Calman: 2.3 | ∀{0.09-98 Ø4.97}
90% sRGB (Argyll 1.6.3 3D)
65% AdobeRGB 1998 (Argyll 1.6.3 3D)
64.6% AdobeRGB 1998 (Argyll 3D)
91.3% sRGB (Argyll 3D)
63% Display P3 (Argyll 3D)
Gamma: 2.266
CCT: 6933 K
| Aorus 15P WB BOE HF NV156FHM-N4G, IPS, 1920x1080, 15.6" | Acer Predator Triton 300 PT315-52-79LP BOE08FB, IPS, 1920x1080, 15.6" | Asus ROG Strix G15 G512LW Sharp LQ156M1JW09, IPS, 1920x1080, 15.6" | Dell G5 15 SE 5505 P89F BOE NV156FH, WVA, 1920x1080, 15.6" | |
|---|---|---|---|---|
| Display | -37% | 7% | -1% | |
| Display P3 Coverage (%) | 63 | 39.51 -37% | 67.8 8% | 63 0% |
| sRGB Coverage (%) | 91.3 | 58.1 -36% | 98.3 8% | 90.1 -1% |
| AdobeRGB 1998 Coverage (%) | 64.6 | 40.81 -37% | 68.5 6% | 64.1 -1% |
| Response Times | -175% | -48% | -75% | |
| Response Time Grey 50% / Grey 80% * (ms) | 8.8 ? | 29.2 ? -232% | 16 ? -82% | 20.4 ? -132% |
| Response Time Black / White * (ms) | 9.2 ? | 20 ? -117% | 10.4 ? -13% | 10.8 ? -17% |
| PWM Frequency (Hz) | 23580 ? | 198.4 ? | ||
| Screen | -65% | -19% | -12% | |
| Brightness middle (cd/m²) | 275 | 279 1% | 300.9 9% | 292 6% |
| Brightness (cd/m²) | 268 | 257 -4% | 289 8% | 290 8% |
| Brightness Distribution (%) | 91 | 89 -2% | 92 1% | 77 -15% |
| Black Level * (cd/m²) | 0.33 | 0.31 6% | 0.31 6% | 0.27 18% |
| Contrast (:1) | 833 | 900 8% | 971 17% | 1081 30% |
| Colorchecker dE 2000 * | 2.72 | 5.84 -115% | 3.54 -30% | 3.99 -47% |
| Colorchecker dE 2000 max. * | 4.45 | 21.8 -390% | 9.82 -121% | 6.11 -37% |
| Colorchecker dE 2000 calibrated * | 2.09 | 4.54 -117% | 1 52% | 3.02 -44% |
| Greyscale dE 2000 * | 2.3 | 3.1 -35% | 5.9 -157% | 3.3 -43% |
| Gamma | 2.266 97% | 2.116 104% | 2.37 93% | 2.25 98% |
| CCT | 6933 94% | 6577 99% | 7456 87% | 7047 92% |
| Color Space (Percent of AdobeRGB 1998) (%) | 65 | 41 -37% | 63.3 -3% | 58.1 -11% |
| Color Space (Percent of sRGB) (%) | 90 | 59 -34% | 98.3 9% | 89.7 0% |
| Toplam Ortalama (Program / Ayarlar) | -92% /
-74% | -20% /
-18% | -29% /
-18% |
* ... daha küçük daha iyidir
Already out of the box, the display shows good color reproduction. With a color deviation of 2.72, the target (Delta E less than 3) is met. The display doesn't suffer from a blue tint. Moreover, improvements are achieved by means of calibration: The color deviation drops to 2.09, and the grayscales are displayed in a more balanced way. The AdobeRGB (65%) and sRGB (90%) color spaces are not completely reproduced.

Yanıt Sürelerini Görüntüle
| ↔ Tepki Süresi Siyahtan Beyaza | ||
|---|---|---|
| 9.2 ms ... yükseliş ↗ ve sonbahar↘ birleşimi | ↗ 4.8 ms yükseliş | 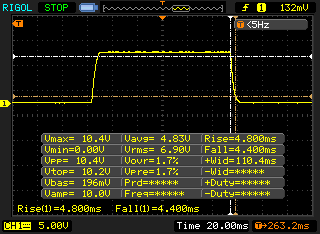 |
| ↘ 4.4 ms sonbahar | ||
| Ekran, testlerimizde hızlı yanıt oranları gösteriyor ve oyun oynamaya uygun olmalı. Karşılaştırıldığında, test edilen tüm cihazlar 0.1 (minimum) ile 240 (maksimum) ms arasında değişir. » Tüm cihazların 25 %'si daha iyi. Bu, ölçülen yanıt süresinin test edilen tüm cihazların ortalamasından (19.9 ms) daha iyi olduğu anlamına gelir. | ||
| ↔ Tepki Süresi %50 Griden %80 Griye | ||
| 8.8 ms ... yükseliş ↗ ve sonbahar↘ birleşimi | ↗ 4.4 ms yükseliş | 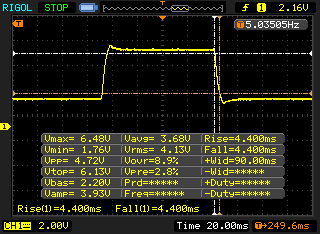 |
| ↘ 4.4 ms sonbahar | ||
| Ekran, testlerimizde hızlı yanıt oranları gösteriyor ve oyun oynamaya uygun olmalı. Karşılaştırıldığında, test edilen tüm cihazlar 0.165 (minimum) ile 636 (maksimum) ms arasında değişir. » Tüm cihazların 22 %'si daha iyi. Bu, ölçülen yanıt süresinin test edilen tüm cihazların ortalamasından (31.1 ms) daha iyi olduğu anlamına gelir. | ||
Ekran Titremesi / PWM (Darbe Genişliği Modülasyonu)
| Ekran titriyor / PWM algılanmadı | 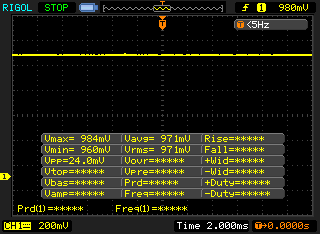 | ||
Karşılaştırıldığında: Test edilen tüm cihazların %52 %'si ekranı karartmak için PWM kullanmıyor. PWM tespit edilirse, ortalama 7798 (minimum: 5 - maksimum: 343500) Hz ölçüldü. | |||
The viewing-angle stable IPS panel can be read from any position. Outdoors, reading the display is possible when the sun doesn't shine too brightly.

Performance - Enough for the coming years
With the Aorus 15P WB, Gigabyte has a 15.6-inch gaming laptop in its range that brings every modern game smoothly onto the screen and also cuts a fine figure in all other application areas.
Test conditions
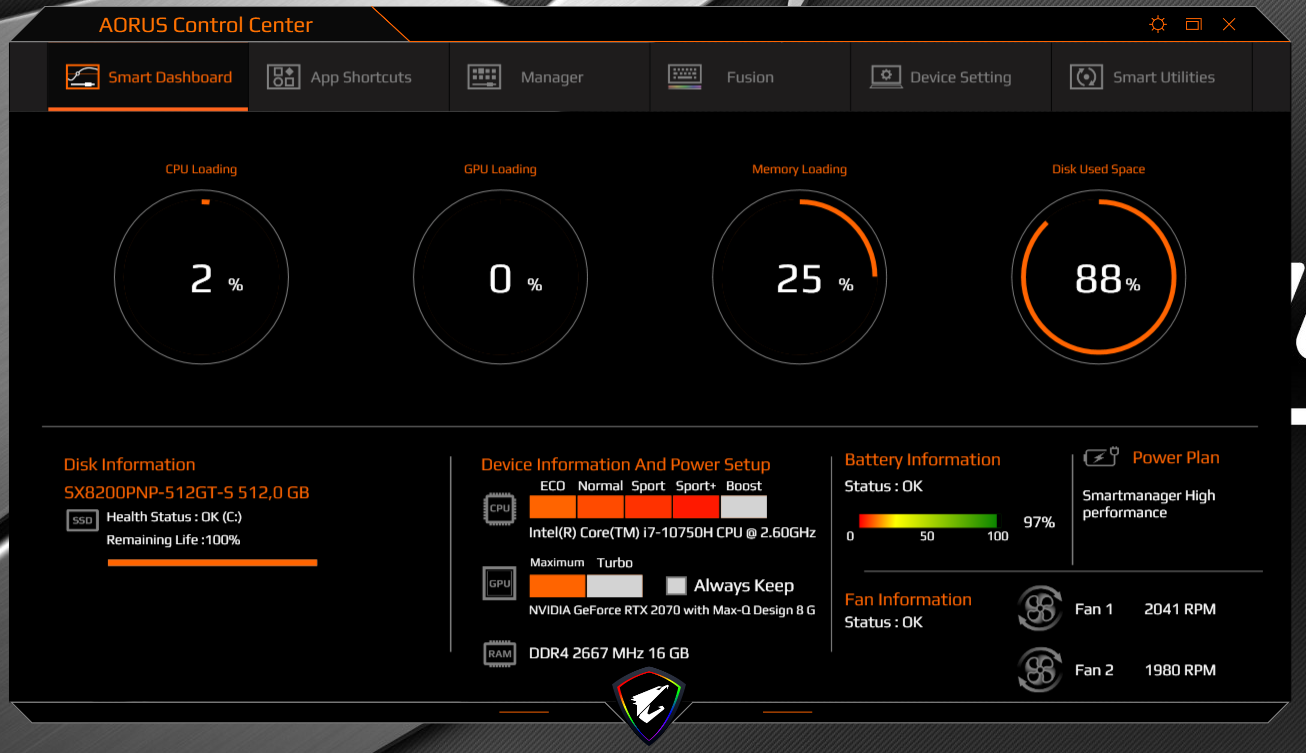
The preinstalled Aorus Control Center offers the option to set an energy profile, among other things. We use the "Auto" option here (with active AI function). Subsequently, the Control Center chooses the appropriate settings itself.
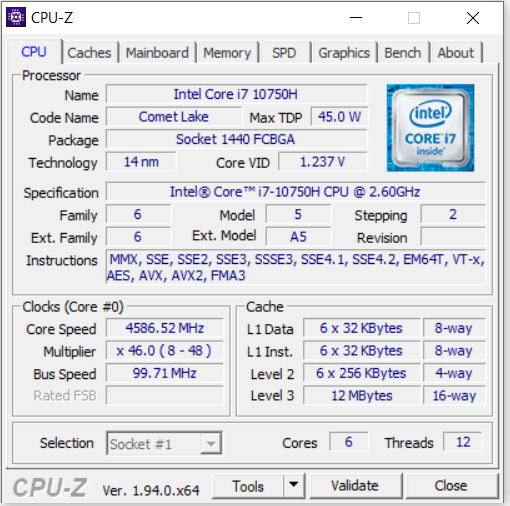
Processor
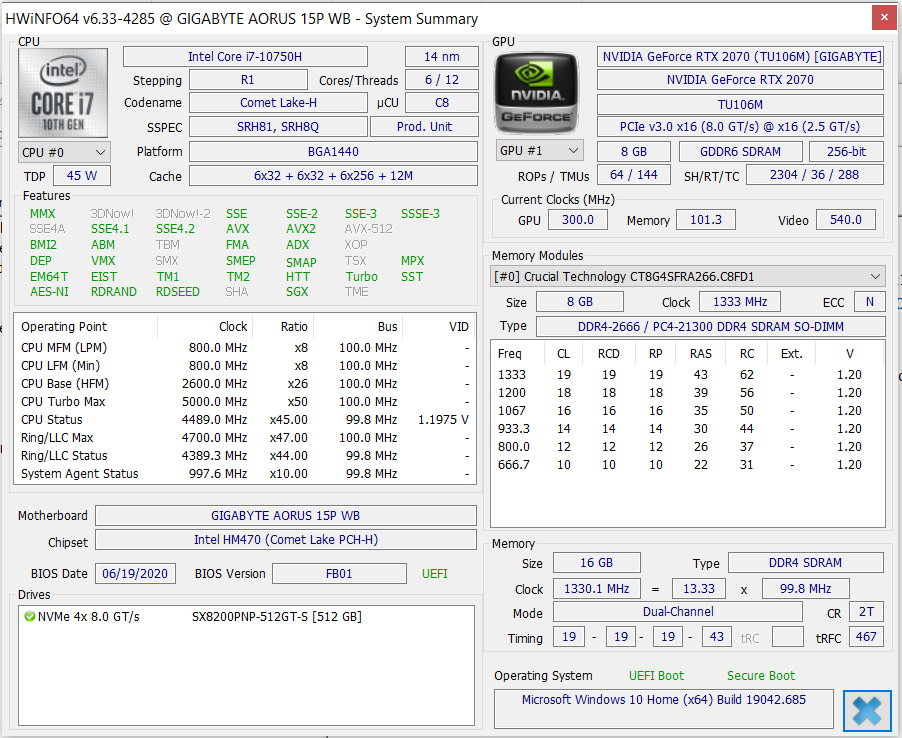
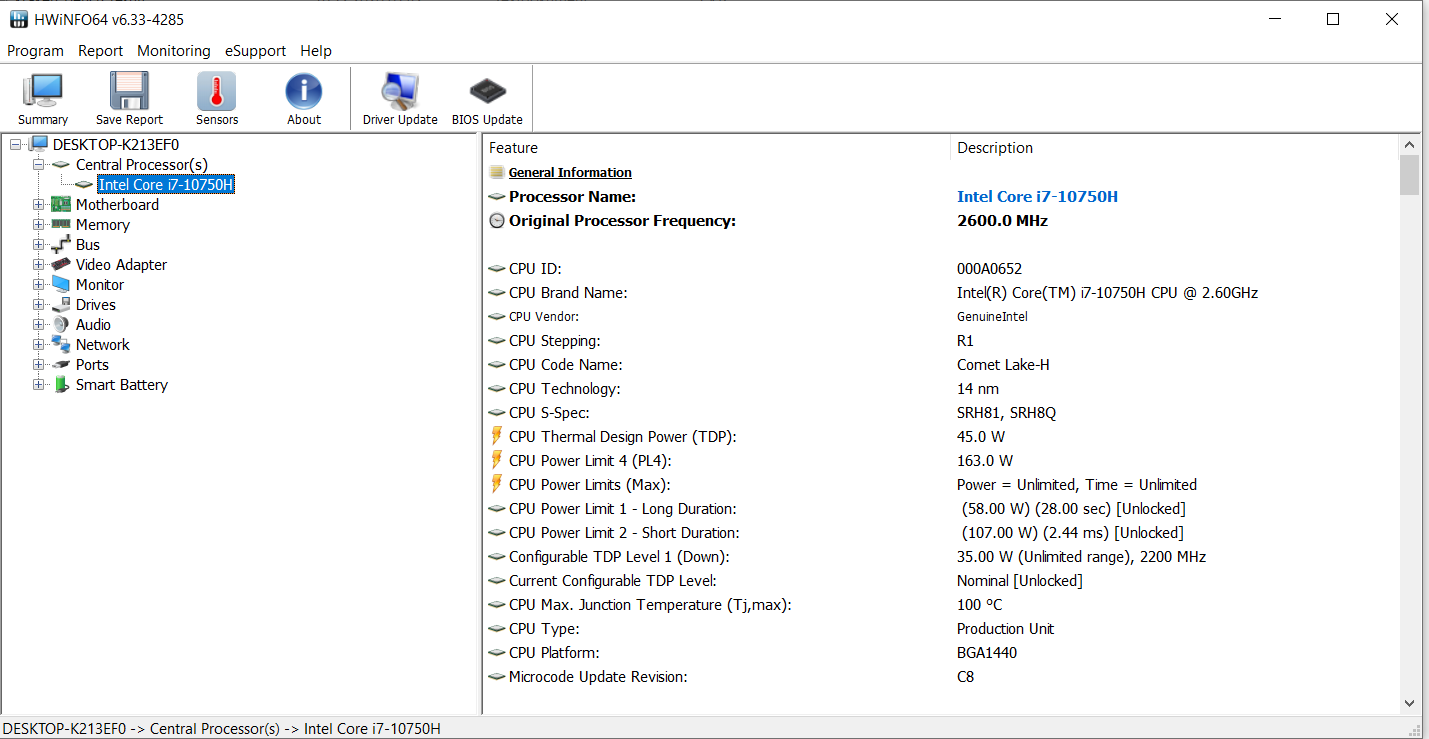
The Core i7-10750H hexa-core processor (Comet Lake) operates at a base clock of 2.6 GHz. An increase to 4.3 GHz (six cores) and 5 GHz (one core) is possible via Turbo. Hyper-Threading (two threads per core) is supported.
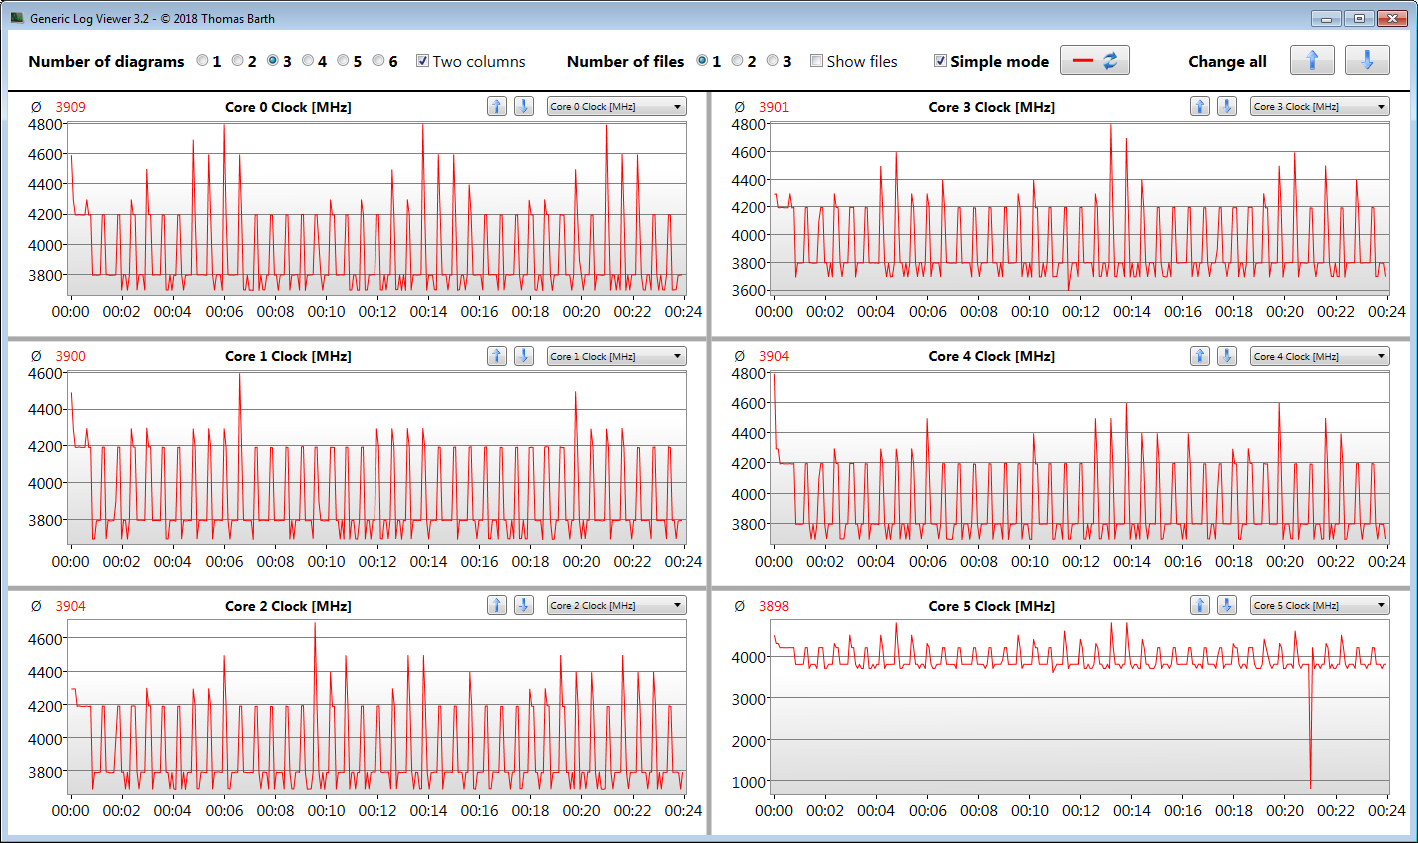
The processor executes the multithread test of the Cinebench R15 benchmark at 4.2 to 4.3 GHz. The single-thread test is run at 4.3 to 5 GHz. On battery power, the CPU operates at 2 GHz (multithread and single-thread).
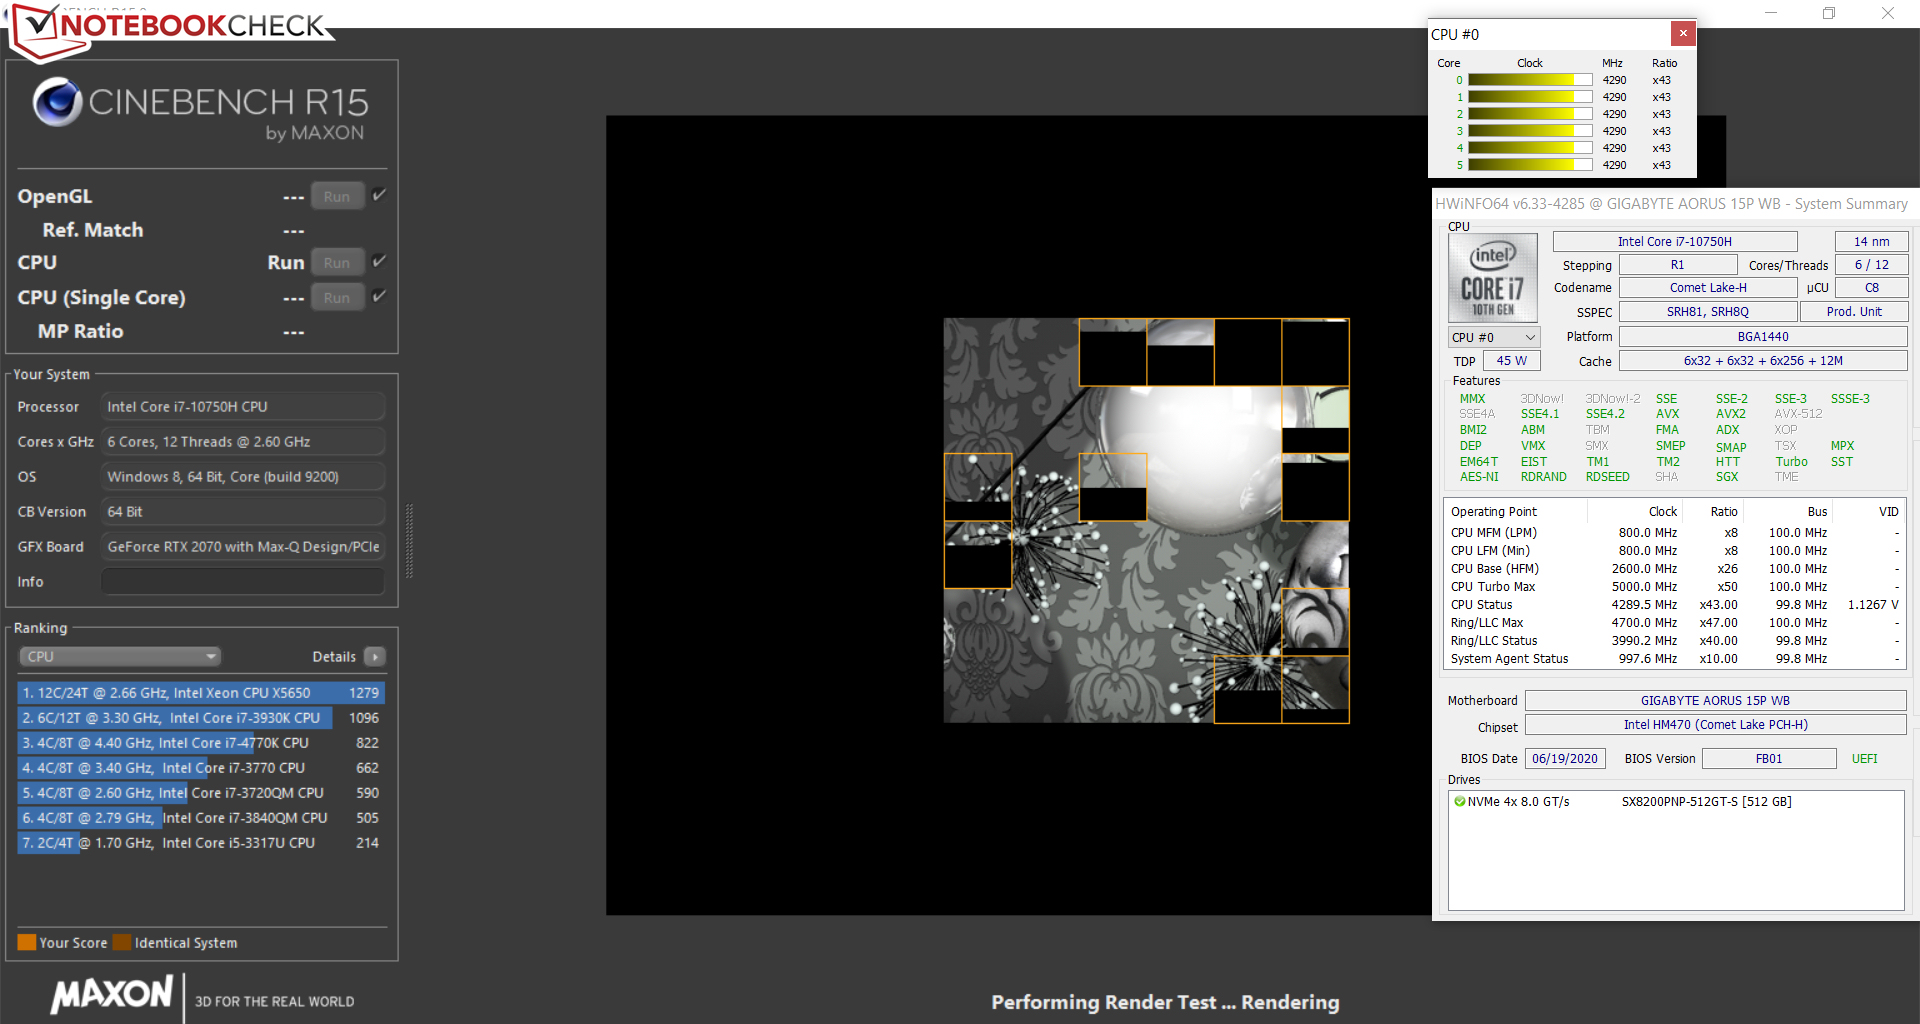
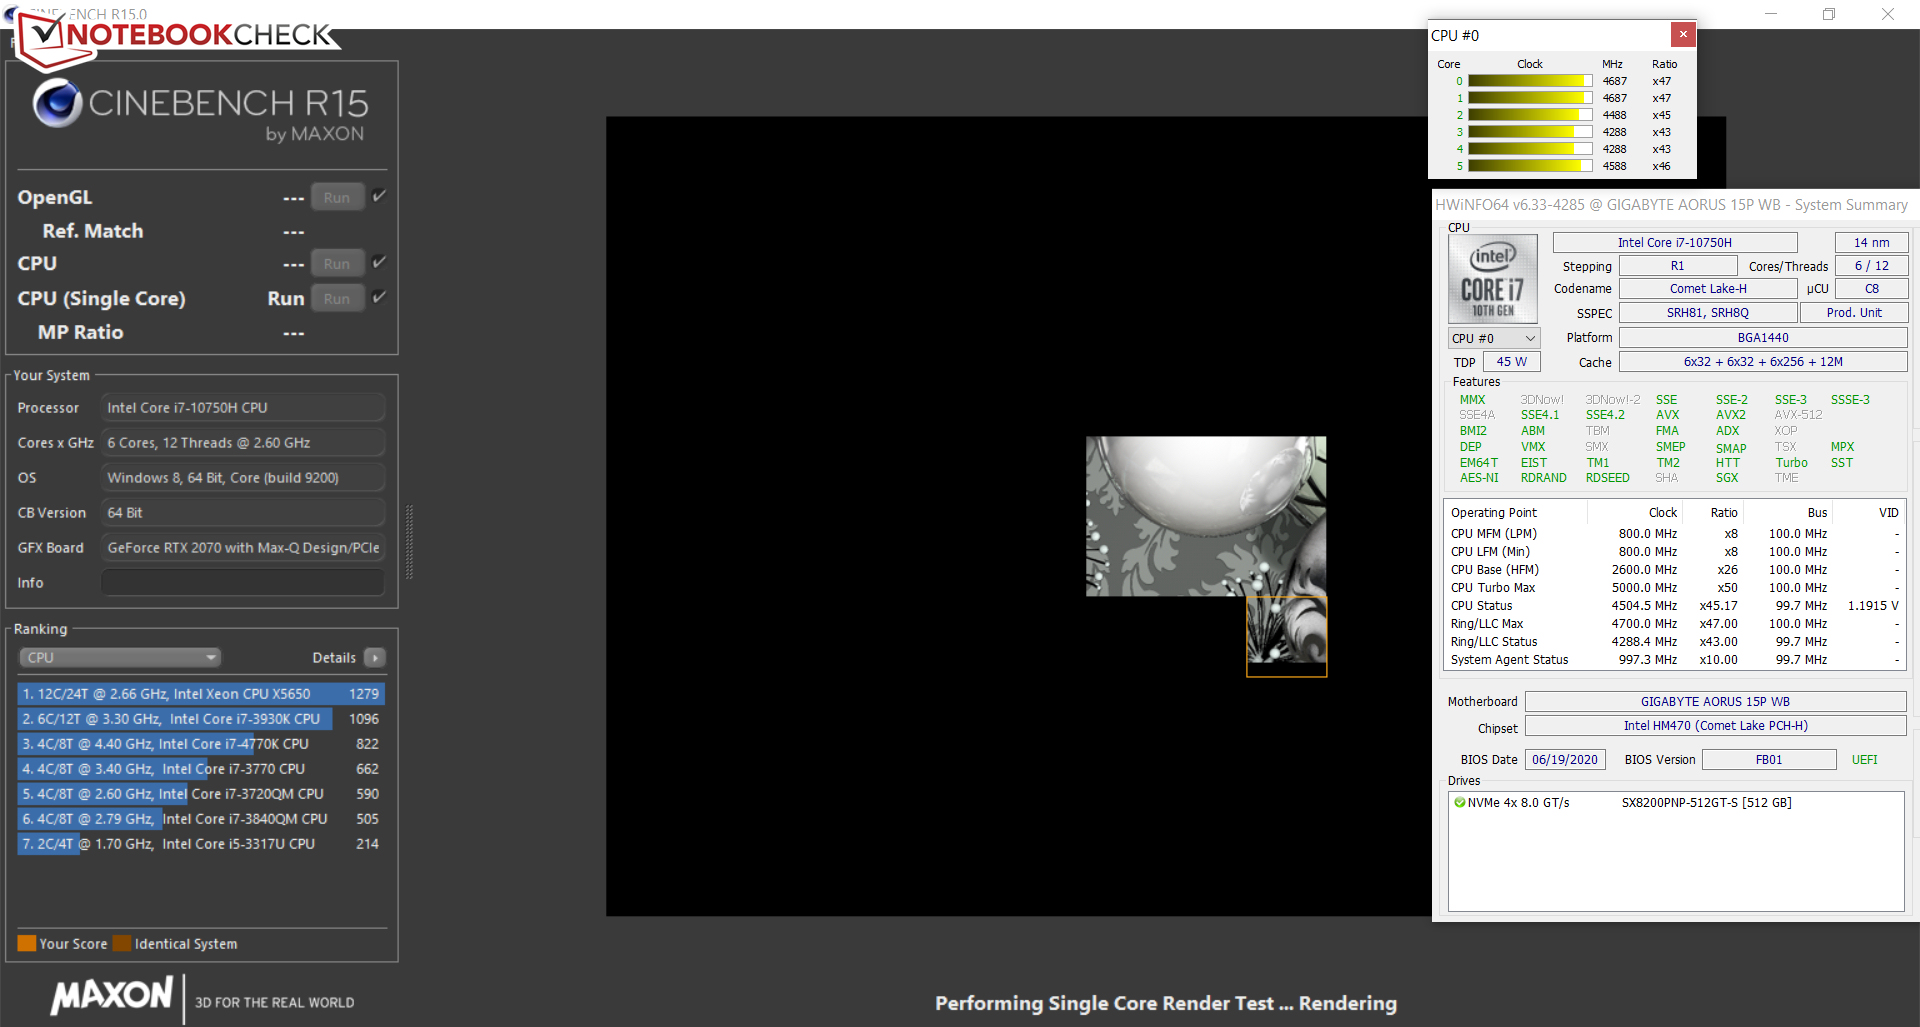
We verify if the CPU Turbo is consistently used when plugged in by running the Cinebench R15 benchmark's multithread test in a continuous loop for at least 30 minutes. Turbo is used at a fairly high level.
| Cinebench R15 | |
| CPU Single 64Bit | |
| Sınıf ortalaması Gaming (188.8 - 343, n=112, son 2 yıl) | |
| Asus ROG Strix G15 G512LW | |
| Acer Predator Triton 300 PT315-52-79LP | |
| Aorus 15P WB | |
| Ortalama Intel Core i7-10750H (184 - 213, n=45) | |
| Dell G5 15 SE 5505 P89F | |
| CPU Multi 64Bit | |
| Sınıf ortalaması Gaming (1578 - 6271, n=113, son 2 yıl) | |
| Dell G5 15 SE 5505 P89F | |
| Asus ROG Strix G15 G512LW | |
| Aorus 15P WB | |
| Acer Predator Triton 300 PT315-52-79LP | |
| Ortalama Intel Core i7-10750H (804 - 1418, n=50) | |
| Blender - v2.79 BMW27 CPU | |
| Ortalama Intel Core i7-10750H (322 - 587, n=43) | |
| Acer Predator Triton 300 PT315-52-79LP | |
| Aorus 15P WB | |
| Asus ROG Strix G15 G512LW | |
| Dell G5 15 SE 5505 P89F | |
| Sınıf ortalaması Gaming (80 - 330, n=110, son 2 yıl) | |
| 7-Zip 18.03 | |
| 7z b 4 -mmt1 | |
| Sınıf ortalaması Gaming (4199 - 7436, n=111, son 2 yıl) | |
| Aorus 15P WB | |
| Asus ROG Strix G15 G512LW | |
| Ortalama Intel Core i7-10750H (4504 - 5470, n=43) | |
| Acer Predator Triton 300 PT315-52-79LP | |
| Dell G5 15 SE 5505 P89F | |
| 7z b 4 | |
| Sınıf ortalaması Gaming (33491 - 148086, n=111, son 2 yıl) | |
| Dell G5 15 SE 5505 P89F | |
| Asus ROG Strix G15 G512LW | |
| Aorus 15P WB | |
| Acer Predator Triton 300 PT315-52-79LP | |
| Ortalama Intel Core i7-10750H (26040 - 37345, n=43) | |
| Cinebench R20 | |
| CPU (Single Core) | |
| Sınıf ortalaması Gaming (442 - 895, n=112, son 2 yıl) | |
| Aorus 15P WB | |
| Dell G5 15 SE 5505 P89F | |
| Asus ROG Strix G15 G512LW | |
| Acer Predator Triton 300 PT315-52-79LP | |
| Ortalama Intel Core i7-10750H (431 - 504, n=43) | |
| CPU (Multi Core) | |
| Sınıf ortalaması Gaming (4029 - 16108, n=112, son 2 yıl) | |
| Dell G5 15 SE 5505 P89F | |
| Asus ROG Strix G15 G512LW | |
| Acer Predator Triton 300 PT315-52-79LP | |
| Aorus 15P WB | |
| Ortalama Intel Core i7-10750H (1749 - 3325, n=43) | |
| Geekbench 5.5 | |
| Single-Core | |
| Sınıf ortalaması Gaming (986 - 2474, n=111, son 2 yıl) | |
| Asus ROG Strix G15 G512LW | |
| Aorus 15P WB | |
| Acer Predator Triton 300 PT315-52-79LP | |
| Ortalama Intel Core i7-10750H (1114 - 1333, n=43) | |
| Dell G5 15 SE 5505 P89F | |
| Multi-Core | |
| Sınıf ortalaması Gaming (6460 - 27010, n=111, son 2 yıl) | |
| Dell G5 15 SE 5505 P89F | |
| Asus ROG Strix G15 G512LW | |
| Acer Predator Triton 300 PT315-52-79LP | |
| Aorus 15P WB | |
| Ortalama Intel Core i7-10750H (4443 - 6674, n=43) | |
| HWBOT x265 Benchmark v2.2 - 4k Preset | |
| Sınıf ortalaması Gaming (11.5 - 44.3, n=111, son 2 yıl) | |
| Dell G5 15 SE 5505 P89F | |
| Asus ROG Strix G15 G512LW | |
| Aorus 15P WB | |
| Acer Predator Triton 300 PT315-52-79LP | |
| Ortalama Intel Core i7-10750H (5.54 - 11.6, n=43) | |
| LibreOffice - 20 Documents To PDF | |
| Dell G5 15 SE 5505 P89F | |
| Ortalama Intel Core i7-10750H (43.1 - 99.2, n=43) | |
| Aorus 15P WB | |
| Sınıf ortalaması Gaming (19 - 88.8, n=111, son 2 yıl) | |
| Acer Predator Triton 300 PT315-52-79LP | |
| Asus ROG Strix G15 G512LW | |
| R Benchmark 2.5 - Overall mean | |
| Ortalama Intel Core i7-10750H (0.578 - 0.708, n=42) | |
| Acer Predator Triton 300 PT315-52-79LP | |
| Asus ROG Strix G15 G512LW | |
| Aorus 15P WB | |
| Dell G5 15 SE 5505 P89F | |
| Sınıf ortalaması Gaming (0.3439 - 0.759, n=112, son 2 yıl) | |
* ... daha küçük daha iyidir
System performance
The laptop offers enough computing power for all common application areas for the next few years. Gaming, video-editing, and image-editing don't pose a big challenge for the device. Furthermore, the system runs well and smoothly. This is accompanied by very good results in the PCMark benchmarks.
| PCMark 8 Home Score Accelerated v2 | 4410 puan | |
| PCMark 8 Creative Score Accelerated v2 | 6169 puan | |
| PCMark 8 Work Score Accelerated v2 | 5556 puan | |
| PCMark 10 Score | 6301 puan | |
Yardım | ||
| PCMark 10 - Score | |
| Sınıf ortalaması Gaming (5828 - 11574, n=96, son 2 yıl) | |
| Aorus 15P WB | |
| Dell G5 15 SE 5505 P89F | |
| Ortalama Intel Core i7-10750H, NVIDIA GeForce RTX 2070 Max-Q (5208 - 6301, n=3) | |
| Asus ROG Strix G15 G512LW | |
| Acer Predator Triton 300 PT315-52-79LP | |
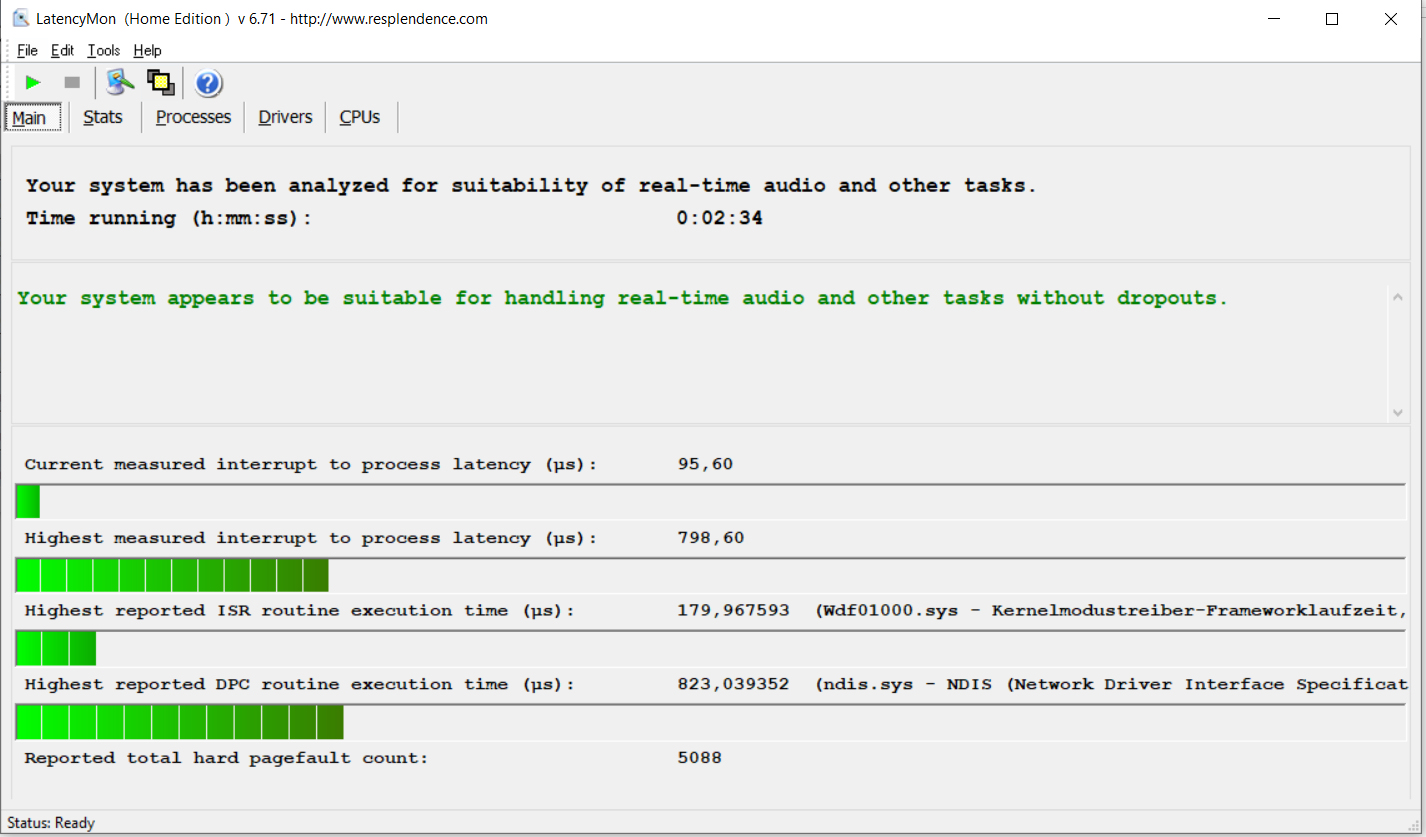
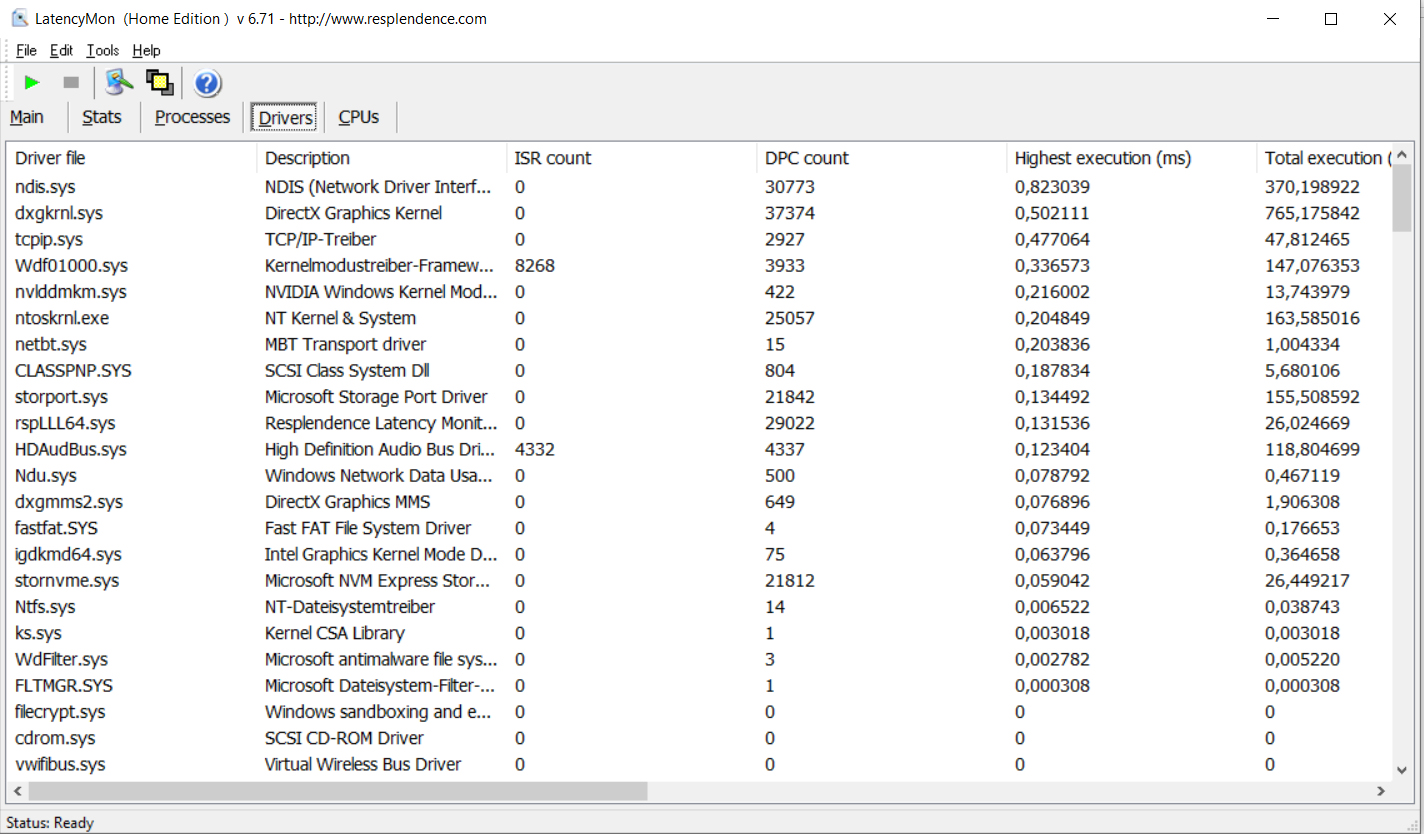
DPC latencies
In our standardized latency monitor test (web surfing, 4K video playback, high-load Prime95), we didn't observe any abnormalities with the DPC latencies. The system seems to be suitable for real-time video and audio-editing.
| DPC Latencies / LatencyMon - interrupt to process latency (max), Web, Youtube, Prime95 | |
| Asus ROG Strix G15 G512LW | |
| Dell G5 15 SE 5505 P89F | |
| Acer Predator Triton 300 PT315-52-79LP | |
| Aorus 15P WB | |
* ... daha küçük daha iyidir
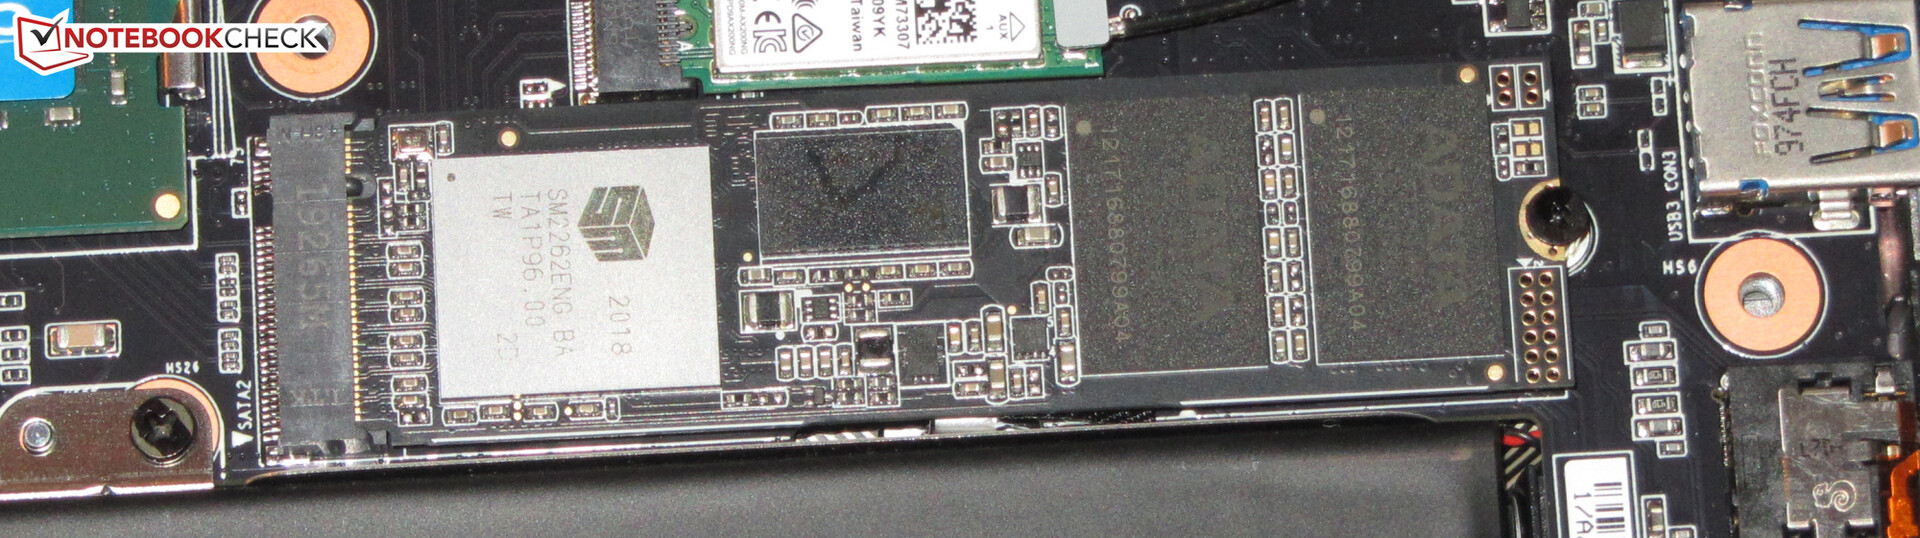
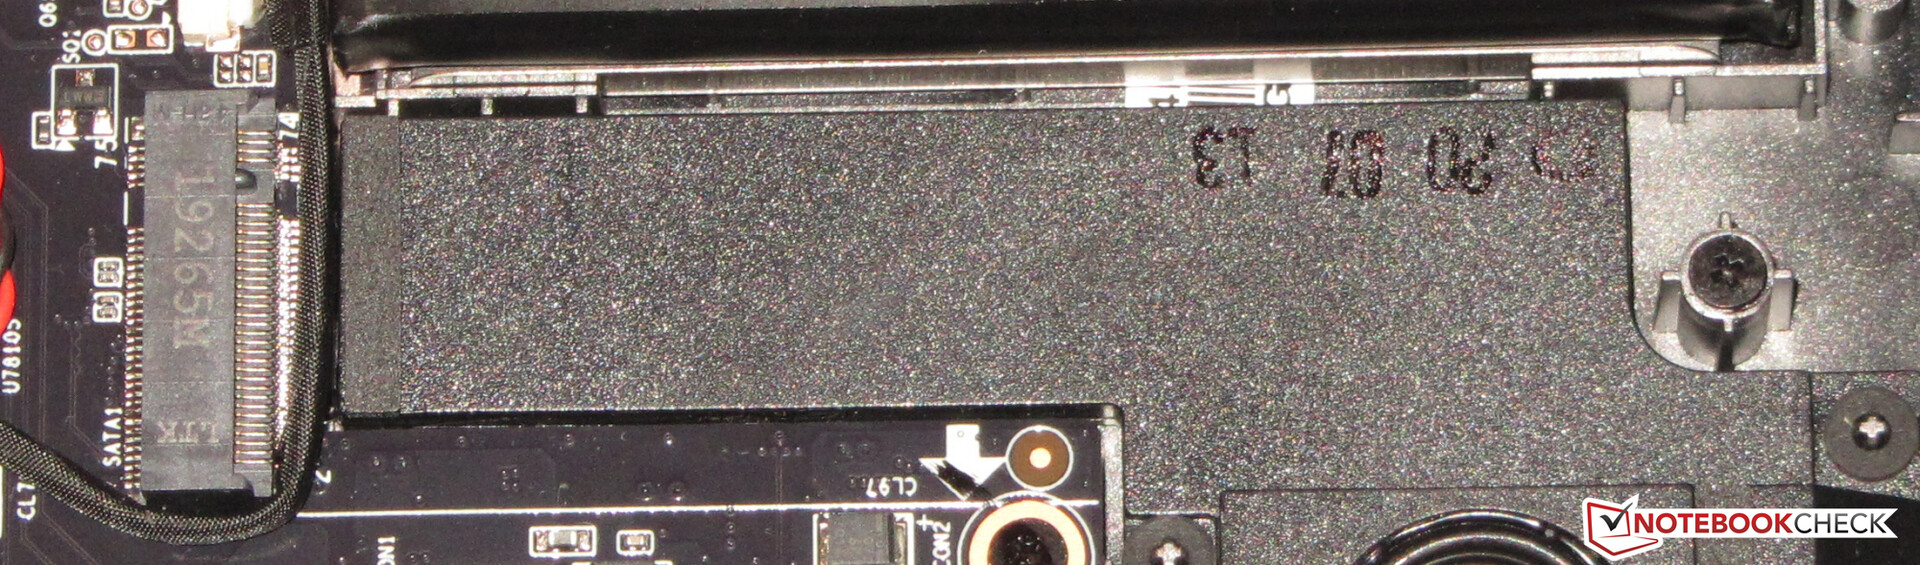
Storage
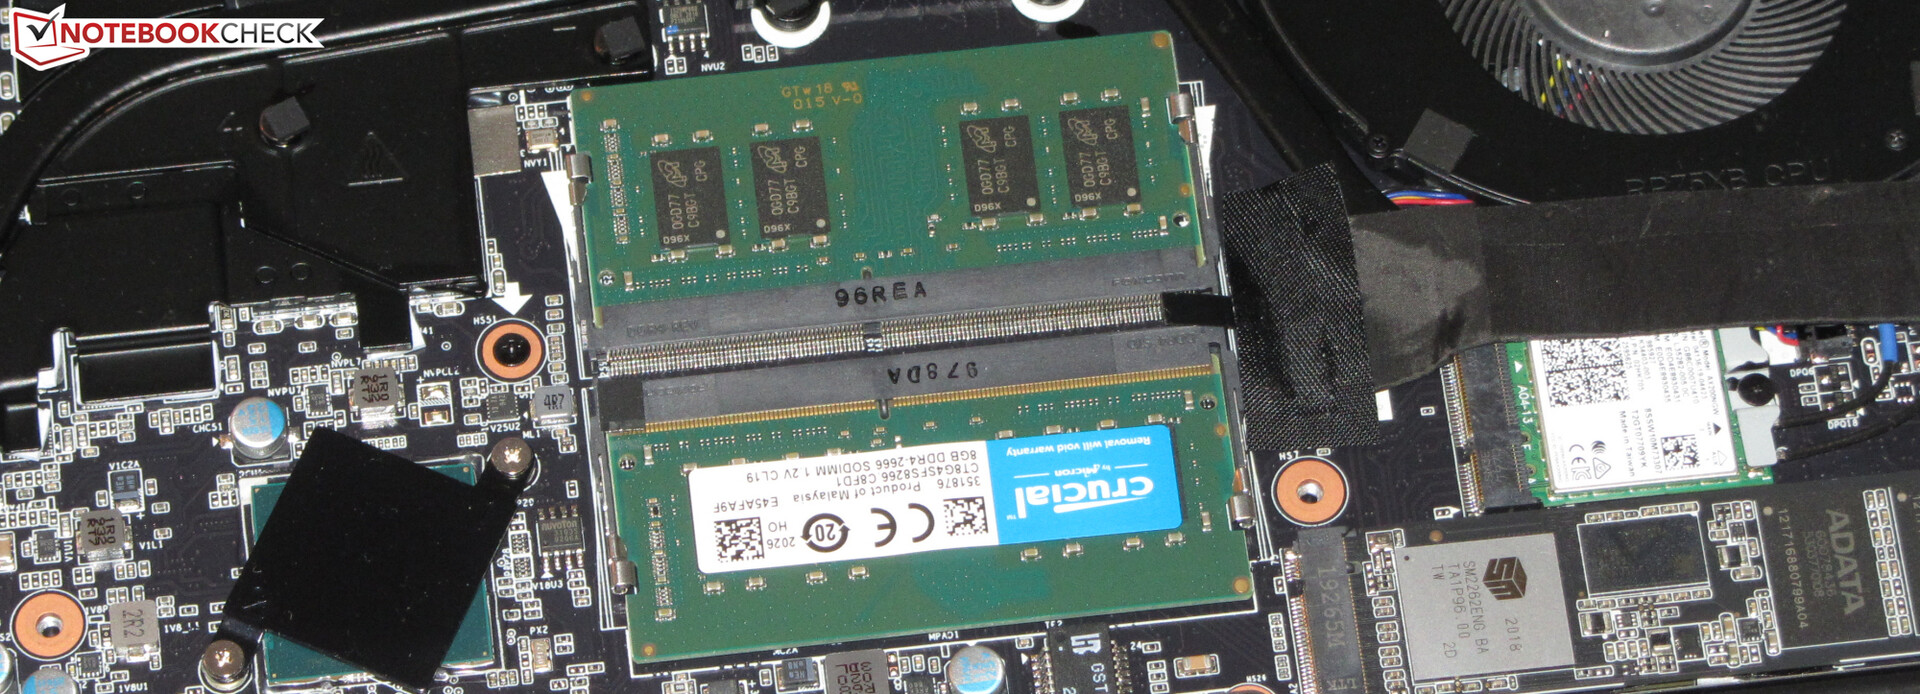
An NVMe SSD (M.2 2280) from Adata serves as the system drive. It provides 512 GB of storage space and delivers good transfer rates. The laptop can accommodate a total of two M.2 2280 SSDs (1x NVMe, 1x NVMe/SATA). RAID 0/1 is not supported, though.

| Aorus 15P WB ADATA XPG SX8200 Pro (ASX8200PNP-512GT) | Acer Predator Triton 300 PT315-52-79LP WDC PC SN730 SDBQNTY-1T00 | Asus ROG Strix G15 G512LW Toshiba XG5-P KXG50PNV2T04 | Dell G5 15 SE 5505 P89F Samsung PM991 MZ9LQ512HALU | Ortalama ADATA XPG SX8200 Pro (ASX8200PNP-512GT) | |
|---|---|---|---|---|---|
| CrystalDiskMark 5.2 / 6 | -3% | -31% | -23% | -1% | |
| Write 4K (MB/s) | 131.7 | 117.5 -11% | 116.5 -12% | 142.1 8% | 149.5 ? 14% |
| Read 4K (MB/s) | 55.7 | 47.36 -15% | 27.6 -50% | 46.43 -17% | 53.6 ? -4% |
| Write Seq (MB/s) | 2273 | 2748 21% | 1020 -55% | 1108 -51% | 2346 ? 3% |
| Read Seq (MB/s) | 2533 | 2084 -18% | 1999 -21% | 1622 -36% | 2501 ? -1% |
| Write 4K Q32T1 (MB/s) | 475.1 | 407.3 -14% | 375.9 -21% | 467 -2% | 419 ? -12% |
| Read 4K Q32T1 (MB/s) | 590 | 474.6 -20% | 398.5 -32% | 525 -11% | 520 ? -12% |
| Write Seq Q32T1 (MB/s) | 2373 | 3069 29% | 1015 -57% | 1203 -49% | 2463 ? 4% |
| Read Seq Q32T1 (MB/s) | 3068 | 3154 3% | 3049 -1% | 2288 -25% | 2997 ? -2% |
| AS SSD | 47% | -44% | -35% | 8% | |
| Seq Read (MB/s) | 2241 | 2369 6% | 1933 -14% | 1386 -38% | 2688 ? 20% |
| Seq Write (MB/s) | 2121 | 2446 15% | 787 -63% | 1234 -42% | 1888 ? -11% |
| 4K Read (MB/s) | 52.3 | 40.61 -22% | 26.4 -50% | 41.32 -21% | 53.3 ? 2% |
| 4K Write (MB/s) | 116.2 | 103.2 -11% | 109.8 -6% | 128 10% | 124.8 ? 7% |
| 4K-64 Read (MB/s) | 713 | 1637 130% | 848 19% | 854 20% | 714 ? 0% |
| 4K-64 Write (MB/s) | 827 | 1961 137% | 923 12% | 721 -13% | 1114 ? 35% |
| Access Time Read * (ms) | 0.054 | 0.06 -11% | 0.044 19% | 0.098 -81% | 0.05575 ? -3% |
| Access Time Write * (ms) | 0.031 | 0.036 -16% | 0.158 -410% | 0.095 -206% | 0.03125 ? -1% |
| Score Read (Points) | 989 | 1915 94% | 1067 8% | 1034 5% | 1036 ? 5% |
| Score Write (Points) | 1155 | 2309 100% | 1112 -4% | 973 -16% | 1428 ? 24% |
| Score Total (Points) | 2659 | 5205 96% | 2669 0% | 2536 -5% | 2968 ? 12% |
| Toplam Ortalama (Program / Ayarlar) | 22% /
26% | -38% /
-39% | -29% /
-30% | 4% /
4% |
* ... daha küçük daha iyidir
Continuous load read: DiskSpd Read Loop, Queue Depth 8
Graphics card
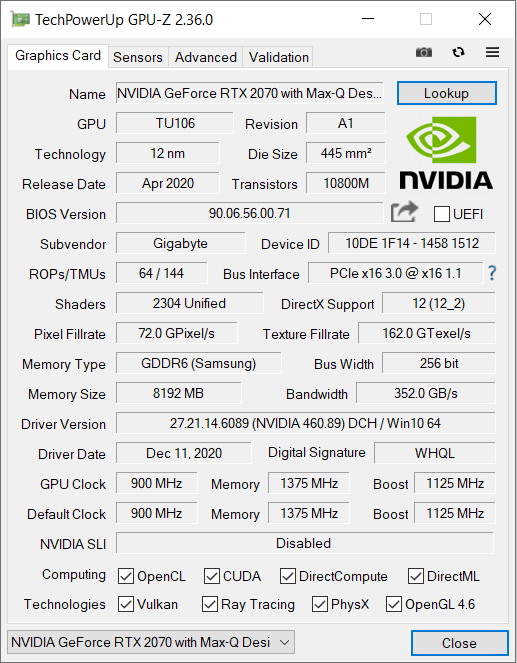
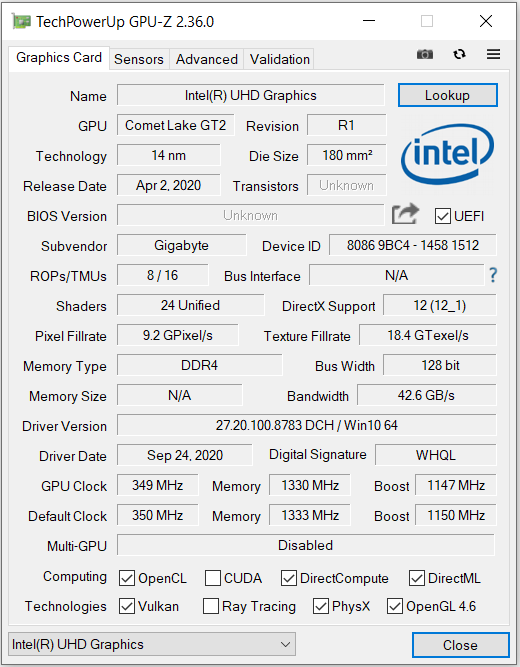
The dedicated GeForce RTX 2070 Max-Q graphics core is a high-end GPU. This is an efficiency-tuned version of the regular RTX 2070 that is intended for thin and light laptops. The GPU is supported by fast GDDR6 memory (8,192 MB). The 3DMark results are at a normal level for the GPU installed here. The UHD Graphics 630 GPU integrated into the processor is active, and the laptop works with Nvidia's Optimus graphics-switching solution. The GeForce GPU can be disabled in the computer's BIOS.
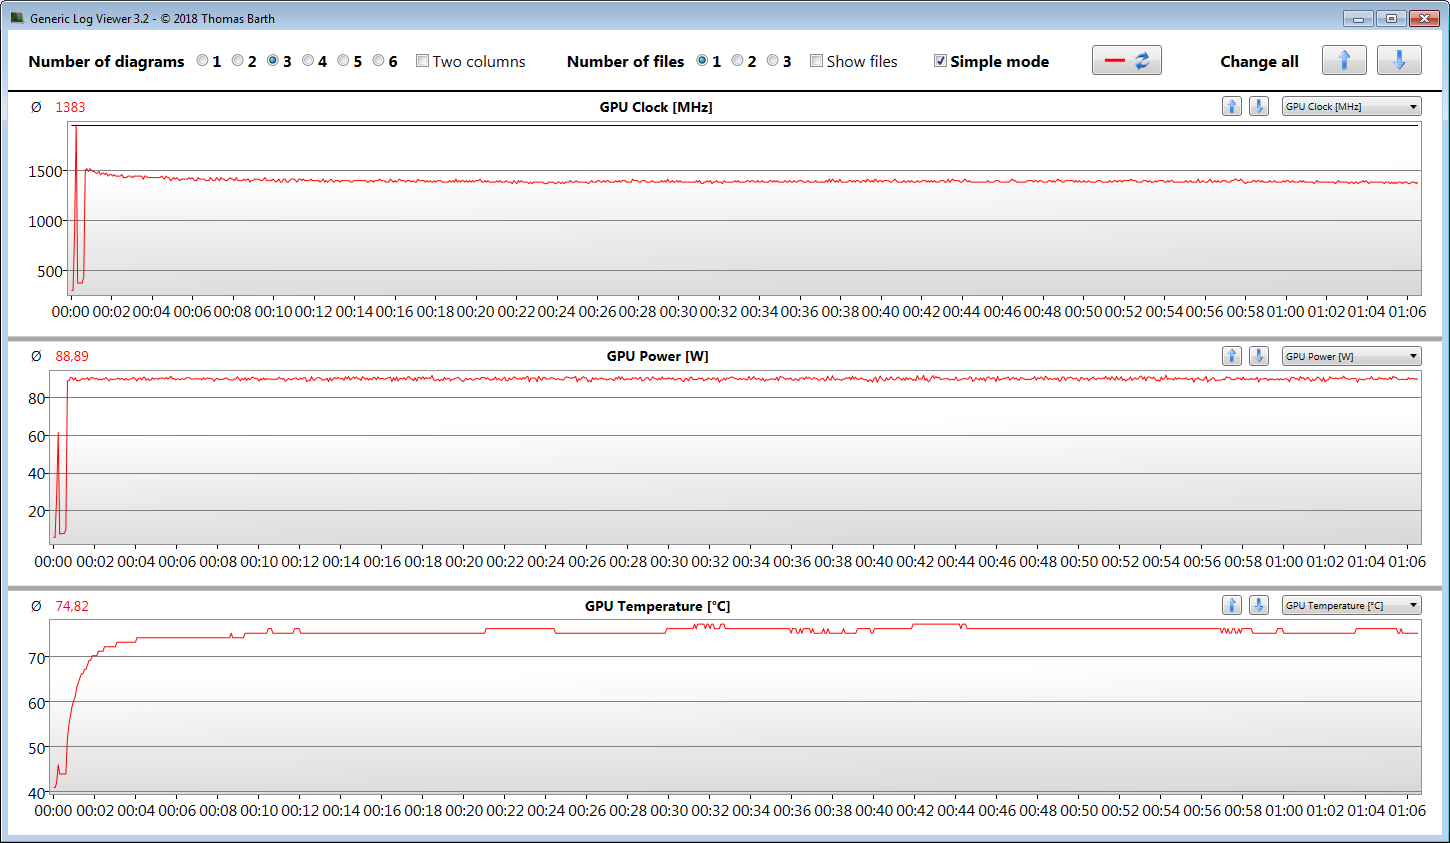
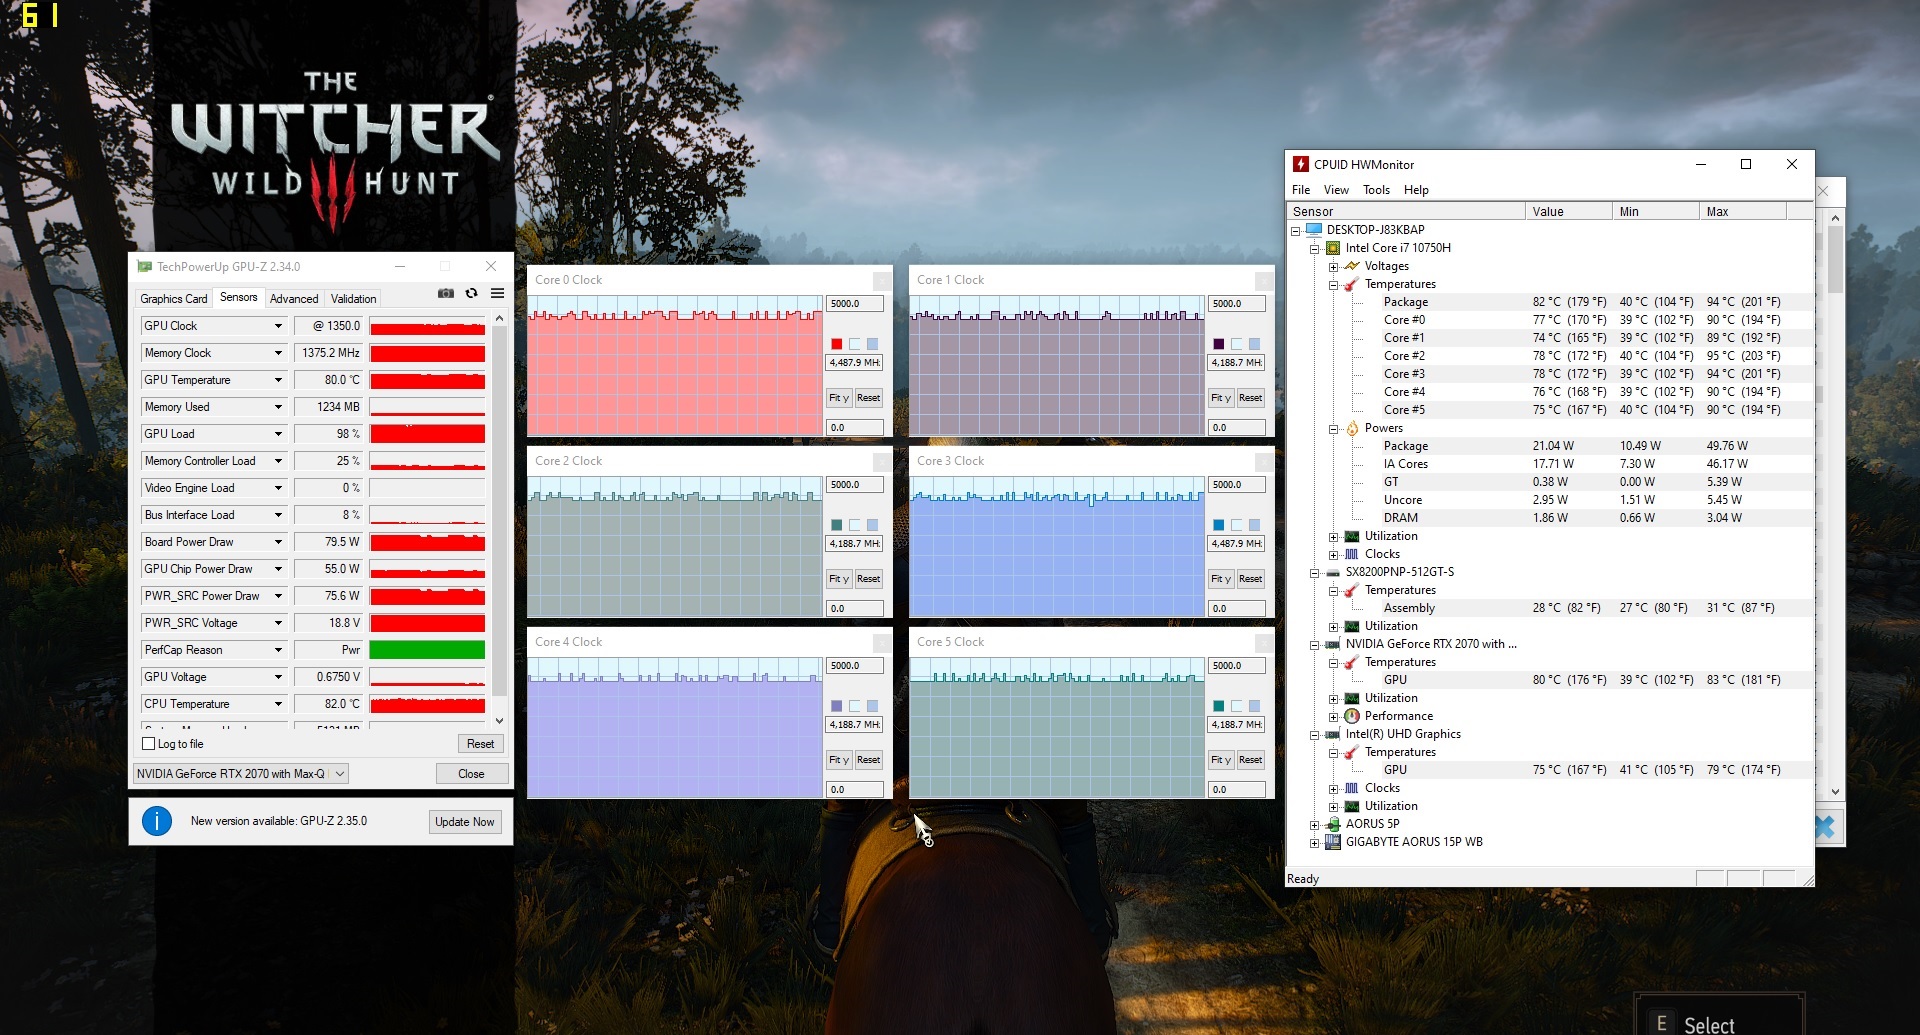
Nvidia specifies a clock range between 900 MHz (base) and 1,125 MHz (boost) for this DirectX 12 GPU. Higher speeds are feasible when a predetermined temperature and/or energy threshold is not reached. We register a maximum of 1,939 MHz. Our The Witcher 3 test is run at an average of 1,383 MHz.
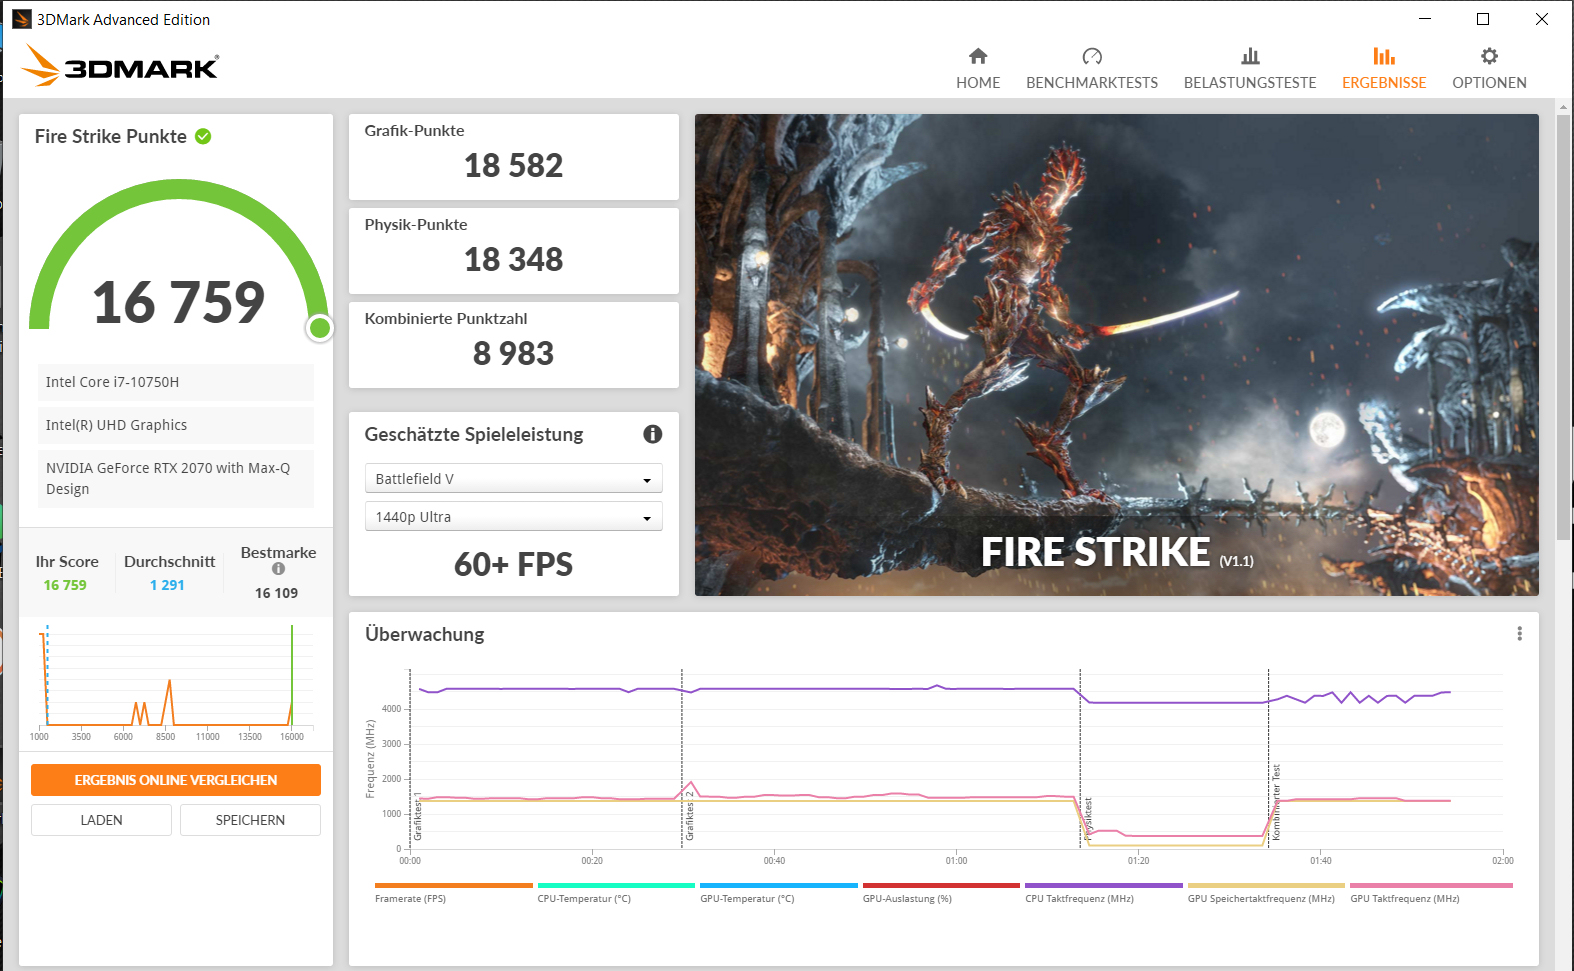
| 3DMark 11 Performance | 19910 puan | |
| 3DMark Cloud Gate Standard Score | 39445 puan | |
| 3DMark Fire Strike Score | 16759 puan | |
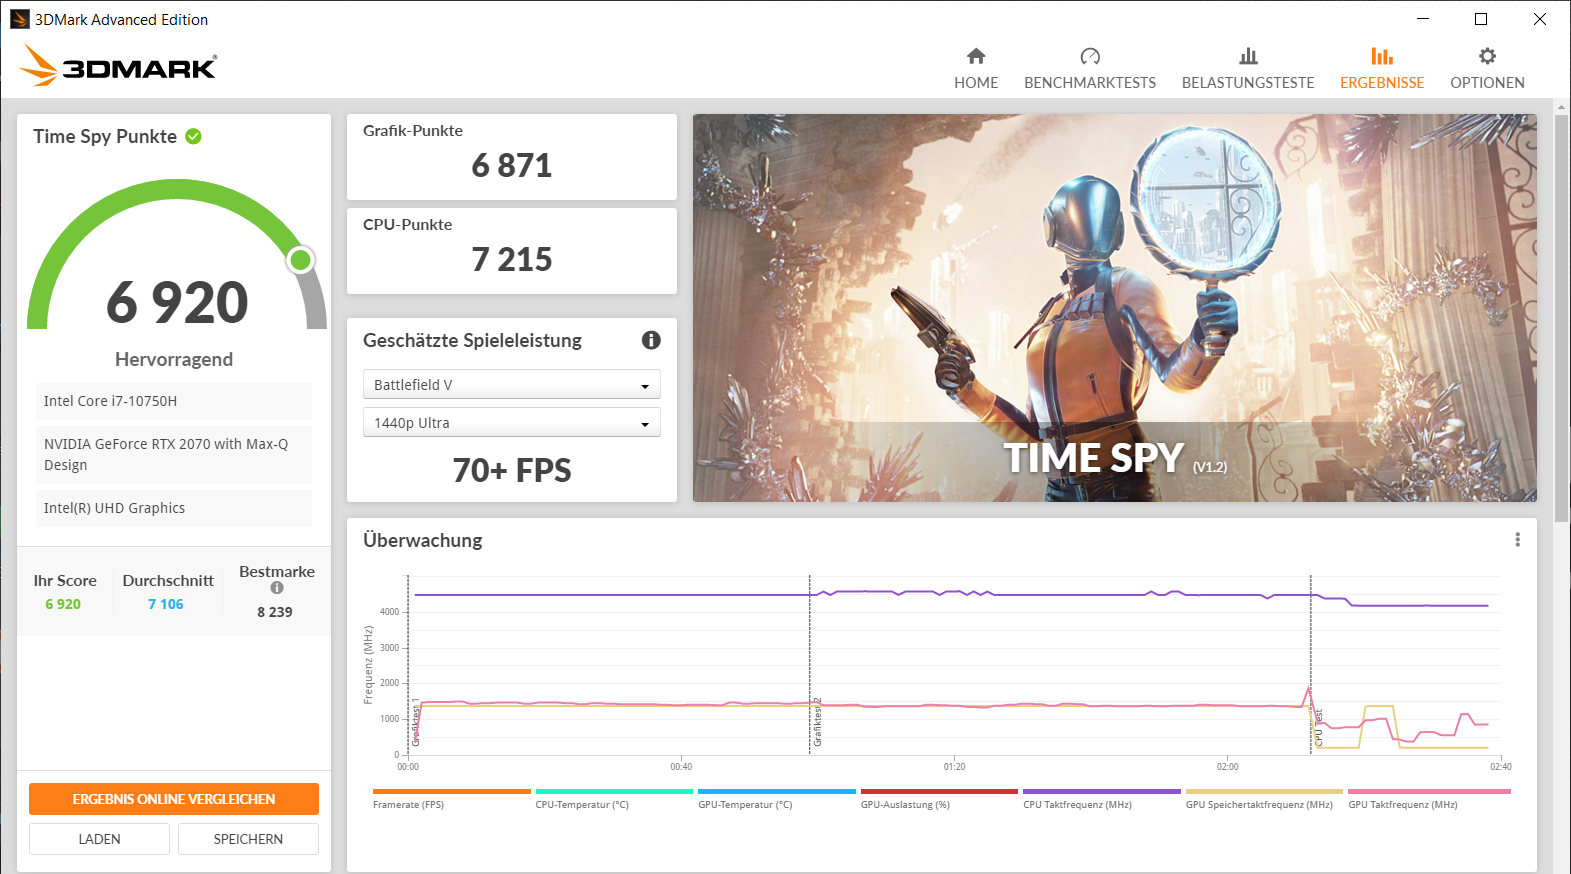
| 3DMark Time Spy Score | 6920 puan | |
Yardım | ||
| 3DMark 11 - 1280x720 Performance GPU | |
| Sınıf ortalaması Gaming (21841 - 80022, n=109, son 2 yıl) | |
| Asus ROG Strix G15 G512LW | |
| Dell G5 15 SE 5505 P89F | |
| Aorus 15P WB | |
| Ortalama NVIDIA GeForce RTX 2070 Max-Q (14723 - 27694, n=31) | |
| Acer Predator Triton 300 PT315-52-79LP | |
| 3DMark | |
| 1280x720 Cloud Gate Standard Graphics | |
| Sınıf ortalaması Gaming (86886 - 223650, n=61, son 2 yıl) | |
| Asus ROG Strix G15 G512LW | |
| Aorus 15P WB | |
| Ortalama NVIDIA GeForce RTX 2070 Max-Q (39014 - 134255, n=28) | |
| Dell G5 15 SE 5505 P89F | |
| 1920x1080 Fire Strike Graphics | |
| Sınıf ortalaması Gaming (12242 - 62849, n=121, son 2 yıl) | |
| Asus ROG Strix G15 G512LW | |
| Dell G5 15 SE 5505 P89F | |
| Aorus 15P WB | |
| Ortalama NVIDIA GeForce RTX 2070 Max-Q (11563 - 21191, n=31) | |
| Acer Predator Triton 300 PT315-52-79LP | |
| 2560x1440 Time Spy Graphics | |
| Sınıf ortalaması Gaming (5012 - 26212, n=120, son 2 yıl) | |
| Asus ROG Strix G15 G512LW | |
| Aorus 15P WB | |
| Ortalama NVIDIA GeForce RTX 2070 Max-Q (5948 - 8065, n=28) | |
| Dell G5 15 SE 5505 P89F | |
| Acer Predator Triton 300 PT315-52-79LP | |
Gaming performance
The installed hardware brings all modern games smoothly onto the screen at Full HD resolution and high to maximum quality settings. Higher resolutions (a suitable monitor would have to be plugged in for this) often require lowering the quality level.
| The Witcher 3 - 1920x1080 Ultra Graphics & Postprocessing (HBAO+) | |
| Sınıf ortalaması Gaming (95 - 240, n=8, son 2 yıl) | |
| Asus ROG Strix G15 G512LW | |
| Aorus 15P WB | |
| Ortalama NVIDIA GeForce RTX 2070 Max-Q (56 - 83.8, n=31) | |
| Dell G5 15 SE 5505 P89F | |
| Acer Predator Triton 300 PT315-52-79LP | |
| Far Cry 5 - 1920x1080 Ultra Preset AA:T | |
| Sınıf ortalaması Gaming (70 - 151, n=10, son 2 yıl) | |
| Aorus 15P WB | |
| Ortalama NVIDIA GeForce RTX 2070 Max-Q (67 - 101, n=7) | |
| Acer Predator Triton 300 PT315-52-79LP | |
| Doom Eternal - 1920x1080 Ultra Preset | |
| Aorus 15P WB | |
| Ortalama NVIDIA GeForce RTX 2070 Max-Q (125.6 - 137.9, n=4) | |
| Dell G5 15 SE 5505 P89F | |
| X-Plane 11.11 - 1920x1080 high (fps_test=3) | |
| Sınıf ortalaması Gaming (52.1 - 143.5, n=116, son 2 yıl) | |
| Ortalama NVIDIA GeForce RTX 2070 Max-Q (61.6 - 85.3, n=11) | |
| Aorus 15P WB | |
| Acer Predator Triton 300 PT315-52-79LP | |
| Asus ROG Strix G15 G512LW | |
| Dell G5 15 SE 5505 P89F | |
| Call of Duty Black Ops Cold War - 1920x1080 Highest Settings | |
| Aorus 15P WB | |
| Ortalama NVIDIA GeForce RTX 2070 Max-Q (n=1) | |
| Yakuza Like a Dragon - 1920x1080 Ultra Preset | |
| Aorus 15P WB | |
| Ortalama NVIDIA GeForce RTX 2070 Max-Q (n=1) | |
| Star Wars Squadrons - 1920x1080 Ultra Preset | |
| Aorus 15P WB | |
| Ortalama NVIDIA GeForce RTX 2070 Max-Q (n=1) | |
In order to verify whether the frame rates remain largely constant over a prolonged period of time, we let the game The Witcher 3 run for about 60 minutes at Full HD resolution and maximum quality settings. The character is not moved. A drop in frame rates wasn't found.
| düşük | orta | yüksek | ultra | |
|---|---|---|---|---|
| The Witcher 3 (2015) | 275.4 | 222.4 | 129.2 | 69.8 |
| Dota 2 Reborn (2015) | 150.7 | 136.2 | 124.8 | 115.1 |
| X-Plane 11.11 (2018) | 106 | 93.3 | 78.8 | |
| Far Cry 5 (2018) | 132 | 109 | 102 | 97 |
| Doom Eternal (2020) | 260.8 | 152.7 | 136.4 | 131.1 |
| Crysis Remastered (2020) | 196 | 117 | 56.6 | 43 |
| Star Wars Squadrons (2020) | 272.2 | 192.7 | 182.4 | 172.4 |
| Watch Dogs Legion (2020) | 107 | 88 | 77 | 51 |
| Assassin´s Creed Valhalla (2020) | 113 | 75 | 63 | 55 |
| Call of Duty Black Ops Cold War (2020) | 159 | 79.3 | 70.5 | 64.1 |
| Yakuza Like a Dragon (2020) | 111.1 | 80.8 | 81.1 | 72 |
| Immortals Fenyx Rising (2020) | 117 | 78 | 66 | 61 |
| Cyberpunk 2077 1.0 (2020) | 106 | 62 | 51.5 | 43.8 |
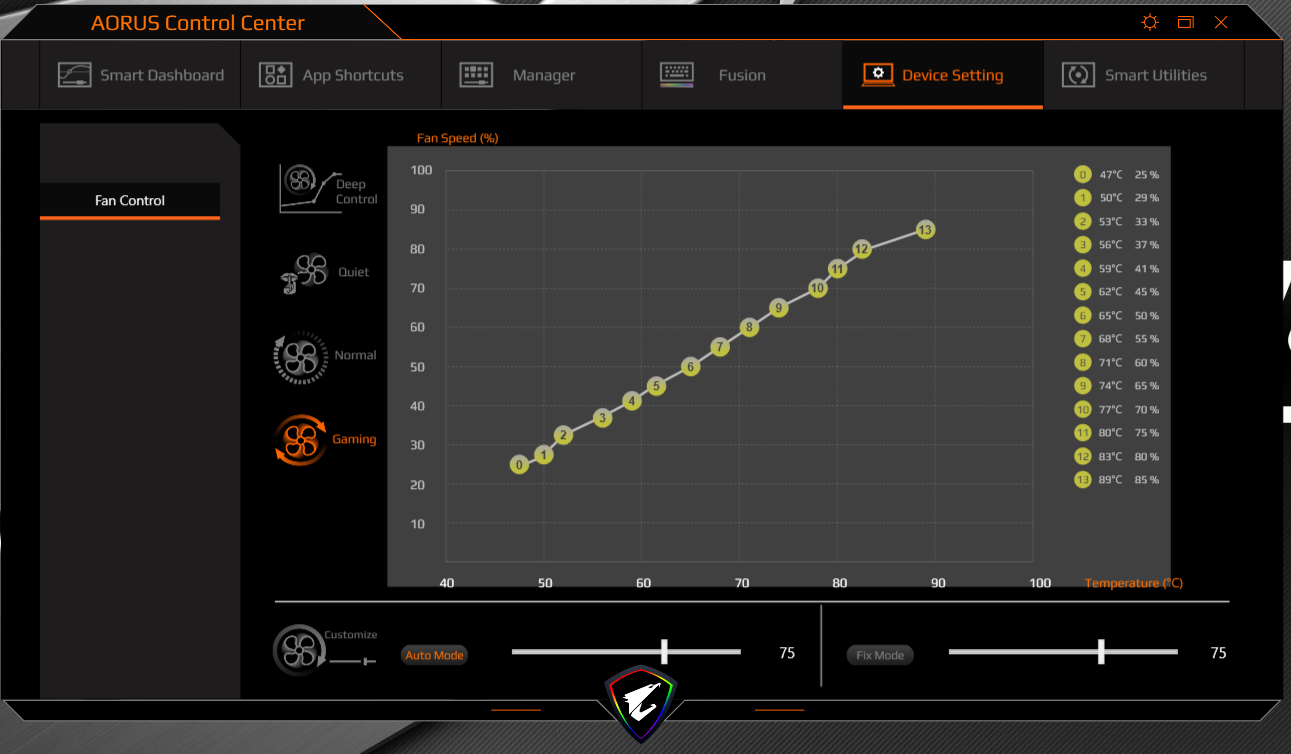
Emissions - Noise levels are acceptable
Noise emissions
The two fans work consistently at low speeds in idle mode. The resulting noise is completely acceptable. Under load, the fans turn up, though. We register maximum sound pressure levels of 45 dB(A) (stress test) and 43 dB(A) (our The Witcher 3 test), respectively. The whole situation manifests itself in a constant, tolerable fan noise. A headset is not an absolute necessity.
Ses yüksekliği
| Boşta |
| 29 / 30 / 31 dB |
| Çalışırken |
| 41 / 45 dB |
 | ||
30 dB sessiz 40 dB(A) duyulabilirlik 50 dB(A) gürültülü |
||
min: | ||
| Aorus 15P WB i7-10750H, GeForce RTX 2070 Max-Q | Acer Predator Triton 300 PT315-52-79LP i7-10750H, GeForce RTX 2060 Mobile | Asus ROG Strix G15 G512LW i7-10750H, GeForce RTX 2070 Mobile | Dell G5 15 SE 5505 P89F R7 4800H, Radeon RX 5600M | Sınıf ortalaması Gaming | |
|---|---|---|---|---|---|
| Noise | -3% | -7% | 1% | 0% | |
| kapalı / ortam * (dB) | 25 | 25 -0% | 25.7 -3% | 28 -12% | 24.1 ? 4% |
| Idle Minimum * (dB) | 29 | 25 14% | 25.7 11% | 28 3% | 25.8 ? 11% |
| Idle Average * (dB) | 30 | 29 3% | 29.7 1% | 28 7% | 27.5 ? 8% |
| Idle Maximum * (dB) | 31 | 34 -10% | 34 -10% | 28 10% | 30 ? 3% |
| Load Average * (dB) | 41 | 44 -7% | 38.9 5% | 28 32% | 43.1 ? -5% |
| Witcher 3 ultra * (dB) | 43 | 49 -14% | 54.1 -26% | 50.6 -18% | |
| Load Maximum * (dB) | 45 | 49 -9% | 57.4 -28% | 50.6 -12% | 54 ? -20% |
* ... daha küçük daha iyidir
Temperature
Our stress test (Prime95 and FurmMark run for at least an hour) is run by the CPU and GPU at 2.8 to 2.9 GHz and 1,230 MHz, respectively. The stress test is an extreme scenario that doesn't occur in everyday use. We perform this test to check whether the system remains stable even under full load.
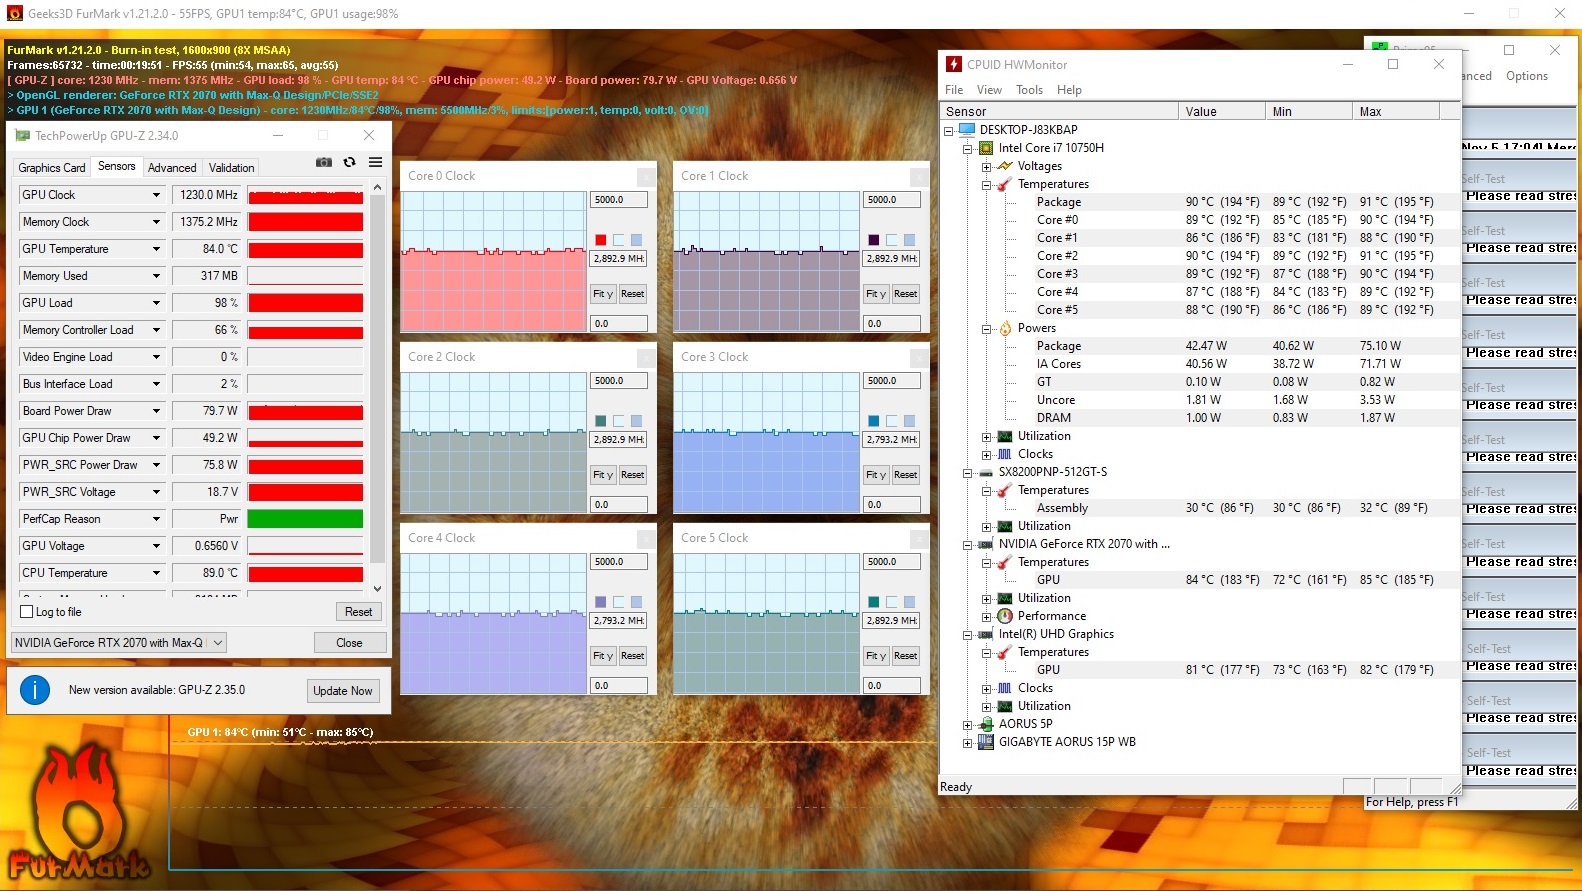
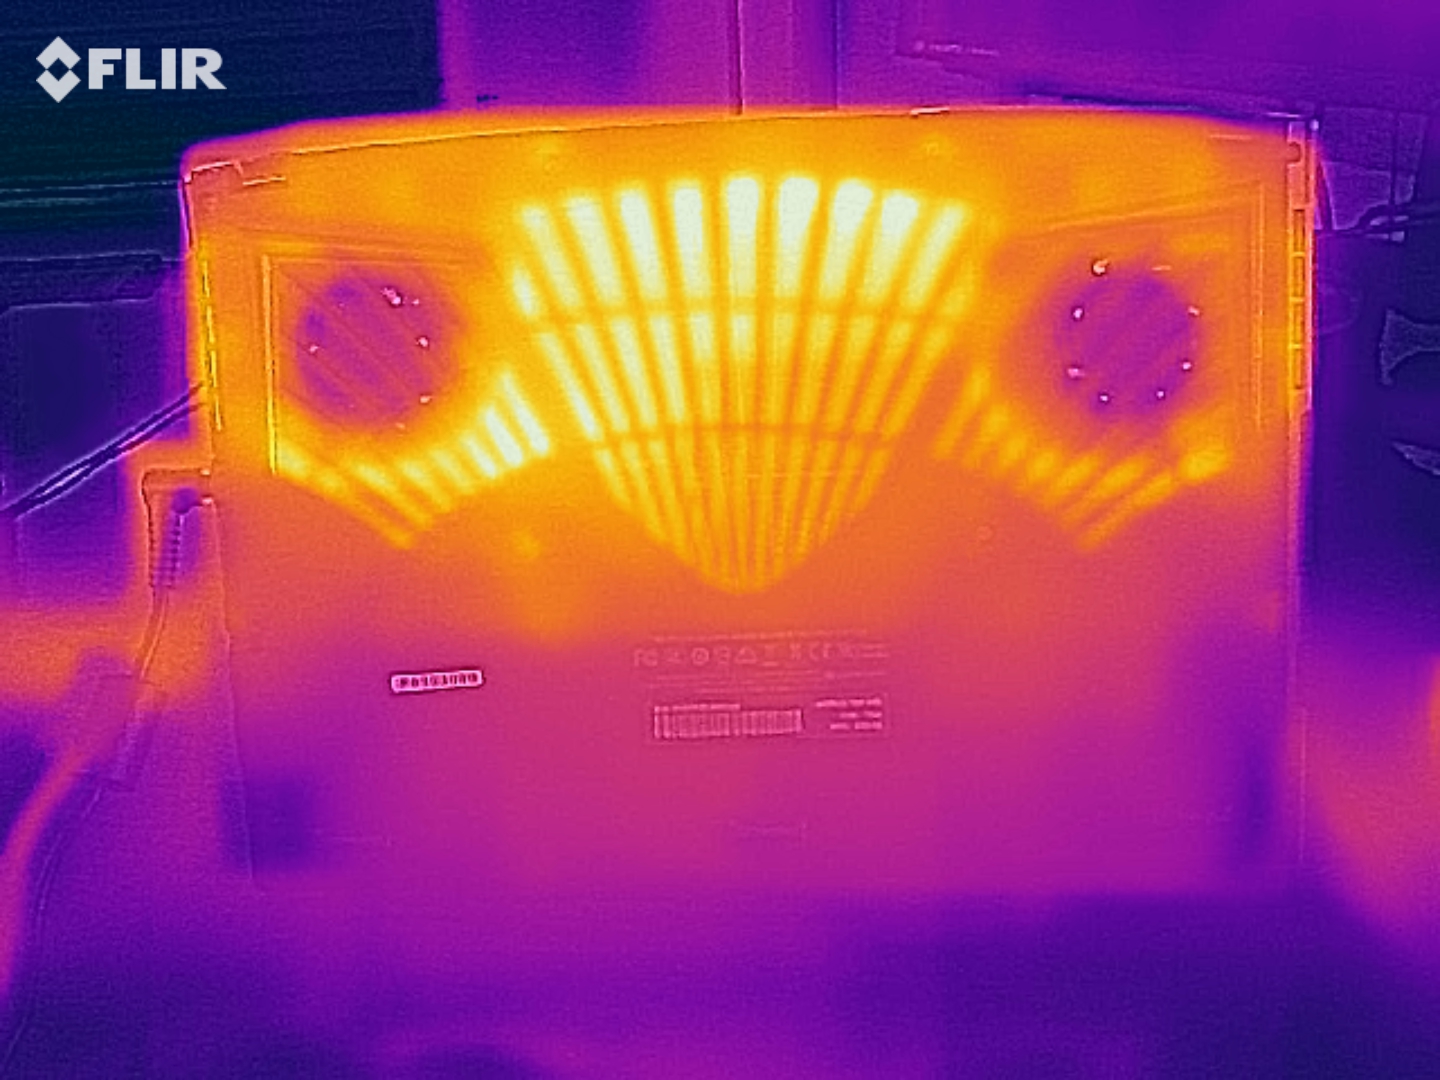
The Aorus laptop heats up considerably under load. During the stress test, we registered temperatures above 60 °C (~140 °F) at several measuring points on the underside. Furthermore, the temperature increases slightly less during our The Witcher 3 test. The laptop should not be placed on the lap in either case. In everyday use, however, the temperatures are within the green range.
(-) Üst taraftaki maksimum sıcaklık, 40.4 °C / 105 F ortalamasına kıyasla 47 °C / 117 F'dir. , Gaming sınıfı için 21.2 ile 68.8 °C arasında değişir.
(-) Alt kısım, 43.2 °C / 110 F ortalamasına kıyasla maksimum 62 °C / 144 F'ye kadar ısınır
(+) Boşta kullanımda, üst tarafın ortalama sıcaklığı 24.7 °C / 76 F olup, cihazın 33.9 °C / 93 F.
(±) The Witcher 3 oynarken, üst tarafın ortalama sıcaklığı 37 °C / 99 F olup, cihazın 33.9 °C / 93 F.
(+) Avuç içi dayanakları ve dokunmatik yüzey maksimum (32 °C / 89.6 F) cilt sıcaklığına ulaşıyor ve bu nedenle sıcak değil.
(-) Benzer cihazların avuç içi dayanağı alanının ortalama sıcaklığı 28.8 °C / 83.8 F (-3.2 °C / -5.8 F) idi.
| Aorus 15P WB i7-10750H, GeForce RTX 2070 Max-Q | Acer Predator Triton 300 PT315-52-79LP i7-10750H, GeForce RTX 2060 Mobile | Asus ROG Strix G15 G512LW i7-10750H, GeForce RTX 2070 Mobile | Dell G5 15 SE 5505 P89F R7 4800H, Radeon RX 5600M | Sınıf ortalaması Gaming | |
|---|---|---|---|---|---|
| Heat | -18% | -4% | -7% | -5% | |
| Maximum Upper Side * (°C) | 47 | 55 -17% | 53.4 -14% | 53 -13% | 45.2 ? 4% |
| Maximum Bottom * (°C) | 62 | 65 -5% | 49 21% | 57.6 7% | 48.2 ? 22% |
| Idle Upper Side * (°C) | 26 | 32 -23% | 29.6 -14% | 27.4 -5% | 31.1 ? -20% |
| Idle Bottom * (°C) | 27 | 34 -26% | 29.4 -9% | 31 -15% | 34.3 ? -27% |
* ... daha küçük daha iyidir
Speakers
The stereo speakers are located in the front area of the device's underside. They produce a decent sound that lacks bass. A better sound experience can be achieved with headphones or external speakers.
Aorus 15P WB ses analizi
(±) | hoparlör ses yüksekliği ortalama ama iyi (76 dB)
Bas 100 - 315Hz
(-) | neredeyse hiç bas yok - ortalama olarak medyandan 20.8% daha düşük
(±) | Bas doğrusallığı ortalamadır (13% delta - önceki frekans)
Ortalar 400 - 2000 Hz
(±) | daha yüksek ortalar - ortalama olarak medyandan 5.4% daha yüksek
(+) | orta frekanslar doğrusaldır (4.9% deltadan önceki frekansa)
Yüksekler 2 - 16 kHz
(+) | dengeli yüksekler - medyandan yalnızca 2.6% uzakta
(+) | yüksekler doğrusaldır (6.7% deltadan önceki frekansa)
Toplam 100 - 16.000 Hz
(±) | Genel sesin doğrusallığı ortalamadır (20.4% ortancaya göre fark)
Aynı sınıfla karşılaştırıldığında
» Bu sınıftaki tüm test edilen cihazların %72%'si daha iyi, 6% benzer, 22% daha kötüydü
» En iyisinin deltası 6% idi, ortalama 18% idi, en kötüsü 132% idi
Test edilen tüm cihazlarla karşılaştırıldığında
» Test edilen tüm cihazların %53'si daha iyi, 8 benzer, % 39 daha kötüydü
» En iyisinin deltası 4% idi, ortalama 24% idi, en kötüsü 134% idi
Energy management - Aorus laptop offers very good battery life
Energy consumption
The gaming laptop doesn't have any surprises in store in terms of energy consumption. We register a maximum power consumption of 19 watts in idle usage. The stress test and our The Witcher 3 test let the demand rise up to 249 watts and to an average of 150 watts, respectively. The power adapter's output is 230 watts.
| Kapalı / Bekleme modu | |
| Boşta | |
| Çalışırken |
|
Key:
min: | |
| Aorus 15P WB i7-10750H, GeForce RTX 2070 Max-Q | Acer Predator Triton 300 PT315-52-79LP i7-10750H, GeForce RTX 2060 Mobile | Asus ROG Strix G15 G512LW i7-10750H, GeForce RTX 2070 Mobile | Dell G5 15 SE 5505 P89F R7 4800H, Radeon RX 5600M | Sınıf ortalaması Gaming | |
|---|---|---|---|---|---|
| Power Consumption | 22% | -33% | 27% | -14% | |
| Idle Minimum * (Watt) | 13 | 4 69% | 16.2 -25% | 6.5 50% | 13.3 ? -2% |
| Idle Average * (Watt) | 15 | 10 33% | 24.1 -61% | 10.6 29% | 19 ? -27% |
| Idle Maximum * (Watt) | 19 | 19 -0% | 30.8 -62% | 11 42% | 24.5 ? -29% |
| Load Average * (Watt) | 100 | 96 4% | 127.6 -28% | 84.1 16% | 108.1 ? -8% |
| Witcher 3 ultra * (Watt) | 150 | 136 9% | 187.5 -25% | 152.9 -2% | |
| Load Maximum * (Watt) | 249 | 214 14% | 239 4% | 180.4 28% | 254 ? -2% |
* ... daha küçük daha iyidir
Battery life
The Aorus 15P achieves runtimes of 7:07 hours and 8:04 hours in our WLAN test (accessing websites using a script) and video test (the short film Big Buck Bunny (H.264 encoding, Full HD) running in a loop), respectively. During both tests, the laptop's power-saving functions are disabled, and the display brightness is set to about 150 cd/m². In addition, the wireless modules are disabled for the video test.
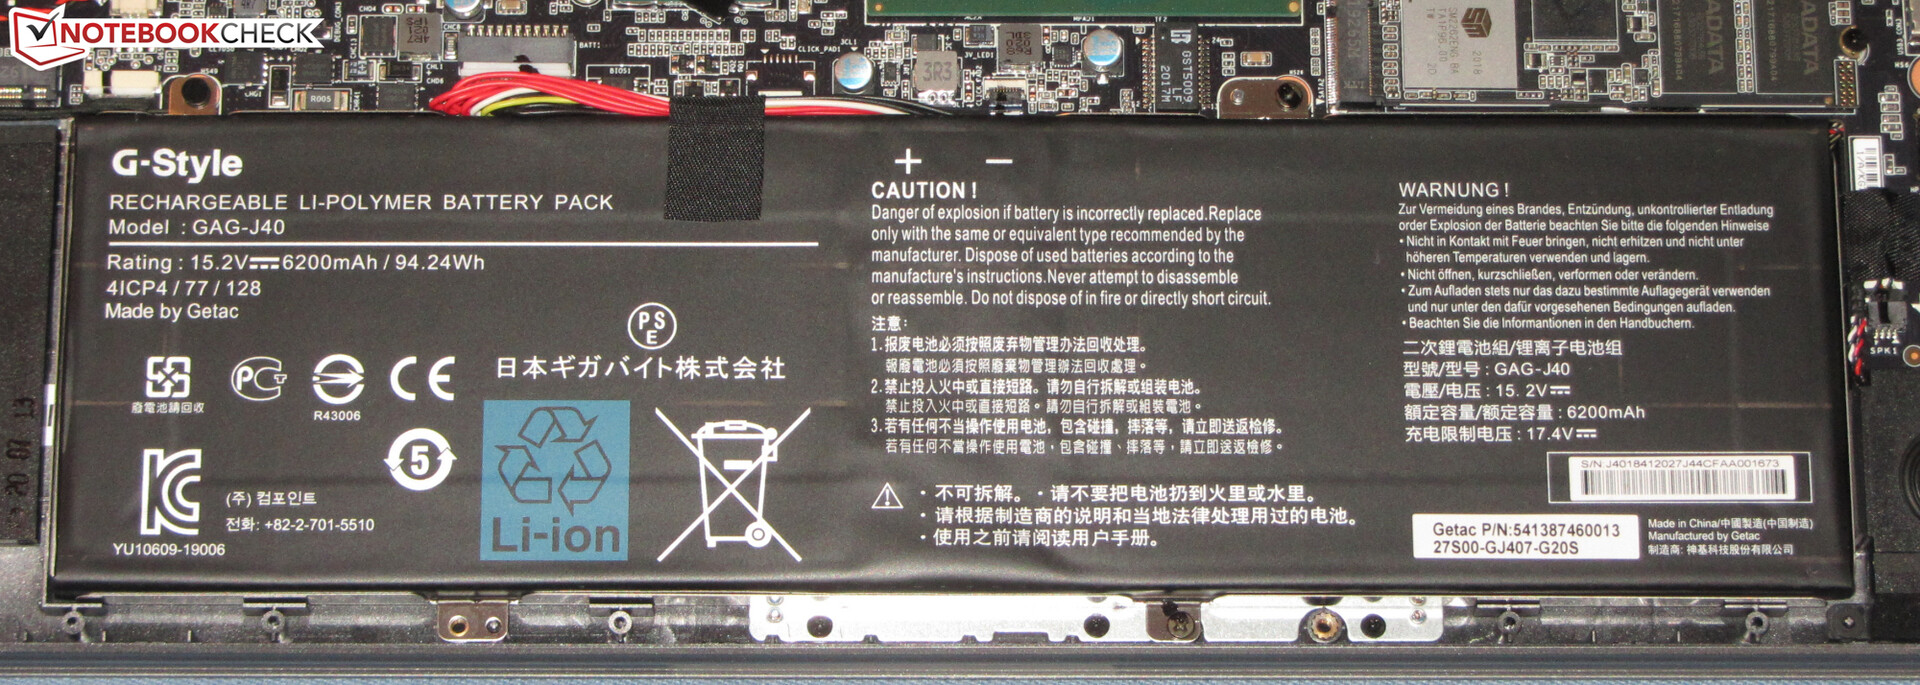
| Aorus 15P WB i7-10750H, GeForce RTX 2070 Max-Q, 94.24 Wh | Acer Predator Triton 300 PT315-52-79LP i7-10750H, GeForce RTX 2060 Mobile, 58.7 Wh | Asus ROG Strix G15 G512LW i7-10750H, GeForce RTX 2070 Mobile, 66 Wh | Dell G5 15 SE 5505 P89F R7 4800H, Radeon RX 5600M, 51 Wh | Sınıf ortalaması Gaming | |
|---|---|---|---|---|---|
| Pil Çalışma Süresi | -24% | -10% | -16% | -15% | |
| Reader / Idle (h) | 11.3 | 9.6 -15% | 11.2 -1% | 8.71 ? -23% | |
| H.264 (h) | 8.1 | 8.26 ? 2% | |||
| WiFi v1.3 (h) | 7.1 | 5.5 -23% | 6.4 -10% | 6.2 -13% | 7.01 ? -1% |
| Load (h) | 2.3 | 1.5 -35% | 1.5 -35% | 1.47 ? -36% |
Artılar
Eksiler
Verdict
With the Aorus 15P WB, Gigabyte has released a compact 15.6-inch gaming laptop that brings all modern games smoothly onto the screen thanks to the Core i7-10750H processor and the GeForce RTX 2070 Max-Q graphics core. Full HD resolution and high to maximum quality settings can usually be selected.
All in all, the Aorus 15P WB is a well-rounded gaming laptop that doesn't have any major weaknesses.
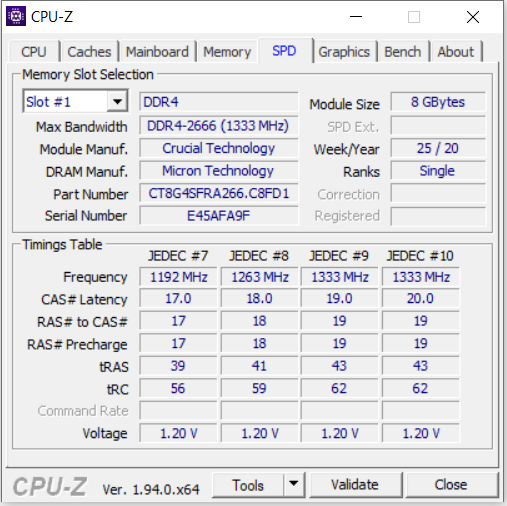
The hardware is supported by 16 GB of RAM (2x 8 GB, dual-channel mode, max. 64 GB) and a 512 GB NVMe SSD. The storage capacity is not exactly generous for a gaming laptop. A second NVMe SSD can be retrofitted if necessary, though. Since the bottom cover can be removed without any difficulty, upgrades should be easy.
The display (Full HD, IPS, 144 Hz) offers stable viewing angles, a matte surface, fast response times, good color reproduction, and decent color-space coverage. However, the maximum brightness and contrast should be higher. The keyboard (RGB backlighting) proved to be suitable for everyday use. Furthermore, the excellent battery life shouldn't go unmentioned. One battery charge is enough for practical runtimes of 7 to 8 hours - many office laptops can't pull this off.
Price and availability
The Aorus 15P WB is currently available in the WB-7DE1130SH configuration (Core i7-10750H, GeForce RTX 2070 Max-Q, 16 GB of RAM, 512 GB SSD) at a price of just under 1,540 Euros (~$1,891) at Computeruniverse.net.
Aorus 15P WB
- 01/02/2021 v7 (old)
Sascha Mölck
Price comparison

