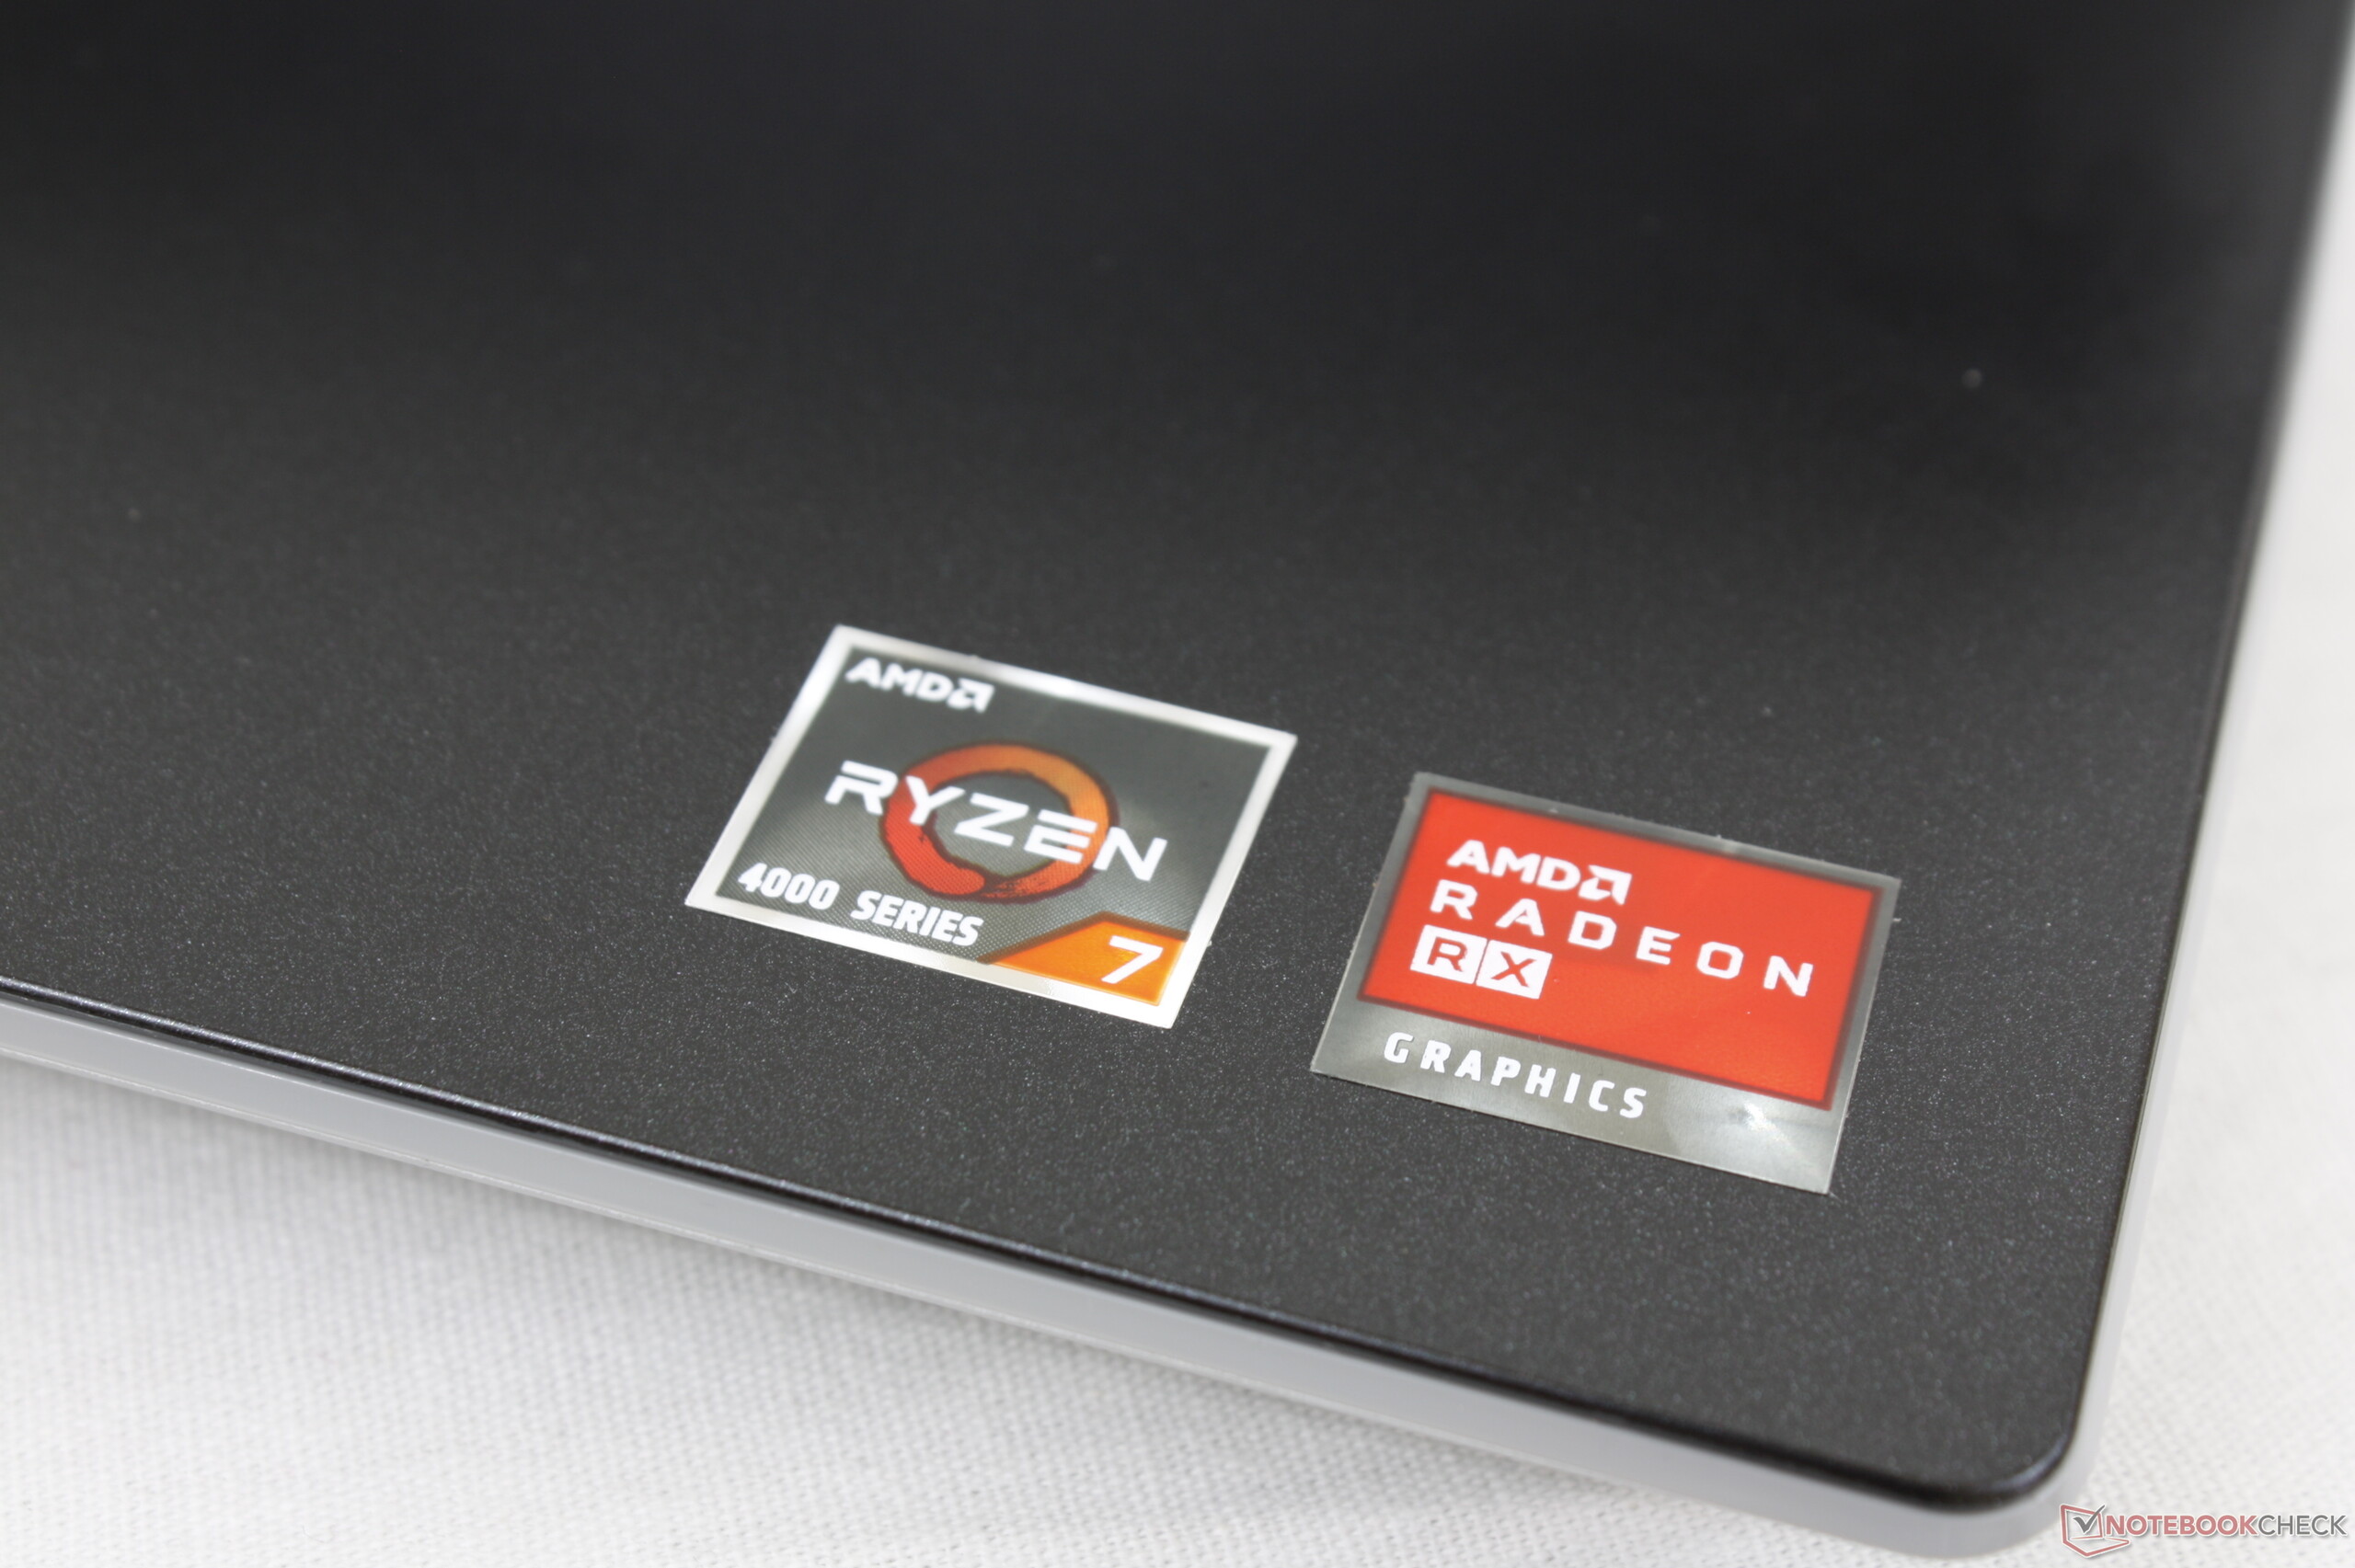
Tam gaz AMD: Dell G5 15 Special Edition Radeon RX 5600M Laptop incelemesi
Dell G5 15 Special Edition herhangi bir Intel CPU ve Nvidia GPU ile birlikte gönderilseydi, büyük olasılıkla çoğu okuyucu radarını geçecekti. Bunun yerine, sistem şimdiye kadar 7 nm Ryzen 7 4800H CPU'yu bir Radeon RX 5600M GPU ile eşleştiren tek dizüstü bilgisayar olarak benzersiz bir niş yarattı. Ayrıca, 2020 yılında AMD SmartShift'i entegre eden tek dizüstü bilgisayar olması bekleniyor - bu, Sony Playstation 5'de görünecek ancak XBox Series X'de görünmeyen aynı performans arttırıcı teknoloji. Bu ilginç özellikleri makul 850 $ ile birleştirin 1200 USD fiyat noktası ve Dell'in en son uygun fiyatlı oyun dizüstü bilgisayarının performansı hakkında neden bu kadar çok abartı olduğunu görebiliyoruz. İncelediğimiz SKU, Ryzen 7 4800H CPU, 1080p144 ekran, 16 GB RAM ile donatılmış üst düzey bir yapılandırmadır. ve yaklaşık 1250 $ karşılığında 512 GB NVMe SSD. Ryzen 5 4600H, 1080p60 ekran ve RAM ve depolama alanının yarısı ile daha az SKU mevcuttur. Radeon RX 5600M tüm seçeneklerde sabittir. Doğrudan rakipler, Asus TUF A15, HP Omen 15, Lenovo Legion Y740 veya MSI Bravo 15 gibi orta sınıf 15.6 inç oyun dizüstü bilgisayarlarına diğer bütçeleri içerir. m15 R2Dell XPS 15 9500Dell G5 15 5590Dell Latitude 7400Dell Inspiron 15
Derecelendirme | Tarih | Modeli | Ağırlık | Yükseklik | Boyut | Çözünürlük | Fiyat |
|---|---|---|---|---|---|---|---|
| 83.7 % v7 (old) | 06/2020 | Dell G5 15 SE 5505 P89F R7 4800H, Radeon RX 5600M | 2.4 kg | 21.6 mm | 15.60" | 1920x1080 | |
| 82.7 % v7 (old) | Asus TUF Gaming A15 FA506IV-HN172 R7 4800H, GeForce RTX 2060 Mobile | 2.2 kg | 24.9 mm | 15.60" | 1920x1080 | ||
| 82.6 % v7 (old) | 12/2019 | Dell G5 15 5590-P8RVW i7-9750H, GeForce RTX 2070 Max-Q | 2.8 kg | 23.7 mm | 15.60" | 1920x1080 | |
| 84.8 % v7 (old) | 10/2019 | Lenovo Legion Y740-15ICHg i7-9750H, GeForce RTX 2070 Max-Q | 2.3 kg | 25 mm | 15.60" | 1920x1080 | |
| 83.2 % v7 (old) | 05/2020 | MSI GP65 10SFK-047US i7-10750H, GeForce RTX 2070 Mobile | 2.3 kg | 27.5 mm | 15.60" | 1920x1080 | |
| 81.5 % v7 (old) | HP Omen 15-dc1020ng i5-9300H, GeForce GTX 1650 Mobile | 2.3 kg | 25 mm | 15.60" | 1920x1080 |
Durum
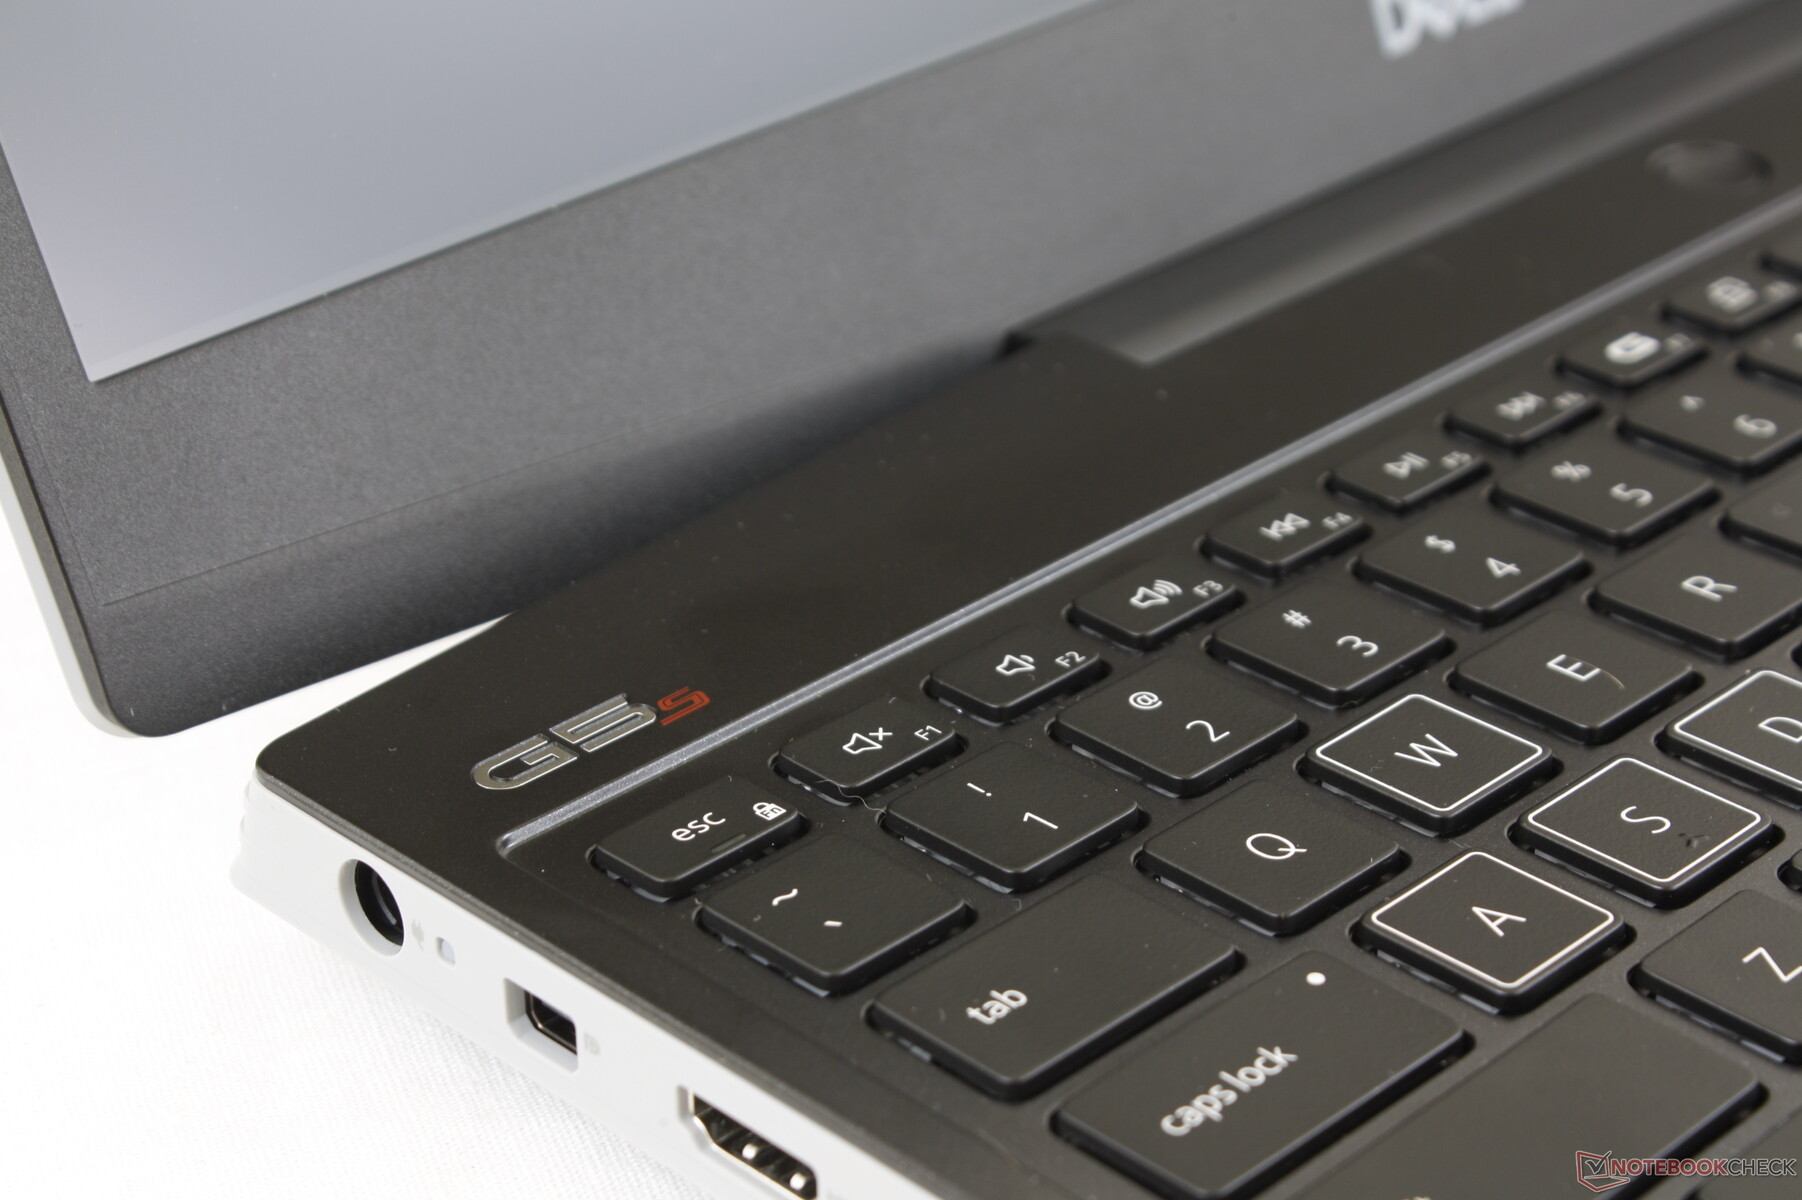
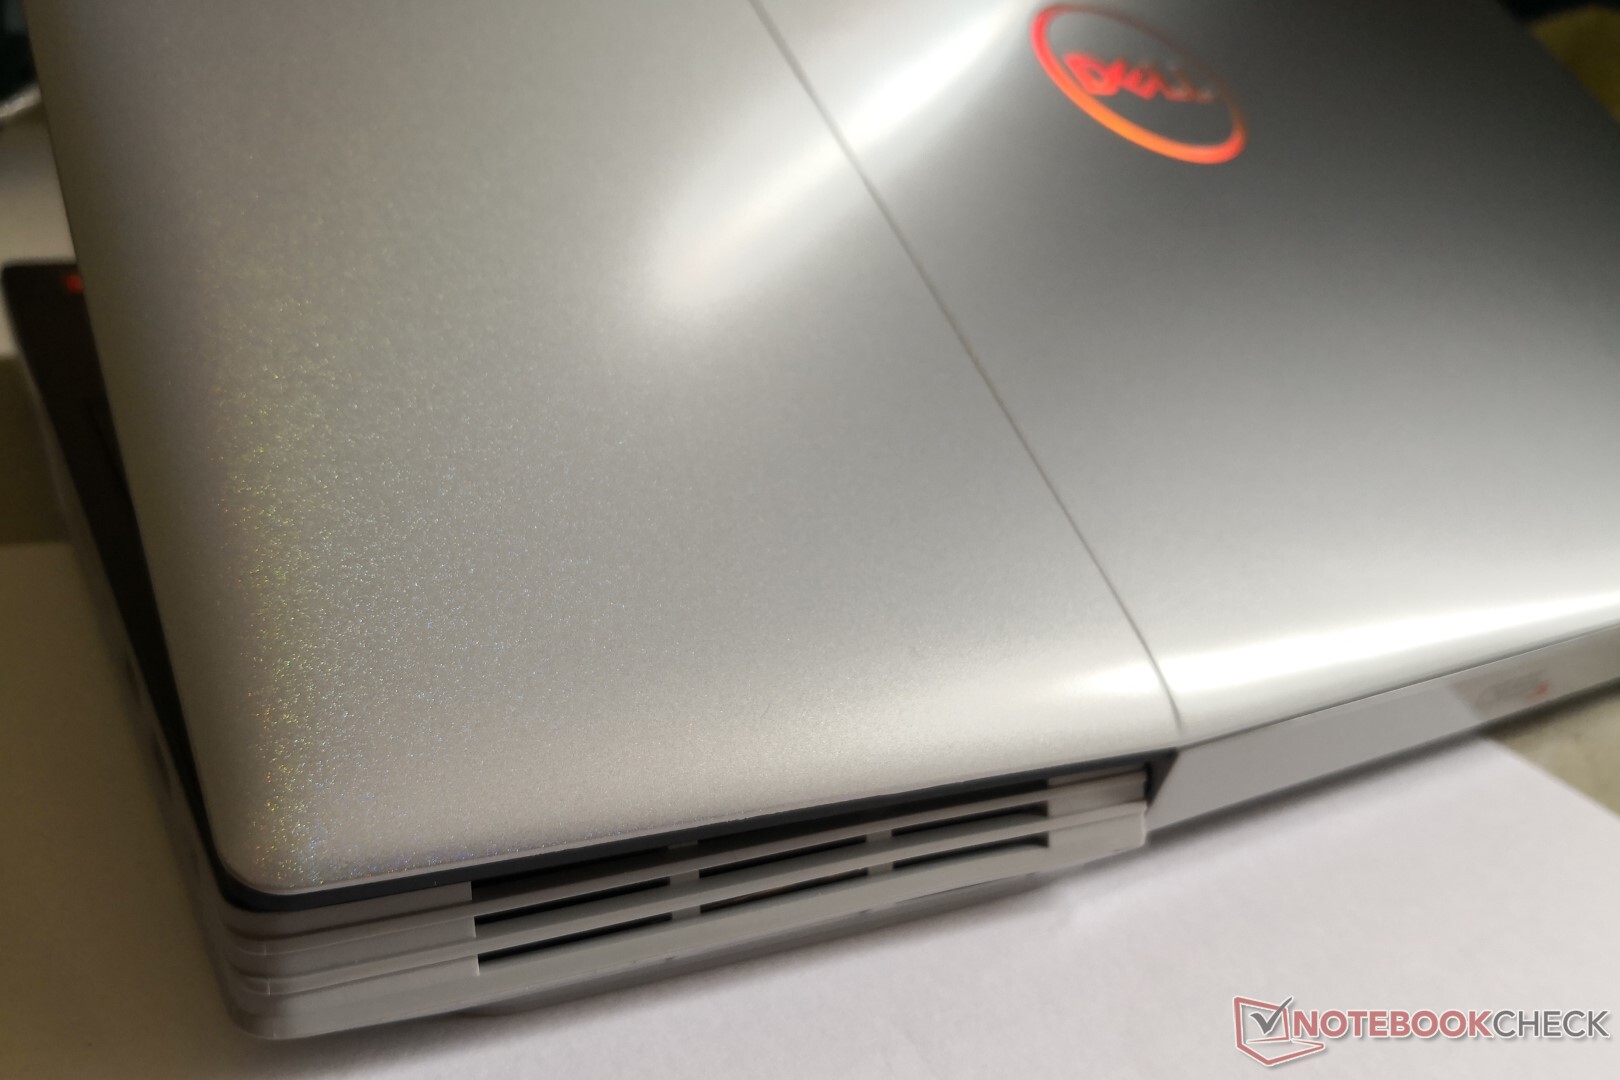
Stilistik olarak, şasi çoğu kullanıcıyla vurulacak veya özlenecek. Potansiyel sahipleri, bunun bir Alienware veya MSI GS65 veya Razer Blade 15 gibi 2000 dolarlık minimalist tek kişilik bir oyun dizüstü bilgisayarı olmadığını hatırlamak zorunda. Bunun yerine, burada bir Inspiron 15'in genel estetiği ile çoğunlukla plastik olan şey var. Dış kapak hafif yanardöner ince bir görsel yetenek için gökkuşağı efekti, ancak bu eski G5 15 tasarımlarında olduğu gibi daha "sıradan" bir jet siyah rengini tercih eden oyuncular için karışık bir çanta olabilir. Dell'in şu anda "Supernova Silver" dışında başka renk seçenekleri sunmaması çok kötü. Bir yapı kalitesi perspektifinden, baz, klavye merkezine baskı uygularken veya köşeleri bükerken asgari çöküntüler veya çarpılma ile sağlamdır. -to tarafı. Bir Alienware m15 R2 kadar sağlam gelmiyor, ancak en azından Asus TUF A15 ile karşılaştırılabilir. Kapak daha sert olabilir ve ekran açılırken kasa gıcırdama eğilimi gösterir. Sistemin en ucuz olduğunu ve bütçe fiyat noktasını en iyi temsil ettiği yerdir.
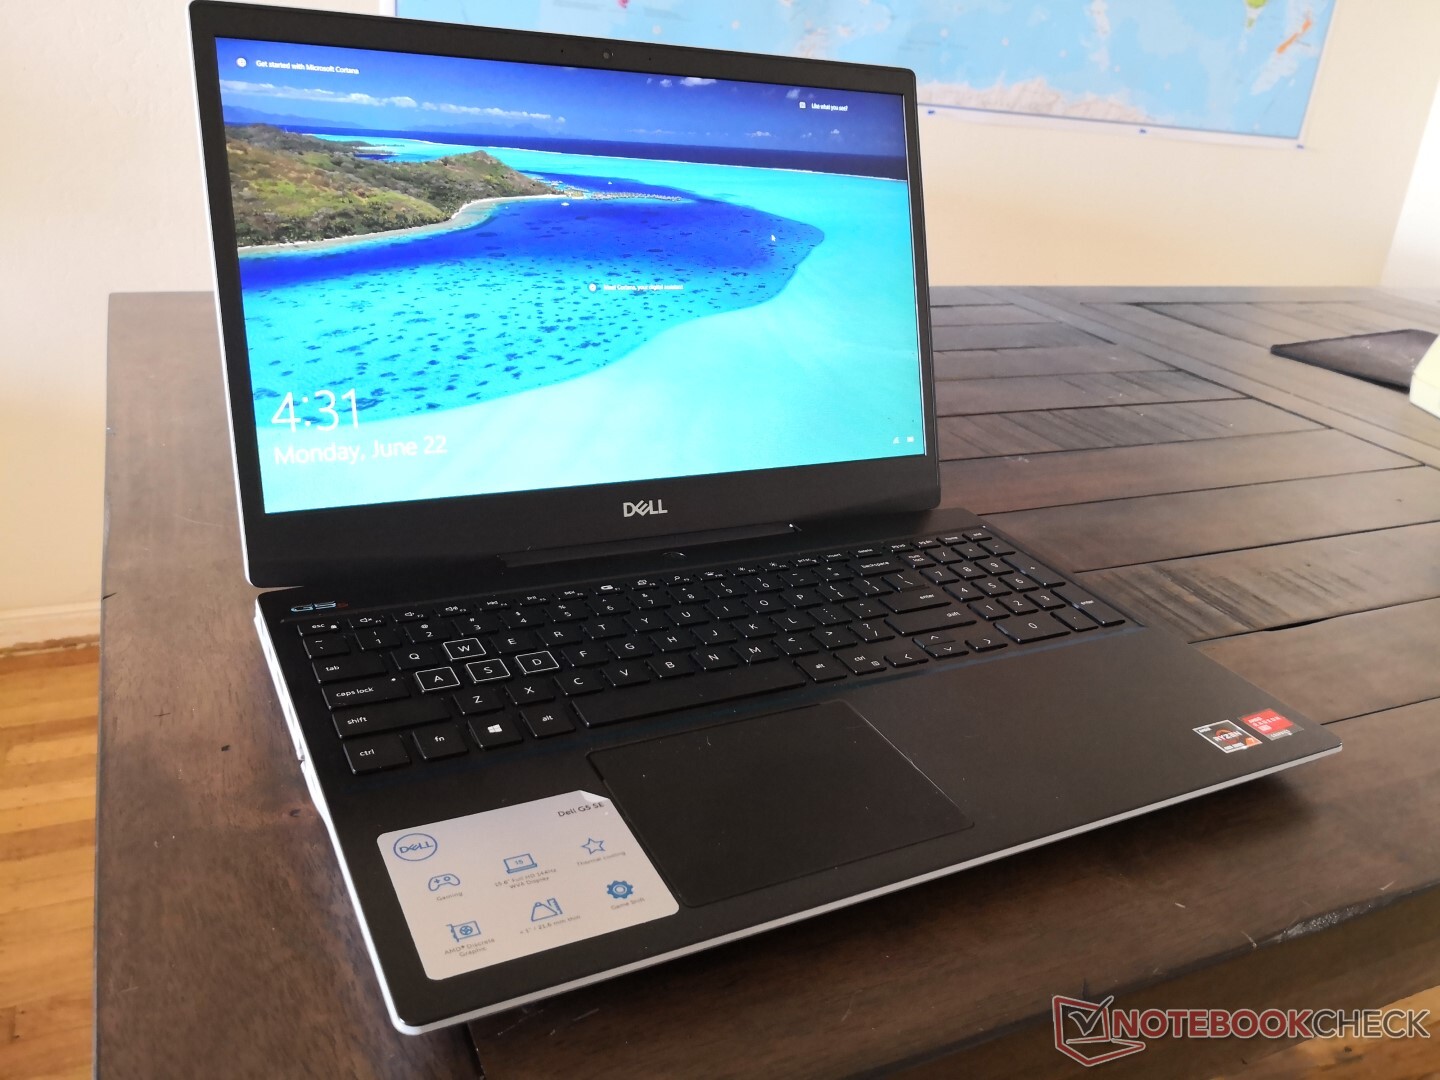
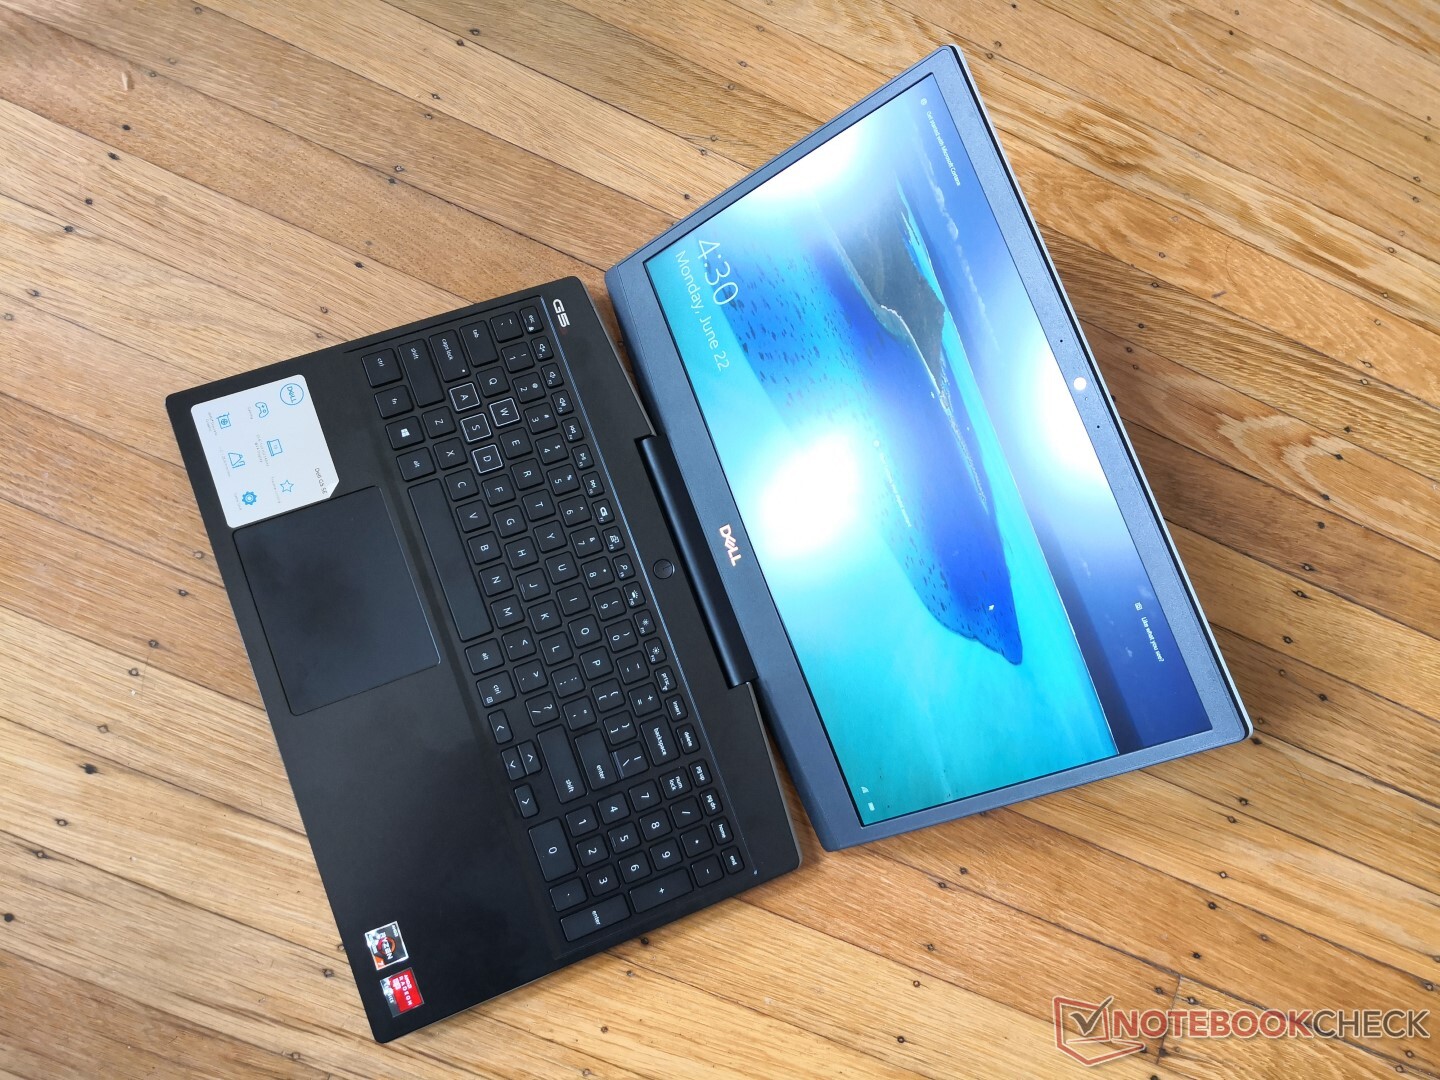
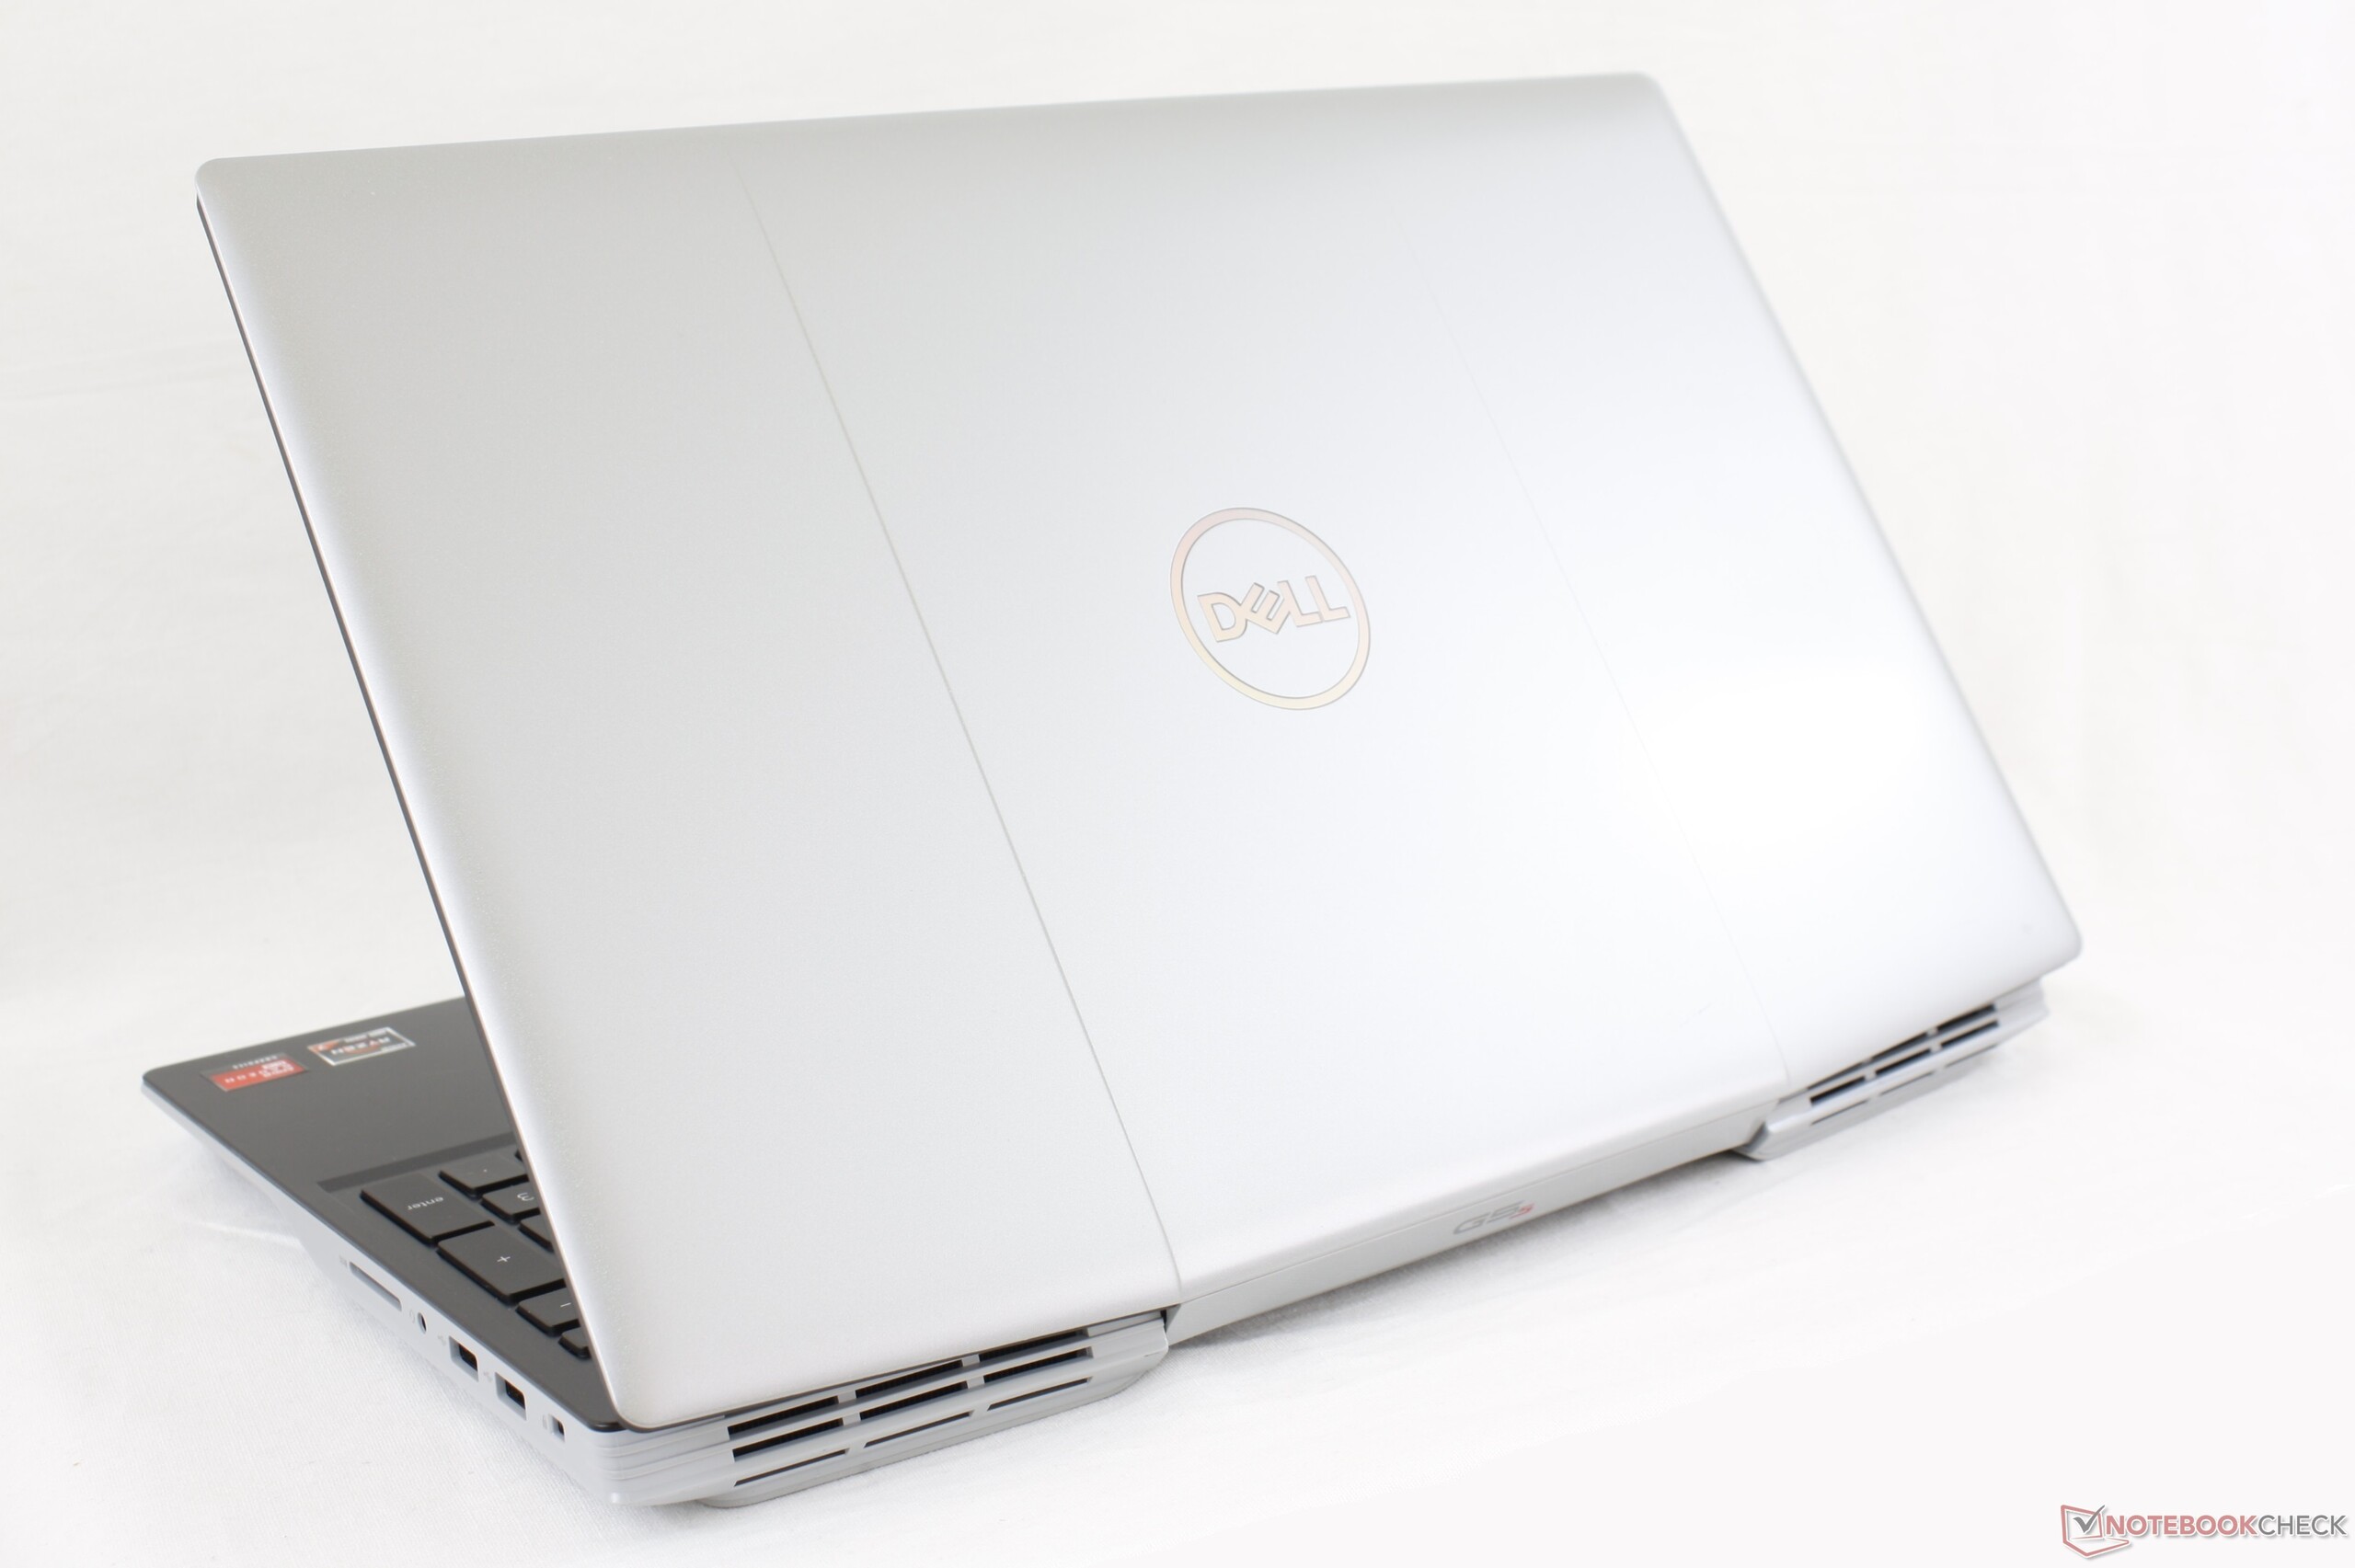
Yeni kasa, eski G5 15 dizüstü bilgisayarlar hakkındaki en büyük şikayetlerimizden bazılarını ele alıyor: boyut ve ağırlık. G5 15 SE, fiyat aralığındaki diğer dizüstü bilgisayarlarla daha uyumlu olması için öncüllerinden belirgin şekilde daha küçük ve daha hafiftir. Aynı fiyat aralığındaki "nihai" ince ve hafif oyun dizüstü bilgisayarı, eski Asus Zephyrus GA502 serisi olmaya devam ediyor.
Bağlantı
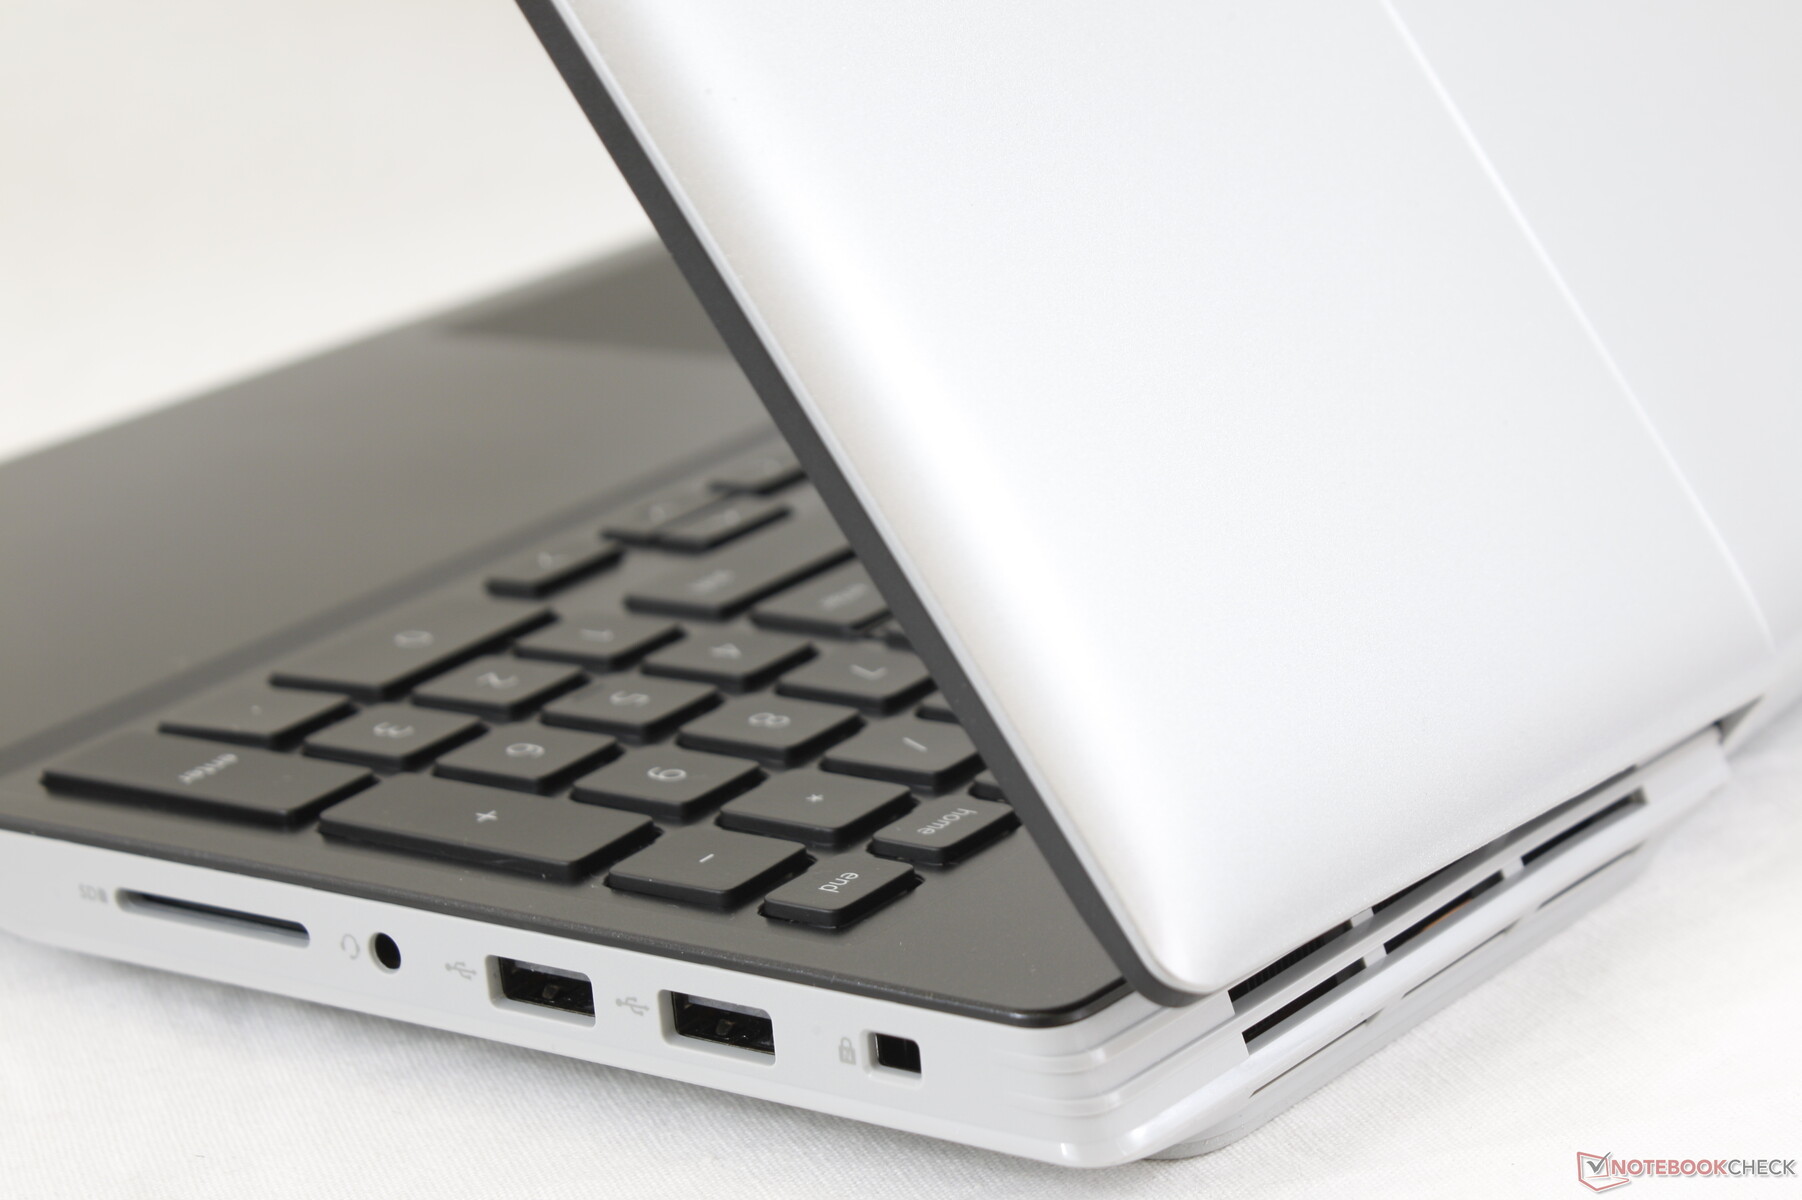
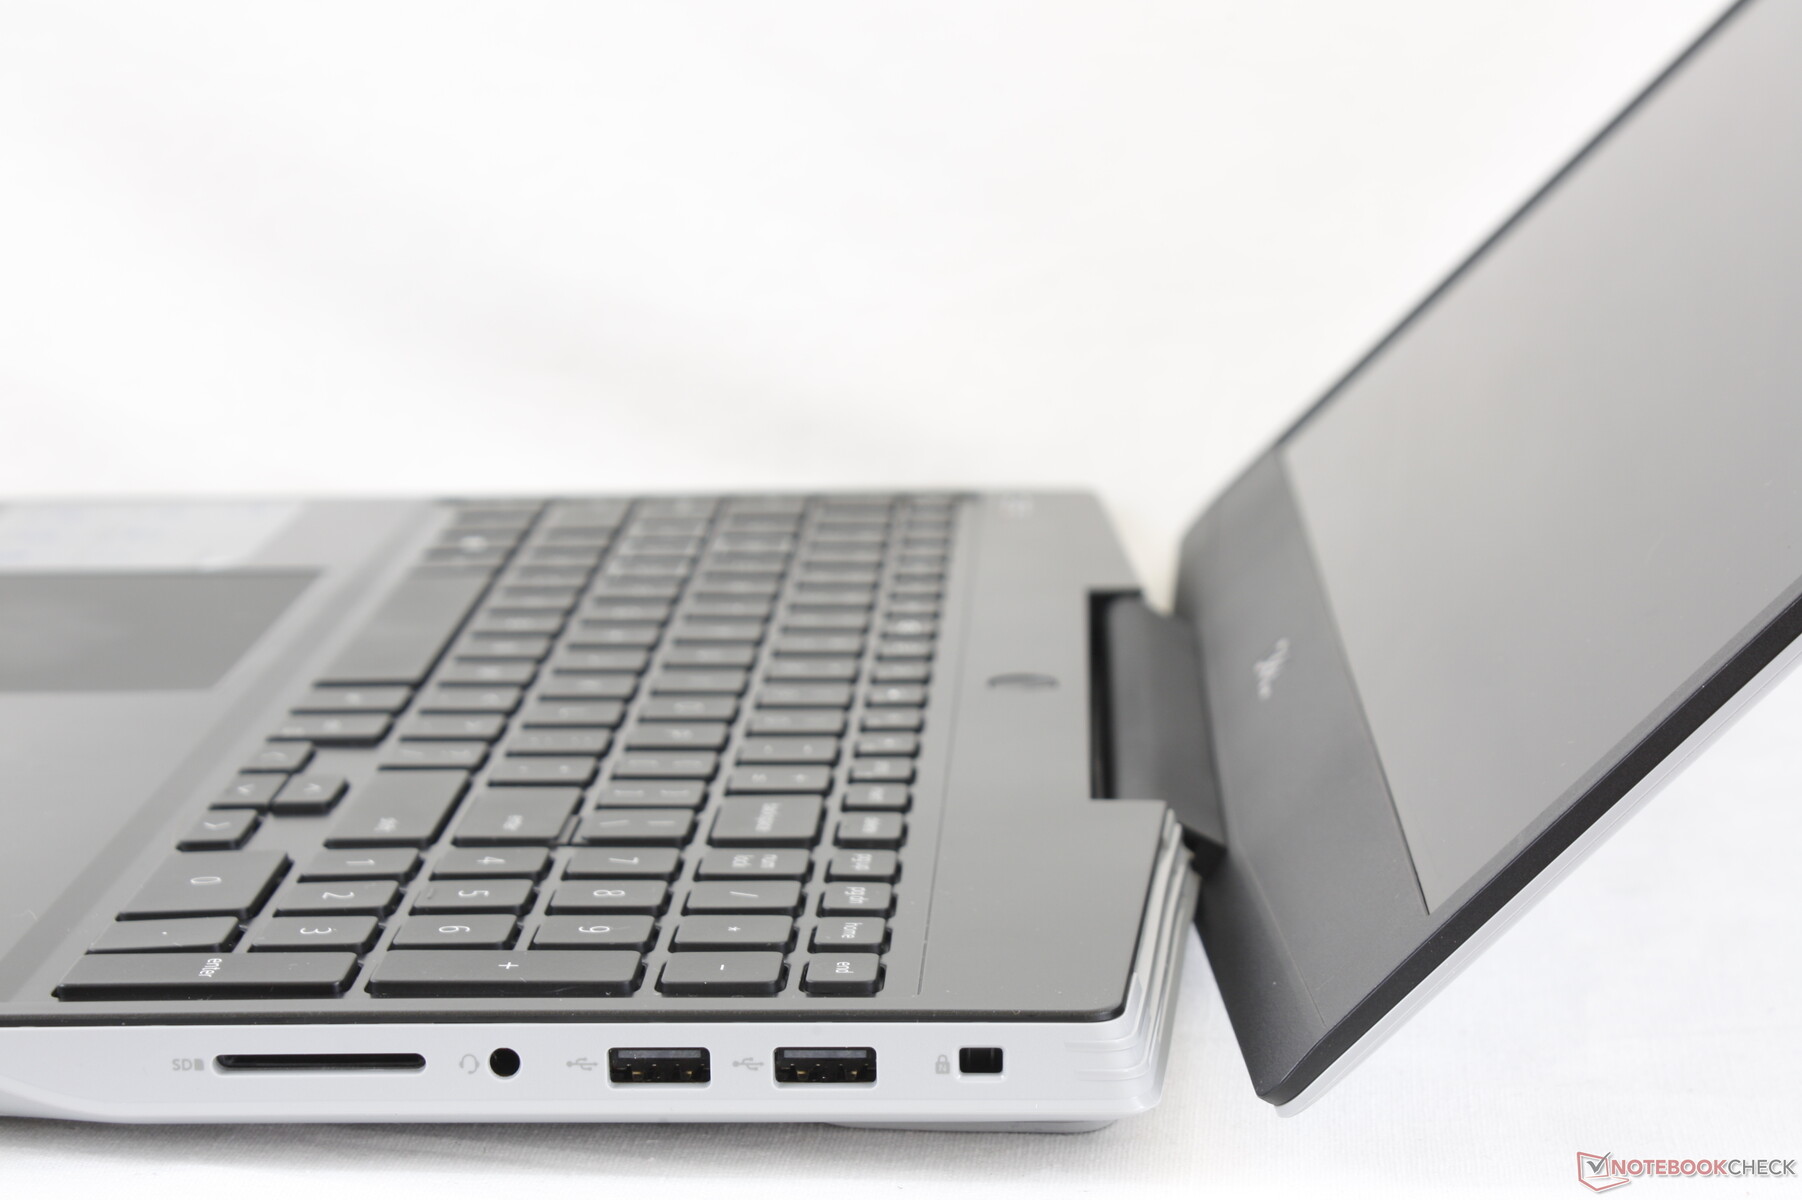
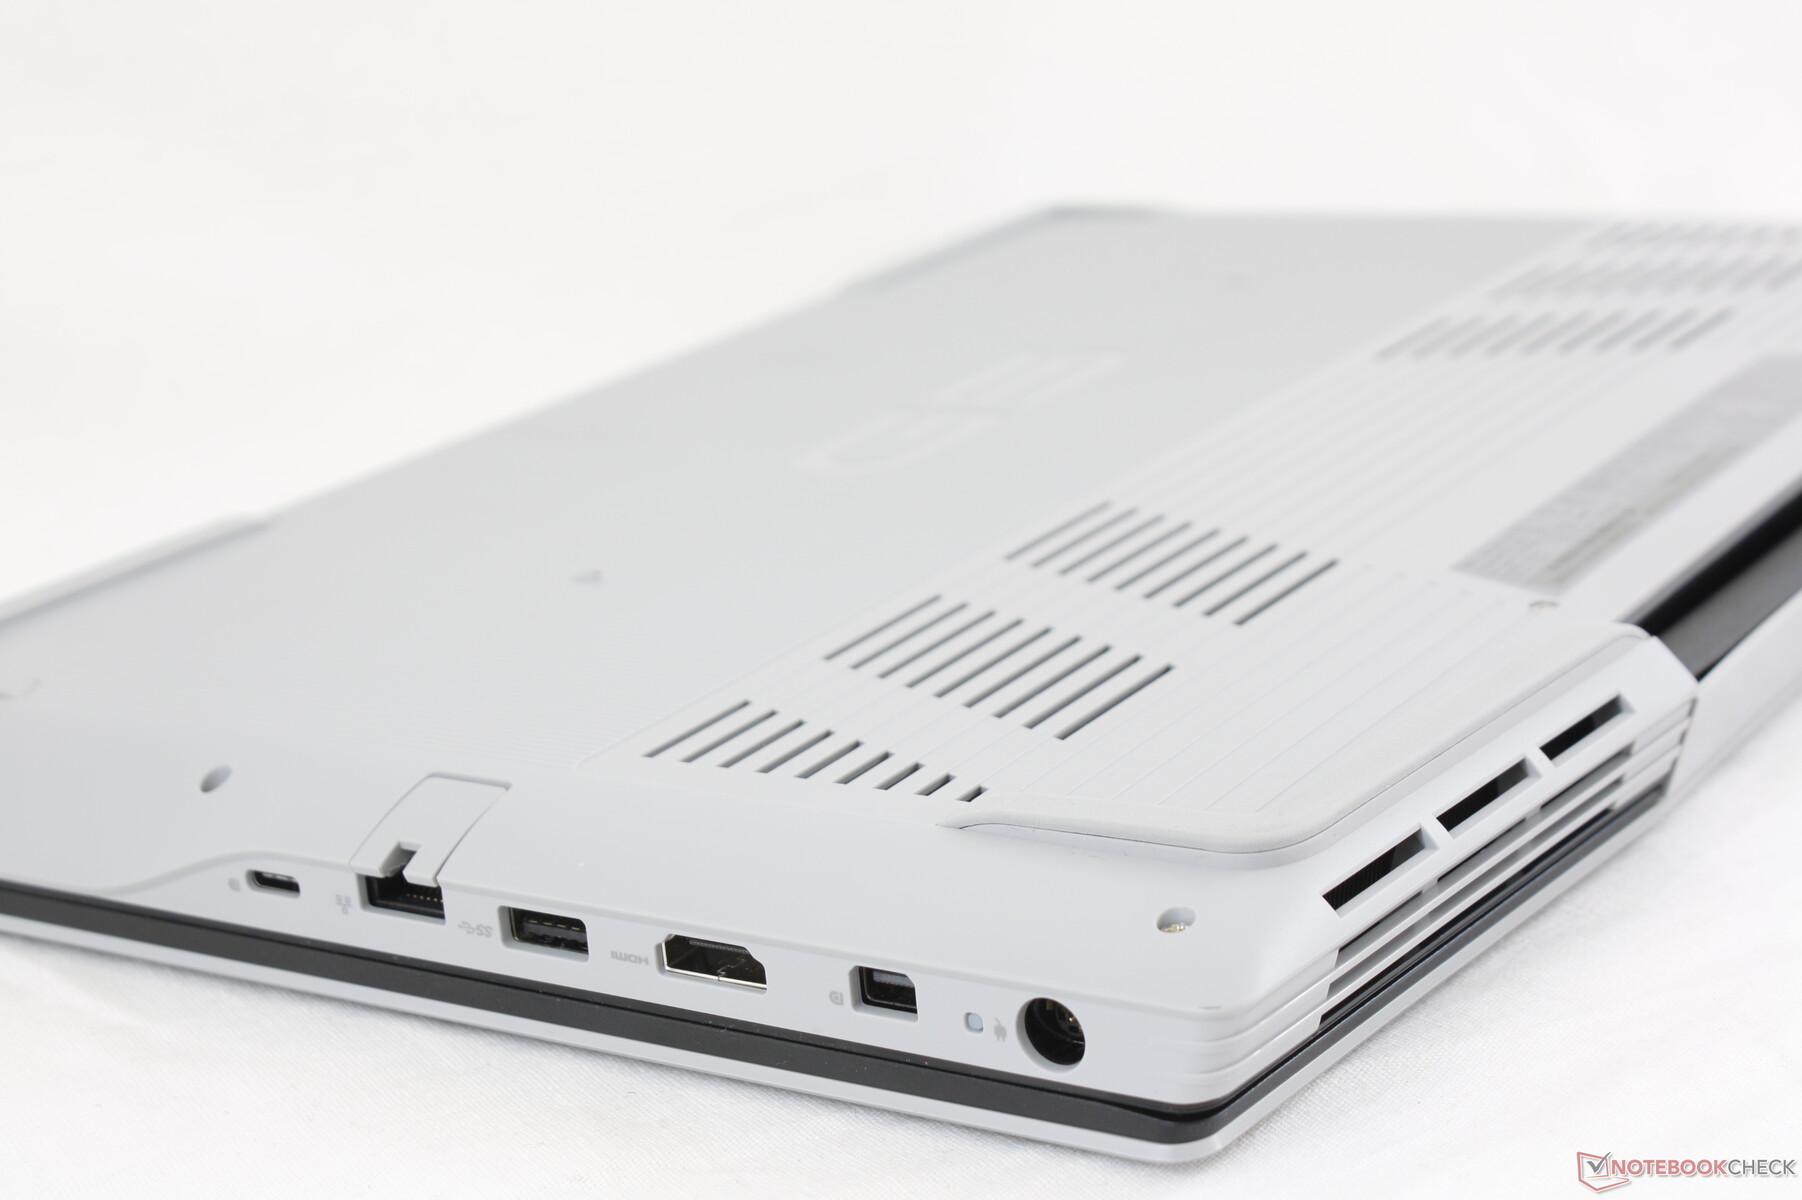
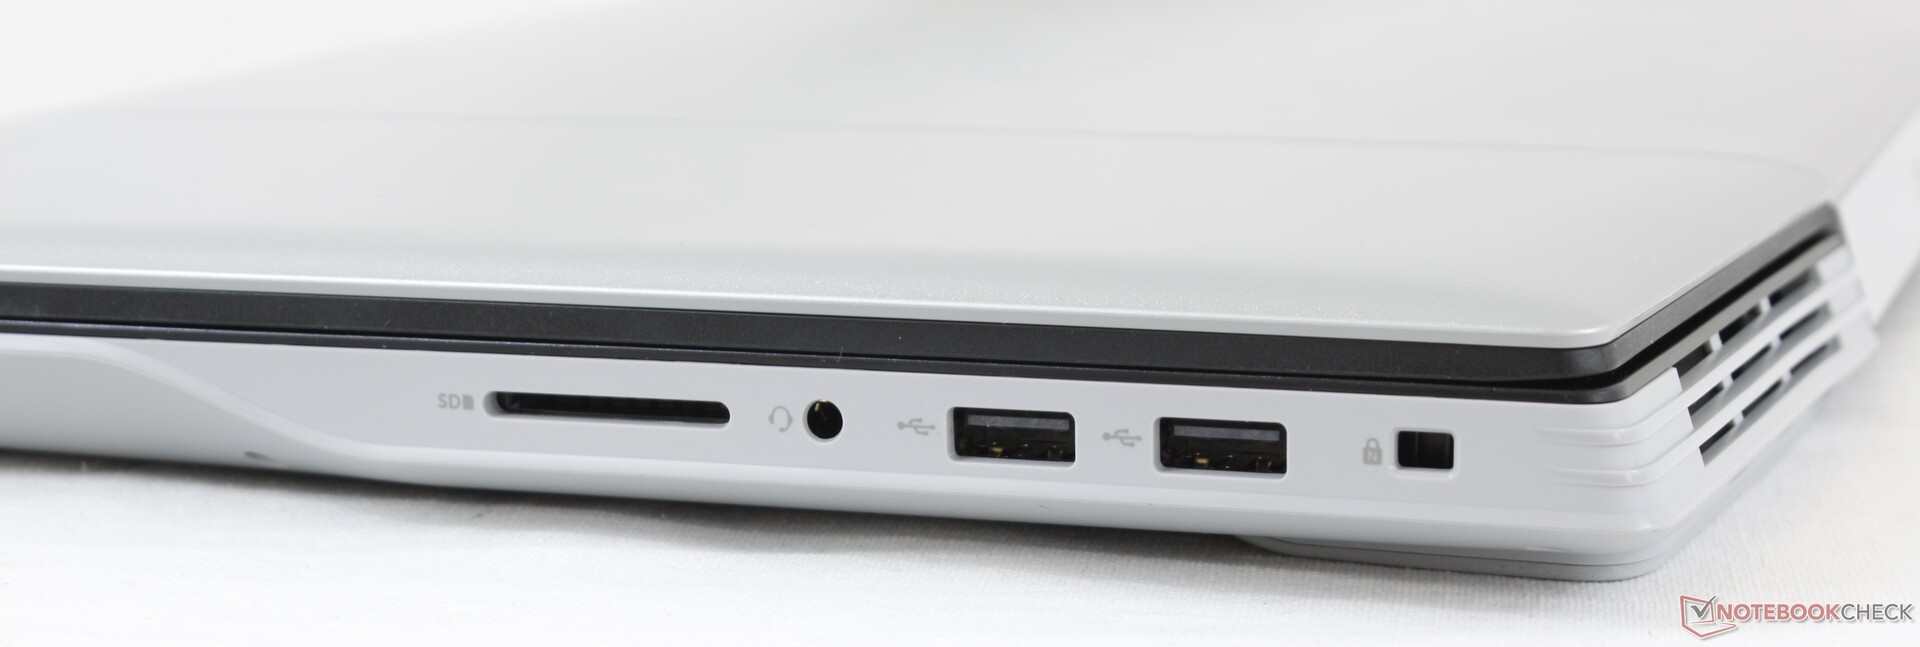
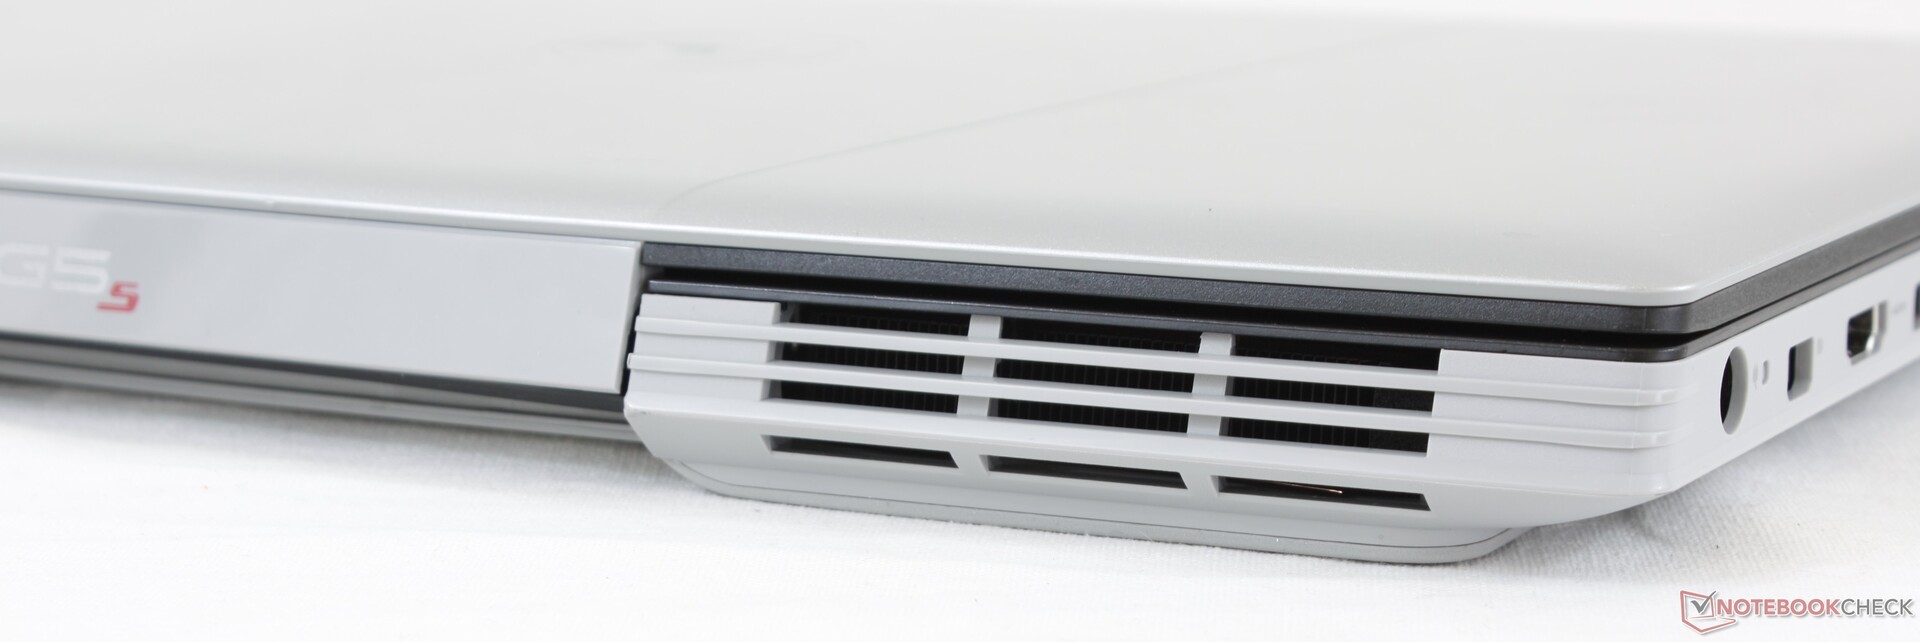
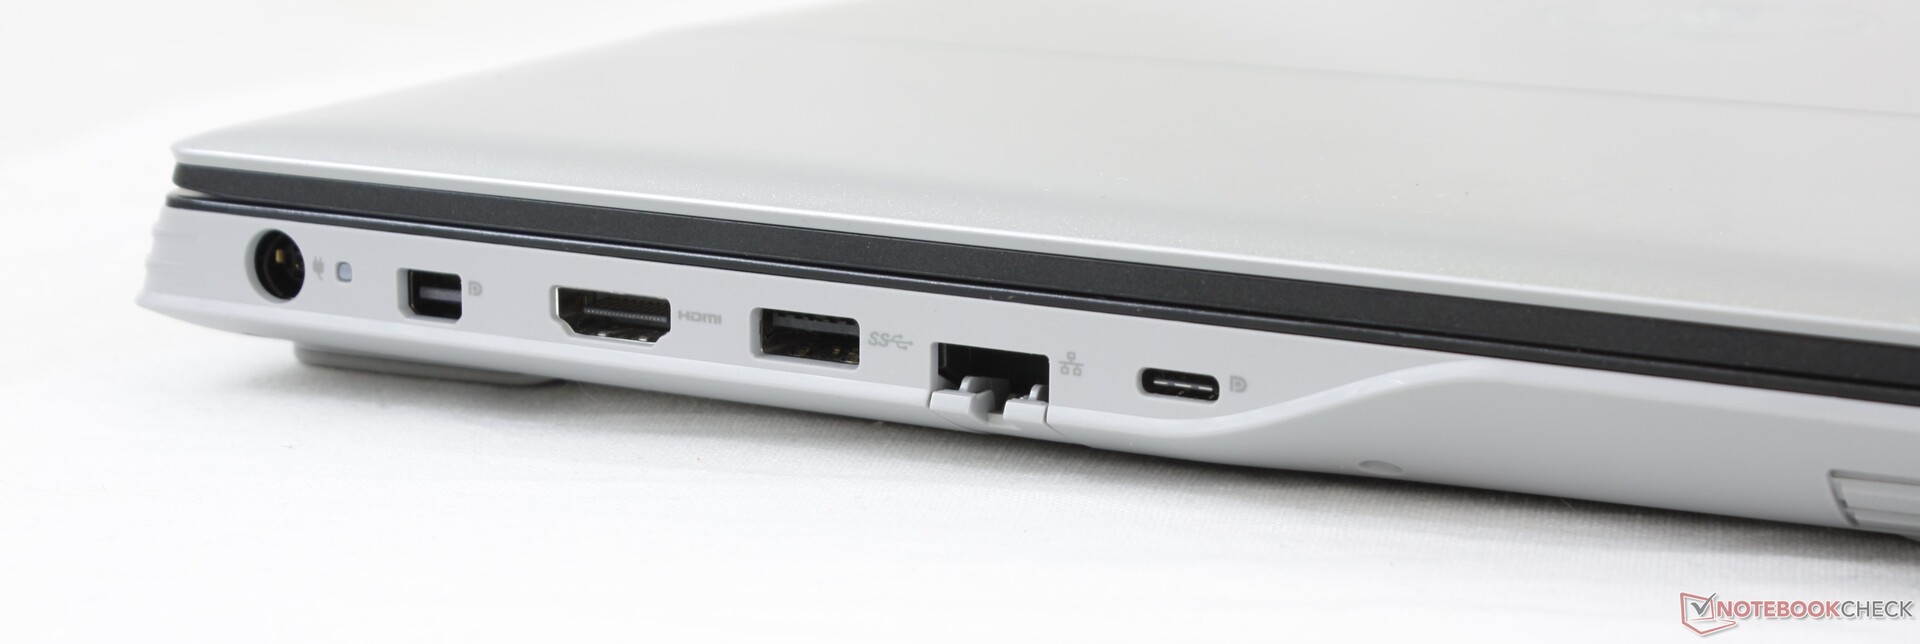
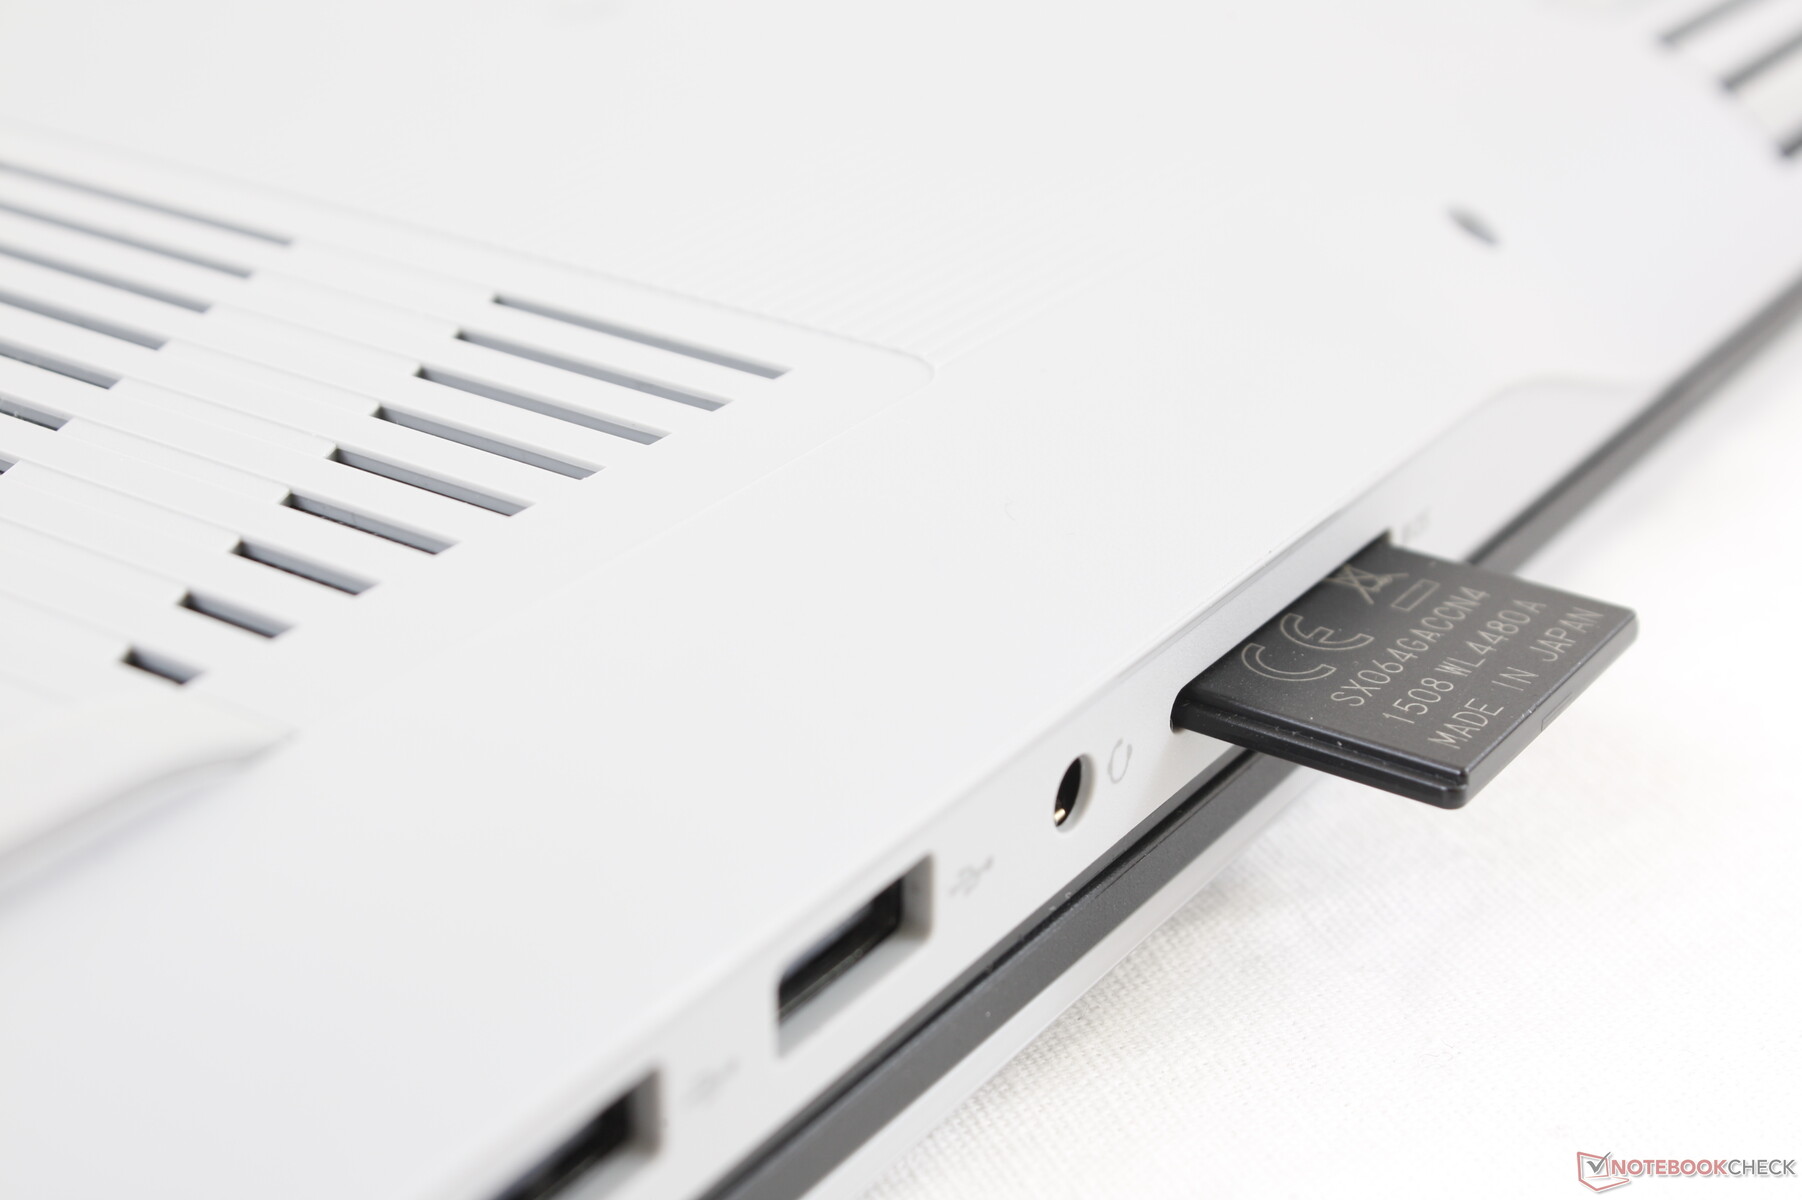
Bağlantı noktası seçenekleri esasen G5 15 5590 ile aynıdır, ancak iki büyük fark vardır. Birincisi, USB Type-C bağlantı noktası artık Thunderbolt 3'ü desteklemiyor ve ikincisi, daha kolay erişilebilirlik için bağlantı noktası yerleşimi artık değişti. Bu seçenek giderek yaygınlaşmayacağından Dell'in özel mini DisplayPort'u koruduğunu görmek ilginç.
SD Kart Okuyucu
Entegre SD kart okuyucu yavaş olmaya devam ediyor. UHS-II test kartımızdan masaüstüne 1 GB boyutundaki fotoğrafların çekilmesi, XPS 15'teki 8 saniyenin altına kıyasla yaklaşık 28 saniye sürer.
| SD Card Reader | |
| average JPG Copy Test (av. of 3 runs) | |
| HP Omen 15-dc1020ng (Toshiba Exceria Pro SDXC 64 GB UHS-II) | |
| Dell G5 15 SE 5505 P89F (Toshiba Exceria Pro SDXC 64 GB UHS-II) | |
| MSI GP65 10SFK-047US (Toshiba Exceria Pro SDXC 64 GB UHS-II) | |
| Dell G5 15 5590-P8RVW (Toshiba Exceria Pro SDXC 64 GB UHS-II) | |
| maximum AS SSD Seq Read Test (1GB) | |
| HP Omen 15-dc1020ng (Toshiba Exceria Pro SDXC 64 GB UHS-II) | |
| Dell G5 15 SE 5505 P89F (Toshiba Exceria Pro SDXC 64 GB UHS-II) | |
| MSI GP65 10SFK-047US (Toshiba Exceria Pro SDXC 64 GB UHS-II) | |
| Dell G5 15 5590-P8RVW (Toshiba Exceria Pro SDXC 64 GB UHS-II) | |
İletişim
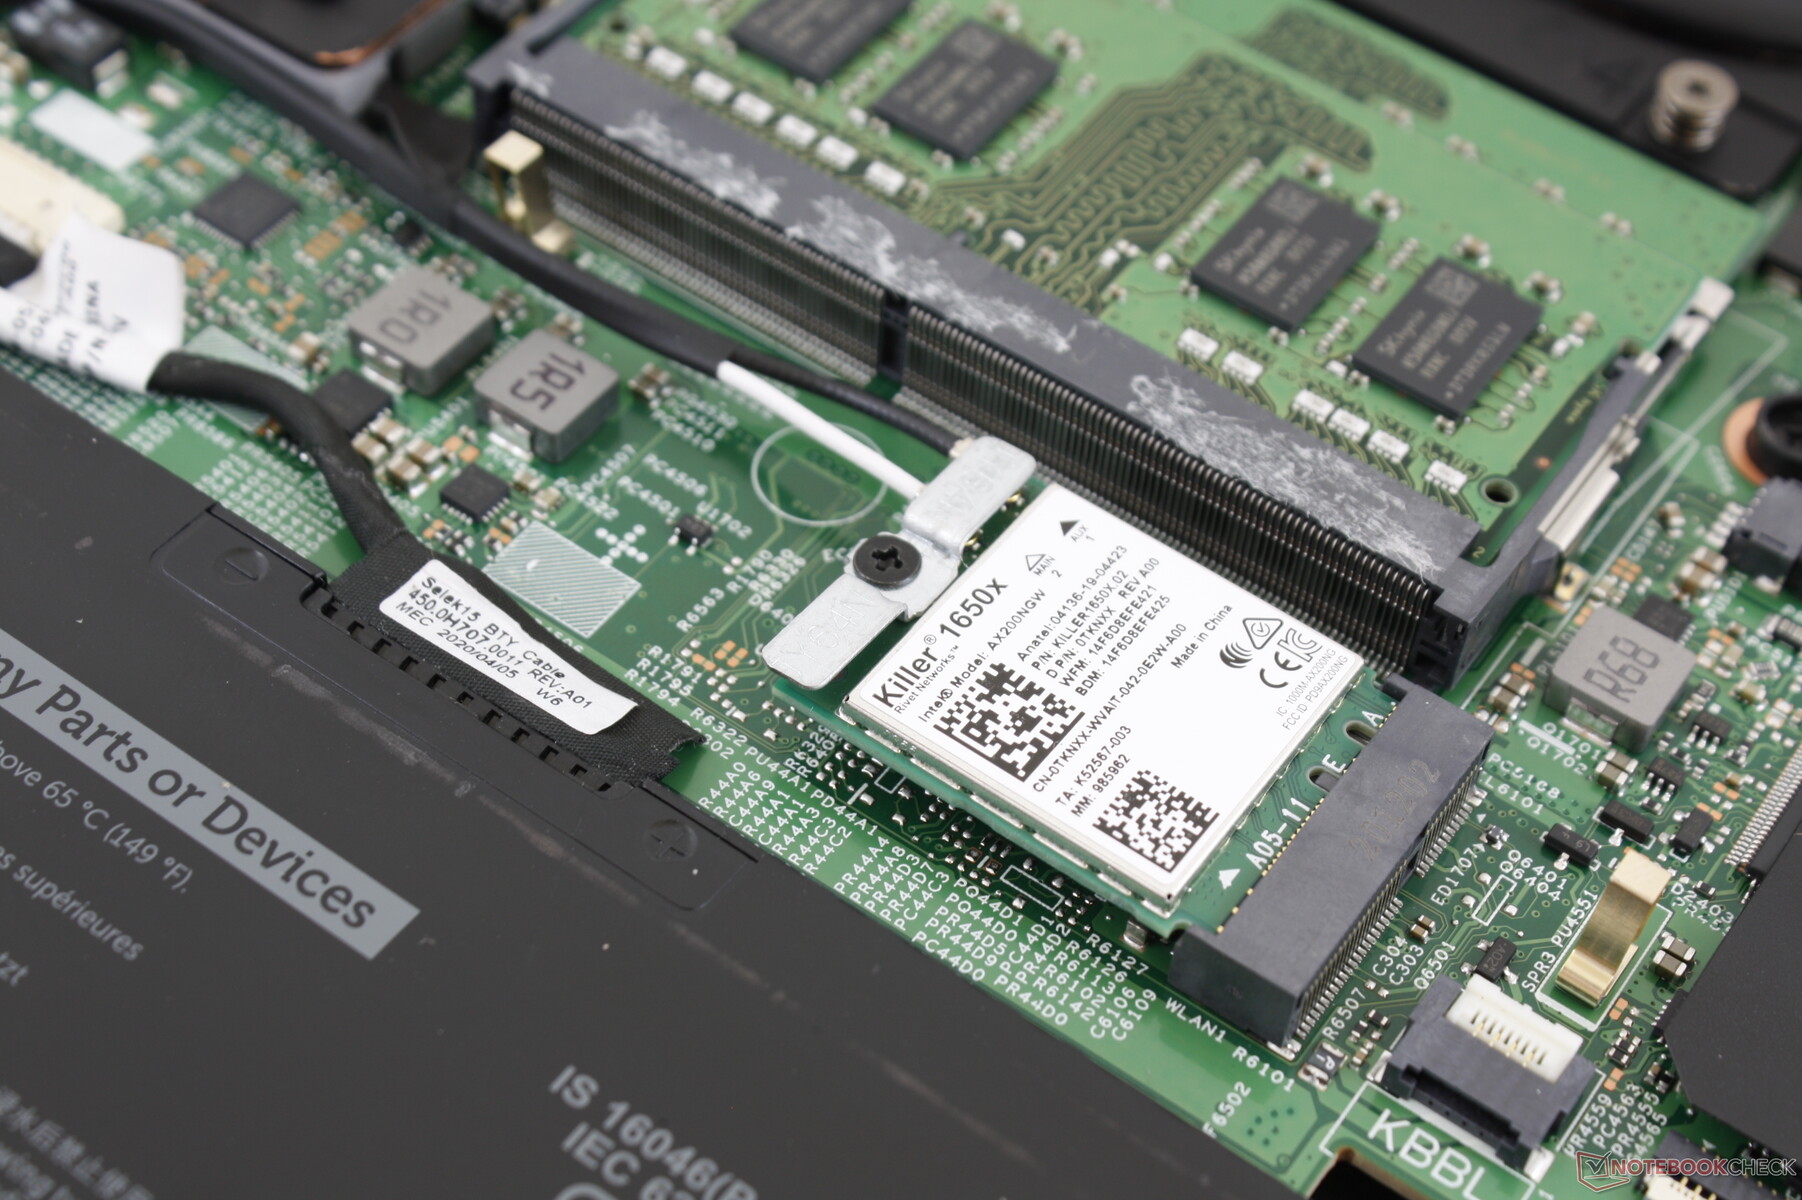
Killer AX1650s, Wi-Fi 6 ve Bluetooth 5.1 bağlantısı için tüm SKU'larda standart olarak gelir. Netgear RAX200 yönlendiricimize bağlandığında herhangi bir sorunla karşılaşmadık.
| Networking | |
| iperf3 transmit AX12 | |
| Dell G5 15 SE 5505 P89F | |
| HP Envy x360 15-dr1679cl | |
| Dell XPS 15 9500 Core i7 4K UHD | |
| Asus TUF Gaming A15 FA506IV-HN172 | |
| iperf3 receive AX12 | |
| Dell G5 15 SE 5505 P89F | |
| Dell XPS 15 9500 Core i7 4K UHD | |
| HP Envy x360 15-dr1679cl | |
| Asus TUF Gaming A15 FA506IV-HN172 | |
Web kamerası


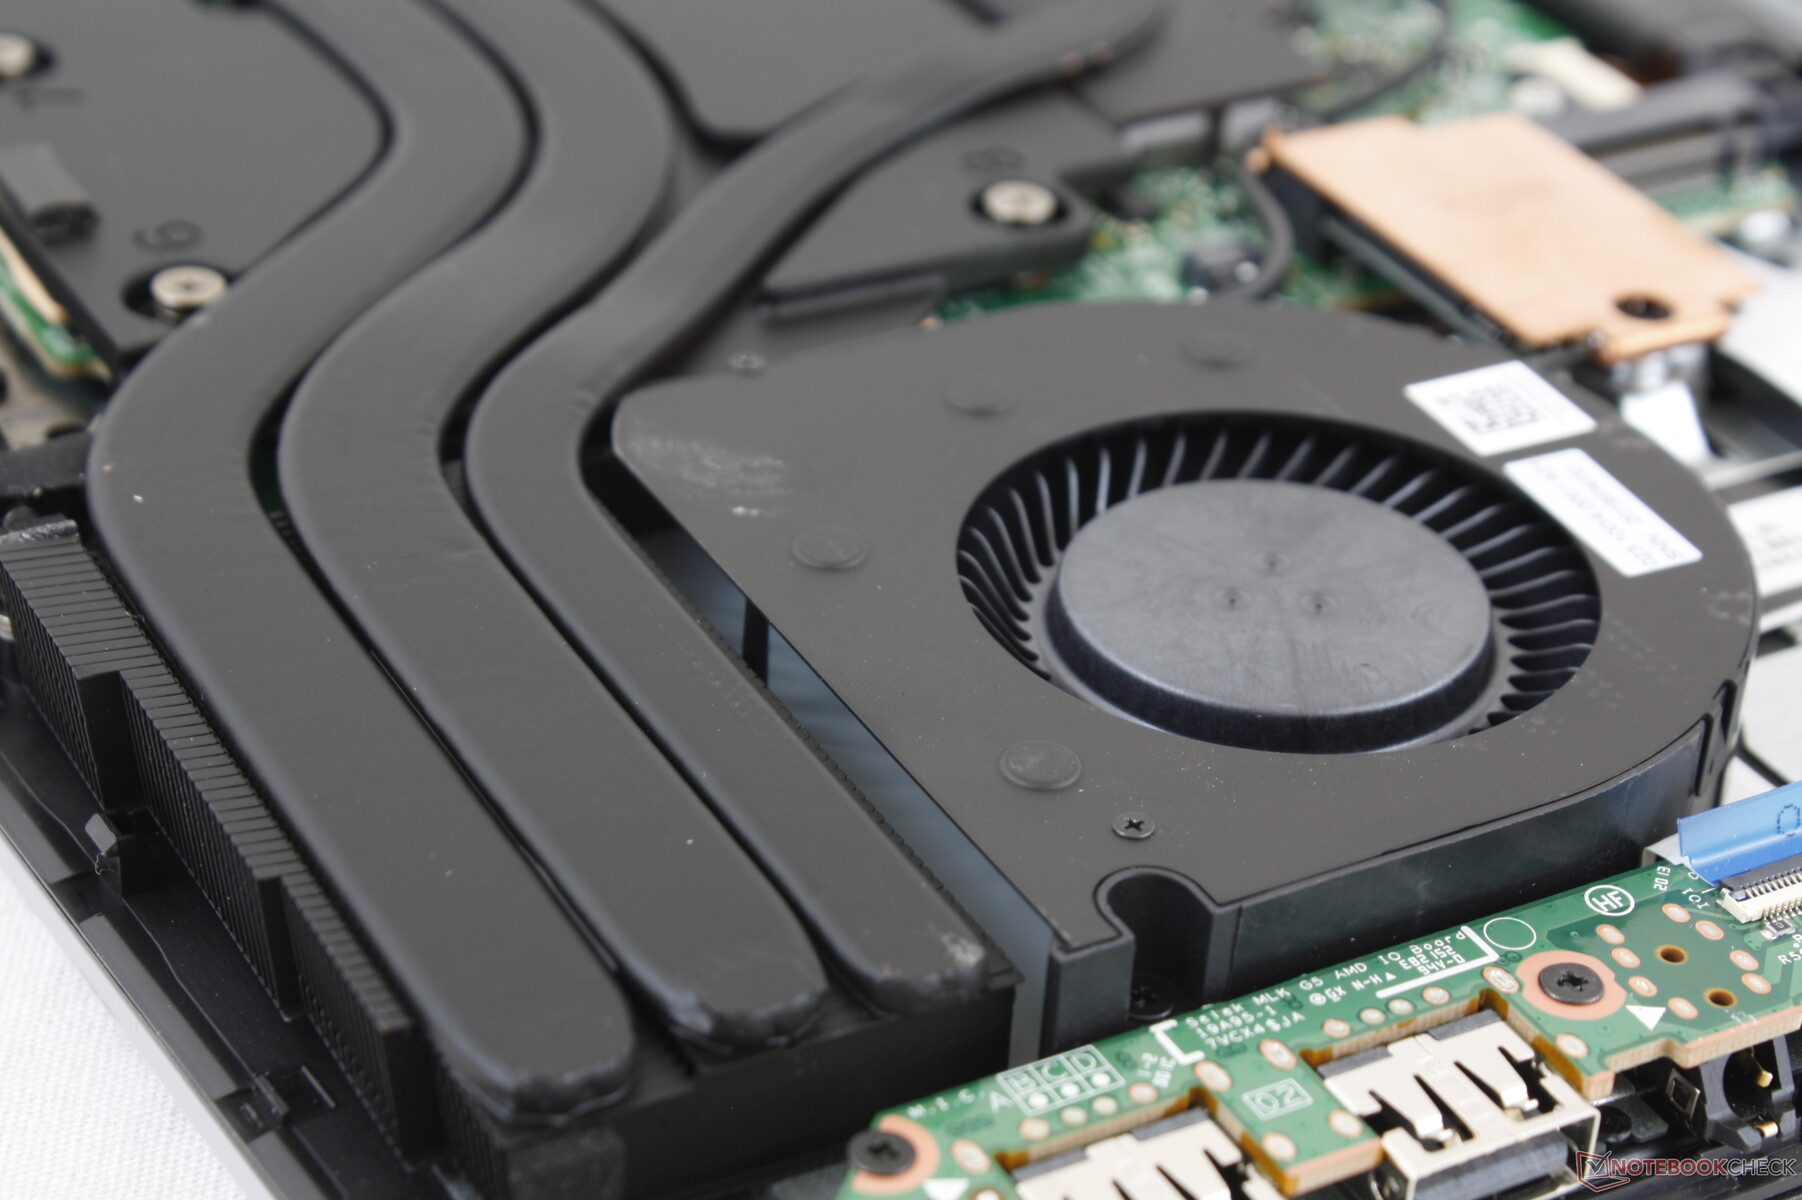
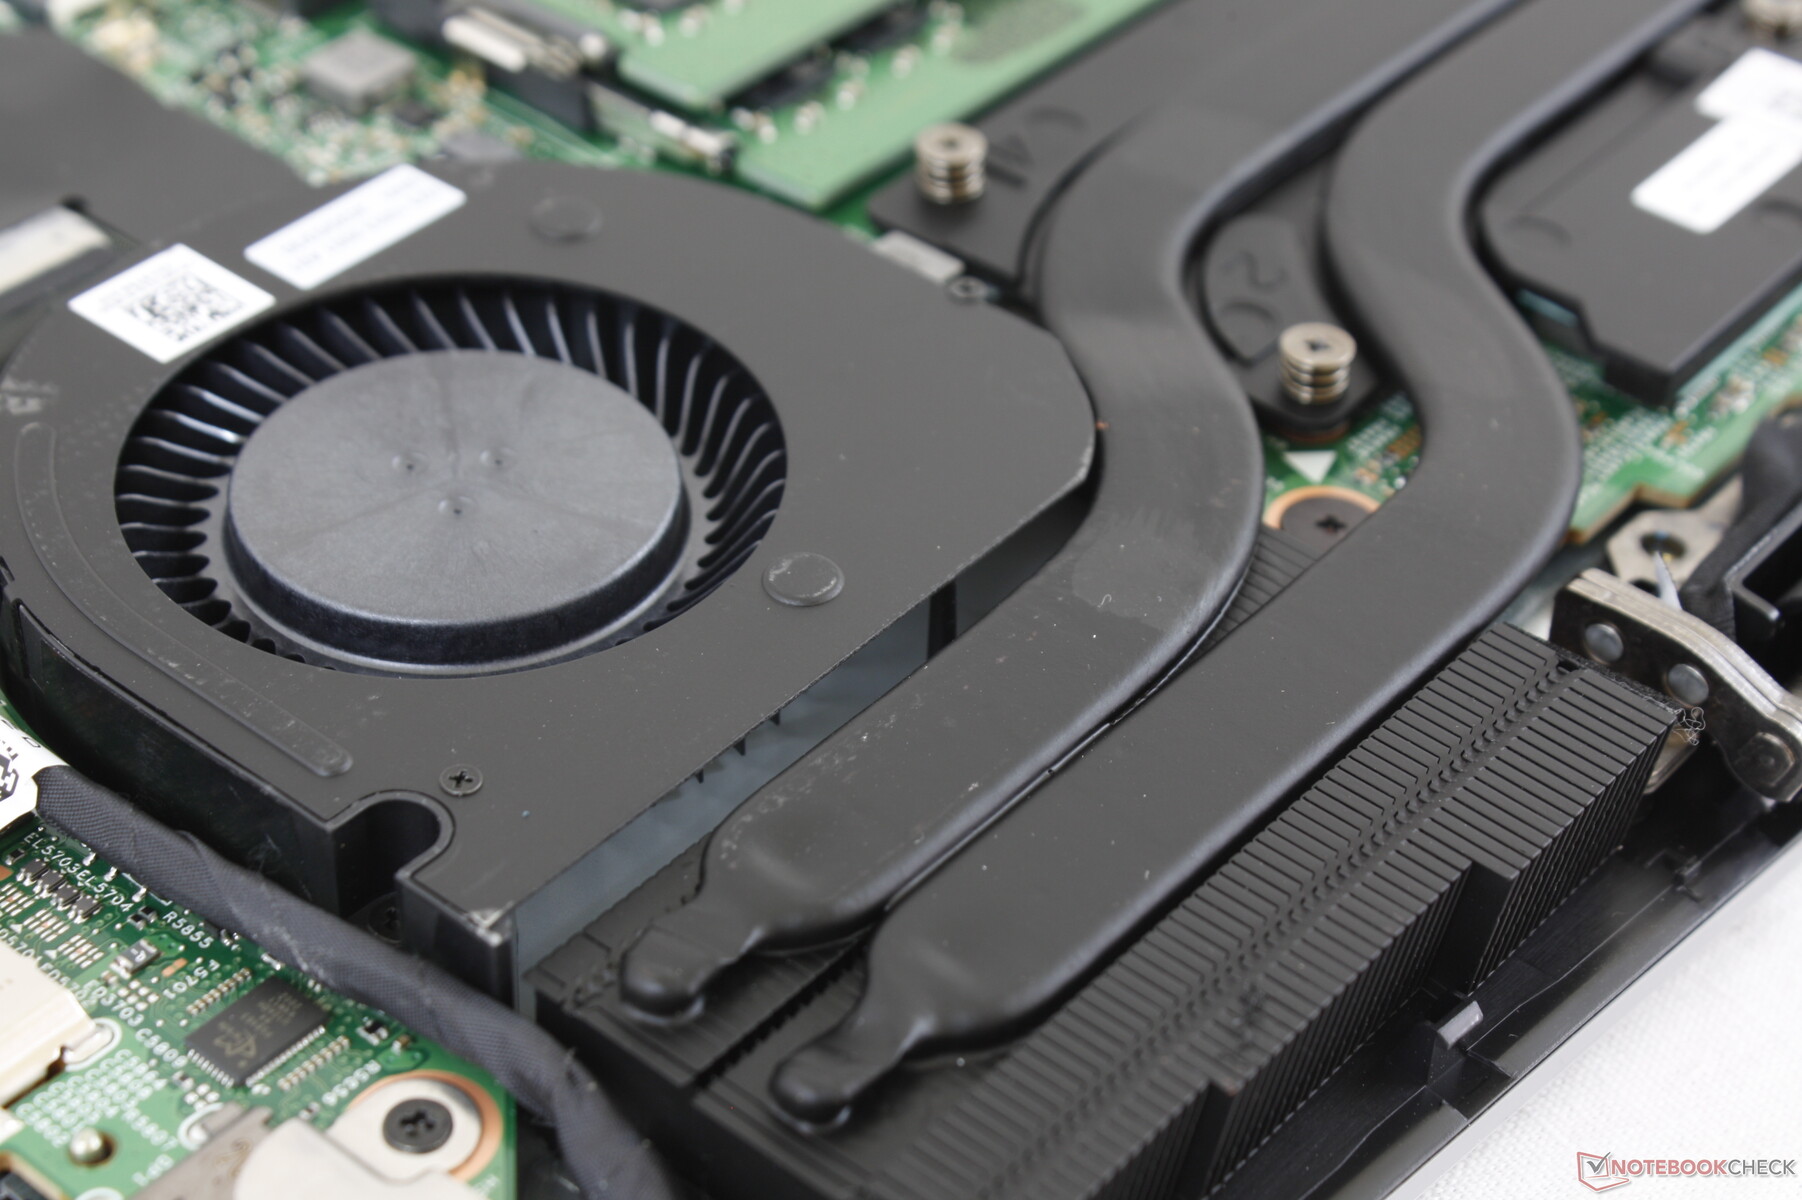
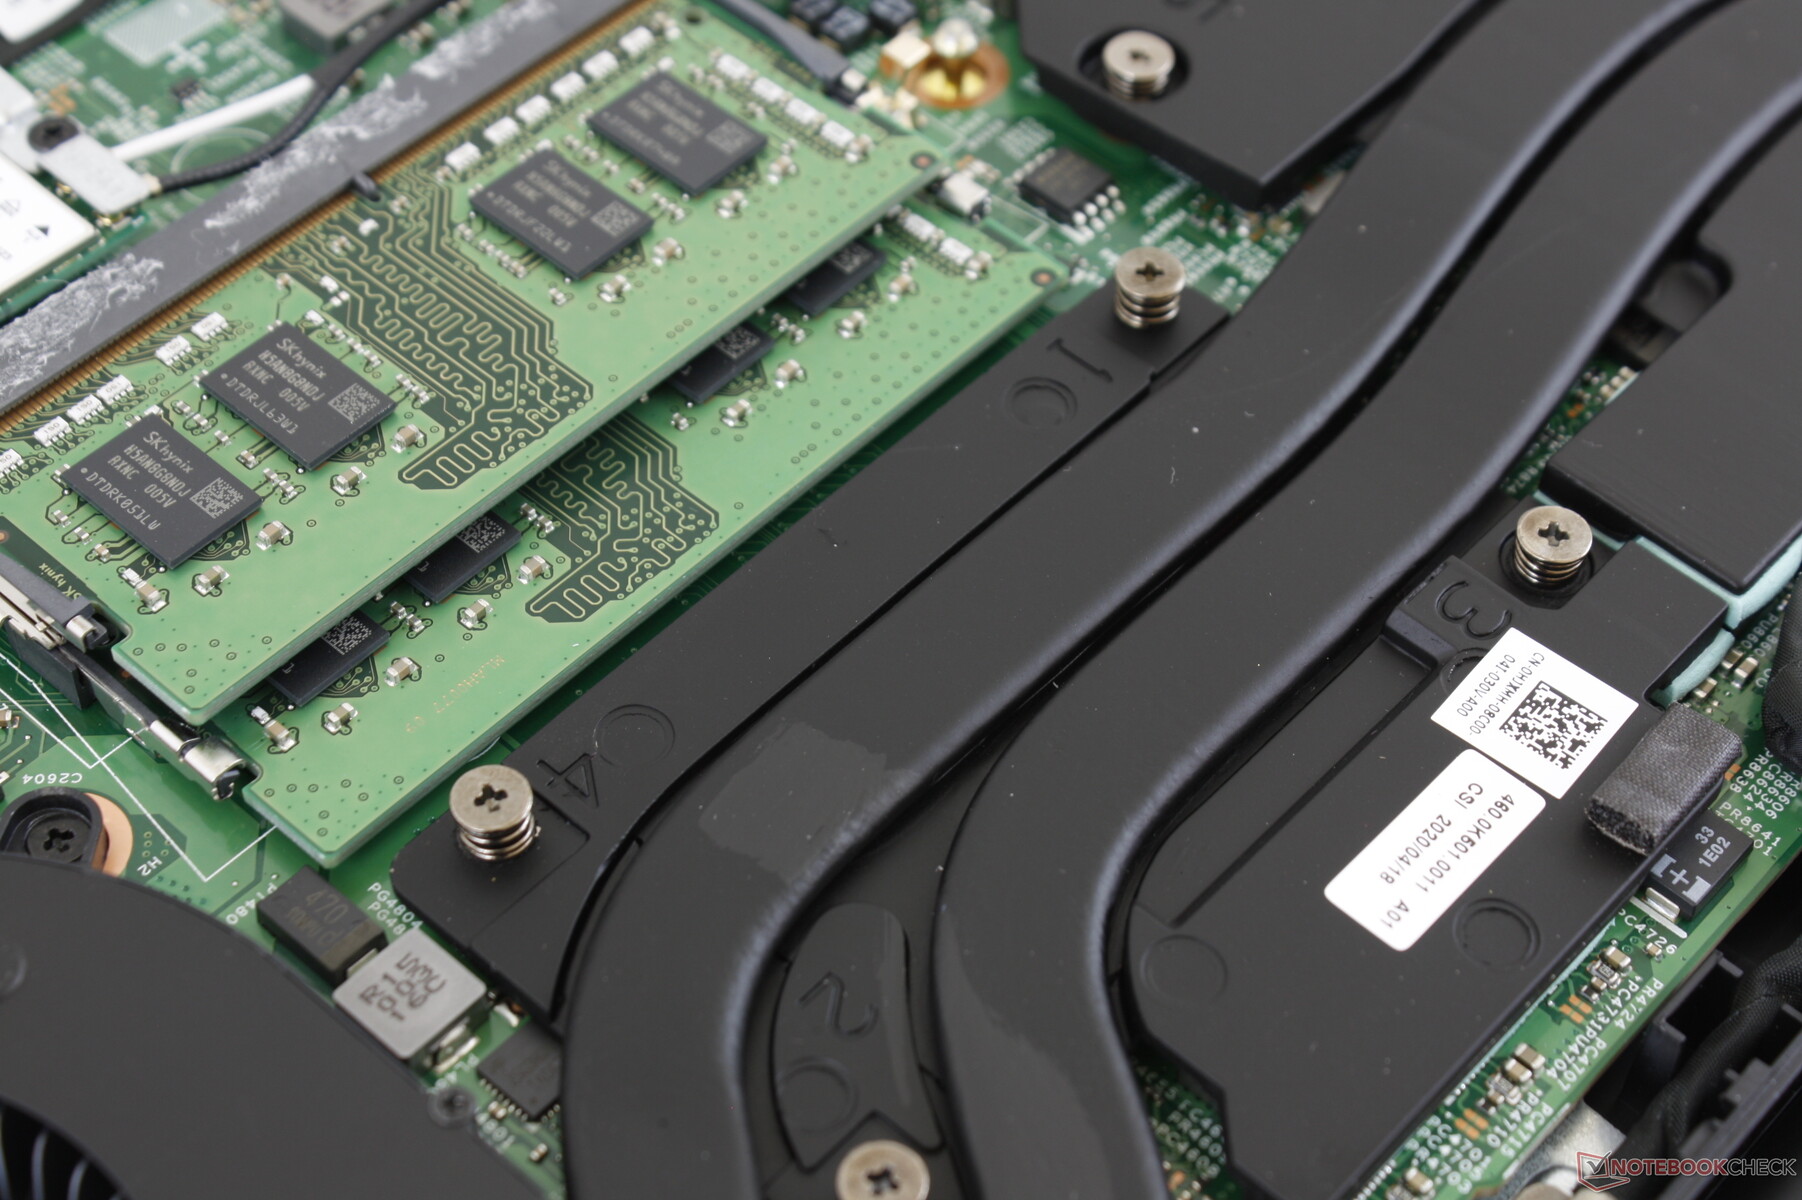
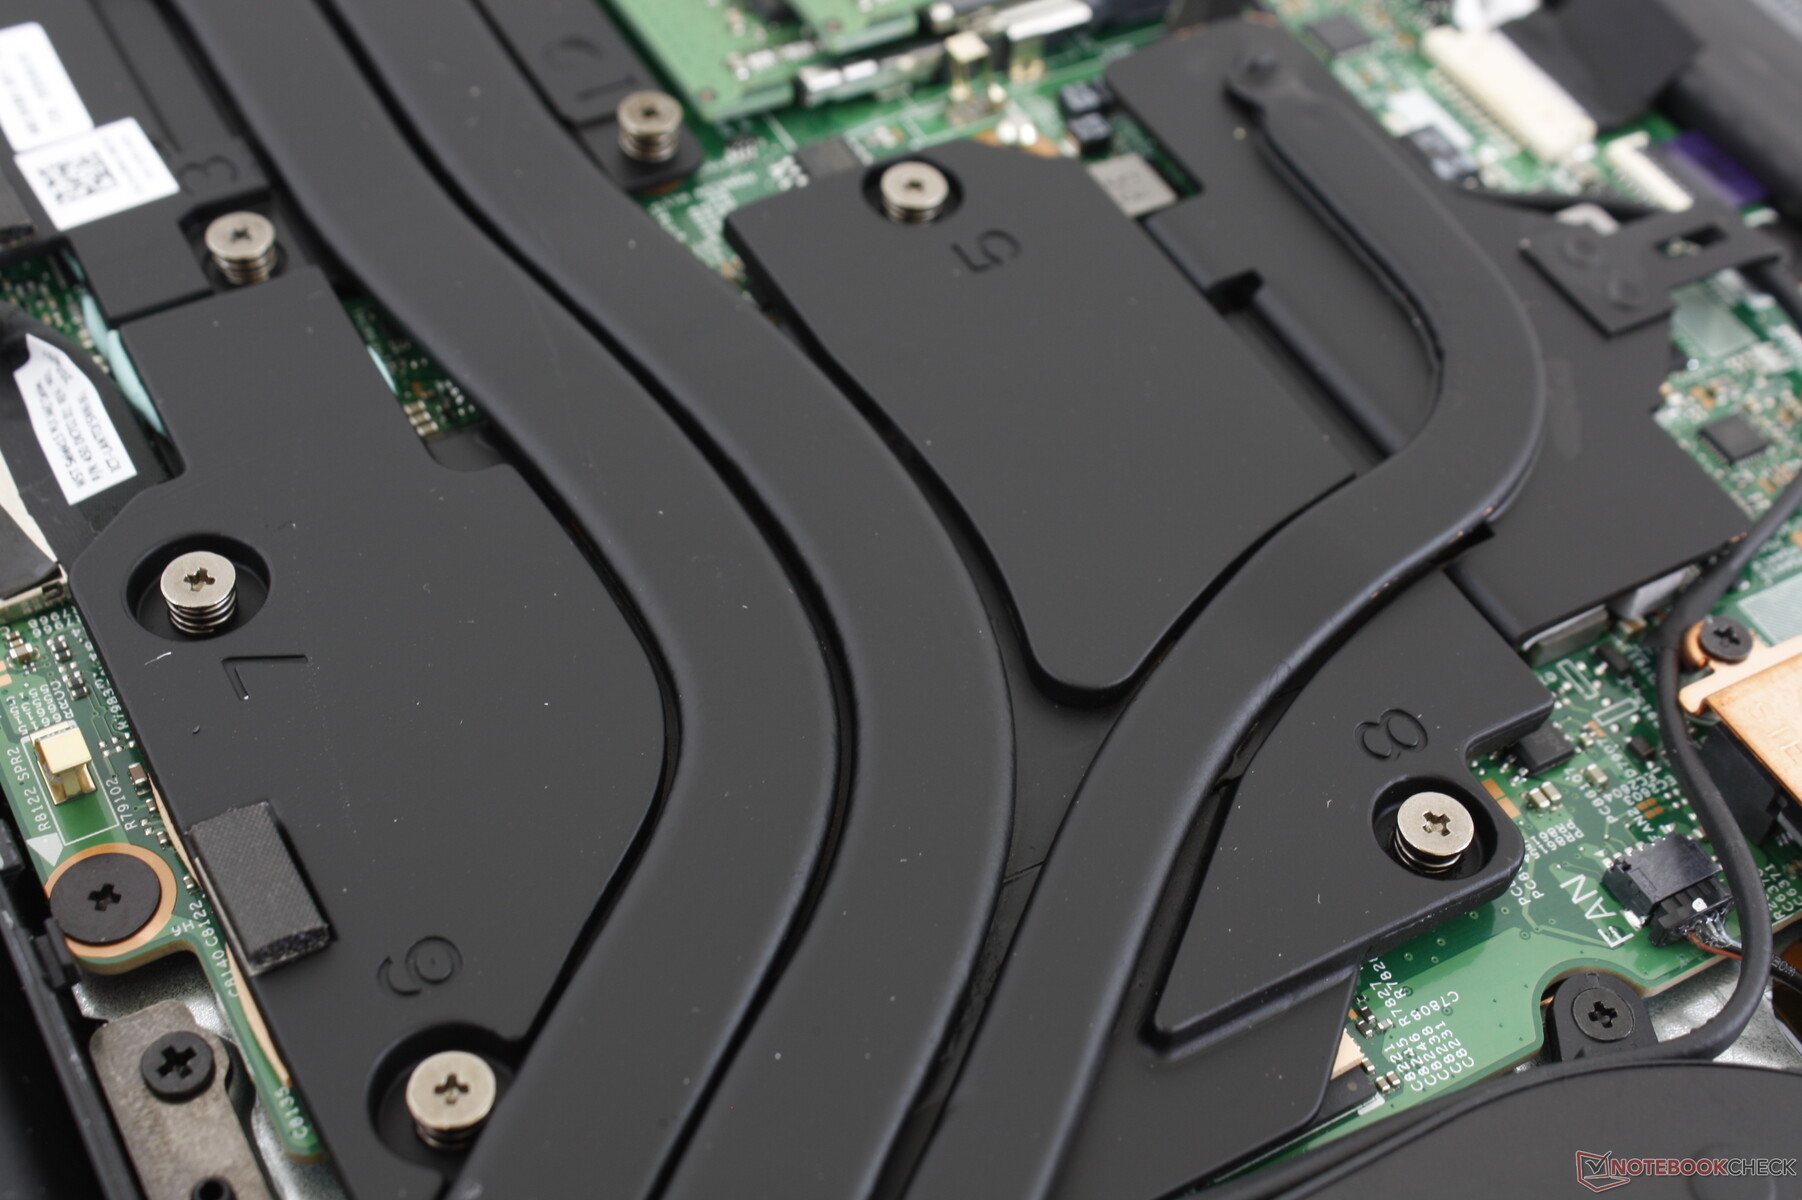
Bakım
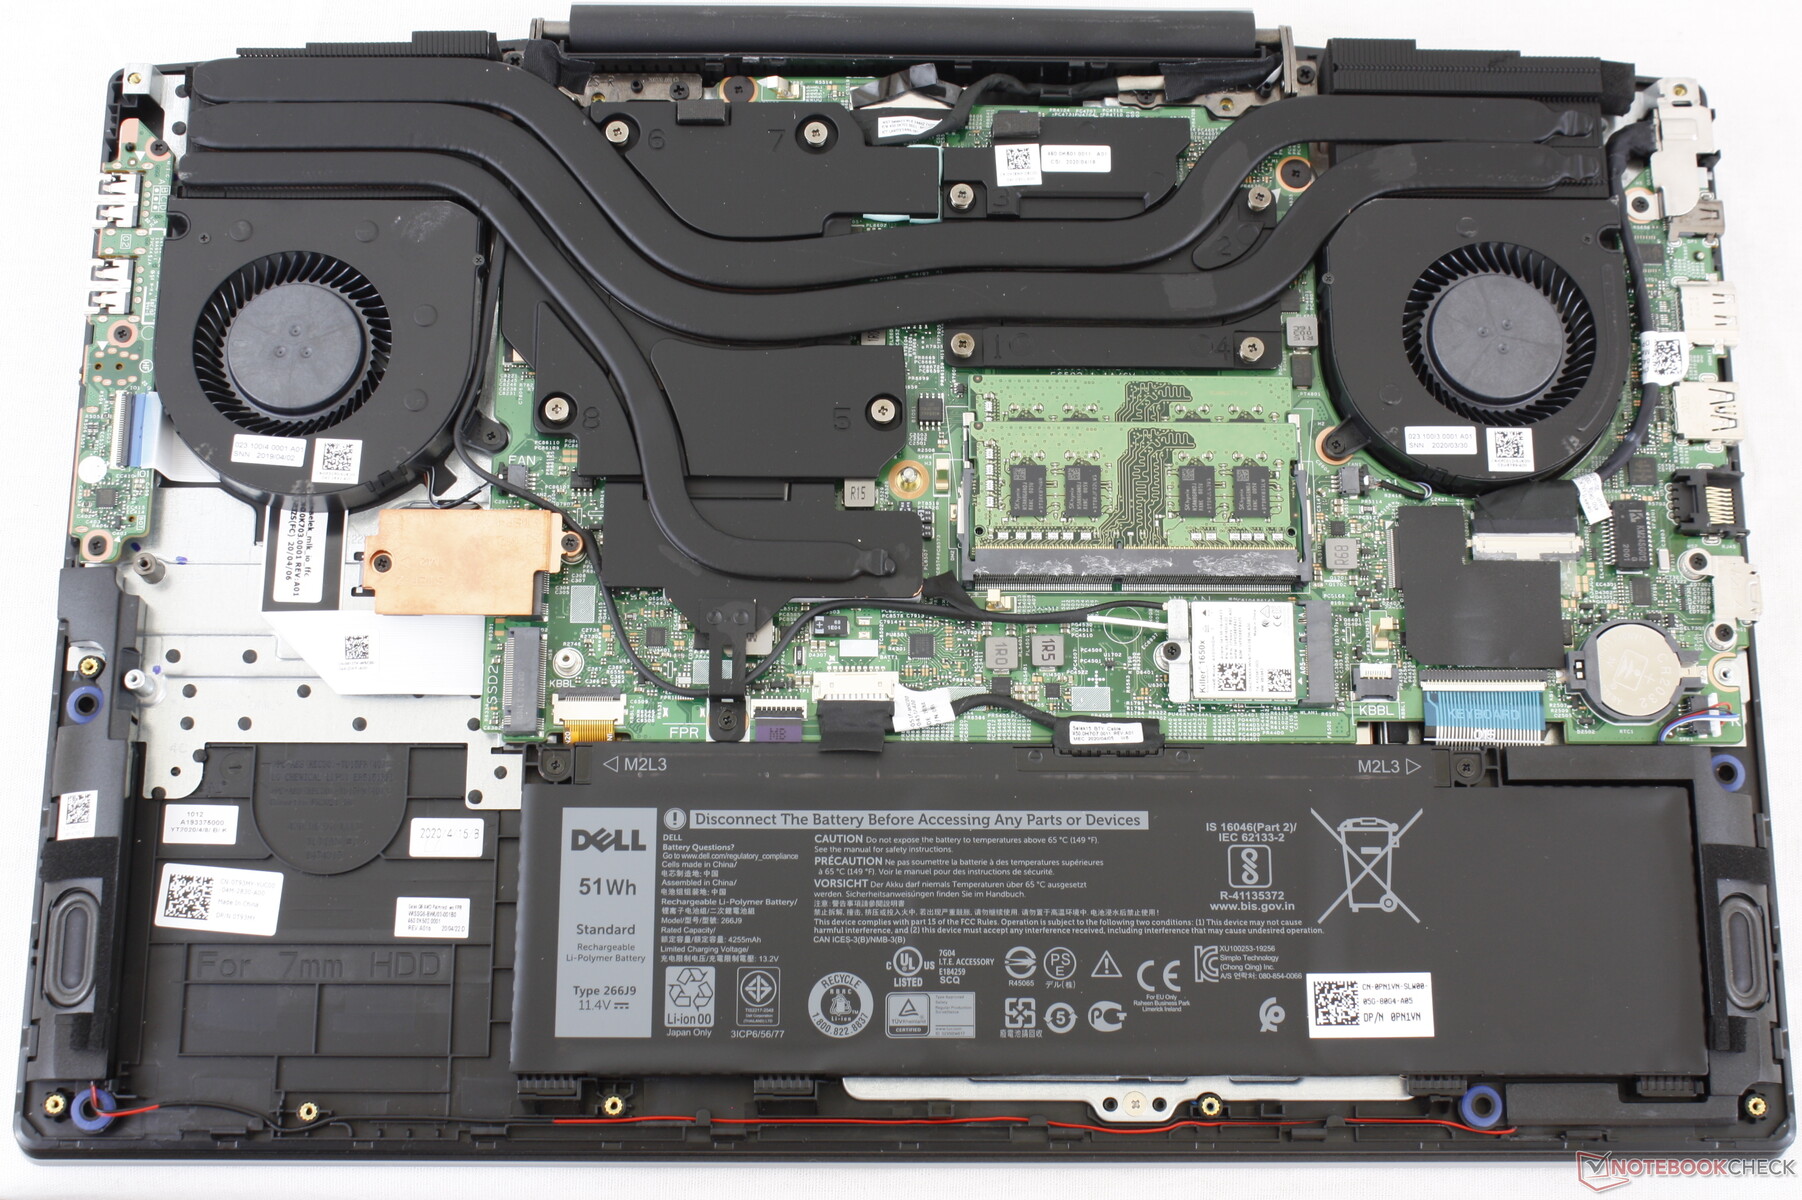
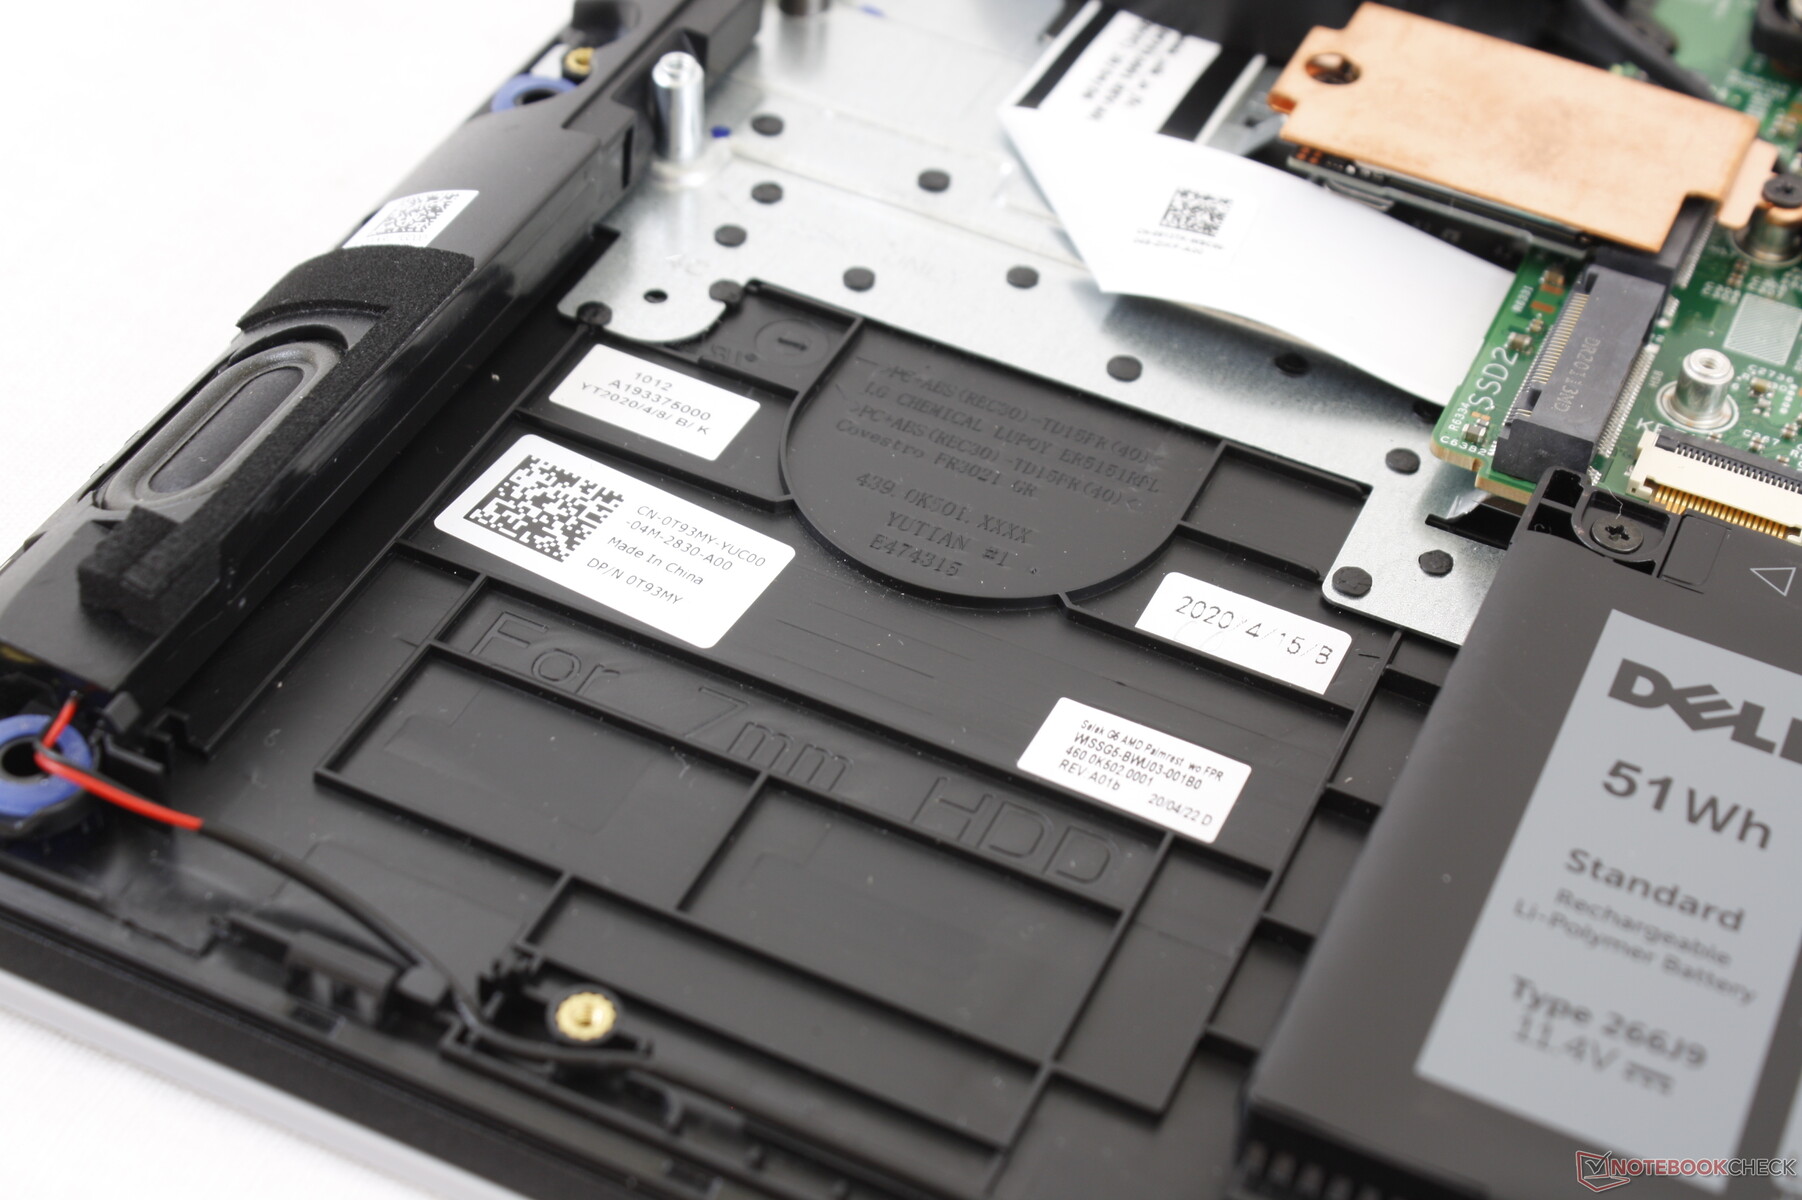
Philips tornavida ve arka kısım için keskin kenar ile alt panelin çıkarılması nispeten kolaydır. Dahili son nesil G5 15 5590 ile karşılaştırıldığında tamamen yeniden tasarlandı.
Aksesuarlar ve Garanti
Kutuda AC adaptörü ve normal evrak işleri dışında hiçbir ekstra yoktur. Doğrudan Dell'den satın alınırsa, standart bir yıllık sınırlı garanti birçok eklenti seçeneği için geçerlidir.
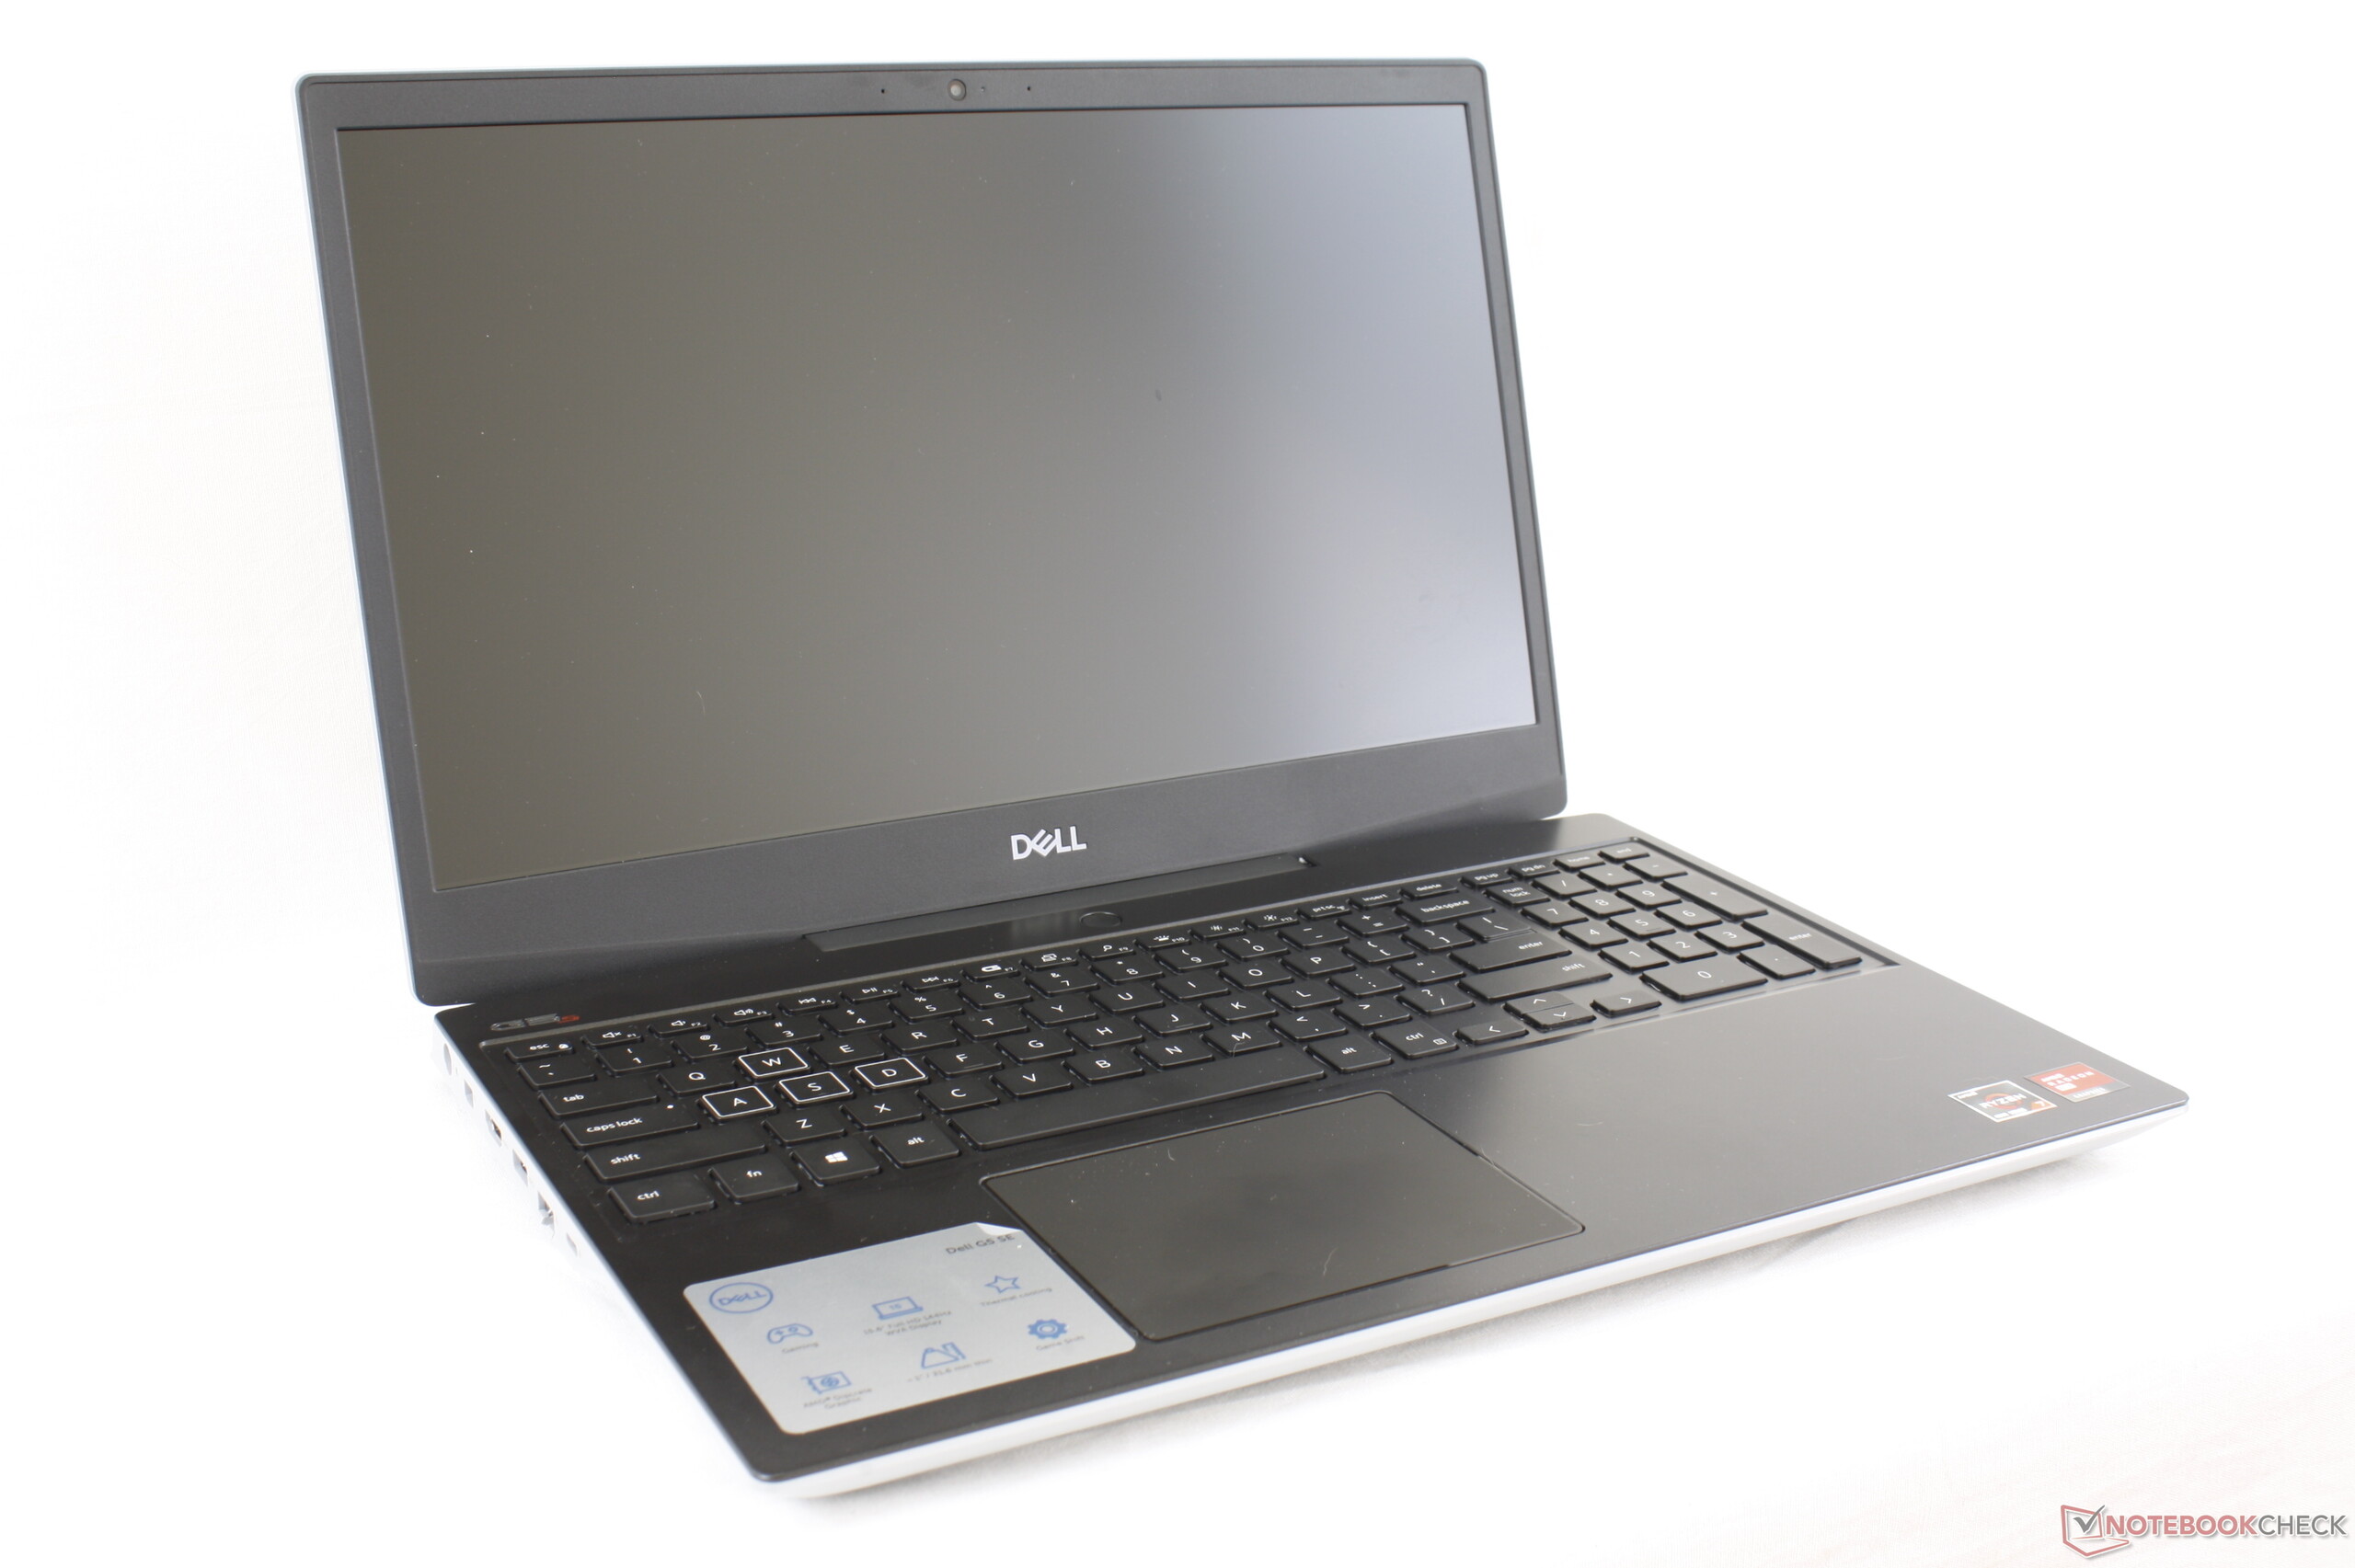
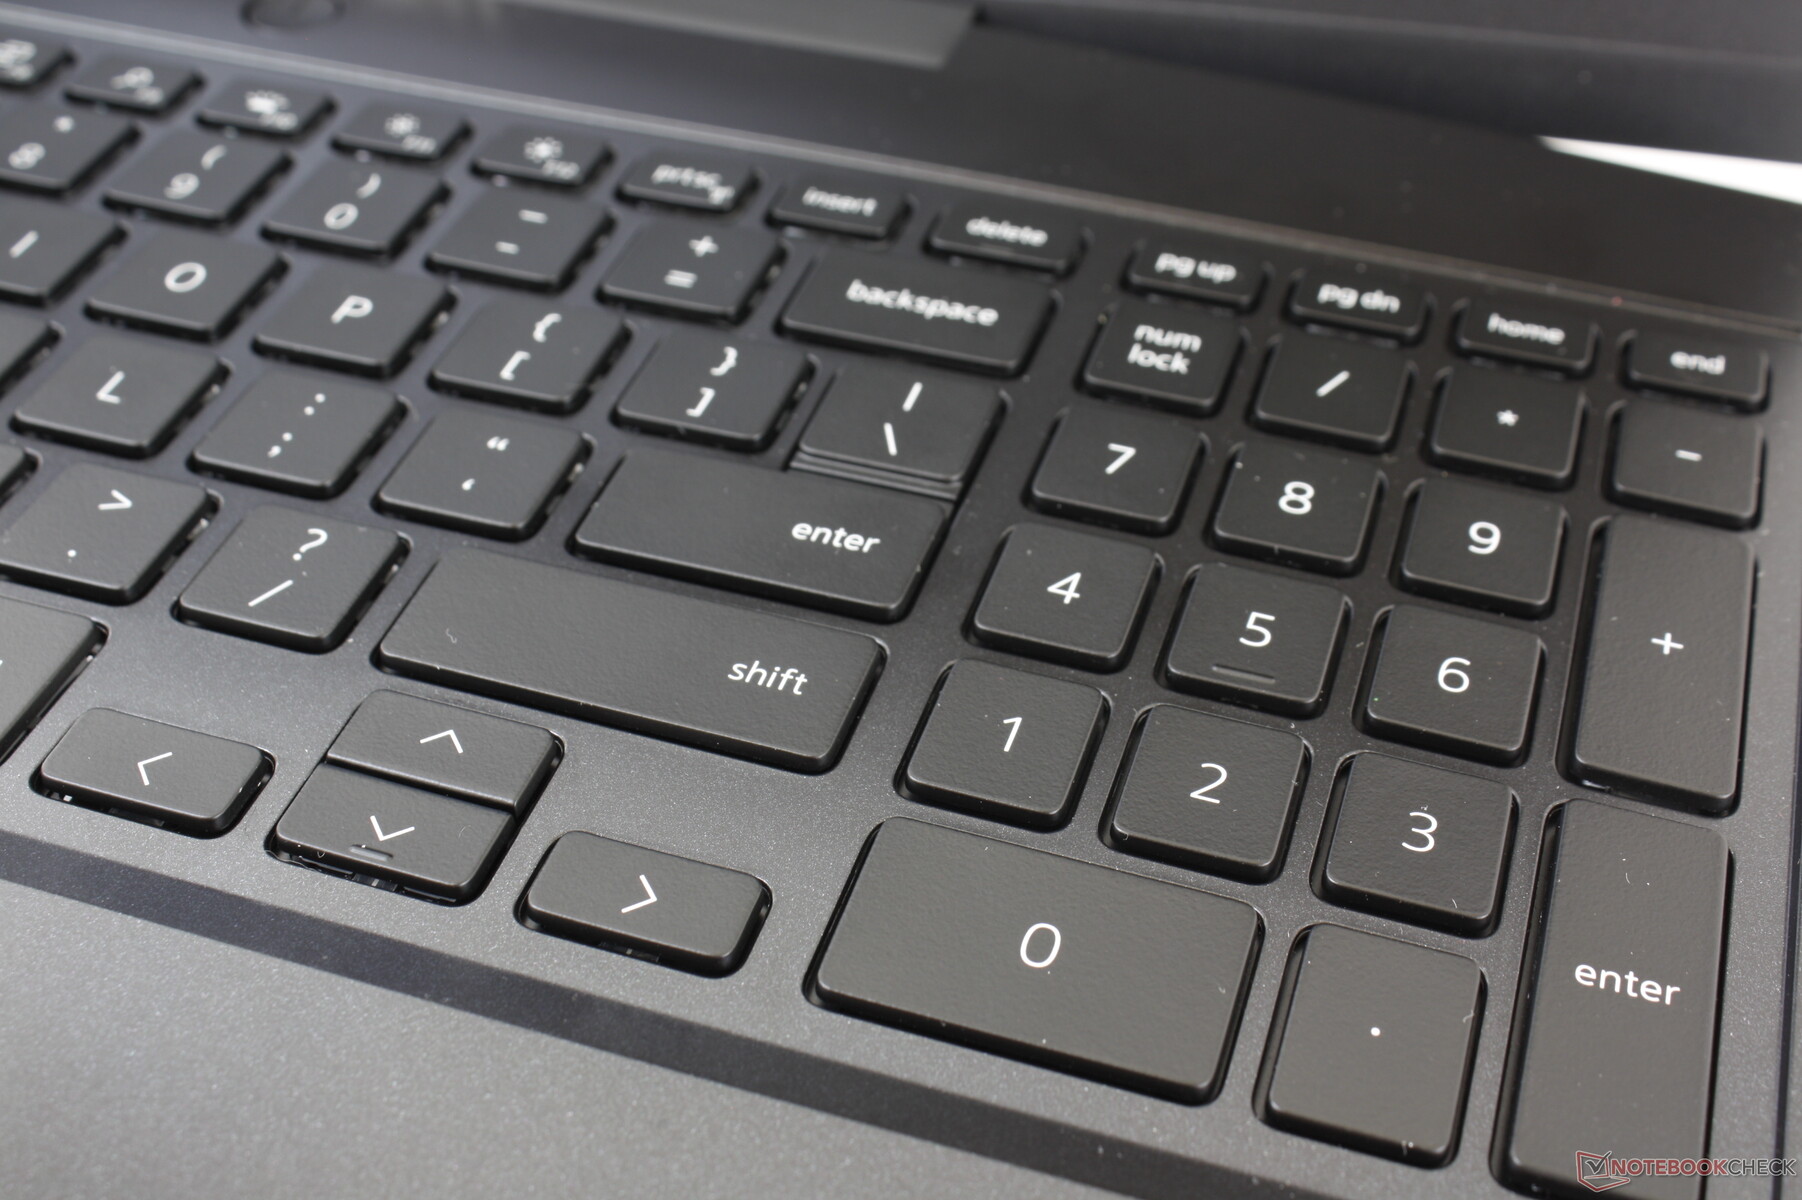
Giriş cihazları
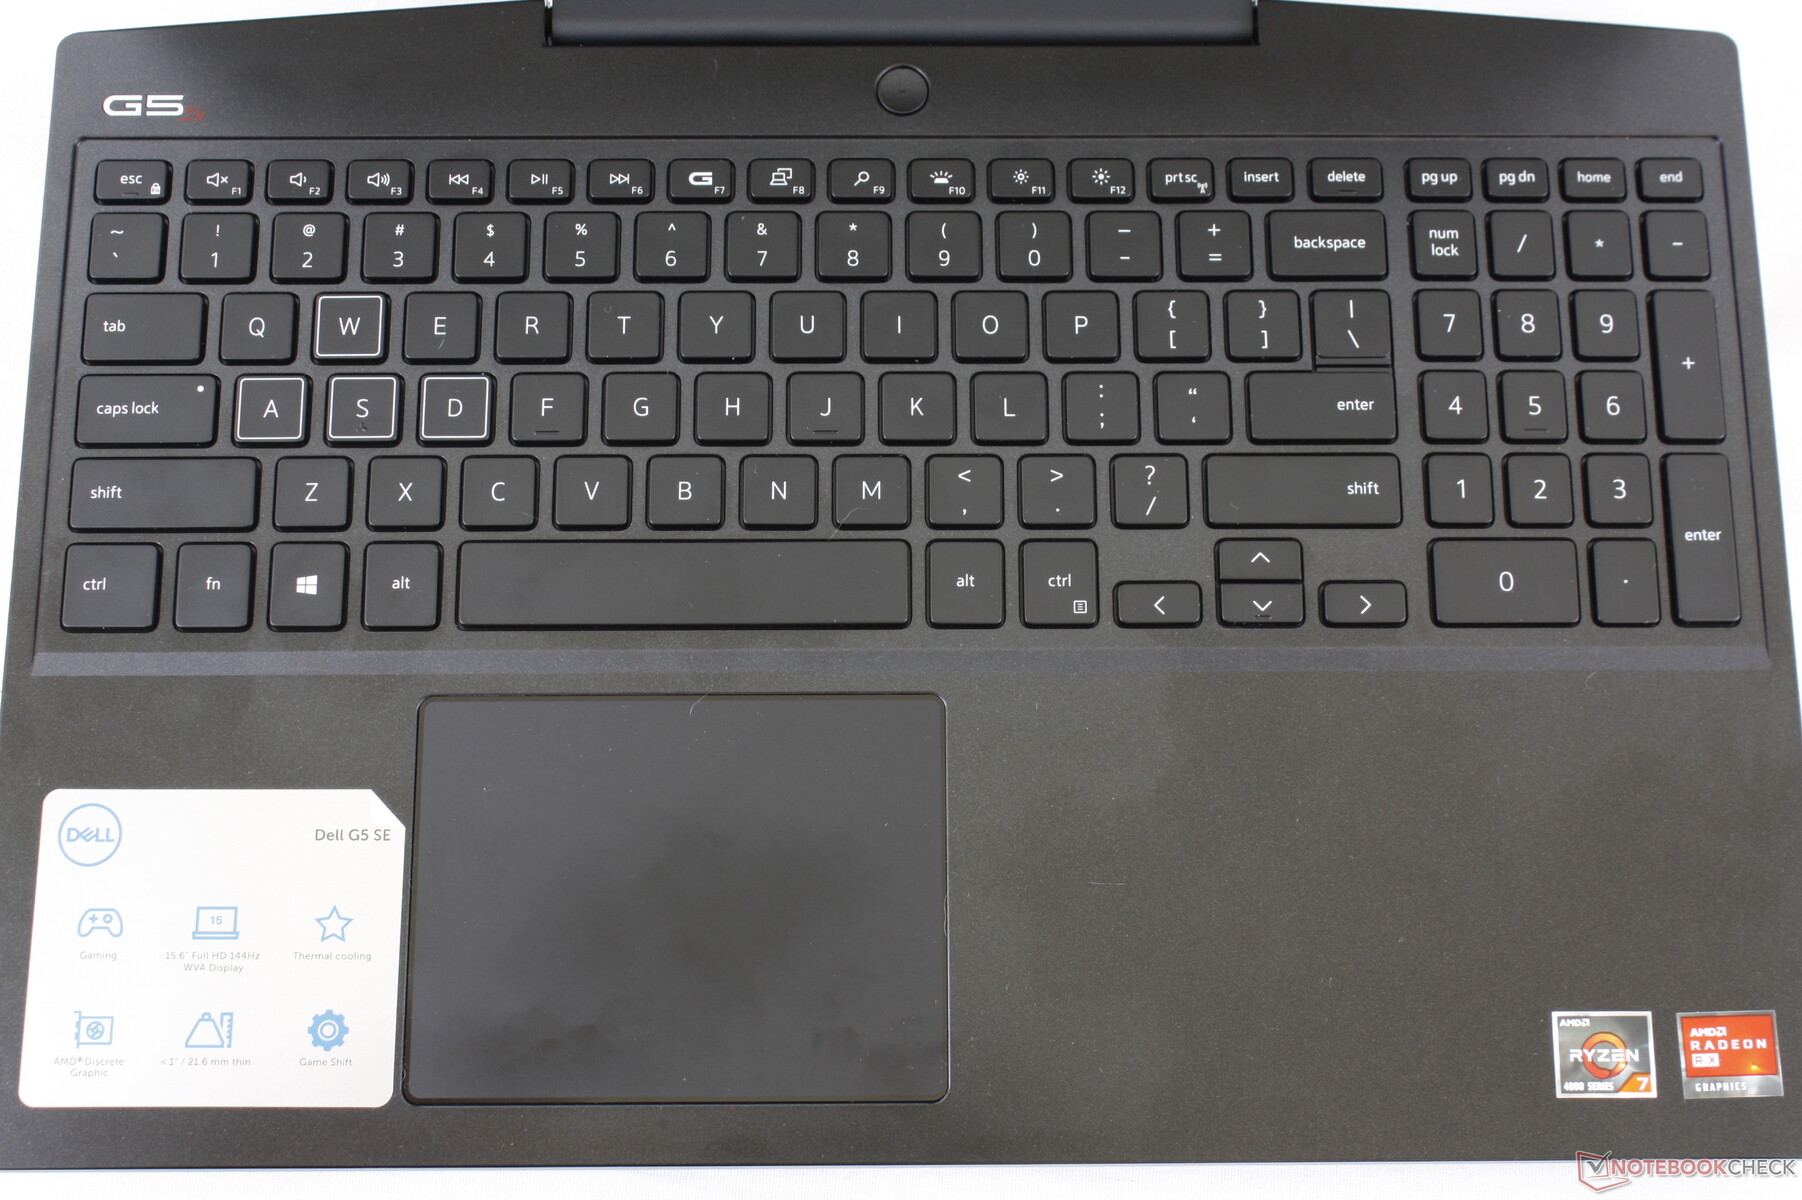
Klavye klavye düzeni ve geri bildirimleri G5 15 5590 ile aynı kalır. Dell, Alienware Command Center Yüksek Performans modunu değiştirmek için F7 tuşuna yeni bir "G" fn kısayol tuşu ekledi. Bu mod sistemden en iyi performansı almak için gereklidir, ancak fan gürültüsü hemen maksimum seviyesine atlar. Dört bölgeli RGB arka ışığı dahildir ve tüm tuşlar ve semboller yanar. Allienware Command Center çalışıyor olmalıdır, aksi takdirde arka ışık etkinleştirilemez.
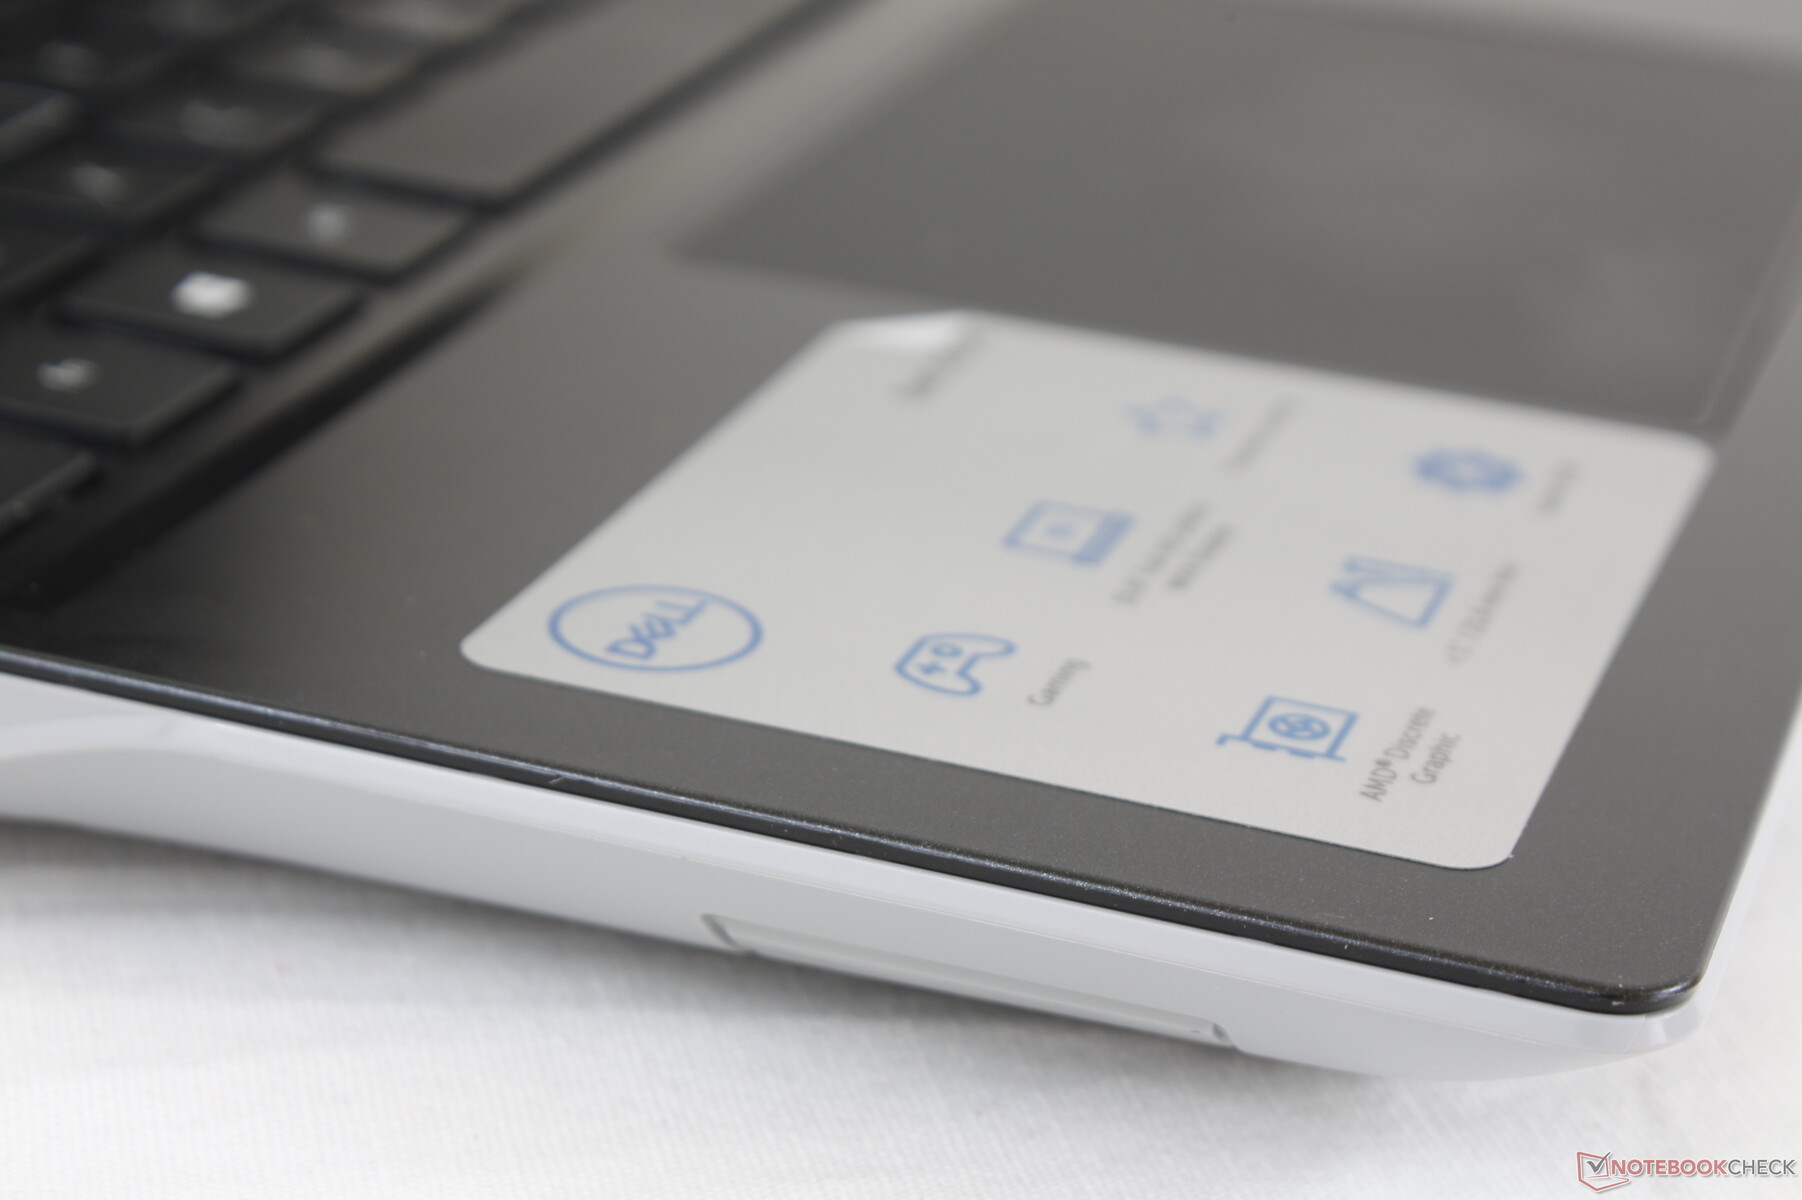
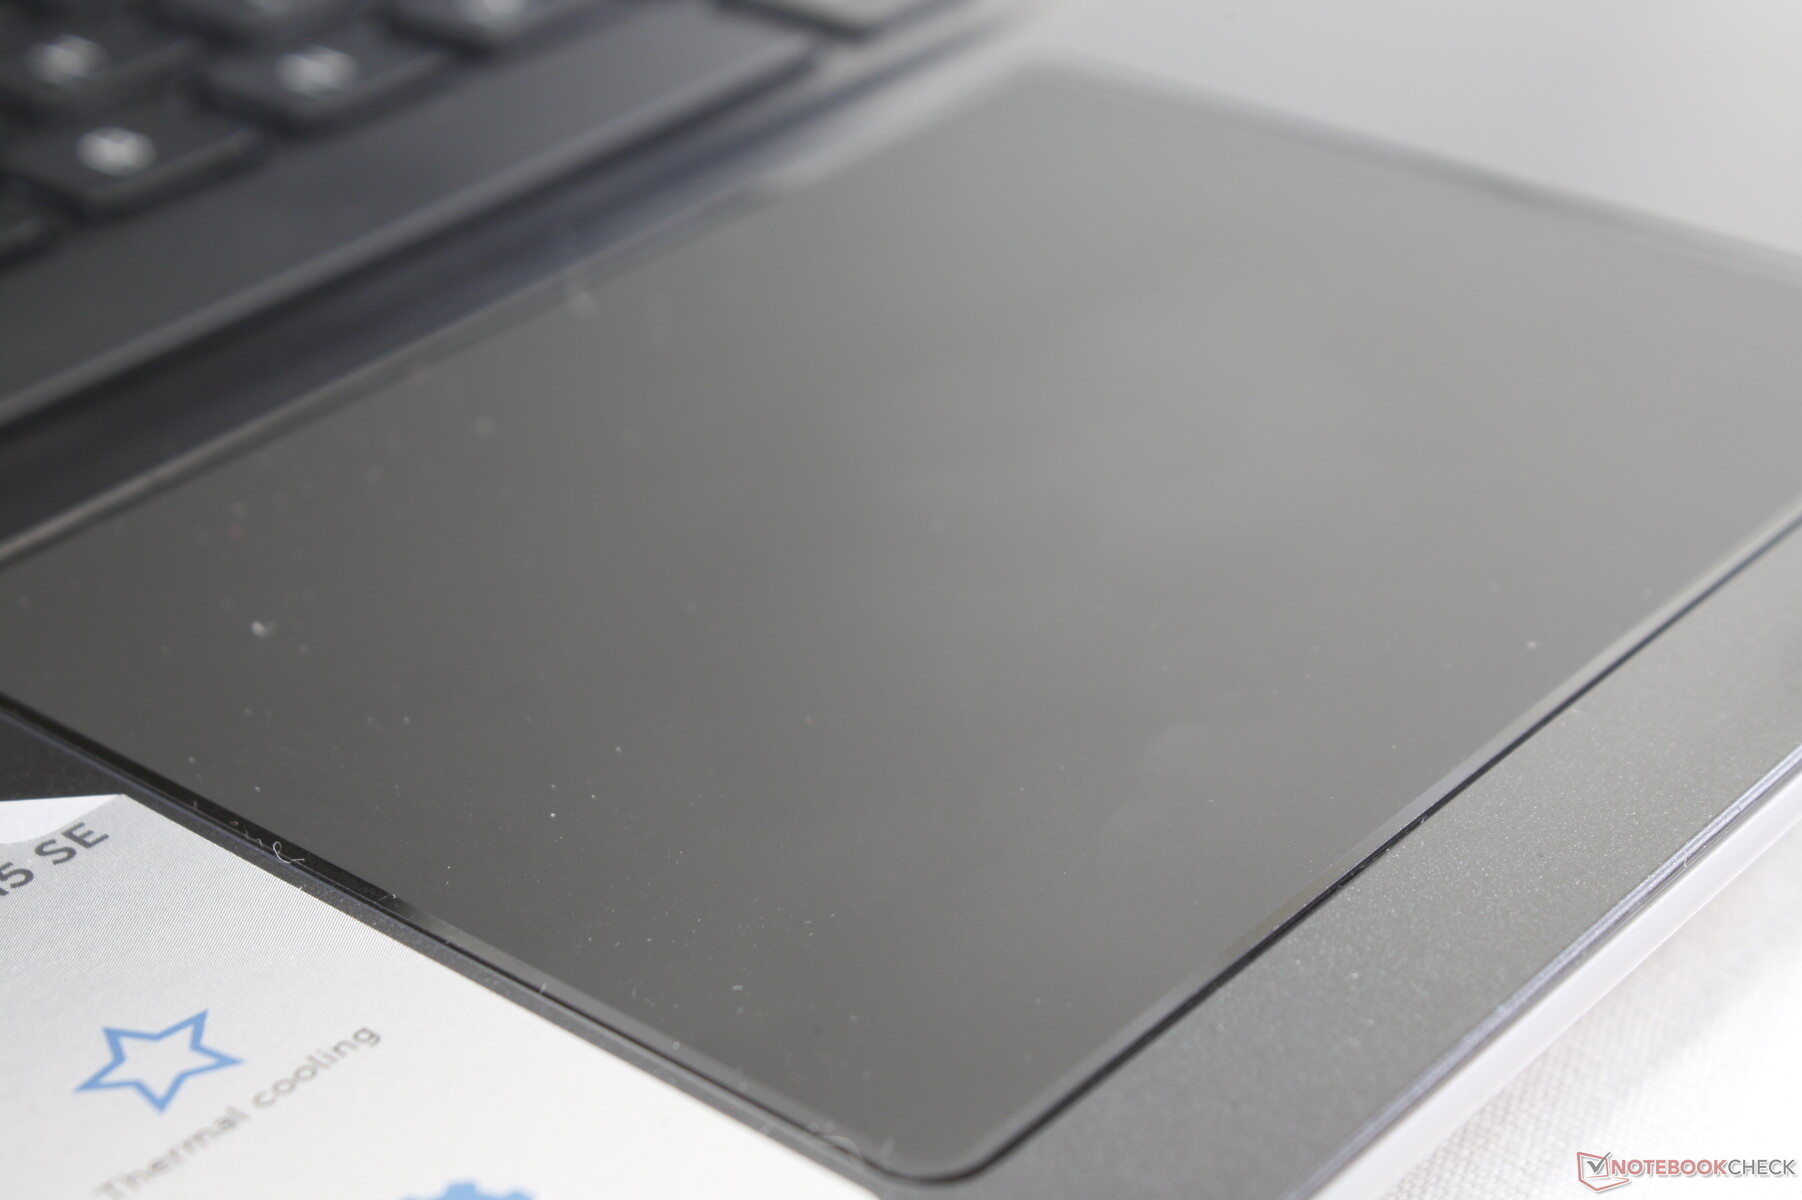
Dokunmatik
Clickpad (10,5 x 8 cm), hem yavaş hem de yüksek hızlarda imleç kontrolü için iyi çalışır ve 144 Hz ekran yenileme hızı nedeniyle de çok duyarlı hisseder. Ancak, tıklama çok sığ ve süngerimsi.

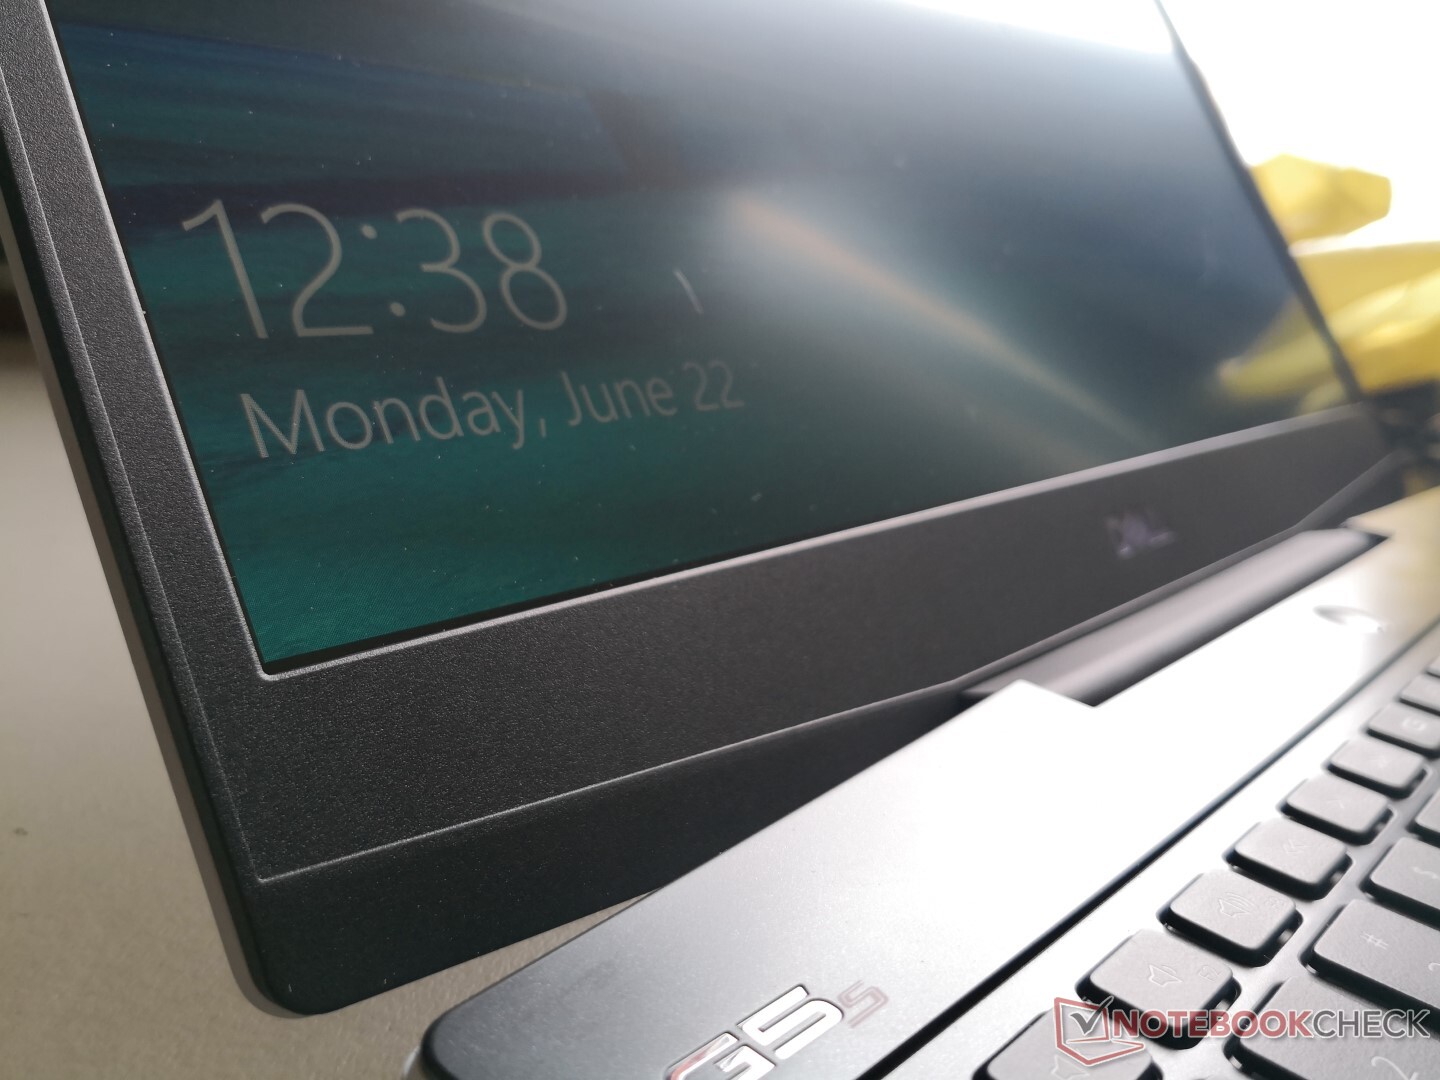
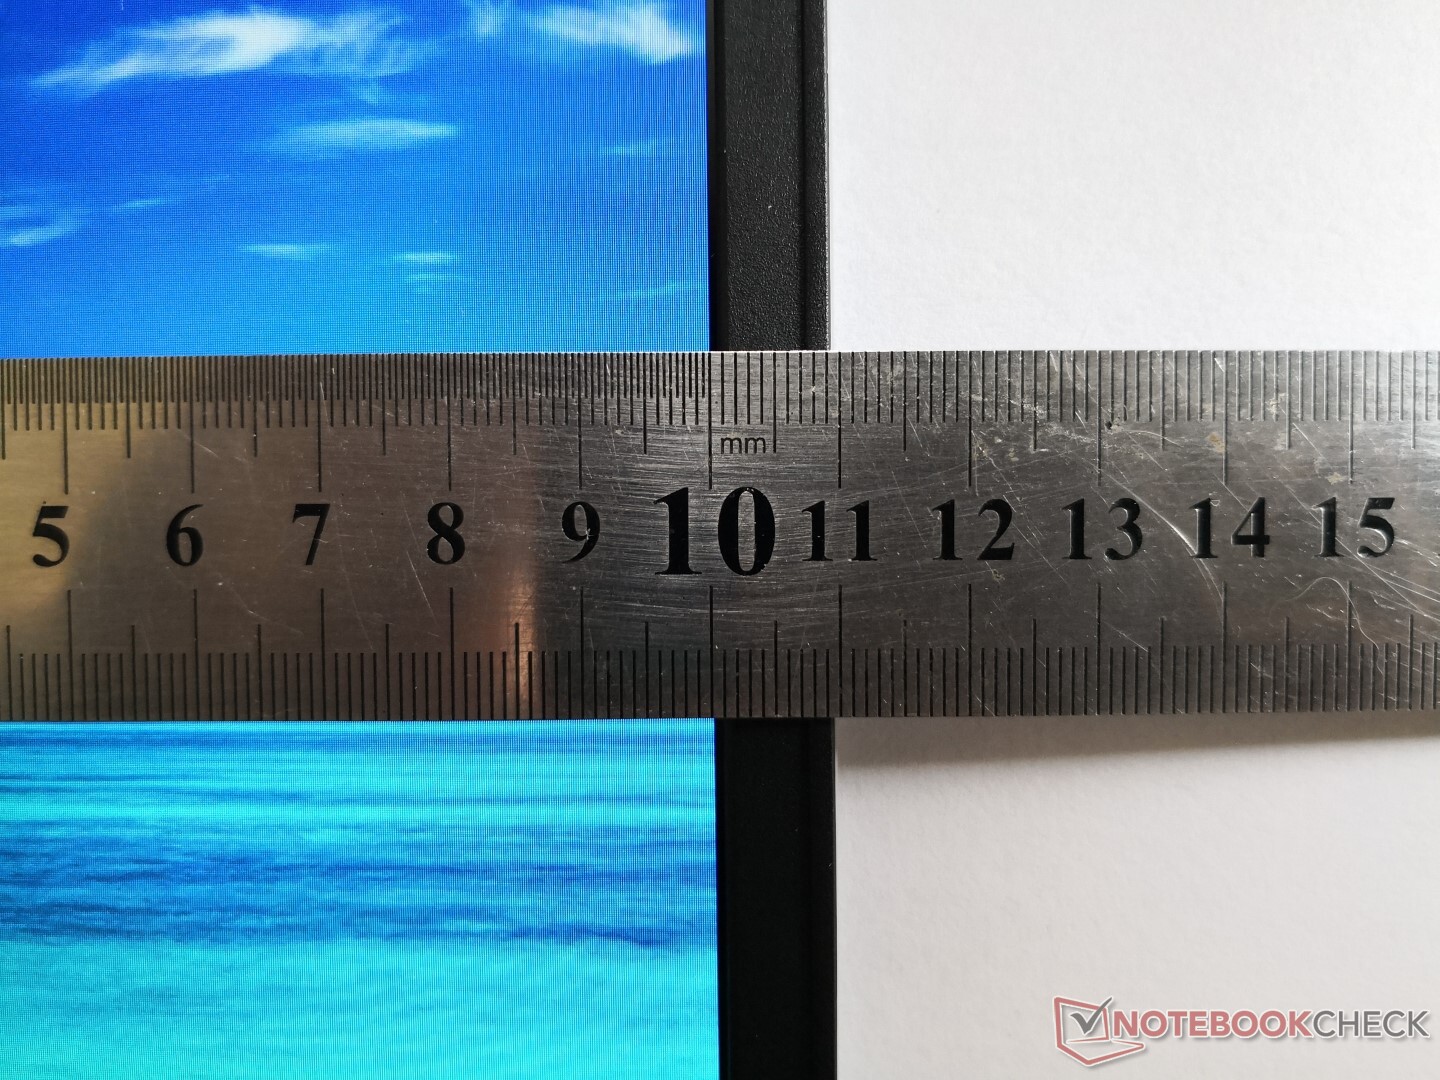
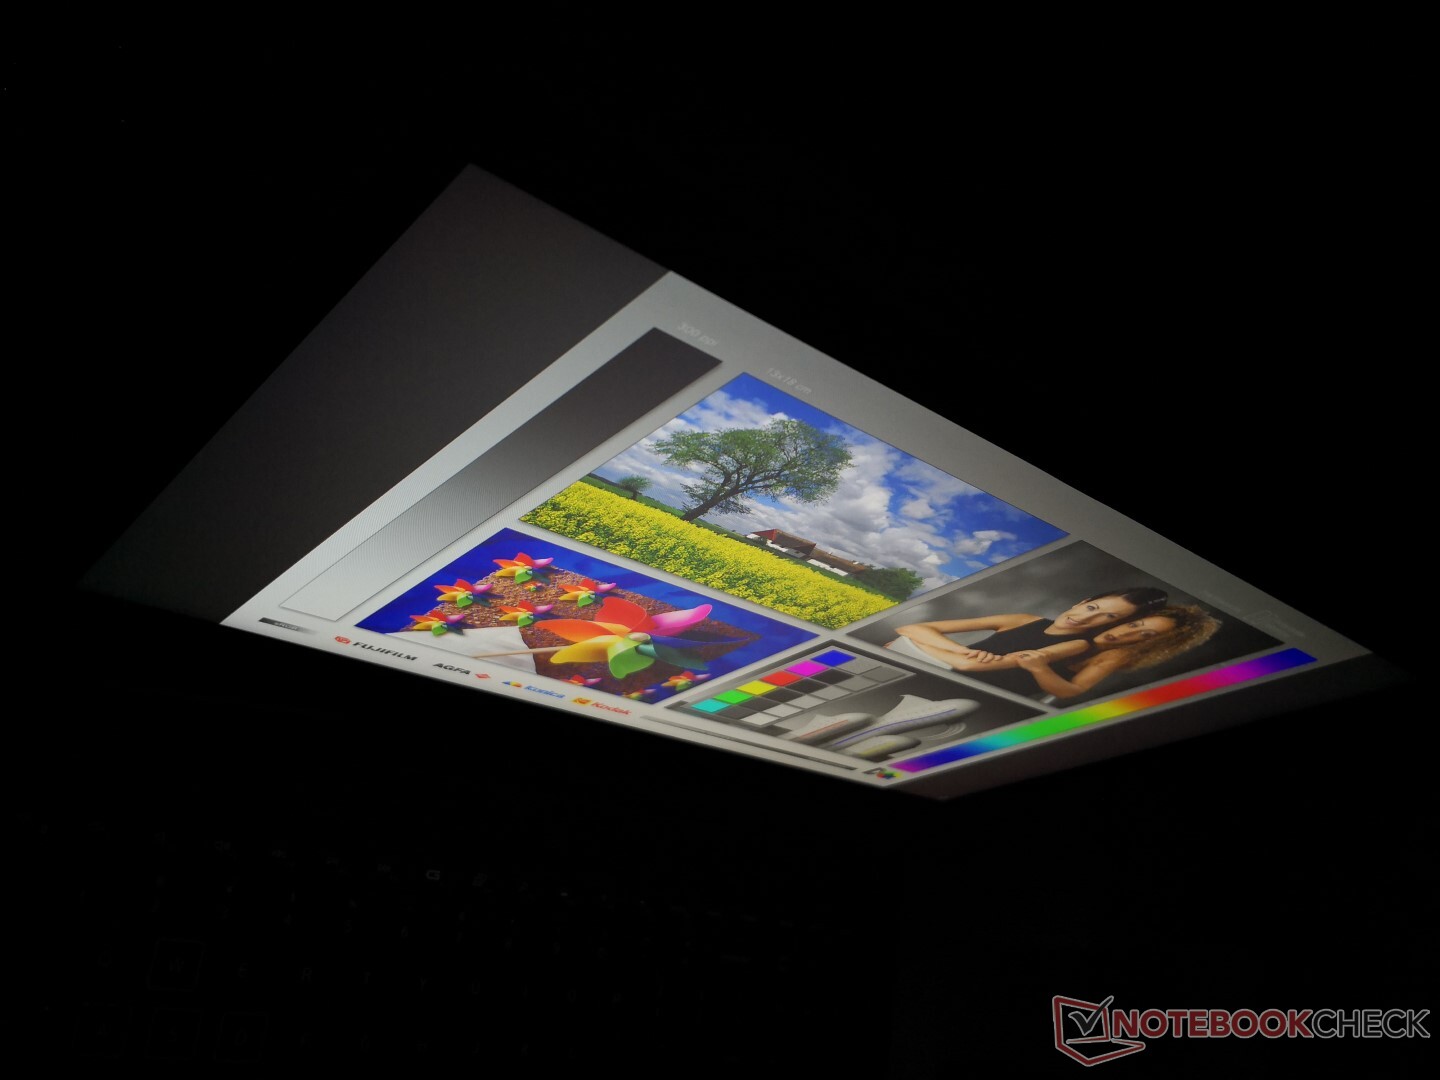
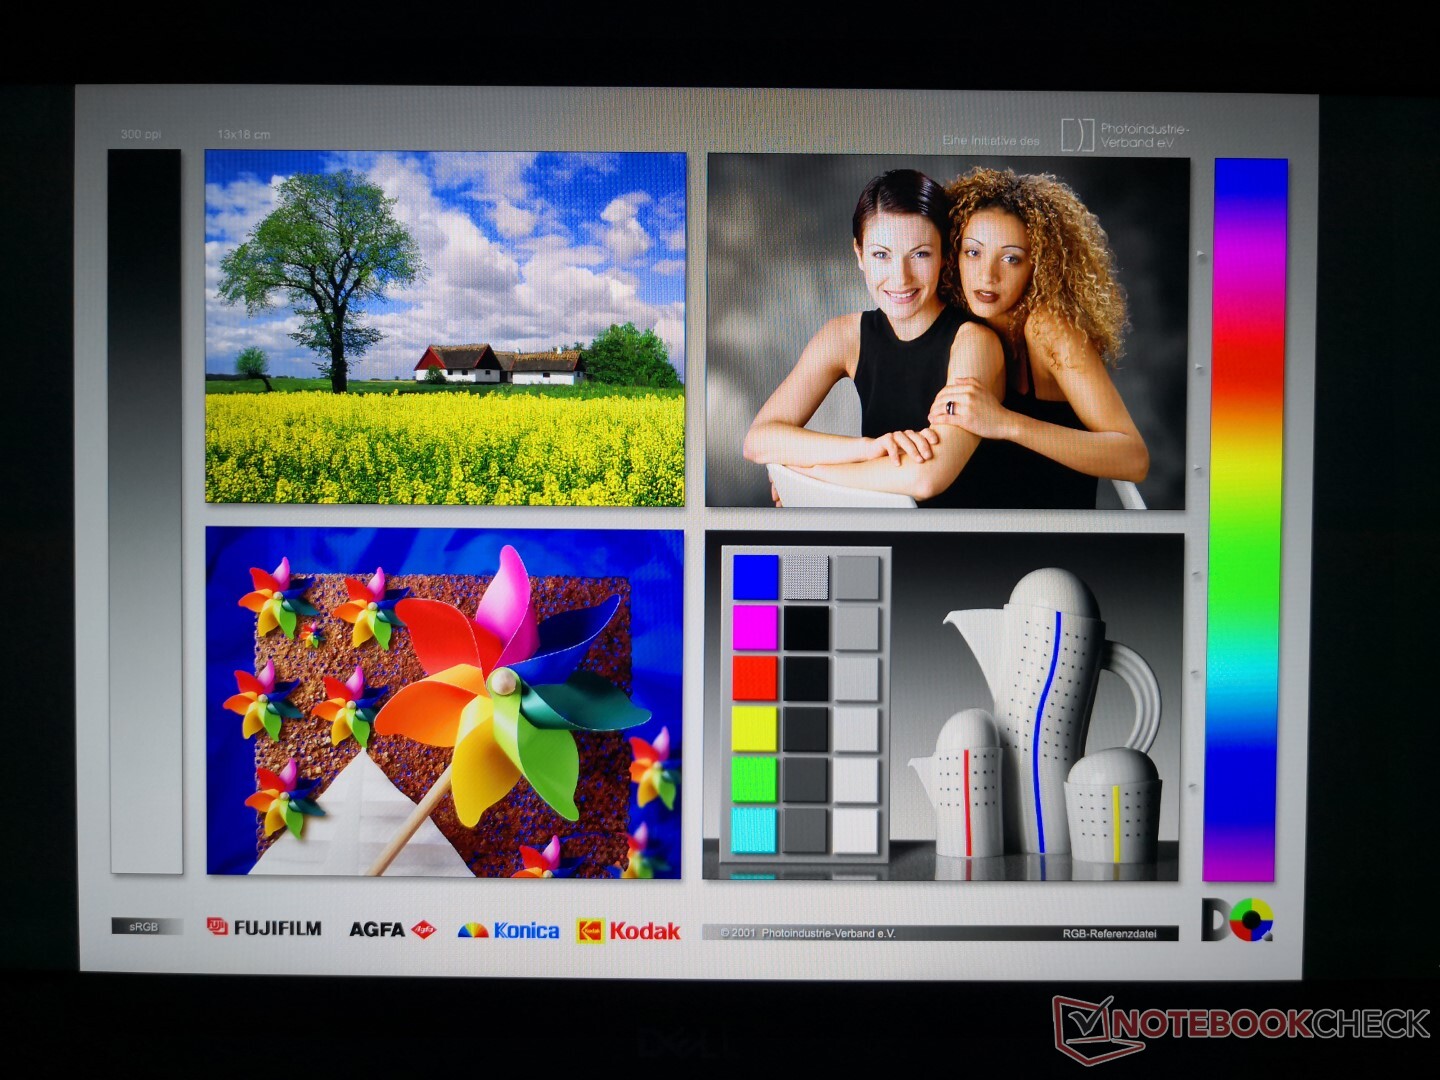
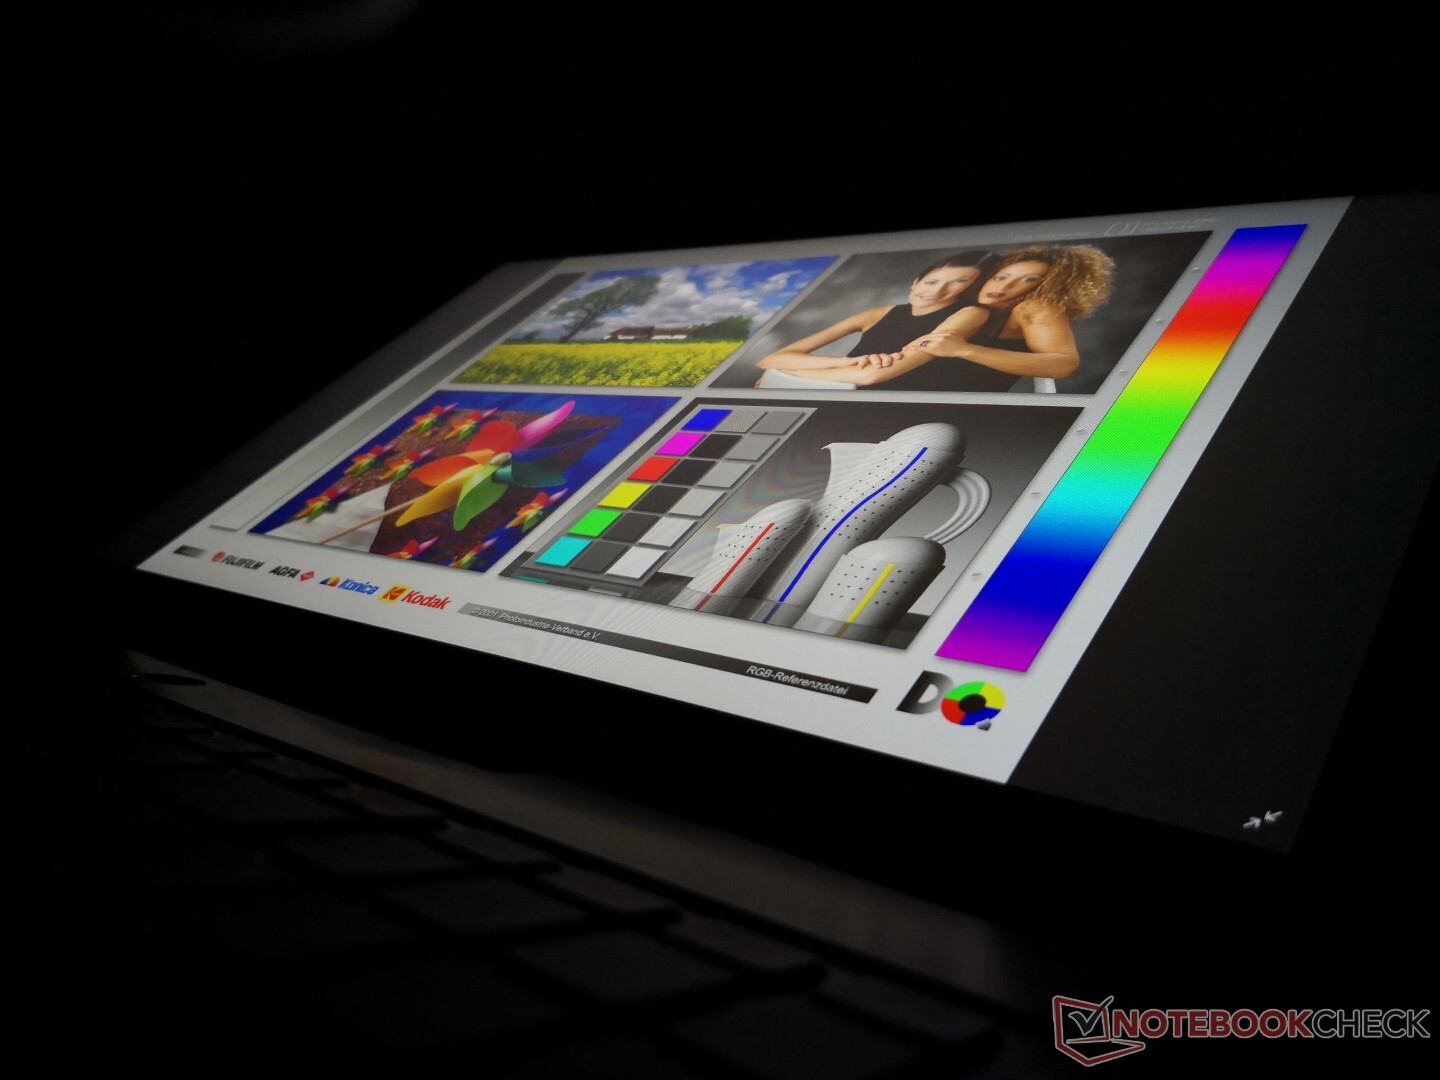
Görüntüle
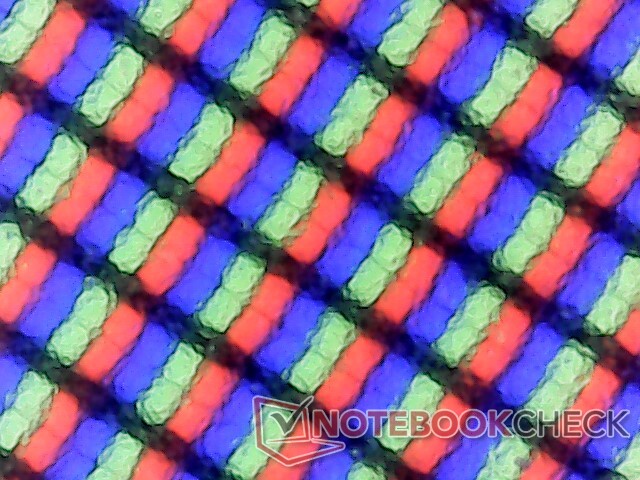
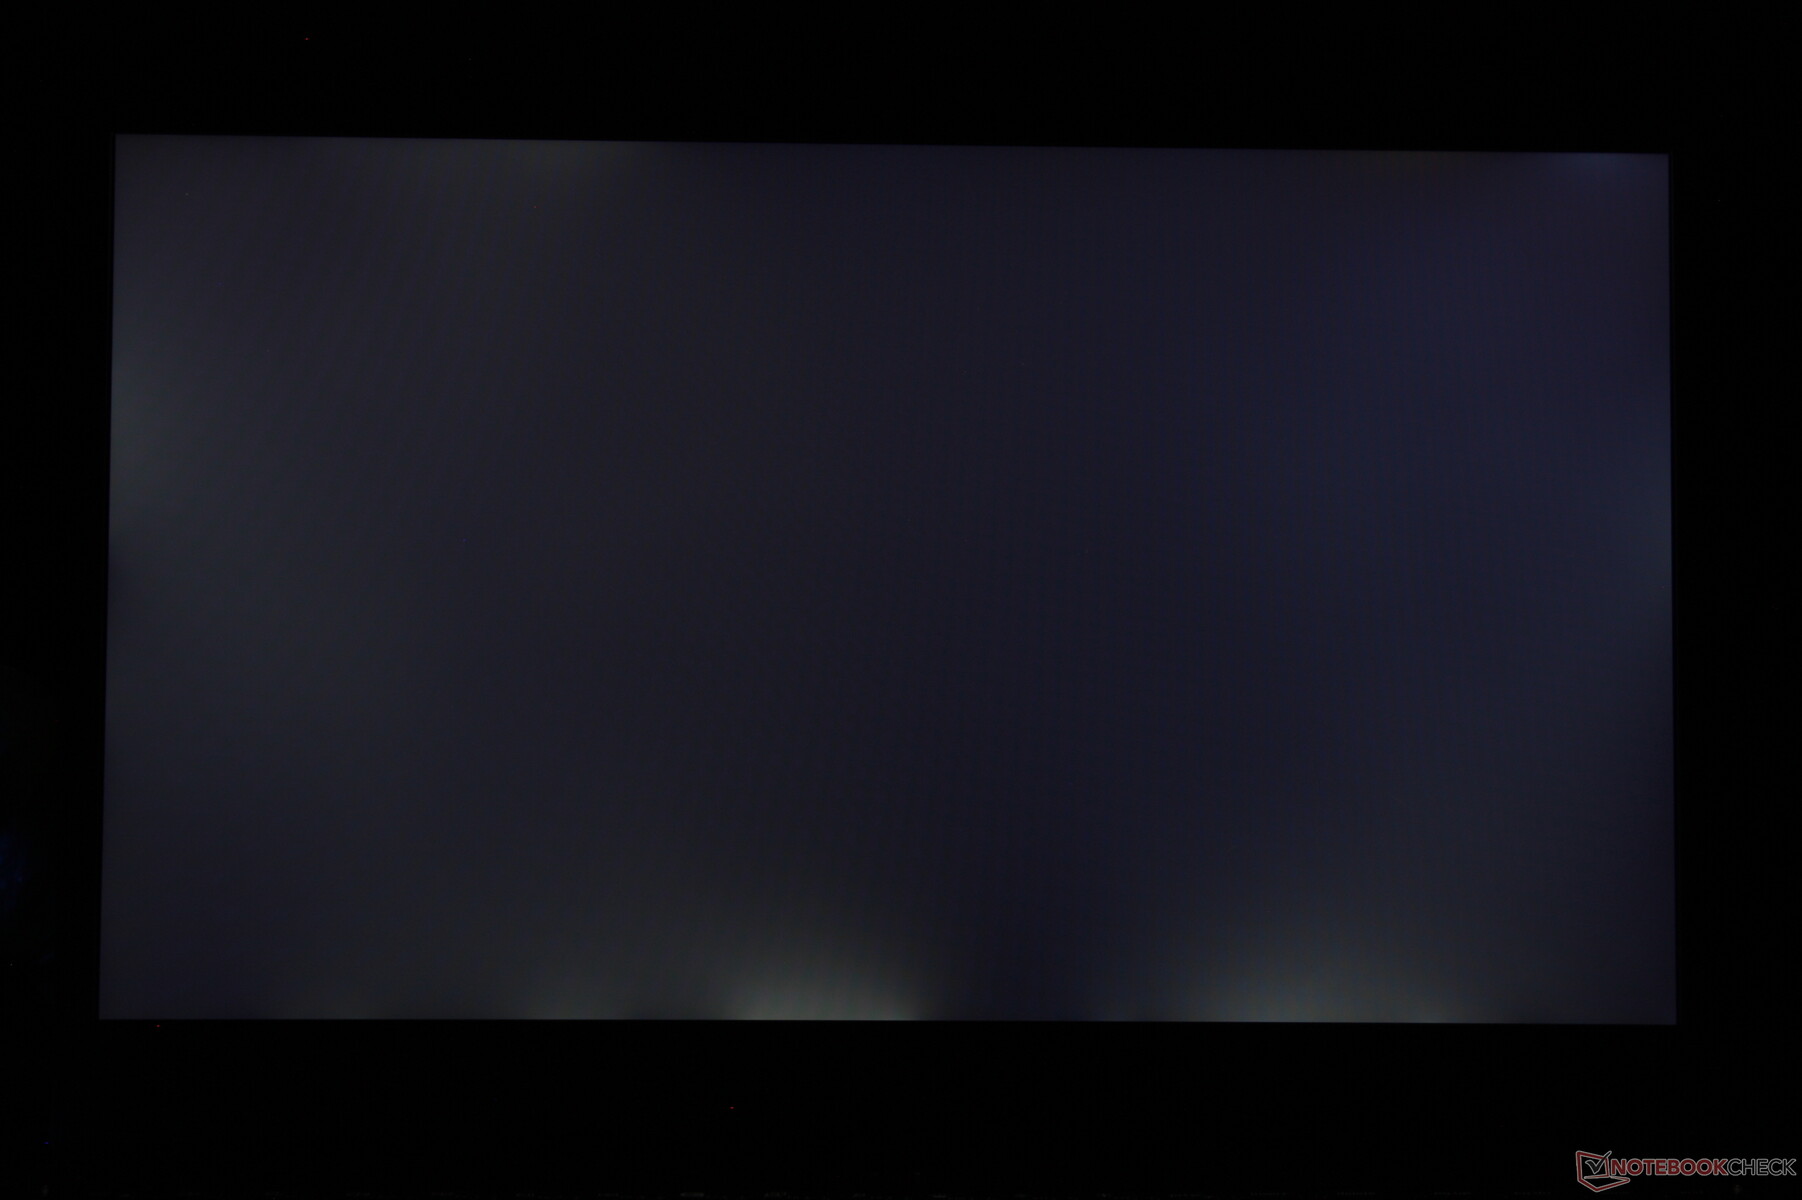
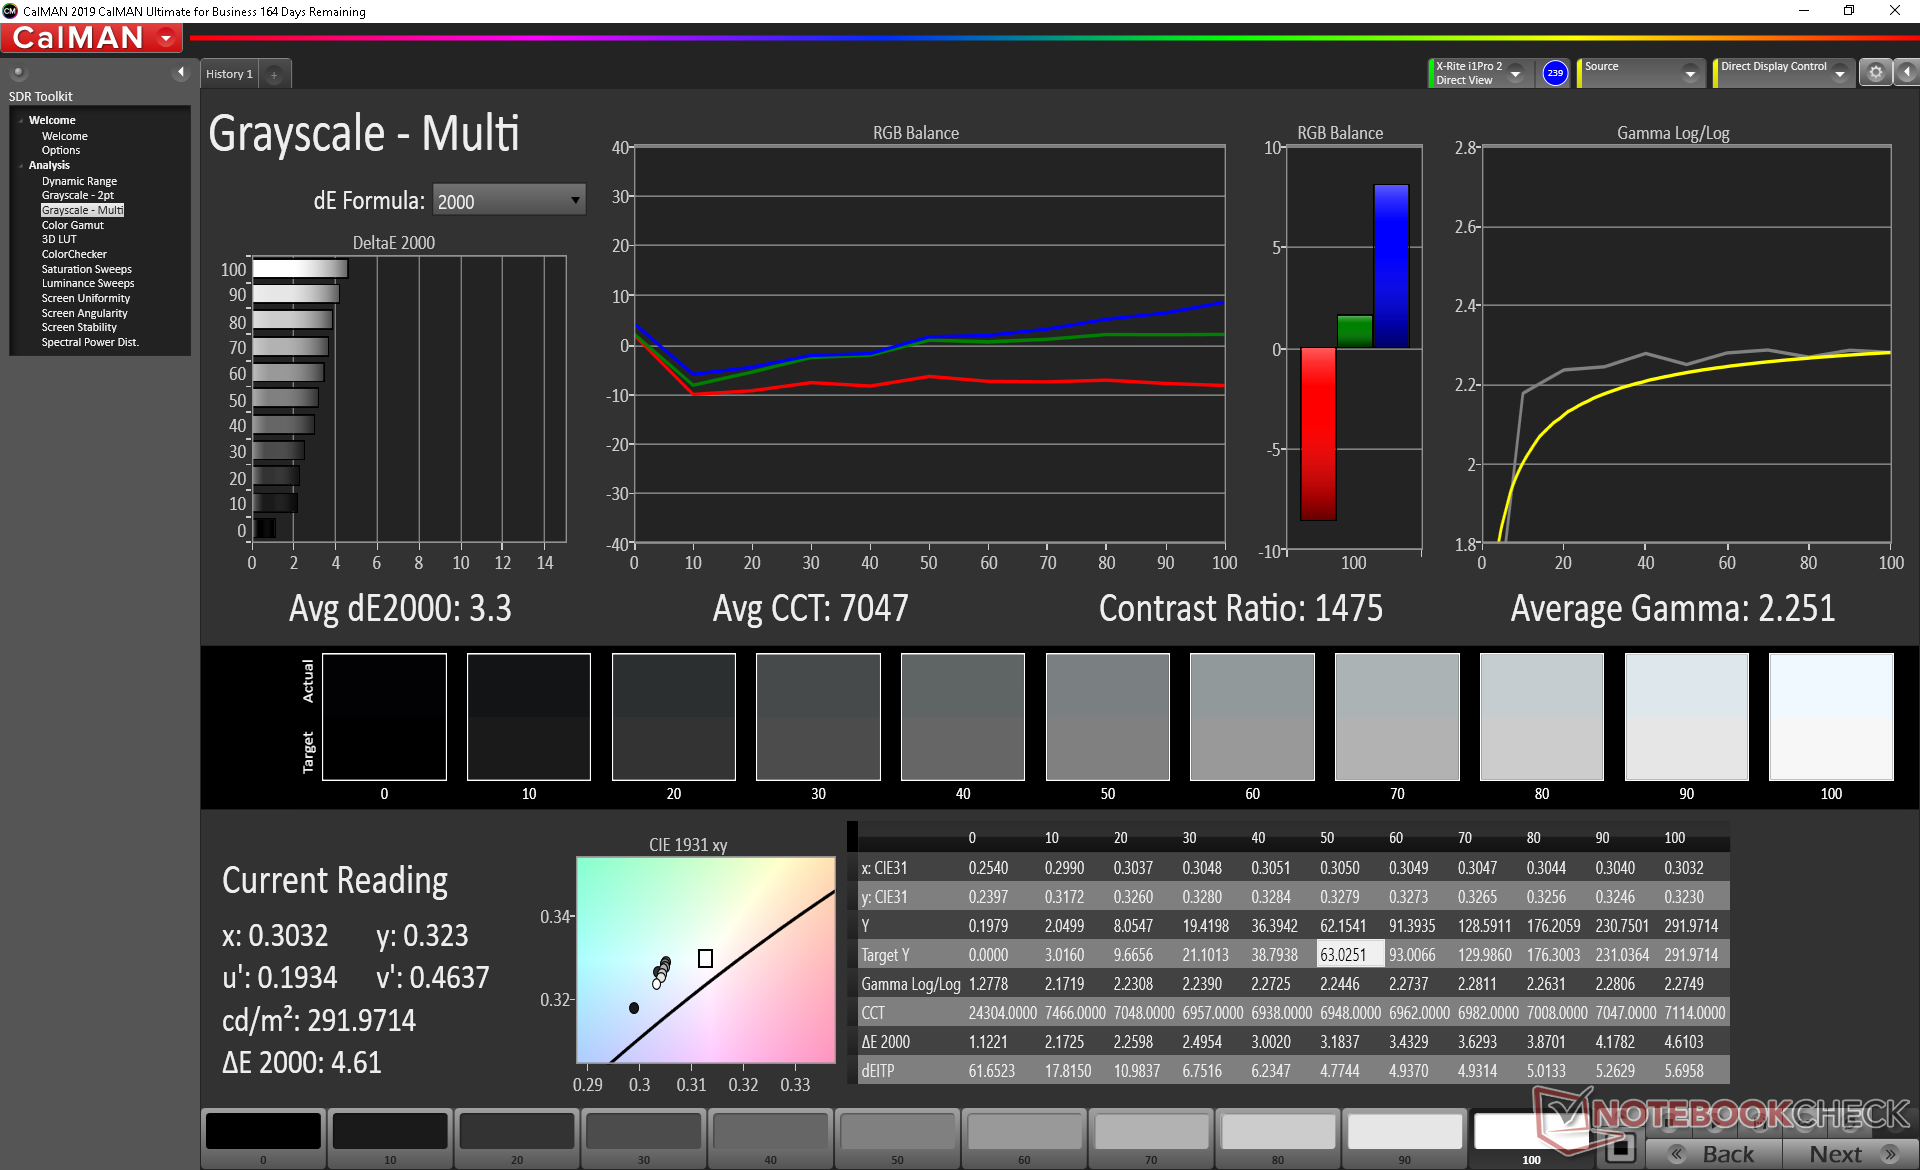
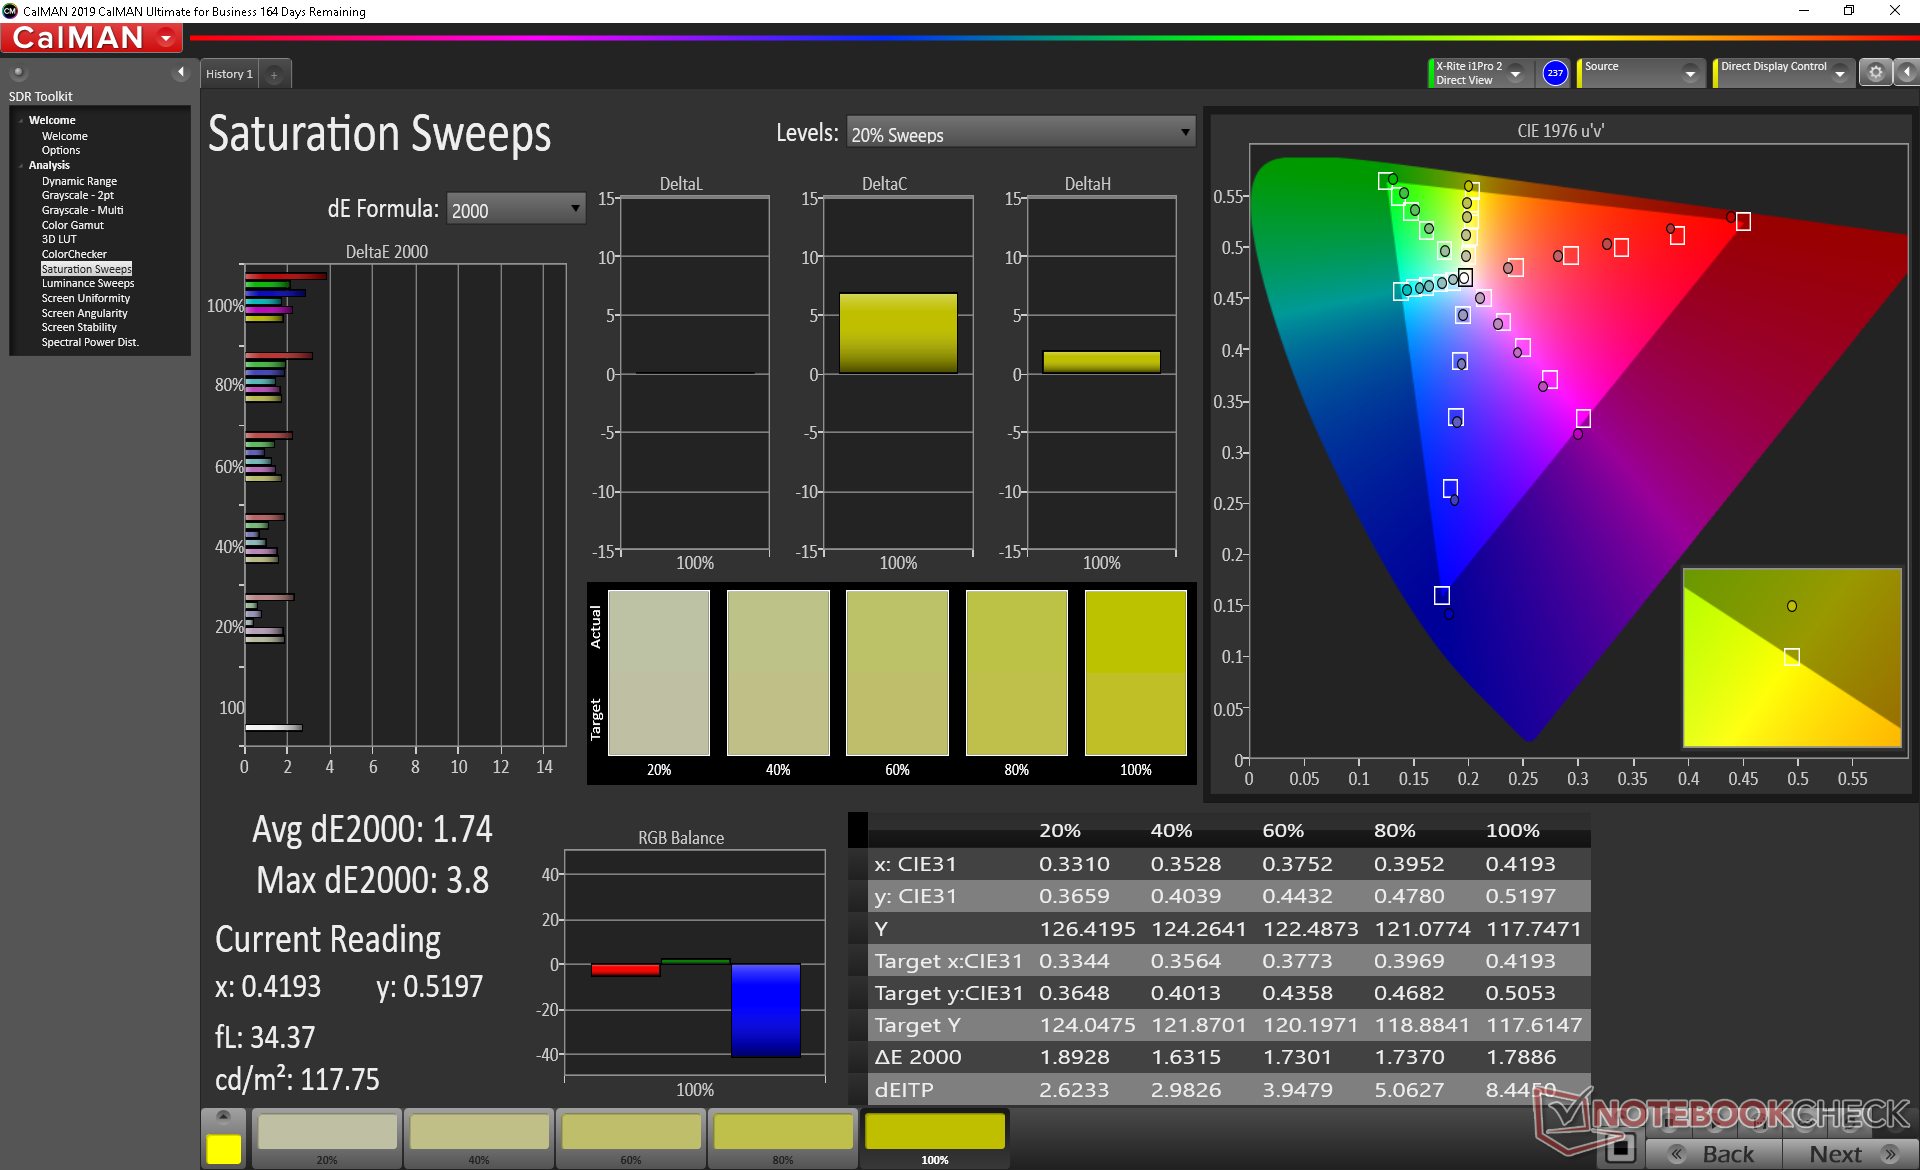
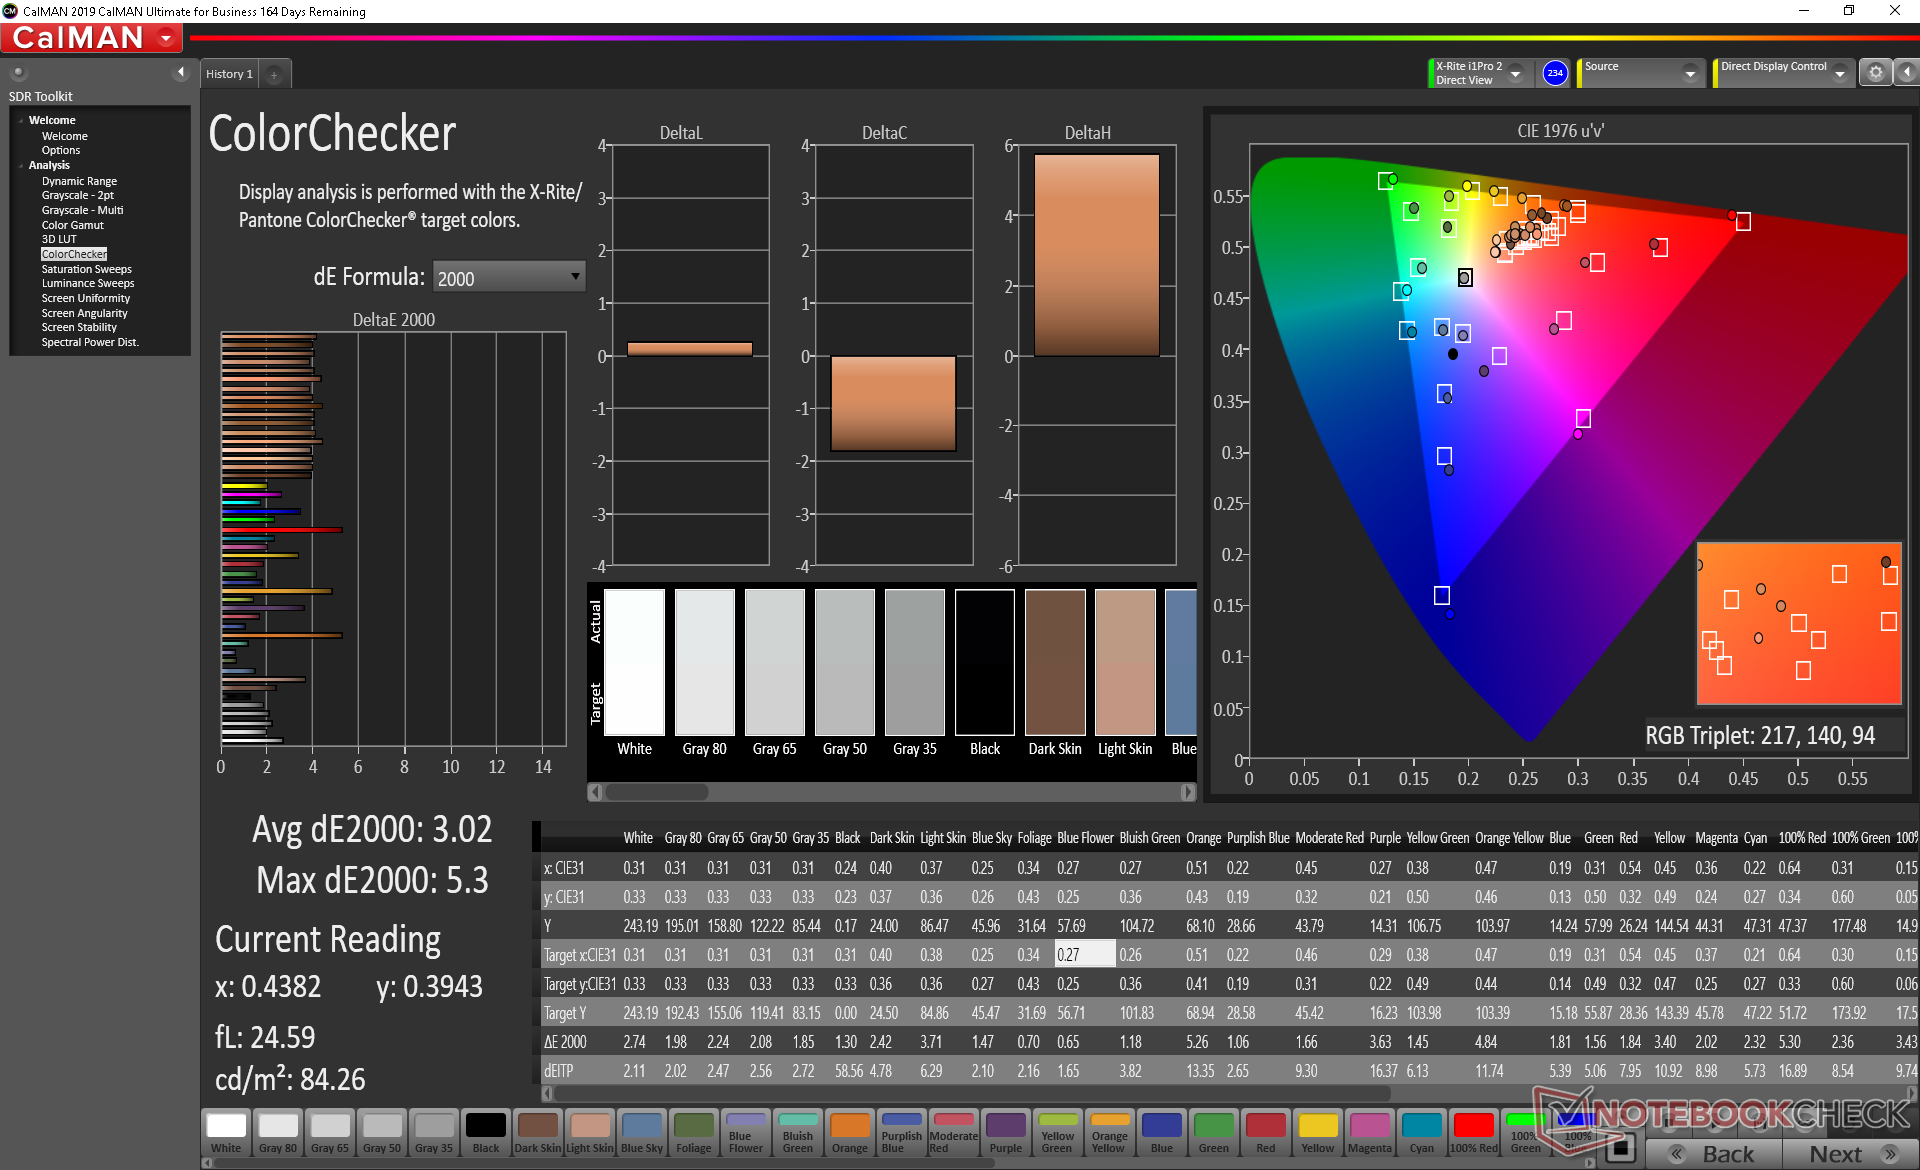
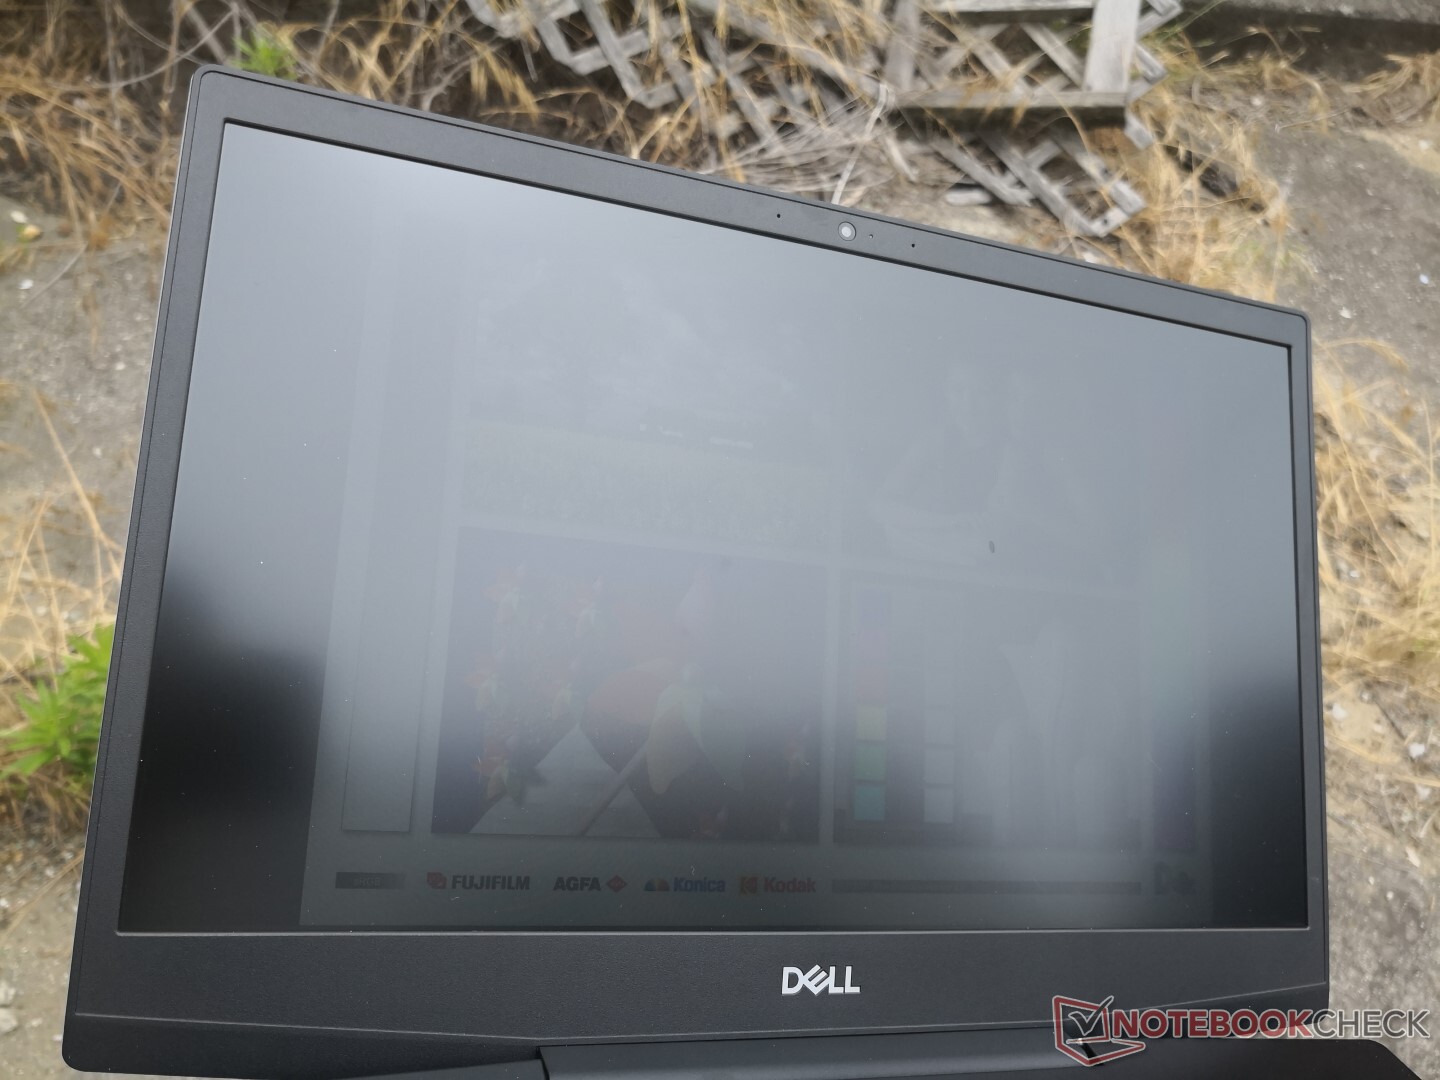
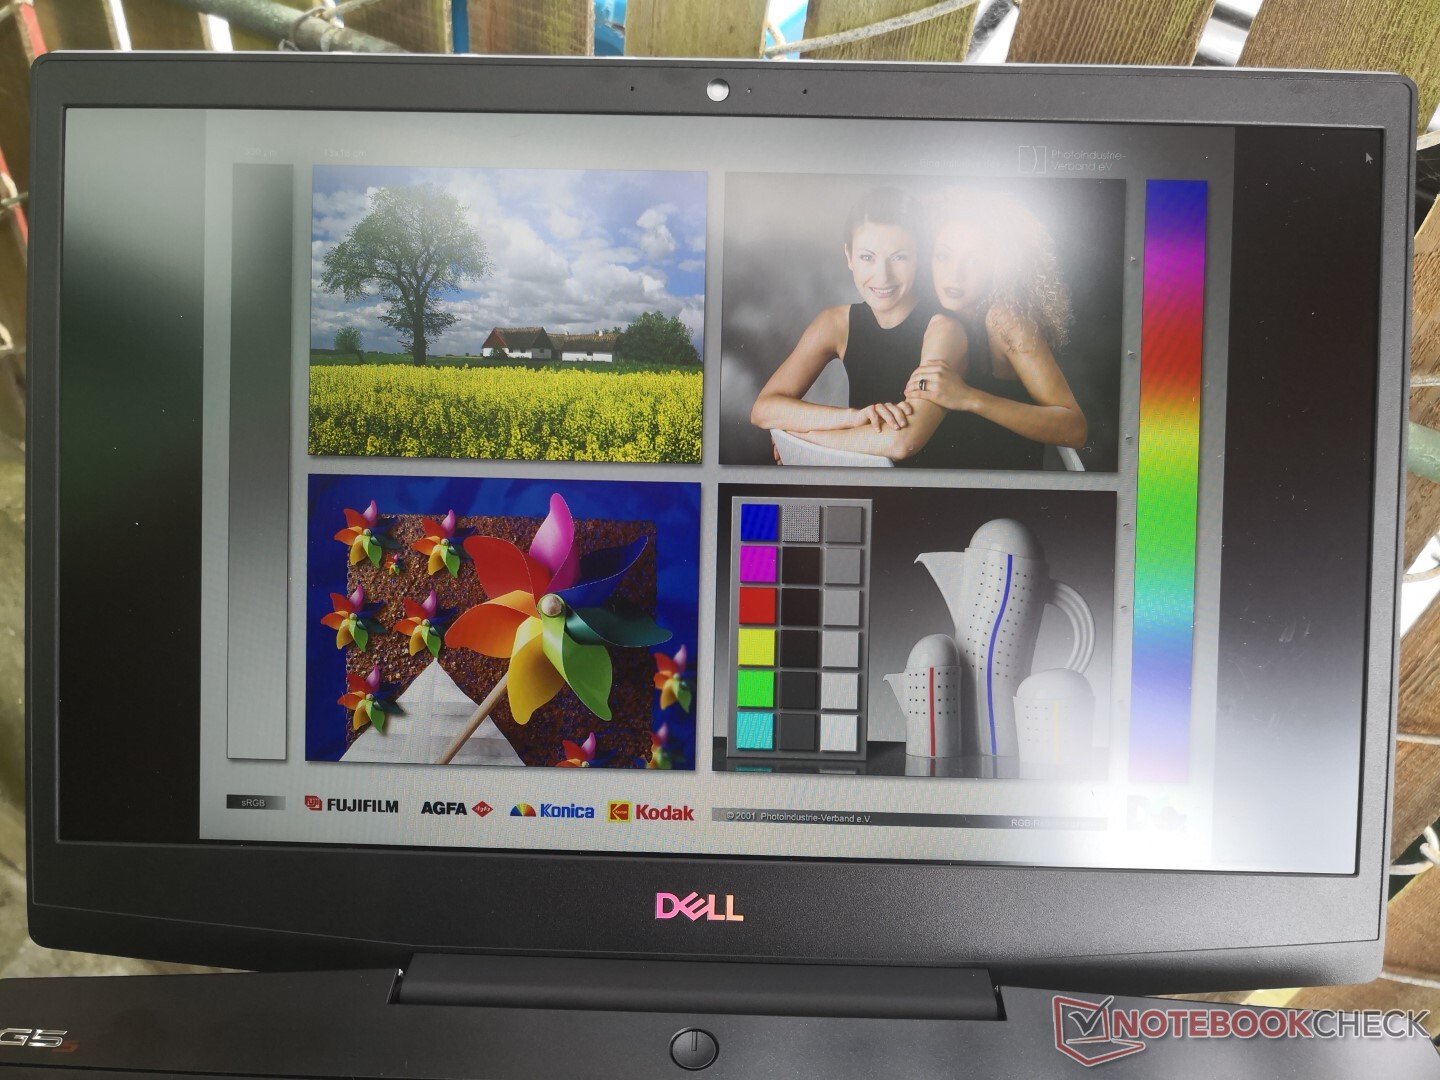
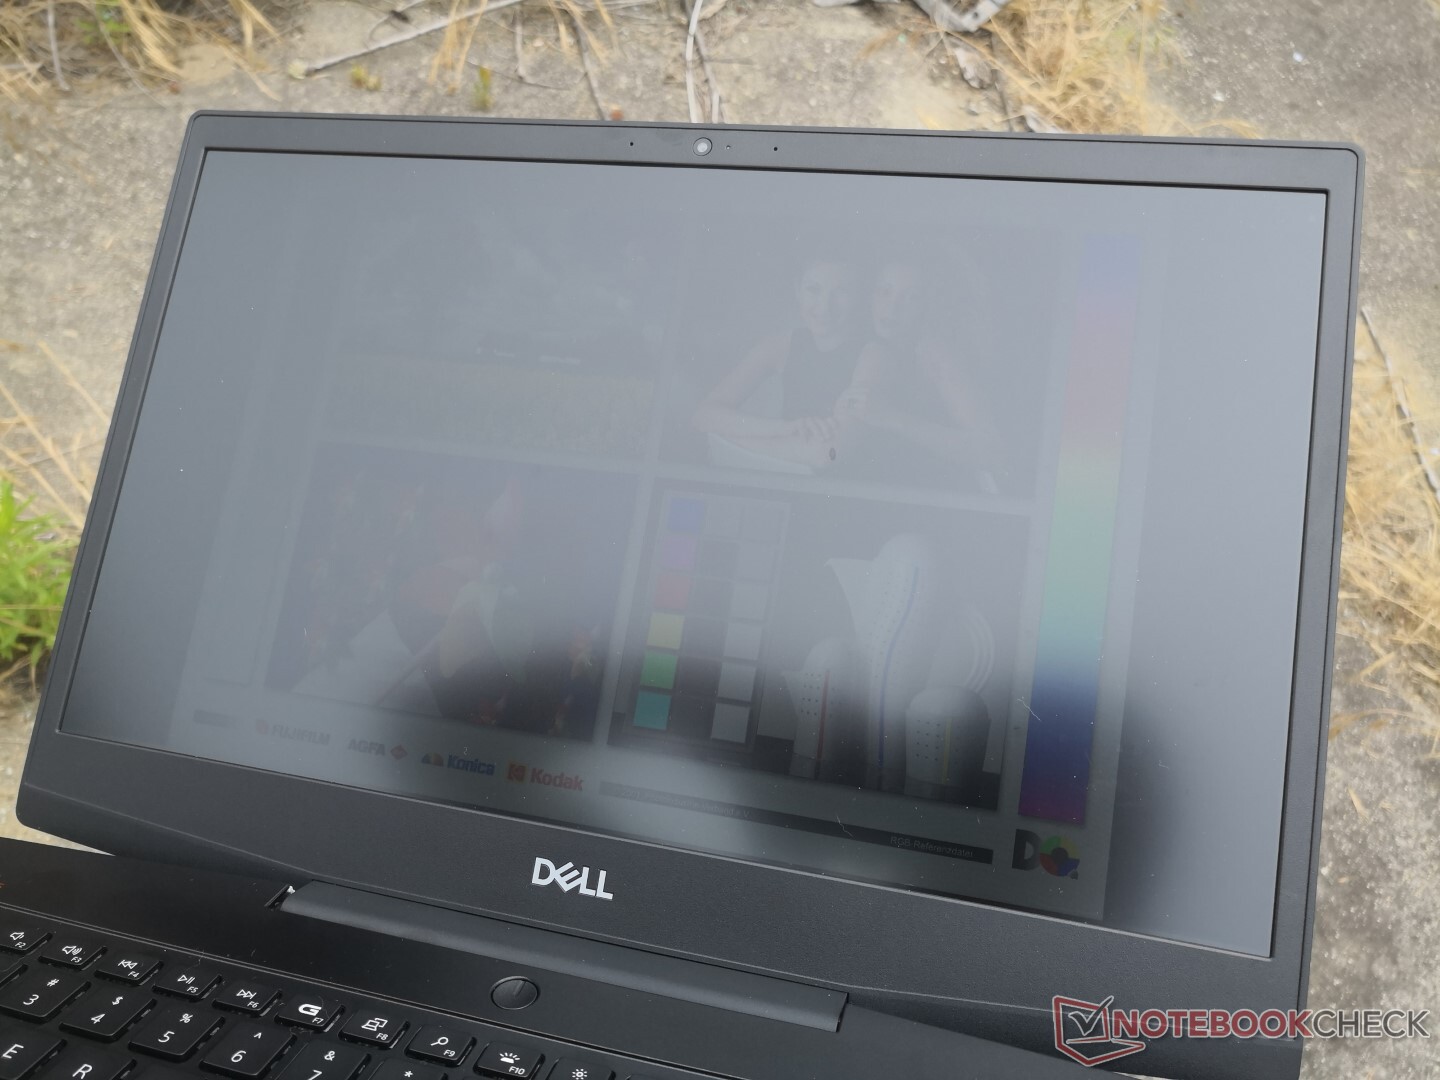
Dell, tüm SKU'larda 60 Hz veya 144 Hz seçenekleriyle yalnızca bir 1080p WVA paneli sunar. Ne yazık ki, uyarlanabilir senkronizasyon mevcut değil. Ekran kalitesi harika ve orta sınıf bir oyun dizüstü bilgisayarını temsil ediyor. Hızlı tepki süreleri, iyi kontrast oranı ve iyi renkler, biraz daha iyi olmasalar bile, diğer ~ 1000 $ alternatiflerine göre görmeyi beklediğimiz yerdir. Örneğin, Asus TUF A15 FA506IV daha zayıf renklere ve daha yavaş tepki sürelerine sahiptir, ancak uyarlanabilir senkronizasyon uyumluluğunun ek faydası vardır. Akılda tutulması gereken bazı reklamsız dezavantajları vardır. Darbe genişliği modülasyonu, yüzde 99'a kadar tüm parlaklık seviyelerinde mevcuttur, yani ekranda titremeye duyarlı kullanıcıların Dell G5 15 SE'den kaçınmak isteyebileceği anlamına gelir. Ayrıca, ünitemiz, oyun oynarken veya siyah kenarlıklarla video oynatılırken fark edilir hale gelen alt kenar boyunca orta derecede düzensiz arka ışık kanamasından muzdariptir.
| |||||||||||||||||||||||||
Aydınlatma: 77 %
Batarya modunda parlaklık: 292 cd/m²
Kontrast: 1081:1 (Siyah: 0.27 cd/m²)
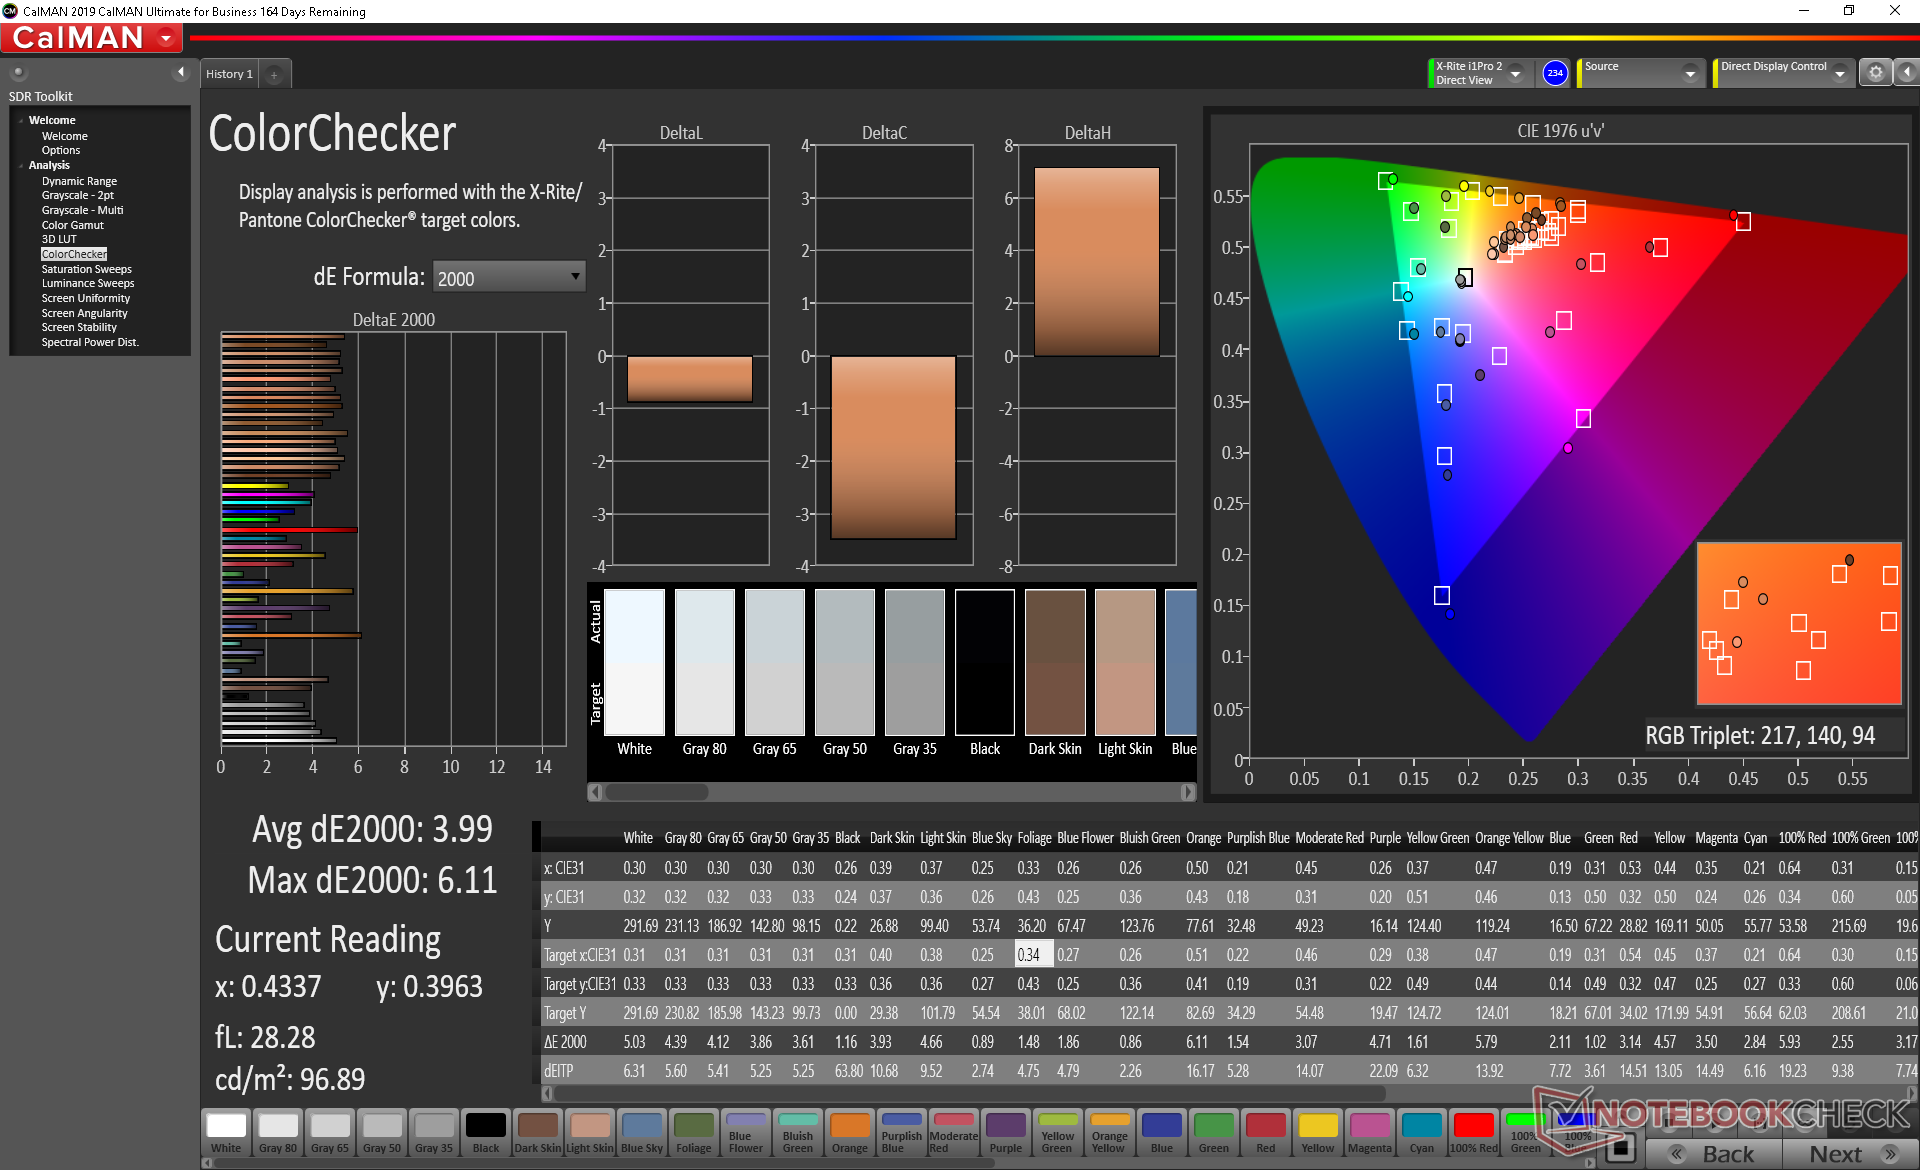
ΔE ColorChecker Calman: 3.99 | ∀{0.5-29.43 Ø4.73}
calibrated: 3.02
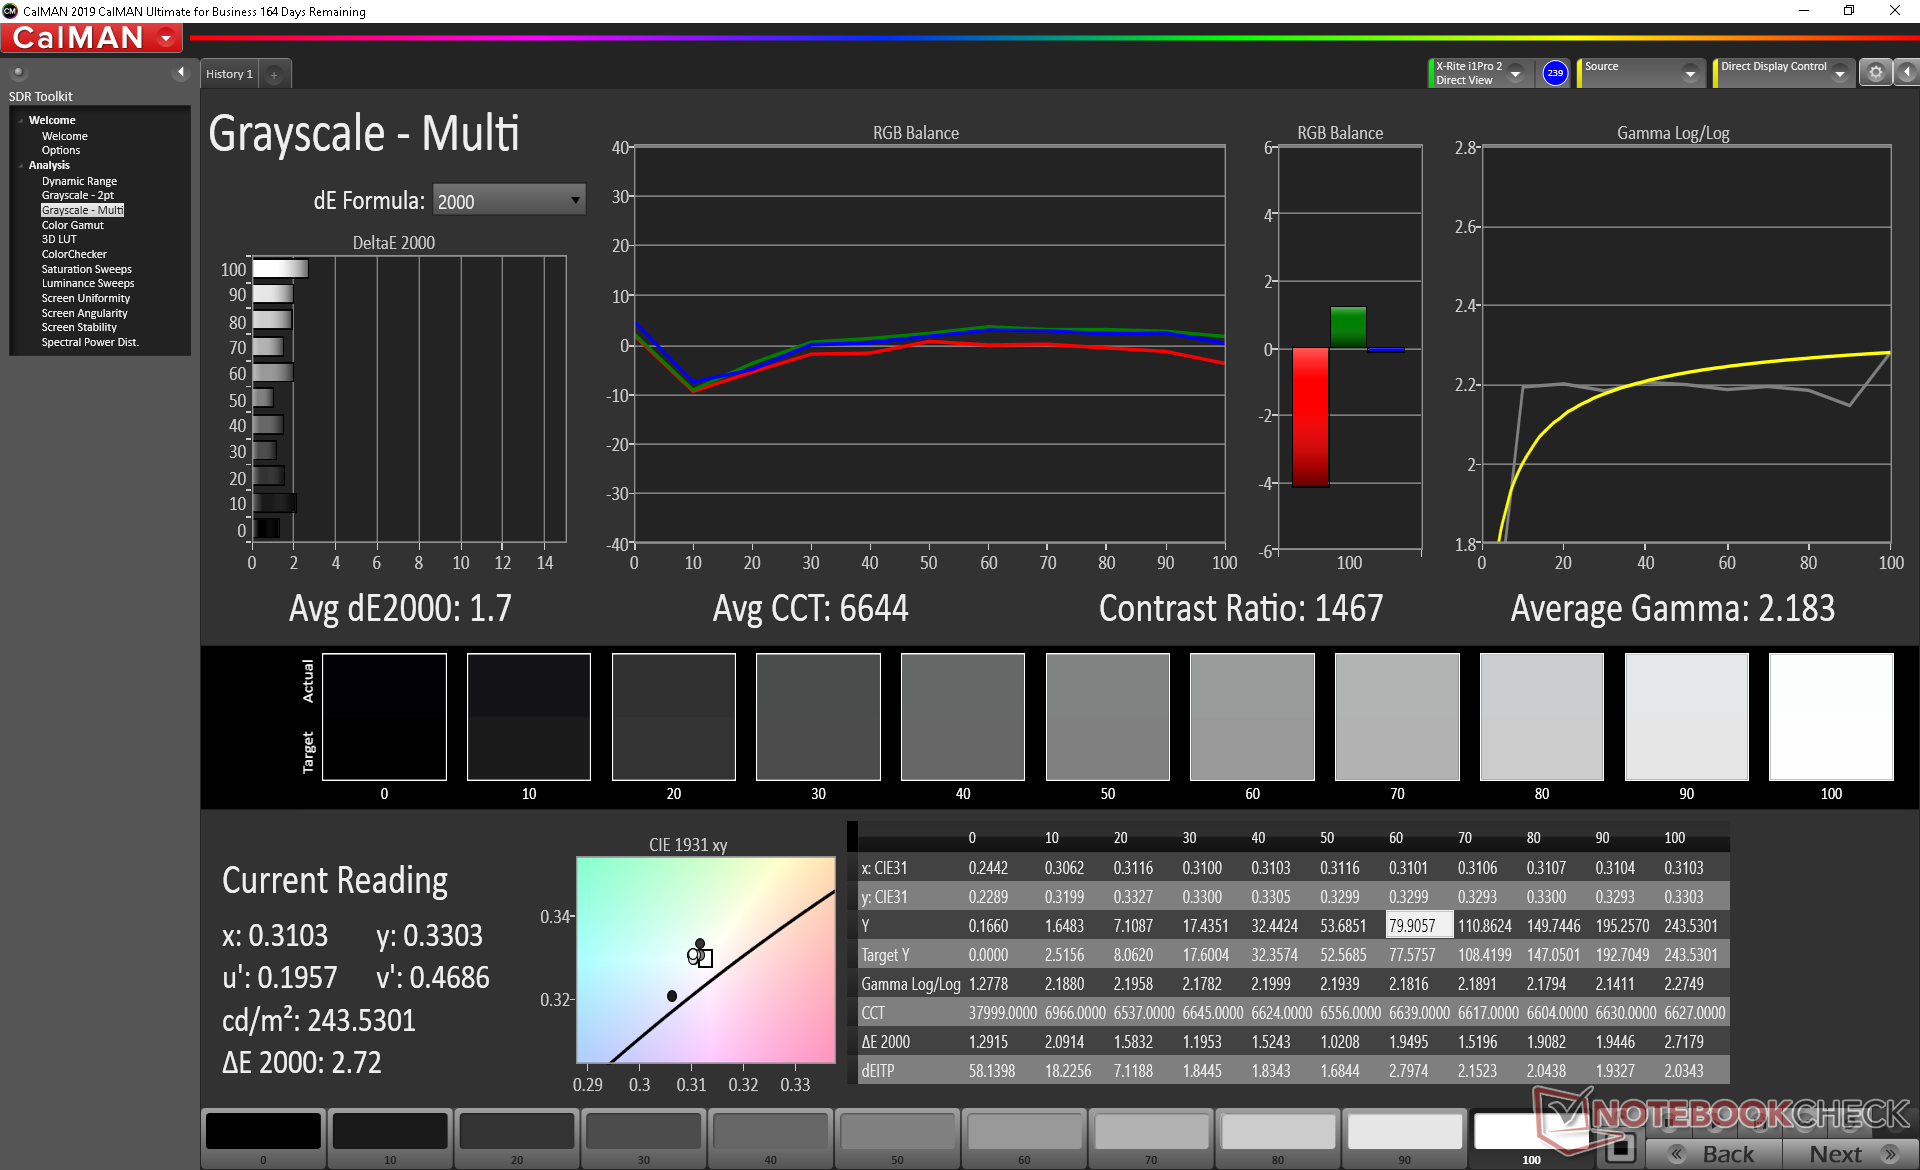
ΔE Greyscale Calman: 3.3 | ∀{0.09-98 Ø4.97}
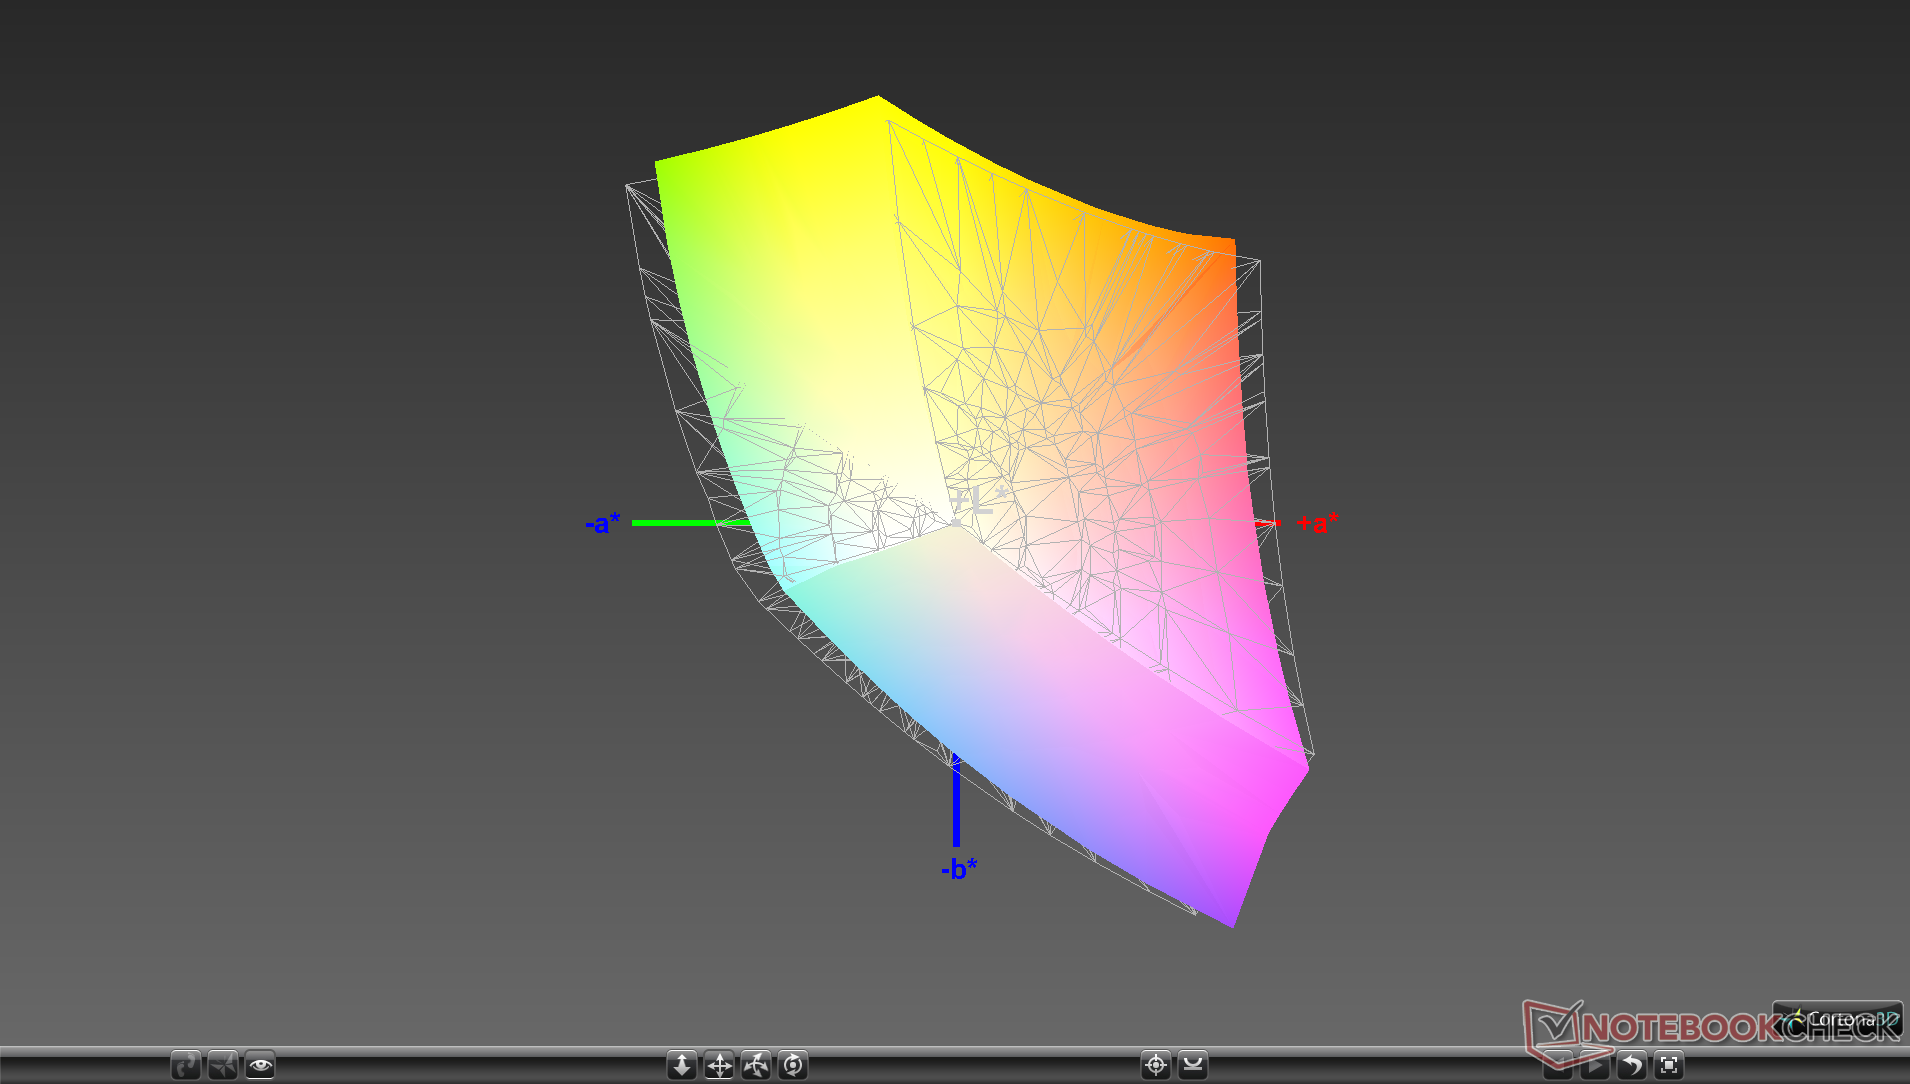
89.7% sRGB (Argyll 1.6.3 3D)
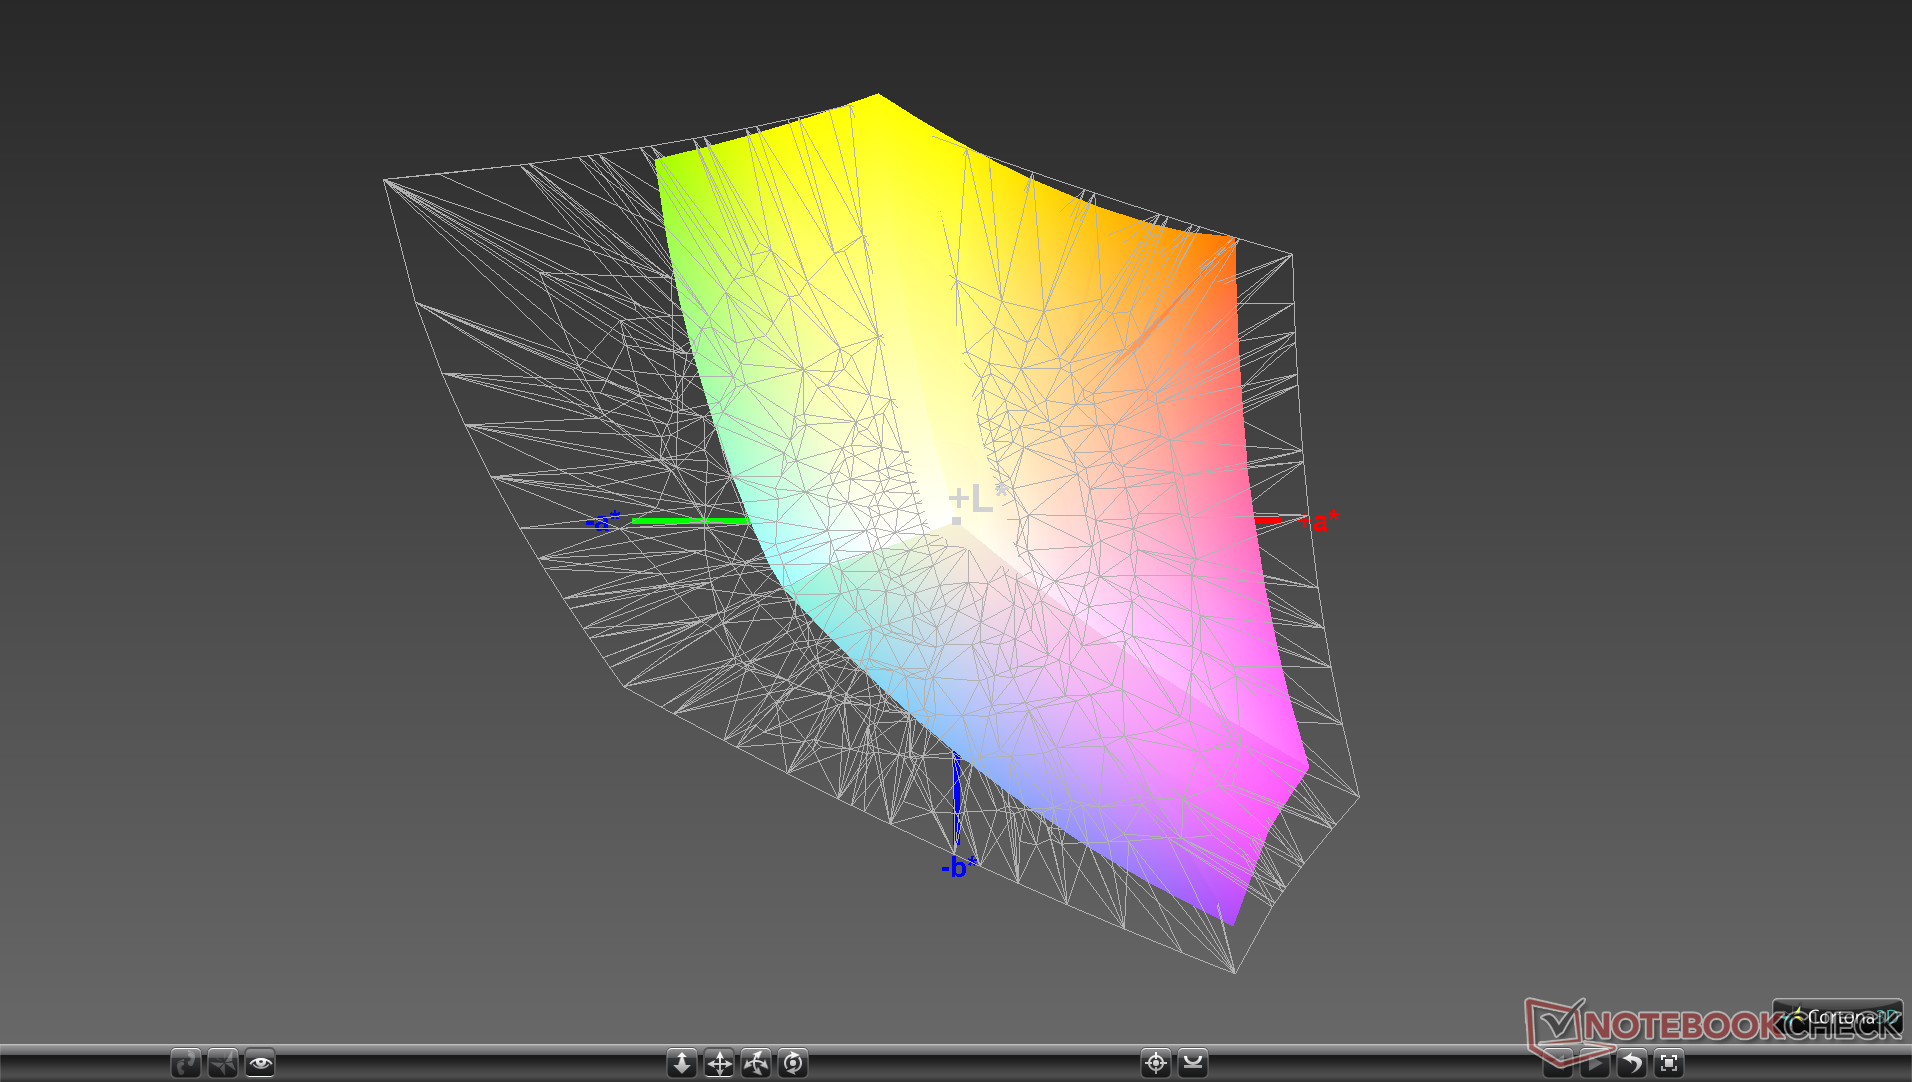
58.1% AdobeRGB 1998 (Argyll 1.6.3 3D)
64.1% AdobeRGB 1998 (Argyll 3D)
90.1% sRGB (Argyll 3D)
63% Display P3 (Argyll 3D)
Gamma: 2.25
CCT: 7047 K
| Dell G5 15 SE 5505 P89F BOE NV156FH, WVA, 15.6", 1920x1080 | Asus TUF Gaming A15 FA506IV-HN172 LM156LF-2F01, IPS, 15.6", 1920x1080 | Dell G5 15 5590-P8RVW AU Optronics B156HAN (AUO80ED), IPS, 15.6", 1920x1080 | Lenovo Legion Y740-15ICHg BOE NV156FHM-N4J, IPS, 15.6", 1920x1080 | HP Omen 15-dc1020ng LGD05CE, IPS, 15.6", 1920x1080 | MSI Alpha 15 A3DDK-034 AU Optronics B156HAN08.0 (AUO80ED), IPS, 15.6", 1920x1080 | |
|---|---|---|---|---|---|---|
| Display | -37% | 3% | 5% | -38% | 3% | |
| Display P3 Coverage (%) | 63 | 38.92 -38% | 65.7 4% | 67.7 7% | 38.37 -39% | 66.4 5% |
| sRGB Coverage (%) | 90.1 | 58.5 -35% | 91.2 1% | 91.6 2% | 57.6 -36% | 91 1% |
| AdobeRGB 1998 Coverage (%) | 64.1 | 40.22 -37% | 66.7 4% | 67.1 5% | 39.69 -38% | 66.6 4% |
| Response Times | -95% | 1% | 7% | -135% | 35% | |
| Response Time Grey 50% / Grey 80% * (ms) | 20.4 ? | 34 ? -67% | 16.4 ? 20% | 19 ? 7% | 40 ? -96% | 7 ? 66% |
| Response Time Black / White * (ms) | 10.8 ? | 24 ? -122% | 12.8 ? -19% | 10 ? 7% | 29.6 ? -174% | 10.4 ? 4% |
| PWM Frequency (Hz) | 198.4 ? | |||||
| Screen | -27% | 4% | 28% | -34% | -5% | |
| Brightness middle (cd/m²) | 292 | 280 -4% | 291 0% | 477 63% | 251 -14% | 310 6% |
| Brightness (cd/m²) | 290 | 254 -12% | 295 2% | 431 49% | 232 -20% | 310 7% |
| Brightness Distribution (%) | 77 | 88 14% | 83 8% | 84 9% | 76 -1% | 86 12% |
| Black Level * (cd/m²) | 0.27 | 0.15 44% | 0.22 19% | 0.175 35% | 0.17 37% | 0.29 -7% |
| Contrast (:1) | 1081 | 1867 73% | 1323 22% | 2726 152% | 1476 37% | 1069 -1% |
| Colorchecker dE 2000 * | 3.99 | 5.89 -48% | 3.95 1% | 4.17 -5% | 6.2 -55% | 4.78 -20% |
| Colorchecker dE 2000 max. * | 6.11 | 19 -211% | 7.46 -22% | 6.97 -14% | 18.6 -204% | 8.1 -33% |
| Colorchecker dE 2000 calibrated * | 3.02 | 4.79 -59% | 2.05 32% | 2.51 17% | 4.8 -59% | 2.36 22% |
| Greyscale dE 2000 * | 3.3 | 4.08 -24% | 3.82 -16% | 3.49 -6% | 4.2 -27% | 4.78 -45% |
| Gamma | 2.25 98% | 2.33 94% | 2.49 88% | 2.5 88% | 2.32 95% | 2.43 91% |
| CCT | 7047 92% | 7303 89% | 7317 89% | 7076 92% | 7454 87% | 7739 84% |
| Color Space (Percent of AdobeRGB 1998) (%) | 58.1 | 37 -36% | 59 2% | 60 3% | 36.5 -37% | 59 2% |
| Color Space (Percent of sRGB) (%) | 89.7 | 58 -35% | 91 1% | 91 1% | 57.4 -36% | 91 1% |
| Toplam Ortalama (Program / Ayarlar) | -53% /
-37% | 3% /
4% | 13% /
21% | -69% /
-48% | 11% /
2% |
* ... daha küçük daha iyidir
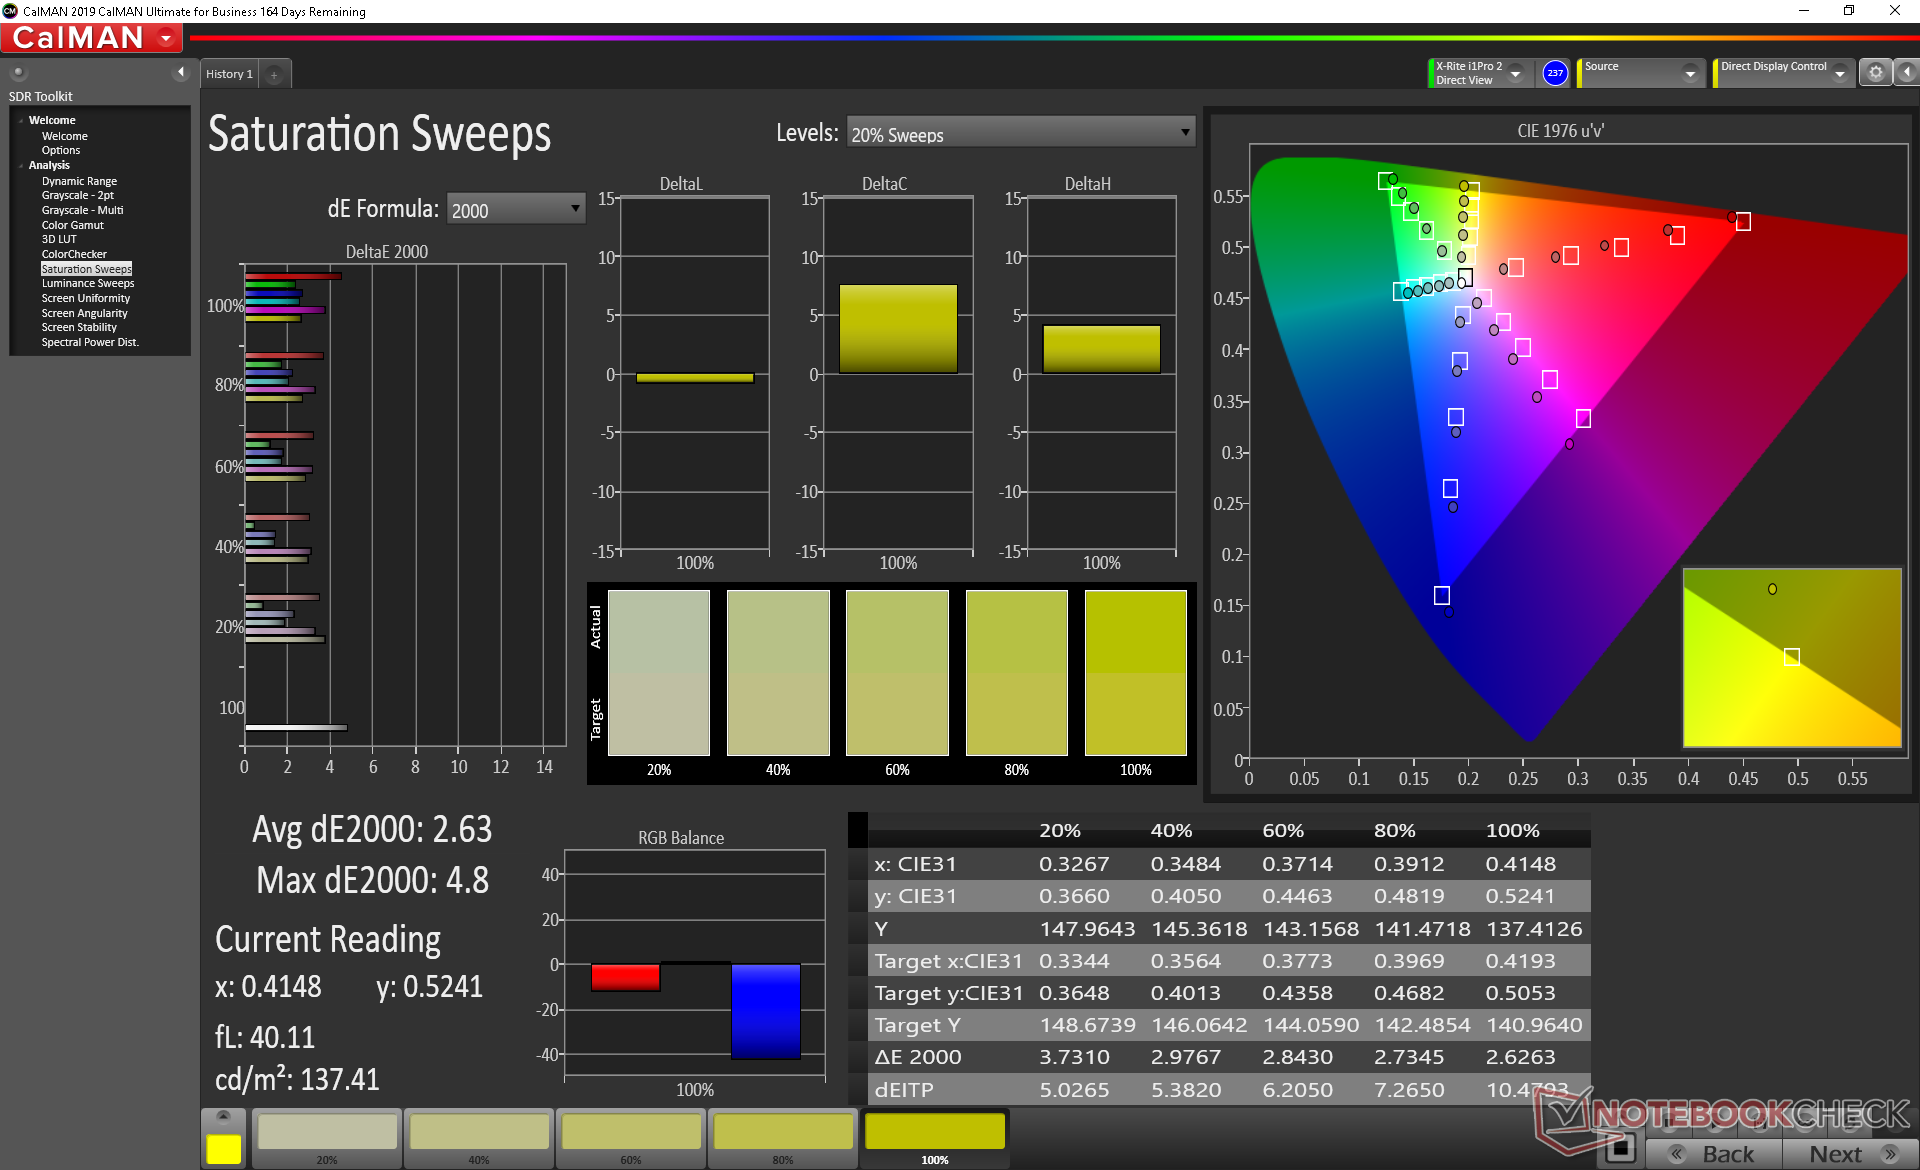
Renk alanı, sRGB ve AdobeRGB standartlarının sırasıyla yaklaşık yüzde 90'ı ve yüzde 58'i oranında orta sınıftan yüksek teknolojiye sahip bir oyun dizüstü bilgisayarı için tipiktir. Daha geniş bir gam talep etmek genellikle oyun oynarken tartışmasız daha önemli olan yenileme hızından veya yanıt sürelerinden ödün verilmesine neden olur.
X-Rite kolorimetre ölçümleri kutudan çıkmış, iyi kalibre edilmiş bir ekran gösteriyor. Renk sıcaklığı biraz fazla soğuk, ancak kalibrasyonumuz bunu herhangi bir sorun olmadan giderir.
Yanıt Sürelerini Görüntüle
| ↔ Tepki Süresi Siyahtan Beyaza | ||
|---|---|---|
| 10.8 ms ... yükseliş ↗ ve sonbahar↘ birleşimi | ↗ 6.4 ms yükseliş | 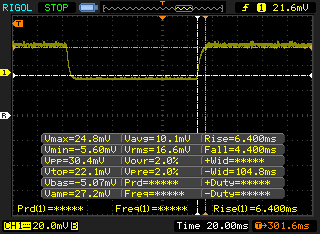 |
| ↘ 4.4 ms sonbahar | ||
| Ekran, testlerimizde iyi yanıt oranları gösteriyor ancak rekabetçi oyuncular için çok yavaş olabilir. Karşılaştırıldığında, test edilen tüm cihazlar 0.1 (minimum) ile 240 (maksimum) ms arasında değişir. » Tüm cihazların 29 %'si daha iyi. Bu, ölçülen yanıt süresinin test edilen tüm cihazların ortalamasından (19.9 ms) daha iyi olduğu anlamına gelir. | ||
| ↔ Tepki Süresi %50 Griden %80 Griye | ||
| 20.4 ms ... yükseliş ↗ ve sonbahar↘ birleşimi | ↗ 10.8 ms yükseliş | 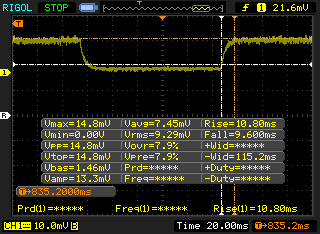 |
| ↘ 9.6 ms sonbahar | ||
| Ekran, testlerimizde iyi yanıt oranları gösteriyor ancak rekabetçi oyuncular için çok yavaş olabilir. Karşılaştırıldığında, test edilen tüm cihazlar 0.165 (minimum) ile 636 (maksimum) ms arasında değişir. » Tüm cihazların 33 %'si daha iyi. Bu, ölçülen yanıt süresinin test edilen tüm cihazların ortalamasından (31.1 ms) daha iyi olduğu anlamına gelir. | ||
Ekran Titremesi / PWM (Darbe Genişliği Modülasyonu)
| Ekran titriyor / PWM algılandı | 198.4 Hz | ≤ 99 % parlaklık ayarı | 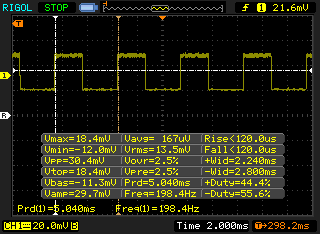 |
Ekran arka ışığı 198.4 Hz'de titriyor (en kötü durum, örneğin PWM kullanılması) 99 % ve altındaki parlaklık ayarında titreme algılandı. Bu parlaklık ayarının üzerinde titreme veya PWM olmamalıdır. 198.4 Hz frekansı nispeten düşüktür, bu nedenle hassas kullanıcılar belirtilen parlaklık ayarında ve altında muhtemelen titremeyi fark edecek ve göz yorgunluğu yaşayacaktır. Karşılaştırıldığında: Test edilen tüm cihazların %52 %'si ekranı karartmak için PWM kullanmıyor. PWM tespit edilirse, ortalama 7784 (minimum: 5 - maksimum: 343500) Hz ölçüldü. | |||
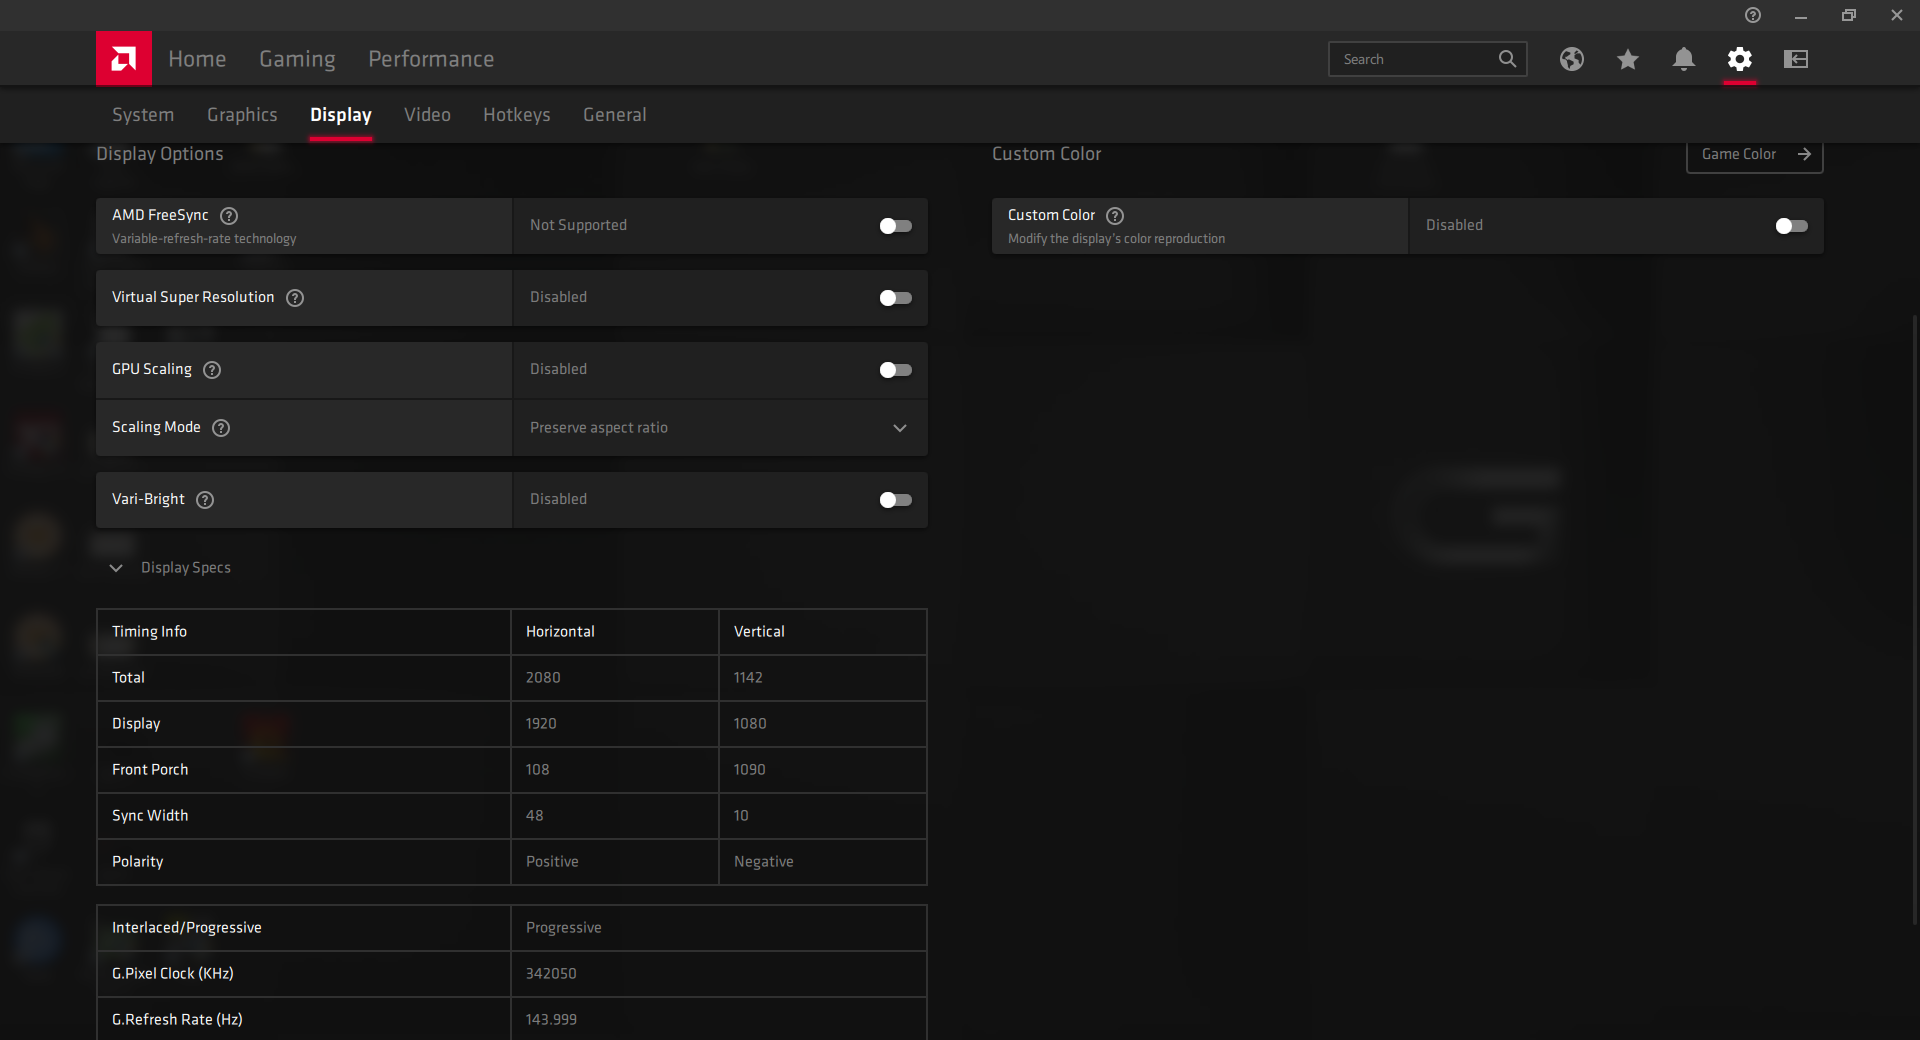
Görüş açıları aynı değilse IPS'ye benzer. Anormal derecede aşırı açılardan bakılmadığı sürece renkler ve kontrast bozulmaz. Arka ışık çoğunlukla iç mekan izleme için tasarlandığından, dış mekan görünürlüğü ortalama olarak en iyi düzeydedir. AMD Vari-Bright'ı devre dışı bırakmayı unutmayın, aksi takdirde pil gücüyle çalışırken maksimum parlaklık düşer.
Verim
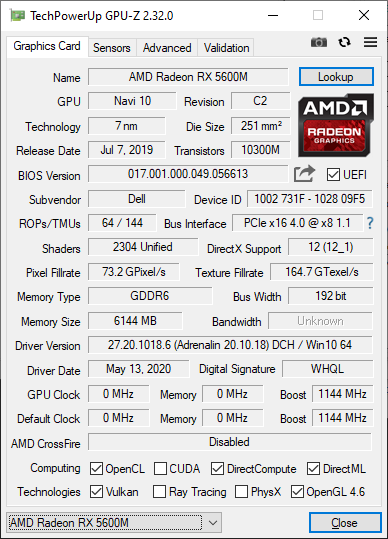
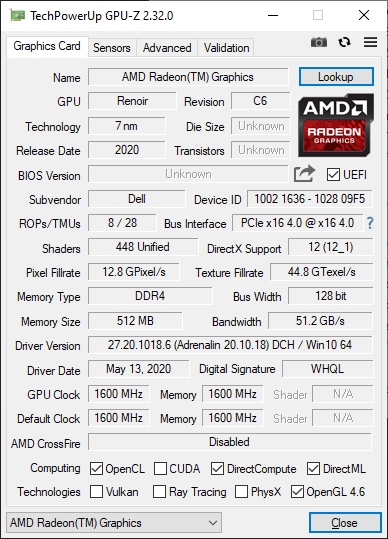
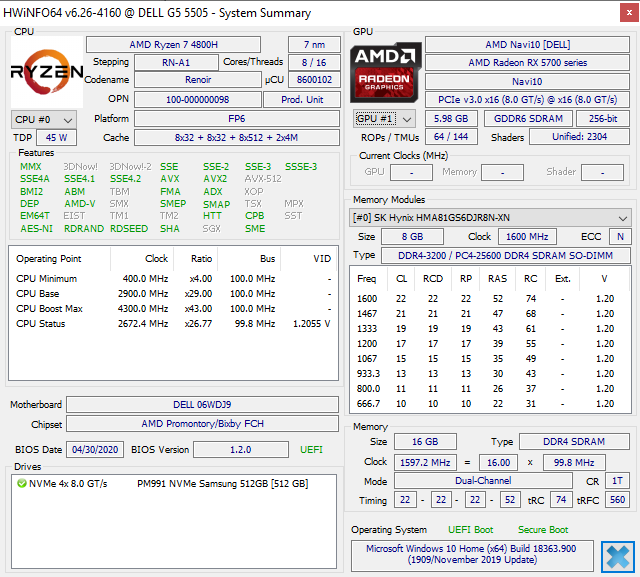
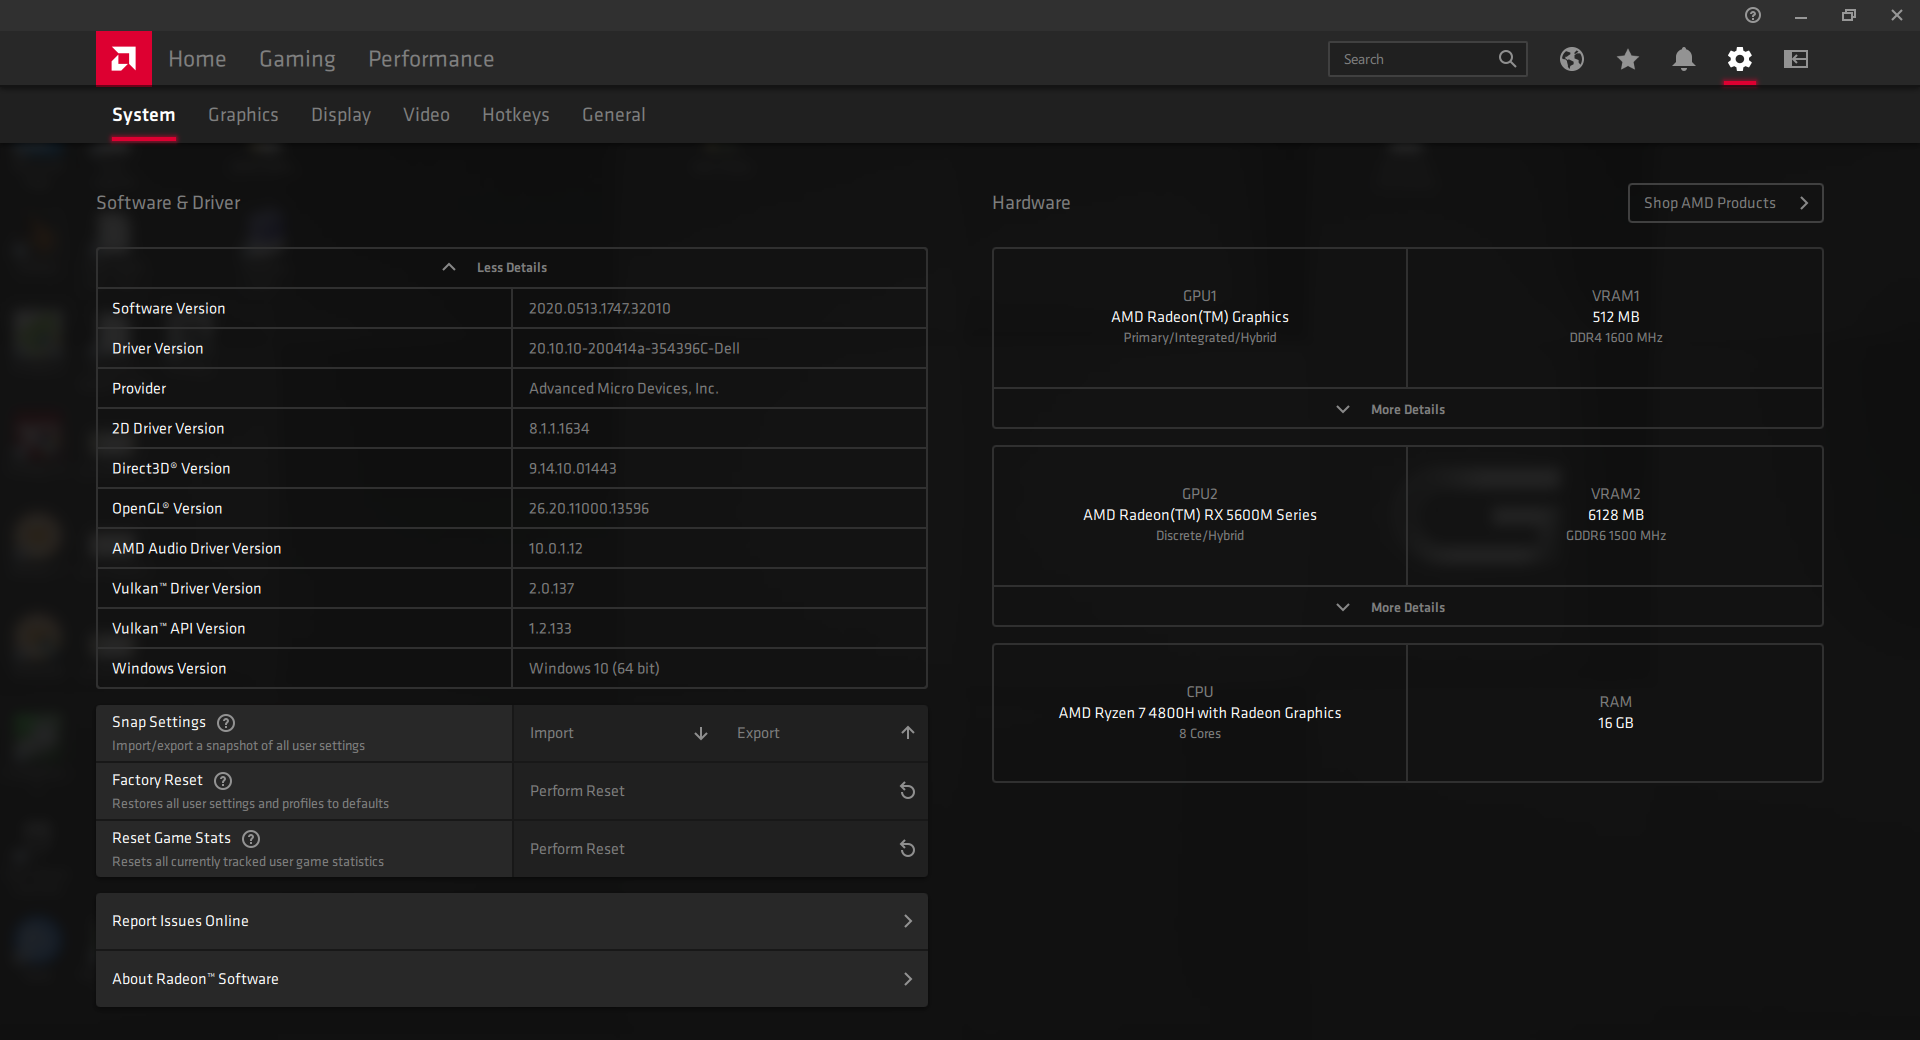
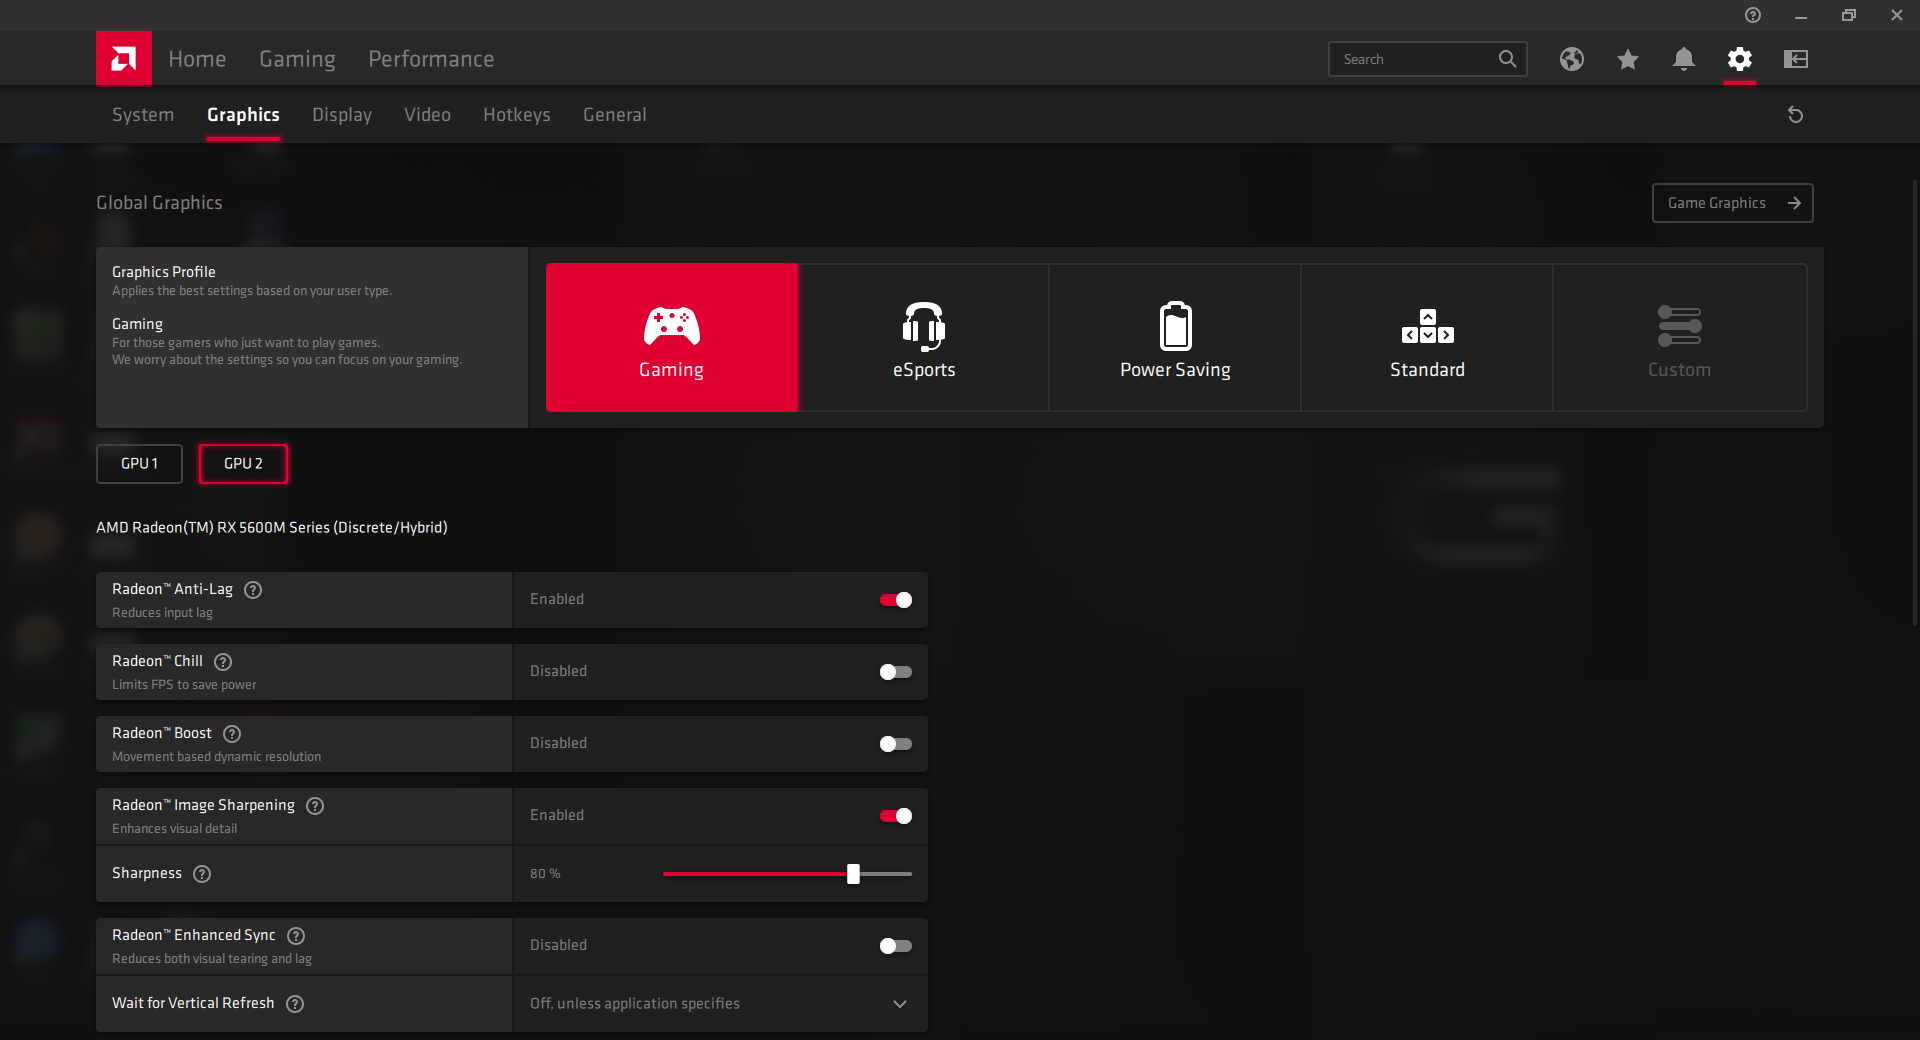
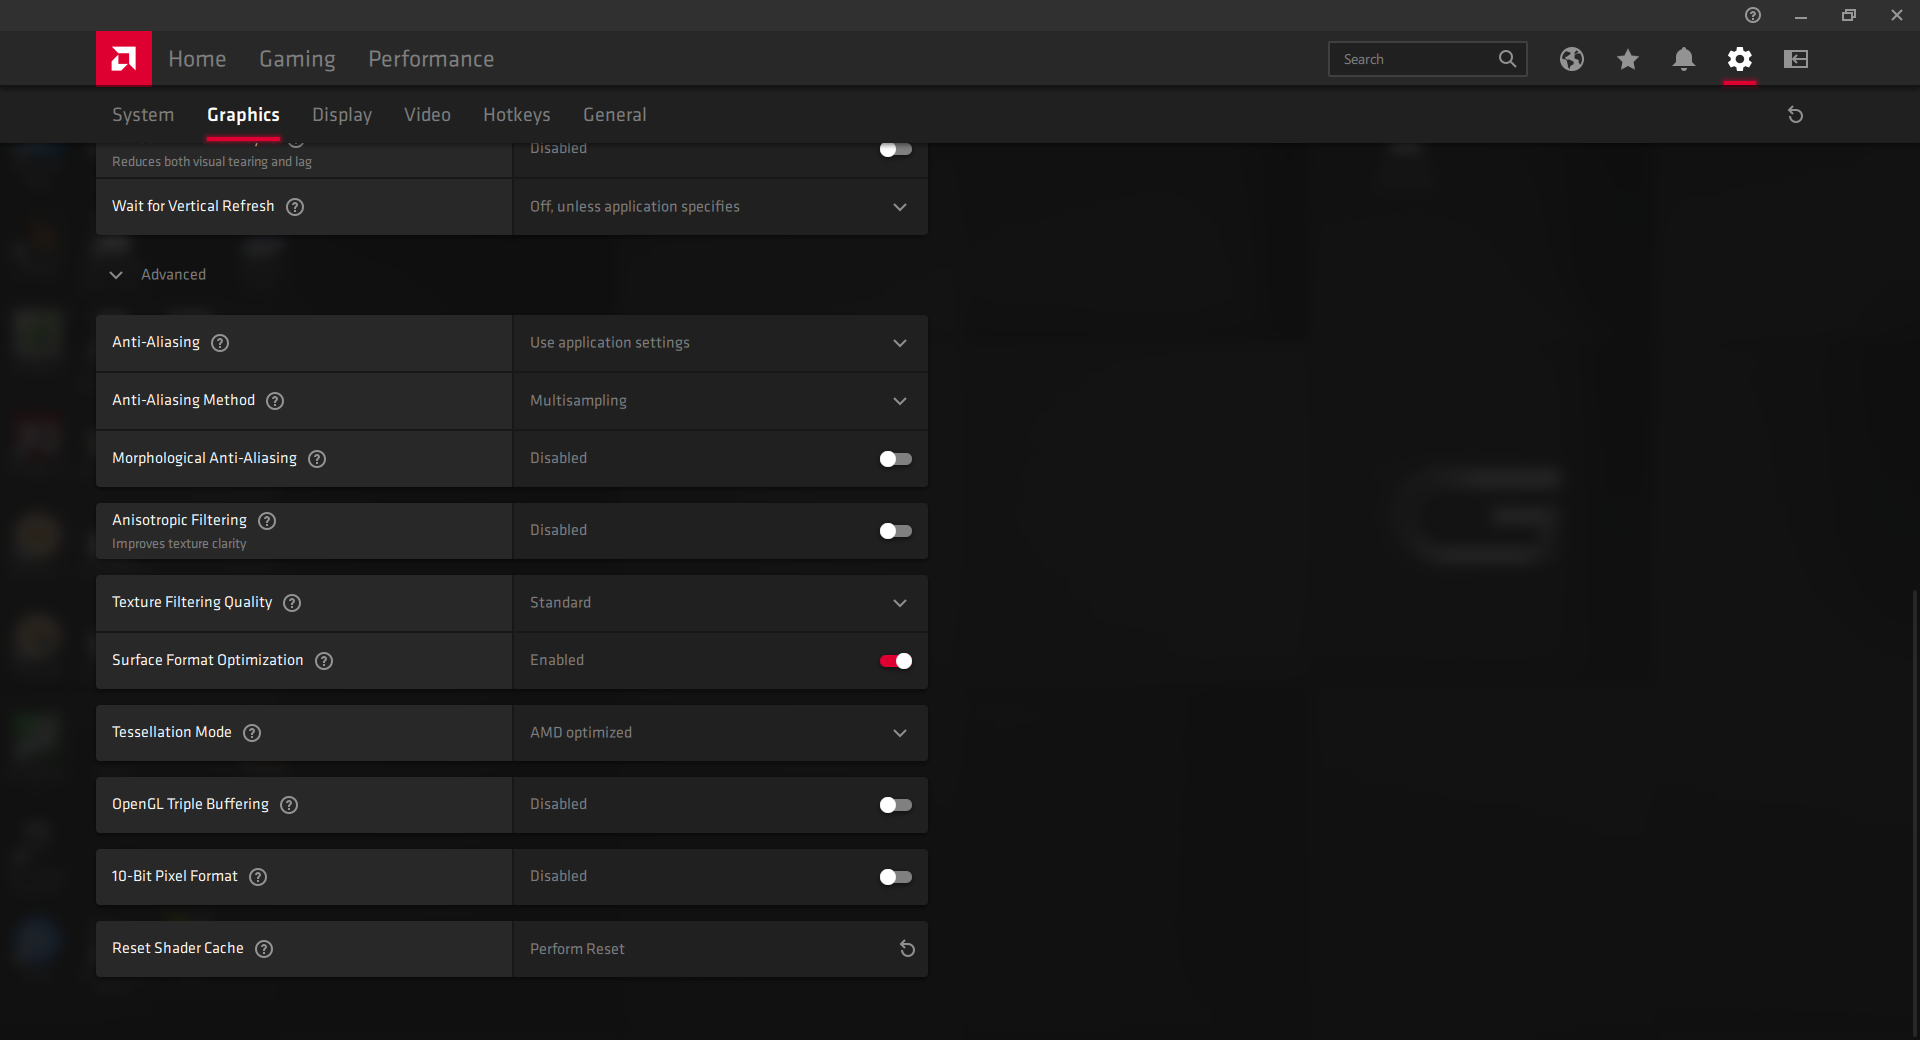
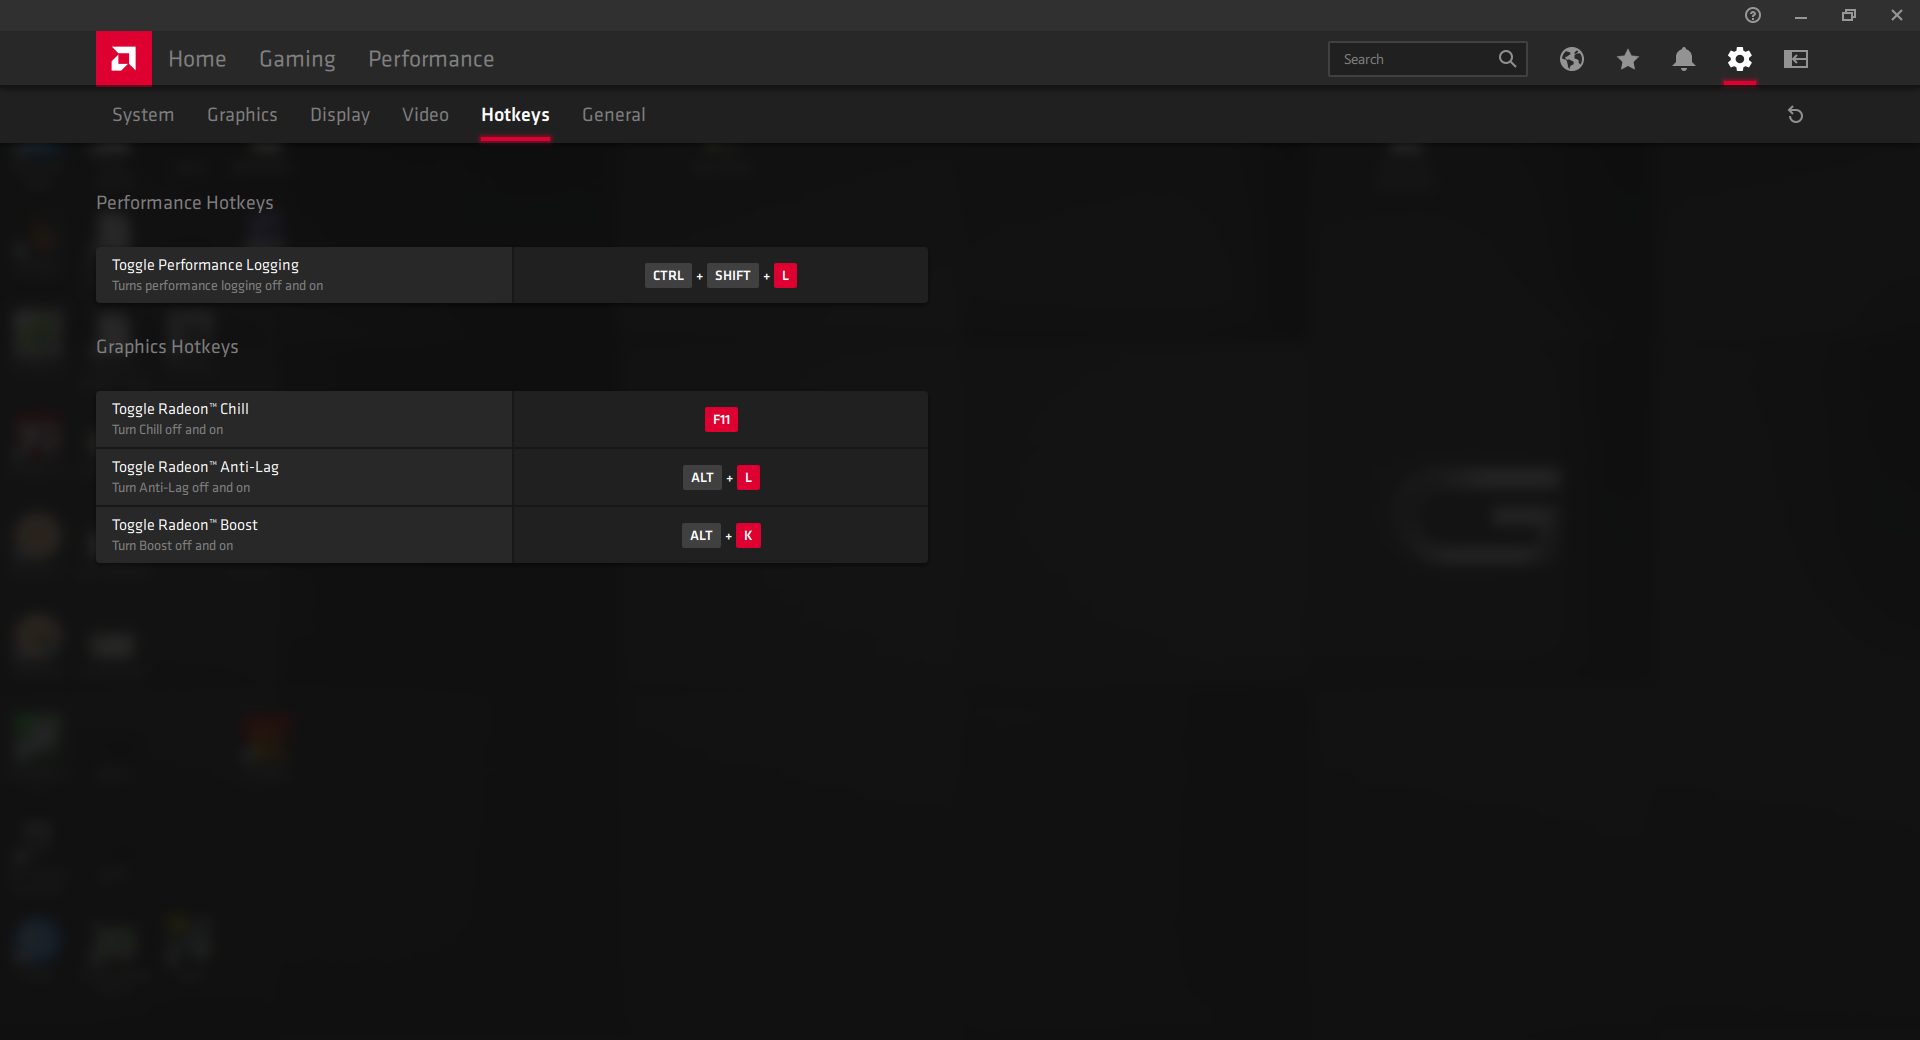
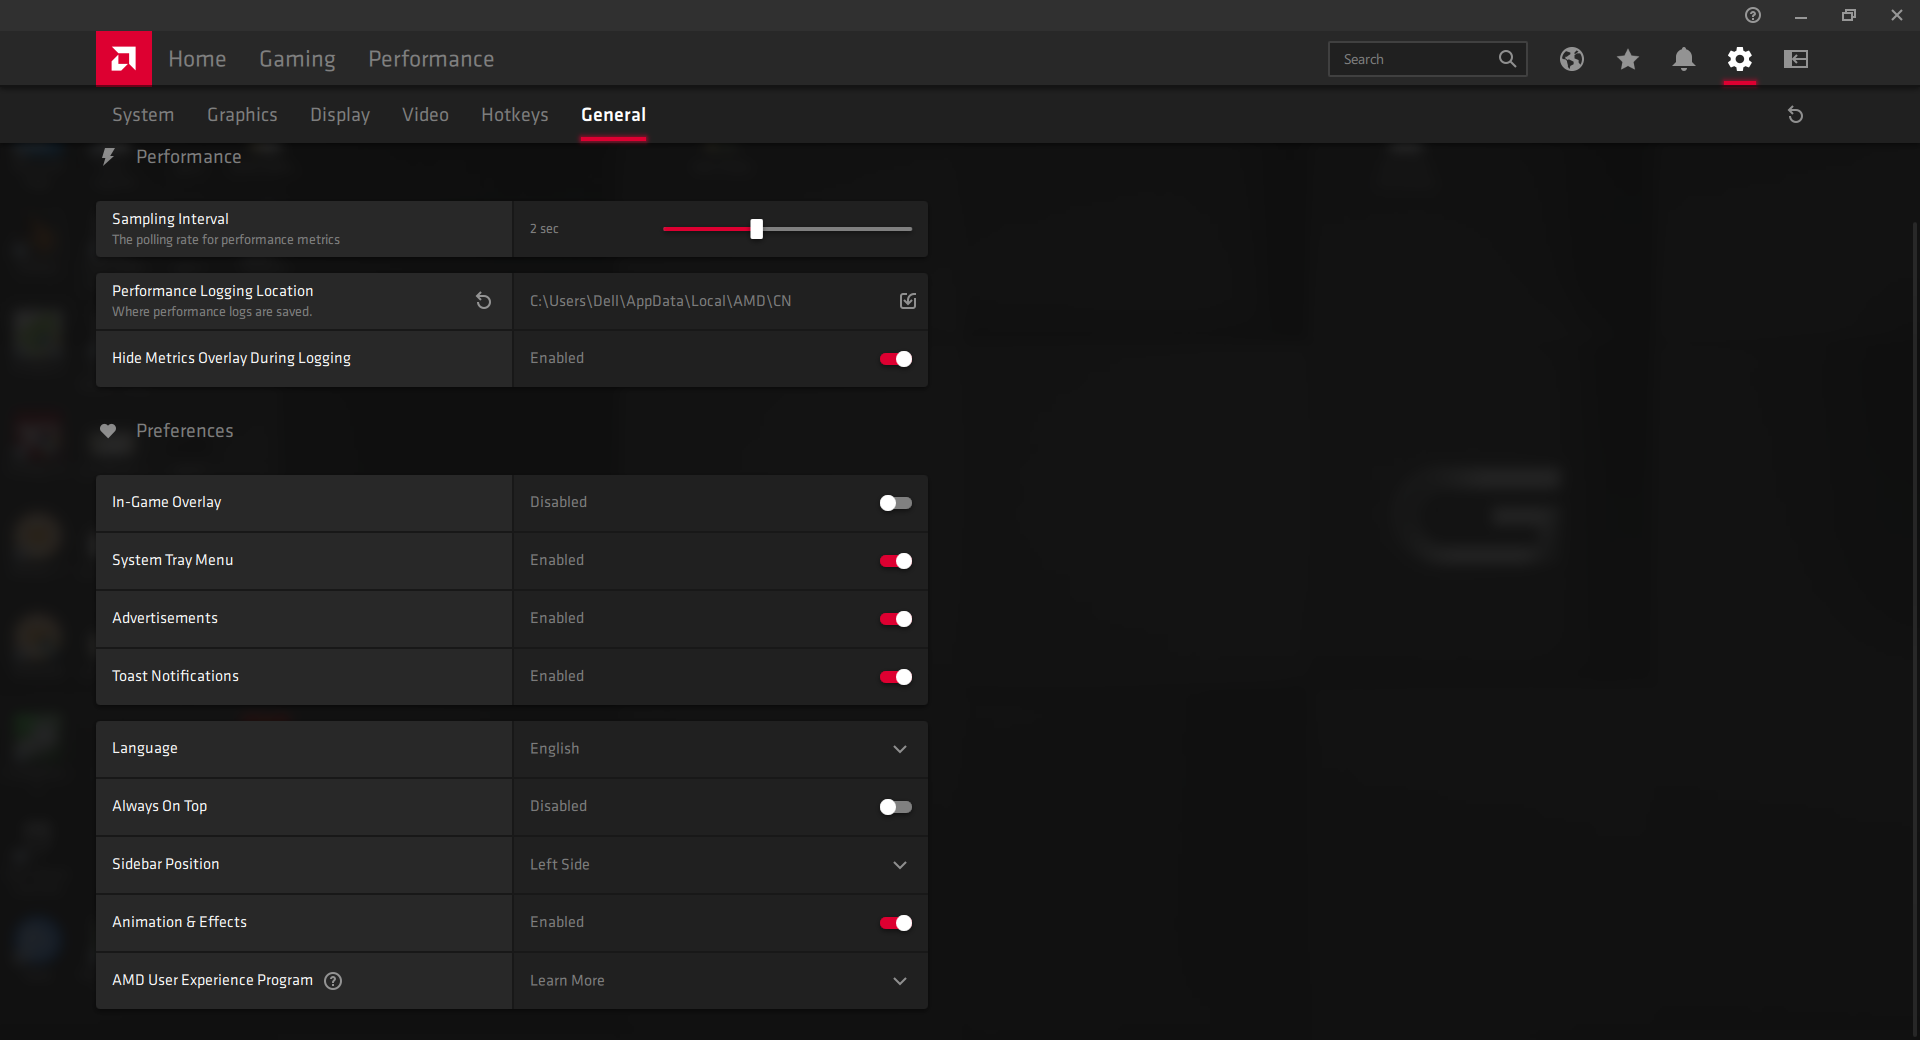
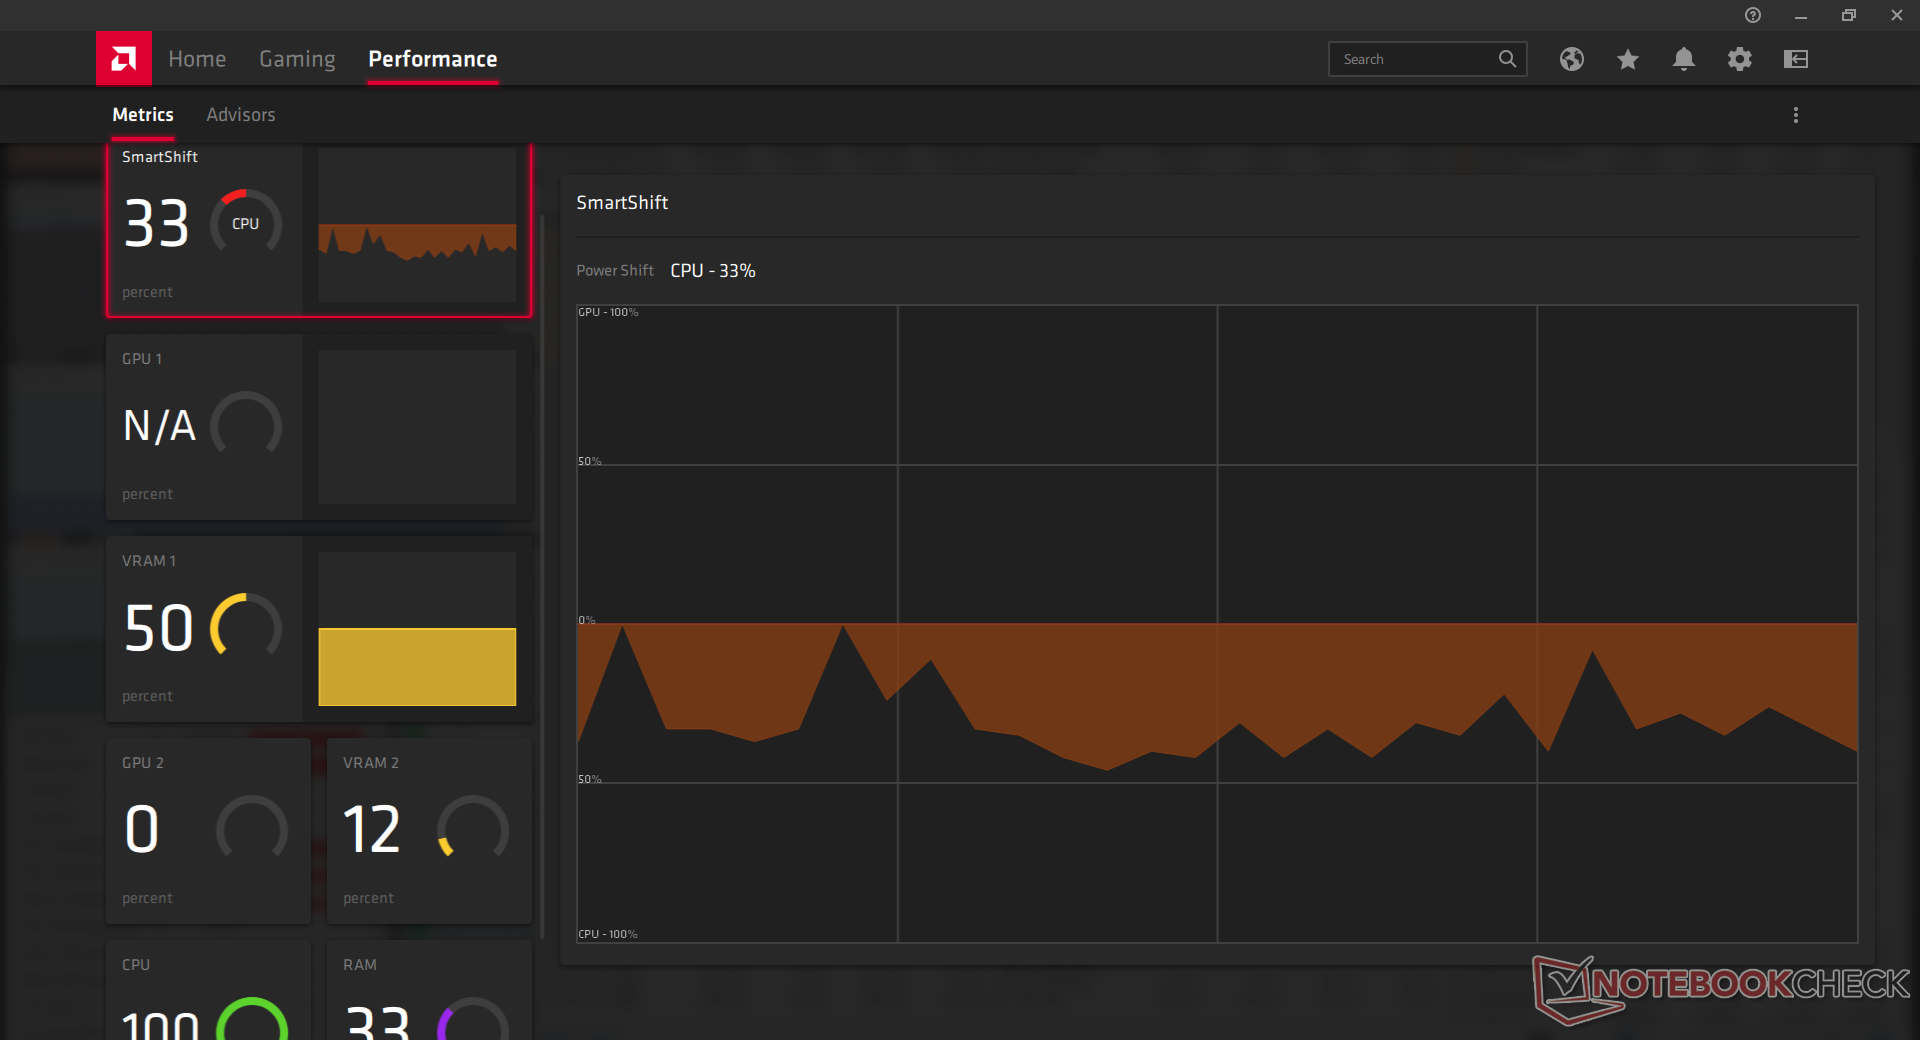
Şu anda tüm SKU'lar Zen 2 hexa çekirdekli Ryzen 5 4600H veya okta çekirdekli Ryzen 7 4800H ile birlikte gelir. Her ikisi de en son 10. nesil Intel Core i7 CPU'larla doğrudan rekabet ediyor ve son nesil AMD oyun dizüstü bilgisayarlarında bulunan Zen dört çekirdekli Ryzen 5 3550H veya Ryzen 7 3750H'ye göre muazzam bir gelişme. AMD SmartShift her zaman aktiftir ve değiştirilemez veya kapalı. Radeon Anti-Lag, Chill, Boost, Vari-Bright, vsync ve diğerleri de dahil olmak üzere önemli özellikler arasında geçiş yapılabileceğinden, sahiplerin yenilenen Radeon yazılımına aşina olmalarını öneririz.
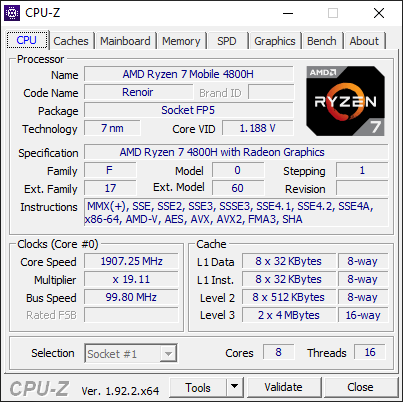
İşlemci
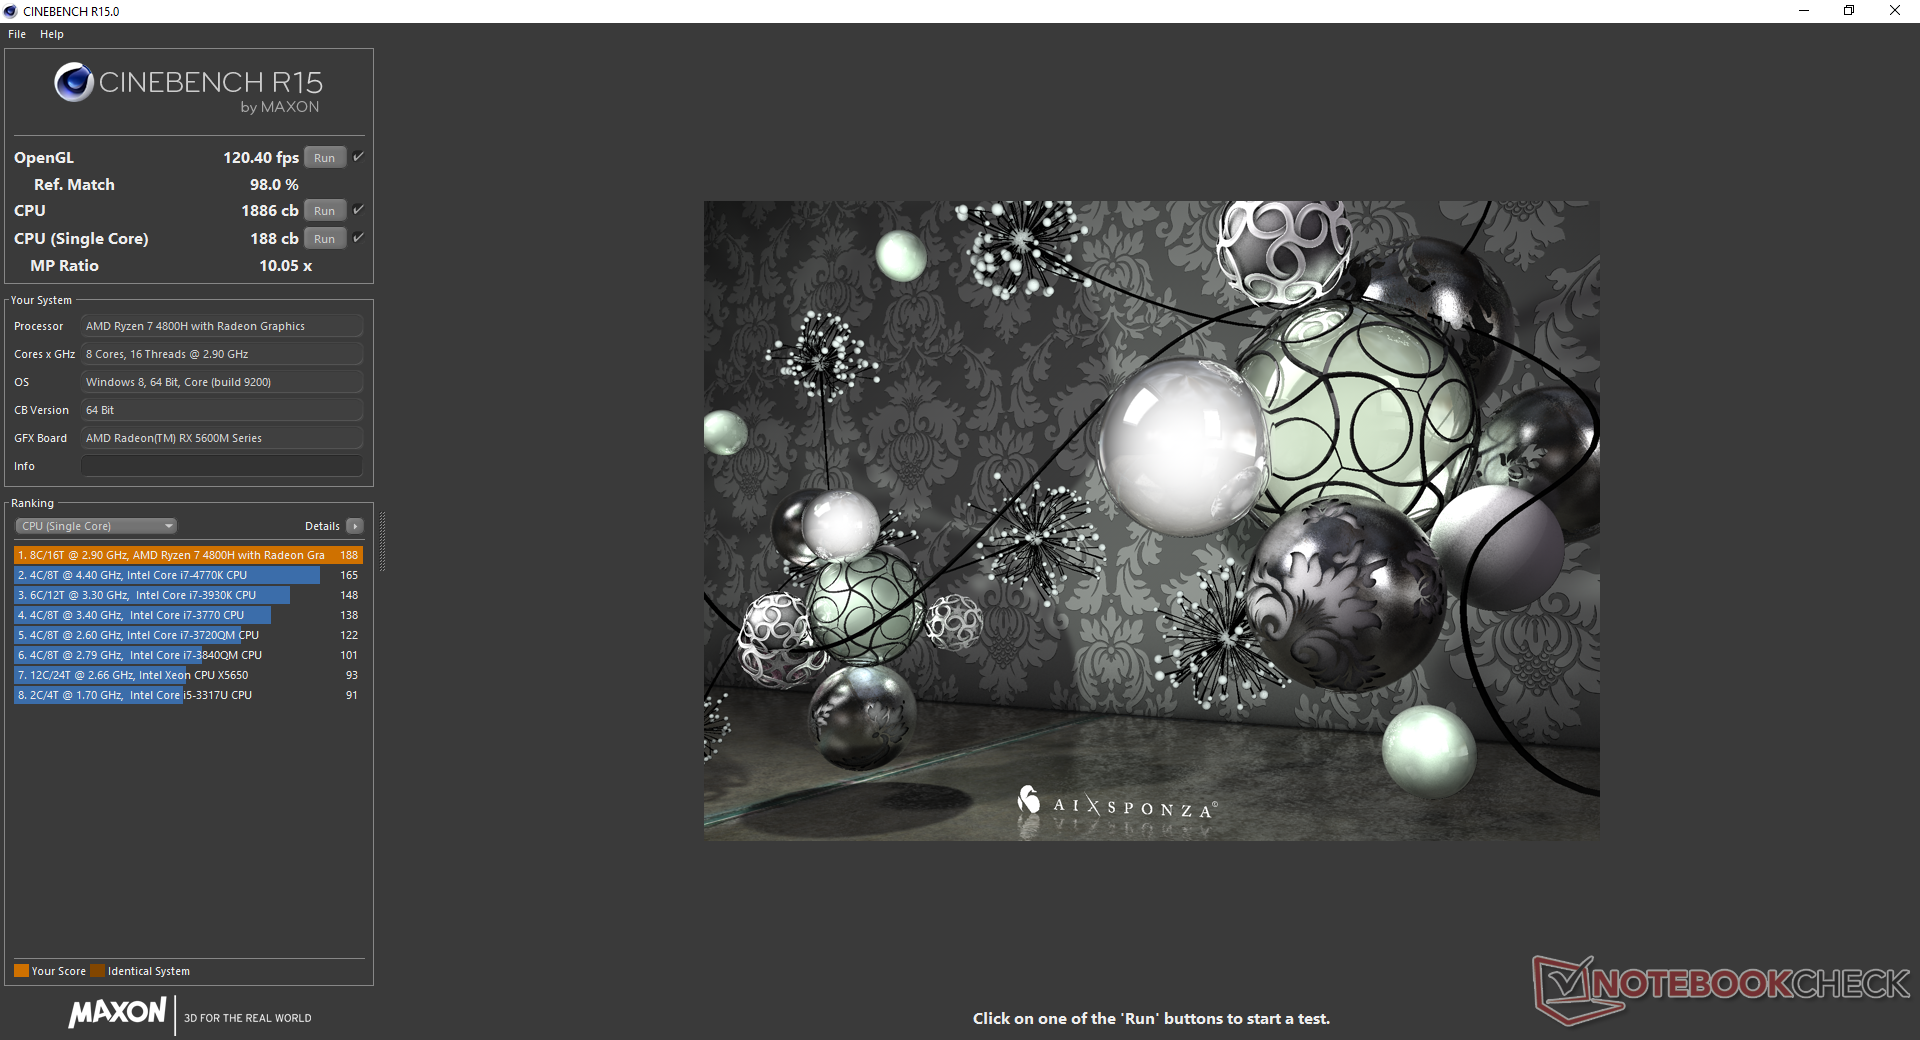
SmartShift'in etkin olması, Dell'in aniden alabileceğiniz en hızlı Ryzen 7 4800H ile donatıldığı anlamına gelmez. Örneğin Eluktronics RP-15, azaltmayı hesapladıktan sonra aynı CPU ile yaklaşık yüzde 7 daha hızlı çalışabilir. Zaman içindeki performans, aşağıdaki CineBench R15 Multi-Thread döngü testimizde gösterildiği gibi Asus TUF A15'te gözlemlediğimizden daha istikrarlı ve daha tutarlıdır. Ryzen 5 4600H seçeneğinden yükseltme, kullanıcılara yaklaşık yüzde 36 daha hızlı çok iş parçacığı performansı sağlayacaktır. Ham işlemci performansı, çok iş parçacıklı 10'uncu çekirdek i9-10980HK'yı bile çok az iş parçacığında biraz daha geride bırakarak inanılmaz derecede hızlı olmaya devam ediyor iş parçacıklı görevler. Bu özel Intel CPU genellikle yüzlerce dolara mal olan daha pahalı dizüstü bilgisayarlarda bulunur. İlginç bir şekilde, CineBench R15 döngü testimizdeki performans, 1800 nokta aralığına gelmeden önce yaklaşık 1560 noktaya düşecektir. Başlangıçta bir fluke olduğundan şüphelendik ve bu yüzden testi sadece ikinci kez benzer bir burun bulması için yeniden düzenliyoruz. İşlemci aşırı seviyelere gerildiğinde hafif bir performans hatası olabilir. Daha fazla teknik bilgi ve karşılaştırma karşılaştırmaları için Ryzen 7 4800H'deki özel sayfamıza bakın.
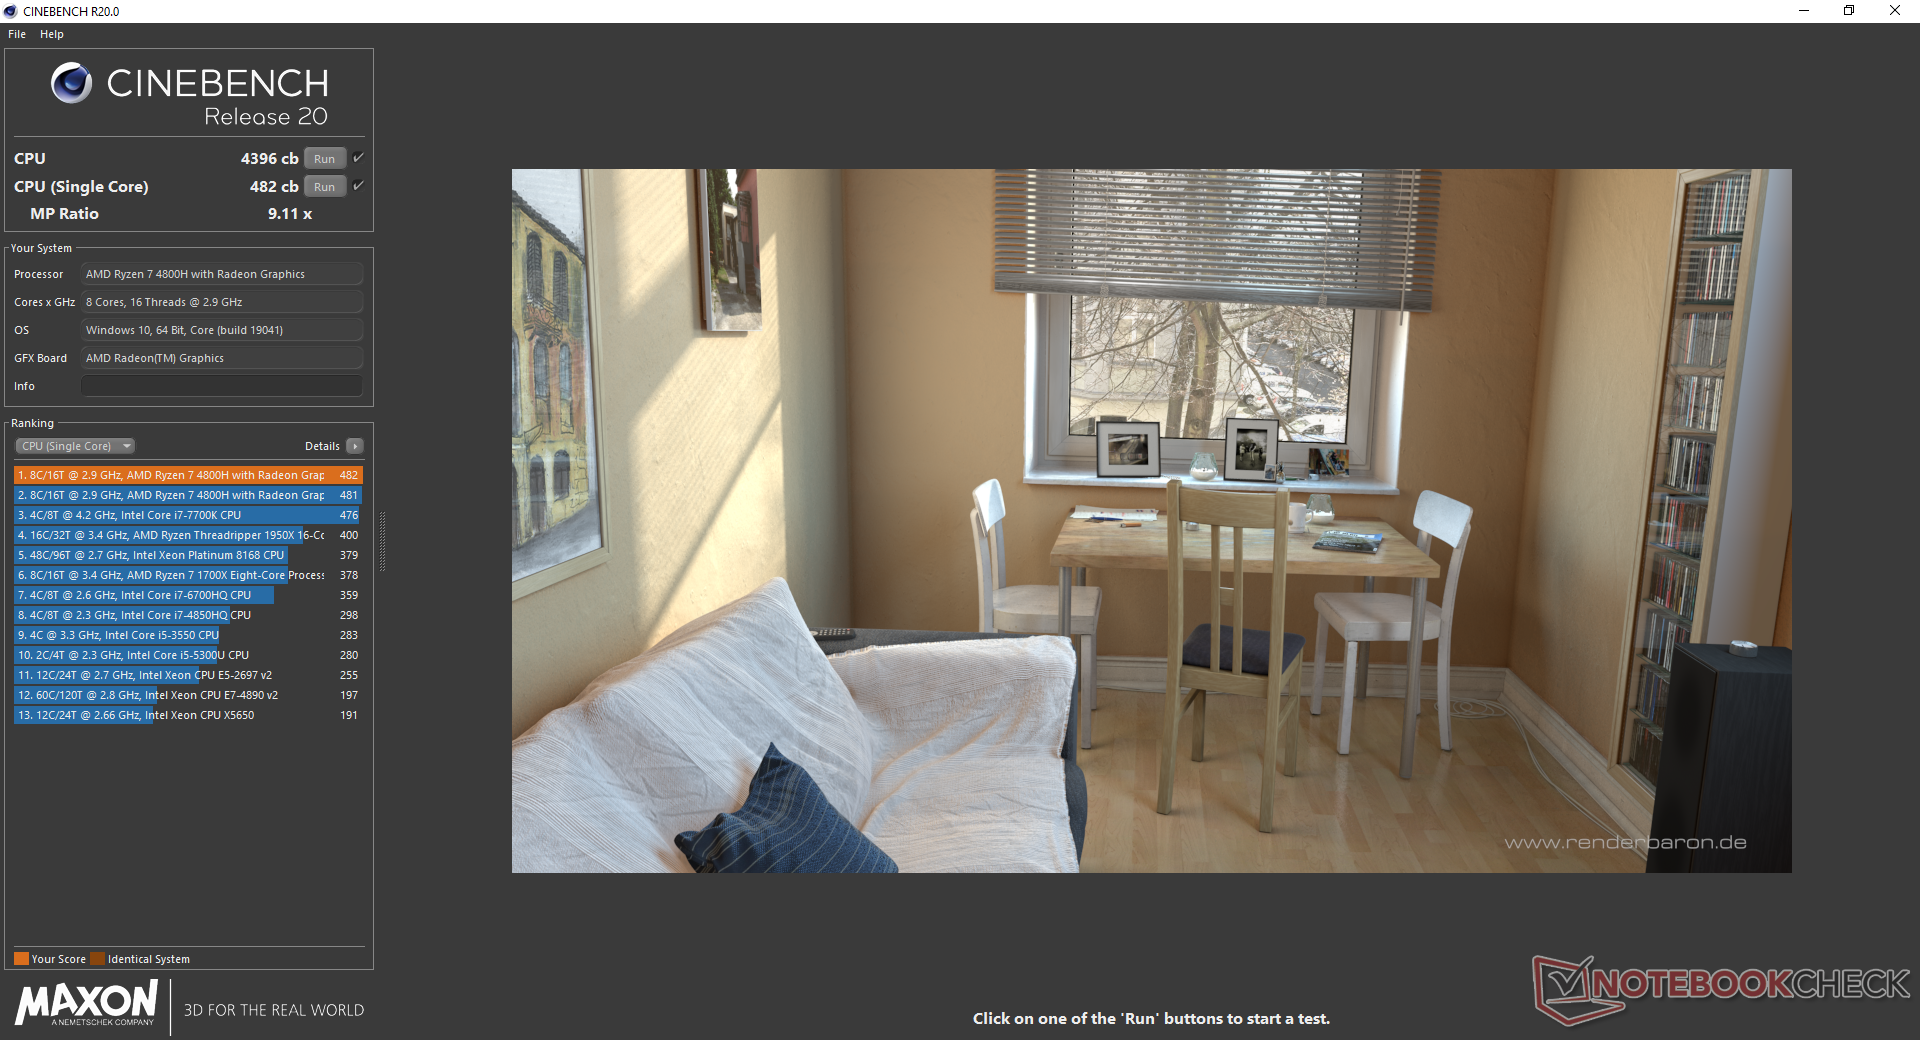
Cinebench R15: CPU Multi 64Bit | CPU Single 64Bit
Blender: v2.79 BMW27 CPU
7-Zip 18.03: 7z b 4 -mmt1 | 7z b 4
Geekbench 5.5: Single-Core | Multi-Core
HWBOT x265 Benchmark v2.2: 4k Preset
LibreOffice : 20 Documents To PDF
R Benchmark 2.5: Overall mean
| Cinebench R20 / CPU (Multi Core) | |
| AMD Radeon RX Vega 64 | |
| Eurocom Sky X4C i9-9900KS | |
| Dell G5 15 SE 5505 P89F | |
| Asus Zephyrus G14 GA401IV | |
| Ortalama AMD Ryzen 7 4800H (3692 - 4663, n=18) | |
| MSI GE66 Raider 10SFS | |
| Gigabyte Aero 15 OLED XB-8DE51B0SP | |
| MSI GE65 Raider 9SF-049US | |
| Dell XPS 15 9500 Core i7 4K UHD | |
| Acer Nitro 5 AN515-44-R5FT | |
| Schenker XMG Fusion 15 XFU15L19 | |
| MSI GE63 Raider 8SG | |
| MSI Alpha 15 A3DDK-034 | |
| Cinebench R20 / CPU (Single Core) | |
| Gigabyte Aero 15 OLED XB-8DE51B0SP | |
| Eurocom Sky X4C i9-9900KS | |
| AMD Radeon RX Vega 64 | |
| Asus Zephyrus G14 GA401IV | |
| Dell XPS 15 9500 Core i7 4K UHD | |
| Dell G5 15 SE 5505 P89F | |
| Ortalama AMD Ryzen 7 4800H (462 - 491, n=17) | |
| MSI GE66 Raider 10SFS | |
| MSI GE65 Raider 9SF-049US | |
| Schenker XMG Fusion 15 XFU15L19 | |
| Acer Nitro 5 AN515-44-R5FT | |
| MSI GE63 Raider 8SG | |
| MSI Alpha 15 A3DDK-034 | |
| Cinebench R15 / CPU Multi 64Bit | |
| AMD Radeon RX Vega 64 | |
| Dell G5 15 SE 5505 P89F | |
| Eurocom Sky X4C i9-9900KS | |
| Asus Zephyrus G14 GA401IV | |
| Ortalama AMD Ryzen 7 4800H (1652 - 1995, n=21) | |
| Gigabyte Aero 15 OLED XB-8DE51B0SP | |
| MSI GE66 Raider 10SFS | |
| MSI GE65 Raider 9SF-049US | |
| Acer Nitro 5 AN515-44-R5FT | |
| Dell XPS 15 9500 Core i7 4K UHD | |
| Schenker XMG Fusion 15 XFU15L19 | |
| MSI GE63 Raider 8SG | |
| MSI Alpha 15 A3DDK-034 | |
| Cinebench R15 / CPU Single 64Bit | |
| Eurocom Sky X4C i9-9900KS | |
| Gigabyte Aero 15 OLED XB-8DE51B0SP | |
| MSI GE66 Raider 10SFS | |
| AMD Radeon RX Vega 64 | |
| Dell XPS 15 9500 Core i7 4K UHD | |
| MSI GE65 Raider 9SF-049US | |
| Asus Zephyrus G14 GA401IV | |
| Dell G5 15 SE 5505 P89F | |
| Ortalama AMD Ryzen 7 4800H (186 - 191, n=15) | |
| Schenker XMG Fusion 15 XFU15L19 | |
| Acer Nitro 5 AN515-44-R5FT | |
| MSI GE63 Raider 8SG | |
| MSI Alpha 15 A3DDK-034 | |
| Blender / v2.79 BMW27 CPU | |
| Schenker XMG Fusion 15 XFU15L19 | |
| Dell XPS 15 9500 Core i7 4K UHD | |
| Acer Nitro 5 AN515-44-R5FT | |
| Asus Zephyrus G14 GA401IV | |
| Gigabyte Aero 15 OLED XB-8DE51B0SP | |
| MSI GE66 Raider 10SFS | |
| Dell G5 15 SE 5505 P89F | |
| Ortalama AMD Ryzen 7 4800H (248 - 299, n=15) | |
| Eurocom Sky X4C i9-9900KS | |
| AMD Radeon RX Vega 64 | |
| 7-Zip 18.03 / 7z b 4 -mmt1 | |
| Eurocom Sky X4C i9-9900KS | |
| MSI GE66 Raider 10SFS | |
| Gigabyte Aero 15 OLED XB-8DE51B0SP | |
| Dell XPS 15 9500 Core i7 4K UHD | |
| AMD Radeon RX Vega 64 | |
| Schenker XMG Fusion 15 XFU15L19 | |
| Ortalama AMD Ryzen 7 4800H (4575 - 4743, n=15) | |
| Dell G5 15 SE 5505 P89F | |
| Asus Zephyrus G14 GA401IV | |
| Acer Nitro 5 AN515-44-R5FT | |
| 7-Zip 18.03 / 7z b 4 | |
| AMD Radeon RX Vega 64 | |
| Eurocom Sky X4C i9-9900KS | |
| Ortalama AMD Ryzen 7 4800H (44827 - 53883, n=15) | |
| Dell G5 15 SE 5505 P89F | |
| Asus Zephyrus G14 GA401IV | |
| Gigabyte Aero 15 OLED XB-8DE51B0SP | |
| MSI GE66 Raider 10SFS | |
| Acer Nitro 5 AN515-44-R5FT | |
| Dell XPS 15 9500 Core i7 4K UHD | |
| Schenker XMG Fusion 15 XFU15L19 | |
| Geekbench 5.5 / Single-Core | |
| Eurocom Sky X4C i9-9900KS | |
| MSI GE66 Raider 10SFS | |
| Gigabyte Aero 15 OLED XB-8DE51B0SP | |
| Dell XPS 15 9500 Core i7 4K UHD | |
| AMD Radeon RX Vega 64 | |
| Schenker XMG Fusion 15 XFU15L19 | |
| Asus Zephyrus G14 GA401IV | |
| Ortalama AMD Ryzen 7 4800H (1154 - 1207, n=17) | |
| Dell G5 15 SE 5505 P89F | |
| Acer Nitro 5 AN515-44-R5FT | |
| MSI Alpha 15 A3DDK-034 | |
| Geekbench 5.5 / Multi-Core | |
| Eurocom Sky X4C i9-9900KS | |
| AMD Radeon RX Vega 64 | |
| MSI GE66 Raider 10SFS | |
| Gigabyte Aero 15 OLED XB-8DE51B0SP | |
| Dell XPS 15 9500 Core i7 4K UHD | |
| Dell G5 15 SE 5505 P89F | |
| Ortalama AMD Ryzen 7 4800H (5920 - 8672, n=17) | |
| Asus Zephyrus G14 GA401IV | |
| Schenker XMG Fusion 15 XFU15L19 | |
| Acer Nitro 5 AN515-44-R5FT | |
| MSI Alpha 15 A3DDK-034 | |
| HWBOT x265 Benchmark v2.2 / 4k Preset | |
| AMD Radeon RX Vega 64 | |
| Eurocom Sky X4C i9-9900KS | |
| Gigabyte Aero 15 OLED XB-8DE51B0SP | |
| MSI GE66 Raider 10SFS | |
| Dell G5 15 SE 5505 P89F | |
| Ortalama AMD Ryzen 7 4800H (10.8 - 14.1, n=16) | |
| Asus Zephyrus G14 GA401IV | |
| Schenker XMG Fusion 15 XFU15L19 | |
| Dell XPS 15 9500 Core i7 4K UHD | |
| Acer Nitro 5 AN515-44-R5FT | |
| LibreOffice / 20 Documents To PDF | |
| Dell G5 15 SE 5505 P89F | |
| Acer Nitro 5 AN515-44-R5FT | |
| Ortalama AMD Ryzen 7 4800H (28.6 - 95.8, n=14) | |
| Schenker XMG Fusion 15 XFU15L19 | |
| MSI GE66 Raider 10SFS | |
| Dell XPS 15 9500 Core i7 4K UHD | |
| Gigabyte Aero 15 OLED XB-8DE51B0SP | |
| R Benchmark 2.5 / Overall mean | |
| Acer Nitro 5 AN515-44-R5FT | |
| Schenker XMG Fusion 15 XFU15L19 | |
| Dell XPS 15 9500 Core i7 4K UHD | |
| Ortalama AMD Ryzen 7 4800H (0.562 - 0.603, n=15) | |
| Dell G5 15 SE 5505 P89F | |
| MSI GE66 Raider 10SFS | |
| Gigabyte Aero 15 OLED XB-8DE51B0SP | |
Cinebench R15: CPU Multi 64Bit | CPU Single 64Bit
Blender: v2.79 BMW27 CPU
7-Zip 18.03: 7z b 4 -mmt1 | 7z b 4
Geekbench 5.5: Single-Core | Multi-Core
HWBOT x265 Benchmark v2.2: 4k Preset
LibreOffice : 20 Documents To PDF
R Benchmark 2.5: Overall mean
* ... daha küçük daha iyidir
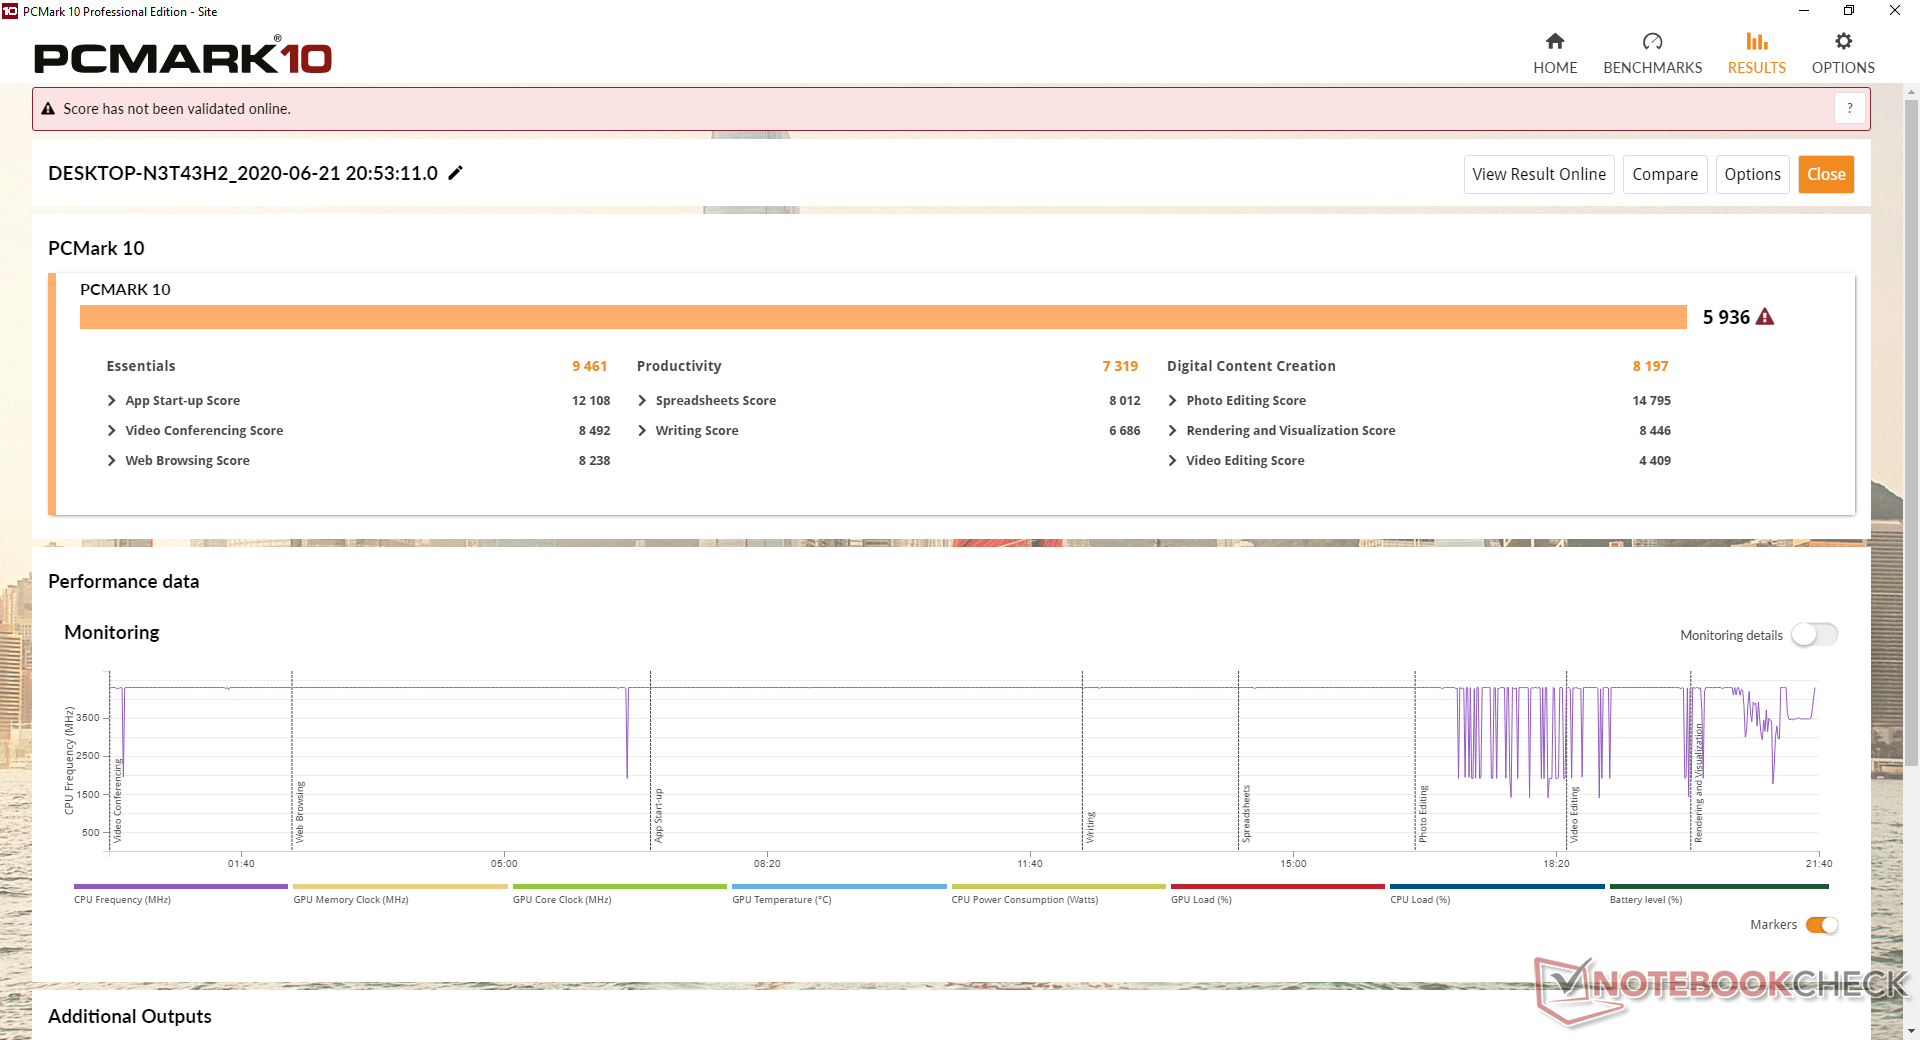
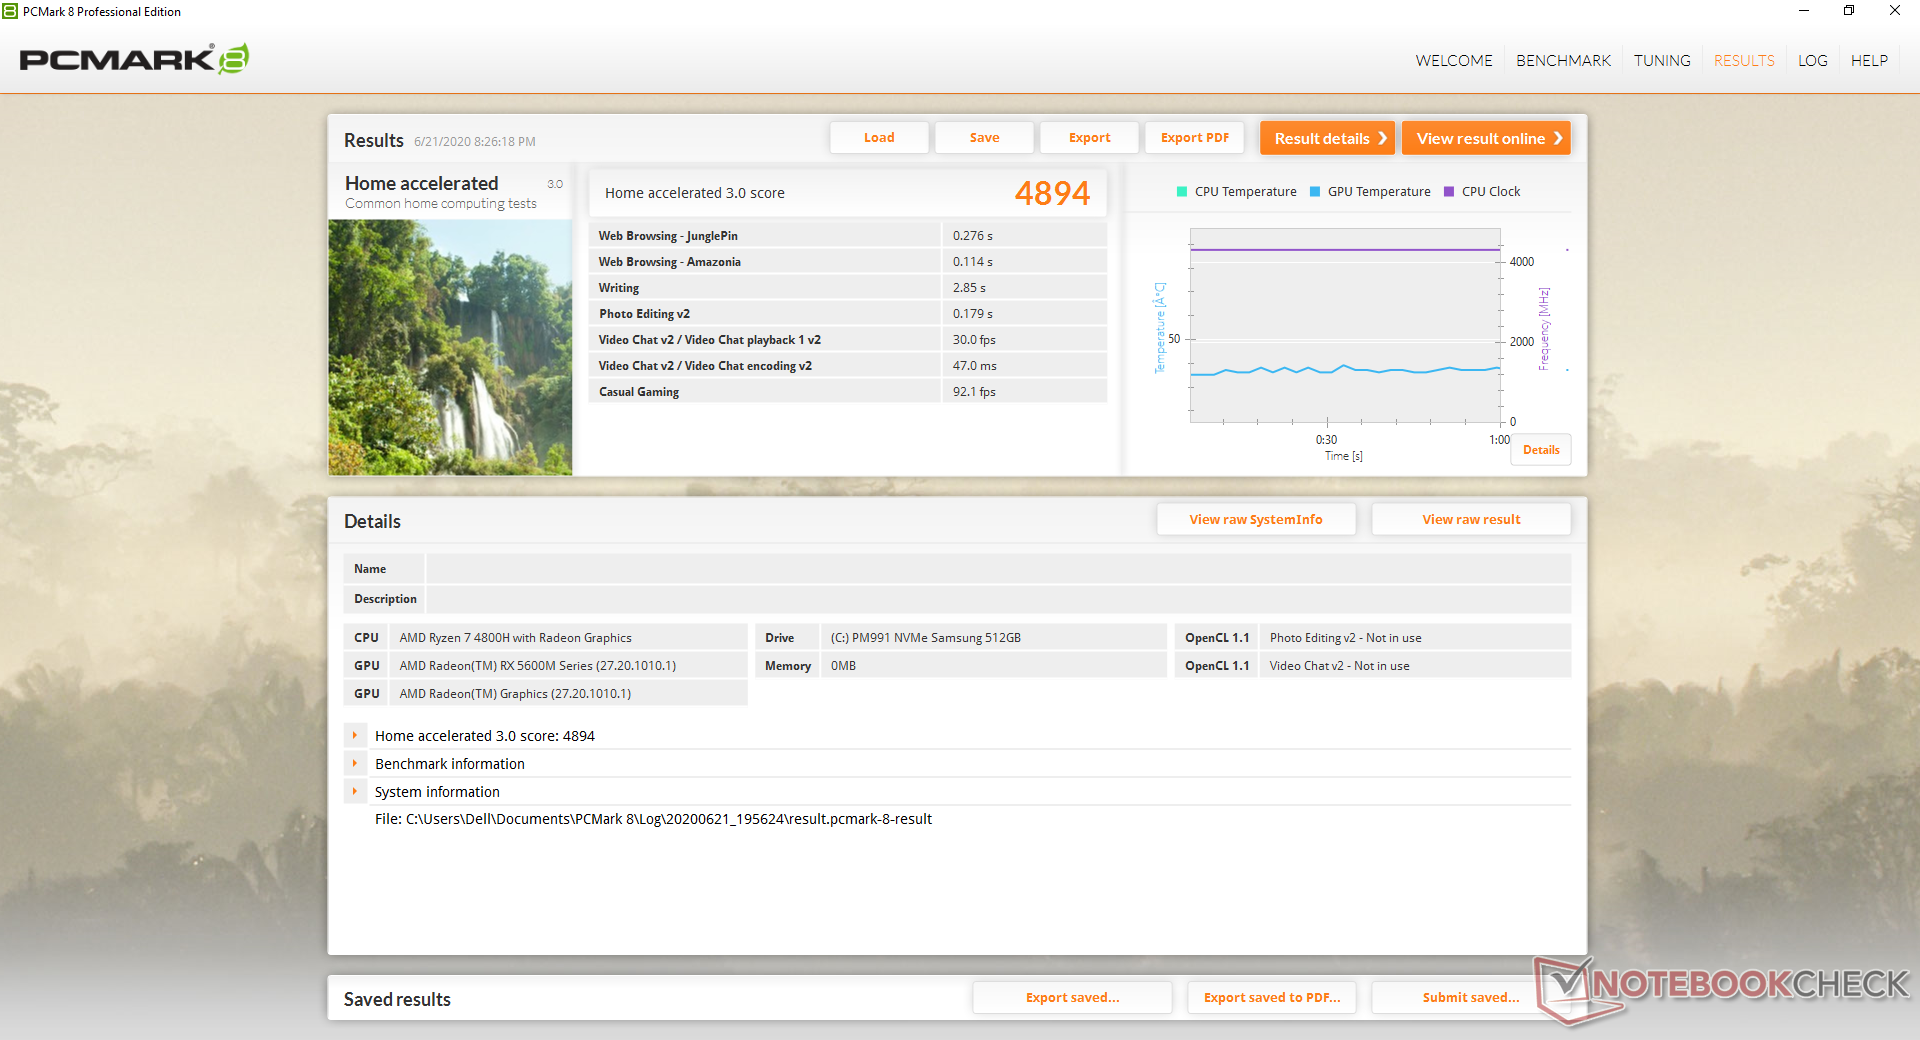
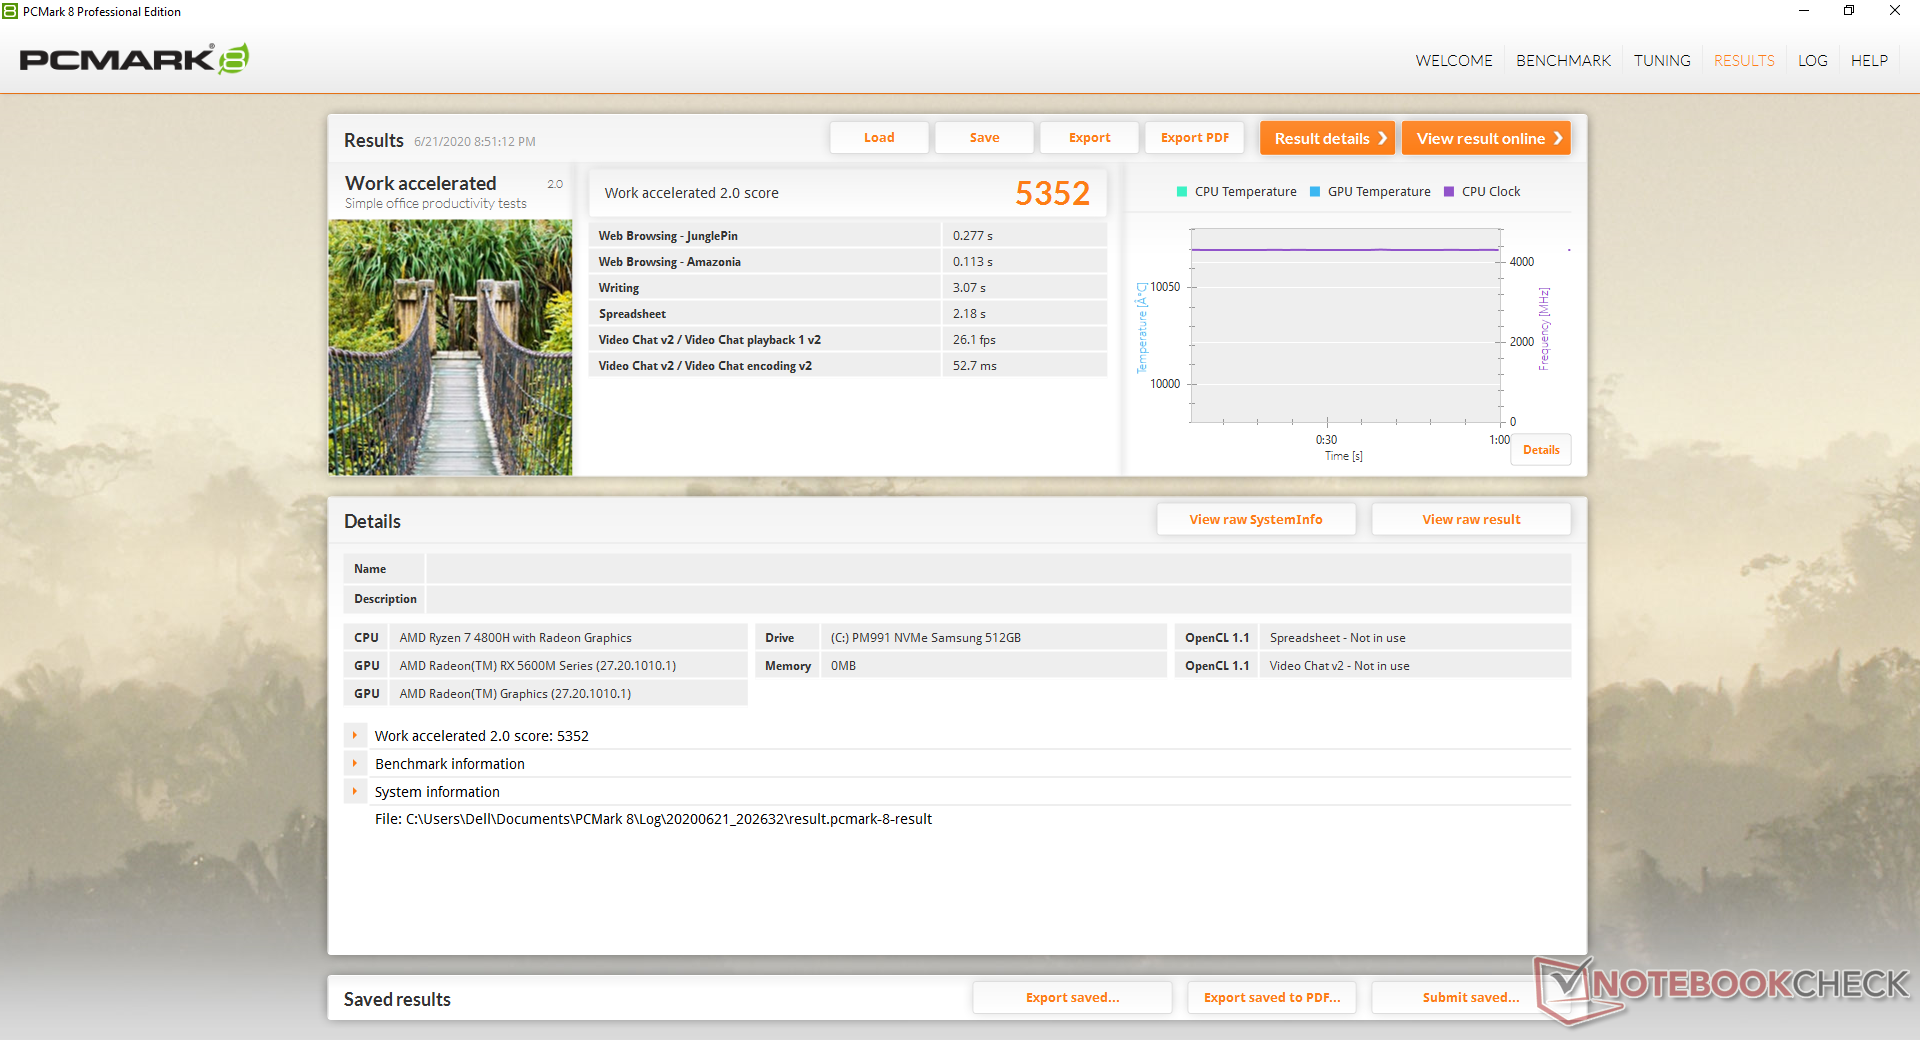
System Performance
PCMark results are neck-to-neck with other high-performance gaming laptops powered by Intel H-series CPUs and Turing GPUs. Most notably, scores are consistently ahead of last year's MSI Alpha 15 series which ran on last generation AMD hardware. We didn't experience any hardware or software issues during our time with the unit.
| PCMark 10 | |
| Score | |
| MSI GP65 10SFK-047US | |
| Lenovo Legion Y740-15ICHg | |
| Dell G5 15 SE 5505 P89F | |
| Dell G5 15 5590-P8RVW | |
| Asus TUF Gaming A15 FA506IV-HN172 | |
| HP Omen 15-dc1020ng | |
| MSI Alpha 15 A3DDK-034 | |
| Essentials | |
| MSI GP65 10SFK-047US | |
| Dell G5 15 SE 5505 P89F | |
| Lenovo Legion Y740-15ICHg | |
| Dell G5 15 5590-P8RVW | |
| Asus TUF Gaming A15 FA506IV-HN172 | |
| HP Omen 15-dc1020ng | |
| MSI Alpha 15 A3DDK-034 | |
| Productivity | |
| MSI GP65 10SFK-047US | |
| Lenovo Legion Y740-15ICHg | |
| Dell G5 15 SE 5505 P89F | |
| HP Omen 15-dc1020ng | |
| Asus TUF Gaming A15 FA506IV-HN172 | |
| Dell G5 15 5590-P8RVW | |
| MSI Alpha 15 A3DDK-034 | |
| Digital Content Creation | |
| Lenovo Legion Y740-15ICHg | |
| Dell G5 15 SE 5505 P89F | |
| MSI GP65 10SFK-047US | |
| Dell G5 15 5590-P8RVW | |
| Asus TUF Gaming A15 FA506IV-HN172 | |
| MSI Alpha 15 A3DDK-034 | |
| HP Omen 15-dc1020ng | |
| PCMark 8 | |
| Home Score Accelerated v2 | |
| Lenovo Legion Y740-15ICHg | |
| Dell G5 15 SE 5505 P89F | |
| Asus TUF Gaming A15 FA506IV-HN172 | |
| MSI GP65 10SFK-047US | |
| MSI Alpha 15 A3DDK-034 | |
| HP Omen 15-dc1020ng | |
| Work Score Accelerated v2 | |
| MSI GP65 10SFK-047US | |
| Lenovo Legion Y740-15ICHg | |
| Asus TUF Gaming A15 FA506IV-HN172 | |
| Dell G5 15 SE 5505 P89F | |
| HP Omen 15-dc1020ng | |
| MSI Alpha 15 A3DDK-034 | |
| PCMark 8 Home Score Accelerated v2 | 4894 puan | |
| PCMark 8 Work Score Accelerated v2 | 5352 puan | |
| PCMark 10 Score | 5936 puan | |
Yardım | ||
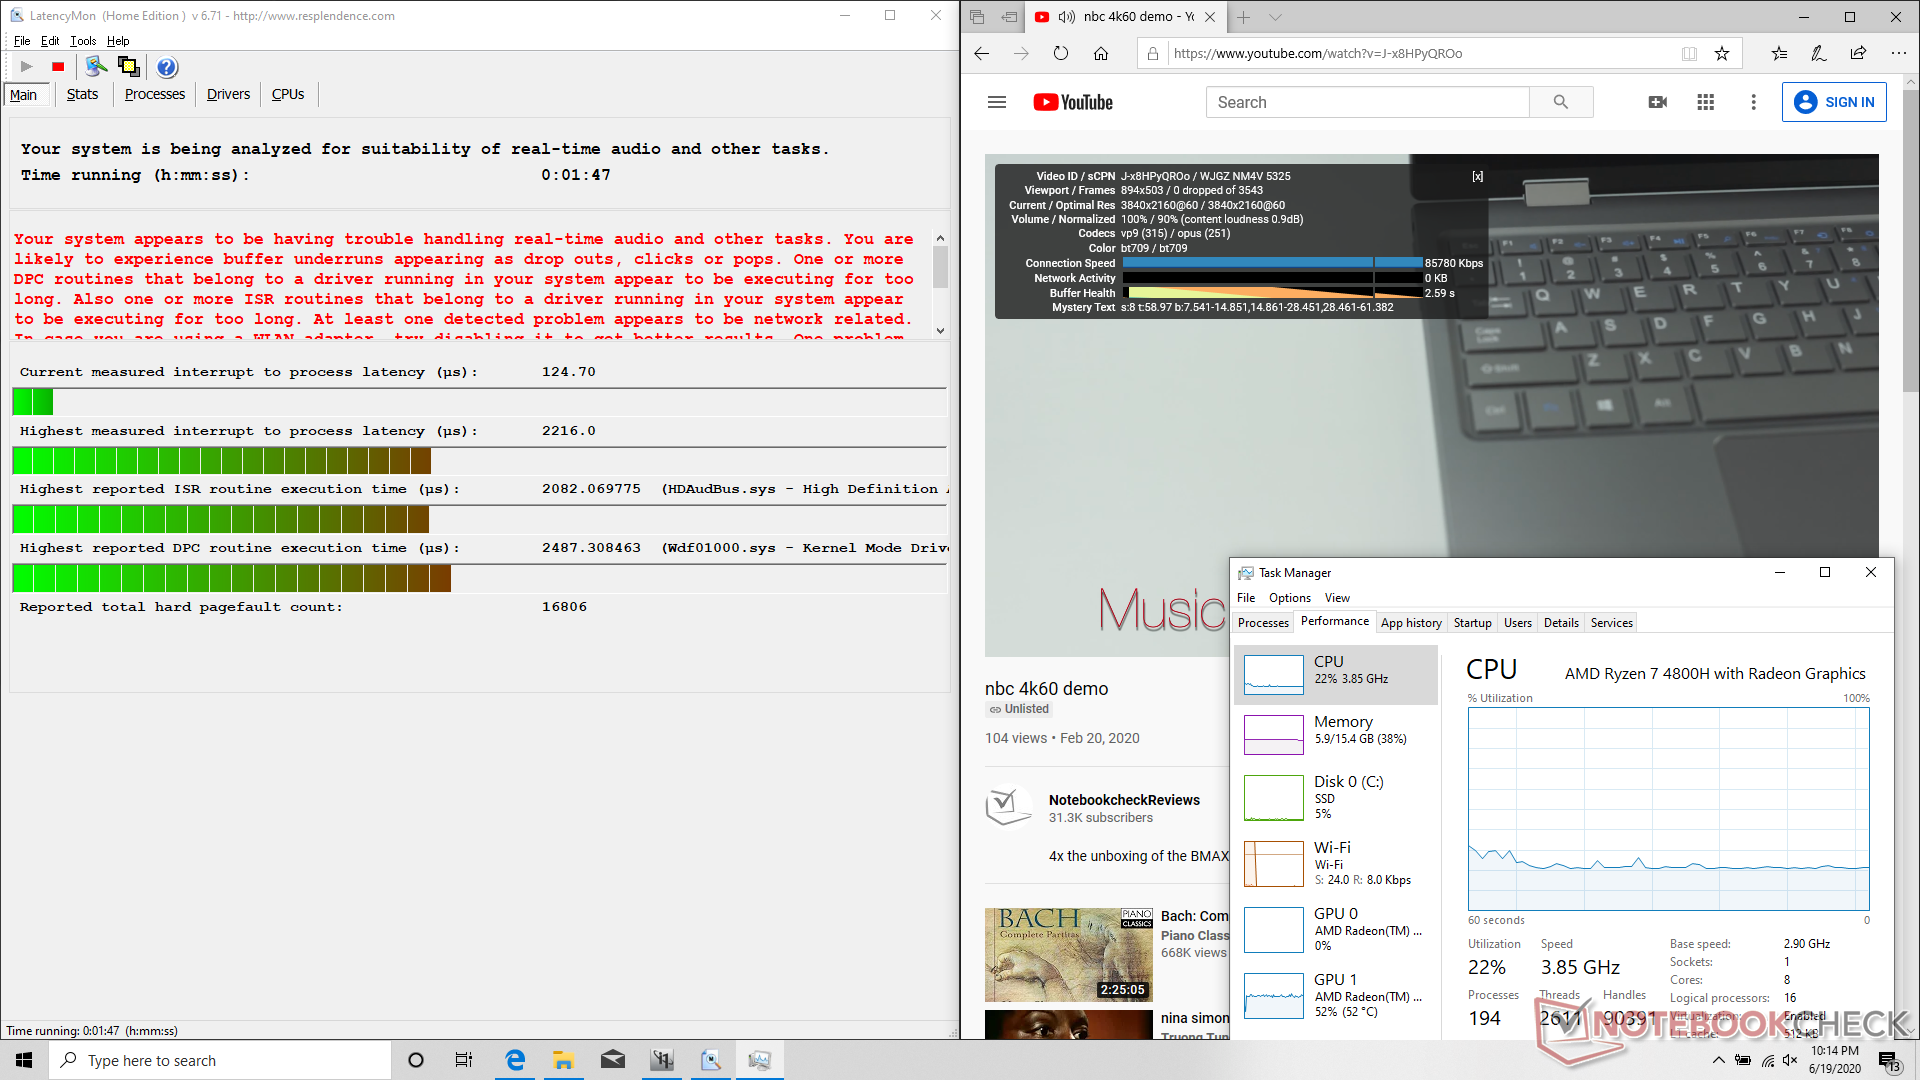
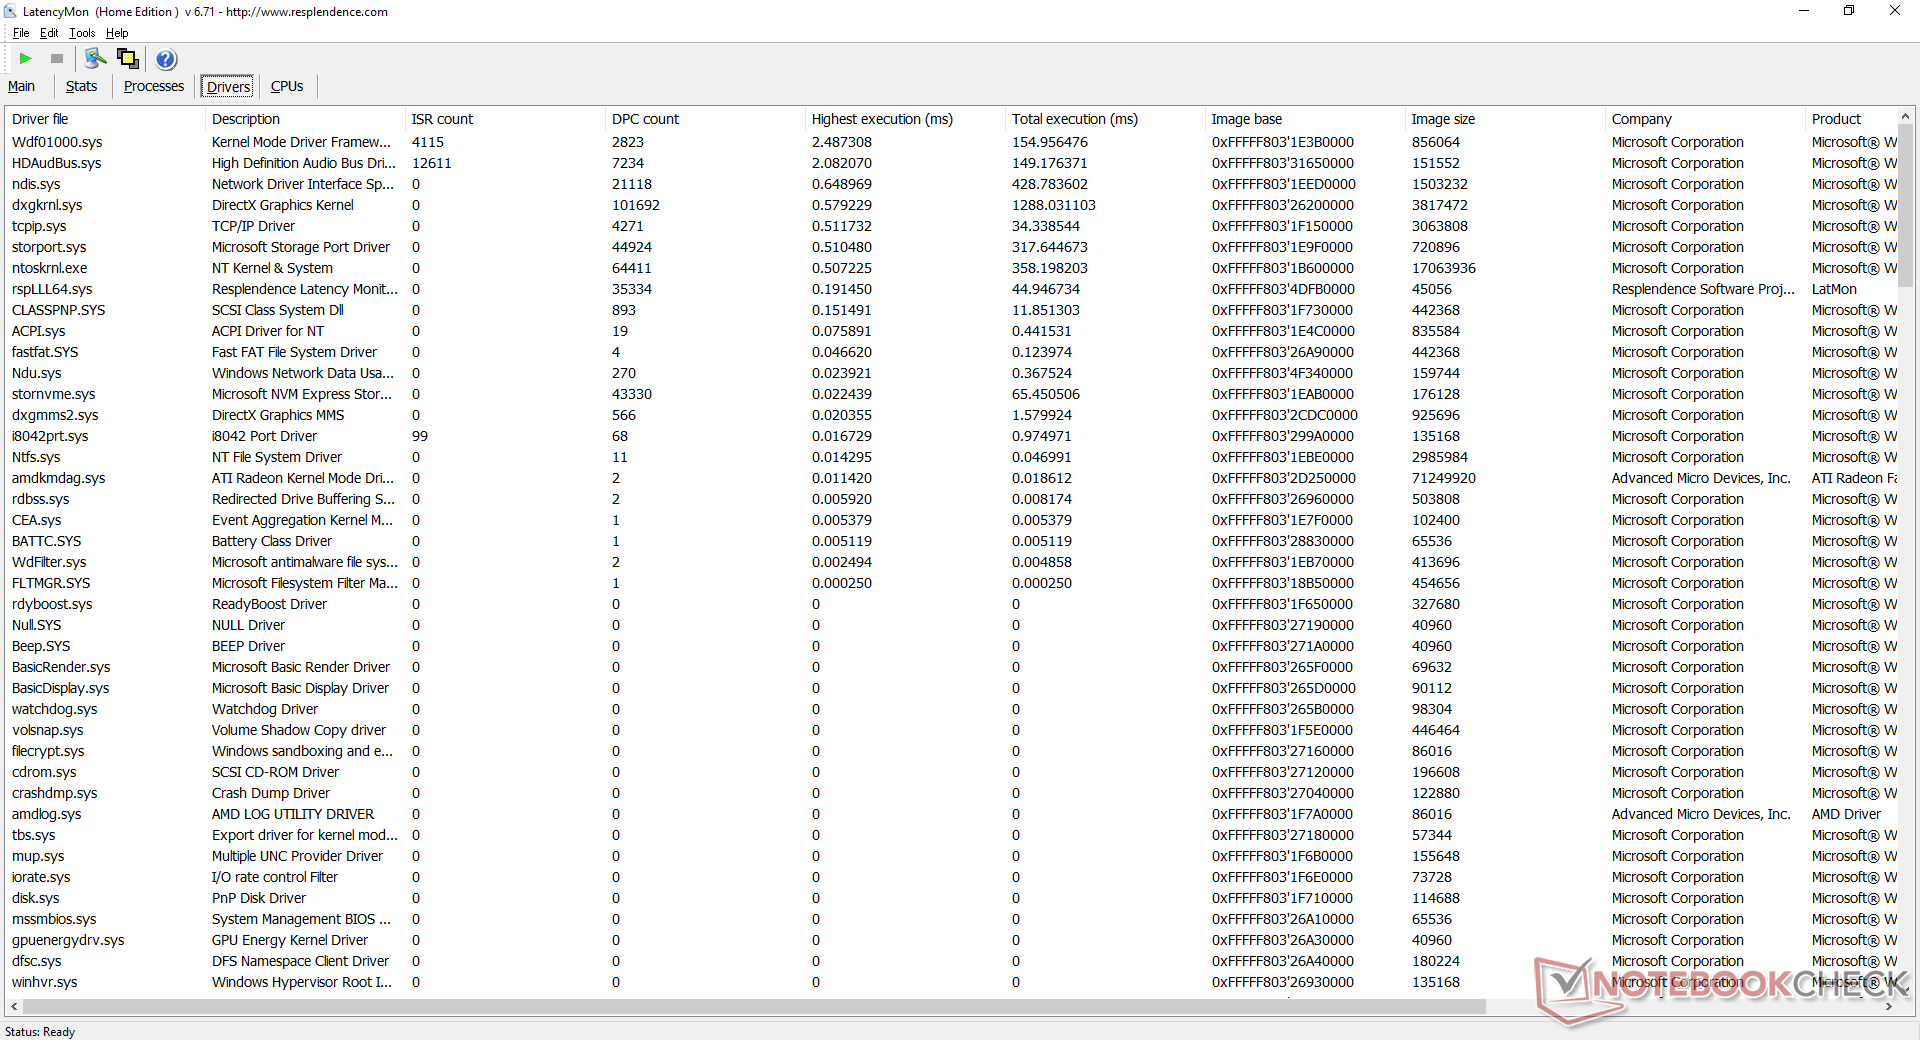
DPC Latency
LatencyMon shows DPC latency issues when opening multiple tabs on our homepage. 4K video playback on YouTube is otherwise smooth with no dropped frames.
| DPC Latencies / LatencyMon - interrupt to process latency (max), Web, Youtube, Prime95 | |
| Dell XPS 15 9500 Core i7 4K UHD | |
| HP Envy x360 15-dr1679cl | |
| Dell G5 15 SE 5505 P89F | |
| Gigabyte Aero 15 OLED XB-8DE51B0SP | |
| MSI GP65 10SFK-047US | |
| Acer Nitro 5 AN515-44-R5FT | |
| MSI GE66 Raider 10SFS | |
| Asus TUF Gaming A15 FA506IV-HN172 | |
* ... daha küçük daha iyidir
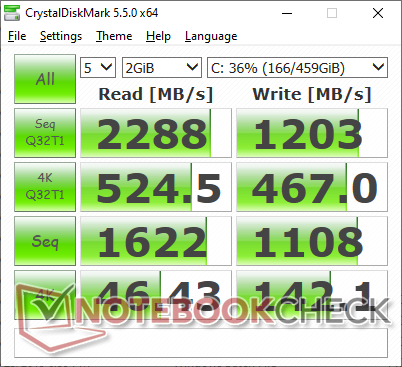
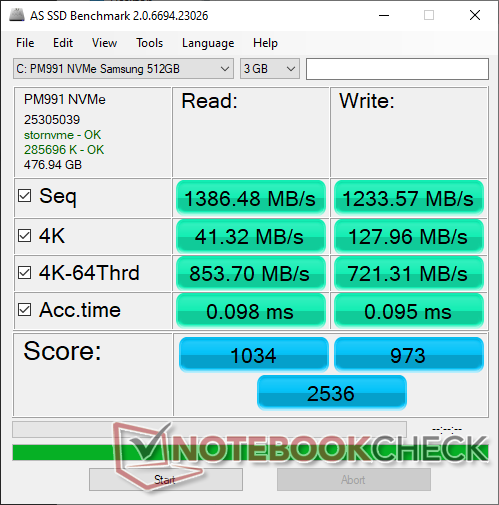
Storage Devices
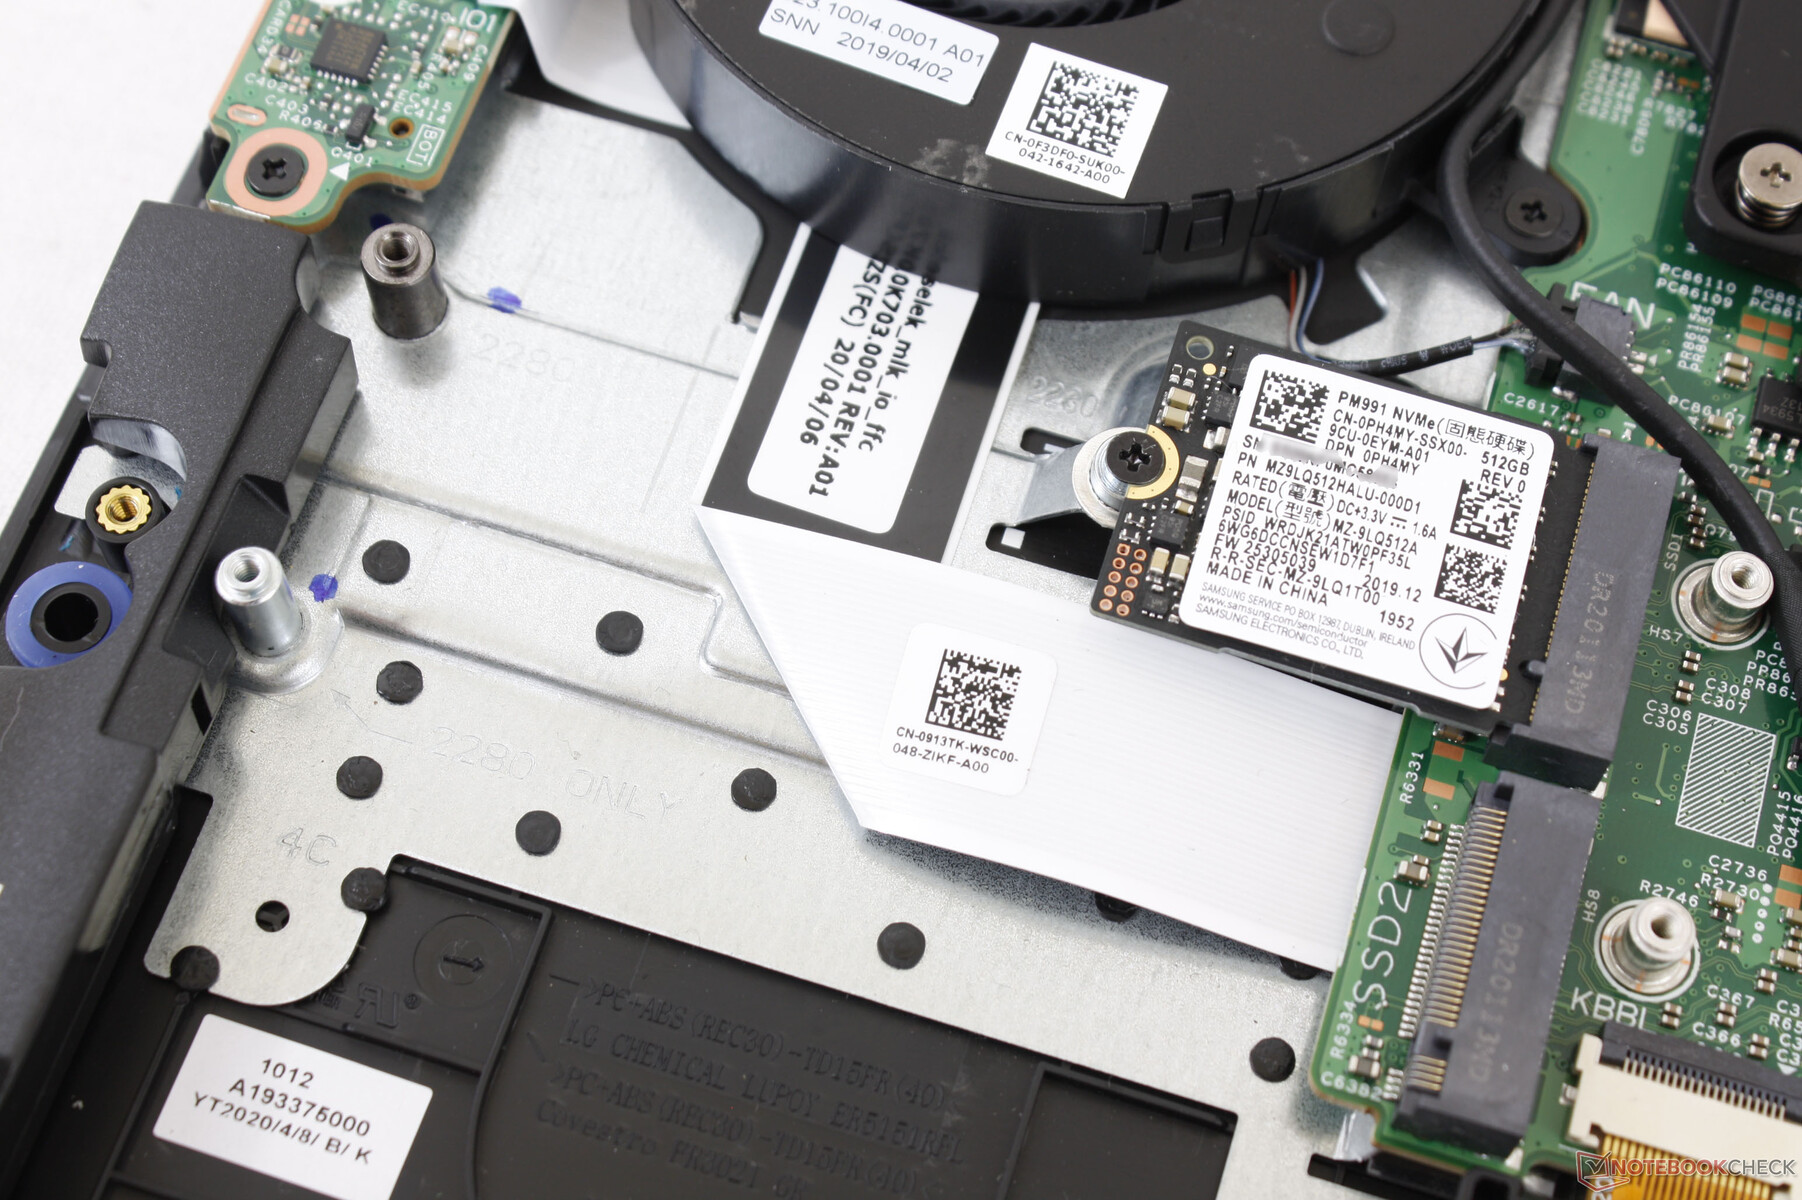
Up to two M.2 2280 NVMe drives are supported. Curiously, our unit comes with an uncommon M.2 2230 NVMe SSD, but the more popular 2280 form factor will work as well. Transfer rates from our miniature Samsing PM991 SSD are faster than the cheaper SK Hynix BC501 but still slower than the full-size Samsing PM981 series.
See our table of SSDs and HDDs for more benchmark comparisons.
| Dell G5 15 SE 5505 P89F Samsung PM991 MZ9LQ512HALU | Dell G5 15 5590-P8RVW SK Hynix BC501 HFM512GDJTNG | Asus TUF Gaming A15 FA506IV-HN172 Kingston OM8PCP3512F-AB | HP Omen 15-dc1020ng WDC PC SN720 SDAQNTW-512G | MSI Alpha 15 A3DDK-034 Kingston RBUSNS8154P3512GJ | |
|---|---|---|---|---|---|
| AS SSD | -10% | -3% | 48% | -12% | |
| Seq Read (MB/s) | 1386 | 1221 -12% | 1682 21% | 2955 113% | 1423 3% |
| Seq Write (MB/s) | 1234 | 731 -41% | 904 -27% | 2440 98% | 958 -22% |
| 4K Read (MB/s) | 41.32 | 37.93 -8% | 60.2 46% | 40.56 -2% | 33.2 -20% |
| 4K Write (MB/s) | 128 | 88.1 -31% | 164.8 29% | 118.6 -7% | 80.7 -37% |
| 4K-64 Read (MB/s) | 854 | 778 -9% | 472.5 -45% | 1283 50% | 816 -4% |
| 4K-64 Write (MB/s) | 721 | 552 -23% | 845 17% | 1538 113% | 708 -2% |
| Access Time Read * (ms) | 0.098 | 0.091 7% | 0.087 11% | 0.084 14% | 0.1 -2% |
| Access Time Write * (ms) | 0.095 | 0.043 55% | 0.02 79% | 0.032 66% | 0.047 51% |
| Score Read (Points) | 1034 | 938 -9% | 701 -32% | 1619 57% | 991 -4% |
| Score Write (Points) | 973 | 713 -27% | 1101 13% | 1901 95% | 885 -9% |
| Score Total (Points) | 2536 | 2114 -17% | 2143 -15% | 4323 70% | 2365 -7% |
| Copy ISO MB/s (MB/s) | 1284 | 675 -47% | 1418 10% | 1043 -19% | |
| Copy Program MB/s (MB/s) | 401.9 | 248.4 -38% | 392.5 -2% | 252.7 -37% | |
| Copy Game MB/s (MB/s) | 1013 | 535 -47% | 907 -10% | 483.6 -52% | |
| CrystalDiskMark 5.2 / 6 | -32% | 1% | 22% | -25% | |
| Write 4K (MB/s) | 142.1 | 64.6 -55% | 219.8 55% | 112.1 -21% | 105.4 -26% |
| Read 4K (MB/s) | 46.43 | 35.64 -23% | 50.2 8% | 42.01 -10% | 33.24 -28% |
| Write Seq (MB/s) | 1108 | 748 -32% | 979 -12% | 1964 77% | 1029 -7% |
| Read Seq (MB/s) | 1622 | 1039 -36% | 1990 23% | 2065 27% | 1098 -32% |
| Write 4K Q32T1 (MB/s) | 467 | 435.7 -7% | 516 10% | 318.2 -32% | 322.1 -31% |
| Read 4K Q32T1 (MB/s) | 525 | 292.4 -44% | 298.3 -43% | 406.7 -23% | 352 -33% |
| Write Seq Q32T1 (MB/s) | 1203 | 870 -28% | 982 -18% | 2534 111% | 1036 -14% |
| Read Seq Q32T1 (MB/s) | 2288 | 1557 -32% | 1907 -17% | 3438 50% | 1606 -30% |
| Write 4K Q8T8 (MB/s) | 981 | ||||
| Read 4K Q8T8 (MB/s) | 300.9 | ||||
| Toplam Ortalama (Program / Ayarlar) | -21% /
-20% | -1% /
-1% | 35% /
38% | -19% /
-16% |
* ... daha küçük daha iyidir

Disk Throttling: DiskSpd Read Loop, Queue Depth 8
GPU Performance
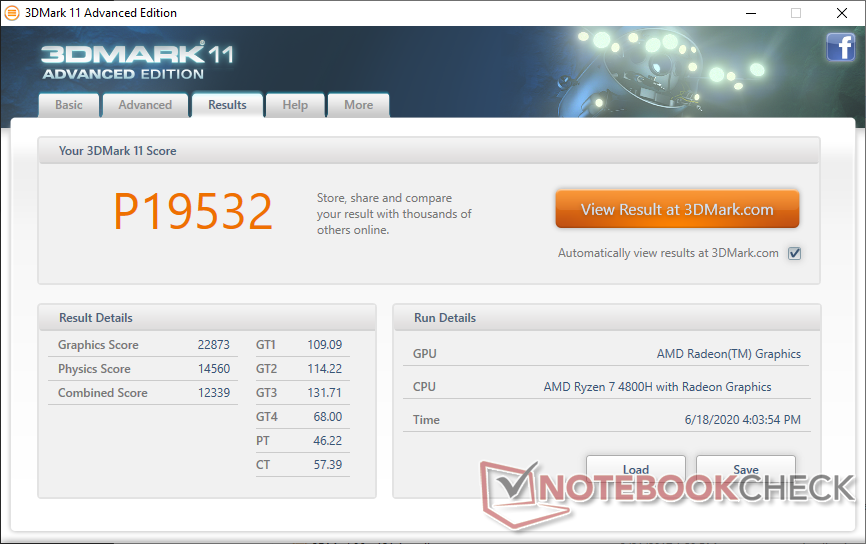
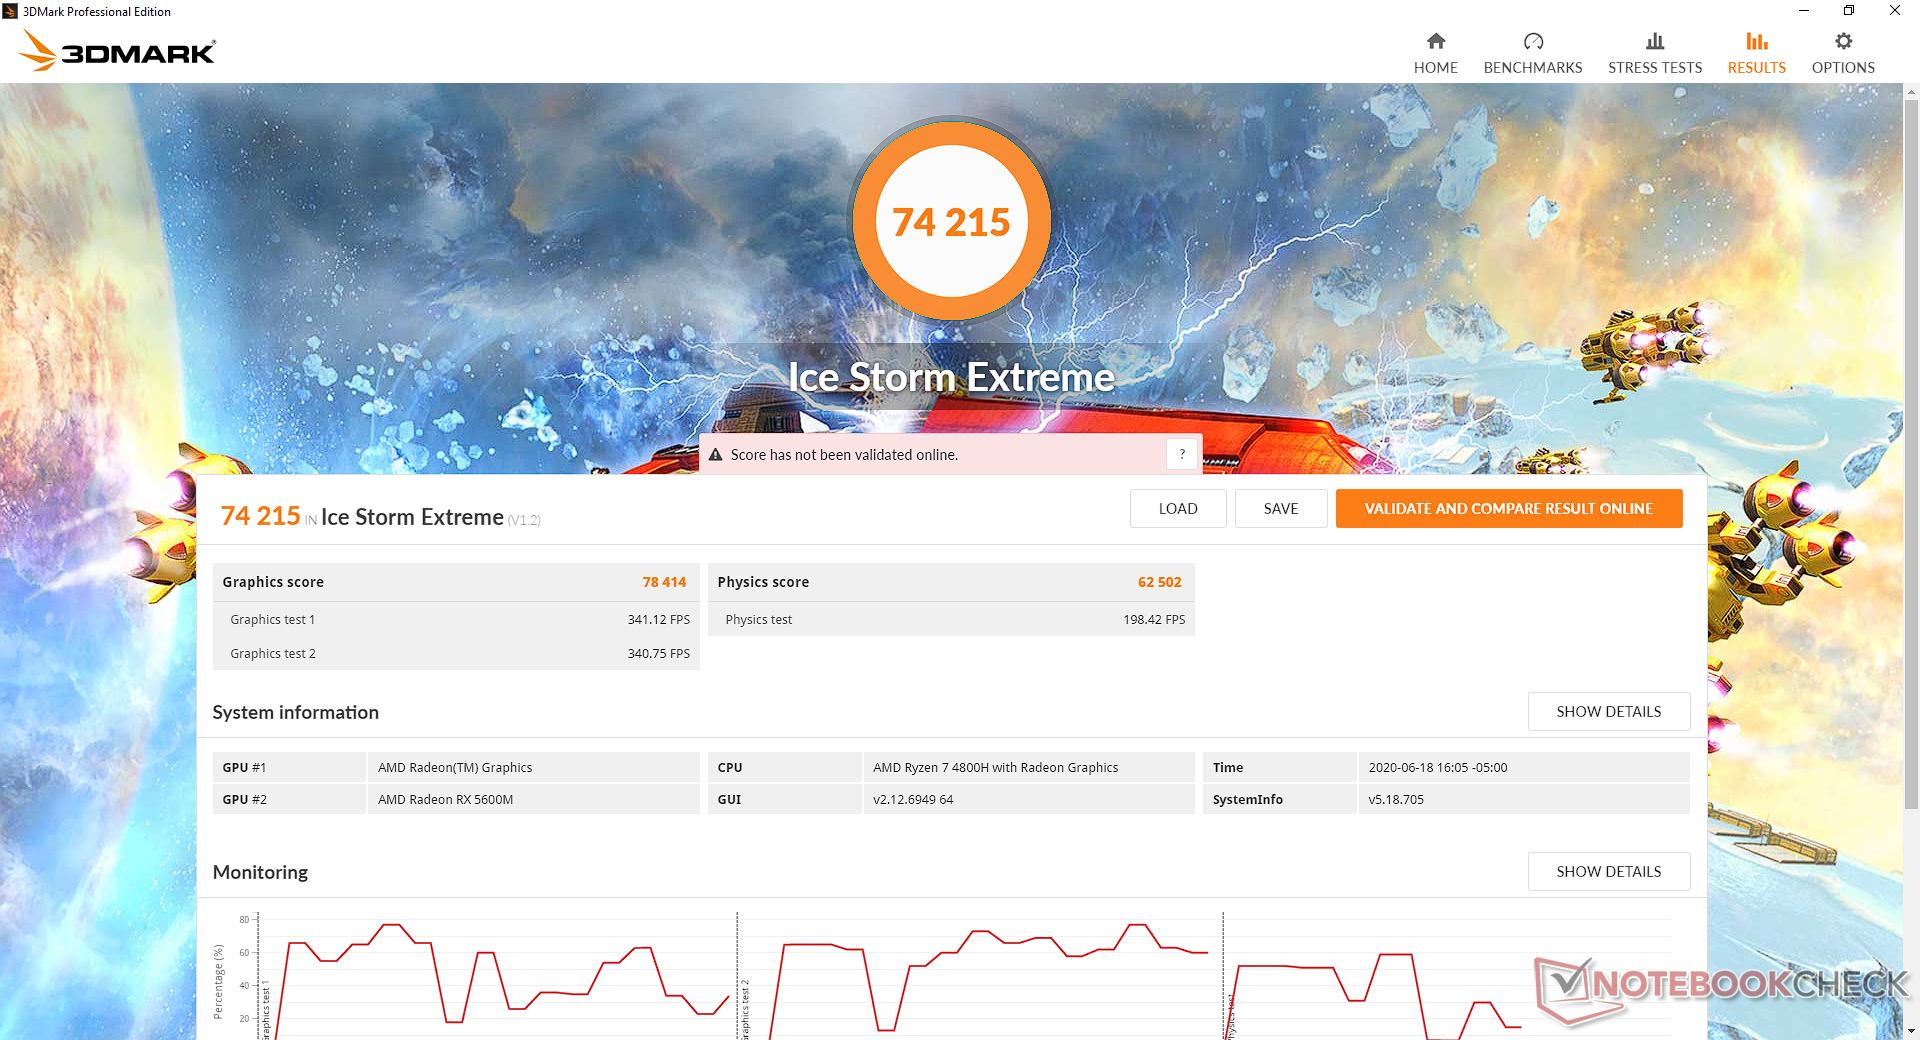
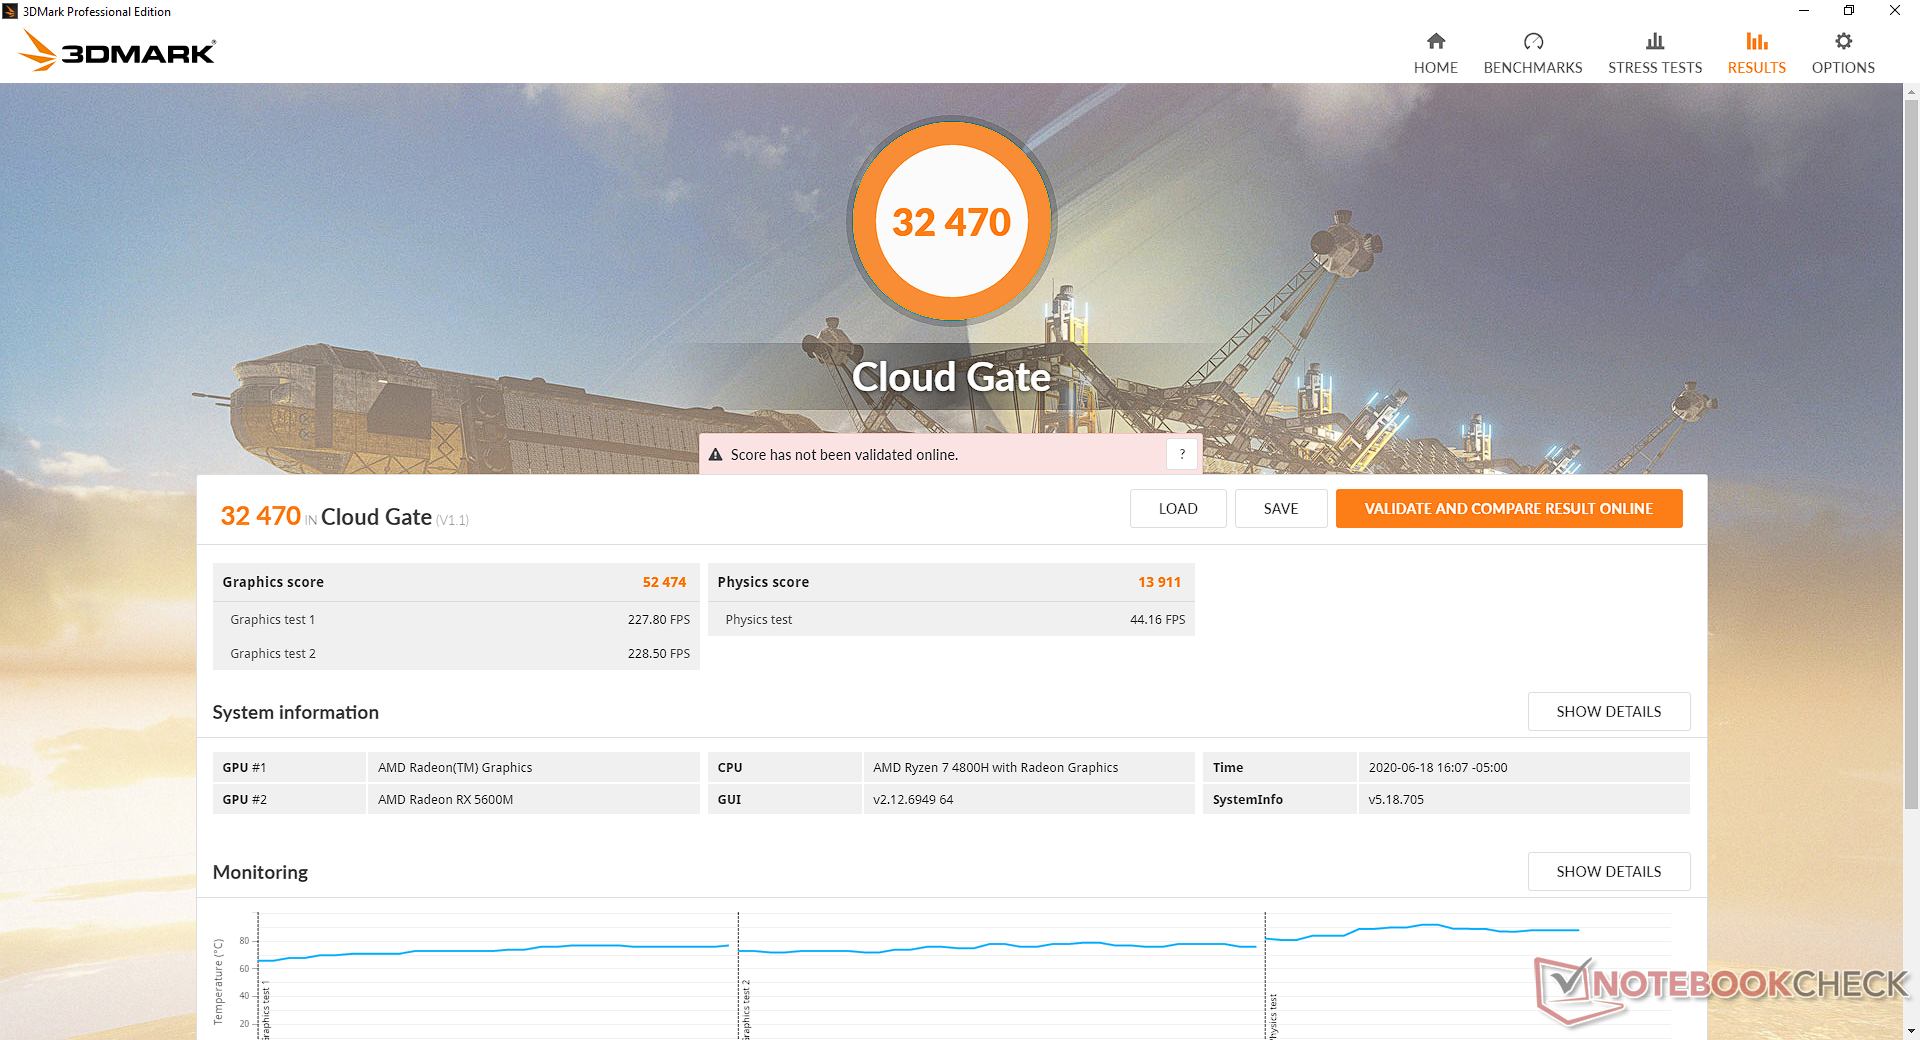
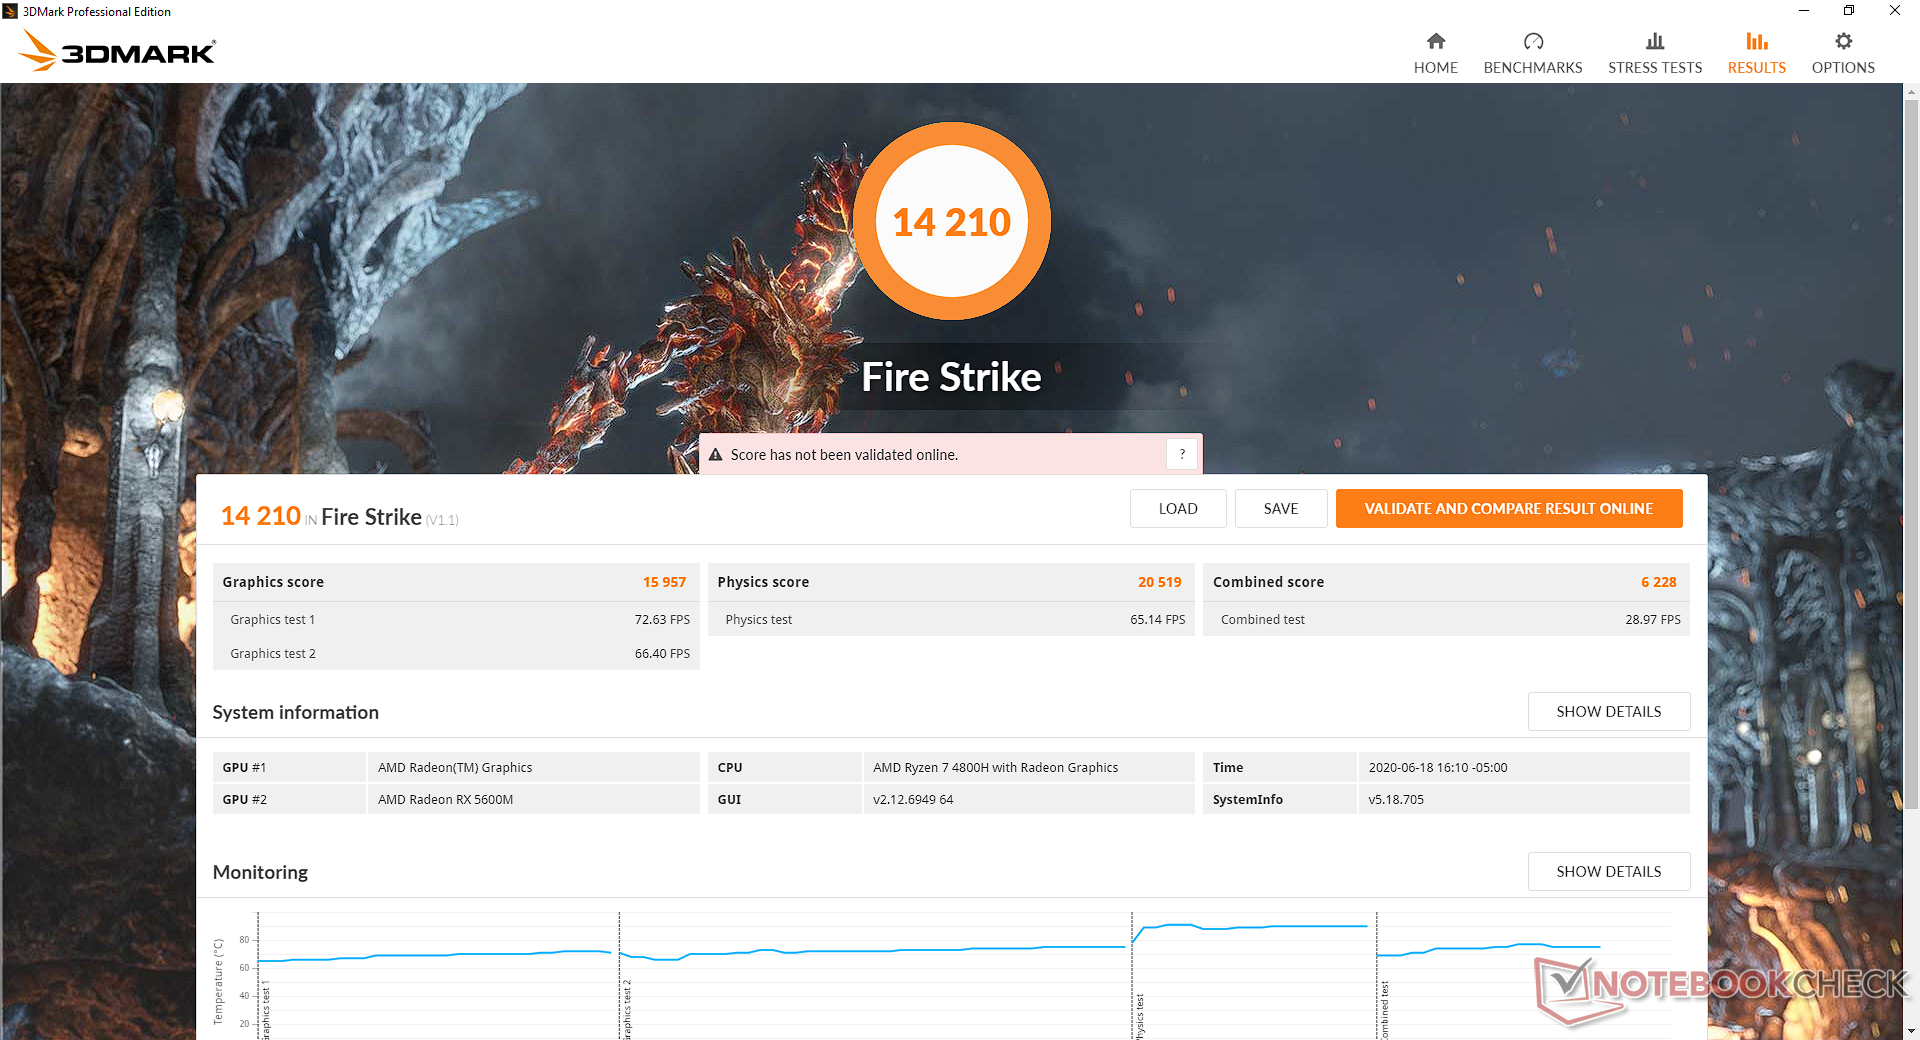
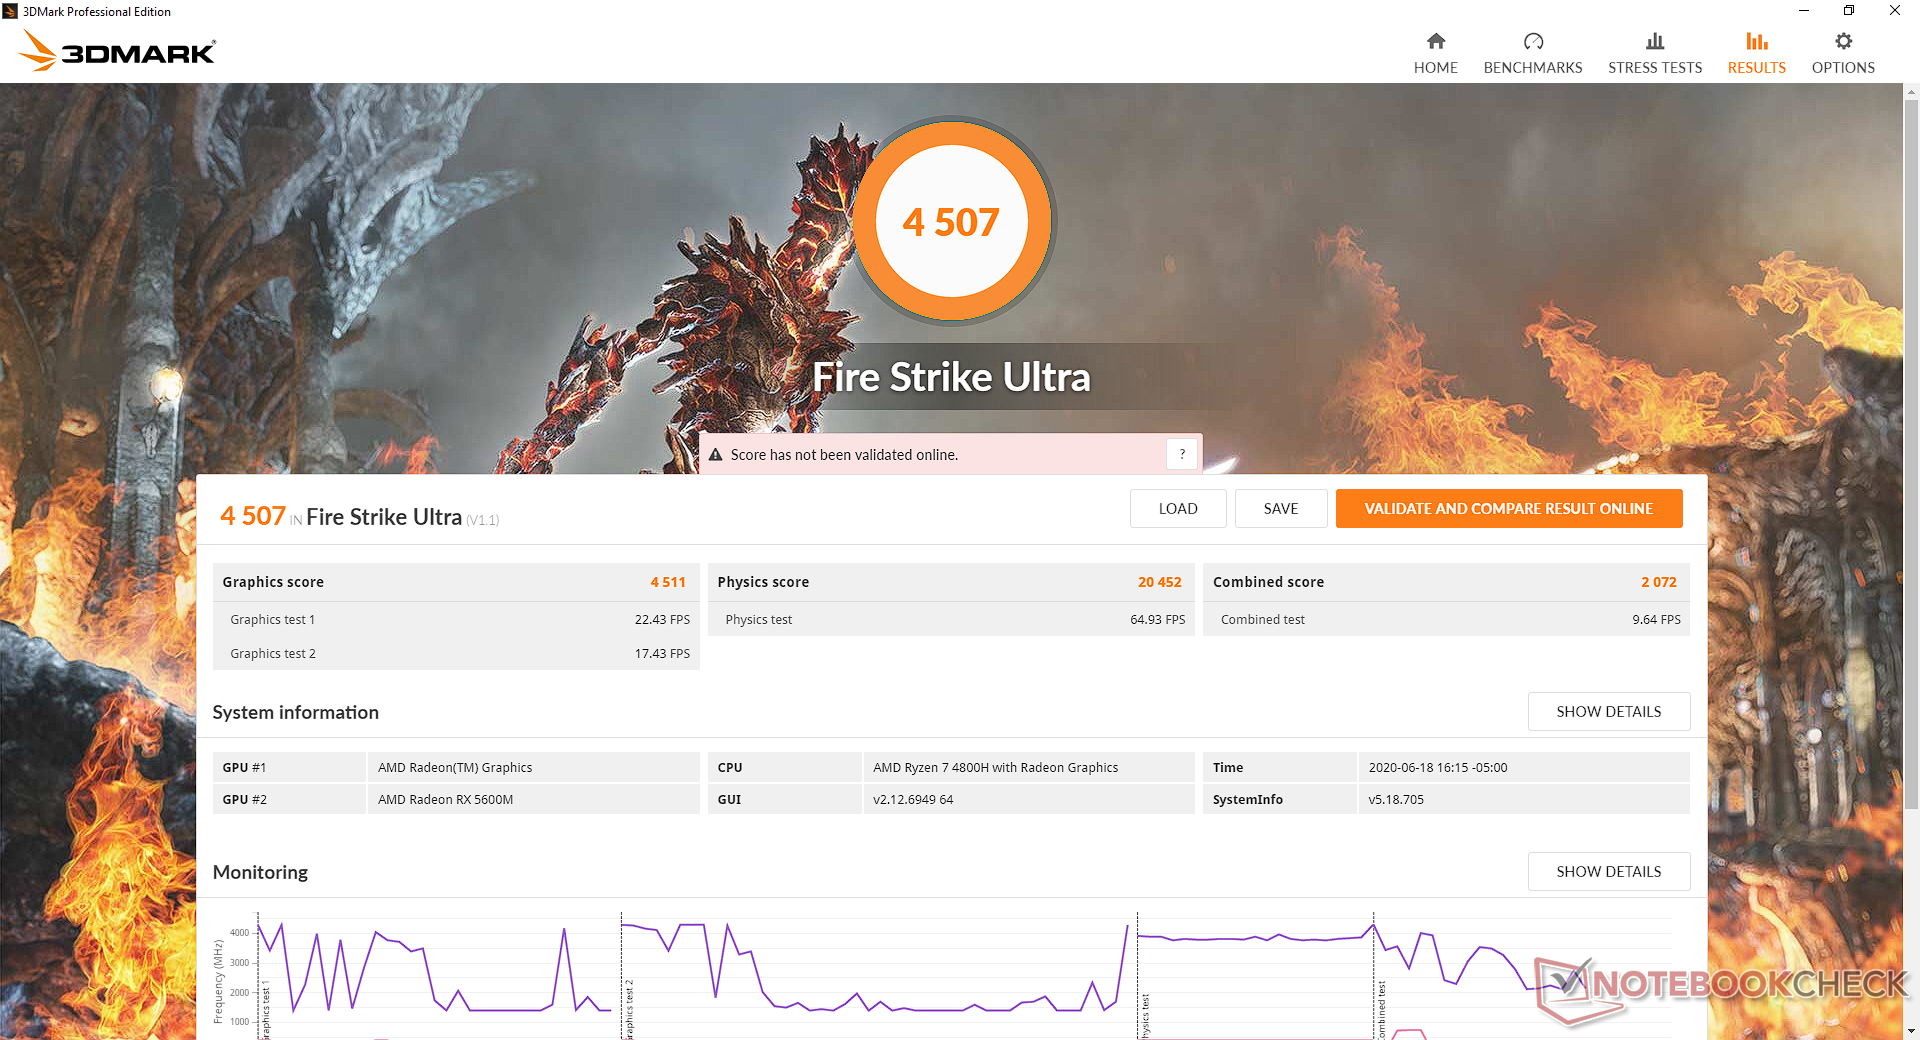
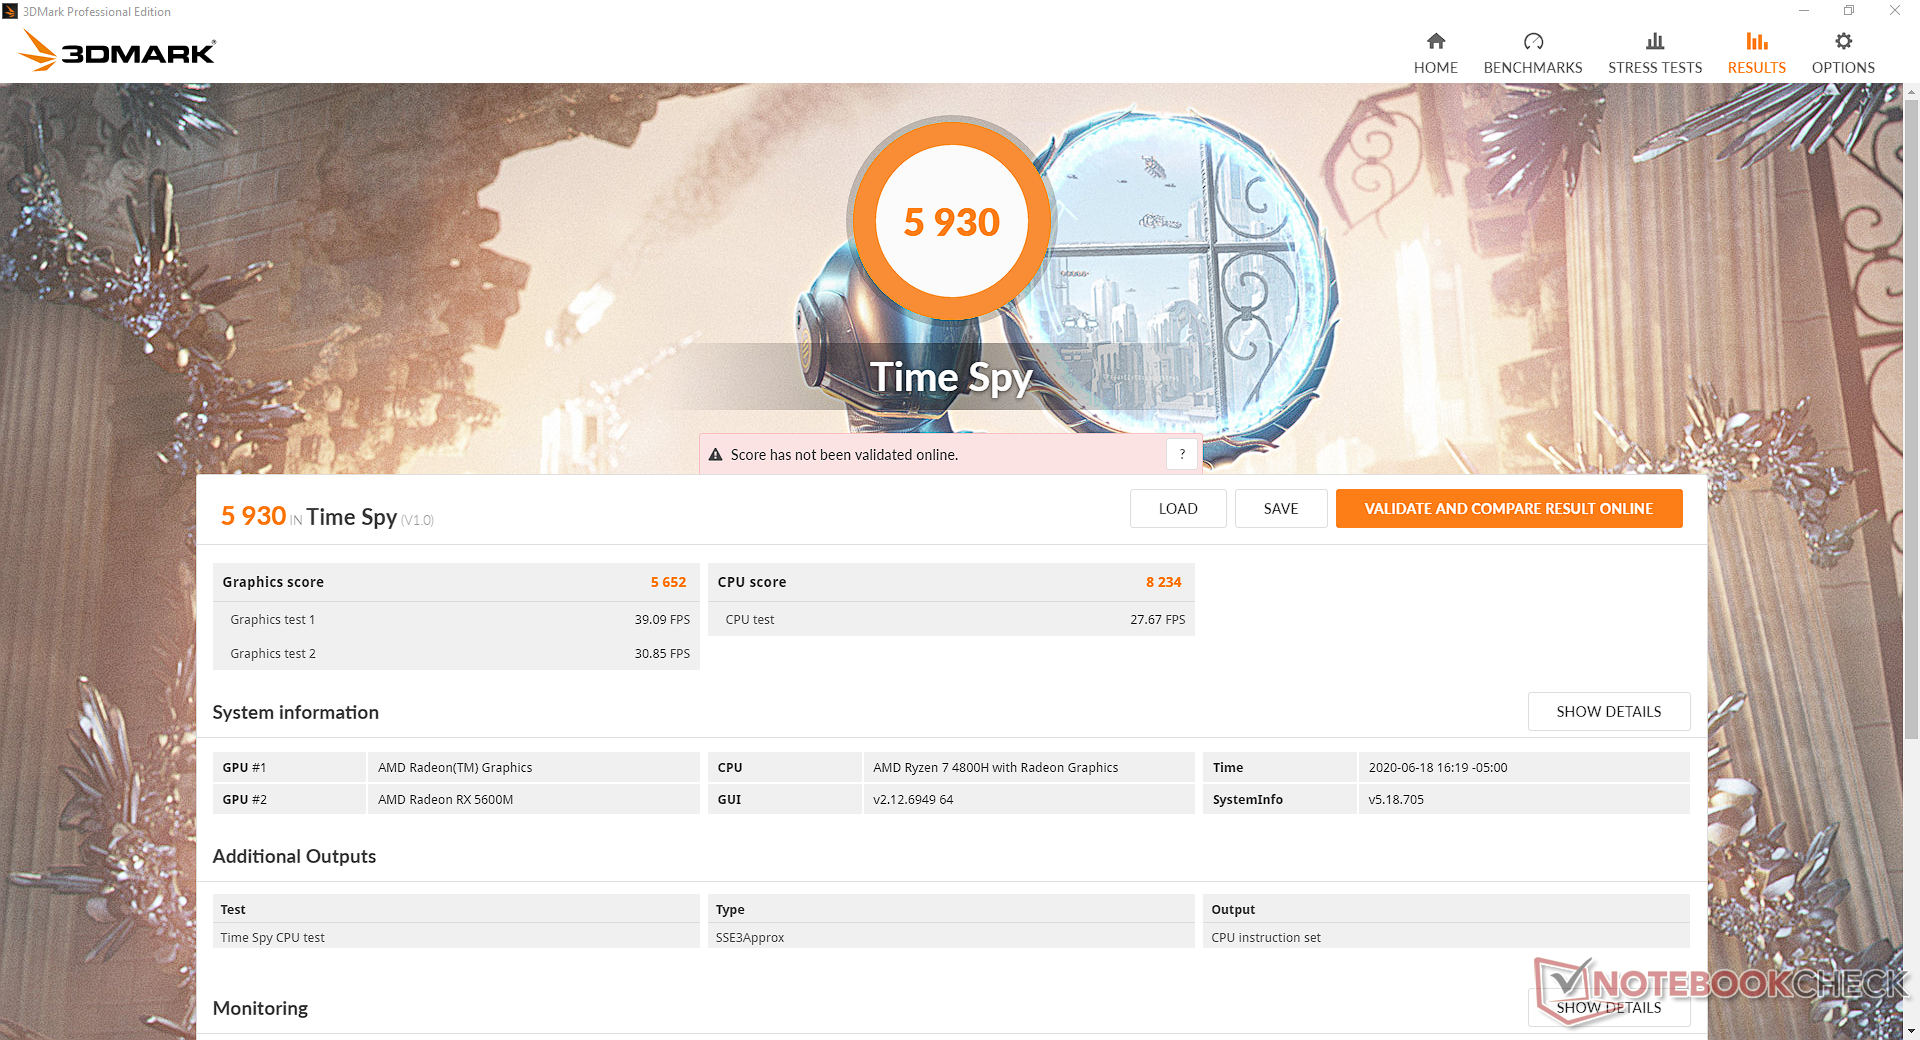
3DMark scores are approximately 45 percent faster than the Radeon RX 5500M to edge out the all-popular mobile GeForce RTX 2060. It's almost on par with the much more expensive RTX 2070 Max-Q. Laptops in this price range typically come with the GTX 1660 Ti instead which will be about 10 to 20 percent slower than our Navi 10 chip.
The main catch is that the AMD GPU offers no hardware-accelerated ray-tracing unlike on the RTX 2060. If such features are important to you, then GeForce RTX-based laptops will still offer more value.
| 3DMark | |
| 1920x1080 Fire Strike Graphics | |
| Eurocom Sky X4C i9-9900KS | |
| MSI GE66 Raider 10SFS | |
| MSI RTX 2060 Gaming Z 6G | |
| Dell G5 15 SE 5505 P89F | |
| Razer Blade 15 RZ09-0328 | |
| Ortalama NVIDIA GeForce RTX 2060 Mobile (14768 - 18358, n=43) | |
| Asus TUF Gaming A15 FA506IV-HN172 | |
| HP Omen 15-dc0015ng | |
| Maingear Vector 15 | |
| MSI Bravo 17 A4DDR | |
| Asus Zephyrus S GX531GM | |
| Acer Nitro 5 AN515-44-R5FT | |
| 2560x1440 Time Spy Graphics | |
| Eurocom Sky X4C i9-9900KS | |
| MSI GE66 Raider 10SFS | |
| MSI RTX 2060 Gaming Z 6G | |
| Razer Blade 15 RZ09-0328 | |
| Dell G5 15 SE 5505 P89F | |
| Ortalama NVIDIA GeForce RTX 2060 Mobile (5660 - 6910, n=41) | |
| Asus TUF Gaming A15 FA506IV-HN172 | |
| Maingear Vector 15 | |
| HP Omen 15-dc0015ng | |
| MSI Bravo 17 A4DDR | |
| Acer Nitro 5 AN515-44-R5FT | |
| Asus Zephyrus S GX531GM | |
| 2560x1440 Time Spy Score | |
| Eurocom Sky X4C i9-9900KS | |
| MSI GE66 Raider 10SFS | |
| MSI RTX 2060 Gaming Z 6G | |
| Dell G5 15 SE 5505 P89F | |
| Razer Blade 15 RZ09-0328 | |
| Asus TUF Gaming A15 FA506IV-HN172 | |
| Ortalama NVIDIA GeForce RTX 2060 Mobile (5679 - 6926, n=41) | |
| Maingear Vector 15 | |
| HP Omen 15-dc0015ng | |
| MSI Bravo 17 A4DDR | |
| Acer Nitro 5 AN515-44-R5FT | |
| Asus Zephyrus S GX531GM | |
| 2560x1440 Time Spy CPU | |
| Eurocom Sky X4C i9-9900KS | |
| MSI Bravo 17 A4DDR | |
| Dell G5 15 SE 5505 P89F | |
| MSI GE66 Raider 10SFS | |
| MSI RTX 2060 Gaming Z 6G | |
| Asus TUF Gaming A15 FA506IV-HN172 | |
| Maingear Vector 15 | |
| Ortalama NVIDIA GeForce RTX 2060 Mobile (4463 - 9287, n=41) | |
| Acer Nitro 5 AN515-44-R5FT | |
| HP Omen 15-dc0015ng | |
| Razer Blade 15 RZ09-0328 | |
| Asus Zephyrus S GX531GM | |
| 3DMark 11 | |
| 1280x720 Performance GPU | |
| Eurocom Sky X4C i9-9900KS | |
| MSI GE66 Raider 10SFS | |
| MSI RTX 2060 Gaming Z 6G | |
| Dell G5 15 SE 5505 P89F | |
| Razer Blade 15 RZ09-0328 | |
| Asus TUF Gaming A15 FA506IV-HN172 | |
| Ortalama NVIDIA GeForce RTX 2060 Mobile (19143 - 24662, n=40) | |
| Maingear Vector 15 | |
| HP Omen 15-dc0015ng | |
| MSI Bravo 17 A4DDR | |
| Acer Nitro 5 AN515-44-R5FT | |
| Asus Zephyrus S GX531GM | |
| 1280x720 Performance Combined | |
| Eurocom Sky X4C i9-9900KS | |
| MSI GE66 Raider 10SFS | |
| MSI RTX 2060 Gaming Z 6G | |
| MSI Bravo 17 A4DDR | |
| Dell G5 15 SE 5505 P89F | |
| Maingear Vector 15 | |
| HP Omen 15-dc0015ng | |
| Razer Blade 15 RZ09-0328 | |
| Ortalama NVIDIA GeForce RTX 2060 Mobile (1107 - 14726, n=40) | |
| Asus TUF Gaming A15 FA506IV-HN172 | |
| Acer Nitro 5 AN515-44-R5FT | |
| Asus Zephyrus S GX531GM | |
| 3DMark 06 Standard Score | 38139 puan | |
| 3DMark Vantage P Result | 18582 puan | |
| 3DMark 11 Performance | 21400 puan | |
| 3DMark Ice Storm Standard Score | 76143 puan | |
| 3DMark Cloud Gate Standard Score | 36805 puan | |
| 3DMark Fire Strike Score | 16652 puan | |
| 3DMark Time Spy Score | 6610 puan | |
Yardım | ||
Gaming Performance
Of course, 3DMark never tells the whole story. Real-world performance in games is most similar to the mobile GeForce RTX 2060 if not slightly lower by a few percentage points in most games. Still, it's a noticeable improvement over last year's Radeon RX 5500M.
See our dedicated page on the Radeon RX 5600M for more technical information and benchmark comparisons.
| Shadow of the Tomb Raider - 1920x1080 Highest Preset AA:T | |
| MSI GE66 Raider 10SFS | |
| Lenovo Legion Y740-17IRH | |
| Eluktronics RP-15 | |
| Ortalama NVIDIA GeForce RTX 2060 Mobile (54 - 86, n=22) | |
| Asus Zephyrus G14 GA401IV | |
| Dell G5 15 SE 5505 P89F | |
| MSI Bravo 17 A4DDR | |
| Acer Nitro 5 AN515-44-R5FT | |
| Razer Blade Stealth Core i7 GTX 1650 Ti Max-Q 4K | |
| MSI Prestige 14 A10RD | |
| The Witcher 3 - 1920x1080 Ultra Graphics & Postprocessing (HBAO+) | |
| MSI GE66 Raider 10SFS | |
| Dell G5 15 SE 5505 P89F | |
| Eluktronics RP-15 | |
| Ortalama NVIDIA GeForce RTX 2060 Mobile (50.6 - 74, n=40) | |
| Lenovo Legion Y740-17IRH | |
| Asus Zephyrus G14 GA401IV | |
| MSI Bravo 17 A4DDR | |
| Acer Nitro 5 AN515-44-R5FT | |
| Razer Blade Stealth Core i7 GTX 1650 Ti Max-Q 4K | |
| Asus ZenBook 15 UX534FTC-A8190T | |
| MSI Prestige 14 A10RD | |
| Borderlands 3 - 1920x1080 Badass Overall Quality (DX11) | |
| MSI GE66 Raider 10SFS | |
| Lenovo Legion Y740-17IRH | |
| Ortalama NVIDIA GeForce RTX 2060 Mobile (47.5 - 57.3, n=7) | |
| Asus Zephyrus G14 GA401IV | |
| Dell G5 15 SE 5505 P89F | |
| Eluktronics RP-15 | |
| NVIDIA GeForce GTX 1060 | |
| MSI Bravo 17 A4DDR | |
| Acer Nitro 5 AN515-44-R5FT | |
| Razer Blade Stealth Core i7 GTX 1650 Ti Max-Q 4K | |
| Asus ZenBook 15 UX534FTC-A8190T | |
| MSI Prestige 14 A10RD | |
Idling on Witcher 3 shows steady frame rates except towards the end where frame rates jarringly jumped between ~85 FPS to ~95 FPS for seemingly no reason.
| düşük | orta | yüksek | ultra | |
|---|---|---|---|---|
| The Witcher 3 (2015) | 266.4 | 103.6 | 66.1 | |
| Dota 2 Reborn (2015) | 124 | 119 | 106 | 102 |
| X-Plane 11.11 (2018) | 48.2 | 37.6 | 33.7 | |
| Shadow of the Tomb Raider (2018) | 122 | 89 | 83 | 68 |
| Assassin´s Creed Odyssey (2018) | 78 | 67 | 60 | 49 |
| Apex Legends (2019) | 143.7 | 137.1 | 110.7 | 104.1 |
| Far Cry New Dawn (2019) | 91 | 77 | 74 | 67 |
| Metro Exodus (2019) | 146.4 | 75.5 | 55.2 | 44.9 |
| Dirt Rally 2.0 (2019) | 215 | 135 | 113.6 | 77.3 |
| The Division 2 (2019) | 129 | 93 | 75 | 57 |
| Anno 1800 (2019) | 80.4 | 79.1 | 63.5 | 40 |
| Total War: Three Kingdoms (2019) | 196.8 | 96.9 | 64.9 | 44.2 |
| F1 2019 (2019) | 191 | 140 | 114 | 106 |
| Control (2019) | 176.7 | 72.3 | 53.1 | |
| Borderlands 3 (2019) | 105.2 | 81.7 | 61.2 | 47.8 |
| Ghost Recon Breakpoint (2019) | 96 | 76 | 68 | 50 |
| GRID 2019 (2019) | 186.2 | 134.3 | 116.6 | 88.6 |
| Need for Speed Heat (2019) | 86.9 | 76.6 | 70.1 | 60.1 |
| Star Wars Jedi Fallen Order (2019) | 76 | 68.4 | 67.1 | |
| Hunt Showdown (2020) | 150.7 | 91.3 | 66.2 | |
| Doom Eternal (2020) | 232.3 | 144.7 | 124 | 114.6 |
| Gears Tactics (2020) | 137.8 | 135.7 | 96.1 | 70.6 |
Emissions
System Noise
Fan noise is both surprisingly quiet and way too loud depending on the workload. When browsing or playing video on the Power Saver or Balanced profiles, the fans will almost always be silent. In fact, we had to run the first benchmark scene of 3DMark 06 twice just to trigger the fans up to 32 dB(A). The G5 15 SE is one of the quieter gaming laptops in this regard.
When gaming, however, "quiet" immediately goes out the window. Fan noise will jump to 39 dB(A) before eventually stabilizing at 50.6 dB(A) to be very close to what we recorded on the Dell G5 15 5590 or Asus TUF A15 FA506IV. The G5 15 SE doesn't run any quieter than many of its closest competitors when under high loads.
| Dell G5 15 SE 5505 P89F Radeon RX 5600M, R7 4800H, Samsung PM991 MZ9LQ512HALU | Dell G5 15 5590-P8RVW GeForce RTX 2070 Max-Q, i7-9750H, SK Hynix BC501 HFM512GDJTNG | Asus TUF Gaming A15 FA506IV-HN172 GeForce RTX 2060 Mobile, R7 4800H, Kingston OM8PCP3512F-AB | HP Omen 15-dc1020ng GeForce GTX 1650 Mobile, i5-9300H, WDC PC SN720 SDAQNTW-512G | MSI Alpha 15 A3DDK-034 Radeon RX 5500M, R7 3750H, Kingston RBUSNS8154P3512GJ | Lenovo Legion Y740-15ICHg GeForce RTX 2070 Max-Q, i7-9750H, WDC PC SN520 SDAPMUW-128G | |
|---|---|---|---|---|---|---|
| Noise | -20% | -10% | 0% | -32% | -10% | |
| kapalı / ortam * (dB) | 28 | 30 -7% | 30.2 -8% | 28.8 -3% | 29 -4% | 30 -7% |
| Idle Minimum * (dB) | 28 | 32 -14% | 30.2 -8% | 28.8 -3% | 36 -29% | 31.3 -12% |
| Idle Average * (dB) | 28 | 33 -18% | 30.2 -8% | 29.5 -5% | 37 -32% | 31.3 -12% |
| Idle Maximum * (dB) | 28 | 34 -21% | 30.2 -8% | 31.1 -11% | 46 -64% | 31.3 -12% |
| Load Average * (dB) | 28 | 50 -79% | 40 -43% | 35.2 -26% | 50 -79% | 42 -50% |
| Witcher 3 ultra * (dB) | 50.6 | 50 1% | 49 3% | 35.2 30% | 51 -1% | 42.1 17% |
| Load Maximum * (dB) | 50.6 | 52 -3% | 49 3% | 41 19% | 57 -13% | 46.5 8% |
* ... daha küçük daha iyidir
Ses yüksekliği
| Boşta |
| 28 / 28 / 28 dB |
| Çalışırken |
| 28 / 50.6 dB |
 | ||
30 dB sessiz 40 dB(A) duyulabilirlik 50 dB(A) gürültülü |
||
min: | ||
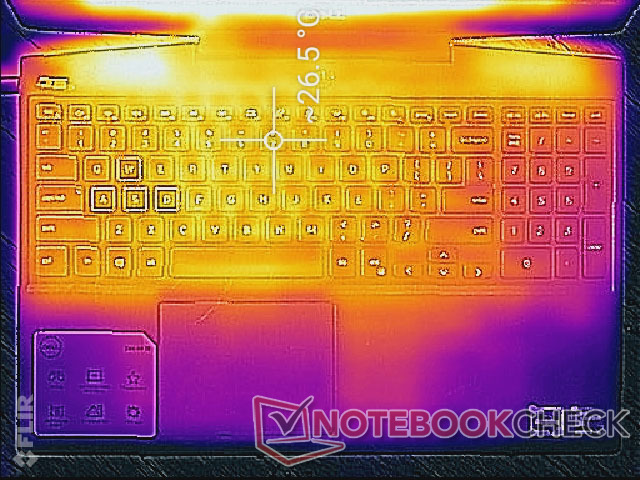
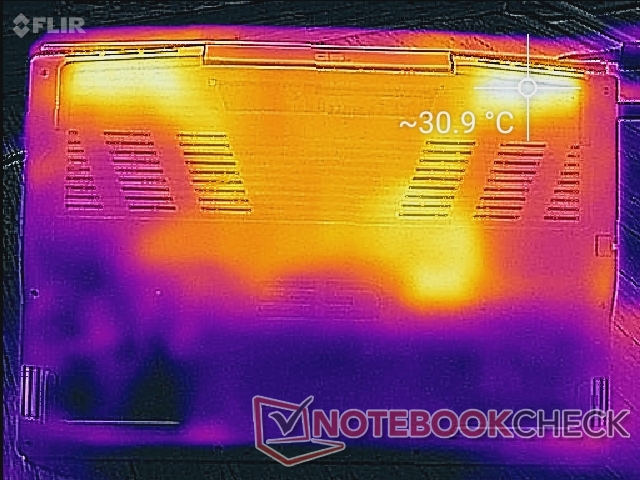
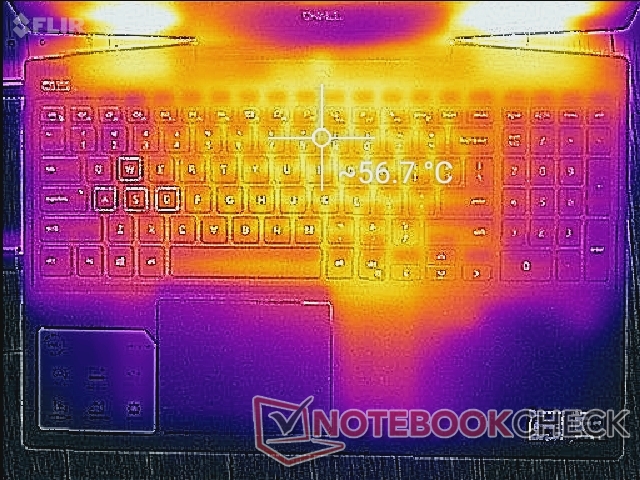
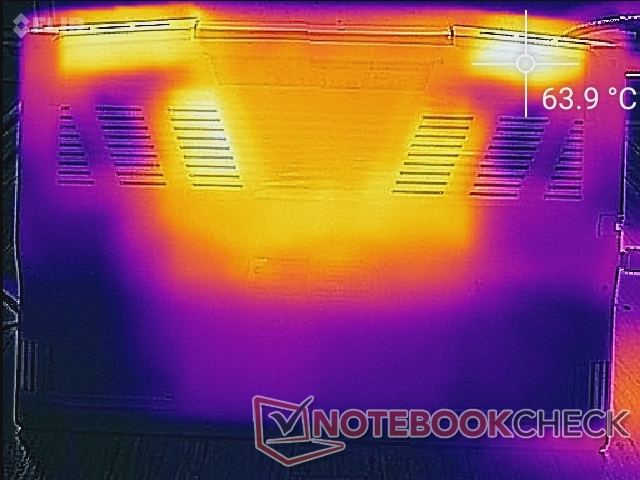
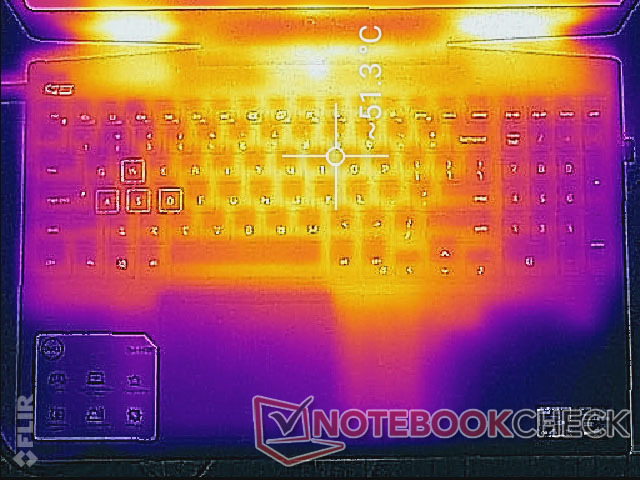
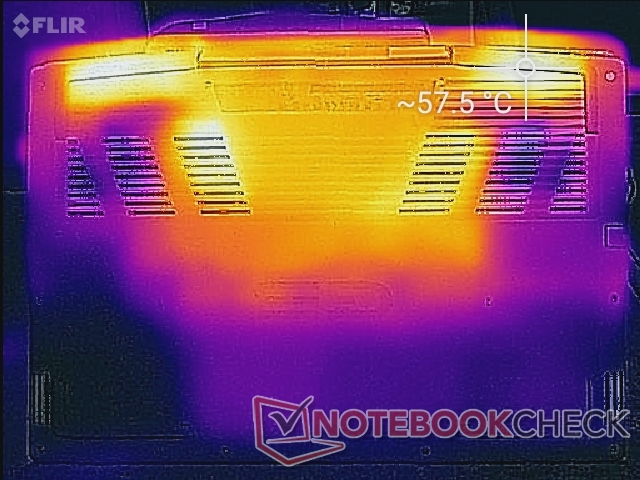
Temperature
Surface temperatures are not anything to write home about. When gaming, hot spots can become as warm as 56 C to even 64 C as shown by our temperature maps below. These areas are thankfully towards the rear or keyboard center away from the palms rests and WASD keys. Even so, this is one of the warmer 15.6-inch gaming laptops we've seen. The competing Asus TUF A15, for example, runs warm as well but certainly not as hot as the Dell when under similar conditions.
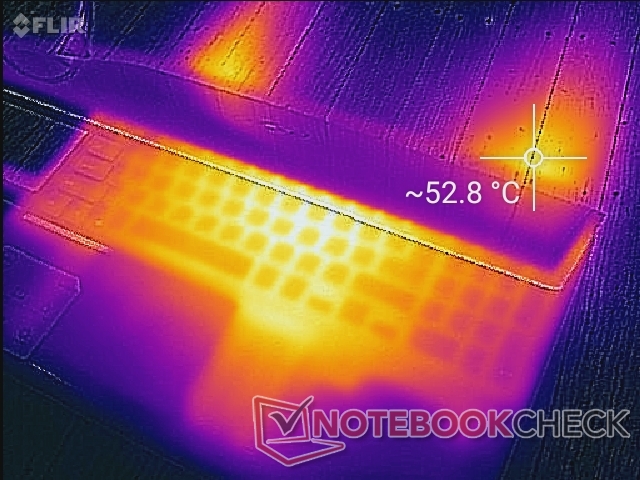
(-) Üst taraftaki maksimum sıcaklık, 40.4 °C / 105 F ortalamasına kıyasla 53 °C / 127 F'dir. , Gaming sınıfı için 21.2 ile 68.8 °C arasında değişir.
(-) Alt kısım, 43.2 °C / 110 F ortalamasına kıyasla maksimum 57.6 °C / 136 F'ye kadar ısınır
(+) Boşta kullanımda, üst tarafın ortalama sıcaklığı 25.4 °C / 78 F olup, cihazın 33.9 °C / 93 F.
(-) The Witcher 3 oynarken, üst tarafın ortalama sıcaklığı 44.2 °C / 112 F olup, cihazın 33.9 °C / 93 F.
(±) Avuç içi dayanakları ve dokunmatik yüzey maksimum 37.2 °C / 99 F ile dokunulamayacak kadar ısınabilir.
(-) Benzer cihazların avuç içi dayanağı alanının ortalama sıcaklığı 28.8 °C / 83.8 F (-8.4 °C / -15.2 F) idi.
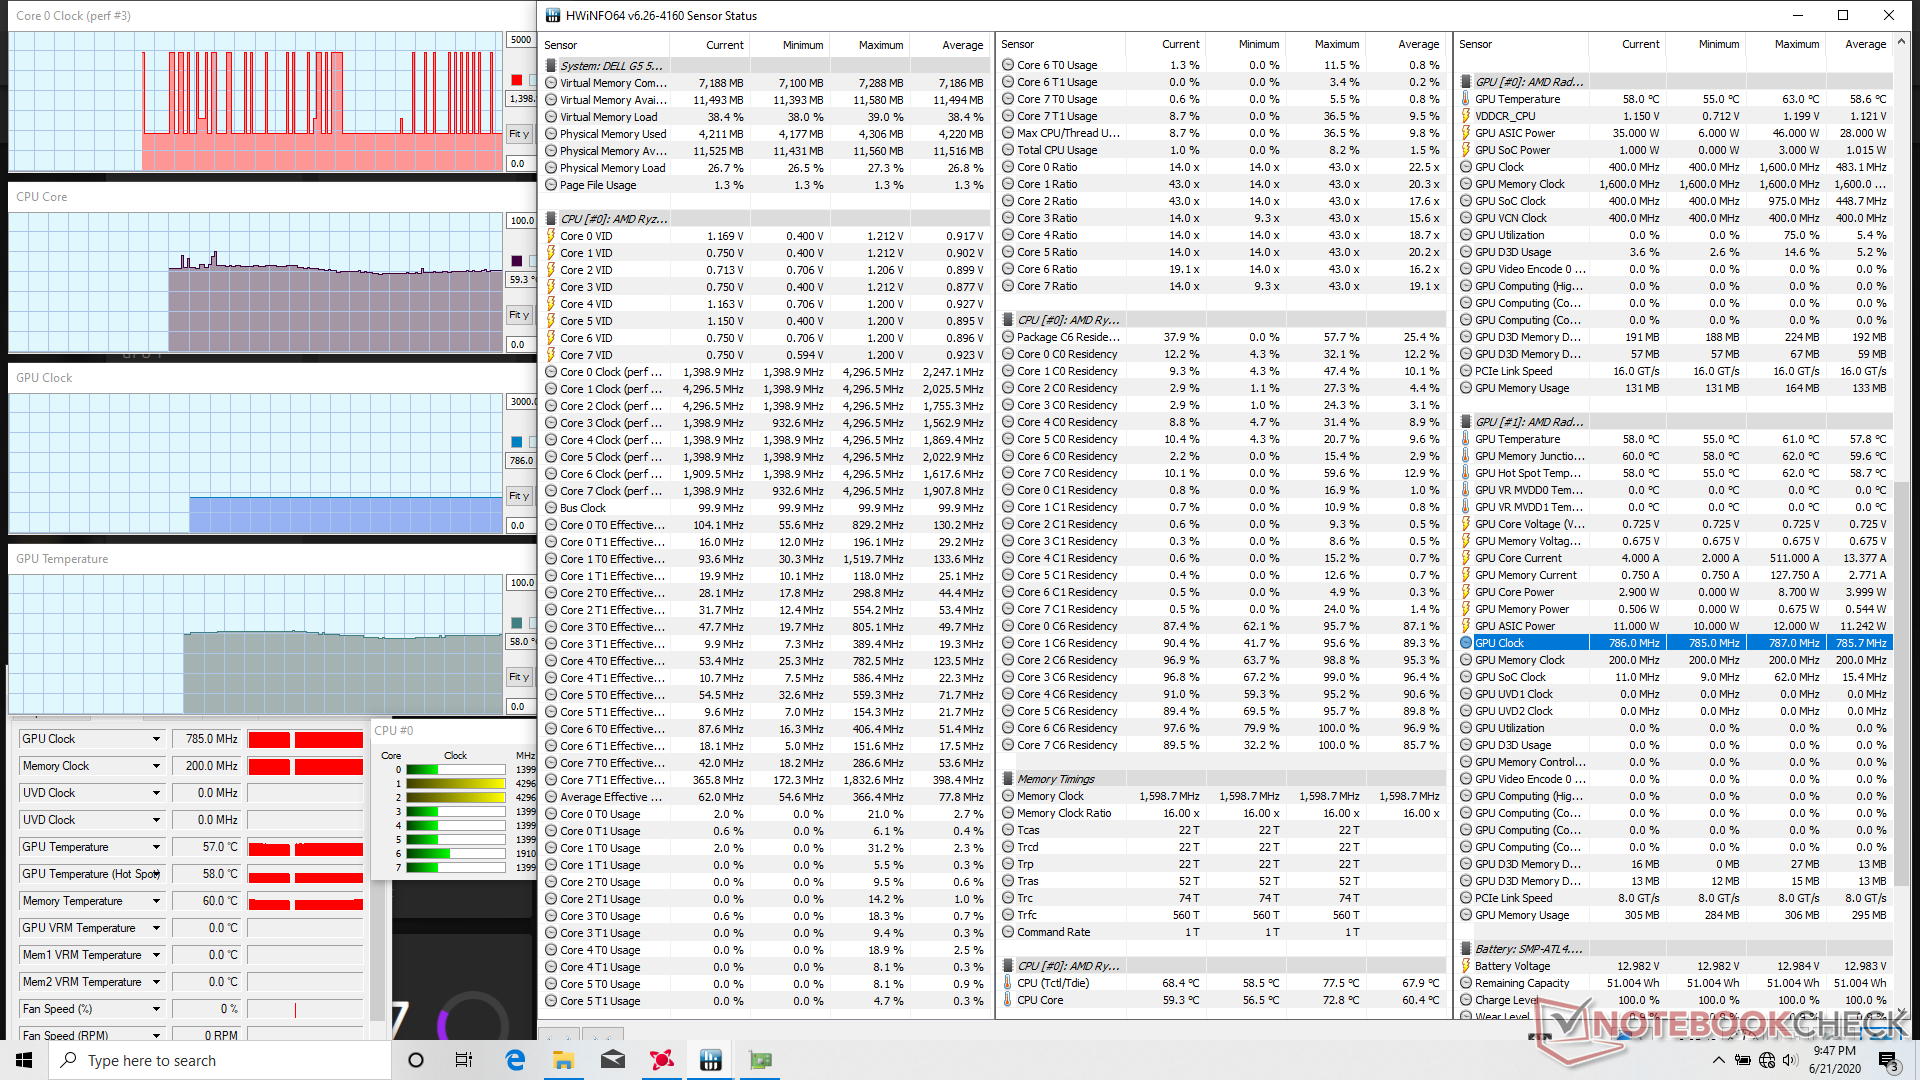
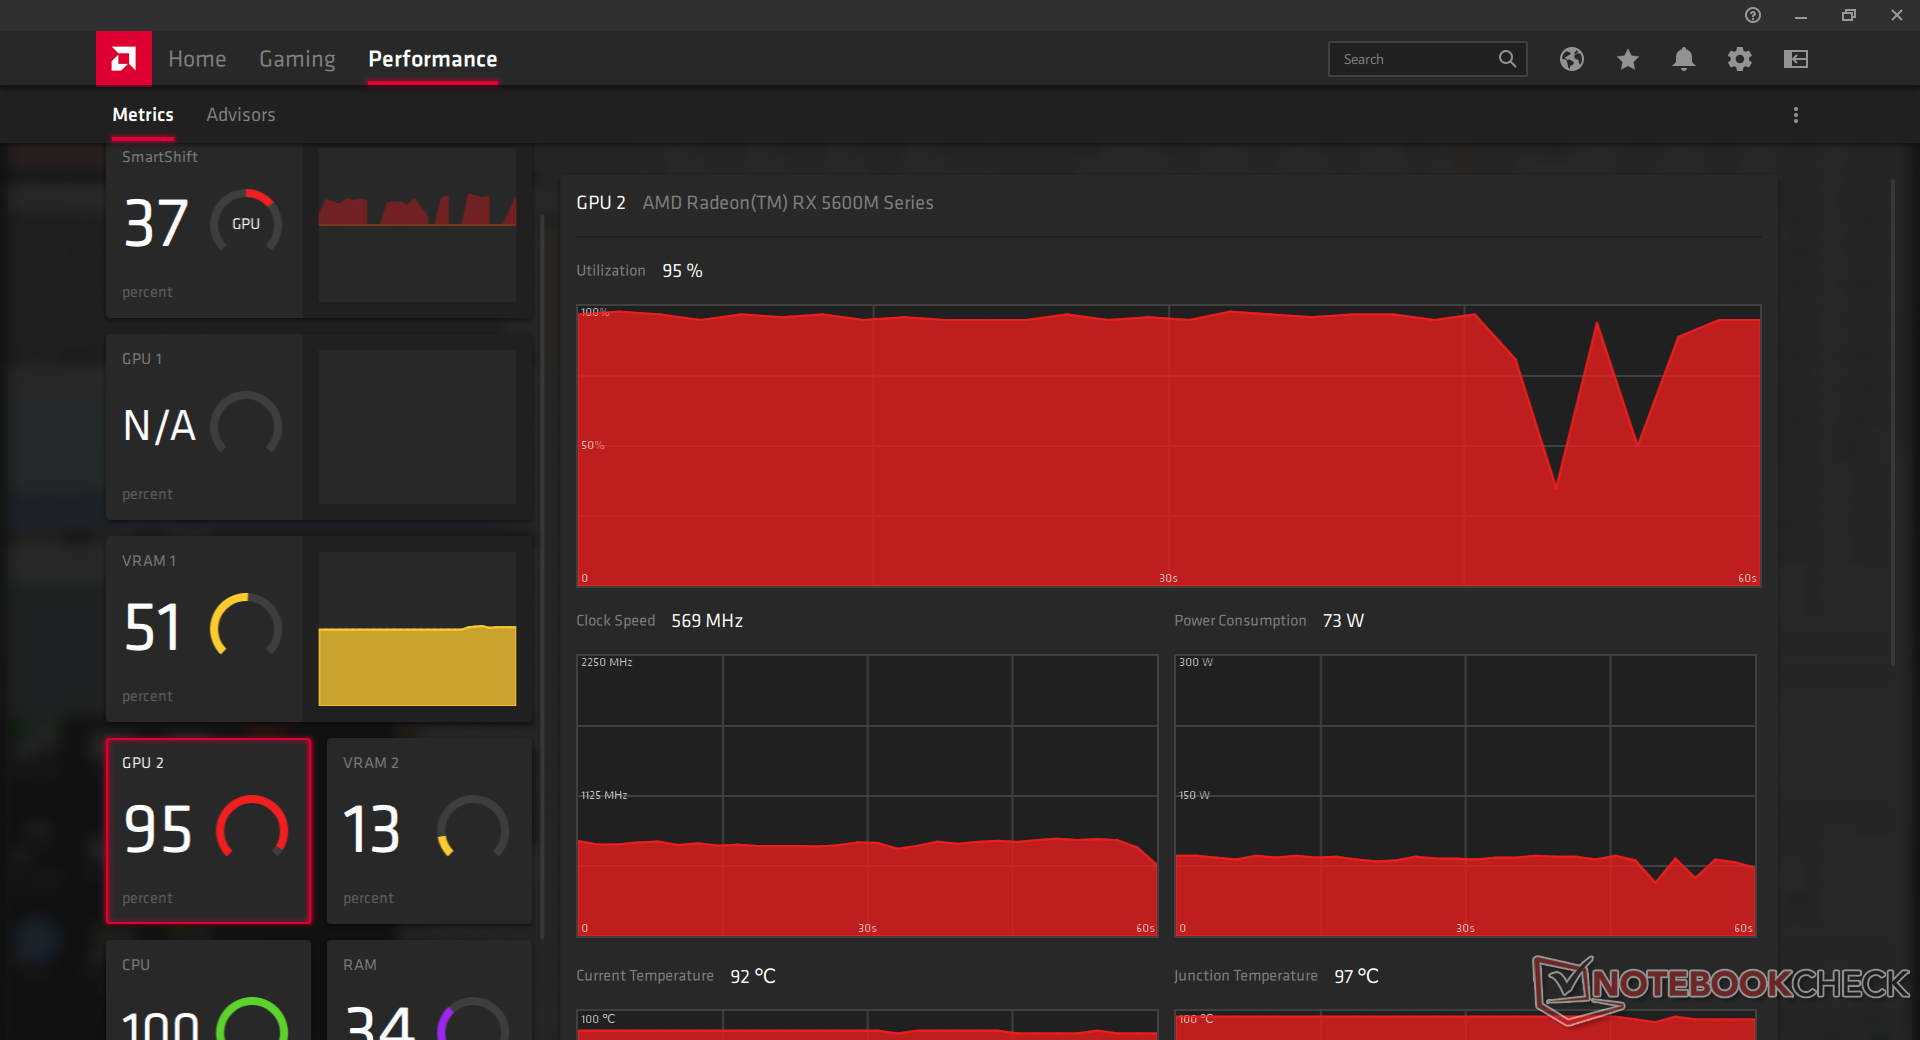
Stress Test
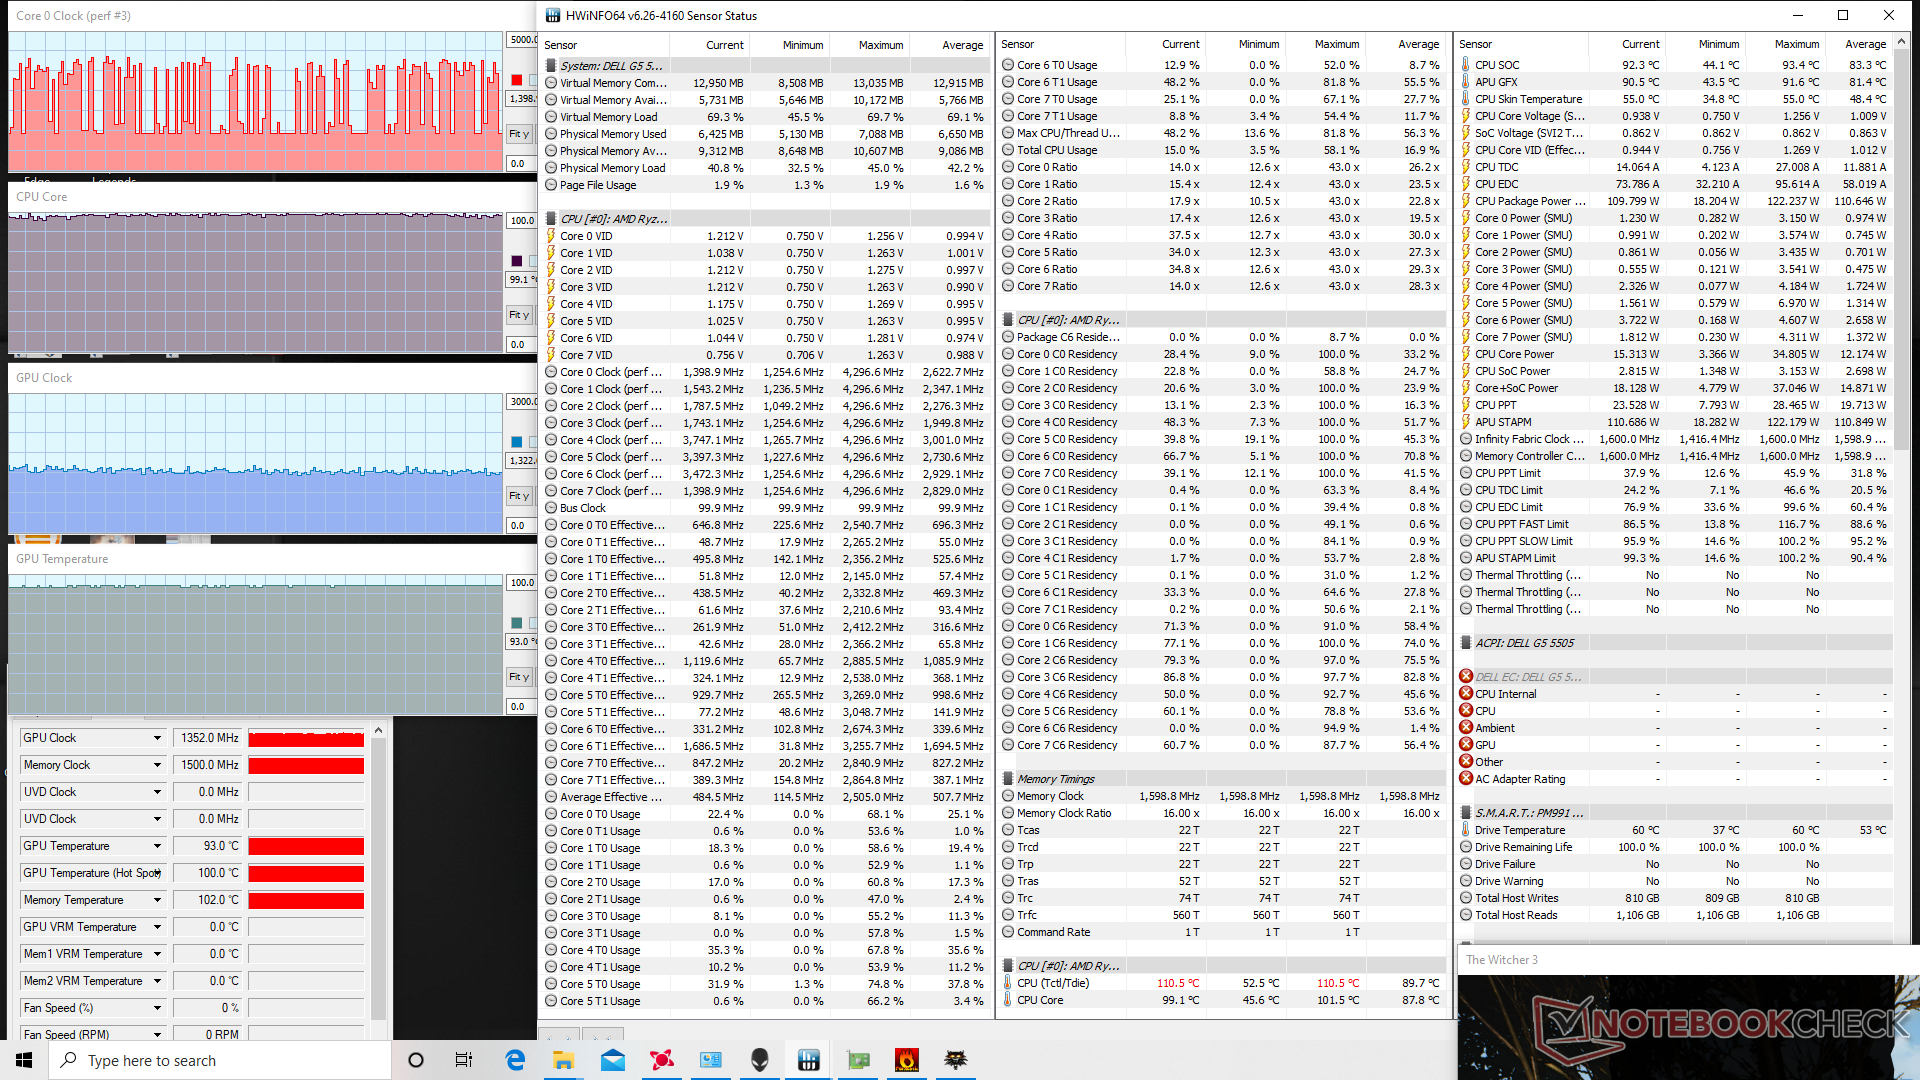
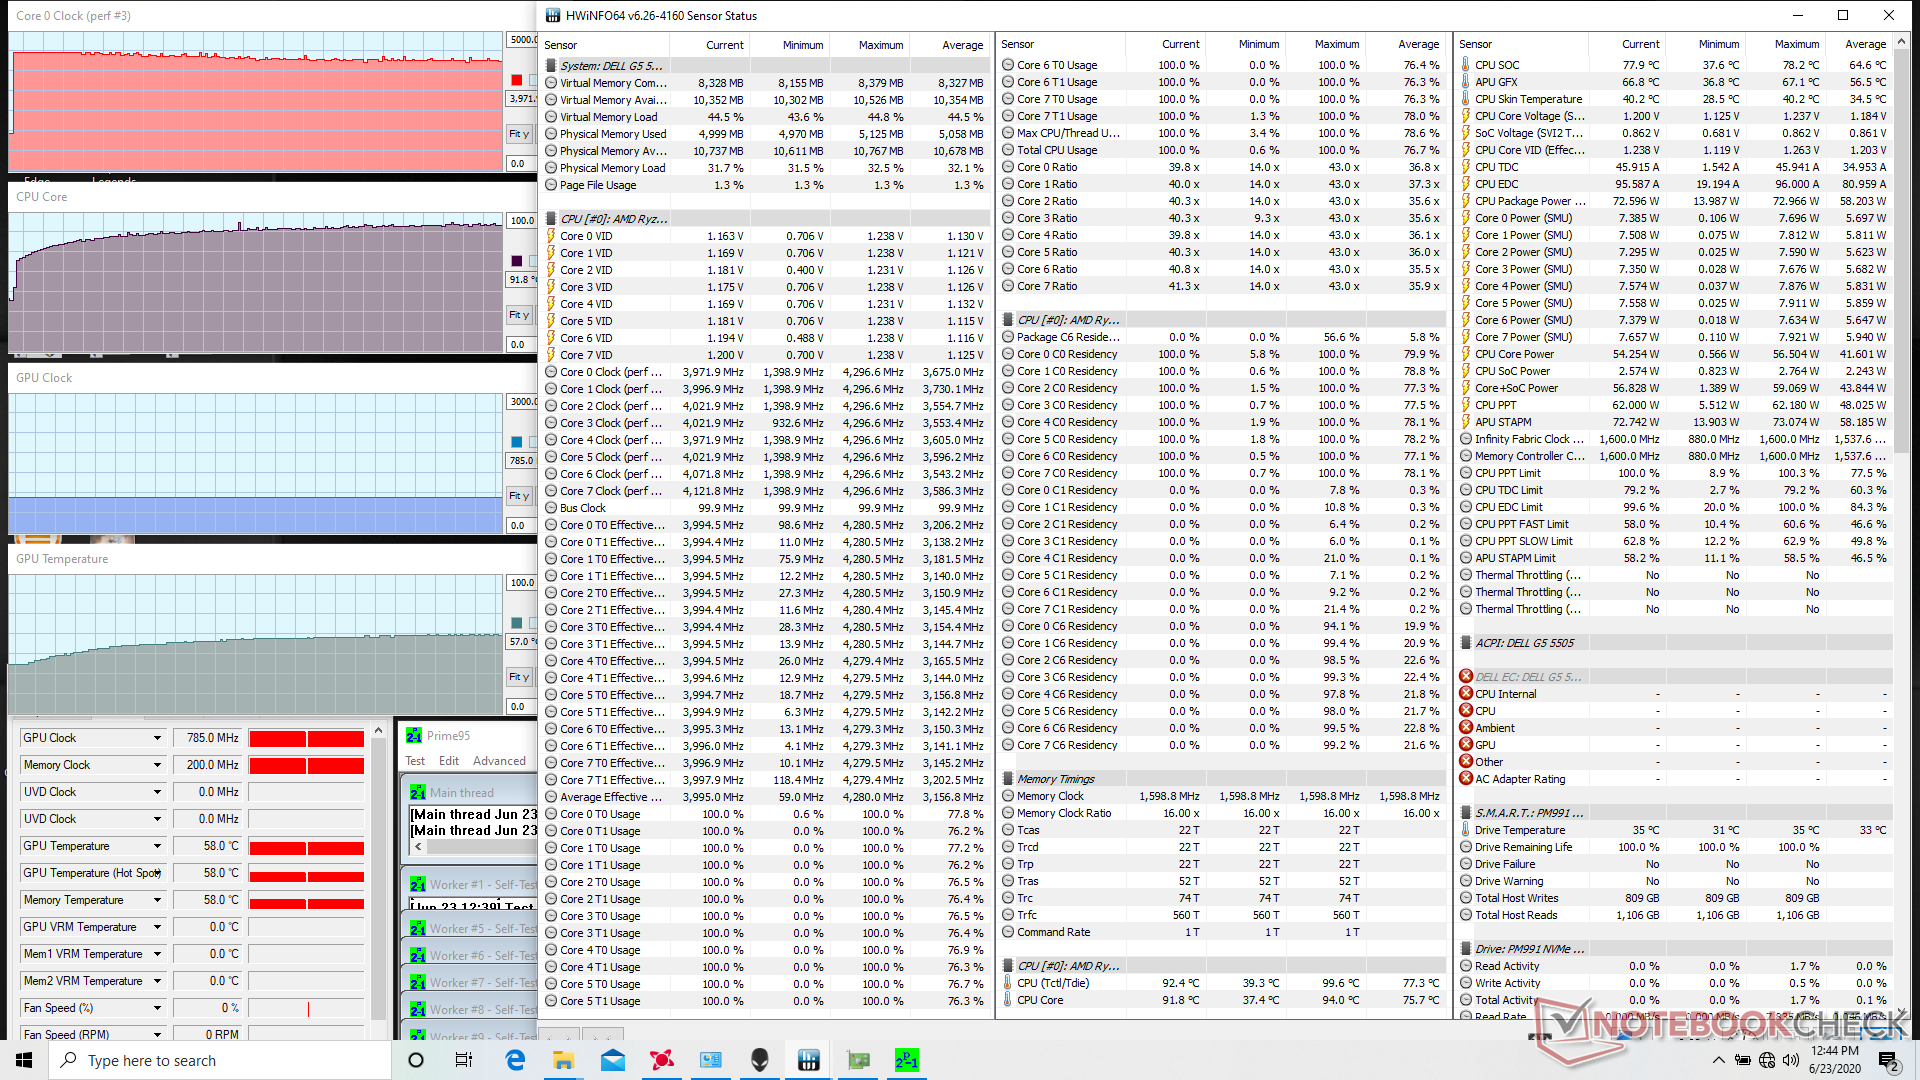
We stress the system with synthetic loads to look for any potential stability or throttling issues. When running Prime95, the CPU can be observed boosting to 4.3 GHz for the first minute or so until stabilizing at 4 GHz and at a very warm core temperature of 92 C. Though the high CPU performance sustainability is appreciated, the high core temperature will likely turn off a lot of enthusiasts.
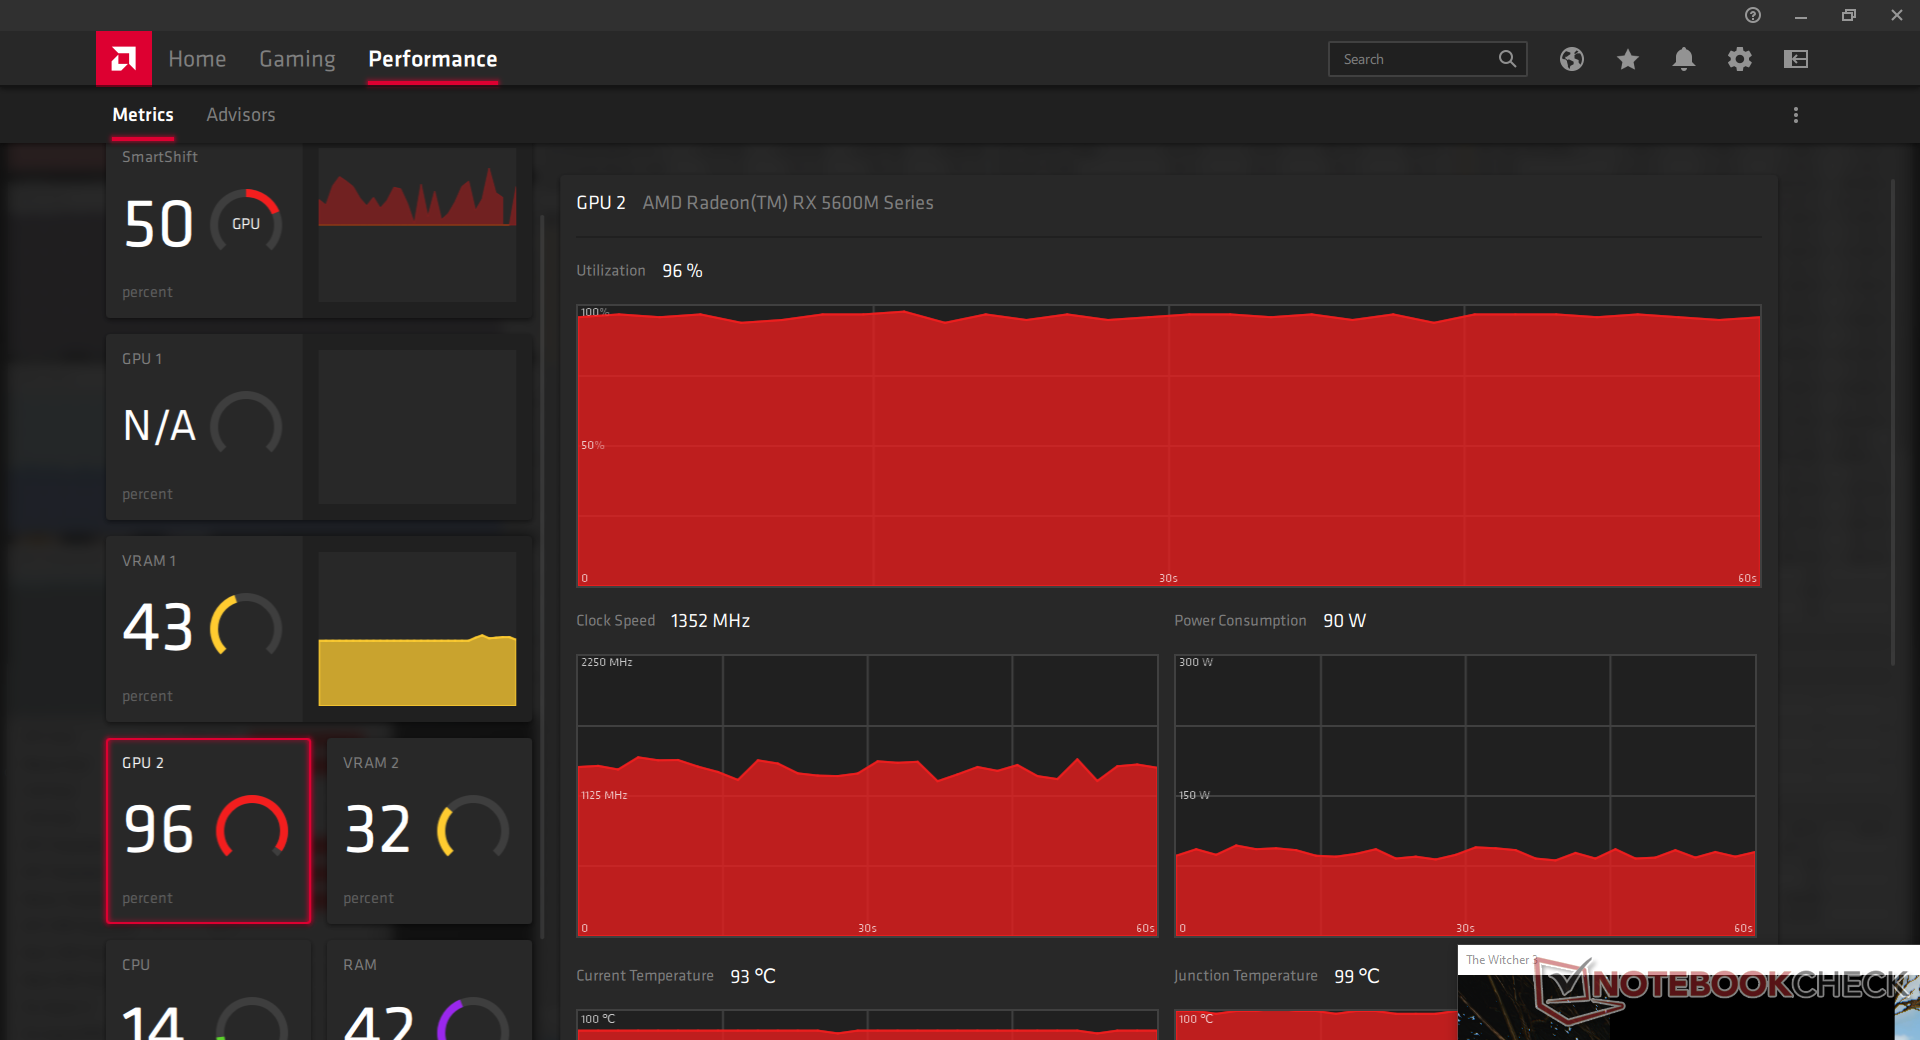
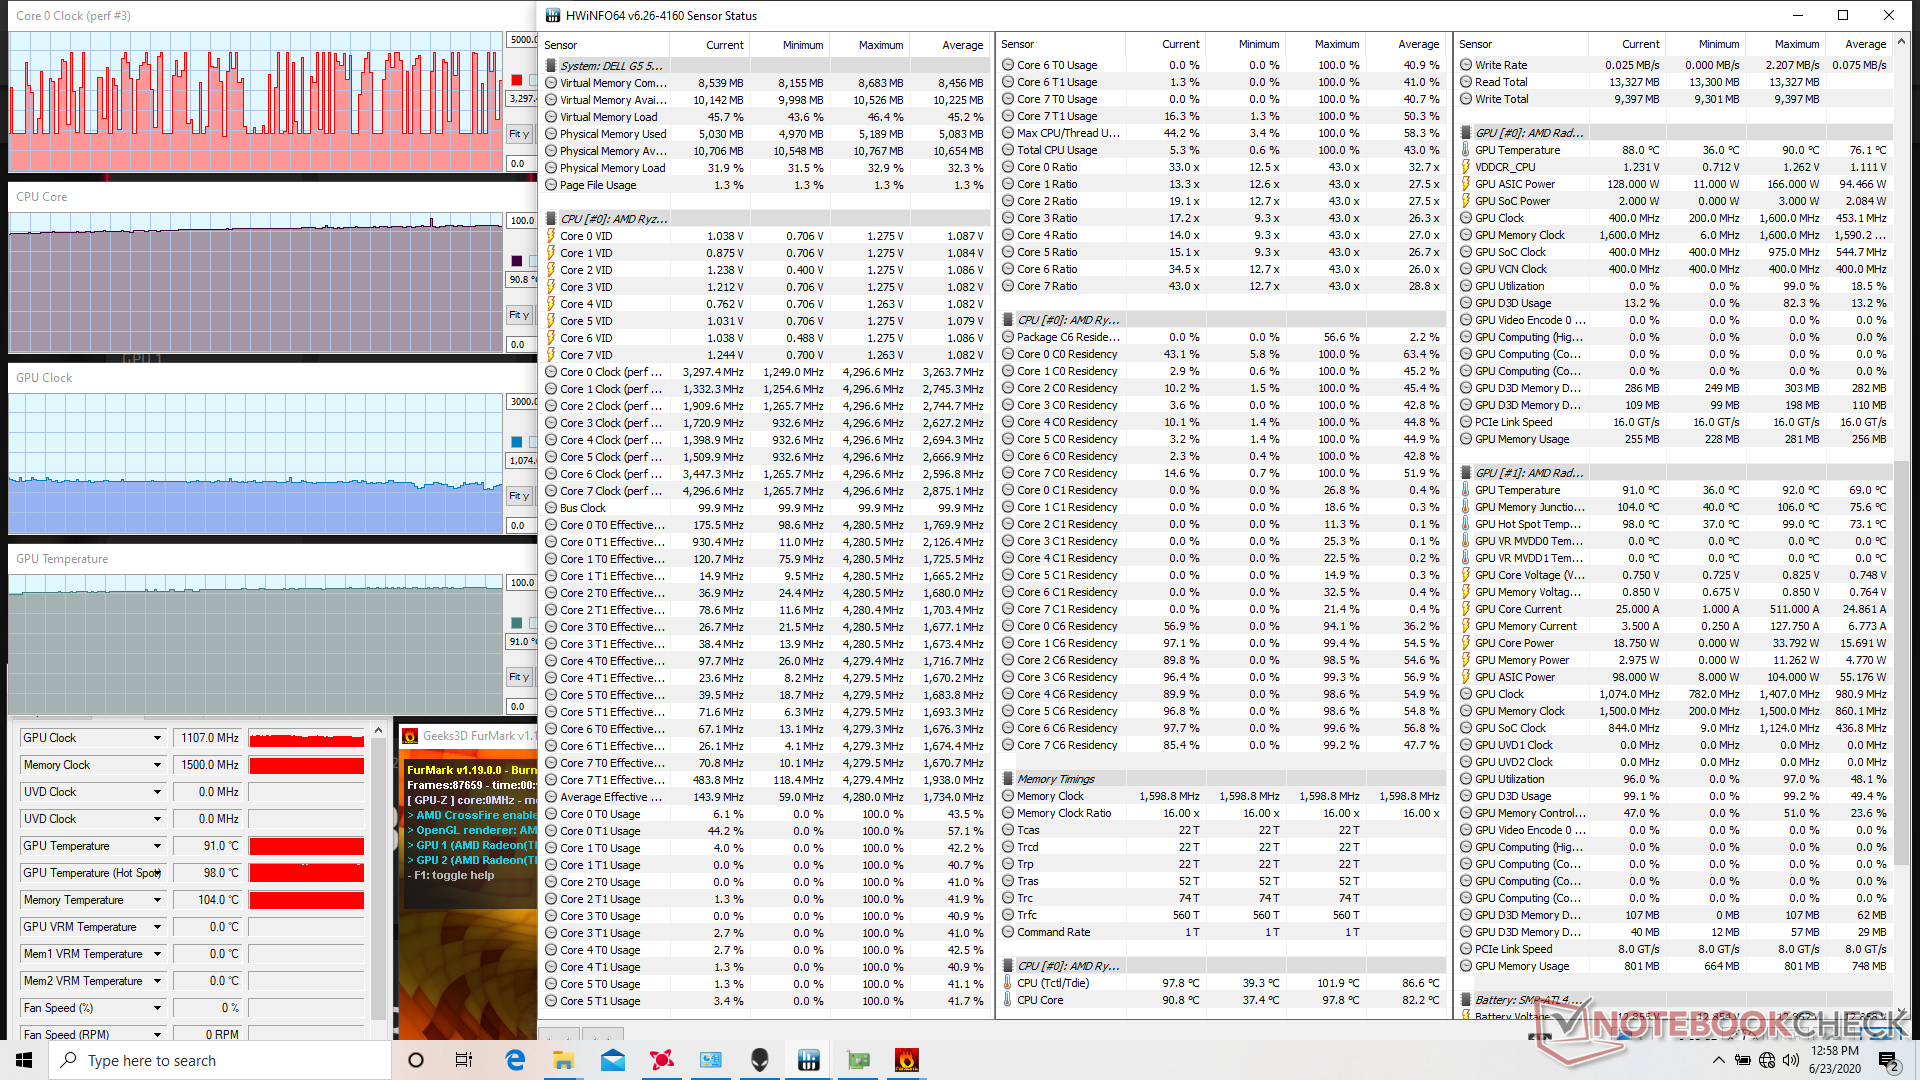
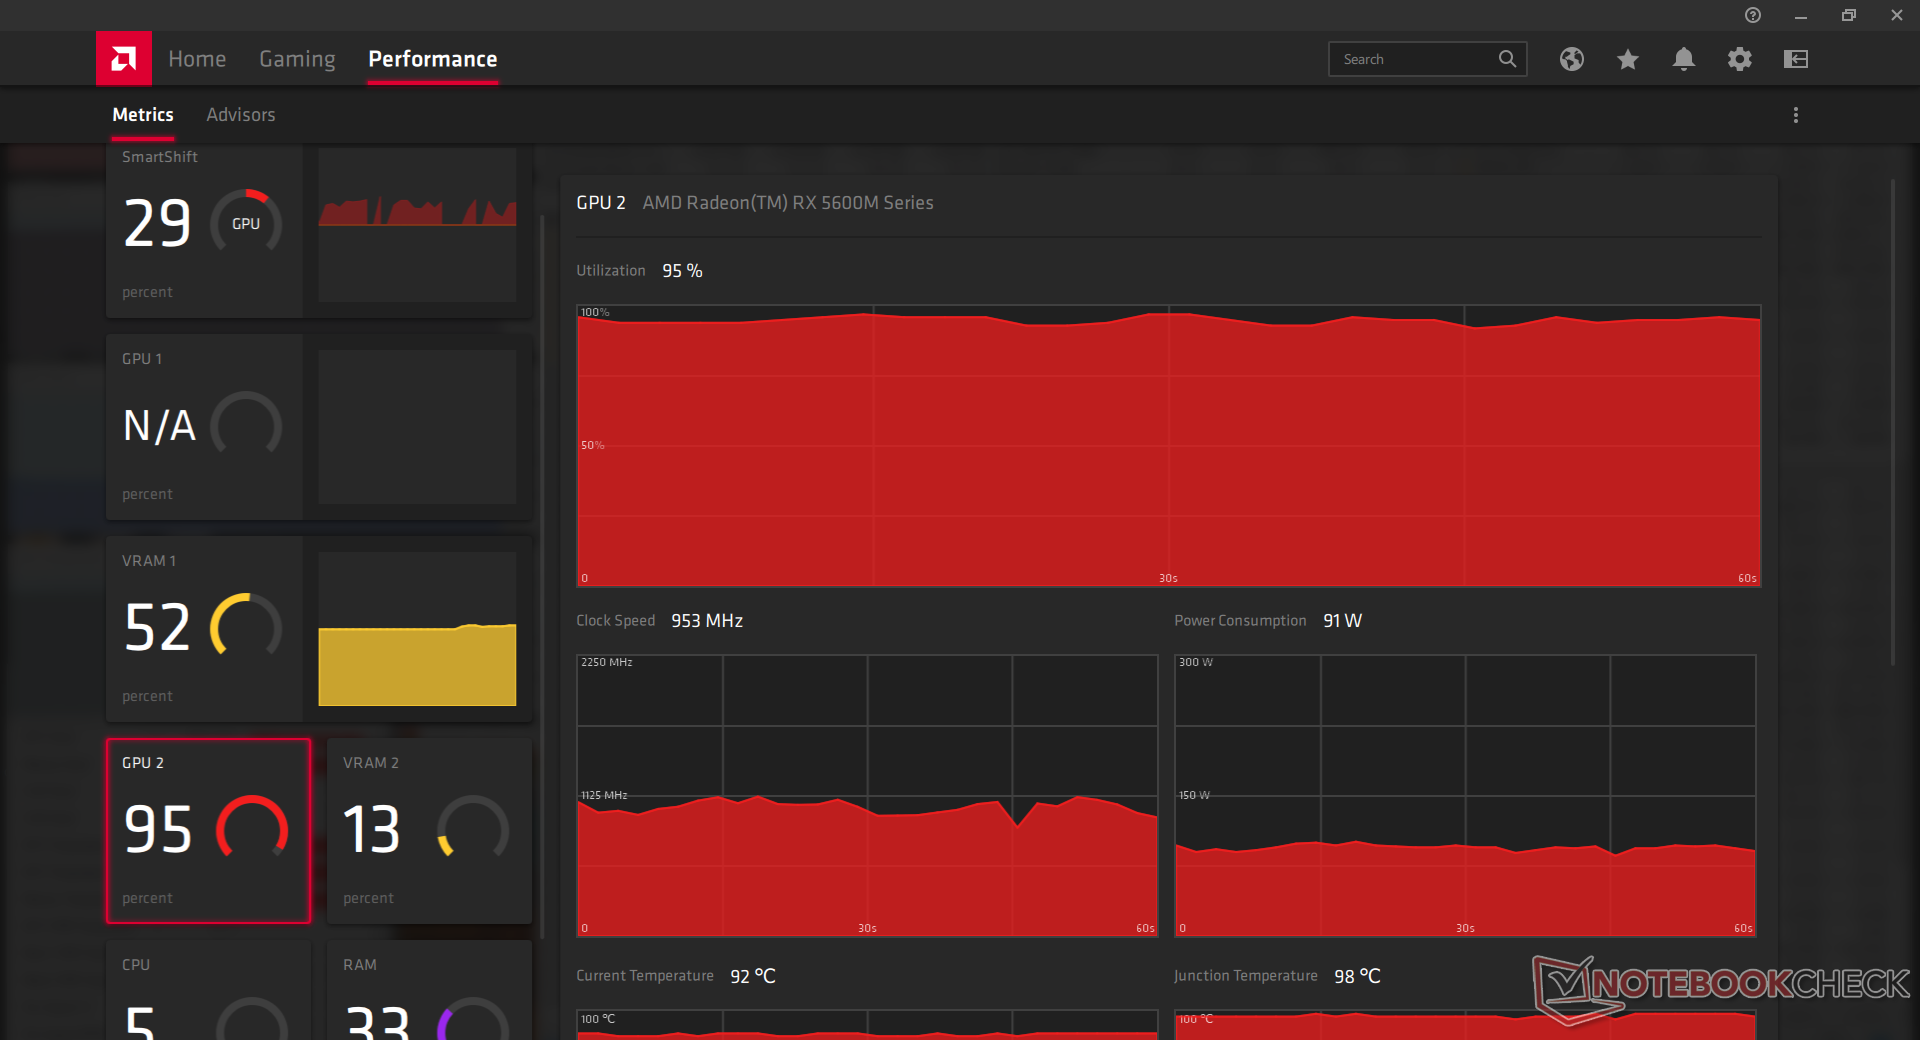
Temperature results are unfortunately similar when gaming. Running Witcher 3, for example, causes the CPU and GPU to stabilize at 99 C and 93 C, respectively, to be much warmer than expected. These readings also explain the very warm surface temperatures we recorded above. Other 15.6-inch gaming laptops with comparable GeForce GTX 1660 Ti graphics are able to run cooler than our Dell. The Razer Blade 15 Base Model and Maingear Vector 15, for example, each hover around the low to mid 80 C range when under the same gaming loads.
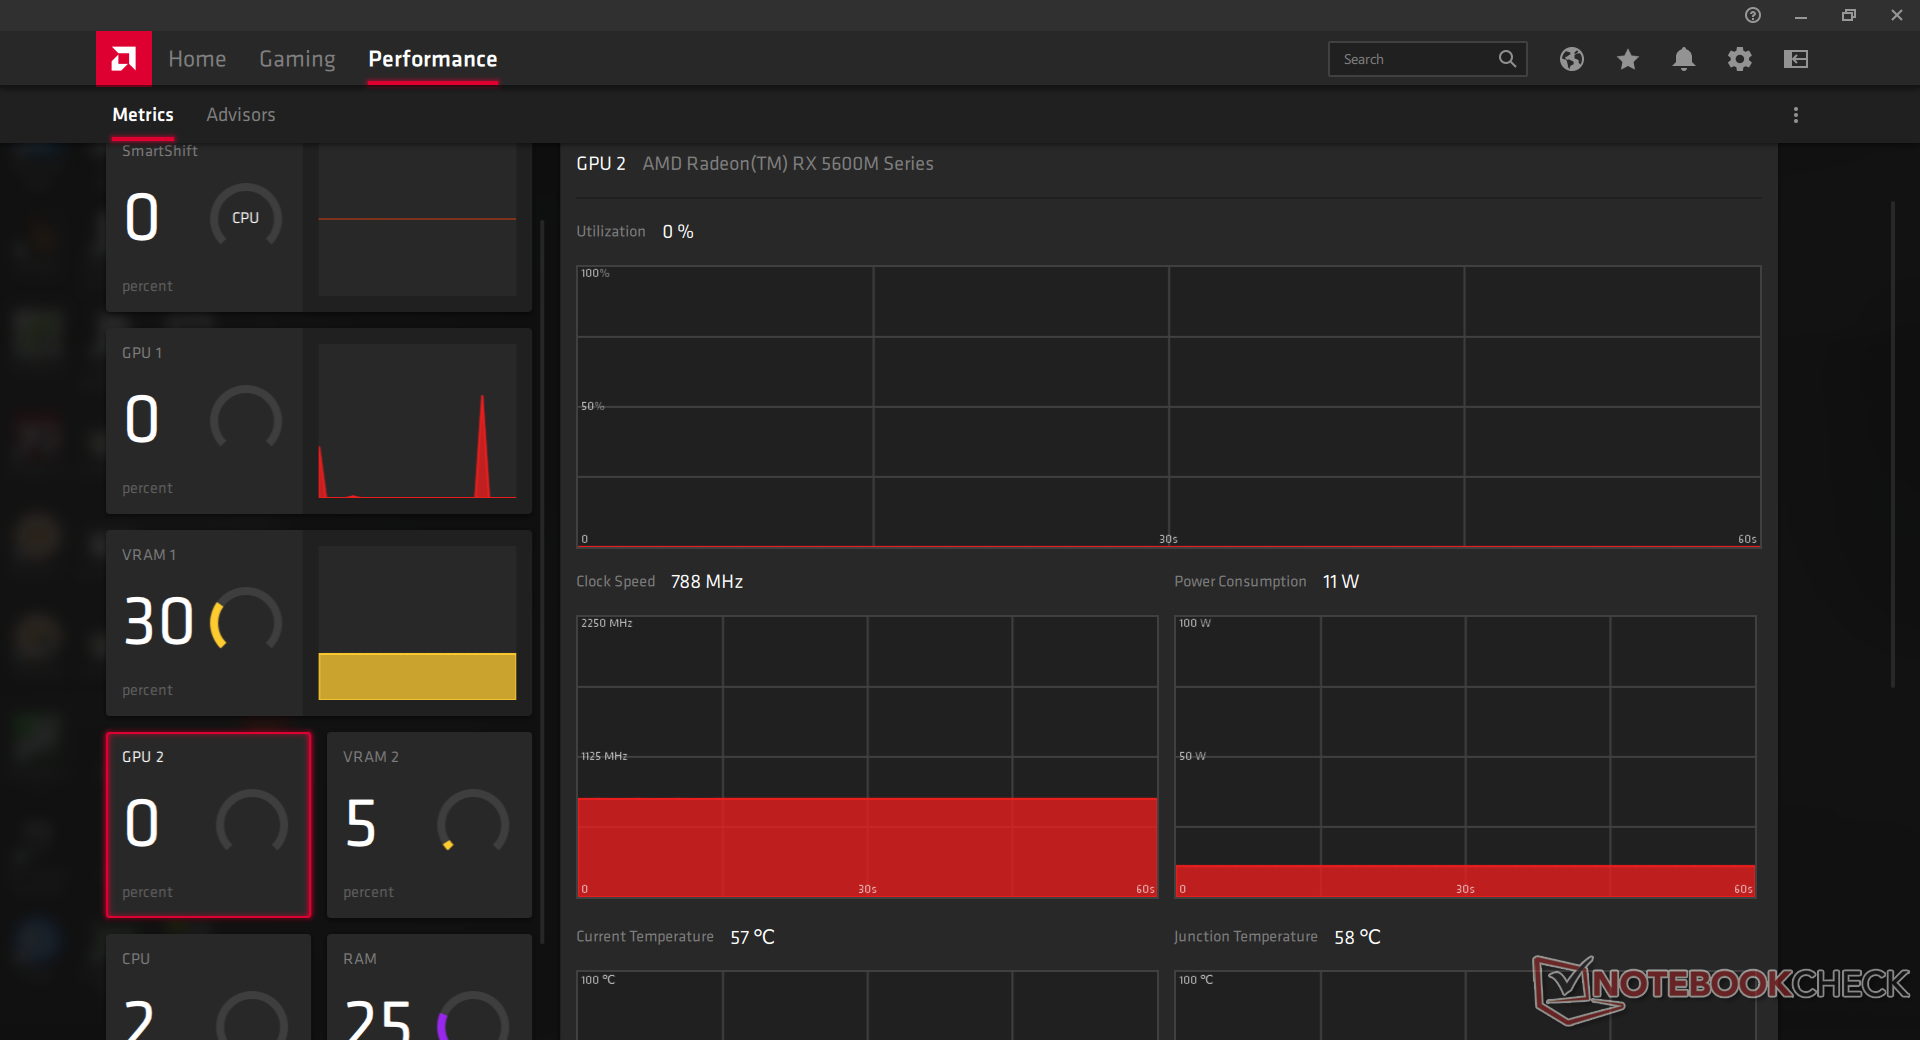
Running on battery power will limit performance especially because the system will automatically switch to the integrated Radeon GPU when disconnected from AC power. A Fire Strike test on batteries returns Physics and Graphics scores of 20266 and 3613 points, respectively, compared to 22299 and 18807 points when on mains.
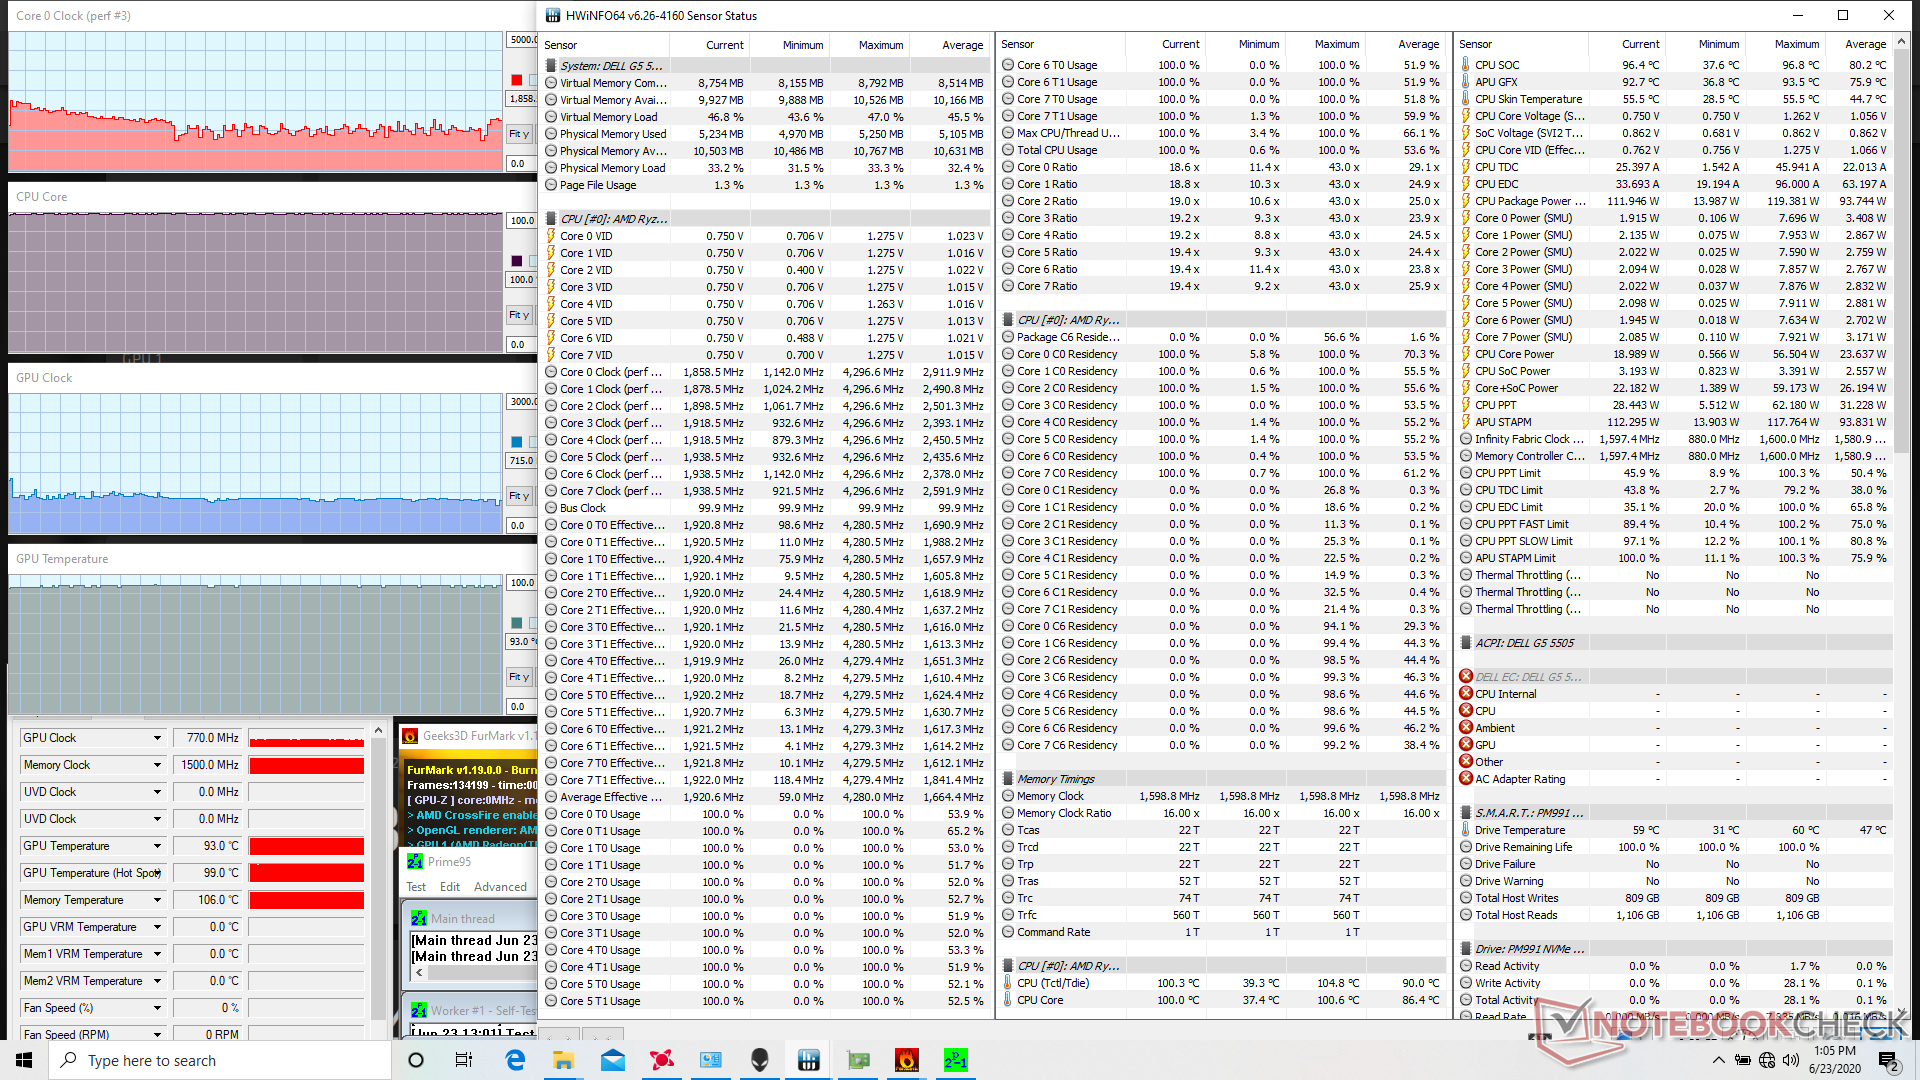
| CPU Clock (GHz) | GPU Clock (MHz) | Average CPU Temperature (°C) | Average GPU Temperature (°C) | |
| System Idle | -- | -- | 59 | 58 |
| Prime95 Stress | 4.0 | -- | 92 | 57 |
| FurMark Stress | -- | 1107 | 91 | 91 |
| Prime95 + FurMark Stress | ~1.5 | 770 | 100 | 93 |
| Witcher 3 Stress | 1.4 - 3.0 | 1352 | 99 | 93 |
Speakers


Energy Management
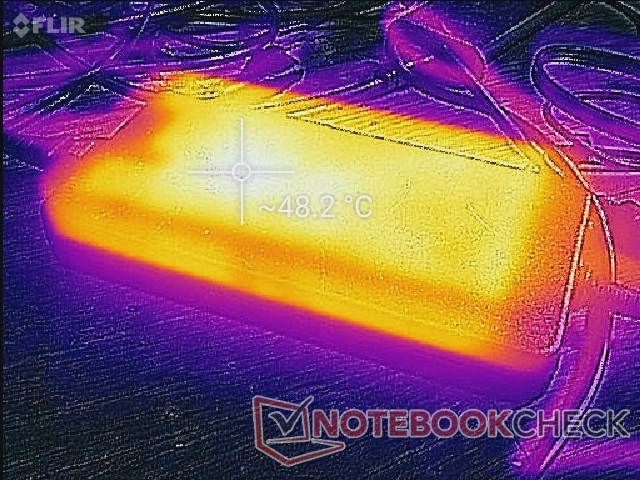
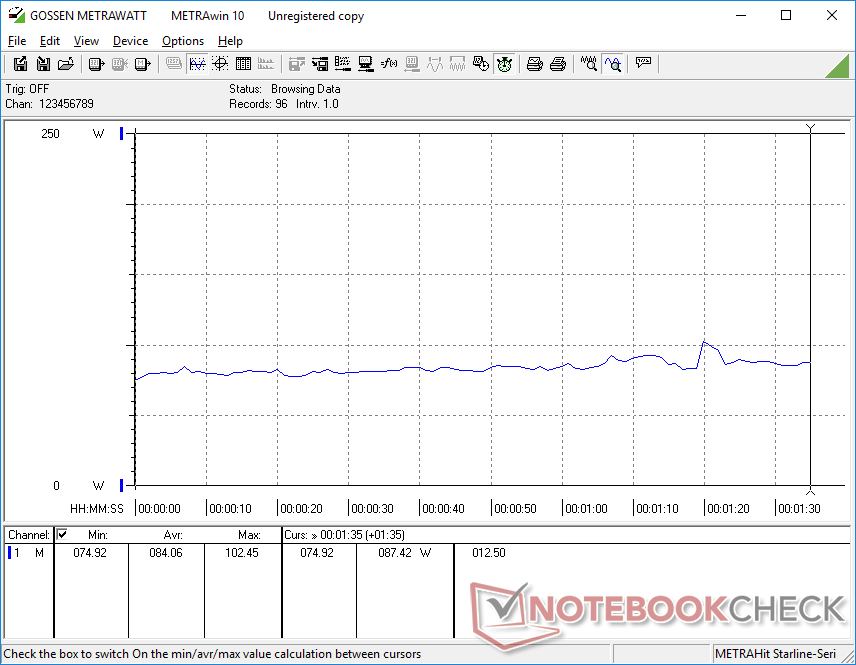
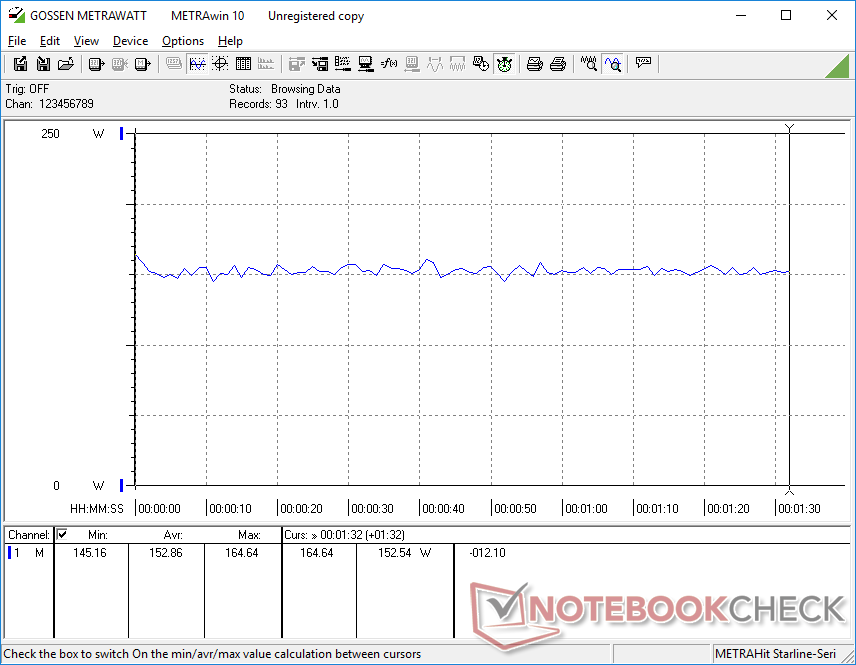
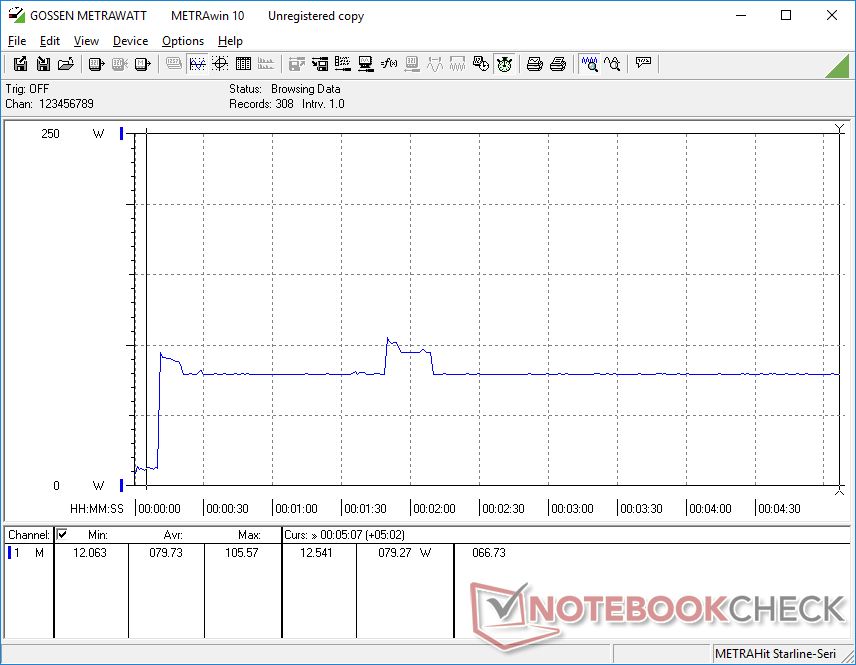
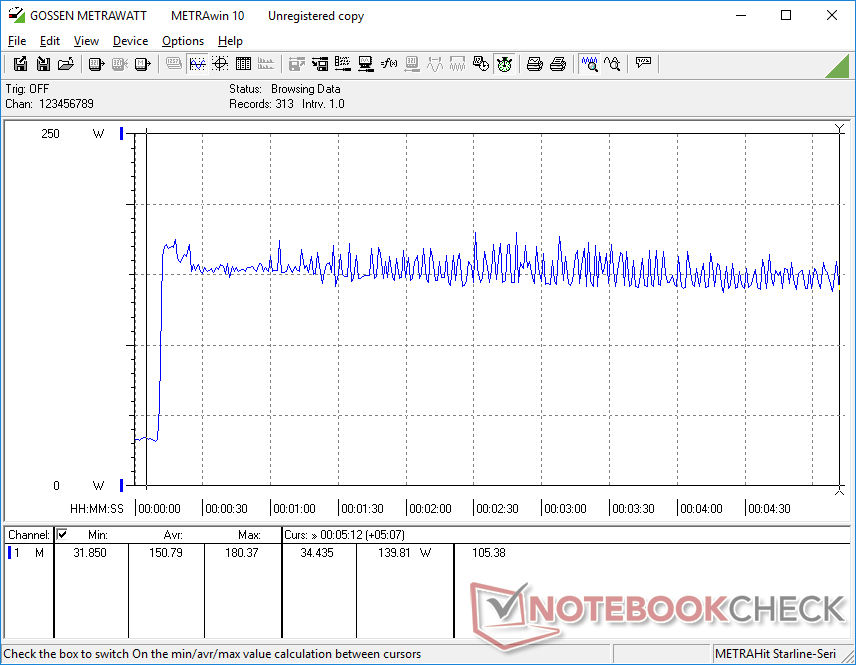
Power Consumption
Nvidia laptops with the comparable GeForce RTX 2060 still have the performance-per-watt advantage. When running Witcher 3, for example, our Dell would consume an average of 153 W compared to 144 W and 134 W on the Asus TUF A15 FA506IV and Eluktronics RP-15, respectively, each with the same Ryzen 7 CPU but RTX 2060 GPU.
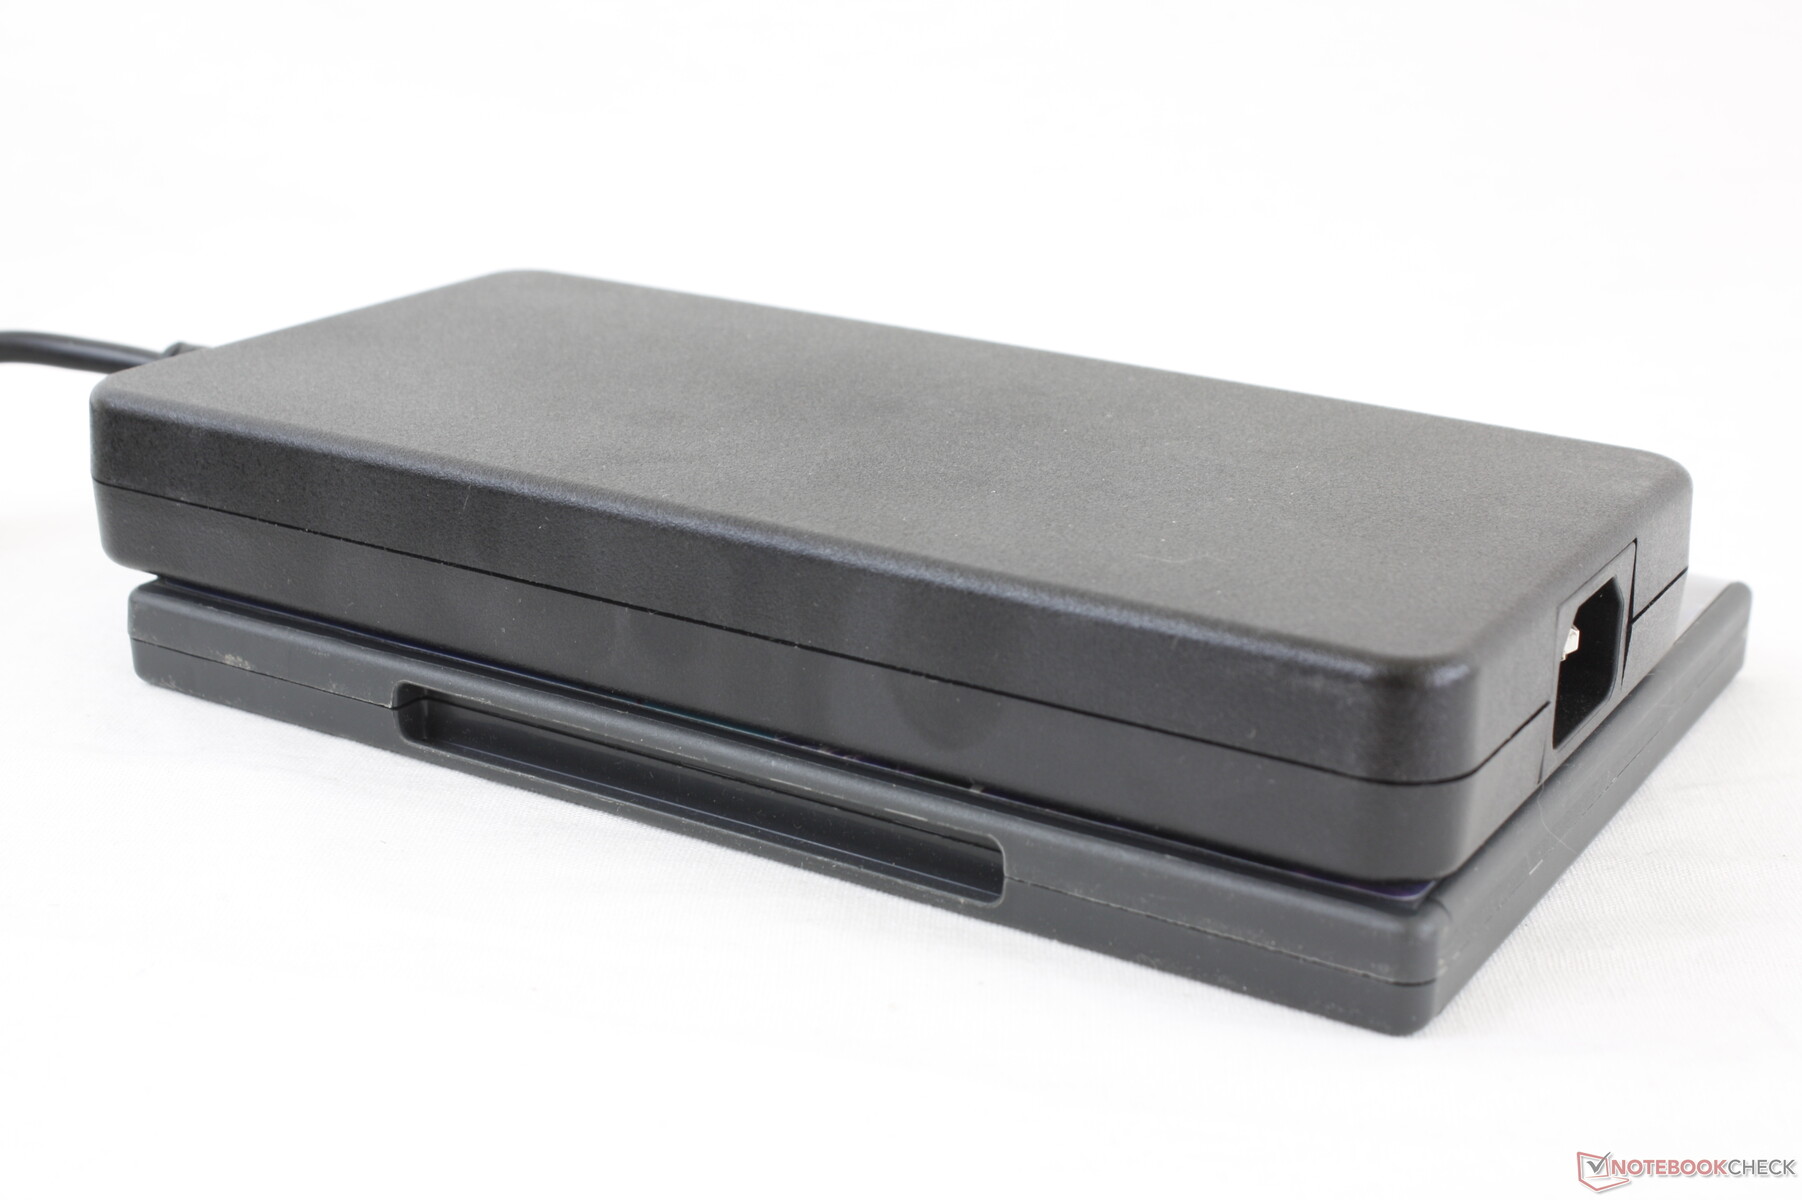
We're able to record a maximum demand of 180 W from the large (~20 x 10 x 2.9 cm) 240 W AC adapter. Dell could have probably went with a smaller and more portable adapter without having to compromise performance.
| Kapalı / Bekleme modu | |
| Boşta | |
| Çalışırken |
|
Key:
min: | |
| Dell G5 15 SE 5505 P89F R7 4800H, Radeon RX 5600M, Samsung PM991 MZ9LQ512HALU, WVA, 1920x1080, 15.6" | Dell G5 15 5590-P8RVW i7-9750H, GeForce RTX 2070 Max-Q, SK Hynix BC501 HFM512GDJTNG, IPS, 1920x1080, 15.6" | Asus TUF Gaming A15 FA506IV-HN172 R7 4800H, GeForce RTX 2060 Mobile, Kingston OM8PCP3512F-AB, IPS, 1920x1080, 15.6" | HP Omen 15-dc1020ng i5-9300H, GeForce GTX 1650 Mobile, WDC PC SN720 SDAQNTW-512G, IPS, 1920x1080, 15.6" | MSI Alpha 15 A3DDK-034 R7 3750H, Radeon RX 5500M, Kingston RBUSNS8154P3512GJ, IPS, 1920x1080, 15.6" | Schenker XMG Core 15 GK5CP6V i7-9750H, GeForce GTX 1660 Ti Mobile, Samsung SSD 970 EVO Plus 500GB, IPS, 1920x1080, 15.6" | |
|---|---|---|---|---|---|---|
| Power Consumption | -24% | -1% | 22% | -57% | -16% | |
| Idle Minimum * (Watt) | 6.5 | 5 23% | 5.4 17% | 4.04 38% | 14 -115% | 9 -38% |
| Idle Average * (Watt) | 10.6 | 13 -23% | 10 6% | 7.2 32% | 18 -70% | 12 -13% |
| Idle Maximum * (Watt) | 11 | 23 -109% | 10.5 5% | 11.4 -4% | 32 -191% | 18 -64% |
| Load Average * (Watt) | 84.1 | 121 -44% | 135 -61% | 80.8 4% | 64 24% | 86 -2% |
| Witcher 3 ultra * (Watt) | 152.9 | 133 13% | 144 6% | 93.6 39% | 123 20% | 126 18% |
| Load Maximum * (Watt) | 180.4 | 184 -2% | 147 19% | 144.5 20% | 193 -7% | 173 4% |
* ... daha küçük daha iyidir
Battery Life
Two battery capacities are available: 51 Wh for the lower-end SKUs and 68 Wh for the higher-end SKUs. Our test unit comes with the 51 Wh option, but both are downgrades when compared to the 90 Wh option on the last generation G5 15 5590.
Runtimes are still slightly above average for a gaming laptop at just over 6 hours of real-world WLAN use despite the reduction in battery capacity. Charging from empty to full capacity, however, is slower than expected at 2 to 2.5 hours. The system cannot be recharged via USB-C.
| Dell G5 15 SE 5505 P89F R7 4800H, Radeon RX 5600M, 51 Wh | Dell G5 15 5590-P8RVW i7-9750H, GeForce RTX 2070 Max-Q, 90 Wh | Asus TUF Gaming A15 FA506IV-HN172 R7 4800H, GeForce RTX 2060 Mobile, 48 Wh | HP Omen 15-dc1020ng i5-9300H, GeForce GTX 1650 Mobile, 52.5 Wh | MSI Alpha 15 A3DDK-034 R7 3750H, Radeon RX 5500M, 51 Wh | Lenovo Legion Y740-15ICHg i7-9750H, GeForce RTX 2070 Max-Q, 57 Wh | |
|---|---|---|---|---|---|---|
| Pil Çalışma Süresi | -8% | 5% | 8% | -43% | -52% | |
| Reader / Idle (h) | 11.2 | 8.6 -23% | 9.8 -12% | 15.9 42% | 5.8 -48% | |
| WiFi v1.3 (h) | 6.2 | 5.7 -8% | 6.2 0% | 6.4 3% | 4.1 -34% | 3 -52% |
| Load (h) | 1.5 | 1.6 7% | 1.9 27% | 1.2 -20% | 0.8 -47% | |
| Witcher 3 ultra (h) | 1 |
Artılar
Eksiler
Verdict
A 15.6-inch gaming laptop with Core i7-9750H CPU and GeForce RTX 2060 GPU will typically run about $1200 USD. The all-AMD Dell G5 15 SE can be configured with the Ryzen 5 4600H CPU and Radeon RX 5600M GPU for very similar results for about $300 less. Performance-per-dollar is therefore the biggest advantage of the system in a market still dominated by Intel-Nvidia options.
There are notable disadvantages to keep in mind with temperature and fan noise being the most striking. Warm processors are expected from gaming laptops, but when you're reaching ~95 C when gaming with fans on full blast, this doesn't leave very strong first impressions especially in regard to the longevity of the system.
Other drawbacks relate mostly to the inexpensive price point. The noticeable backlight bleeding, USB 2.0 ports, lack of adaptive sync, and all-plastic chassis are the usual compromises on most ~$1000 gaming laptops. From a performance, serviceability, and display perspective, however, these features could easily be part of a laptop retailing for several hundreds more.
It's a lot of power for not a lot of money. Users will want to keep in mind that the impressive performance comes at the cost of both very warm temperatures and loud fans as a result.
Dell G5 15 SE 5505 P89F
- 06/24/2020 v7 (old)
Allen Ngo
Price comparison

