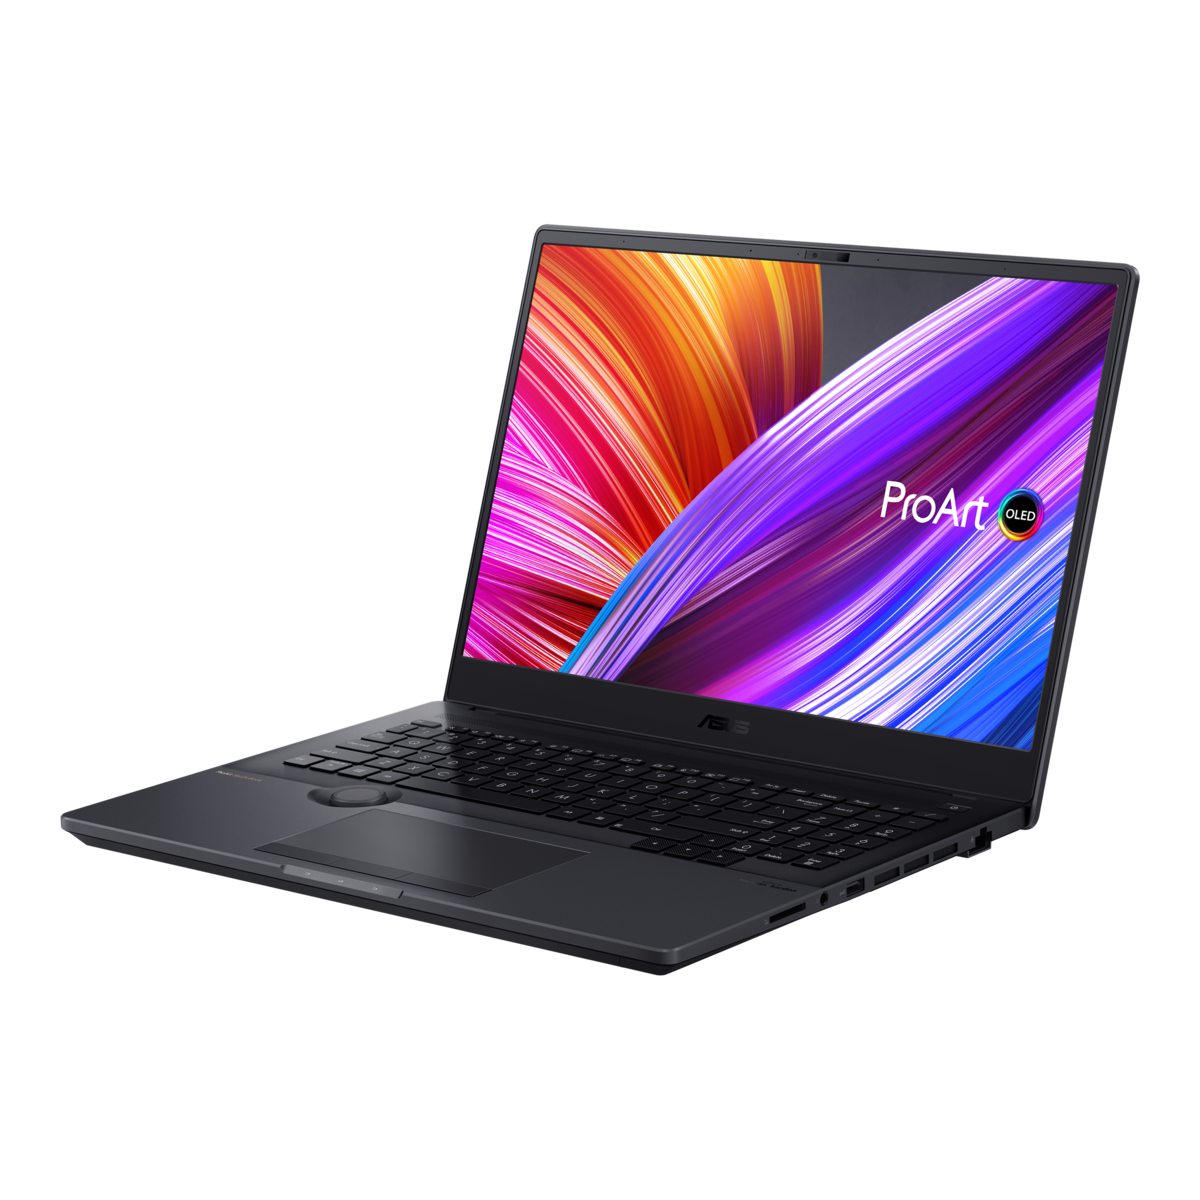
Asus ProArt StudioBook Pro 16 W7600 Dizüstü Bilgisayarı İncelemede: Güçlü ve hafif iş istasyonu
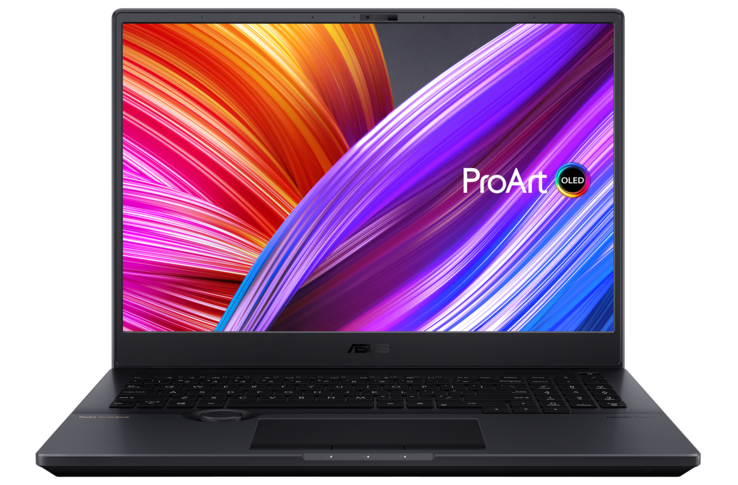
Asus, ProArt Studiobook Pro 16 ile yaratıcı profesyoneller için yeni bir dizüstü bilgisayar serisi sunuyor. İçerik oluşturucu dizüstü bilgisayar, daha geniş bir çalışma yüzeyi sunan 16:10 en boy oranına sahip 4K OLED HDR ekrana sahiptir. Ek olarak, çeşitli yaratıcı araçları kontrol etmek için kullanılabilen ve bu nedenle tasarımcılar için çalışmayı basitleştirmesi beklenen bir Asus Dial var. Üretici, donanım açısından büyük silahları ortaya çıkarıyor, çünkü yalnızca Intel'in 3. nesil Xeon CPU'su değil, aynı zamanda iş istasyonu GPU'su Nvidia RTX A5000. Bu nedenle serinin profesyonel kullanıcılara yönelik olması ve 3D oluşturma veya yüksek çözünürlüklü video düzenleme gibi karmaşık görevleri yerine getirmesi bekleniyor. Asus Almanya'nın bize sağladığı test ünitesi ön numune olduğu için cihaz henüz bizden puan alamıyor.
Rakipler arasında aynı donanıma sahip bir iş istasyonu olan HP ZBook Fury 15 G8 ile HP ZBook Studio 15 G8 ve Dell Precision 5560 yer alıyor.
Karşılaştırmada muhtemel rakipleri
Derece | Tarih | Model | Ağırlık | Yükseklik | Boyut | Çözünürlük | En iyi fiyat |
|---|---|---|---|---|---|---|---|
v (old) | 03/2022 | Asus ProArt StudioBook 16 W7600H5A-2BL2 W-11955M, RTX A5000 Laptop GPU | 2.4 kg | 21.4 mm | 16.00" | 3840x2400 | |
| 90.3 % v7 (old) | 12/2021 | HP ZBook Fury 15 G8 i9-11950H, RTX A5000 Laptop GPU | 2.5 kg | 25.9 mm | 15.60" | 3840x2160 | |
| 87.8 % v7 (old) | 10/2021 | HP ZBook Studio 15 G8 i9-11950H, GeForce RTX 3070 Laptop GPU | 1.9 kg | 18 mm | 15.60" | 3840x2160 | |
| 88.3 % v7 (old) | 12/2021 | Dell Precision 5000 5560 i7-11850H, RTX A2000 Laptop GPU | 2 kg | 18 mm | 15.60" | 3840x2400 |
Kasa
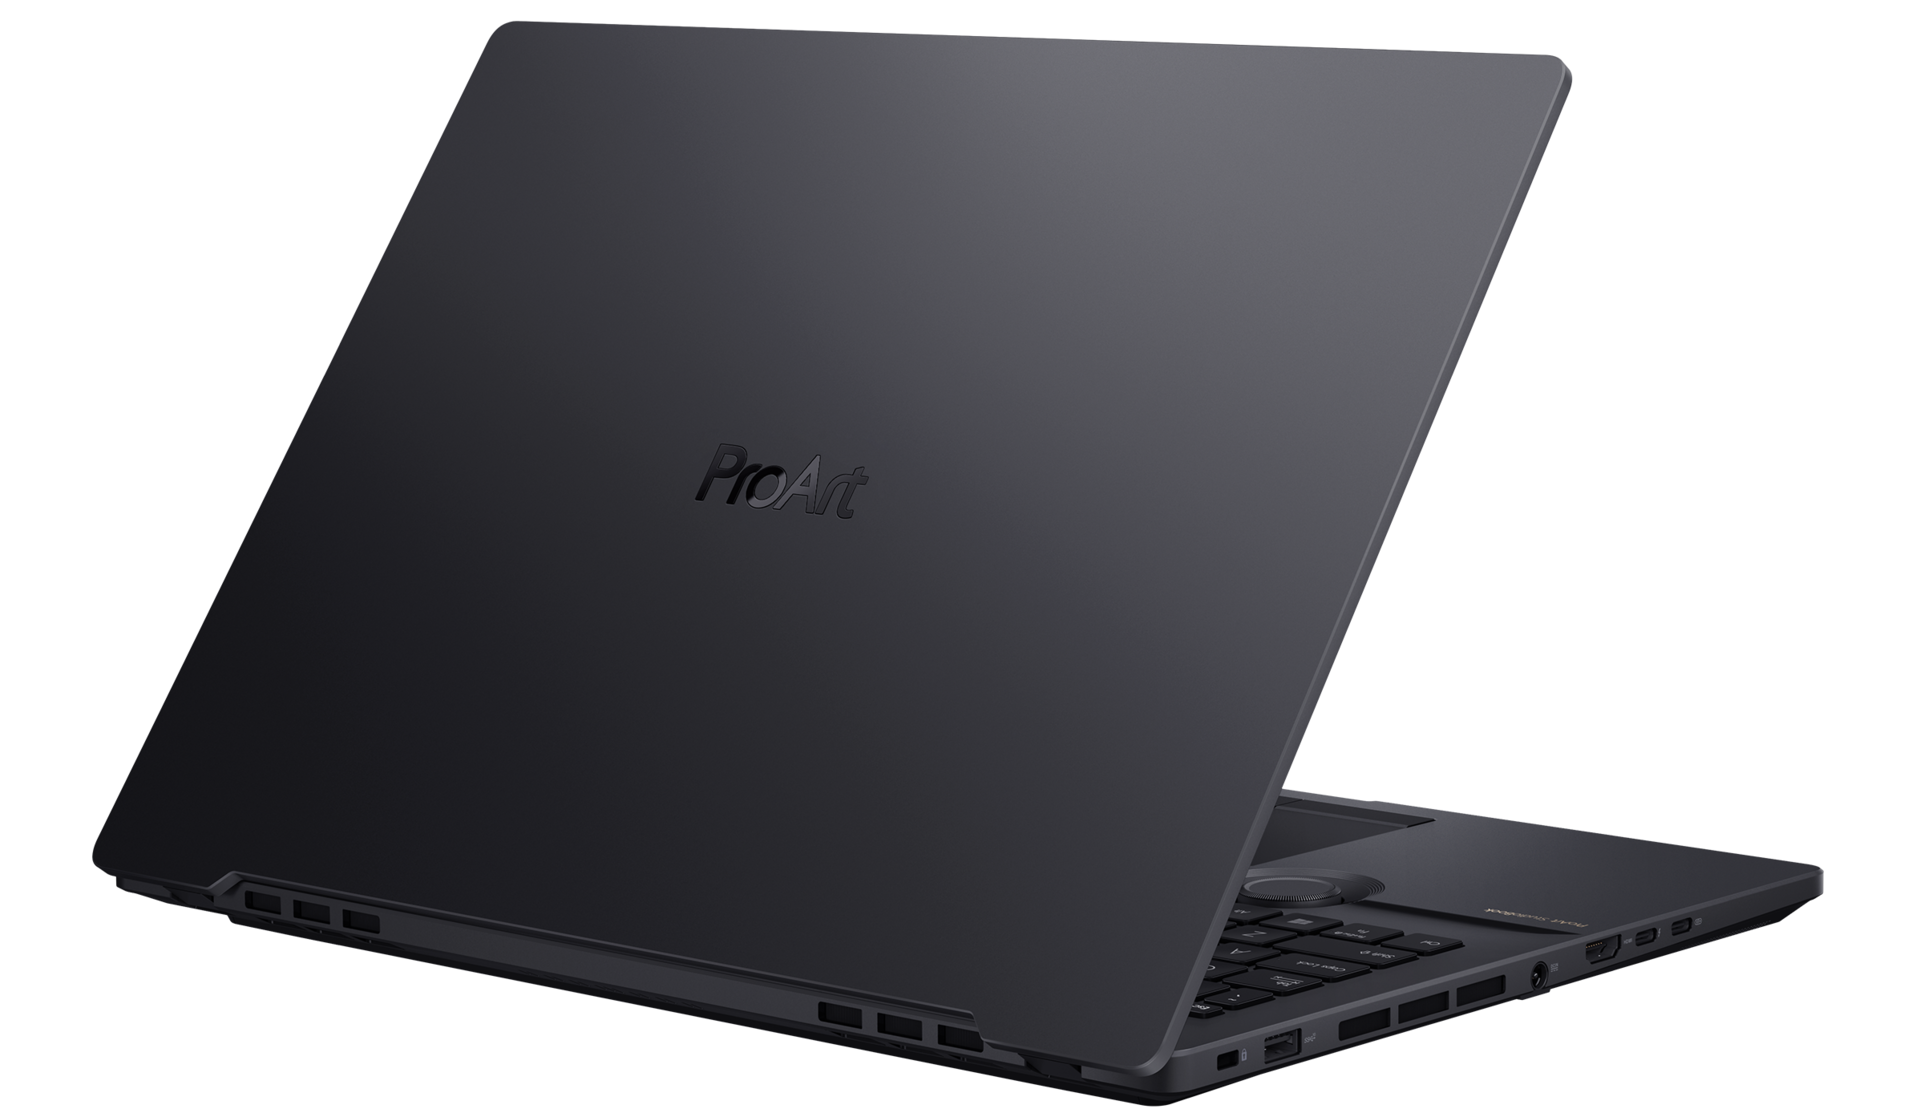
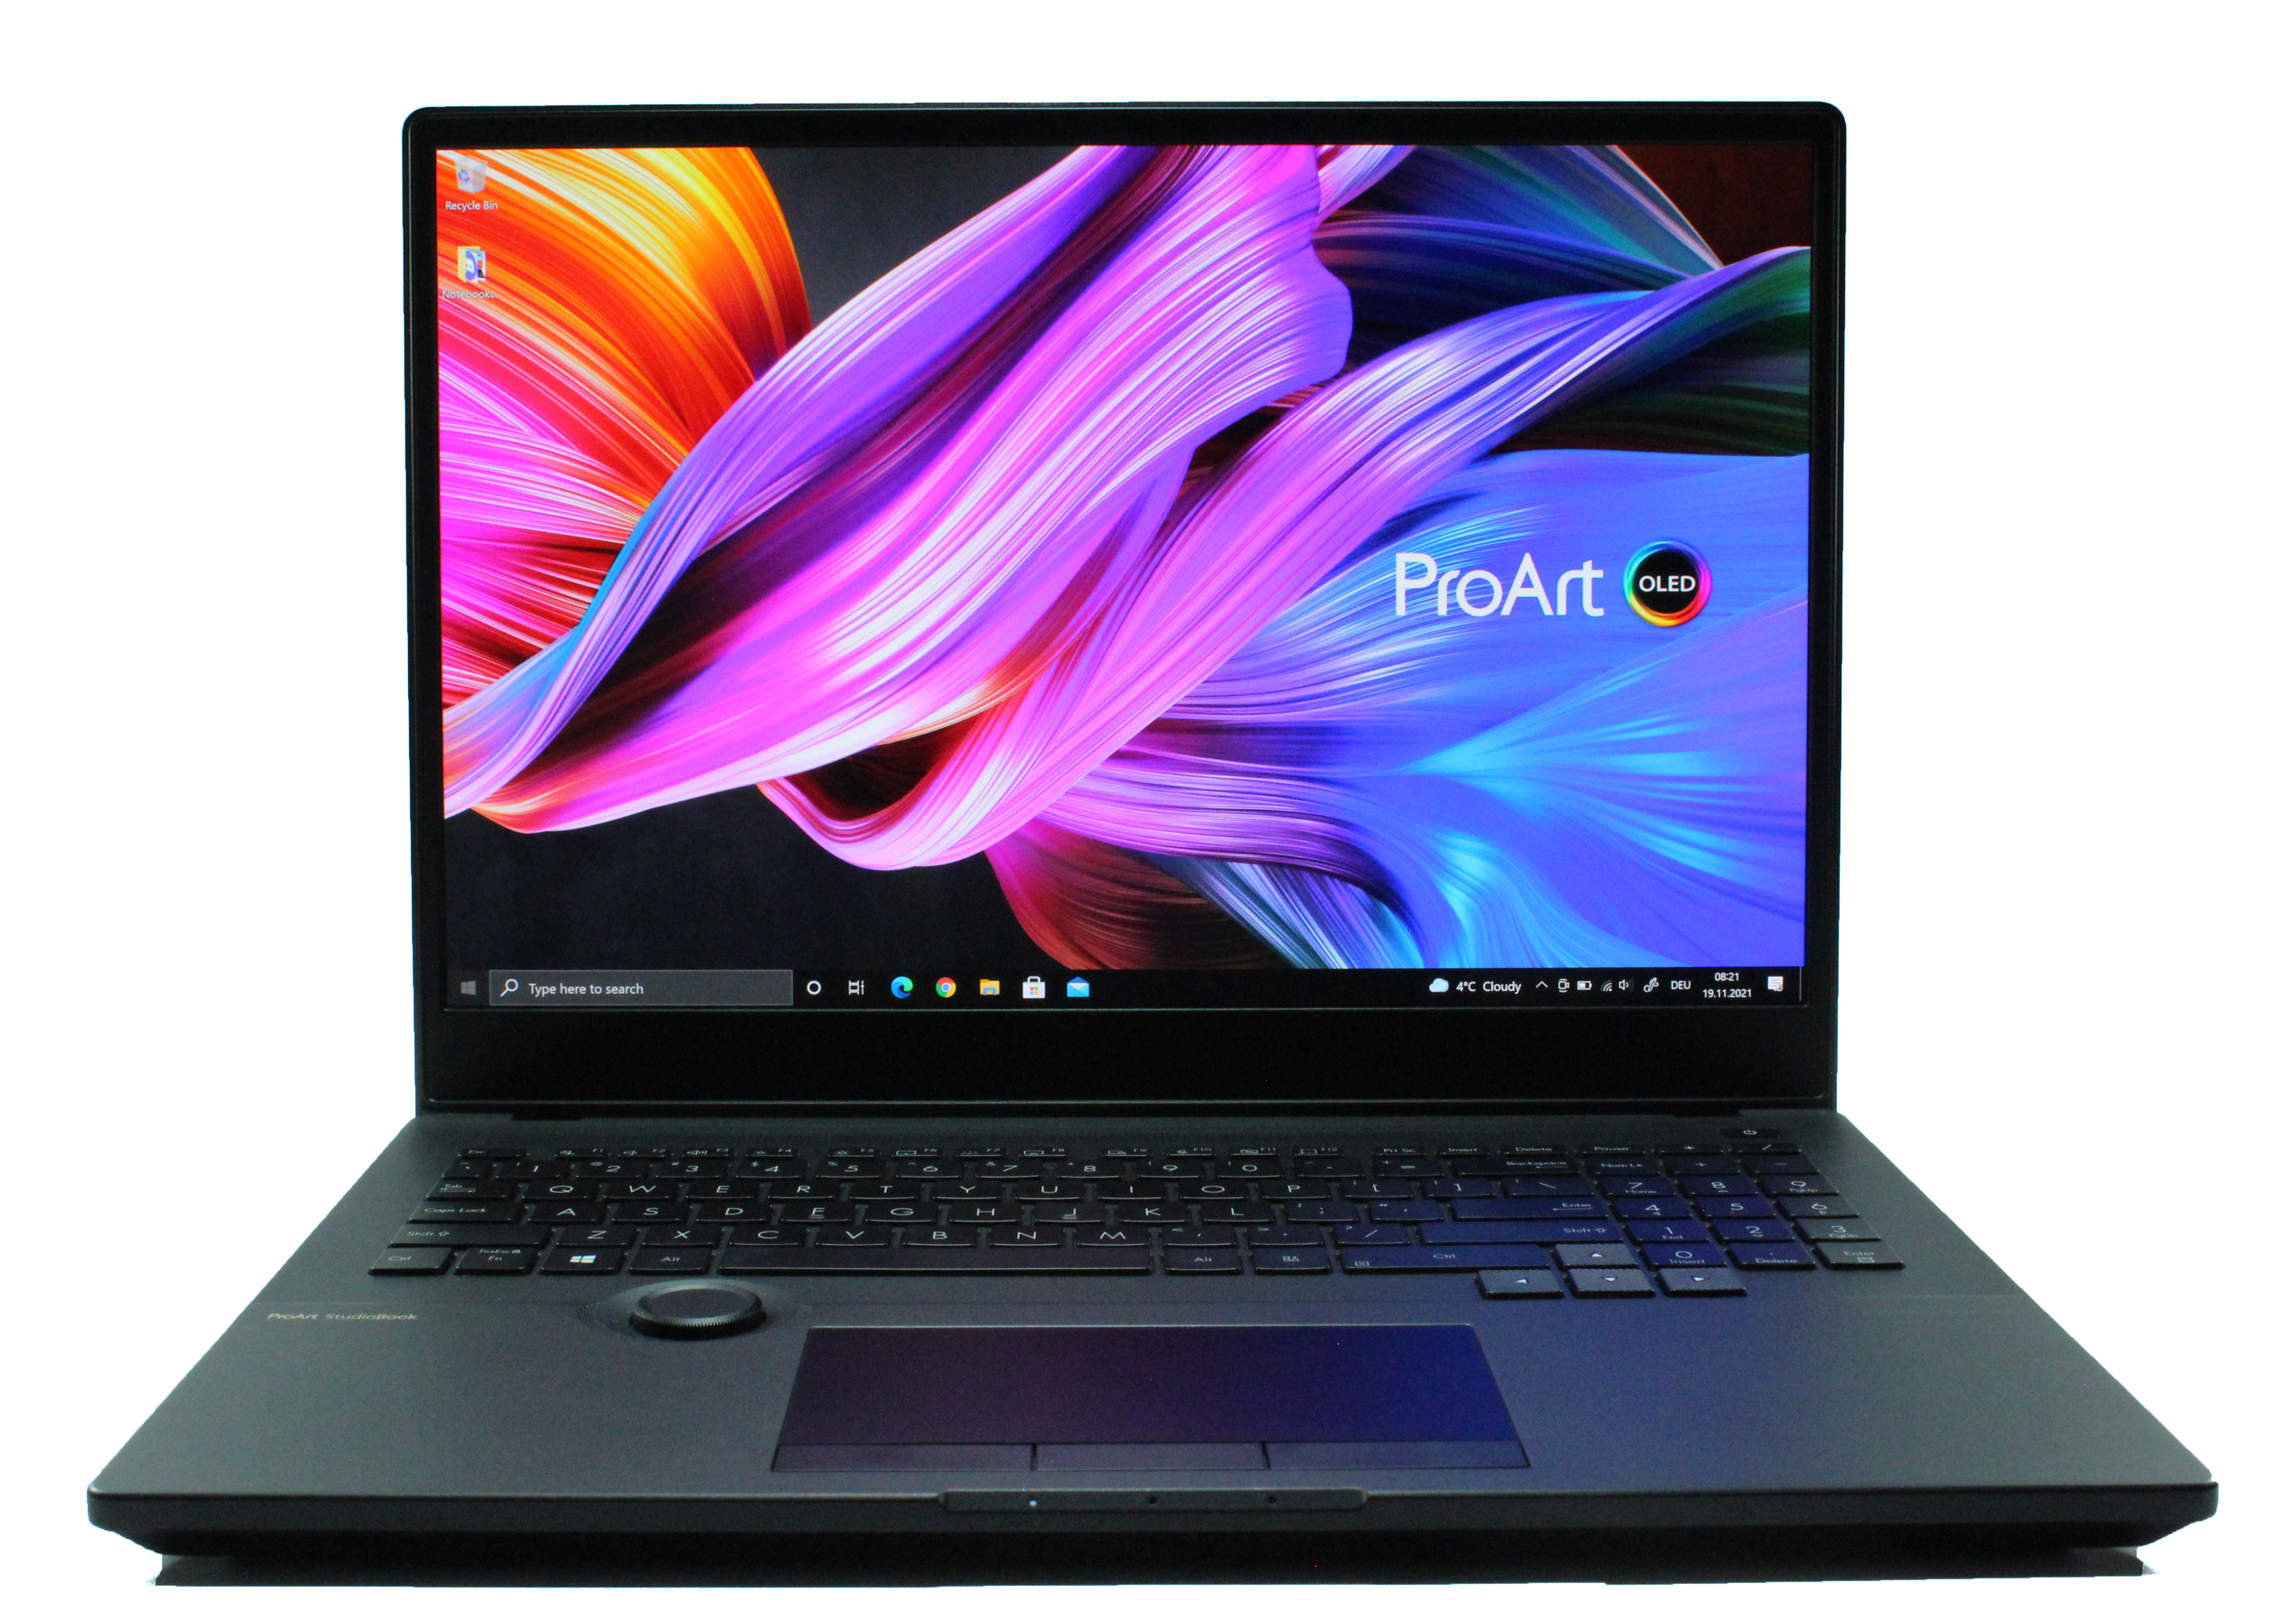
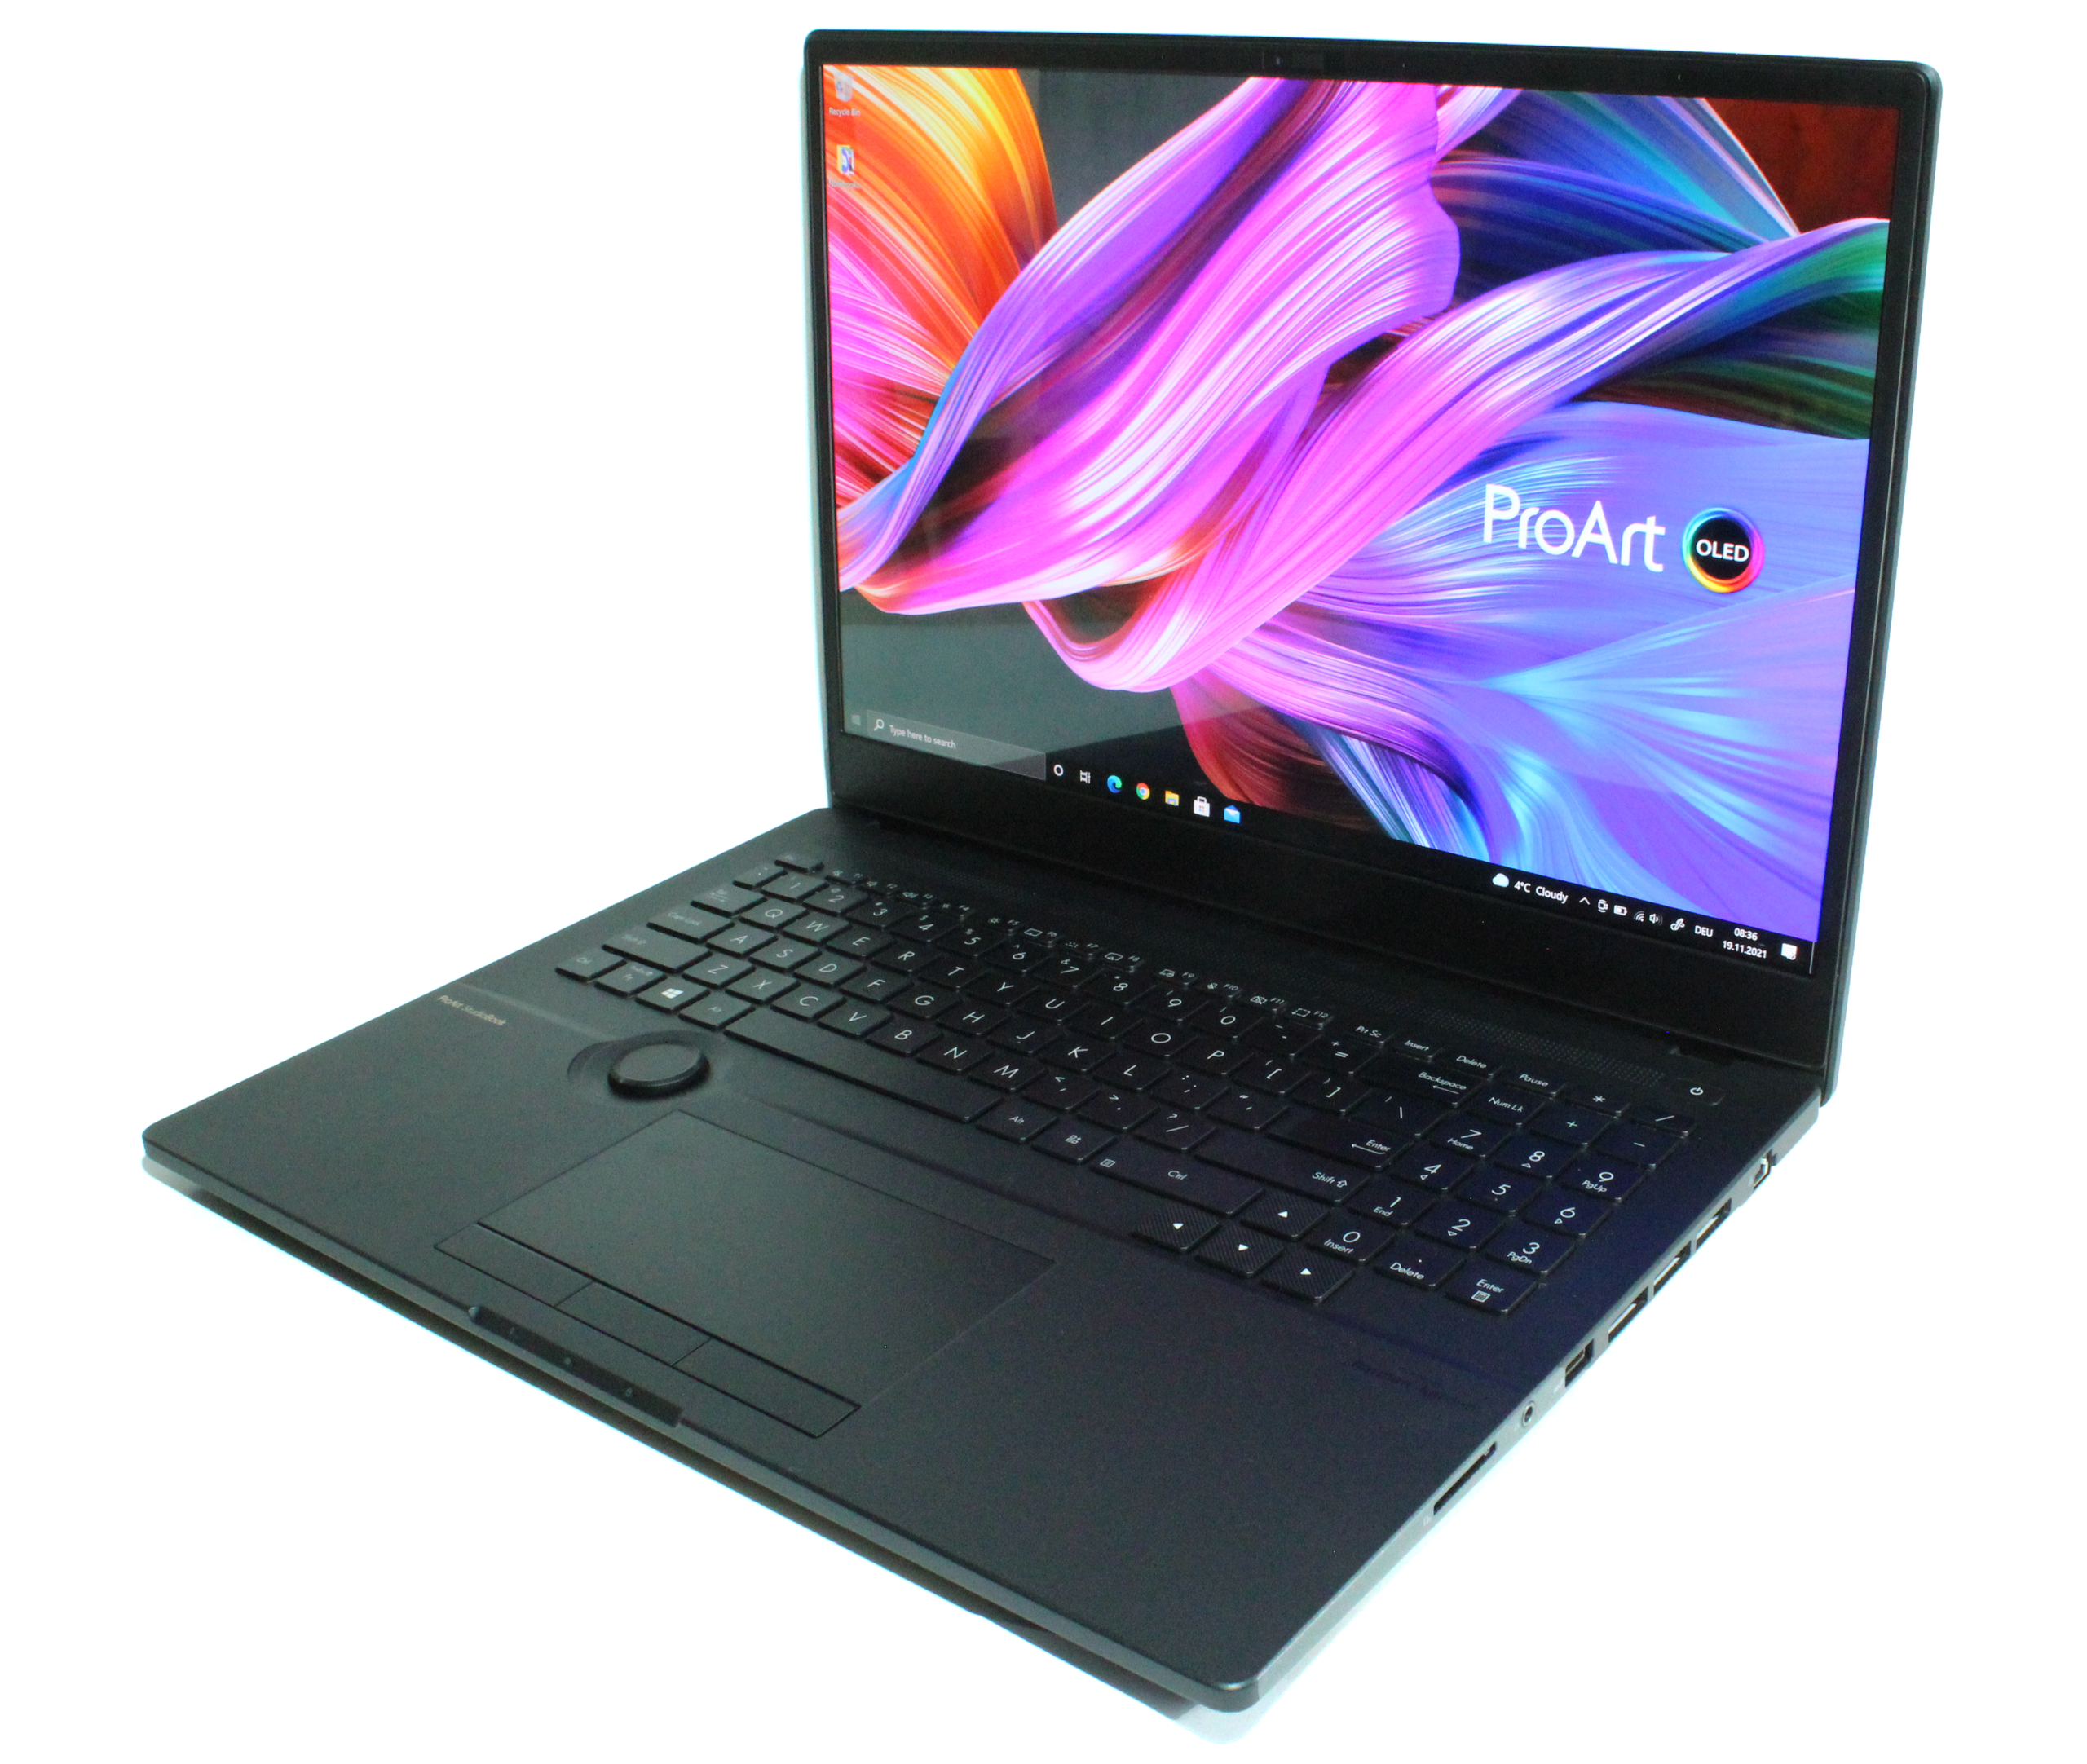
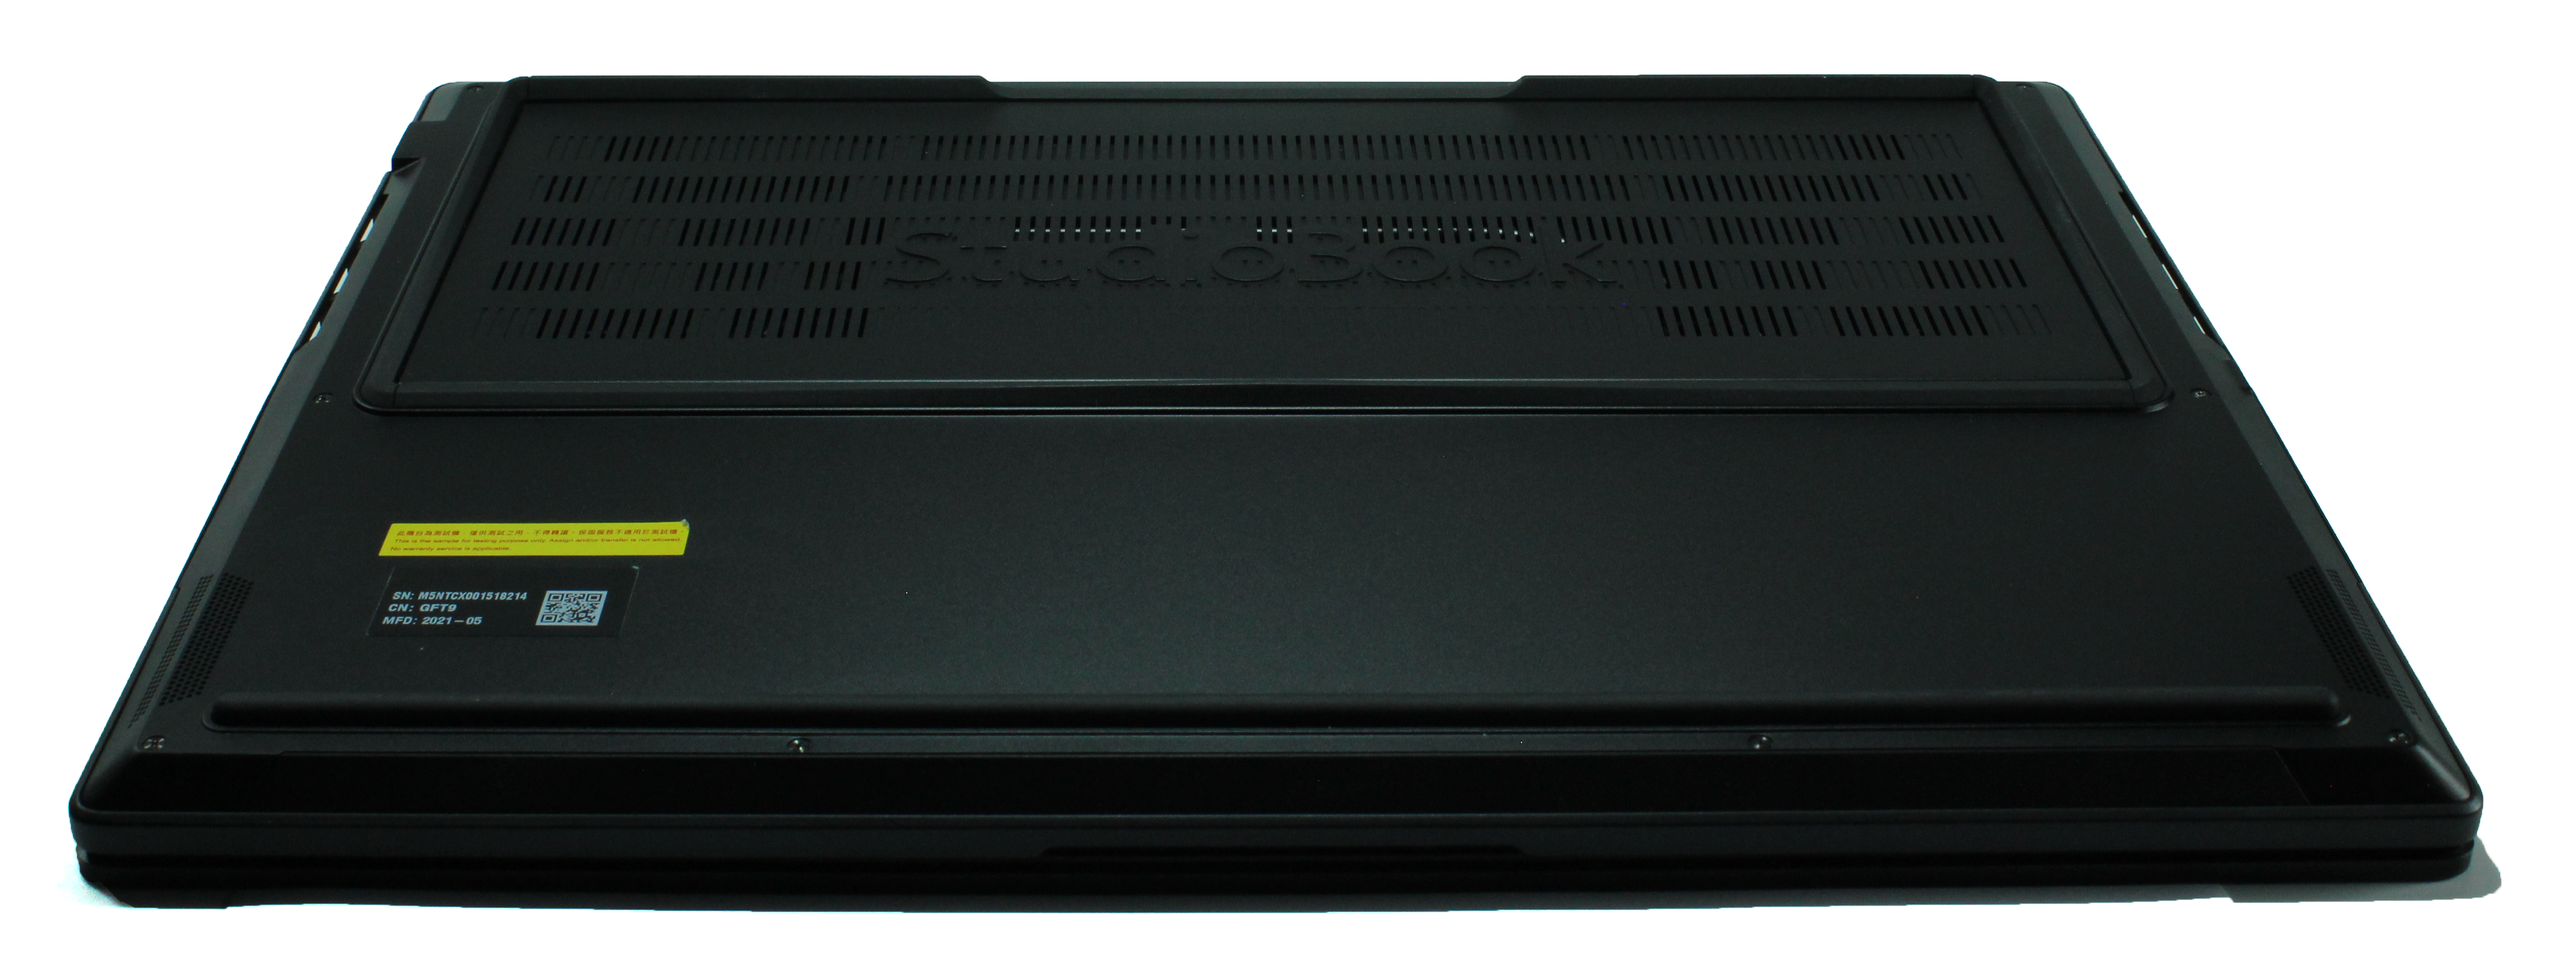
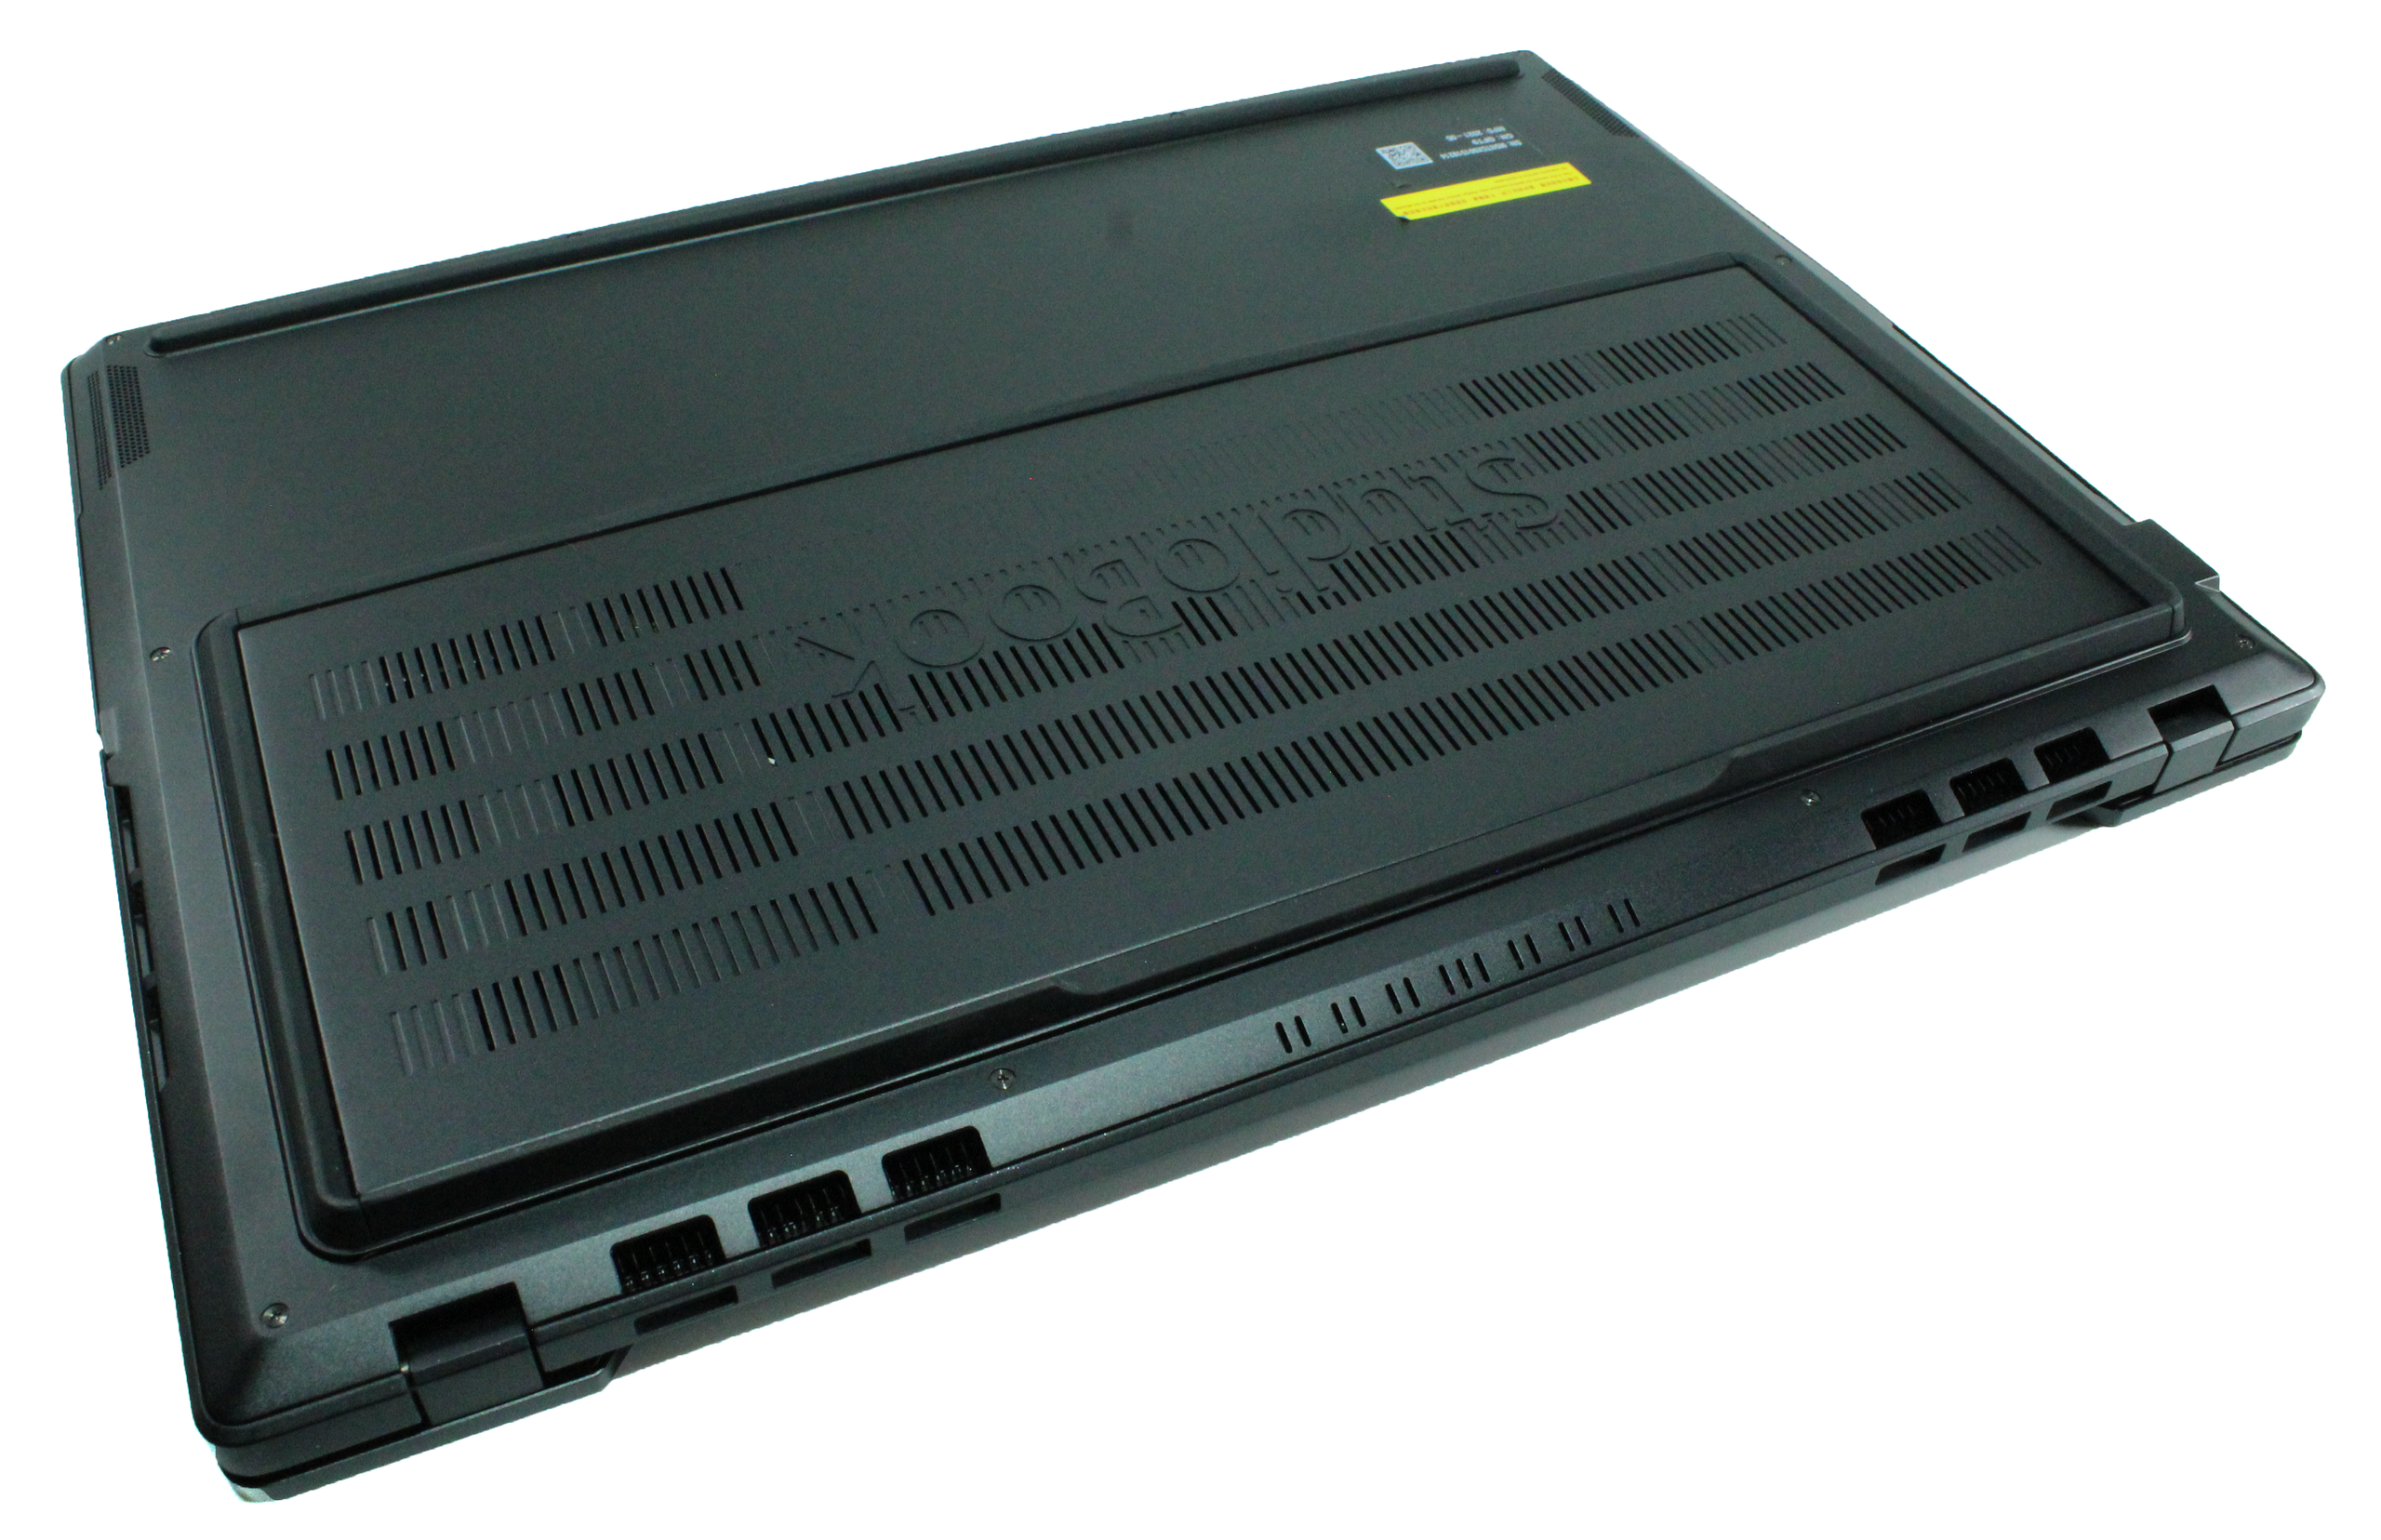
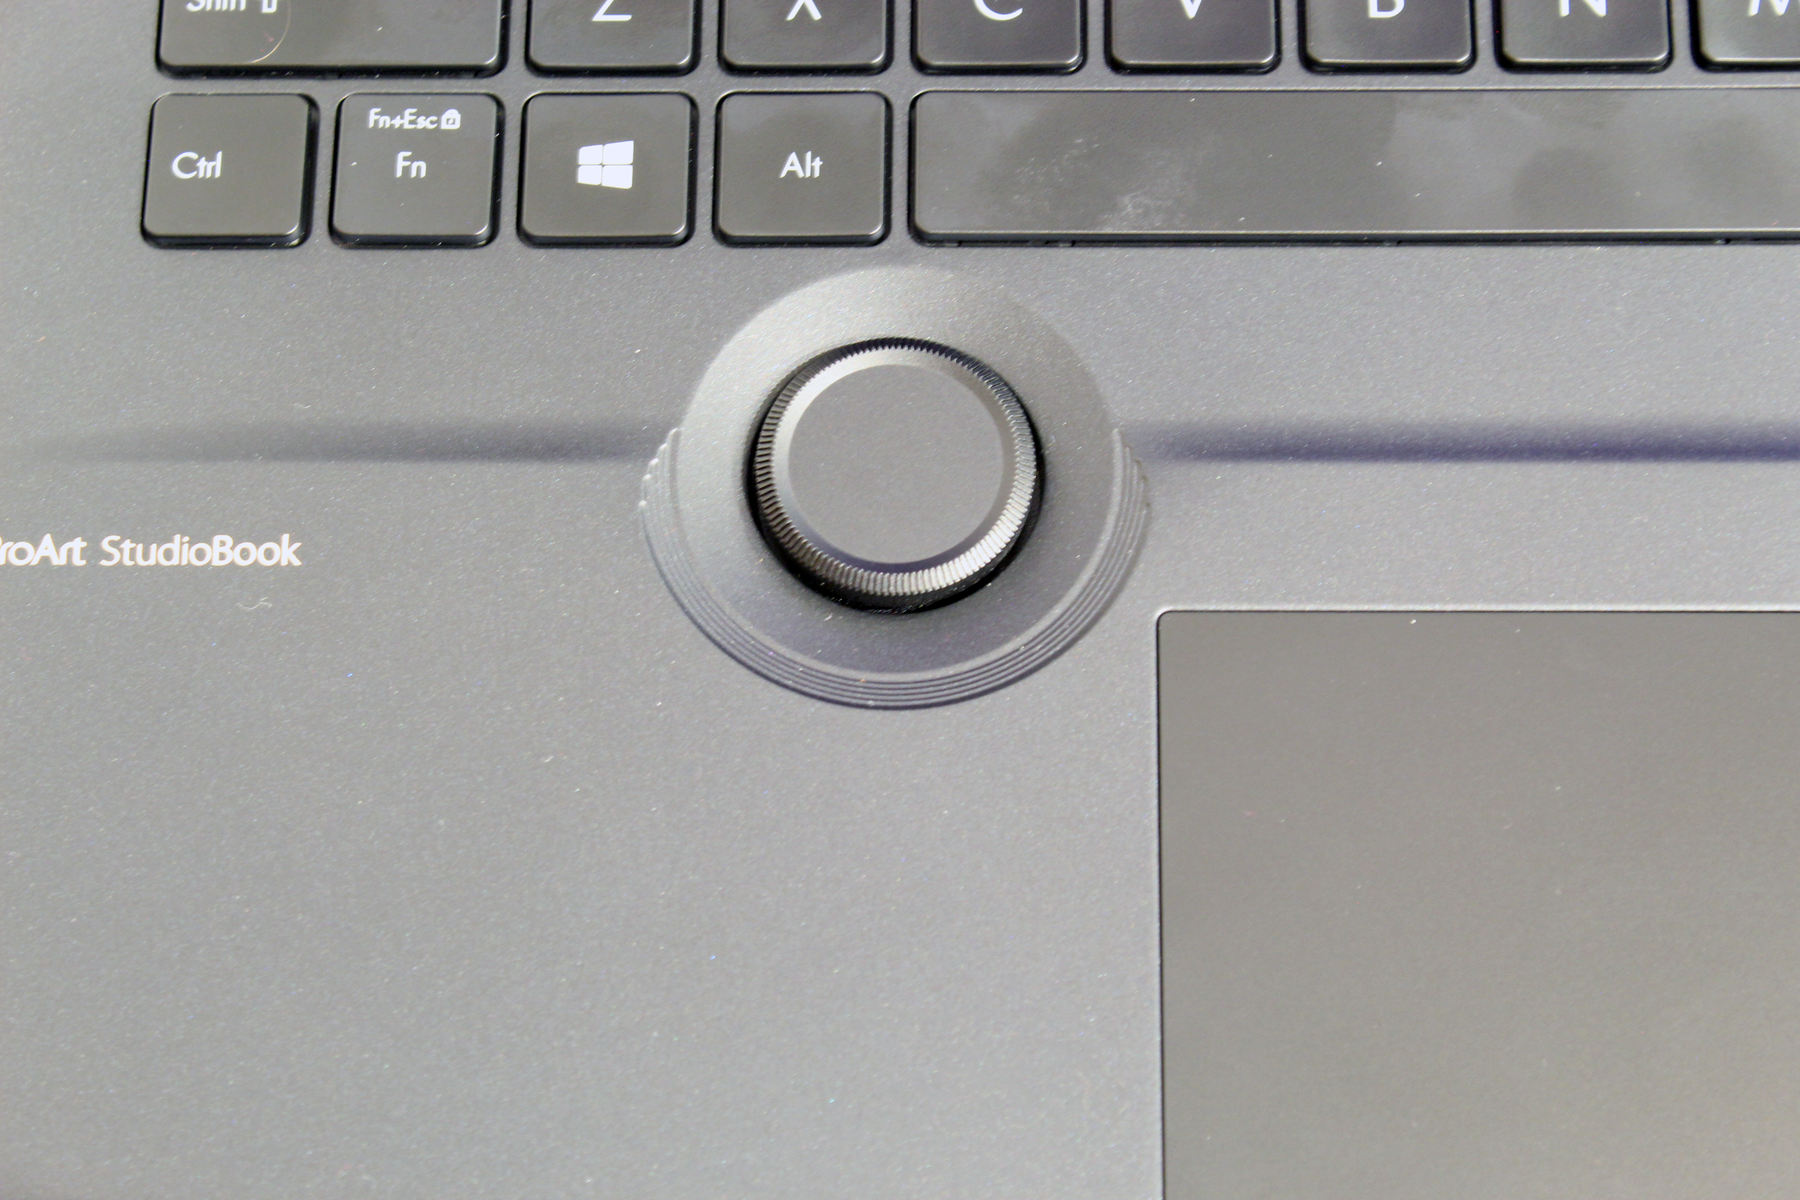
Asus ProArt StudioBook 16'nın kasası çok sağlam ve 2,4 kg ile boyutuna göre nispeten hafif. Kasa, mat, ışıltılı ve aynı zamanda daha pürüzlü bir yüzey veren kaplamalı magnezyum alaşımından yapılmıştır. Cihazın özel bir özelliği, izleme panelinin yanına yerleştirilmiş olan ve örneğin görüntü ve video düzenleme programlarındaki bazı işlevlerin kontrolünü özellikle hassas hale getirebilen Asus Dial Controller'dır. Ek olarak, Asus Dial Controller, sistemin parlaklığının veya hacminin daha hızlı ayarlanması için kullanılabilir. Asus ProArt StudioBook 16'nın tasarımı nezih ve klavye, izleme dörtgeni ve Asus Dial'ın düzeniyle çok düzgün görünüyor. Ayrıca kasanın öne çıkan özelliği ise kullanıcıya yazı yazarken daha fazla rahatlık sağlaması beklenen yüksek ayaklar. Bu yüksek ayaklar klavyenin avuç içi dayanağından daha yüksek olmasına neden olur. Asus ayrıca, cihazın soğutmasını optimize etmek için daha fazla temiz havanın geçmesine izin veren standın arka ortasında bir girinti yaptı.

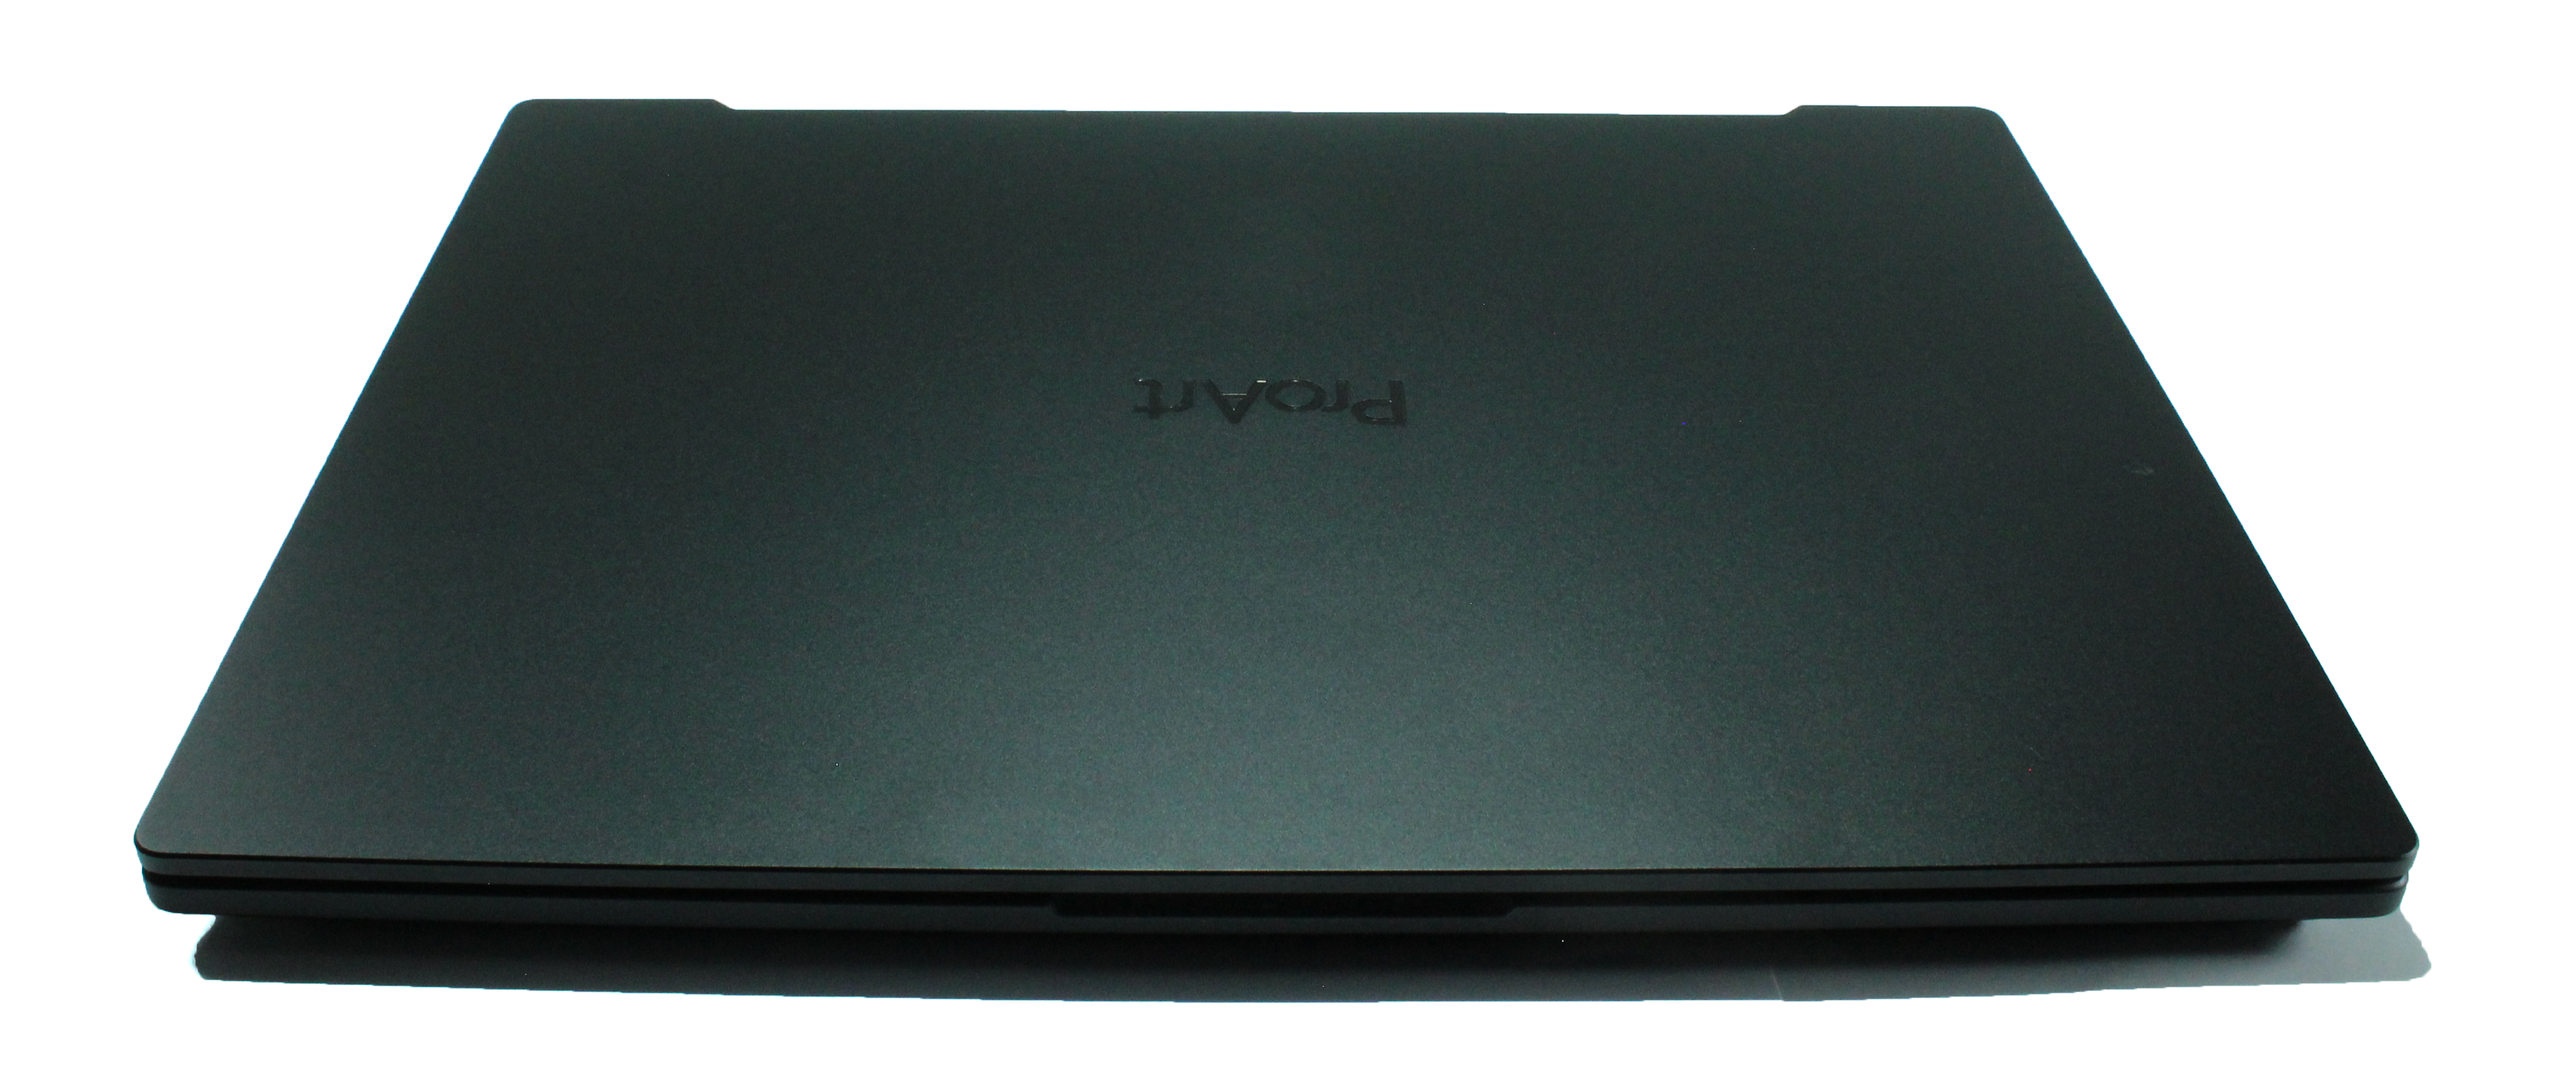
16 inç ekranı ve yalnızca 2,1 santimetrelik toplam yüksekliği ile Asus ProArt StudioBook şaşırtıcı derecede incedir. HP ZBook Fury, daha küçük ekranı ile dışarıdan biraz daha dar iken, bizim cihazımızdan neredeyse yarım santimetre daha uzun. Ağırlık açısından, rekabet Asus'umuzdan belirgin şekilde daha hafif, tek istisna ZBook Fury.
Bağlantılar
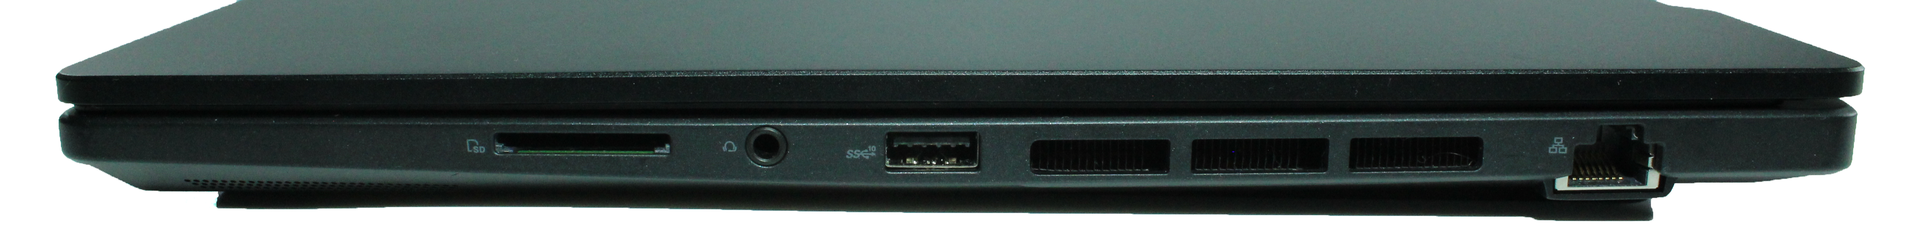
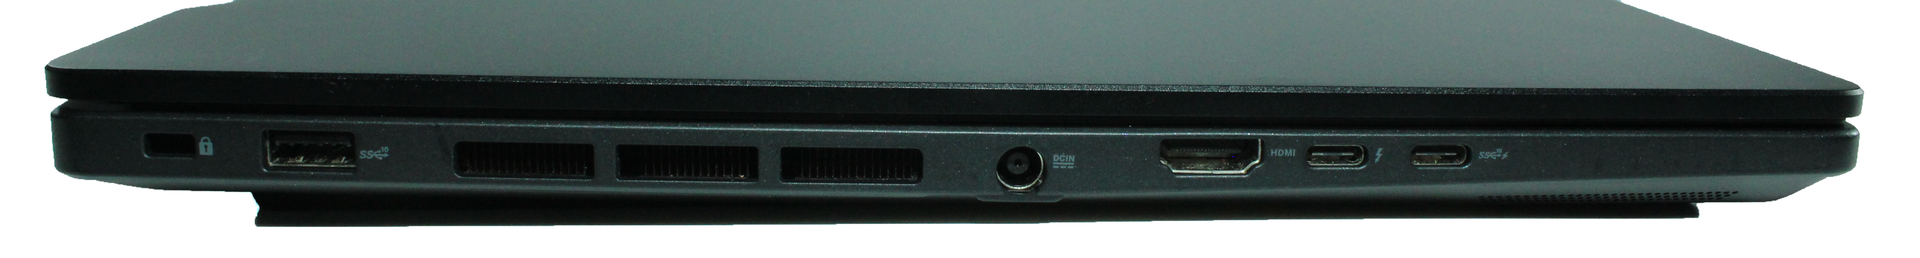
Dizüstü bilgisayarın bağlantı noktaları iki tarafa dağıtılmıştır: sol tarafta, Kensington Kilidi, USB-A 3.2 Gen.2, güç konektörü, HDMI 2.1, Thunderbolt 4 ve USB-C 3.2 Gen 2 bağlantı noktası bulunur. soğutma sisteminin havalandırma delikleri. Havalandırma kanalları tıpkı soldaki gibi sağ tarafa doğru uzanır. Sağ tarafta ayrıca tam boyutlu bir SD kart okuyucu, 3,5 mm birleşik jak, USB-A 3.2 Gen.2 ve Gigabit LAN bulunuyor. Hem Thunderbolt 4 hem de USB-C bağlantı noktası, Güç Dağıtımını destekler ve her birine bir ekran bağlanmasına izin verir. Bağlantı noktaları yeterince aralıklıdır ve tüm bağlantı noktaları doluyken kullanıcının rahatını etkilemez. Dizüstü bilgisayarın arka tarafında yalnızca soğutma sisteminin havalandırma delikleri bulunur.
SD Kart Okuyucu
Entegre SD kart okuyucusunun aktarım hızı, üretim öncesi cihazımızda beklenenden daha düşük. 128 GB Angelbird AV PRO V60 referans hafıza kartımızla ortalama veri çıkışı bile sağlanamıyor.
| SD Card Reader | |
| average JPG Copy Test (av. of 3 runs) | |
| Dell Precision 5000 5560 (AV Pro V60) | |
| Sınıf ortalaması Workstation (49.6 - 681, n=14, son 2 yıl) | |
| HP ZBook Fury 15 G8 (AV Pro V60) | |
| HP ZBook Studio 15 G8 (AV Pro V60) | |
| Asus ProArt StudioBook 16 W7600H5A-2BL2 (AV Pro SD microSD 128 GB V60) | |
| maximum AS SSD Seq Read Test (1GB) | |
| Sınıf ortalaması Workstation (87.6 - 1455, n=14, son 2 yıl) | |
| Dell Precision 5000 5560 (AV Pro V60) | |
| HP ZBook Studio 15 G8 (AV Pro V60) | |
| HP ZBook Fury 15 G8 (AV Pro V60) | |
| Asus ProArt StudioBook 16 W7600H5A-2BL2 (AV Pro SD microSD 128 GB V60) | |
İletişim
Üretim öncesi cihazımızda kurulu Intel Wi-Fi AX201, performans testimizde performans potansiyelinden yararlanamıyor ve ortalamanın yüzde 20 ila 60 gerisinde kalıyor.
Web kamerası
Test cihazımızdaki 720p web kamerasının kamera kalitesi çok düşük. Çoğu dizüstü bilgisayar kamerası gibi, görüntü netliğinden ve renk doğruluğundan yoksundur.

")
")


Bakım ve Erişilebilirlik
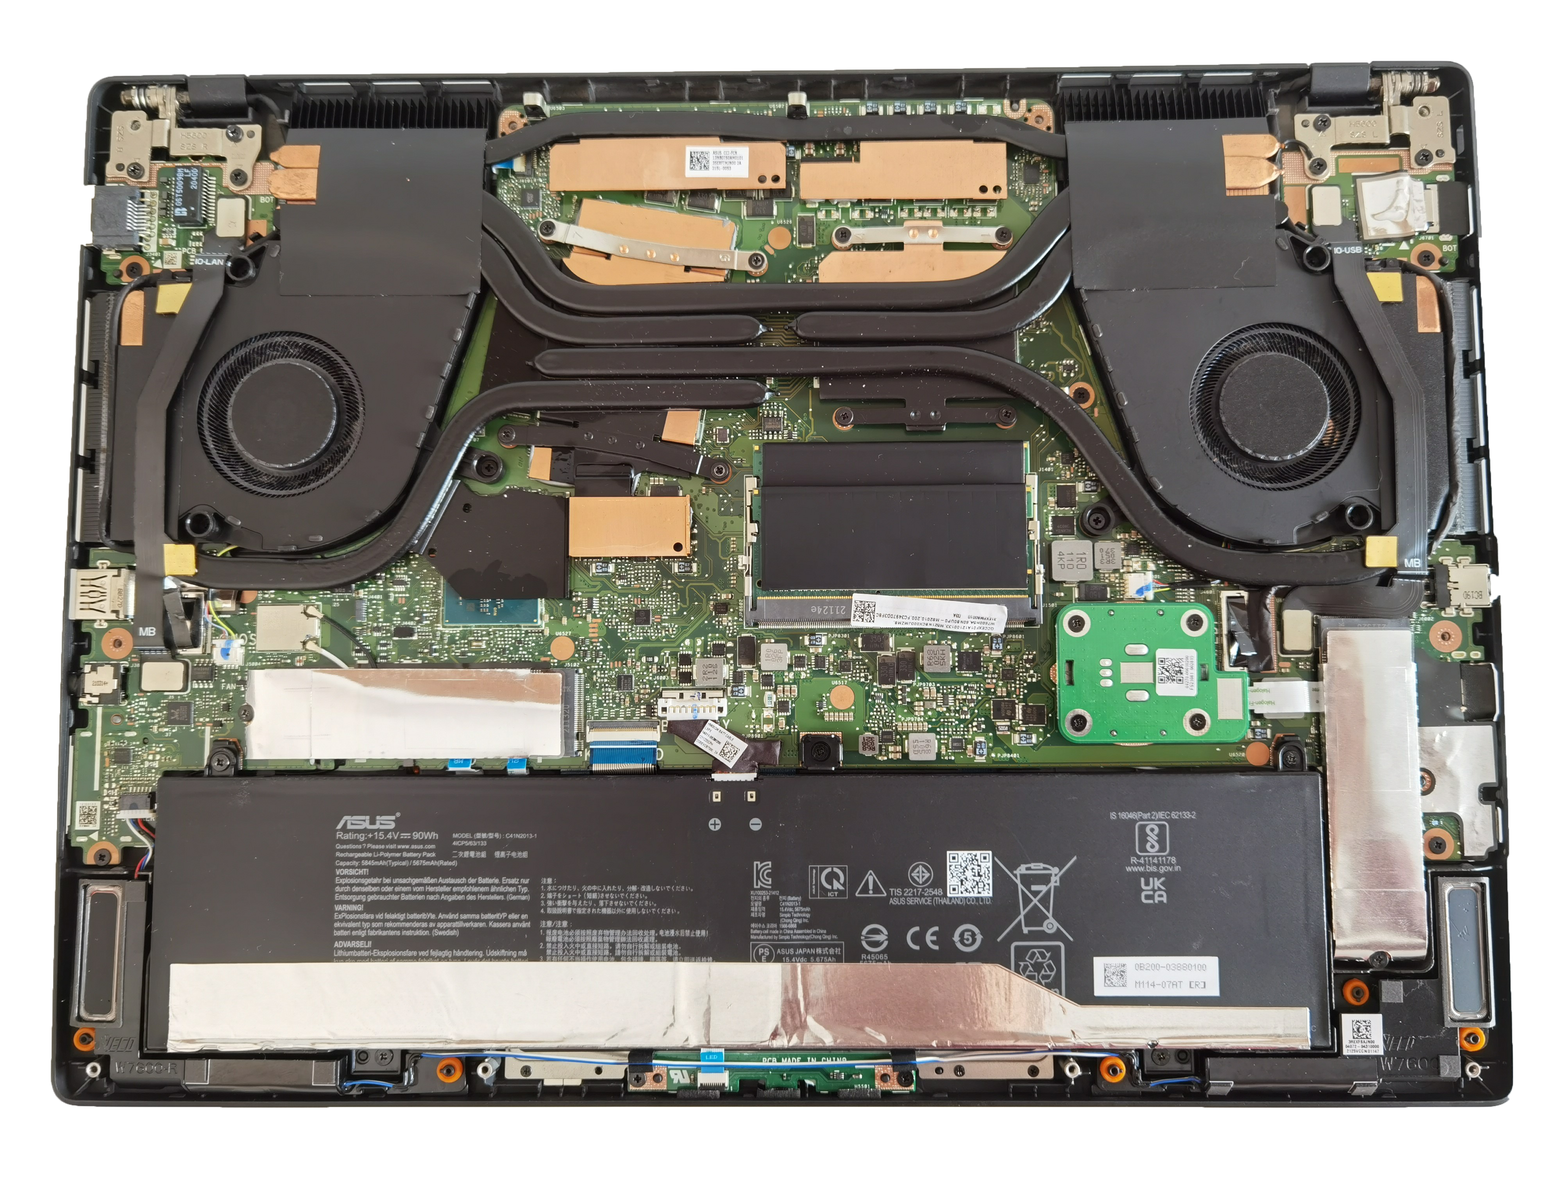
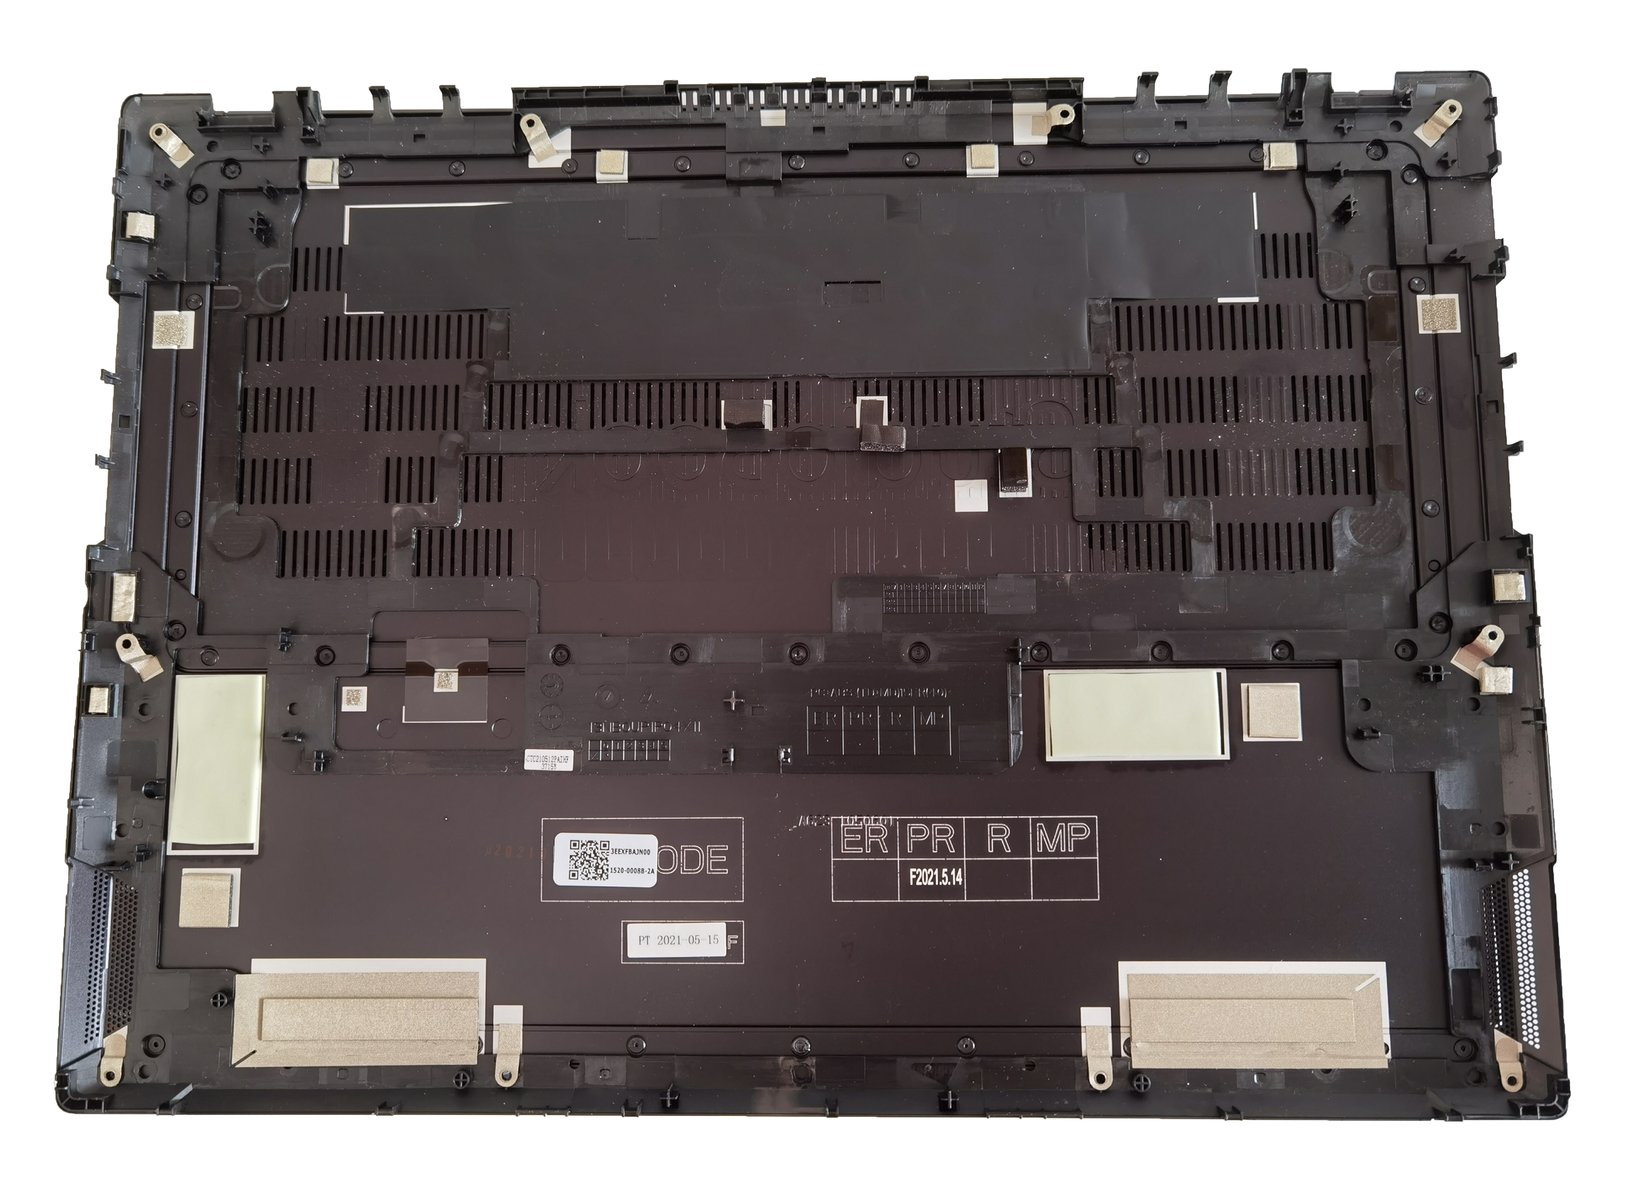
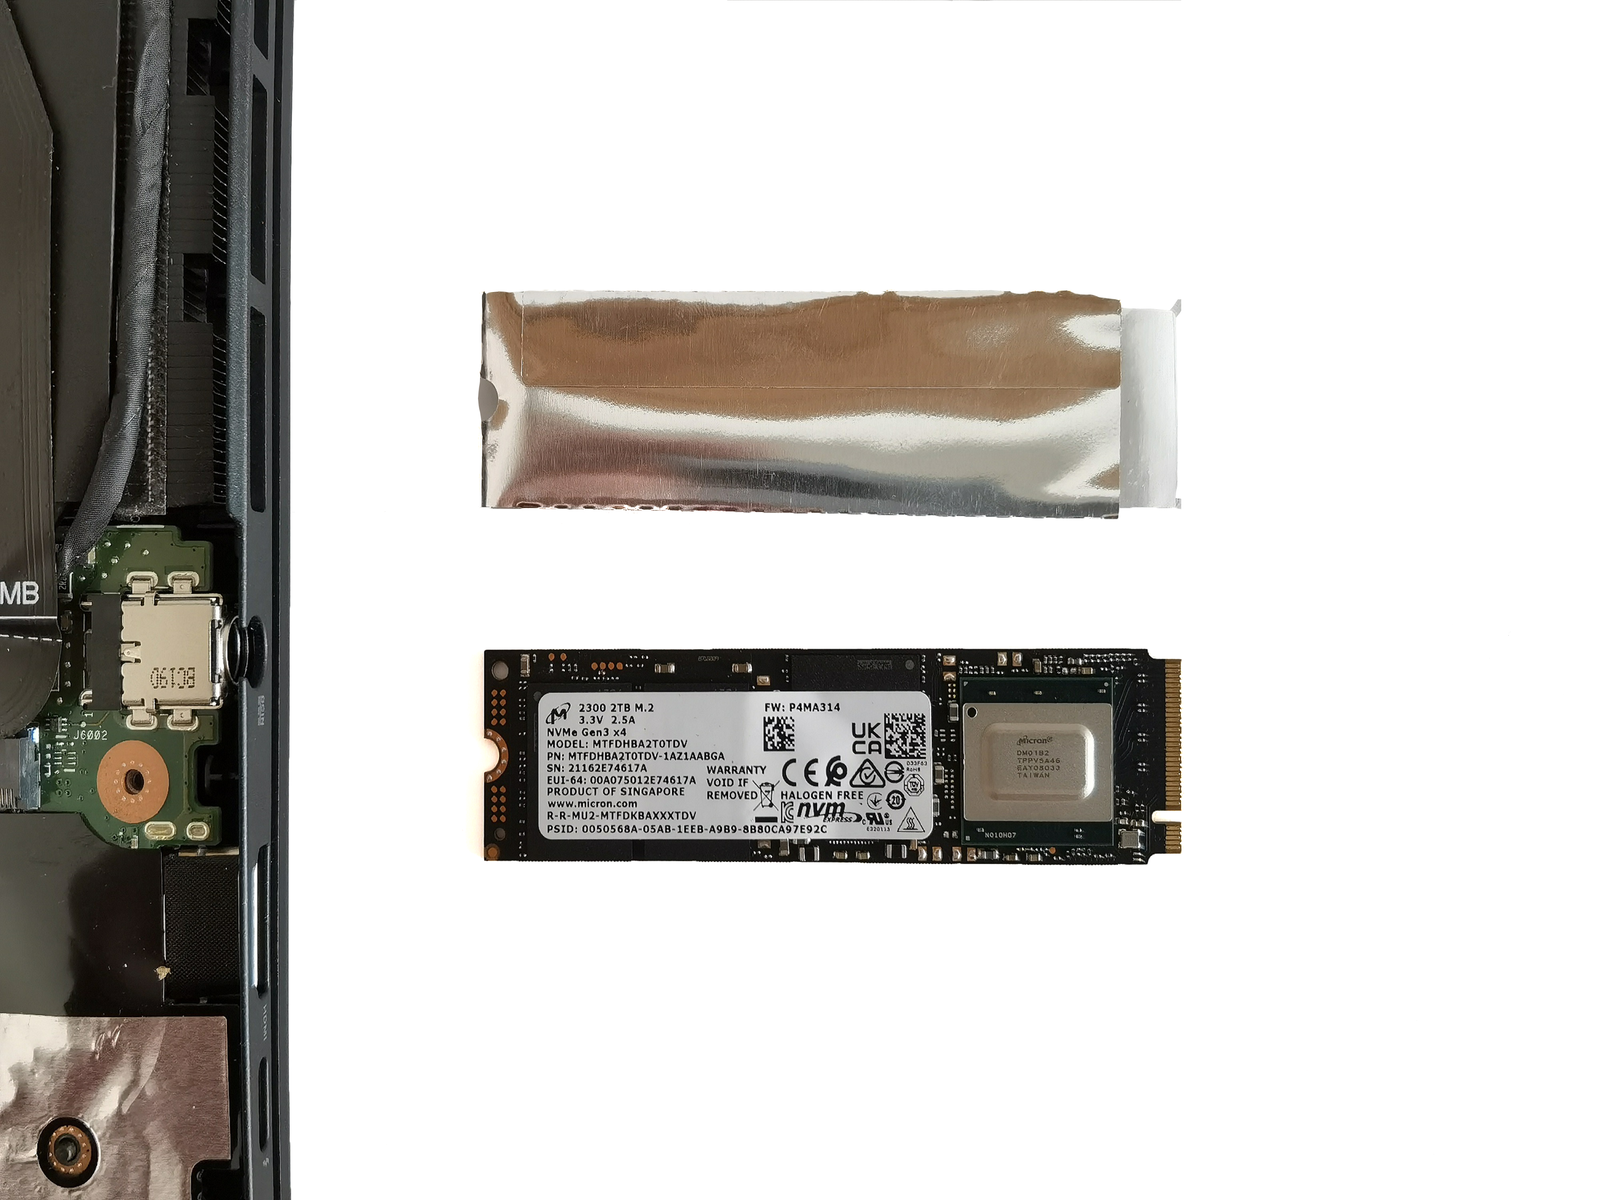
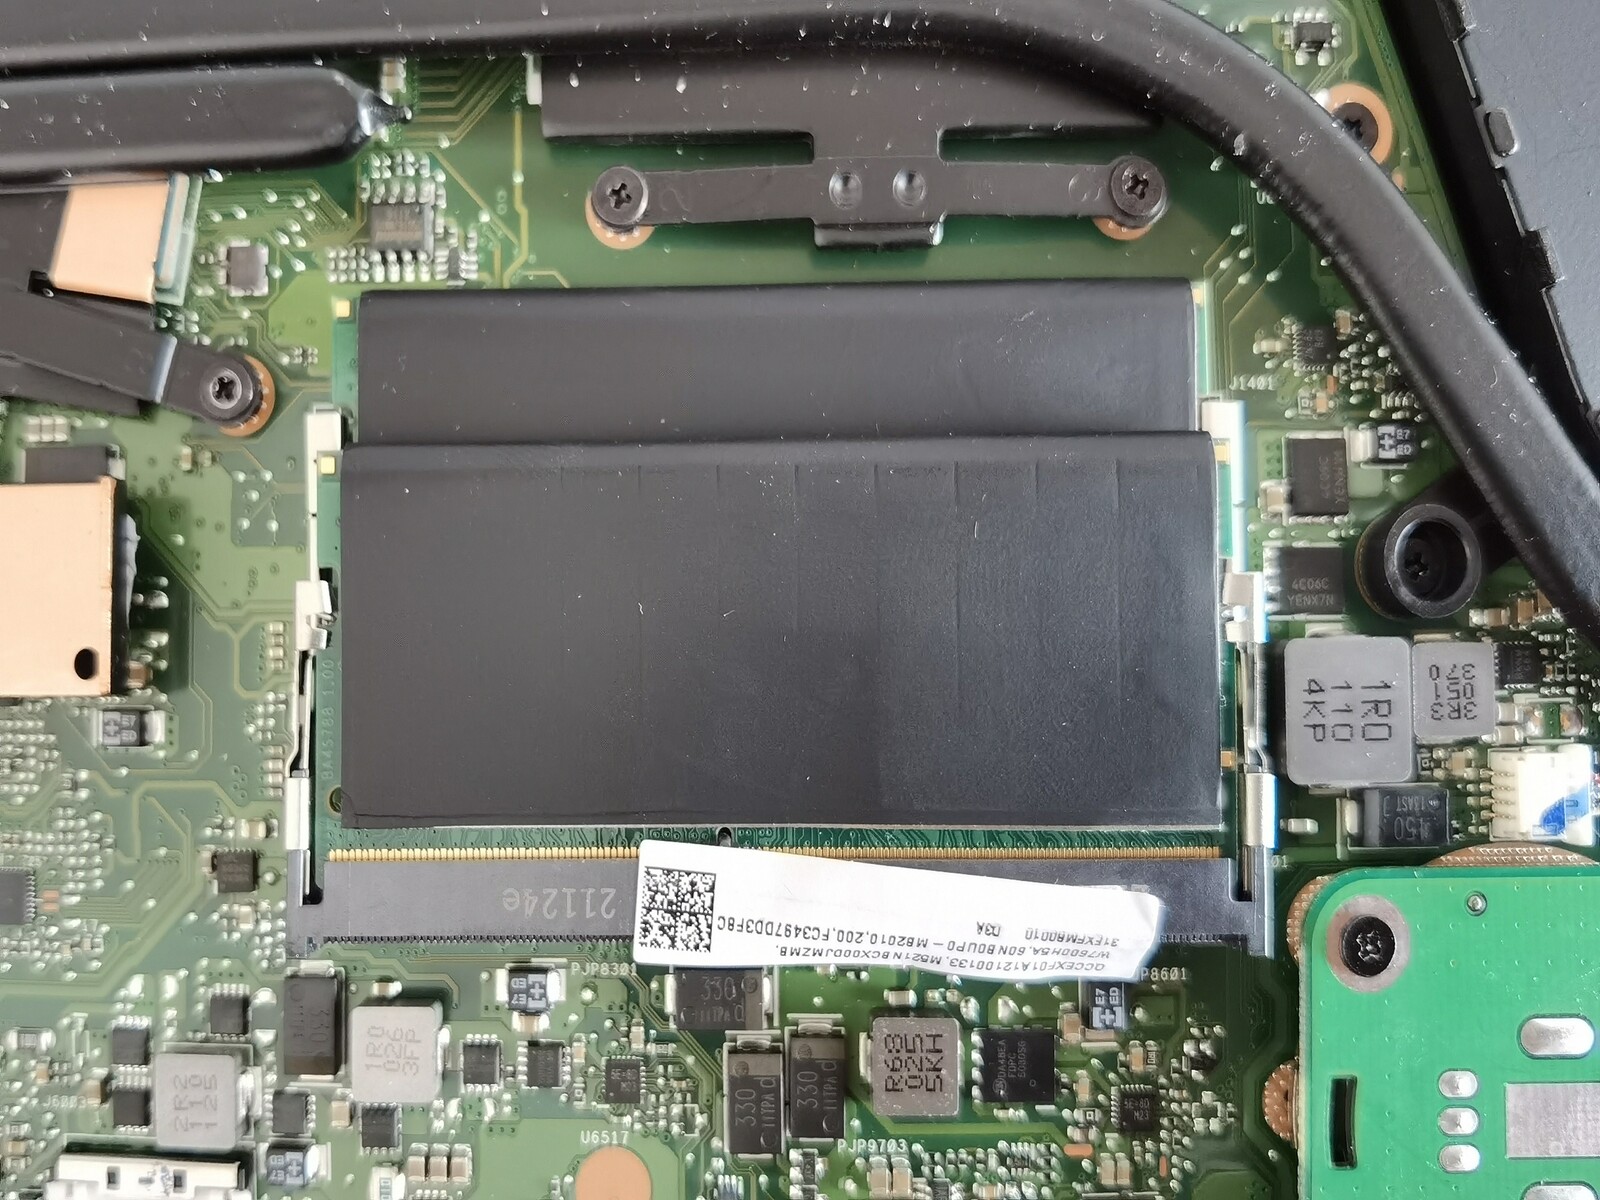
Taban plakası, on çapraz vidayı gevşeterek kolayca çıkarılabilir. İçeride, kullanıcılar inceleme birimimizde tamamen dolu olan hem RAM hem de SSD yuvalarına doğrudan erişebilecekler. Buna göre fanlar da bu şekilde temizlenebilir. Soğutma devresinin yonga setini de kapsadığını ve hatta RAM ve SSD'lerin bile pasif soğutmaya sahip olduğunu belirtmekte fayda var. İkincisi için, taban plakasında ek ısı iletim pedleri vardır.
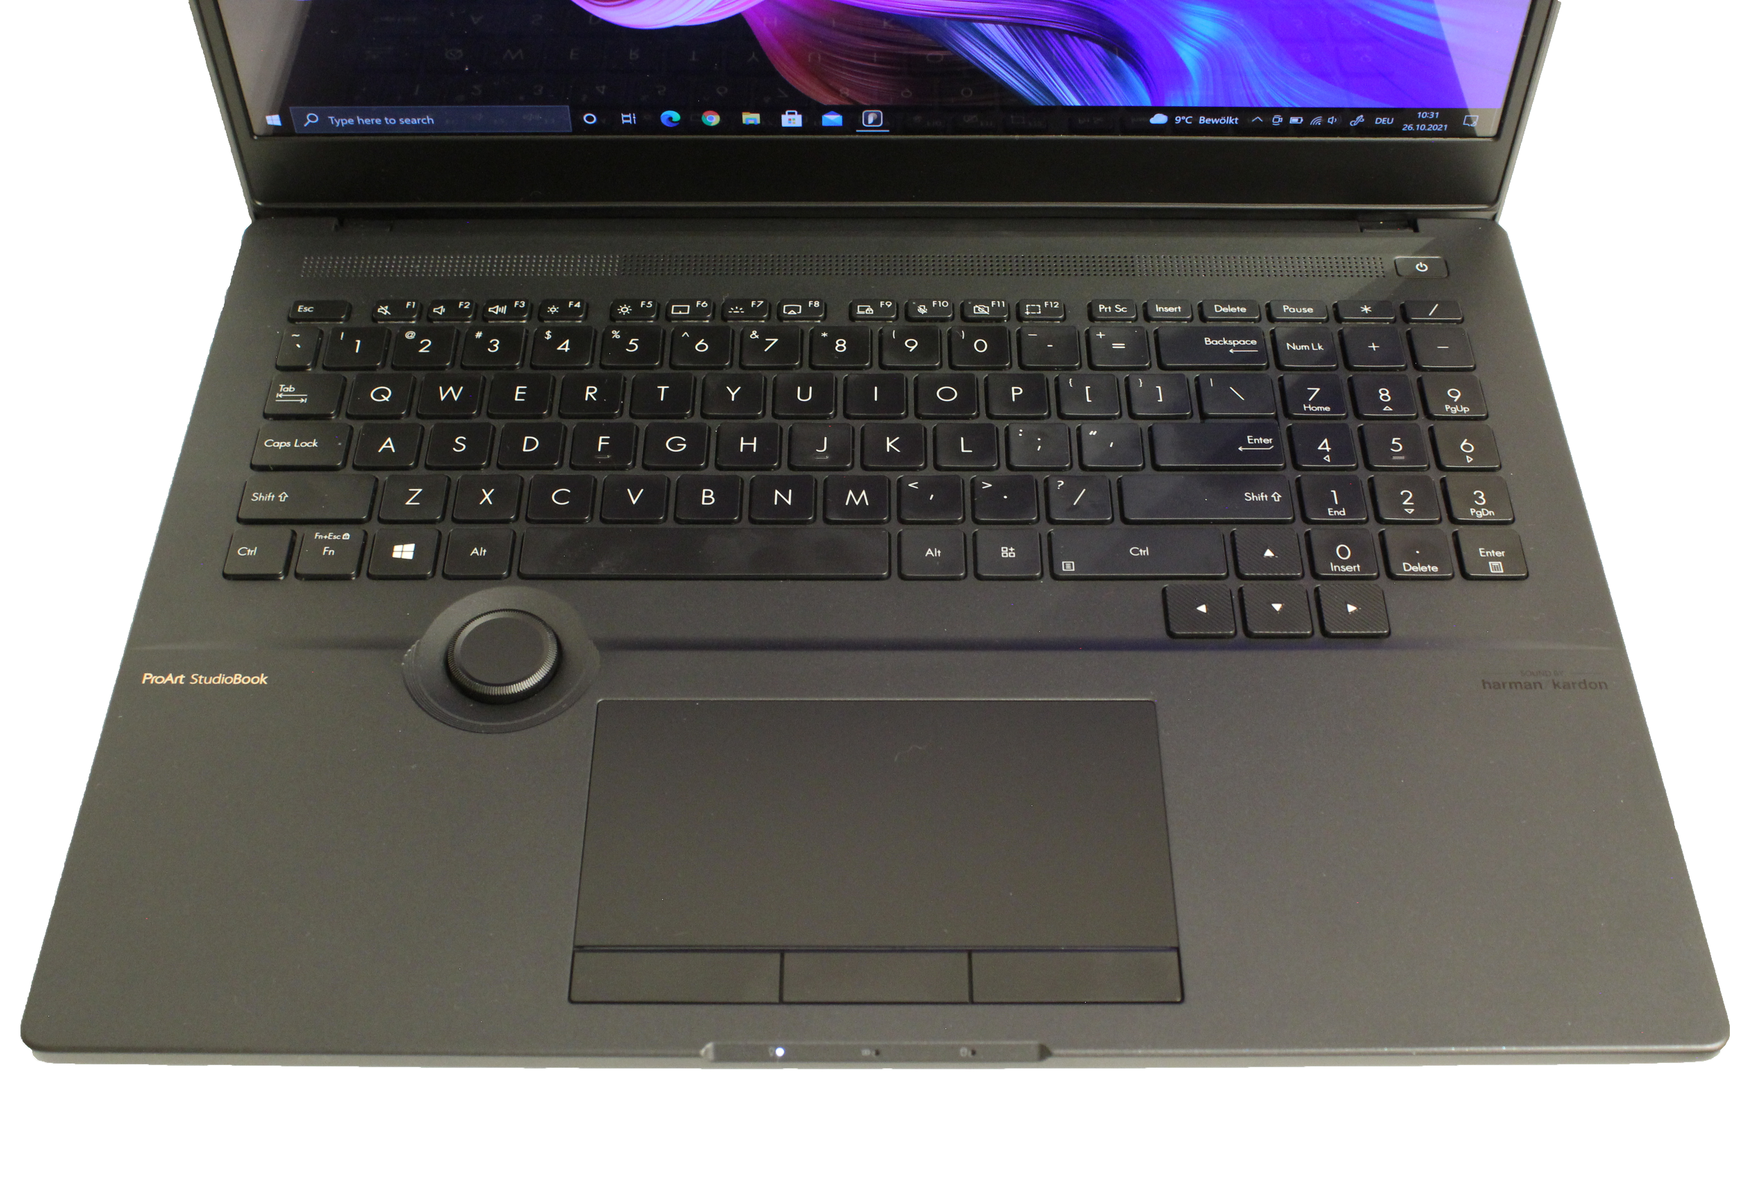
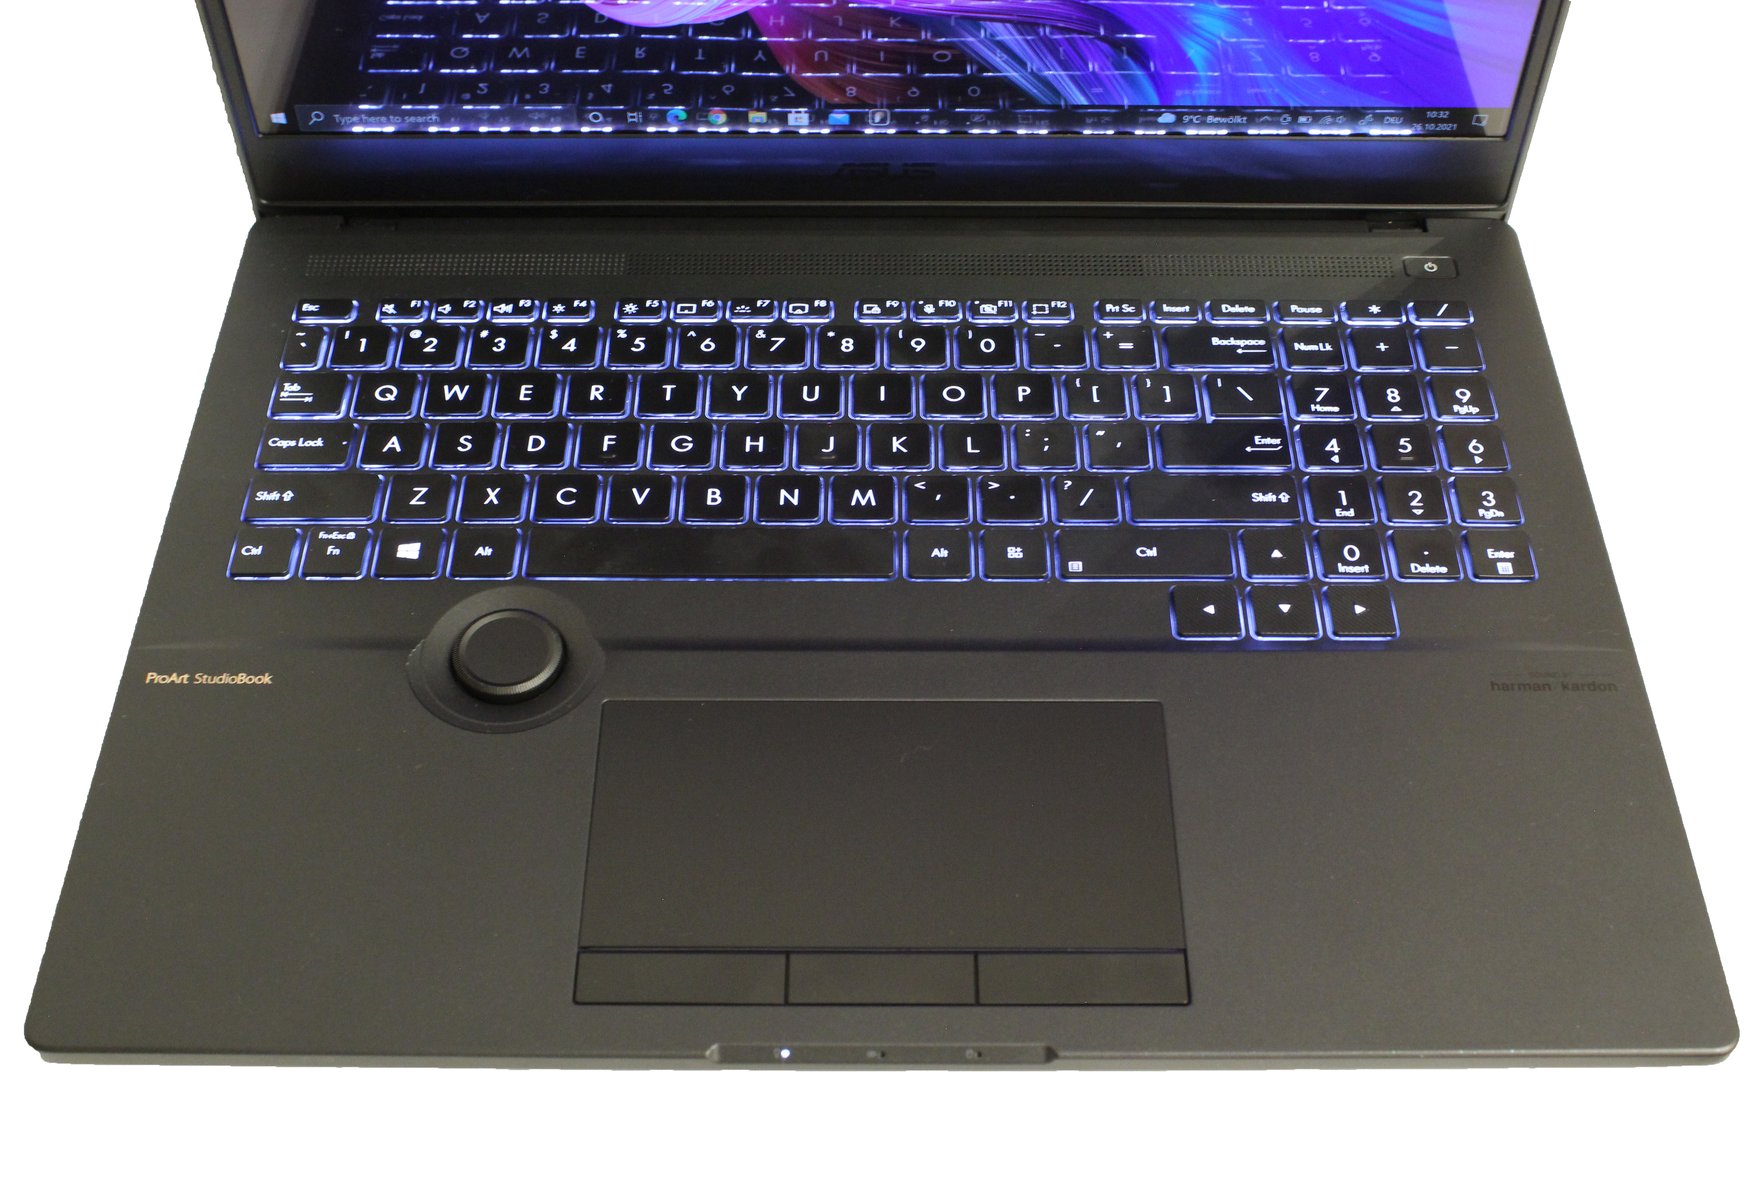
Giriş Birimleri: Profesyonel işlerde Asus Dial
Tuş takımı
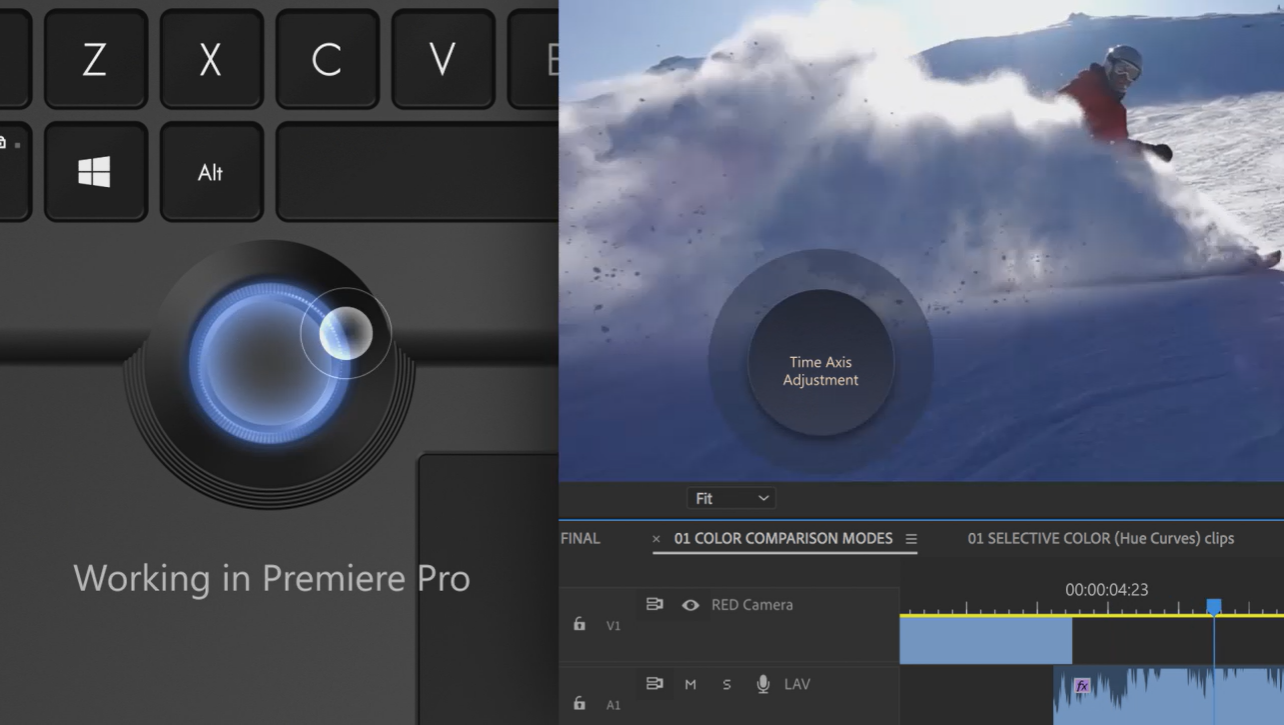
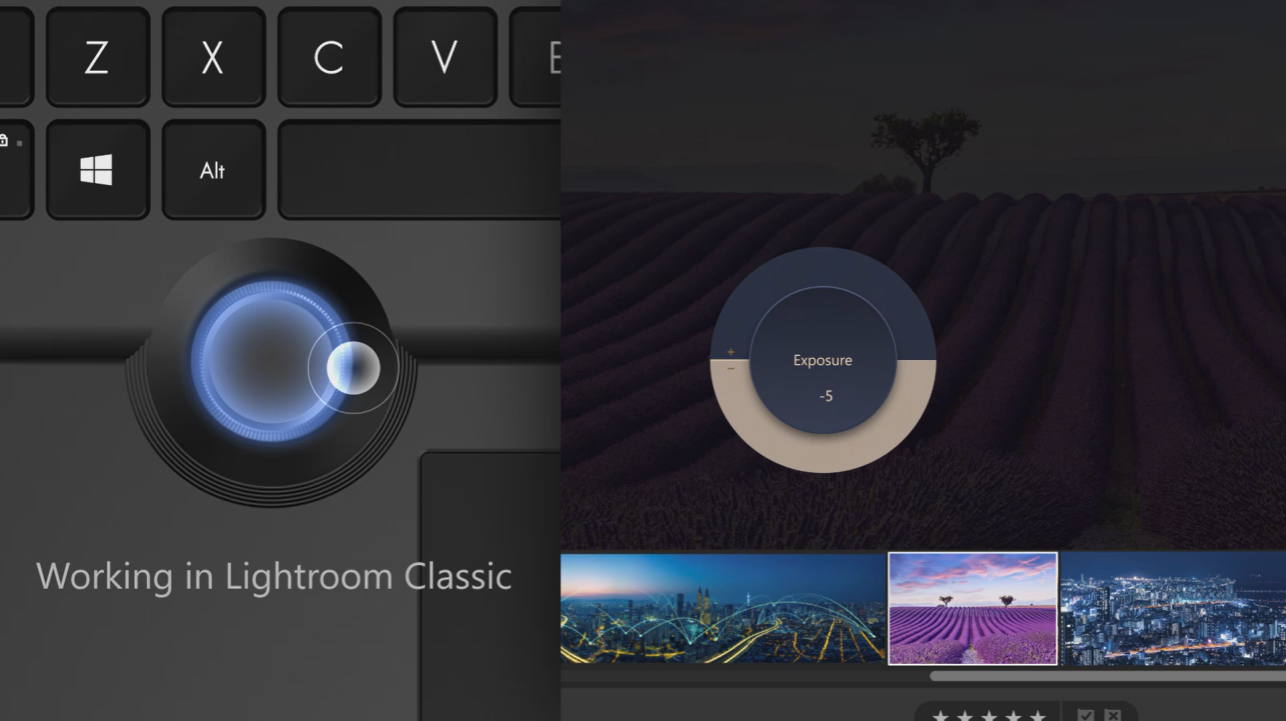
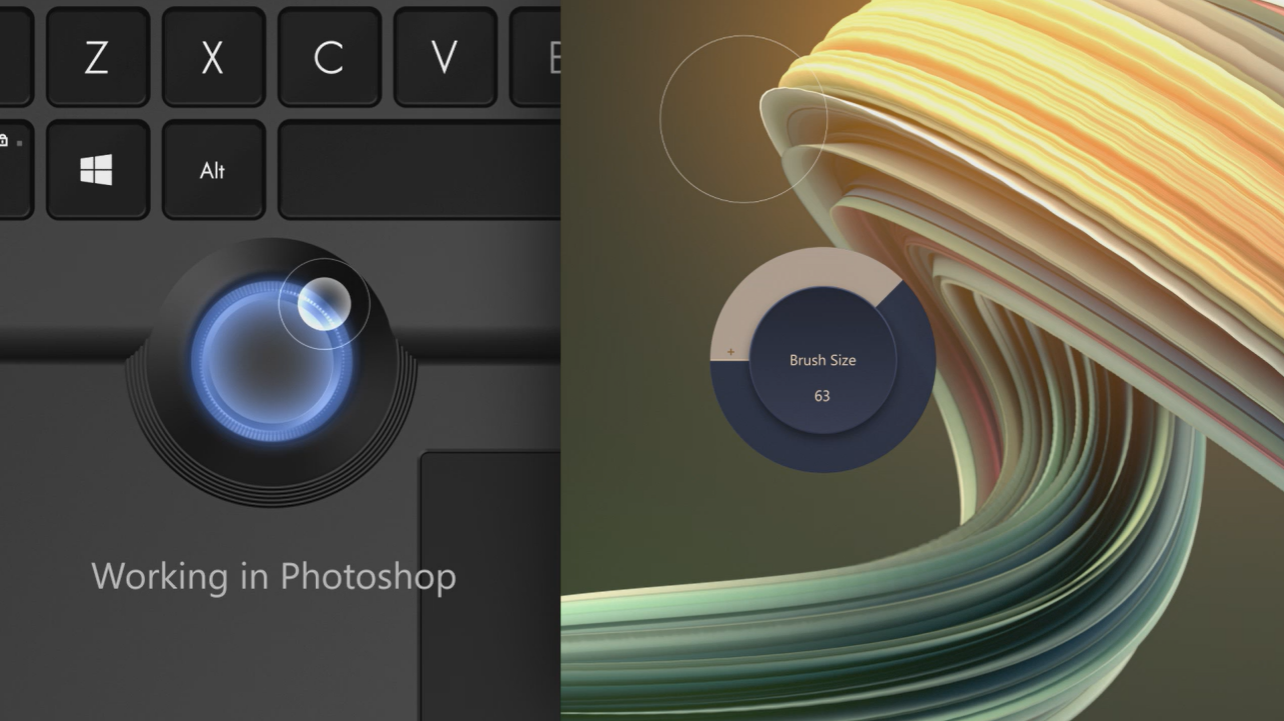
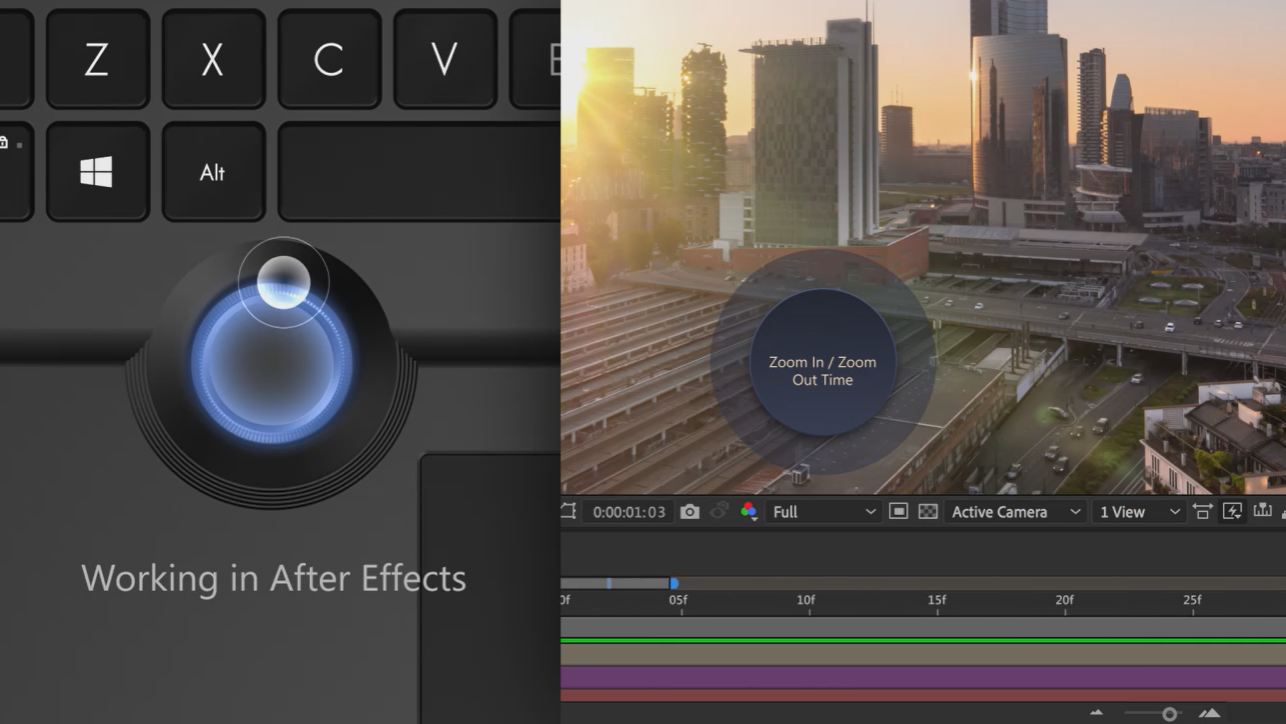
Asus ProArt Studiobook 16'nın klavyesi, iyi bir basınç noktası ile tanımlandırılabilir. Tuşlar normal bir boyuta sahiptir ve daha pürüzlü yüzeye rağmen yazarken çok rahat hissettirir. Tuş tıkırtısı oldukça gizlidir ve rahatsız edici olarak algılanmaz. Klavye aydınlatması üç seviyede ayarlanabilir. Ek olarak Asus Dial Controller var: yuvarlak kontrolörün ergonomik kenarları sayesinde ayarlar çok hassas ve aynı zamanda çok sessiz bir şekilde yapılabilir. Örneğin, Photoshop'ta fırçayı sezgisel olarak kontrol edebilir veya kadranı kullanarak katmanı kolayca değiştirebilirsiniz. Dial Controller ile yakınlaştırma, gezinme veya renk dengesini veya tonunu ayarlamak kolay olmalıdır. Resim galerimizde Arama Denetleyicisinin kullanımına ilişkin birkaç örnek gösterilmektedir.
Dokunmatik yüzey
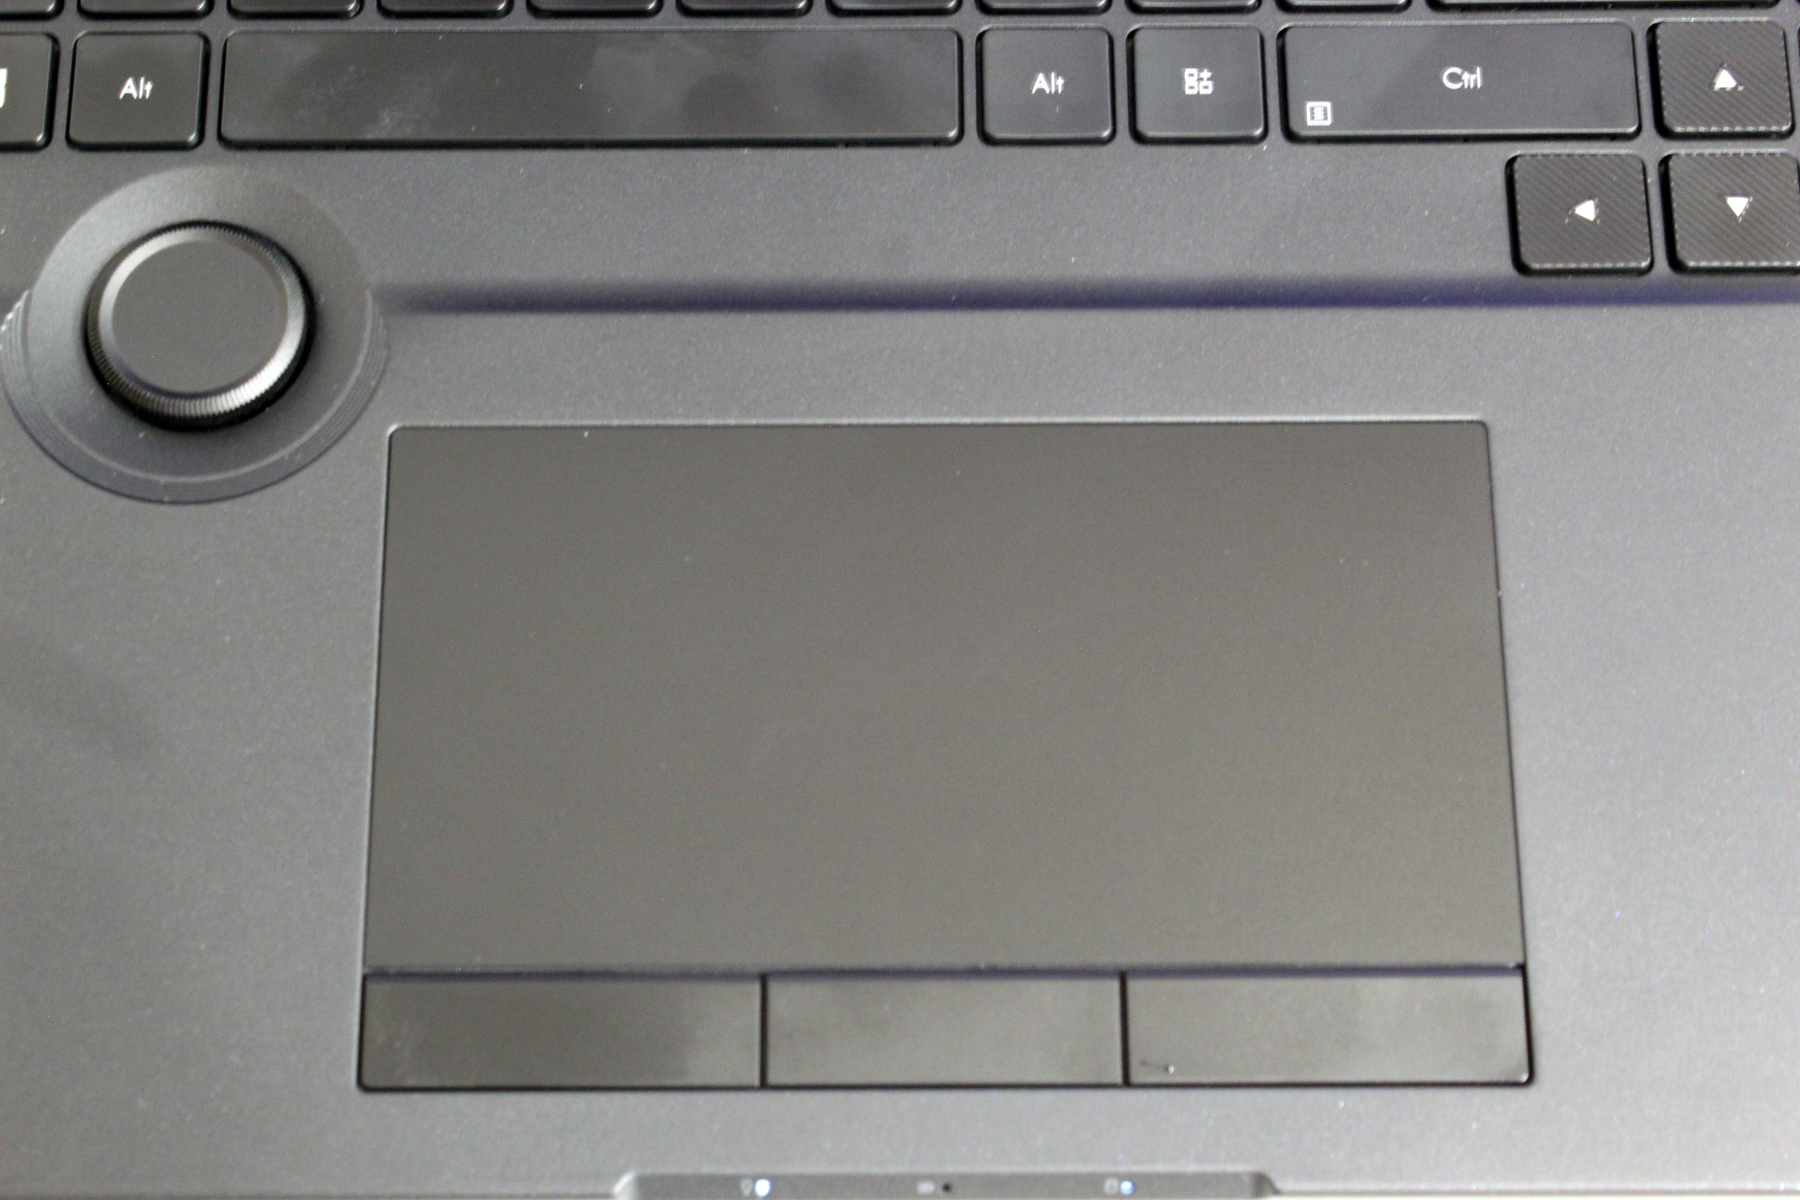
Üretim öncesi numunemizin dokunmatik yüzeyi, kullanıcıya geniş bir yüzeyin yanı sıra çok iyi kayma özellikleri sunar. Benzer şekilde, kaydırma veya sekmeler arasında geçiş yapma gibi çoklu dokunma özellikleri burada sorunsuz çalışır. Özel 3 düğmeli dokunmatik yüzey, kaydırma, döndürme veya daire içine alma gibi uygulama işlevleri için merkezi kontrole ihtiyaç duyan 3D tasarımcılar için uygundur. Asus Dial ile birleştiğinde, bu iki özellik yaratıcı profesyoneller için gerçek bir rüya takımıdır.
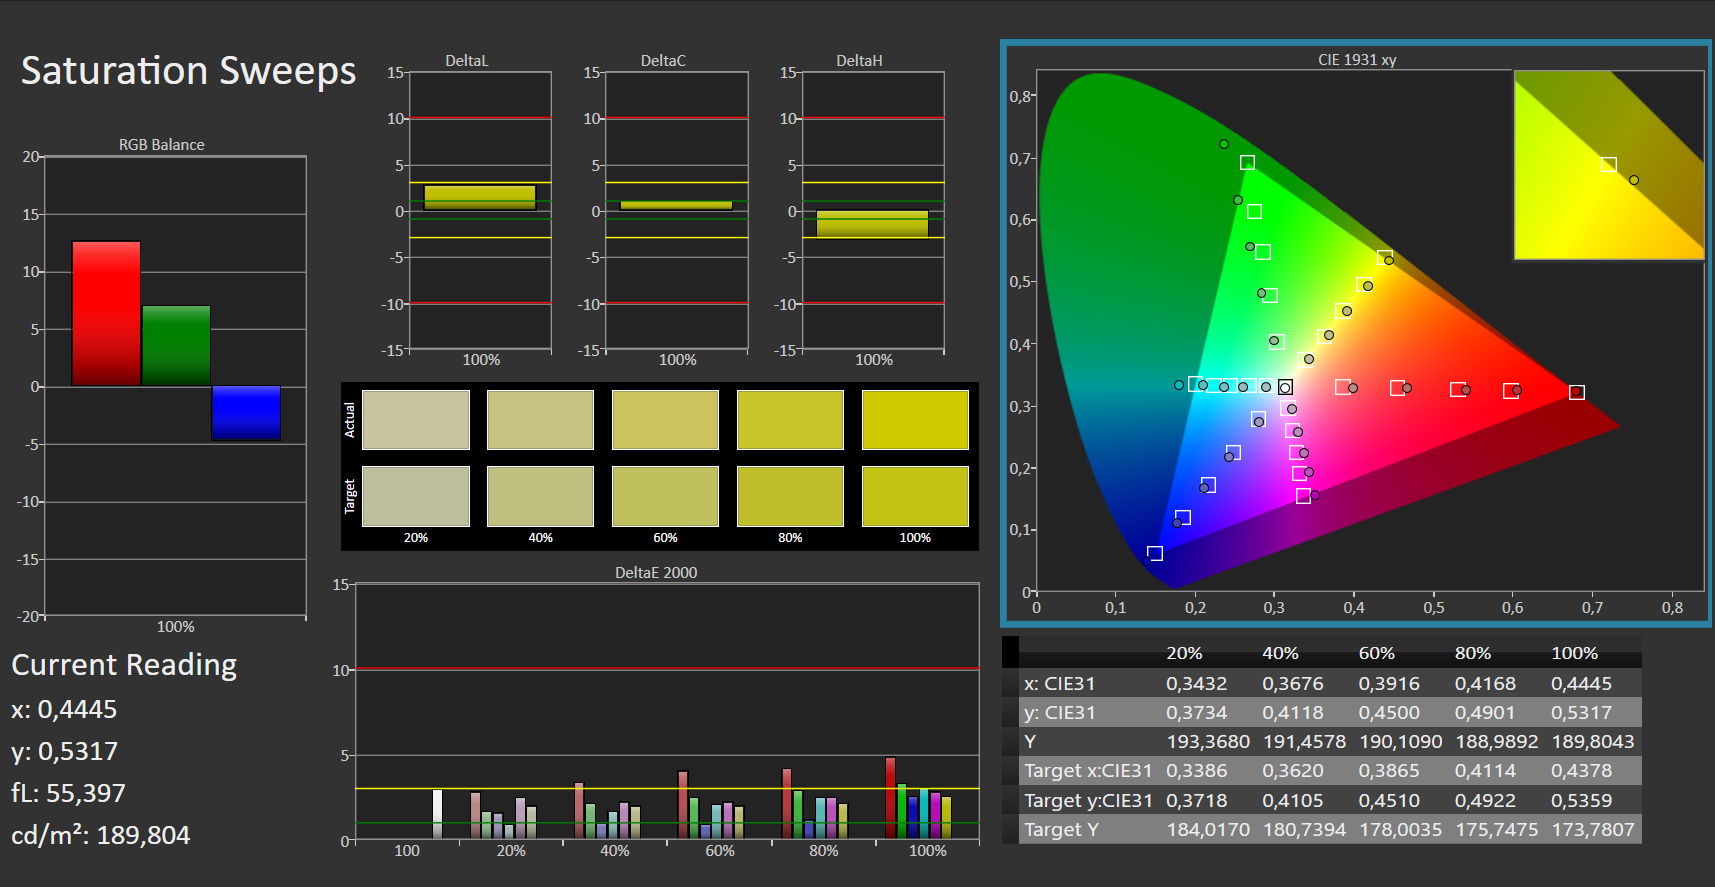
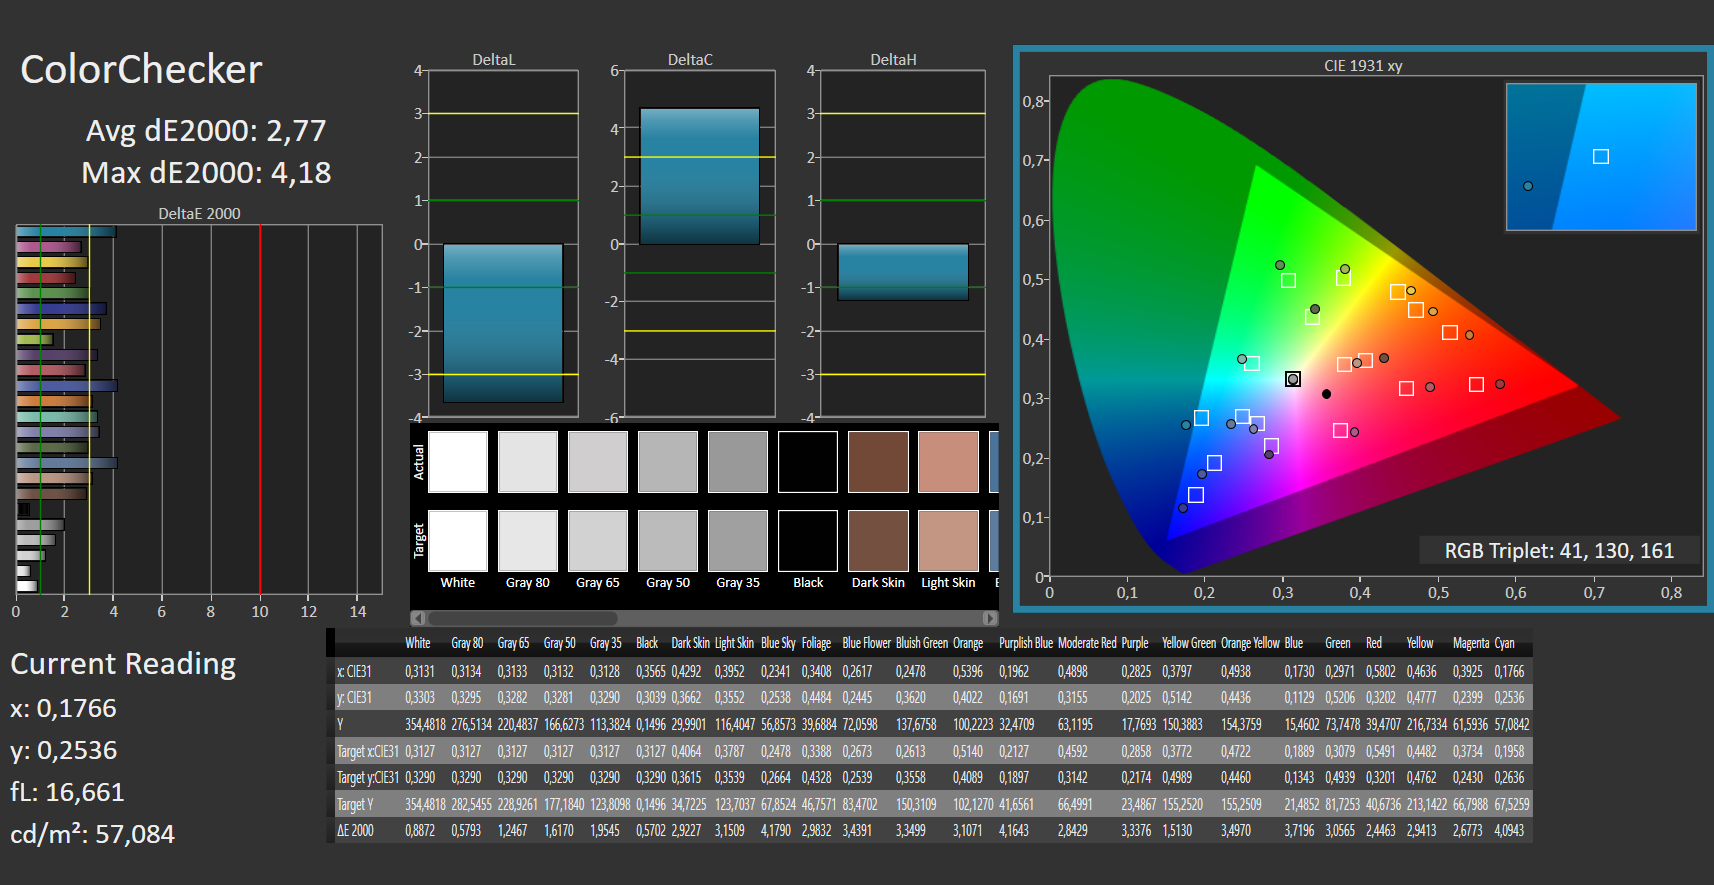
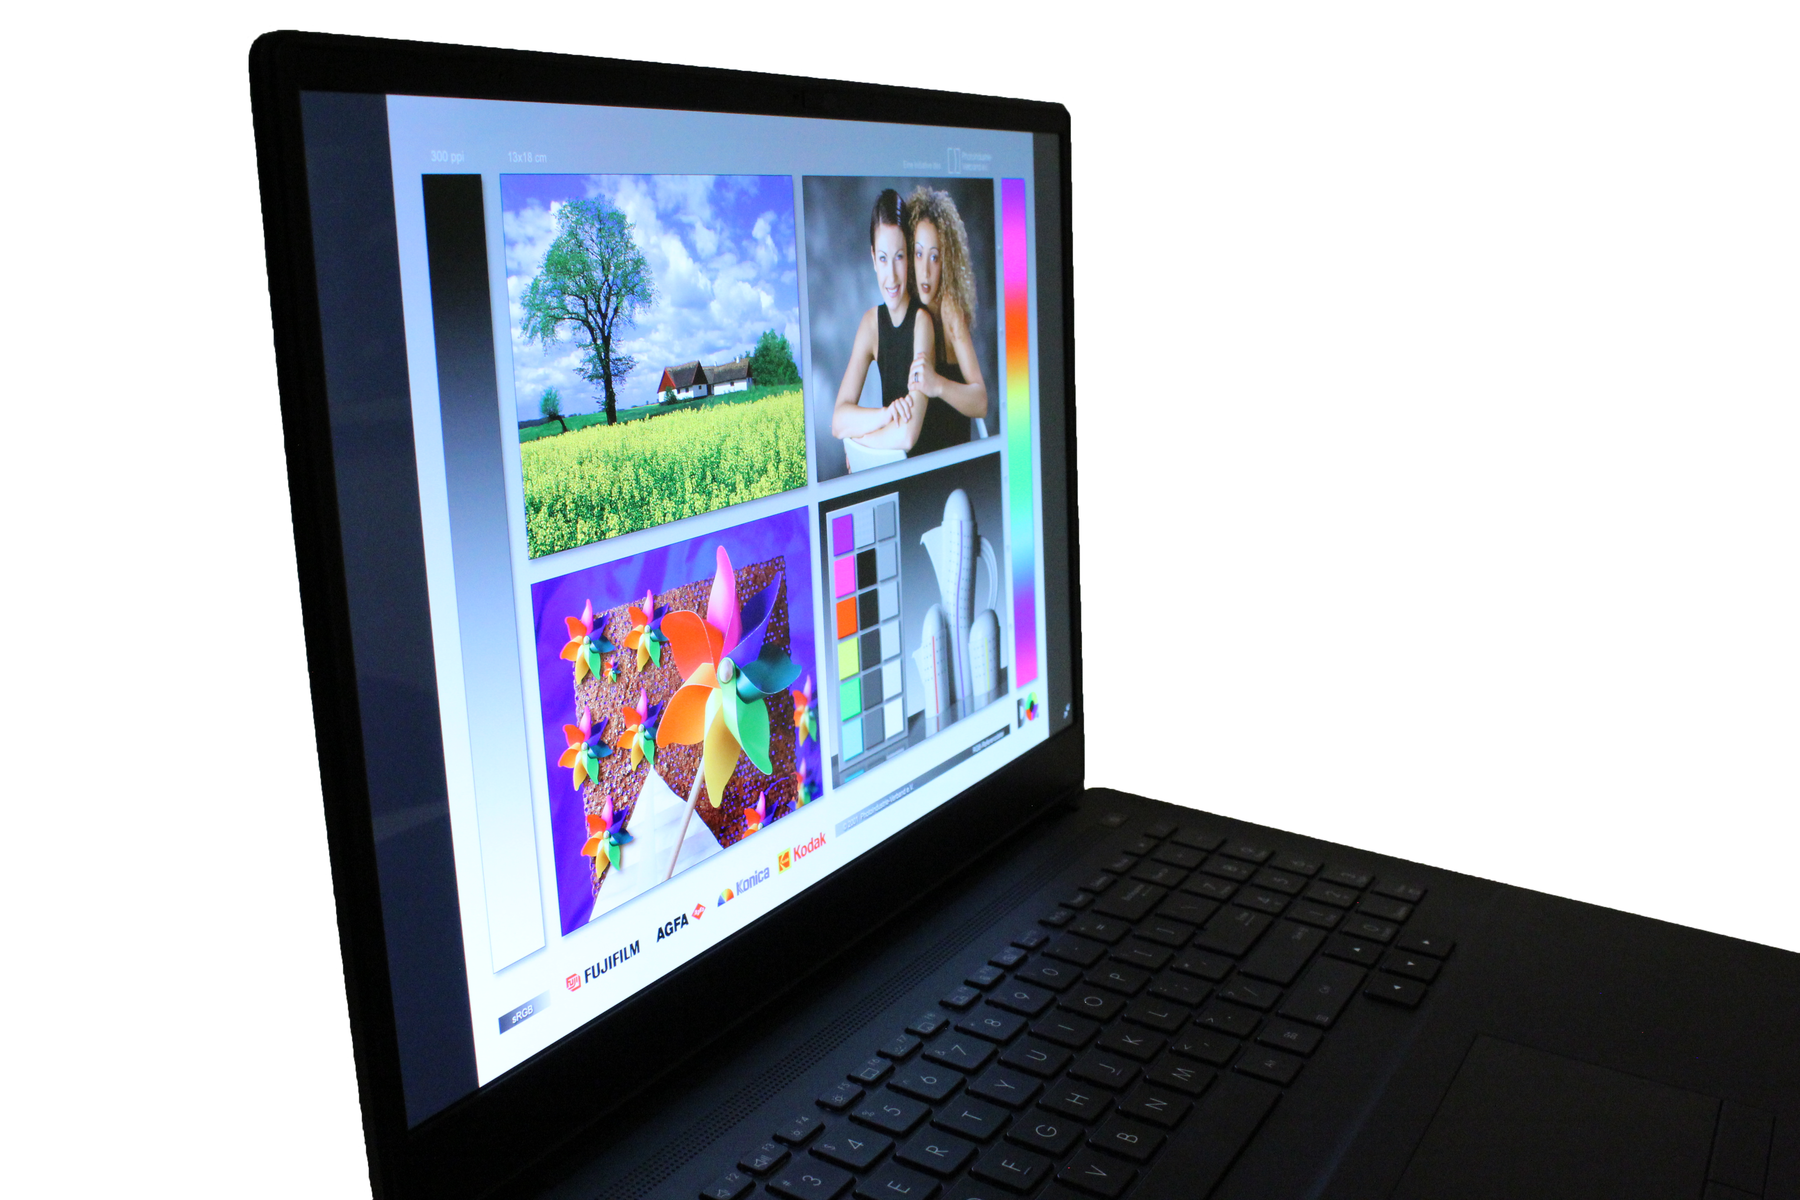
Ekran: 16:10 formatında dünyanın ilk 4K OLED HDR paneli

İnceleme örneğimiz, 16 inç ekran köşegenine ve 16:10 en boy oranına sahip 4K OLED HDR panele sahiptir. İlk bakışta iyi bir izlenim bırakıyor ve OLED panellerin tipik avantajlarını sunuyor. Ayrıca, Pantone sertifikası sayesinde çok iyi fabrika kalibrasyonuna sahiptir ve bu nedenle resim ve videoları düzenlemek için mükemmel şekilde uygundur. Arka ışık %96'da çok dengeli, yalnızca maksimum parlaklık daha iyi olabilirdi. Bunun dışında 240 Hz frekansındaki PWM, yüzde 80 ve daha düşük parlaklık seviyelerinde mevcut. Rekabet de bazı puanlar alabilir: örneğin, HP ZBook Fury, yansıma yapmayan, 120 Hz ve çok daha parlak bir panel ile donatılmıştır. Bununla birlikte, grenlilik, haleler ve daha zayıf bir kalibrasyon gibi bazı dezavantajları da vardır.
Üretim öncesi örneğimizde OLED panel olduğu için ekran kanaması olmaz.
| |||||||||||||||||||||||||
Aydınlatma: 96 %
Batarya modunda parlaklık: 354 cd/m²
Kontrast: ∞:1 (Siyah: 0 cd/m²)
ΔE ColorChecker Calman: 2.45 | ∀{0.5-29.43 Ø4.72}
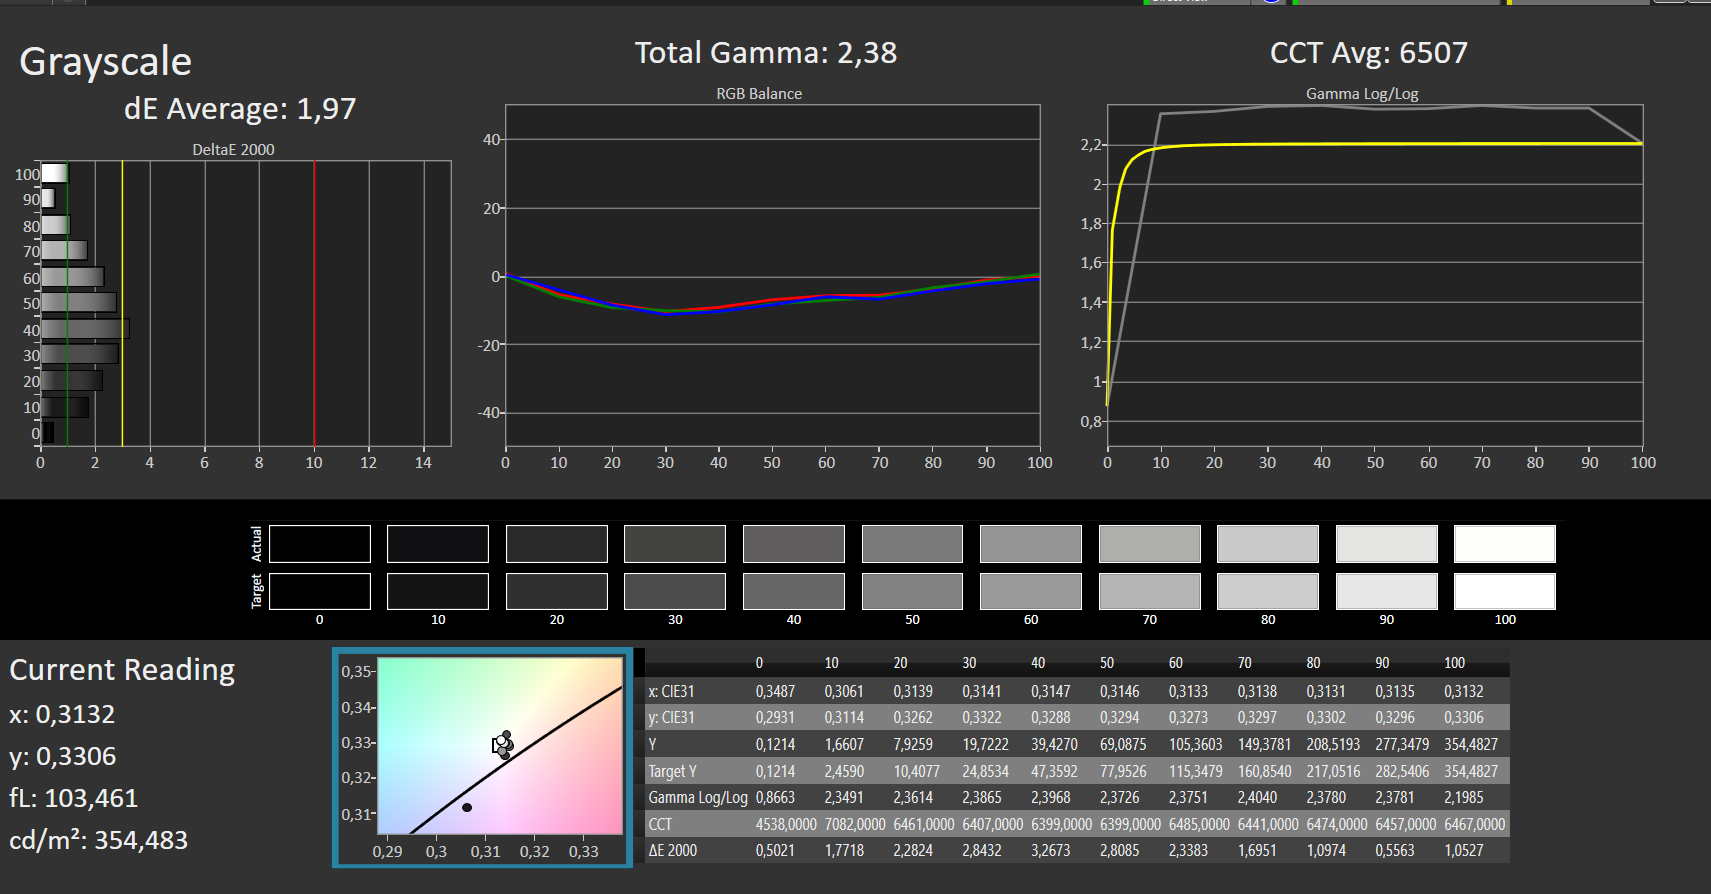
calibrated: 2.77
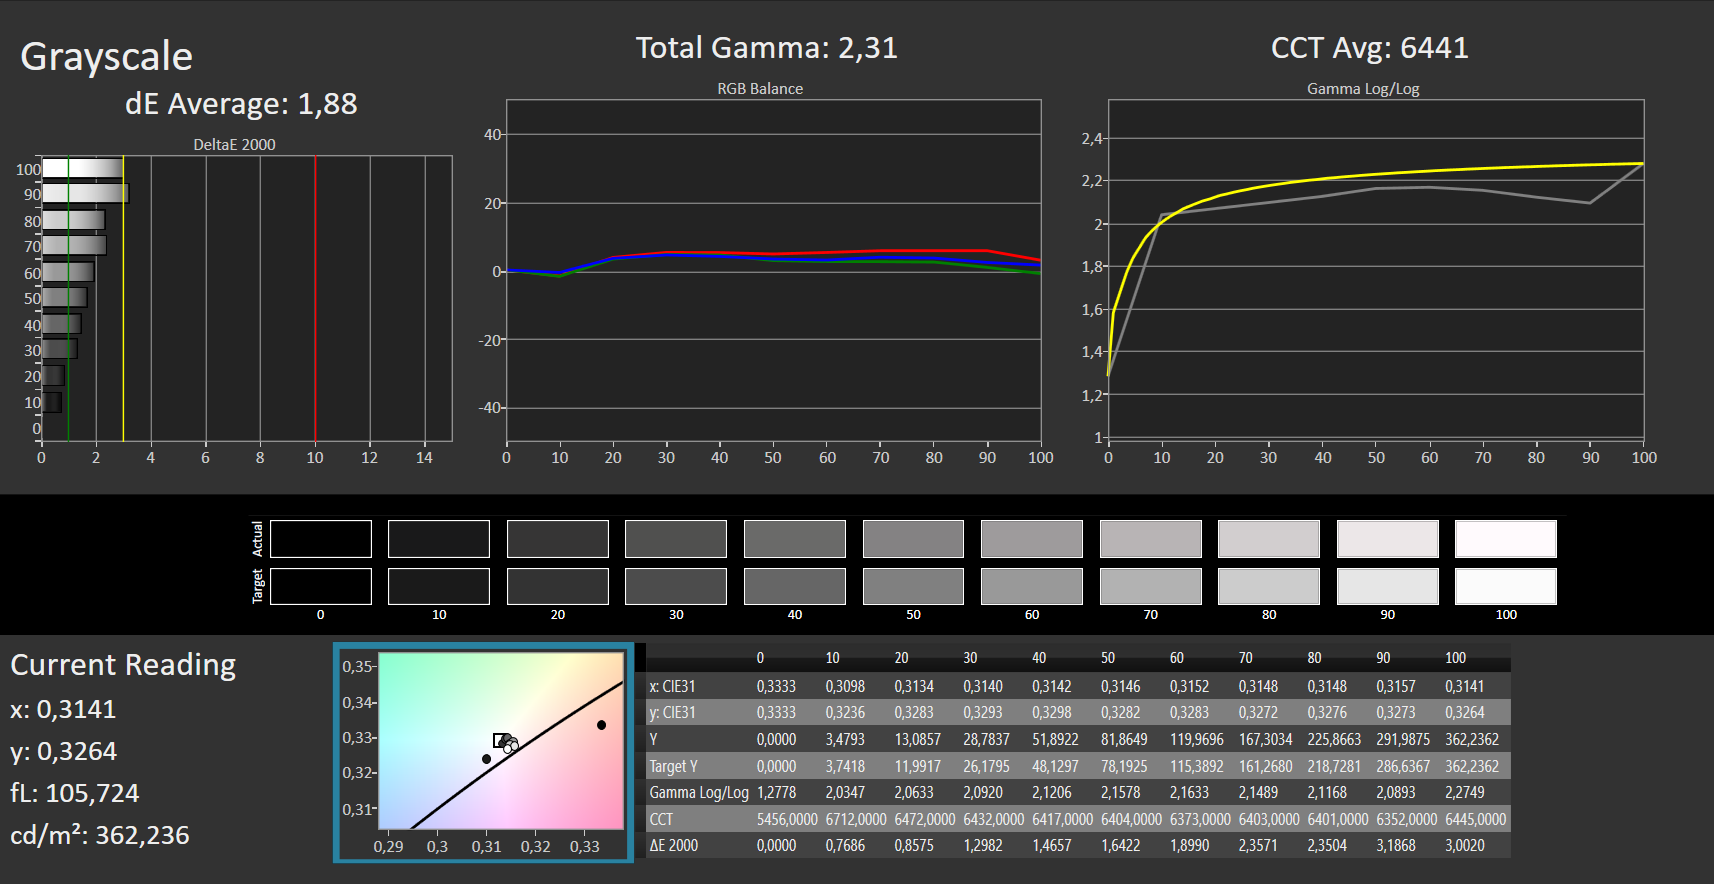
ΔE Greyscale Calman: 1.88 | ∀{0.09-98 Ø4.97}
98.6% AdobeRGB 1998 (Argyll 3D)
100% sRGB (Argyll 3D)
99.9% Display P3 (Argyll 3D)
Gamma: 2.31
CCT: 6441 K
| Asus ProArt StudioBook 16 W7600H5A-2BL2 ATNA60YV02-0, OLED, 3840x2400, 16" | HP ZBook Fury 15 G8 BOE0969, IPS, 3840x2160, 15.6" | HP ZBook Studio 15 G8 SDC4145, OLED, 3840x2160, 15.6" | Dell Precision 5000 5560 Sharp LQ156R1, IPS, 3840x2400, 15.6" | |
|---|---|---|---|---|
| Display | -5% | -1% | -1% | |
| Display P3 Coverage (%) | 99.9 | 95.9 -4% | 99.9 0% | 94.9 -5% |
| sRGB Coverage (%) | 100 | 100 0% | 100 0% | 100 0% |
| AdobeRGB 1998 Coverage (%) | 98.6 | 87.3 -11% | 95.3 -3% | 100 1% |
| Response Times | -545% | -20% | -1840% | |
| Response Time Grey 50% / Grey 80% * (ms) | 2 ? | 14.8 ? -640% | 2.4 ? -20% | 47.2 ? -2260% |
| Response Time Black / White * (ms) | 2 ? | 11 ? -450% | 2.4 ? -20% | 30.4 ? -1420% |
| PWM Frequency (Hz) | 240 ? | 240.4 ? | ||
| Screen | -40% | -36% | -24% | |
| Brightness middle (cd/m²) | 353 | 626 77% | 379.6 8% | 501.5 42% |
| Brightness (cd/m²) | 360 | 589 64% | 380 6% | 467 30% |
| Brightness Distribution (%) | 96 | 87 -9% | 95 -1% | 83 -14% |
| Black Level * (cd/m²) | 0.58 | 0.44 | ||
| Colorchecker dE 2000 * | 2.45 | 5.41 -121% | 5.15 -110% | 4.73 -93% |
| Colorchecker dE 2000 max. * | 3.75 | 9.05 -141% | 7.79 -108% | 8.45 -125% |
| Colorchecker dE 2000 calibrated * | 2.77 | 0.6 78% | 3.1 -12% | 0.51 82% |
| Greyscale dE 2000 * | 1.88 | 6.2 -230% | 2.6 -38% | 3.6 -91% |
| Gamma | 2.31 95% | 2.66 83% | 1.99 111% | 2.08 106% |
| CCT | 6441 101% | 6101 107% | 6166 105% | 6447 101% |
| Contrast (:1) | 1079 | 1140 | ||
| Toplam Ortalama (Program / Ayarlar) | -197% /
-116% | -19% /
-25% | -622% /
-321% |
* ... daha küçük daha iyidir
4K OLED HDR ekran sayesinde, üretim öncesi örneğimiz son derece yüksek kontrast ve zengin, derin siyahlar sunar. Panel, DCI-P3 ve sRGB renk alanlarını tamamen kapsıyor ve ayrıca AdobeRGB 1998 renk alanında %98,6 ile çok iyi değerler sunuyor. Ayrıca, çok iyi bir resim sunan çok yüksek bir görüntü keskinliği vardır, bu da ekranın profesyonel grafik düzenleme gereksinimlerini karşıladığı anlamına gelir.


Üretim öncesi test örneğimiz, yalnızca sınırlı ölçüde dış mekanda kullanıma uygundur. 350 cd/m² parlaklık ve parlak ekran ile gölgede bile kötü bir görüntüye sahipsiniz. HP ZBook Fury, rakipleri arasında 600 cd/m²'nin üzerinde parlaklığa sahip kurulu IPS paneli sayesinde daha iyisini yapabilir.
Yanıt Sürelerini Görüntüle
| ↔ Tepki Süresi Siyahtan Beyaza | ||
|---|---|---|
| 2 ms ... yükseliş ↗ ve sonbahar↘ birleşimi | ↗ 1 ms yükseliş |  |
| ↘ 1 ms sonbahar | ||
| Ekran, testlerimizde çok hızlı yanıt oranları gösteriyor ve hızlı oyun oynamaya çok uygun olmalı. Karşılaştırıldığında, test edilen tüm cihazlar 0.1 (minimum) ile 240 (maksimum) ms arasında değişir. » Tüm cihazların 11 %'si daha iyi. Bu, ölçülen yanıt süresinin test edilen tüm cihazların ortalamasından (19.8 ms) daha iyi olduğu anlamına gelir. | ||
| ↔ Tepki Süresi %50 Griden %80 Griye | ||
| 2 ms ... yükseliş ↗ ve sonbahar↘ birleşimi | ↗ 1 ms yükseliş |  |
| ↘ 1 ms sonbahar | ||
| Ekran, testlerimizde çok hızlı yanıt oranları gösteriyor ve hızlı oyun oynamaya çok uygun olmalı. Karşılaştırıldığında, test edilen tüm cihazlar 0.165 (minimum) ile 636 (maksimum) ms arasında değişir. » Tüm cihazların 10 %'si daha iyi. Bu, ölçülen yanıt süresinin test edilen tüm cihazların ortalamasından (31 ms) daha iyi olduğu anlamına gelir. | ||
Ekran Titremesi / PWM (Darbe Genişliği Modülasyonu)
| Ekran titriyor / PWM algılandı | 240 Hz | ≤ 80 % parlaklık ayarı |  |
Ekran arka ışığı 240 Hz'de titriyor (en kötü durum, örneğin PWM kullanılması) 80 % ve altındaki parlaklık ayarında titreme algılandı. Bu parlaklık ayarının üzerinde titreme veya PWM olmamalıdır. 240 Hz frekansı nispeten düşüktür, bu nedenle hassas kullanıcılar belirtilen parlaklık ayarında ve altında muhtemelen titremeyi fark edecek ve göz yorgunluğu yaşayacaktır. Karşılaştırıldığında: Test edilen tüm cihazların %52 %'si ekranı karartmak için PWM kullanmıyor. PWM tespit edilirse, ortalama 7753 (minimum: 5 - maksimum: 343500) Hz ölçüldü. | |||
Yerleşik OLED HDR paneli sayesinde Asus ProArt Studiobook Pro 16 OLED'imizin görüş açıları görüntüde herhangi bir bozulma olmadan süper geniştir.
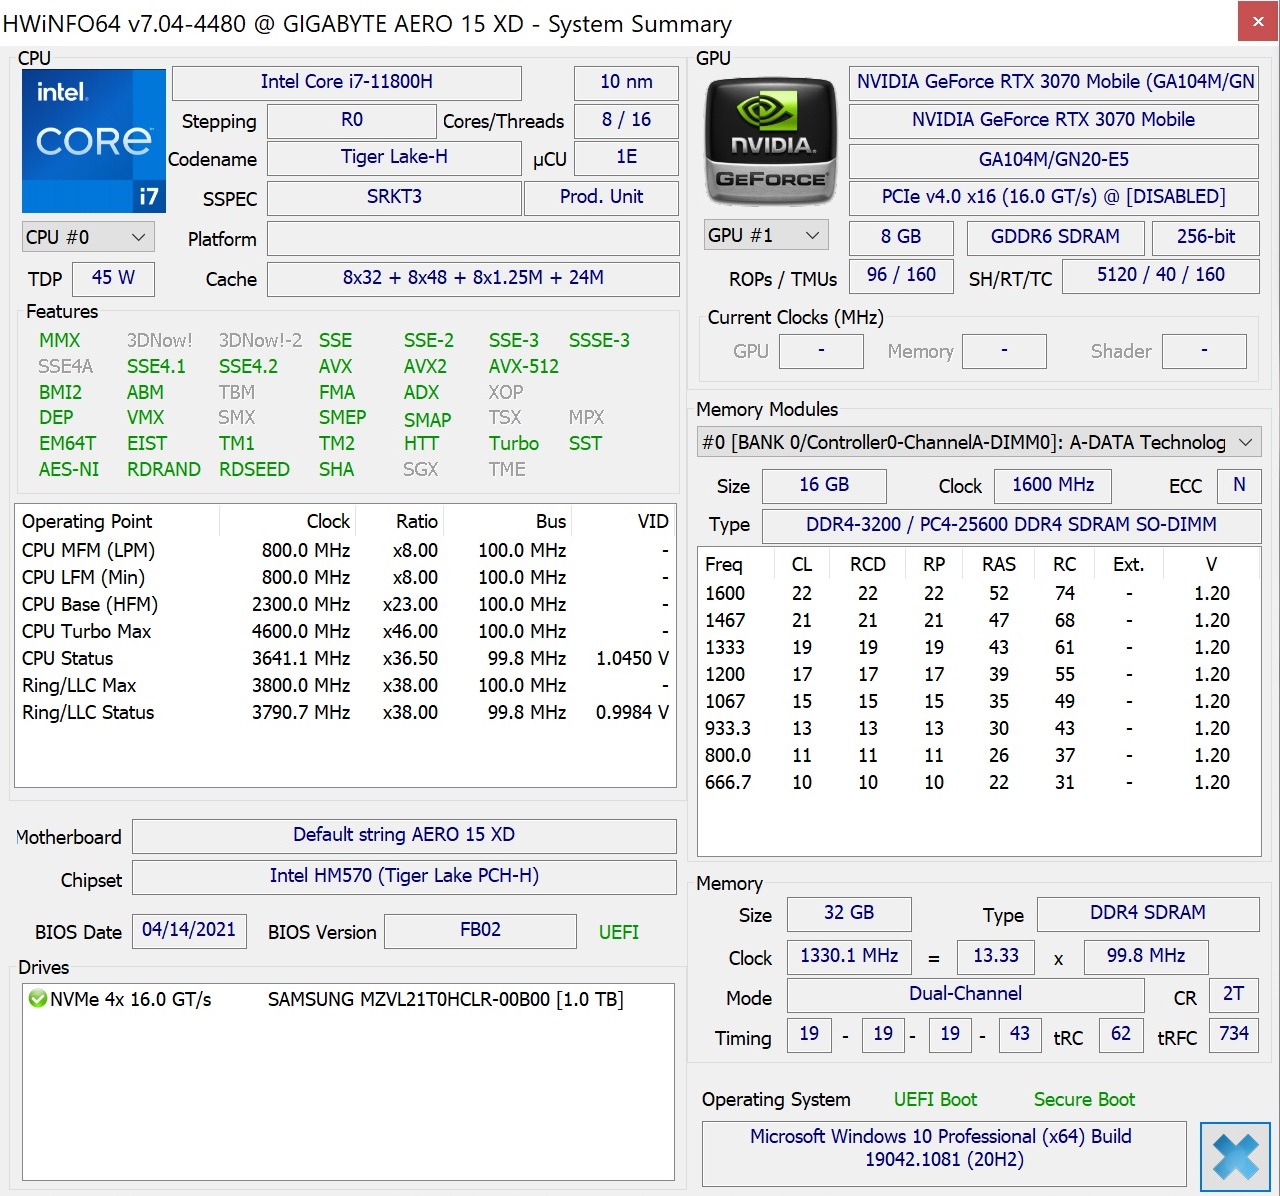
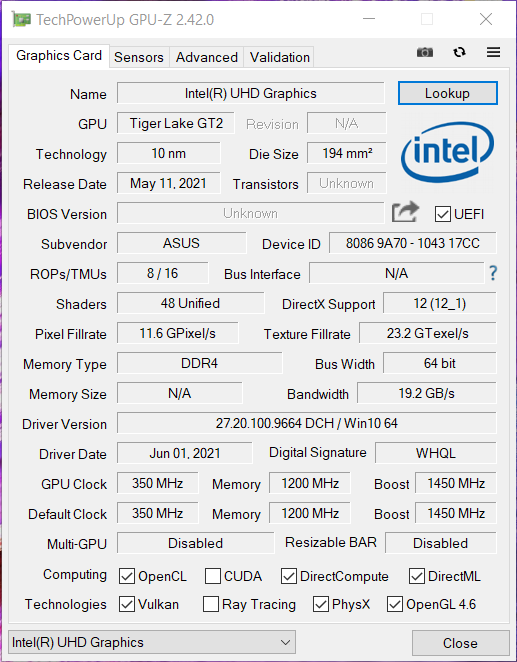
Performans: Gelişmiş soğutma ile üst düzey performans
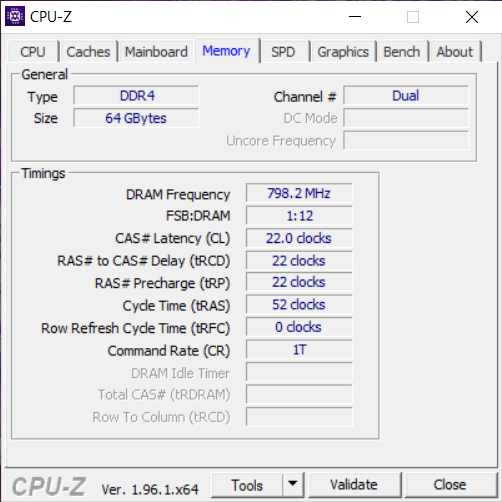
Asus, Intel ve Nvidia'nın şu anda iş istasyonları için sunduğu en yeni ve en güçlü bileşenleri kullanmaktan taviz vermiyor ve güveniyor. Bu nedenle, bir Raid 0 dizisinde 64 GB DDR4 RAM ve iki 2 TB NVMe SSD ile birlikte bir Intel Xeon W-11955M içeride çalışıyor. Grafik yükü, XE mimarisine dayalı olarak Nvidia RTX A5000 ve Intel UHD Graphics arasında dağıtılır . Cihazımızda kurulu çalışan bellek, 3200 MHz saat hızına sahip ECC RAM'dir. Ne yazık ki, SSD yuvaları iki PCI-Express 3.0 SSD tarafından işgal edilmiştir. Yapılandırmanın geri kalanı göz önüne alındığında, PCIe Gen.4 daha uygun olabilirdi. Diğer konfigürasyonların mevcut olup olmayacağı şüpheli, ancak bu görülmeye devam ediyor.
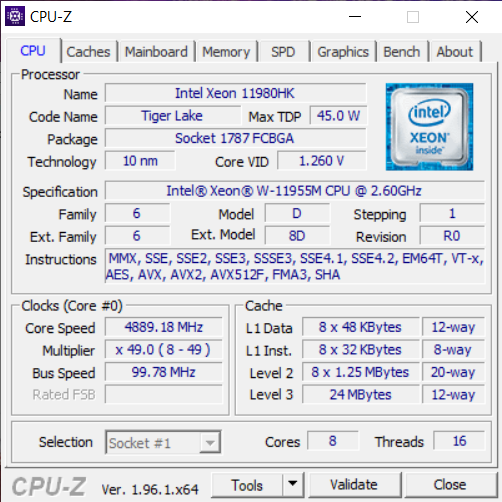
İşlemci
Şimdi 2021 yılının 2. çeyreğinde tanıtılan Tiger-Lake okta çekirdekli CPU'dan bahsedelim. Mobil iş istasyonları için tasarlanan Intel Xeon W11955M,, yeni 10 nm SuperFin prosesi ile üretiliyor ve bu işlemciye kıyasla Intel Core i9-11950H ayrıca ECC belleği için destek sunar. Çip, 45 watt'lık bir TDP'ye sahiptir, ancak bu, test örneğimizde daha yüksek yapılandırılmıştır ve uygulama senaryosuna bağlı olarak kalıcı olarak 54 watt'a yükselir. İşlemci çekirdekleri 2,6 ila 5 GHz arasında saat hızına sahip olabilir ve DDR4-3200 belleği destekler.
Cinebench Multi dayanıklılık testimizde performans beklenen düzeyde ve bu nedenle HP ZBook Fury'nin Intel Core i9-11950H'sinden kolayca daha iyi performans gösteriyor. Bir yandan, bu aynı zamanda 140W'lık bir birleşik TDP için tasarlanmış kurulu soğutma sisteminden de kaynaklanmaktadır. Cihazı, Asus ProArt Creator Hub'da bulunan ve soğutmayı gerekli görevlere dinamik olarak uyarlayan performans modunda test ettik. Günlük görevler için standart mod vardır ve uygulama ayrıca fanların tam hıza ayarlanmasına izin verir. Ancak bu, fanlar sürekli yüksek 5.600 RPM'de çalışırken kulaklığın takılması gerekliliği dışında testlerde fazla bir katma değer sağlamadı. Batarya modunda sistem cihazımızı 54'ten 15 watt'a kadar yavaşlatıyor ki bu da performansında fark ediliyor. İşlemci hakkında daha fazla ayrıntı CPU bölümümüzde bulunabilir.
Cinebench R15 Çoklu dayanıklılık testi
Cinebench R20: CPU (Multi Core) | CPU (Single Core)
Cinebench R15: CPU Multi 64Bit | CPU Single 64Bit
Blender: v2.79 BMW27 CPU
7-Zip 18.03: 7z b 4 | 7z b 4 -mmt1
Geekbench 5.5: Multi-Core | Single-Core
HWBOT x265 Benchmark v2.2: 4k Preset
LibreOffice : 20 Documents To PDF
R Benchmark 2.5: Overall mean
SPECviewperf 2020: 1920x1080 Solidworks (solidworks-05) | 1920x1080 Siemens NX (snx-04) | 1920x1080 Medical (medical-03) | 1920x1080 Maya (maya-06) | 1920x1080 Energy (energy-03) | 1920x1080 Creo (creo-03) | 1920x1080 CATIA (catia-06) | 1920x1080 3ds Max (3dsmax-07) | 3840x2160 Solidworks (solidworks-05) | 3840x2160 Siemens NX (snx-04) | 3840x2160 Medical (medical-03) | 3840x2160 Maya (maya-06) | 3840x2160 Energy (energy-03) | 3840x2160 Creo (creo-03) | 3840x2160 CATIA (catia-06) | 3840x2160 3ds Max (3dsmax-07)
| Cinebench R23 / Multi Core | |
| Sınıf ortalaması Workstation (14621 - 38520, n=24, son 2 yıl) | |
| Schenker XMG Ultra 17 Rocket Lake | |
| MSI GS76 Stealth 11UH | |
| HP ZBook Fury 15 G8 | |
| HP ZBook Studio 15 G8 | |
| Ortalama Intel Xeon W-11955M (10862 - 12412, n=2) | |
| Asus ProArt StudioBook 16 W7600H5A-2BL2 | |
| Dell Precision 5000 5560 | |
| Cinebench R23 / Single Core | |
| Sınıf ortalaması Workstation (1712 - 2228, n=24, son 2 yıl) | |
| Schenker XMG Ultra 17 Rocket Lake | |
| HP ZBook Fury 15 G8 | |
| MSI GS76 Stealth 11UH | |
| HP ZBook Studio 15 G8 | |
| Ortalama Intel Xeon W-11955M (1480 - 1621, n=2) | |
| Dell Precision 5000 5560 | |
| Asus ProArt StudioBook 16 W7600H5A-2BL2 | |
| Cinebench R20 / CPU (Multi Core) | |
| Sınıf ortalaması Workstation (5760 - 15043, n=24, son 2 yıl) | |
| Schenker XMG Ultra 17 Rocket Lake | |
| MSI GS76 Stealth 11UH | |
| HP ZBook Fury 15 G8 | |
| HP ZBook Studio 15 G8 | |
| Asus ProArt StudioBook 16 W7600H5A-2BL2 | |
| Ortalama Intel Xeon W-11955M (n=1) | |
| Dell Precision 5000 5560 | |
| Cinebench R20 / CPU (Single Core) | |
| Sınıf ortalaması Workstation (671 - 857, n=24, son 2 yıl) | |
| Schenker XMG Ultra 17 Rocket Lake | |
| HP ZBook Fury 15 G8 | |
| HP ZBook Studio 15 G8 | |
| MSI GS76 Stealth 11UH | |
| Dell Precision 5000 5560 | |
| Asus ProArt StudioBook 16 W7600H5A-2BL2 | |
| Ortalama Intel Xeon W-11955M (n=1) | |
| Cinebench R15 / CPU Multi 64Bit | |
| Sınıf ortalaması Workstation (2489 - 5810, n=24, son 2 yıl) | |
| Schenker XMG Ultra 17 Rocket Lake | |
| MSI GS76 Stealth 11UH | |
| Asus ProArt StudioBook 16 W7600H5A-2BL2 | |
| Ortalama Intel Xeon W-11955M (n=1) | |
| HP ZBook Studio 15 G8 | |
| HP ZBook Fury 15 G8 | |
| Dell Precision 5000 5560 | |
| Cinebench R15 / CPU Single 64Bit | |
| Sınıf ortalaması Workstation (191.4 - 328, n=24, son 2 yıl) | |
| Schenker XMG Ultra 17 Rocket Lake | |
| HP ZBook Fury 15 G8 | |
| MSI GS76 Stealth 11UH | |
| HP ZBook Studio 15 G8 | |
| Dell Precision 5000 5560 | |
| Asus ProArt StudioBook 16 W7600H5A-2BL2 | |
| Ortalama Intel Xeon W-11955M (n=1) | |
| Blender / v2.79 BMW27 CPU | |
| Dell Precision 5000 5560 | |
| Asus ProArt StudioBook 16 W7600H5A-2BL2 | |
| Ortalama Intel Xeon W-11955M (n=1) | |
| HP ZBook Fury 15 G8 | |
| HP ZBook Studio 15 G8 | |
| MSI GS76 Stealth 11UH | |
| Schenker XMG Ultra 17 Rocket Lake | |
| Sınıf ortalaması Workstation (91 - 222, n=24, son 2 yıl) | |
| 7-Zip 18.03 / 7z b 4 | |
| Sınıf ortalaması Workstation (60489 - 116969, n=24, son 2 yıl) | |
| Schenker XMG Ultra 17 Rocket Lake | |
| MSI GS76 Stealth 11UH | |
| HP ZBook Fury 15 G8 | |
| HP ZBook Studio 15 G8 | |
| Asus ProArt StudioBook 16 W7600H5A-2BL2 | |
| Ortalama Intel Xeon W-11955M (n=1) | |
| Dell Precision 5000 5560 | |
| 7-Zip 18.03 / 7z b 4 -mmt1 | |
| Sınıf ortalaması Workstation (5126 - 6960, n=24, son 2 yıl) | |
| Schenker XMG Ultra 17 Rocket Lake | |
| HP ZBook Studio 15 G8 | |
| HP ZBook Fury 15 G8 | |
| Dell Precision 5000 5560 | |
| MSI GS76 Stealth 11UH | |
| Asus ProArt StudioBook 16 W7600H5A-2BL2 | |
| Ortalama Intel Xeon W-11955M (n=1) | |
| Geekbench 5.5 / Multi-Core | |
| Sınıf ortalaması Workstation (11542 - 25554, n=24, son 2 yıl) | |
| Schenker XMG Ultra 17 Rocket Lake | |
| MSI GS76 Stealth 11UH | |
| Ortalama Intel Xeon W-11955M (8349 - 9766, n=2) | |
| Asus ProArt StudioBook 16 W7600H5A-2BL2 | |
| HP ZBook Studio 15 G8 | |
| Geekbench 5.5 / Single-Core | |
| Sınıf ortalaması Workstation (1783 - 2183, n=24, son 2 yıl) | |
| Schenker XMG Ultra 17 Rocket Lake | |
| HP ZBook Studio 15 G8 | |
| MSI GS76 Stealth 11UH | |
| Ortalama Intel Xeon W-11955M (1487 - 1686, n=2) | |
| Asus ProArt StudioBook 16 W7600H5A-2BL2 | |
| HWBOT x265 Benchmark v2.2 / 4k Preset | |
| Sınıf ortalaması Workstation (17.8 - 40.5, n=24, son 2 yıl) | |
| Schenker XMG Ultra 17 Rocket Lake | |
| MSI GS76 Stealth 11UH | |
| HP ZBook Studio 15 G8 | |
| HP ZBook Fury 15 G8 | |
| Asus ProArt StudioBook 16 W7600H5A-2BL2 | |
| Ortalama Intel Xeon W-11955M (n=1) | |
| Dell Precision 5000 5560 | |
| LibreOffice / 20 Documents To PDF | |
| HP ZBook Fury 15 G8 | |
| MSI GS76 Stealth 11UH | |
| HP ZBook Studio 15 G8 | |
| Dell Precision 5000 5560 | |
| Sınıf ortalaması Workstation (37.1 - 74.7, n=24, son 2 yıl) | |
| Schenker XMG Ultra 17 Rocket Lake | |
| Asus ProArt StudioBook 16 W7600H5A-2BL2 | |
| Ortalama Intel Xeon W-11955M (n=1) | |
| R Benchmark 2.5 / Overall mean | |
| Asus ProArt StudioBook 16 W7600H5A-2BL2 | |
| Ortalama Intel Xeon W-11955M (n=1) | |
| HP ZBook Studio 15 G8 | |
| HP ZBook Fury 15 G8 | |
| Dell Precision 5000 5560 | |
| MSI GS76 Stealth 11UH | |
| Schenker XMG Ultra 17 Rocket Lake | |
| Sınıf ortalaması Workstation (0.3825 - 0.603, n=24, son 2 yıl) | |
| SPECviewperf 2020 / Solidworks (solidworks-05) | |
| Asus ProArt StudioBook 16 W7600H5A-2BL2 | |
| Ortalama Intel Xeon W-11955M (n=1) | |
| Sınıf ortalaması Workstation (50.6 - 542, n=10, son 2 yıl) | |
| HP ZBook Fury 15 G8 | |
| Dell Precision 5000 5560 | |
| SPECviewperf 2020 / Siemens NX (snx-04) | |
| Sınıf ortalaması Workstation (22.3 - 903, n=24, son 2 yıl) | |
| Asus ProArt StudioBook 16 W7600H5A-2BL2 | |
| Ortalama Intel Xeon W-11955M (n=1) | |
| HP ZBook Fury 15 G8 | |
| Dell Precision 5000 5560 | |
| SPECviewperf 2020 / Medical (medical-03) | |
| Sınıf ortalaması Workstation (28.8 - 227, n=24, son 2 yıl) | |
| Asus ProArt StudioBook 16 W7600H5A-2BL2 | |
| Ortalama Intel Xeon W-11955M (n=1) | |
| HP ZBook Fury 15 G8 | |
| Dell Precision 5000 5560 | |
| SPECviewperf 2020 / Maya (maya-06) | |
| Sınıf ortalaması Workstation (117.8 - 724, n=23, son 2 yıl) | |
| Asus ProArt StudioBook 16 W7600H5A-2BL2 | |
| Ortalama Intel Xeon W-11955M (n=1) | |
| HP ZBook Fury 15 G8 | |
| Dell Precision 5000 5560 | |
| SPECviewperf 2020 / Energy (energy-03) | |
| Asus ProArt StudioBook 16 W7600H5A-2BL2 | |
| Ortalama Intel Xeon W-11955M (n=1) | |
| Sınıf ortalaması Workstation (2.78 - 176.7, n=24, son 2 yıl) | |
| HP ZBook Fury 15 G8 | |
| Dell Precision 5000 5560 | |
| SPECviewperf 2020 / Creo (creo-03) | |
| Asus ProArt StudioBook 16 W7600H5A-2BL2 | |
| Ortalama Intel Xeon W-11955M (n=1) | |
| Sınıf ortalaması Workstation (49.2 - 261, n=24, son 2 yıl) | |
| HP ZBook Fury 15 G8 | |
| Dell Precision 5000 5560 | |
| SPECviewperf 2020 / CATIA (catia-06) | |
| Asus ProArt StudioBook 16 W7600H5A-2BL2 | |
| Ortalama Intel Xeon W-11955M (n=1) | |
| HP ZBook Fury 15 G8 | |
| Sınıf ortalaması Workstation (27.1 - 182.2, n=24, son 2 yıl) | |
| Dell Precision 5000 5560 | |
| SPECviewperf 2020 / 3ds Max (3dsmax-07) | |
| Asus ProArt StudioBook 16 W7600H5A-2BL2 | |
| Ortalama Intel Xeon W-11955M (n=1) | |
| Sınıf ortalaması Workstation (24.7 - 251, n=24, son 2 yıl) | |
| HP ZBook Fury 15 G8 | |
| Dell Precision 5000 5560 | |
| SPECviewperf 2020 / Solidworks (solidworks-05) | |
| Asus ProArt StudioBook 16 W7600H5A-2BL2 | |
| Ortalama Intel Xeon W-11955M (n=1) | |
| HP ZBook Fury 15 G8 | |
| Dell Precision 5000 5560 | |
| SPECviewperf 2020 / Siemens NX (snx-04) | |
| Sınıf ortalaması Workstation (30.6 - 561, n=11, son 2 yıl) | |
| Asus ProArt StudioBook 16 W7600H5A-2BL2 | |
| Ortalama Intel Xeon W-11955M (n=1) | |
| HP ZBook Fury 15 G8 | |
| Dell Precision 5000 5560 | |
| SPECviewperf 2020 / Medical (medical-03) | |
| Sınıf ortalaması Workstation (20.3 - 96.8, n=12, son 2 yıl) | |
| Ortalama Intel Xeon W-11955M (n=1) | |
| Asus ProArt StudioBook 16 W7600H5A-2BL2 | |
| HP ZBook Fury 15 G8 | |
| Dell Precision 5000 5560 | |
| SPECviewperf 2020 / Maya (maya-06) | |
| Sınıf ortalaması Workstation (132 - 380, n=12, son 2 yıl) | |
| Asus ProArt StudioBook 16 W7600H5A-2BL2 | |
| Ortalama Intel Xeon W-11955M (n=1) | |
| HP ZBook Fury 15 G8 | |
| Dell Precision 5000 5560 | |
| SPECviewperf 2020 / Energy (energy-03) | |
| Asus ProArt StudioBook 16 W7600H5A-2BL2 | |
| Ortalama Intel Xeon W-11955M (n=1) | |
| Sınıf ortalaması Workstation (15.8 - 74.3, n=12, son 2 yıl) | |
| HP ZBook Fury 15 G8 | |
| Dell Precision 5000 5560 | |
| SPECviewperf 2020 / Creo (creo-03) | |
| Sınıf ortalaması Workstation (47.2 - 185.7, n=12, son 2 yıl) | |
| HP ZBook Fury 15 G8 | |
| Asus ProArt StudioBook 16 W7600H5A-2BL2 | |
| Ortalama Intel Xeon W-11955M (n=1) | |
| Dell Precision 5000 5560 | |
| SPECviewperf 2020 / CATIA (catia-06) | |
| Sınıf ortalaması Workstation (44 - 106, n=12, son 2 yıl) | |
| Asus ProArt StudioBook 16 W7600H5A-2BL2 | |
| Ortalama Intel Xeon W-11955M (n=1) | |
| HP ZBook Fury 15 G8 | |
| Dell Precision 5000 5560 | |
| SPECviewperf 2020 / 3ds Max (3dsmax-07) | |
| Sınıf ortalaması Workstation (47.4 - 154.7, n=12, son 2 yıl) | |
| Asus ProArt StudioBook 16 W7600H5A-2BL2 | |
| Ortalama Intel Xeon W-11955M (n=1) | |
| HP ZBook Fury 15 G8 | |
| Dell Precision 5000 5560 | |
* ... daha küçük daha iyidir
Sistem performansı
Sistem performansı da - beklentilere göre - tüm rakiplerinin üzerinde. Asus ProArt Studiobook 16, Intel Core i9 11900K ve Lenovo Thinkpad P1 ile yalnızca masaüstü muadili Schenker XMG Ultra 17'ye yenilgiyi kabul etmek zorunda . Günlük kullanımda sistemle ilgili herhangi bir sorun tespit edemedik ve tüm görevler gecikmeden yerine getirildi. Programları açarken ve kapatırken sadece şebeke ve pil çalışması arasındaki küçük fark fark edilir.
| PCMark 10 / Score | |
| Sınıf ortalaması Workstation (6563 - 10409, n=20, son 2 yıl) | |
| Schenker XMG Ultra 17 Rocket Lake | |
| Lenovo ThinkPad P1 G4-20Y4S0KS00 | |
| Asus ProArt StudioBook 16 W7600H5A-2BL2 | |
| Ortalama Intel Xeon W-11955M, NVIDIA RTX A5000 Laptop GPU (n=1) | |
| HP ZBook Fury 15 G8 | |
| HP ZBook Studio 15 G8 | |
| Dell Precision 5000 5560 | |
| PCMark 10 / Essentials | |
| Schenker XMG Ultra 17 Rocket Lake | |
| Lenovo ThinkPad P1 G4-20Y4S0KS00 | |
| Dell Precision 5000 5560 | |
| Sınıf ortalaması Workstation (9622 - 11157, n=20, son 2 yıl) | |
| Asus ProArt StudioBook 16 W7600H5A-2BL2 | |
| Ortalama Intel Xeon W-11955M, NVIDIA RTX A5000 Laptop GPU (n=1) | |
| HP ZBook Fury 15 G8 | |
| HP ZBook Studio 15 G8 | |
| PCMark 10 / Productivity | |
| Sınıf ortalaması Workstation (8789 - 20616, n=20, son 2 yıl) | |
| Schenker XMG Ultra 17 Rocket Lake | |
| Dell Precision 5000 5560 | |
| Asus ProArt StudioBook 16 W7600H5A-2BL2 | |
| Ortalama Intel Xeon W-11955M, NVIDIA RTX A5000 Laptop GPU (n=1) | |
| Lenovo ThinkPad P1 G4-20Y4S0KS00 | |
| HP ZBook Fury 15 G8 | |
| HP ZBook Studio 15 G8 | |
| PCMark 10 / Digital Content Creation | |
| Sınıf ortalaması Workstation (8108 - 15631, n=20, son 2 yıl) | |
| Schenker XMG Ultra 17 Rocket Lake | |
| Lenovo ThinkPad P1 G4-20Y4S0KS00 | |
| Asus ProArt StudioBook 16 W7600H5A-2BL2 | |
| Ortalama Intel Xeon W-11955M, NVIDIA RTX A5000 Laptop GPU (n=1) | |
| HP ZBook Fury 15 G8 | |
| HP ZBook Studio 15 G8 | |
| Dell Precision 5000 5560 | |
| PCMark 10 Score | 6951 puan | |
Yardım | ||
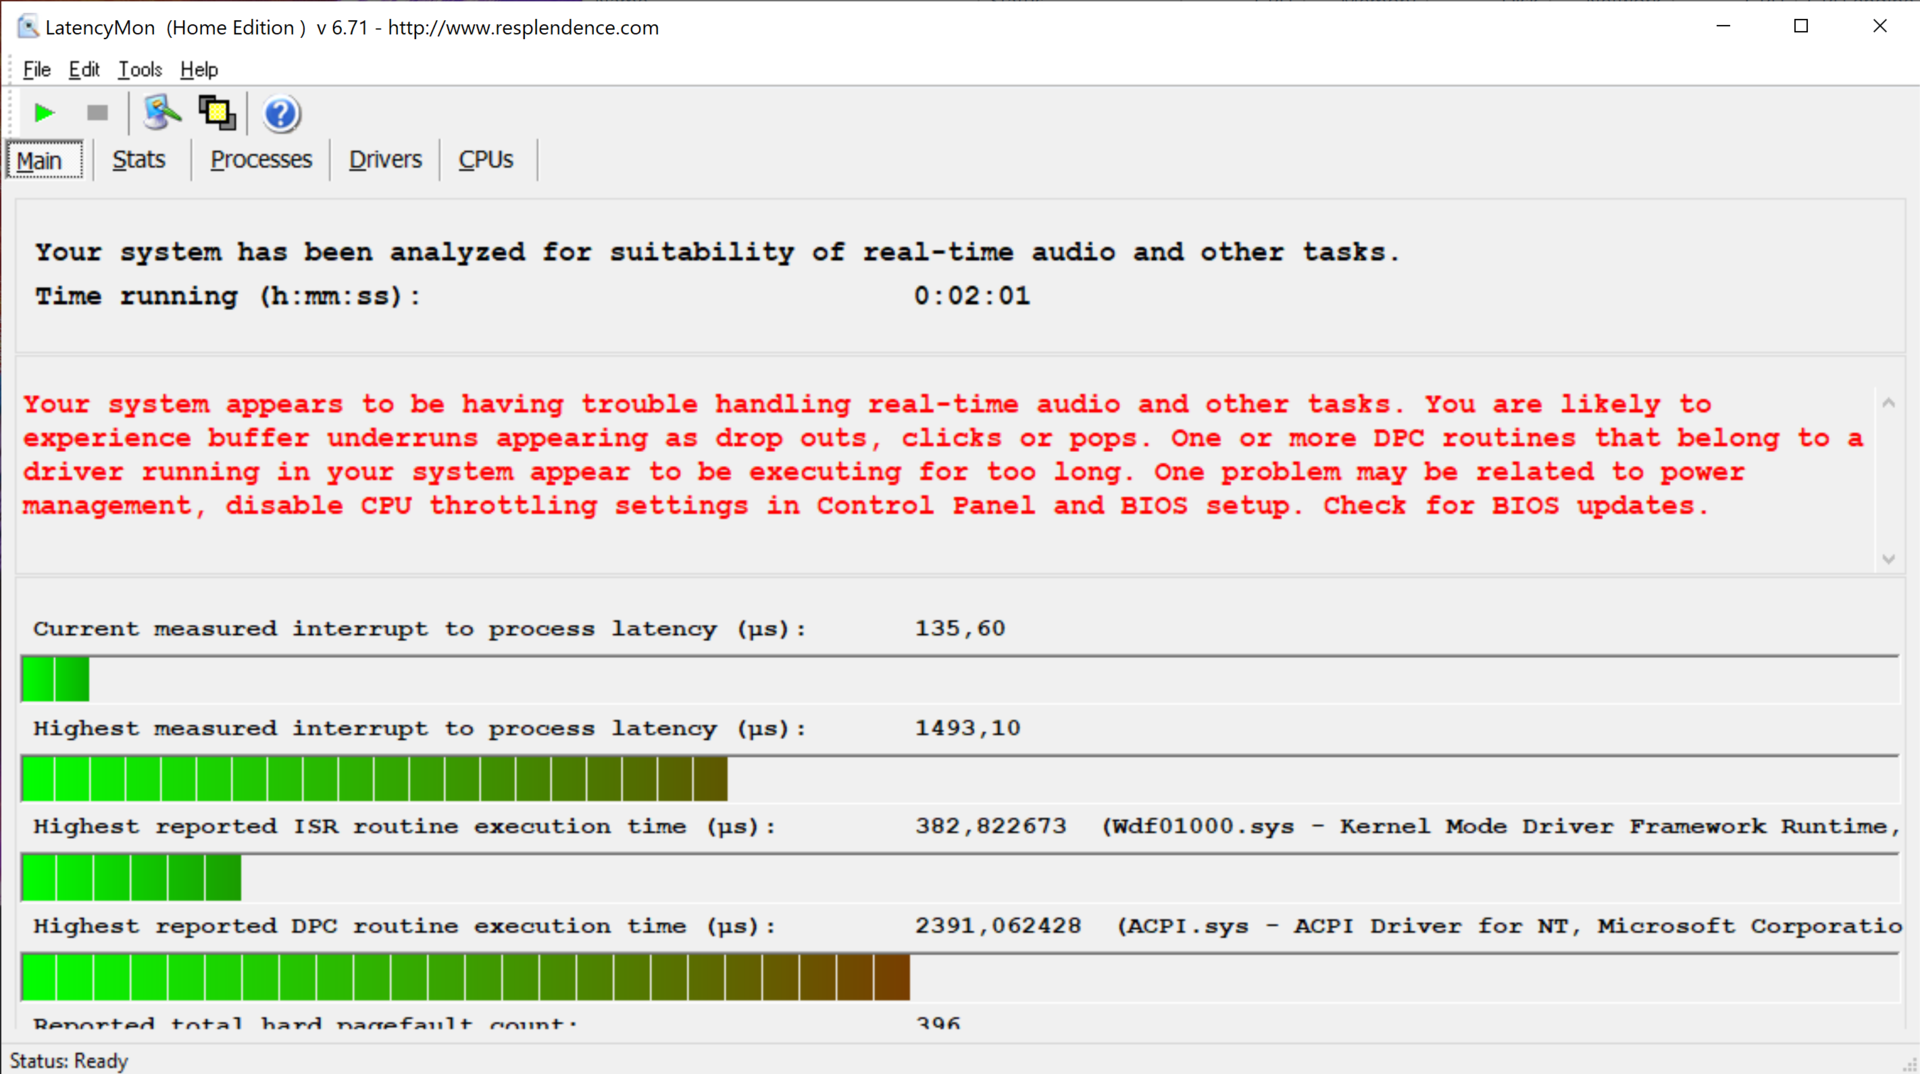
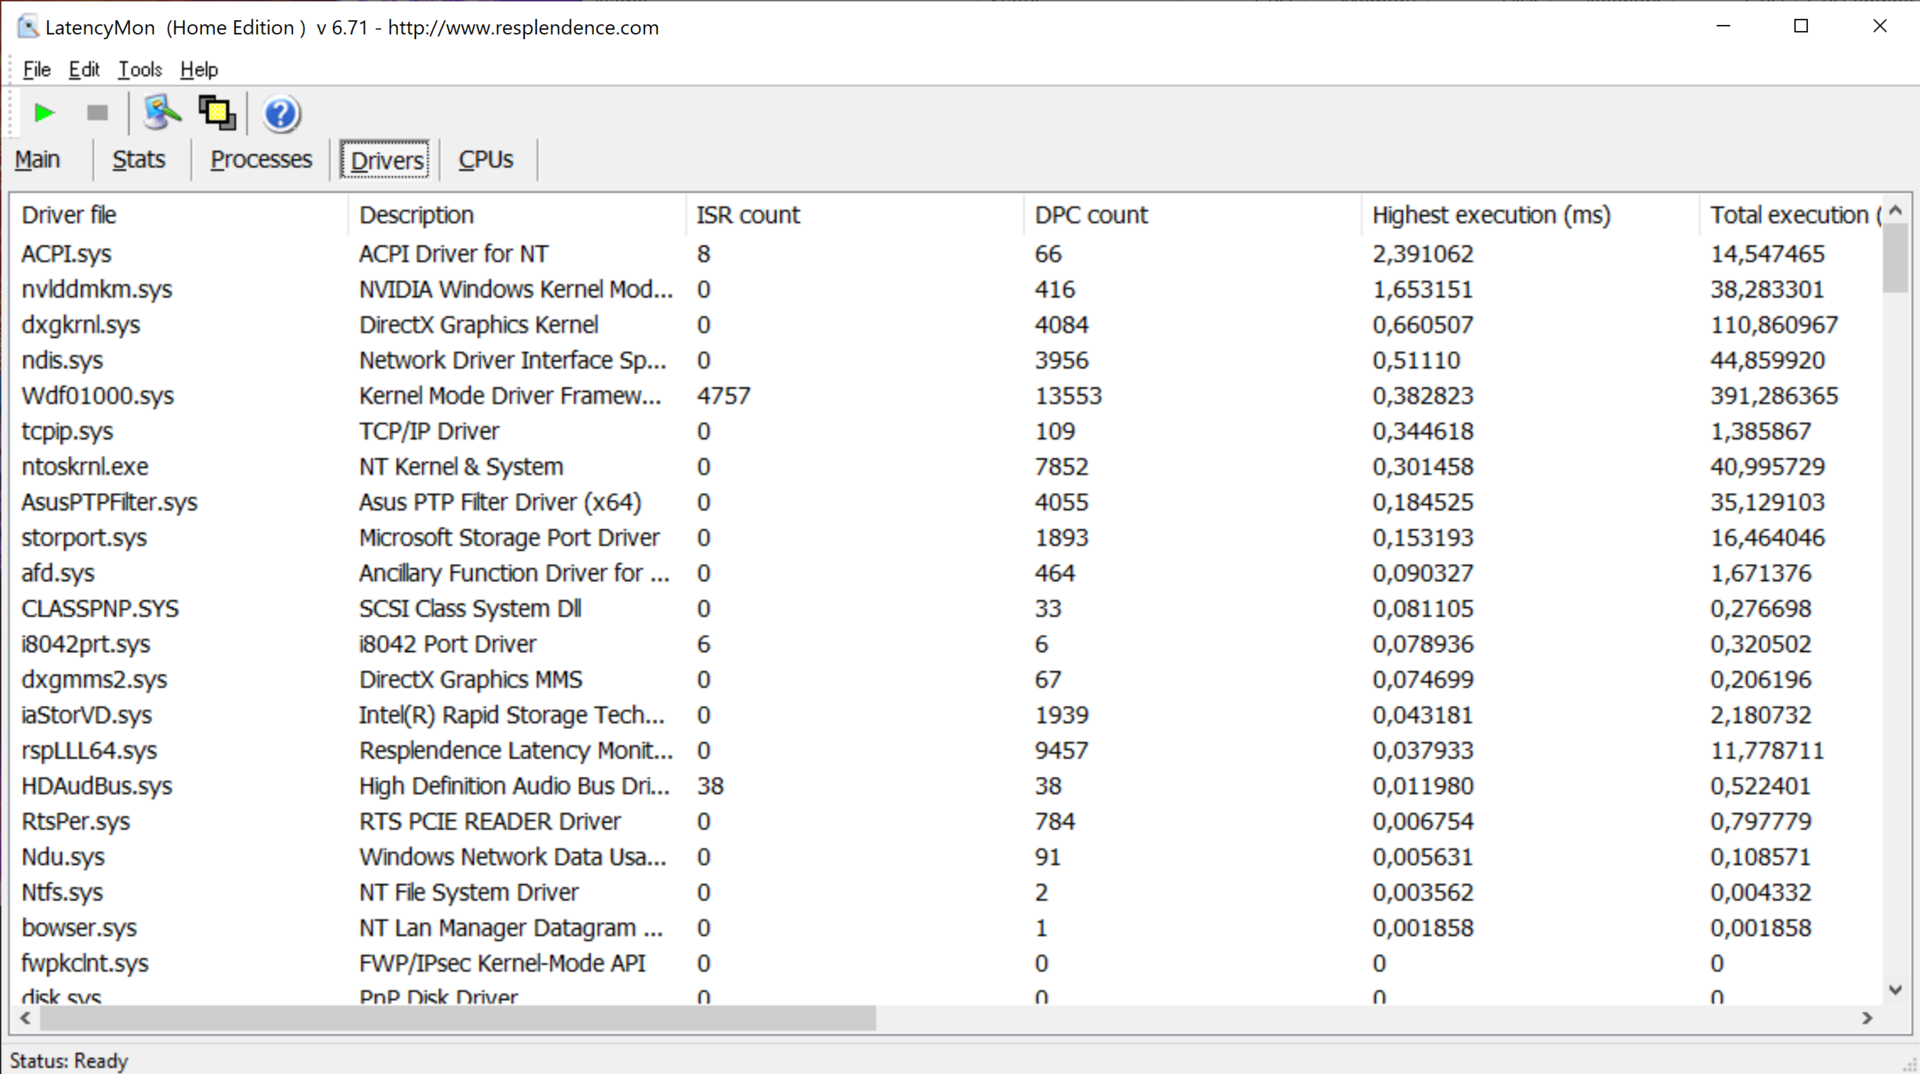
DPC gecikmeleri
Test cihazımızın kullanım amacı ses ve video dosyalarıyla çalışmayı içerdiğinden, DPC gecikmeleri sorunlara neden olabilir. Test, gecikmeler açısından optimizasyona ihtiyaç olduğunu gösterdi ve cihazımızın kendisi Youtube video testimiz sırasında kareler düşürdü.
| DPC Latencies / LatencyMon - interrupt to process latency (max), Web, Youtube, Prime95 | |
| HP ZBook Studio 15 G8 | |
| Asus ProArt StudioBook 16 W7600H5A-2BL2 | |
| Dell Precision 5000 5560 | |
| HP ZBook Fury 15 G8 | |
* ... daha küçük daha iyidir
Depolama
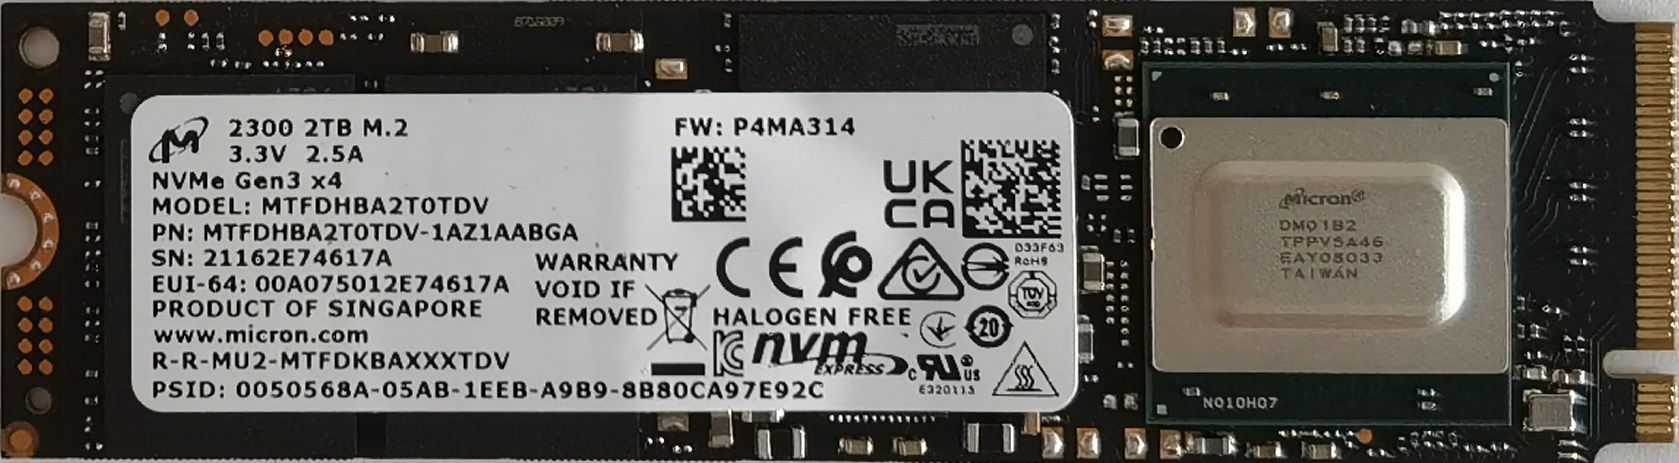
Ön üretim cihazı teorik olarak iki adede kadar M.2 PCI-Express 4.0 NVMe SSD'yi destekler, bu nedenle Asus'un neden burada bir RAID 0 konfigürasyonunda PCIe 3.0'lı iki SSD'yi kurduğu sorgulanabilir. Bunlar, AS SSD kıyaslamasında ve Crystal DiskMark'ta oldukça vasat bir performans sergiliyor ve HP Zbook Fury'deki tek PCIe 3.0 SSD bile bazı kıyaslama bölümlerinde yapılandırmamızın arkasında. Burada da bir optimizasyon ihtiyacı görüyoruz: Asus ya PCIe 4.0 sürücülerine güvenmeli ya da sürücülerini optimize etmekle meşgul olmalı.
| Asus ProArt StudioBook 16 W7600H5A-2BL2 2x Micron 2300 2TB MTFDHBA2T0TDV (RAID 0) | HP ZBook Fury 15 G8 Samsung PM981a MZVLB1T0HBLR | Schenker XMG Ultra 17 Rocket Lake Samsung SSD 980 Pro 2TB MZ-V8P2T0 | HP ZBook Studio 15 G8 Samsung PM981a MZVLB2T0HALB | Dell Precision 5000 5560 Samsung PM9A1 MZVL22T0HBLB | Lenovo ThinkPad P1 G4-20Y4S0KS00 Samsung PM9A1 MZVL21T0HCLR | Ortalama 2x Micron 2300 2TB MTFDHBA2T0TDV (RAID 0) | |
|---|---|---|---|---|---|---|---|
| CrystalDiskMark 5.2 / 6 | 38% | 174% | 44% | 110% | 0% | ||
| Write 4K (MB/s) | 105.6 | 96.3 -9% | 240 127% | 110.5 5% | 172.4 63% | 105.6 ? 0% | |
| Read 4K (MB/s) | 50.2 | 51.5 3% | 87.8 75% | 51.8 3% | 78.8 57% | 50.2 ? 0% | |
| Write Seq (MB/s) | 445.6 | 1942 336% | 4281 861% | 2071 365% | 2991 571% | 446 ? 0% | |
| Read Seq (MB/s) | 753 | 2504 233% | 4228 461% | 2505 233% | 3351 345% | 753 ? 0% | |
| Write 4K Q32T1 (MB/s) | 2713 | 346.6 -87% | 696 -74% | 429.8 -84% | 459.2 -83% | 2713 ? 0% | |
| Read 4K Q32T1 (MB/s) | 2399 | 408 -83% | 778 -68% | 418.3 -83% | 484.3 -80% | 2399 ? 0% | |
| Write Seq Q32T1 (MB/s) | 5378 | 3019 -44% | 5195 -3% | 3060 -43% | 4761 -11% | 5378 ? 0% | |
| Read Seq Q32T1 (MB/s) | 6189 | 3514 -43% | 7099 15% | 3539 -43% | 7071 14% | 6189 ? 0% | |
| AS SSD | -21% | 80% | 14% | 35% | 85% | 0% | |
| Seq Read (MB/s) | 4317 | 2937 -32% | 5010 16% | 2953 -32% | 5169 20% | 4526 5% | 4317 ? 0% |
| Seq Write (MB/s) | 2037 | 1688 -17% | 3974 95% | 1691 -17% | 1986 -3% | 3988 96% | 2037 ? 0% |
| 4K Read (MB/s) | 48.97 | 44.27 -10% | 51.9 6% | 43.98 -10% | 78 59% | 82.9 69% | 49 ? 0% |
| 4K Write (MB/s) | 112.4 | 105.8 -6% | 156.8 40% | 105.4 -6% | 214.6 91% | 207.5 85% | 112.4 ? 0% |
| 4K-64 Read (MB/s) | 1253 | 873 -30% | 2611 108% | 1065 -15% | 1232 -2% | 2751 120% | 1253 ? 0% |
| 4K-64 Write (MB/s) | 1473 | 1996 36% | 3859 162% | 1957 33% | 2719 85% | 3270 122% | 1473 ? 0% |
| Access Time Read * (ms) | 0.045 | 0.048 -7% | 0.072 -60% | 0.04 11% | 0.024 47% | 0.024 47% | 0.045 ? -0% |
| Access Time Write * (ms) | 0.083 | 0.107 -29% | 0.026 69% | 0.105 -27% | 0.059 29% | 0.021 75% | 0.083 ? -0% |
| Score Read (Points) | 1765 | 1211 -31% | 3164 79% | 1404 -20% | 1827 4% | 3287 86% | 1765 ? 0% |
| Score Write (Points) | 1722 | 2271 32% | 4414 156% | 2232 30% | 3133 82% | 3876 125% | 1722 ? 0% |
| Score Total (Points) | 4256 | 4046 -5% | 9134 115% | 4297 1% | 5753 35% | 8821 107% | 4256 ? 0% |
| Copy ISO MB/s (MB/s) | 2441 | 901 -63% | 3424 40% | 2474 1% | 3201 31% | 2441 ? 0% | |
| Copy Program MB/s (MB/s) | 395.7 | 118.7 -70% | 1091 176% | 1074 171% | 415.8 5% | 396 ? 0% | |
| Copy Game MB/s (MB/s) | 1115 | 372 -67% | 2365 112% | 1929 73% | 1212 9% | 1115 ? 0% | |
| Toplam Ortalama (Program / Ayarlar) | 9% /
0% | 127% /
114% | 29% /
25% | 73% /
62% | 85% /
85% | 0% /
0% |
* ... daha küçük daha iyidir

Constant Performance Reading: DiskSpd Read Loop, Queue Depth 8
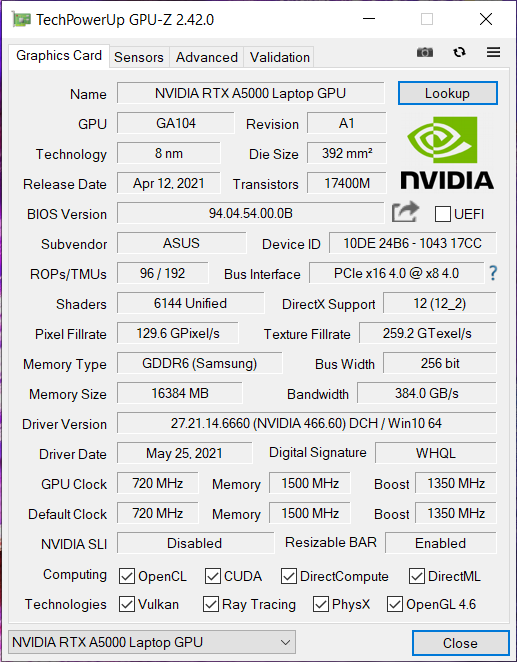
Ekran kartı
Kurulu soğutma sistemi ve 110 watt'a kadar TDP sayesinde , 16 GB VRAM'li RTX A5000 saf grafik performansı açısından ikna edicidir ve bu nedenle sentetik karşılaştırmalarda HP ZBook Fury'nin yüzde 15 ila 20 önünde yer alır.
| 3DMark Fire Strike Score | 22819 puan | |
| 3DMark Fire Strike Extreme Score | 12825 puan | |
| 3DMark Time Spy Score | 10157 puan | |
Yardım | ||
Oyun performansı
Ön üretim cihazımız oyun oynamak için optimize edilmemiş olsa da, çoğu oyunu QHD olarak işlemeye devam ediyor. Ancak, ekran 60 Hz ile sınırlıdır. Rakipler arasında sadece gerçek oyun santralleri - Schenker XMG Ultra gibi - inceleme örneğimizden açıkça daha iyi performans gösterebilir. Genel olarak, Asus ProArt Studiobook Pro 16'nın oyun performansı, bir RTX 3080'in daha düşük seviyesinde.
Beklendiği gibi, oyun performansı pil gücüyle çok sınırlıdır.
| The Witcher 3 | |
| 1920x1080 High Graphics & Postprocessing (Nvidia HairWorks Off) | |
| Schenker XMG Ultra 17 Rocket Lake | |
| MSI GS76 Stealth 11UH | |
| HP ZBook Studio 15 G8 | |
| Ortalama NVIDIA RTX A5000 Laptop GPU (124 - 179, n=3) | |
| HP ZBook Fury 15 G8 | |
| Asus ProArt StudioBook 16 W7600H5A-2BL2 | |
| Sınıf ortalaması Workstation (91 - 156.4, n=2, son 2 yıl) | |
| Dell Precision 5000 5560 | |
| 1920x1080 Ultra Graphics & Postprocessing (HBAO+) | |
| Schenker XMG Ultra 17 Rocket Lake | |
| MSI GS76 Stealth 11UH | |
| Ortalama NVIDIA RTX A5000 Laptop GPU (81.7 - 98.3, n=3) | |
| Asus ProArt StudioBook 16 W7600H5A-2BL2 | |
| HP ZBook Fury 15 G8 | |
| HP ZBook Studio 15 G8 | |
| Sınıf ortalaması Workstation (51 - 91.7, n=2, son 2 yıl) | |
| Dell Precision 5000 5560 | |
| Dota 2 Reborn | |
| 3840x2160 ultra (3/3) best looking | |
| Sınıf ortalaması Workstation (103.5 - 170.9, n=9, son 2 yıl) | |
| Asus ProArt StudioBook 16 W7600H5A-2BL2 | |
| MSI GS76 Stealth 11UH | |
| Ortalama NVIDIA RTX A5000 Laptop GPU (95 - 118, n=2) | |
| HP ZBook Fury 15 G8 | |
| HP ZBook Studio 15 G8 | |
| Dell Precision 5000 5560 | |
| 1920x1080 ultra (3/3) best looking | |
| Schenker XMG Ultra 17 Rocket Lake | |
| Sınıf ortalaması Workstation (50.7 - 178.4, n=24, son 2 yıl) | |
| MSI GS76 Stealth 11UH | |
| HP ZBook Fury 15 G8 | |
| Ortalama NVIDIA RTX A5000 Laptop GPU (117 - 131, n=2) | |
| Dell Precision 5000 5560 | |
| Asus ProArt StudioBook 16 W7600H5A-2BL2 | |
| HP ZBook Studio 15 G8 | |
| 1920x1080 high (2/3) | |
| Schenker XMG Ultra 17 Rocket Lake | |
| MSI GS76 Stealth 11UH | |
| Sınıf ortalaması Workstation (52.1 - 199.8, n=24, son 2 yıl) | |
| HP ZBook Fury 15 G8 | |
| HP ZBook Studio 15 G8 | |
| Ortalama NVIDIA RTX A5000 Laptop GPU (124 - 140, n=2) | |
| Dell Precision 5000 5560 | |
| Asus ProArt StudioBook 16 W7600H5A-2BL2 | |
| Metro Exodus | |
| 3840x2160 Ultra Quality AF:16x | |
| HP ZBook Fury 15 G8 | |
| Ortalama NVIDIA RTX A5000 Laptop GPU (24 - 28.5, n=2) | |
| Asus ProArt StudioBook 16 W7600H5A-2BL2 | |
| 2560x1440 Ultra Quality AF:16x | |
| HP ZBook Fury 15 G8 | |
| Ortalama NVIDIA RTX A5000 Laptop GPU (41 - 46.3, n=2) | |
| Asus ProArt StudioBook 16 W7600H5A-2BL2 | |
| Dell Precision 5000 5560 | |
| 1920x1080 Ultra Quality AF:16x | |
| HP ZBook Fury 15 G8 | |
| Ortalama NVIDIA RTX A5000 Laptop GPU (55 - 59.8, n=2) | |
| Asus ProArt StudioBook 16 W7600H5A-2BL2 | |
| Dell Precision 5000 5560 | |
| 1920x1080 High Quality AF:16x | |
| HP ZBook Fury 15 G8 | |
| Ortalama NVIDIA RTX A5000 Laptop GPU (69 - 74.5, n=2) | |
| Asus ProArt StudioBook 16 W7600H5A-2BL2 | |
| Dell Precision 5000 5560 | |
| F1 2020 | |
| 3840x2160 Ultra High Preset AA:T AF:16x | |
| Asus ProArt StudioBook 16 W7600H5A-2BL2 | |
| Ortalama NVIDIA RTX A5000 Laptop GPU (n=1) | |
| 1920x1080 Ultra High Preset AA:T AF:16x | |
| Asus ProArt StudioBook 16 W7600H5A-2BL2 | |
| Ortalama NVIDIA RTX A5000 Laptop GPU (n=1) | |
| 1920x1080 High Preset AA:T AF:16x | |
| Asus ProArt StudioBook 16 W7600H5A-2BL2 | |
| Ortalama NVIDIA RTX A5000 Laptop GPU (n=1) | |
| F1 2021 | |
| 3840x2160 Ultra High Preset + Raytracing AA:T AF:16x | |
| Asus ProArt StudioBook 16 W7600H5A-2BL2 | |
| MSI GS76 Stealth 11UH | |
| Ortalama NVIDIA RTX A5000 Laptop GPU (38 - 53.6, n=3) | |
| HP ZBook Fury 15 G8 | |
| 2560x1440 Ultra High Preset + Raytracing AA:T AF:16x | |
| MSI GS76 Stealth 11UH | |
| Asus ProArt StudioBook 16 W7600H5A-2BL2 | |
| Ortalama NVIDIA RTX A5000 Laptop GPU (59 - 88.2, n=3) | |
| HP ZBook Fury 15 G8 | |
| Dell Precision 5000 5560 | |
| 1920x1080 Ultra High Preset + Raytracing AA:T AF:16x | |
| MSI GS76 Stealth 11UH | |
| Asus ProArt StudioBook 16 W7600H5A-2BL2 | |
| Ortalama NVIDIA RTX A5000 Laptop GPU (85 - 109, n=3) | |
| HP ZBook Fury 15 G8 | |
| Dell Precision 5000 5560 | |
| 1920x1080 High Preset AA:T AF:16x | |
| MSI GS76 Stealth 11UH | |
| Asus ProArt StudioBook 16 W7600H5A-2BL2 | |
| Ortalama NVIDIA RTX A5000 Laptop GPU (122 - 161, n=3) | |
| HP ZBook Fury 15 G8 | |
| Dell Precision 5000 5560 | |
| Cyberpunk 2077 1.0 | |
| 3840x2160 Ultra Preset | |
| Ortalama NVIDIA RTX A5000 Laptop GPU (16.7 - 25, n=2) | |
| Asus ProArt StudioBook 16 W7600H5A-2BL2 | |
| 2560x1440 Ultra Preset | |
| Ortalama NVIDIA RTX A5000 Laptop GPU (37.1 - 51, n=2) | |
| Asus ProArt StudioBook 16 W7600H5A-2BL2 | |
| 1920x1080 Ultra Preset | |
| Schenker XMG Ultra 17 Rocket Lake | |
| Ortalama NVIDIA RTX A5000 Laptop GPU (58.6 - 78, n=2) | |
| Asus ProArt StudioBook 16 W7600H5A-2BL2 | |
| 1920x1080 High Preset | |
| Schenker XMG Ultra 17 Rocket Lake | |
| Ortalama NVIDIA RTX A5000 Laptop GPU (68.1 - 90, n=2) | |
| Asus ProArt StudioBook 16 W7600H5A-2BL2 | |
60 Dakikalık Witcher 3 (FHD/Ultra) testimizde, performans test boyunca sürekliliğini koruyor.
Witcher 3 FPS Diagramm
| düşük | orta | yüksek | ultra | QHD | 4K | |
|---|---|---|---|---|---|---|
| GTA V (2015) | 180 | 175 | 158 | 85.8 | 82.2 | 76.3 |
| The Witcher 3 (2015) | 321 | 217.9 | 124 | 89.9 | 54.8 | |
| Dota 2 Reborn (2015) | 144 | 136 | 124 | 117 | 118 | |
| Final Fantasy XV Benchmark (2018) | 184 | 123 | 91.8 | 70.6 | 41 | |
| X-Plane 11.11 (2018) | 117 | 102 | 81.6 | 52 | ||
| Far Cry 5 (2018) | 76 | 69 | 62 | 60 | 58 | 36 |
| Strange Brigade (2018) | 419 | 231 | 192 | 160 | 129 | |
| Metro Exodus (2019) | 148 | 126 | 69 | 55 | 41 | 24 |
| F1 2020 (2020) | 253 | 181 | 164 | 133 | 63.1 | |
| Cyberpunk 2077 1.0 (2020) | 114.6 | 83.1 | 68.1 | 58.6 | 37.1 | 16.7 |
| F1 2021 (2021) | 269 | 171 | 159 | 104 | 82.8 | 48.7 |
Emisyonlar: Yüksek performans olumsuz etkiliyor
Gürültü yayılımı
Boştayken bile, fanlar söz sahibidir ve neredeyse hiç hareketsiz kalmazlar. Yük altındayken fanlar net bir şekilde duyulur ve gerekli performansa uyum sağlar. ProArt Creator Hub'da fan hızı için çeşitli ayarlar yapılabilir. Kullanıcılar üç mod arasından seçim yapabilir: Standart mod, Performans modu ve Tam fan hızı. Testte, tam fan hızının avantajlarının çok marjinal olduğu ortaya çıktı.
Ses yüksekliği
| Boşta |
| 26 / 26 / 26.5 dB |
| Çalışırken |
| 42 / 43 dB |
 | ||
30 dB sessiz 40 dB(A) duyulabilirlik 50 dB(A) gürültülü |
||
min: | ||
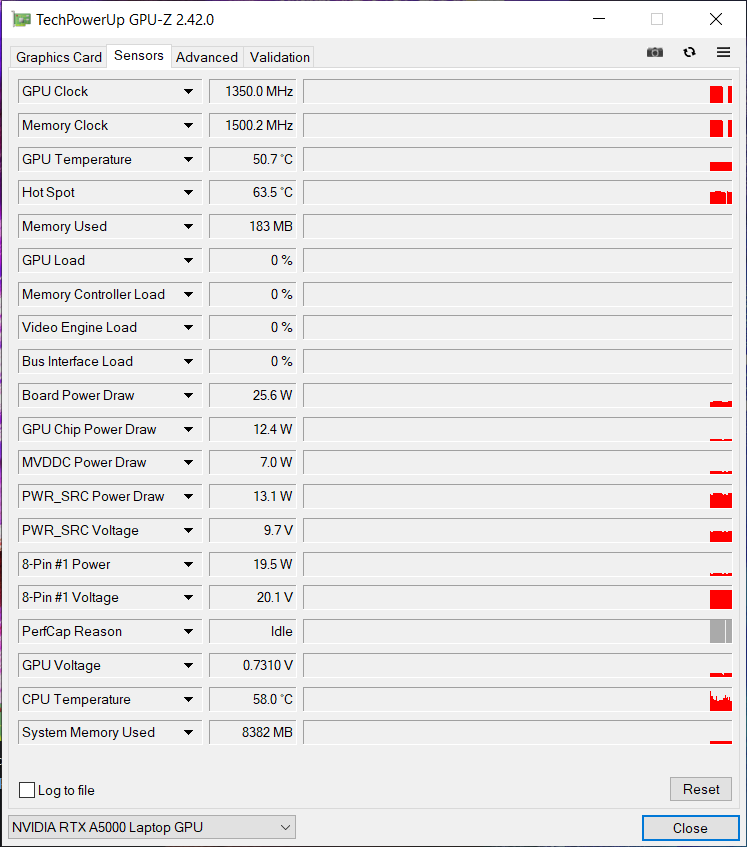
Sıcaklıklar
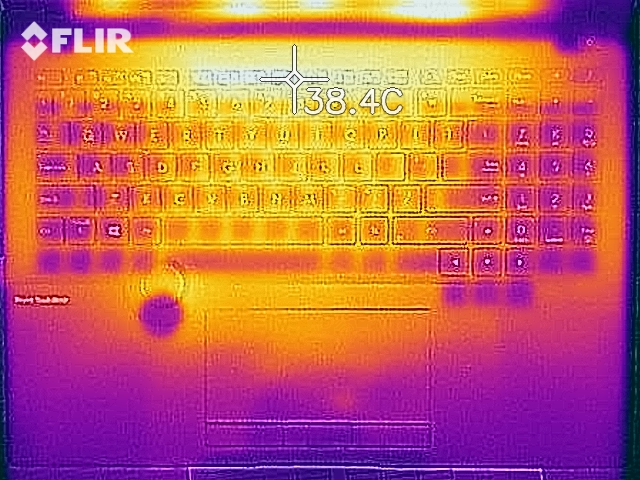
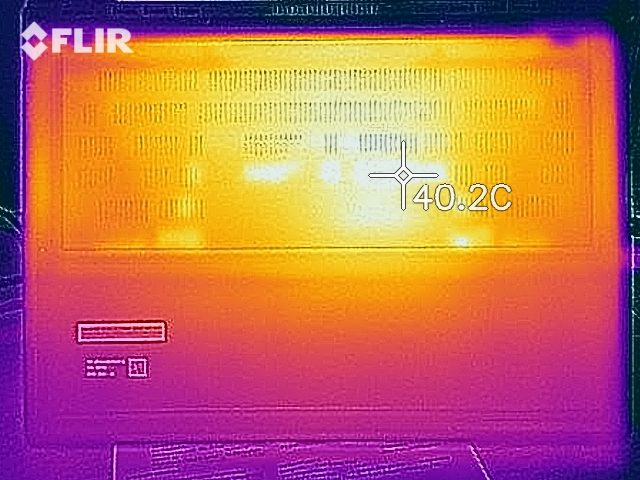
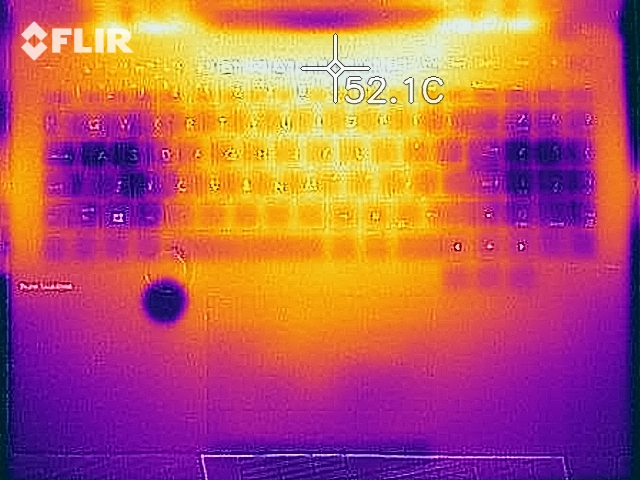
Çok fazla güç, çok fazla atık ısı üretir. Bu, üretim öncesi örneğimizde de geçerlidir, çünkü cihaz hiçbir zaman gerçekten serin kalmaz. CPU'ya çok fazla yük bindiğinde sıcaklığı hızla 100 °C'yi aşar. GPU ise biraz daha iyi performans gösteriyor ve sadece 80 °C'nin biraz üzerine çıkıyor. İçerideki yüksek sıcaklıklara rağmen yüzey sıcaklıkları oldukça ılımlı.
(-) Üst taraftaki maksimum sıcaklık, 38.2 °C / 101 F ortalamasına kıyasla 45.7 °C / 114 F'dir. , Workstation sınıfı için 22.2 ile 69.8 °C arasında değişir.
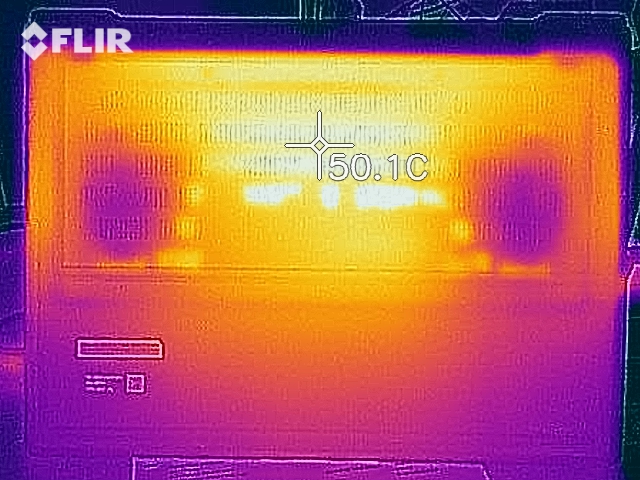
(-) Alt kısım, 41.1 °C / 106 F ortalamasına kıyasla maksimum 48.3 °C / 119 F'ye kadar ısınır
(+) Boşta kullanımda, üst tarafın ortalama sıcaklığı 31.6 °C / 89 F olup, cihazın 32 °C / 90 F.
(+) Avuç içi dayanakları ve dokunmatik yüzey maksimum (35.2 °C / 95.4 F) cilt sıcaklığına ulaşıyor ve bu nedenle sıcak değil.
(-) Benzer cihazların avuç içi dayanağı alanının ortalama sıcaklığı 27.8 °C / 82 F (-7.4 °C / -13.4 F) idi.
Hoparlörler
ProArt Studiobook Pro 16'nın ses kalitesi çok iyi ve çok dengeli. Düşük ve yüksek ses seviyelerindeki iyi, temiz ve tam ses ile zengin bas özellikle etkileyicidir.
Asus ProArt StudioBook 16 W7600H5A-2BL2 ses analizi
(±) | hoparlör ses yüksekliği ortalama ama iyi (76 dB)
Bas 100 - 315Hz
(-) | neredeyse hiç bas yok - ortalama olarak medyandan 17% daha düşük
(±) | Bas doğrusallığı ortalamadır (10.4% delta - önceki frekans)
Ortalar 400 - 2000 Hz
(+) | dengeli ortalar - medyandan yalnızca 1.2% uzakta
(+) | orta frekanslar doğrusaldır (5.1% deltadan önceki frekansa)
Yüksekler 2 - 16 kHz
(±) | daha yüksek en yüksekler - ortalama olarak medyandan 5.1% daha yüksek
(+) | yüksekler doğrusaldır (4.9% deltadan önceki frekansa)
Toplam 100 - 16.000 Hz
(±) | Genel sesin doğrusallığı ortalamadır (16.5% ortancaya göre fark)
Aynı sınıfla karşılaştırıldığında
» Bu sınıftaki tüm test edilen cihazların %46%'si daha iyi, 7% benzer, 47% daha kötüydü
» En iyisinin deltası 7% idi, ortalama 17% idi, en kötüsü 35% idi
Test edilen tüm cihazlarla karşılaştırıldığında
» Test edilen tüm cihazların %28'si daha iyi, 6 benzer, % 66 daha kötüydü
» En iyisinin deltası 4% idi, ortalama 23% idi, en kötüsü 134% idi
HP ZBook Fury 15 G8 ses analizi
(±) | hoparlör ses yüksekliği ortalama ama iyi (79.8 dB)
Bas 100 - 315Hz
(±) | azaltılmış bas - ortalama olarak medyandan 10.6% daha düşük
(±) | Bas doğrusallığı ortalamadır (8.8% delta - önceki frekans)
Ortalar 400 - 2000 Hz
(+) | dengeli ortalar - medyandan yalnızca 3.9% uzakta
(+) | orta frekanslar doğrusaldır (4.8% deltadan önceki frekansa)
Yüksekler 2 - 16 kHz
(+) | dengeli yüksekler - medyandan yalnızca 2.9% uzakta
(+) | yüksekler doğrusaldır (5.3% deltadan önceki frekansa)
Toplam 100 - 16.000 Hz
(+) | genel ses doğrusaldır (11.9% ortancaya göre fark)
Aynı sınıfla karşılaştırıldığında
» Bu sınıftaki tüm test edilen cihazların %17%'si daha iyi, 4% benzer, 79% daha kötüydü
» En iyisinin deltası 7% idi, ortalama 17% idi, en kötüsü 35% idi
Test edilen tüm cihazlarla karşılaştırıldığında
» Test edilen tüm cihazların %9'si daha iyi, 2 benzer, % 89 daha kötüydü
» En iyisinin deltası 4% idi, ortalama 23% idi, en kötüsü 134% idi
Güç yönetimi: Studiobook'un pilde zayıf çalışma süreleri
Enerji tüketimi
Minimum 12,4 ve maksimum 25 watt'lık boşta güç tüketimi, HP ZBook Fury'den biraz daha yüksektir.
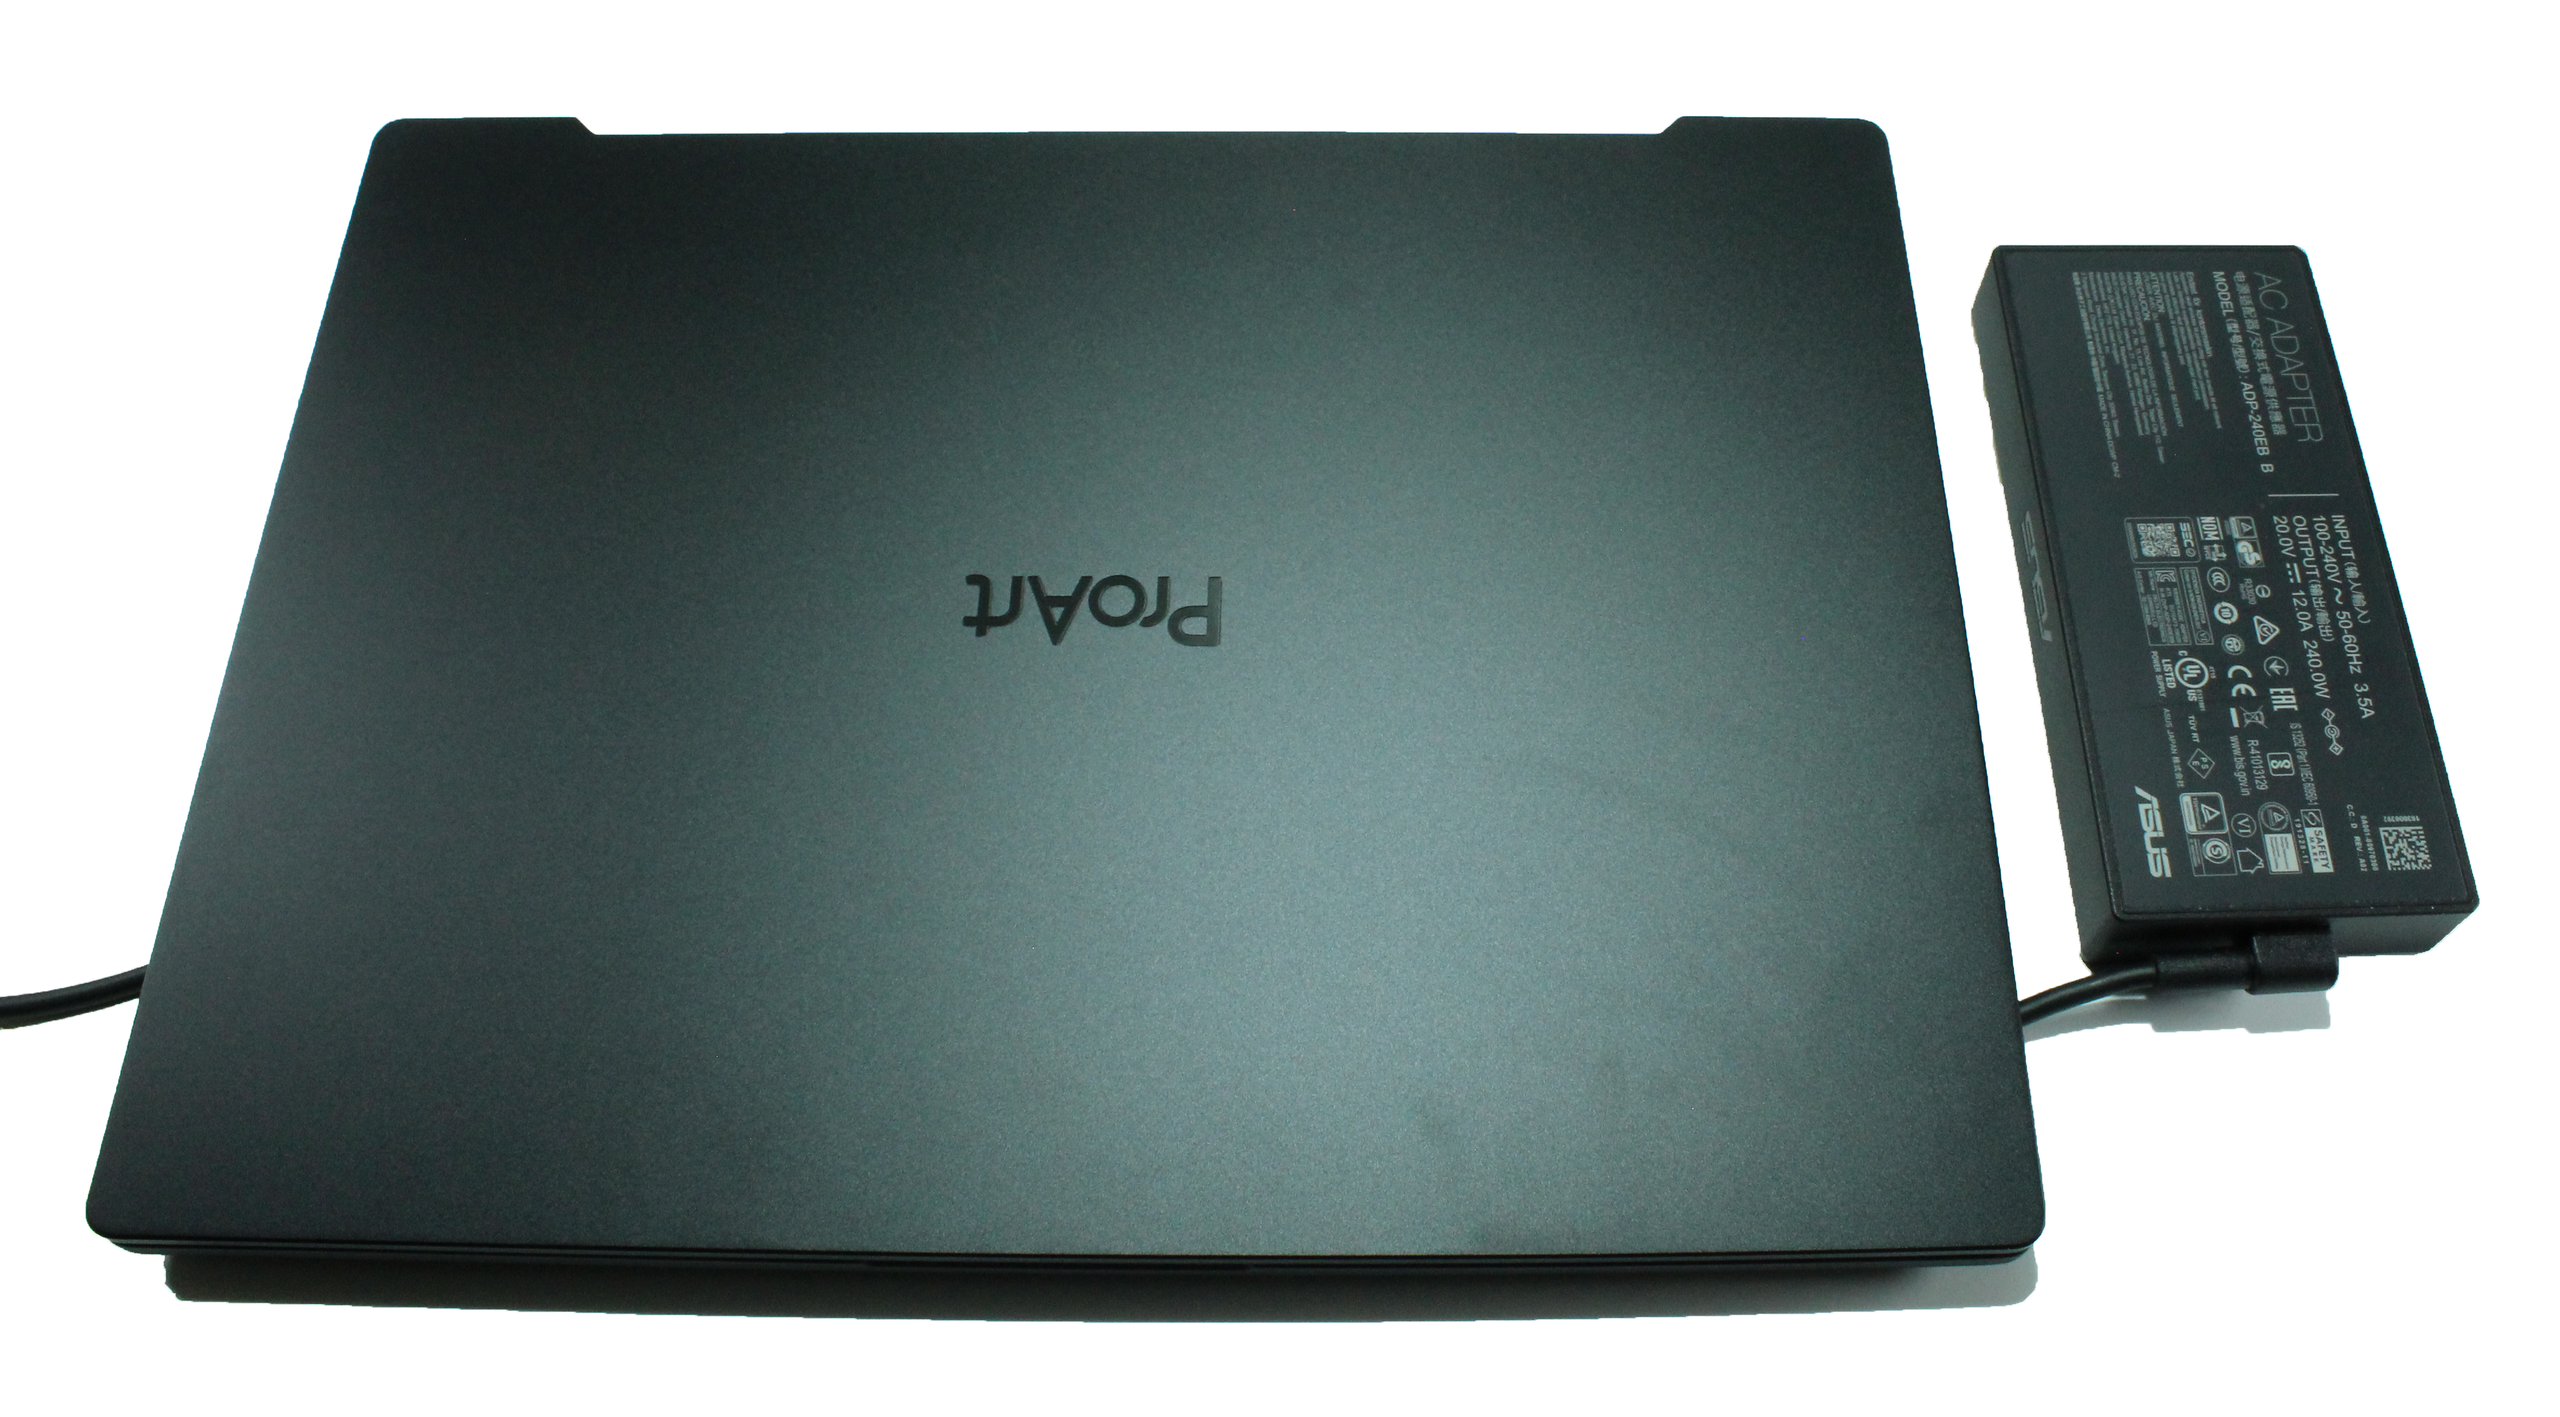
240 W güç kaynağı iş için fazlasıyla yeterli olsa da, dizüstü bilgisayarın maksimum enerji tüketimi yalnızca 134 watt'tır. Güç tüketiminin 132 watt olduğu The Witcher 3 ile bu tutarsızlık daha da belirginleşiyor. Bu bir üretim öncesi örnek olduğundan, maksimum güç tüketiminin yine de performans lehine ayarlanacağını varsayıyoruz.
| Kapalı / Bekleme modu | |
| Boşta | |
| Çalışırken |
|
Key:
min: | |
| Asus ProArt StudioBook 16 W7600H5A-2BL2 W-11955M, RTX A5000 Laptop GPU, 2x Micron 2300 2TB MTFDHBA2T0TDV (RAID 0), OLED, 3840x2400, 16" | HP ZBook Fury 15 G8 i9-11950H, RTX A5000 Laptop GPU, Samsung PM981a MZVLB1T0HBLR, IPS, 3840x2160, 15.6" | HP ZBook Studio 15 G8 i9-11950H, GeForce RTX 3070 Laptop GPU, Samsung PM981a MZVLB2T0HALB, OLED, 3840x2160, 15.6" | Dell Precision 5000 5560 i7-11850H, RTX A2000 Laptop GPU, Samsung PM9A1 MZVL22T0HBLB, IPS, 3840x2400, 15.6" | Lenovo ThinkPad P1 G4-20Y4S0KS00 i7-11850H, GeForce RTX 3070 Laptop GPU, Samsung PM9A1 MZVL21T0HCLR, IPS LED, 3840x2400, 16" | Schenker XMG Ultra 17 Rocket Lake i9-11900K, GeForce RTX 3080 Laptop GPU, Samsung SSD 980 Pro 2TB MZ-V8P2T0, IPS, 1920x1080, 17.3" | Ortalama NVIDIA RTX A5000 Laptop GPU | Sınıf ortalaması Workstation | |
|---|---|---|---|---|---|---|---|---|
| Power Consumption | -2% | -8% | 22% | 3% | -201% | -5% | 13% | |
| Idle Minimum * (Watt) | 12.4 | 8.3 33% | 11 11% | 6.2 50% | 8.1 35% | 62 -400% | 10.4 ? 16% | 9.04 ? 27% |
| Idle Average * (Watt) | 16.5 | 19.9 -21% | 18.8 -14% | 13.9 16% | 20.2 -22% | 64 -288% | 18.3 ? -11% | 13.8 ? 16% |
| Idle Maximum * (Watt) | 25 | 21.8 13% | 31.7 -27% | 23.8 5% | 21.9 12% | 69 -176% | 22.3 ? 11% | 17.7 ? 29% |
| Load Average * (Watt) | 132 | 110.9 16% | 105.2 20% | 95.7 27% | 88.2 33% | 183 -39% | 125.1 ? 5% | 96.2 ? 27% |
| Witcher 3 ultra * (Watt) | 132 | 165 -25% | 148 -12% | 87 34% | 149 -13% | 297 -125% | ||
| Load Maximum * (Watt) | 134 | 171.8 -28% | 171.8 -28% | 132.6 1% | 170.6 -27% | 368 -175% | 195.8 ? -46% | 178.5 ? -33% |
* ... daha küçük daha iyidir
Witcher 3 enerji tüketimi / Stress testi
Pil ömrü
Ön üretim cihazımızın pil çalışma süresi karışık bir izlenim bırakıyor ve tüm rekabetin gerisinde kalıyor. Standart WLAN testimizde test cihazı 300 dakika sonra nefessiz kalıyor.
| Asus ProArt StudioBook 16 W7600H5A-2BL2 W-11955M, RTX A5000 Laptop GPU, 90 Wh | HP ZBook Fury 15 G8 i9-11950H, RTX A5000 Laptop GPU, 94 Wh | HP ZBook Studio 15 G8 i9-11950H, GeForce RTX 3070 Laptop GPU, 83 Wh | Dell Precision 5000 5560 i7-11850H, RTX A2000 Laptop GPU, 86 Wh | Lenovo ThinkPad P1 G4-20Y4S0KS00 i7-11850H, GeForce RTX 3070 Laptop GPU, 90 Wh | Sınıf ortalaması Workstation | |
|---|---|---|---|---|---|---|
| Pil Çalışma Süresi | 24% | 24% | 26% | 170% | 249% | |
| H.264 (h) | 1.8 | 7.2 300% | 9.51 ? 428% | |||
| WiFi v1.3 (h) | 5 | 6.2 24% | 6.2 24% | 6.3 26% | 7 40% | 8.52 ? 70% |
| Witcher 3 ultra (h) | 1.6 | |||||
| Load (h) | 1.8 | 1.8 | 1.2 | 1.429 ? | ||
| Reader / Idle (h) | 12.9 | 12 | 26.1 ? |
Son Görüş
Asus ProArt Studiobook Pro 16'nın ilk izlenimi oldukça sağlam. Hafif ve zarif kasa, magnezyum alaşımıyla göz dolduruyor. Buradaki özel bir özellik, kullanıcının görüntü ve video düzenleme programlarındaki bazı belirli işlevleri çok hassas bir şekilde yürütmesini sağlayan yerleşik Asus Dial Controller'dır. Klavye sadece iyi bir baskı noktasıyla değil, aynı zamanda genel olarak rahat yazımla da kendini tutabilir. Dokunmatik yüzey iyi kayma özellikleri sunar ve çok büyük olmasa bile yeterli bir yüzeye sahiptir. Limanlar iyi yerleştirilmiş ve modern gereksinimleri karşılamaktadır.
Üretim öncesi numunenin ilk performans testleri bazı soruları yanıtsız bırakıyor, ancak bize beklenen performansın net bir resmini veriyorlar. Grafik performansı, düşük TDP'li bir RTX 3080 ile aynı seviyede. Sistem performansı sürekli olarak iyi ve günlük kullanımda bize herhangi bir eleştiri nedeni vermedi. Yine de Asus'un ürün piyasaya çıkana kadar optimize etmesi gereken bazı şeyler olduğunu düşünüyoruz. Yaklaşık 134 watt'lık maksimum güç tüketimi dikkat çekici ve bu da 240 watt'lık güç kaynağının hakkını vermiyor.
Asus ProArt Studiobook Pro 16, görüntü kalitesi ve renk alanı kapsamı açısından mobil iş istasyonları için yeni standartlar belirliyor. Yüksek kaliteli ve hafif kasa, 16:10 formatında 4K OLED HDR panel ve Asus Dial Controller gibi özellikler özellikle etkileyici.
Öte yandan OLED ekran birinci sınıftır ve çeşitli sertifikalara ve 16:10 formatına sahiptir. Çok iyi fabrika kalibrasyonu burada da olumlu bir şekilde öne çıkıyor ve bu paneli resim ve videoların profesyonel düzenlemesi için uygun hale getiriyor. Asus ProArt Studiobook Pro 16'nın ses kalitesi de şaşırtıcı: çok iyi ve temiz ses ve zengin bas ile öne çıkıyor. Üretim öncesi ünitemizde fan karakteristiği oldukça dürtüseldir: fanlar neredeyse hiç hareketsiz durmaz ve istenen performansa uyarlanabilir şekilde davranır. Bununla birlikte, net bir şekilde duyulabilir ve cihazın performansı ve boyutu için yüksek ancak kabul edilebilir bir arka plan gürültüsü üretirler.
Fiyat ve stok durumu
Ön seri bir cihaz olduğu için bu test için bir puan veremiyoruz. Serinin çıkışına kadar birçok özelliğin üretici tarafından ayarlanabileceğini belirtmek isteriz. Beklenen teslim tarihi ve fiyatı henüz bilinmiyor.
Price comparison
