Asus ROG Zephyrus G15 dizüstü bilgisayar incelemesi: Göz alıcı
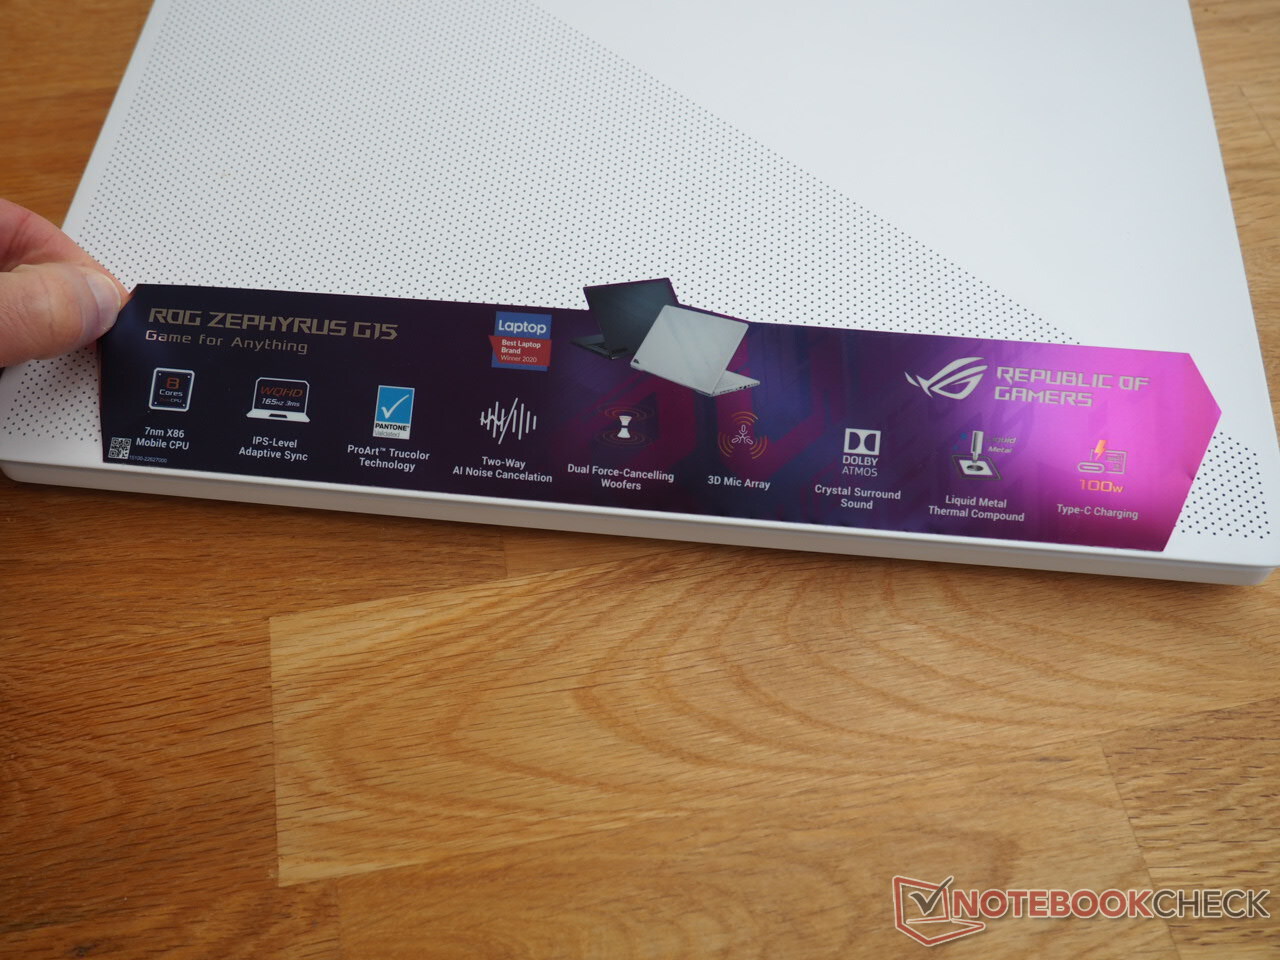
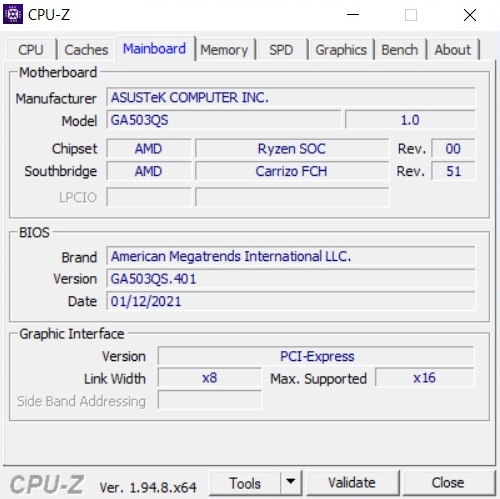
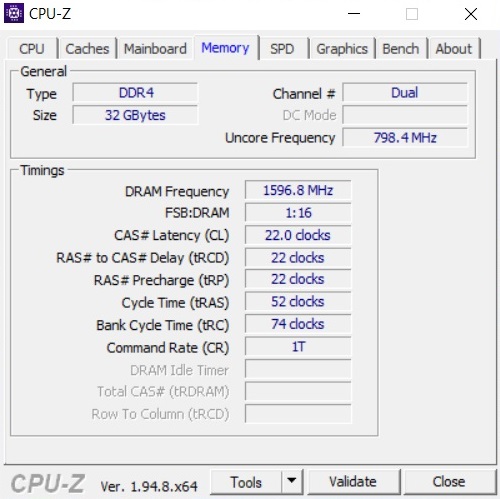
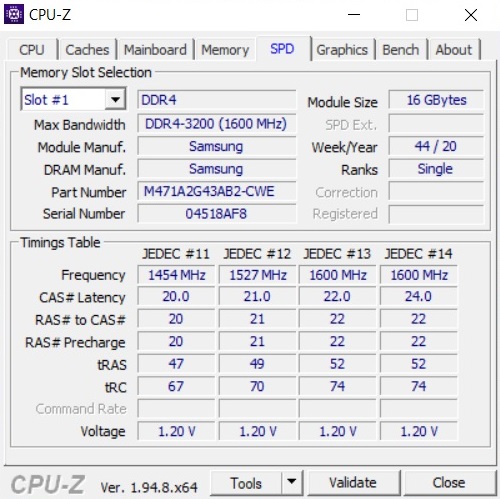
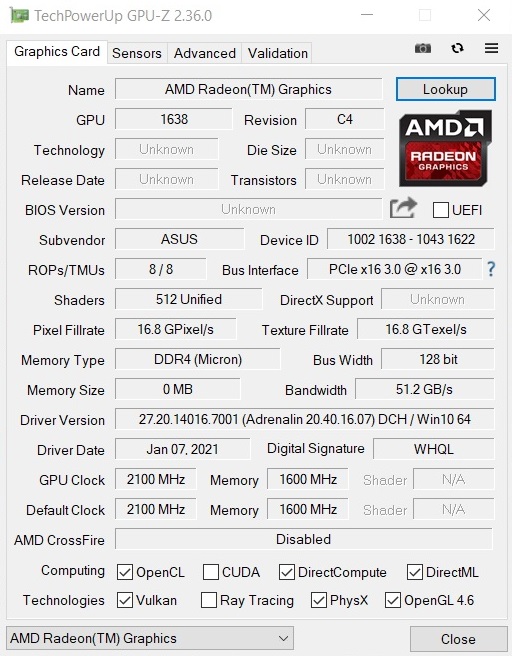
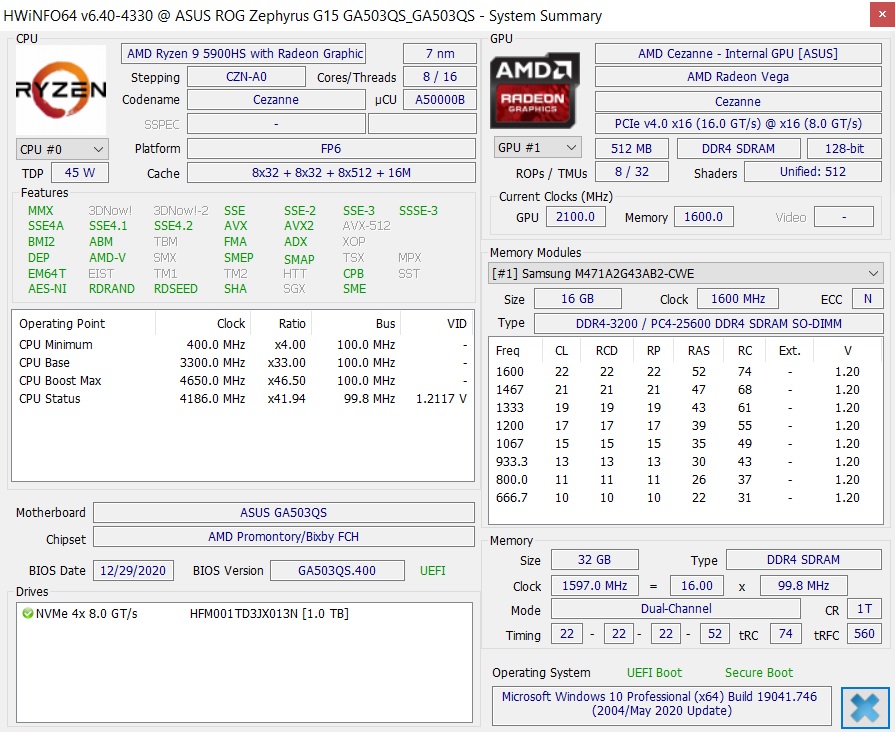
Yeni ROG Zephyrus G15'in en üst modelini almaya karar verirseniz, son derece güçlü bir genel pakete sahip olacaksınız. Bu şekilde, test ettiğimiz GA503Q modeli, çok güçlü bir Ryzen 9 5900HS CPU ve yalnızca 100 watt TDP (Dinamik Güçlendirme dahil) ile belirtilen GeForce RTX 3080 dizüstü bilgisayar GPU'suna sahip olabilir. Ayrıca, 16 GB'ı anakarta lehimlenen test modelimize 1 TB NVMe tabanlı SSD ve 32 GB DDR4 RAM (çift kanal) kuruldu. Bu arada, FreeSync ve 165 Hz özellikli mat bir WQHD ekran görüntü reprodüksiyonunu halleder. Not: Teknik özellikler belgemize göre, 144 Hz Full HD ekran ikincil panel seçeneği olarak mevcuttur, ancak düşük renk alanı kapsamı (% 45 NTSC) nedeniyle bunu önermiyoruz.
ROG Zephyrus G15'in rakipleri arasında MSI GS66 10SGS, Razer Blade 15 2020, Acer Predator Triton 500 PT515 ve Lenovo Legion 7 15IMH gibi diğer 15 inçlik ince oyun modelleri yer alıyor. Bu dizüstü bilgisayarlar tablolarda karşılaştırma cihazları olarak görünür.
Possible contenders in comparison
Derecelendirme | Tarih | Modeli | Ağırlık | Yükseklik | Boyut | Çözünürlük | Fiyat |
|---|---|---|---|---|---|---|---|
| 83.8 % v7 (old) | 02/2021 | Asus ROG Zephyrus G15 GA503Q R9 5900HS, GeForce RTX 3080 Laptop GPU | 2 kg | 20 mm | 15.60" | 2560x1440 | |
| 84 % v7 (old) | 06/2020 | MSI GS66 10SGS i7-10750H, GeForce RTX 2080 Super Max-Q | 2.2 kg | 20 mm | 15.60" | 1920x1080 | |
| 85.9 % v7 (old) | 08/2020 | Razer Blade 15 RTX 2080 Super Max-Q i7-10875H, GeForce RTX 2080 Super Max-Q | 2.2 kg | 17.8 mm | 15.60" | 1920x1080 | |
v (old) | 06/2020 | Acer Predator Triton 500 PT515-52-70N3 i7-10750H, GeForce RTX 2080 Super Max-Q | 2.1 kg | 18 mm | 15.60" | 1920x1080 | |
| 86.3 % v7 (old) | 01/2021 | Lenovo Legion 7 15IMH05-81YT001VGE i9-10980HK, GeForce RTX 2080 Super Max-Q | 2.4 kg | 19.9 mm | 15.60" | 1920x1080 |
Durum
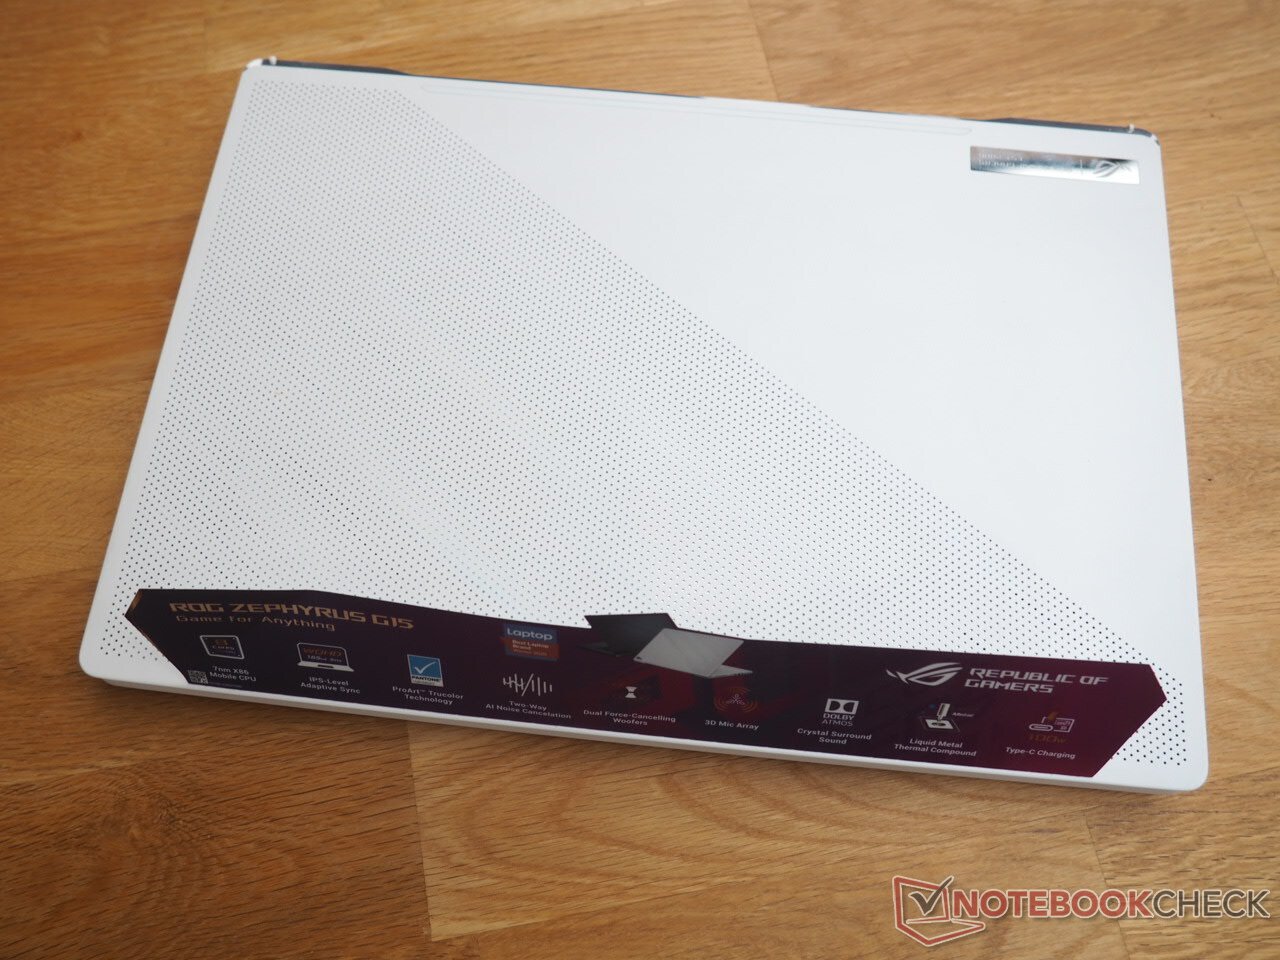
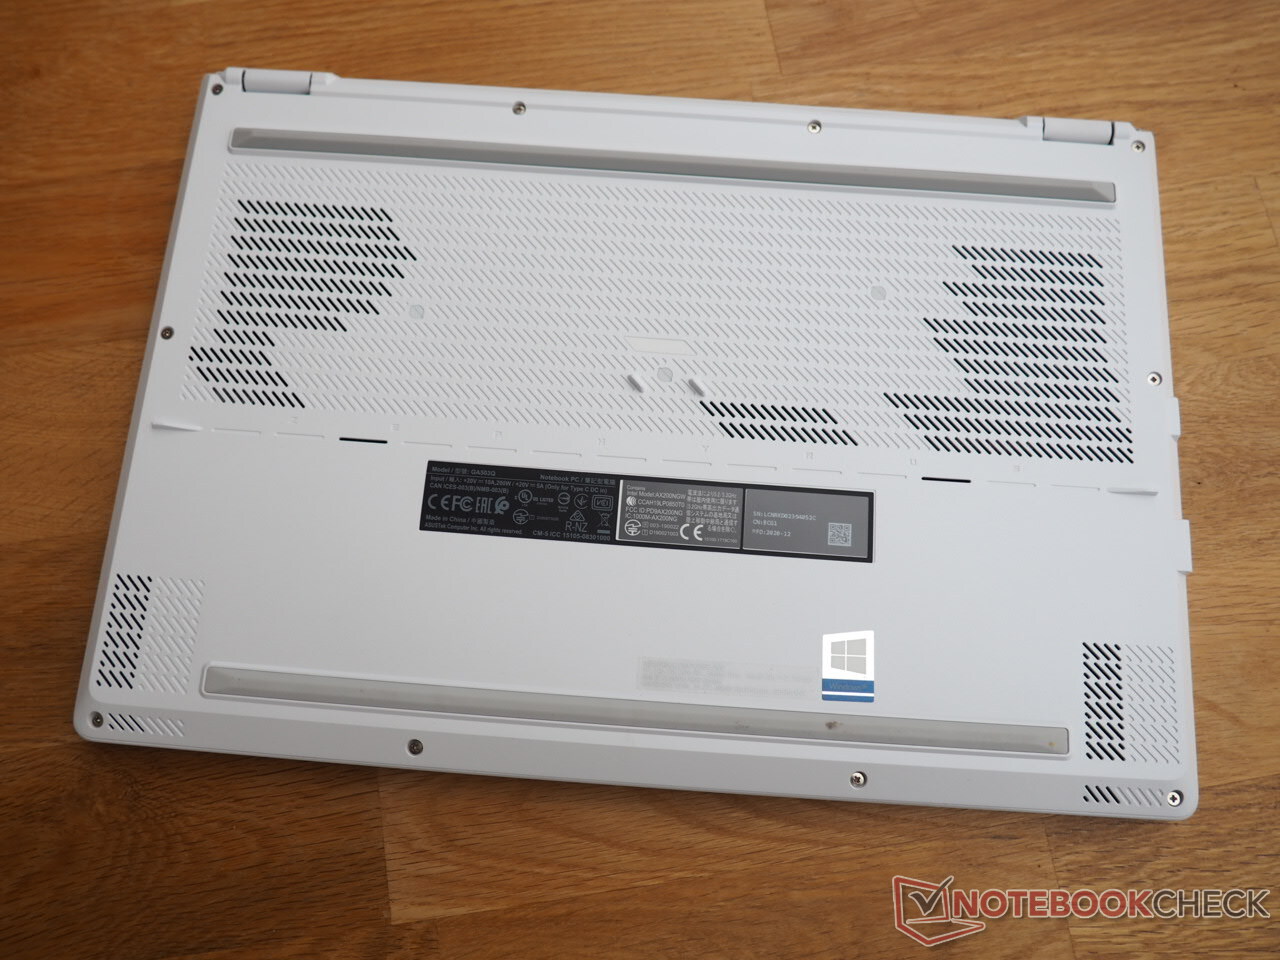
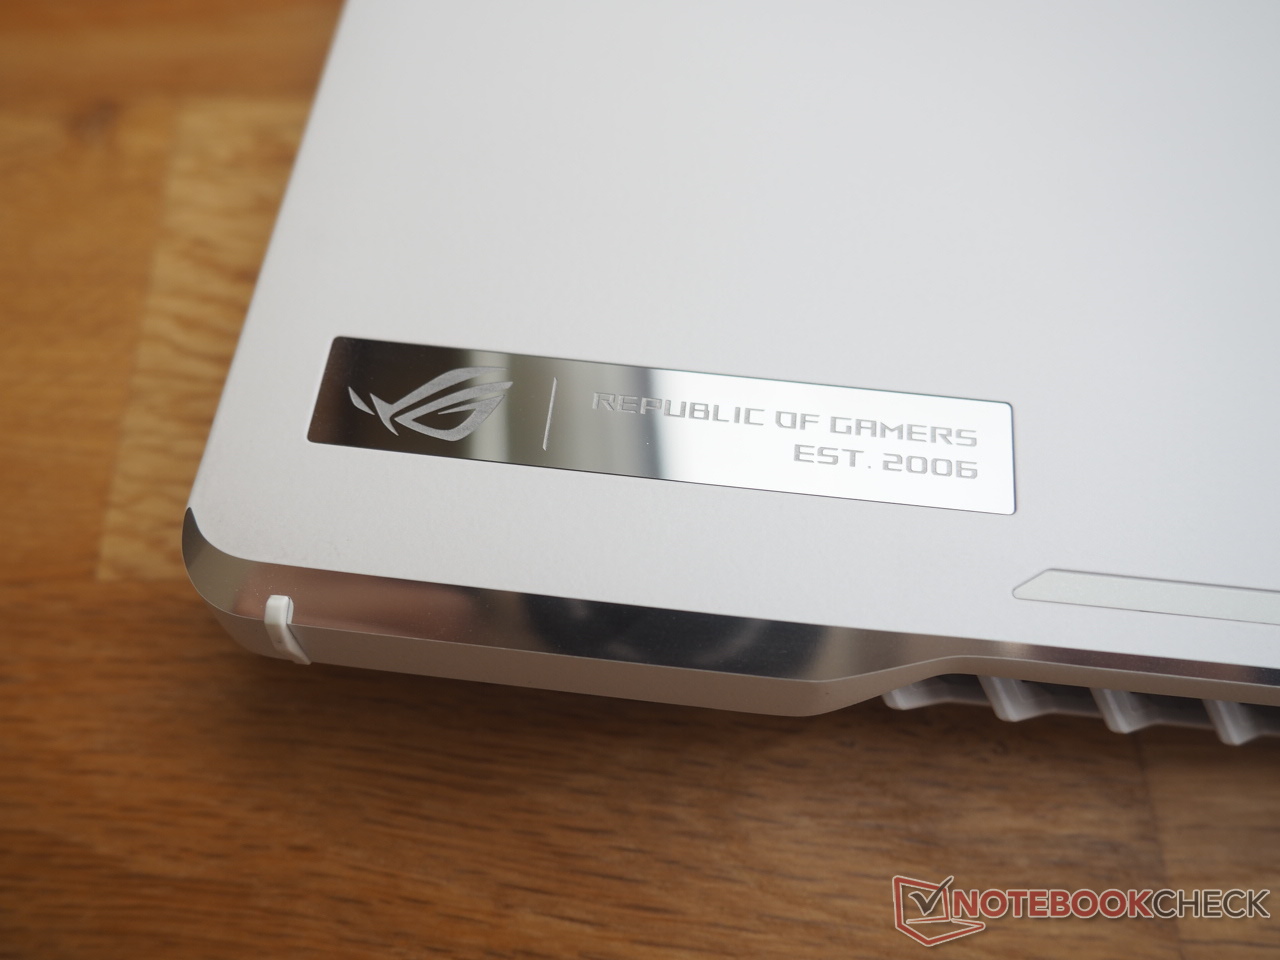
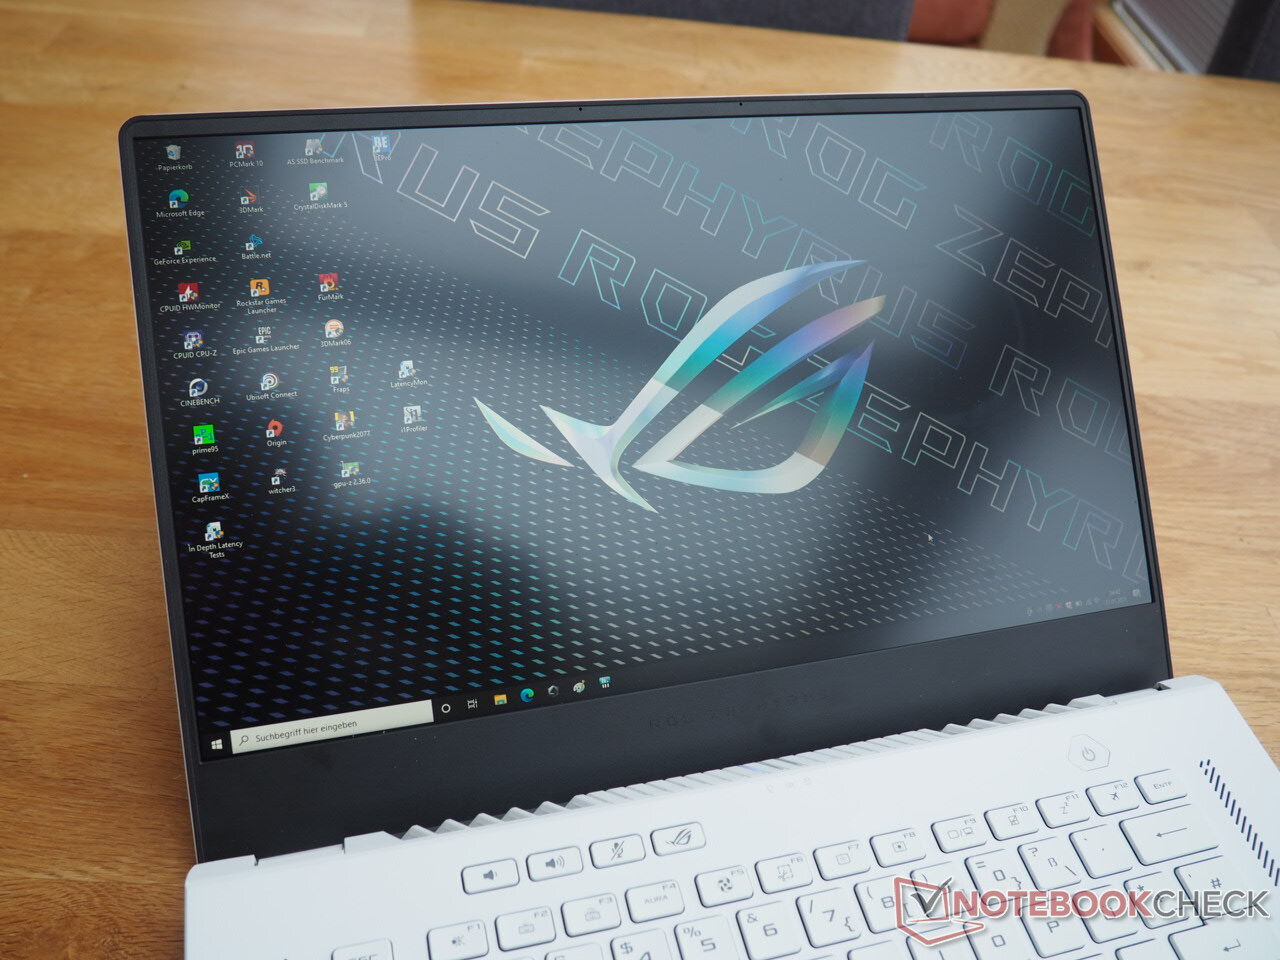
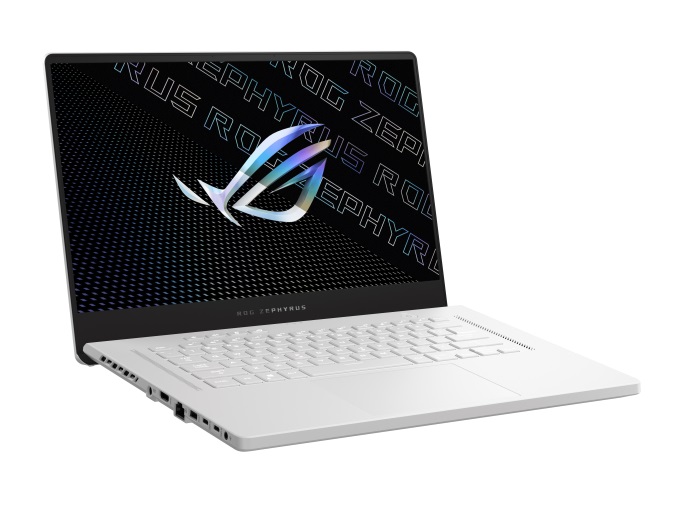
Zephyrus G15 gri veya beyaz renklerde mevcuttur. İkinci baskı kesinlikle dikkat çekicidir. Bir yandan dizüstü bilgisayar segmentinde beyaz neredeyse hiç kullanılmazken, diğer yandan kapaktaki küçük noktalar veya delikler gibi çeşitli detay vurguları farklı bir görünüm sağlıyor. Özellikle kapak ve klavye alanı magnezyum-alüminyum karışımından yapıldığı için cihaz görsel olarak çok üst düzey görünüyor (yine de yüzeyler büküldüğünde gıcırdama eğilimindedir). çok fazla talepte bulunmayın. Yapı kalitesi yüksek seviyededir. Test cihazının tüm unsurları birbiriyle sorunsuz bir şekilde birleşir. Menteşe yapısı, bir oyun dizüstü bilgisayarı için biraz sıra dışı. Menteşeler, kapak açıldığında taban ünitesinin arka alanı birkaç milimetre yükseltilecek şekilde tasarlanmıştır (maksimum 180 ° açı, tek elle açılma mümkündür), bu da aynı anda havalandırmayı kolaylaştırır (ancak, yüzey sallandığında ekran oldukça hızlı bir şekilde geriye doğru eğilir).
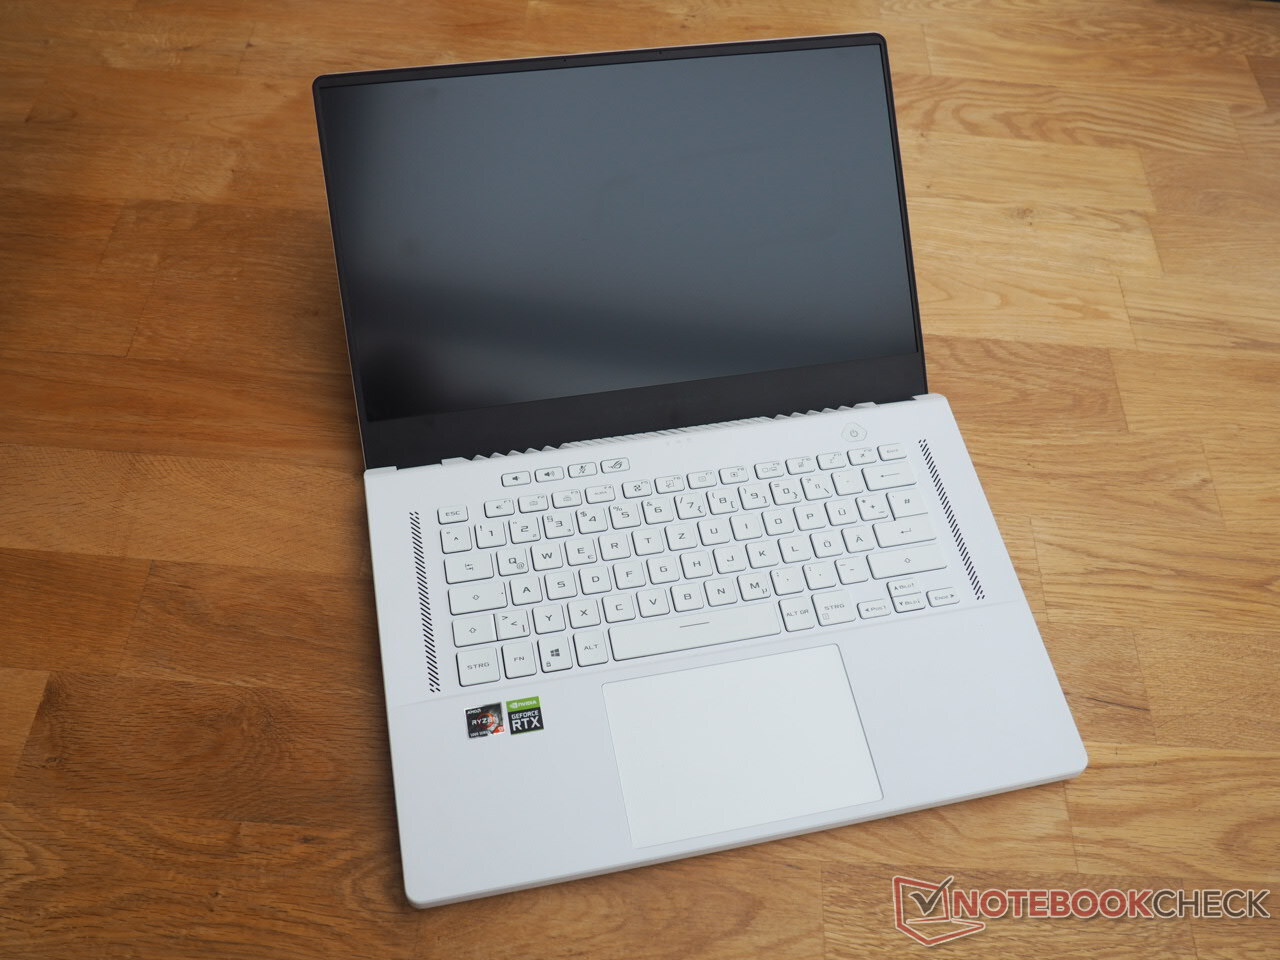
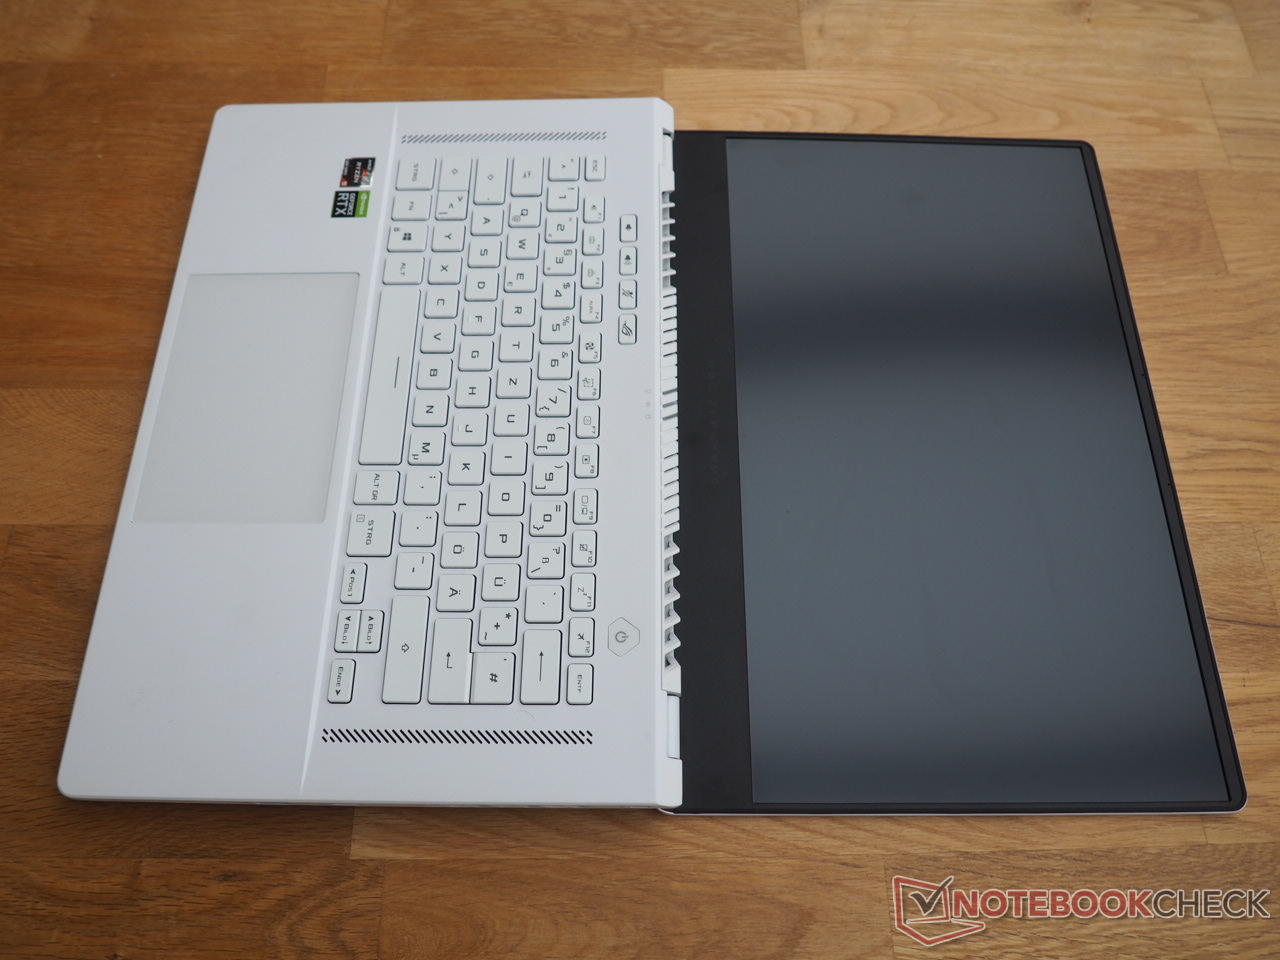
G15, düşük ağırlığı ile de etkileyicidir. 2 kg'ın biraz altında, test alanındaki en düşük değerdir ve oldukça rahat bir şekilde taşınabilir. Boyutlar açısından işler birbirine benzer. İnce çerçeve tasarımı ile 2,0 cm yüksekliğin kombinasyonu ince bir görünümü garanti eder.
Bağlantı
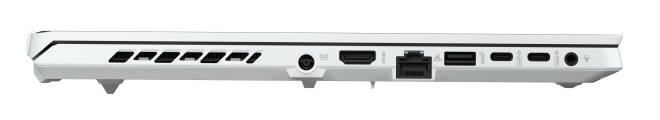
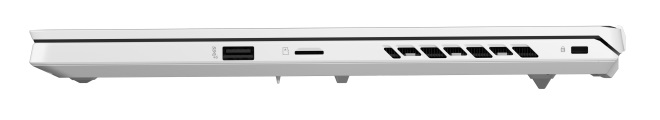
Bağlantı noktaları, bu kadar kompakt bir dizüstü oyun bilgisayarı için fena değil. Bu şekilde, 15 inçlik bir RJ45 bağlantı noktası, bir ses jakı, bir HDMI 2.0 çıkışı, bir Kensington kilit yuvası ve yalnızca microSD modellerini kabul edebilen bir kart okuyucusu barındırıyor, bu biraz üzücü. Yazık demişken: AMD kullanımı nedeniyle, G15 Thunderbolt olmadan yapmak zorunda. USB bağlantı noktalarına gelince, Asus 100 watt Güç Dağıtımı ve DisplayPort desteğine sahip iki A Tipi bağlantı noktası ve iki Tip-C bağlantı noktası (her biri 3.2 Gen 2) seçti.Sağ elini kullanan kullanıcılar, sol taraftaki bağlantı noktaları öne doğru çok fazla itildiği için, sol taraflar muhtemelen yerleşim planından şikayet edeceklerdir. Bağlı kablolar, harici bir farenin hareket aralığını önemli ölçüde kısıtlayabilir.
İletişim
Intel'in kablosuz modülü (Wi-Fi 6 AX200), WLAN 802.11a / b / g / n / ac / ax ve Bluetooth 5.1'i destekler. Testimizdeki hız (referans yönlendiriciye 1 metre mesafe, Netgear Nighthawk AX12) çok iyiydi.
Aksesuarlar
Asus, Zephyrus G15'e 0,5 kg'ın biraz altında ve 15 x 7 x 2,5 cm ölçülerinde 200 watt güç adaptörü sağlıyor.
Bakım
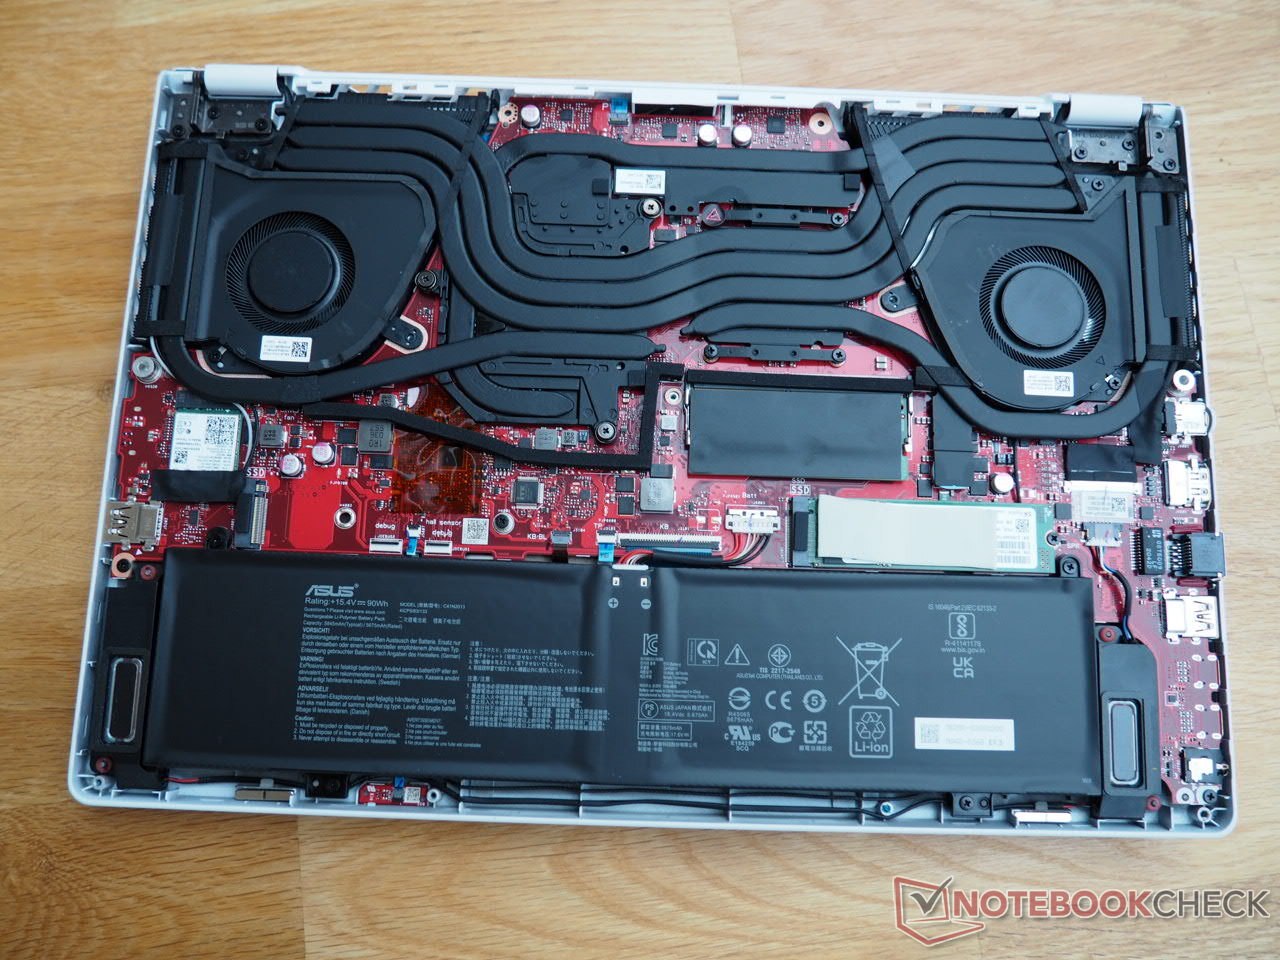
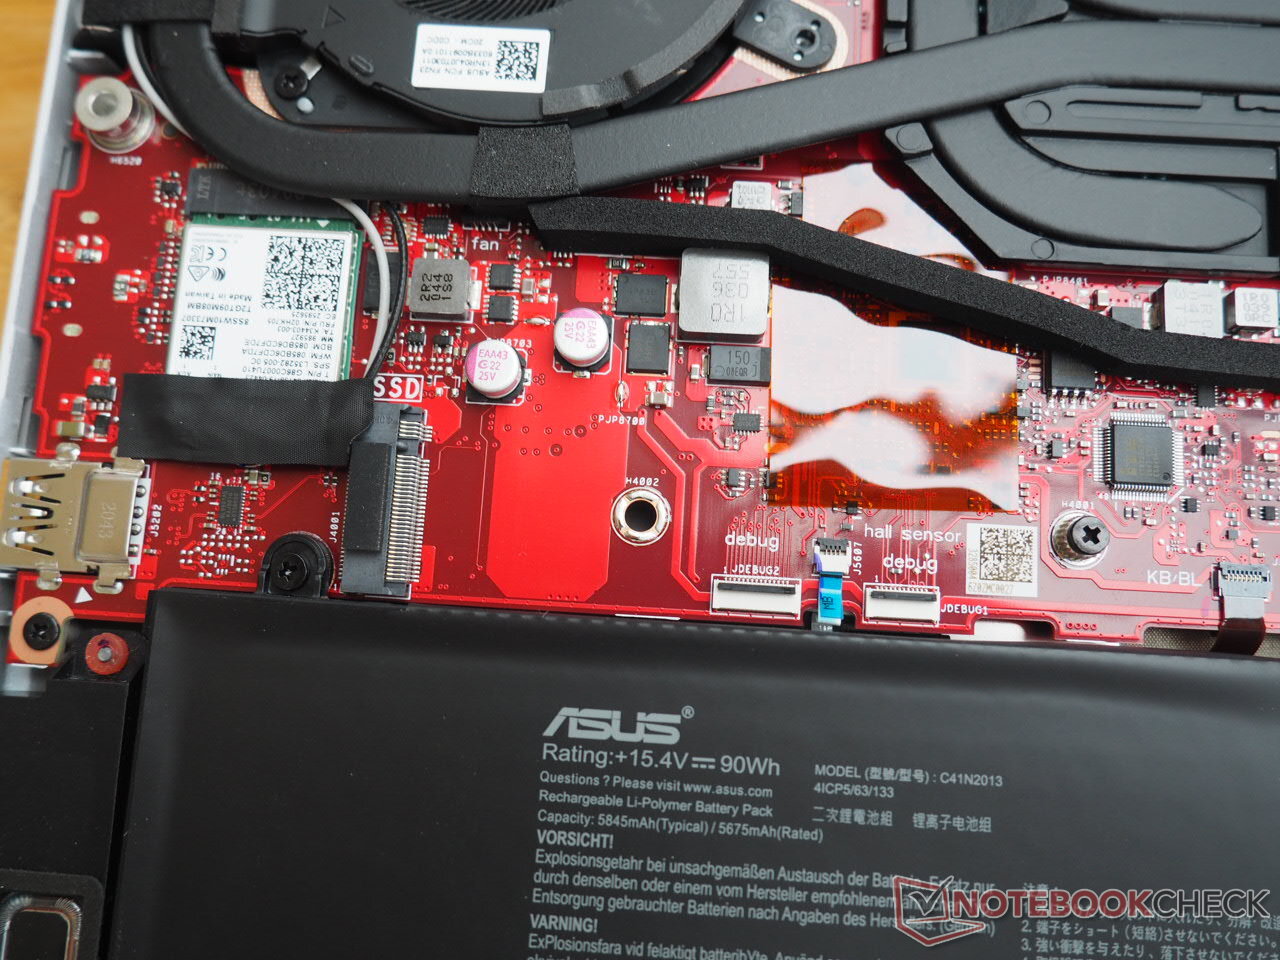
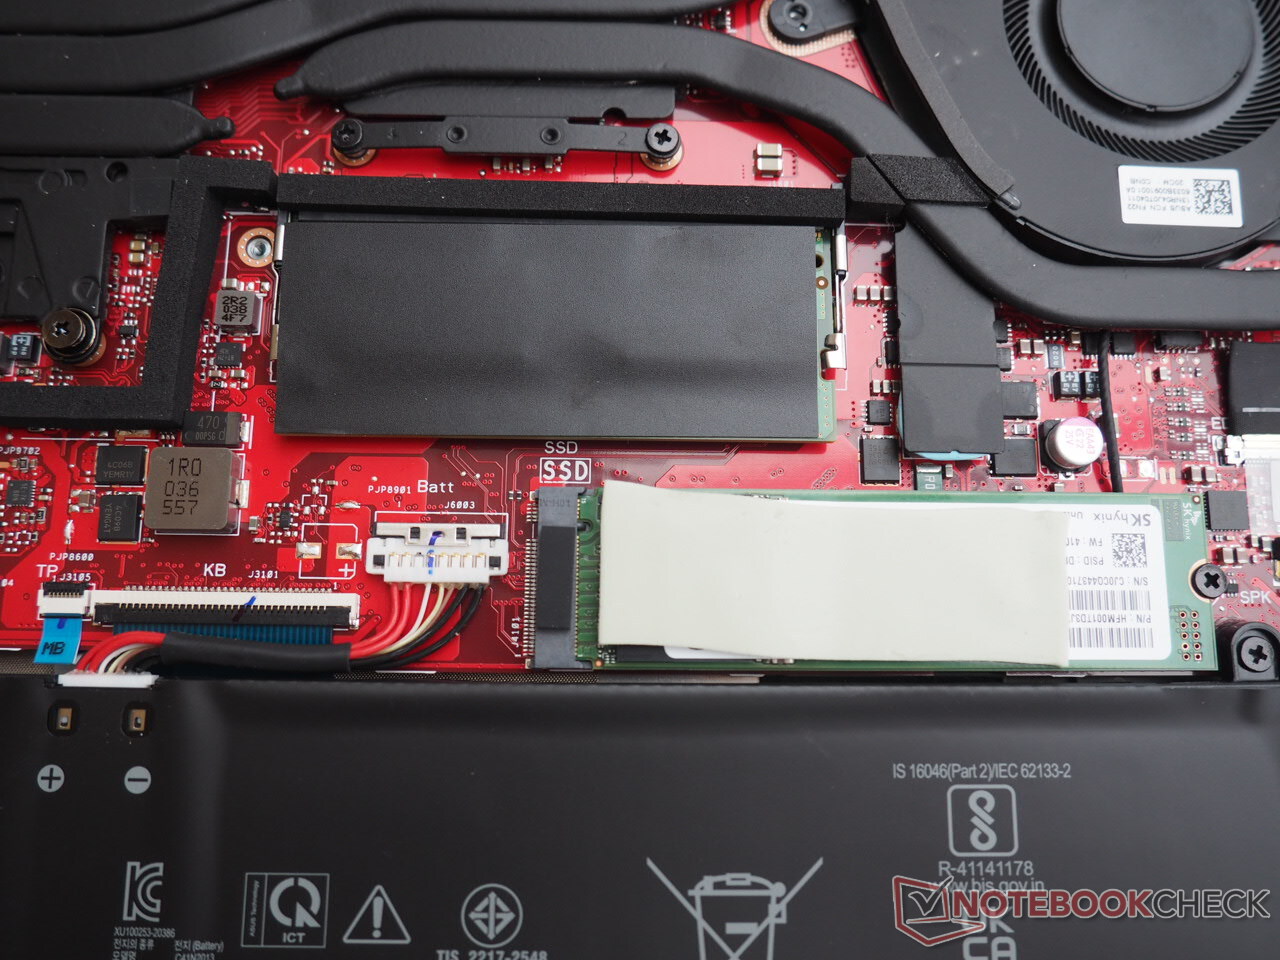
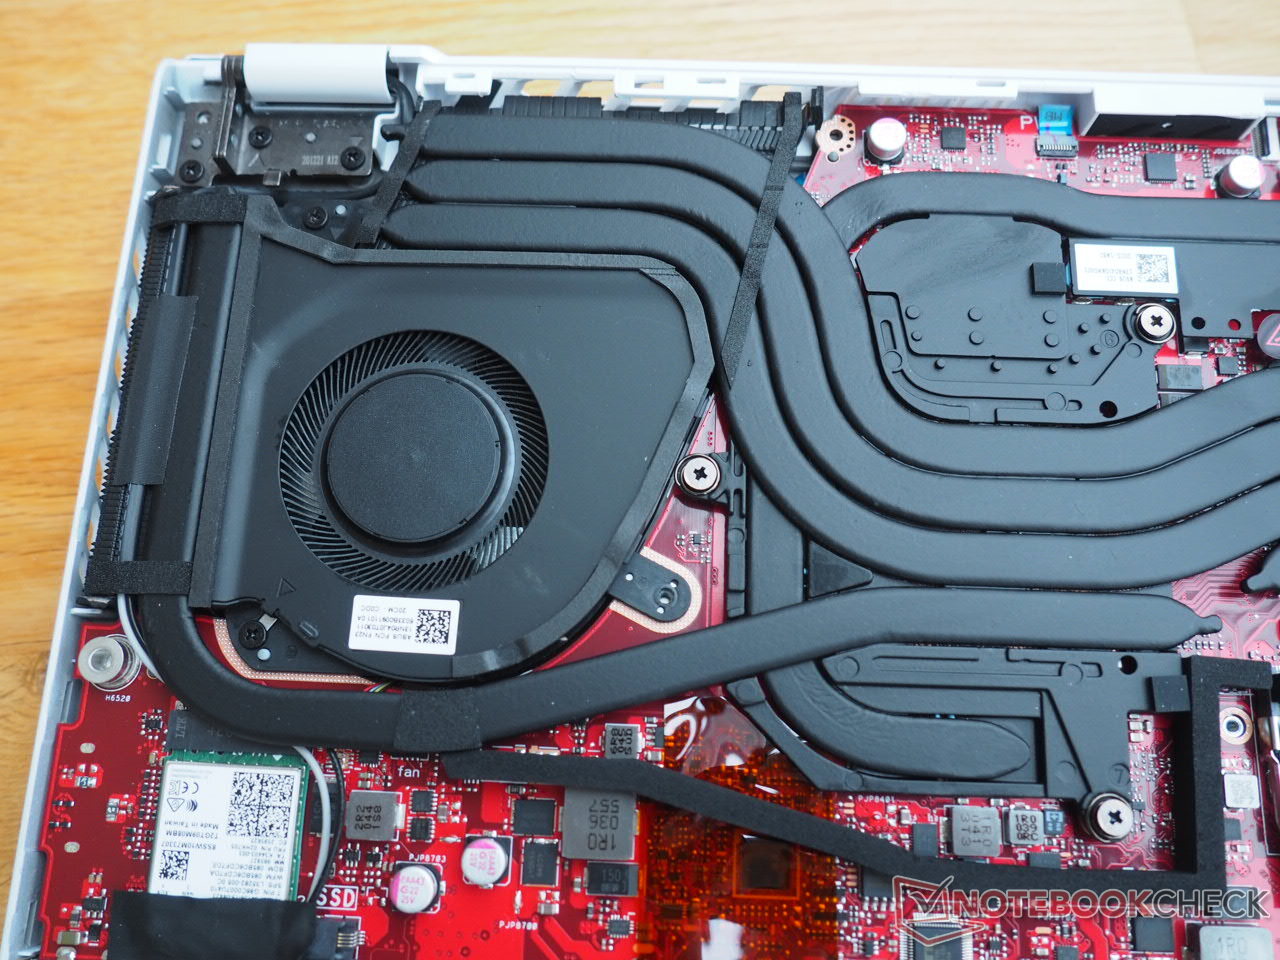
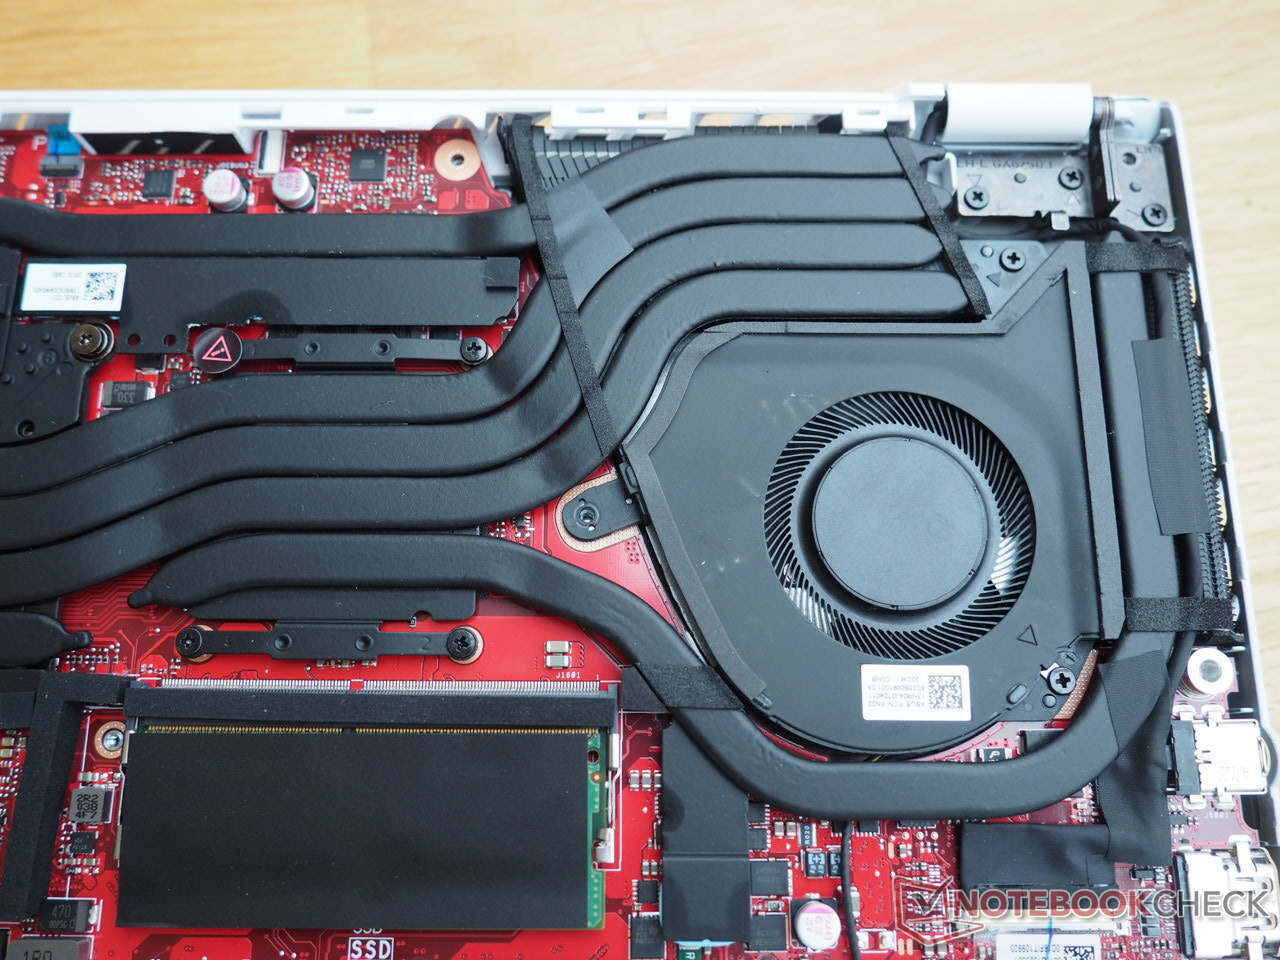
15 inçlik cihazda bir bakım kapağı bulunmadığından, bileşenlere ulaşmak için kasanın alt kısmının tamamı çıkarılmalıdır. Alt kapak 13 vidayla sabitlenmiştir (not: bunlardan üçü lastik contaların arkasında bulunur). Kasanın içinde sadece iki fan ve birkaç ısı borusundan (Sıvı Metal) oluşan soğutma sistemi değil, aynı zamanda bir SO-DIMM yuvası (dolu), iki M.2 yuvası (1x boş), pil, ve kablosuz modüle erişilebilir.
Garanti
Asus, cihaz için 24 ay garanti veriyor.
Giriş cihazları
Keyboard
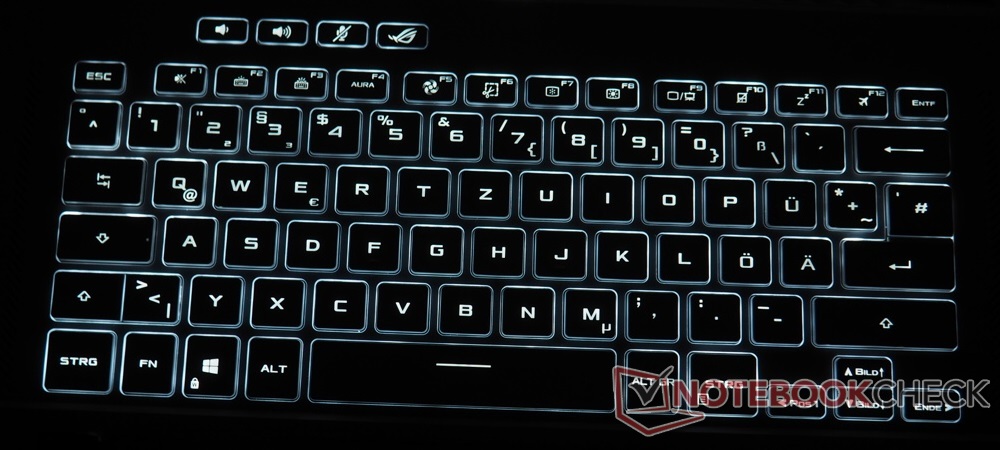
The keyboard left us with mixed feelings. Starting with the key size, which is only convincing when it comes to the main keys. The arrow keys and the F-row, on the other hand, are quite narrow. Not every user will like the layout, either. In this way, for example, the left Shift and <>| are stuck directly together. A single-line Enter is also unusual for a German model. However, the missing Insert and Print Screen keys bothered us the most in the test.
Asus should also work on the labeling. Depending on the ambient brightness, the keys can hardly be read when the backlight is activated. At least the backlight can be adjusted in several levels or turned off completely if desired. Moreover, we would describe the typing feel as quite modest. The keyboard neither reacts particularly crisp nor particularly mushy to input. Practical: Sound can be conveniently controlled using special keys.
Dokunmatik yüzey
Asus, cömert boyutlu dokunmatik yüzey için övgüyü hak ediyor. 13 x 8.5 cm, 15 inçlik segmentte nadirdir; parmağınızı sıfırlamanıza gerek kalmadan ekranda uzun mesafeler koşmanıza izin verir. Büyük dokunmatik yüzey sayesinde, avuç içi dayanağı da cömert boyuttadır ve bu da ergonomiye fayda sağlar. Bunun ötesinde, dokunmatik yüzey pürüzsüz ve son derece kaygan bir yüzeyle etkileyicidir. Çoklu dokunma desteği hakkında da şikayet edecek bir şey yok (iki parmak hareketlerini kullanarak yakınlaştırma ve kaydırma). Yalnızca yüksek ve biraz tıkırtılı tıklama sesi bir dezavantajdır.
Görüntüle
WQHD ekranlar şu anda görüntü netliği ve kaynak tüketimi arasındaki mükemmel uzlaşmayı temsil ediyor. Asus, Zephyrus G15 için CMN'den (N156KME-GNA) 165 Hz'lik bir model kullanıyor; yüksek frekans ve nispeten düşük tepki süresi (10 ms'nin altında griden griye) nedeniyle oyuncular için çok uygundur.
| |||||||||||||||||||||||||
Aydınlatma: 89 %
Batarya modunda parlaklık: 327 cd/m²
Kontrast: 991:1 (Siyah: 0.33 cd/m²)
ΔE ColorChecker Calman: 4.49 | ∀{0.5-29.43 Ø4.73}
calibrated: 2.27
ΔE Greyscale Calman: 4.2 | ∀{0.09-98 Ø4.97}
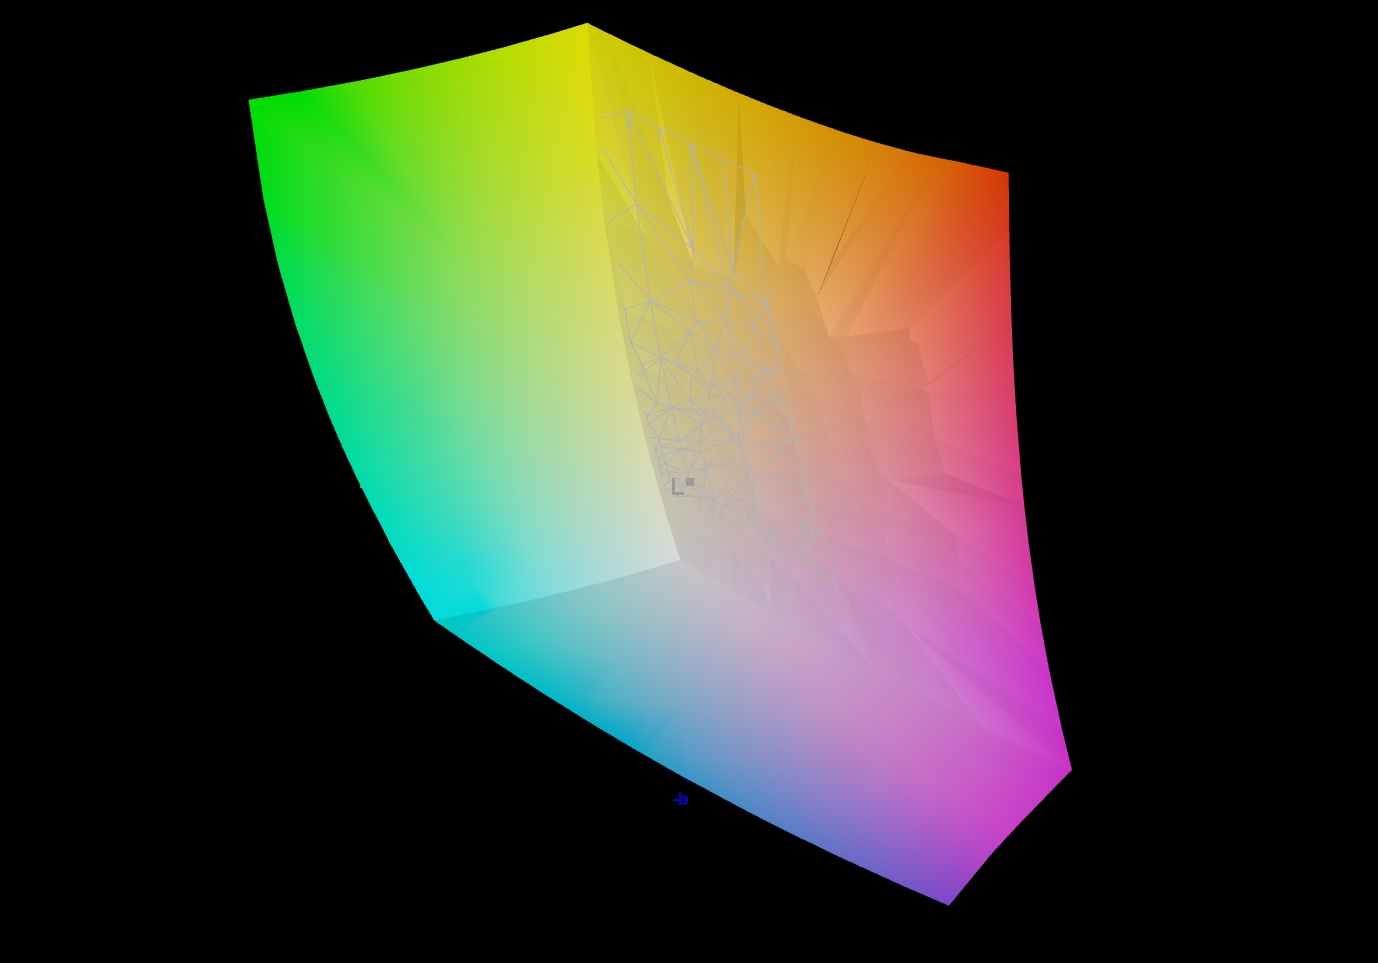
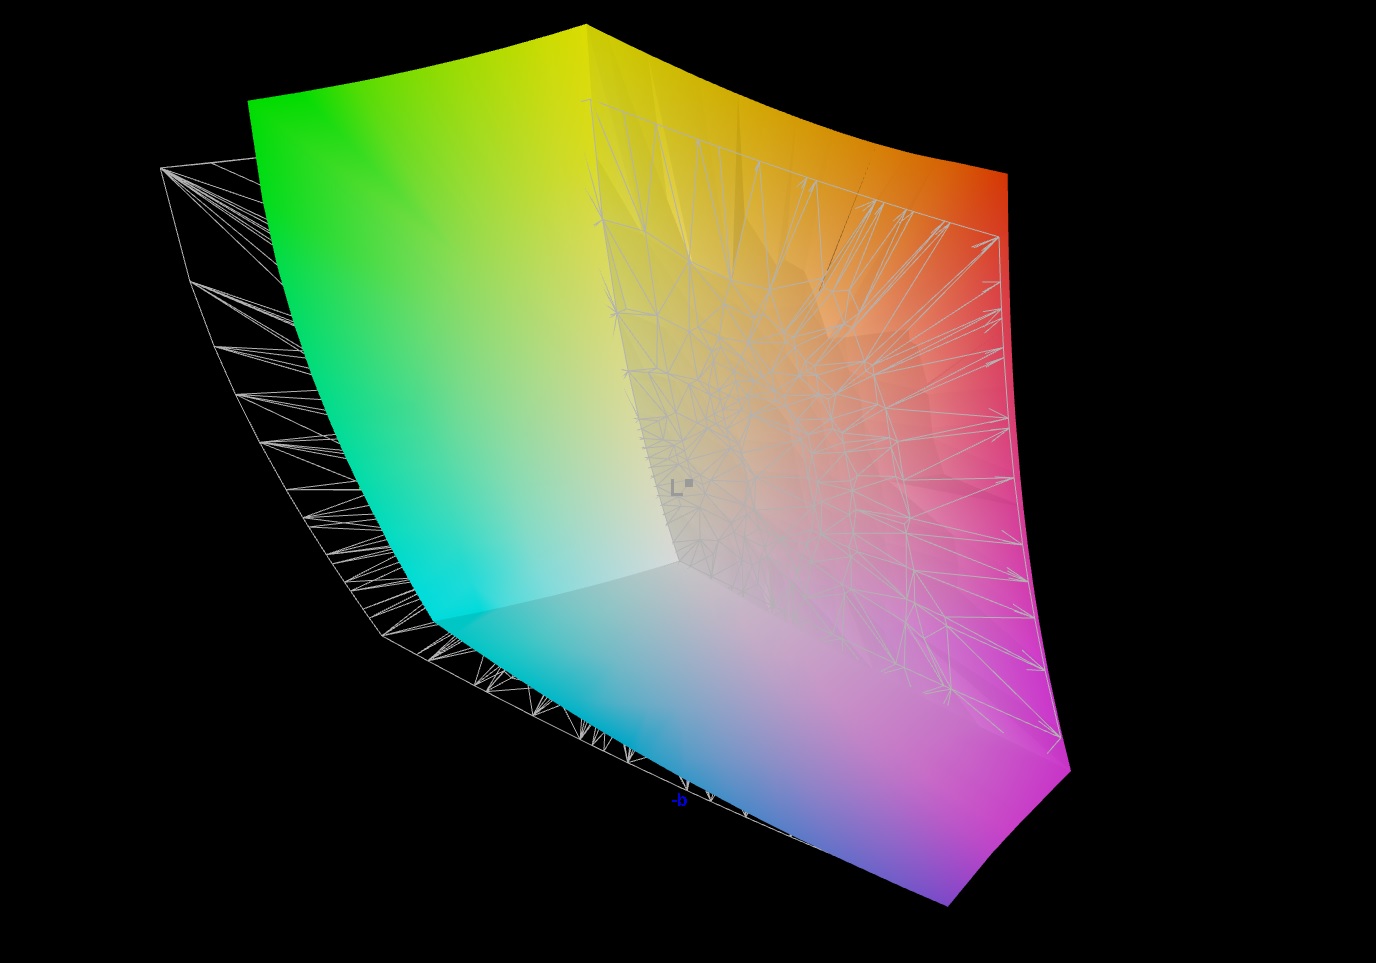
99% sRGB (Argyll 1.6.3 3D)
86% AdobeRGB 1998 (Argyll 1.6.3 3D)
86.2% AdobeRGB 1998 (Argyll 3D)
99.9% sRGB (Argyll 3D)
97.3% Display P3 (Argyll 3D)
Gamma: 2.173
CCT: 7014 K
| Asus ROG Zephyrus G15 GA503Q CMN N156KME-GNA (CMN152A), IPS-Level, 2560x1440, 15.6" | MSI GS66 10SGS AU Optronics B156HAN12.0, IPS, 1920x1080, 15.6" | Razer Blade 15 RTX 2080 Super Max-Q AU Optronics B156HAN12.0, IPS, 1920x1080, 15.6" | Acer Predator Triton 500 PT515-52-70N3 AUO B156HAN12.0 (AUO7A8C), IPS, 1920x1080, 15.6" | Lenovo Legion 7 15IMH05-81YT001VGE AUO048E, IPS, 1920x1080, 15.6" | |
|---|---|---|---|---|---|
| Display | -16% | -15% | -15% | -15% | |
| Display P3 Coverage (%) | 97.3 | 69.9 -28% | 70.2 -28% | 70.3 -28% | 70.3 -28% |
| sRGB Coverage (%) | 99.9 | 99.1 -1% | 99 -1% | 99.5 0% | 99.4 -1% |
| AdobeRGB 1998 Coverage (%) | 86.2 | 71.1 -18% | 71.4 -17% | 72.2 -16% | 71.3 -17% |
| Response Times | -8% | 26% | -29% | 19% | |
| Response Time Grey 50% / Grey 80% * (ms) | 8.8 ? | 11.2 ? -27% | 6 ? 32% | 14.4 ? -64% | 8 ? 9% |
| Response Time Black / White * (ms) | 11.2 ? | 10 ? 11% | 9 ? 20% | 10.4 ? 7% | 8 ? 29% |
| PWM Frequency (Hz) | |||||
| Screen | 24% | 18% | 6% | 30% | |
| Brightness middle (cd/m²) | 327 | 339.4 4% | 347 6% | 320 -2% | 470 44% |
| Brightness (cd/m²) | 309 | 331 7% | 328 6% | 318 3% | 468 51% |
| Brightness Distribution (%) | 89 | 92 3% | 89 0% | 88 -1% | 85 -4% |
| Black Level * (cd/m²) | 0.33 | 0.24 27% | 0.285 14% | 0.24 27% | 0.21 36% |
| Contrast (:1) | 991 | 1414 43% | 1218 23% | 1333 35% | 2238 126% |
| Colorchecker dE 2000 * | 4.49 | 1.58 65% | 2.35 48% | 4.03 10% | 3.28 27% |
| Colorchecker dE 2000 max. * | 8.42 | 3.8 55% | 4.15 51% | 8.43 -0% | 7.31 13% |
| Colorchecker dE 2000 calibrated * | 2.27 | 1.47 35% | 1.16 49% | 0.98 57% | 0.8 65% |
| Greyscale dE 2000 * | 4.2 | 2.3 45% | 3.04 28% | 5.94 -41% | 4.49 -7% |
| Gamma | 2.173 101% | 2.24 98% | 2.35 94% | 2.42 91% | 2.4 92% |
| CCT | 7014 93% | 6952 93% | 6658 98% | 6751 96% | 7438 87% |
| Color Space (Percent of AdobeRGB 1998) (%) | 86 | 64.8 -25% | 65 -24% | 66 -23% | 65 -24% |
| Color Space (Percent of sRGB) (%) | 99 | 99.4 0% | 99 0% | 99 0% | 99 0% |
| Toplam Ortalama (Program / Ayarlar) | 0% /
12% | 10% /
13% | -13% /
-2% | 11% /
20% |
* ... daha küçük daha iyidir
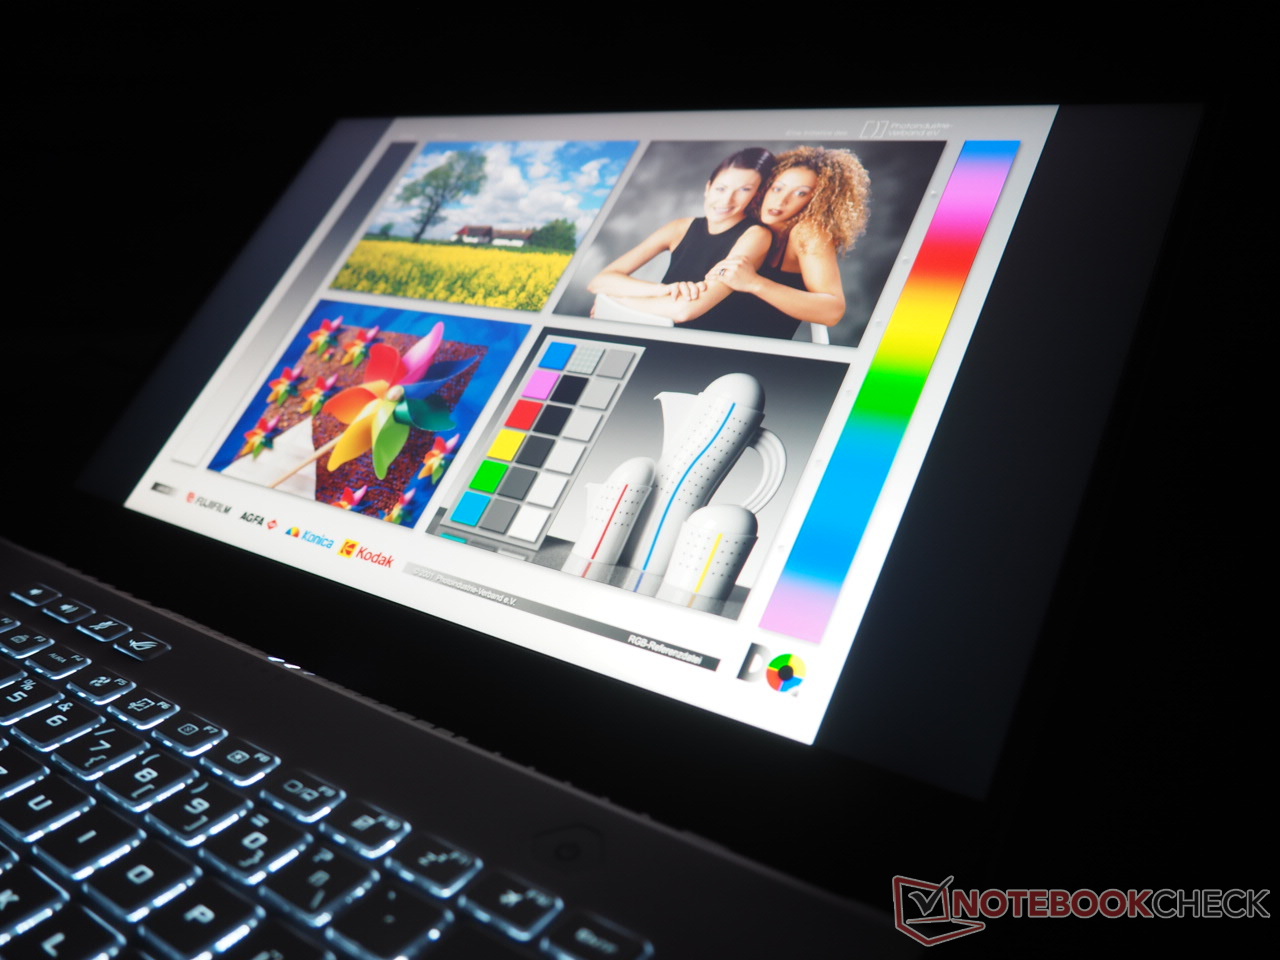
However, professional users who want to do photo or video editing, for example, and who rely on high color-space coverage should also be happy with the WQHD panel. According to our tests, the 15-inch display covers 99% of the sRGB space and 86% of the AdobeRGB space - a very good result. For comparison: The competition manages a maximum of 66% of AdobeRGB.
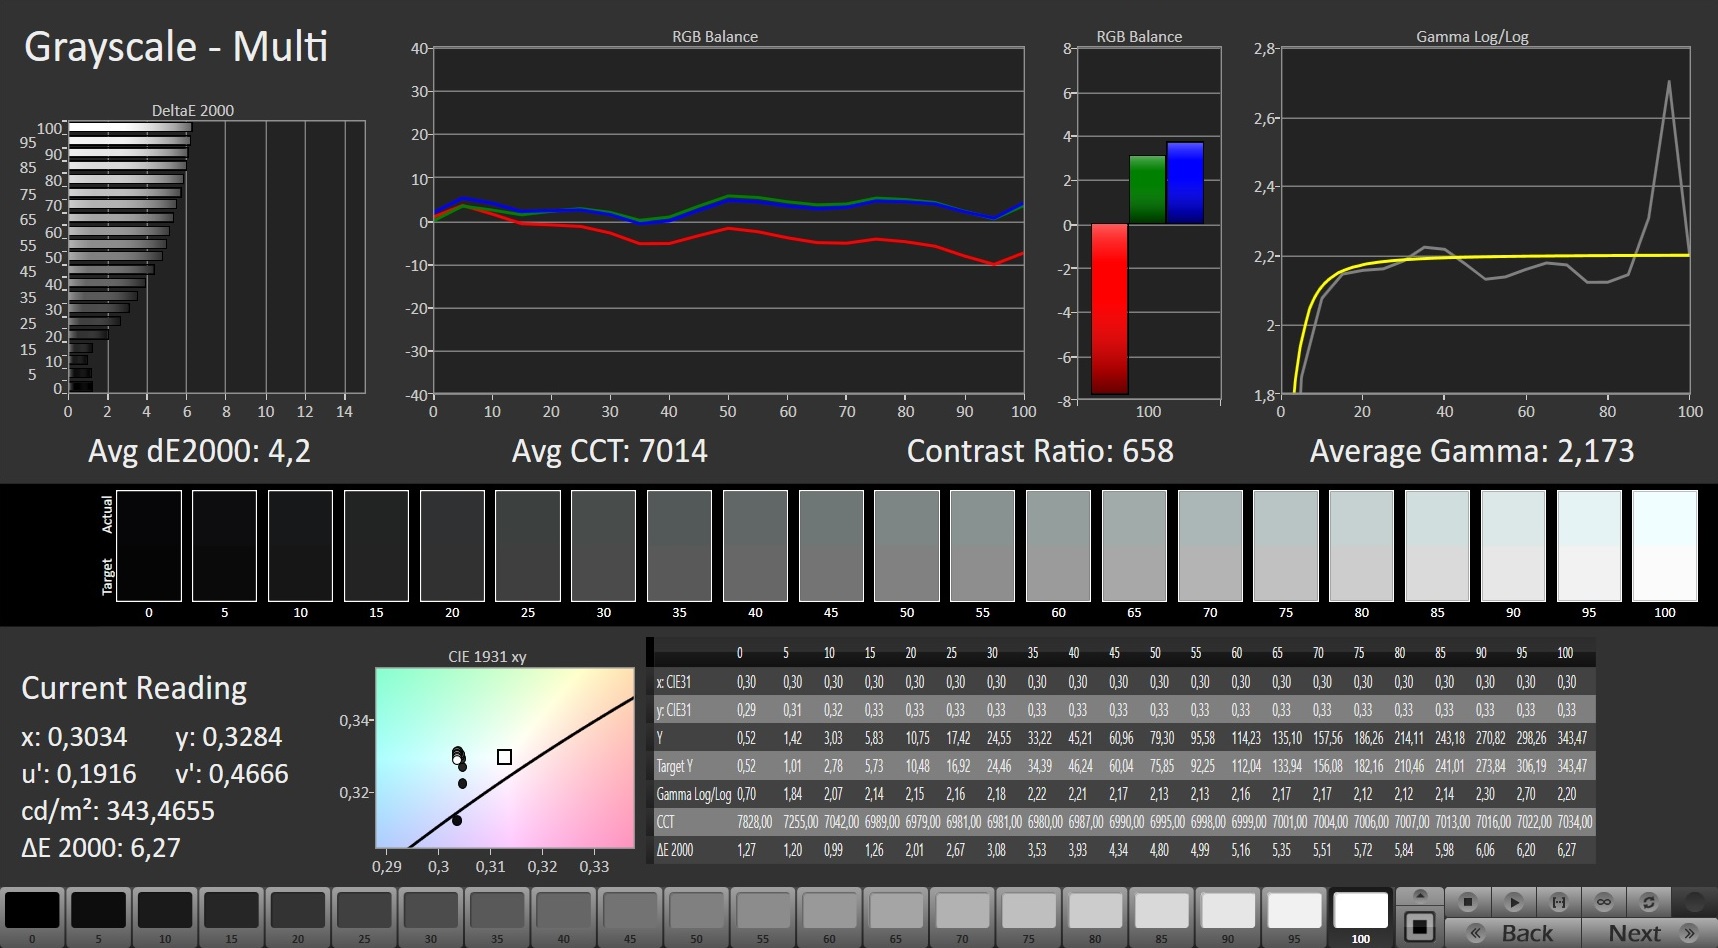
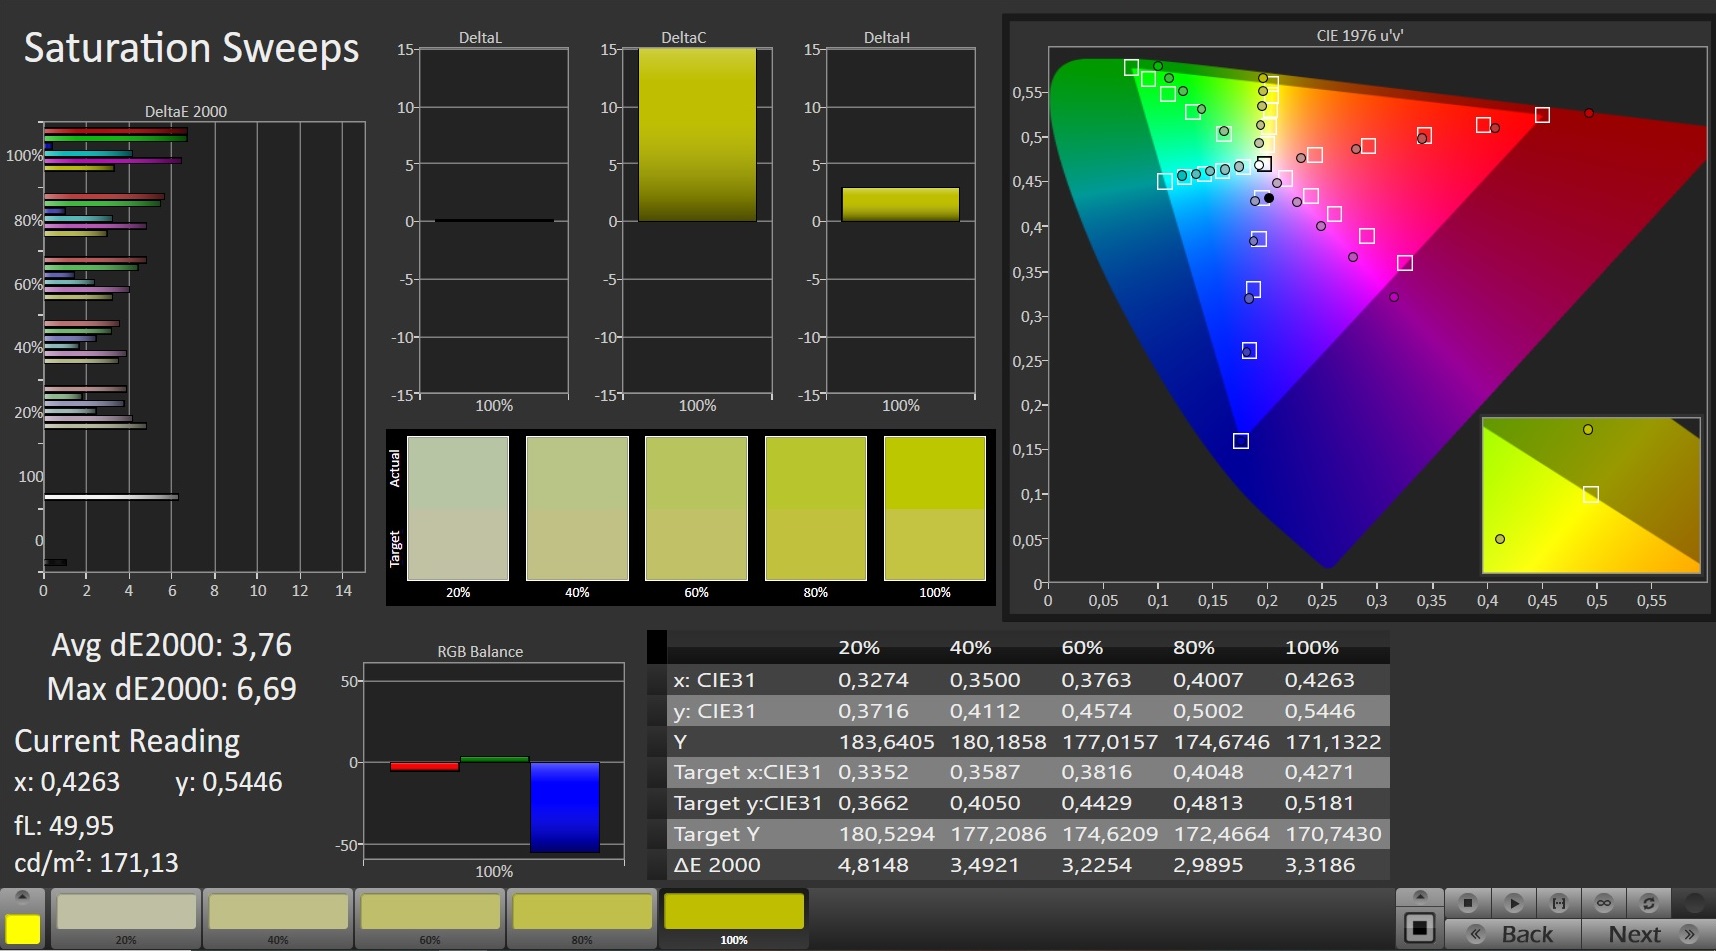
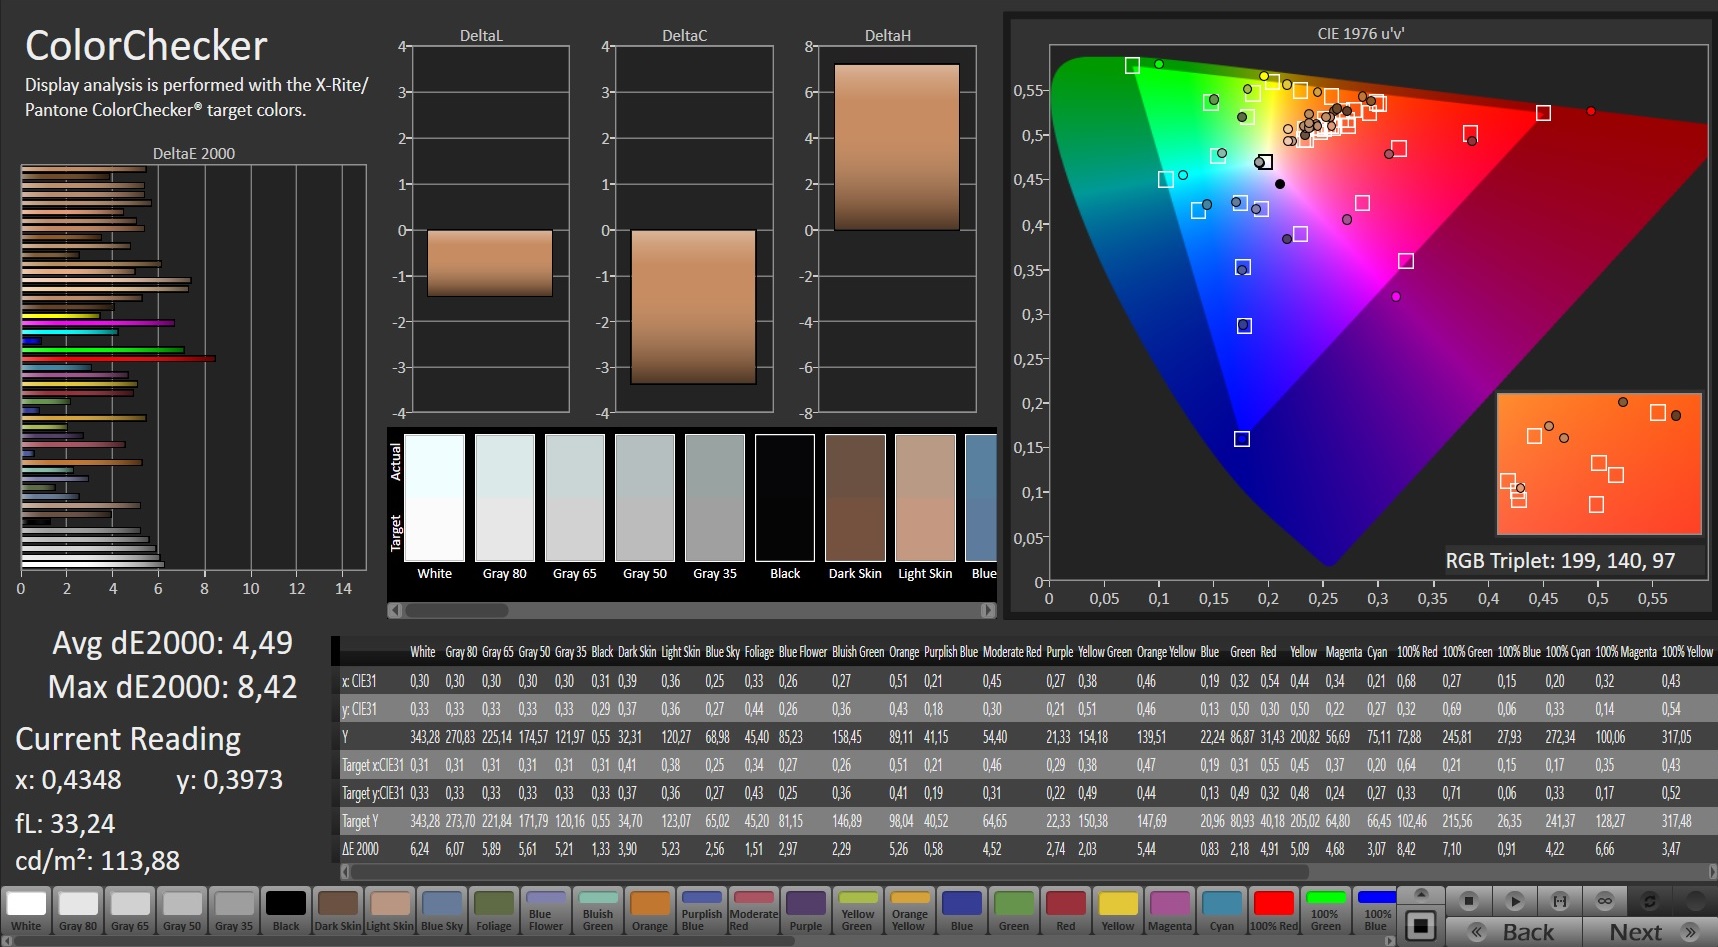
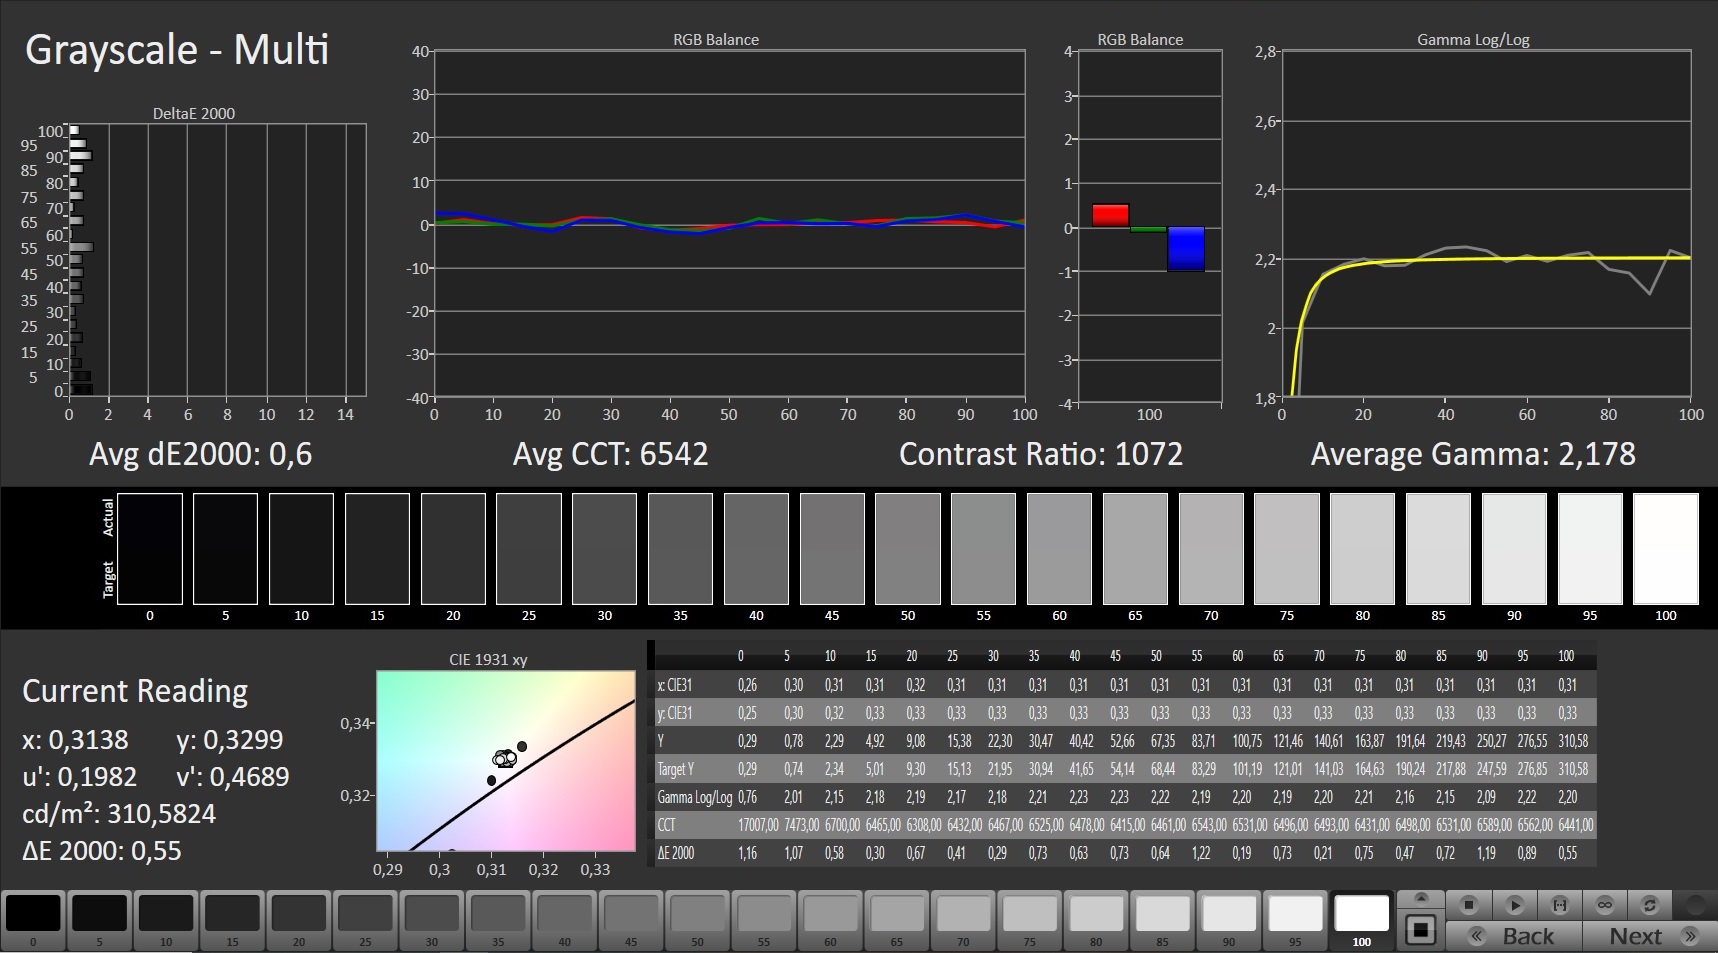
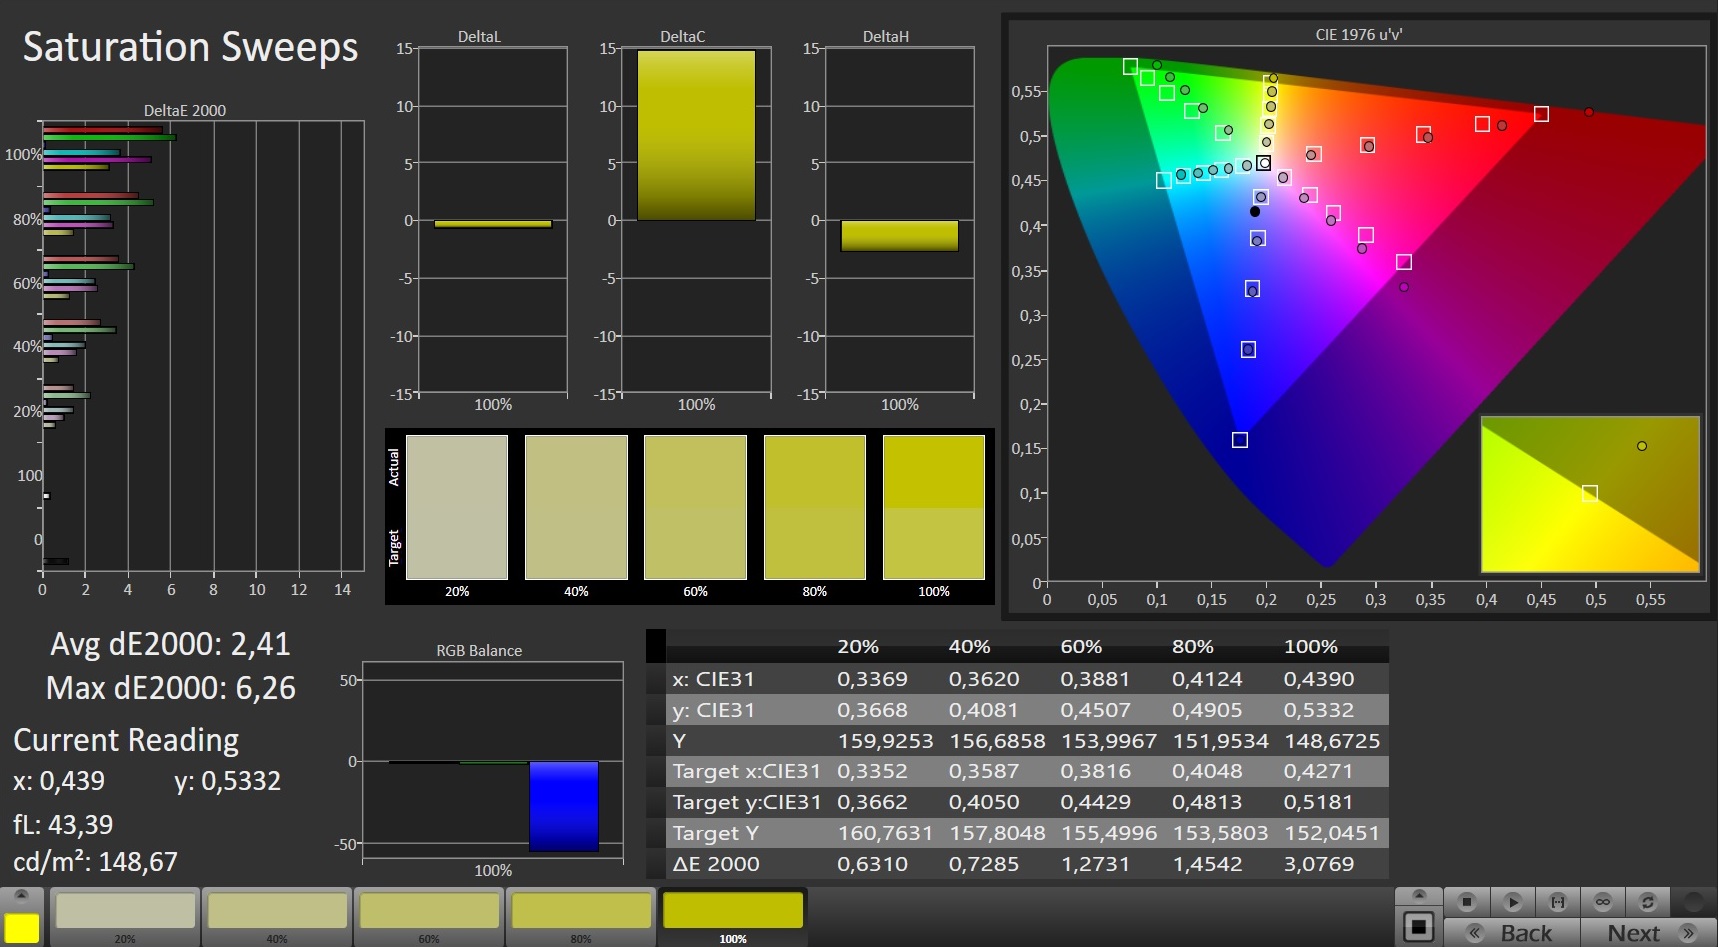
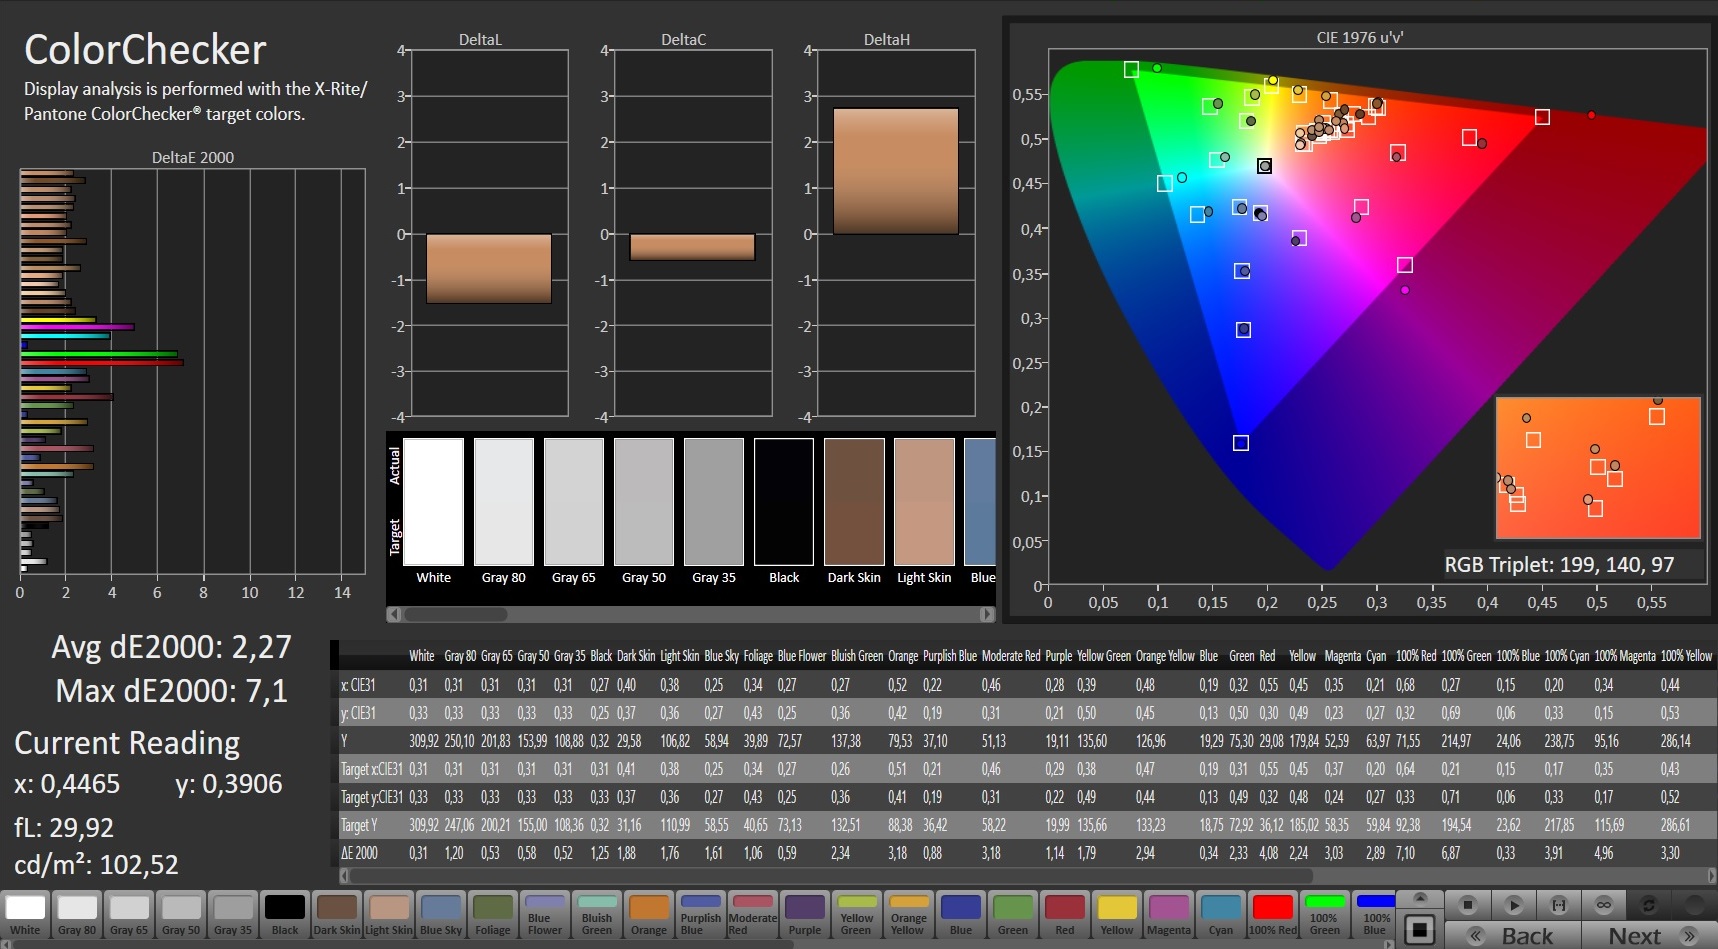
The color accuracy, which is decent out of the box, can be brought to a very good level via calibration (see Calman screenshots).
The rest of the panel's values are less spectacular. With a brightness of just under 310 cd/m² and a contrast of around 1,000:1, the ROG Zephyrus G15 settles in the midfield. The same applies to the black level (0.33 cd/m²). The viewing angles are at the typical IPS level.
Yanıt Sürelerini Görüntüle
| ↔ Tepki Süresi Siyahtan Beyaza | ||
|---|---|---|
| 11.2 ms ... yükseliş ↗ ve sonbahar↘ birleşimi | ↗ 6.8 ms yükseliş | 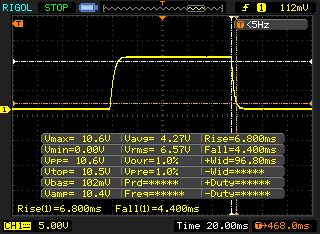 |
| ↘ 4.4 ms sonbahar | ||
| Ekran, testlerimizde iyi yanıt oranları gösteriyor ancak rekabetçi oyuncular için çok yavaş olabilir. Karşılaştırıldığında, test edilen tüm cihazlar 0.1 (minimum) ile 240 (maksimum) ms arasında değişir. » Tüm cihazların 30 %'si daha iyi. Bu, ölçülen yanıt süresinin test edilen tüm cihazların ortalamasından (19.9 ms) daha iyi olduğu anlamına gelir. | ||
| ↔ Tepki Süresi %50 Griden %80 Griye | ||
| 8.8 ms ... yükseliş ↗ ve sonbahar↘ birleşimi | ↗ 4.4 ms yükseliş | 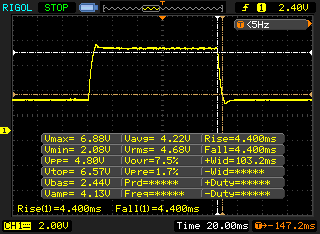 |
| ↘ 4.4 ms sonbahar | ||
| Ekran, testlerimizde hızlı yanıt oranları gösteriyor ve oyun oynamaya uygun olmalı. Karşılaştırıldığında, test edilen tüm cihazlar 0.165 (minimum) ile 636 (maksimum) ms arasında değişir. » Tüm cihazların 22 %'si daha iyi. Bu, ölçülen yanıt süresinin test edilen tüm cihazların ortalamasından (31.1 ms) daha iyi olduğu anlamına gelir. | ||
Ekran Titremesi / PWM (Darbe Genişliği Modülasyonu)
| Ekran titriyor / PWM algılanmadı |  | ||
Karşılaştırıldığında: Test edilen tüm cihazların %52 %'si ekranı karartmak için PWM kullanmıyor. PWM tespit edilirse, ortalama 7798 (minimum: 5 - maksimum: 343500) Hz ölçüldü. | |||
Test conditions
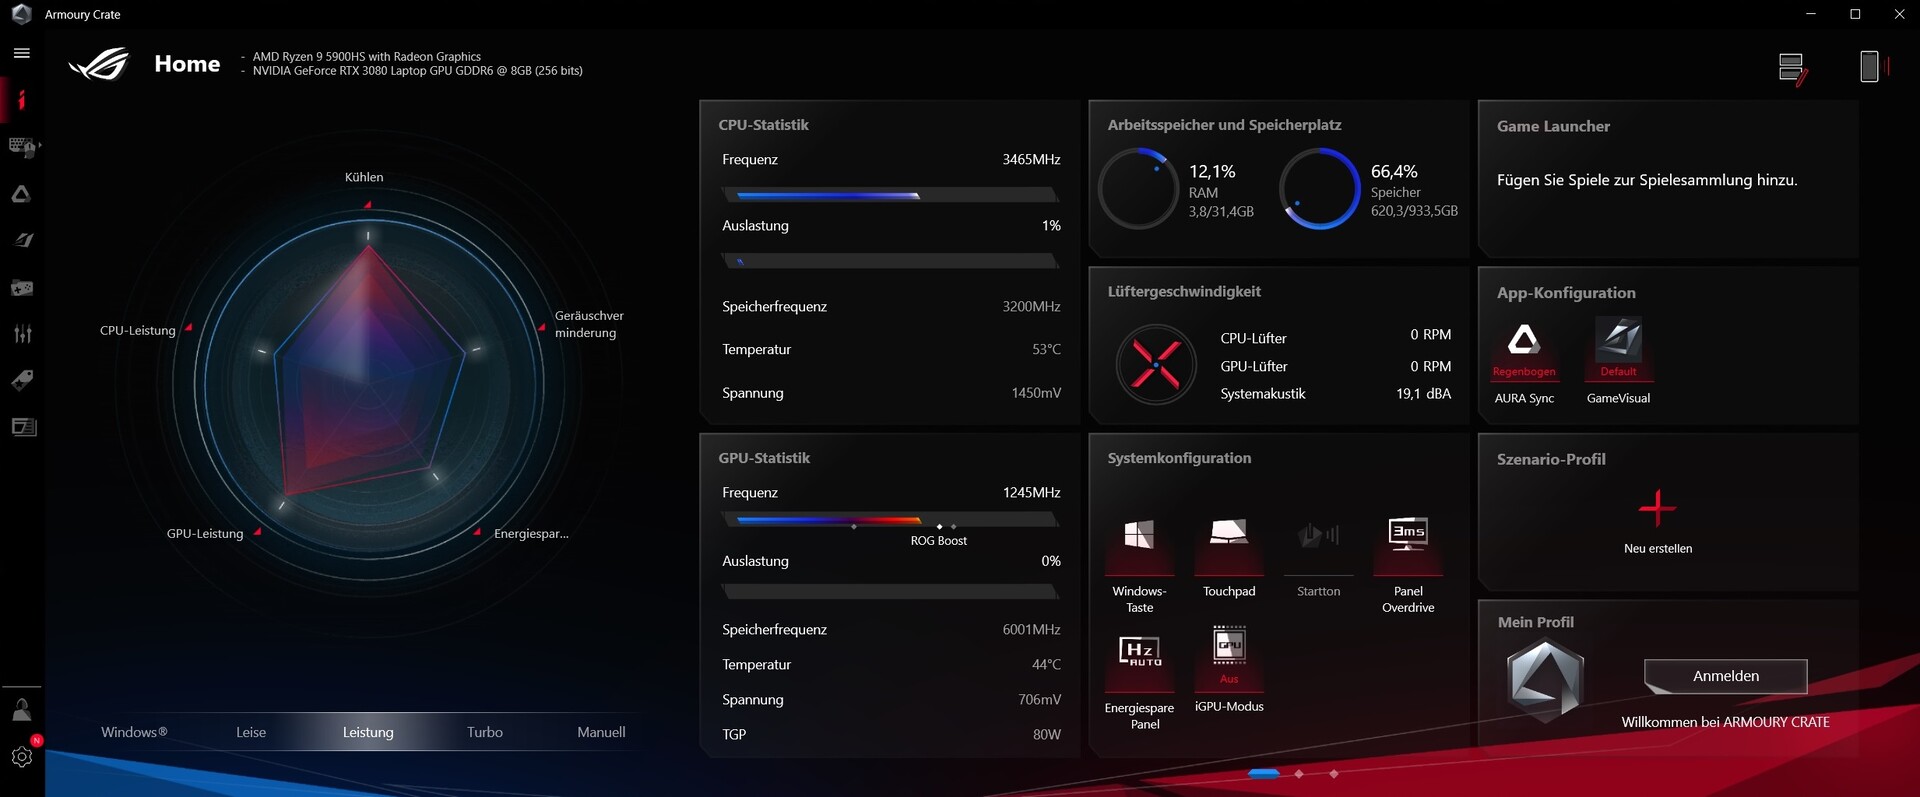
As usual, Asus puts its powerful Armoury Crate software on the system, which offers dozens of settings and tuning options. Our measurements were conducted using the "Performance" profile.
Performance
Despite its compact dimensions, the Zephyrus G15 is a true high-end laptop that should have enough power for all common application scenarios in the coming years.
Processor
With the Cezanne generation, AMD further increases the pressure on its main competitor Intel, which is increasingly falling behind in terms of technology.
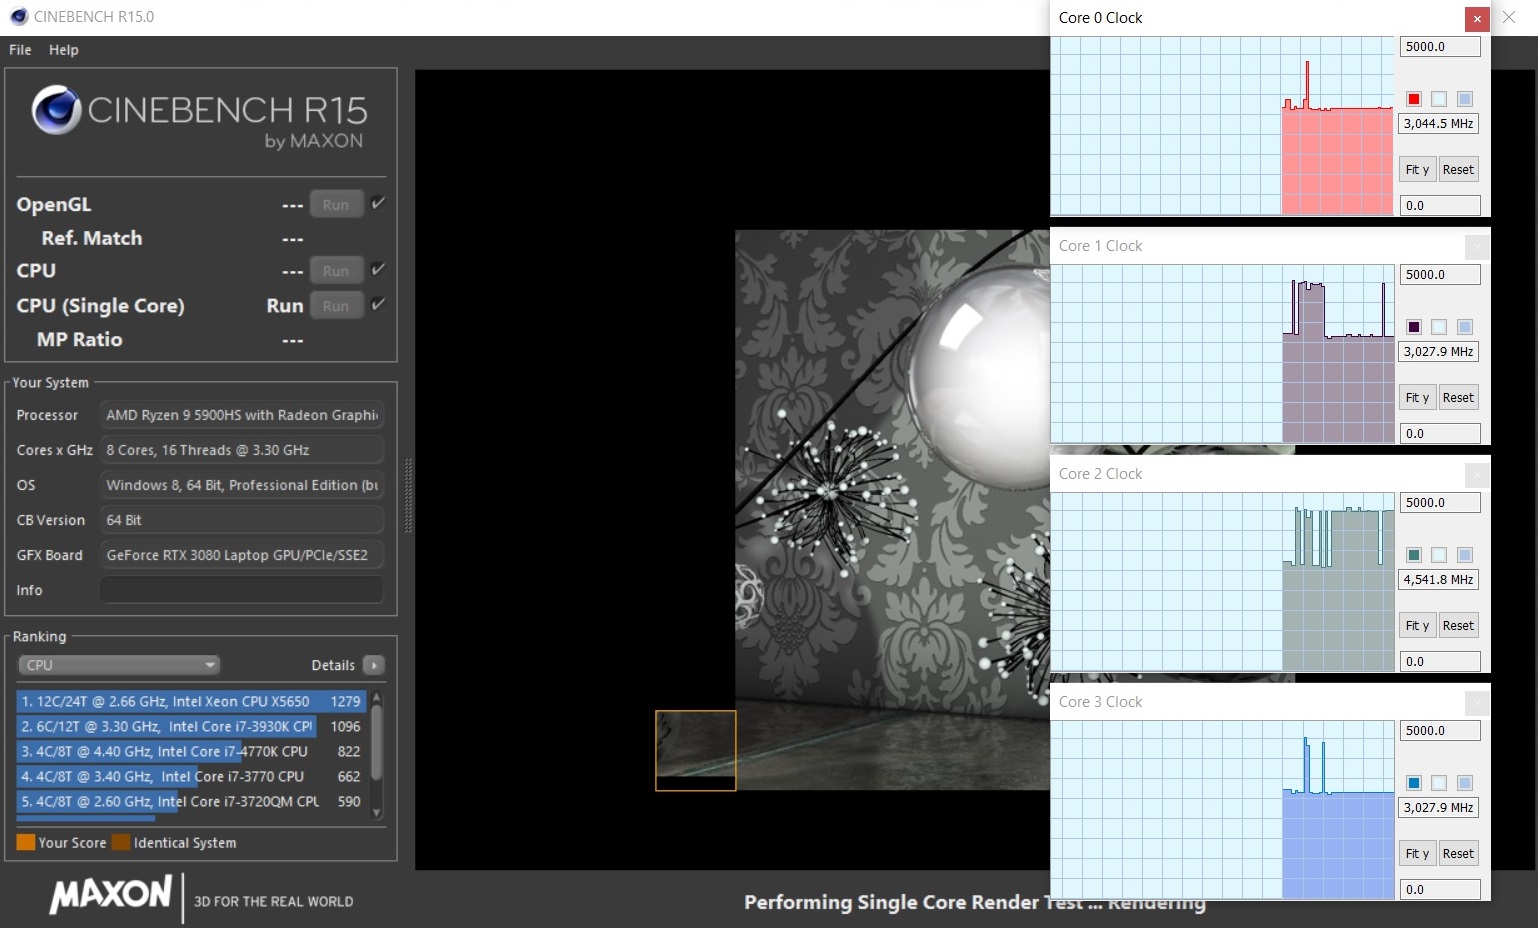
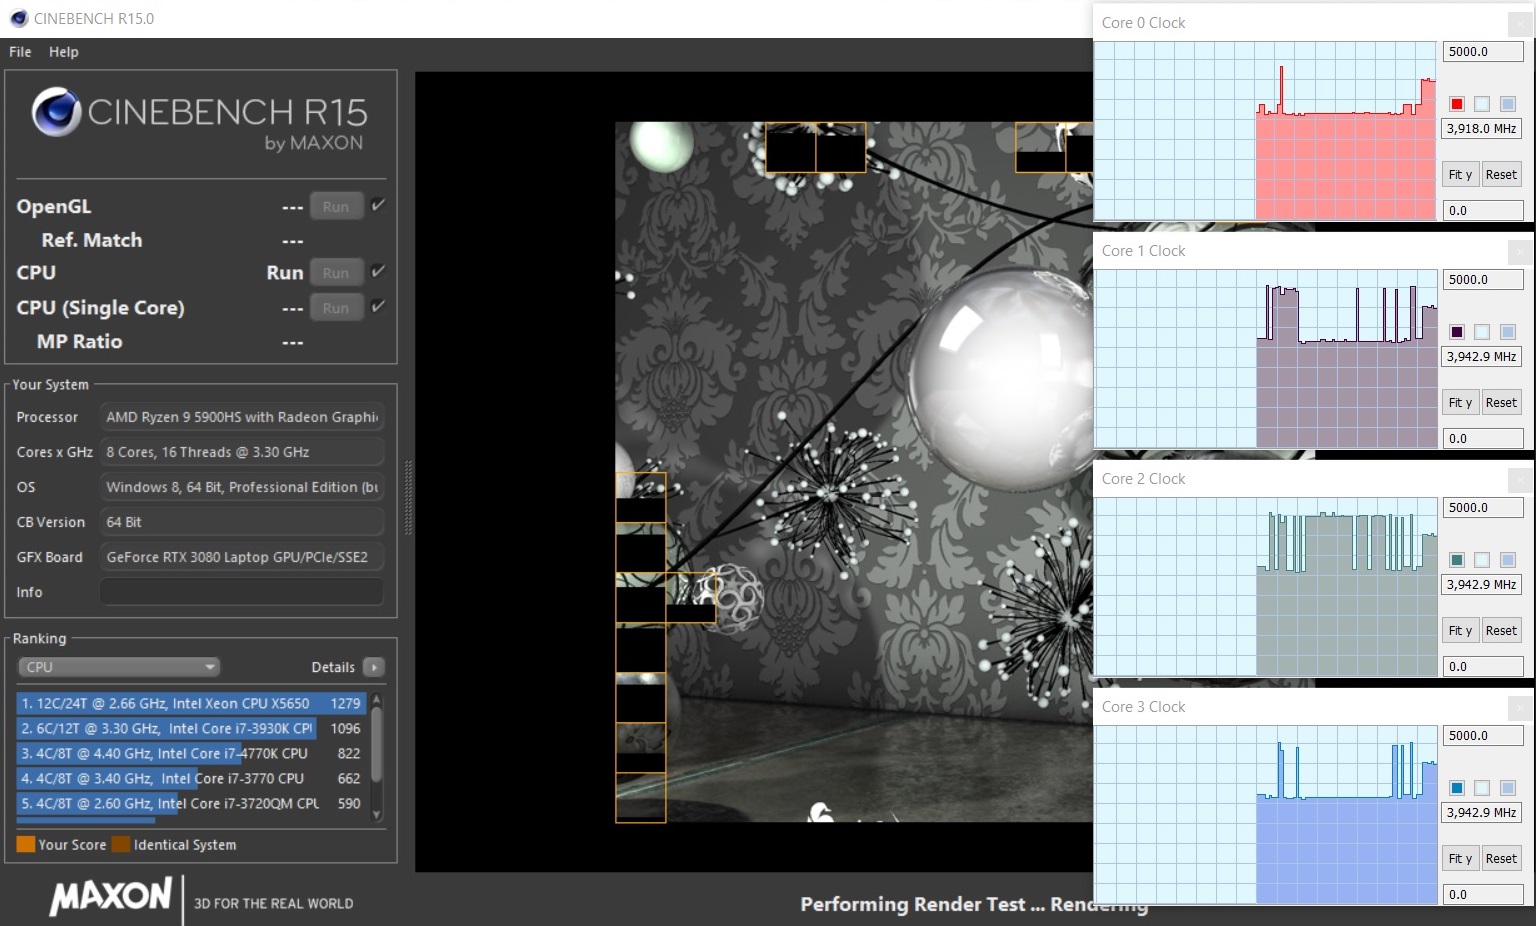
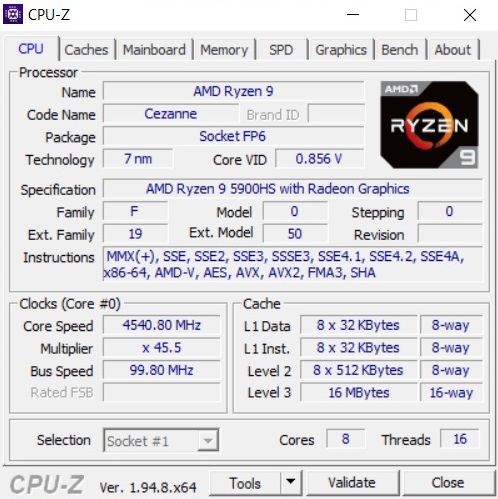
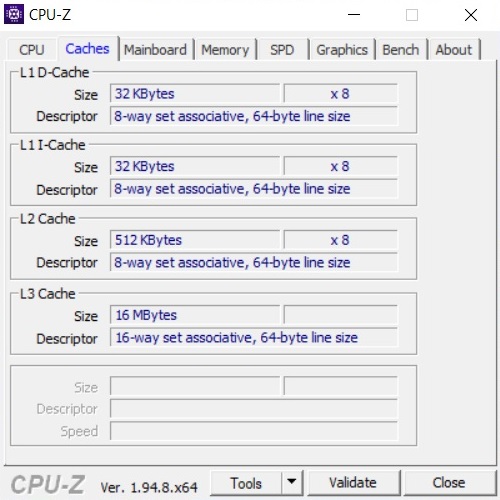
The 7 nm Ryzen 9 5900HS in the G15 belongs to the upper class and can boast 8 cores (16 threads in parallel via SMT) and 16 MB of L3 cache. The base clock speed of 3.3 GHz is increased up to 4.6 GHz under load via Turbo. According to Cinebench R15, the 35-watt CPU reaches between 3.0 and 4.5 GHz in single-core scenarios, whereas the clock rate settles at around 4.0 GHz when all cores are loaded.
Compared to Intel's Comet Lake chips, the R9 5900HS does very well. As you can see in the tables below, even the expensive Core i9-10980HK top model can't keep up with the AMD CPU. Correspondingly, the choice of a Cezanne processor is spot on from a price-performance perspective.
* ... daha küçük daha iyidir
System performance
System benchmarks also benefit from the fast CPU. With a PCMark 10 score of 6,896 points, the Zephyrus G15 is able to outperform the competition, which - at least on paper - lags between 5% and 26% behind. Subjectively speaking, all comparison devices offer a very high system speed.
| PCMark 10 Score | 6896 puan | |
Yardım | ||
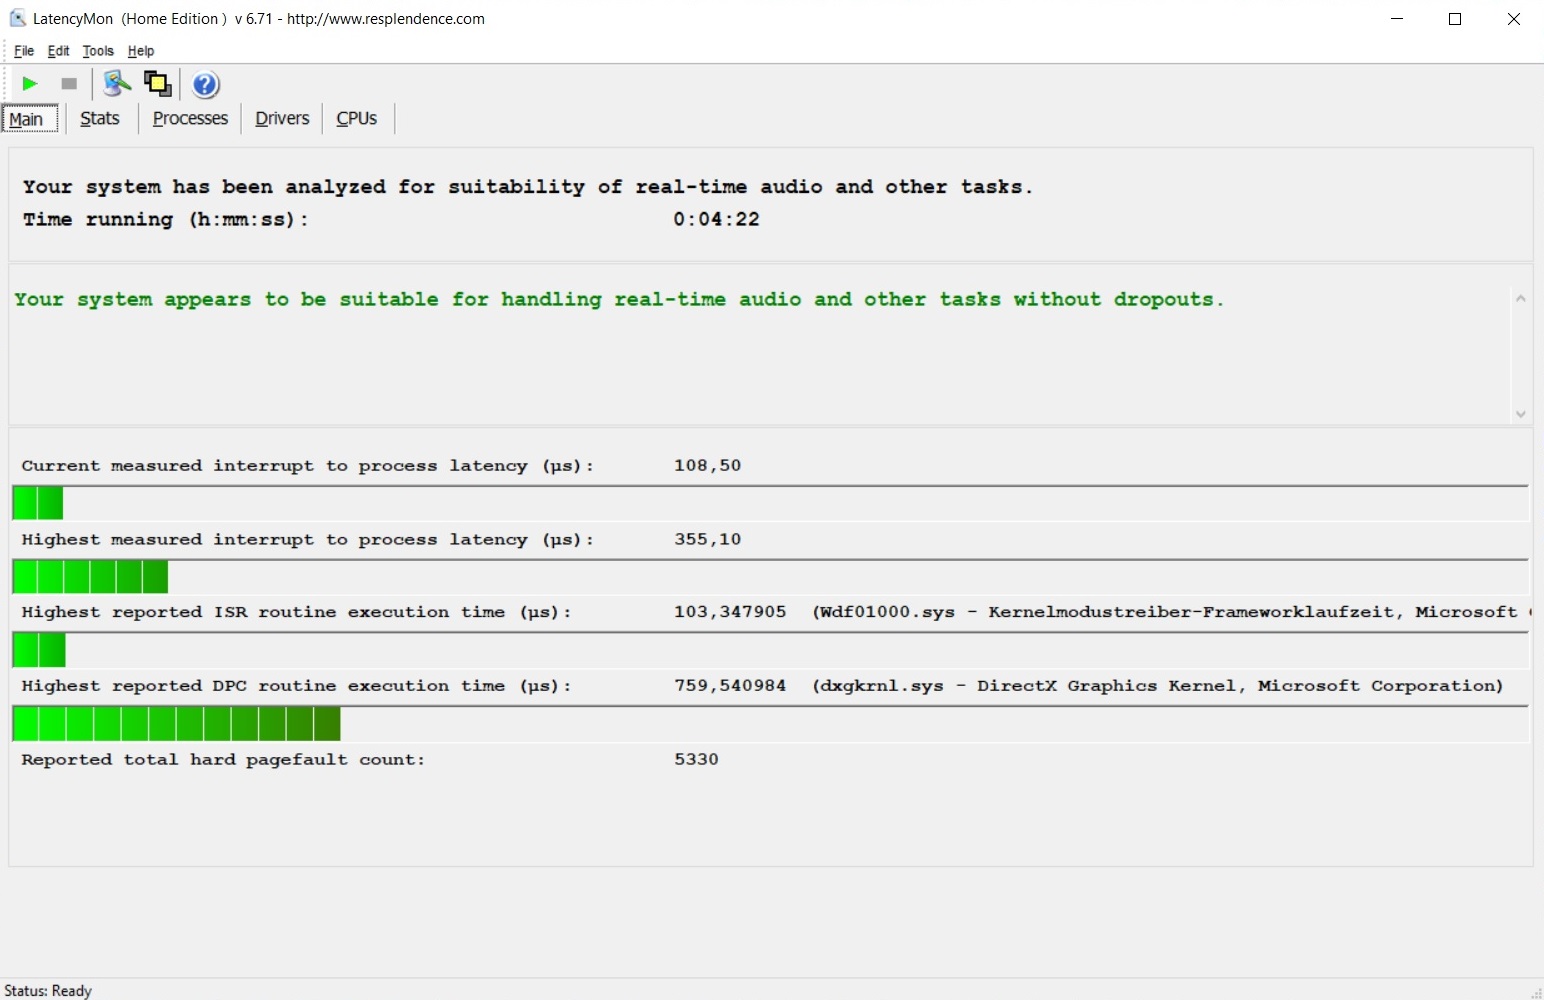
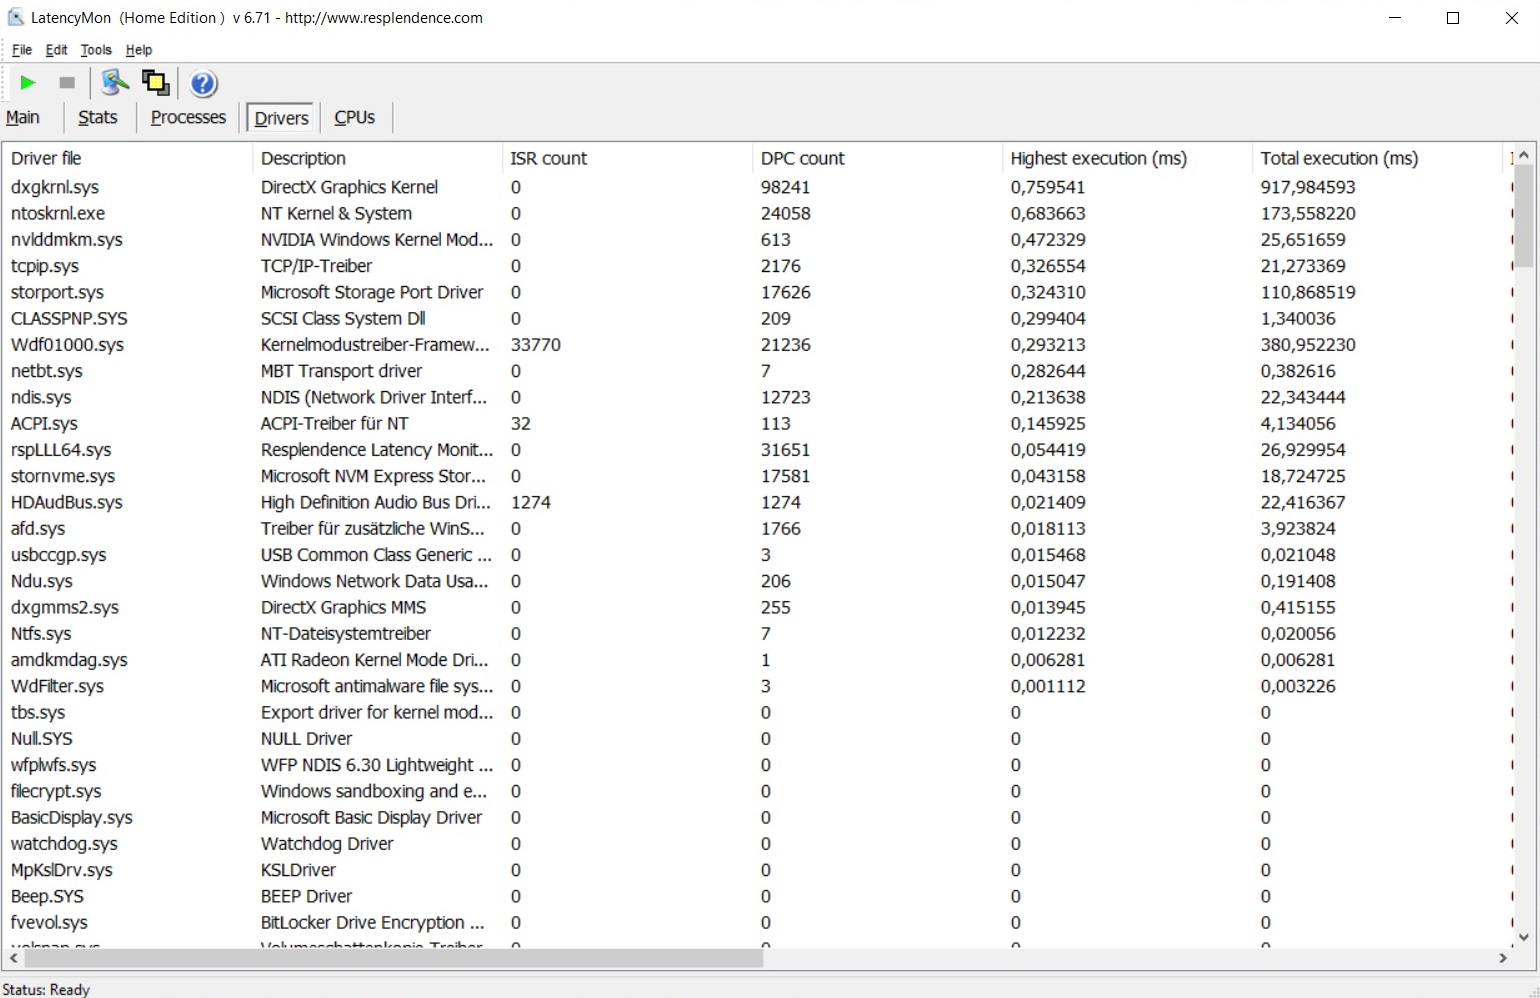
DPC latencies
Asus doesn't mess up when it comes to latencies either. The LatencyMon tool shows that the 15-incher is fully suitable for practical use. Some rivals reveal weaknesses here.
| DPC Latencies / LatencyMon - interrupt to process latency (max), Web, Youtube, Prime95 | |
| Acer Predator Triton 500 PT515-52-70N3 | |
| Lenovo Legion 7 15IMH05-81YT001VGE | |
| MSI GS66 10SGS | |
| Razer Blade 15 RTX 2080 Super Max-Q | |
| Asus ROG Zephyrus G15 GA503Q | |
* ... daha küçük daha iyidir
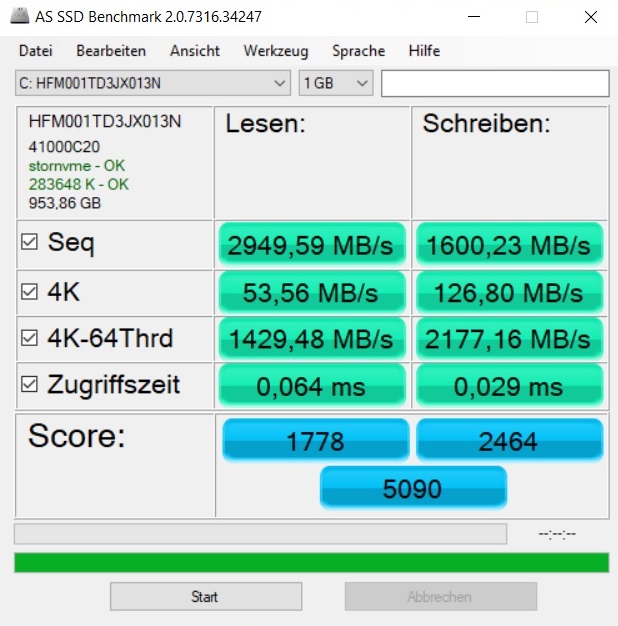
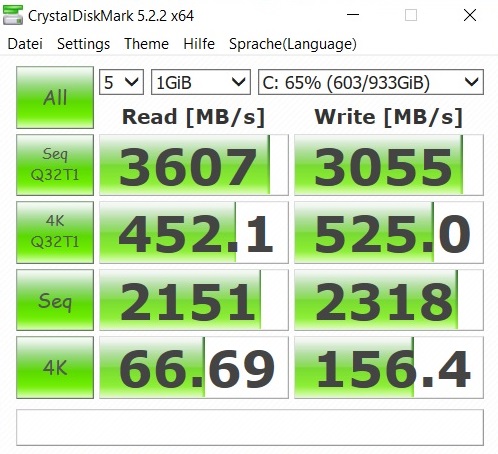
Storage
Although the storage drive comes from the rather unknown brand SK Hynix, the 1 TB SSD can easily compete with the Samsung models from the competition. The PCIe 4 drive achieves a very high speed for both small and large files. A second M.2 slot is available for upgrades.
| Asus ROG Zephyrus G15 GA503Q SK Hynix HFM001TD3JX013N | MSI GS66 10SGS Samsung SSD PM981 MZVLB512HAJQ | Razer Blade 15 RTX 2080 Super Max-Q Samsung PM981a MZVLB1T0HBLR | Acer Predator Triton 500 PT515-52-70N3 Samsung SSD PM981a MZVLB512HBJQ | Lenovo Legion 7 15IMH05-81YT001VGE 2x Samsung PM981a MZVLB1T0HBLR (RAID 0) | |
|---|---|---|---|---|---|
| CrystalDiskMark 5.2 / 6 | -16% | -6% | -5% | -6% | |
| Write 4K (MB/s) | 156.4 | 132.5 -15% | 135.7 -13% | 131.7 -16% | 110.4 -29% |
| Read 4K (MB/s) | 66.7 | 45.03 -32% | 46.98 -30% | 47.34 -29% | 55.1 -17% |
| Write Seq (MB/s) | 2318 | 1987 -14% | 2180 -6% | 2884 24% | |
| Read Seq (MB/s) | 2151 | 1434 -33% | 1949 -9% | 2303 7% | |
| Write 4K Q32T1 (MB/s) | 525 | 467.5 -11% | 510 -3% | 423.9 -19% | 466.6 -11% |
| Read 4K Q32T1 (MB/s) | 452.1 | 536 19% | 569 26% | 487.7 8% | 517 14% |
| Write Seq Q32T1 (MB/s) | 3055 | 2003 -34% | 2984 -2% | 2822 -8% | 3424 12% |
| Read Seq Q32T1 (MB/s) | 3607 | 3306 -8% | 3238 -10% | 3478 -4% | 3519 -2% |
| AS SSD | -31% | -6% | -5% | -4% | |
| Seq Read (MB/s) | 2950 | 1086 -63% | 1950 -34% | 2767 -6% | 3088 5% |
| Seq Write (MB/s) | 1600 | 1901 19% | 2322 45% | 2613 63% | 2561 60% |
| 4K Read (MB/s) | 53.6 | 51 -5% | 45.48 -15% | 47.55 -11% | 43.01 -20% |
| 4K Write (MB/s) | 126.8 | 117.3 -7% | 95.4 -25% | 98.9 -22% | 102 -20% |
| 4K-64 Read (MB/s) | 1429 | 1503 5% | 1484 4% | 1205 -16% | 1549 8% |
| 4K-64 Write (MB/s) | 2177 | 1721 -21% | 1887 -13% | 2007 -8% | 1378 -37% |
| Access Time Read * (ms) | 0.064 | 0.059 8% | 0.051 20% | 0.065 -2% | 0.051 20% |
| Access Time Write * (ms) | 0.029 | 0.1 -245% | 0.038 -31% | 0.038 -31% | 0.037 -28% |
| Score Read (Points) | 1778 | 1662 -7% | 1725 -3% | 1529 -14% | 1901 7% |
| Score Write (Points) | 2464 | 2029 -18% | 2215 -10% | 2367 -4% | 1737 -30% |
| Score Total (Points) | 5090 | 4588 -10% | 4843 -5% | 4677 -8% | 4583 -10% |
| Toplam Ortalama (Program / Ayarlar) | -24% /
-25% | -6% /
-6% | -5% /
-5% | -5% /
-5% |
* ... daha küçük daha iyidir

Continuous load read: DiskSpd Read Loop, Queue Depth 8
Graphics card
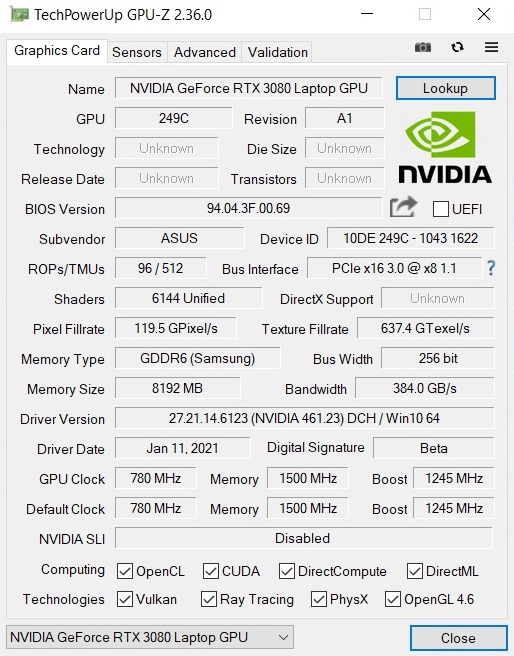
In order not to overtax the cooling system of the slim 15-inch case, Asus uses the weakest version of the RTX 3080 laptop GPU that has an 80-watt TDP (100 watts including Dynamic Boost).
| 3DMark Cloud Gate Standard Score | 42022 puan | |
| 3DMark Fire Strike Score | 20784 puan | |
| 3DMark Time Spy Score | 9391 puan | |
Yardım | ||
The low TDP has a correspondingly negative impact on performance. Despite the large number of shaders, which is far from the desktop counterpart's level (6,144 vs. 8,704), the RTX 3080 laptop version can hardly distinguish itself from devices based on the RTX 2080 (Super) Max-Q in the 3D benchmarks. As a result, buyers shouldn't expect a big performance leap.
8 GB of GDDR6 VRAM is also a bit meager in 2021 considering the video memory requirements of many modern games. A minimum of 10 GB would have been appropriate here (at least the 3080 laptop version is also available as a 16 GB model).
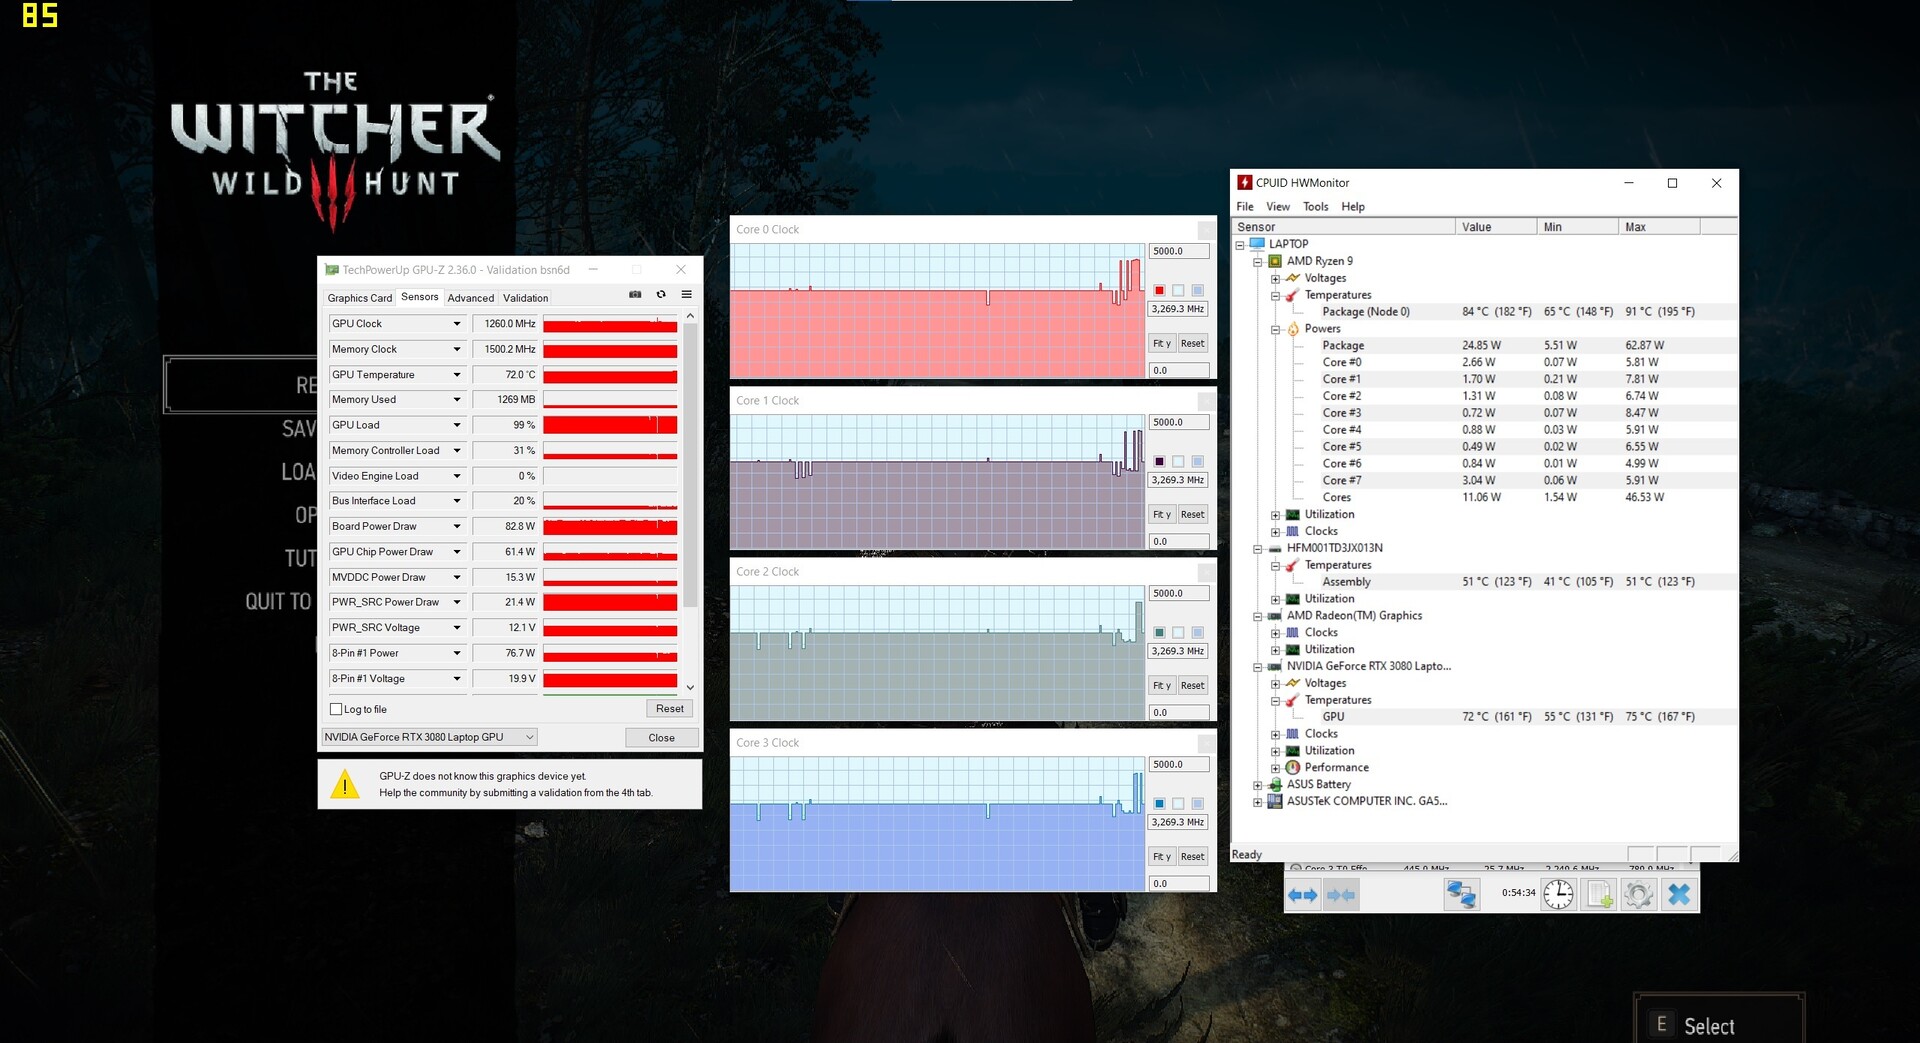
We tested how the GPU behaves over a prolonged period of time with the RPG heavyweight The Witcher 3 for about 60 minutes (Full HD/Ultra). On average, the RTX 3080 laptop GPU ran at 1,260 MHz (base clock speed of 780 MHz) and did not suffer from any performance drops
Gaming Performance
As long as you limit yourself to the native resolution, the Zephyrus G15 delivers very good performance in games. 2560x1440 pixels and maximum details is even possible in demanding titles, although it's not always enough to exceed 60 FPS (see comparison table).
| The Witcher 3 | |
| 1920x1080 Ultra Graphics & Postprocessing (HBAO+) | |
| Sınıf ortalaması Gaming (95 - 240, n=8, son 2 yıl) | |
| Asus ROG Zephyrus G15 GA503Q | |
| Lenovo Legion 7 15IMH05-81YT001VGE | |
| Razer Blade 15 RTX 2080 Super Max-Q | |
| Acer Predator Triton 500 PT515-52-70N3 | |
| MSI GS66 10SGS | |
| 3840x2160 High Graphics & Postprocessing (Nvidia HairWorks Off) | |
| Sınıf ortalaması Gaming (114 - 169.8, n=3, son 2 yıl) | |
| Asus ROG Zephyrus G15 GA503Q | |
| Acer Predator Triton 500 PT515-52-70N3 | |
| düşük | orta | yüksek | ultra | QHD | 4K | |
|---|---|---|---|---|---|---|
| GTA V (2015) | 177 | 152 | 90 | |||
| The Witcher 3 (2015) | 155 | 90.2 | 62.2 | |||
| Dota 2 Reborn (2015) | 148 | 140 | 126 | 119 | ||
| X-Plane 11.11 (2018) | 103 | 88 | 72.4 | |||
| Shadow of the Tomb Raider (2018) | 111 | 106 | 79 | 43 | ||
| Battlefield V (2018) | 131 | 125 | 98.3 | 59.2 | ||
| Apex Legends (2019) | 144 | 144 | 120 | 69.2 | ||
| Far Cry New Dawn (2019) | 101 | 90 | 78 | 50 | ||
| Metro Exodus (2019) | 85 | 68.7 | 53.8 | 35.4 | ||
| The Division 2 (2019) | 105 | 82 | 56 | 31 | ||
| Anno 1800 (2019) | 77.6 | 44.3 | 37.9 | 25.2 | ||
| Rage 2 (2019) | 116 | 115 | 75.5 | 37.8 | ||
| Control (2019) | 82.3 | 55.7 | 29 | |||
| Borderlands 3 (2019) | 94.5 | 76.5 | 55.7 | 32.3 | ||
| GRID 2019 (2019) | 113 | 84.8 | 69.8 | 48.7 | ||
| Need for Speed Heat (2019) | 94.3 | 89.4 | 67.9 | 40.7 | ||
| Star Wars Jedi Fallen Order (2019) | 97.8 | 91.5 | 79 | 42.1 | ||
| Red Dead Redemption 2 (2019) | 85.1 | 57.5 | 46.9 | 31.2 | ||
| Hunt Showdown (2020) | 111 | 71.4 | 36.8 | |||
| Doom Eternal (2020) | 165 | 163 | 123 | 68 | ||
| Gears Tactics (2020) | 136 | 107 | 72.4 | 39.4 | ||
| F1 2020 (2020) | 162 | 131 | 103 | 60 | ||
| Death Stranding (2020) | 83.6 | 82.3 | 73.7 | 52.1 | ||
| Horizon Zero Dawn (2020) | 93 | 84 | 67 | 41 | ||
| Crysis Remastered (2020) | 79.2 | 56.9 | 45.2 | 29.4 | ||
| Serious Sam 4 (2020) | 93.3 | 80.2 | 67.2 | |||
| Mafia Definitive Edition (2020) | 98.7 | 70.7 | 37.2 | |||
| Star Wars Squadrons (2020) | 198 | 189 | 134 | 79.4 | ||
| FIFA 21 (2020) | 198 | 190 | 156 | 104 | ||
| Watch Dogs Legion (2020) | 82 | 65 | 52 | 31 | ||
| Dirt 5 (2020) | 85.6 | 56.4 | 42.7 | 39.6 | ||
| Assassin´s Creed Valhalla (2020) | 74 | 64 | 52 | 33 | ||
| Call of Duty Black Ops Cold War (2020) | 89.4 | 81.7 | 62.8 | 36.9 | ||
| Yakuza Like a Dragon (2020) | 112 | 101 | 67.1 | 35.8 | ||
| Immortals Fenyx Rising (2020) | 88 | 82 | 64 | 44 | ||
| Cyberpunk 2077 1.0 (2020) | 70 | 60.2 | 39.8 | 19.7 |
Emissions
Noise emissions
Although the Zephyrus G15 can get very loud in 3D mode with a maximum of 49 to 51 dB, noise development is roughly on par with the competition, which also screams for a headset when gaming. The situation is much quieter in idle mode. On the one hand, the fans sometimes turn off completely (silent operation), and on the other hand, the base noise level is quite decent considering it's only 27 dB.
Ses yüksekliği
| Boşta |
| 26 / 27 / 31 dB |
| Çalışırken |
| 49 / 51 dB |
 | ||
30 dB sessiz 40 dB(A) duyulabilirlik 50 dB(A) gürültülü |
||
min: | ||
| Asus ROG Zephyrus G15 GA503Q R9 5900HS, GeForce RTX 3080 Laptop GPU | MSI GS66 10SGS i7-10750H, GeForce RTX 2080 Super Max-Q | Razer Blade 15 RTX 2080 Super Max-Q i7-10875H, GeForce RTX 2080 Super Max-Q | Acer Predator Triton 500 PT515-52-70N3 i7-10750H, GeForce RTX 2080 Super Max-Q | Lenovo Legion 7 15IMH05-81YT001VGE i9-10980HK, GeForce RTX 2080 Super Max-Q | |
|---|---|---|---|---|---|
| Noise | -5% | -4% | -10% | 5% | |
| kapalı / ortam * (dB) | 25 | 28.5 -14% | 30.1 -20% | 30 -20% | 24.4 2% |
| Idle Minimum * (dB) | 26 | 30 -15% | 30.1 -16% | 30 -15% | 24.4 6% |
| Idle Average * (dB) | 27 | 30 -11% | 30.1 -11% | 33 -22% | 24.4 10% |
| Idle Maximum * (dB) | 31 | 30.9 -0% | 30.1 3% | 36 -16% | 24.4 21% |
| Load Average * (dB) | 49 | 39.5 19% | 46.8 4% | 50 -2% | 49.3 -1% |
| Witcher 3 ultra * (dB) | 49 | 48 2% | 48.4 1% | 48 2% | 54 -10% |
| Load Maximum * (dB) | 51 | 59.4 -16% | 46 10% | 50 2% | 46.6 9% |
* ... daha küçük daha iyidir
Temperature
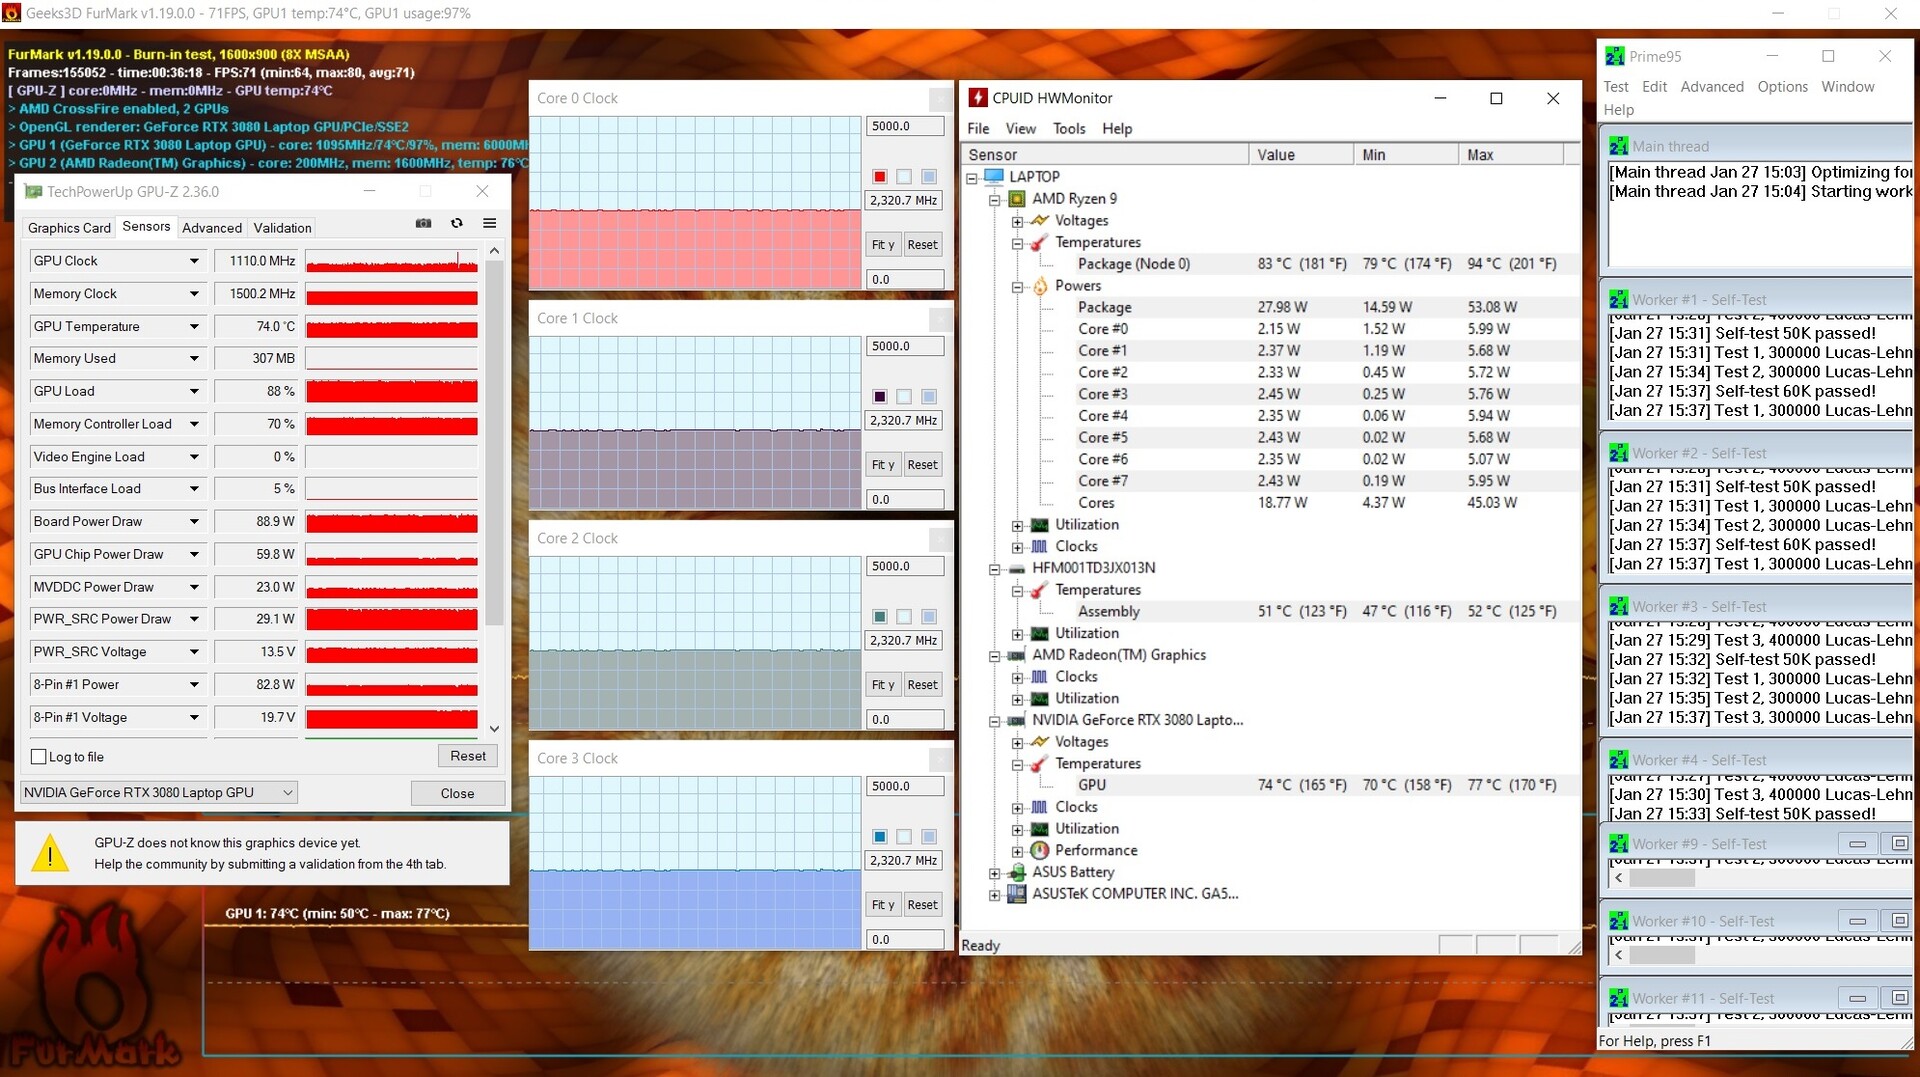
Heat development is a bit worse on the Zephyrus G15 than on its (technically outdated) opponents. In thiss way, we were able to obtain up to 51 °C (~124 °F) on the top and up to 56 °C (~133 °F) on the bottom of the chassis in the stress test with the FurMark and Prime95 tools. The case reaches about 30 °C (~86 °F) in idle usage. Furthermore, the components don't get excessively hot under load. While the GPU reaches just over 70 °C (~158 °F) in 3D applications, the CPU heats up to slightly over 80 °C (~176 °F).
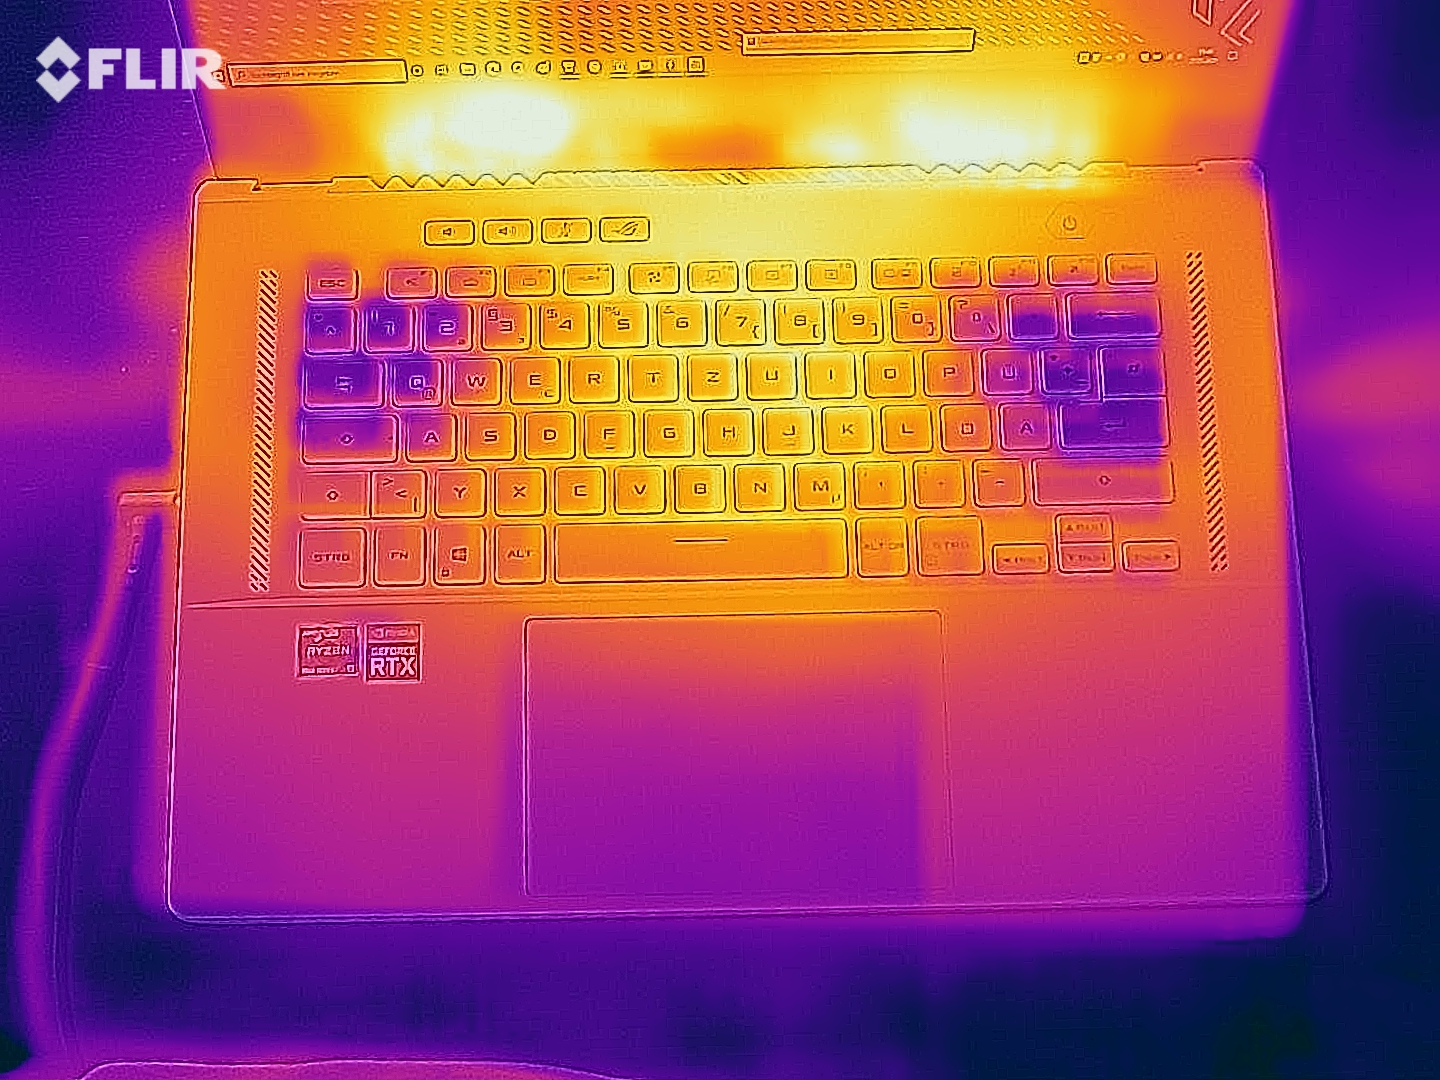
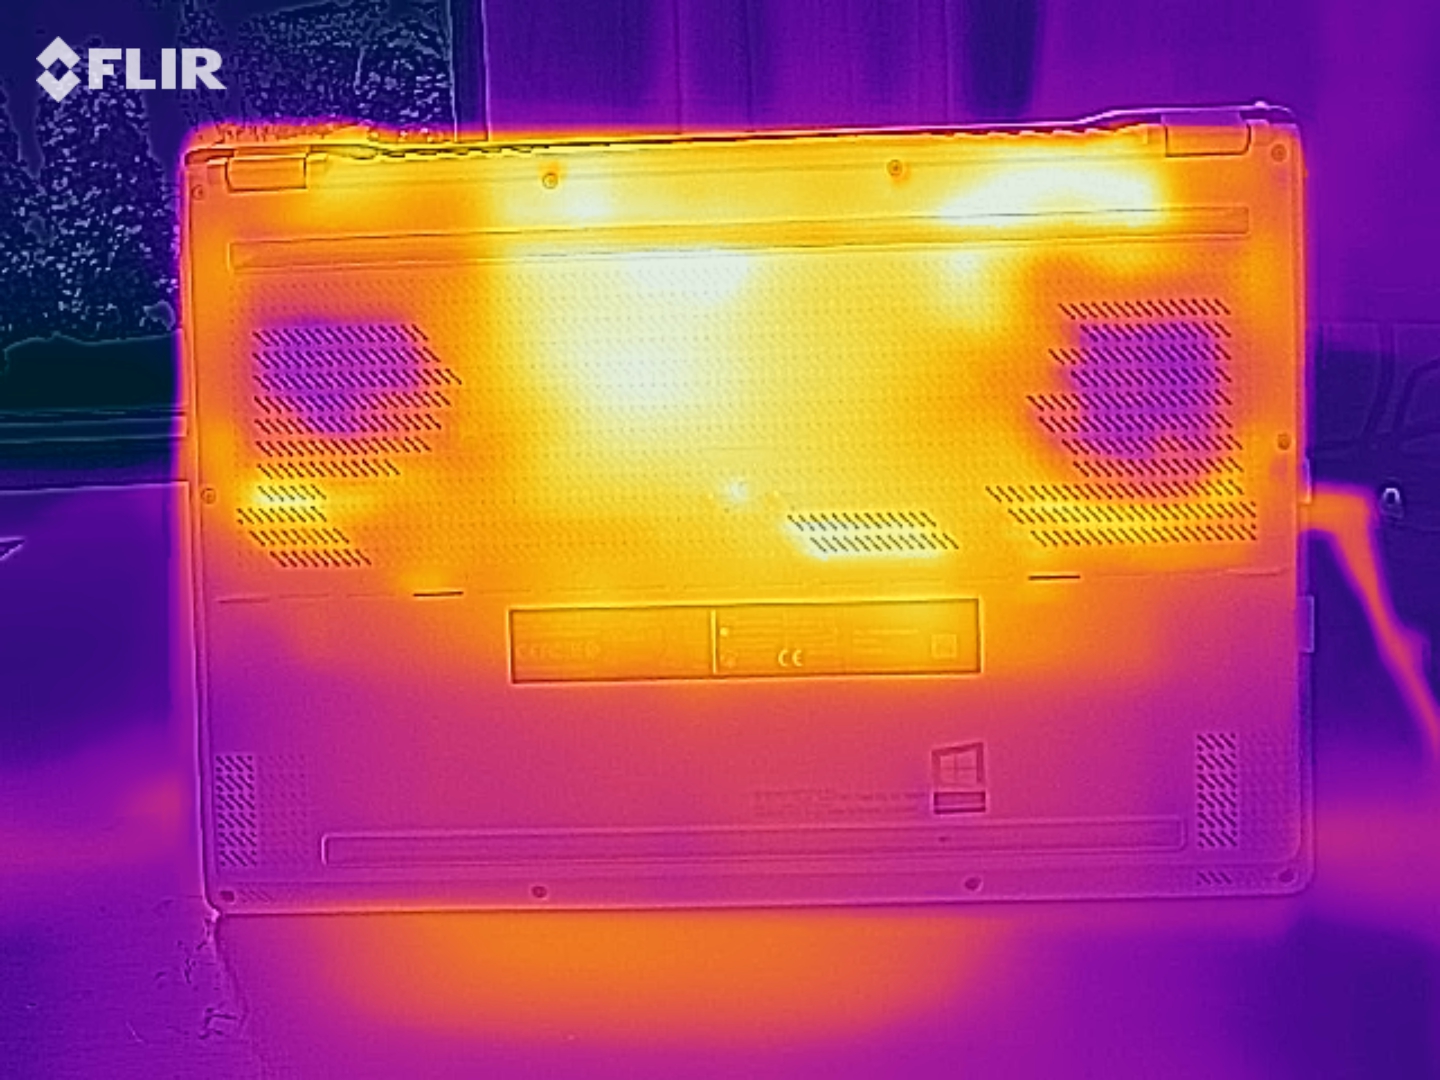
(-) Üst taraftaki maksimum sıcaklık, 40.4 °C / 105 F ortalamasına kıyasla 51 °C / 124 F'dir. , Gaming sınıfı için 21.2 ile 68.8 °C arasında değişir.
(-) Alt kısım, 43.2 °C / 110 F ortalamasına kıyasla maksimum 56 °C / 133 F'ye kadar ısınır
(+) Boşta kullanımda, üst tarafın ortalama sıcaklığı 28.2 °C / 83 F olup, cihazın 33.9 °C / 93 F.
(±) The Witcher 3 oynarken, üst tarafın ortalama sıcaklığı 37.8 °C / 100 F olup, cihazın 33.9 °C / 93 F.
(±) Avuç içi dayanakları ve dokunmatik yüzey maksimum 39 °C / 102.2 F ile dokunulamayacak kadar ısınabilir.
(-) Benzer cihazların avuç içi dayanağı alanının ortalama sıcaklığı 28.8 °C / 83.8 F (-10.2 °C / -18.4 F) idi.
| Asus ROG Zephyrus G15 GA503Q R9 5900HS, GeForce RTX 3080 Laptop GPU | MSI GS66 10SGS i7-10750H, GeForce RTX 2080 Super Max-Q | Razer Blade 15 RTX 2080 Super Max-Q i7-10875H, GeForce RTX 2080 Super Max-Q | Acer Predator Triton 500 PT515-52-70N3 i7-10750H, GeForce RTX 2080 Super Max-Q | Lenovo Legion 7 15IMH05-81YT001VGE i9-10980HK, GeForce RTX 2080 Super Max-Q | |
|---|---|---|---|---|---|
| Heat | 5% | 3% | 9% | 21% | |
| Maximum Upper Side * (°C) | 51 | 47.8 6% | 52 -2% | 44 14% | 35.2 31% |
| Maximum Bottom * (°C) | 56 | 54.4 3% | 53 5% | 50 11% | 32.5 42% |
| Idle Upper Side * (°C) | 29 | 27.4 6% | 29.3 -1% | 29 -0% | 29.4 -1% |
| Idle Bottom * (°C) | 34 | 32 6% | 30.2 11% | 31 9% | 29.6 13% |
* ... daha küçük daha iyidir
Speakers
A big surprise awaits when it comes to the sound system. In contrast to most laptops, which are especially weak in terms of bass, the Zephyrus G15 offers a very balanced and powerful sound - by laptop standards - that outshines the competition. No wonder, since Asus has installed a total of 6 speakers.
Asus ROG Zephyrus G15 GA503Q ses analizi
(±) | hoparlör ses yüksekliği ortalama ama iyi (78 dB)
Bas 100 - 315Hz
(+) | iyi bas - medyandan yalnızca 4% uzakta
(+) | bas doğrusaldır (6.5% delta ile önceki frekans)
Ortalar 400 - 2000 Hz
(+) | dengeli ortalar - medyandan yalnızca 4.5% uzakta
(+) | orta frekanslar doğrusaldır (2.1% deltadan önceki frekansa)
Yüksekler 2 - 16 kHz
(+) | dengeli yüksekler - medyandan yalnızca 3.5% uzakta
(+) | yüksekler doğrusaldır (5.7% deltadan önceki frekansa)
Toplam 100 - 16.000 Hz
(+) | genel ses doğrusaldır (11.2% ortancaya göre fark)
Aynı sınıfla karşılaştırıldığında
» Bu sınıftaki tüm test edilen cihazların %8%'si daha iyi, 4% benzer, 88% daha kötüydü
» En iyisinin deltası 6% idi, ortalama 18% idi, en kötüsü 132% idi
Test edilen tüm cihazlarla karşılaştırıldığında
» Test edilen tüm cihazların %7'si daha iyi, 2 benzer, % 91 daha kötüydü
» En iyisinin deltası 4% idi, ortalama 24% idi, en kötüsü 134% idi
Apple MacBook 12 (Early 2016) 1.1 GHz ses analizi
(+) | hoparlörler nispeten yüksek sesle çalabilir (83.6 dB)
Bas 100 - 315Hz
(±) | azaltılmış bas - ortalama olarak medyandan 11.3% daha düşük
(±) | Bas doğrusallığı ortalamadır (14.2% delta - önceki frekans)
Ortalar 400 - 2000 Hz
(+) | dengeli ortalar - medyandan yalnızca 2.4% uzakta
(+) | orta frekanslar doğrusaldır (5.5% deltadan önceki frekansa)
Yüksekler 2 - 16 kHz
(+) | dengeli yüksekler - medyandan yalnızca 2% uzakta
(+) | yüksekler doğrusaldır (4.5% deltadan önceki frekansa)
Toplam 100 - 16.000 Hz
(+) | genel ses doğrusaldır (10.2% ortancaya göre fark)
Aynı sınıfla karşılaştırıldığında
» Bu sınıftaki tüm test edilen cihazların %7%'si daha iyi, 2% benzer, 91% daha kötüydü
» En iyisinin deltası 5% idi, ortalama 18% idi, en kötüsü 53% idi
Test edilen tüm cihazlarla karşılaştırıldığında
» Test edilen tüm cihazların %5'si daha iyi, 1 benzer, % 94 daha kötüydü
» En iyisinin deltası 4% idi, ortalama 24% idi, en kötüsü 134% idi
Energy management
Energy consumption
The built-in graphics switching solution (Nvidia Optimus) leads to moderate energy consumption in idle usage. 10 to 17 watts could also come from a much weaker multimedia laptop. Under load, our measuring device displayed between 108 and 182 watts, which is also acceptable in view of the performance offered - especially when you consider the competition.
| Kapalı / Bekleme modu | |
| Boşta | |
| Çalışırken |
|
Key:
min: | |
| Asus ROG Zephyrus G15 GA503Q R9 5900HS, GeForce RTX 3080 Laptop GPU | MSI GS66 10SGS i7-10750H, GeForce RTX 2080 Super Max-Q | Razer Blade 15 RTX 2080 Super Max-Q i7-10875H, GeForce RTX 2080 Super Max-Q | Acer Predator Triton 500 PT515-52-70N3 i7-10750H, GeForce RTX 2080 Super Max-Q | Lenovo Legion 7 15IMH05-81YT001VGE i9-10980HK, GeForce RTX 2080 Super Max-Q | |
|---|---|---|---|---|---|
| Power Consumption | -32% | -7% | -17% | -8% | |
| Idle Minimum * (Watt) | 10 | 14.9 -49% | 10.6 -6% | 11 -10% | 9 10% |
| Idle Average * (Watt) | 12 | 17.5 -46% | 13.1 -9% | 15 -25% | 12.6 -5% |
| Idle Maximum * (Watt) | 17 | 29.5 -74% | 15.8 7% | 25 -47% | 17 -0% |
| Load Average * (Watt) | 108 | 94.8 12% | 131 -21% | 95 12% | 115 -6% |
| Witcher 3 ultra * (Watt) | 123 | 146.1 -19% | 146 -19% | 140 -14% | 159 -29% |
| Load Maximum * (Watt) | 182 | 210.9 -16% | 169 7% | 211 -16% | 216 -19% |
* ... daha küçük daha iyidir
Battery life
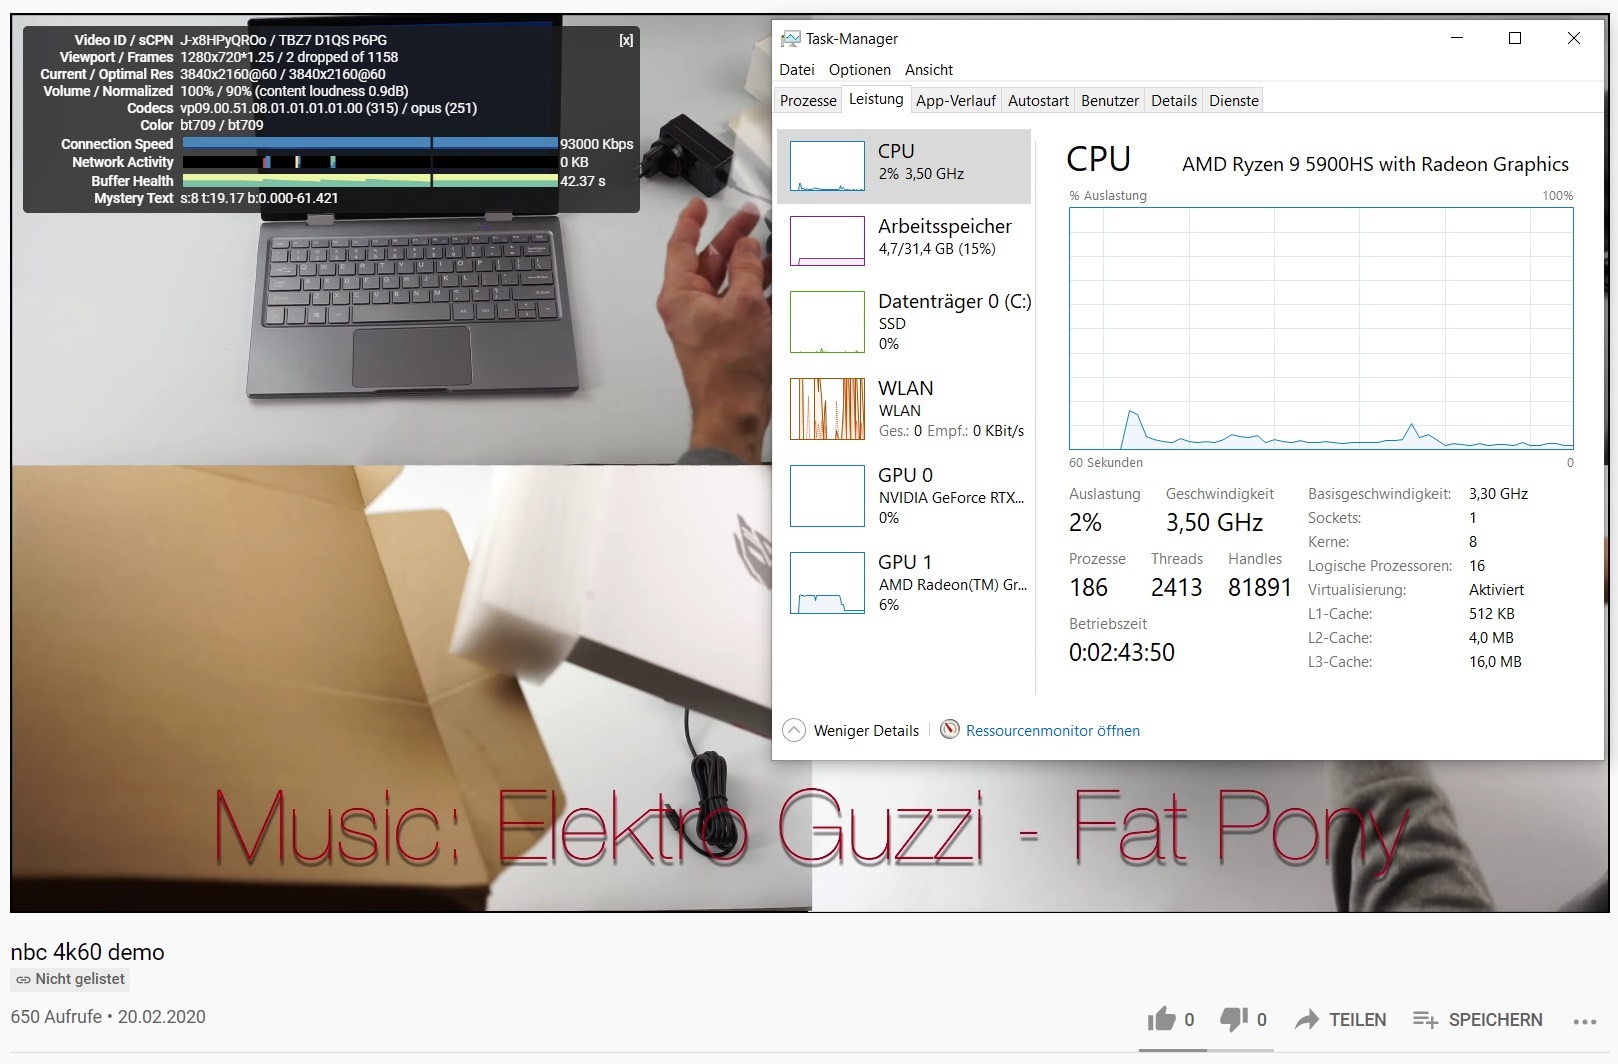
Asus impressively proves that gaming laptops with long battery life are no longer wishful thinking. A maximum of 12 hours of idle usage at minimum brightness is just as remarkable as a good 9.5 hours of Internet surfing over WLAN (brightness reduced to 150 cd/m²). With these rates, the Zephyrus G15 sprints past all its rivals. However, 3D performance also drops massively without a power adapter as our test with The Witcher 3 showed (over 90% less FPS).
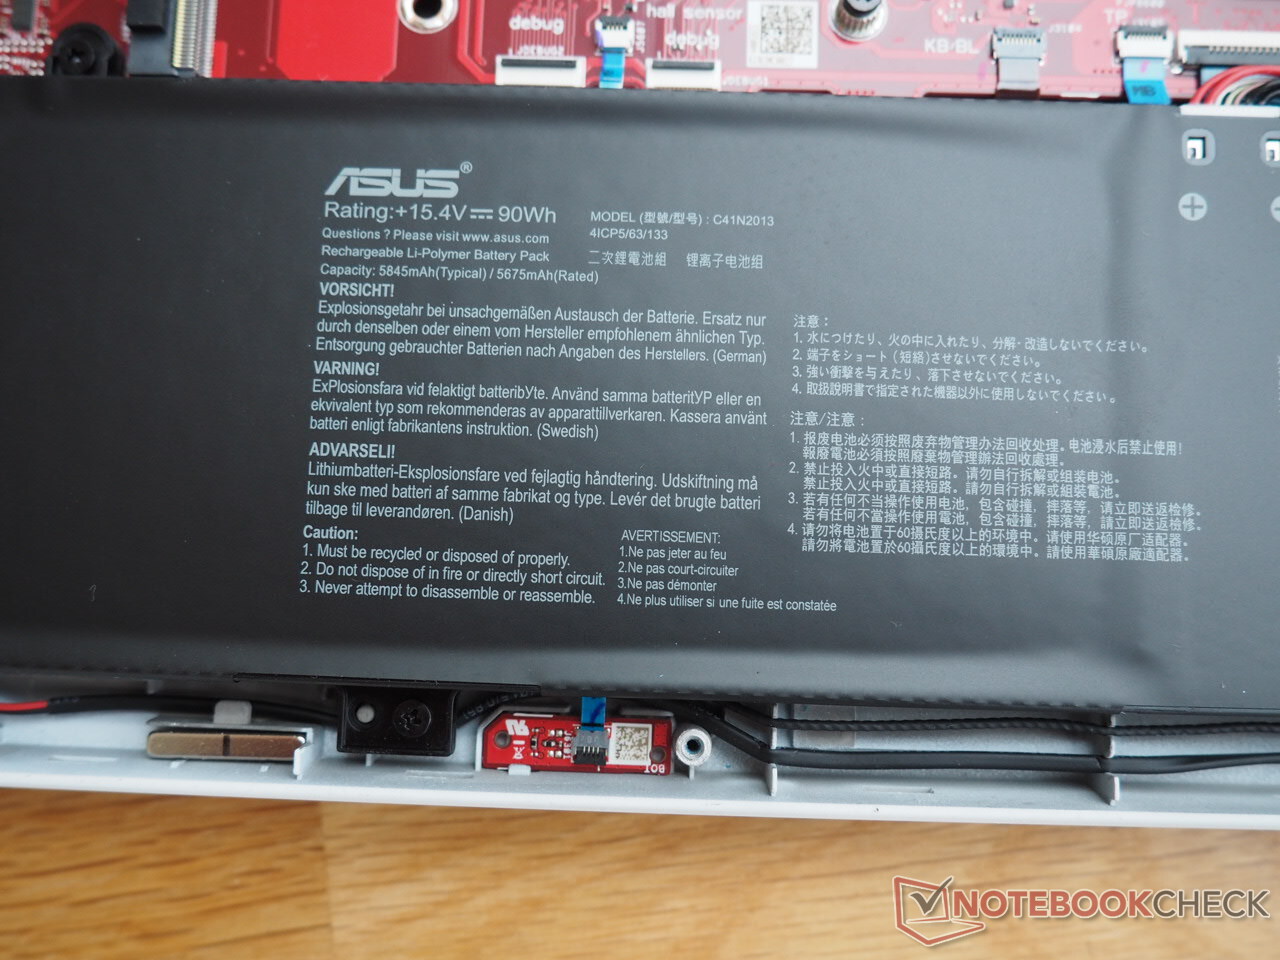
| Asus ROG Zephyrus G15 GA503Q R9 5900HS, GeForce RTX 3080 Laptop GPU, 90 Wh | MSI GS66 10SGS i7-10750H, GeForce RTX 2080 Super Max-Q, 99.99 Wh | Razer Blade 15 RTX 2080 Super Max-Q i7-10875H, GeForce RTX 2080 Super Max-Q, 80 Wh | Acer Predator Triton 500 PT515-52-70N3 i7-10750H, GeForce RTX 2080 Super Max-Q, 84 Wh | Lenovo Legion 7 15IMH05-81YT001VGE i9-10980HK, GeForce RTX 2080 Super Max-Q, 80 Wh | |
|---|---|---|---|---|---|
| Pil Çalışma Süresi | -12% | -12% | -26% | -36% | |
| Reader / Idle (h) | 12.1 | 10.2 -16% | 8.7 -28% | 8.3 -31% | |
| WiFi v1.3 (h) | 9.4 | 6.9 -27% | 6.1 -35% | 6.3 -33% | 3.4 -64% |
| Load (h) | 1.5 | 1.6 7% | 1.9 27% | 1.3 -13% | 1.4 -7% |
| H.264 (h) | 7.3 | 1.5 |
Artılar
Eksiler
Verdict
As long as you're aware of the fact that the GeForce RTX 3080 laptop version can only unfold its potential to a limited extent due to Asus's low TDP setting and that it can be slower than a fast RTX 3070 laptop, the ROG Zephyrus G15 GA503Q cuts a fine figure.
One of the biggest highlights turns out to be the WQHD panel, since it attracts customers with 165 Hz, relatively fast response times, FreeSync, and good color-space coverage.
Other selling points are the surprisingly rich sound, the long battery life, and the sleek design. In terms of looks, the white edition stands out nicely from the competition.
We didn't like the noise level in 3D mode and the keyboard layout as much. The fact that Asus omits a webcam and solders part of the RAM is also annoying.
Price and availability
You will soon be able to purchase our test configuration directly from the manufacturer at a price of $2,499.99. You will also be able to find an RTX 3070 version with 16 GB of RAM in the Eclipse Gray color variant on BestBuy for $1,799.99.
Asus ROG Zephyrus G15 GA503Q
- 01/31/2021 v7 (old)
Florian Glaser
Price comparison

