MSI GS66 Stealth 10SGS Laptop incelemesi: Core i7 mi yoksa Core i9 mu?
Tüm seri için bir fikir edinmek için sadece birden fazla yapılandırma gerekir. Core i9-10980HK CPU ve GeForce RTX 2070 Super Max-Q GPU ile MSI GS66 10SFS'yi kontrol ettikten sonra, şimdi Core i7-10750H ve GeForce RTX 2080 Super Max ile yapılandırılmış GS66 10SGS ile başa çıkmaya hazırız Q yerine. Kullanıcılar iki SKU arasında ne gibi farklılıklar bekleyebilir ve biri diğerinden daha tavsiye edilebilir mi? Aşağıda test edilen konfigürasyon Xotic PC'de 2700 $ USD karşılığında bulunabilir. GS66 doğrudan GS65'i başarıyor ve Razer Blade 15, Asus Zephyrus S GX531, Dell Alienware m15 R2, Gigabyte Aorus serisi, Lenovo Legion Y740-15 ve Acer Predator gibi diğer üst düzey ultra ince oyun dizüstü bilgisayarlarıyla doğrudan rekabet ediyor Triton.Daha fazla MSI incelemesi: MSI GT76MSI GS65MSI GP65MSI GE65MSI GL65
Derecelendirme | Tarih | Modeli | Ağırlık | Yükseklik | Boyut | Çözünürlük | Fiyat |
|---|---|---|---|---|---|---|---|
| 84 % v7 (old) | 06/2020 | MSI GS66 10SGS i7-10750H, GeForce RTX 2080 Super Max-Q | 2.2 kg | 20 mm | 15.60" | 1920x1080 | |
| 81.3 % v7 (old) | 05/2019 | Asus Zephyrus S GX502GW i7-9750H, GeForce RTX 2070 Mobile | 2.1 kg | 19 mm | 15.60" | 1920x1080 | |
| 88.8 % v6 (old) | 04/2019 | Razer Blade 15 RTX 2080 Max-Q i7-9750H, GeForce RTX 2080 Max-Q | 2.2 kg | 17.8 mm | 15.60" | 1920x1080 | |
| 84.8 % v7 (old) | 10/2019 | Lenovo Legion Y740-15ICHg i7-9750H, GeForce RTX 2070 Max-Q | 2.3 kg | 25 mm | 15.60" | 1920x1080 | |
| 83.3 % v7 (old) | Schenker XMG Pro 15 i7-9750H, GeForce RTX 2070 Mobile | 2.5 kg | 30 mm | 15.60" | 1920x1080 |
Durum
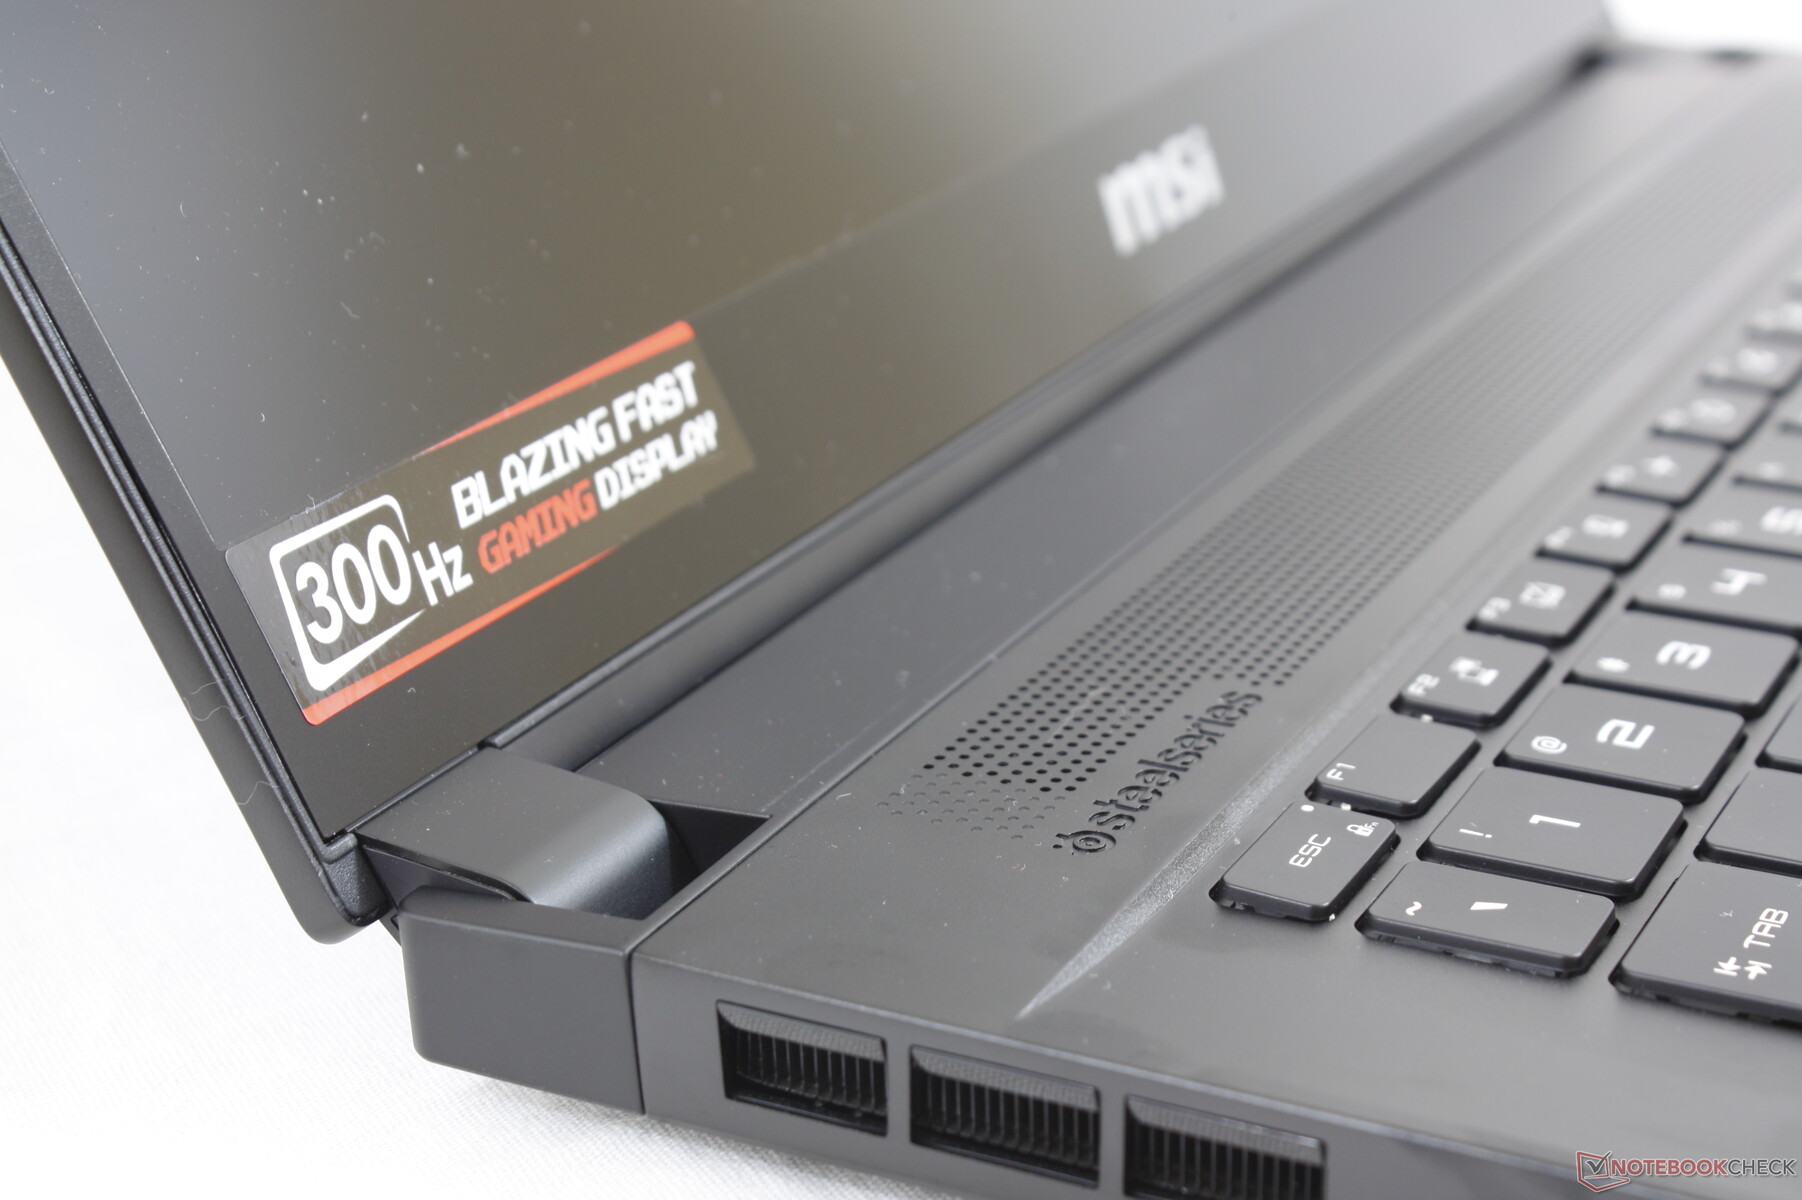
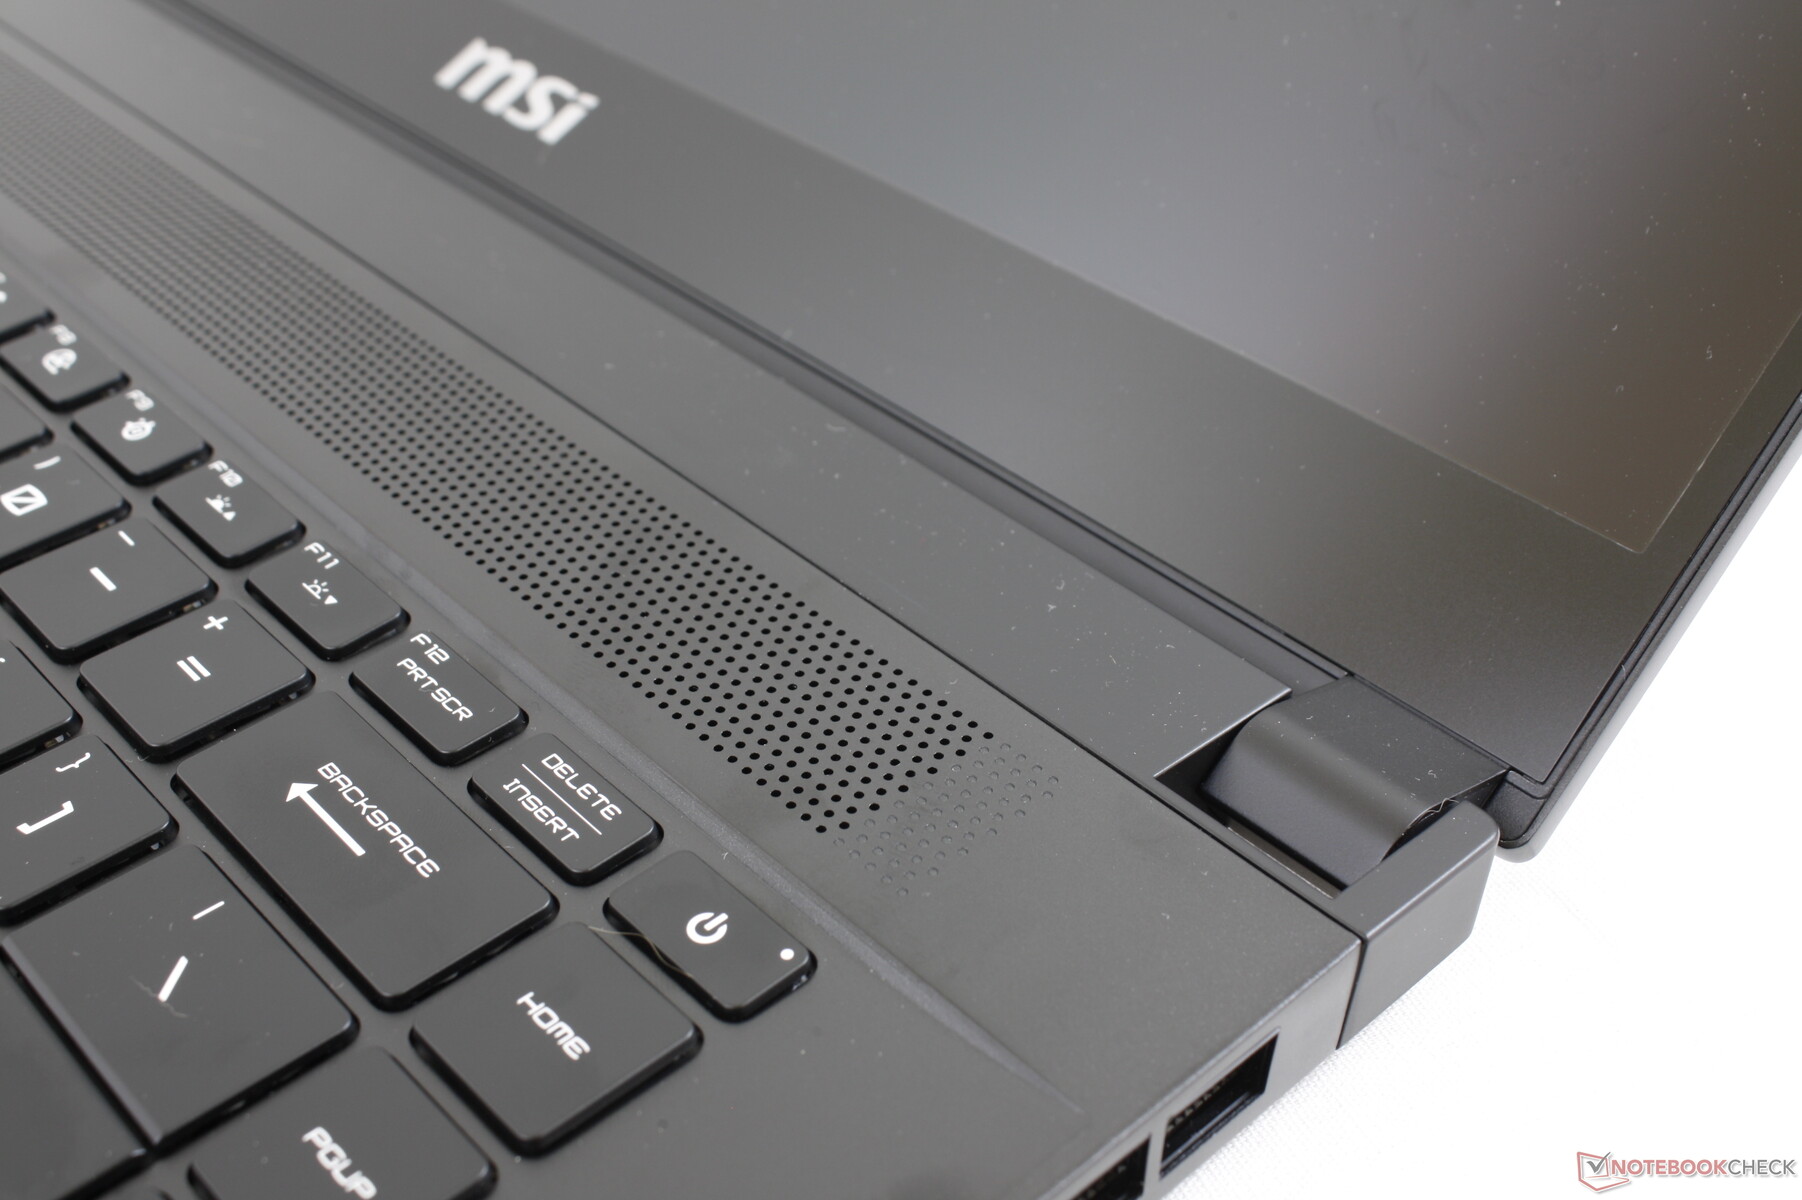
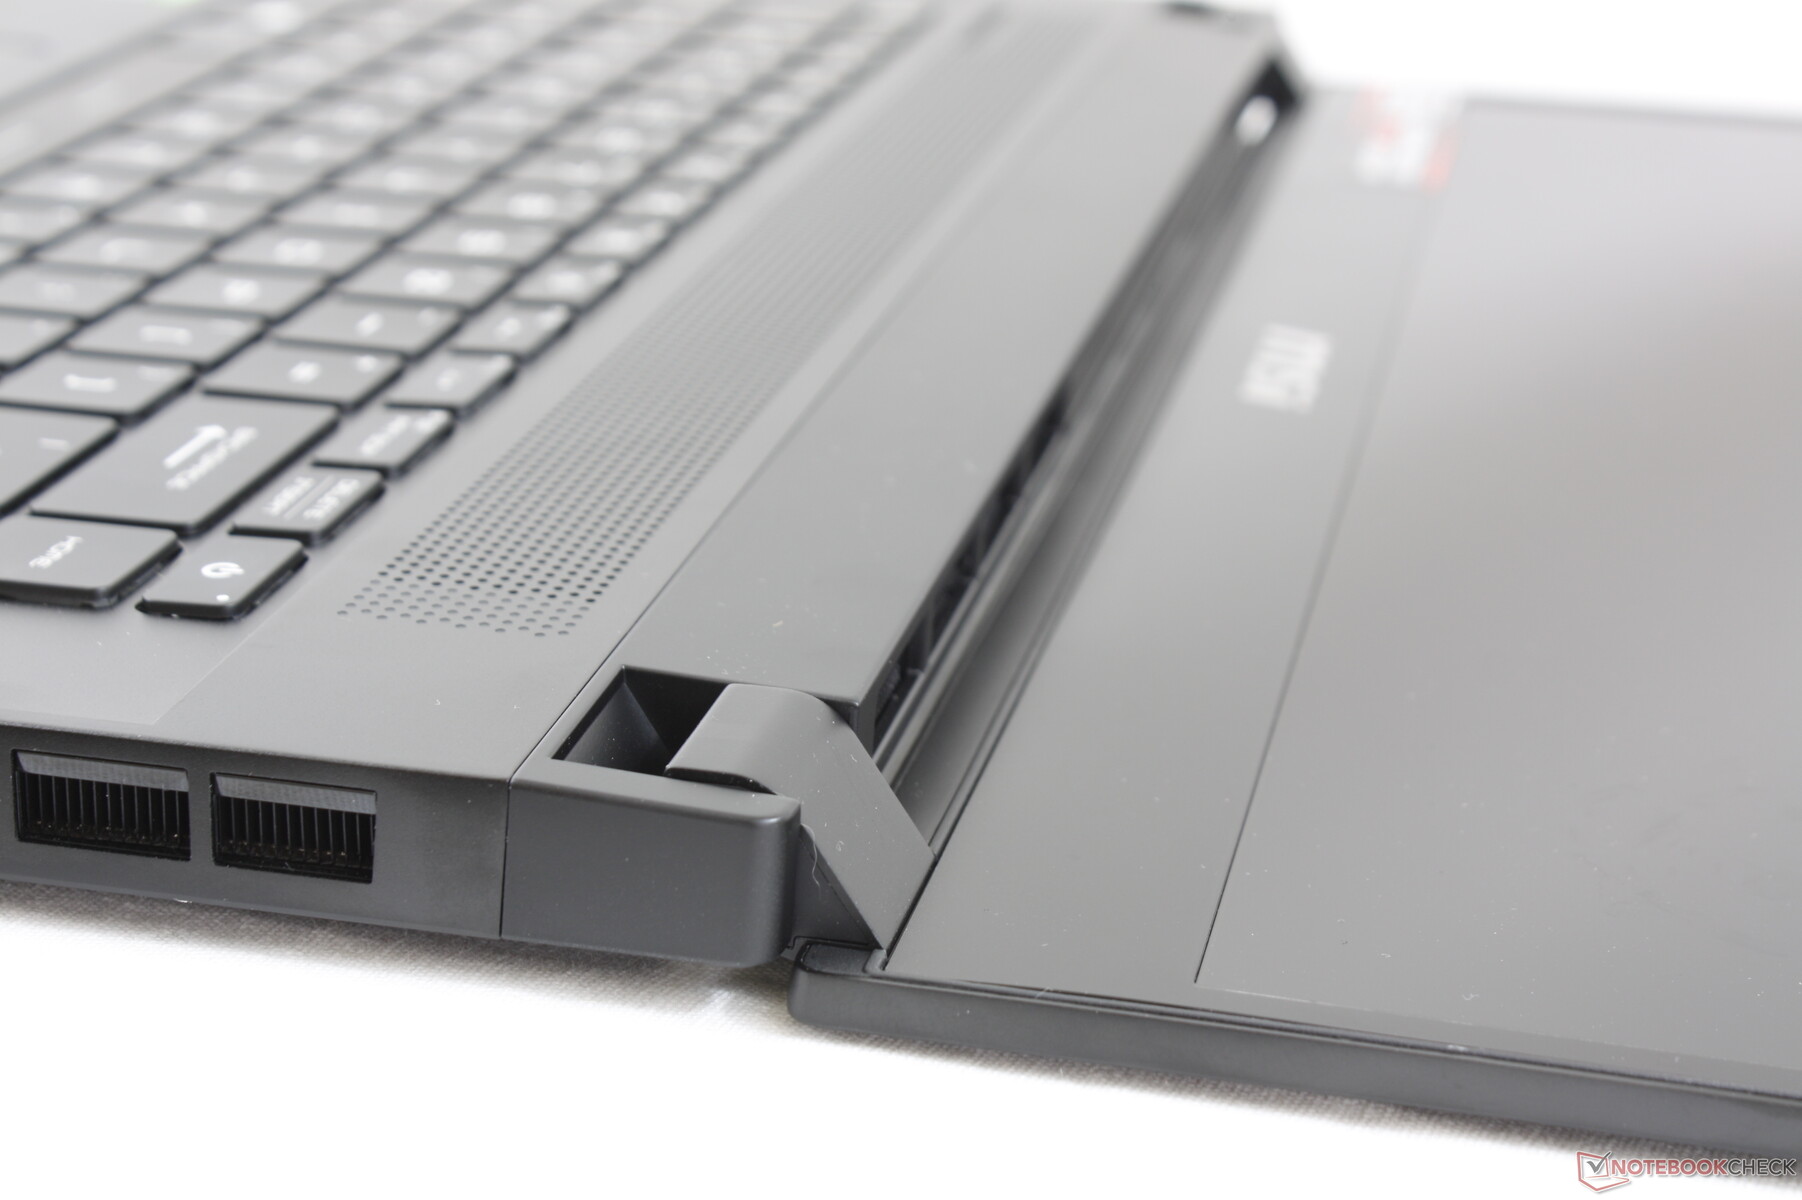
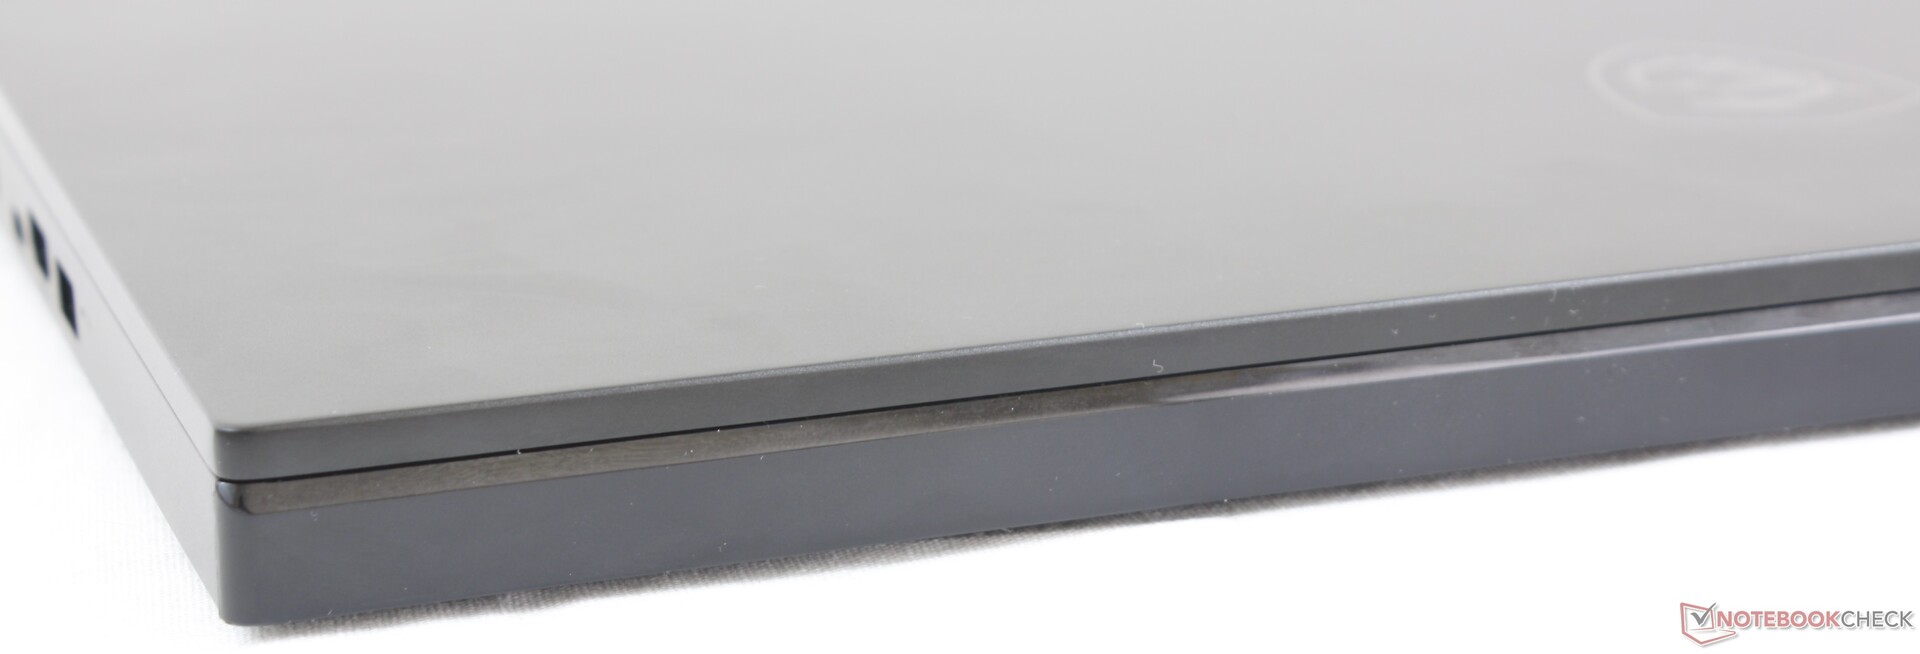
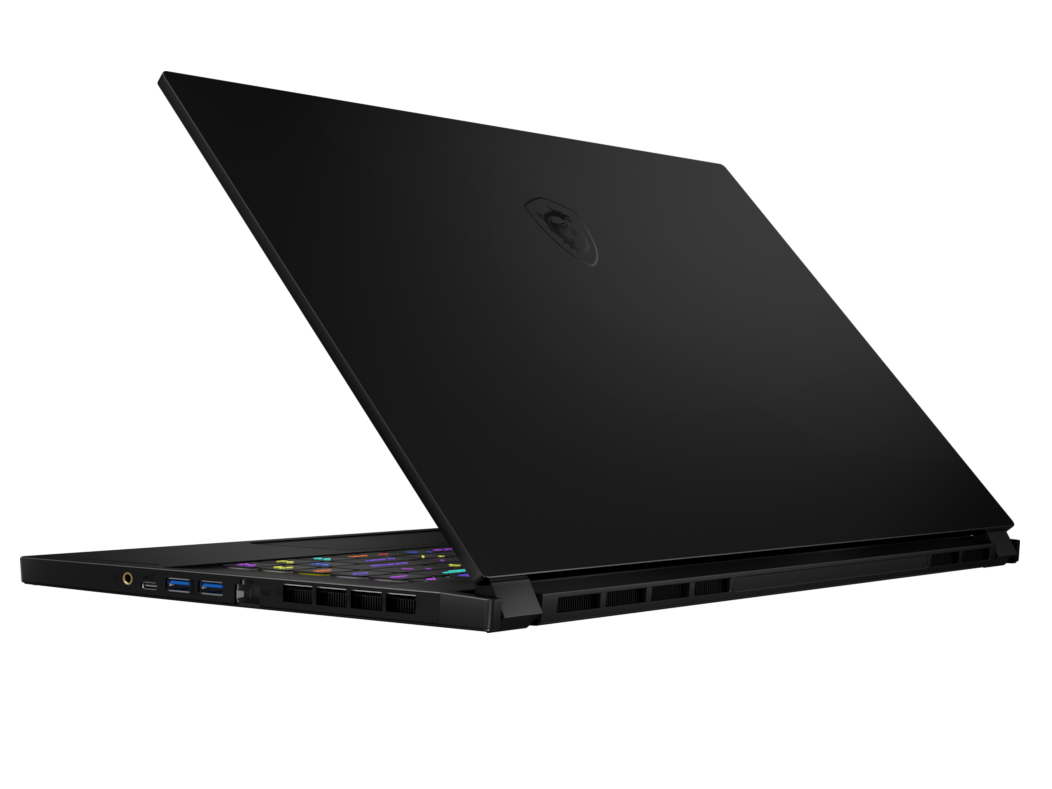
GS65'in ana eleştirilerinden biri, Razer Blade 15 gibi daha sağlam ve daha sert alternatiflere kıyasla esnek yapısıydı. GS66, şasinin daha sıkı ve daha az bükülme olasılığını elden geçirerek bunu ele alıyor. Kesinlikle GS65 üzerinde en büyük ve en göze çarpan gelişmelerden biri.Yeni metal tasarımının hala birkaç dezavantajı var. İlk olarak, şasi hala köşelerinden bükülürken Razer'dan biraz daha fazla bükülüyor ve kırılıyor. İkincisi, zarif siyah tavrına rağmen yekpare bir iskelet değil; örneğin ön kenar ve arka, ayrı parçalardan yapılmıştır, bu da malzemeler arasında eşit olmayan boşluklar ve yarıklar için yer olduğu anlamına gelir.
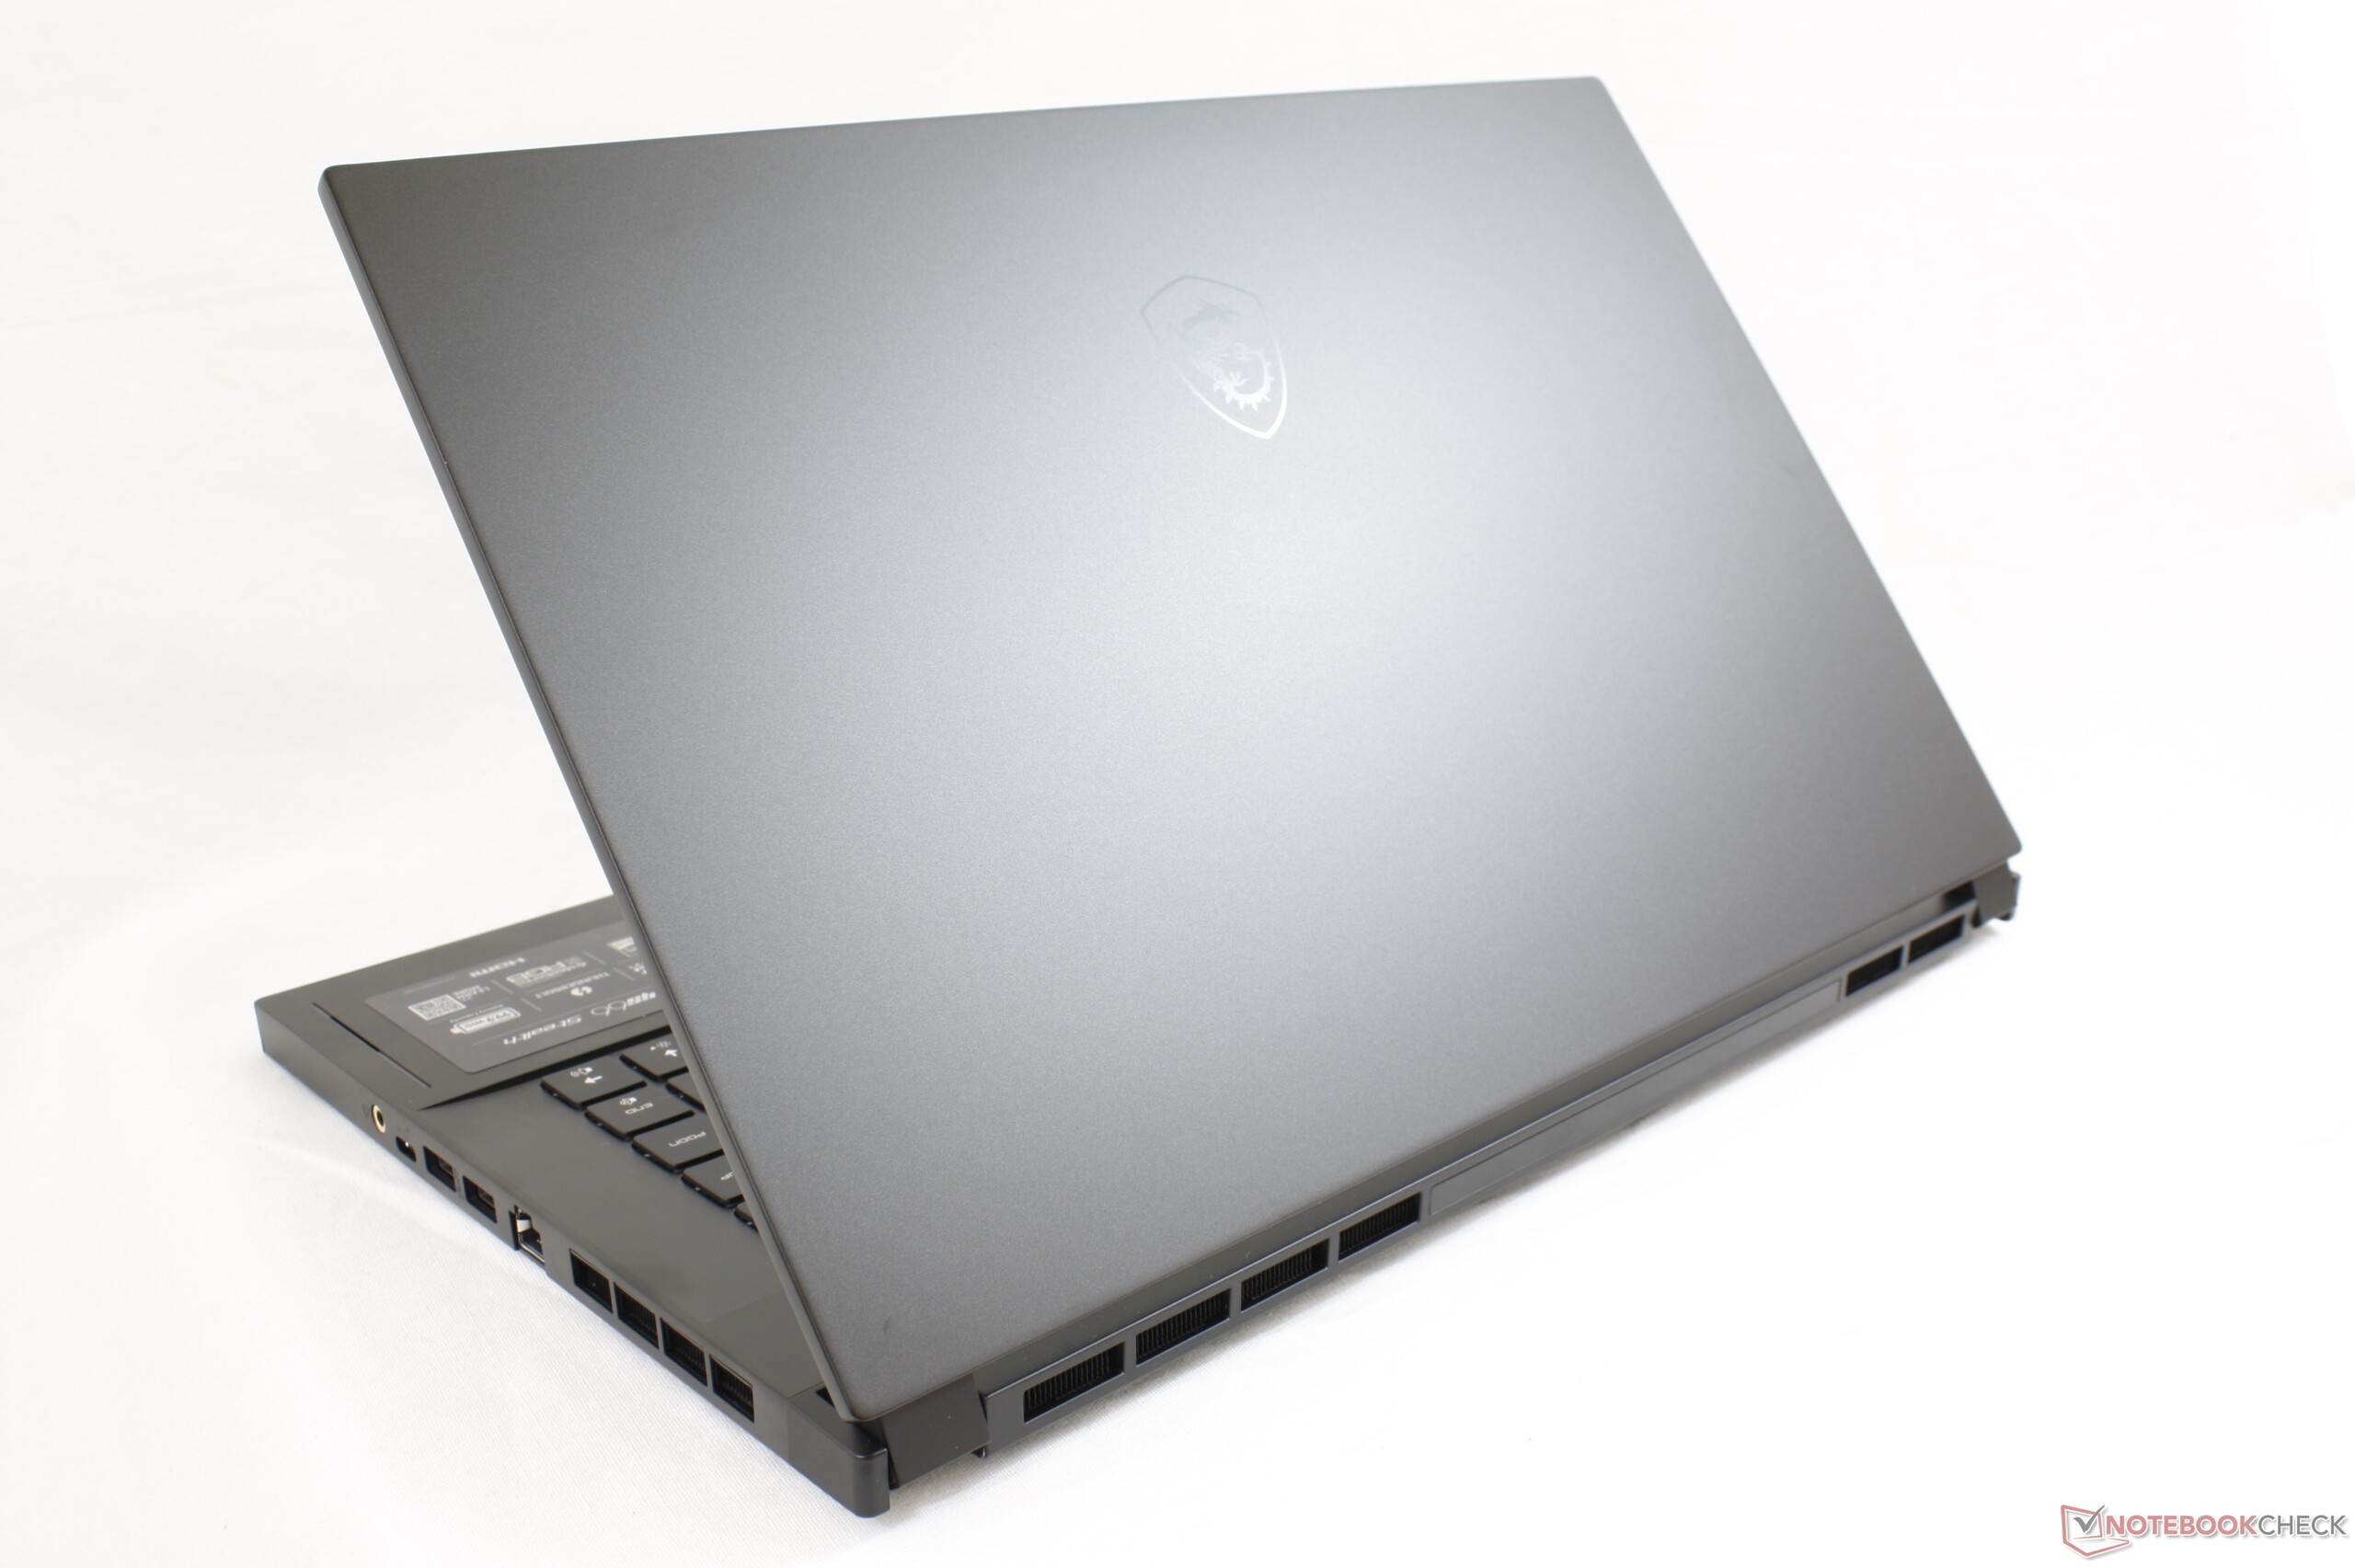
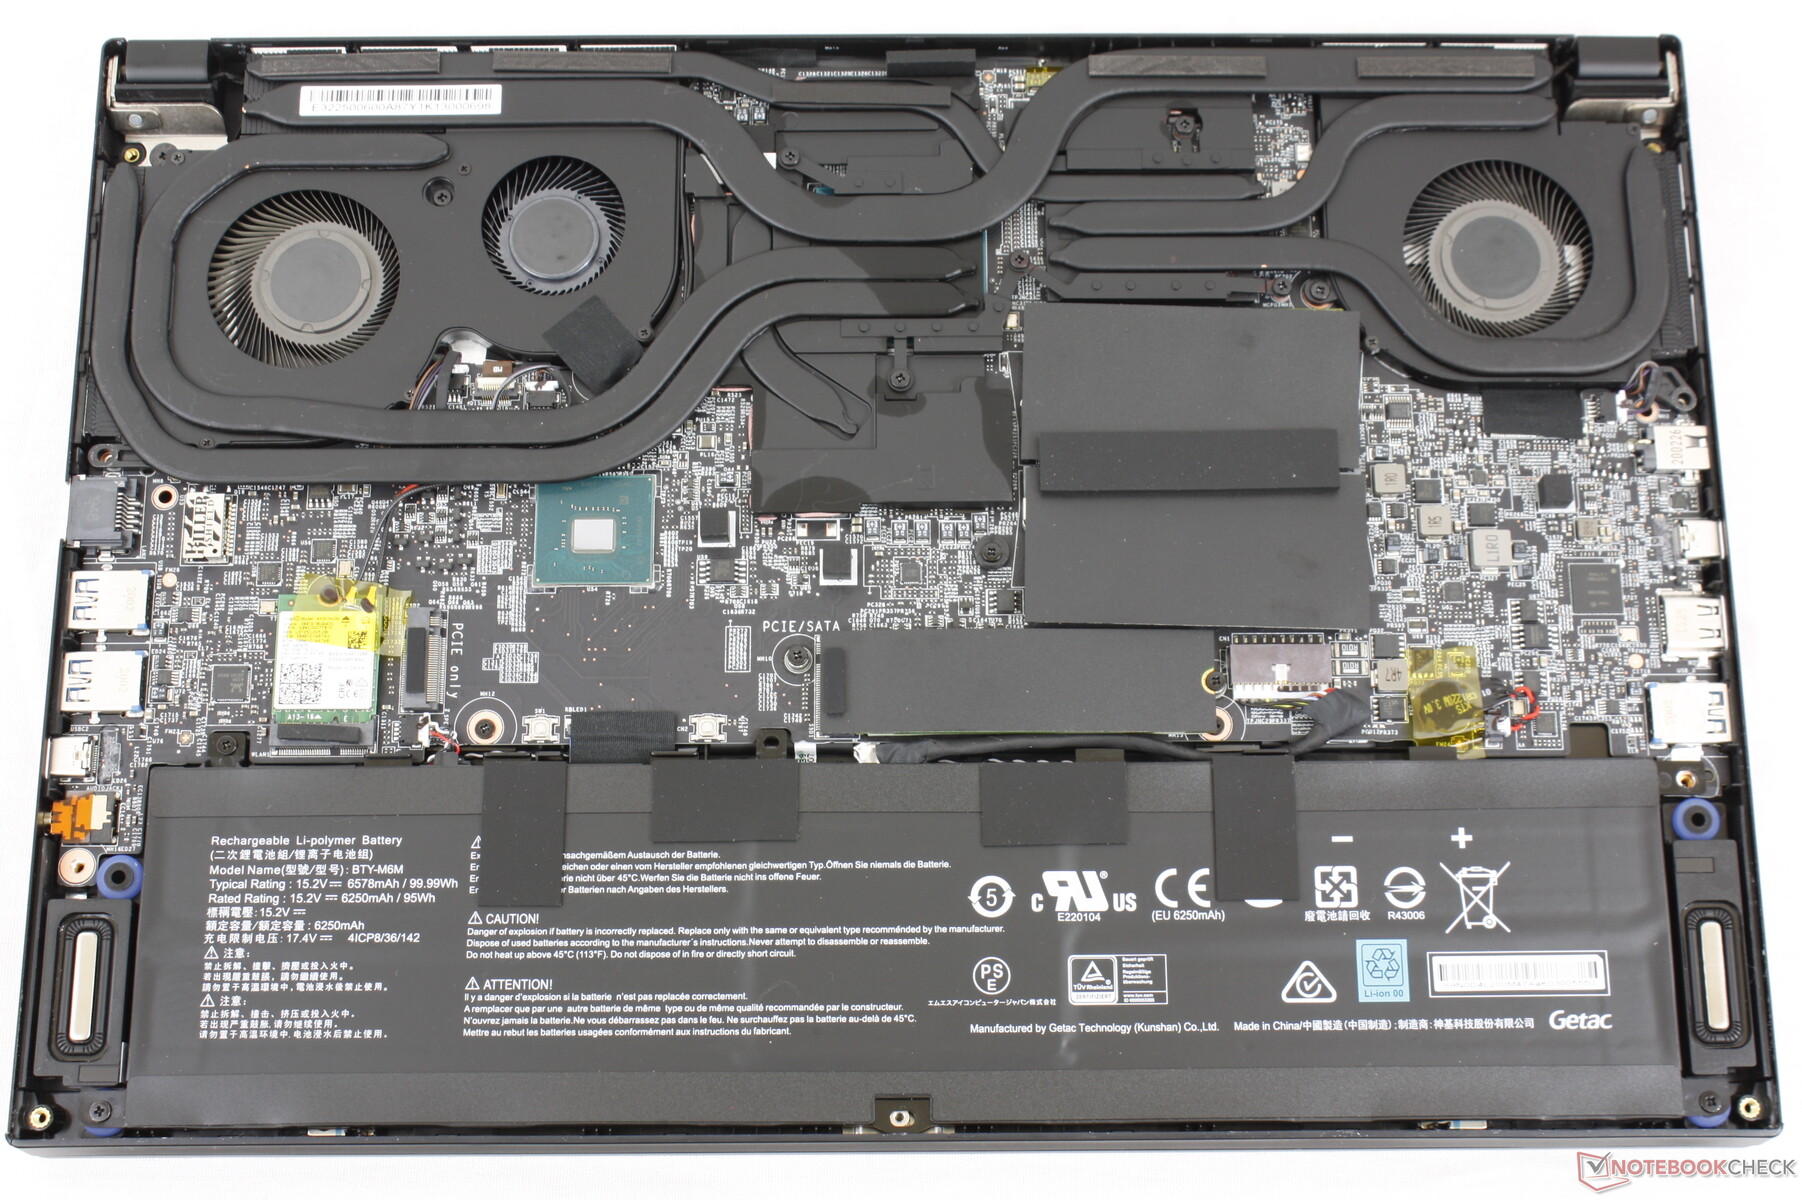
Şasiyi güçlendirmek ve daha büyük bir pil eklemek için MSI, eski GS65 tasarımına göre hem kalınlığı hem de ağırlığı sırasıyla yaklaşık 2 mm ve 200 g arttırmak zorunda kaldı. MSI, GS65 ile piyasadaki en hafif 15,6 inç oyun dizüstü bilgisayarlarından birine sahipti ve bu nedenle yeni modelin belirgin şekilde daha ağır olması biraz rahatsız edici. Bununla birlikte, sistem öncekinden daha iyi ve daha uzun ömürlü hissettiği için hareket muhtemelen en iyisidir.
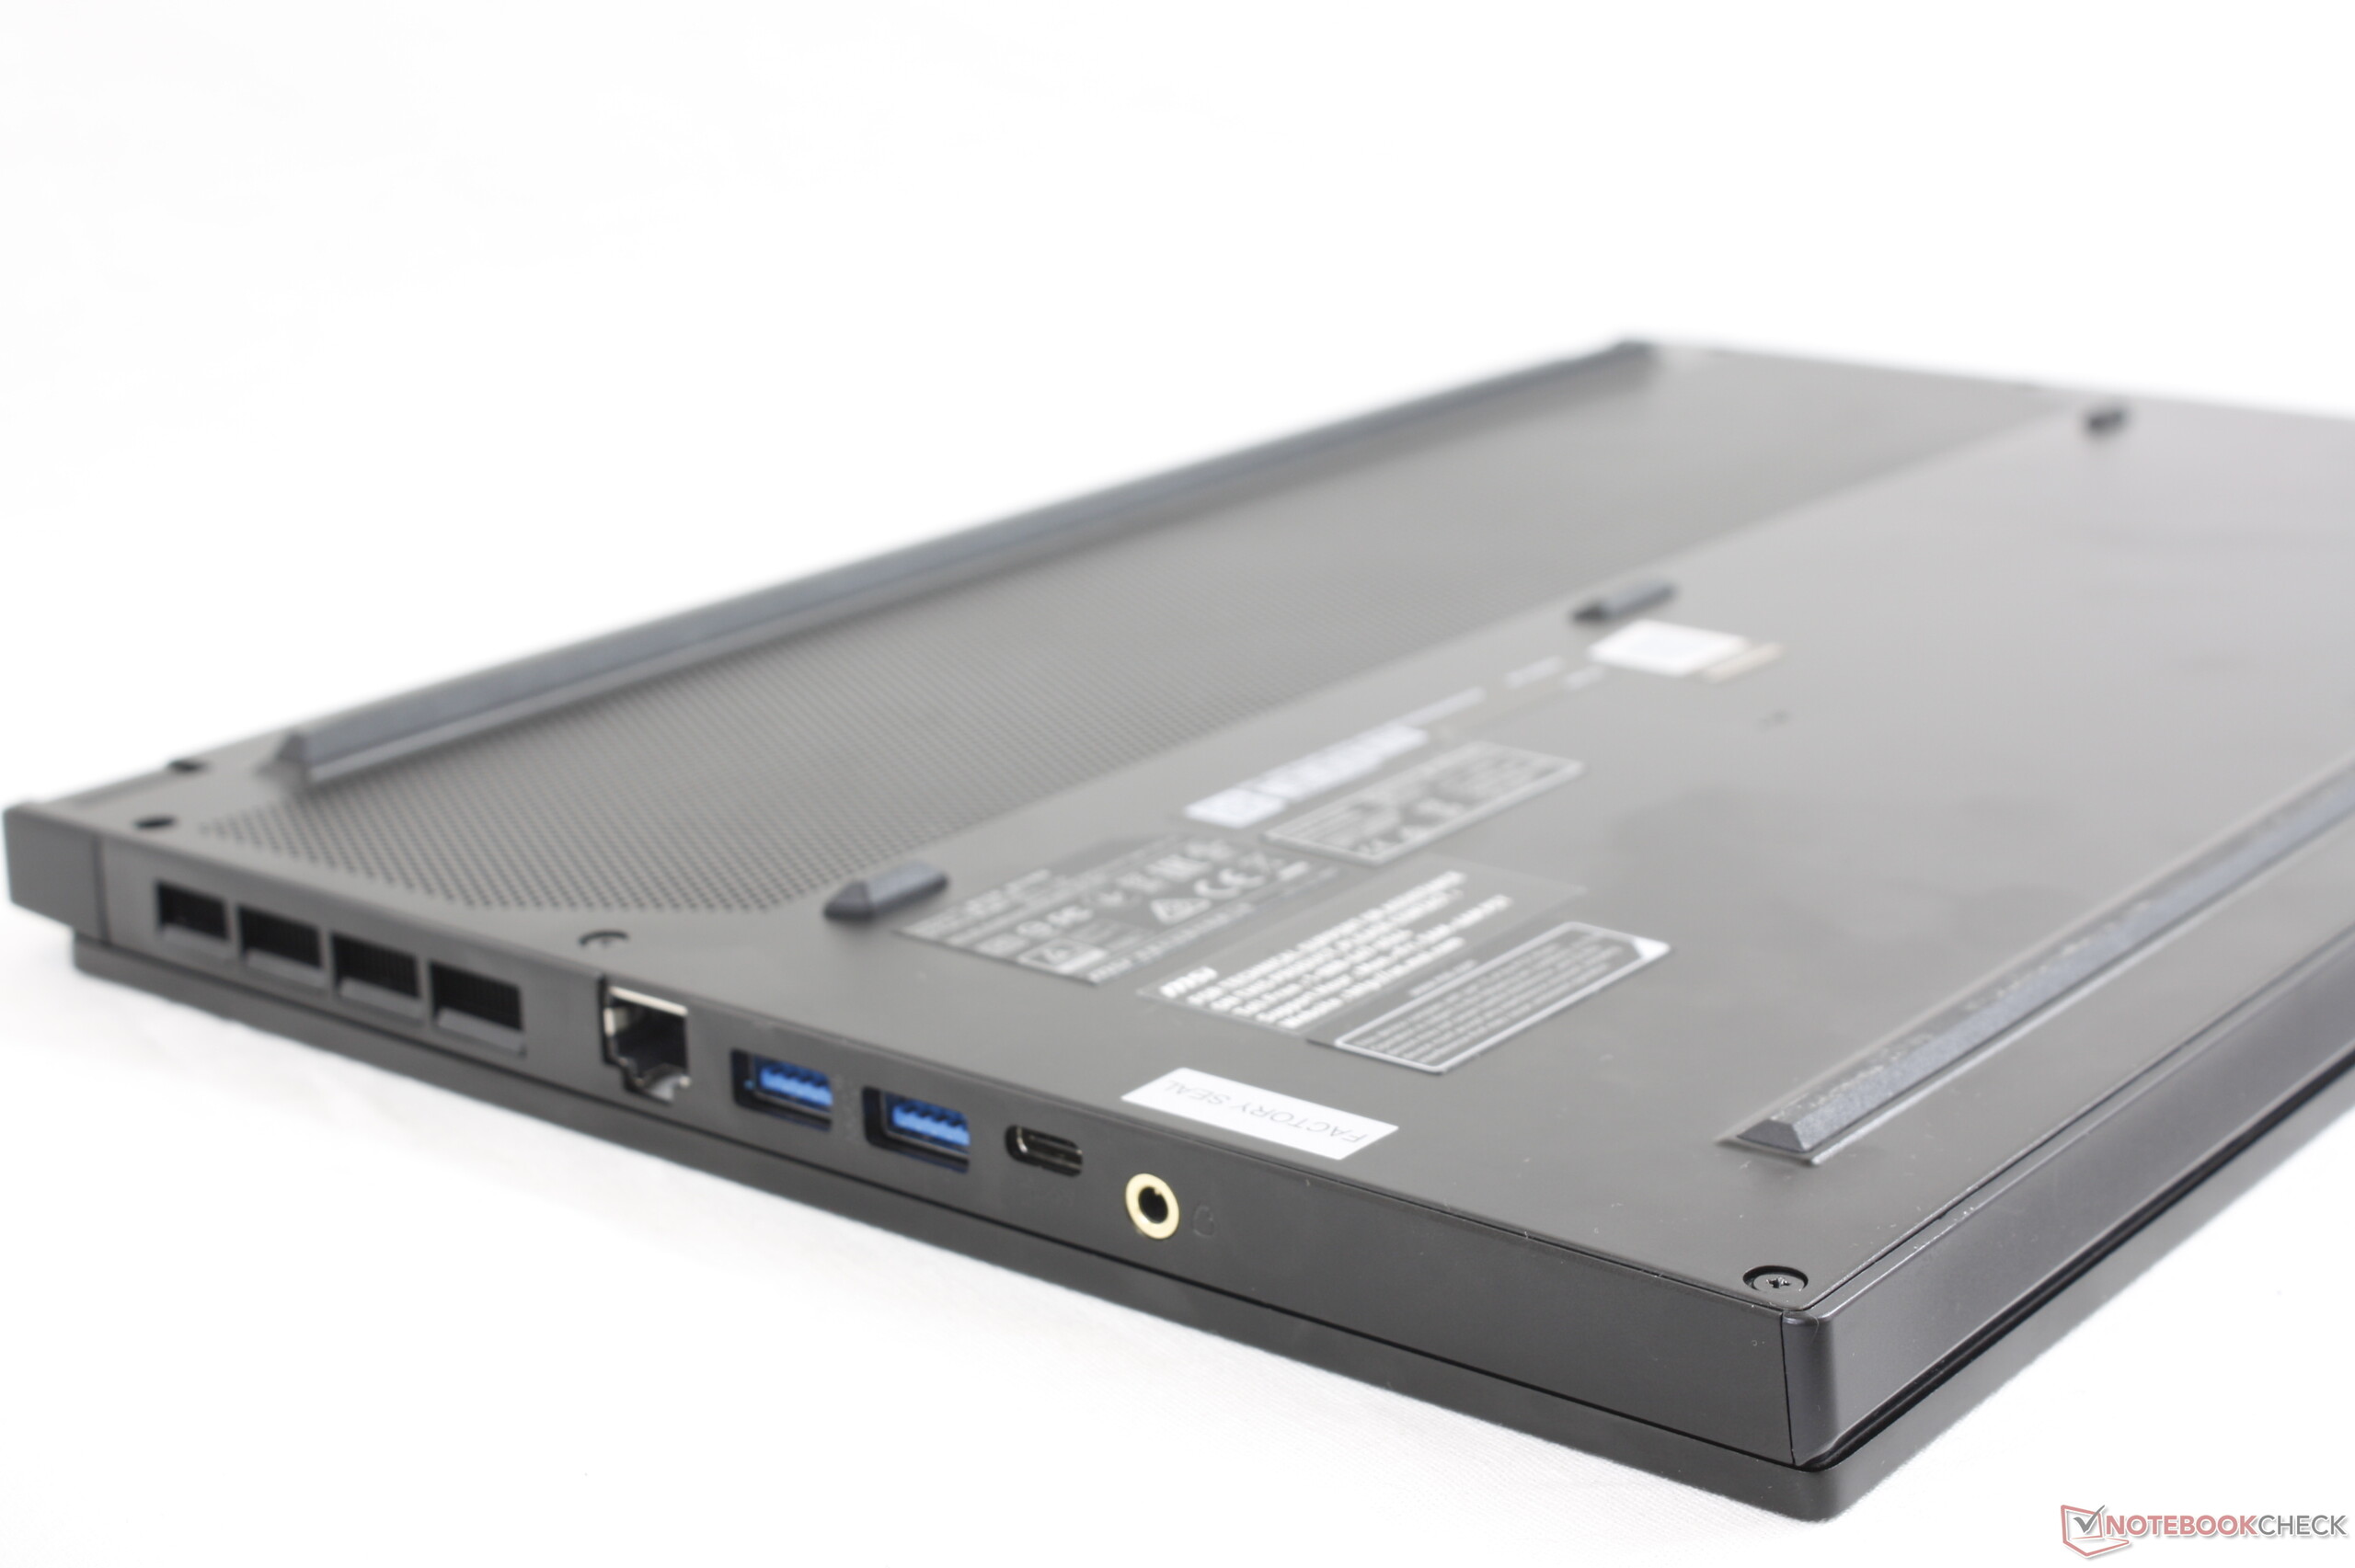
Bağlantı
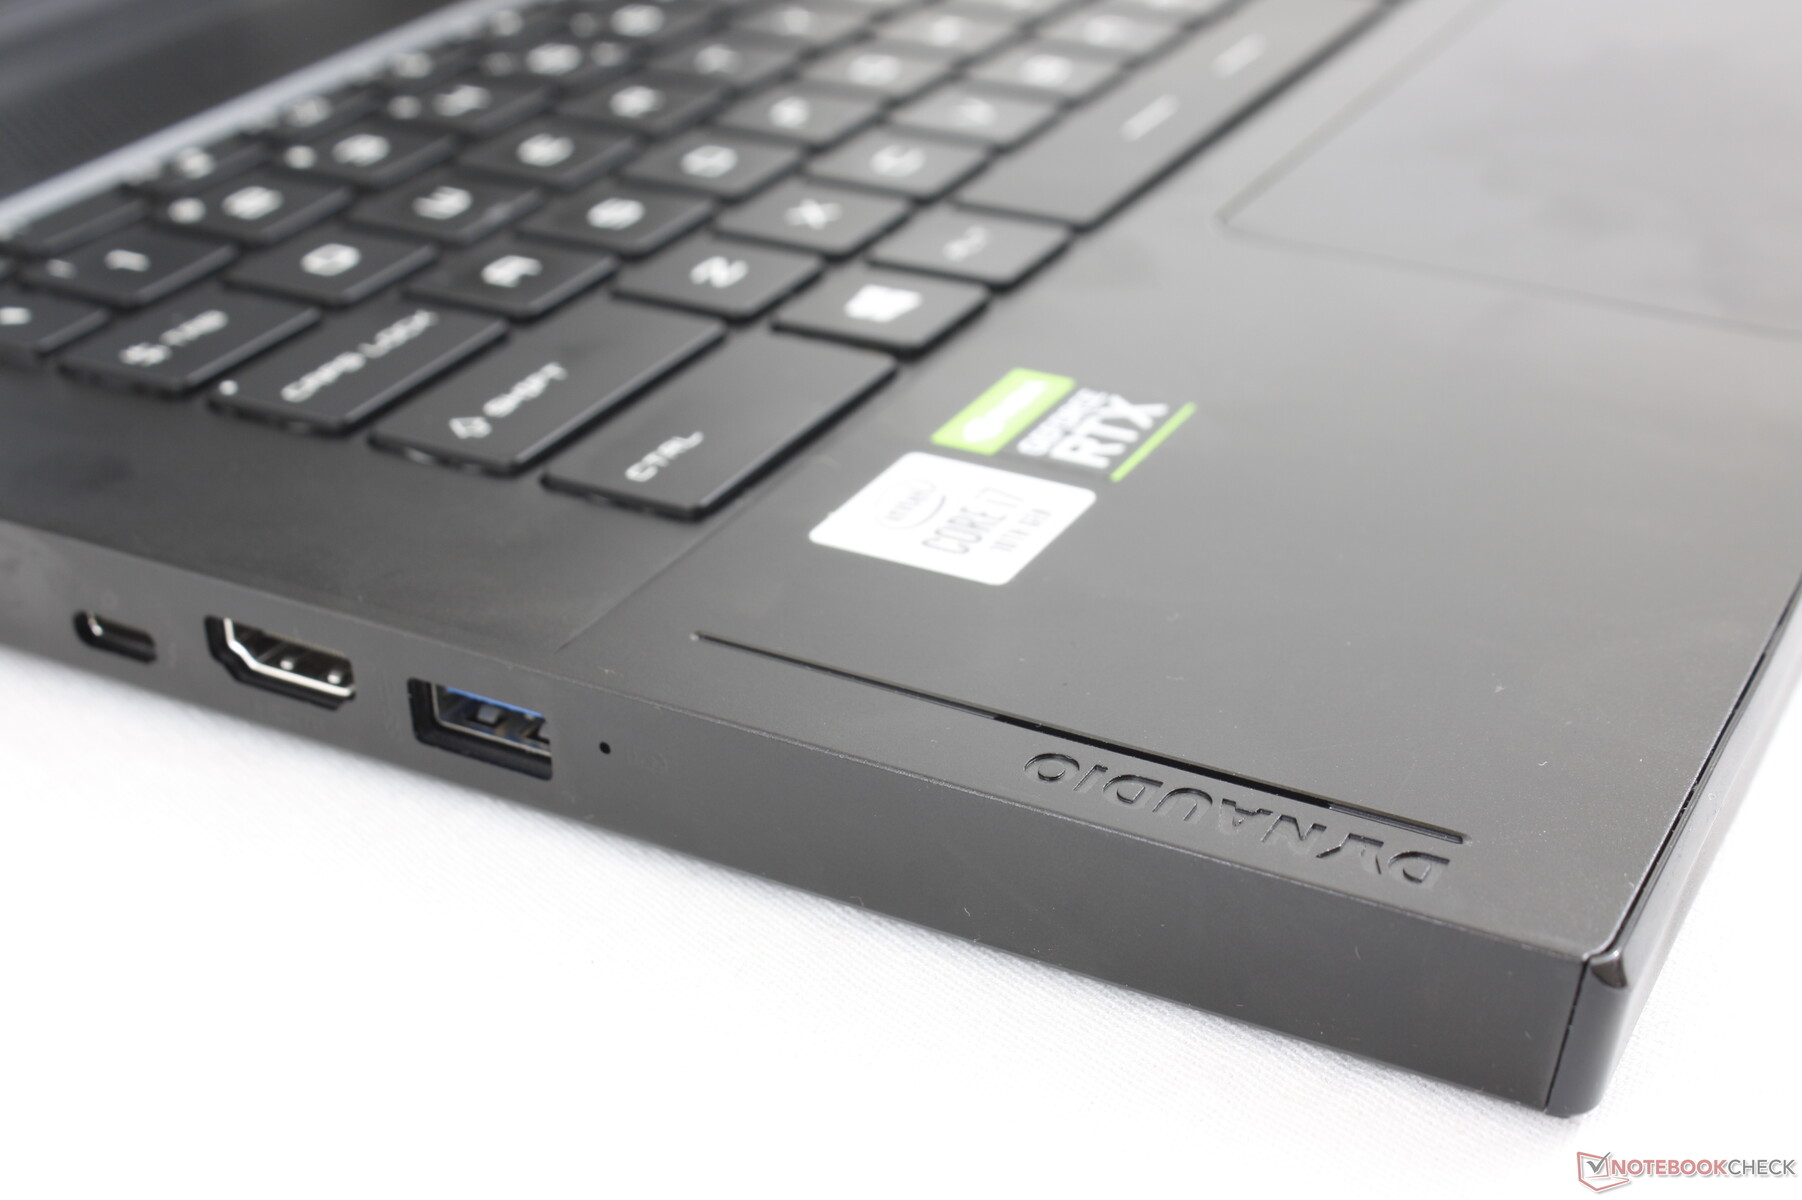
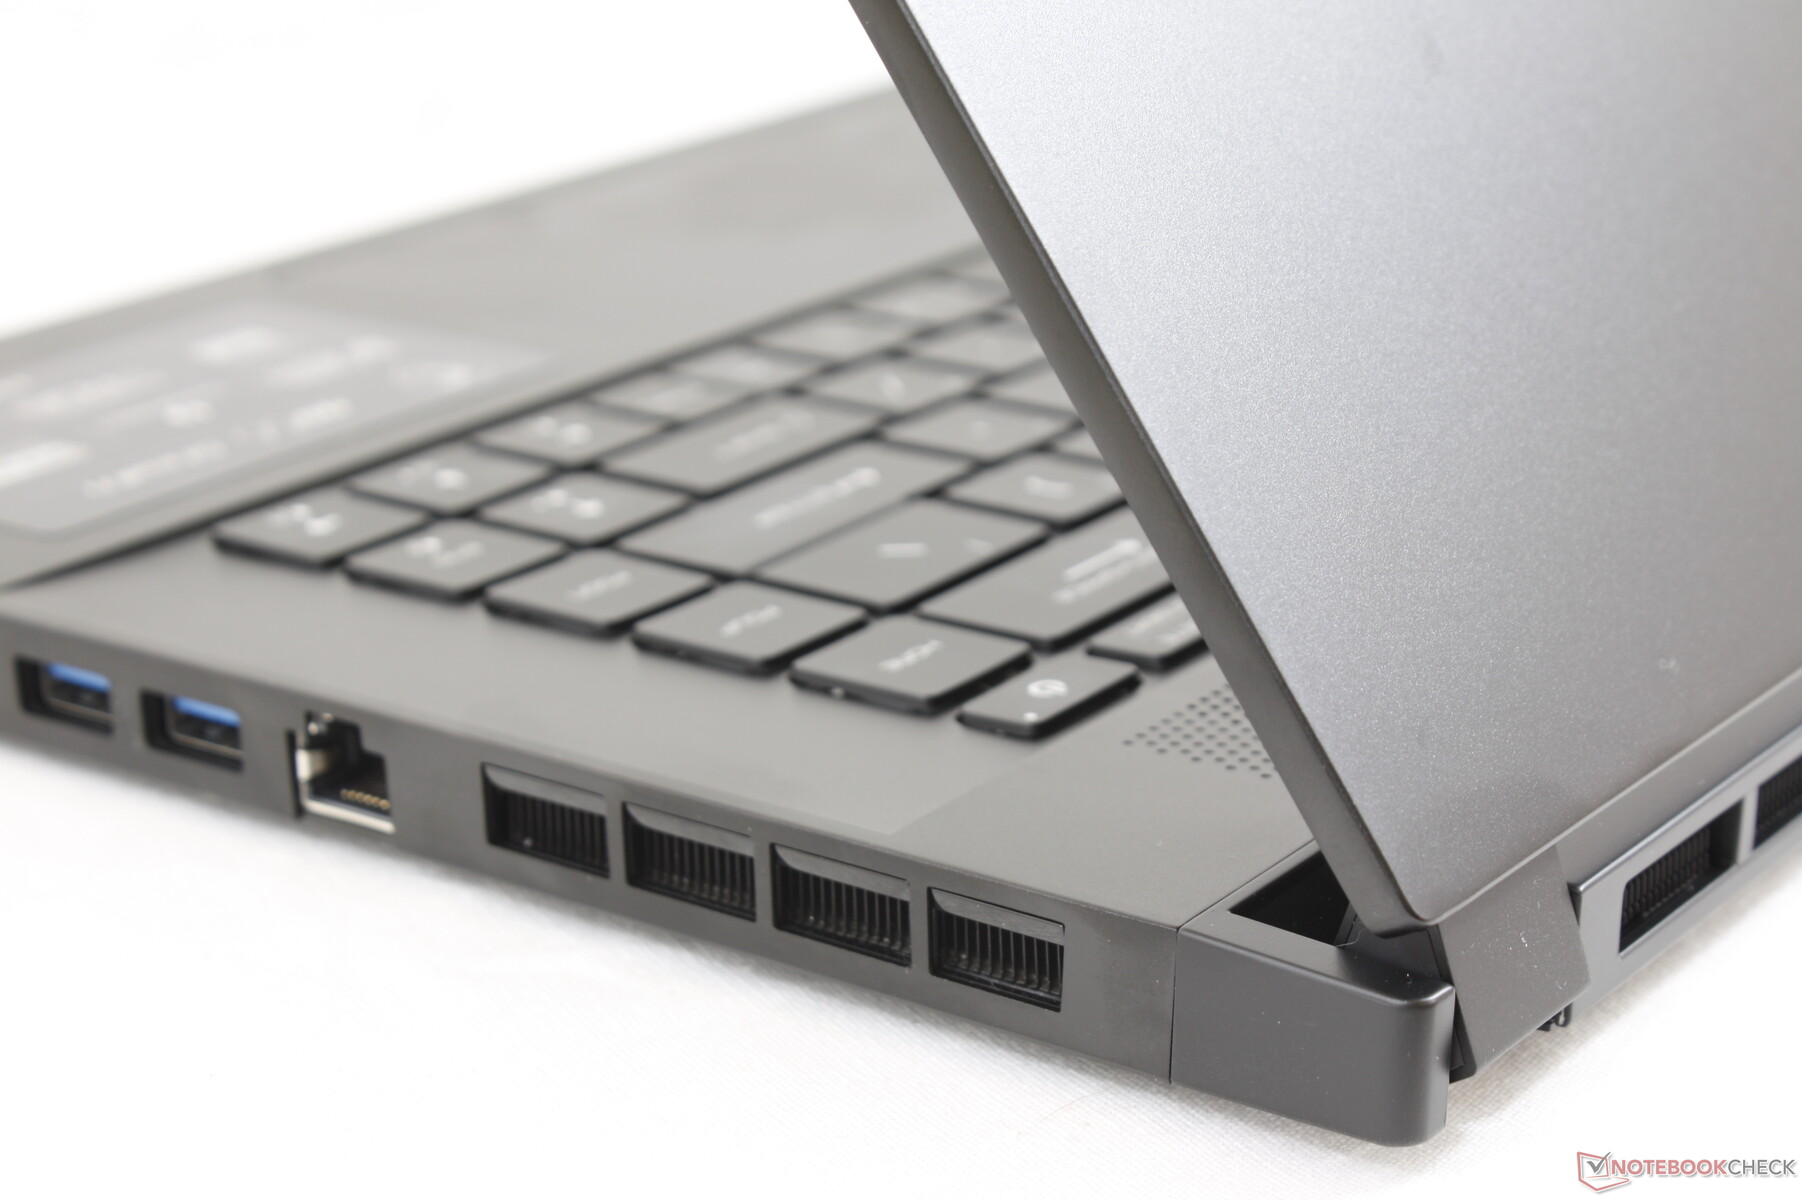
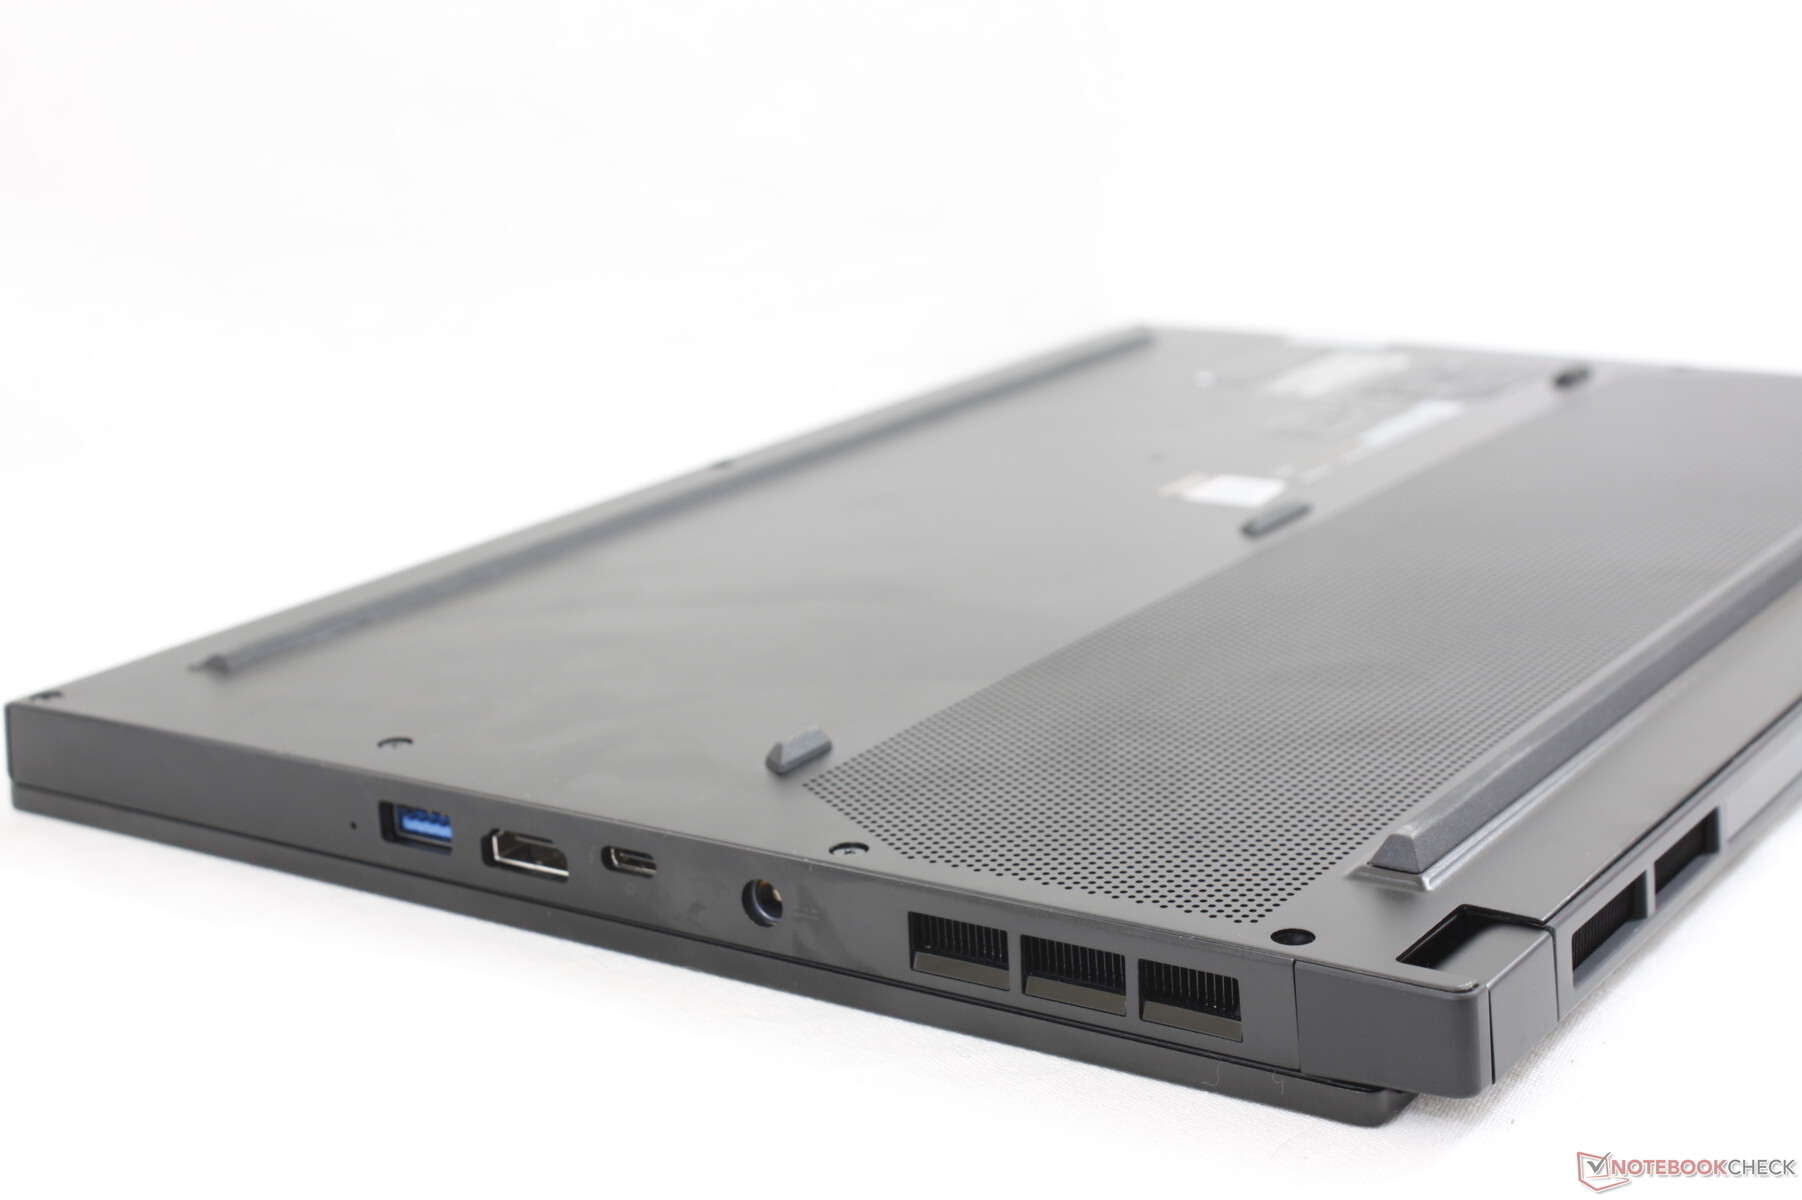
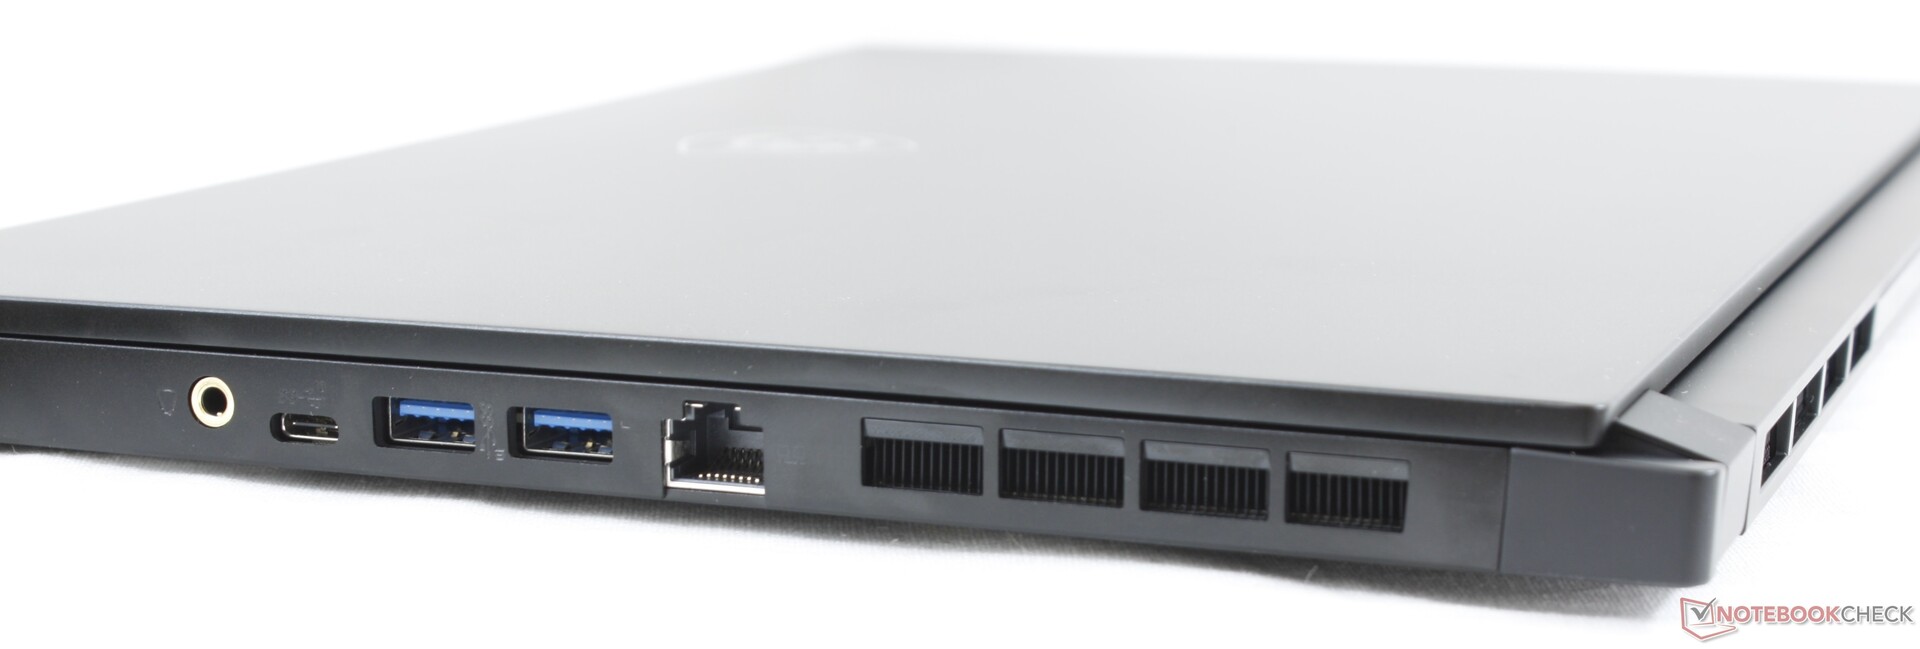
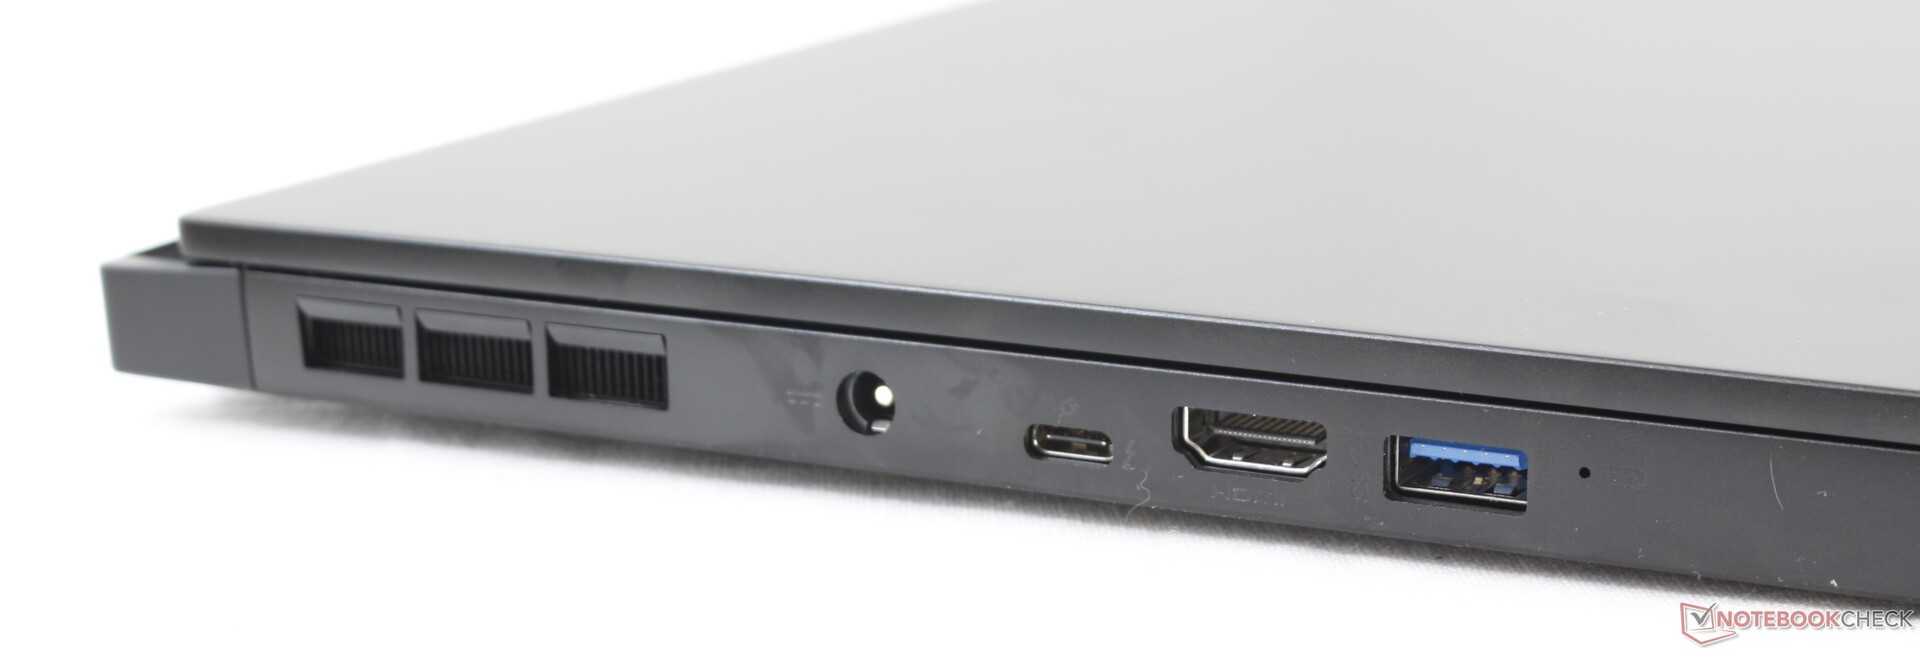
Bağlantı noktası seçenekleri son nesil GS65'ten değiştirildi. En önemlisi, MSI mini-DisplayPort'u ikinci bir USB C Tipi bağlantı noktası lehine değiştirirken, özel mikrofon bağlantı noktası artık hiçbir yerde bulunamamıştır. Çoğu kullanıcının MSI'yı düşürmelerini isteyen bu portları bile kullanmadığından şüpheleniyoruz.Port konumlandırma karışık bir torba olmaya devam ediyor çünkü portlar sıkıca paketlenmiş ve ön kenara yakın. Buna karşılık, Blade 15'in bağlantı noktalarının kabloların önüne geçme olasılığının daha düşük olduğu arkaya doğru da vardır.
İletişim
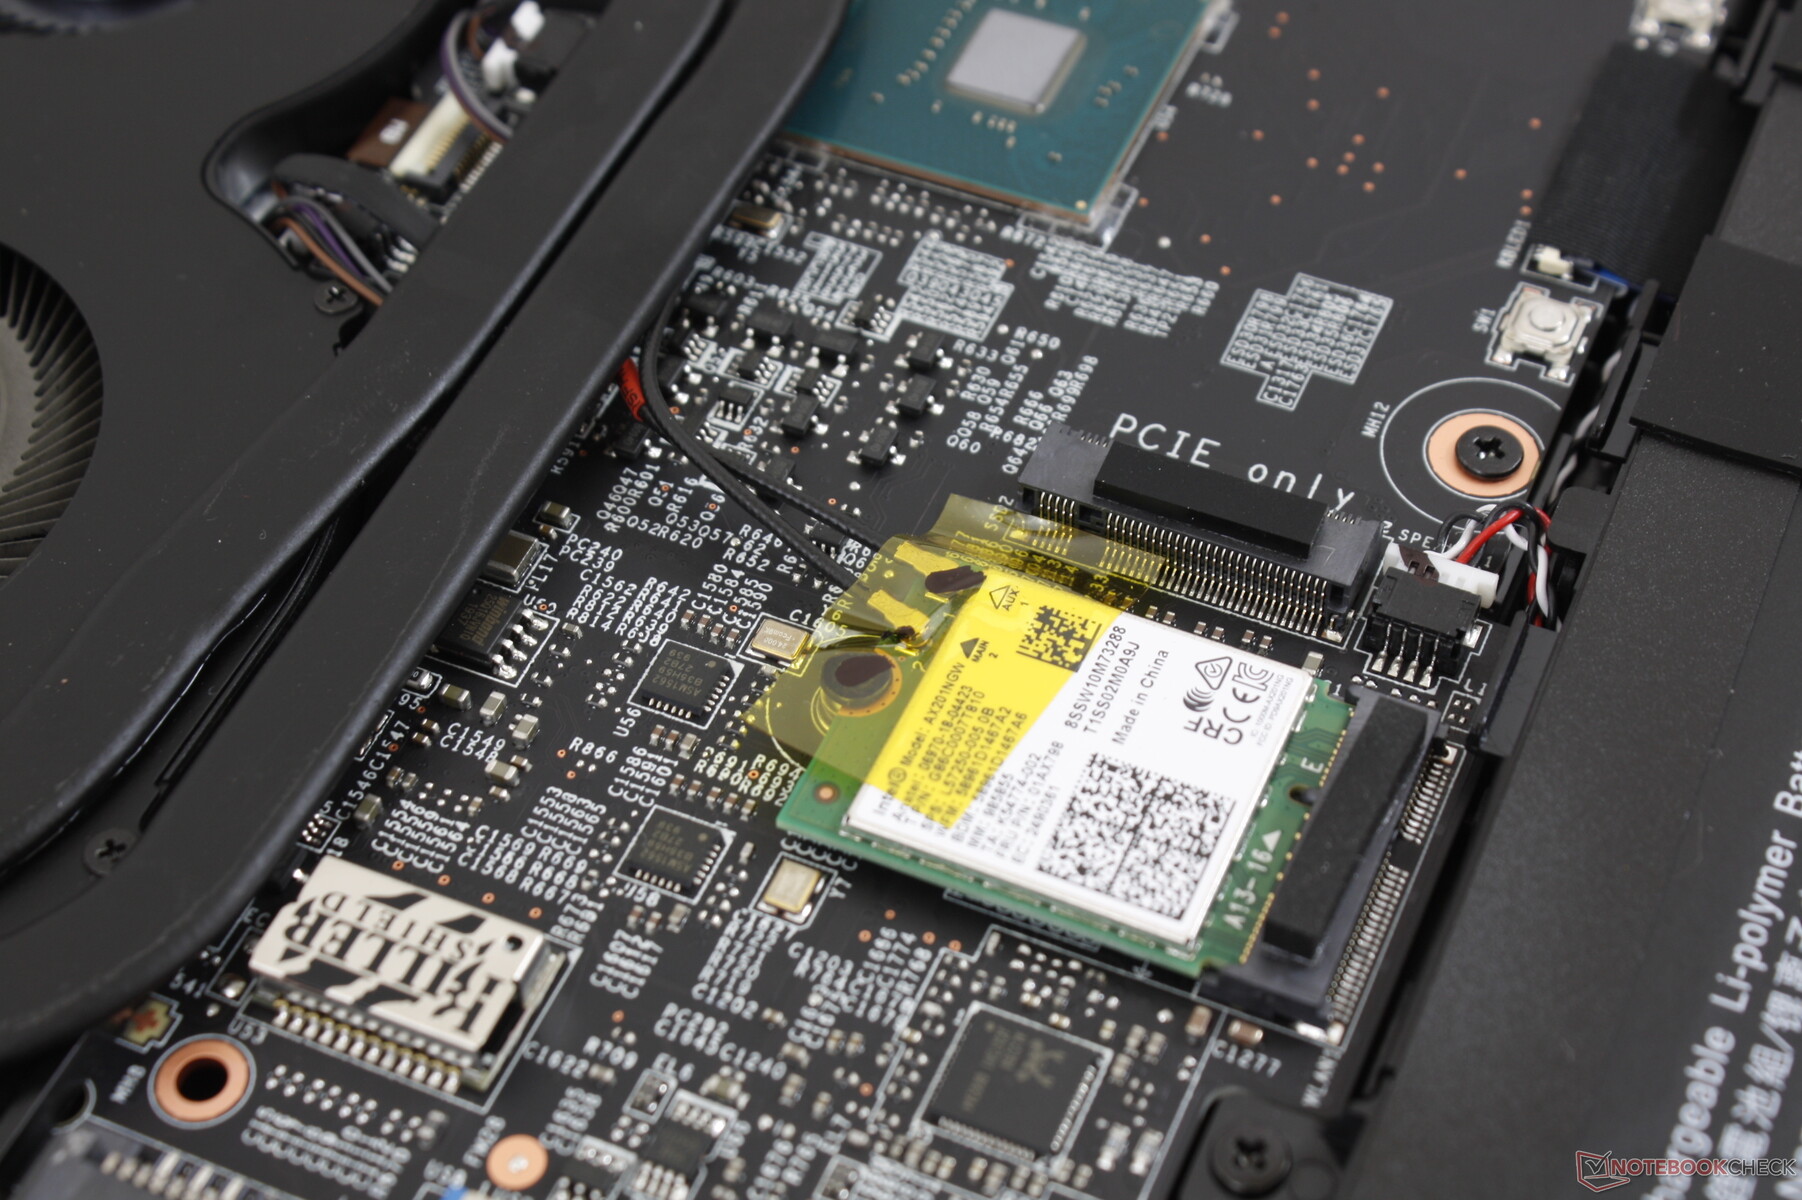
Intel AX201, Wi-Fi 6 bağlantısı ve Buetooth 5.1 için standarttır. Netgear RAX200 test yönlendiricimize bağlandığında herhangi bir sorunla karşılaşmadık. Kullanıcılar ek yazılım özellikleri için Killer 1650'lere yükseltebilir, ancak genel olarak neredeyse tamamen aynı olacaktır.
| Networking | |
| iperf3 transmit AX12 | |
| Asus ZenBook Duo UX481FL | |
| MSI GP65 10SFK-047US | |
| MSI GS66 Stealth 10SFS | |
| MSI GS66 10SGS | |
| MSI GF75 Thin 10SCXR | |
| iperf3 receive AX12 | |
| Asus ZenBook Duo UX481FL | |
| MSI GS66 10SGS | |
| MSI GS66 Stealth 10SFS | |
| MSI GP65 10SFK-047US | |
| MSI GF75 Thin 10SCXR | |
Web kamerası


Bakım
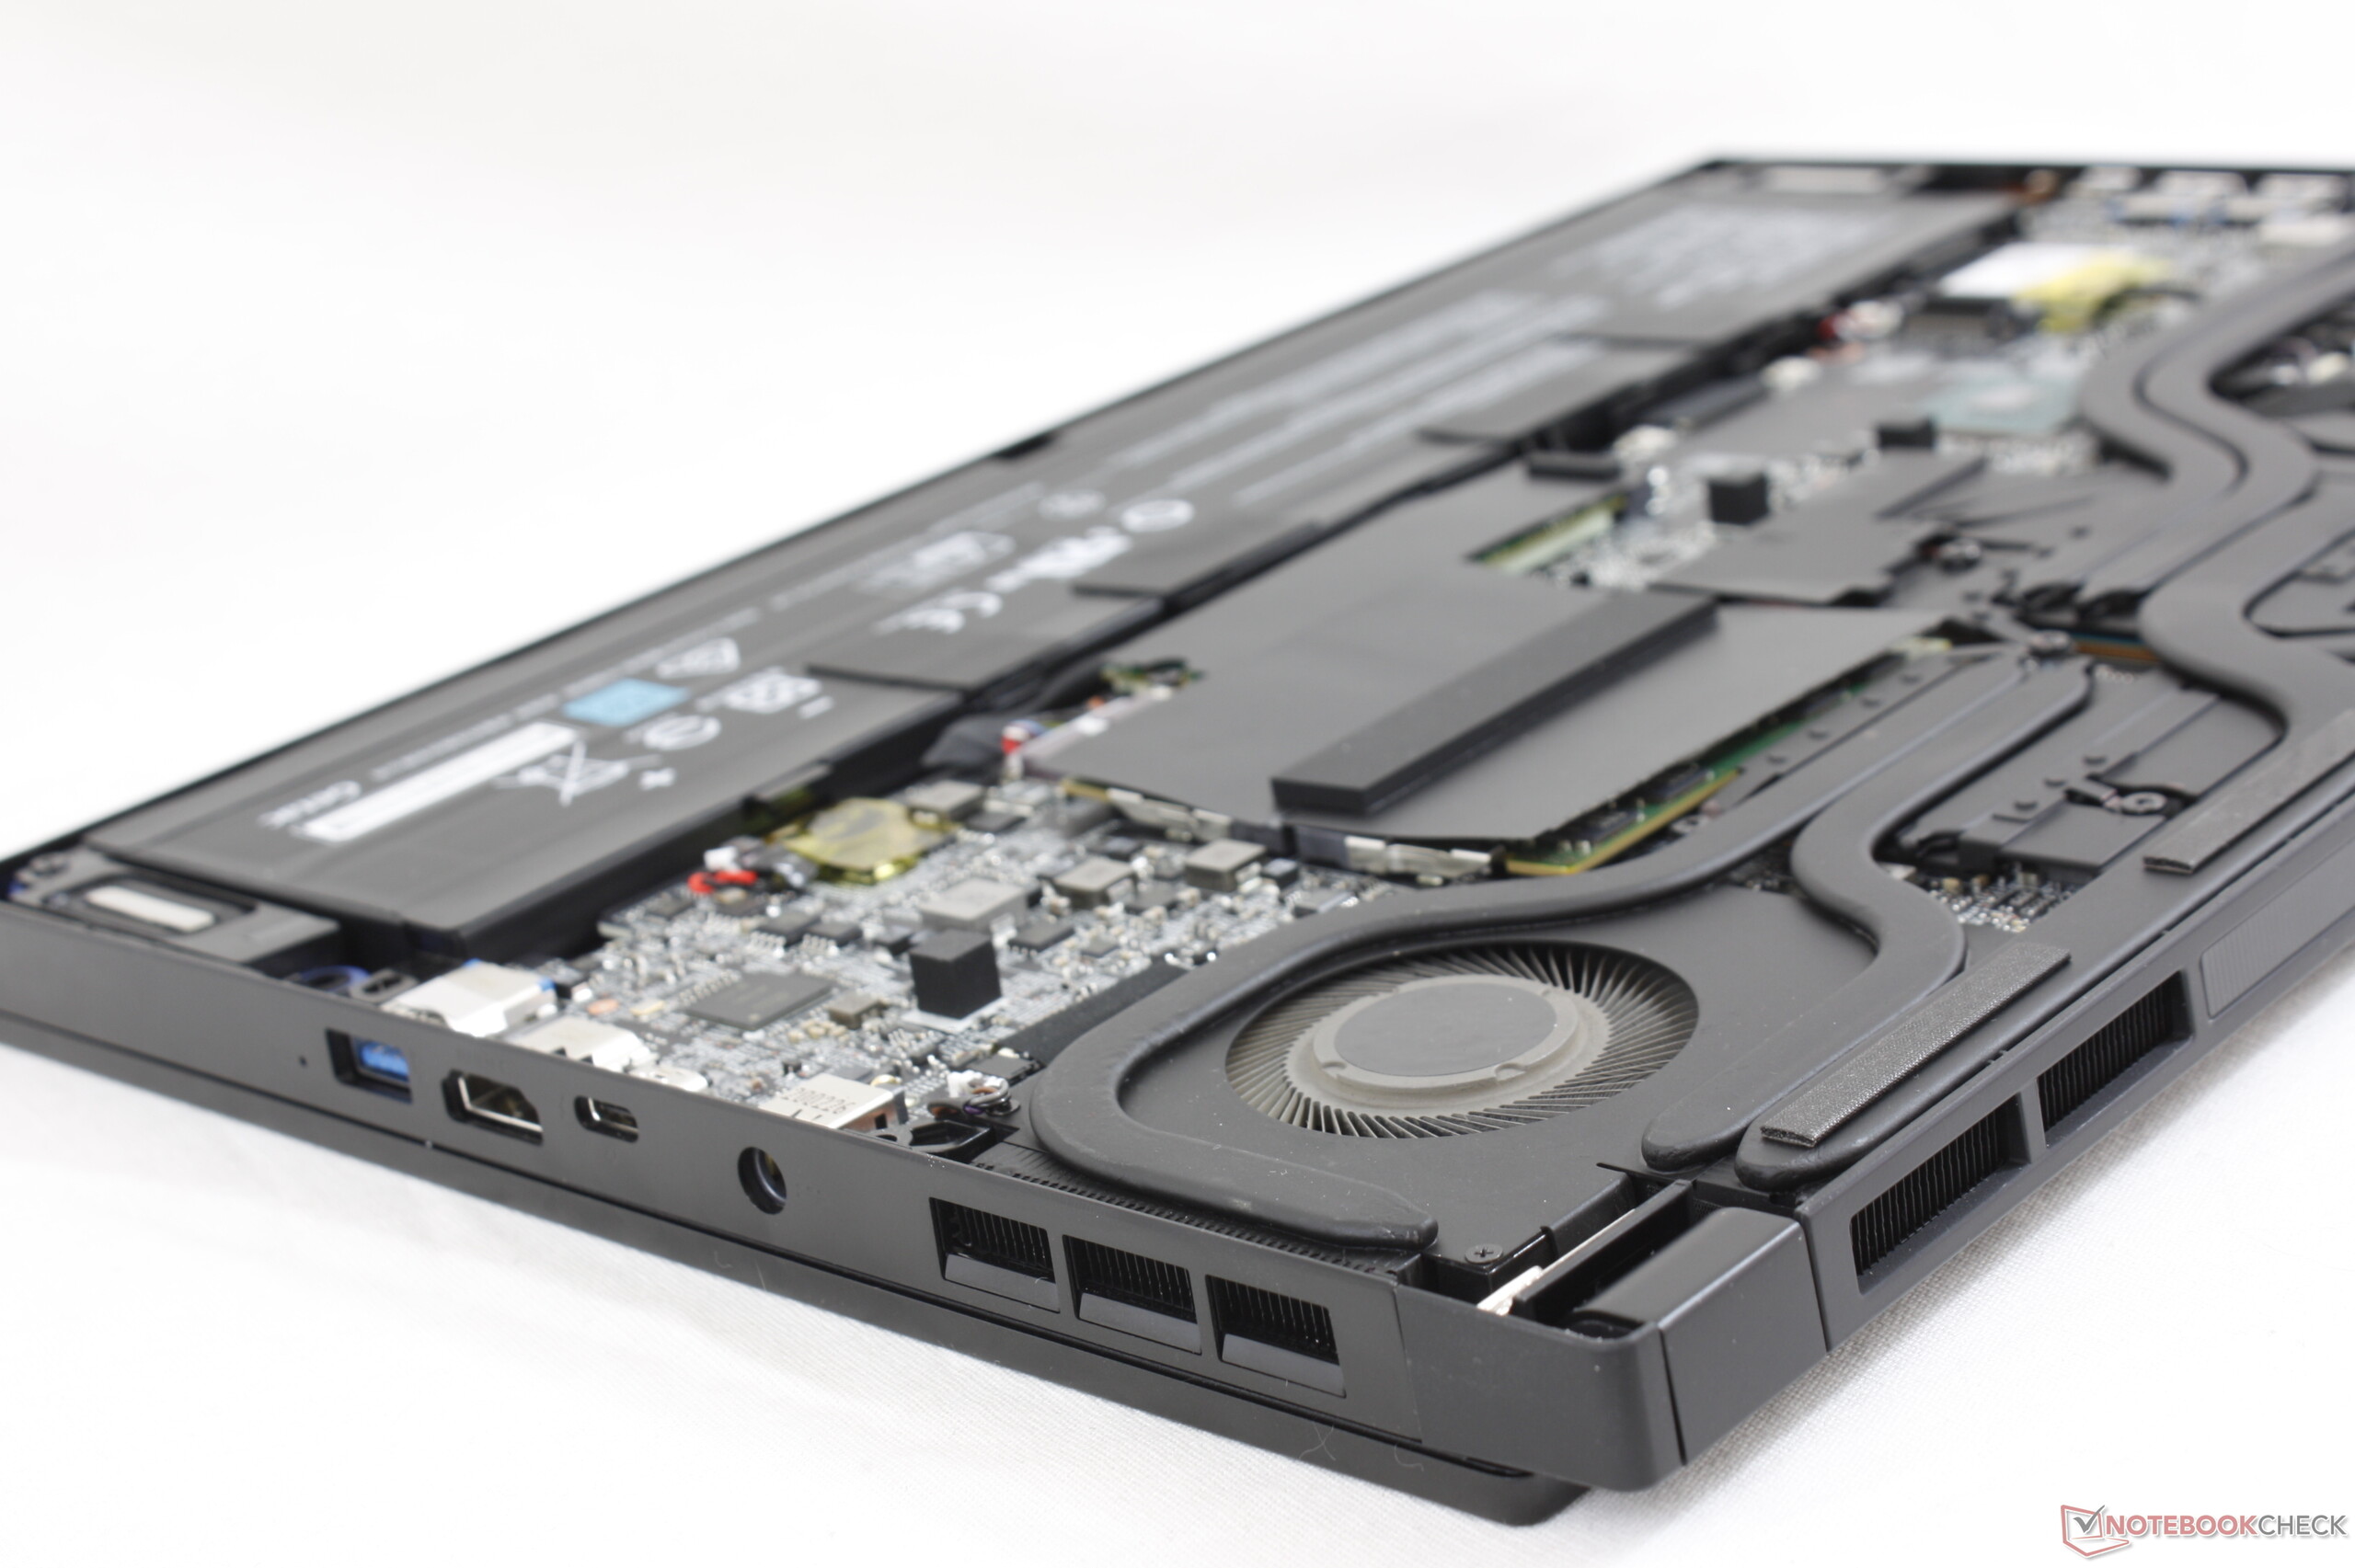
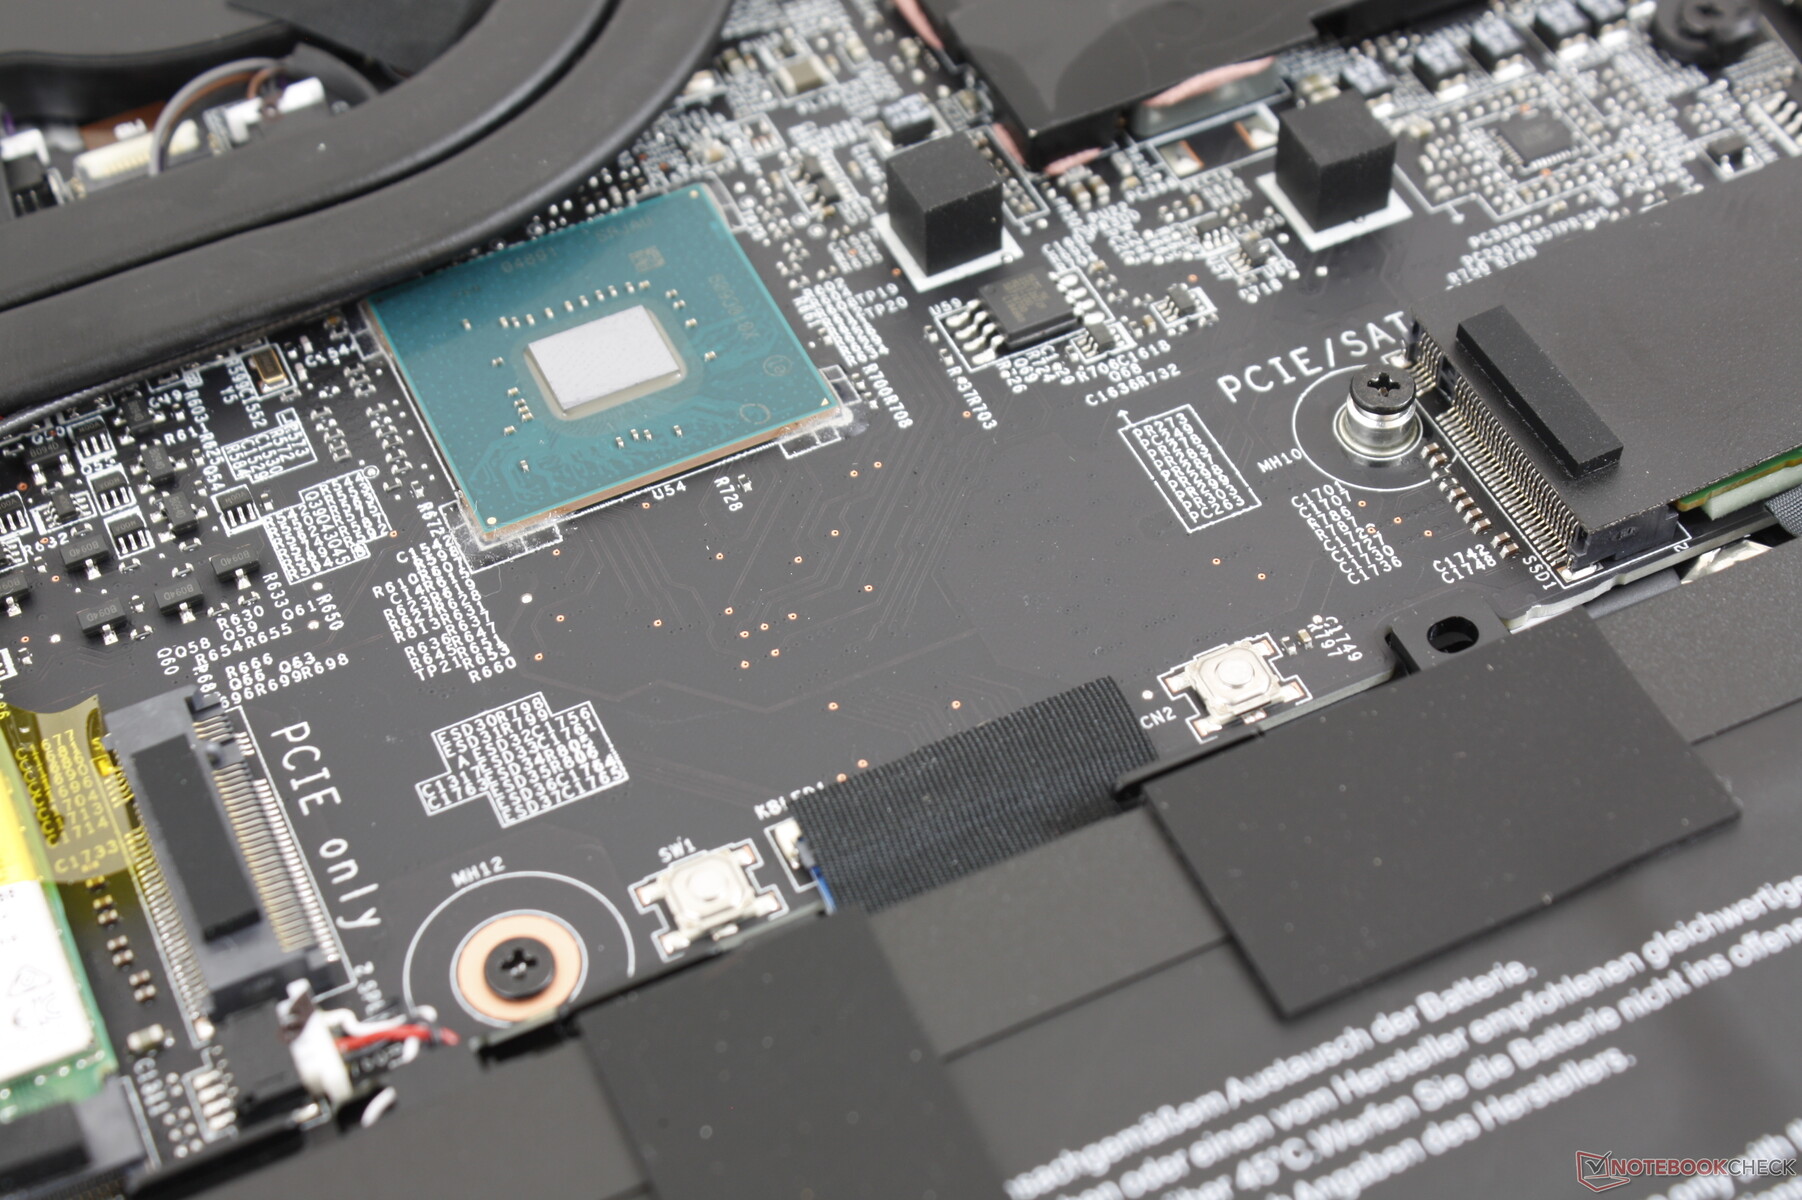
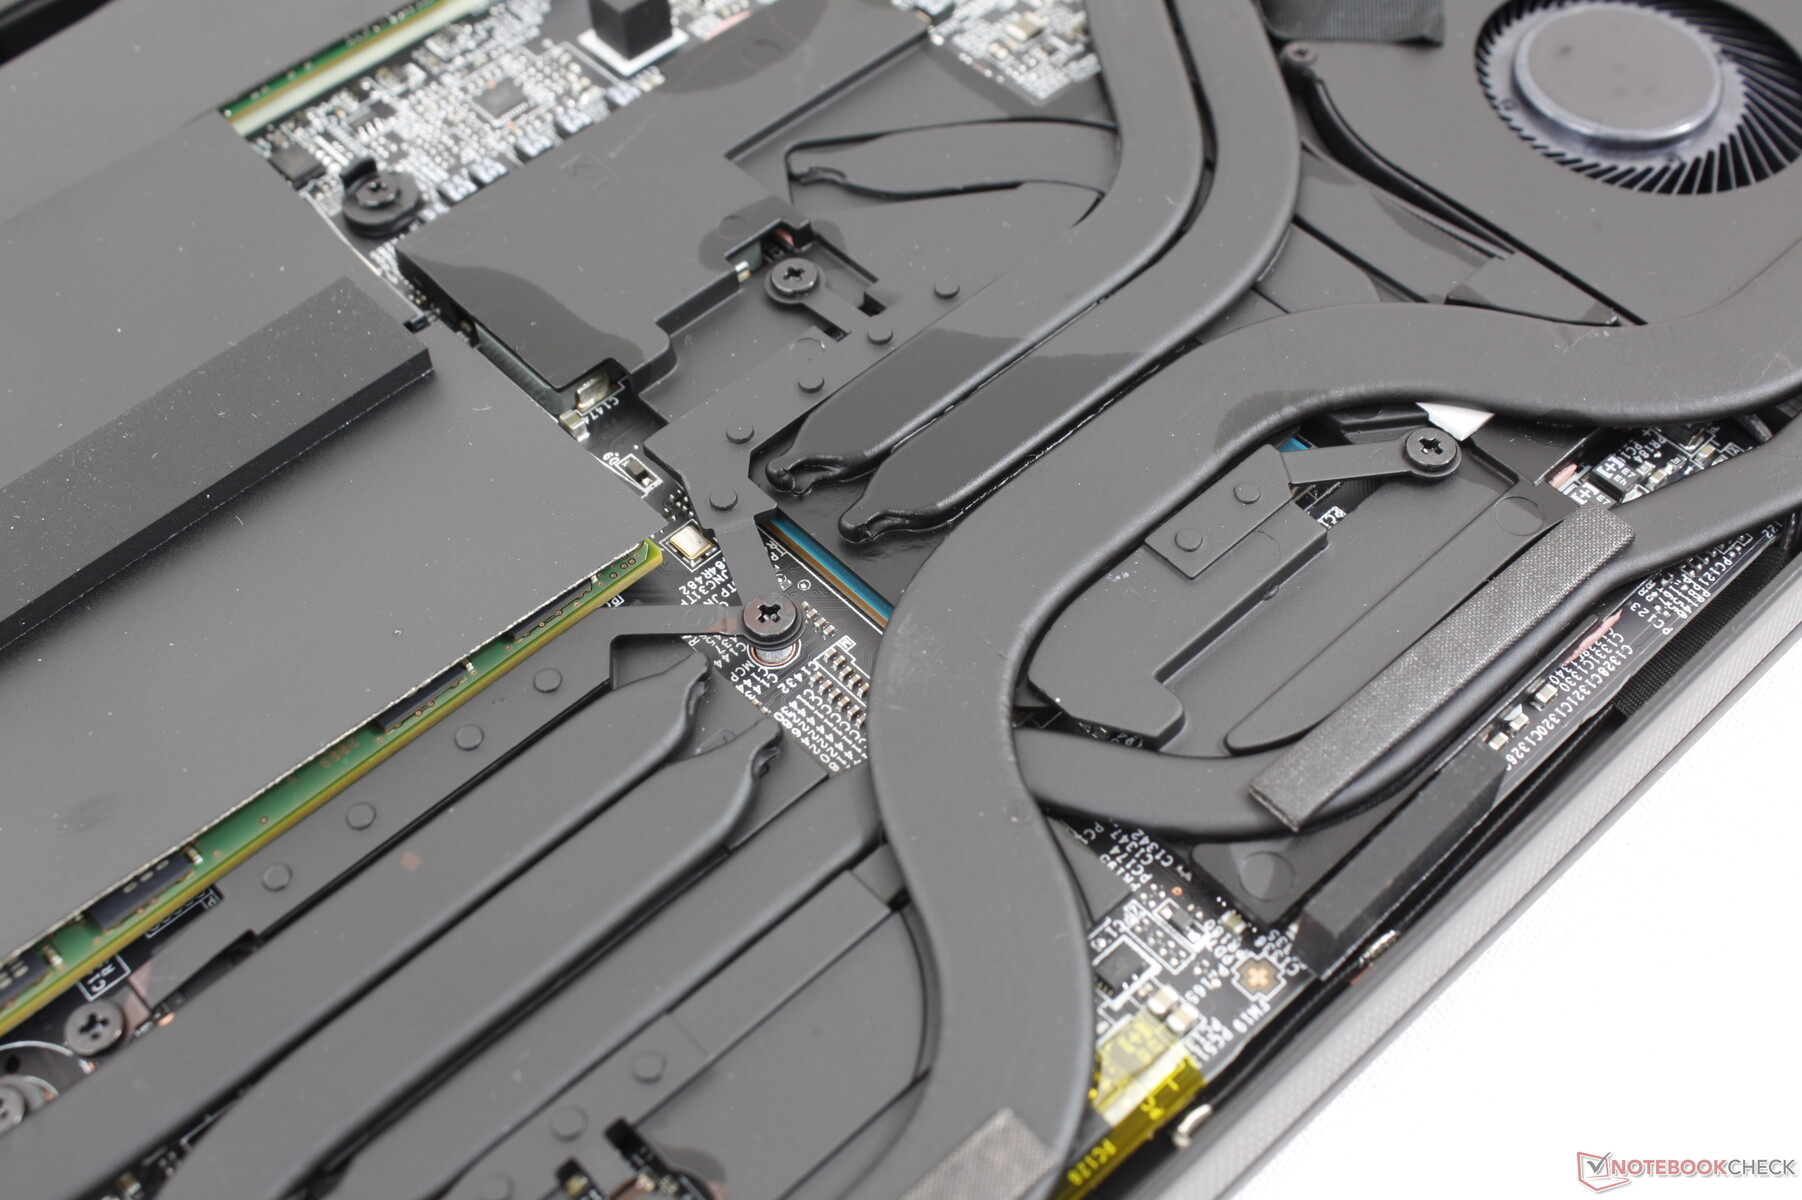
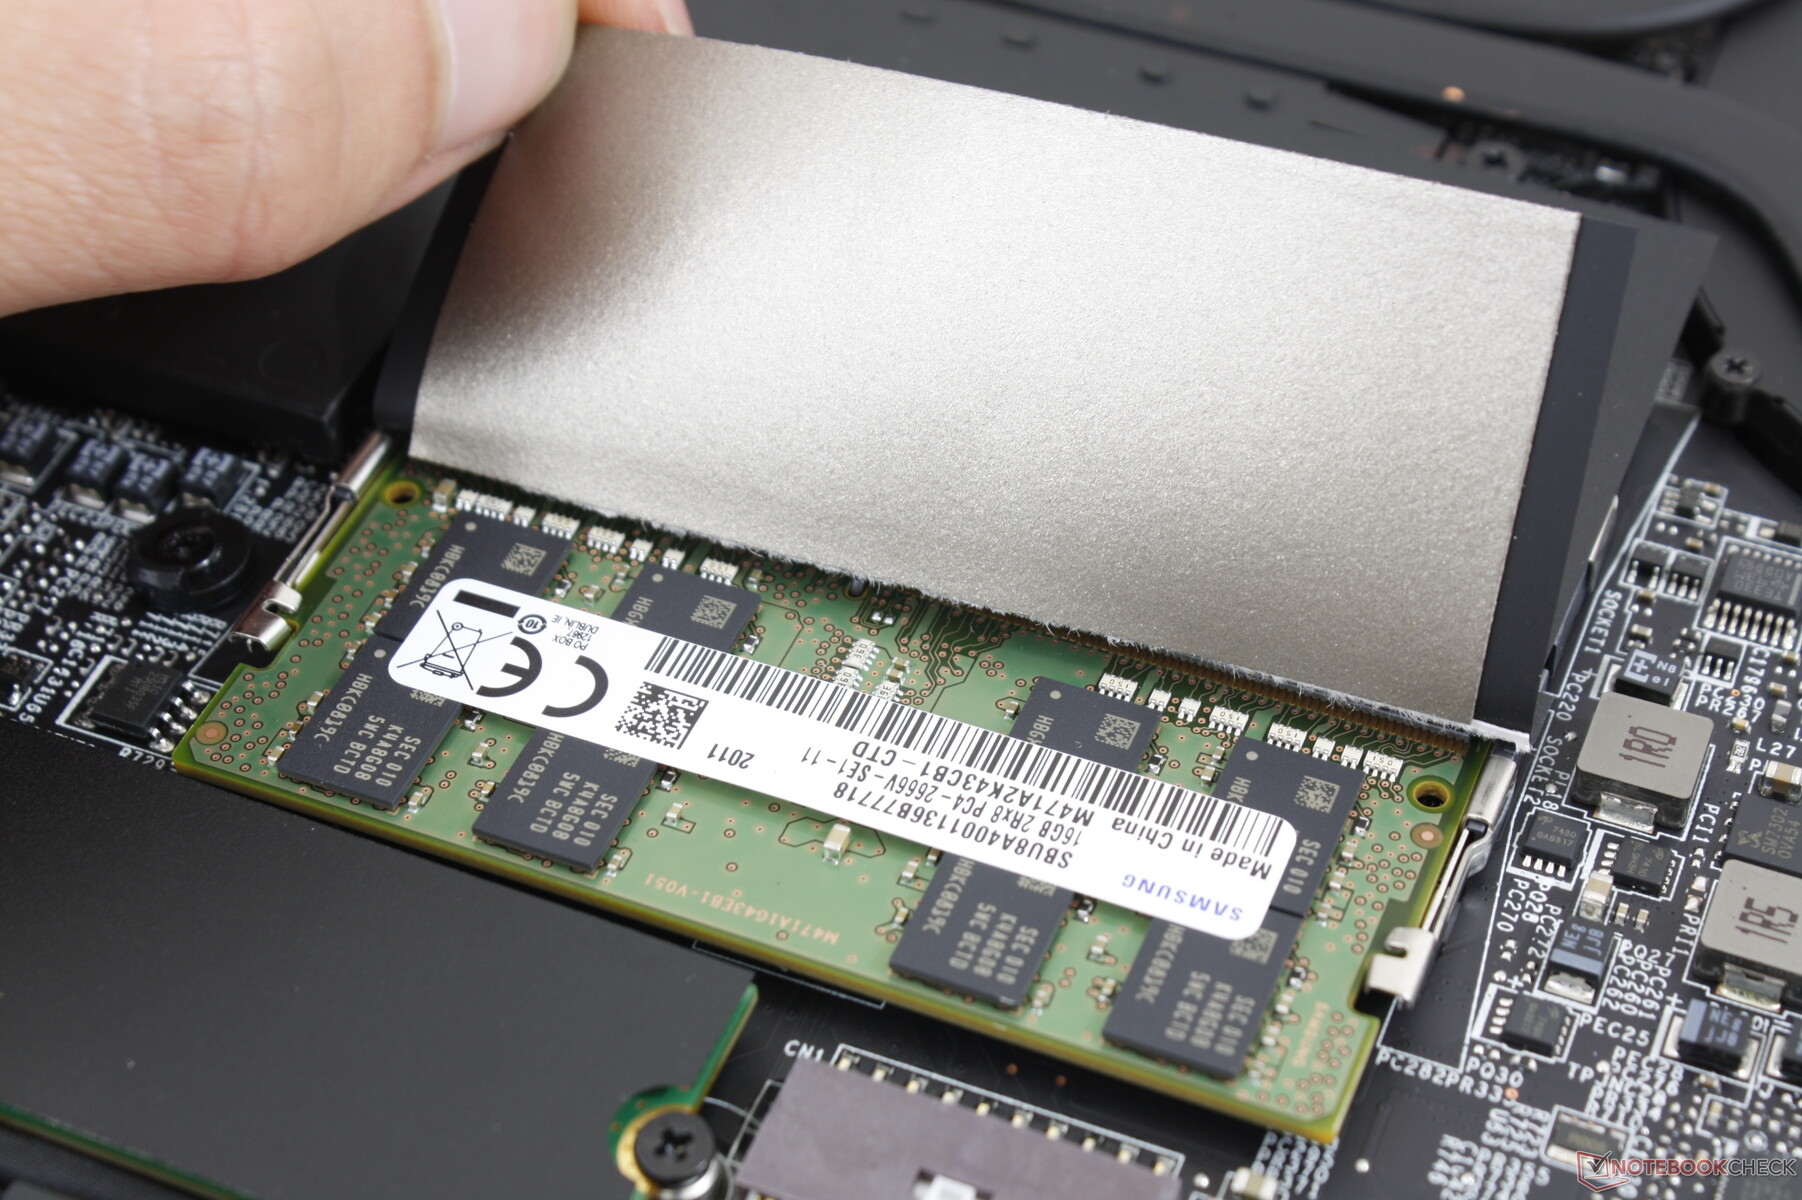
Alt panel 9 Philips vida ile sabitlenmiştir ve sahiplerin içeri girmek için bir 'Fabrika Mührü' çıkartması yırtması gerekecektir. Alt panelin çıkarılması GS65 veya Razer Blade 15'in alt panellerinden daha zordur ve bu nedenle işi yapmak için hem dikkatli eller hem de keskin bir kenar öneririz. Neyse ki, MSI, GS65'teki yükseltmeleri olması gerekenden daha zor hale getiren baş aşağı anakart düzenini attı. Sahipler iki depolama bölmesine, iki SODIMM yuvasına, WLAN modülüne ve dahili pile doğrudan erişebilir.
Aksesuarlar ve Garanti
GS65 kullanışlı bir kadife temizlik bezi ile birlikte gönderileceği için kutuda dikkate değer bir ekstra yok. Standart bir yıllık üretici garantisi, Xotic PC gibi satıcılardan satın alınması durumunda ek seçeneklerle uygulanır.
Giriş cihazları
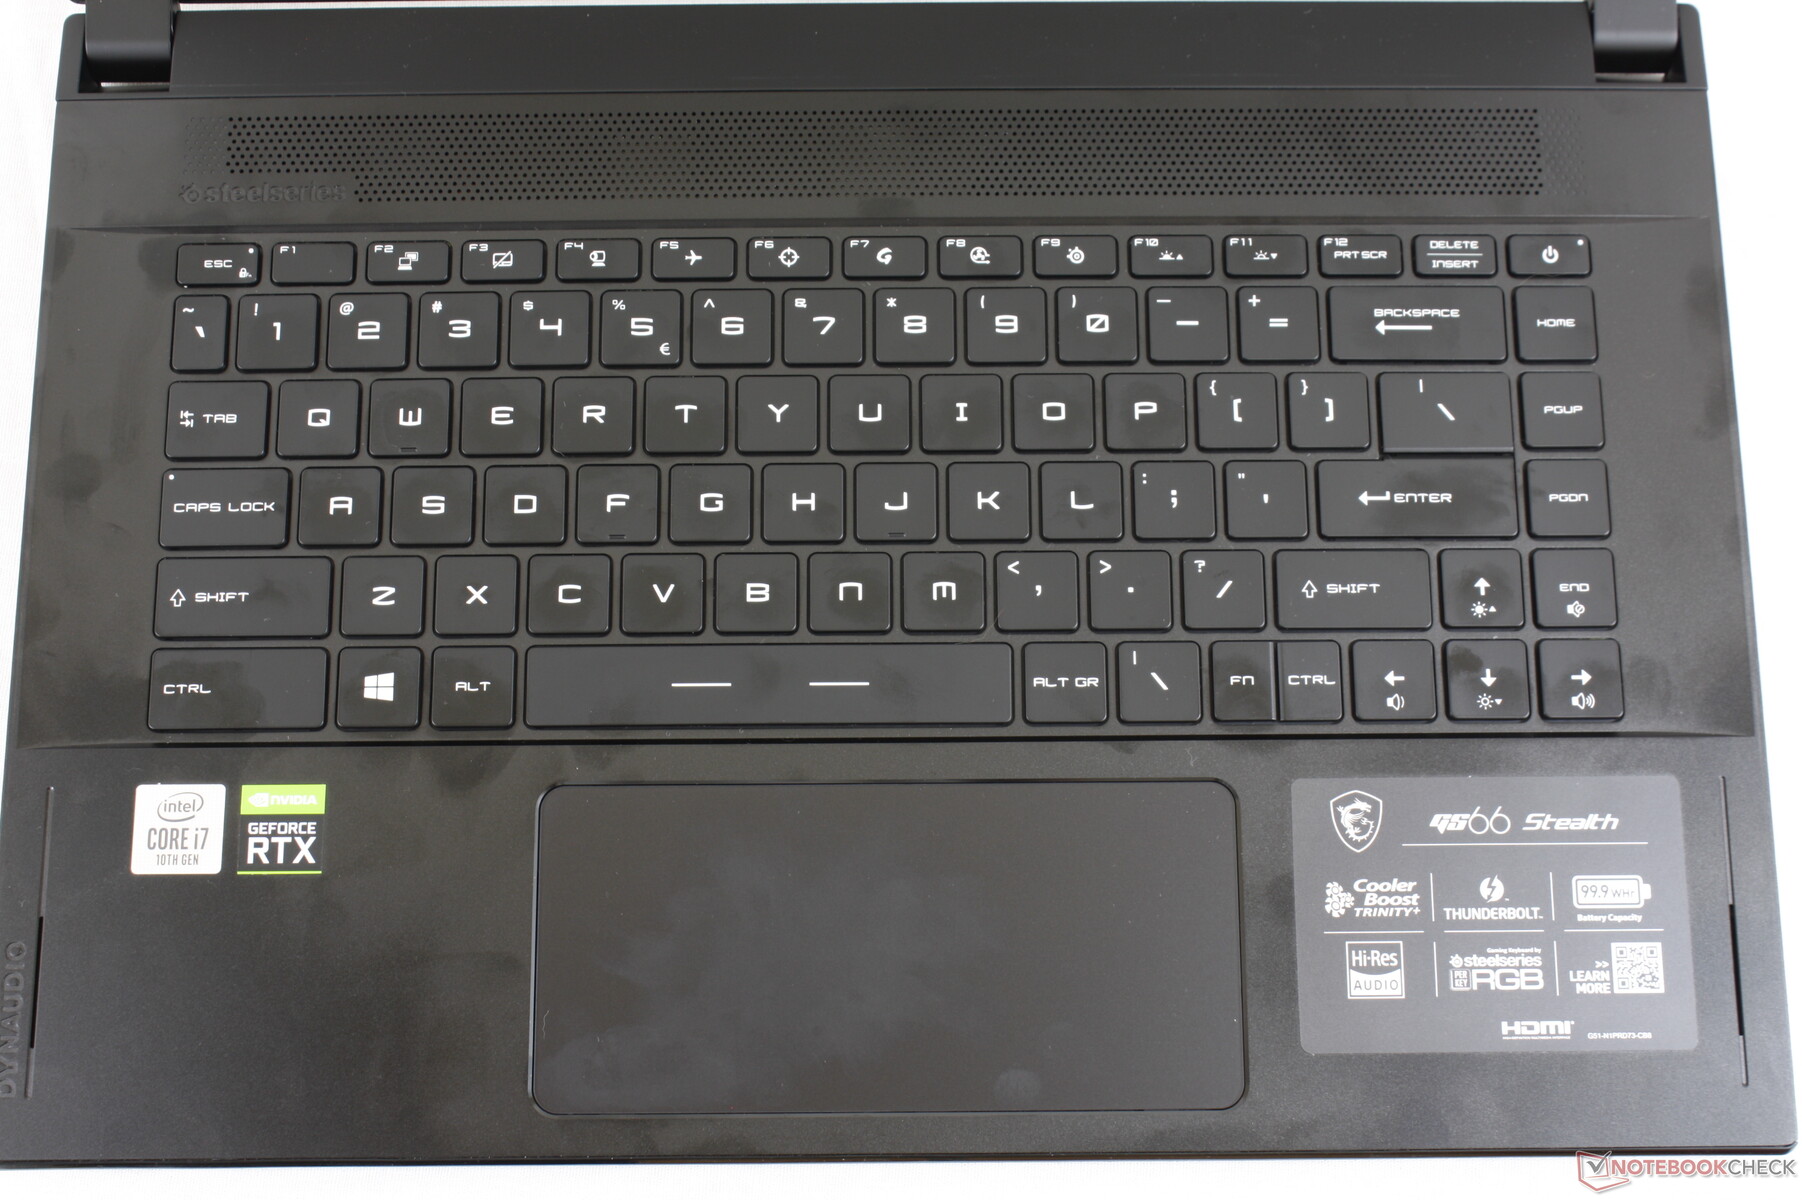
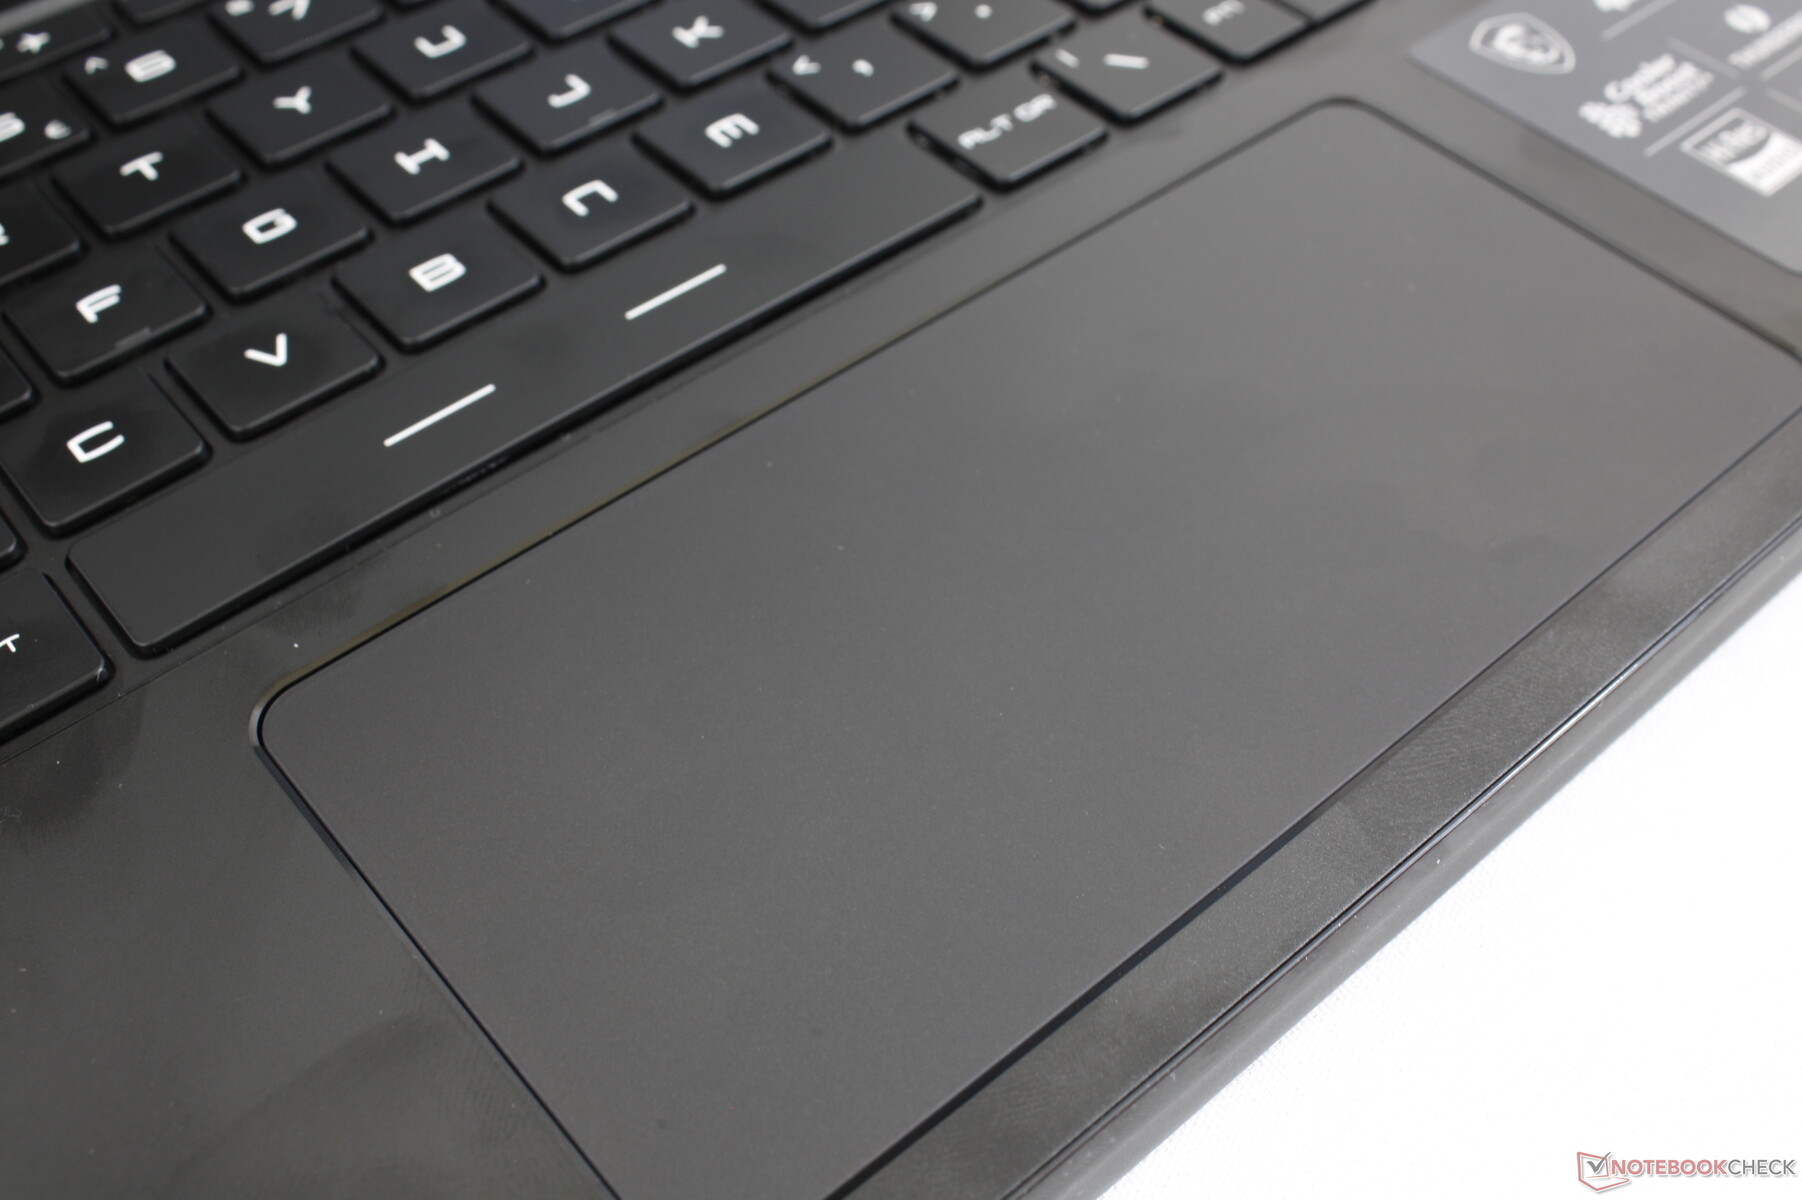
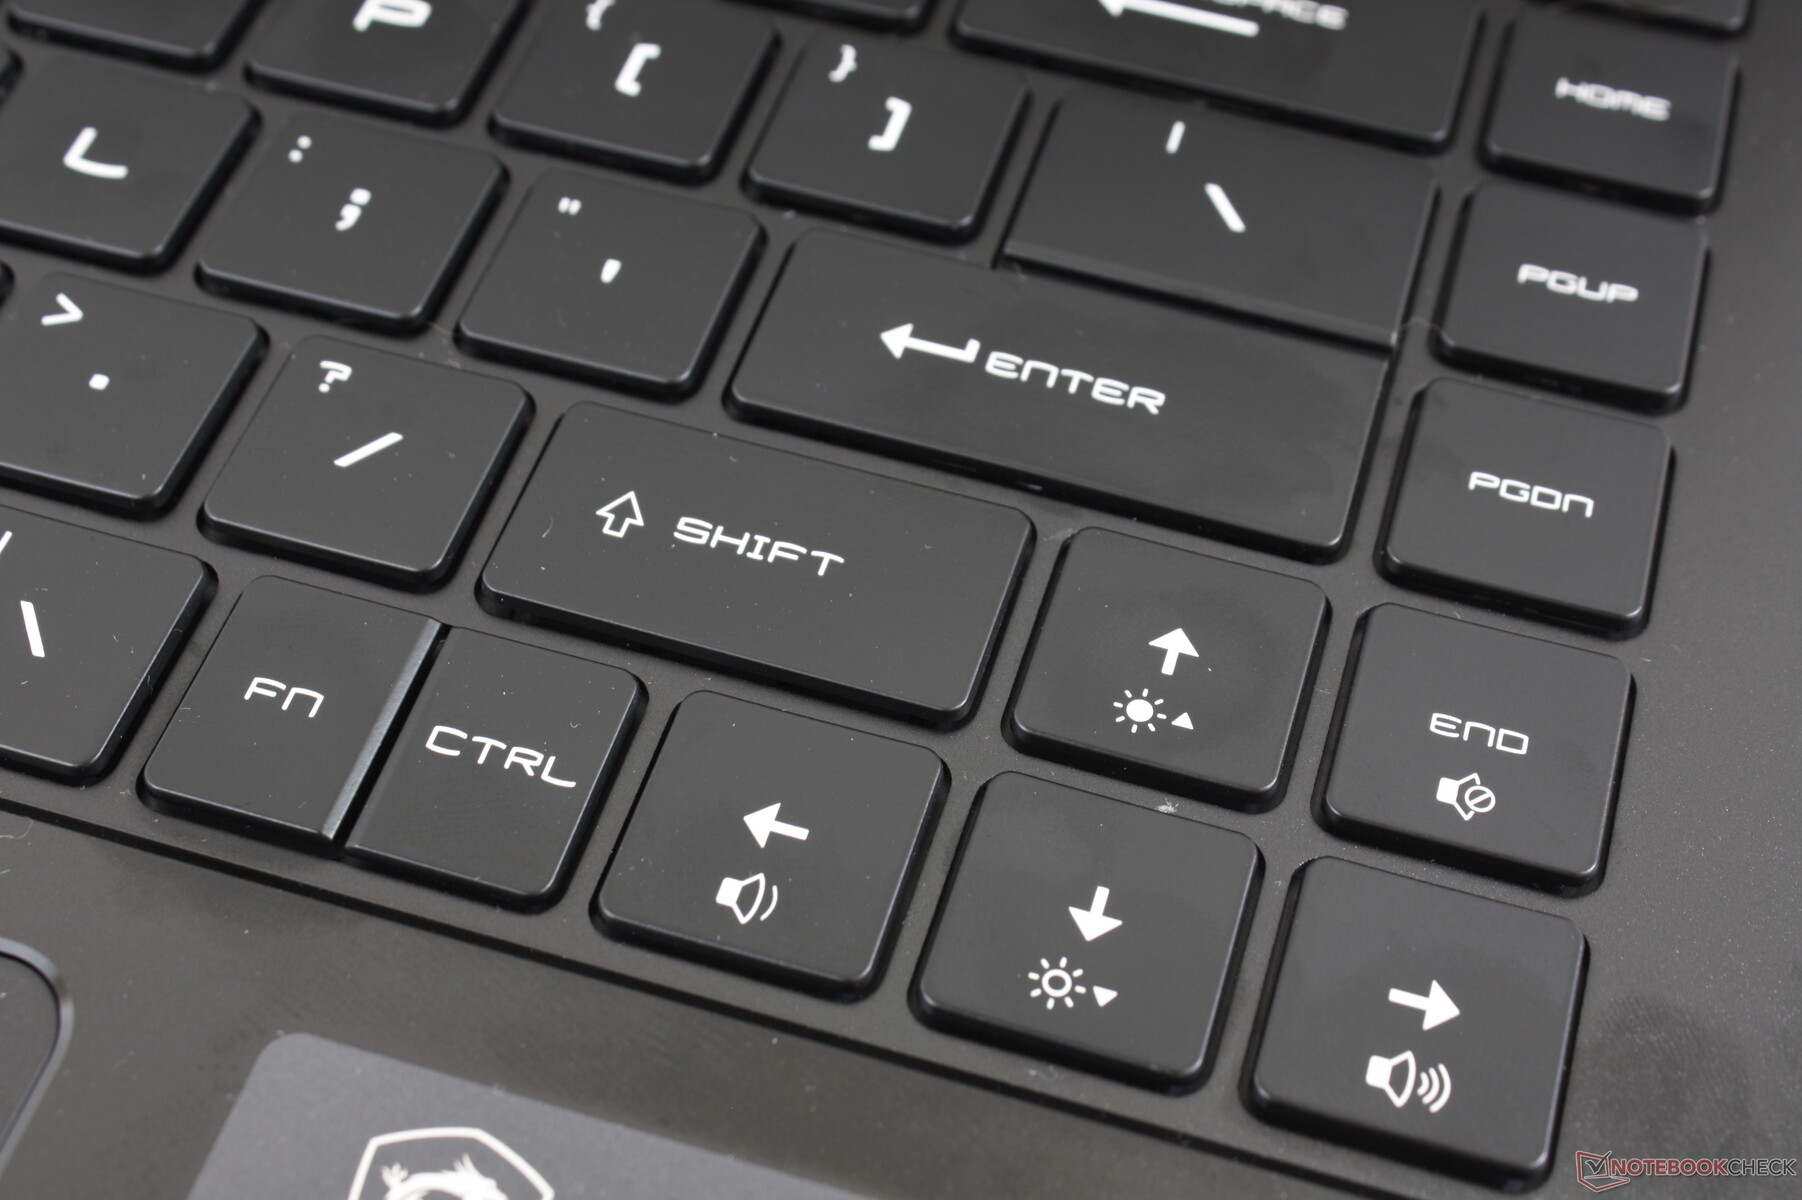
Klavye ve Dokunmatik YüzeyKlavyeyi ve dokunmatik yüzeyi ele alma konusundaki incelememize bakın. Genel olarak, MSI'nın düzeni ve tasarımı revize etmesine rağmen, yazma deneyimini geçen yılki GS65'ten daha iyi veya daha kötü bulmuyoruz. Bununla birlikte, tıklama yastığı, daha kolay ve daha kolay olması için bu sefer daha büyük ve daha sıkıdır.Ancak, parlaklık kontrolleri klavyede açıklanamaz bir şekilde değiştirilmiştir.

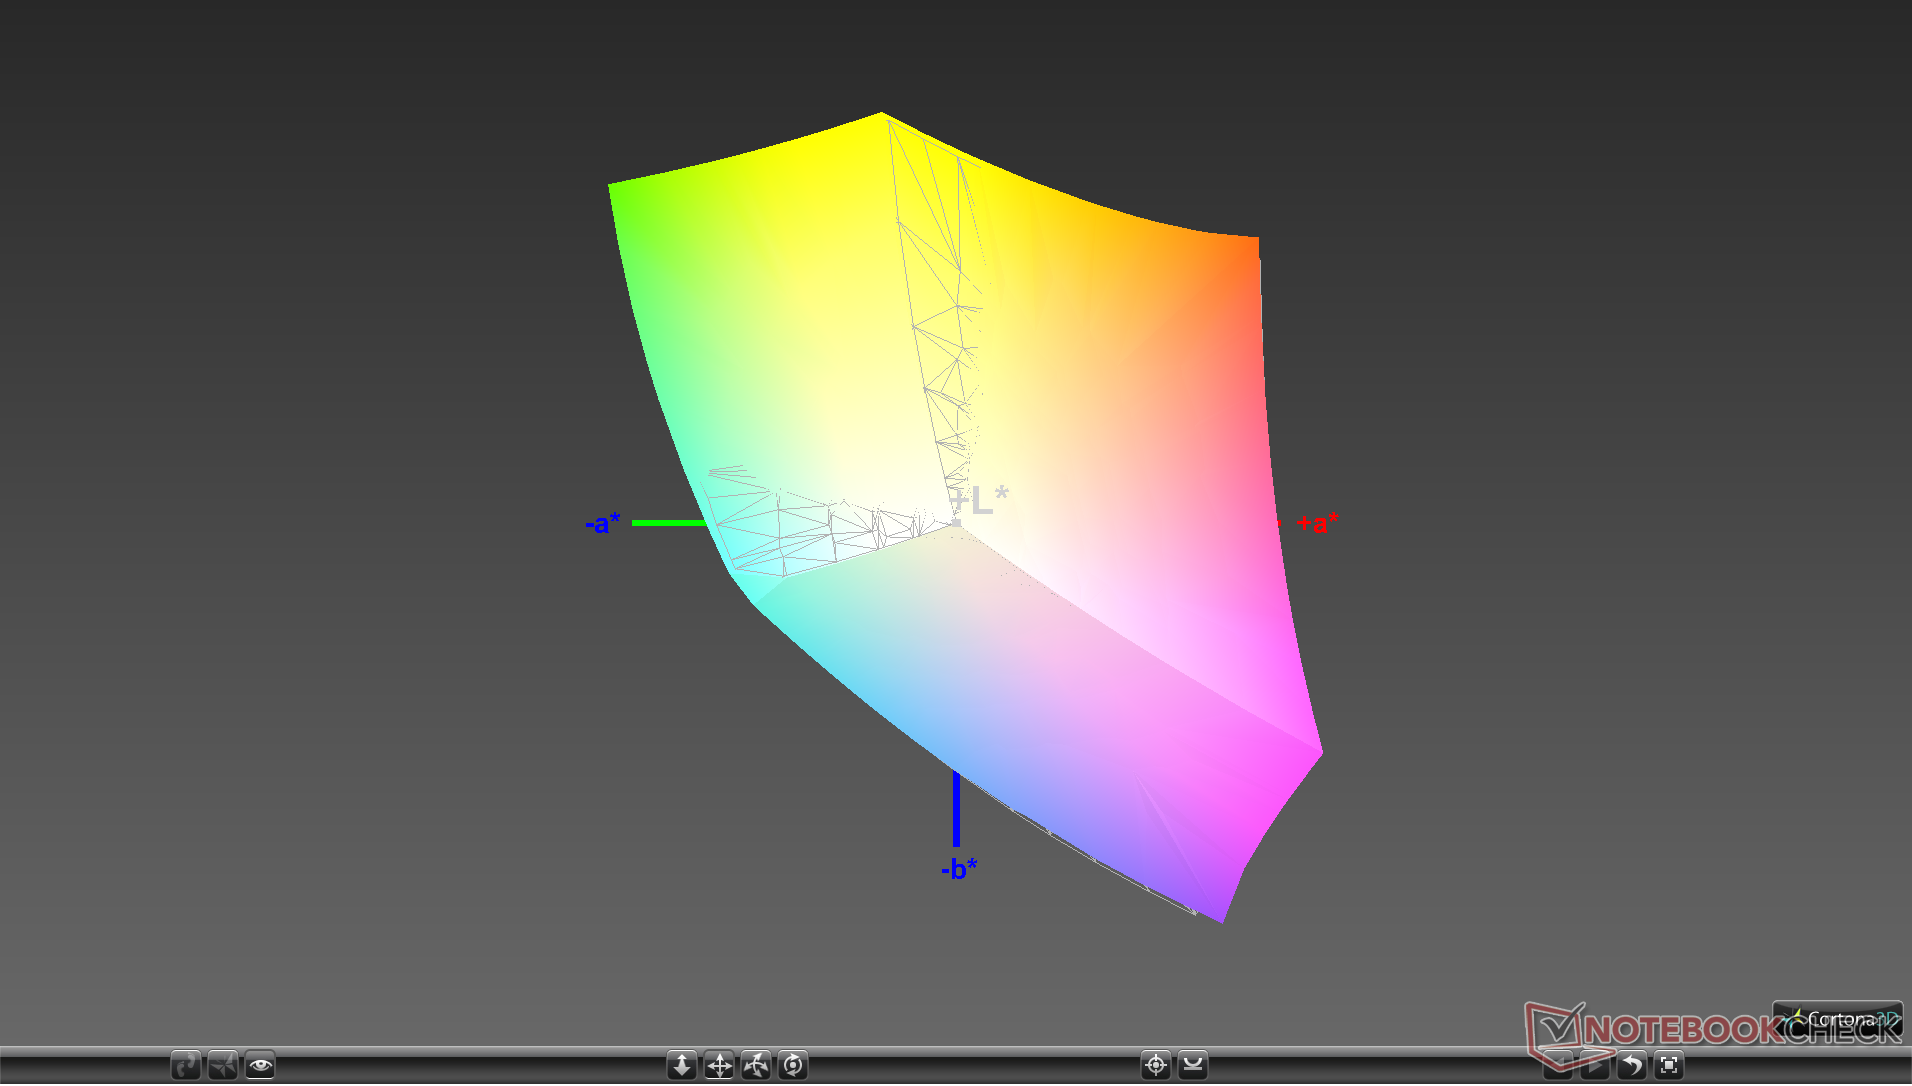
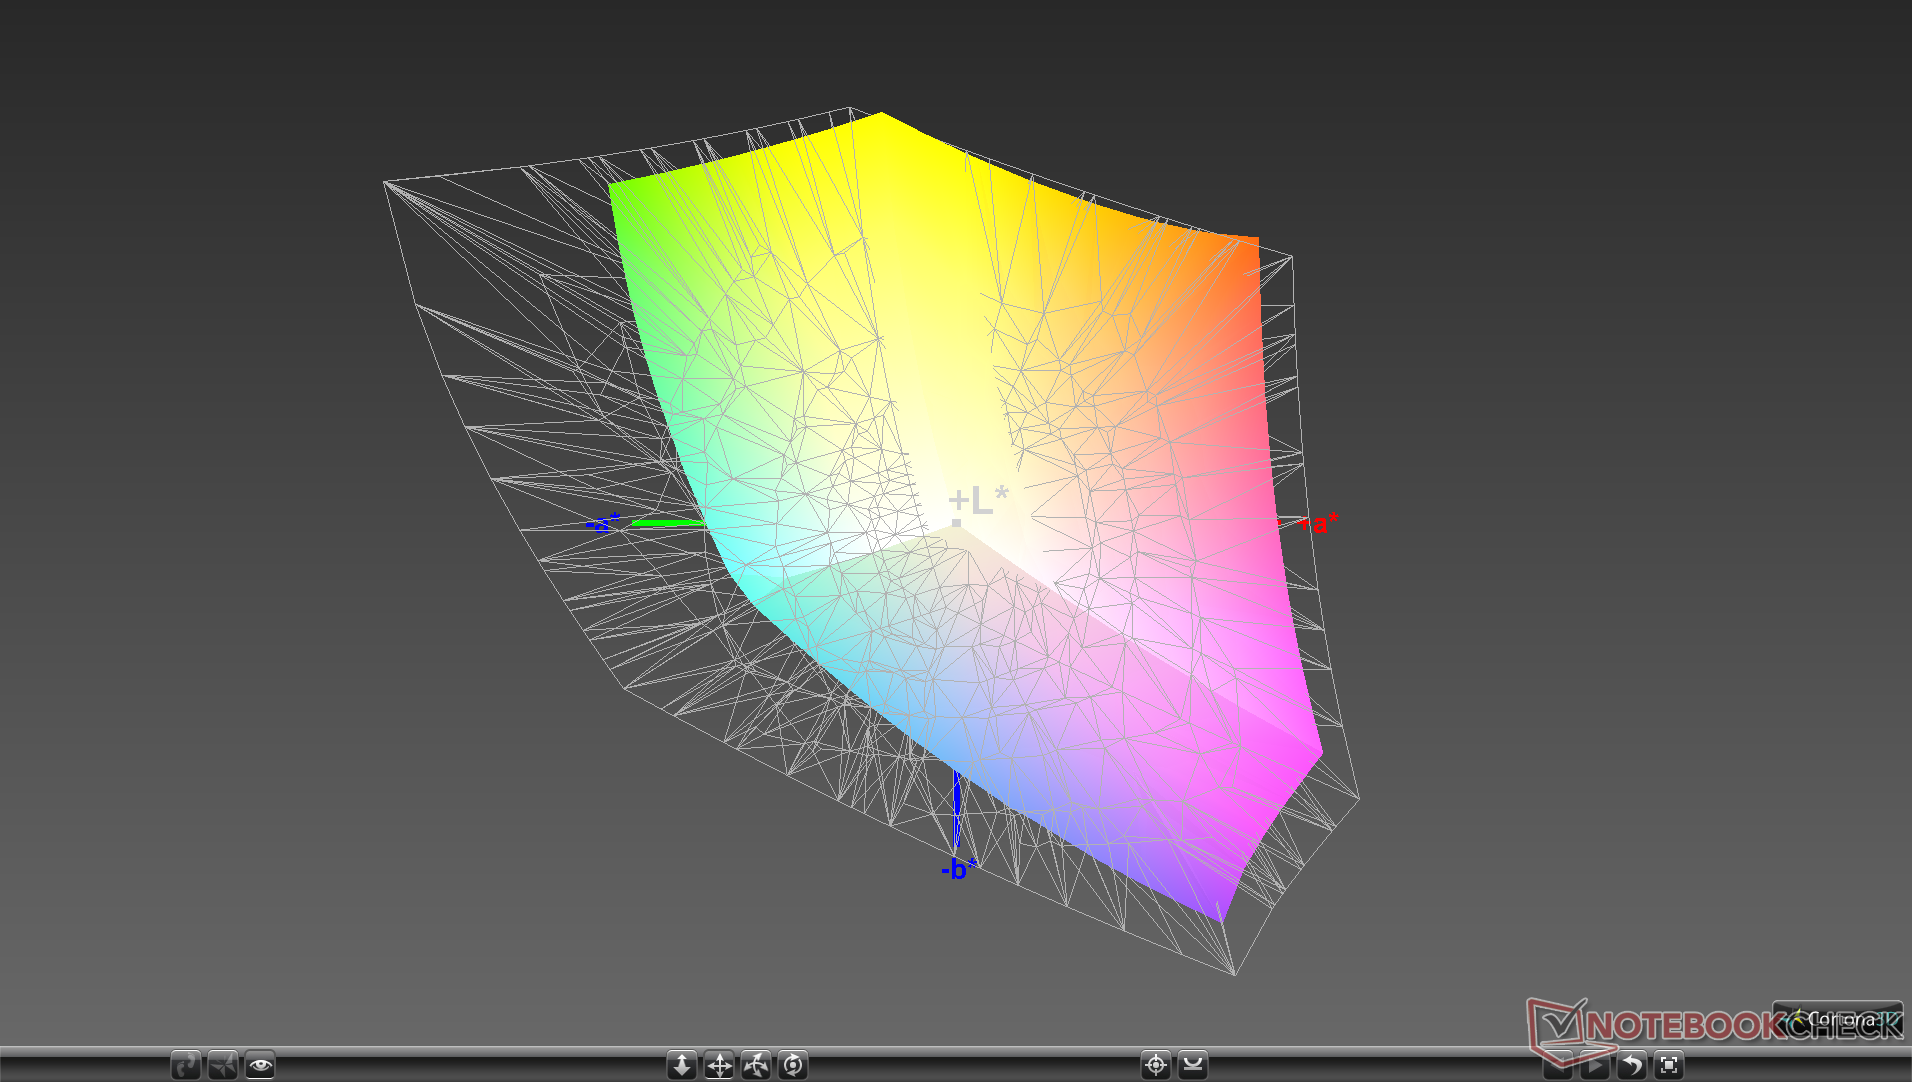
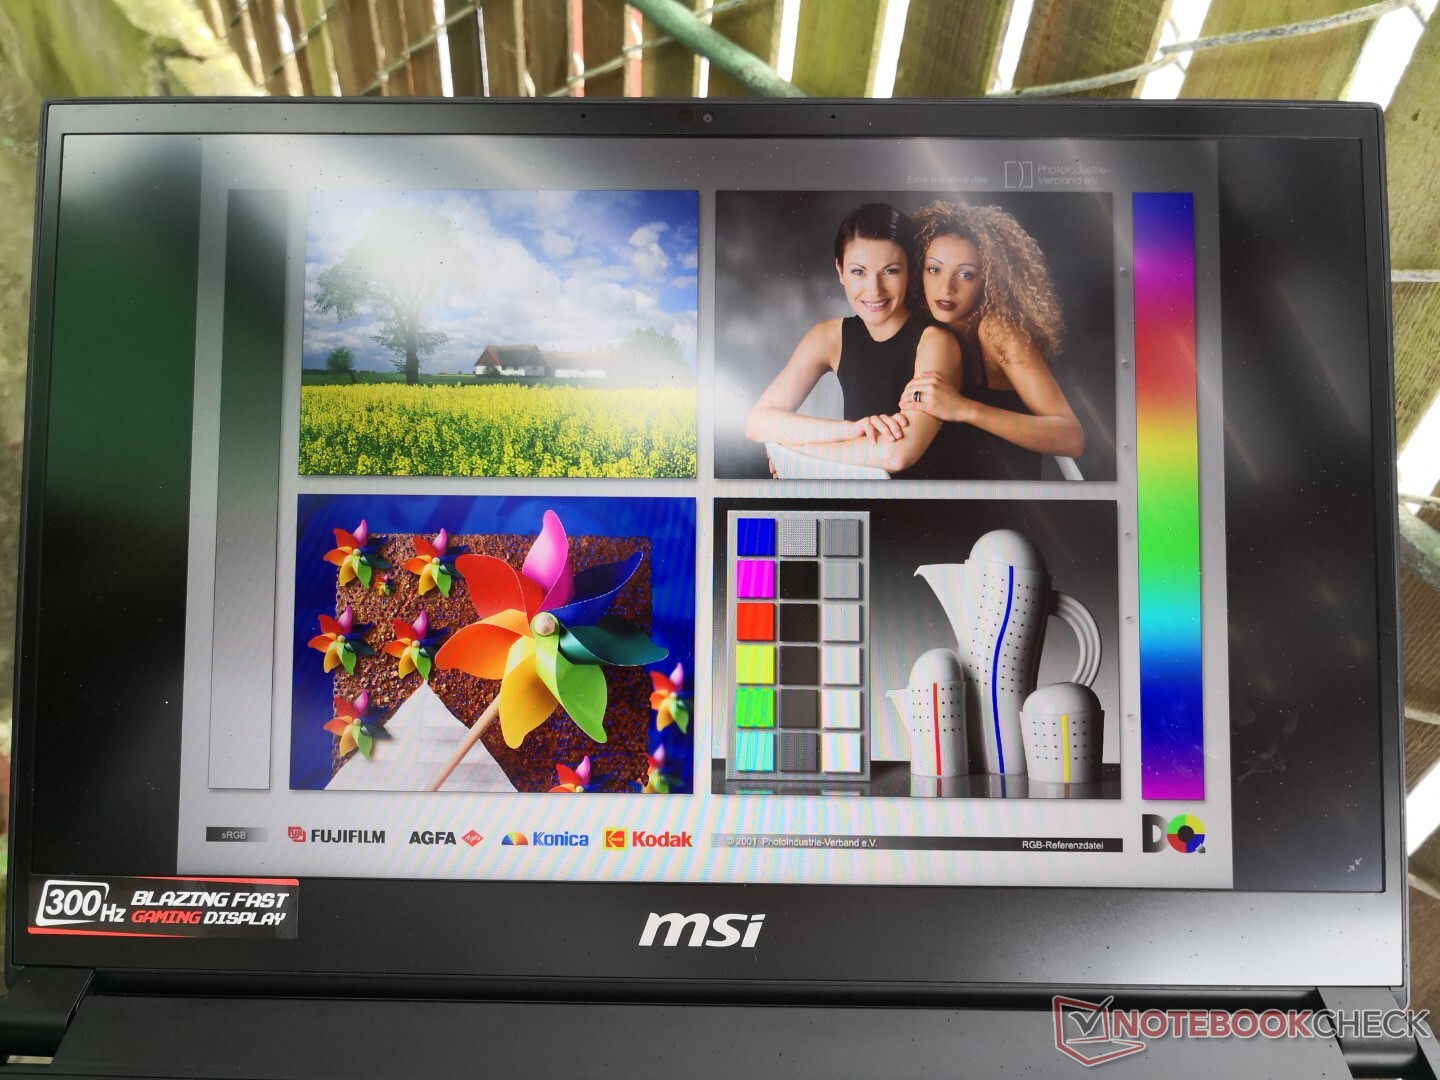
Görüntüle
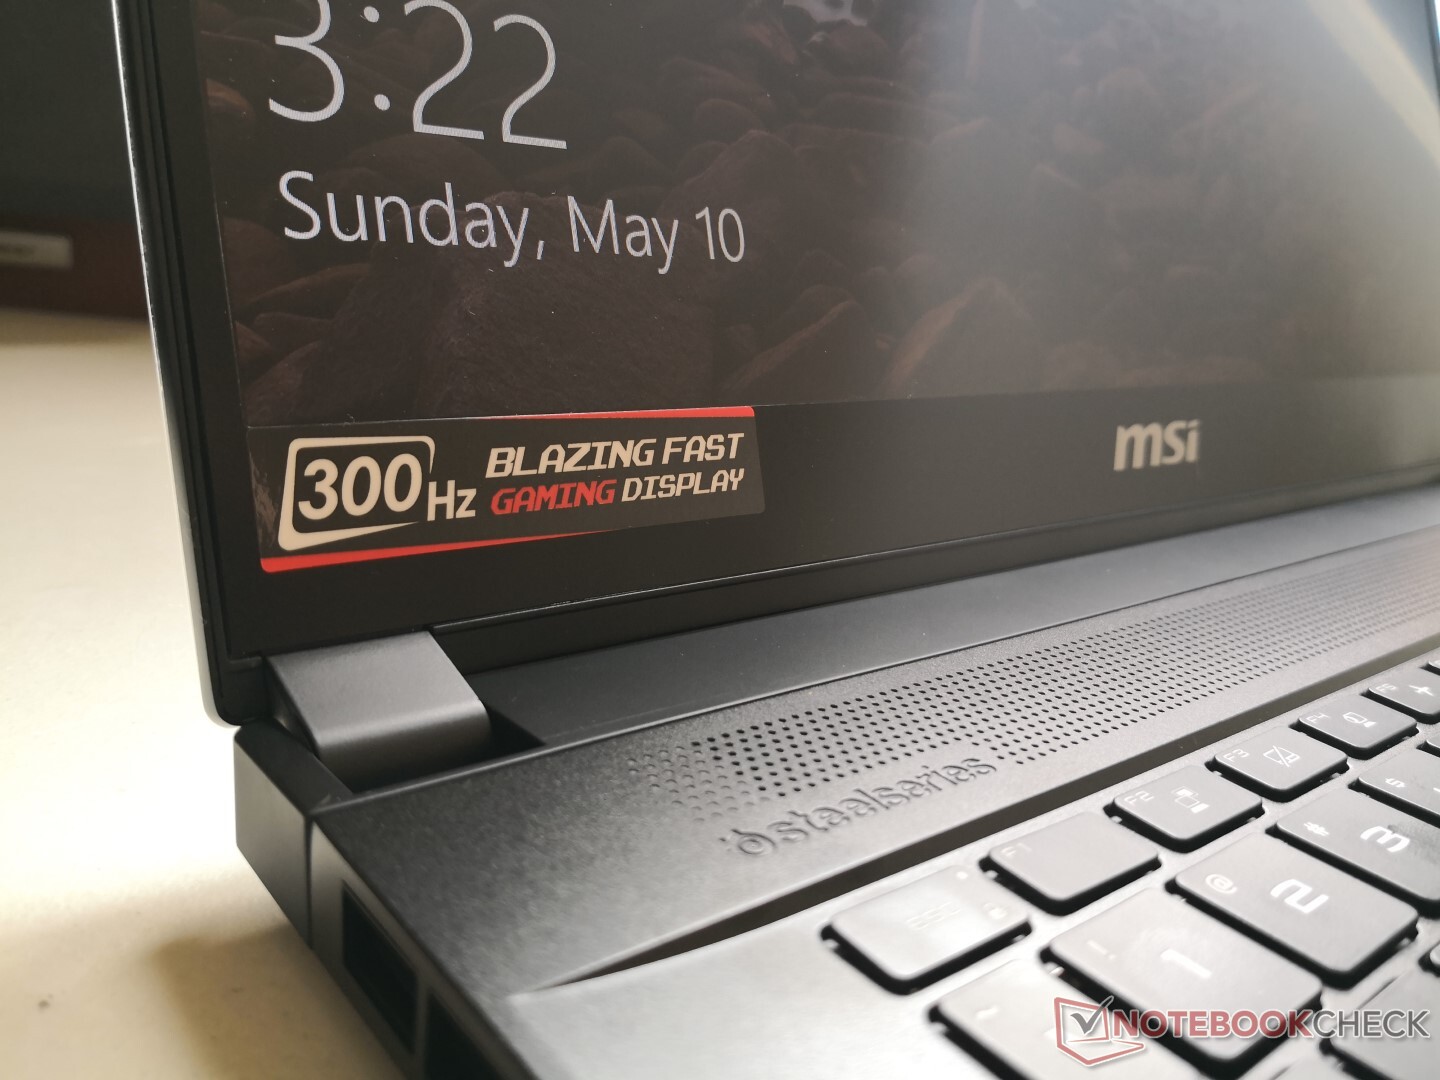
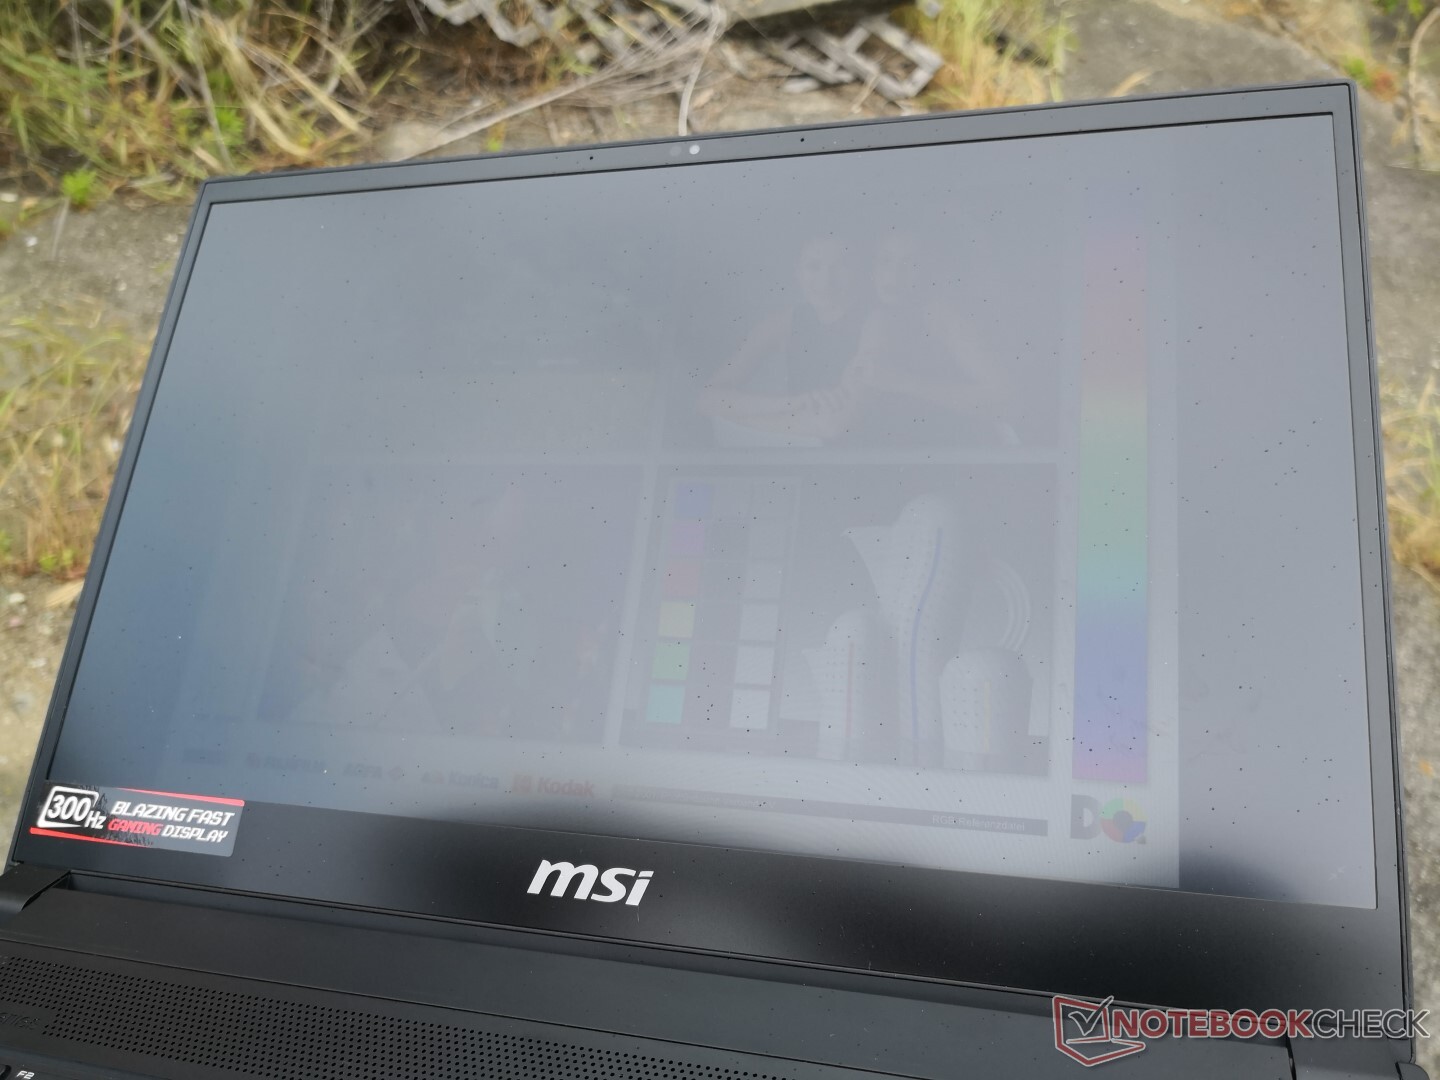
Mevcut tüm SKU'lar 240 Hz veya 300 Hz'de 1080p ekranlarla birlikte gelir. İkinci GS66 test birimimiz, ilk test birimimizde bulunanla aynı 300 Hz AUO B156HAN12.0 IPS panelini kullanır. Derin kontrast oranı (~ 1500: 1), geniş renk alanı (~ yüzde 100 sRGB) ve çok hızlı tepki süreleri (3 ms ila 5 ms), amiral gemisi oyun dizüstü bilgisayarlarına uygun yüksek kaliteli bir ekranı temsil etmek için sağlam kalır. Razer, aynı AU Optronics panelini kullanacak olan Blade 15 için de kendi 300 Hz ekran seçeneğini piyasaya sürmek üzere. 300 Hz ekrandan yararlanmak için oyunlarda 300 FPS'ye ulaşmanız gerekmediğini unutmayın. . Yine de, gelecekte QHD veya 4K UHD seçeneklerini görmek isteriz.

| |||||||||||||||||||||||||
Aydınlatma: 92 %
Batarya modunda parlaklık: 339.4 cd/m²
Kontrast: 1414:1 (Siyah: 0.24 cd/m²)
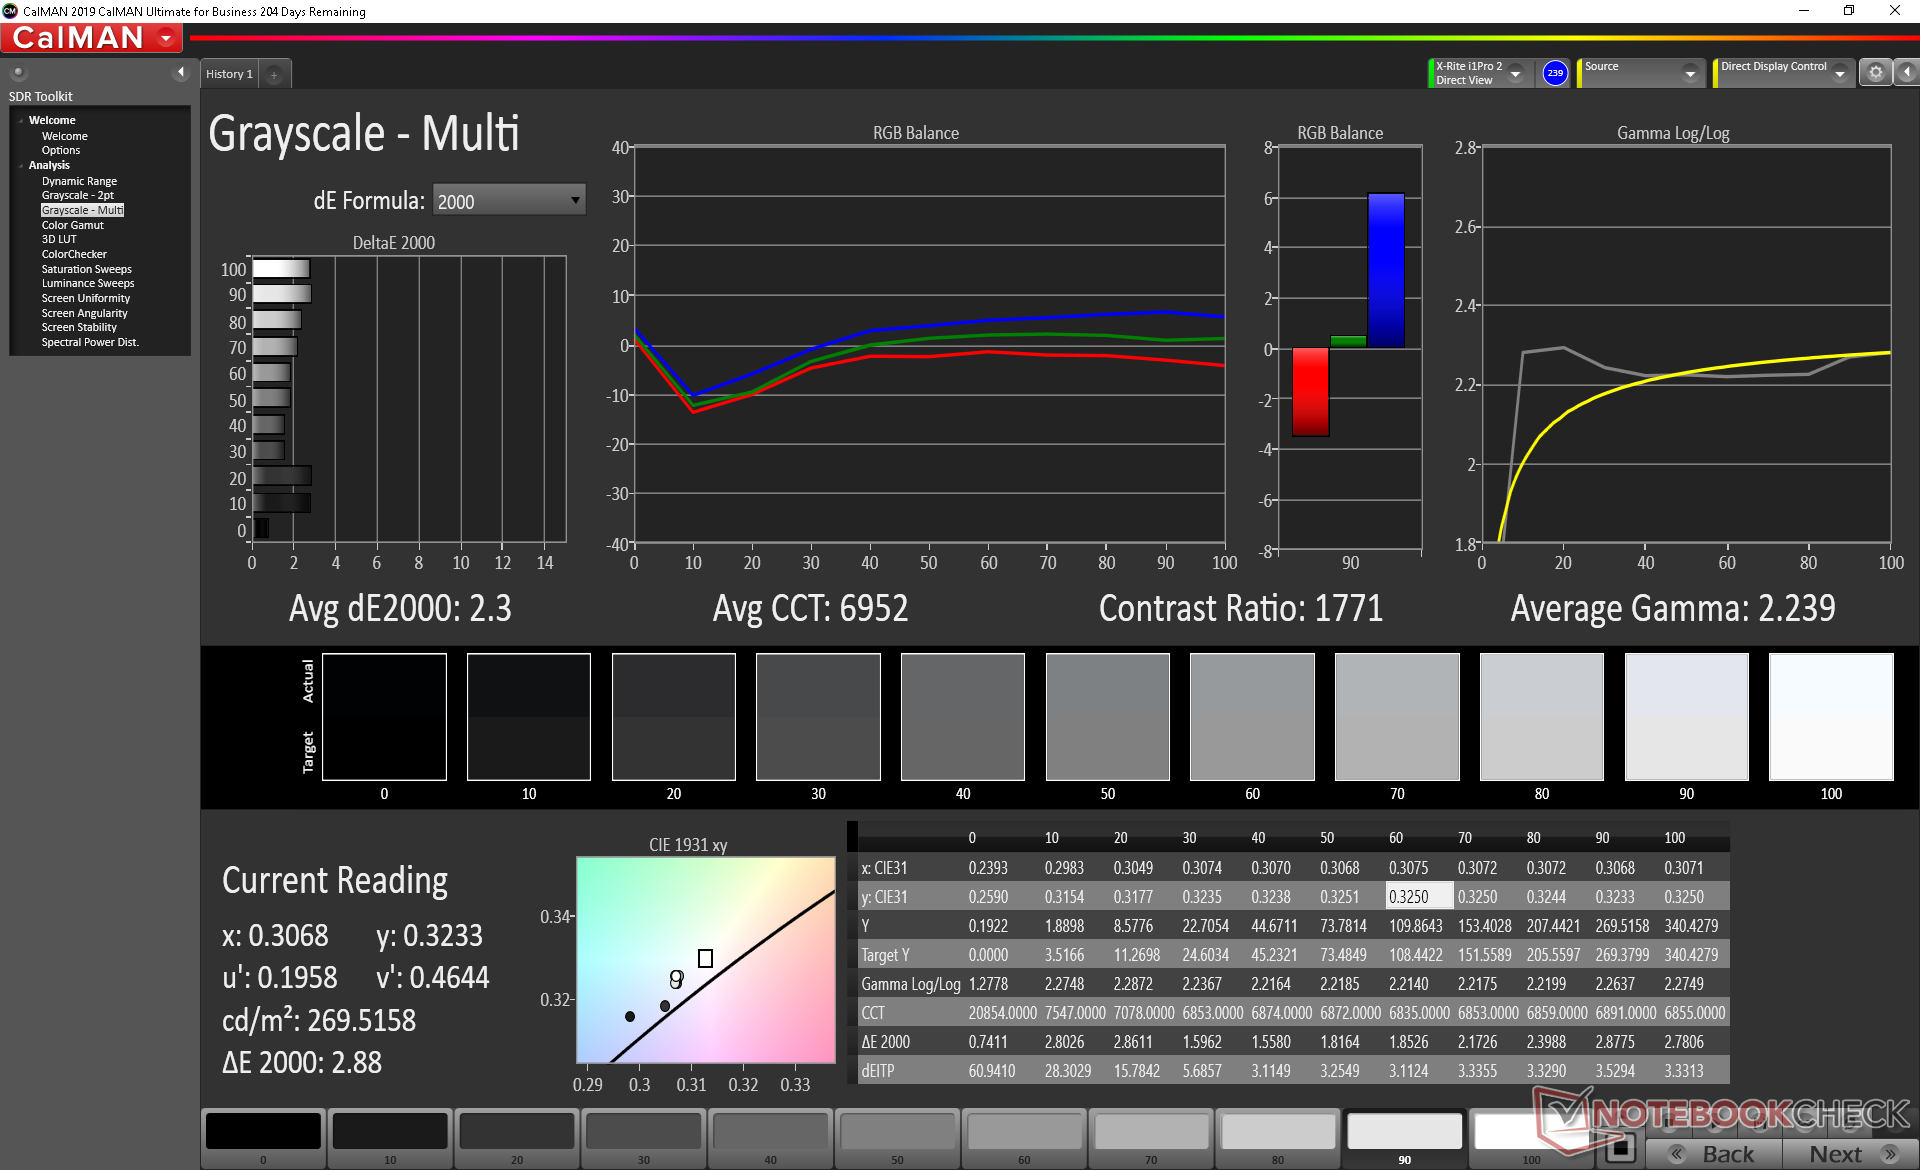
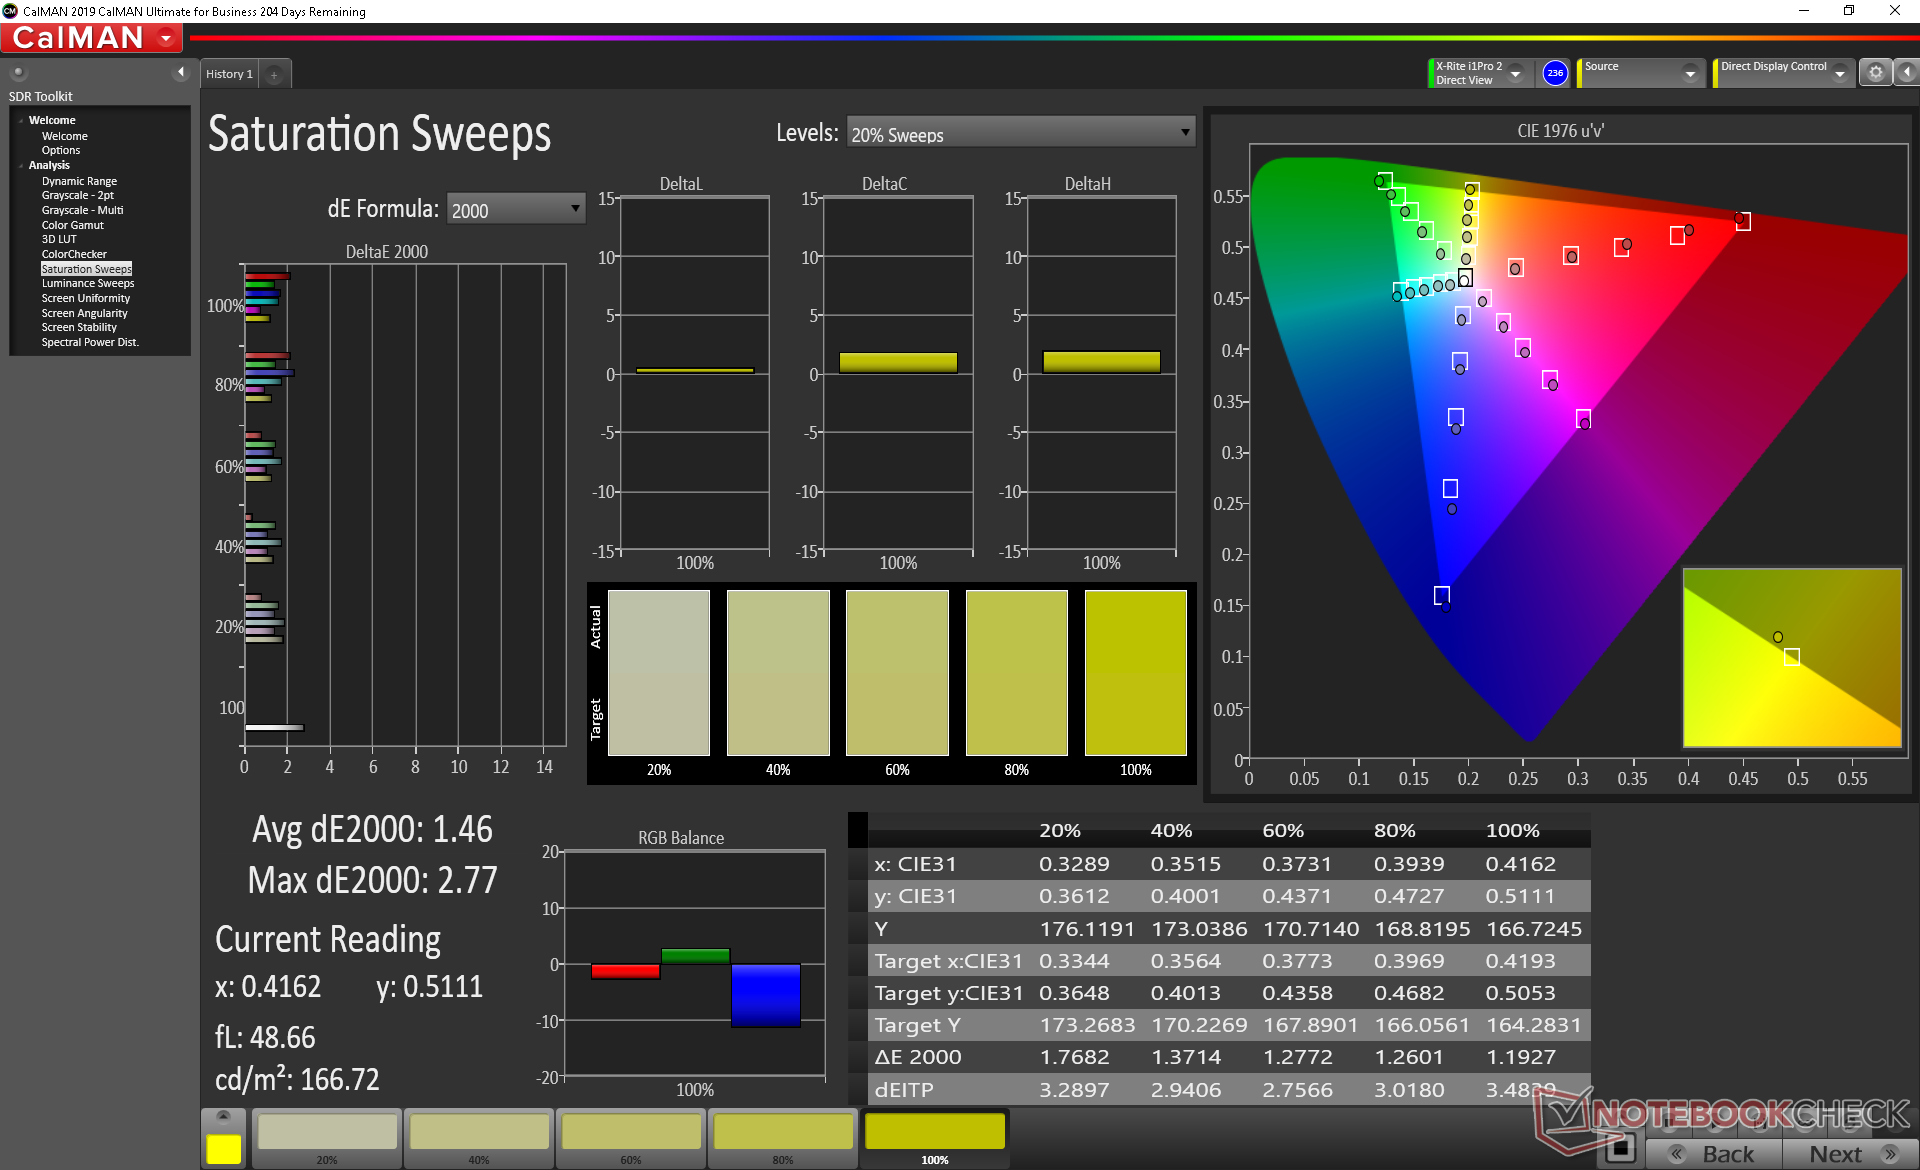
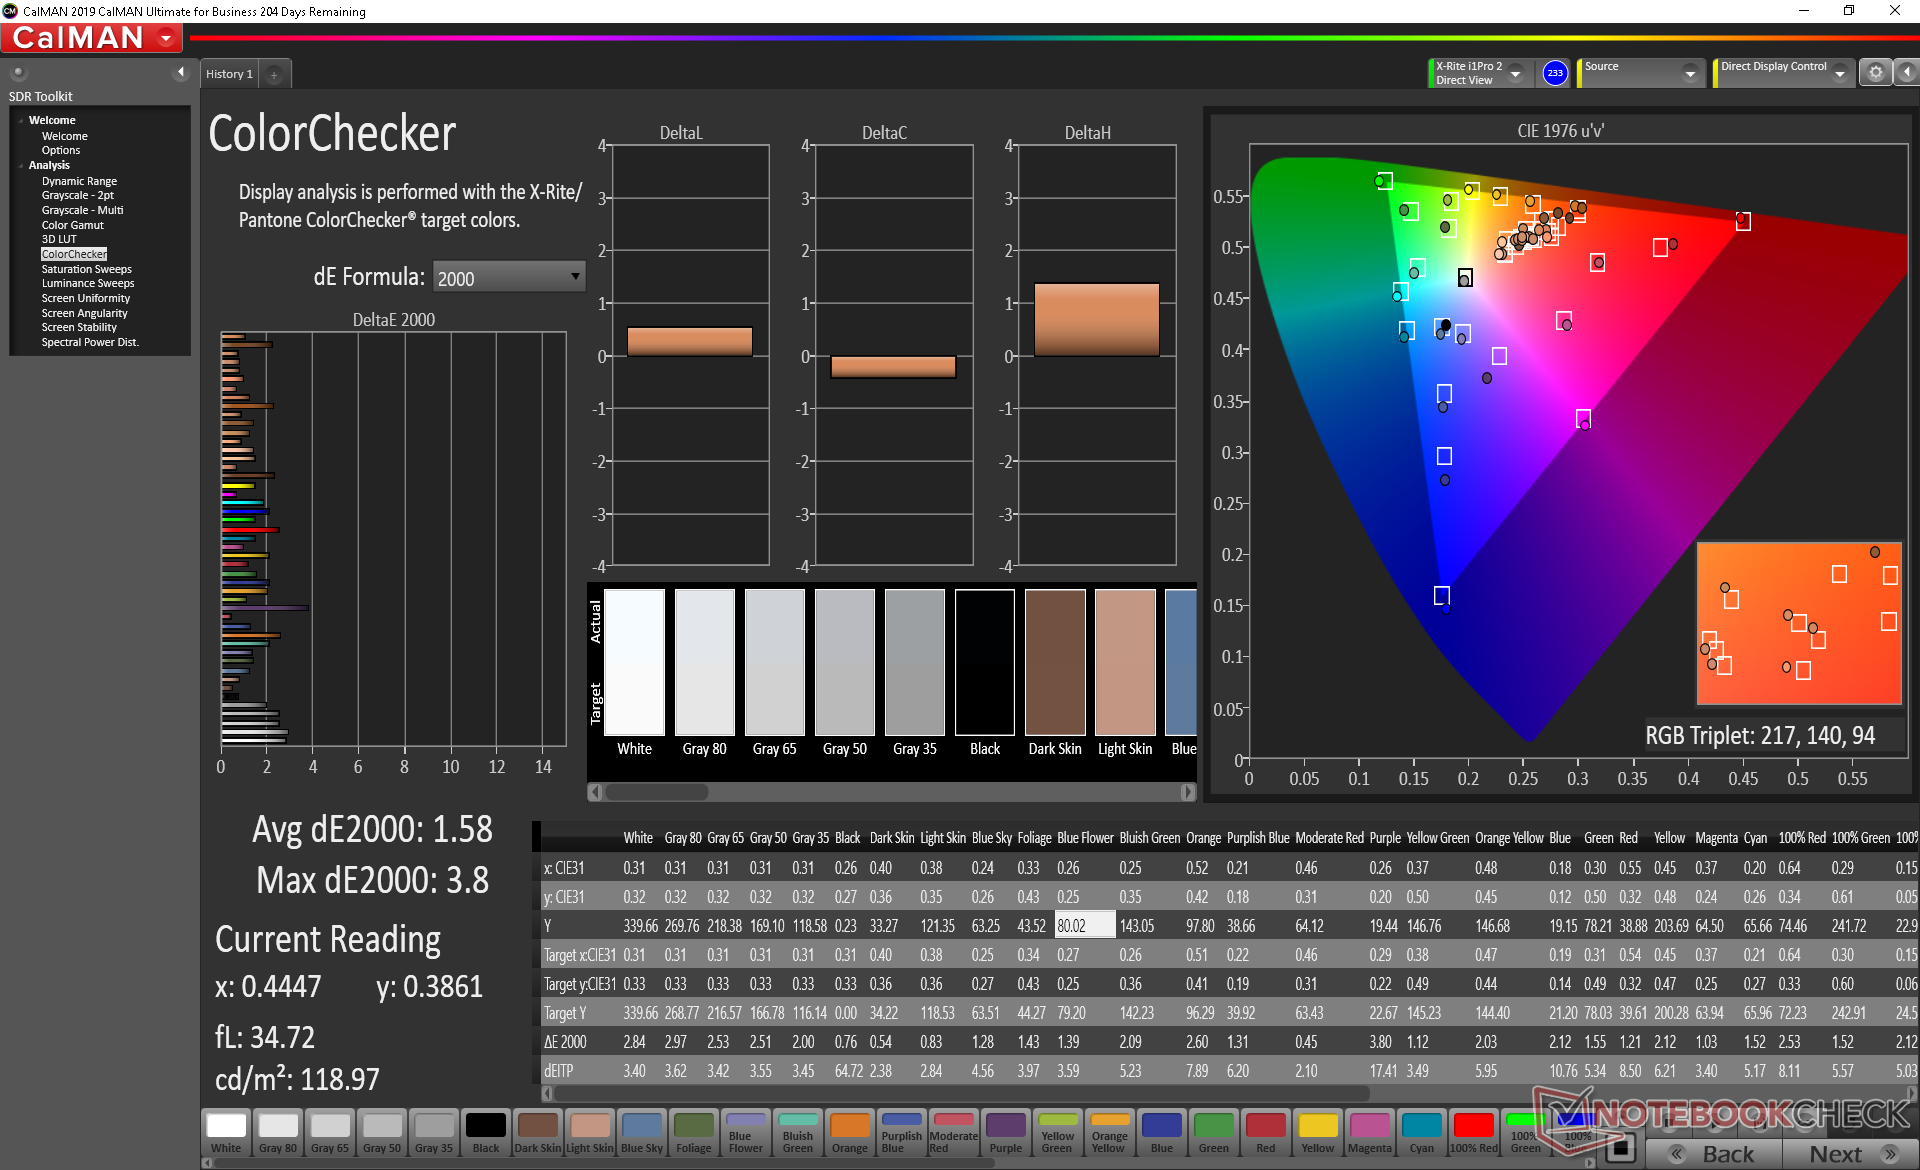
ΔE ColorChecker Calman: 1.58 | ∀{0.5-29.43 Ø4.73}
calibrated: 1.47
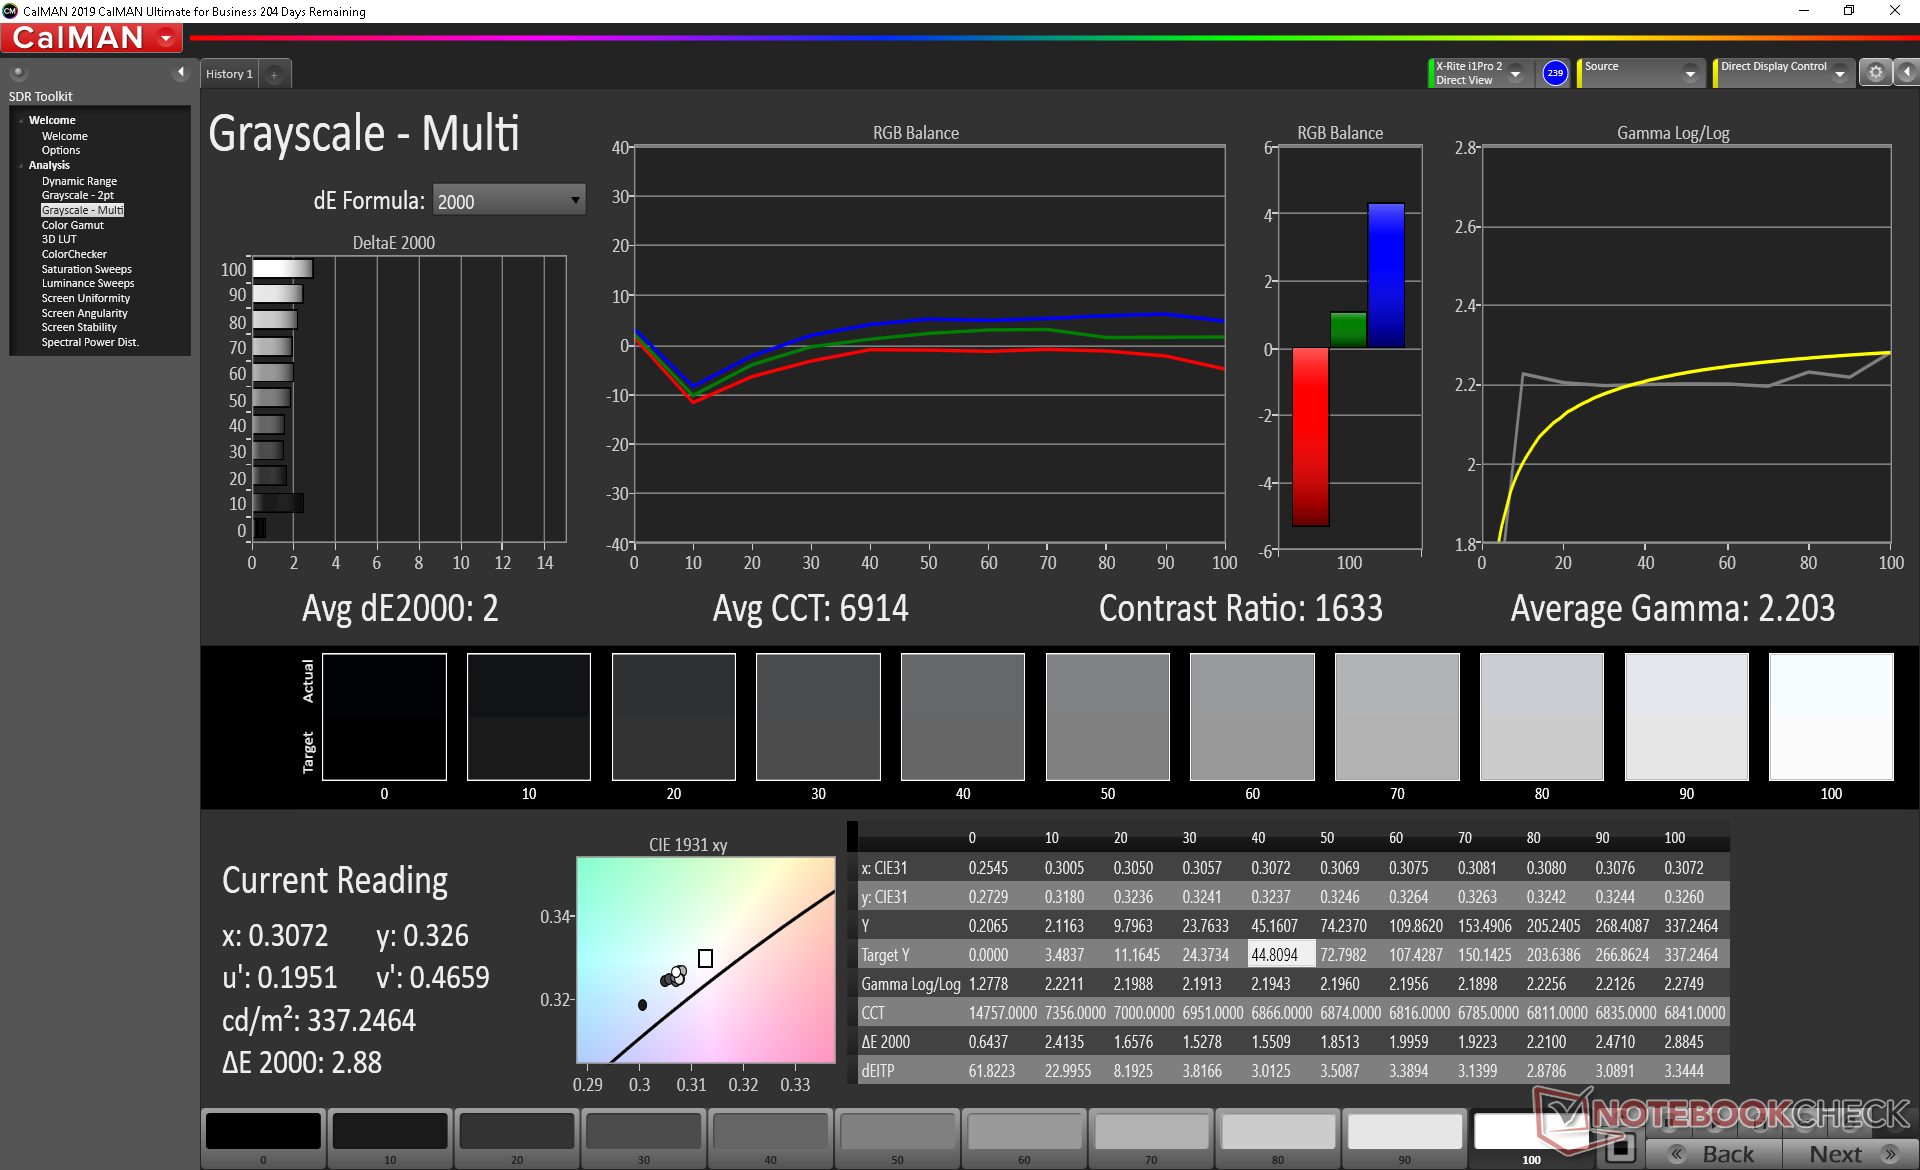
ΔE Greyscale Calman: 2.3 | ∀{0.09-98 Ø4.97}
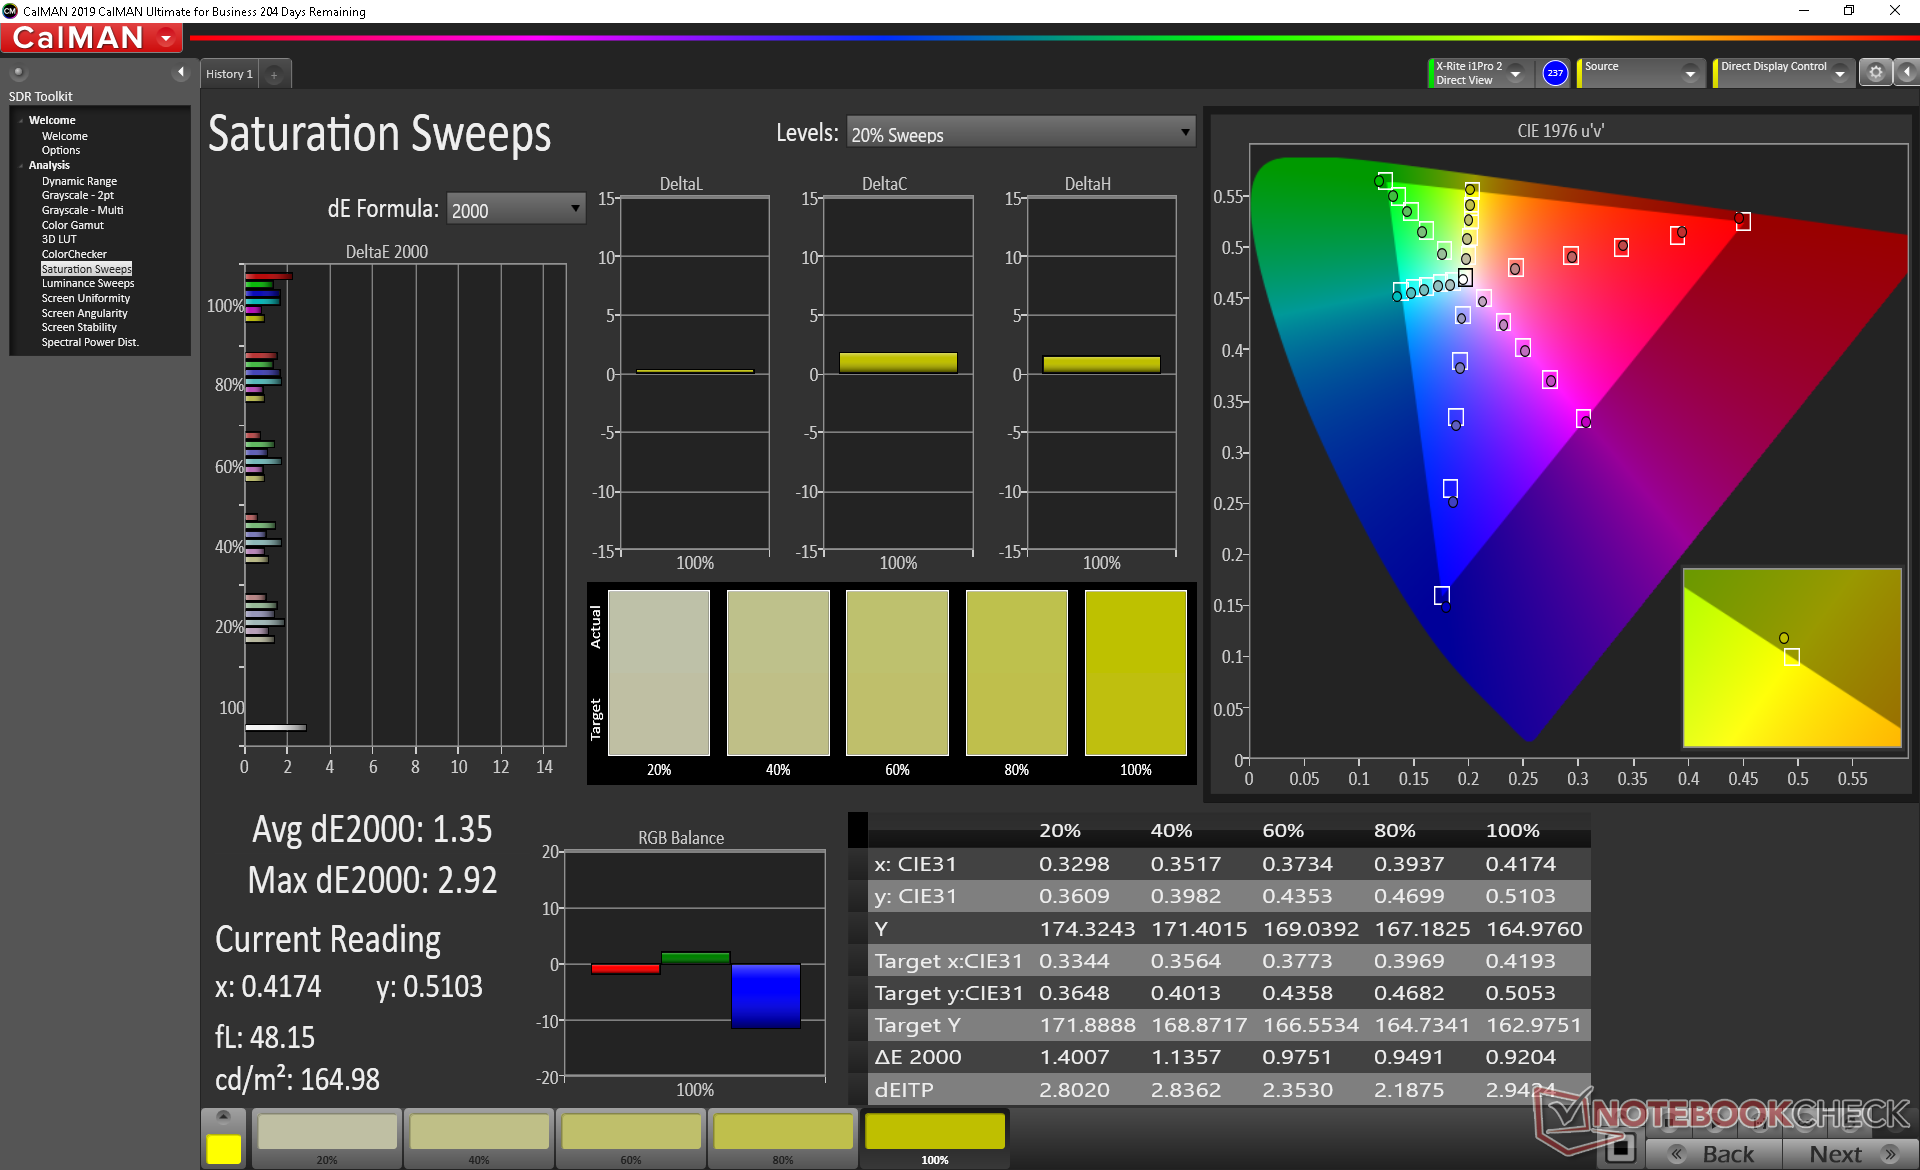
99.4% sRGB (Argyll 1.6.3 3D)
64.8% AdobeRGB 1998 (Argyll 1.6.3 3D)
71.1% AdobeRGB 1998 (Argyll 3D)
99.1% sRGB (Argyll 3D)
69.9% Display P3 (Argyll 3D)
Gamma: 2.24
CCT: 6952 K
| MSI GS66 10SGS AU Optronics B156HAN12.0, IPS, 15.6", 1920x1080 | MSI GS65 Stealth 9SG Sharp LQ156M1JW03 (SHP14C5), IPS, 15.6", 1920x1080 | Asus Zephyrus S GX502GW AU Optronics B156HAN08.2 (AUO82ED), IPS, 15.6", 1920x1080 | Razer Blade 15 RTX 2080 Max-Q Sharp LQ156M1JW03 (SHP14C5), IPS, 15.6", 1920x1080 | HP Omen X 2S 15-dg0075cl AU Optronics AUO82ED, IPS, 15.6", 1920x1080 | Lenovo Legion Y740-15ICHg BOE NV156FHM-N4J, IPS, 15.6", 1920x1080 | |
|---|---|---|---|---|---|---|
| Display | -3% | -7% | -3% | -6% | -6% | |
| Display P3 Coverage (%) | 69.9 | 67.6 -3% | 64.9 -7% | 66.9 -4% | 66.2 -5% | 67.7 -3% |
| sRGB Coverage (%) | 99.1 | 97.5 -2% | 91 -8% | 98.1 -1% | 92.3 -7% | 91.6 -8% |
| AdobeRGB 1998 Coverage (%) | 71.1 | 68.9 -3% | 65.9 -7% | 68.5 -4% | 67.2 -5% | 67.1 -6% |
| Response Times | -21% | 24% | -9% | -22% | -35% | |
| Response Time Grey 50% / Grey 80% * (ms) | 11.2 ? | 13.6 ? -21% | 7.2 ? 36% | 12.8 ? -14% | 15.2 ? -36% | 19 ? -70% |
| Response Time Black / White * (ms) | 10 ? | 12 ? -20% | 8.8 ? 12% | 10.4 ? -4% | 10.8 ? -8% | 10 ? -0% |
| PWM Frequency (Hz) | 23260 ? | 23810 ? | ||||
| Screen | -0% | -23% | -6% | -58% | -18% | |
| Brightness middle (cd/m²) | 339.4 | 282.3 -17% | 286 -16% | 293 -14% | 324.8 -4% | 477 41% |
| Brightness (cd/m²) | 331 | 269 -19% | 275 -17% | 270 -18% | 316 -5% | 431 30% |
| Brightness Distribution (%) | 92 | 90 -2% | 90 -2% | 87 -5% | 84 -9% | 84 -9% |
| Black Level * (cd/m²) | 0.24 | 0.32 -33% | 0.37 -54% | 0.29 -21% | 0.26 -8% | 0.175 27% |
| Contrast (:1) | 1414 | 882 -38% | 773 -45% | 1010 -29% | 1249 -12% | 2726 93% |
| Colorchecker dE 2000 * | 1.58 | 1.17 26% | 2.19 -39% | 1.69 -7% | 4.96 -214% | 4.17 -164% |
| Colorchecker dE 2000 max. * | 3.8 | 3.29 13% | 4.4 -16% | 3.37 11% | 8.95 -136% | 6.97 -83% |
| Colorchecker dE 2000 calibrated * | 1.47 | 1.06 28% | 2.27 -54% | 1.24 16% | 3.23 -120% | 2.51 -71% |
| Greyscale dE 2000 * | 2.3 | 1.3 43% | 2.2 4% | 2.3 -0% | 5 -117% | 3.49 -52% |
| Gamma | 2.24 98% | 2.2 100% | 2.41 91% | 2.3 96% | 2.21 100% | 2.5 88% |
| CCT | 6952 93% | 6643 98% | 6405 101% | 6758 96% | 7742 84% | 7076 92% |
| Color Space (Percent of AdobeRGB 1998) (%) | 64.8 | 63.8 -2% | 59 -9% | 63 -3% | 59.8 -8% | 60 -7% |
| Color Space (Percent of sRGB) (%) | 99.4 | 97.5 -2% | 91 -8% | 98.5 -1% | 91.8 -8% | 91 -8% |
| Toplam Ortalama (Program / Ayarlar) | -8% /
-3% | -2% /
-14% | -6% /
-6% | -29% /
-44% | -20% /
-18% |
* ... daha küçük daha iyidir
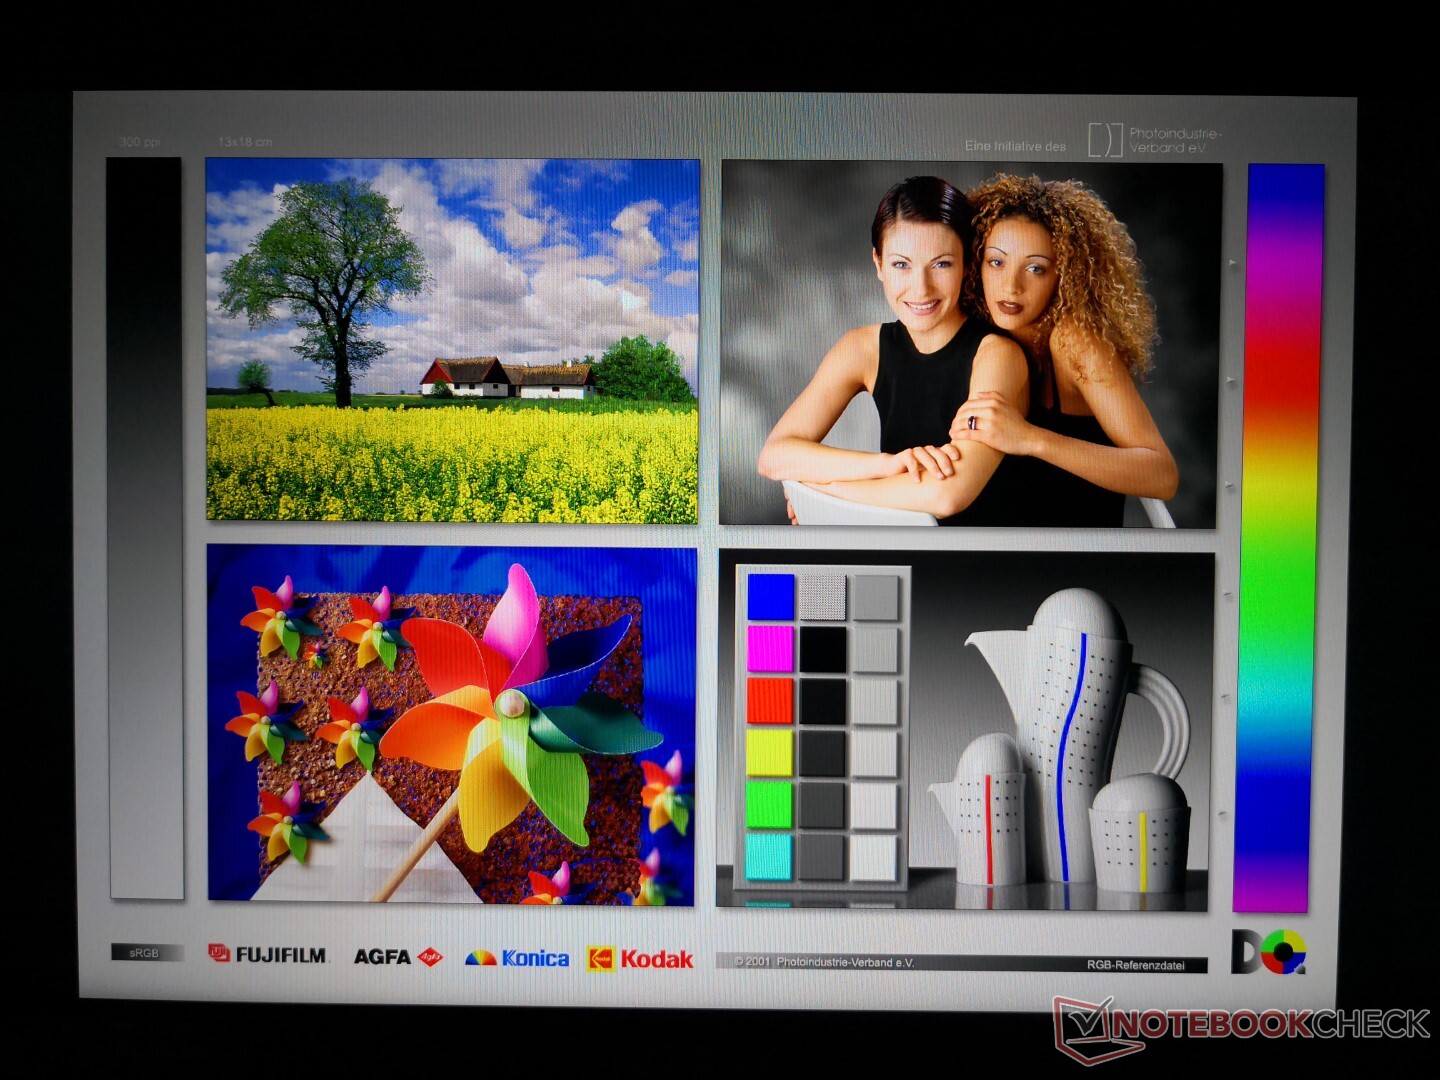
X-Rite kolorimetre ölçümleri kutudan iyi kalibre edilmiş bir ekran gösterir ve ekranı daha da kalibre etme girişimimiz büyük gelişmelerle sonuçlanmaz. Ortalama DeltaE gri tonlama ve ColorChecker değerleri sırasıyla 2.3 ve 1.58'de zaten mükemmel. Önceden yüklenmiş MSI True Color yazılımı, renklerin ve renk sıcaklığının kolay ayarlanmasını sağlar.

Yanıt Sürelerini Görüntüle
| ↔ Tepki Süresi Siyahtan Beyaza | ||
|---|---|---|
| 10 ms ... yükseliş ↗ ve sonbahar↘ birleşimi | ↗ 5.2 ms yükseliş | 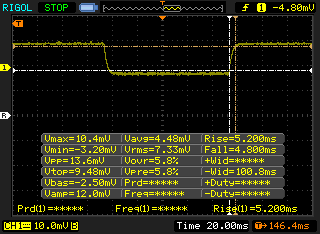 |
| ↘ 4.8 ms sonbahar | ||
| Ekran, testlerimizde iyi yanıt oranları gösteriyor ancak rekabetçi oyuncular için çok yavaş olabilir. Karşılaştırıldığında, test edilen tüm cihazlar 0.1 (minimum) ile 240 (maksimum) ms arasında değişir. » Tüm cihazların 27 %'si daha iyi. Bu, ölçülen yanıt süresinin test edilen tüm cihazların ortalamasından (19.9 ms) daha iyi olduğu anlamına gelir. | ||
| ↔ Tepki Süresi %50 Griden %80 Griye | ||
| 11.2 ms ... yükseliş ↗ ve sonbahar↘ birleşimi | ↗ 6 ms yükseliş | 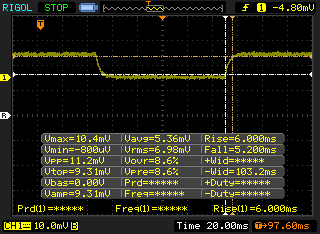 |
| ↘ 5.2 ms sonbahar | ||
| Ekran, testlerimizde iyi yanıt oranları gösteriyor ancak rekabetçi oyuncular için çok yavaş olabilir. Karşılaştırıldığında, test edilen tüm cihazlar 0.165 (minimum) ile 636 (maksimum) ms arasında değişir. » Tüm cihazların 25 %'si daha iyi. Bu, ölçülen yanıt süresinin test edilen tüm cihazların ortalamasından (31.1 ms) daha iyi olduğu anlamına gelir. | ||
Ekran Titremesi / PWM (Darbe Genişliği Modülasyonu)
| Ekran titriyor / PWM algılanmadı | 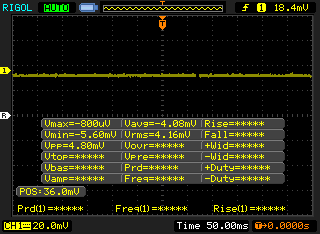 | ||
Karşılaştırıldığında: Test edilen tüm cihazların %52 %'si ekranı karartmak için PWM kullanmıyor. PWM tespit edilirse, ortalama 7794 (minimum: 5 - maksimum: 343500) Hz ölçüldü. | |||
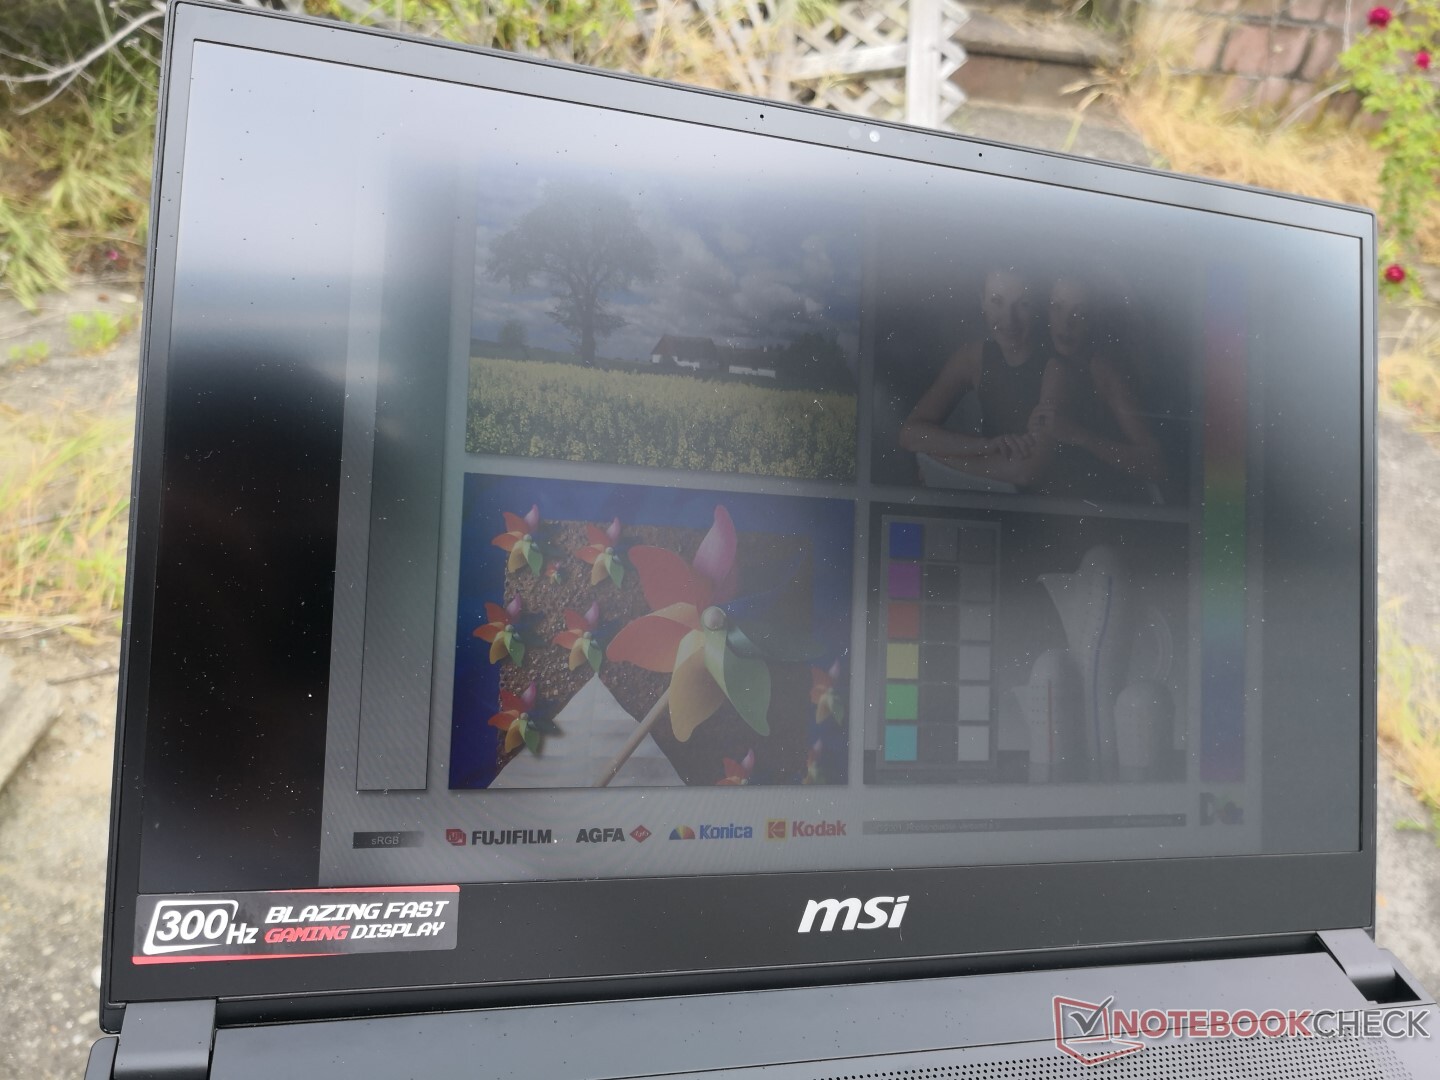
Dış mekan görünürlüğü, çoğu oyun dizüstü bilgisayarından daha iyi veya daha kötü değildir, çünkü 300 nit ekran parlaklığı kategori için tipiktir. MSI, daha kolay hafifletme veya parlama için 180 derecelik menteşeler nedeniyle hala hafif bir avantaja sahiptir.
Verim
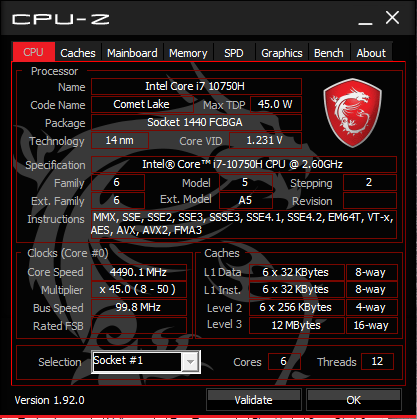
İşlemci
10. nesil hexa-core Core i7-10750H, 2019'un neredeyse tüm oyun dizüstü bilgisayarlarında bulunan 9. nesil Core i7-9750H'nin yerini alıyor. Genel performans, Core i9-8950HK'ya en çok benziyor veya ortalama Core i7- 9750H dizüstü bilgisayar. Çok eski Core i7-7700HQ veya Core i7-8750H serisinden yükseltme yapan kullanıcılar en fazla yararı görecek. Tabii ki, Core i9-9880H, Core i7-10875H veya Core i9-10980HK gibi sekiz çekirdekli çözümler hala Core i7-10750H'den daha iyi performans gösterecektir. MSI, yaklaşık yüzde 27 ila 34 daha hızlı çok iş parçacığı performansı sunar. CineBench R15 Multi-Thread'ı bir döngüde çalıştırmak, MSI GP65 10SFK'da gözlemlediğimiz gibi termal sınırlamalar nedeniyle zaman içinde yüzde 4 ila 5 düşmeden önce 1271 puanlık bir başlangıç puanı gösterir.Çekirdek i7-10750H daha fazla teknik bilgi ve kıyaslama karşılaştırmaları.
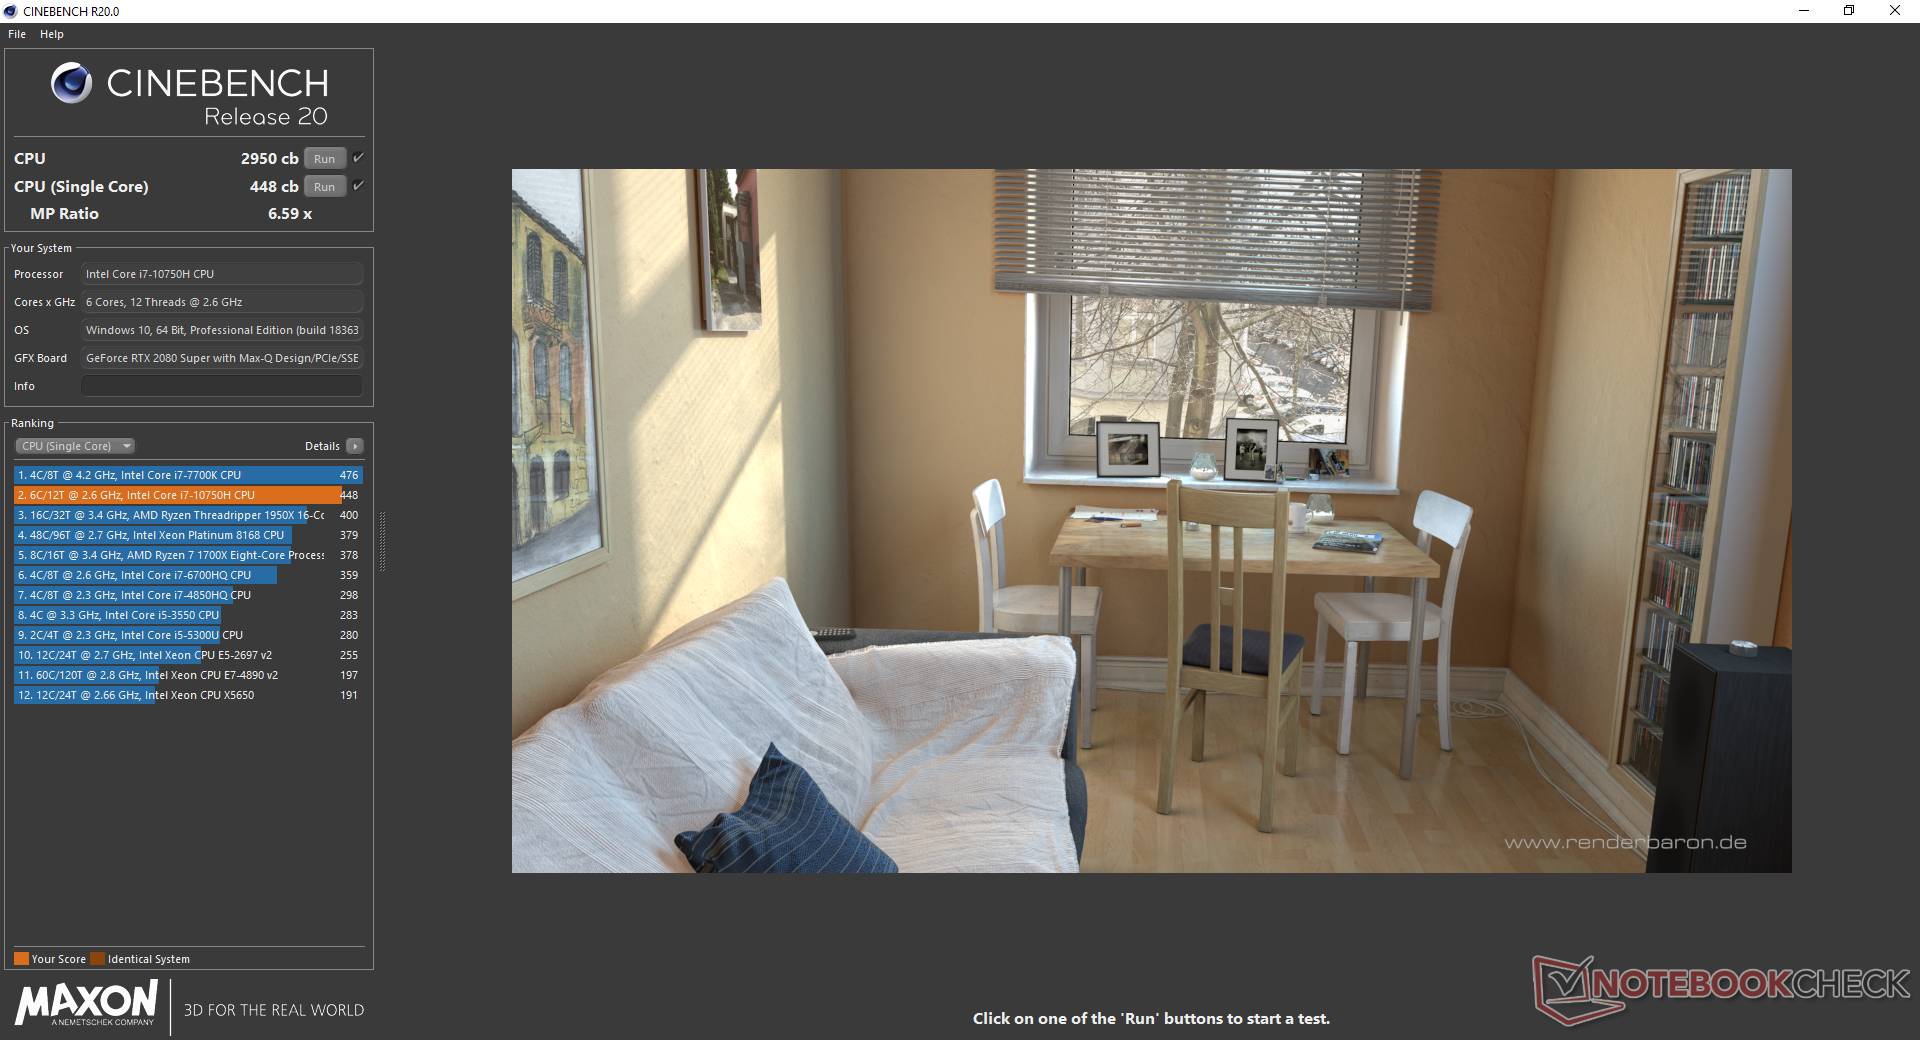

Cinebench R15: CPU Multi 64Bit | CPU Single 64Bit
Blender: v2.79 BMW27 CPU
7-Zip 18.03: 7z b 4 -mmt1 | 7z b 4
Geekbench 5.5: Single-Core | Multi-Core
HWBOT x265 Benchmark v2.2: 4k Preset
LibreOffice : 20 Documents To PDF
R Benchmark 2.5: Overall mean
| Cinebench R20 / CPU (Multi Core) | |
| Asus Zephyrus G14 GA401IV | |
| Gigabyte Aero 15 OLED XB-8DE51B0SP | |
| MSI GS66 Stealth 10SFS | |
| MSI GE65 Raider 9SF-049US | |
| MSI GS66 10SGS | |
| Medion Erazer X15805 | |
| Ortalama Intel Core i7-10750H (1749 - 3325, n=43) | |
| Ortalama Intel Core i7-9750H (2017 - 3133, n=55) | |
| Schenker XMG Pro 15 | |
| MSI GE63 Raider 8SG | |
| MSI GF75 Thin 10SCXR | |
| MSI GF63 Thin 9SC | |
| Cinebench R20 / CPU (Single Core) | |
| Gigabyte Aero 15 OLED XB-8DE51B0SP | |
| Medion Erazer X15805 | |
| Asus Zephyrus G14 GA401IV | |
| MSI GS66 Stealth 10SFS | |
| MSI GE65 Raider 9SF-049US | |
| Ortalama Intel Core i7-10750H (431 - 504, n=43) | |
| MSI GS66 10SGS | |
| Ortalama Intel Core i7-9750H (416 - 486, n=55) | |
| MSI GF75 Thin 10SCXR | |
| Schenker XMG Pro 15 | |
| MSI GF63 Thin 9SC | |
| MSI GE63 Raider 8SG | |
| Cinebench R15 / CPU Multi 64Bit | |
| Asus Zephyrus G14 GA401IV | |
| Gigabyte Aero 15 OLED XB-8DE51B0SP | |
| MSI GS66 Stealth 10SFS | |
| MSI GE65 Raider 9SF-049US | |
| MSI GS66 10SGS | |
| Ortalama Intel Core i7-10750H (804 - 1418, n=50) | |
| Medion Erazer X15805 | |
| Ortalama Intel Core i7-9750H (952 - 1306, n=85) | |
| Schenker XMG Pro 15 | |
| MSI GE63 Raider 8SG | |
| MSI GF75 Thin 10SCXR | |
| MSI GF63 Thin 9SC | |
| Cinebench R15 / CPU Single 64Bit | |
| Gigabyte Aero 15 OLED XB-8DE51B0SP | |
| Medion Erazer X15805 | |
| MSI GS66 Stealth 10SFS | |
| MSI GE65 Raider 9SF-049US | |
| Ortalama Intel Core i7-10750H (184 - 213, n=45) | |
| Asus Zephyrus G14 GA401IV | |
| MSI GS66 10SGS | |
| Ortalama Intel Core i7-9750H (170 - 194, n=82) | |
| MSI GF75 Thin 10SCXR | |
| Schenker XMG Pro 15 | |
| MSI GF63 Thin 9SC | |
| MSI GE63 Raider 8SG | |
| Blender / v2.79 BMW27 CPU | |
| MSI GF75 Thin 10SCXR | |
| Schenker XMG Pro 15 | |
| Ortalama Intel Core i7-9750H (342 - 495, n=21) | |
| Ortalama Intel Core i7-10750H (322 - 587, n=43) | |
| MSI GS66 10SGS | |
| Asus Zephyrus G14 GA401IV | |
| MSI GS66 Stealth 10SFS | |
| Gigabyte Aero 15 OLED XB-8DE51B0SP | |
| 7-Zip 18.03 / 7z b 4 -mmt1 | |
| Gigabyte Aero 15 OLED XB-8DE51B0SP | |
| MSI GS66 Stealth 10SFS | |
| Ortalama Intel Core i7-10750H (4504 - 5470, n=43) | |
| MSI GS66 10SGS | |
| Ortalama Intel Core i7-9750H (4580 - 5090, n=21) | |
| MSI GF75 Thin 10SCXR | |
| Asus Zephyrus G14 GA401IV | |
| Schenker XMG Pro 15 | |
| 7-Zip 18.03 / 7z b 4 | |
| Asus Zephyrus G14 GA401IV | |
| Gigabyte Aero 15 OLED XB-8DE51B0SP | |
| MSI GS66 Stealth 10SFS | |
| MSI GS66 10SGS | |
| Ortalama Intel Core i7-10750H (26040 - 37345, n=43) | |
| Schenker XMG Pro 15 | |
| Ortalama Intel Core i7-9750H (28512 - 35174, n=21) | |
| MSI GF75 Thin 10SCXR | |
| Geekbench 5.5 / Single-Core | |
| Gigabyte Aero 15 OLED XB-8DE51B0SP | |
| MSI GS66 Stealth 10SFS | |
| Ortalama Intel Core i7-10750H (1114 - 1333, n=43) | |
| Asus Zephyrus G14 GA401IV | |
| MSI GS66 10SGS | |
| Ortalama Intel Core i7-9750H (1117 - 1251, n=13) | |
| MSI GF75 Thin 10SCXR | |
| Schenker XMG Pro 15 | |
| Geekbench 5.5 / Multi-Core | |
| Gigabyte Aero 15 OLED XB-8DE51B0SP | |
| Asus Zephyrus G14 GA401IV | |
| MSI GS66 Stealth 10SFS | |
| MSI GS66 10SGS | |
| Ortalama Intel Core i7-10750H (4443 - 6674, n=43) | |
| Schenker XMG Pro 15 | |
| Ortalama Intel Core i7-9750H (4859 - 6262, n=13) | |
| MSI GF75 Thin 10SCXR | |
| HWBOT x265 Benchmark v2.2 / 4k Preset | |
| Gigabyte Aero 15 OLED XB-8DE51B0SP | |
| MSI GS66 Stealth 10SFS | |
| Asus Zephyrus G14 GA401IV | |
| MSI GS66 10SGS | |
| Ortalama Intel Core i7-10750H (5.54 - 11.6, n=43) | |
| Schenker XMG Pro 15 | |
| Ortalama Intel Core i7-9750H (7.1 - 10.7, n=21) | |
| MSI GF75 Thin 10SCXR | |
| LibreOffice / 20 Documents To PDF | |
| Ortalama Intel Core i7-9750H (54.5 - 64.7, n=9) | |
| MSI GF75 Thin 10SCXR | |
| MSI GS66 10SGS | |
| Ortalama Intel Core i7-10750H (43.1 - 99.2, n=43) | |
| MSI GS66 Stealth 10SFS | |
| Gigabyte Aero 15 OLED XB-8DE51B0SP | |
| R Benchmark 2.5 / Overall mean | |
| MSI GF75 Thin 10SCXR | |
| Schenker XMG Pro 15 | |
| Ortalama Intel Core i7-9750H (0.608 - 0.695, n=14) | |
| MSI GS66 10SGS | |
| Ortalama Intel Core i7-10750H (0.578 - 0.708, n=42) | |
| MSI GS66 Stealth 10SFS | |
| Gigabyte Aero 15 OLED XB-8DE51B0SP | |
* ... daha küçük daha iyidir
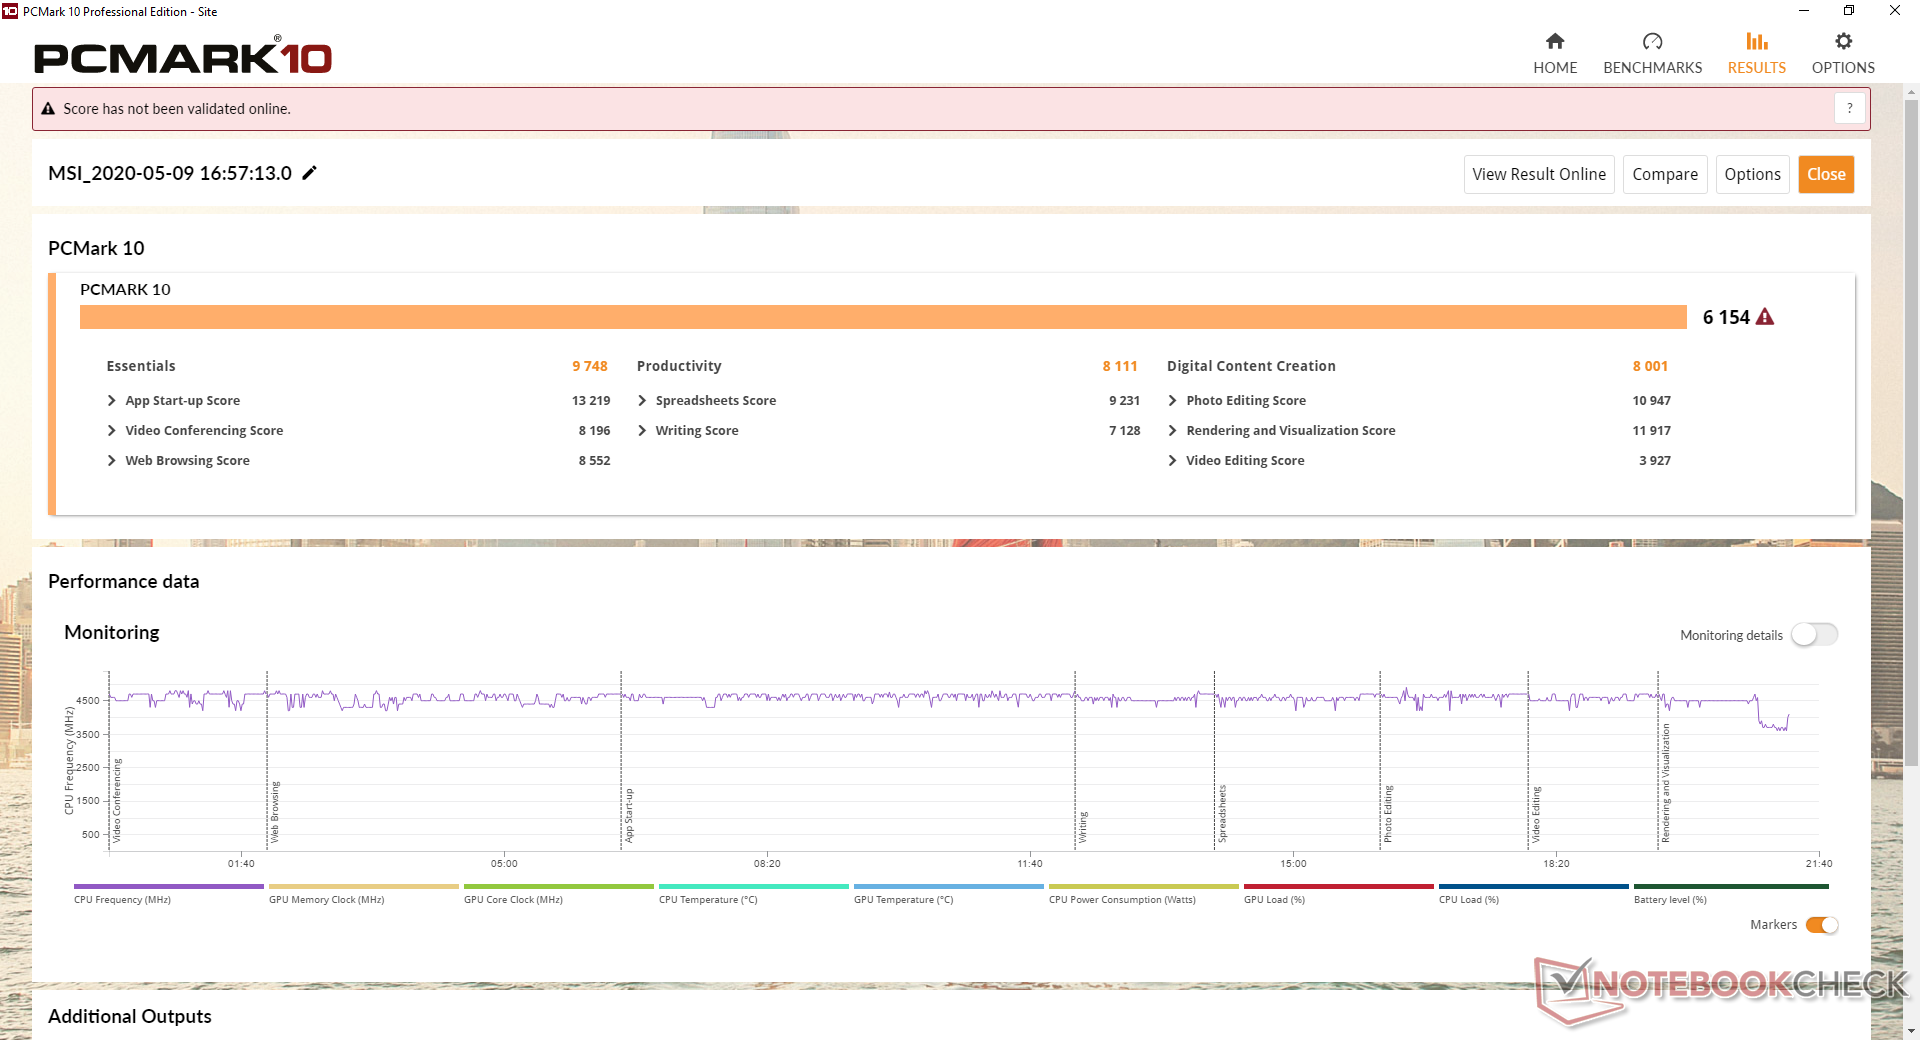
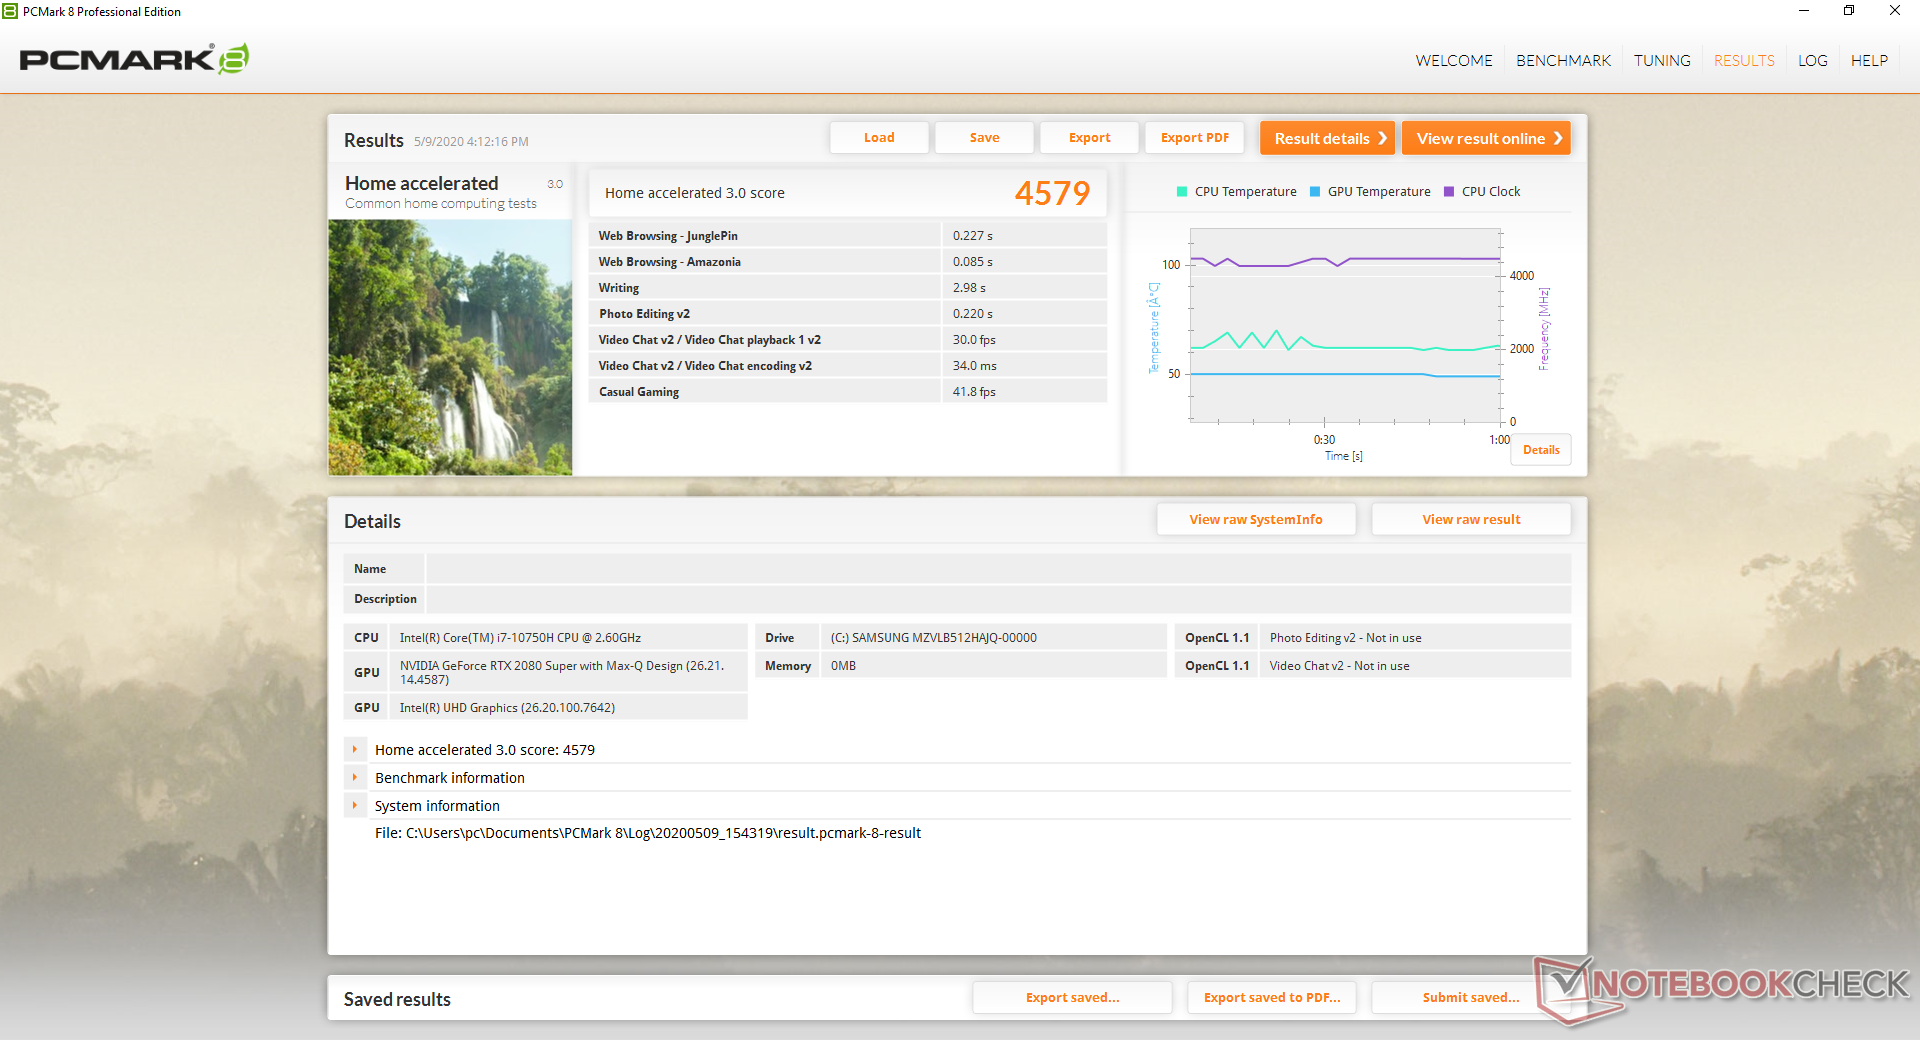
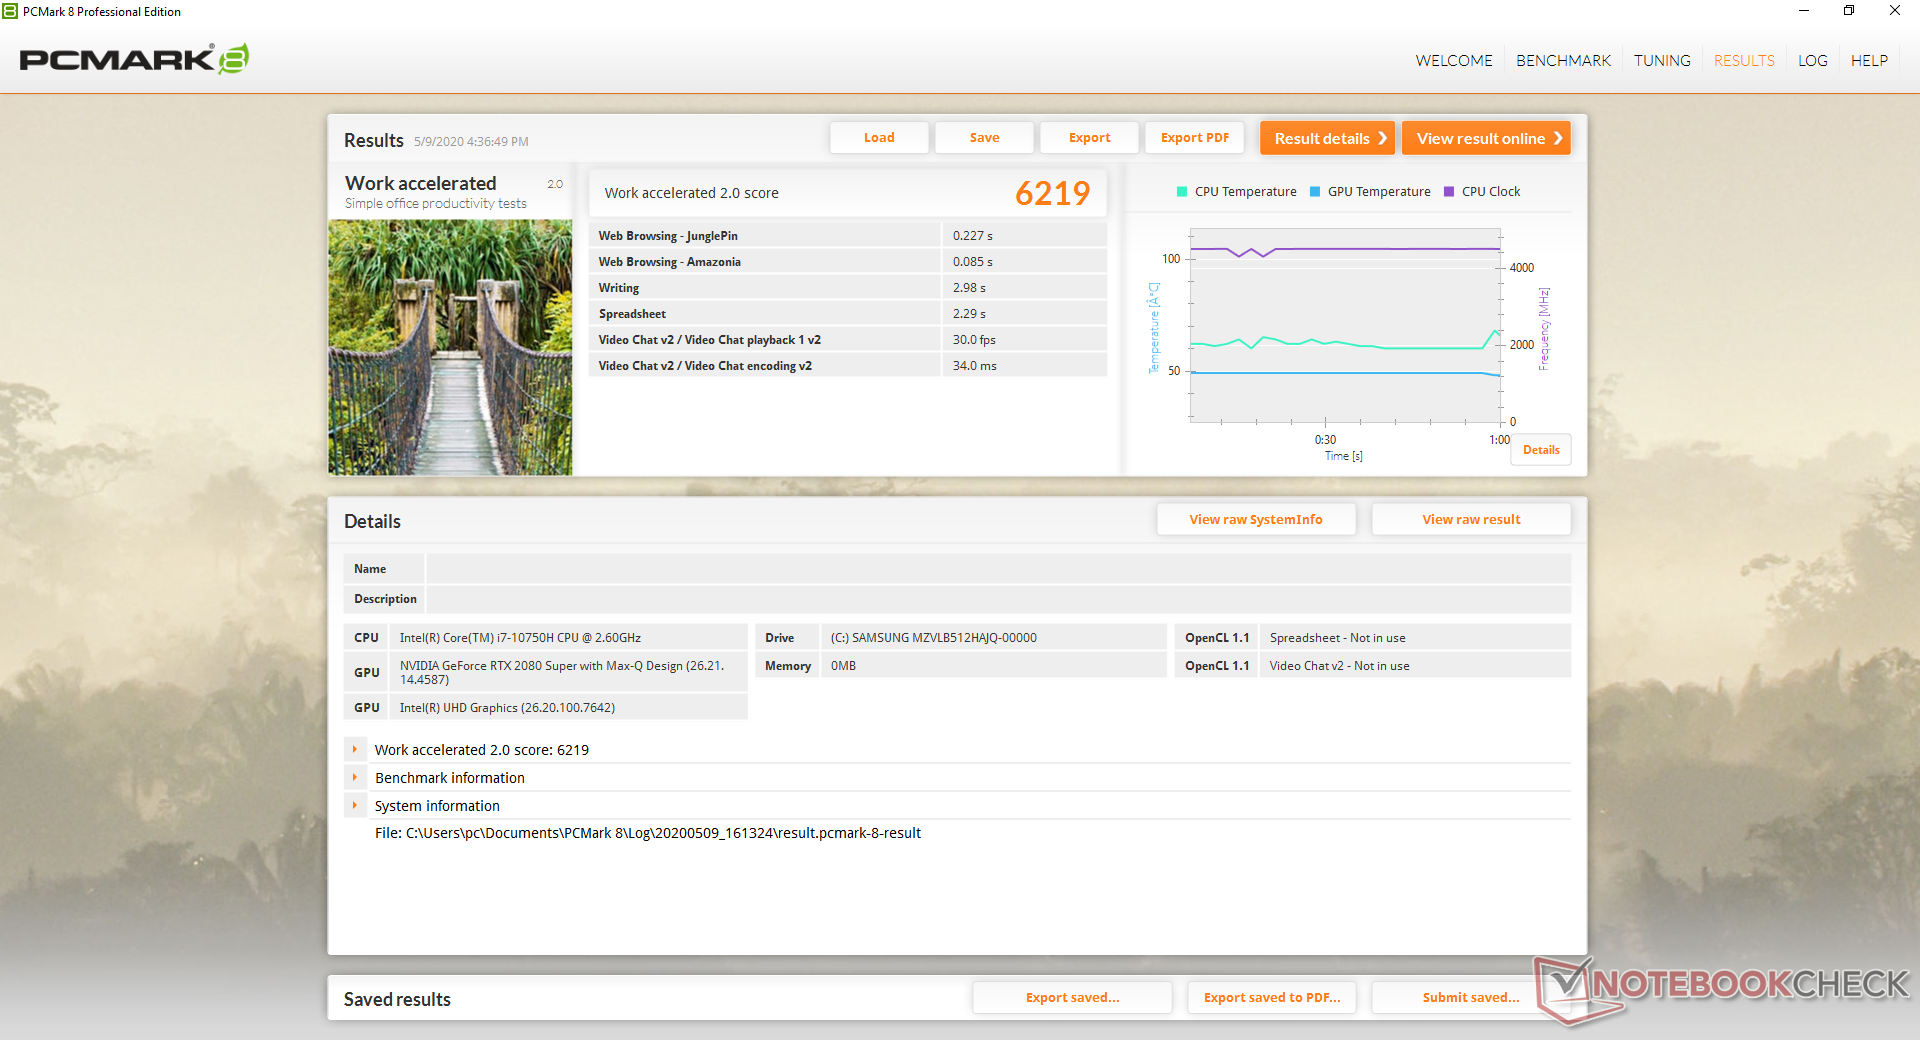
System Performance
PCMark benchmarks are consistently below the GS66 10SFS with the higher-end Core i9-10980HK but slower GeForce RTX 2070 Super Max-Q GPU. Thus, the faster RTX 2080 Super Max-Q in our GS66 10SGS is not enough to make up for the CPU deficit at least for these types of scenarios.
| PCMark 8 | |
| Home Score Accelerated v2 | |
| Lenovo Legion Y740-15ICHg | |
| MSI GS66 10SGS | |
| MSI GS65 Stealth 9SG | |
| Razer Blade 15 RTX 2080 Max-Q | |
| Work Score Accelerated v2 | |
| MSI GS66 10SGS | |
| Lenovo Legion Y740-15ICHg | |
| MSI GS65 Stealth 9SG | |
| Razer Blade 15 RTX 2080 Max-Q | |
| PCMark 8 Home Score Accelerated v2 | 4579 puan | |
| PCMark 8 Work Score Accelerated v2 | 6219 puan | |
| PCMark 10 Score | 6154 puan | |
Yardım | ||
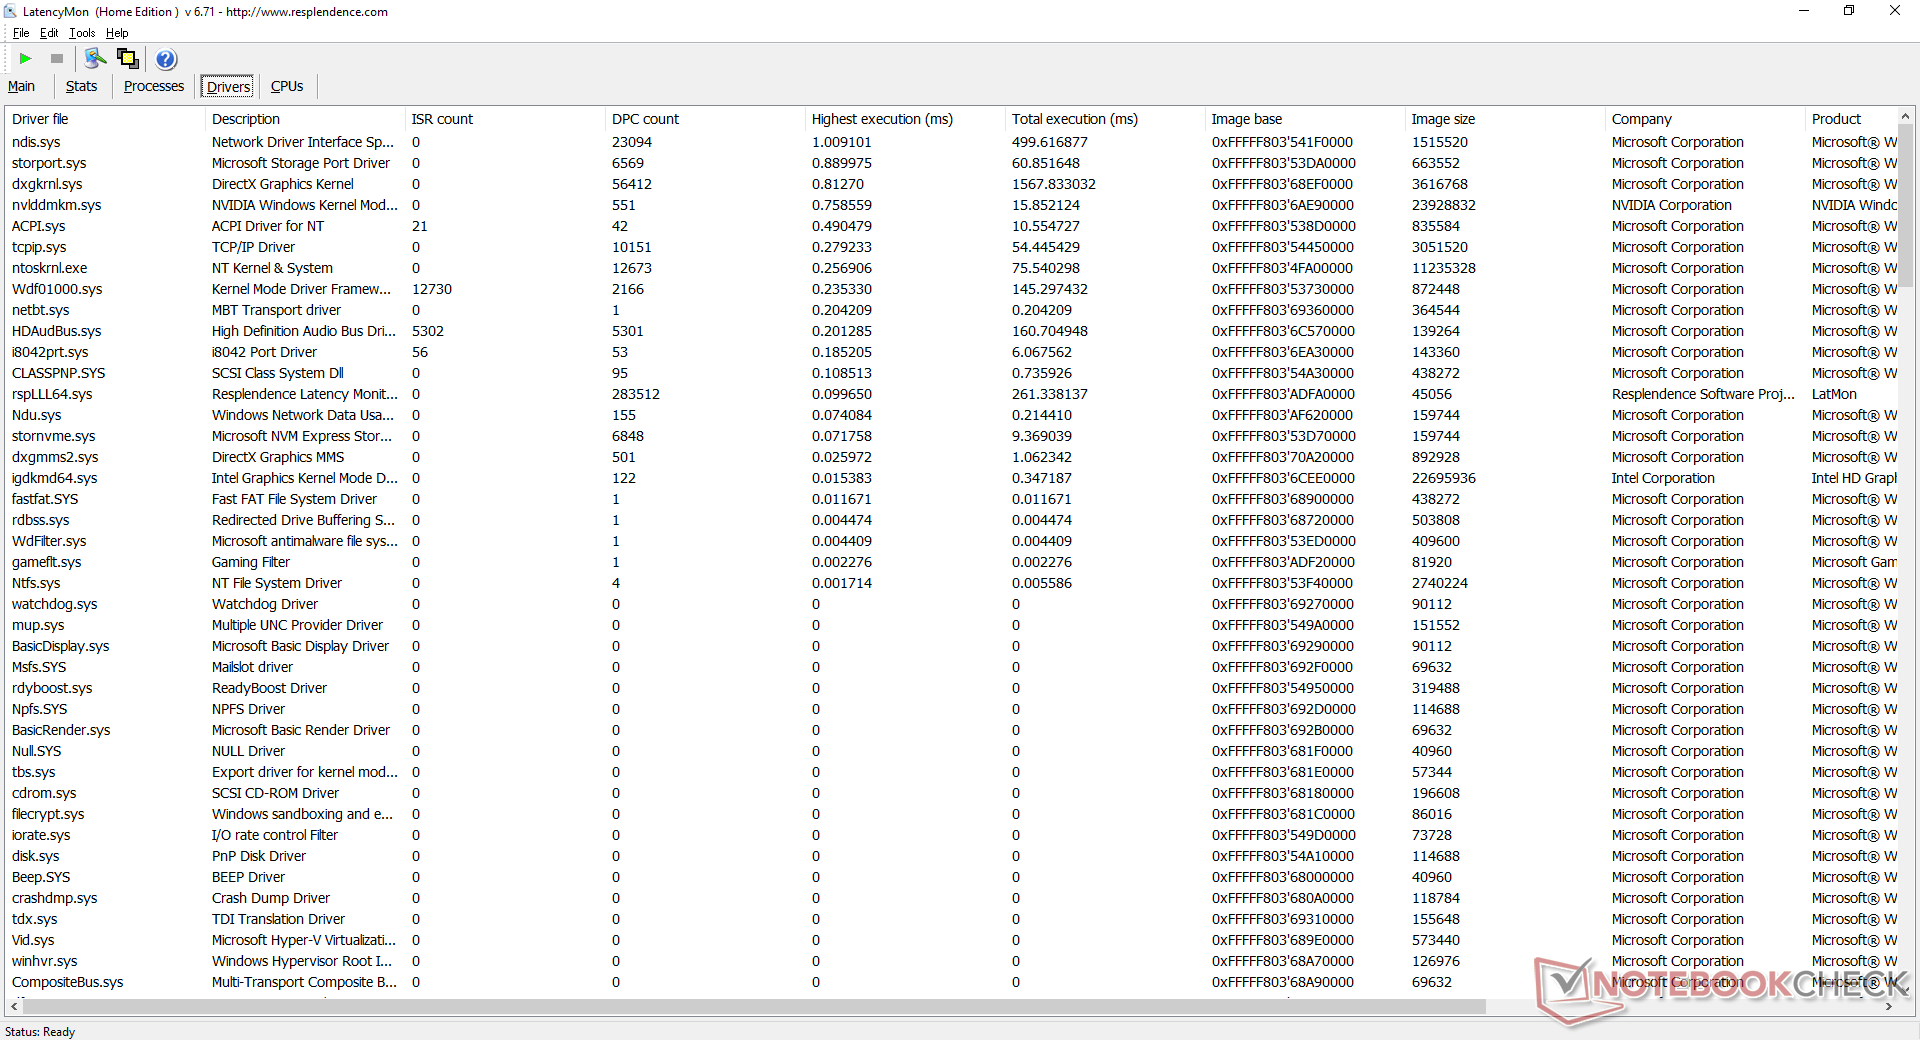
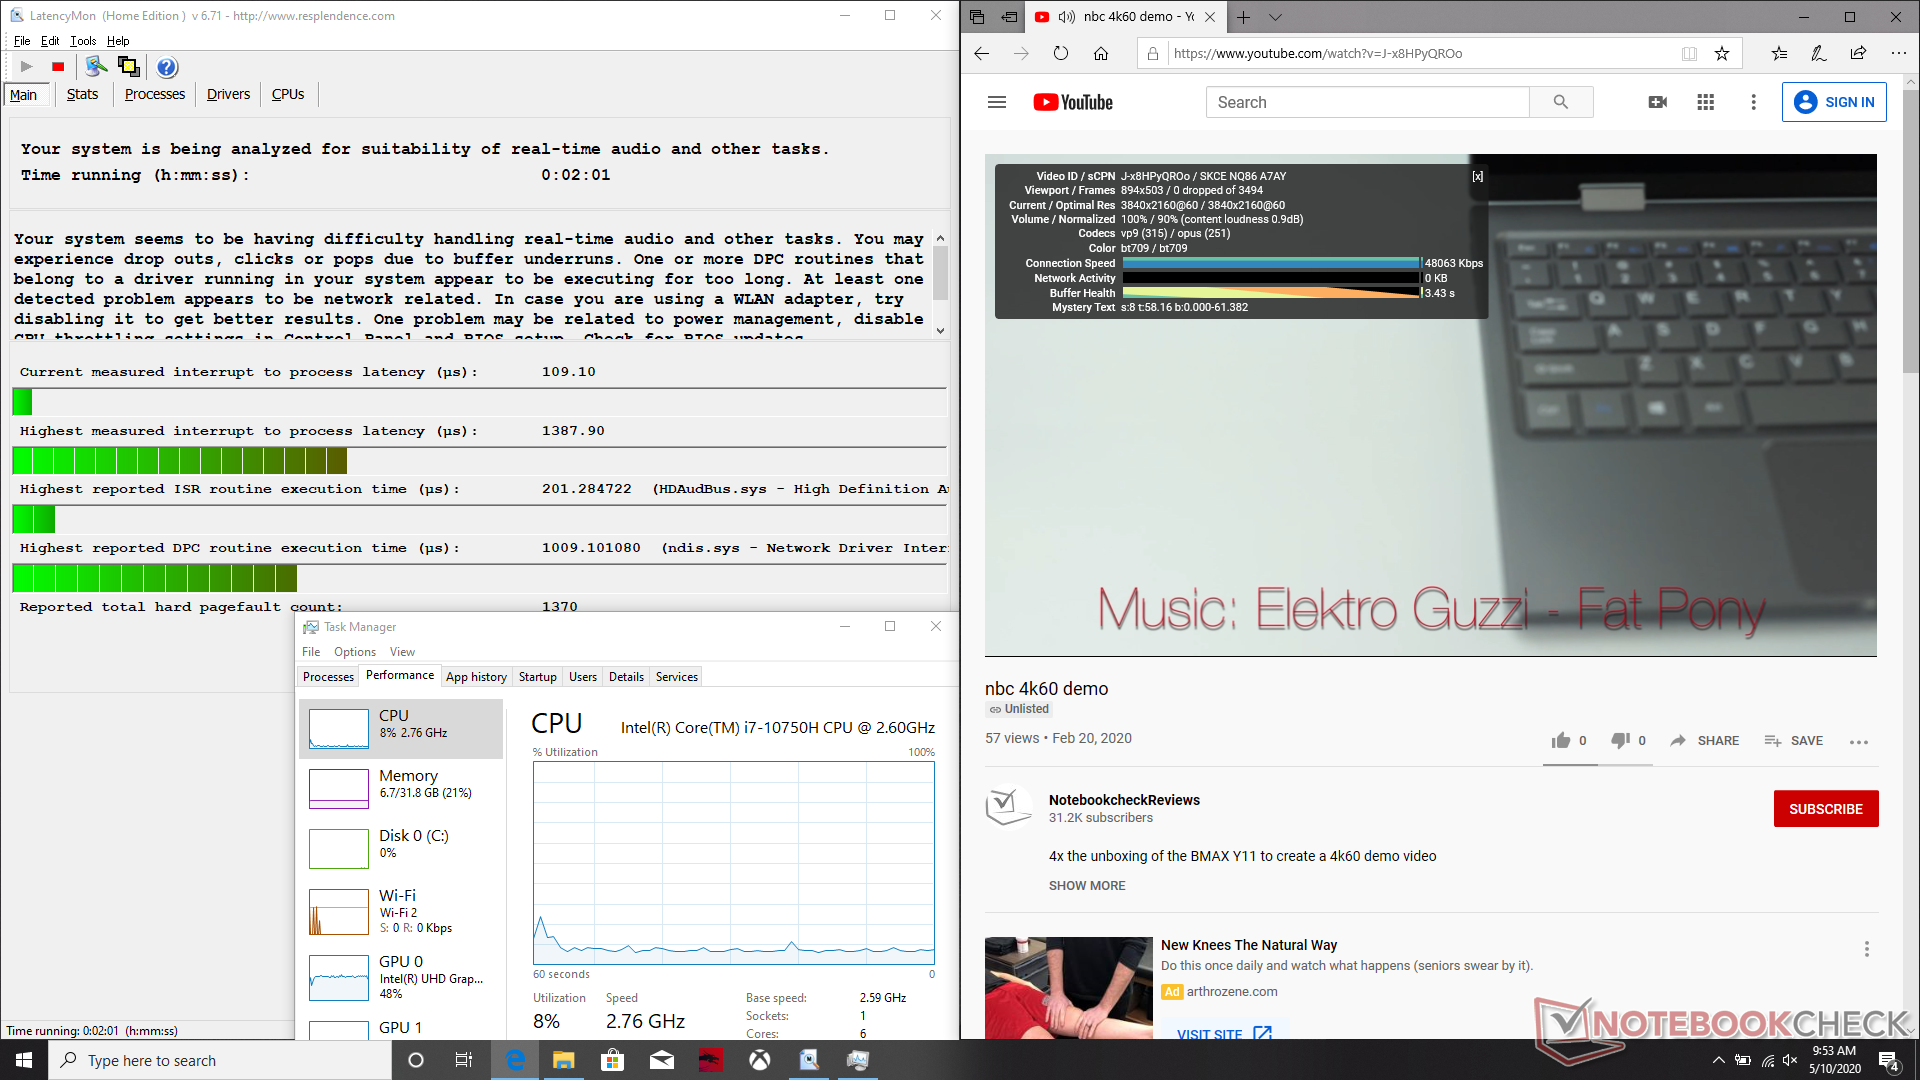
DPC Latency
LatencyMon shows DPC latency issues when opening multiple browser tabs. 4K video playback is otherwise smooth with no frame drops.
| DPC Latencies / LatencyMon - interrupt to process latency (max), Web, Youtube, Prime95 | |
| MSI GS66 10SGS | |
* ... daha küçük daha iyidir
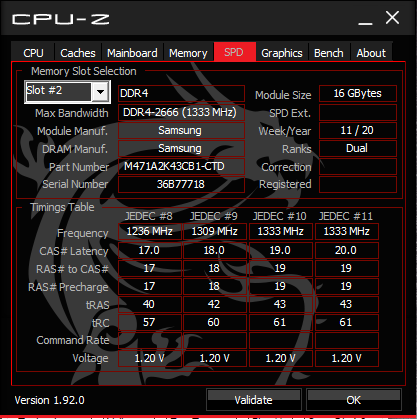
Storage Devices
Our GS66 still uses the same Samsung PM981 MZVLB512HAJQ NVMe SSD as found on last year's GS65. An important gen-to-gen change, however, is that the two M.2 bays are now easier to access whereas they were hidden underneath the motherboard on the GS65 design.
See our table of HDDs and SSDs for more benchmark comparisons. Different drives may be possible depending on the reseller or retailer.
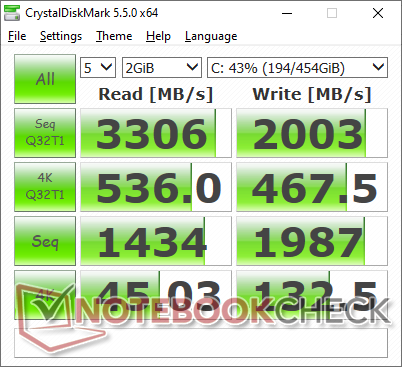
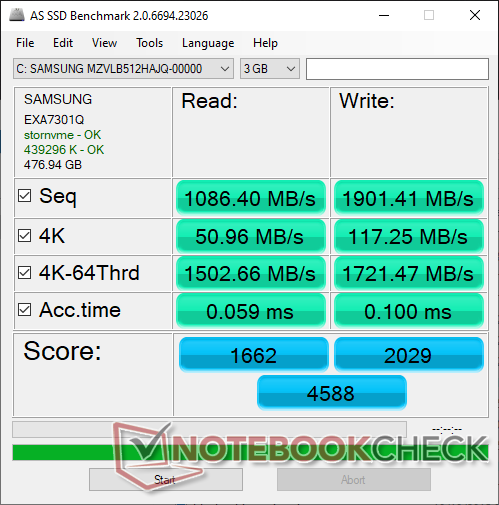

| MSI GS66 10SGS Samsung SSD PM981 MZVLB512HAJQ | MSI GS65 Stealth 9SG Samsung SSD PM981 MZVLB512HAJQ | Asus Zephyrus S GX502GW 2x Intel SSD 660p SSDPEKNW512G8 (RAID 0) | Razer Blade 15 RTX 2080 Max-Q Samsung SSD PM981 MZVLB512HAJQ | Lenovo Legion Y740-15ICHg WDC PC SN520 SDAPMUW-128G | MSI GS66 Stealth 10SFS Samsung SSD PM981 MZVLB1T0HALR | |
|---|---|---|---|---|---|---|
| AS SSD | 9% | -6% | 3% | -49% | 9% | |
| Seq Read (MB/s) | 1086 | 2005 85% | 2506 131% | 1832 69% | 1372 26% | 1065 -2% |
| Seq Write (MB/s) | 1901 | 1580 -17% | 1712 -10% | 1864 -2% | 746 -61% | 2360 24% |
| 4K Read (MB/s) | 51 | 49.33 -3% | 48.32 -5% | 52.1 2% | 35.42 -31% | 48.09 -6% |
| 4K Write (MB/s) | 117.3 | 103.8 -12% | 103.6 -12% | 108.3 -8% | 99.9 -15% | 110.7 -6% |
| 4K-64 Read (MB/s) | 1503 | 1241 -17% | 624 -58% | 1159 -23% | 302.1 -80% | 1635 9% |
| 4K-64 Write (MB/s) | 1721 | 1730 1% | 1253 -27% | 1807 5% | 191.4 -89% | 1829 6% |
| Access Time Read * (ms) | 0.059 | 0.054 8% | 0.08 -36% | 0.05 15% | 0.132 -124% | 0.071 -20% |
| Access Time Write * (ms) | 0.1 | 0.036 64% | 0.04 60% | 0.034 66% | 0.037 63% | 0.034 66% |
| Score Read (Points) | 1662 | 1490 -10% | 923 -44% | 1394 -16% | 475 -71% | 1790 8% |
| Score Write (Points) | 2029 | 1991 -2% | 1528 -25% | 2102 4% | 366 -82% | 2176 7% |
| Score Total (Points) | 4588 | 4230 -8% | 2896 -37% | 4221 -8% | 1065 -77% | 4950 8% |
| Copy ISO MB/s (MB/s) | 2155 | 3025 40% | 2083 -3% | 1062 -51% | ||
| Copy Program MB/s (MB/s) | 715 | 713 0% | 496.5 -31% | 426 -40% | ||
| Copy Game MB/s (MB/s) | 1506 | 1554 3% | 977 -35% | 650 -57% | ||
| CrystalDiskMark 5.2 / 6 | -7% | -4% | -3% | -41% | 6% | |
| Write 4K (MB/s) | 132.5 | 91.3 -31% | 97 -27% | 137.2 4% | 134.2 1% | 131.3 -1% |
| Read 4K (MB/s) | 45.03 | 40.73 -10% | 49.58 10% | 46.82 4% | 37.72 -16% | 45.84 2% |
| Write Seq (MB/s) | 1987 | 1915 -4% | 1838 -7% | 1221 -39% | 389.2 -80% | 2370 19% |
| Read Seq (MB/s) | 1434 | 2051 43% | 2421 69% | 1217 -15% | 1030 -28% | 1509 5% |
| Write 4K Q32T1 (MB/s) | 467.5 | 308.3 -34% | 326.9 -30% | 527 13% | 238.9 -49% | 481.5 3% |
| Read 4K Q32T1 (MB/s) | 536 | 417.4 -22% | 372.9 -30% | 614 15% | 343.9 -36% | 560 4% |
| Write Seq Q32T1 (MB/s) | 2003 | 1922 -4% | 1894 -5% | 1986 -1% | 789 -61% | 2392 19% |
| Read Seq Q32T1 (MB/s) | 3306 | 3395 3% | 2828 -14% | 3234 -2% | 1502 -55% | 3232 -2% |
| Write 4K Q8T8 (MB/s) | 293.4 | |||||
| Read 4K Q8T8 (MB/s) | 405.8 | |||||
| Toplam Ortalama (Program / Ayarlar) | 1% /
3% | -5% /
-5% | 0% /
1% | -45% /
-46% | 8% /
8% |
* ... daha küçük daha iyidir

Disk Throttling: DiskSpd Read Loop, Queue Depth 8
GPU Performance
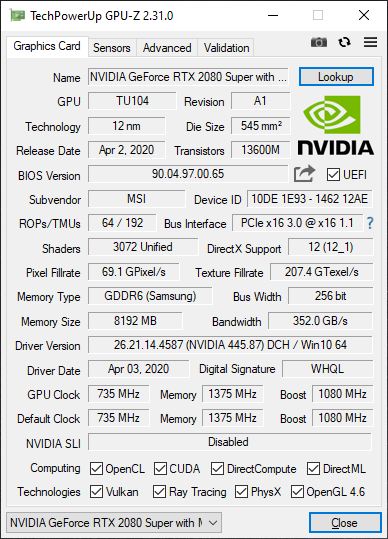
3DMark benchmarks are slightly below the Acer Triton 500 with the same GeForce RTX 2080 Super Max-Q GPU. When looking at the bigger picture, some older laptops with the GeForce RTX 2080 Max-Q are able to outscore our MSI by about 10 percent including the Dell Alienware m17 R2 and Asus ROG Zephyrus S GX701GXR. Users should therefore expect nearly the same gaming performance as the year old GeForce RTX 2080 Max-Q. In fact, upgrading from the GeForce RTX 2070 Super Max-Q configuration will only bring 5 to 10 percent more graphics horsepower.
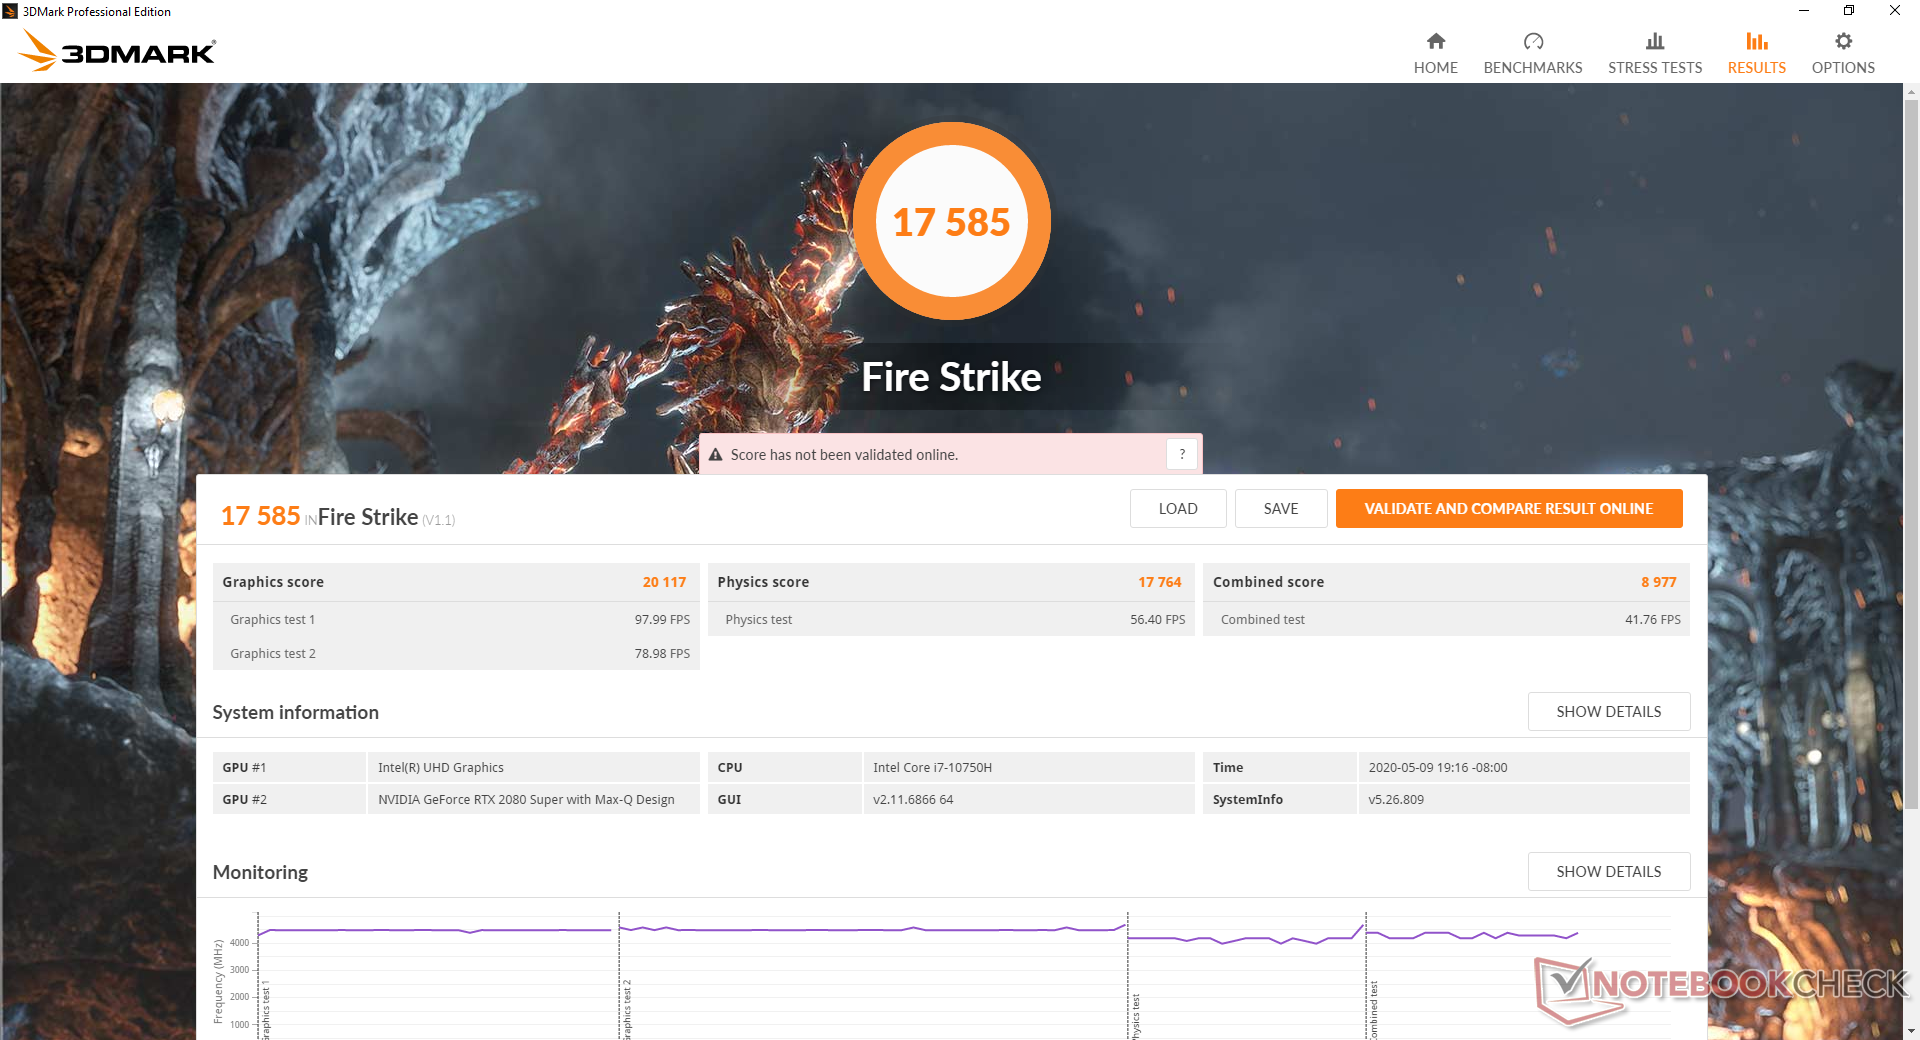
Enabling Cooler Boost will increase GPU performance by only a hair. A 3DMark Fire Strike run with Cooler Boost active returns a Graphics score of 20784 points compared to 20117 points when the feature is off.
Note that G-Sync is not supported as the laptop uses Optimus instead. We can't say we miss the feature since the 300 Hz display will naturally cut down on screen tearing.
| 3DMark 11 | |
| 1280x720 Performance GPU | |
| MSI RTX 2080 Ti Gaming X Trio | |
| Nvidia GeForce RTX 2080 Super FE | |
| Asus ROG Mothership GZ700GX | |
| Ortalama NVIDIA GeForce RTX 2080 Super Max-Q (26292 - 32995, n=10) | |
| Alienware m17 R2 P41E | |
| MSI GS66 10SGS | |
| MSI GS66 Stealth 10SFS | |
| MSI GS65 Stealth 9SG | |
| Alienware 15 R3 Max-Q | |
| Xiaomi Mi Gaming Laptop 2019 | |
| Maingear Vector 15 | |
| MSI Alpha 15 A3DDK-034 | |
| MSI GT72S-6QEG16SR421BW | |
| 1280x720 Performance Combined | |
| MSI RTX 2080 Ti Gaming X Trio | |
| Asus ROG Mothership GZ700GX | |
| MSI GS66 Stealth 10SFS | |
| Alienware m17 R2 P41E | |
| Ortalama NVIDIA GeForce RTX 2080 Super Max-Q (11707 - 17126, n=10) | |
| MSI GS66 10SGS | |
| MSI GS65 Stealth 9SG | |
| Maingear Vector 15 | |
| Xiaomi Mi Gaming Laptop 2019 | |
| Nvidia GeForce RTX 2080 Super FE | |
| Alienware 15 R3 Max-Q | |
| MSI GT72S-6QEG16SR421BW | |
| MSI Alpha 15 A3DDK-034 | |
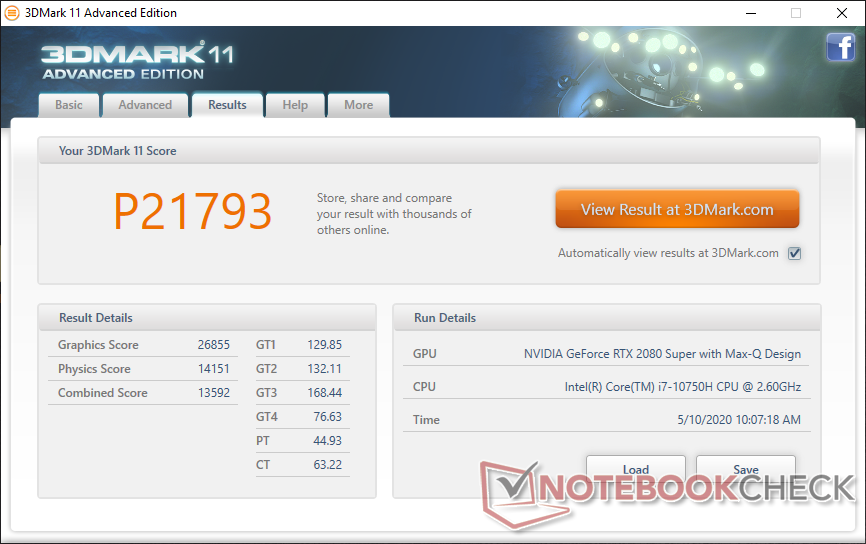
| 3DMark 11 Performance | 21793 puan | |
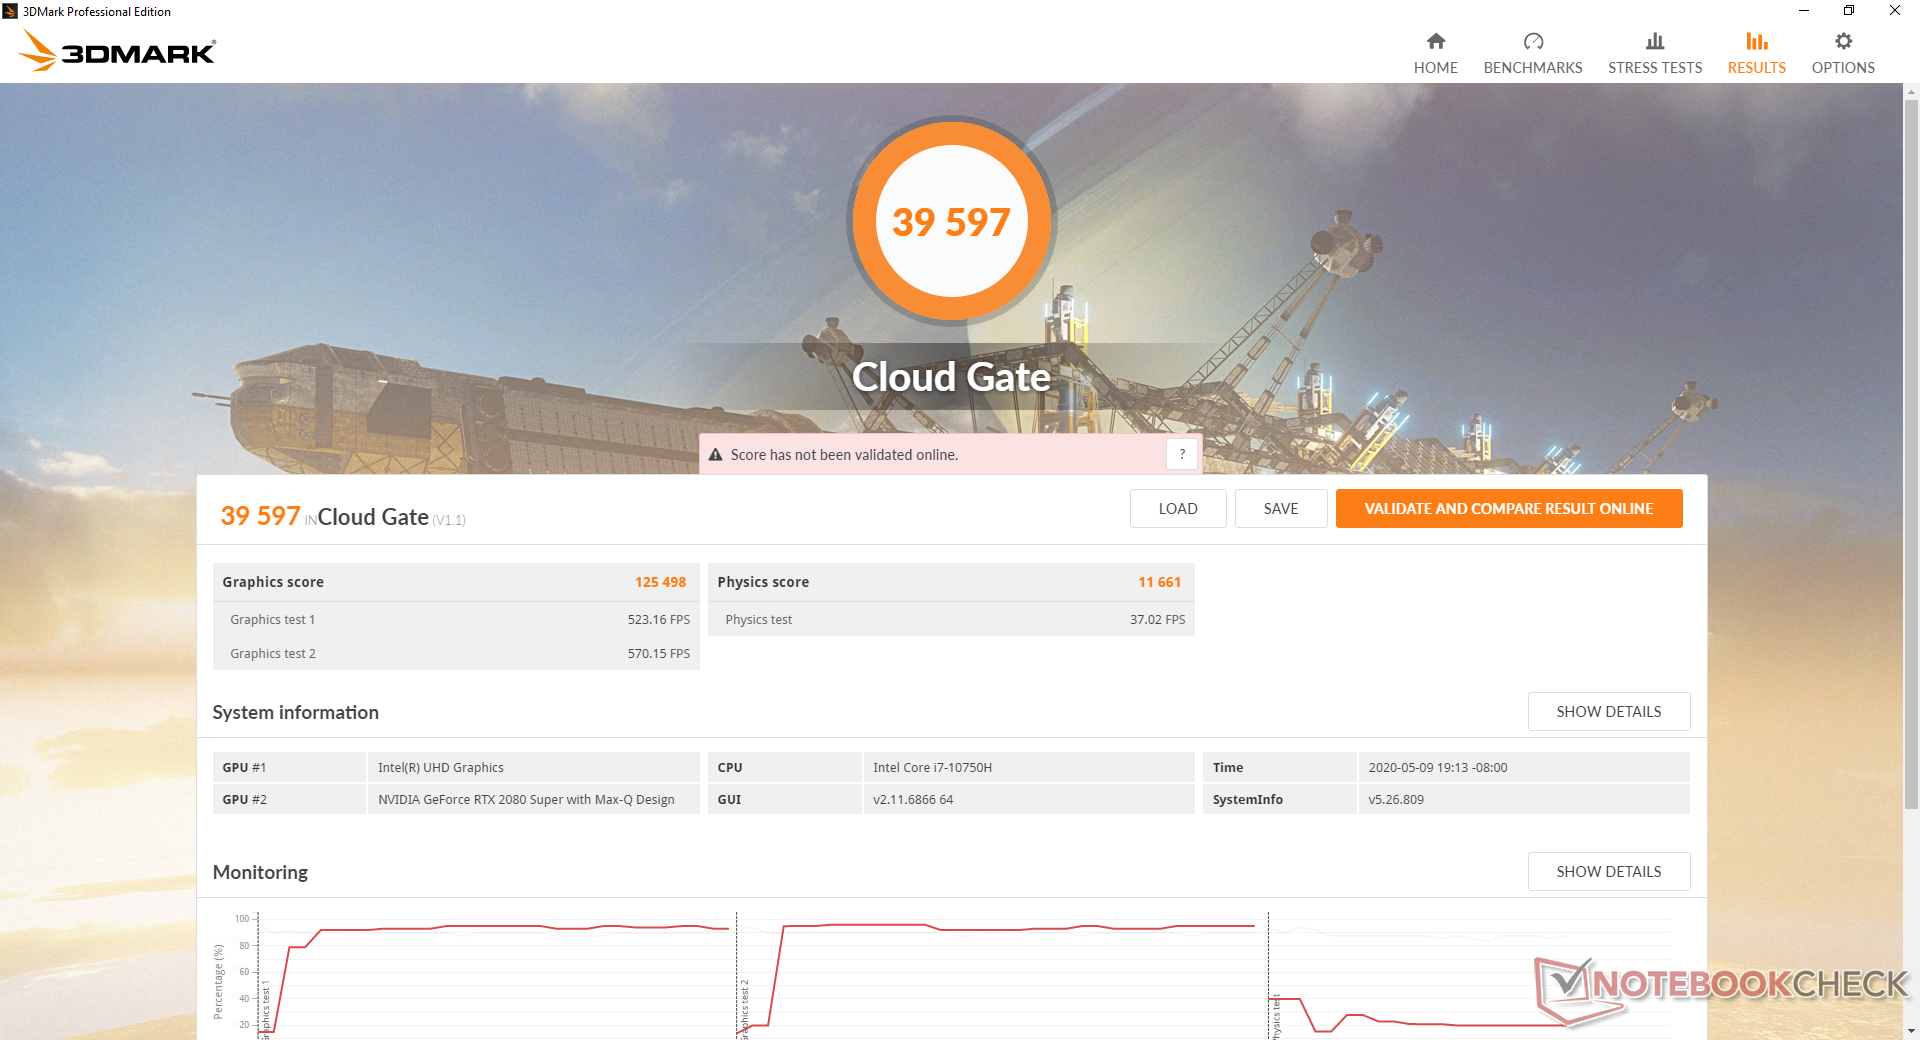
| 3DMark Cloud Gate Standard Score | 39597 puan | |
| 3DMark Fire Strike Score | 17585 puan | |
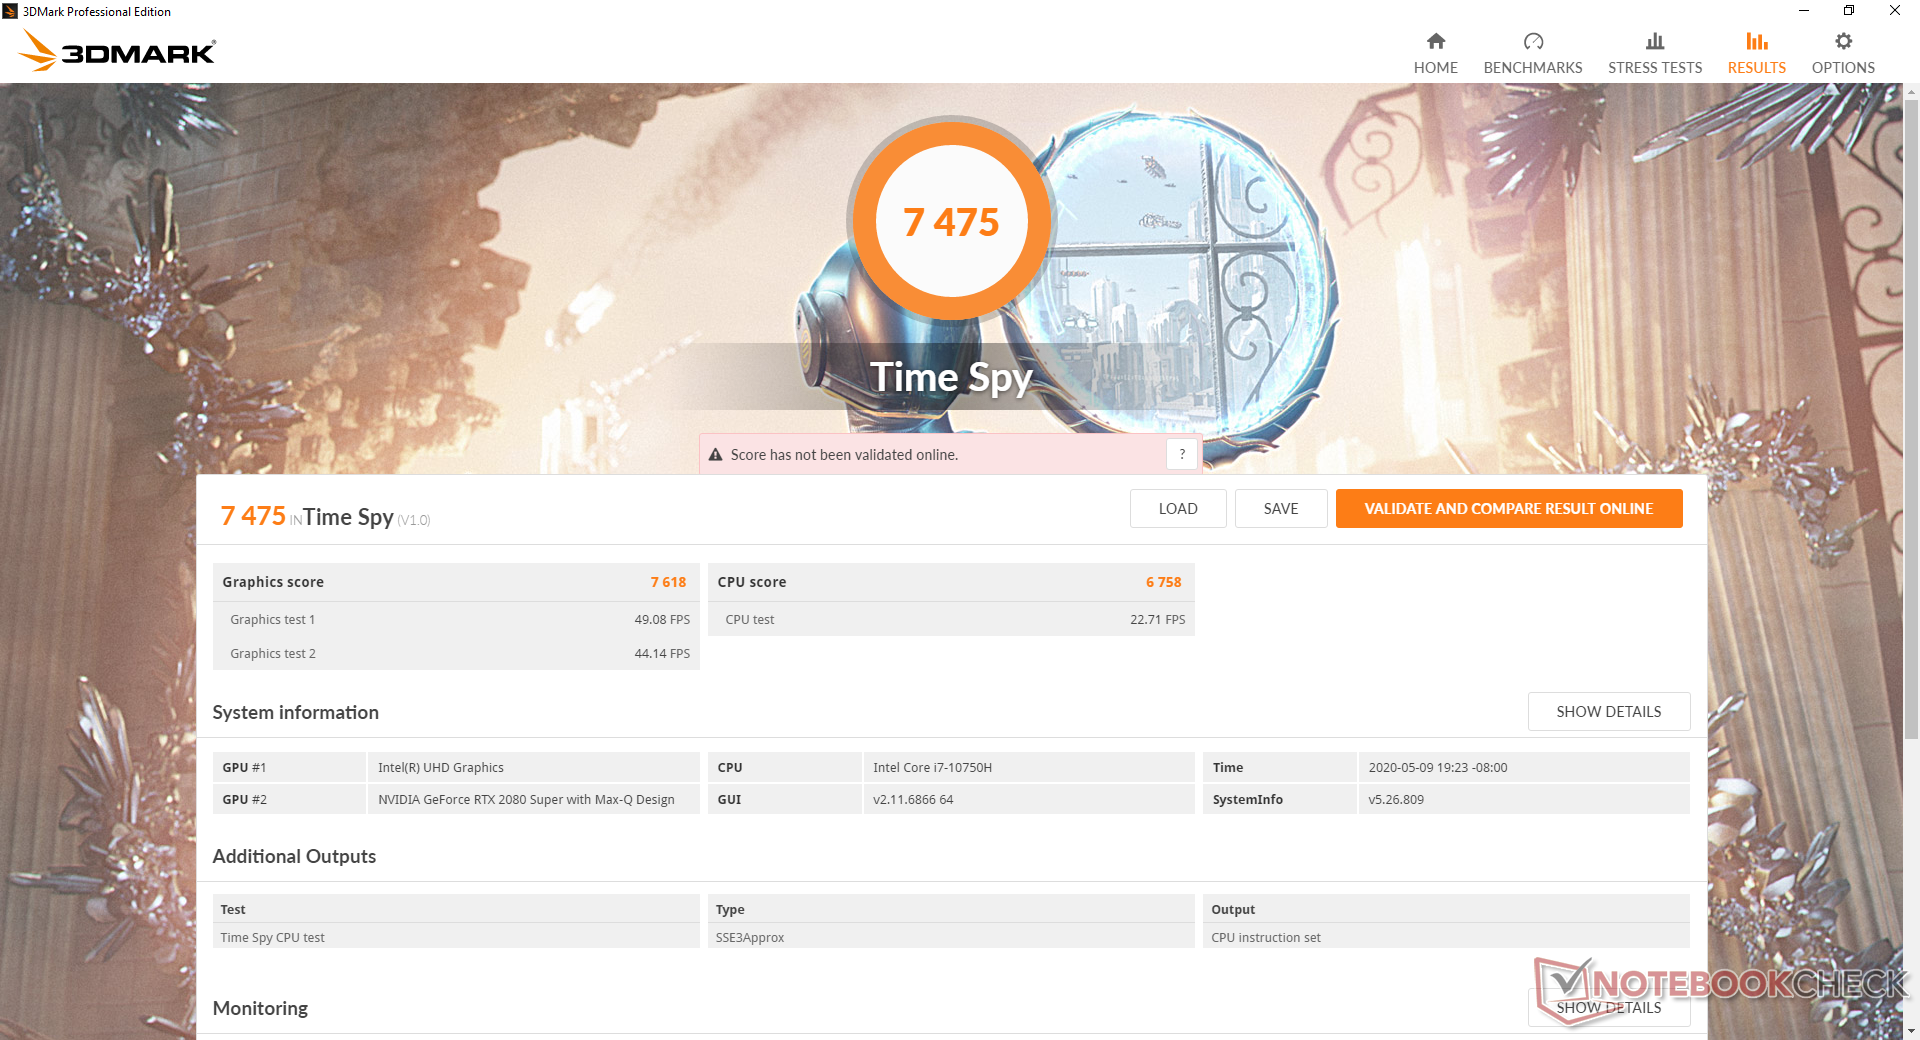
| 3DMark Time Spy Score | 7475 puan | |
Yardım | ||
Gaming Performance
Frame rates are consistently higher than the GS66 10SFS when playing at High or Extreme settings where games are more likely to be GPU bound. Differences are minor at 10 percent or less as predicted by the 3DMark results above.
Interestingly, there are cases where the GeForce RTX 2070 Super Max-Q can outperform our MSI. The Aorus 17G XB, for example, slightly edges out our system on Shadow of the Tomb Raider while it falls behind our system when running Borderlands 3. The faster Core i7-10875H CPU in the Gigabyte laptop is likely responsible for the discrepancy.
See our dedicated page on the GeForce RTX 2080 Super Max-Q for more technical information and benchmarks comparisons.
| Shadow of the Tomb Raider | |
| 1920x1080 Highest Preset AA:T | |
| Nvidia GeForce RTX 2080 Super | |
| MSI GE75 9SG | |
| Alienware m17 R2 P41E | |
| Aorus 17G XB | |
| MSI GS66 10SGS | |
| Ortalama NVIDIA GeForce RTX 2080 Super Max-Q (89 - 106, n=10) | |
| MSI GP65 10SFK-047US | |
| MSI GS66 Stealth 10SFS | |
| Walmart EVOO Gaming 17 | |
| Asus Zephyrus G14 GA401IV | |
| 1920x1080 High Preset AA:SM | |
| MSI GE75 9SG | |
| Nvidia GeForce RTX 2080 Super | |
| Aorus 17G XB | |
| Alienware m17 R2 P41E | |
| Ortalama NVIDIA GeForce RTX 2080 Super Max-Q (93 - 116, n=7) | |
| MSI GS66 10SGS | |
| MSI GS66 Stealth 10SFS | |
| MSI GP65 10SFK-047US | |
| Walmart EVOO Gaming 17 | |
| Asus Zephyrus G14 GA401IV | |
| The Witcher 3 | |
| 1920x1080 Ultra Graphics & Postprocessing (HBAO+) | |
| Nvidia GeForce RTX 2080 Super | |
| MSI GE75 9SG | |
| Ortalama NVIDIA GeForce RTX 2080 Super Max-Q (74.3 - 96, n=11) | |
| MSI GP65 10SFK-047US | |
| Alienware m17 R2 P41E | |
| MSI GS66 10SGS | |
| Aorus 17G XB | |
| MSI GS66 Stealth 10SFS | |
| Walmart EVOO Gaming 17 | |
| Asus Zephyrus G14 GA401IV | |
| 1920x1080 High Graphics & Postprocessing (Nvidia HairWorks Off) | |
| Nvidia GeForce RTX 2080 Super | |
| MSI GE75 9SG | |
| MSI GP65 10SFK-047US | |
| Alienware m17 R2 P41E | |
| Ortalama NVIDIA GeForce RTX 2080 Super Max-Q (138 - 160, n=7) | |
| MSI GS66 10SGS | |
| Aorus 17G XB | |
| Walmart EVOO Gaming 17 | |
| MSI GS66 Stealth 10SFS | |
| Asus Zephyrus G14 GA401IV | |
| Borderlands 3 | |
| 1920x1080 Badass Overall Quality (DX11) | |
| Ortalama NVIDIA GeForce RTX 2080 Super Max-Q (62.5 - 71.6, n=4) | |
| MSI GS66 10SGS | |
| MSI GS66 Stealth 10SFS | |
| Aorus 17G XB | |
| Asus Zephyrus G14 GA401IV | |
| 1920x1080 High Overall Quality (DX11) | |
| MSI GS66 10SGS | |
| Ortalama NVIDIA GeForce RTX 2080 Super Max-Q (78.2 - 84.3, n=4) | |
| Aorus 17G XB | |
| MSI GS66 Stealth 10SFS | |
| Asus Zephyrus G14 GA401IV | |
| düşük | orta | yüksek | ultra | |
|---|---|---|---|---|
| The Witcher 3 (2015) | 310.3 | 239.5 | 142.7 | 74.3 |
| Dota 2 Reborn (2015) | 147 | 132 | 122 | 116 |
| X-Plane 11.11 (2018) | 102 | 90.9 | 76.8 | |
| Shadow of the Tomb Raider (2018) | 138 | 109 | 104 | 96 |
| Assassin´s Creed Odyssey (2018) | 102 | 87 | 75 | 54 |
| Apex Legends (2019) | 299 | 196 | 148.8 | 147.6 |
| Metro Exodus (2019) | 143.3 | 96.2 | 74.4 | 59 |
| Dirt Rally 2.0 (2019) | 252 | 168.4 | 158.5 | 90 |
| The Division 2 (2019) | 165 | 117 | 96 | 73 |
| Anno 1800 (2019) | 159 | 98.2 | 76.7 | 44.4 |
| Total War: Three Kingdoms (2019) | 233 | 127.8 | 88.5 | 64.1 |
| F1 2019 (2019) | 205 | 168 | 147 | 142 |
| Borderlands 3 (2019) | 132.5 | 105.7 | 81.1 | 63.5 |
| Ghost Recon Breakpoint (2019) | 117 | 96 | 86 | 65 |
| GRID 2019 (2019) | 174.8 | 125 | 111 | 74 |
| Need for Speed Heat (2019) | 101.9 | 92 | 84 | 76.9 |
| Escape from Tarkov (2020) | 121 | 121 | 120 | 120 |
| Hunt Showdown (2020) | 207.4 | 121.4 | 102 | |
| Doom Eternal (2020) | 256 | 167.6 | 147.1 | 140 |
Emissions
System Noise
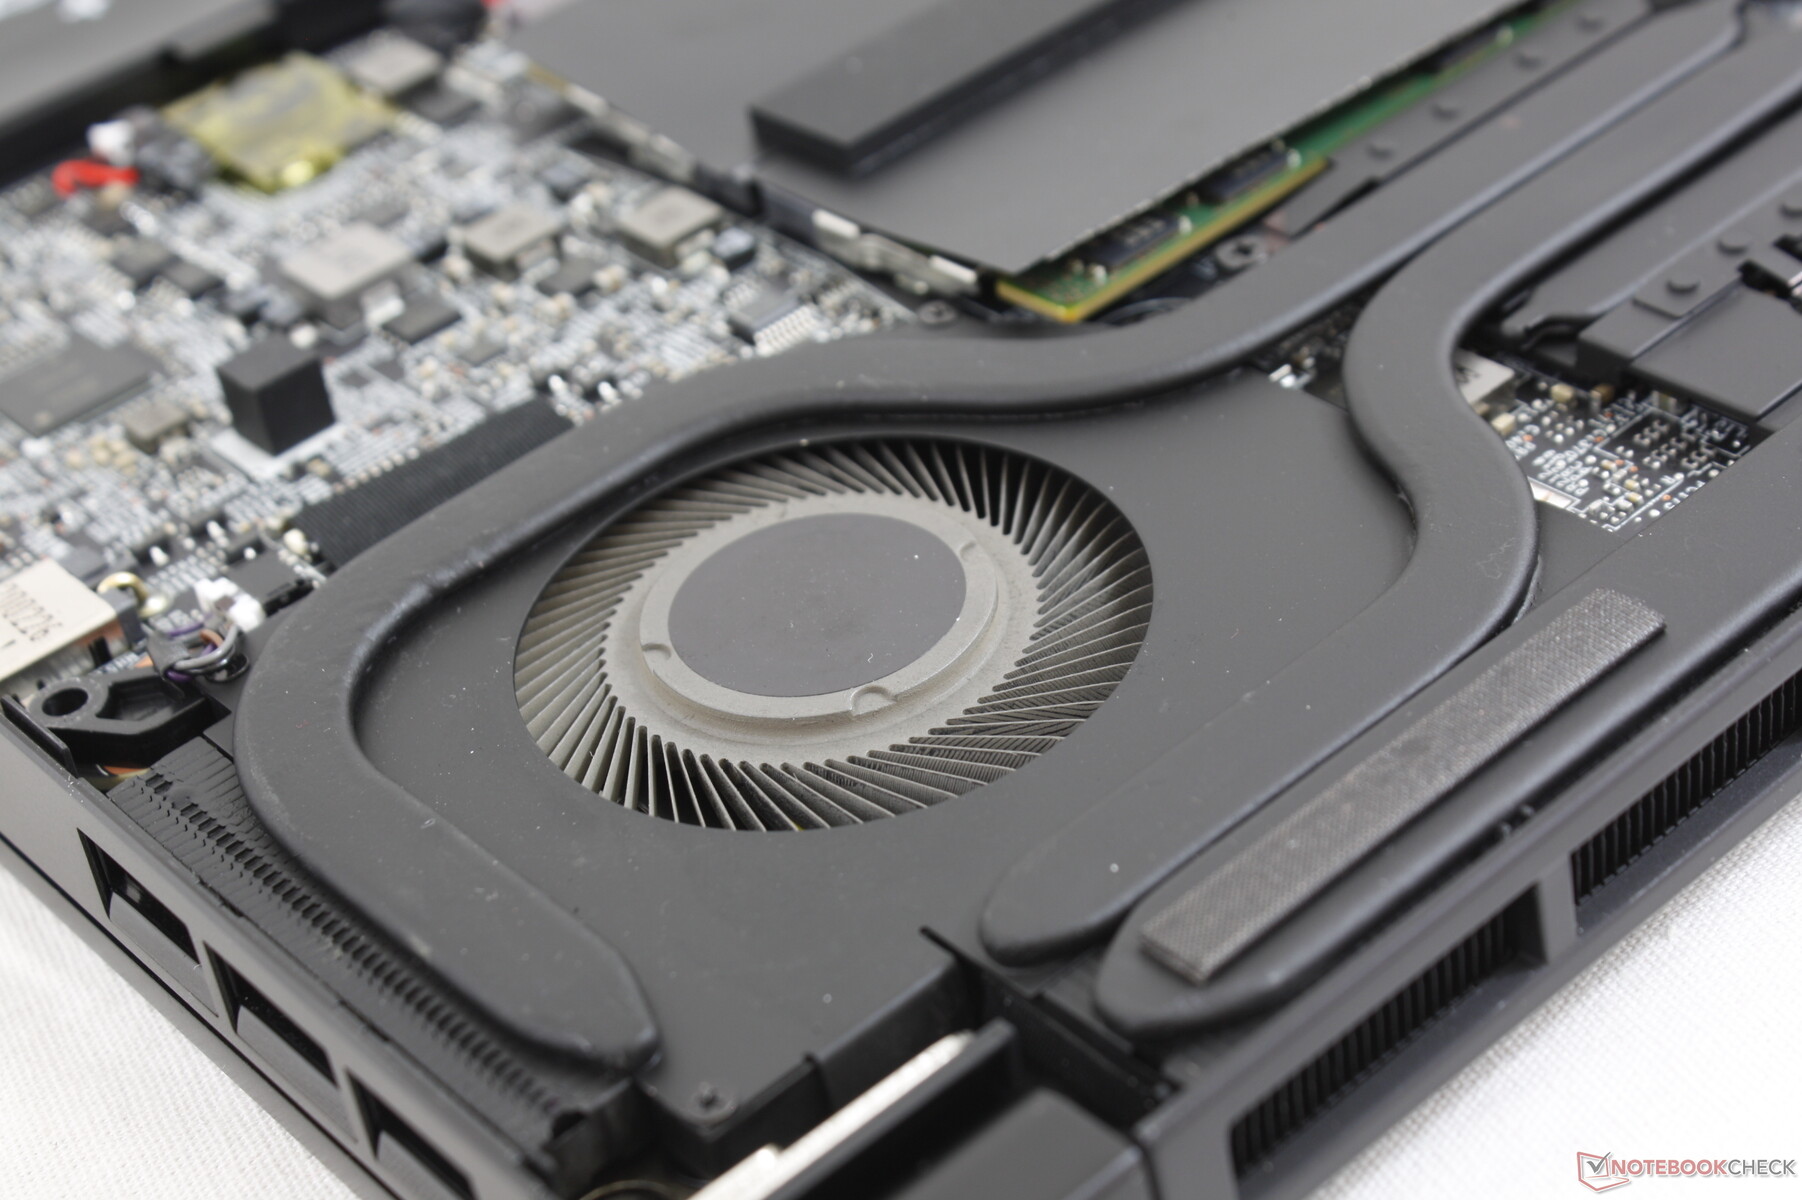
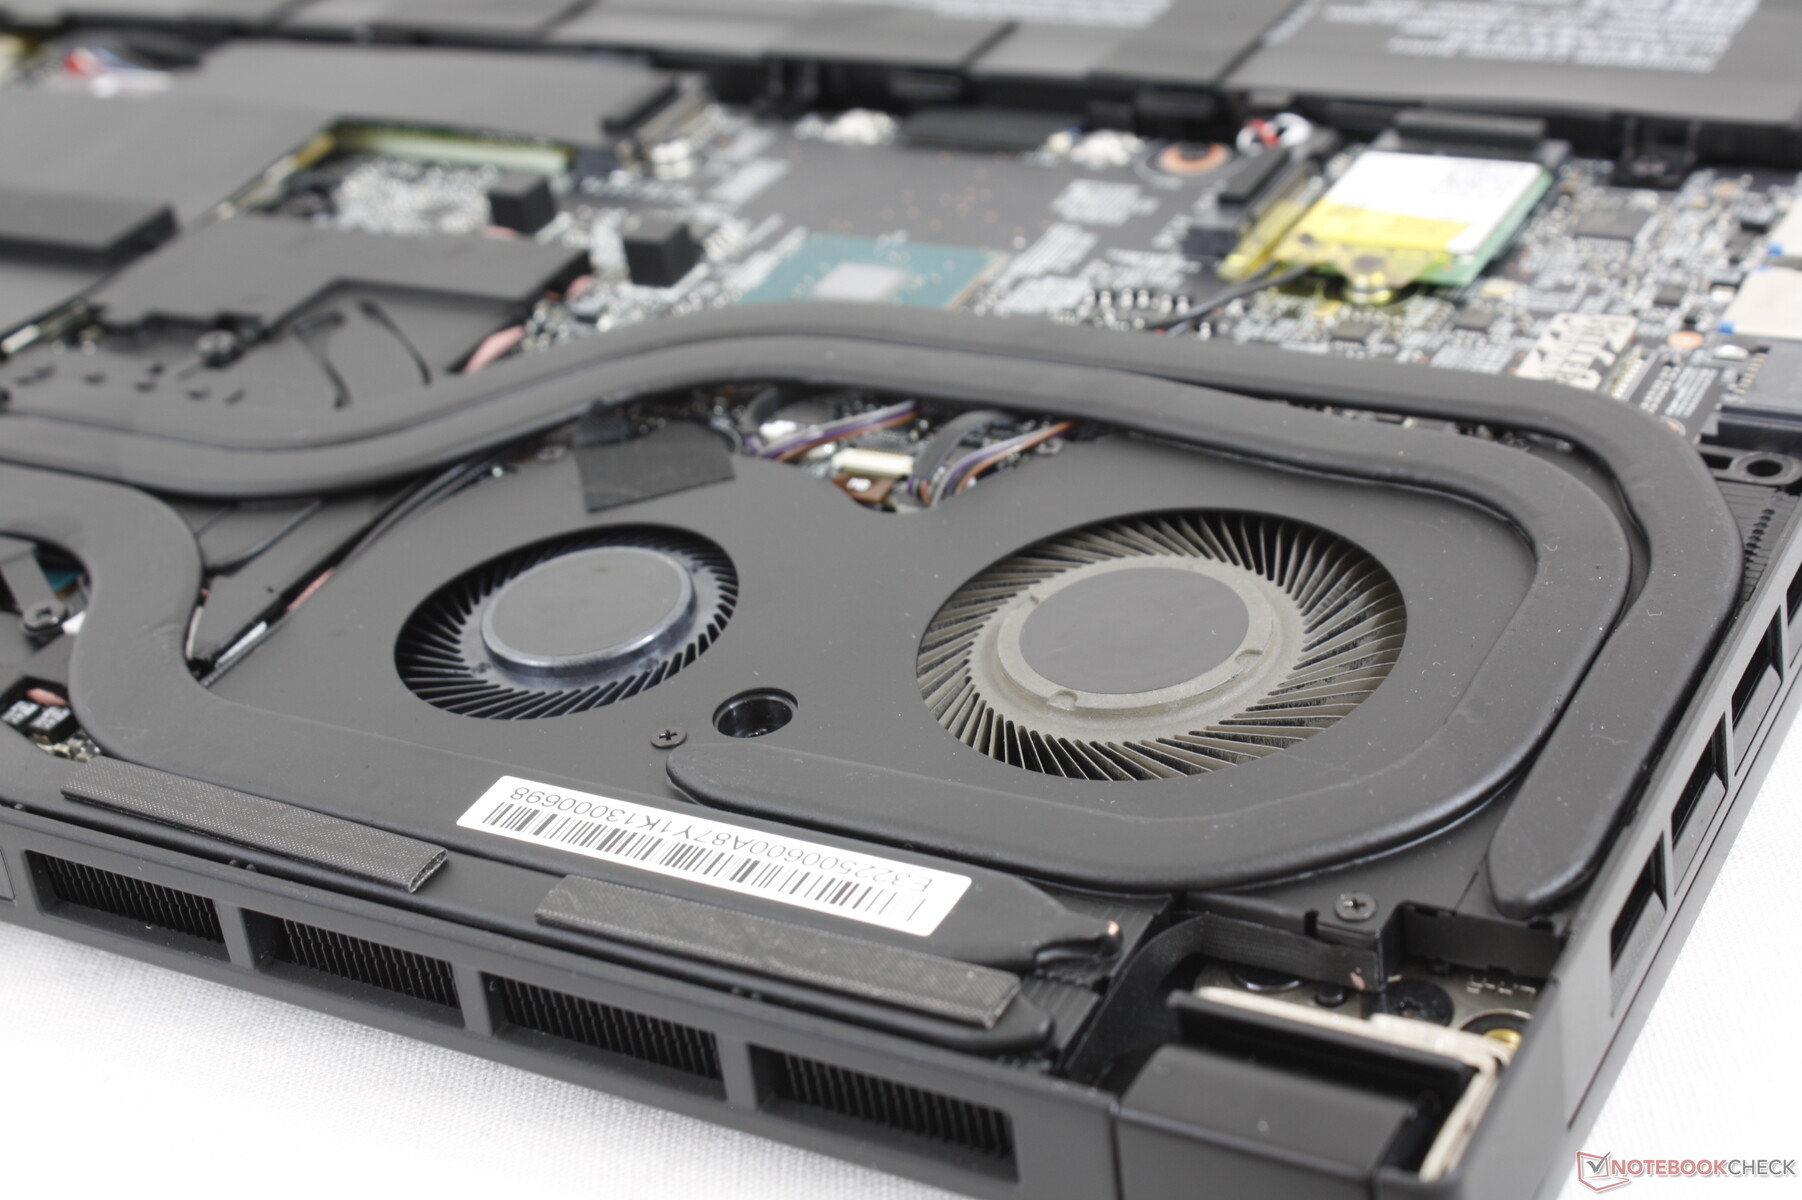
The cooling solution consists of two ~50 mm fans and a smaller ~40 mm one with seven heat pipes between them. Fan noise will always be present at about 30 to 30.9 dB(A) no matter the setting or onscreen load even if on the preset MSI "Silent" power profile. Though audible, we don't find this to be bothersome when browsing or video streaming. Still, we recommend using the laptop in Power Saver or Silent mode if not gaming or else the fans will pulse frequently.
Speaking of fan pulse, our GS66 10SGS is able to remain quieter for longer than the GS66 10SFS before plateauing at the same final decibel reading. For example, fan noise when running the first benchmark scene of 3DMark 06 would top out at 53 dB(A) on the 10SFS while the 10SGS would return a lower fan noise of 39.5 dB(A). When considering the higher Turbo Boost potential of the Core i9 in the 10SGS, the results make sense. When running Witcher 3, fan noise would stabilize at 48 dB(A) on both laptops. Overall results are on par with the GS66 despite the thicker and heavier build of the GS66.
Fan noise tops out at about 53 dB(A) when under more extreme loads like Prime95 and FurMark. If Cooler Boost is enabled, fan noise will increase to a steady 59.4 dB(A). We prefer to keep Cooler Boost off when gaming as it will not boost performance by all that much relative to the extreme increase in fan noise.
| MSI GS66 10SGS GeForce RTX 2080 Super Max-Q, i7-10750H, Samsung SSD PM981 MZVLB512HAJQ | MSI GS65 Stealth 9SG GeForce RTX 2080 Max-Q, i7-9750H, Samsung SSD PM981 MZVLB512HAJQ | Asus Zephyrus S GX502GW GeForce RTX 2070 Mobile, i7-9750H, 2x Intel SSD 660p SSDPEKNW512G8 (RAID 0) | Razer Blade 15 RTX 2080 Max-Q GeForce RTX 2080 Max-Q, i7-9750H, Samsung SSD PM981 MZVLB512HAJQ | HP Omen X 2S 15-dg0075cl GeForce RTX 2070 Max-Q, i7-9750H, WDC PC SN720 SDAPNTW-1T00 | Lenovo Legion Y740-15ICHg GeForce RTX 2070 Max-Q, i7-9750H, WDC PC SN520 SDAPMUW-128G | MSI GS66 Stealth 10SFS GeForce RTX 2070 Super Max-Q, i9-10980HK, Samsung SSD PM981 MZVLB1T0HALR | |
|---|---|---|---|---|---|---|---|
| Noise | 2% | -10% | 9% | -1% | 2% | -11% | |
| kapalı / ortam * (dB) | 28.5 | 28.3 1% | 30 -5% | 28.3 1% | 29 -2% | 30 -5% | 30 -5% |
| Idle Minimum * (dB) | 30 | 30.4 -1% | 31 -3% | 28.8 4% | 30.5 -2% | 31.3 -4% | 32 -7% |
| Idle Average * (dB) | 30 | 30.5 -2% | 33 -10% | 28.8 4% | 31.5 -5% | 31.3 -4% | 34 -13% |
| Idle Maximum * (dB) | 30.9 | 30.6 1% | 38 -23% | 29 6% | 31.5 -2% | 31.3 -1% | 39 -26% |
| Load Average * (dB) | 39.5 | 37.6 5% | 50 -27% | 33.5 15% | 40.6 -3% | 42 -6% | 53 -34% |
| Witcher 3 ultra * (dB) | 48 | 46 4% | 53 -10% | 45 6% | 49.5 -3% | 42.1 12% | 48 -0% |
| Load Maximum * (dB) | 59.4 | 55.1 7% | 56 6% | 45.2 24% | 53.4 10% | 46.5 22% | 53 11% |
* ... daha küçük daha iyidir
Ses yüksekliği
| Boşta |
| 30 / 30 / 30.9 dB |
| Çalışırken |
| 39.5 / 59.4 dB |
 | ||
30 dB sessiz 40 dB(A) duyulabilirlik 50 dB(A) gürültülü |
||
min: | ||
Temperature
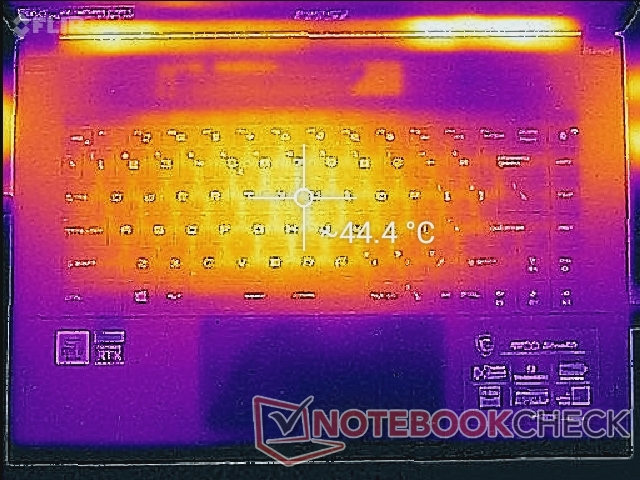
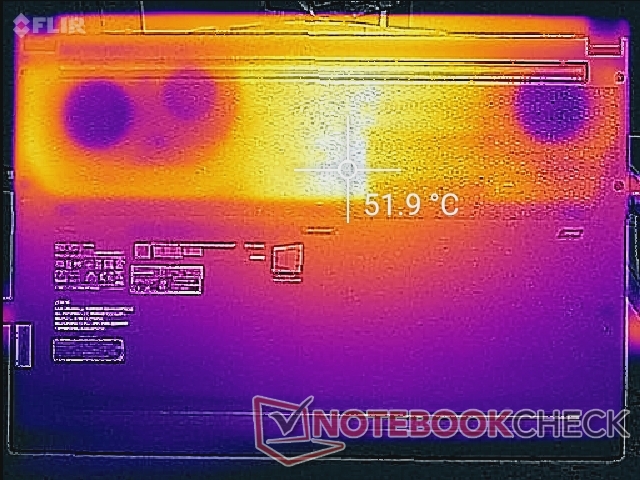
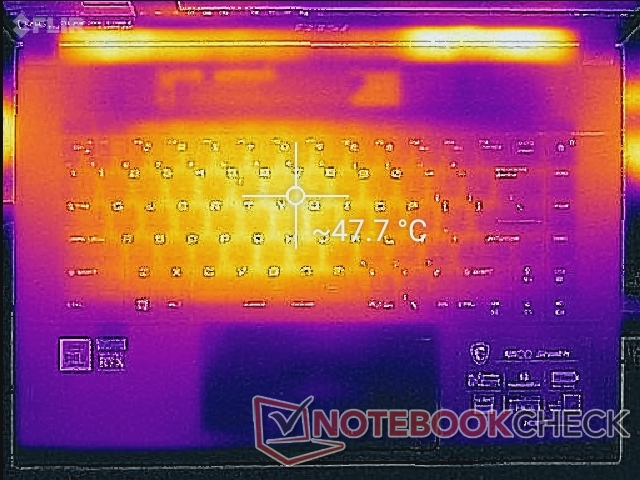
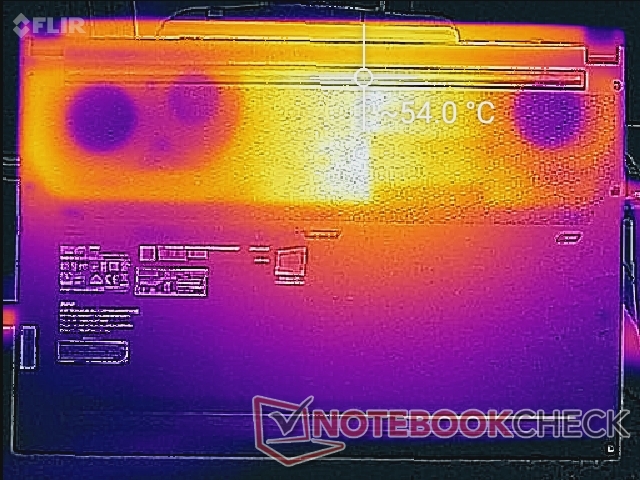
Surface temperatures are similar to what we recorded on last year's MSI GS65. The hot spot continues to be on the very center of the keyboard in contrast to the Asus Zephyrus S GX531 where the hot spot is above the keyboard and away from the keys. If gaming, expect the WASD keys to be about 40 C.
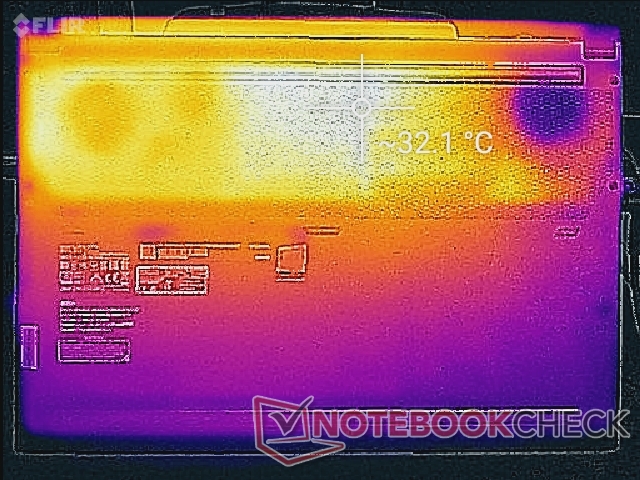
The front half of the laptop will always be much cooler than the back half since the battery occupies most of the front.
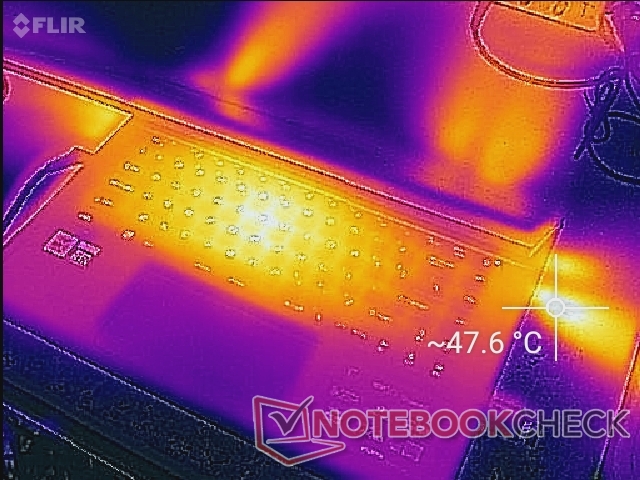
(-) Üst taraftaki maksimum sıcaklık, 40.4 °C / 105 F ortalamasına kıyasla 47.8 °C / 118 F'dir. , Gaming sınıfı için 21.2 ile 68.8 °C arasında değişir.
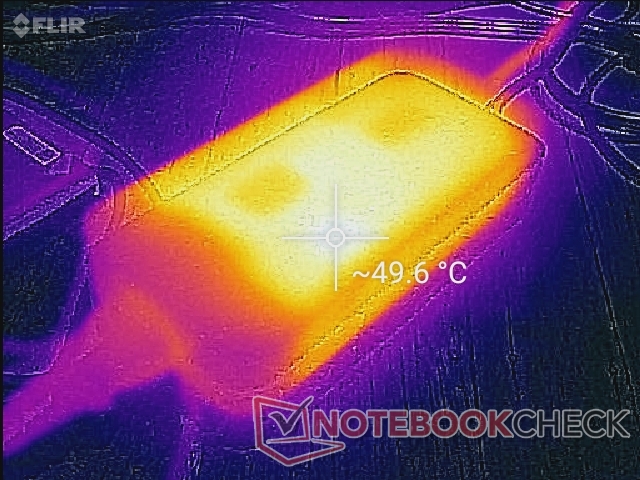
(-) Alt kısım, 43.2 °C / 110 F ortalamasına kıyasla maksimum 54.4 °C / 130 F'ye kadar ısınır
(+) Boşta kullanımda, üst tarafın ortalama sıcaklığı 25.9 °C / 79 F olup, cihazın 33.9 °C / 93 F.
(±) The Witcher 3 oynarken, üst tarafın ortalama sıcaklığı 33.3 °C / 92 F olup, cihazın 33.9 °C / 93 F.
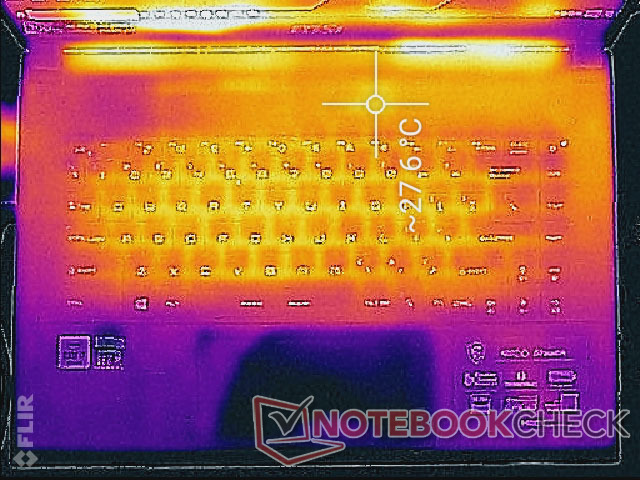
(+) Avuç içi dayanakları ve dokunmatik yüzey, maksimum 28.6 °C / 83.5 F ile cilt sıcaklığından daha soğuktur ve bu nedenle dokunulduğunda soğuktur.
(±) Benzer cihazların avuç içi dayanağı alanının ortalama sıcaklığı 28.8 °C / 83.8 F (+0.2 °C / 0.3 F) idi.
Stress Test
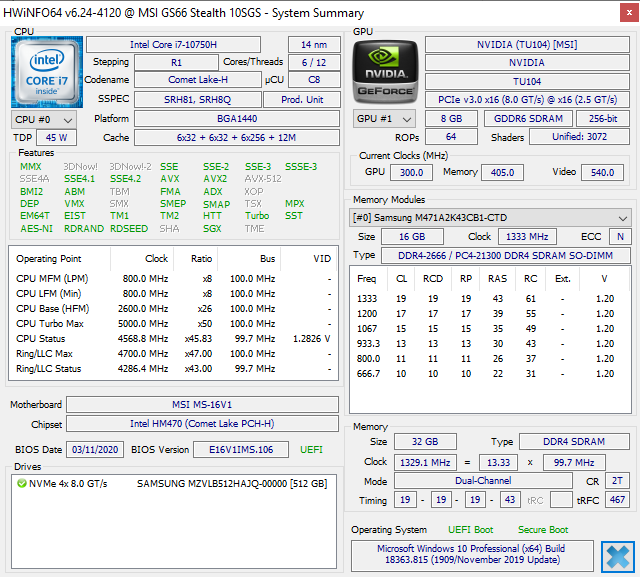
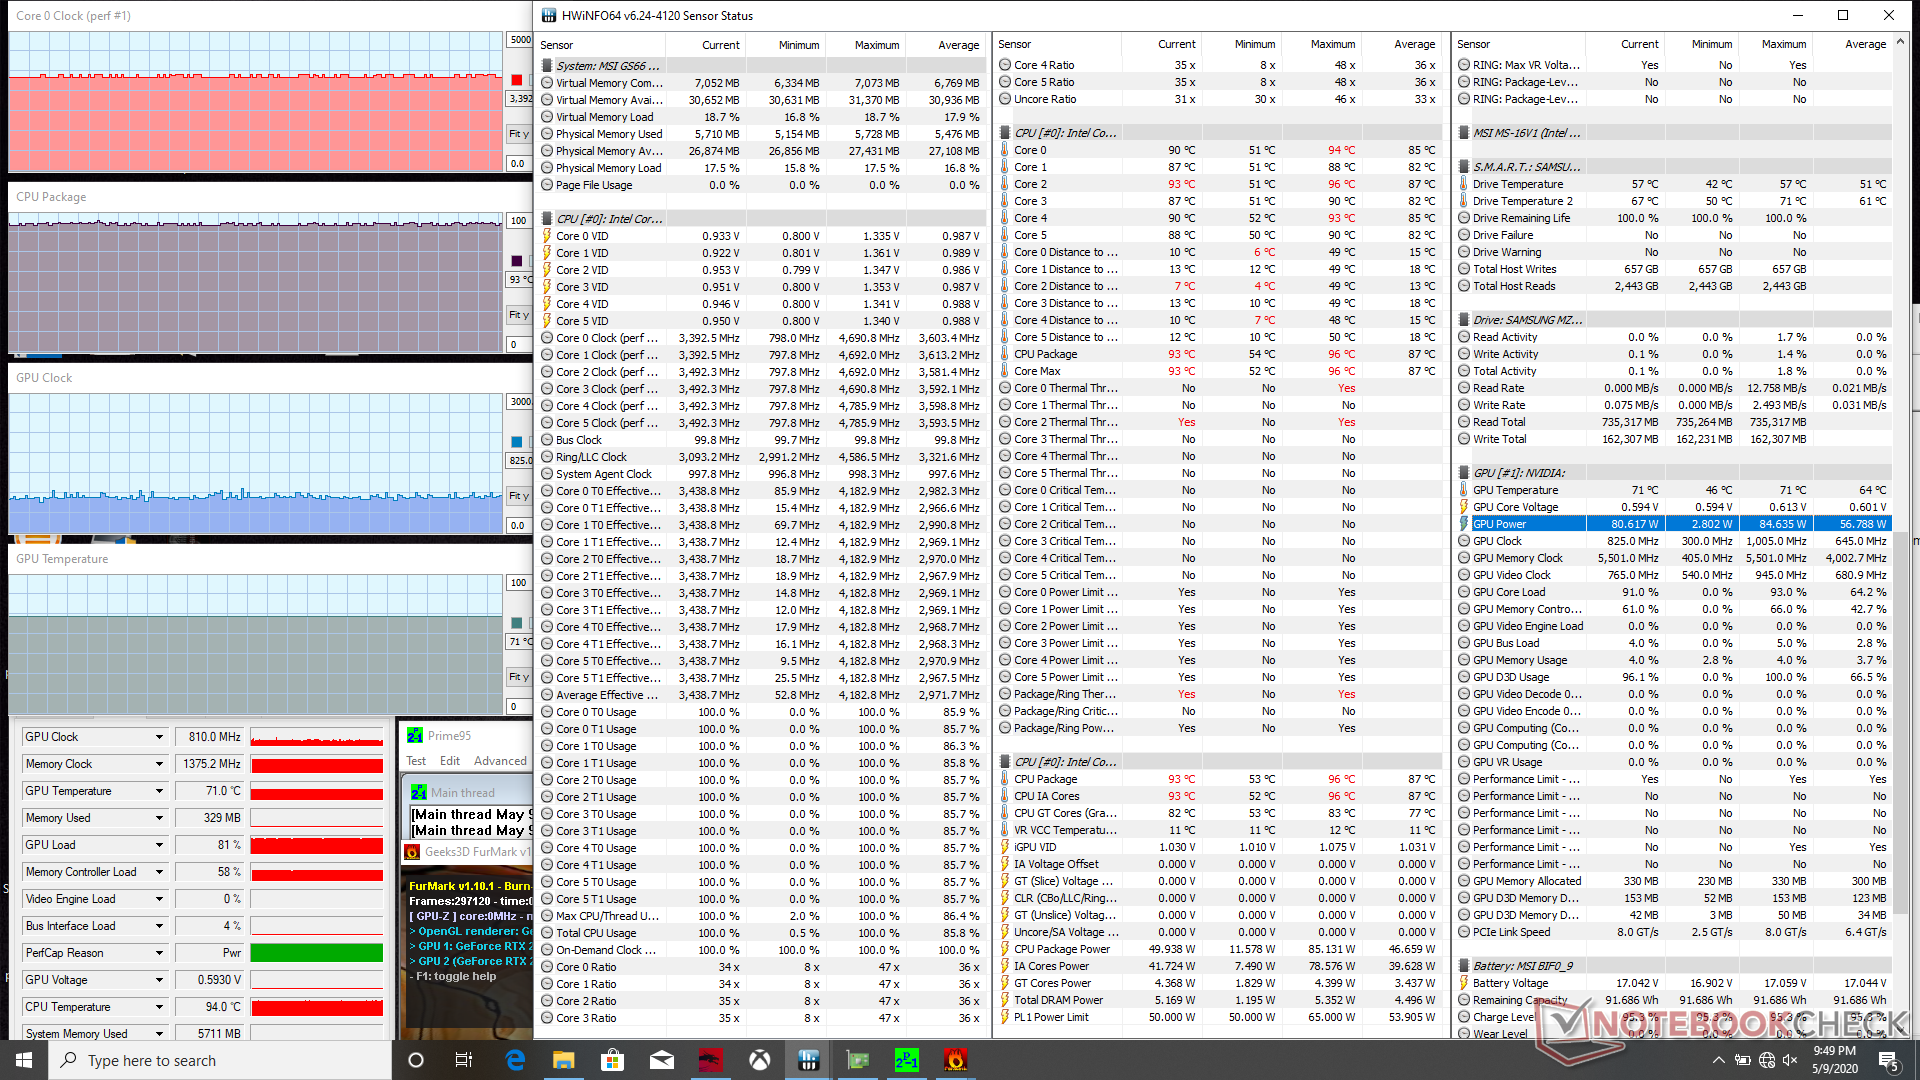
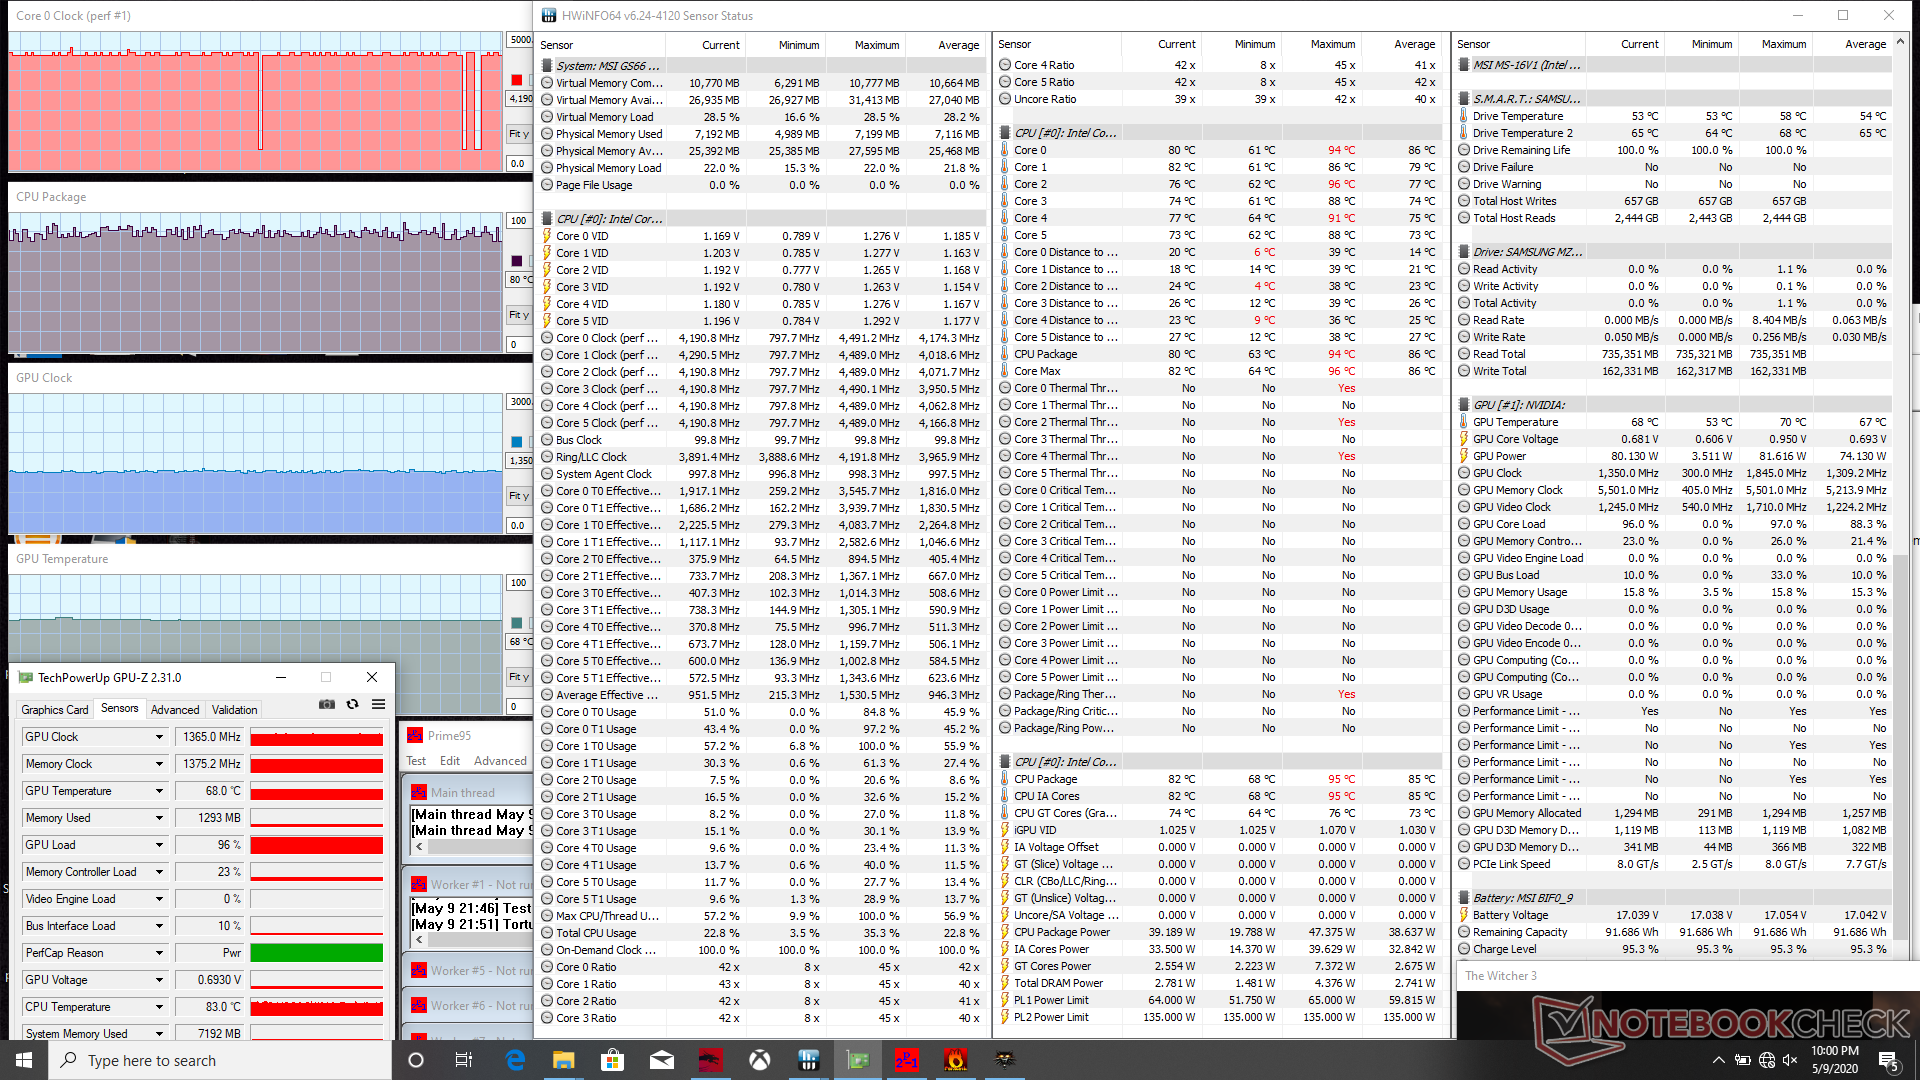
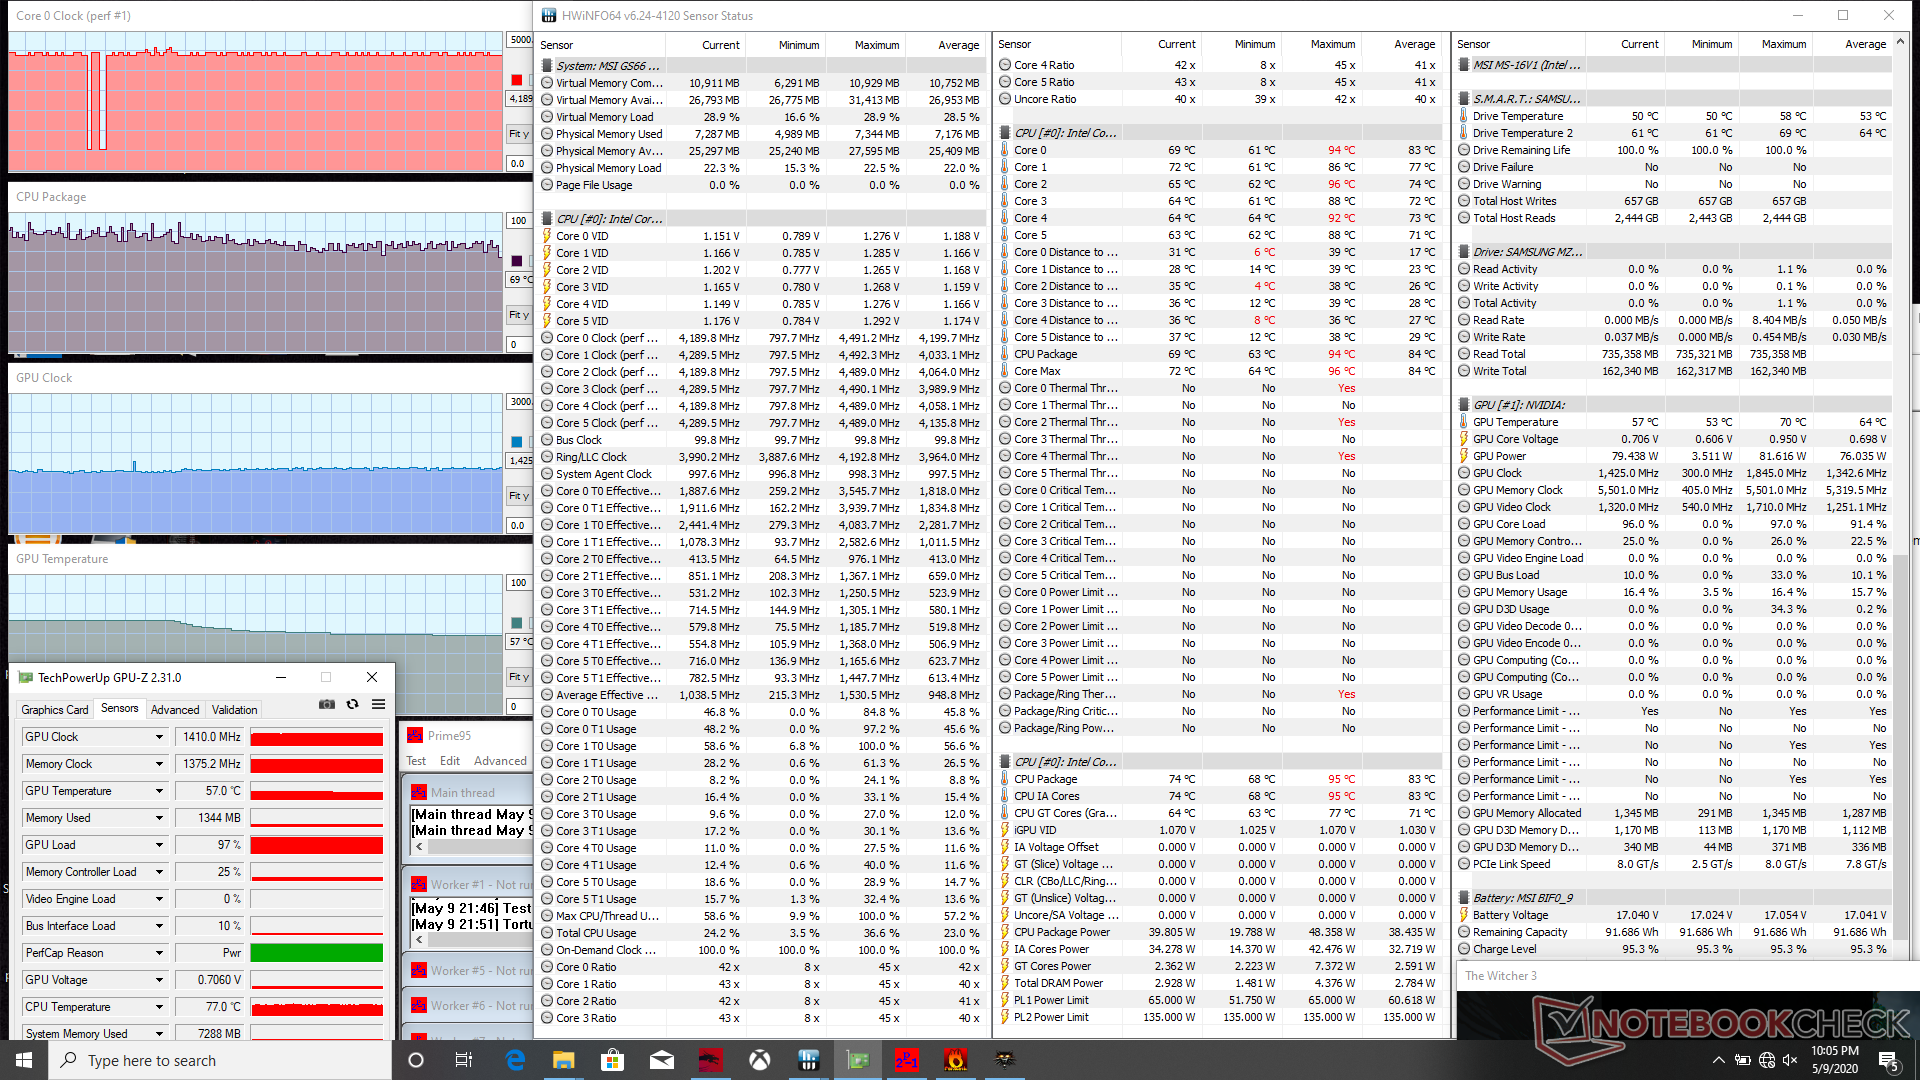
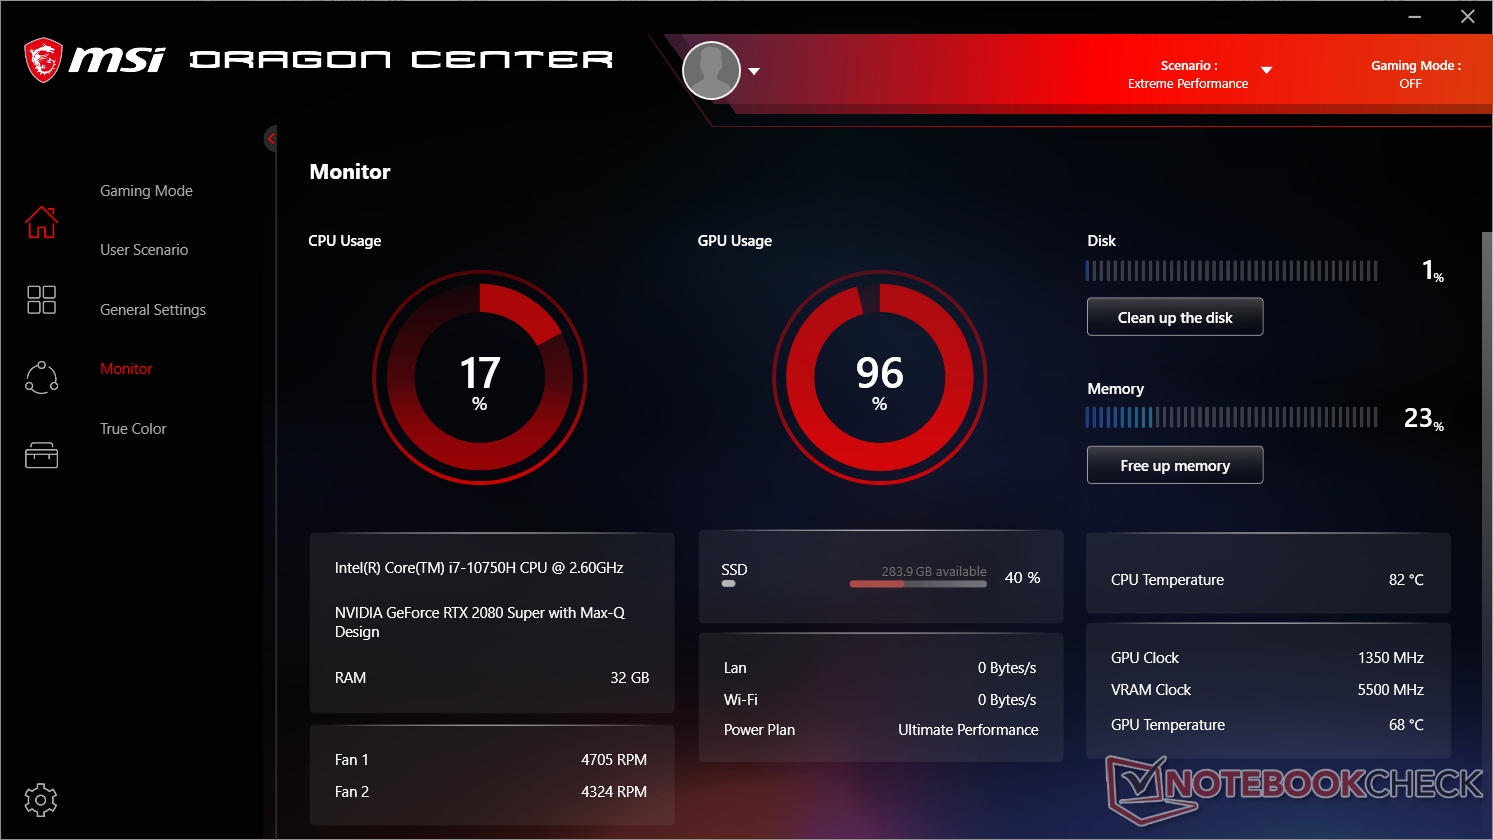
We stress the system with synthetic loads to identify for any potential throttling issues. When running Prime95, the CPU would boost up to 4.2 GHz for only a couple of seconds before dropping to 3.8 - 3.9 GHz for the next 30 to 40 seconds. Afterwards, clock rates and core temperature would stabilize at 3.6 to 3.7 GHz and a toasty 91 C, respectively. Running Prime95 and FurMark simultaneously causes the CPU and GPU to stabilize at 93 C and 71 C, respectively.
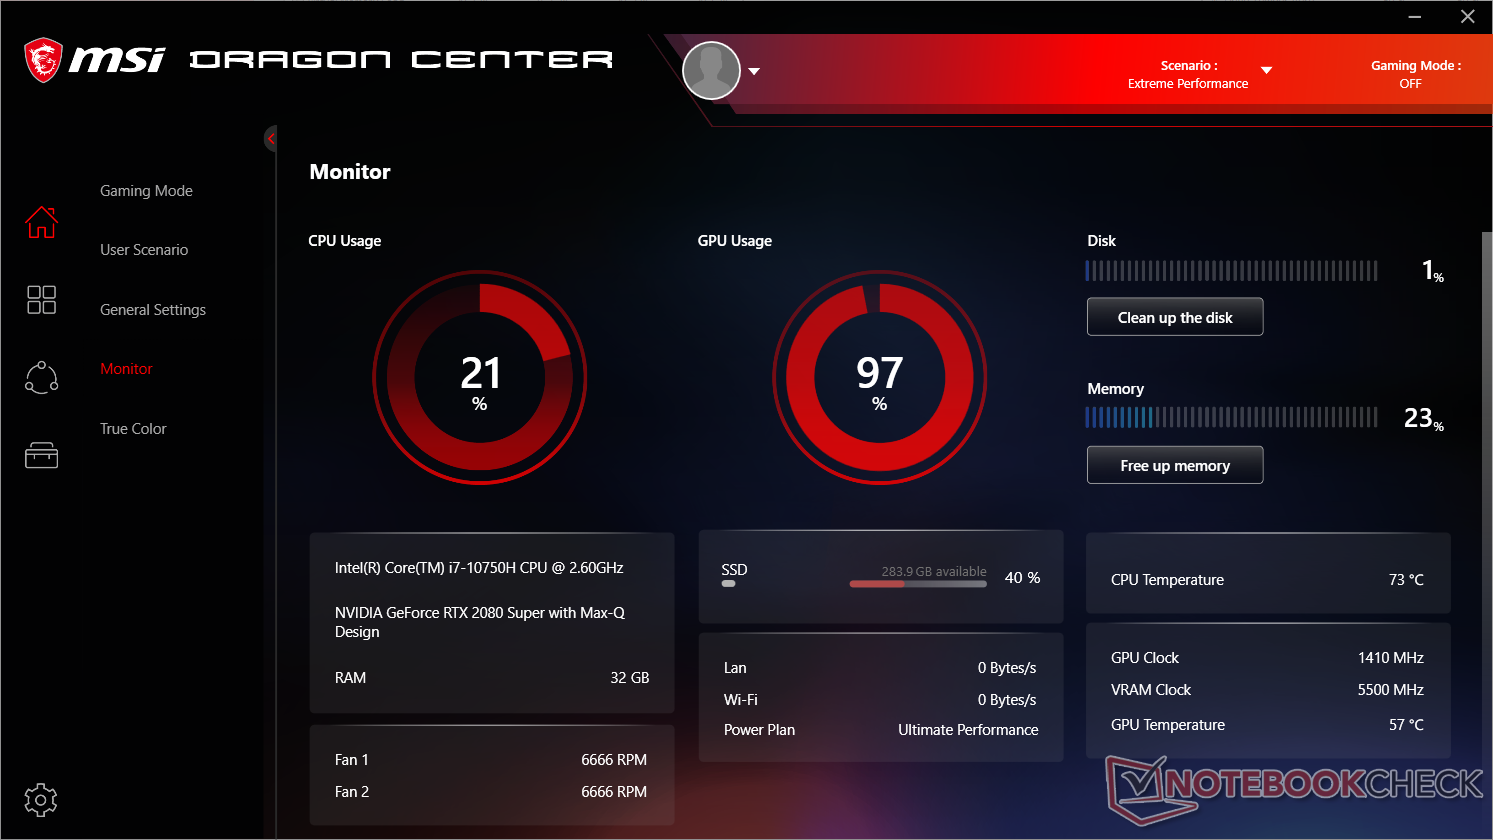
Running Witcher 3 is more representative of real-world gaming loads. The CPU and GPU would stabilize at 82 C and 68 C, respectively, compared to 81 C and 71 C on the older GS65 with the Core i7-9750H and RTX 2080 Max-Q. Enabling Cooler Boost would reduce CPU and GPU temperatures by about 10 C each while boosting GPU clock rate ever so slightly (1365 MHz vs. 1410 MHz).
Running on battery power will impact performance. A Fire Strike run on batteries returns Physics and Graphics scores of 12931 and 5667 points, respectively, compared to 17764 and 20117 points when on mains.
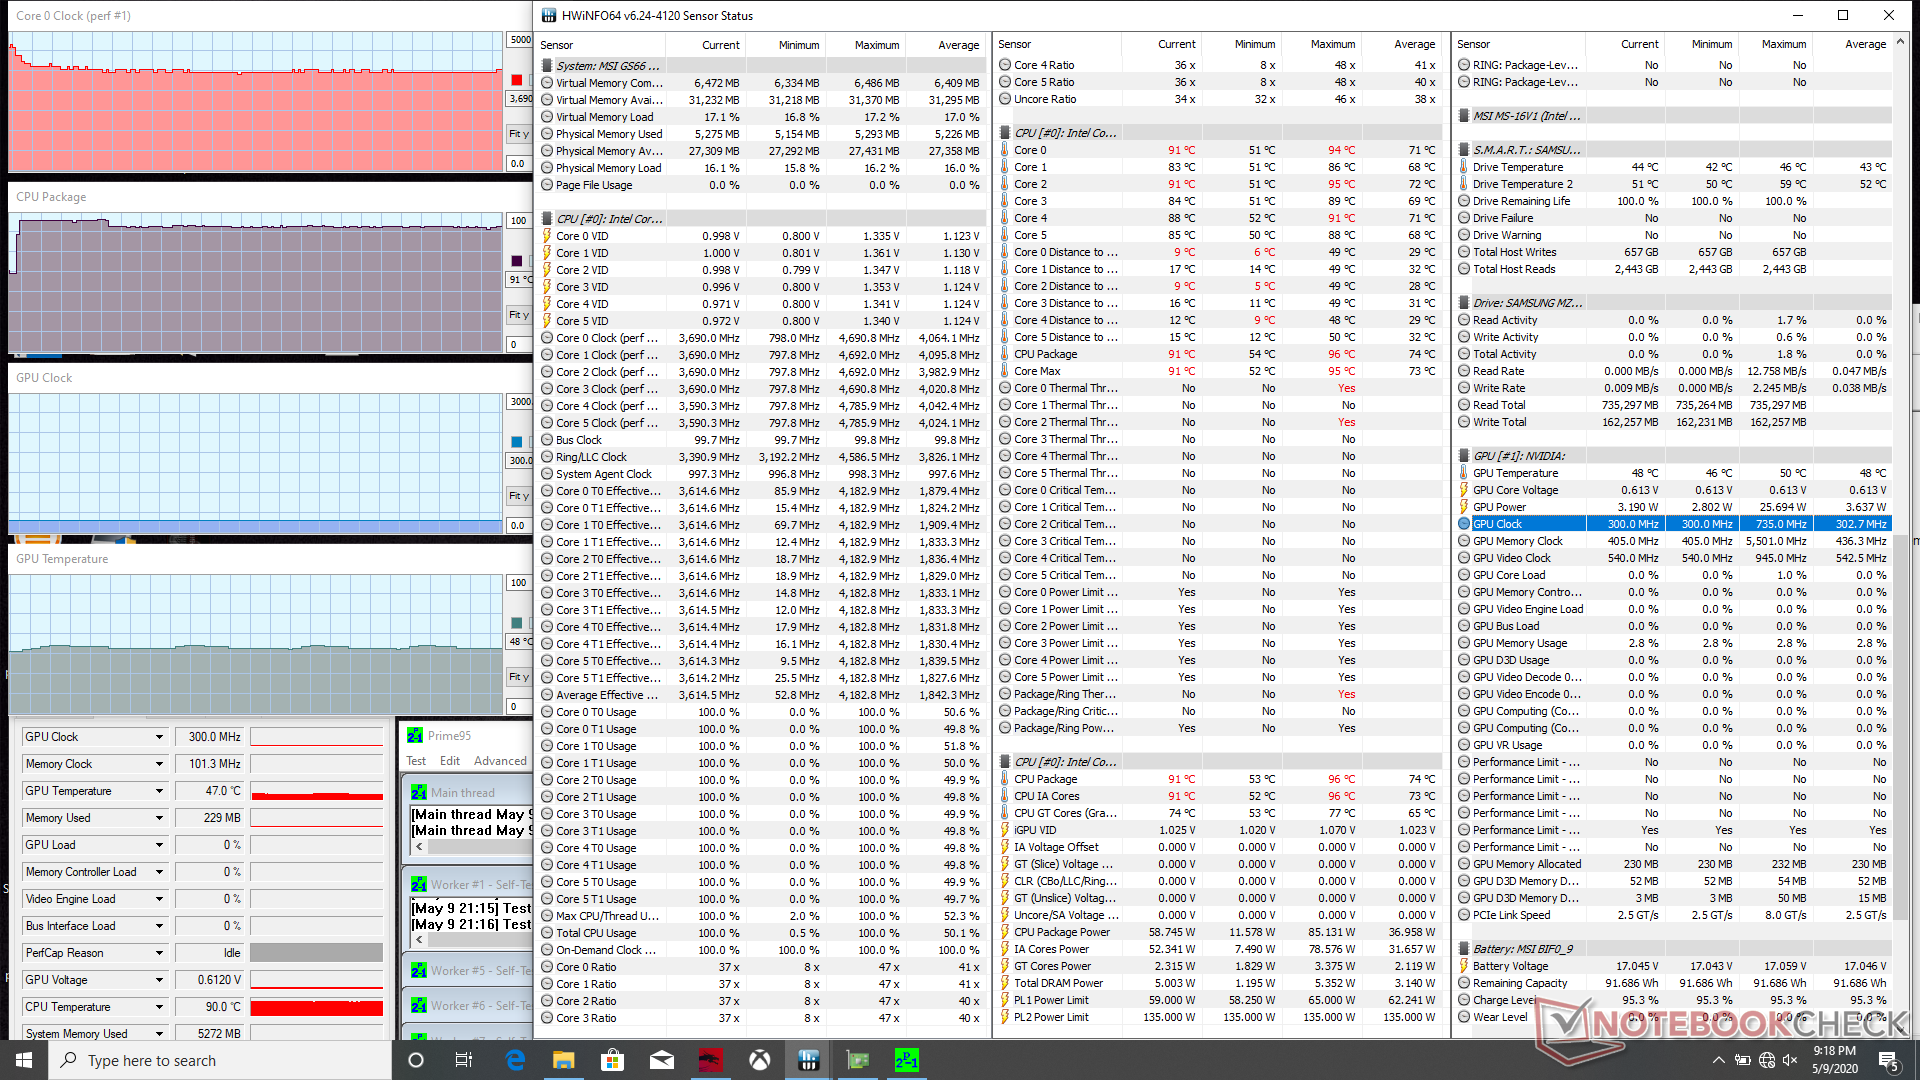
| CPU Clock (GHz) | GPU Clock (MHz) | Average CPU Temperature (°C) | Average GPU Temperature (°C) | |
| System Idle | -- | -- | 55 | 46 |
| Prime95 Stress | 3.6 - 3.7 | -- | 91 | 48 |
| Prime95 + FurMark Stress | 3.3 - 3.4 | 810 | 93 | 71 |
| Witcher 3 Stress (Cooler Boost off) | 4.2 - 4.3 | 1365 | ~82 | 68 |
| Witcher 3 Stress (Cooler Boost on) | 4.2 - 4.3 | 1410 | 71 | 57 |
Speakers


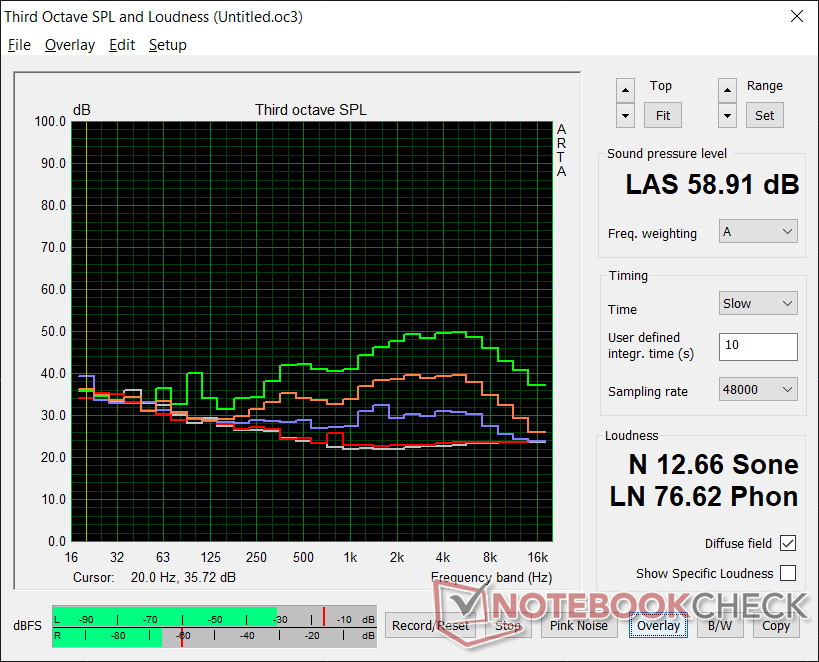
MSI GS66 10SGS ses analizi
(+) | hoparlörler nispeten yüksek sesle çalabilir (92.3 dB)
Bas 100 - 315Hz
(-) | neredeyse hiç bas yok - ortalama olarak medyandan 29.8% daha düşük
(±) | Bas doğrusallığı ortalamadır (7.5% delta - önceki frekans)
Ortalar 400 - 2000 Hz
(±) | daha yüksek ortalar - ortalama olarak medyandan 9.3% daha yüksek
(±) | Ortaların doğrusallığı ortalamadır (9.2% delta - önceki frekans)
Yüksekler 2 - 16 kHz
(±) | azaltılmış yüksekler - ortalama olarak medyandan 6.1% daha düşük
(±) | Yükseklerin doğrusallığı ortalamadır (7.5% delta - önceki frekans)
Toplam 100 - 16.000 Hz
(±) | Genel sesin doğrusallığı ortalamadır (29.4% ortancaya göre fark)
Aynı sınıfla karşılaştırıldığında
» Bu sınıftaki tüm test edilen cihazların %95%'si daha iyi, 2% benzer, 3% daha kötüydü
» En iyisinin deltası 6% idi, ortalama 18% idi, en kötüsü 132% idi
Test edilen tüm cihazlarla karşılaştırıldığında
» Test edilen tüm cihazların %87'si daha iyi, 2 benzer, % 10 daha kötüydü
» En iyisinin deltası 4% idi, ortalama 24% idi, en kötüsü 134% idi
Apple MacBook 12 (Early 2016) 1.1 GHz ses analizi
(+) | hoparlörler nispeten yüksek sesle çalabilir (83.6 dB)
Bas 100 - 315Hz
(±) | azaltılmış bas - ortalama olarak medyandan 11.3% daha düşük
(±) | Bas doğrusallığı ortalamadır (14.2% delta - önceki frekans)
Ortalar 400 - 2000 Hz
(+) | dengeli ortalar - medyandan yalnızca 2.4% uzakta
(+) | orta frekanslar doğrusaldır (5.5% deltadan önceki frekansa)
Yüksekler 2 - 16 kHz
(+) | dengeli yüksekler - medyandan yalnızca 2% uzakta
(+) | yüksekler doğrusaldır (4.5% deltadan önceki frekansa)
Toplam 100 - 16.000 Hz
(+) | genel ses doğrusaldır (10.2% ortancaya göre fark)
Aynı sınıfla karşılaştırıldığında
» Bu sınıftaki tüm test edilen cihazların %7%'si daha iyi, 2% benzer, 91% daha kötüydü
» En iyisinin deltası 5% idi, ortalama 18% idi, en kötüsü 53% idi
Test edilen tüm cihazlarla karşılaştırıldığında
» Test edilen tüm cihazların %5'si daha iyi, 1 benzer, % 94 daha kötüydü
» En iyisinin deltası 4% idi, ortalama 24% idi, en kötüsü 134% idi
Energy Management
Power Consumption
Idling on desktop on Power Saver mode at the minimum brightness setting and with the iGPU active will consume about 15 W. Bumping brightness up to maximum will draw about 2.5 W more. If set to High Performance mode, consumption jumps to almost 30 W meaning it's worth changing the power profile manually to prolong battery life if simply browsing, video streaming, or emailing.
When under higher loads, power consumption trails behind the GS65 10SGS with the Core i9-10980HK even though the latter uses the slower GeForce RTX 2070 Super Max-Q GPU. This makes sense because the RTX 2070 Super Max-Q and RTX 2080 Super Max-Q share nearly the same TDP while the octa-core Core i9 has a cTDP of up to 65 W compared to just 35 W to 45 W on our hexa-core Core i7. Running Witcher 3 draws an average of 146 W to be about 6 percent less than the GS65 10SGS.
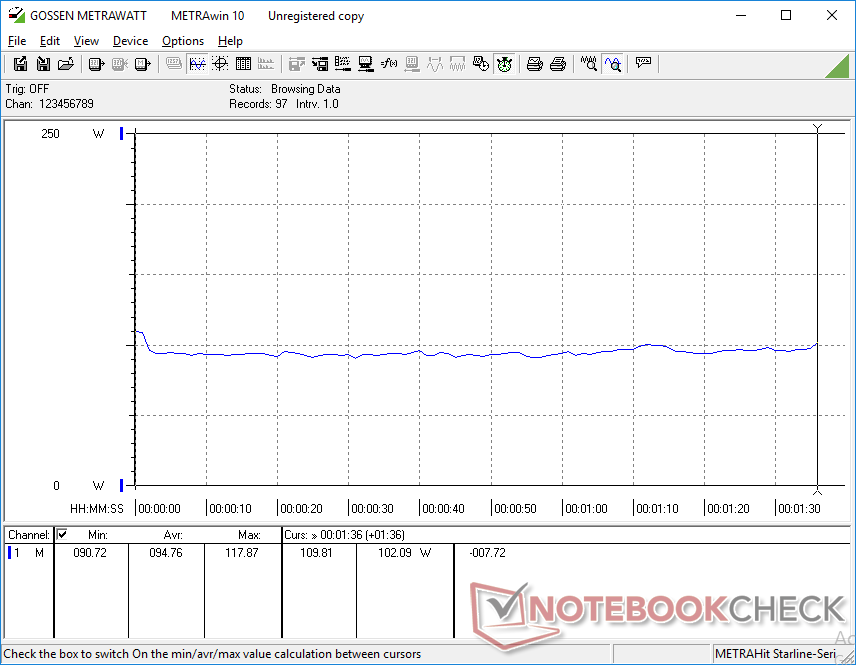
We're able to record a maximum of 210.9 W from the relatively large (~16.5 x 7.5 x 3.3 cm) 230 W AC adapter when running Prime95 and FurMark simultaneously. This peak is only temporary as shown by the graphs below.
| Kapalı / Bekleme modu | |
| Boşta | |
| Çalışırken |
|
Key:
min: | |
| MSI GS66 10SGS i7-10750H, GeForce RTX 2080 Super Max-Q, Samsung SSD PM981 MZVLB512HAJQ, IPS, 1920x1080, 15.6" | MSI GS65 Stealth 9SG i7-9750H, GeForce RTX 2080 Max-Q, Samsung SSD PM981 MZVLB512HAJQ, IPS, 1920x1080, 15.6" | Asus Zephyrus S GX502GW i7-9750H, GeForce RTX 2070 Mobile, 2x Intel SSD 660p SSDPEKNW512G8 (RAID 0), IPS, 1920x1080, 15.6" | Razer Blade 15 RTX 2080 Max-Q i7-9750H, GeForce RTX 2080 Max-Q, Samsung SSD PM981 MZVLB512HAJQ, IPS, 1920x1080, 15.6" | HP Omen X 2S 15-dg0075cl i7-9750H, GeForce RTX 2070 Max-Q, WDC PC SN720 SDAPNTW-1T00, IPS, 1920x1080, 15.6" | Lenovo Legion Y740-15ICHg i7-9750H, GeForce RTX 2070 Max-Q, WDC PC SN520 SDAPMUW-128G, IPS, 1920x1080, 15.6" | MSI GS66 Stealth 10SFS i9-10980HK, GeForce RTX 2070 Super Max-Q, Samsung SSD PM981 MZVLB1T0HALR, IPS, 1920x1080, 15.6" | |
|---|---|---|---|---|---|---|---|
| Power Consumption | -8% | -31% | 9% | -97% | -15% | -1% | |
| Idle Minimum * (Watt) | 14.9 | 18.3 -23% | 24 -61% | 12.5 16% | 46 -209% | 22.2 -49% | 13 13% |
| Idle Average * (Watt) | 17.5 | 22 -26% | 27 -54% | 15.3 13% | 59 -237% | 24.9 -42% | 16 9% |
| Idle Maximum * (Watt) | 29.5 | 28.8 2% | 33 -12% | 20.7 30% | 65.5 -122% | 30.6 -4% | 27 8% |
| Load Average * (Watt) | 94.8 | 93 2% | 129 -36% | 90.2 5% | 99.8 -5% | 101 -7% | 109 -15% |
| Witcher 3 ultra * (Watt) | 146.1 | 142.6 2% | 176 -20% | 162 -11% | 154.1 -5% | 143 2% | 155 -6% |
| Load Maximum * (Watt) | 210.9 | 215.9 -2% | 216 -2% | 209.3 1% | 222.7 -6% | 186 12% | 236 -12% |
* ... daha küçük daha iyidir
Battery Life
One of the major differences between the GS65 and newer GS66 is the increase in battery capacity from 82 Wh to 99 Wh. There is no consumer laptop with an integrated battery pack larger than 99 Wh since the FAA does not allow batteries higher than 100 Wh onboard commercial aircraft. The result is a long battery life especially for a gaming laptop with RTX 2080 graphics at almost 7 hours of real-world WLAN use. Be sure to set the system to Power Saver or Balanced mode to reduce power consumption as mentioned above.
A drawback to the large battery capacity is the slower charging rate. Expect to wait around 2.5 to 3 hours for a full charge compared to 1.5 to 2 hours on most other laptops. The system cannot be recharged via USB Type-C unlike on the Asus Zephyrus M.
| MSI GS66 10SGS i7-10750H, GeForce RTX 2080 Super Max-Q, 99.99 Wh | MSI GS65 Stealth 9SG i7-9750H, GeForce RTX 2080 Max-Q, 82 Wh | Asus Zephyrus S GX502GW i7-9750H, GeForce RTX 2070 Mobile, 76 Wh | Razer Blade 15 RTX 2080 Max-Q i7-9750H, GeForce RTX 2080 Max-Q, 80 Wh | Lenovo Legion Y740-15ICHg i7-9750H, GeForce RTX 2070 Max-Q, 57 Wh | MSI GS66 Stealth 10SFS i9-10980HK, GeForce RTX 2070 Super Max-Q, 99.99 Wh | |
|---|---|---|---|---|---|---|
| Pil Çalışma Süresi | -13% | -42% | 19% | -57% | -8% | |
| Reader / Idle (h) | 10.2 | 5.9 -42% | 15.9 56% | 8.4 -18% | ||
| WiFi v1.3 (h) | 6.9 | 6 -13% | 3.7 -46% | 6.6 -4% | 3 -57% | 6.1 -12% |
| Load (h) | 1.6 | 1 -37% | 1.7 6% | 1.7 6% |
Artılar
Eksiler
Verdict

The MSI GS66 comes in several SKUs with two CPU options (Core i7-10750H, Core i9-10980HK) and three GPU options (GeForce RTX 2060, RTX 2070 Super Max-Q, RTX 2080 Super Max-Q). The two SKUs we've tested so far are the GS66 10SGS (Core i7-10750H, RTX 2080 Super Max-Q) and GS66 10SFS (Core i9-10980HK, RTX 2070 Super Max-Q). If we had to choose between the faster CPU with slower GPU or slower CPU with faster GPU for gaming purposes, it would definitely be the latter as games will still run marginally faster overall with this configuration.
If you intend to use the GS66 for CPU heavy tasks outside of gaming, then the octa-core Core i9 SKU might make more sense because of its 25 to 35 percent faster multi-thread performance advantage over the hexa-core Core i7. Otherwise, any differences would be too marginal when gaming where the faster GPU option often takes precedence. Users who want the best of both worlds can always go with the ultra high-end GS66 10SGS-031 configuration.
Impressive new chassis with not-as-impressive gaming upgrades. The GeForce RTX 2080 Super Max-Q in the GS66 offers just 5 to 10 percent faster graphics performance than the older MSI GS65 with the GeForce RTX 2080 Max-Q. The best reasons to purchase the GS66 over the GS65 are therefore for its stronger chassis design and upgradeability rather than the minor performance gains when gaming.
MSI GS66 10SGS
- 05/17/2020 v7 (old)
Allen Ngo
Price comparison

