Asus TUF Gaming F15 FX507ZM dizüstü bilgisayar incelemesi: En güçlü GeForce RTX 3060 performansı
Asus, TUF Gaming F15 serisini 2022 için yeniledi ve şimdi Intel 12. nesil işlemci serisi yaygın olarak mevcut. Bununla birlikte, basit bir işlemci takası yerine üretici, FX507'yi yaratmak için geçen yılki FX506 kasasının önemli yönlerini güncelledi. Bu inceleme, 2021 FX506 ve 2022 FX507 arasındaki tüm önemli farkların yanı sıra kullanıcıların FX507'den bekleyebilecekleri performans seviyelerini gözden geçirecek.
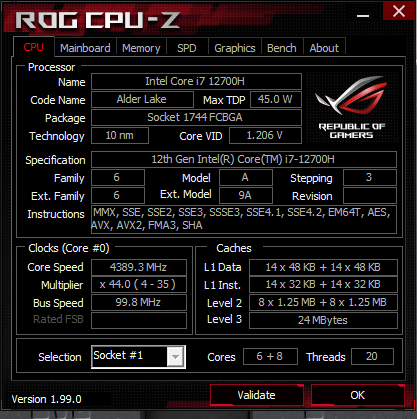
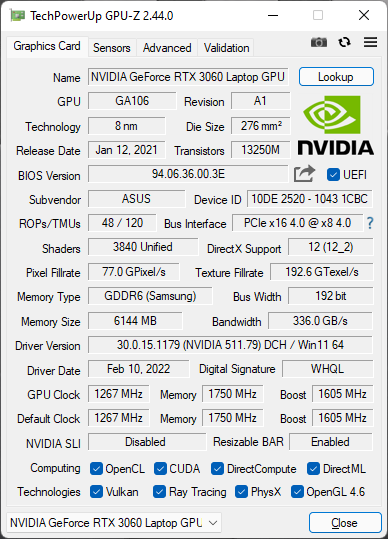
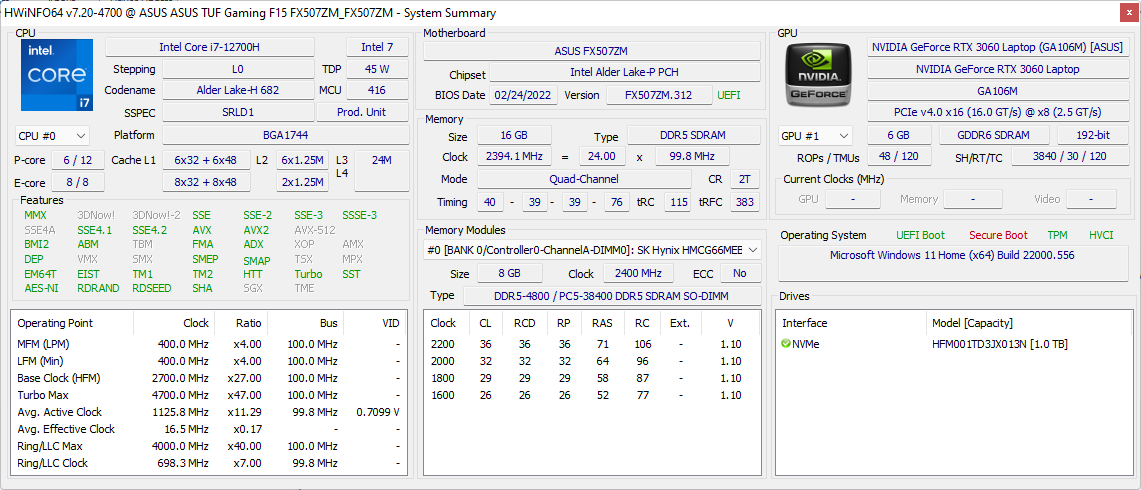
İncelemedeki konfigürasyonumuz Alder Lake-H Core i7-12700H işlemci, GeForce RTX 3060 ekran kartı, 300 Hz 1080p IPS paneli ve yaklaşık 1500 USD perakende satış fiyatına 90 Wh pil ile birlikte gelir. Daha yavaş ekran yenileme hızlarına, daha küçük 56 Wh pile ve daha yavaş işlemci seçeneklerine sahip diğer SKU'lar mevcut olabilir. FX507, eski FX506'daki ile aynı GeForce RTX 3060 ekran kartı ile gelse de, yeni modeldeki ekran kartının daha fazla performans elde etmek için çok daha yüksek bir TGP hedeflediğini unutmayın (140 W'a karşı 95 W).
FX507'nin rakipleri arasında Razer Blade 15 Base Model, MSI GP66, Acer Predator Triton, veya Gigabyte Aorus 5 serisi gibi diğer orta seviye 15,6 inç ince ve hafif oyun dizüstü bilgisayarları yer alıyor.
Daha fazla Asus incelemesi:
Karşılaştırmada muhtemel rakipleri
Derece | Tarih | Model | Ağırlık | Yükseklik | Boyut | Çözünürlük | En iyi fiyat |
|---|---|---|---|---|---|---|---|
| 87.2 % v7 (old) | 06/2022 | Asus TUF Gaming F15 FX507ZM i7-12700H, GeForce RTX 3060 Laptop GPU | 2.1 kg | 24.95 mm | 15.60" | 1920x1080 | |
| 85.9 % v7 (old) | 10/2021 | Asus TUF Gaming F15 FX506HM i7-11800H, GeForce RTX 3060 Laptop GPU | 2.3 kg | 24.9 mm | 15.60" | 1920x1080 | |
| 82.4 % v7 (old) | 02/2021 | Asus TUF Dash F15 FX516PR i7-11370H, GeForce RTX 3070 Laptop GPU | 2 kg | 20 mm | 15.60" | 1920x1080 | |
| 86.3 % v7 (old) | 09/2021 | Asus ROG Strix Scar 15 G533QS R9 5900HX, GeForce RTX 3080 Laptop GPU | 2.3 kg | 27.2 mm | 15.60" | 2560x1440 | |
| 82.9 % v7 (old) | 10/2020 | Asus Zephyrus S15 GX502L i7-10875H, GeForce RTX 2070 Super Mobile | 2.1 kg | 19 mm | 15.60" | 1920x1080 | |
| 85.8 % v7 (old) | 07/2021 | Asus ZenBook Pro Duo UX582 LR-1BH2 i7-10870H, GeForce RTX 3070 Laptop GPU | 2.4 kg | 21.5 mm | 15.60" | 3840x2160 |
Kasa — Daha Küçük ve Daha Hafif
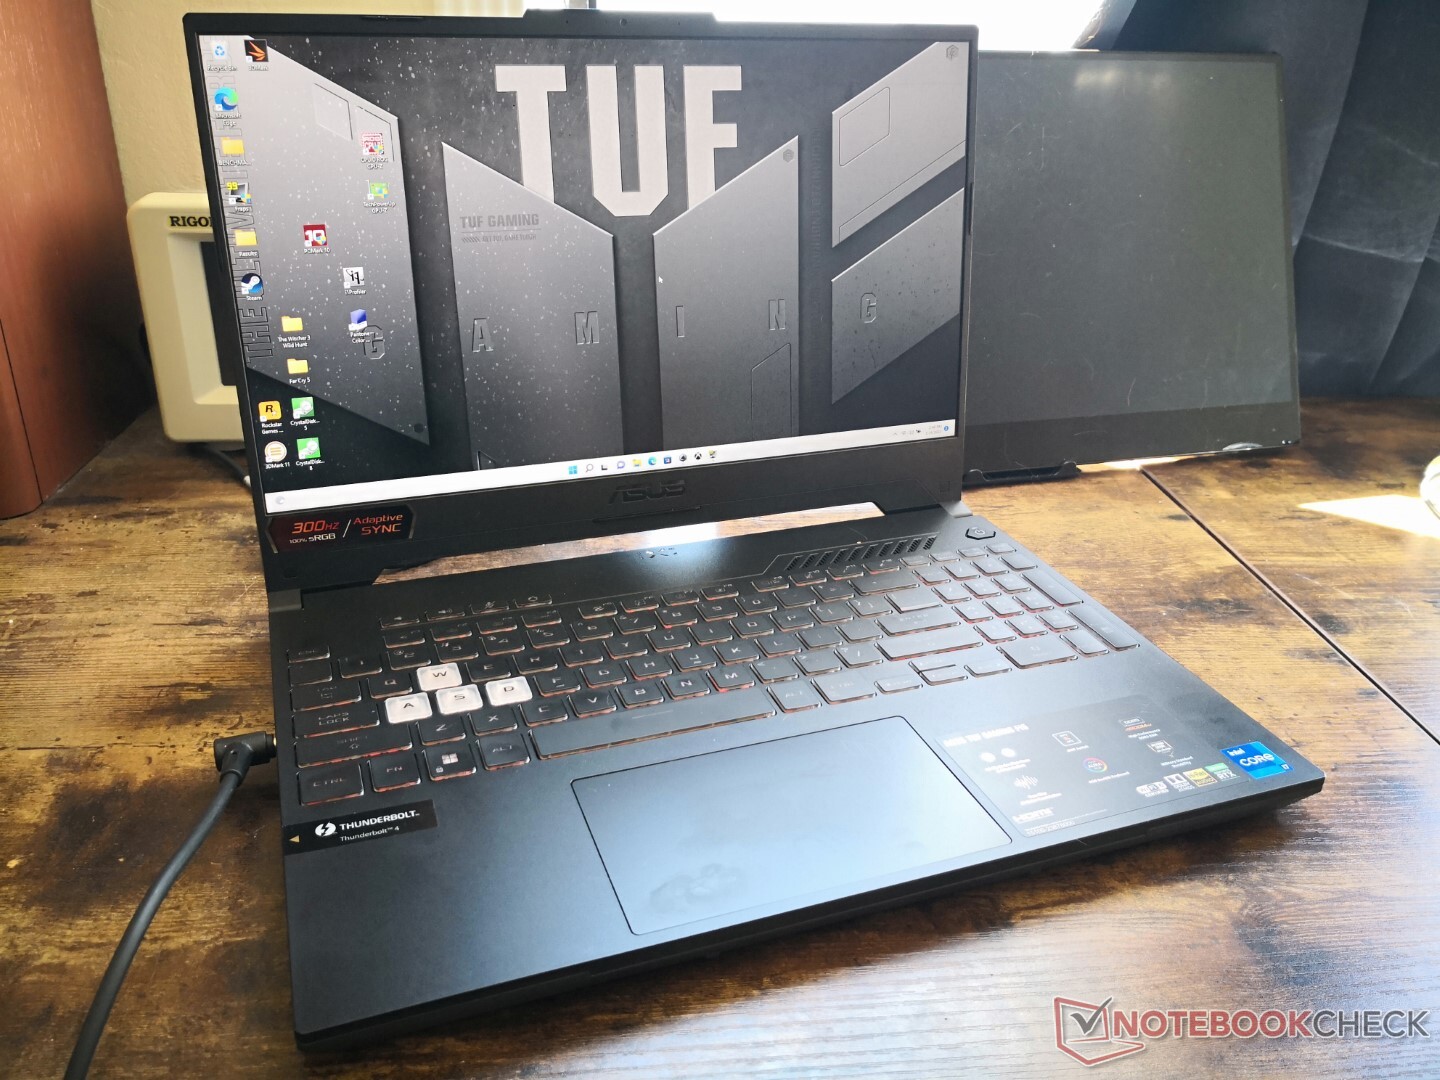
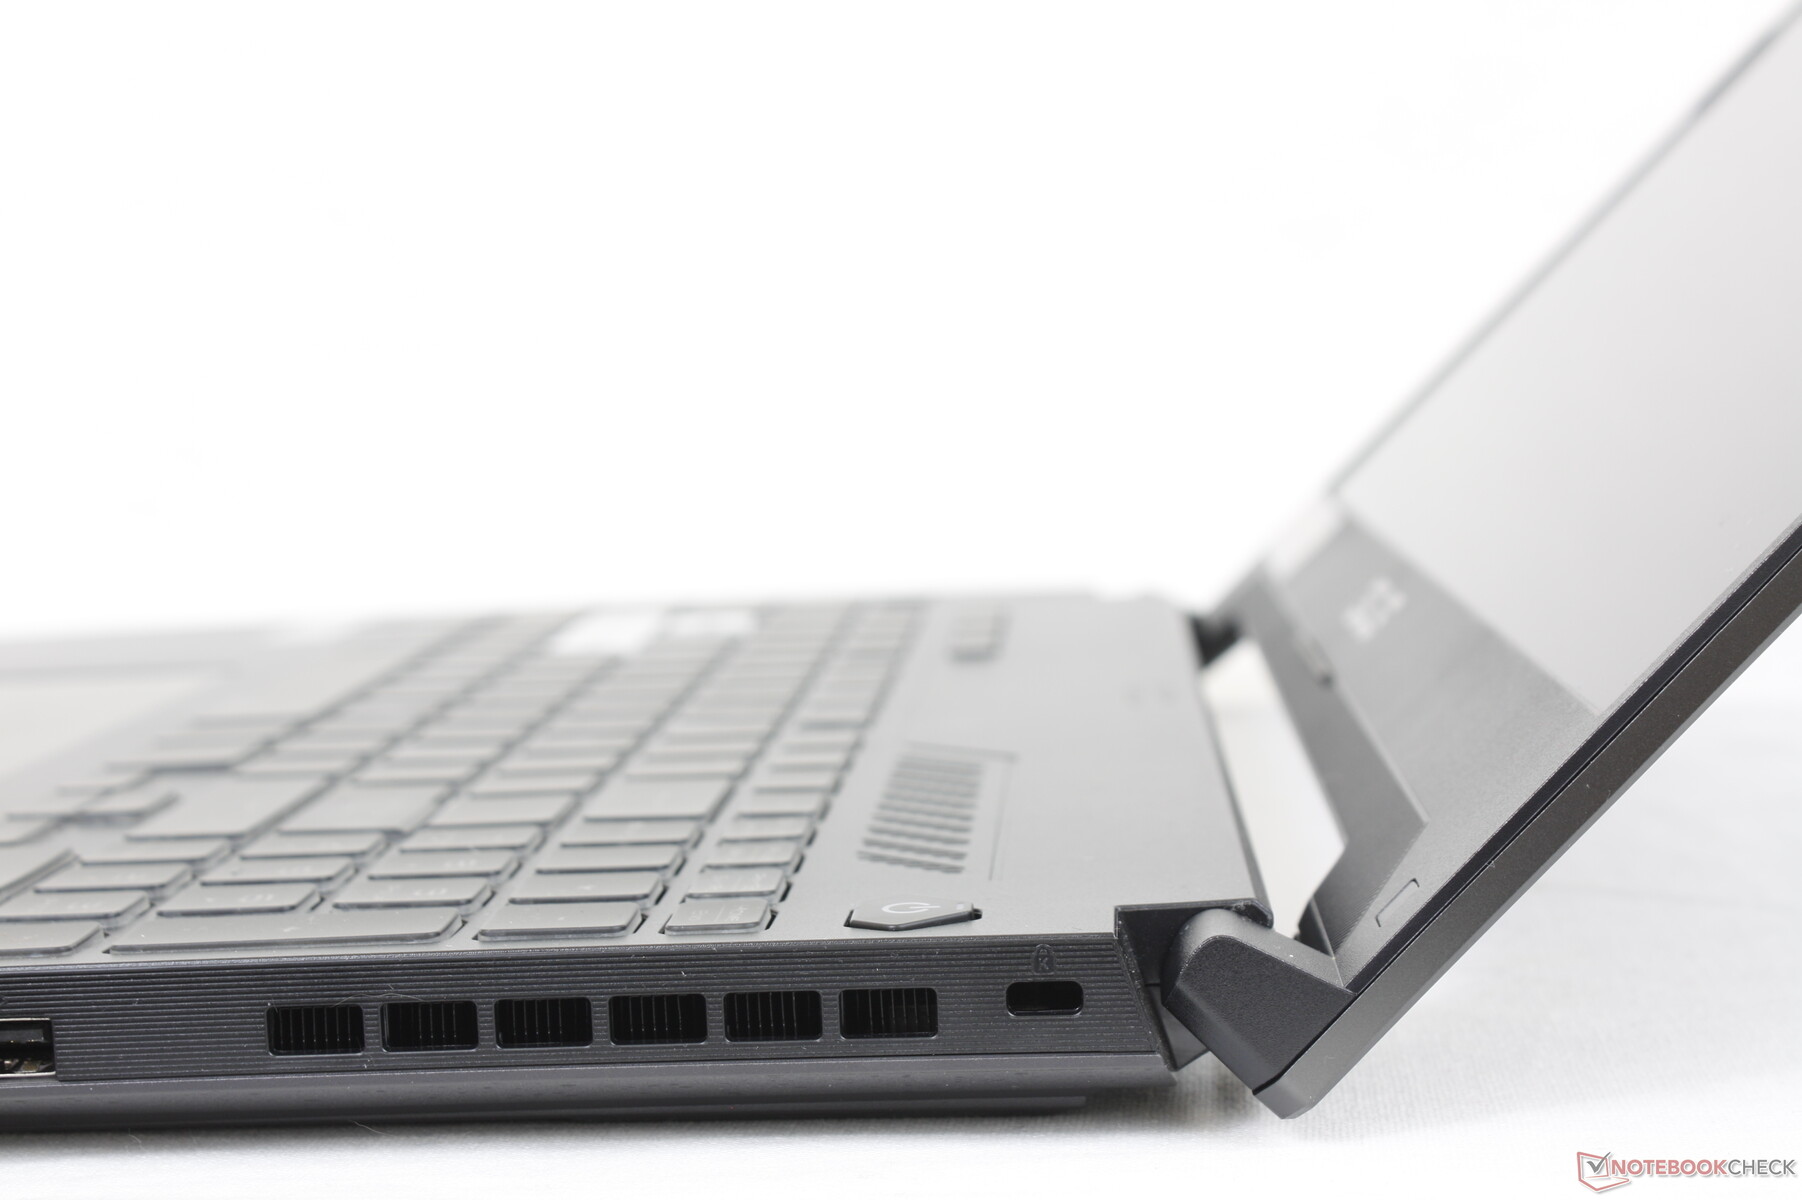
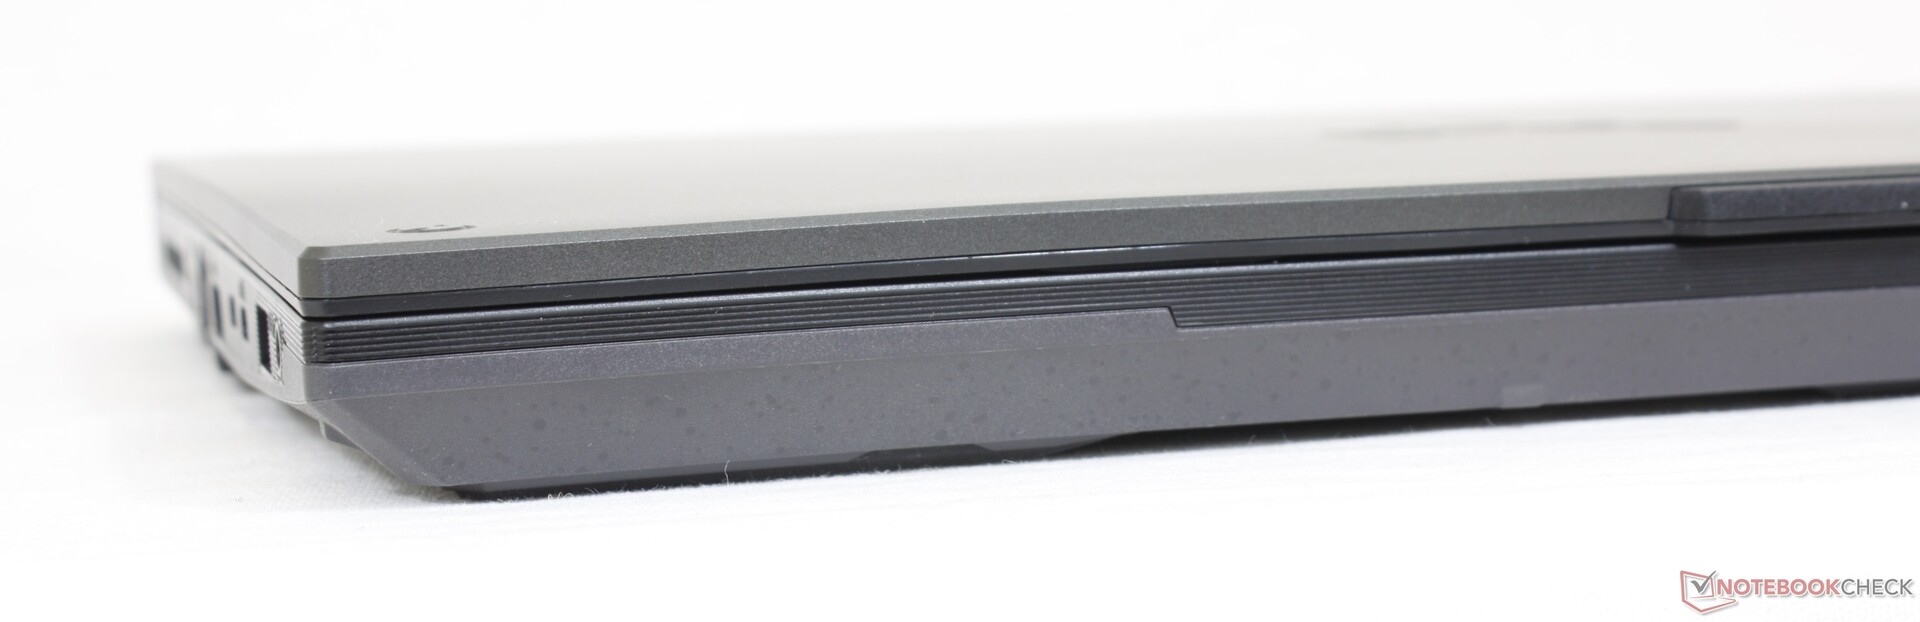
FX507, ilk bakışta FX506 ile aynı görünebilir, ancak aslında çok sayıda küçük değişiklik var. Örneğin, köşeler eskisinden daha keskinken, suni fırçalanmış parlak avuç içi dayanakları artık daha düz mat bir dokuya sahip. FX506'daki tümseklerin ve değişen dokuların çoğu, daha temiz ve daha minimalist bir görünüm için kaldırılmıştır. Şasi malzemeleri, benzer bir sertlik seviyesi için geçen yılki modelle aynı görünüyor.
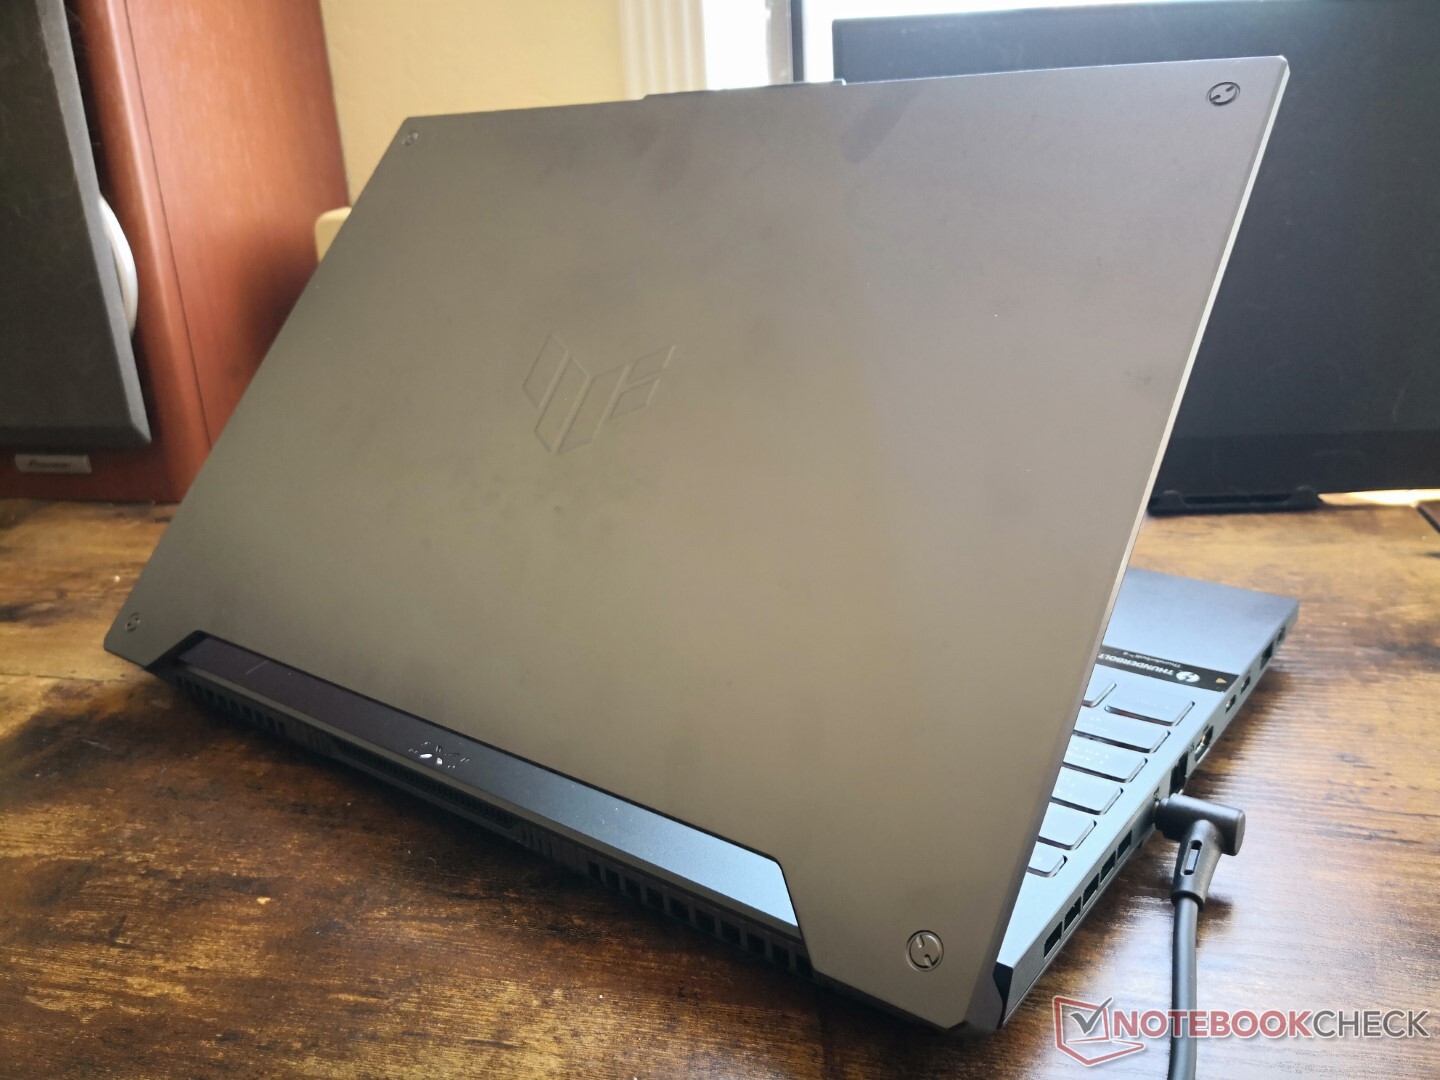
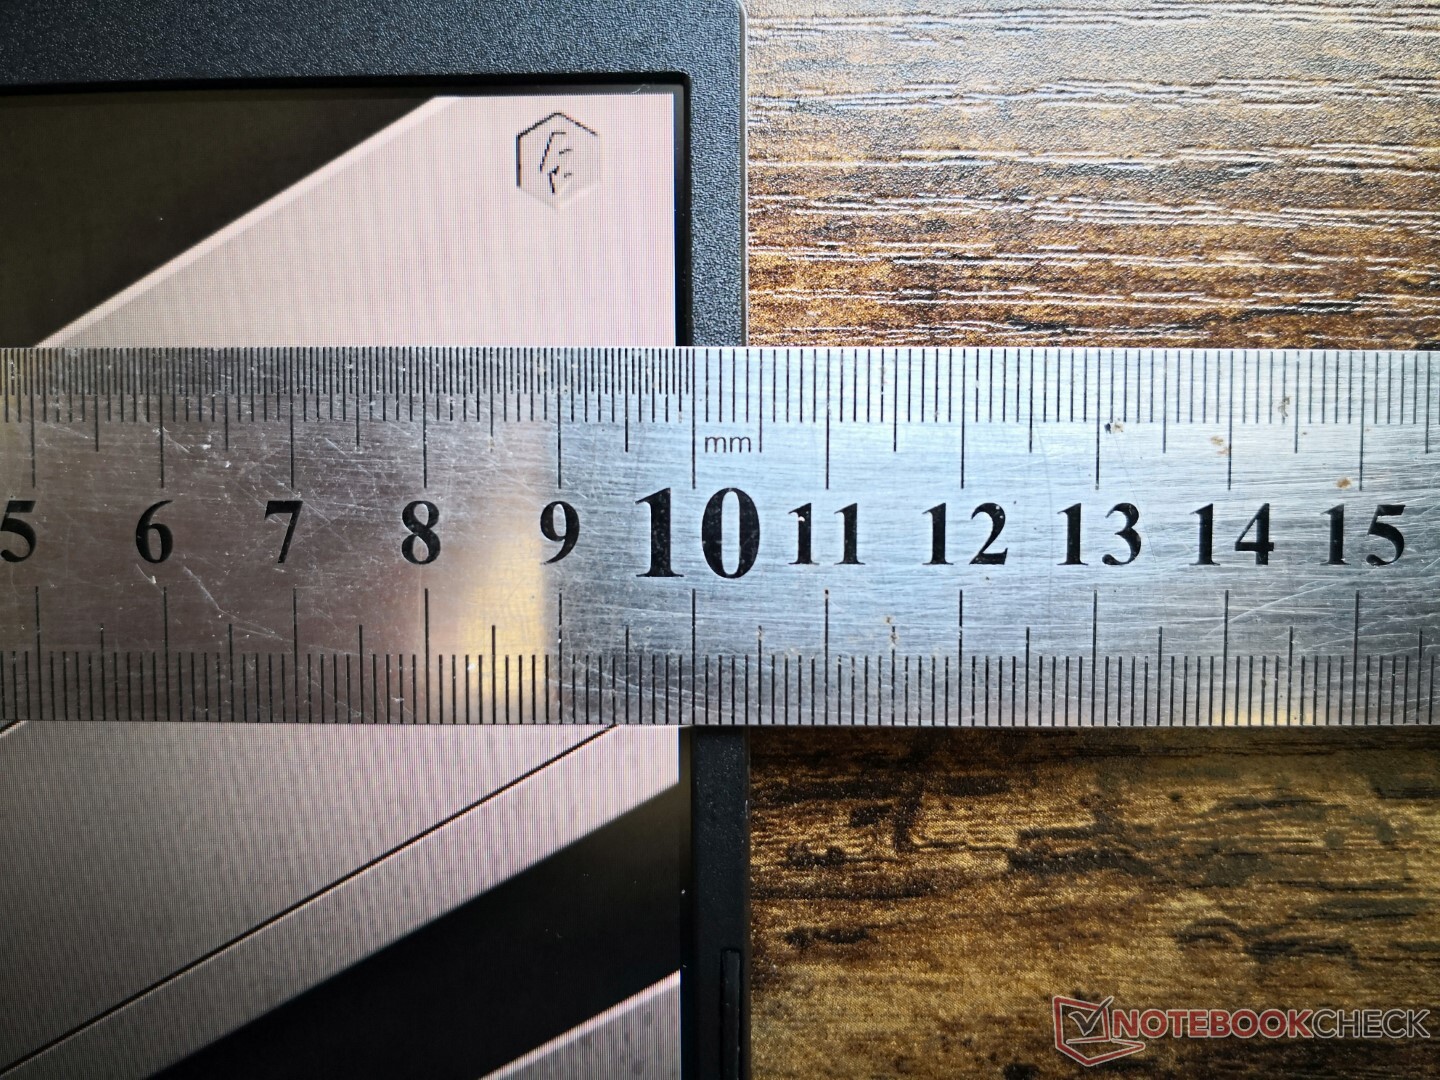
Asus, önceki FX506 modeline kıyasla FX507'nin hem boyutunu hem de ağırlığını azaltmayı başardı. Daha yeni model, daha ince Zephyrus S15 tasarımı kadar hafif olması için biraz daha kısa (354.9 mm'ye karşı 359.8 mm), biraz daha dar (251.9 mm x 256 mm) ve biraz daha hafif (2.1 kg'a karşı 2.3 kg) biraz daha hafif.
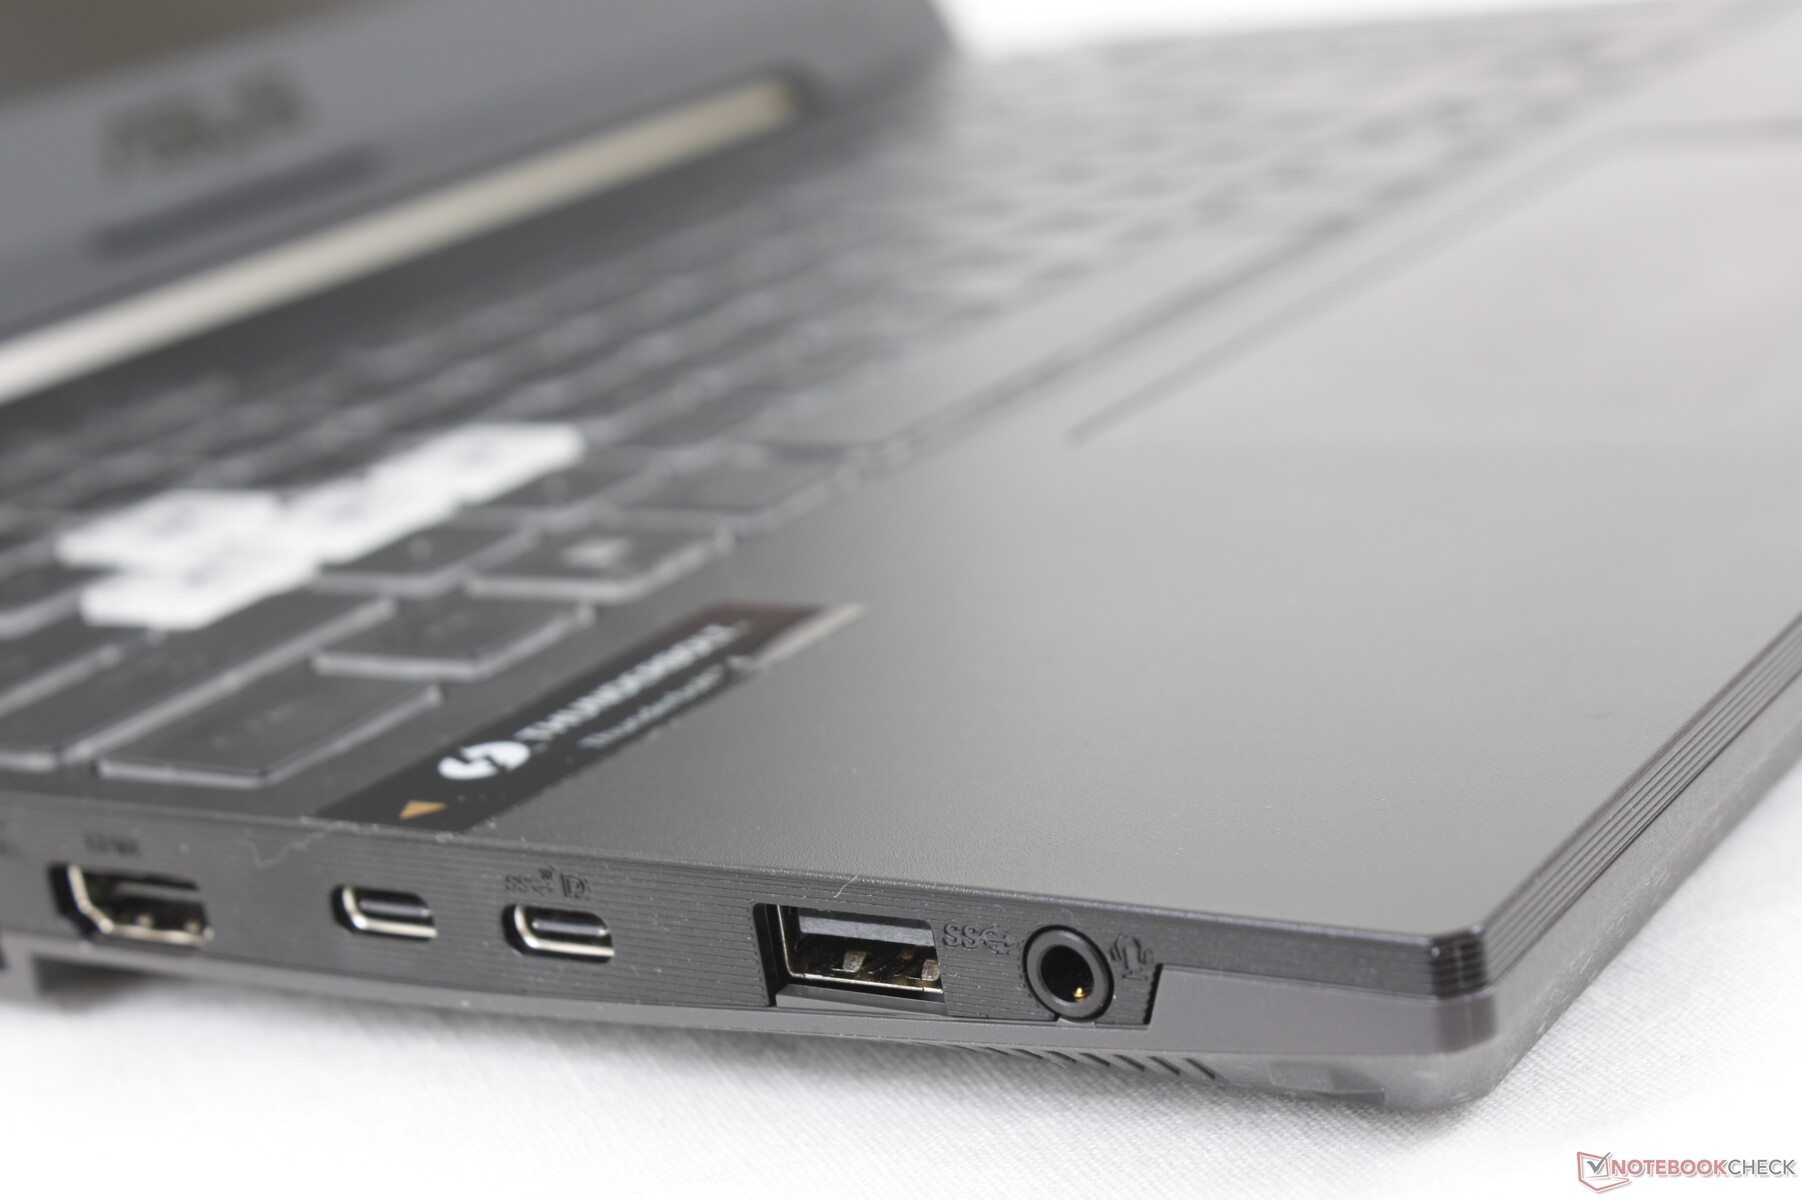
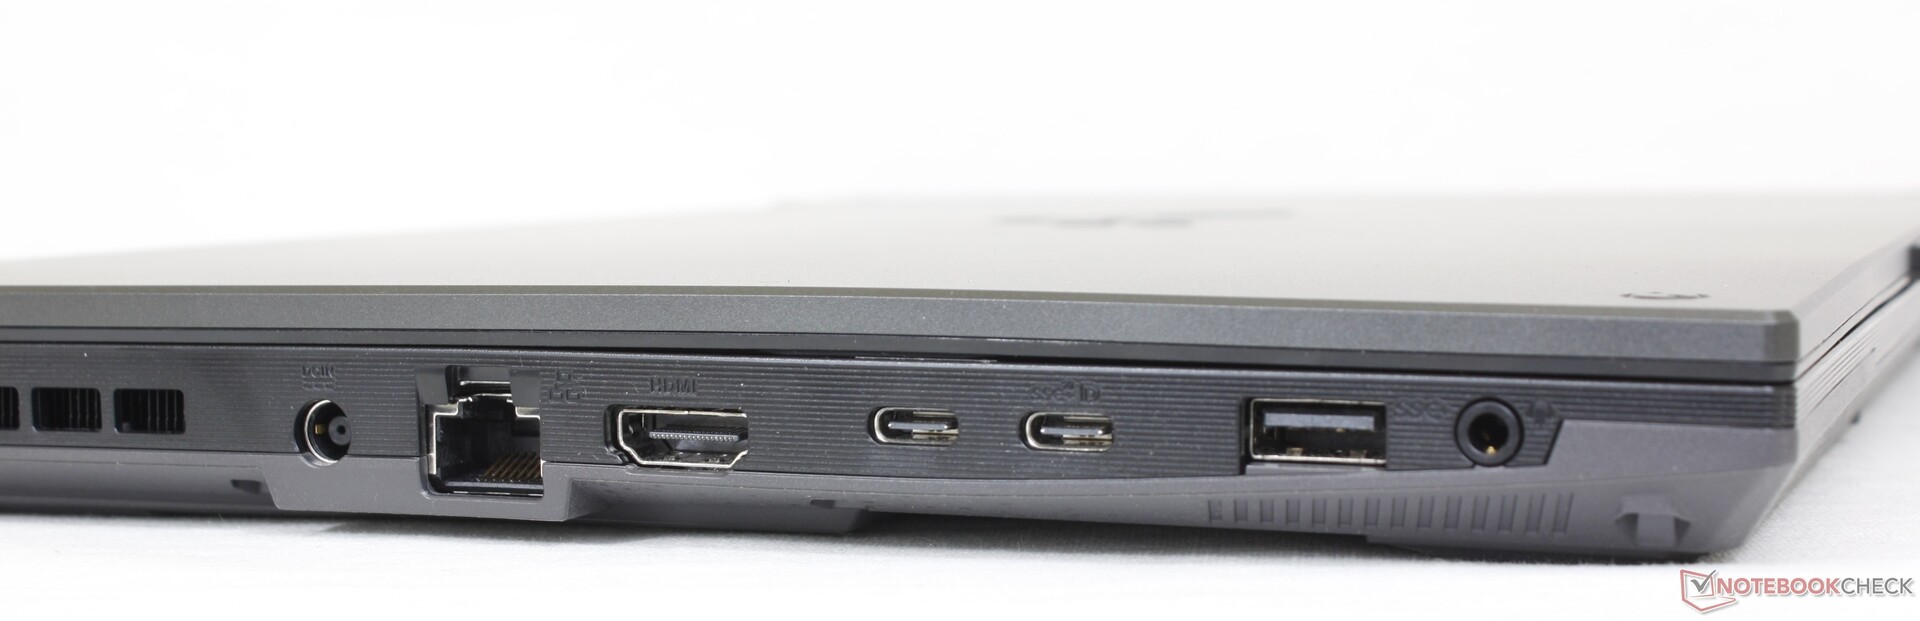
Bağlanabilirlik — Bir USB-C Bağlantı Noktası Daha
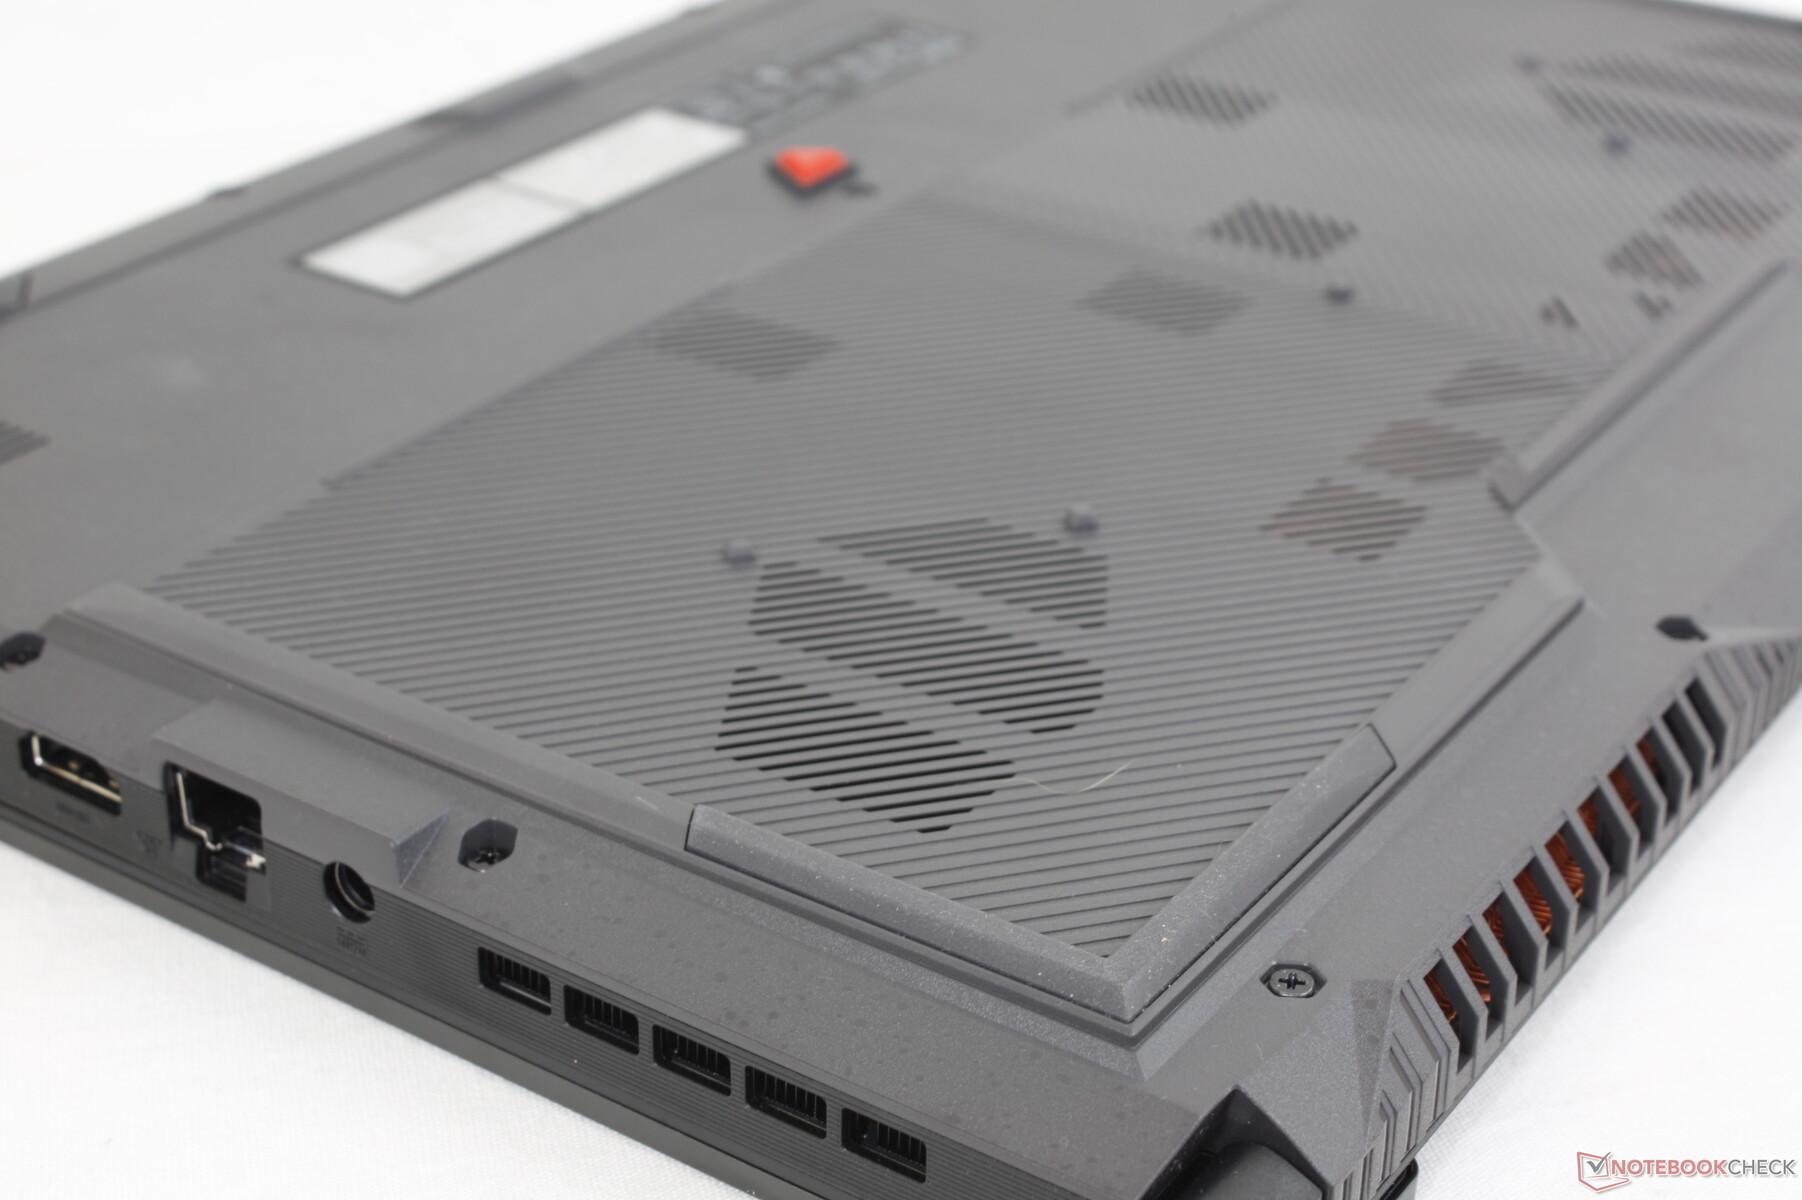
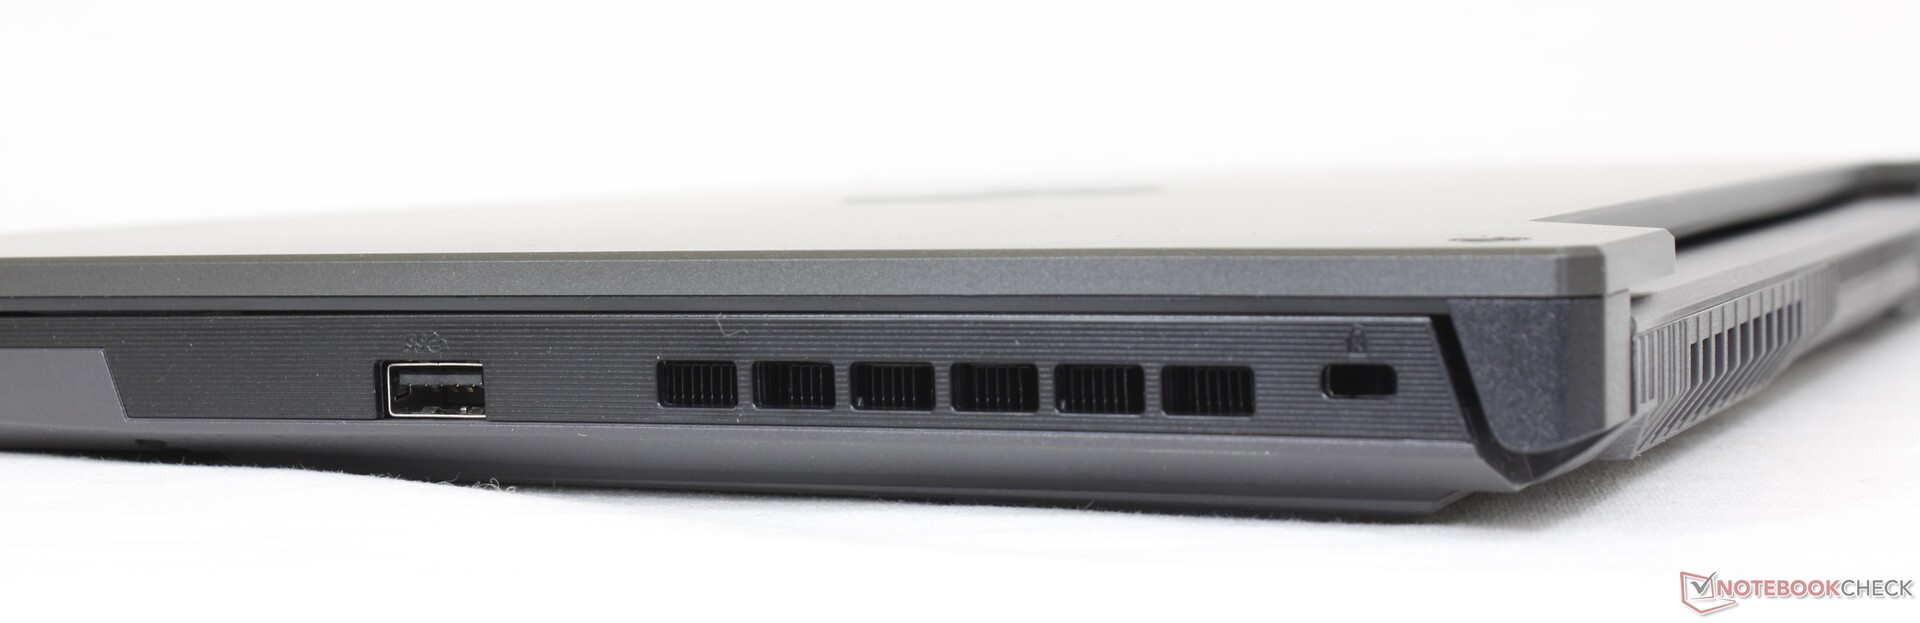
Bağlantı noktası seçenekleri FX506'dan biraz değişti. Daha spesifik olarak, FX507, ikinci bir USB-C bağlantı noktası için bir USB-A bağlantı noktası düşürdü. Diğer tüm bağlantı noktaları aksi takdirde aynıdır.
Herhangi bir Thunderbolt 4 cihazı bağlanırken dizüstü bilgisayarın MSHybrid modunda olması gerektiğini unutmayın. Bu, şimdiye kadar 12. nesil Alder Lake-H işlemcilerde çalışan tüm dizüstü bilgisayarlar için bir sınırlamadır.
İletişim
Kamera
720p web kamerasından kamera kalitesi düşük. Gizlilik kapağı veya Windows Hello desteği de yok.


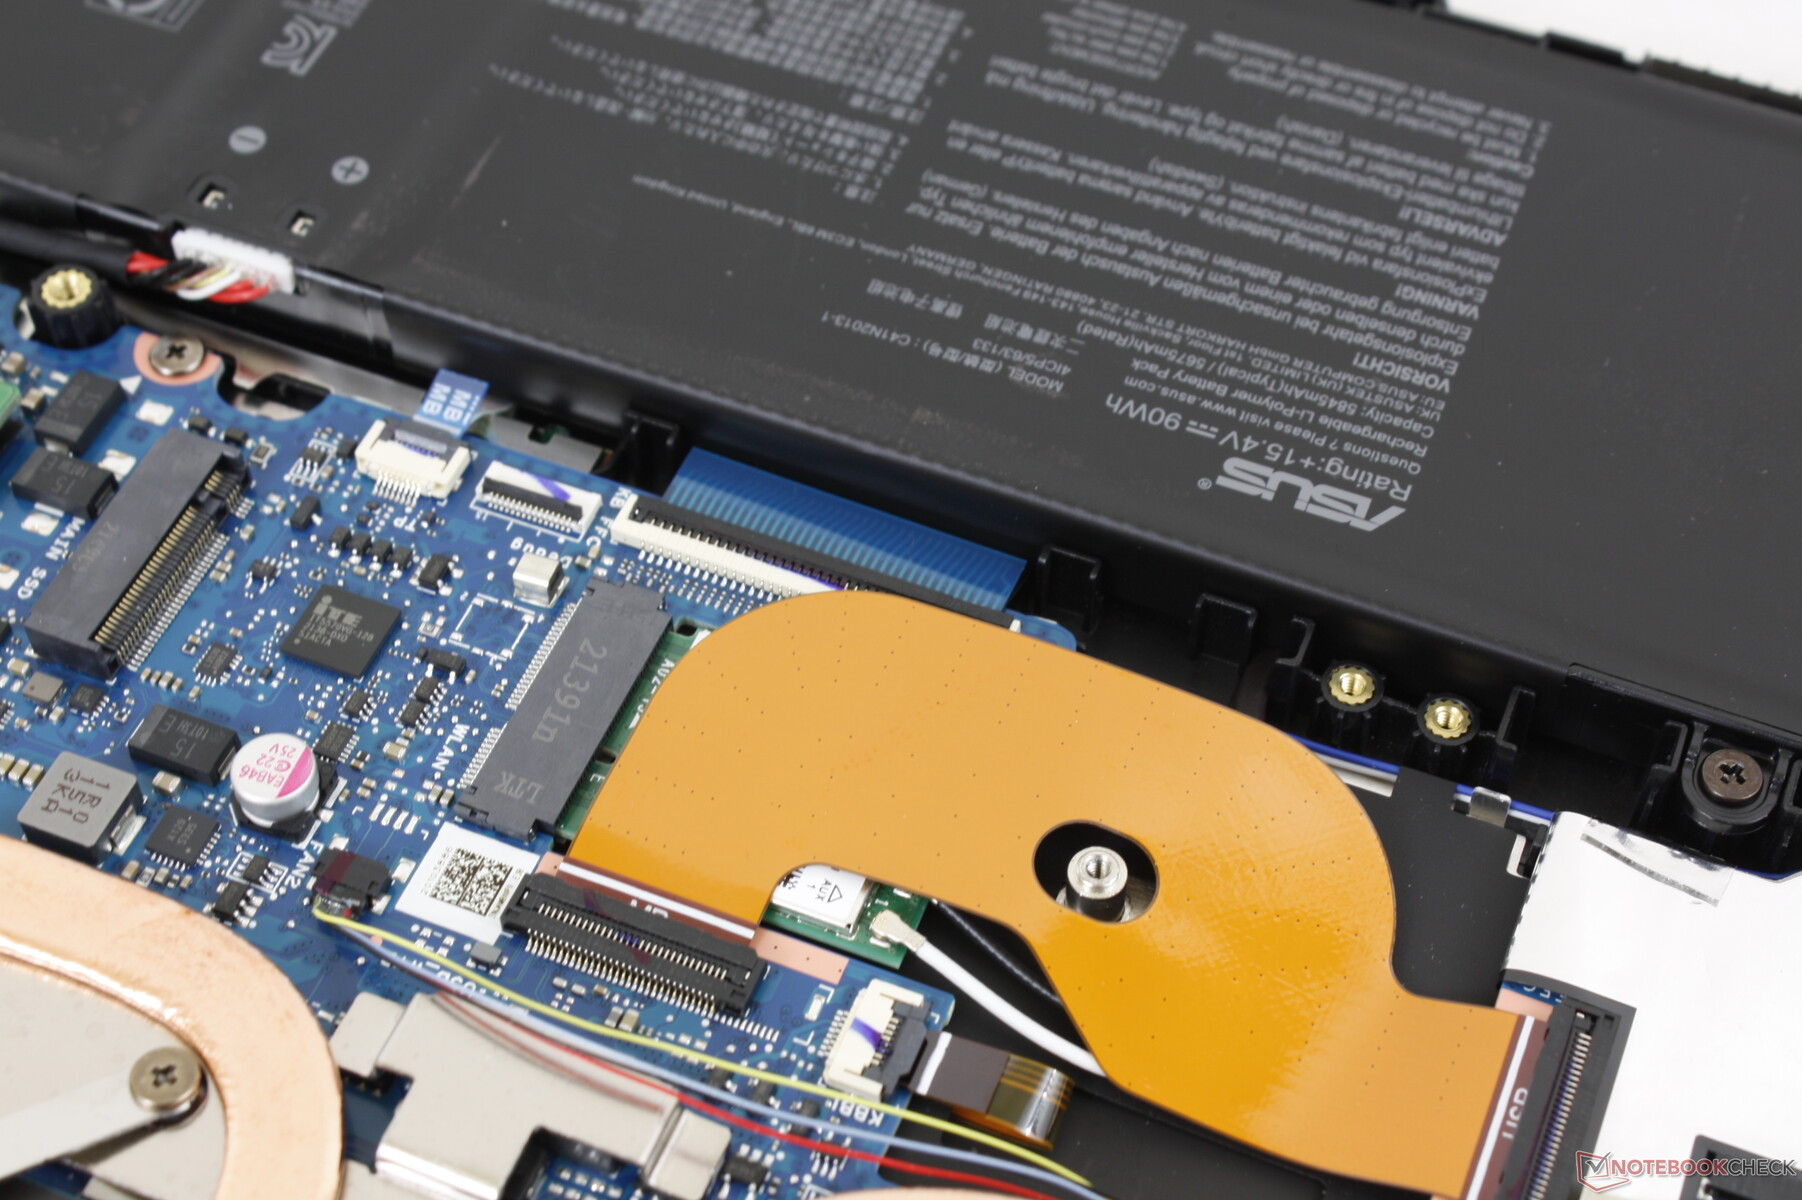
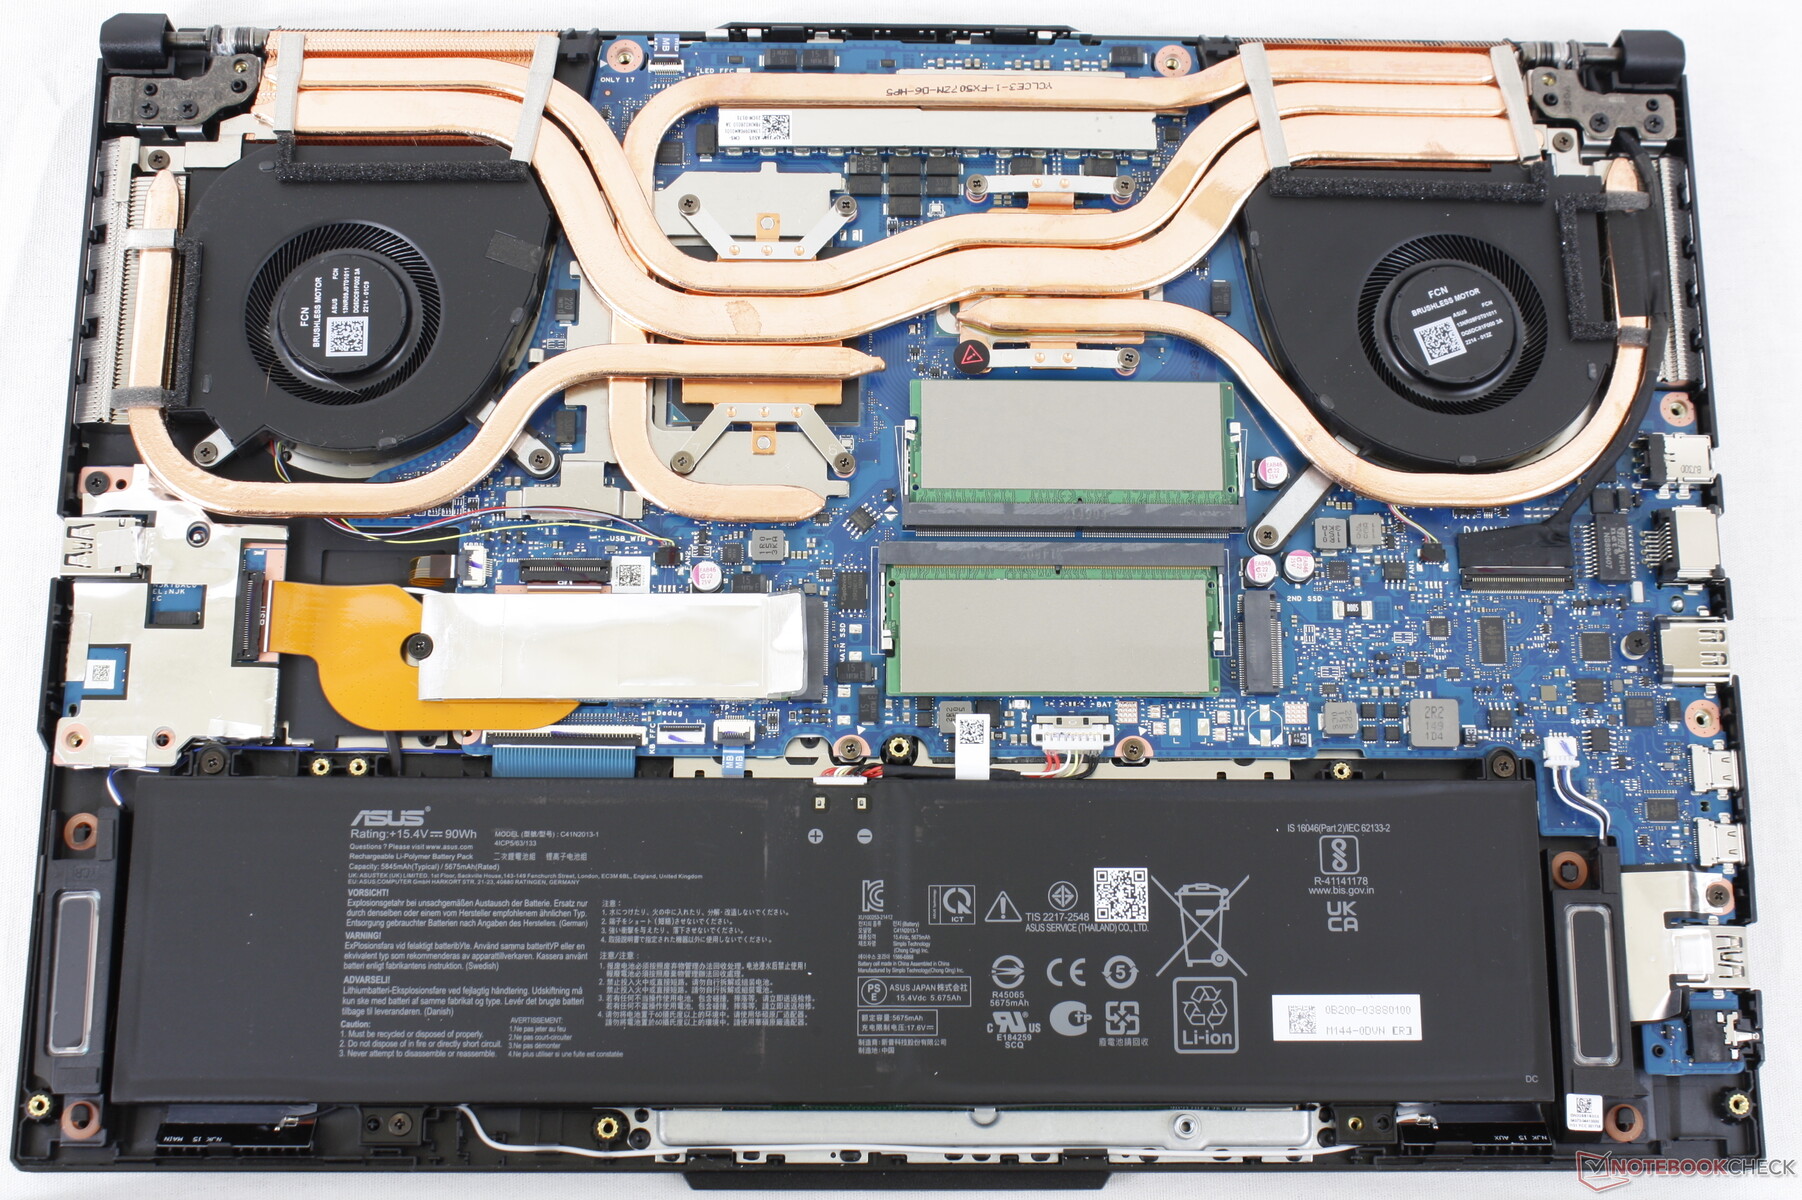
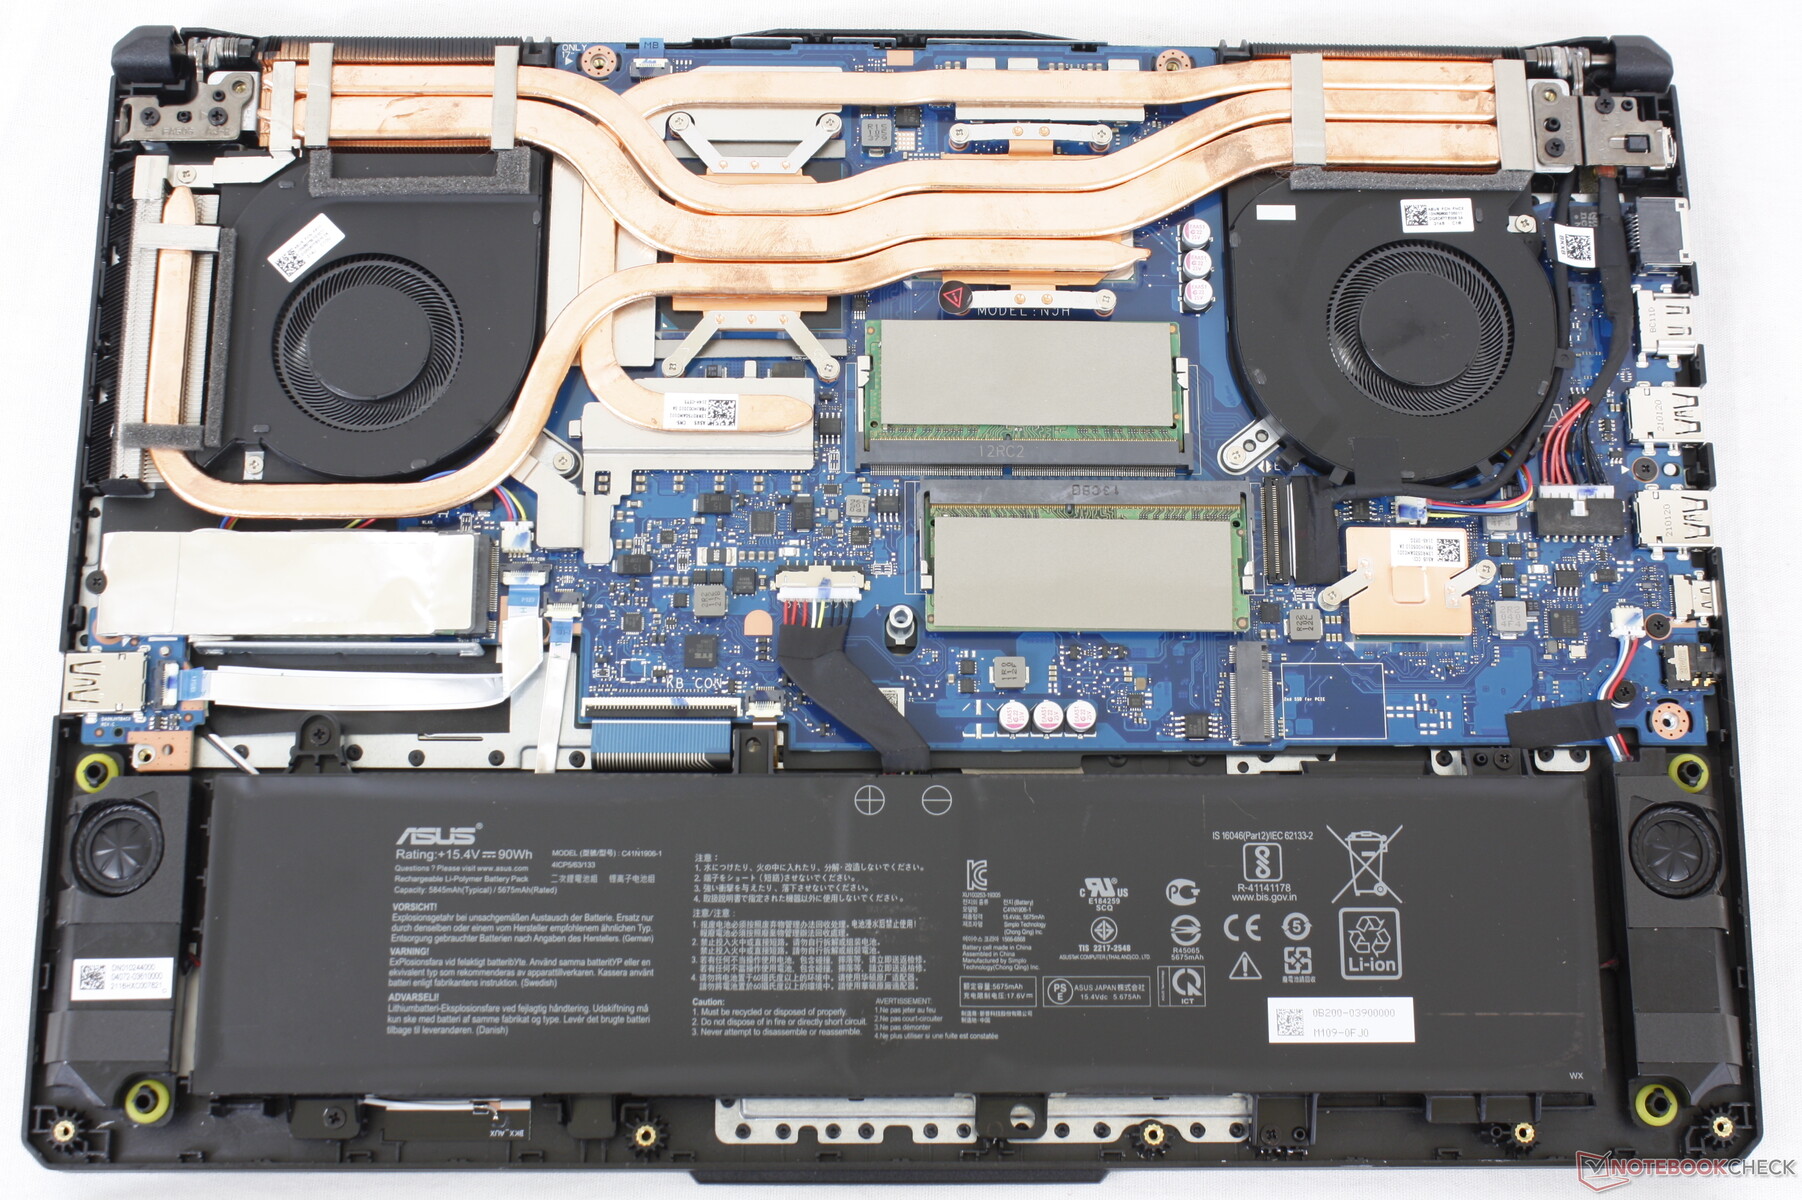
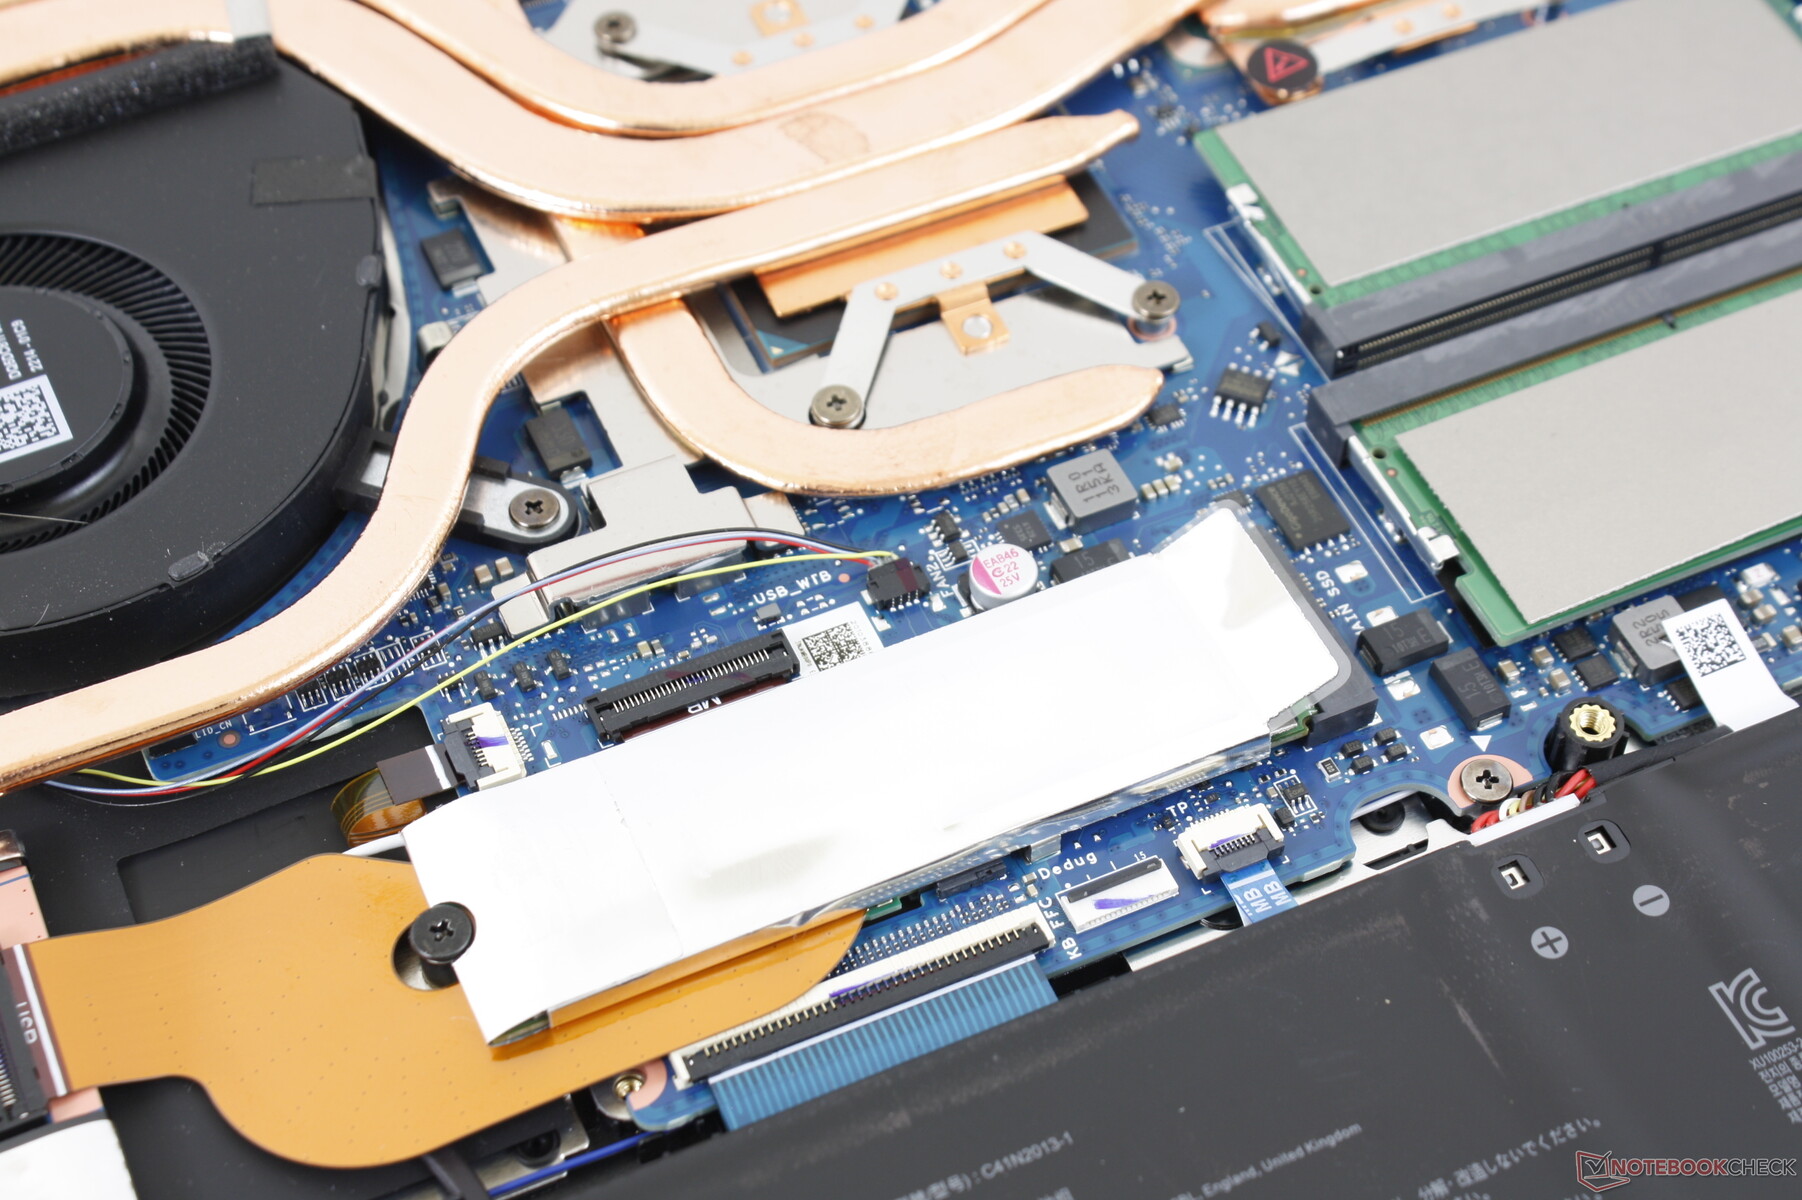
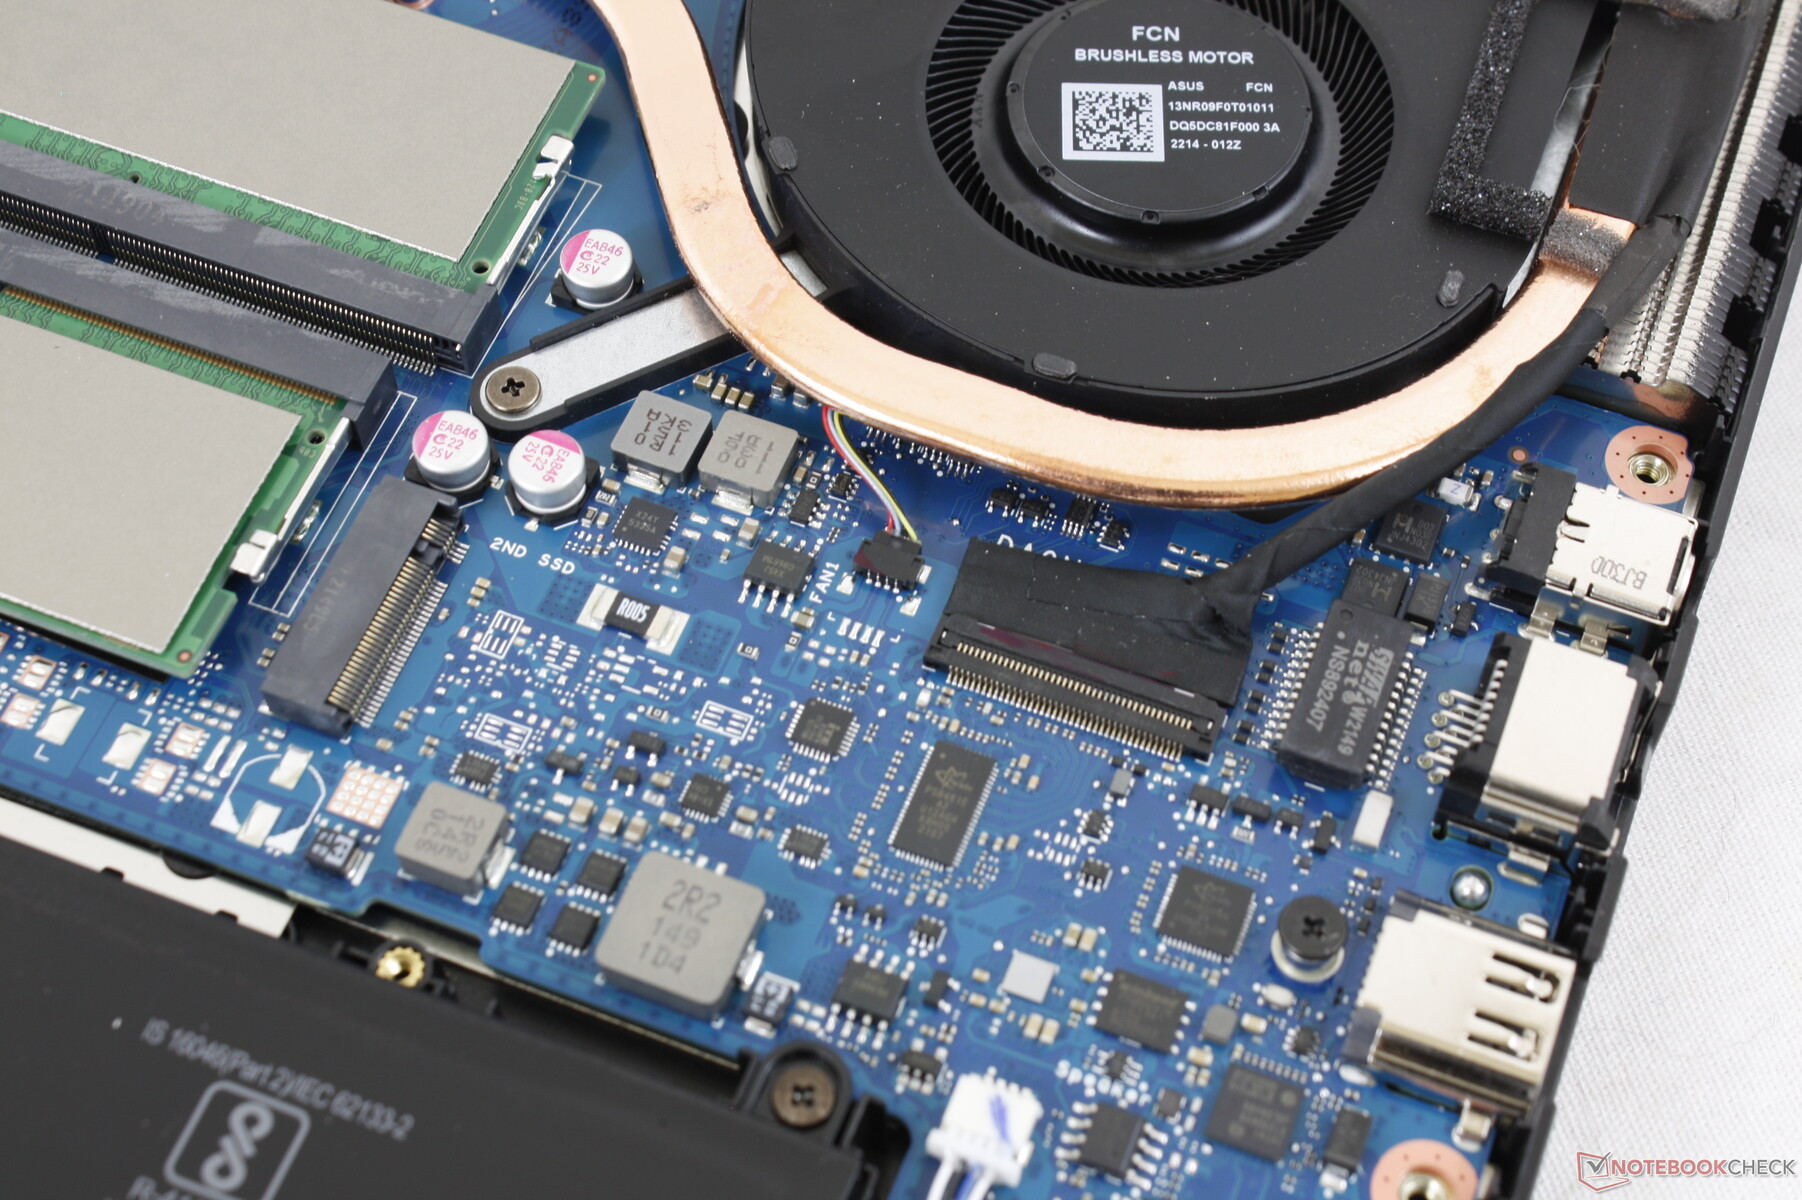
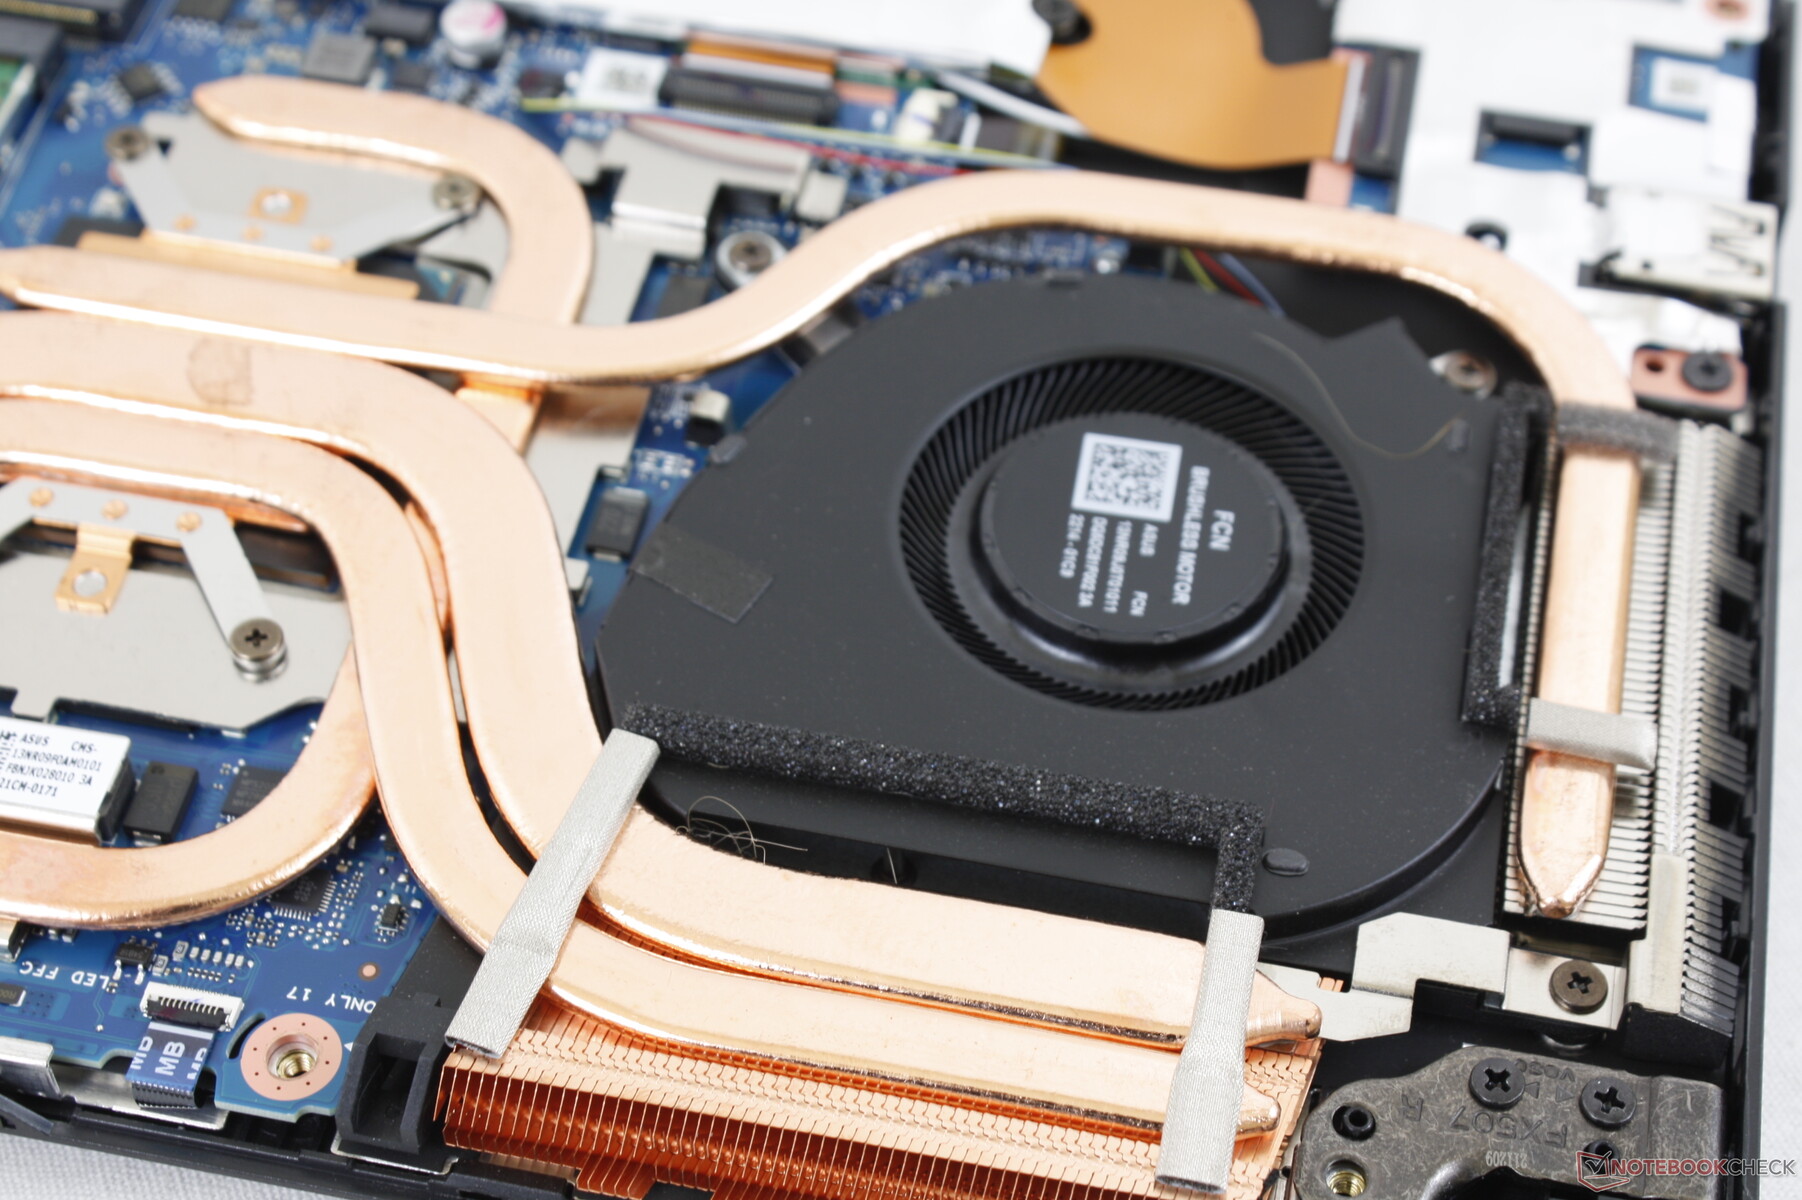
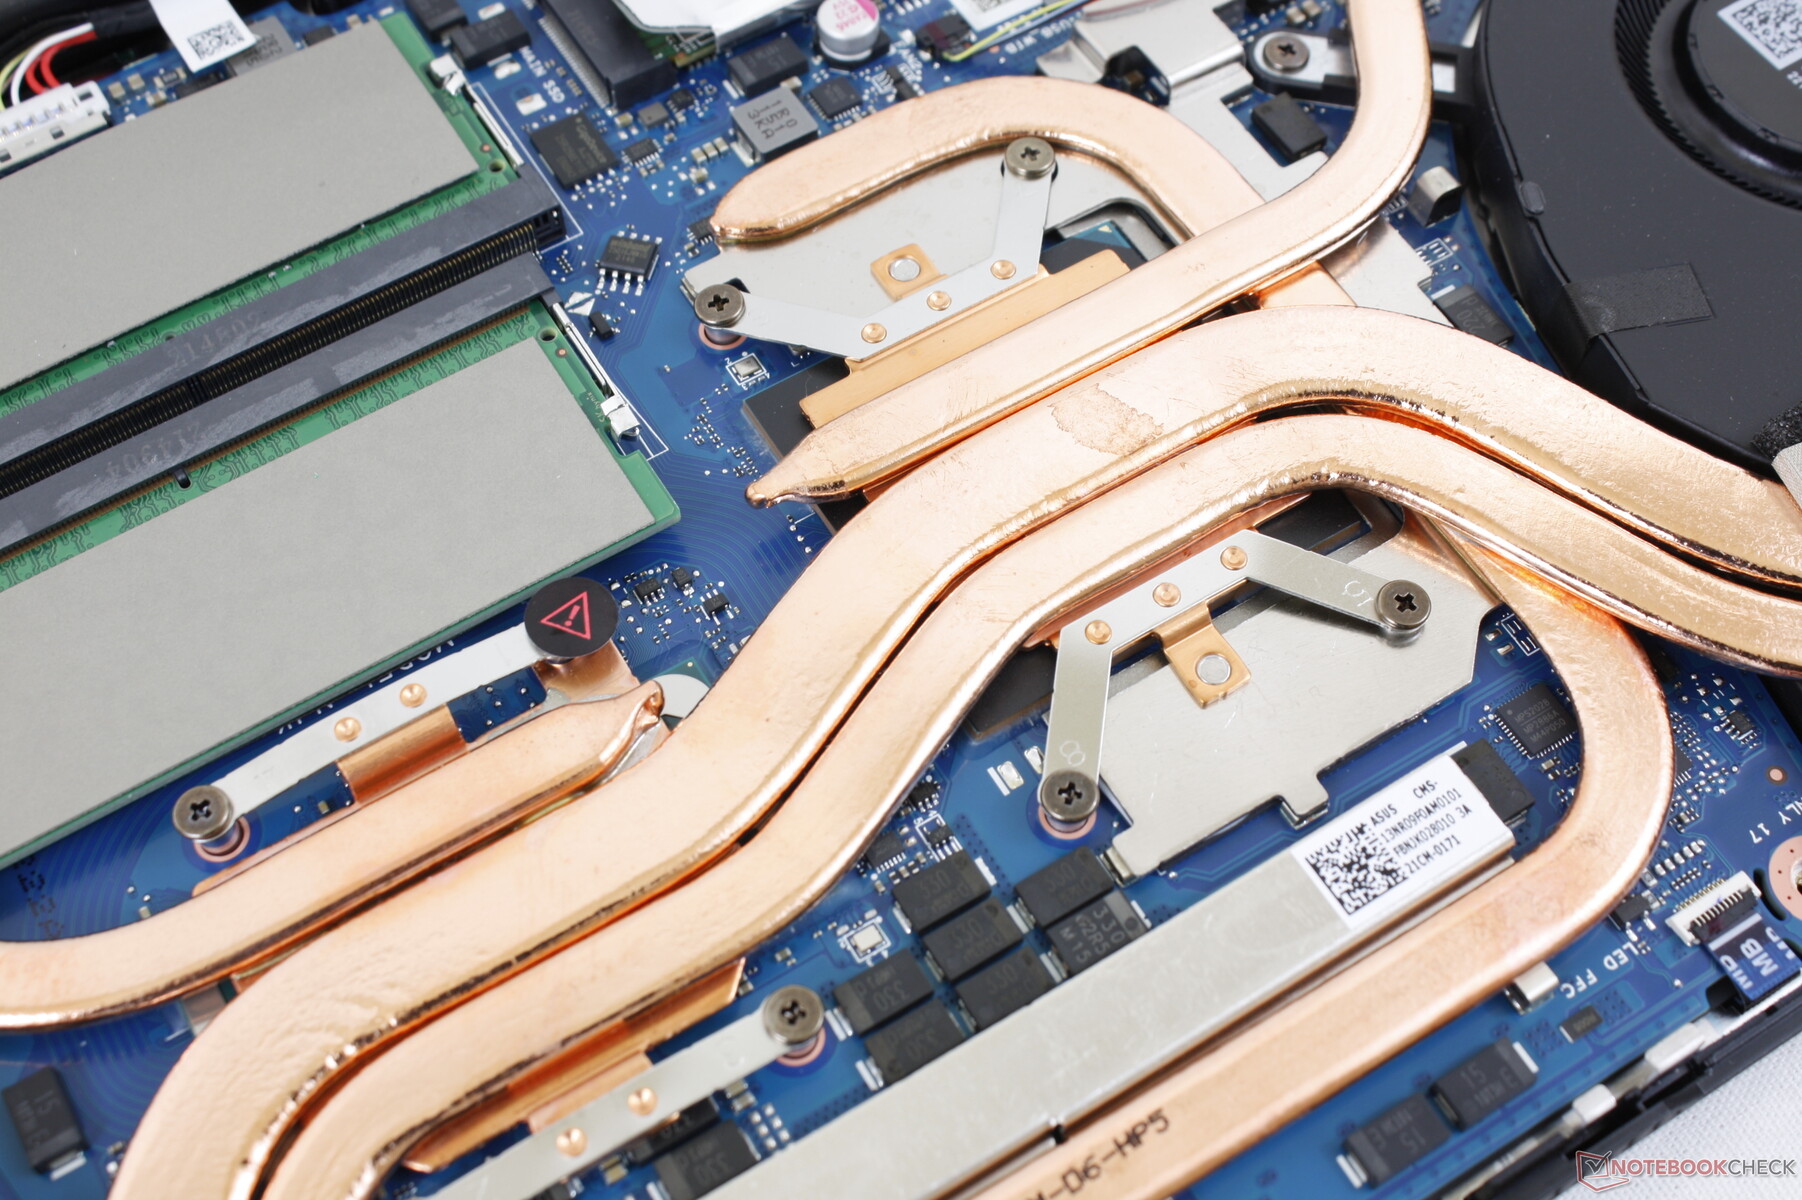
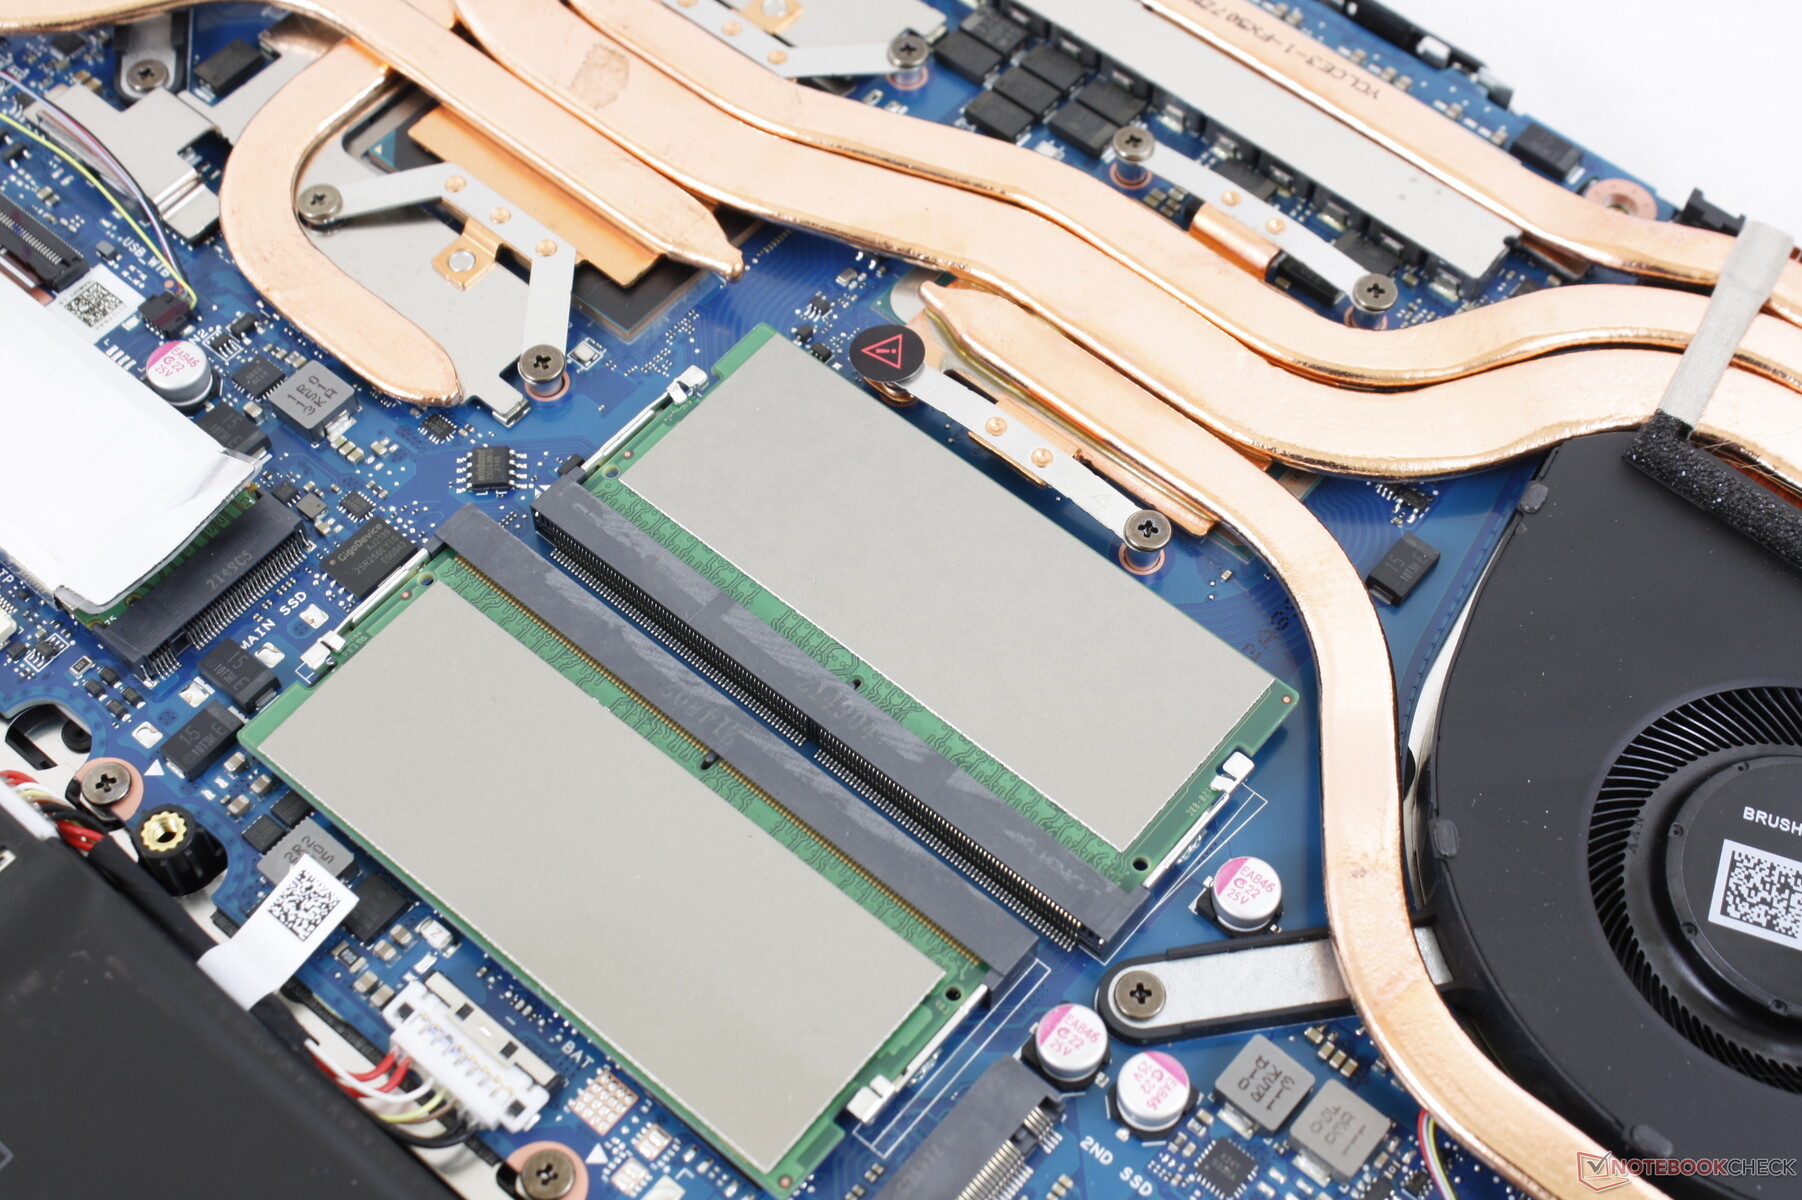
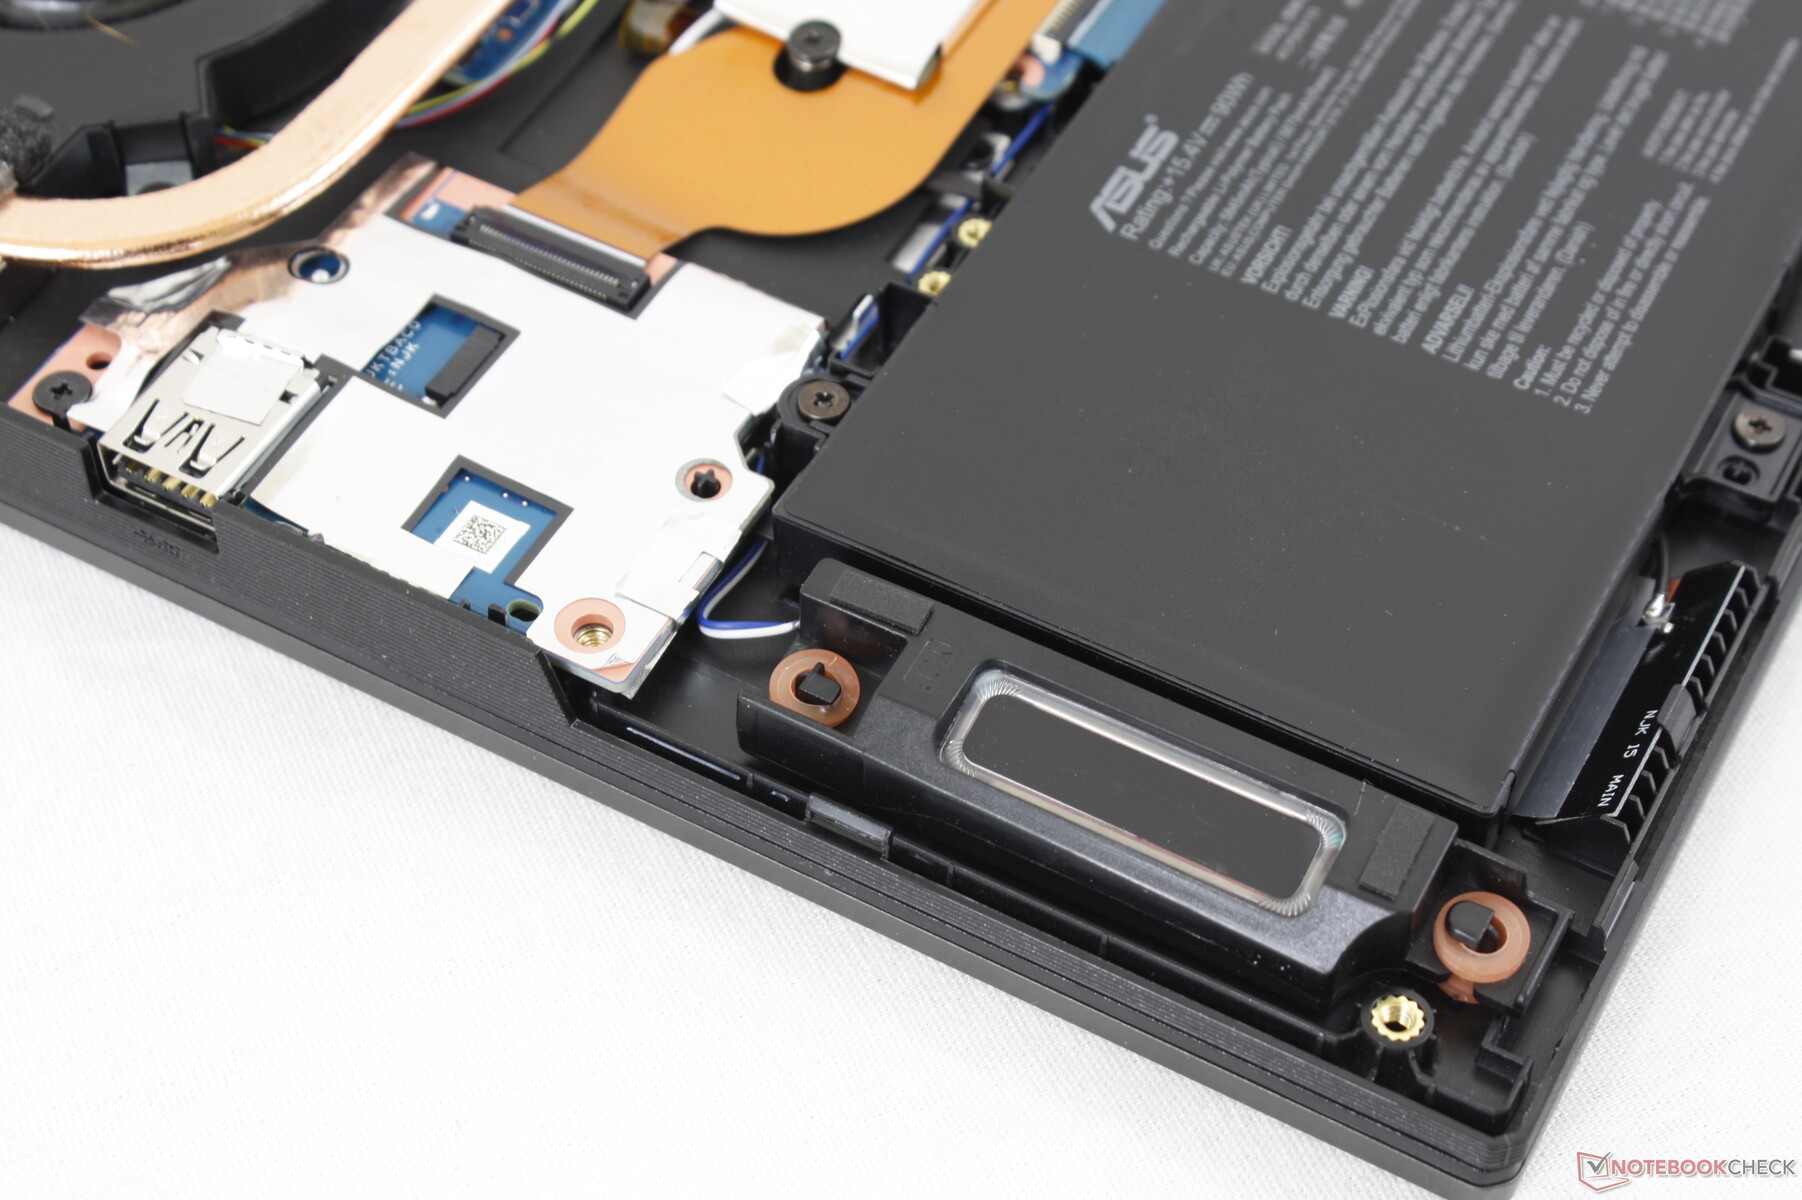
Bakım ve onarım
Alt panelin Philips tornavida ve düz kenar ile çıkarılması nispeten kolaydır. Aşağıdaki karşılaştırma resimlerinde gösterildiği gibi dahili parçalar yenilenmiştir, ancak 2x SODIMM yuvaları, 2x M.2 SSD yuvaları ve çıkarılabilir WLAN modülü kalmıştır.
Aksesuarlar ve Garanti
Kutuda, normal AC adaptörü ve evrak işleri dışında hiçbir ekstra yoktur. Tipik bir yıllık üretici garantisi geçerlidir.
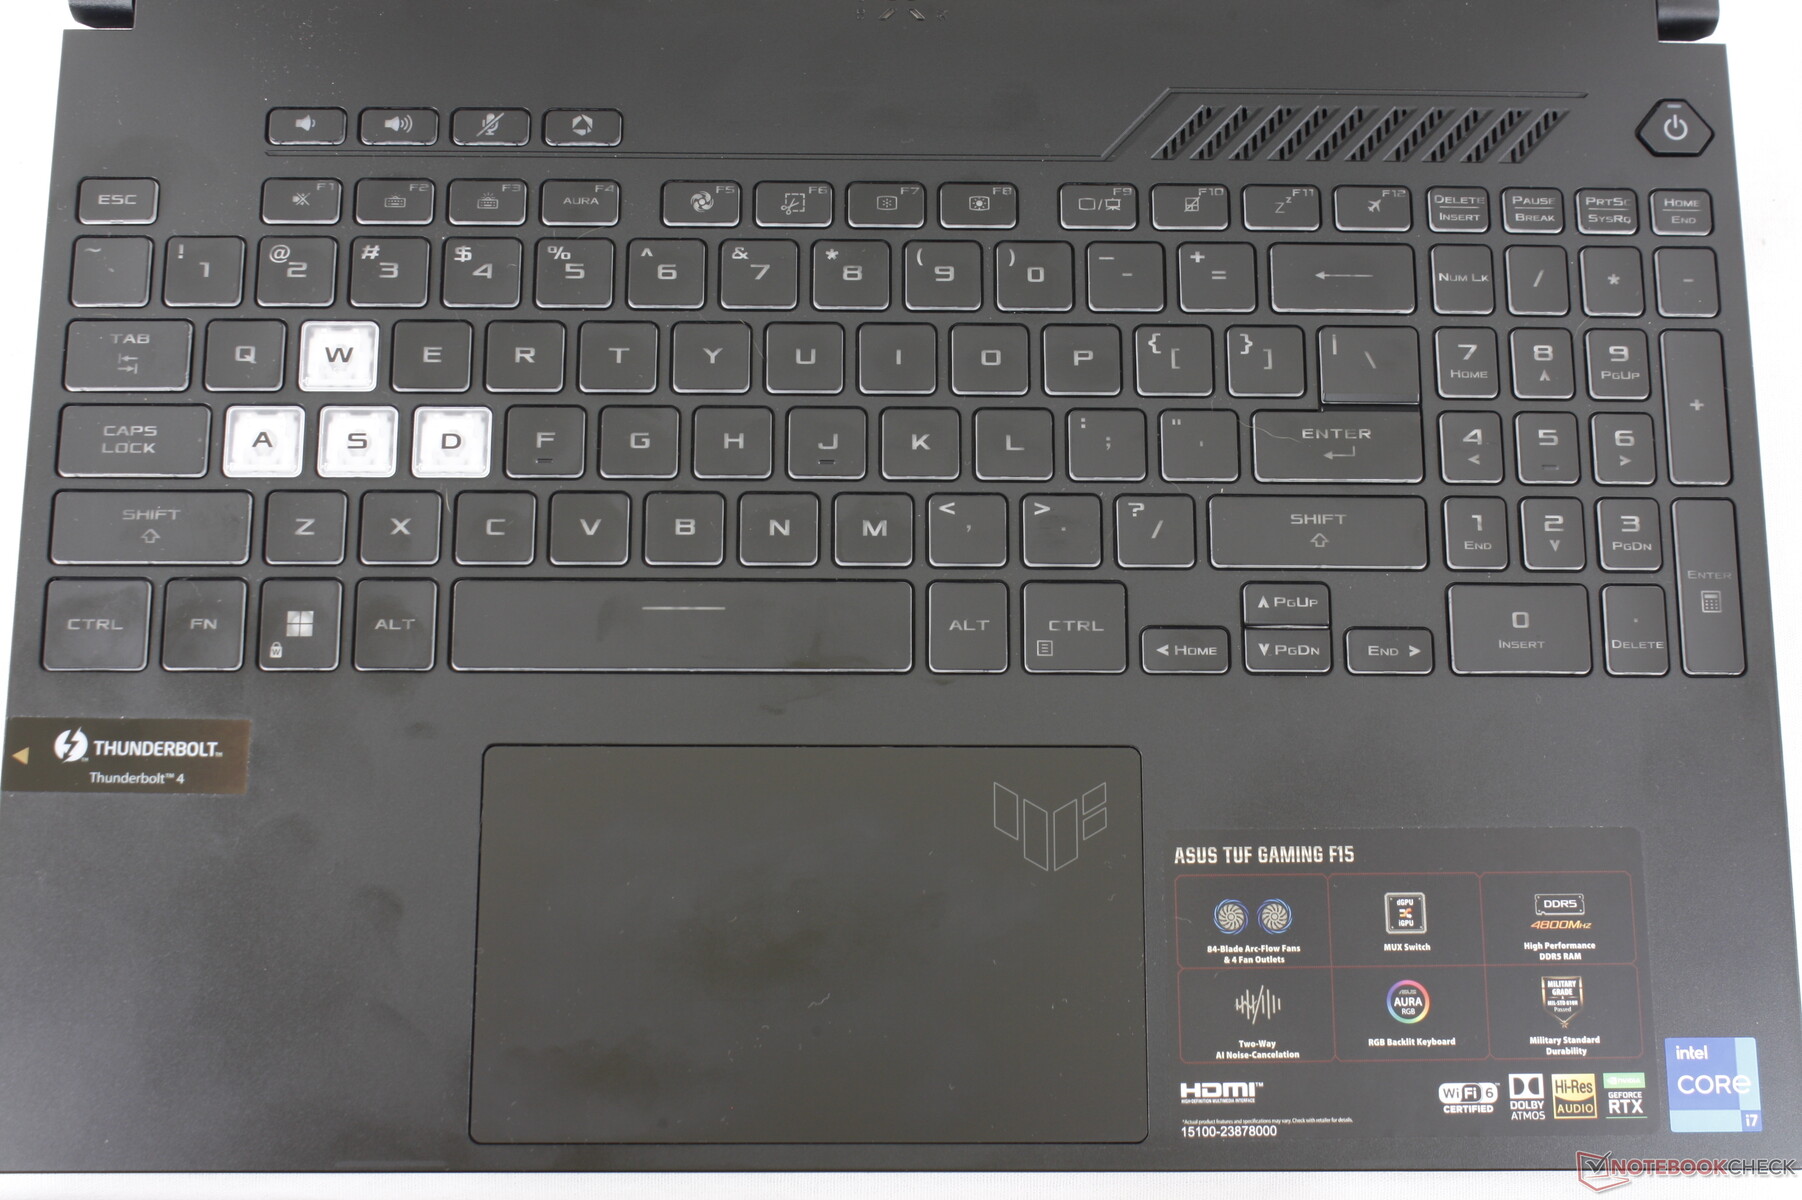
Giriş Birimleri — Farklı Ama Mutlaka Daha İyi Değil
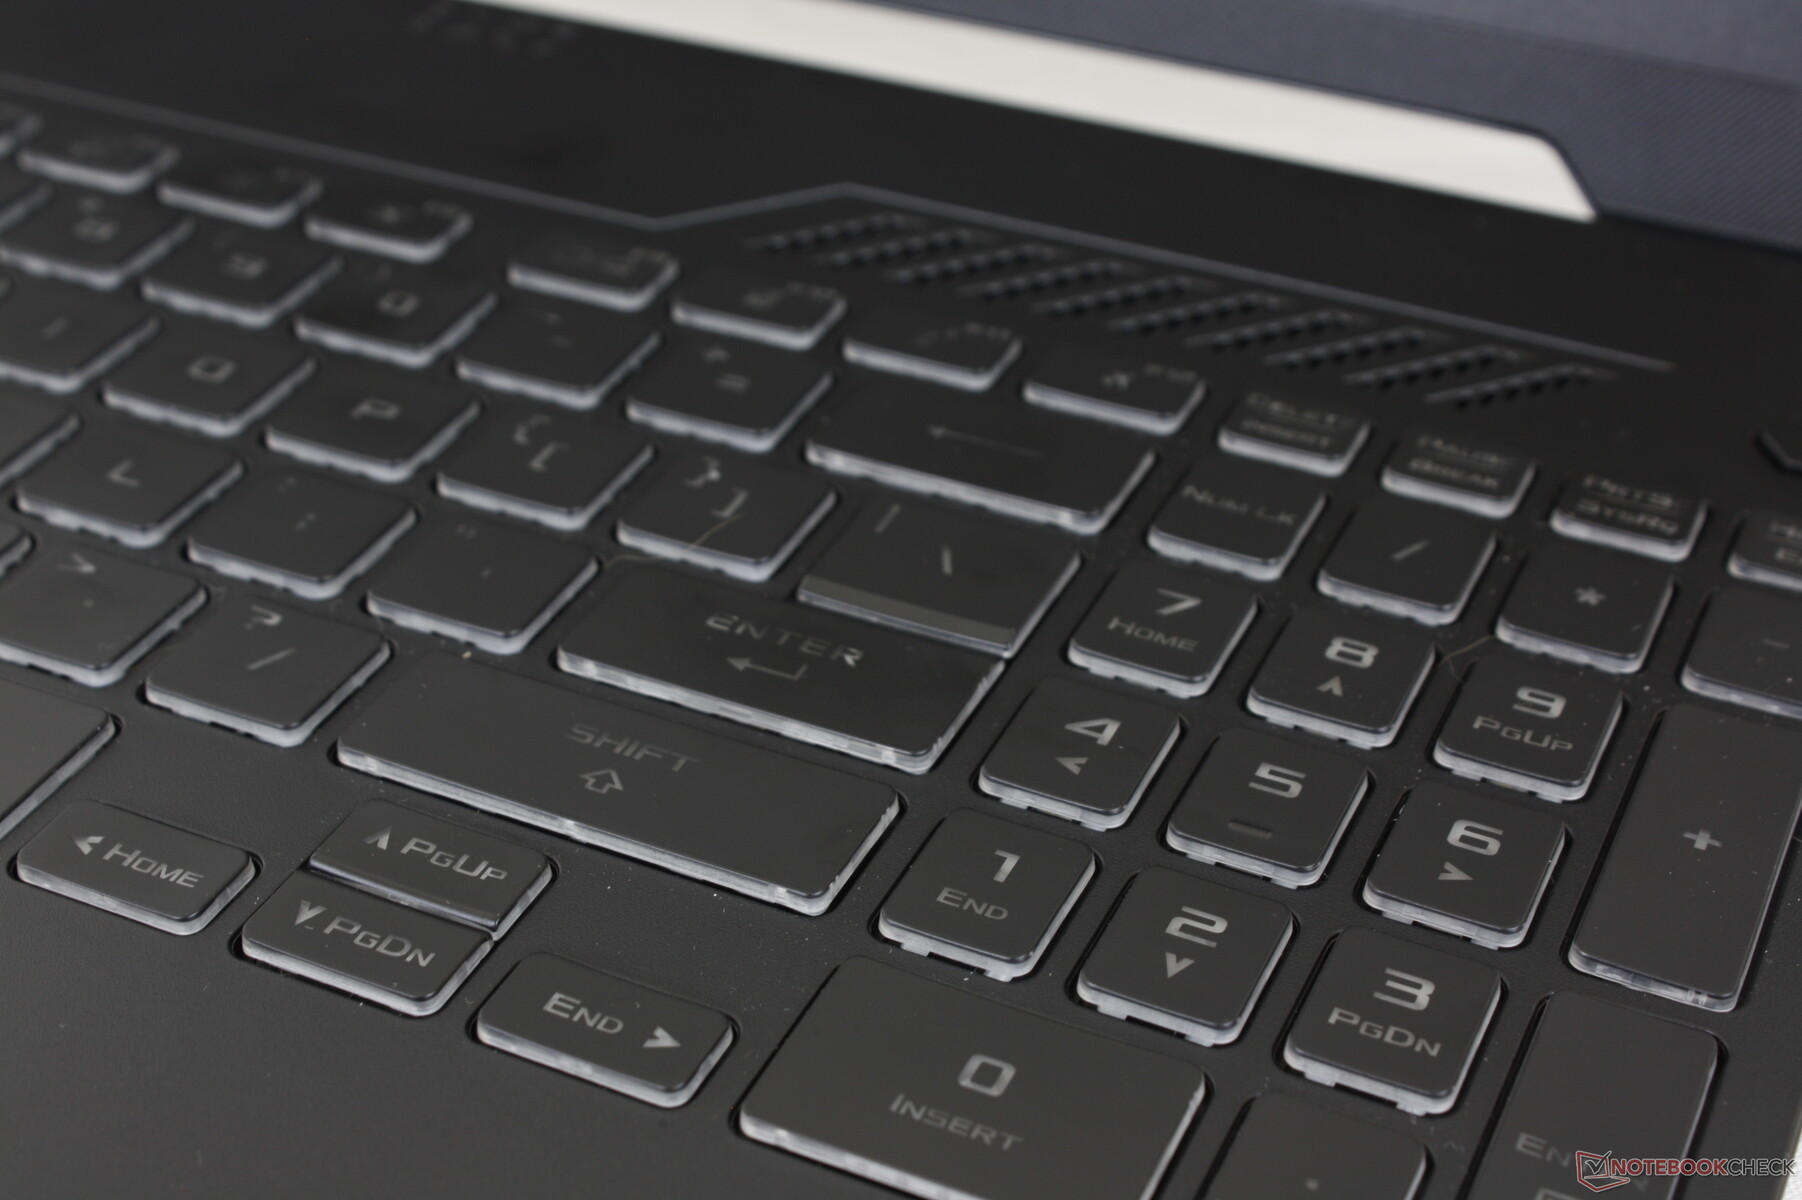
Klavye
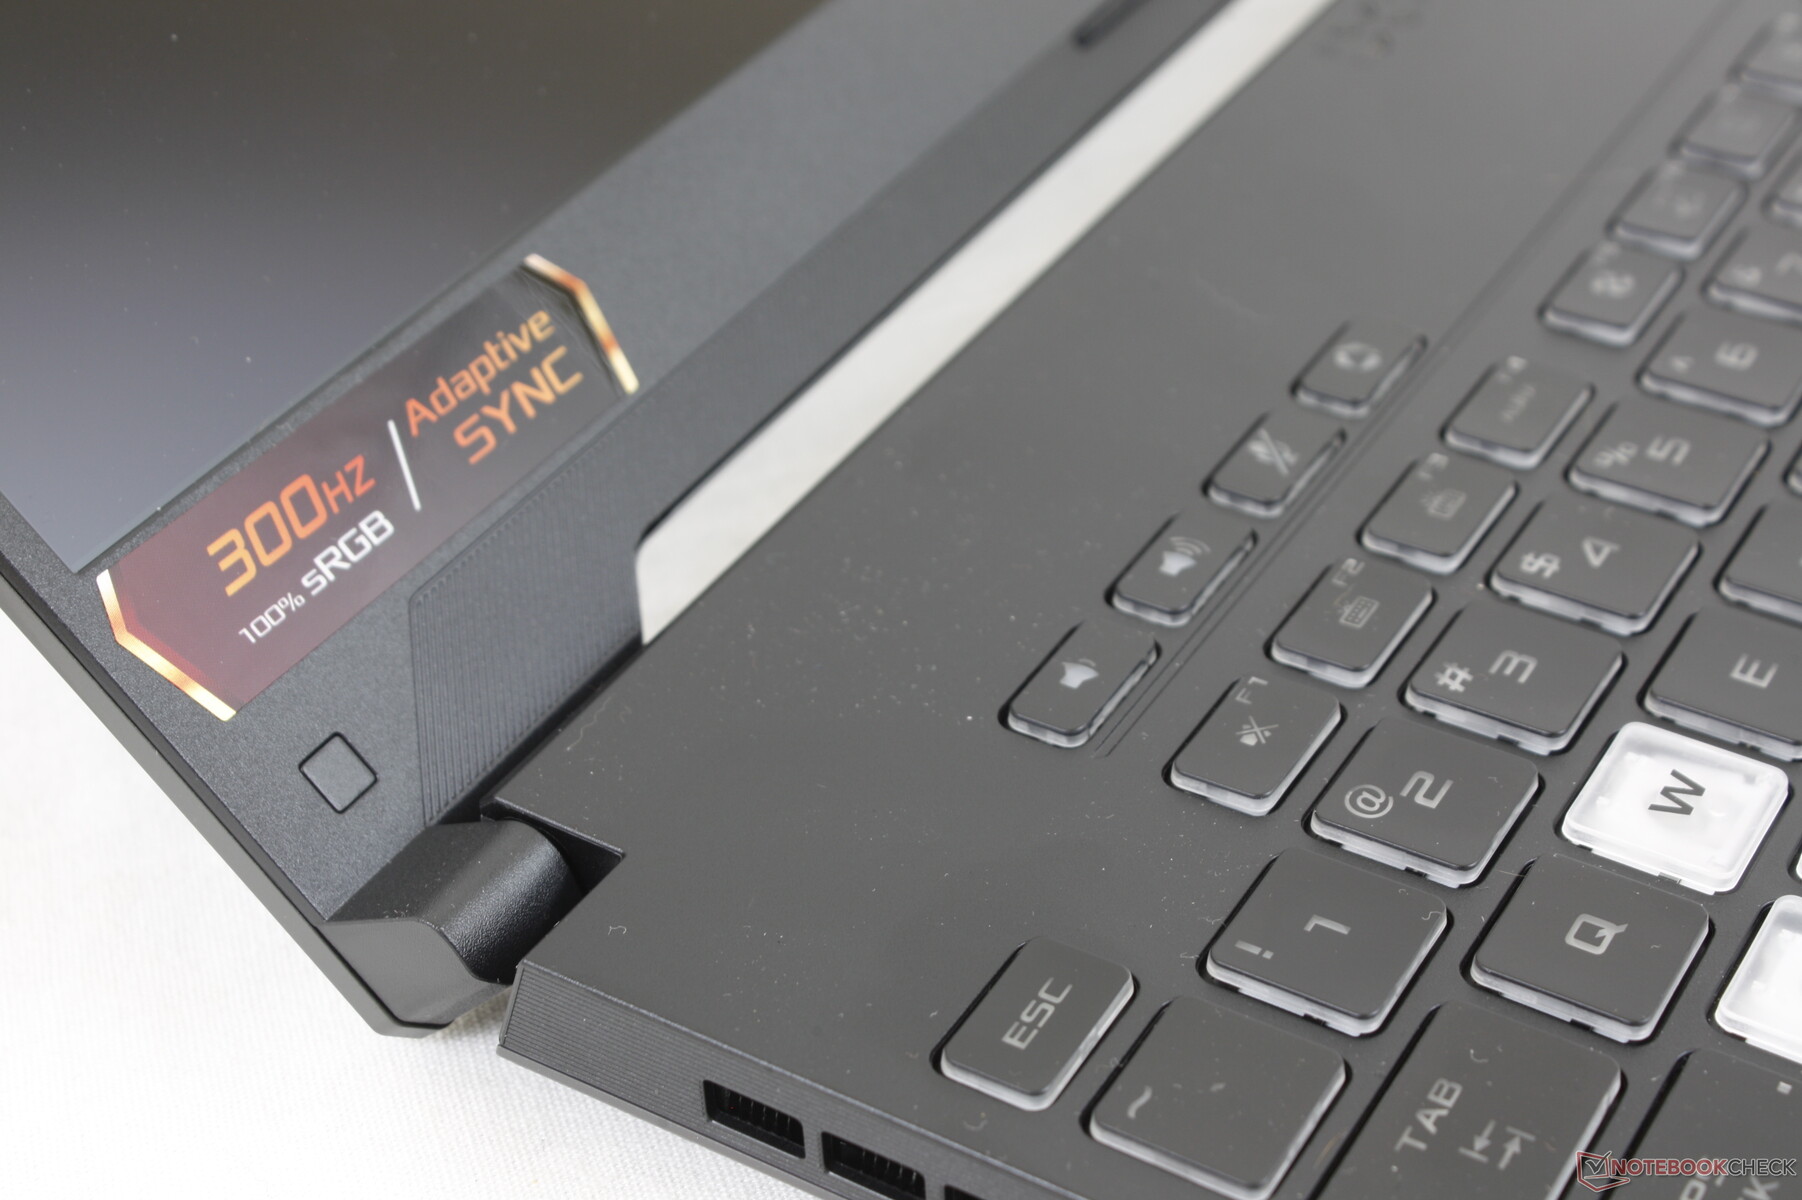
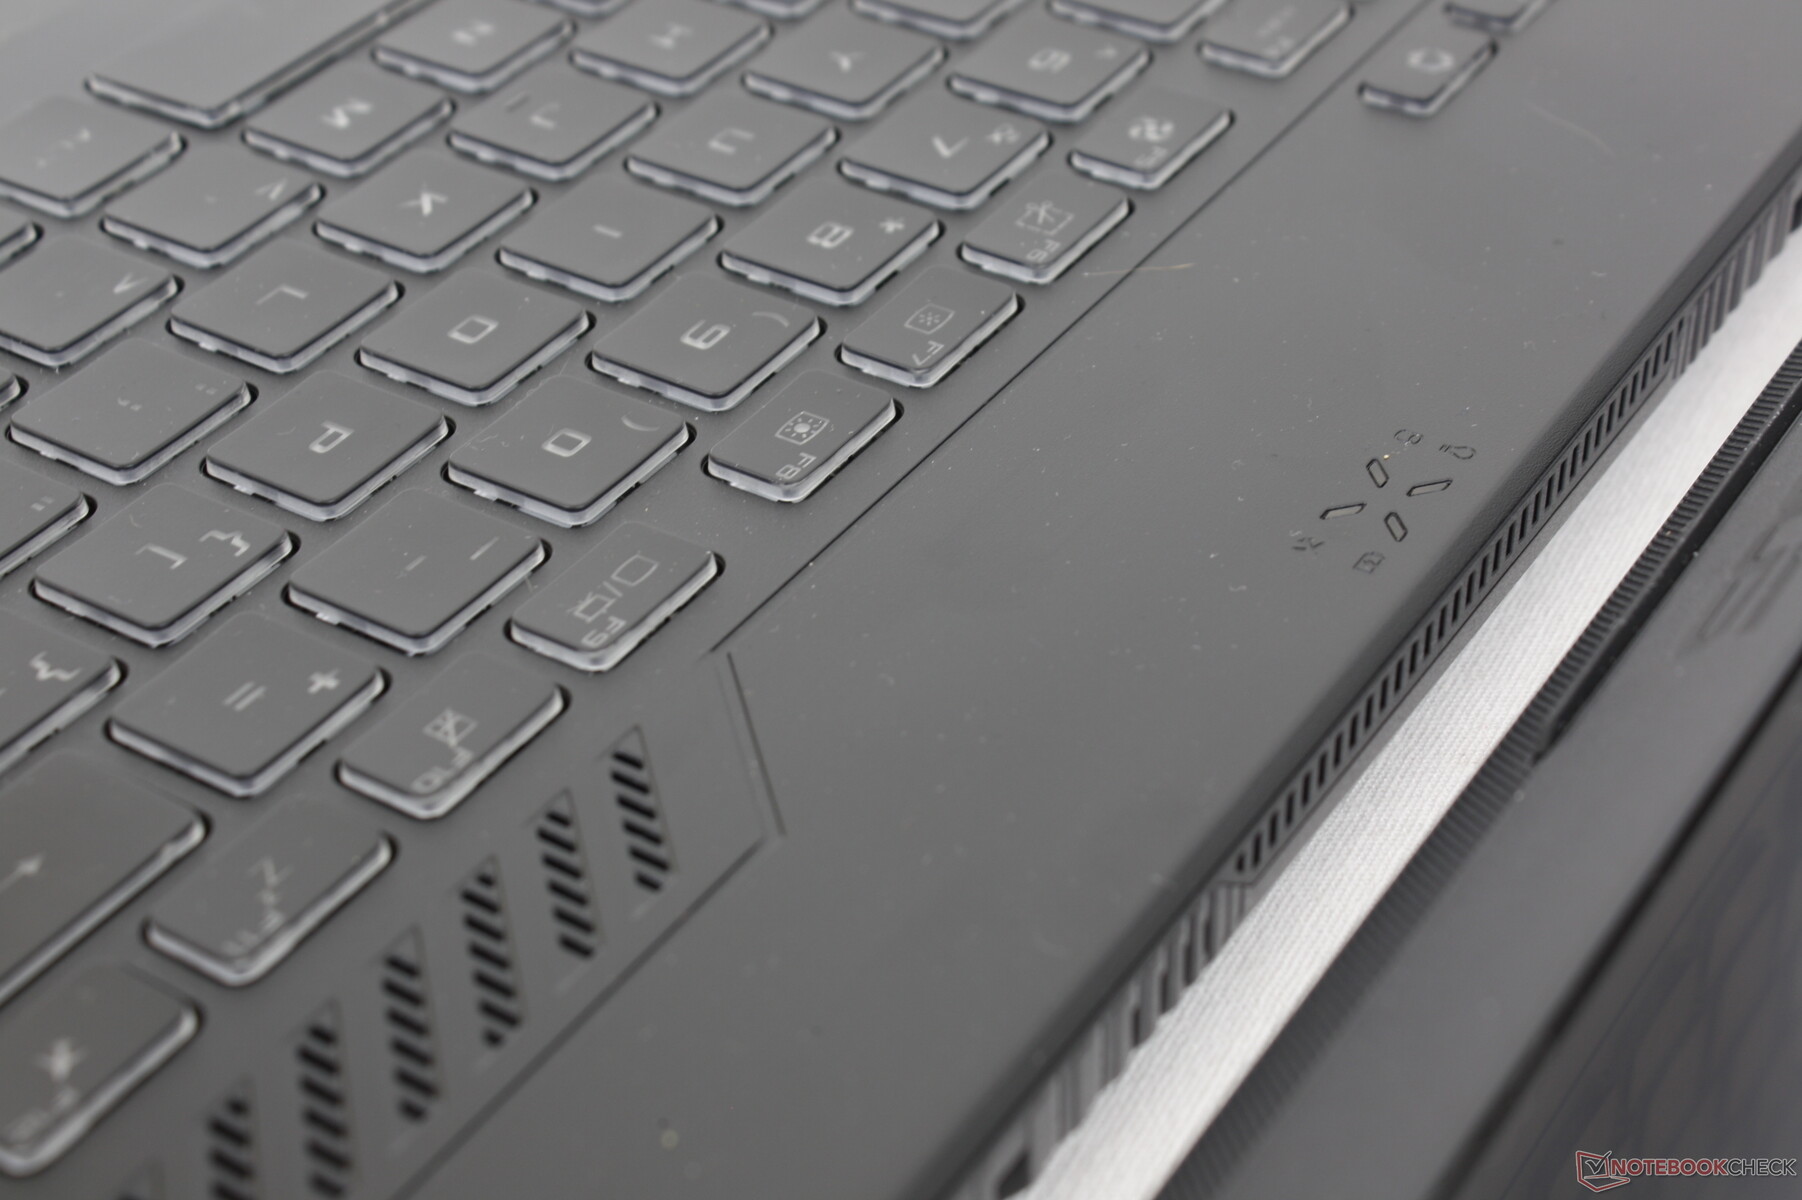
Asus, klavye düzenini FX506'ya kıyasla revize etti. Yardımcı tuşların bazıları artık sol üst köşede kendi sıralarındayken, ok tuşlarının uzunluğu biraz daha uzun. Her tuşun üzerindeki yazı tipi de daha koyu ve daha gri, bu da ne yazık ki okumayı zorlaştırıyor.
Hem temel geri bildirim hem de tek bölgeli RGB arka ışığı yıldan yıla aynı kalır. Çoğu Zephyrus S modelinde klavyelere çok yakınken, Eurocom RX315'teki tuşlara kıyasla daha hafif ve daha yumuşak olan tuşları buluyoruz.
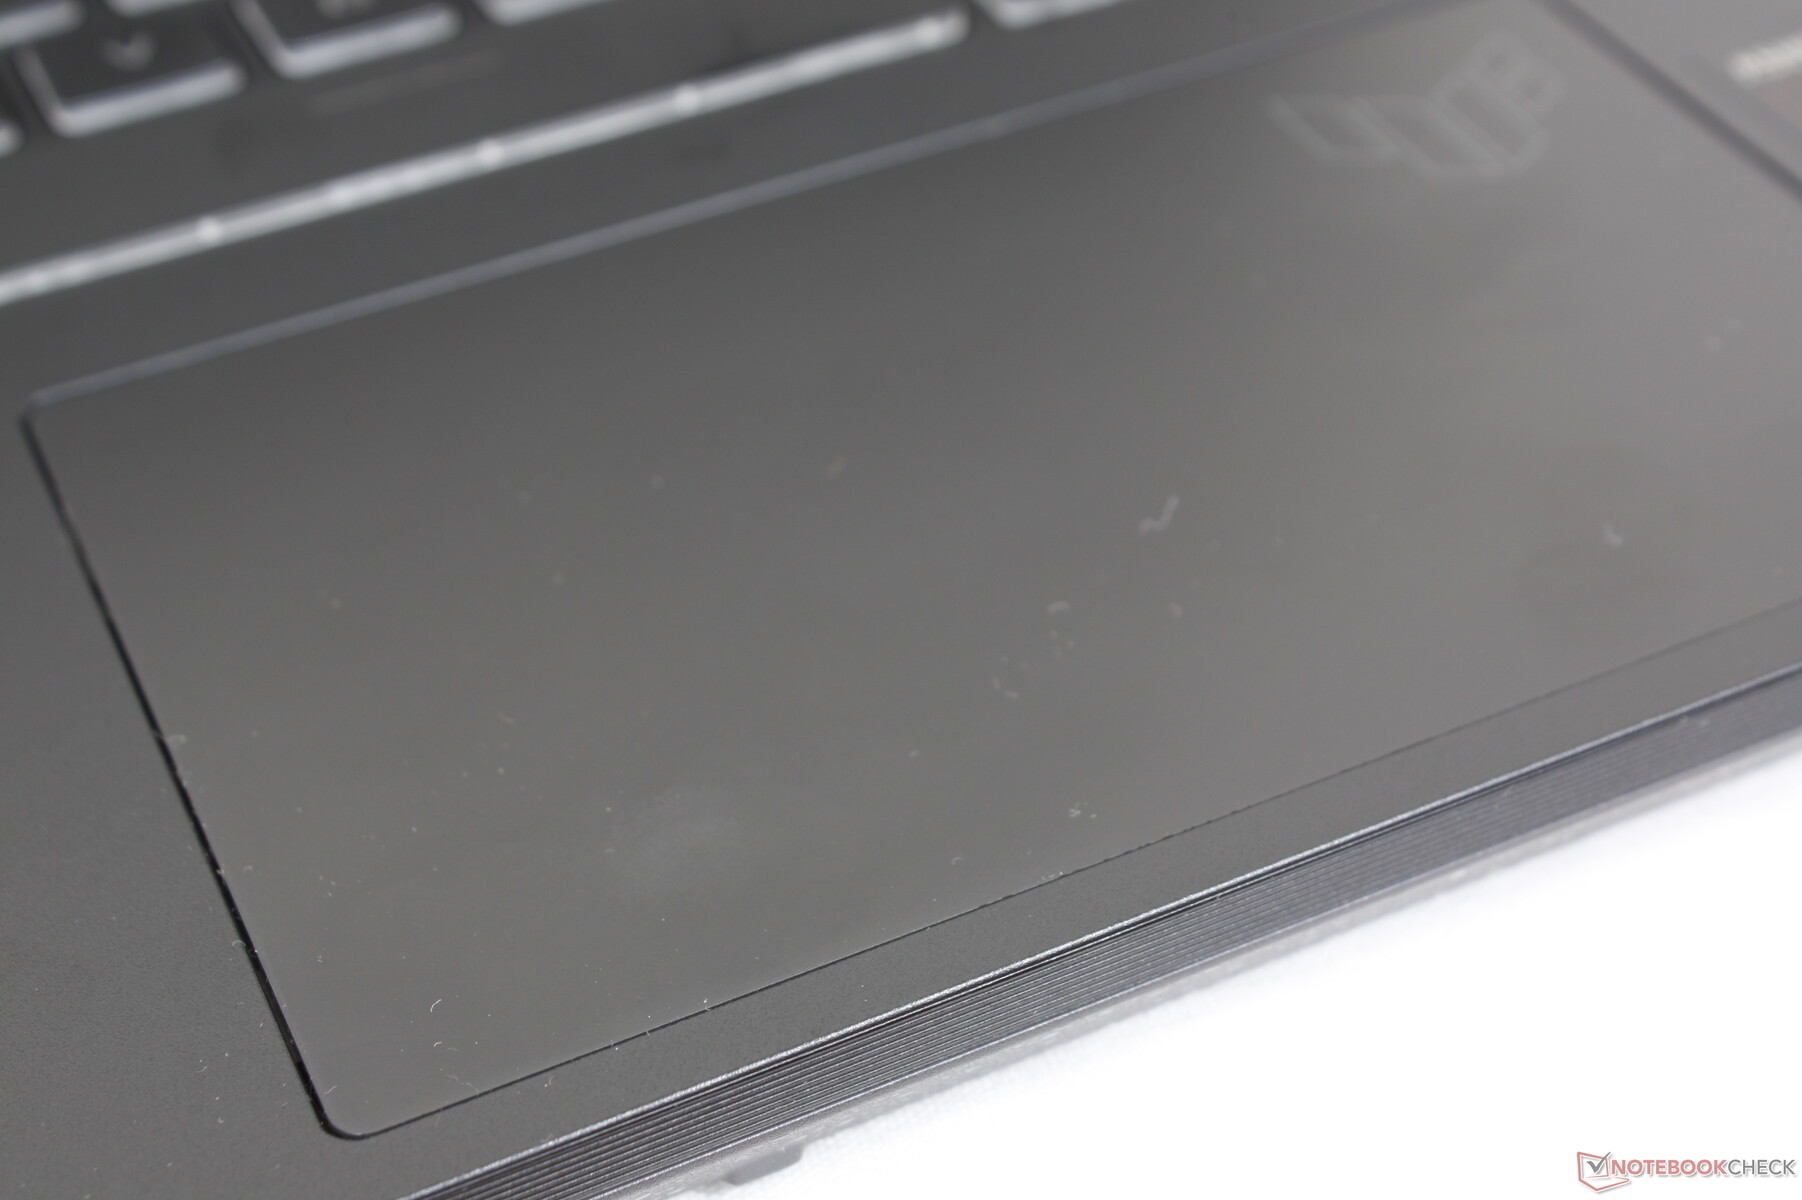
Dokunmatik yüzey
FX507, daha büyük bir tıklama yüzeyi alanı (13 x 7,8 cm'ye karşı 10,6 x 8,0 cm) için FX506'daki özel fare düğmelerini bıraktı. Kayma, çok az yapışma ile tüm hızlarda pürüzsüzdür, ancak tıklamalar girilirken geri bildirim zayıf ve biraz süngerimsidir. Sürükle ve sürükle eylemleri bu nedenle eski FX506'daki kadar rahat değildir.

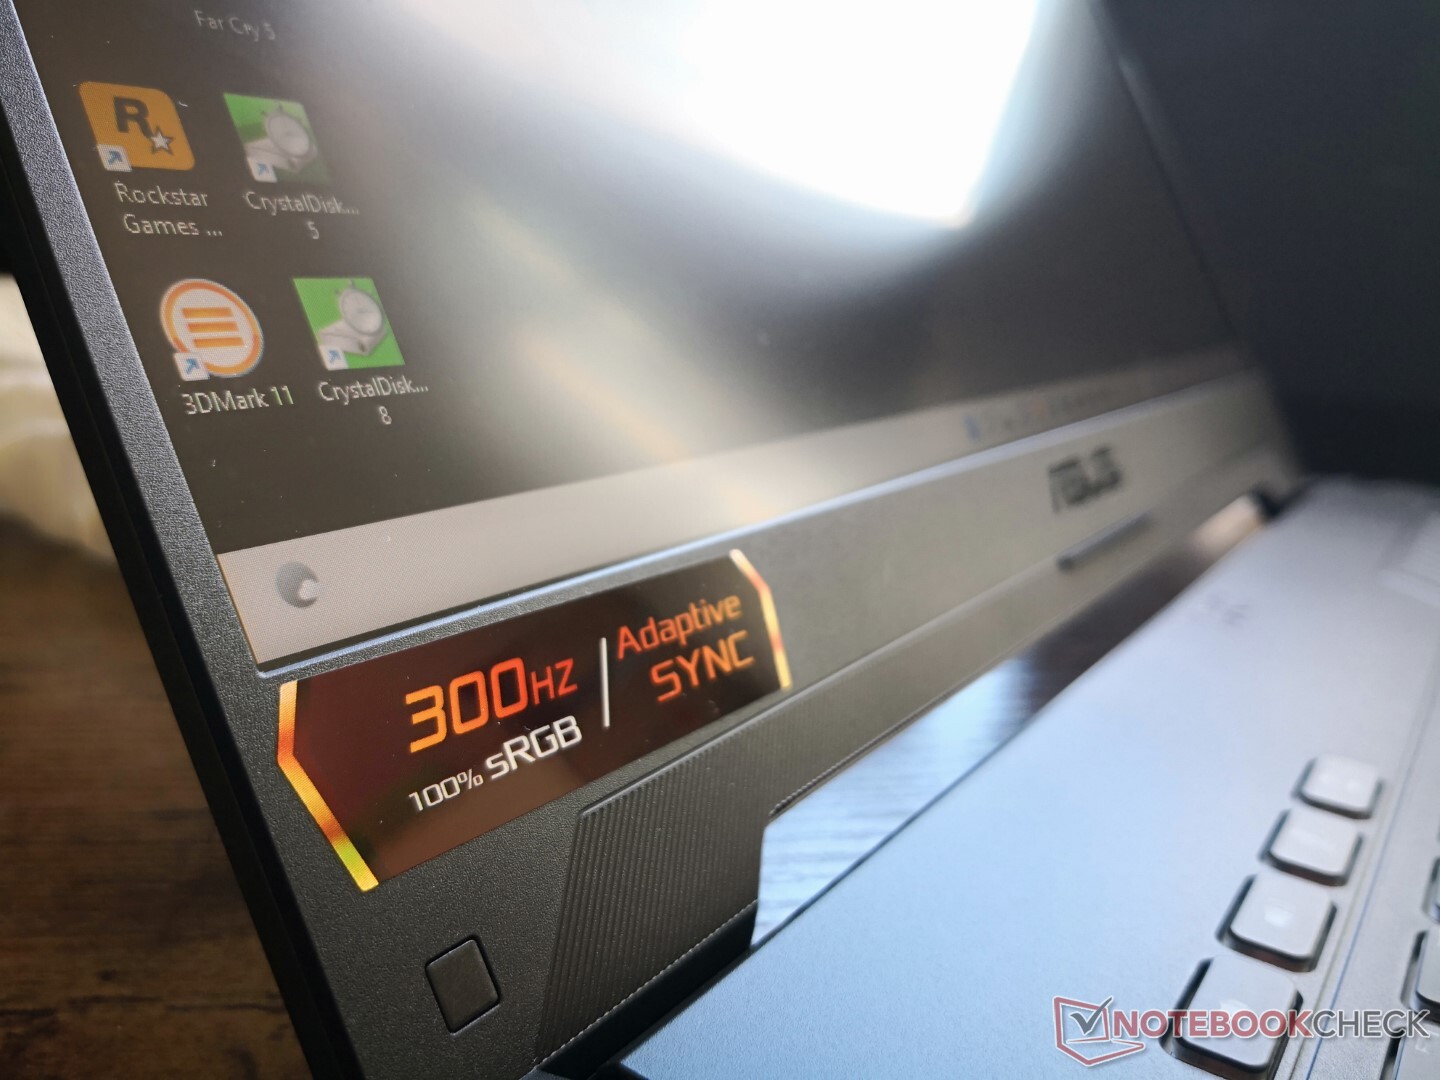
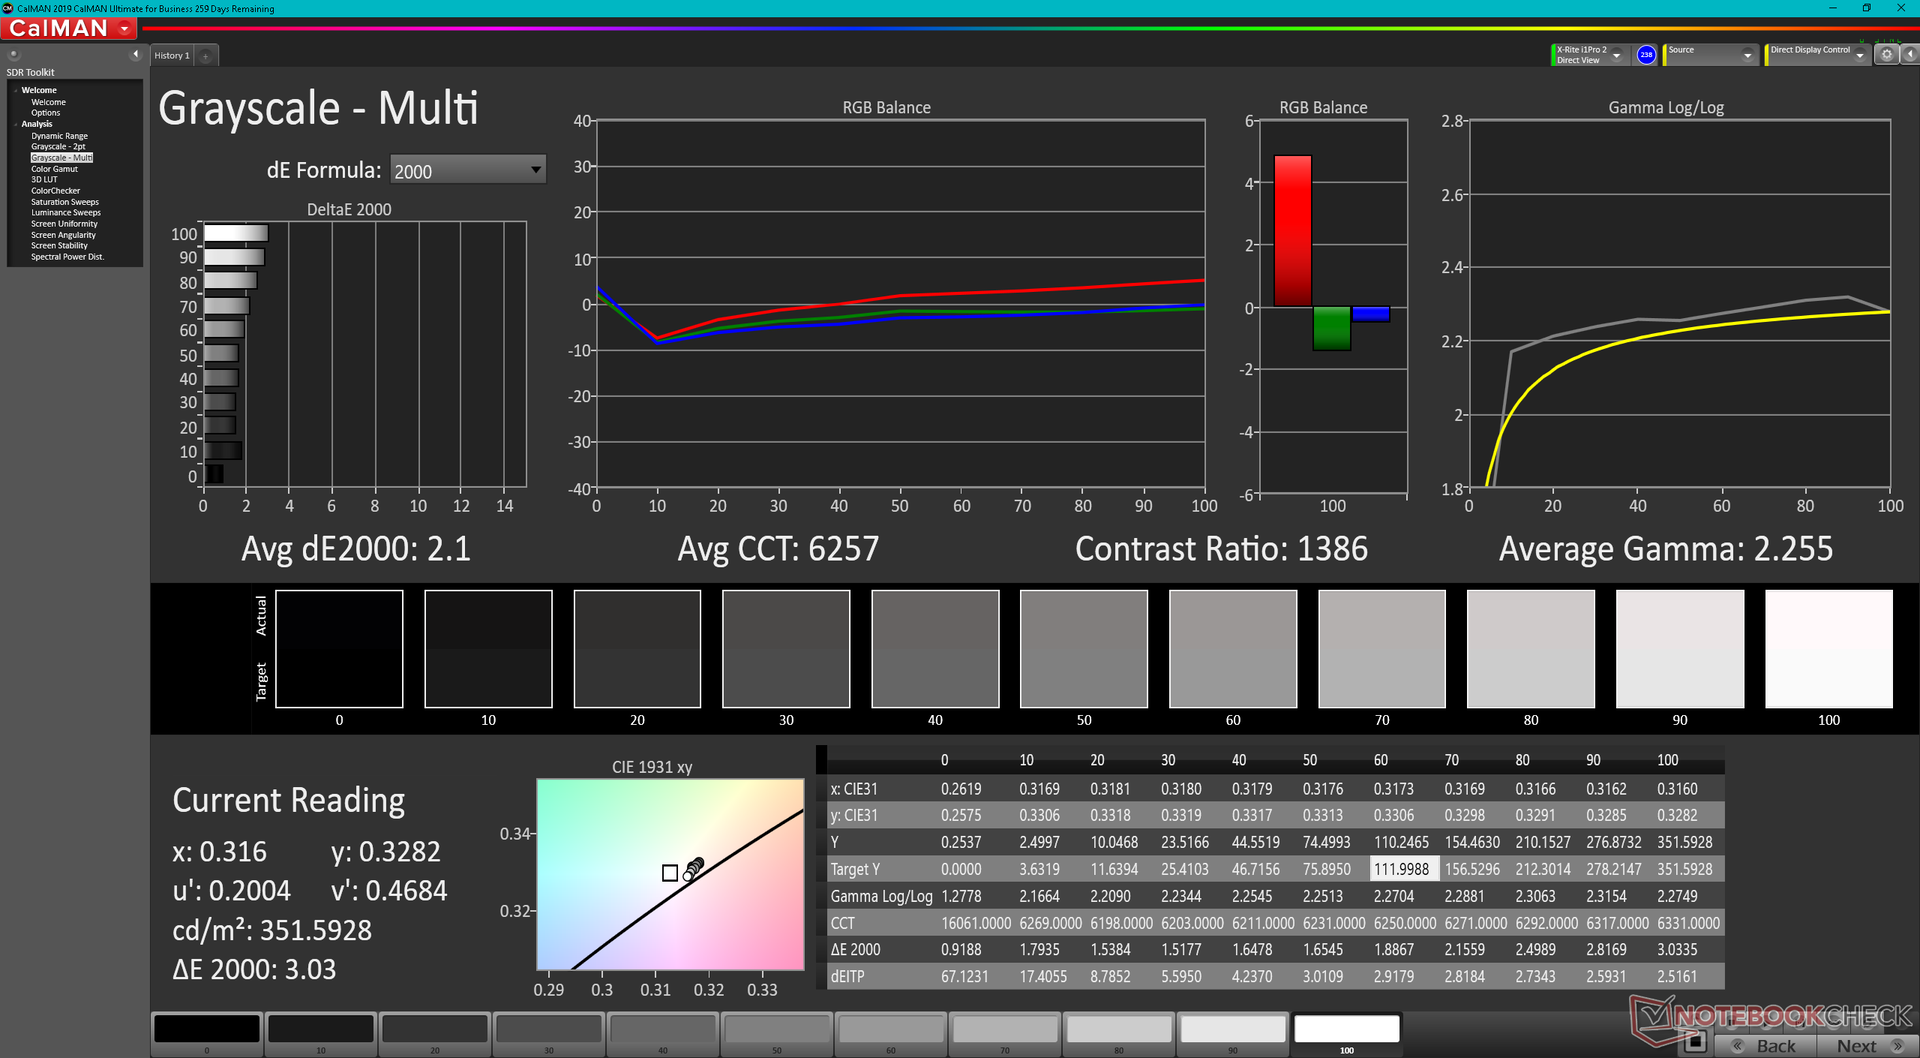
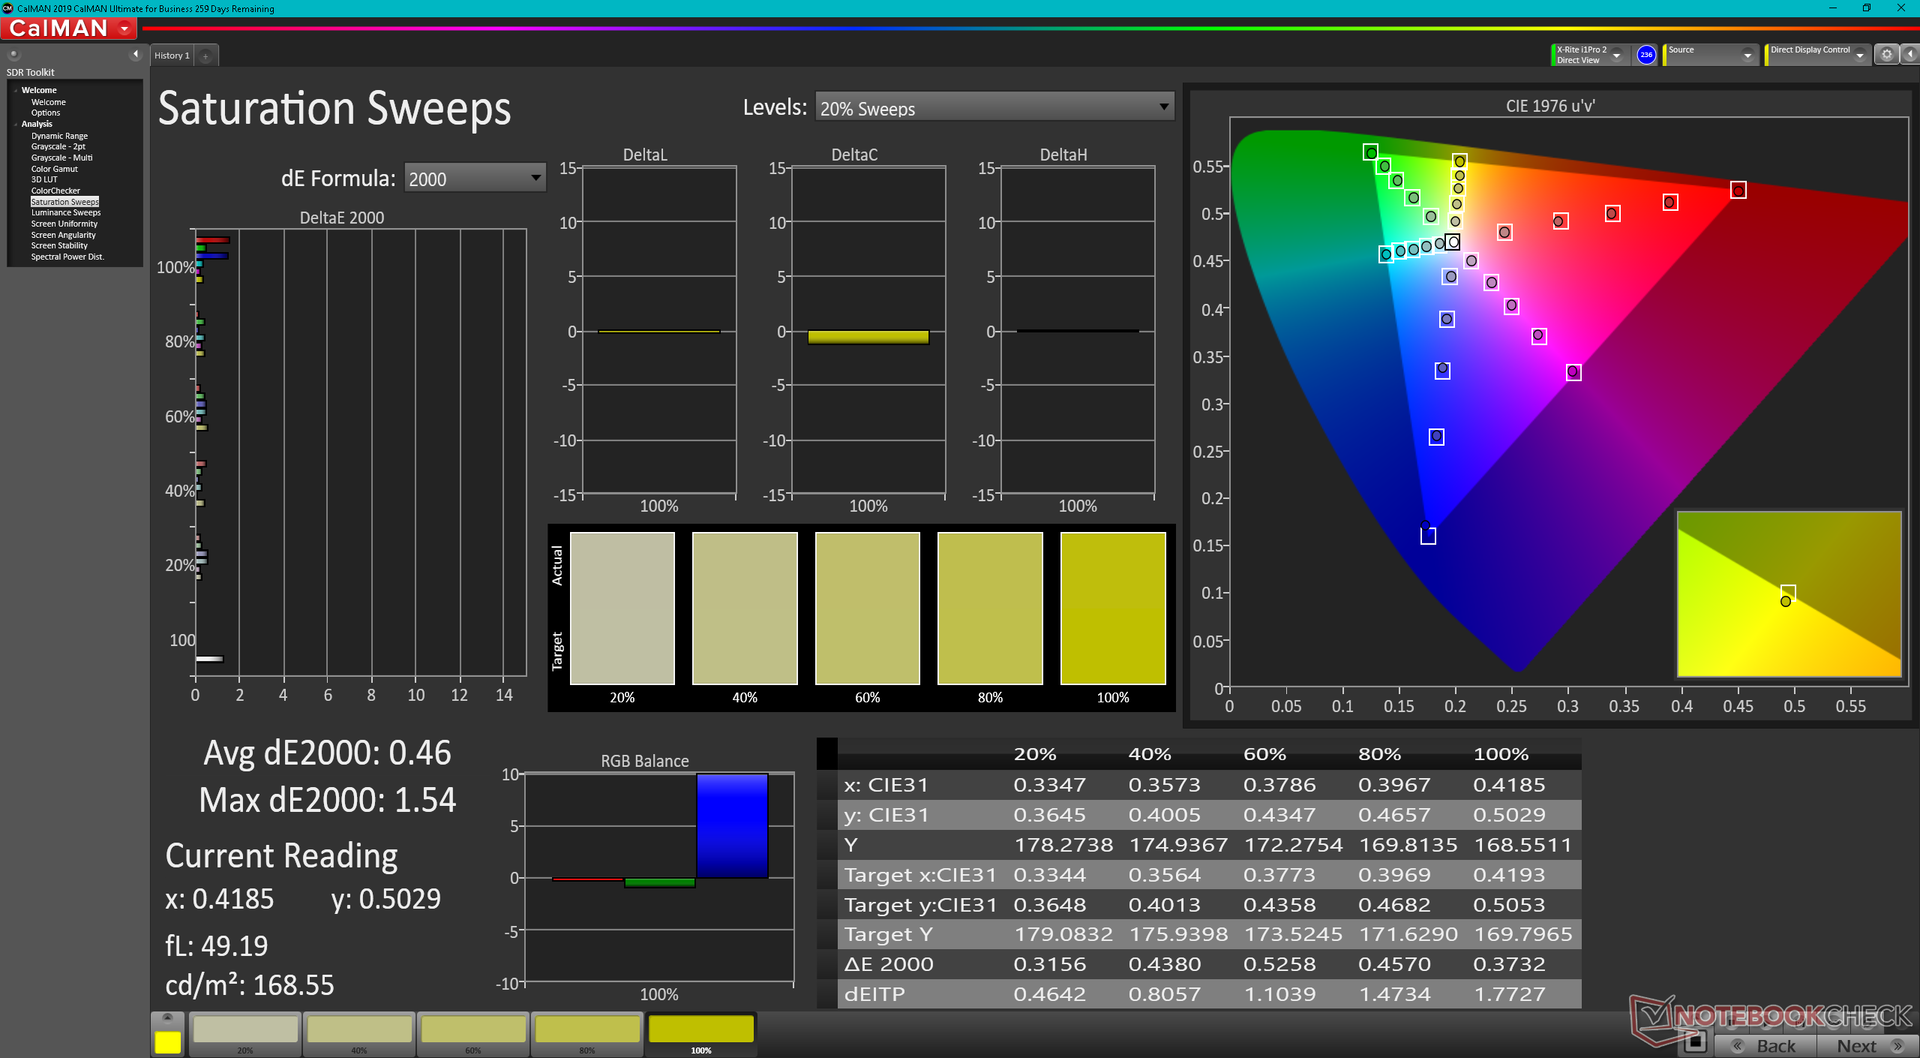
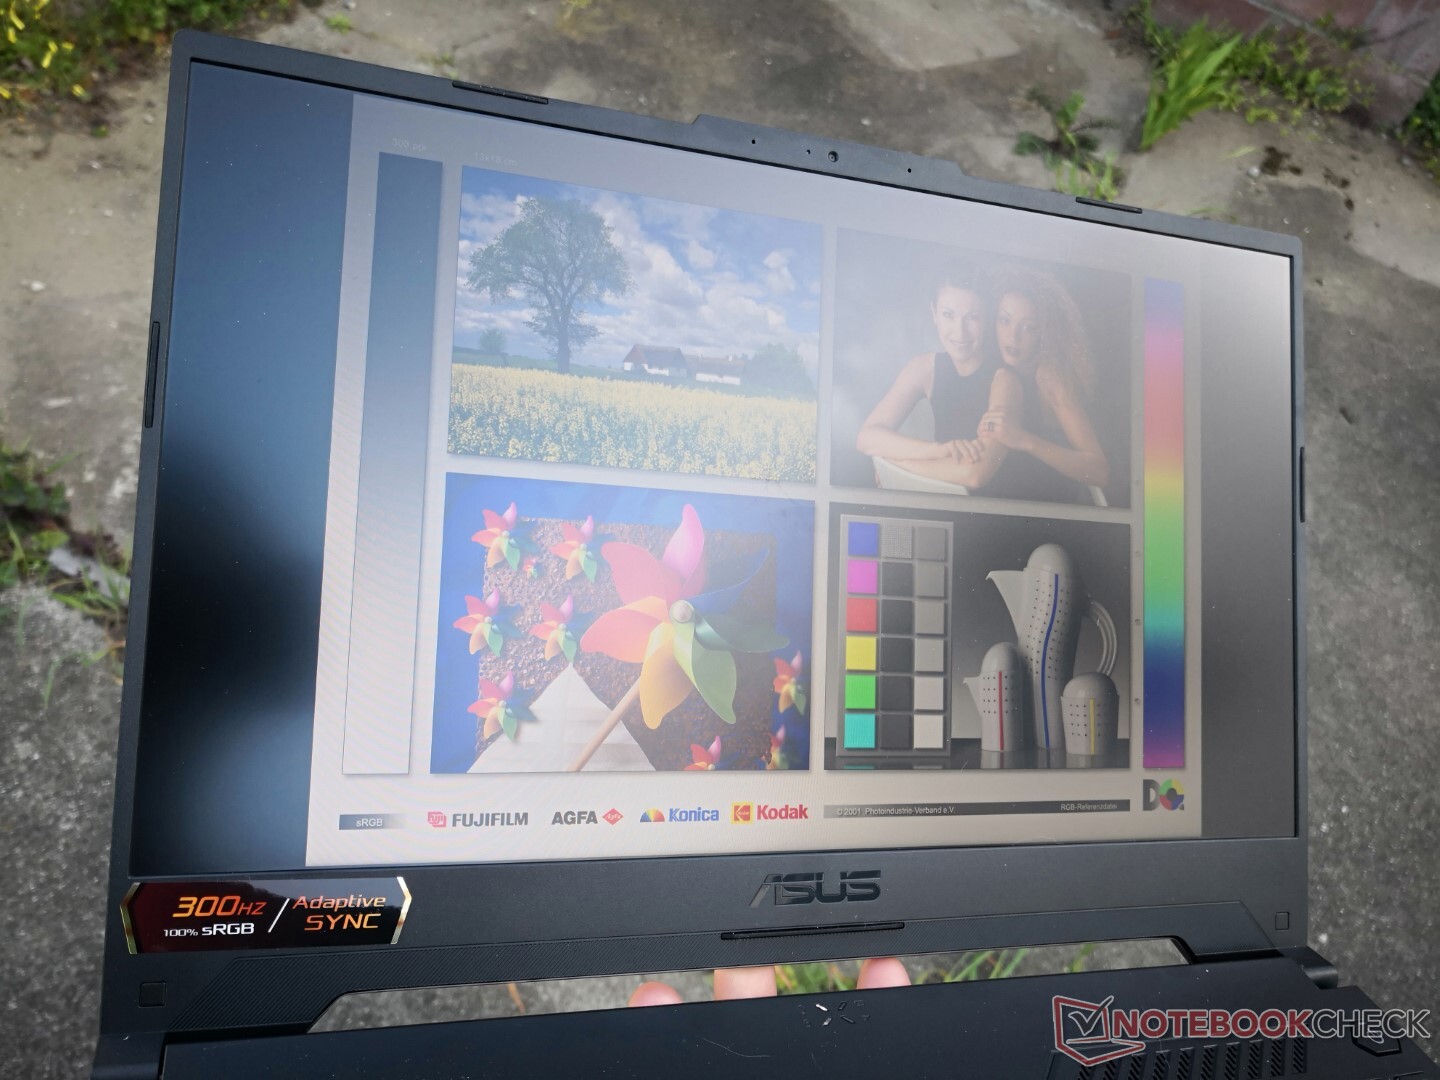
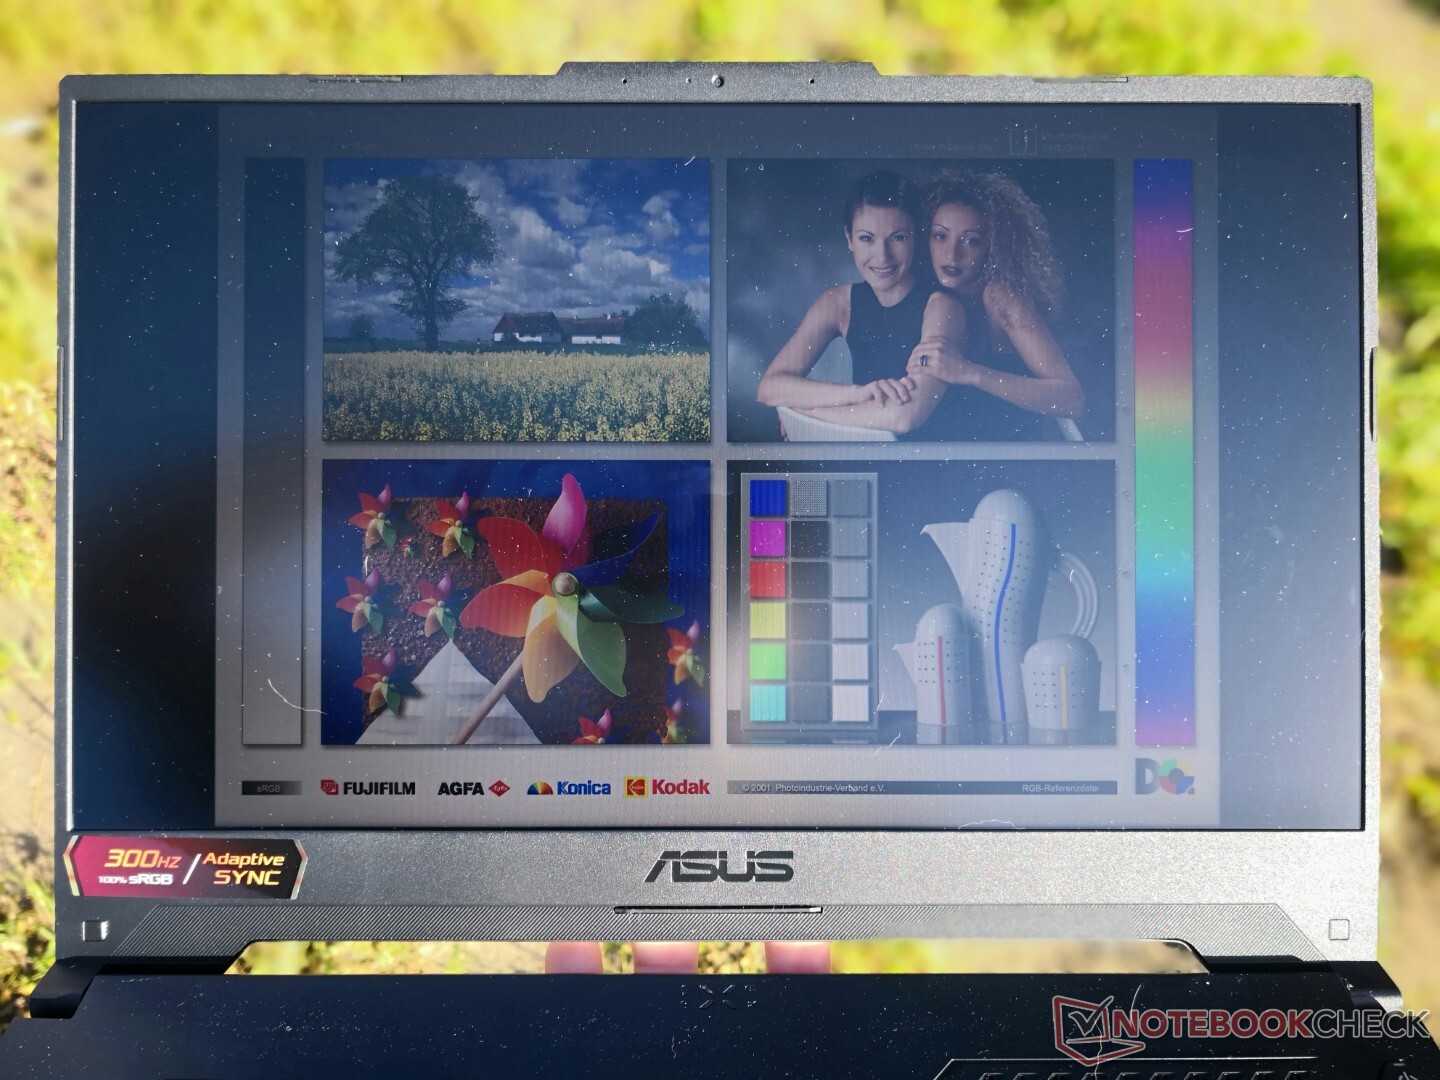
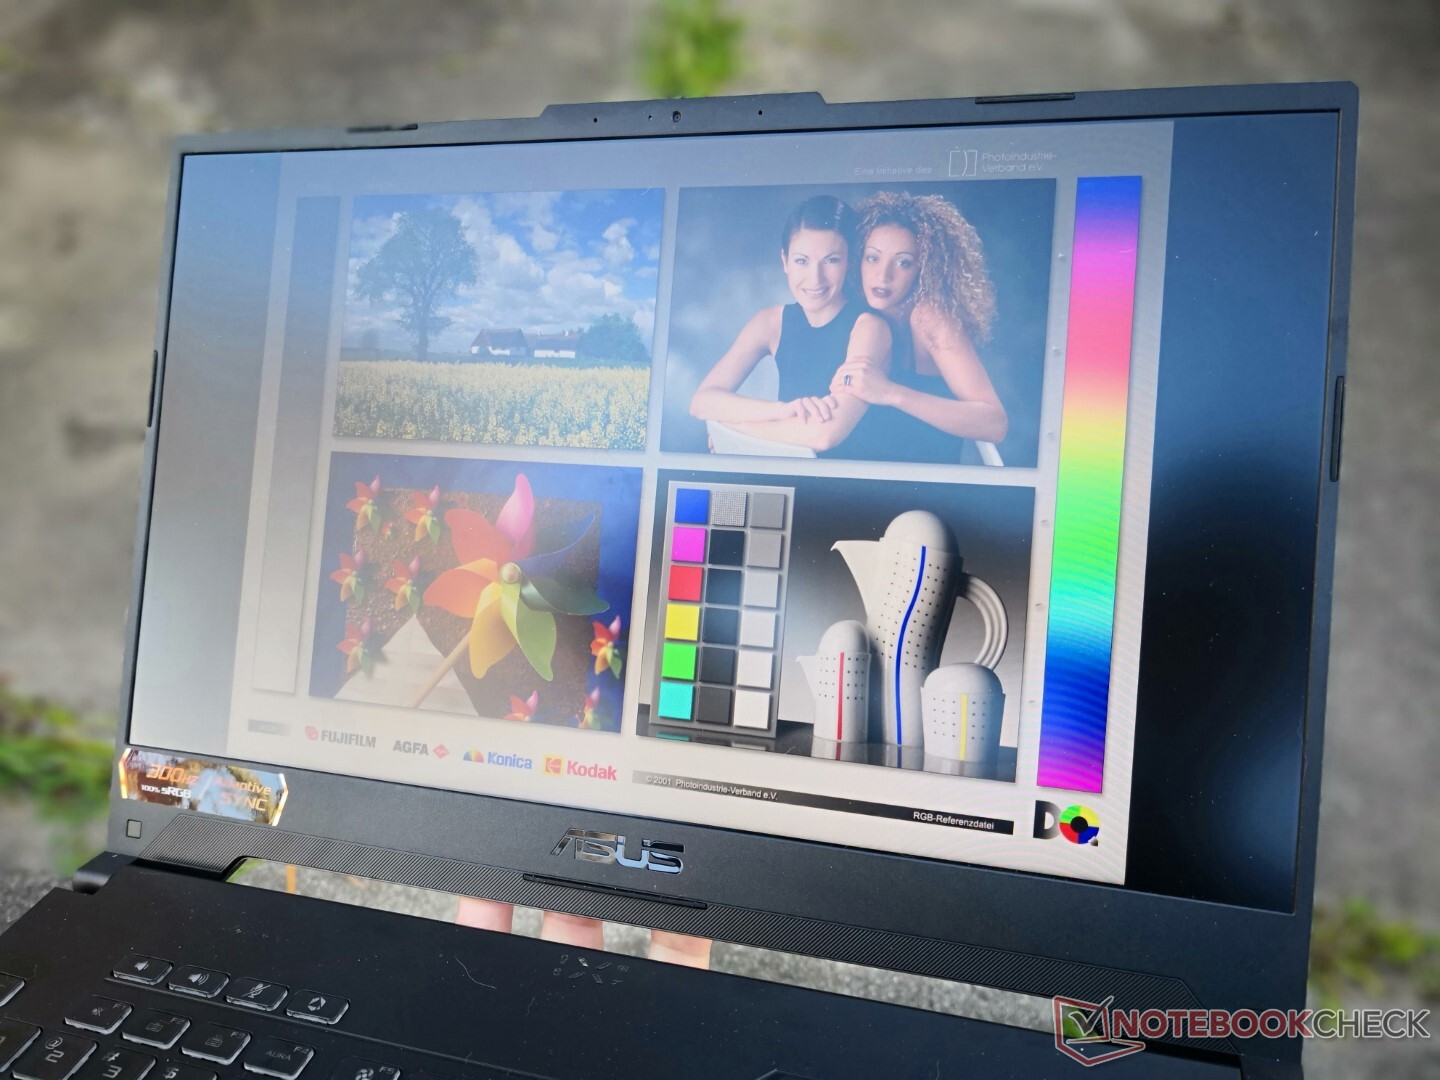
Ekran — Adaptive Sync ile 300 Hz
Asus, FX507'de daha hızlı 300 Hz Sharp TL156VDXP0101 IPS paneli için eski FX516PR'deki 240 Hz Sharp LQ156M1JW26 IPS panelini yükseltti. Daha yüksek yenileme hızının yanı sıra, daha yeni panel ayrıca daha hızlı gri-gri tepki süreleri ve daha parlak bir arka ışık sağlarken, kabaca FX516PR ile aynı kontrast oranını ve gamı korur.
Asus'un FX506'da önemli ölçüde daha düşük renklere ve tepki sürelerine sahip korkunç Chi Mei panelini bıraktığını görmekten mutluyuz.

| |||||||||||||||||||||||||
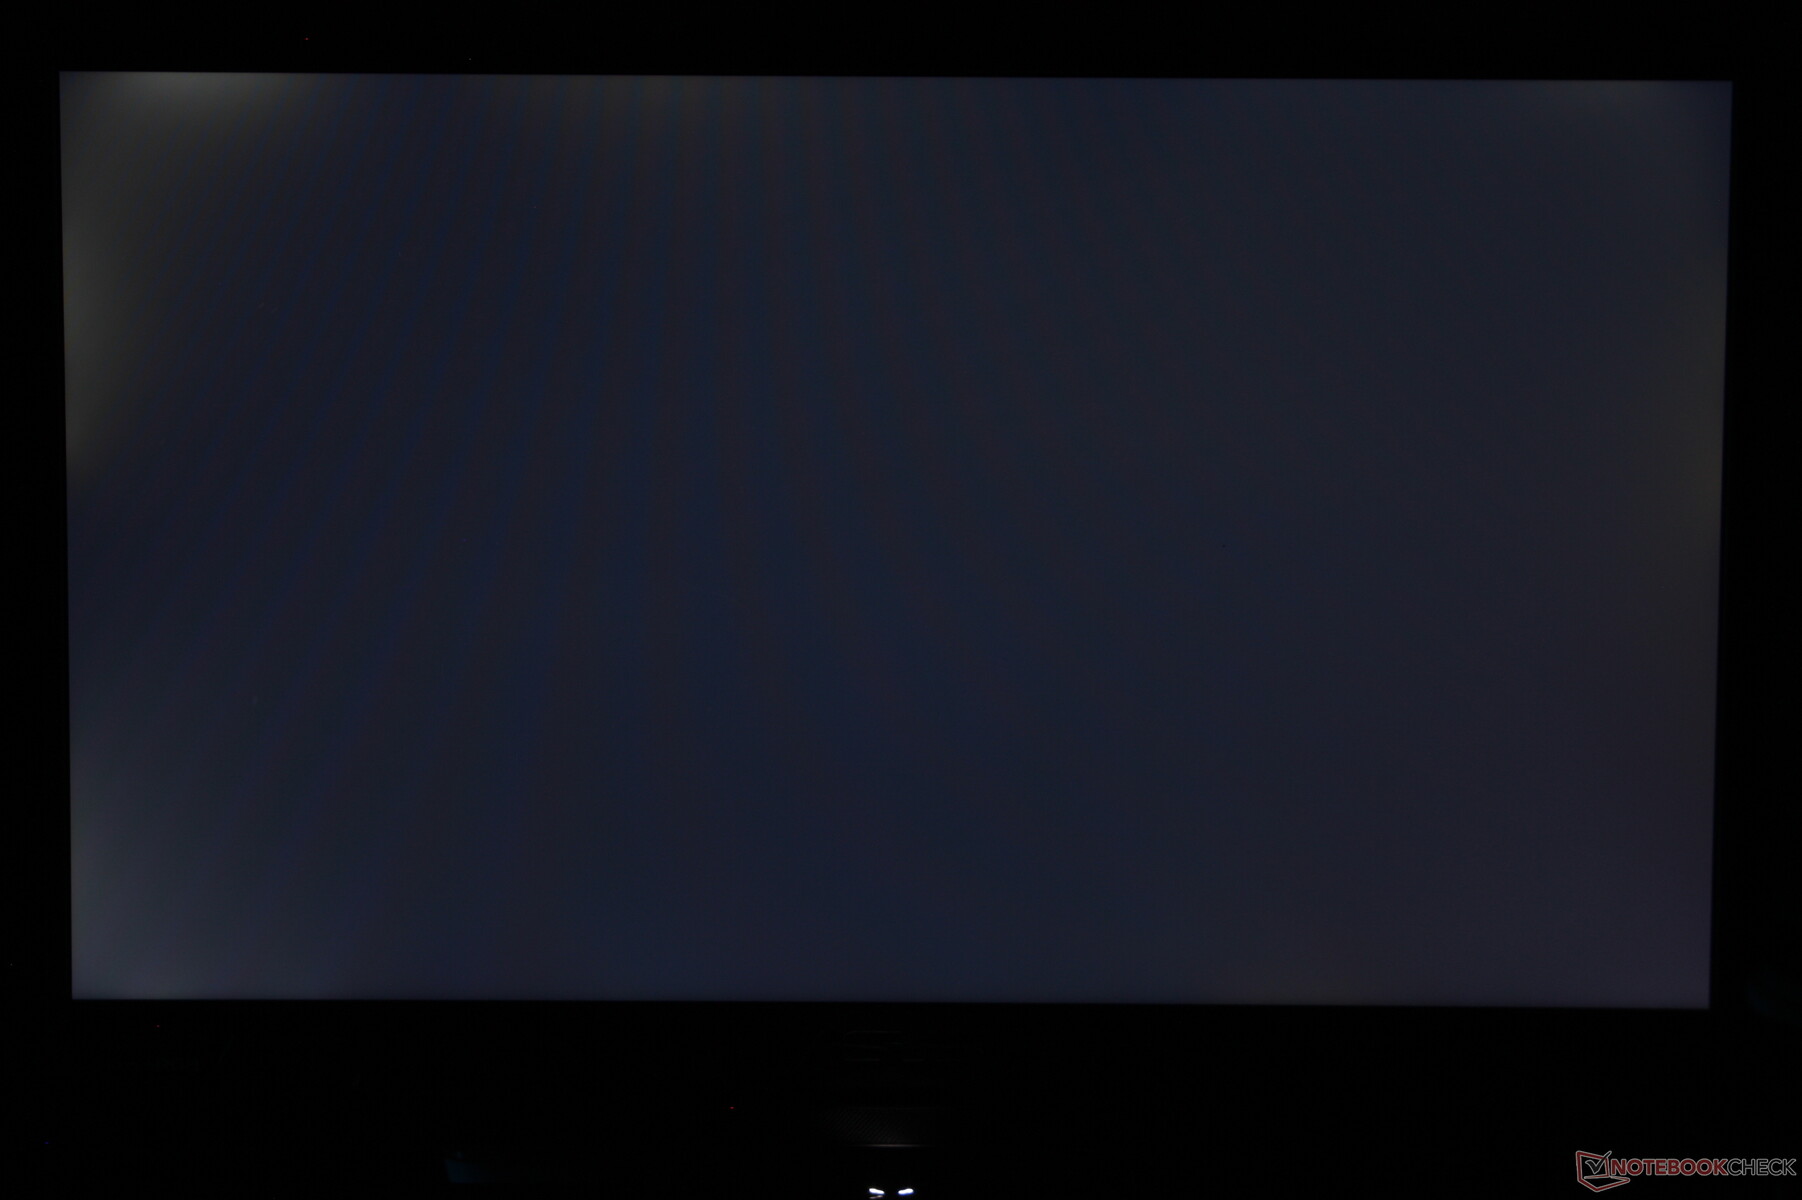
Aydınlatma: 89 %
Batarya modunda parlaklık: 353.7 cd/m²
Kontrast: 1040:1 (Siyah: 0.34 cd/m²)
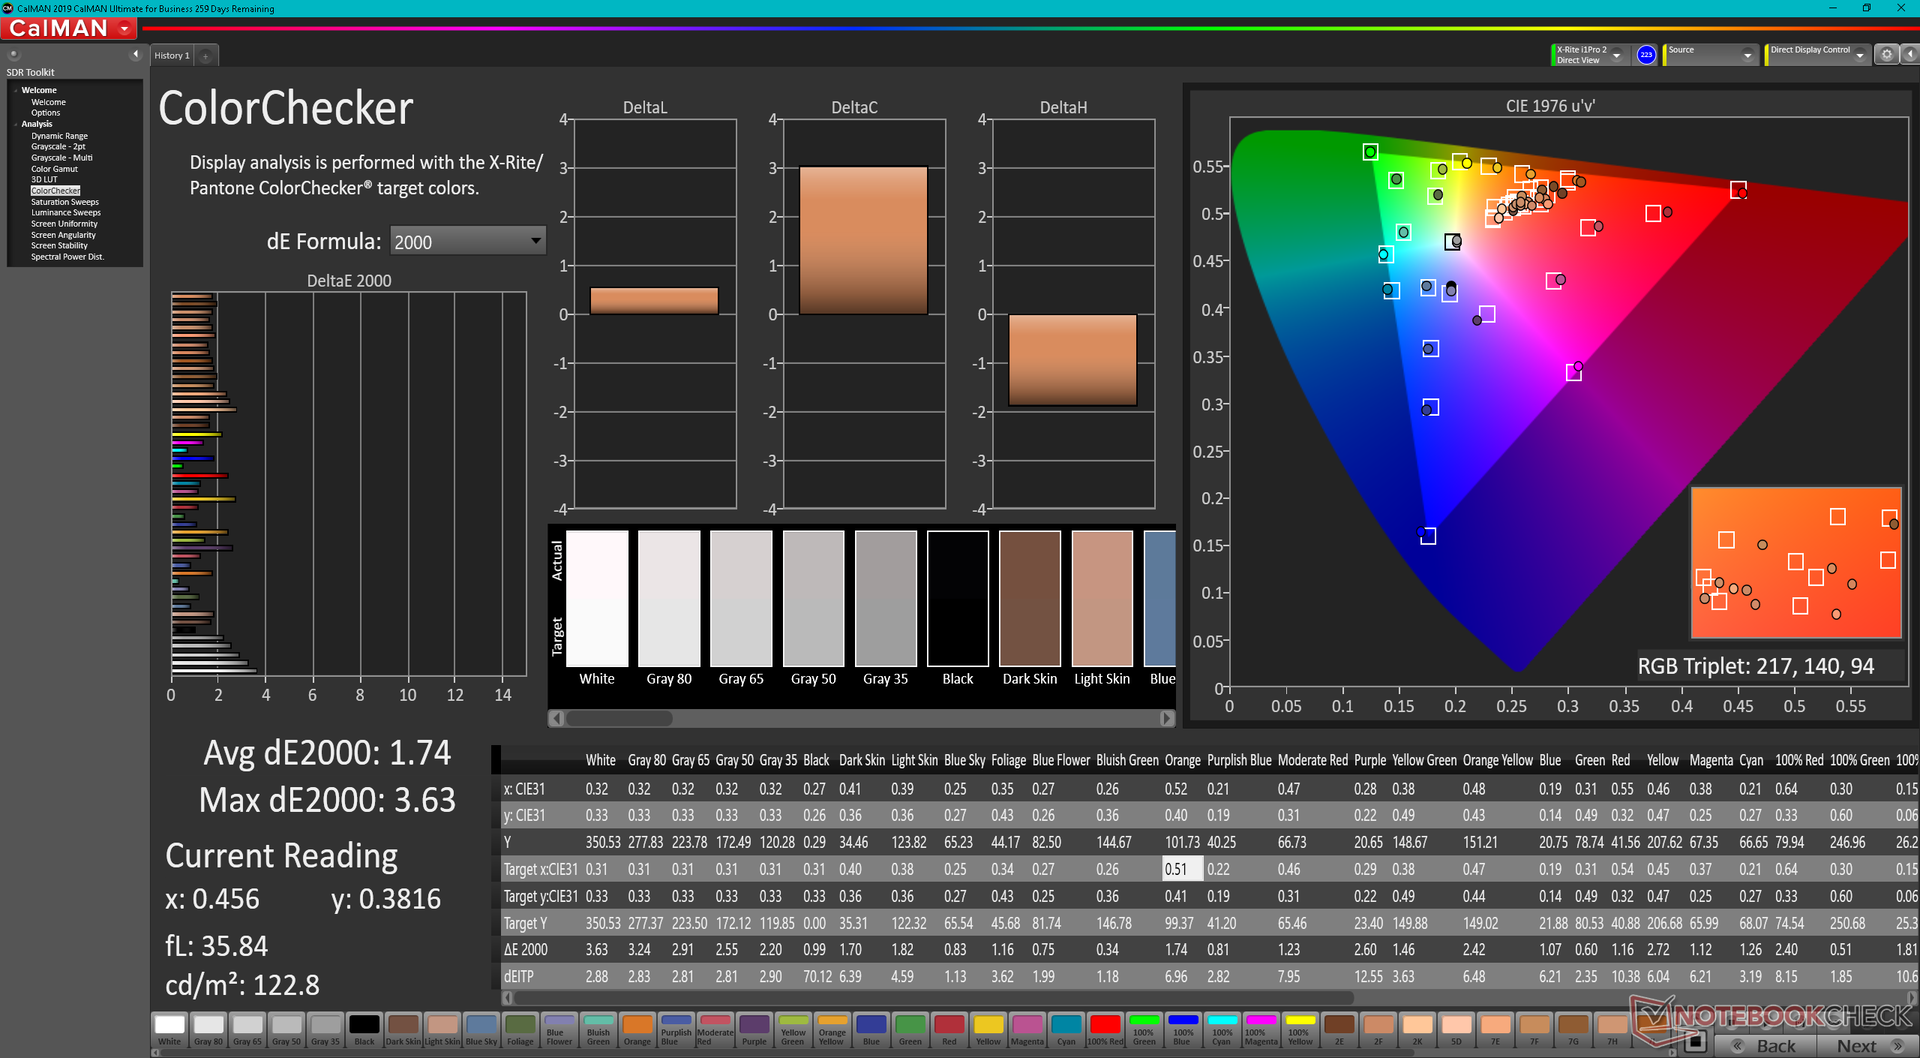
ΔE ColorChecker Calman: 1.74 | ∀{0.5-29.43 Ø4.72}
calibrated: 0.5
ΔE Greyscale Calman: 2.1 | ∀{0.09-98 Ø4.97}
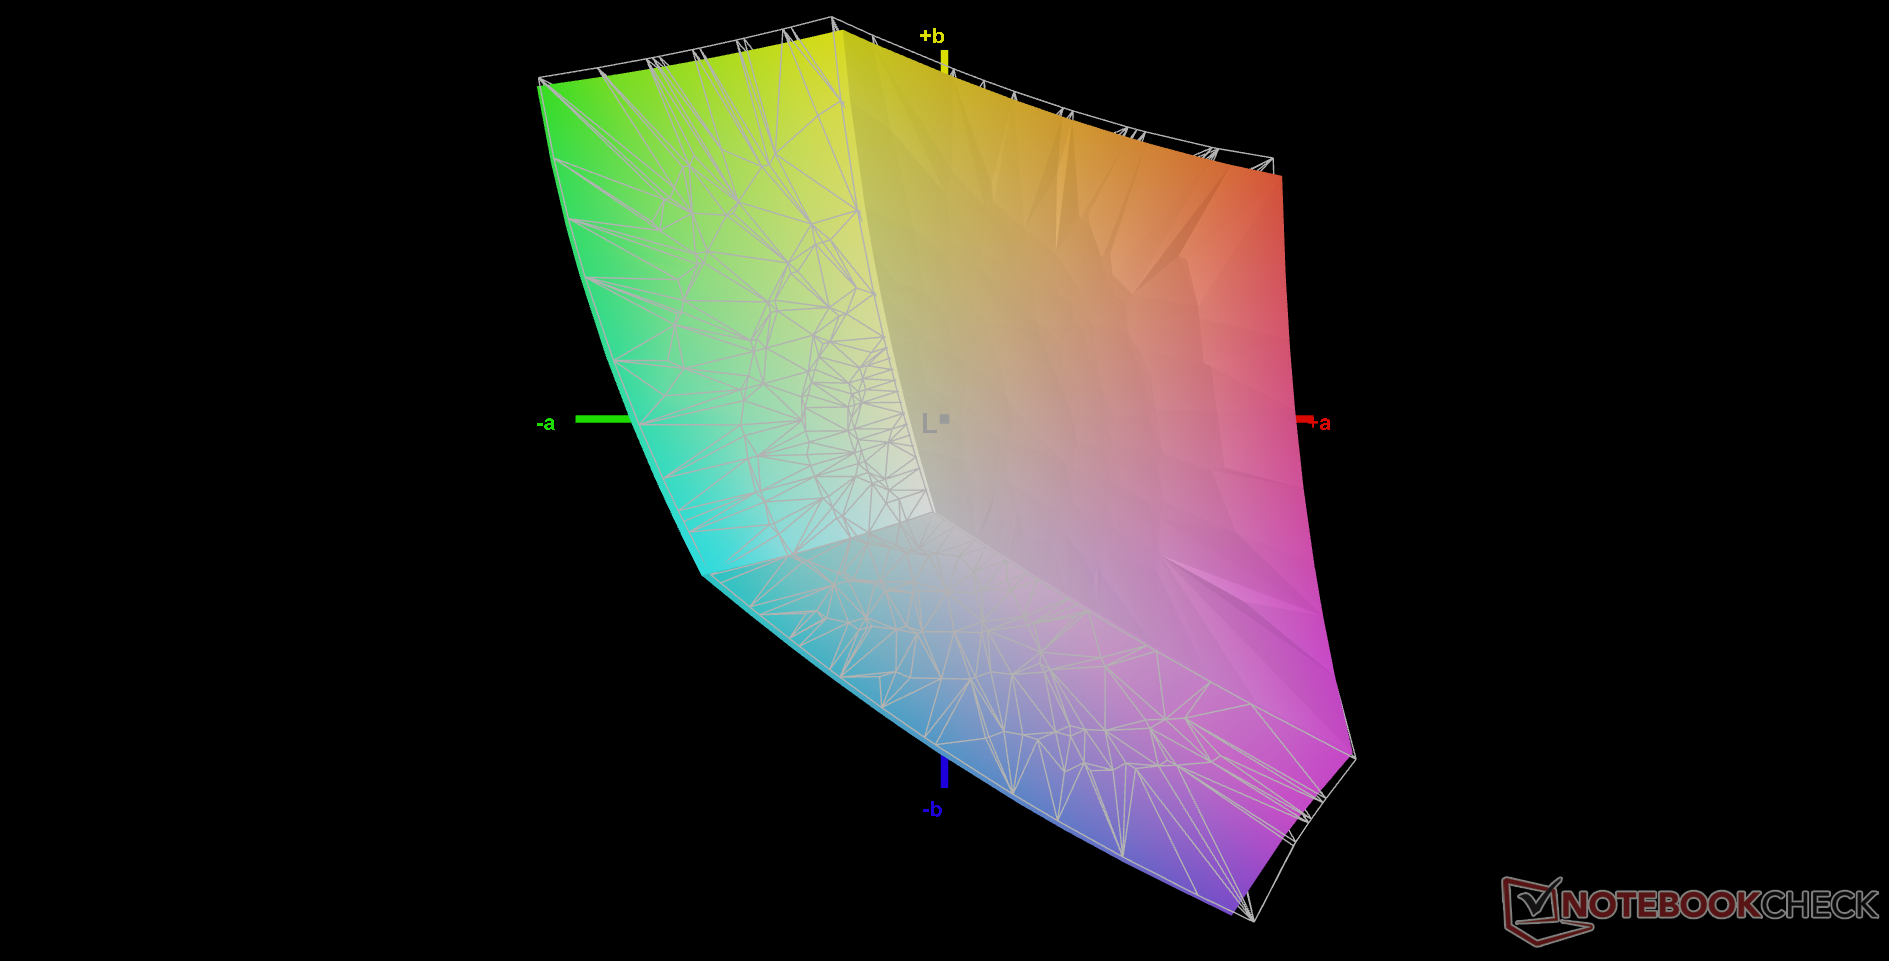
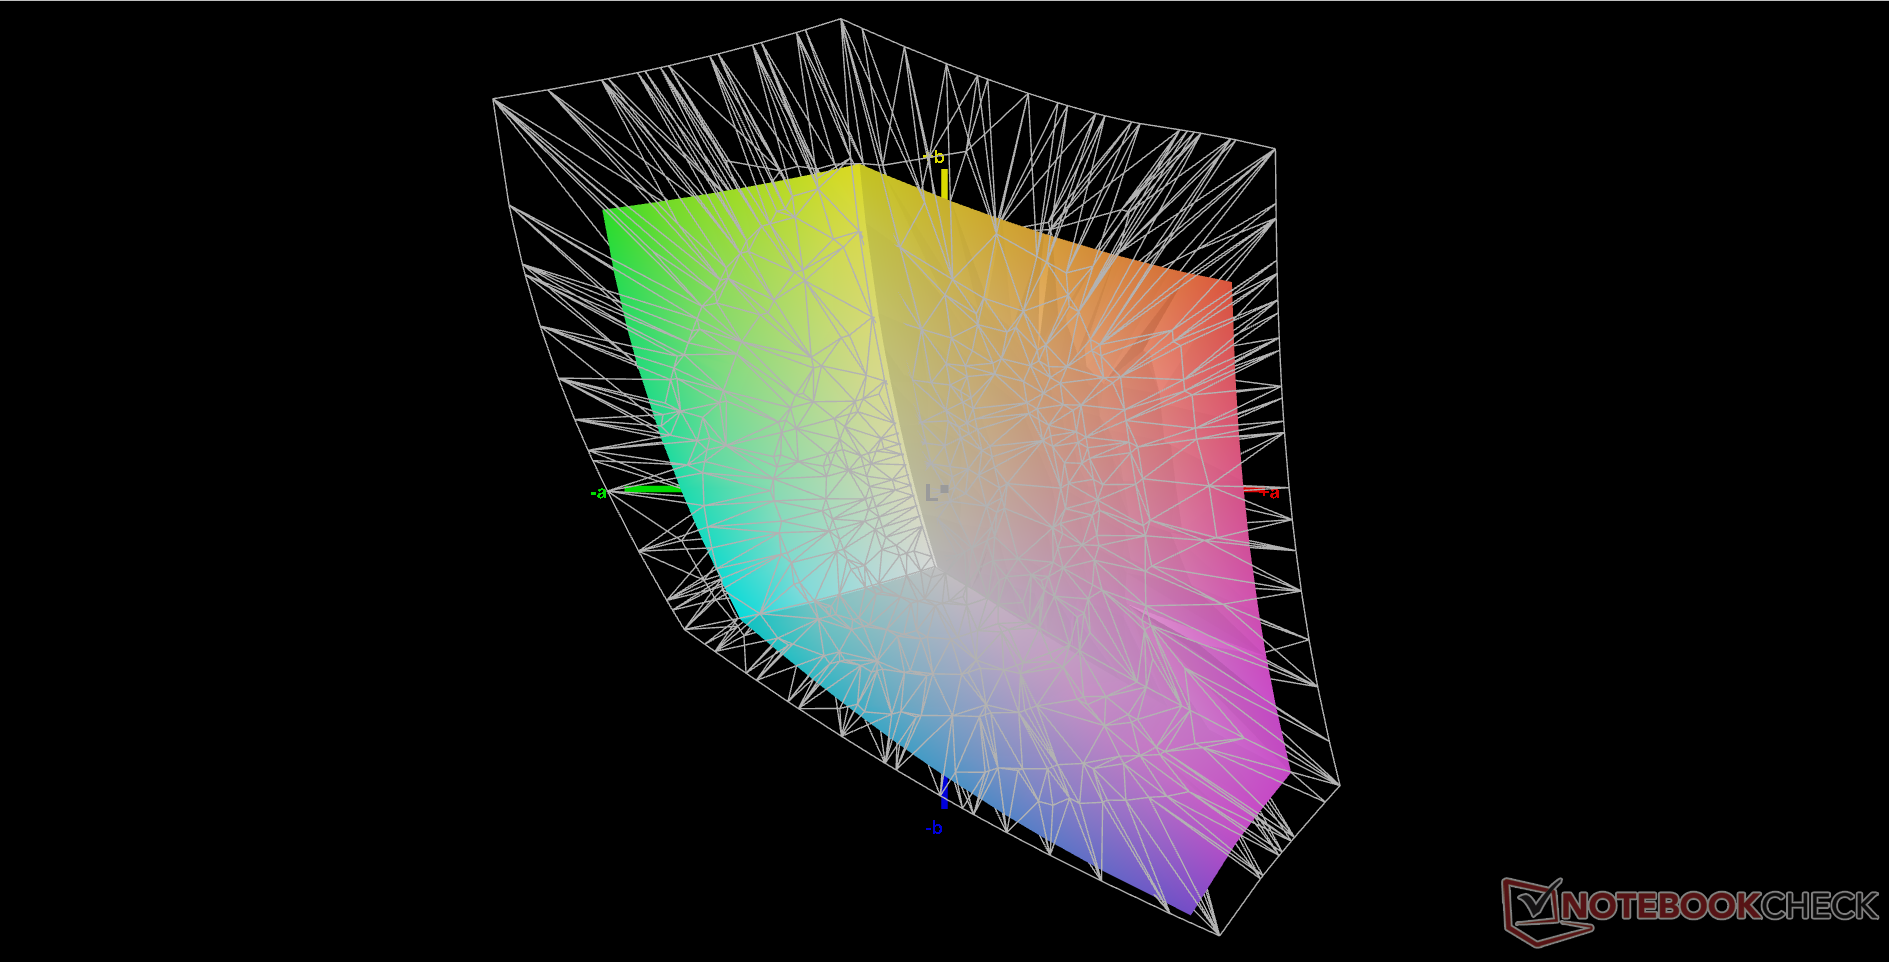
68.5% AdobeRGB 1998 (Argyll 3D)
97% sRGB (Argyll 3D)
66.4% Display P3 (Argyll 3D)
Gamma: 2.3
CCT: 6257 K
| Asus TUF Gaming F15 FX507ZM TL156VDXP0101, IPS, 1920x1080, 15.6" | Asus TUF Gaming F15 FX506HM Chi Mei N156HRA-EA1, IPS, 1920x1080, 15.6" | Asus TUF Dash F15 FX516PR LQ156M1JW26 (SHP1532), IPS, 1920x1080, 15.6" | Asus ROG Strix Scar 15 G533QS BOE CQ NE156QHM-NY1, IPS, 2560x1440, 15.6" | Asus Zephyrus S15 GX502L B156HAN12.0 (AUOBC8C), IPS, 1920x1080, 15.6" | Asus ZenBook Pro Duo UX582 LR-1BH2 SDC4143, OLED + IPS, 3840x2160, 15.6" | |
|---|---|---|---|---|---|---|
| Display | -36% | 0% | 25% | 4% | 33% | |
| Display P3 Coverage (%) | 66.4 | 41.9 -37% | 66.9 1% | 97.6 47% | 69.7 5% | 99.9 50% |
| sRGB Coverage (%) | 97 | 62.9 -35% | 98.1 1% | 99.9 3% | 99.7 3% | 100 3% |
| AdobeRGB 1998 Coverage (%) | 68.5 | 43.3 -37% | 67.9 -1% | 85.3 25% | 71.1 4% | 99.7 46% |
| Response Times | -238% | -46% | -74% | -63% | 69% | |
| Response Time Grey 50% / Grey 80% * (ms) | 5.6 ? | 28.4 ? -407% | 12 ? -114% | 14 ? -150% | 14 ? -150% | 2.4 ? 57% |
| Response Time Black / White * (ms) | 12.8 ? | 21.6 ? -69% | 10 ? 22% | 12.4 ? 3% | 9.6 ? 25% | 2.4 ? 81% |
| PWM Frequency (Hz) | 23580 ? | 59.5 ? | ||||
| Screen | -144% | -27% | -70% | -29% | -87% | |
| Brightness middle (cd/m²) | 353.7 | 268.3 -24% | 286 -19% | 304.3 -14% | 283 -20% | 345 -2% |
| Brightness (cd/m²) | 340 | 257 -24% | 275 -19% | 286 -16% | 289 -15% | 332 -2% |
| Brightness Distribution (%) | 89 | 84 -6% | 91 2% | 76 -15% | 90 1% | 87 -2% |
| Black Level * (cd/m²) | 0.34 | 0.34 -0% | 0.25 26% | 0.33 3% | 0.24 29% | |
| Contrast (:1) | 1040 | 789 -24% | 1144 10% | 922 -11% | 1179 13% | |
| Colorchecker dE 2000 * | 1.74 | 5.05 -190% | 2.43 -40% | 2.76 -59% | 2.26 -30% | 3.3 -90% |
| Colorchecker dE 2000 max. * | 3.63 | 15.43 -325% | 6.33 -74% | 5.57 -53% | 5.64 -55% | 7.2 -98% |
| Colorchecker dE 2000 calibrated * | 0.5 | 3.21 -542% | 0.83 -66% | 2.38 -376% | 1.11 -122% | 2.6 -420% |
| Greyscale dE 2000 * | 2.1 | 5.5 -162% | 3.5 -67% | 4 -90% | 3.4 -62% | 2 5% |
| Gamma | 2.3 96% | 2.35 94% | 2.32 95% | 2.14 103% | 2.228 99% | 2.01 109% |
| CCT | 6257 104% | 7392 88% | 7145 91% | 6844 95% | 7249 90% | 6566 99% |
| Color Space (Percent of AdobeRGB 1998) (%) | 68 | 71 | 89.2 | |||
| Color Space (Percent of sRGB) (%) | 91 | 93 | 100 | |||
| Toplam Ortalama (Program / Ayarlar) | -139% /
-134% | -24% /
-24% | -40% /
-50% | -29% /
-27% | 5% /
-31% |
* ... daha küçük daha iyidir
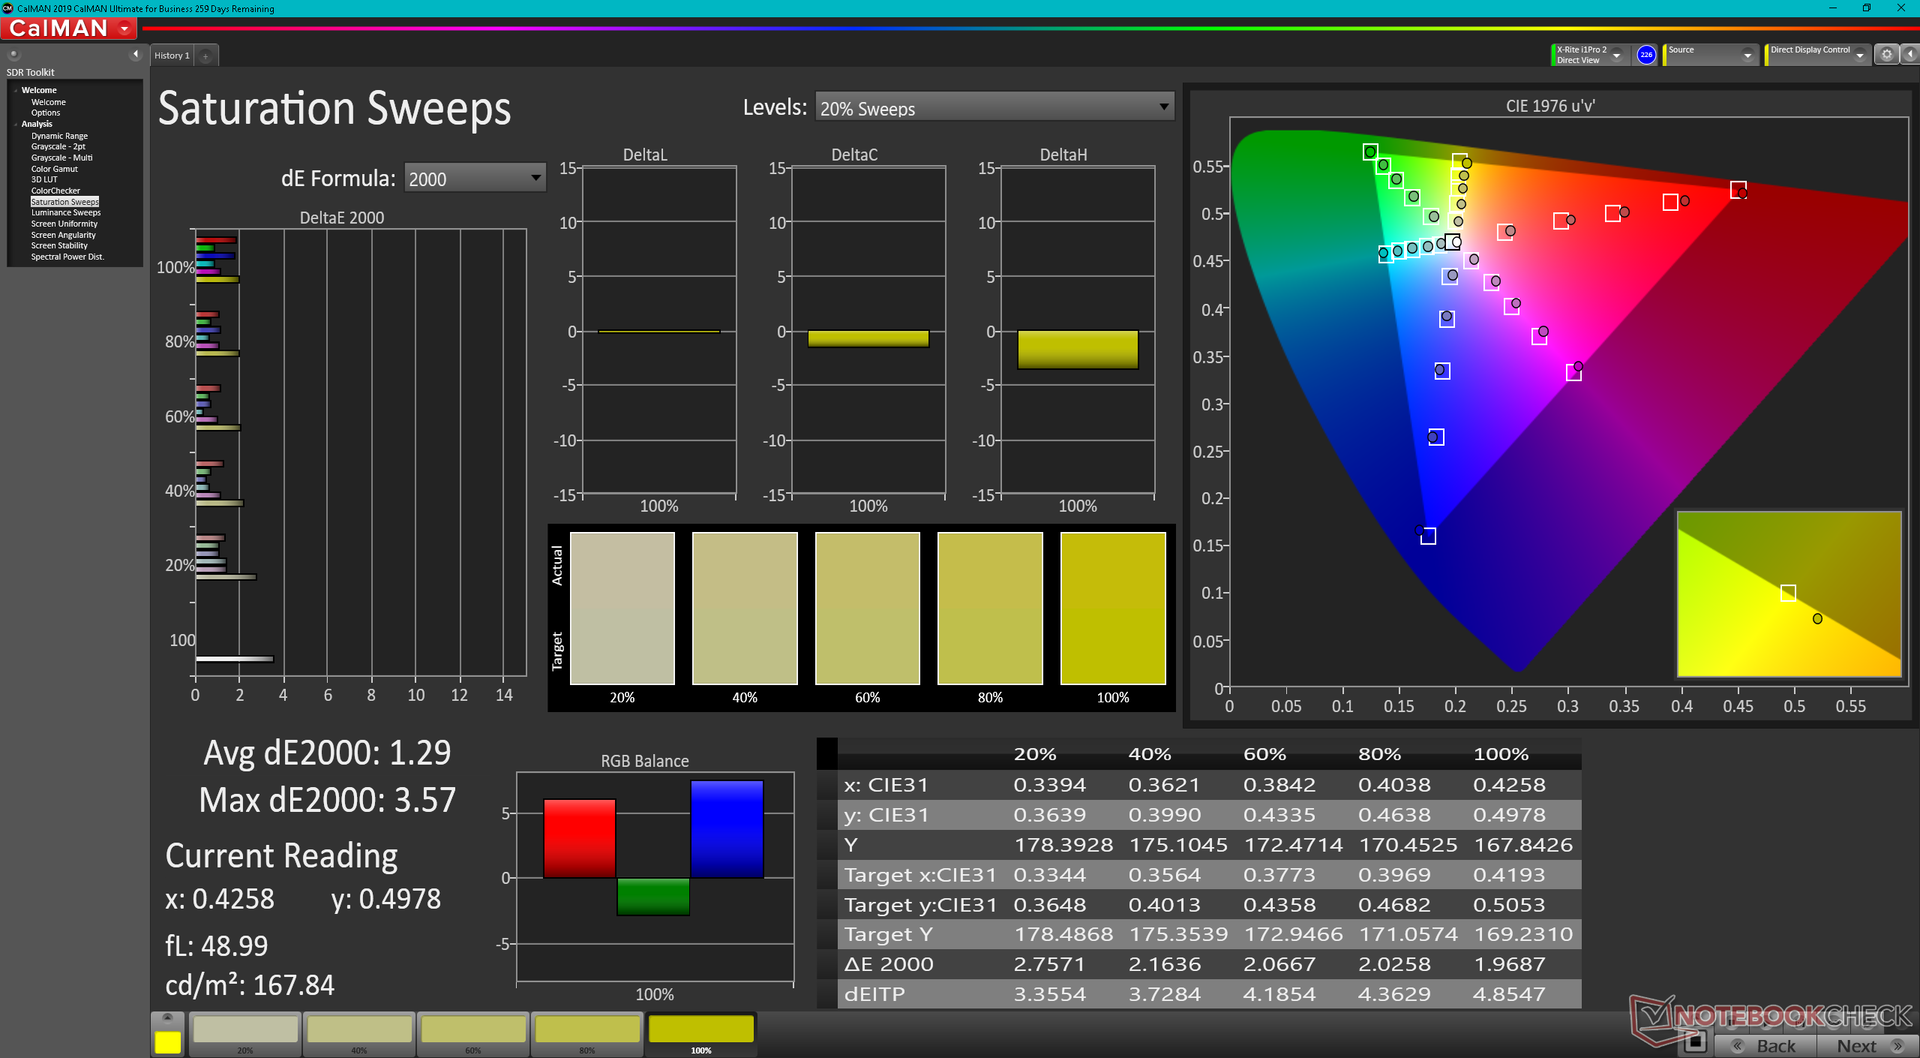
FX506 ve FX507 arasında önemli bir renk alanı değişikliği yoktur. Asus, Razer Blade 15 serisi veya profesyonel ZenBook serisinden farklı olarak FX507 serisi için herhangi bir AdobeRGB veya DCI-P3 kapsama seçeneği sunmuyor.
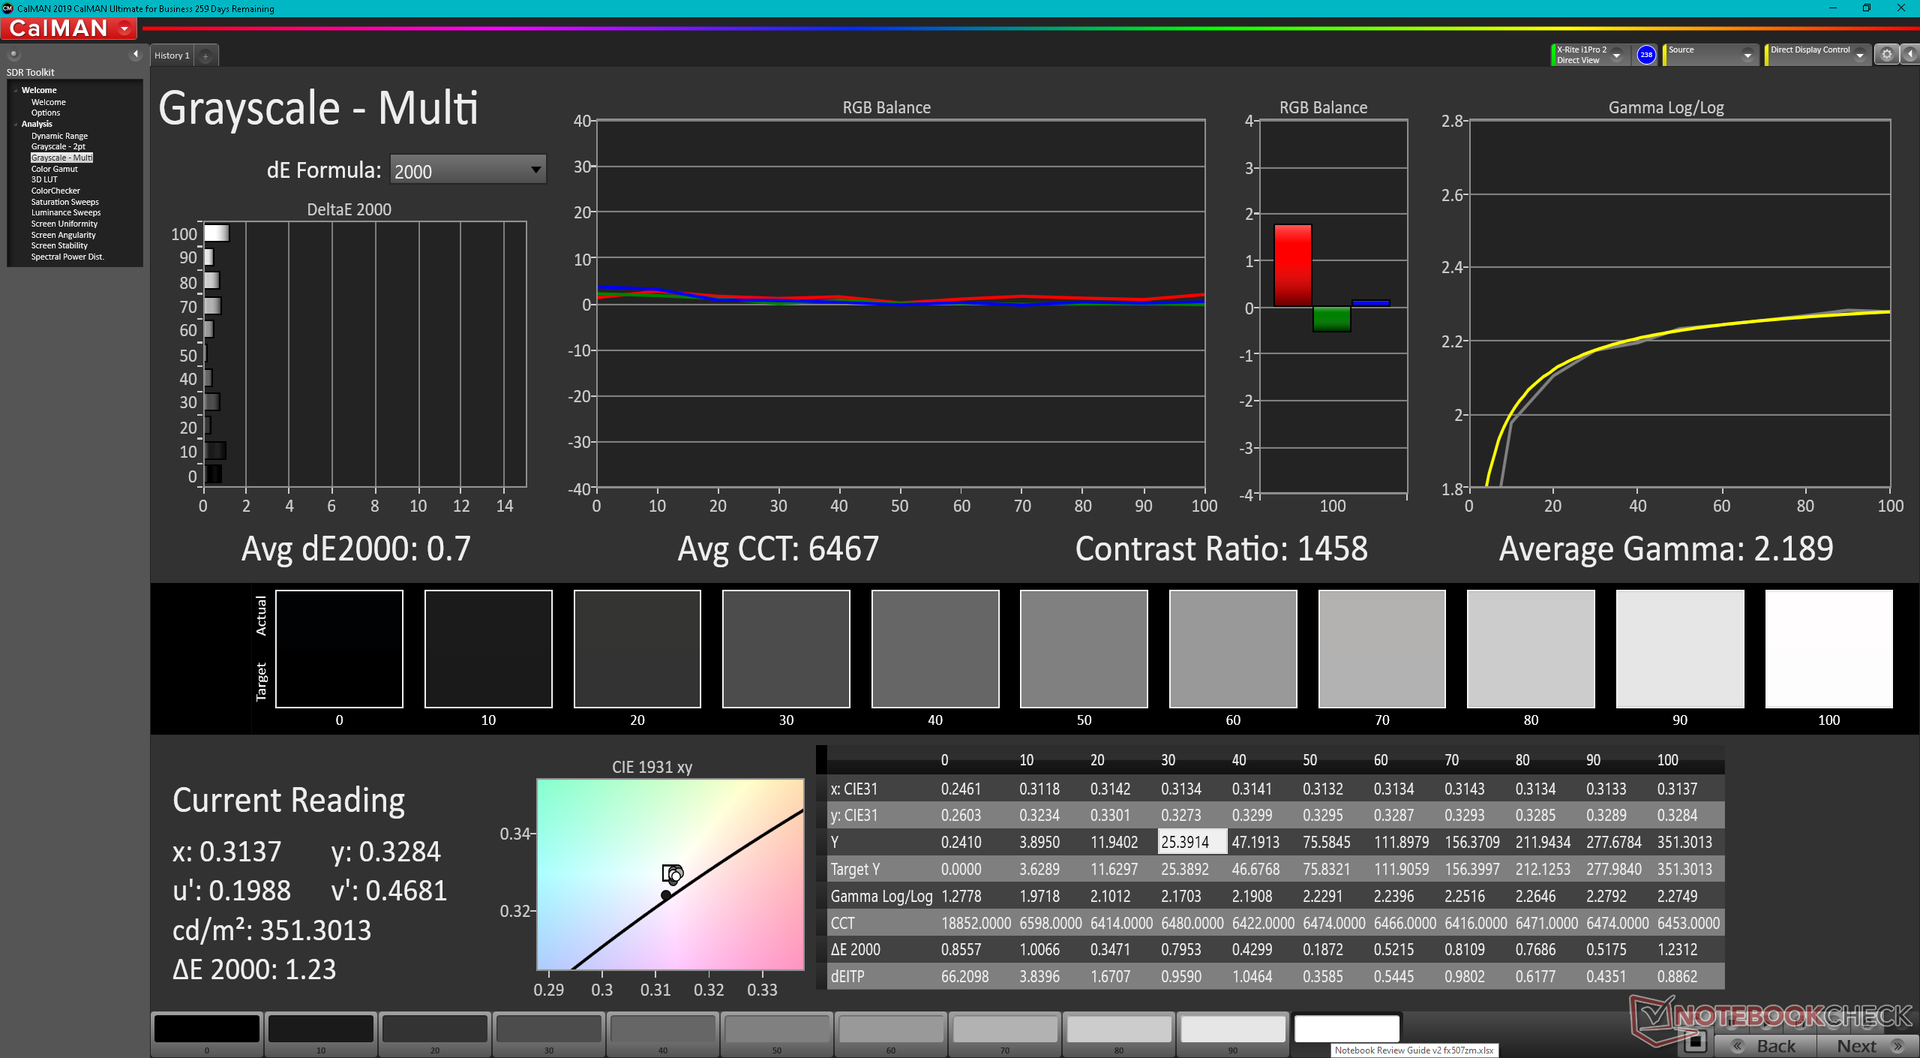
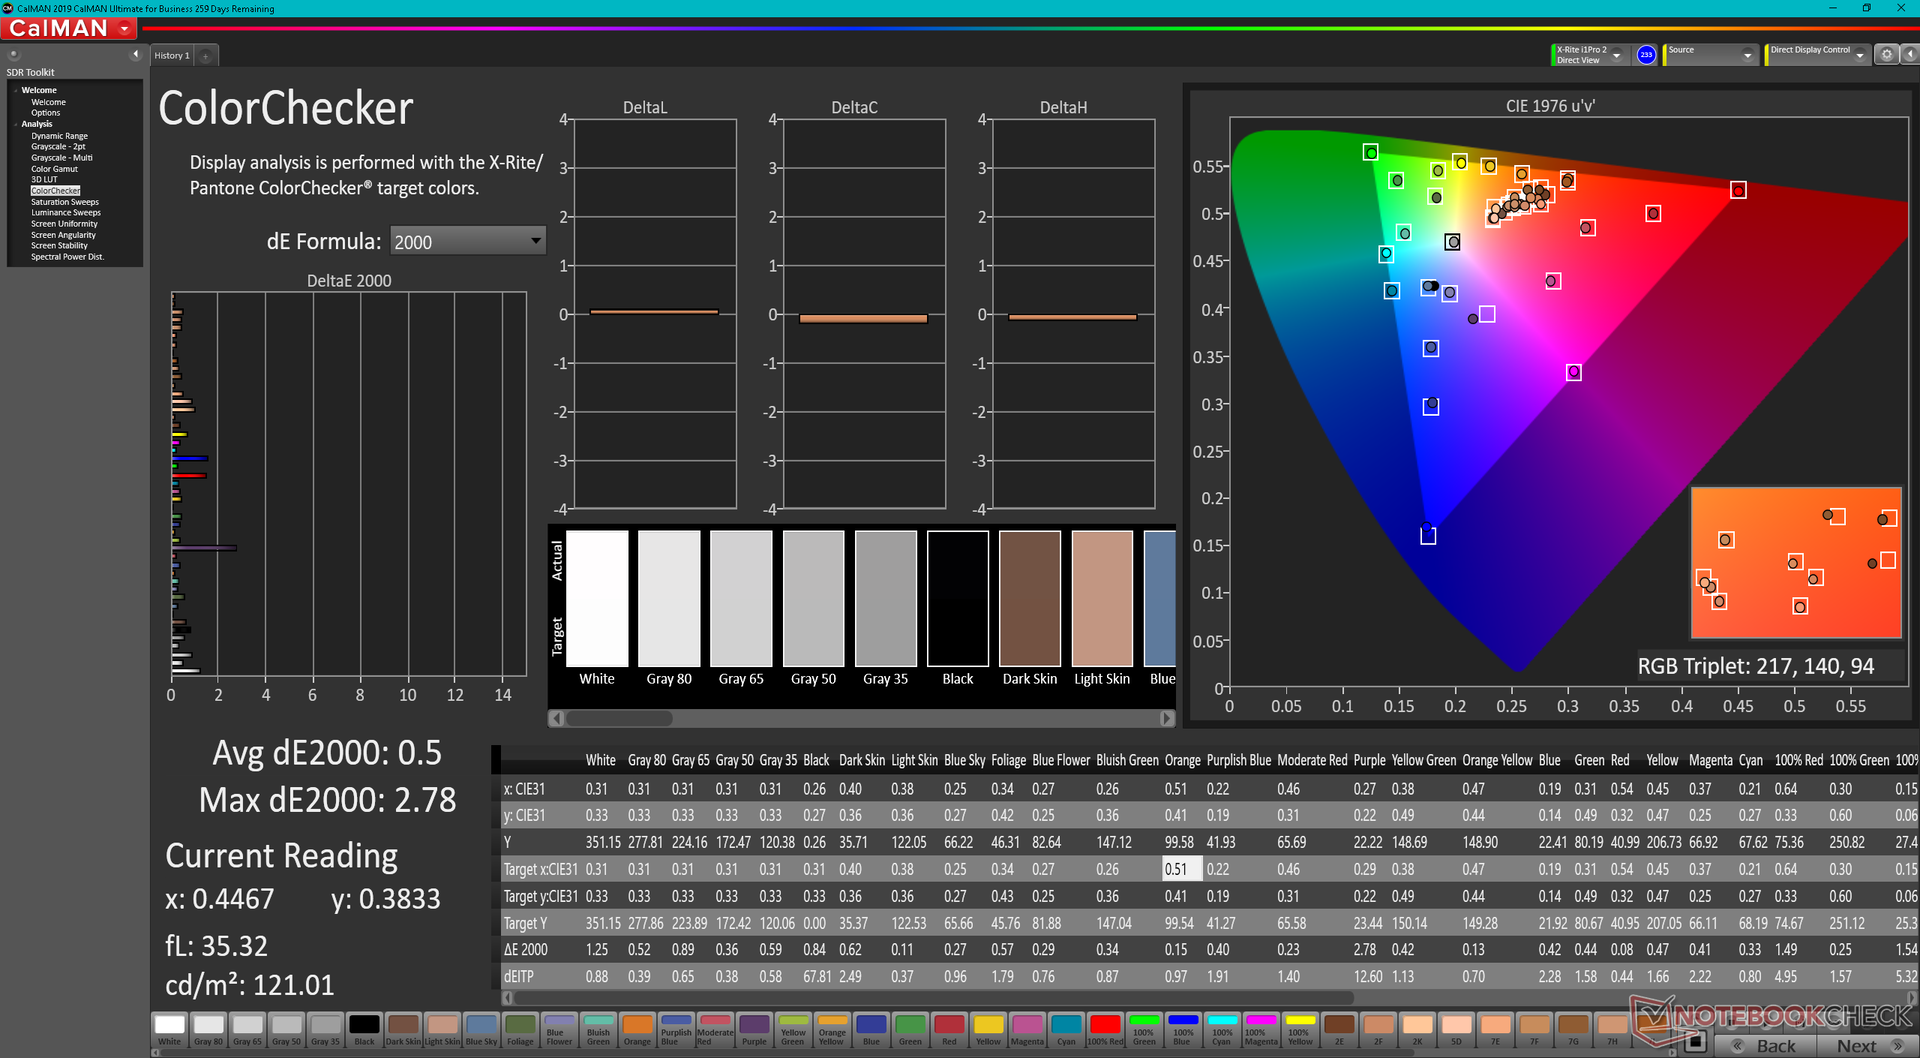
Ekran, sırasıyla yalnızca 2,1 ve 1,74 ortalama gri tonlama ve renk deltaE değerleriyle kutudan çıktığı haliyle iyi kalibre edilmiştir. Ekranı bir X-Rite kolorimetre ile daha da kalibre etmek, deltaE'yi her birini 1'den daha fazla iyileştirir.
Yanıt Sürelerini Görüntüle
| ↔ Tepki Süresi Siyahtan Beyaza | ||
|---|---|---|
| 12.8 ms ... yükseliş ↗ ve sonbahar↘ birleşimi | ↗ 6.8 ms yükseliş | 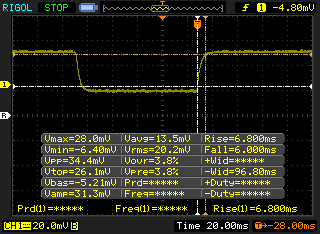 |
| ↘ 6 ms sonbahar | ||
| Ekran, testlerimizde iyi yanıt oranları gösteriyor ancak rekabetçi oyuncular için çok yavaş olabilir. Karşılaştırıldığında, test edilen tüm cihazlar 0.1 (minimum) ile 240 (maksimum) ms arasında değişir. » Tüm cihazların 33 %'si daha iyi. Bu, ölçülen yanıt süresinin test edilen tüm cihazların ortalamasından (19.8 ms) daha iyi olduğu anlamına gelir. | ||
| ↔ Tepki Süresi %50 Griden %80 Griye | ||
| 5.6 ms ... yükseliş ↗ ve sonbahar↘ birleşimi | ↗ 3.2 ms yükseliş | 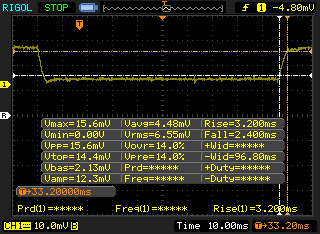 |
| ↘ 2.4 ms sonbahar | ||
| Ekran, testlerimizde çok hızlı yanıt oranları gösteriyor ve hızlı oyun oynamaya çok uygun olmalı. Karşılaştırıldığında, test edilen tüm cihazlar 0.165 (minimum) ile 636 (maksimum) ms arasında değişir. » Tüm cihazların 18 %'si daha iyi. Bu, ölçülen yanıt süresinin test edilen tüm cihazların ortalamasından (31 ms) daha iyi olduğu anlamına gelir. | ||
Ekran Titremesi / PWM (Darbe Genişliği Modülasyonu)
| Ekran titriyor / PWM algılanmadı | 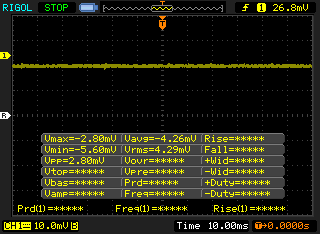 | ||
Karşılaştırıldığında: Test edilen tüm cihazların %52 %'si ekranı karartmak için PWM kullanmıyor. PWM tespit edilirse, ortalama 7778 (minimum: 5 - maksimum: 343500) Hz ölçüldü. | |||

Performans — Intel 12. Nesil Farkı
Test Koşulları
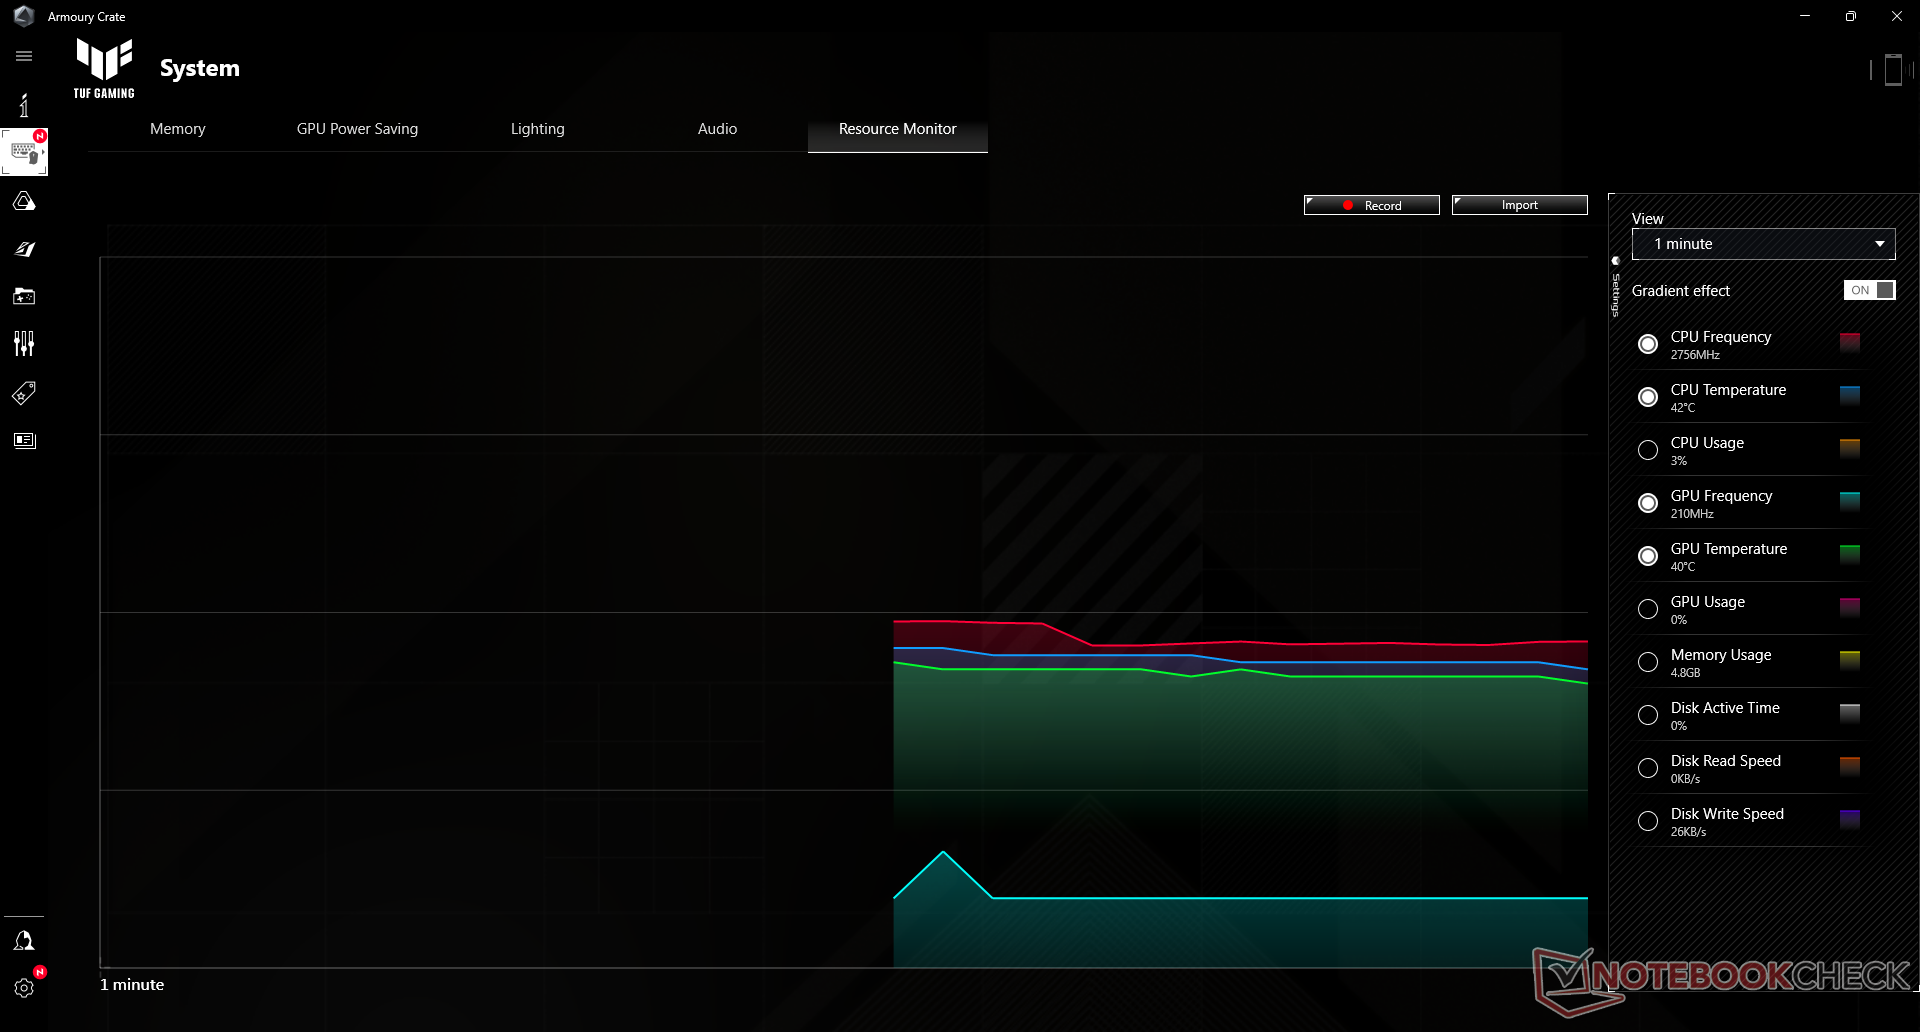
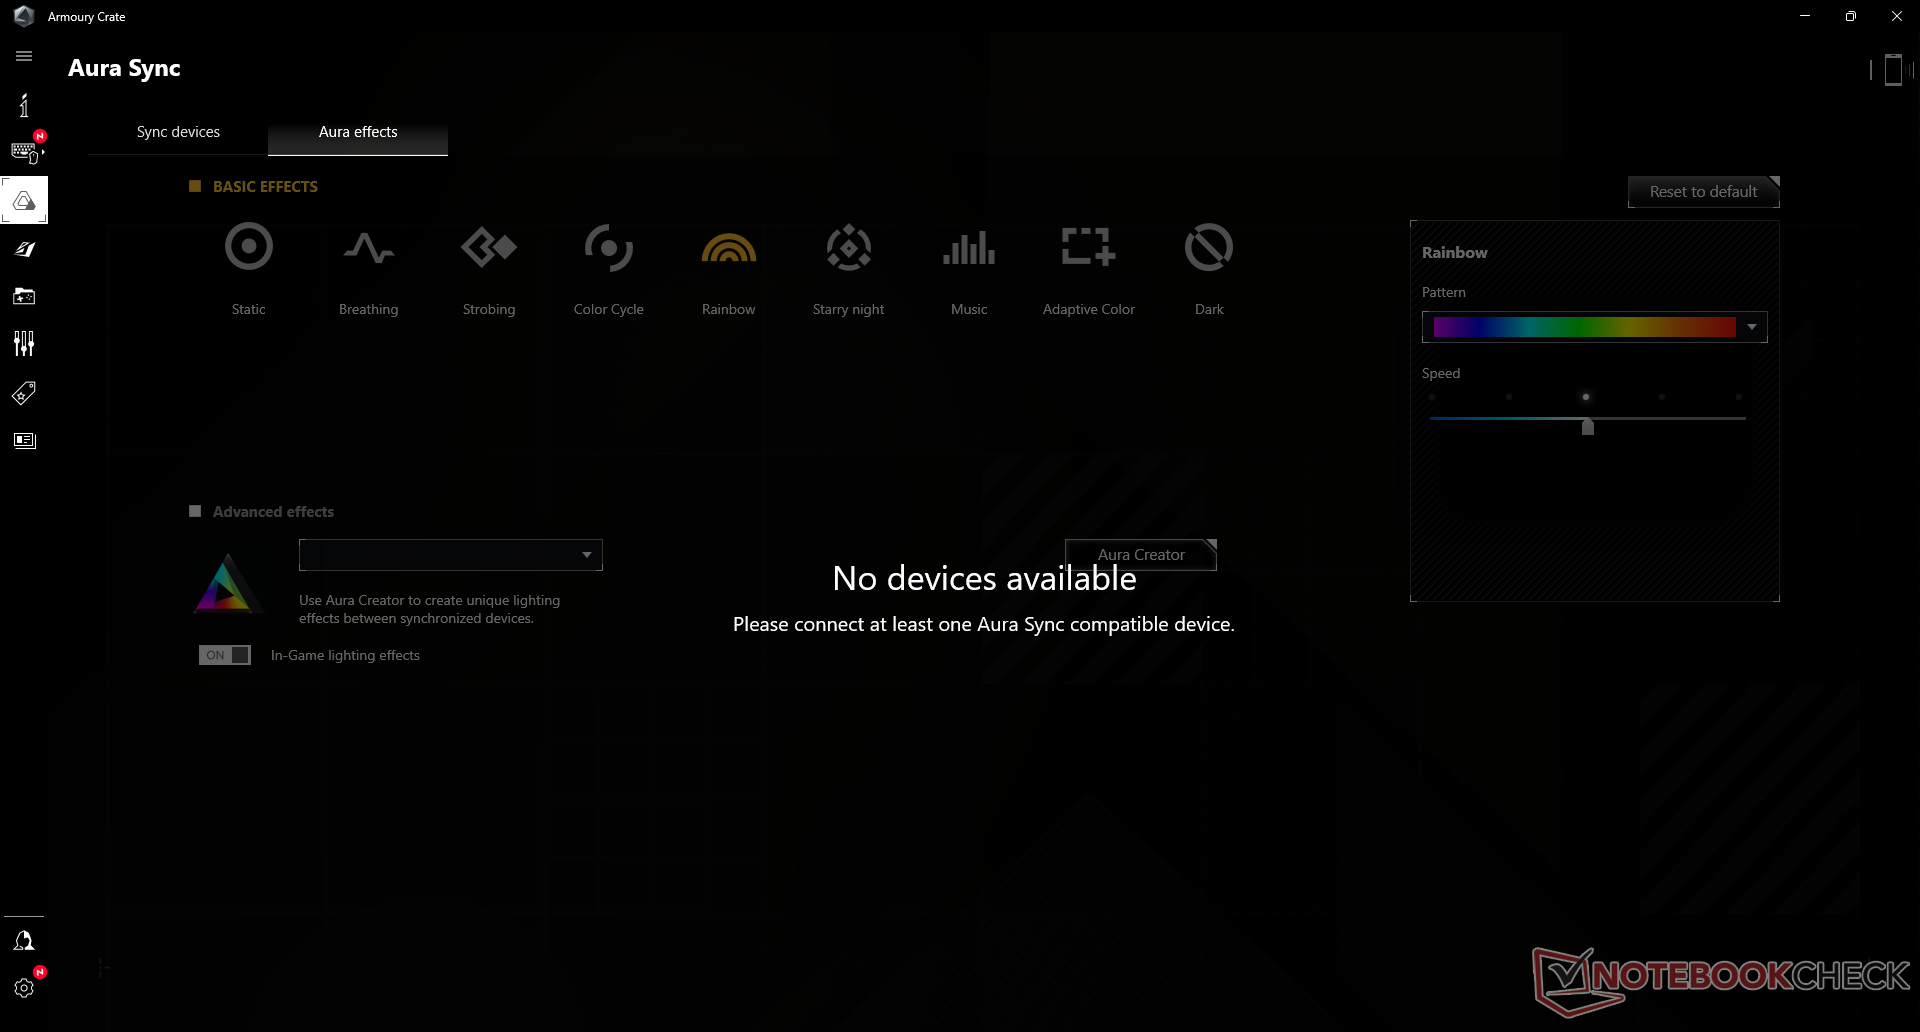
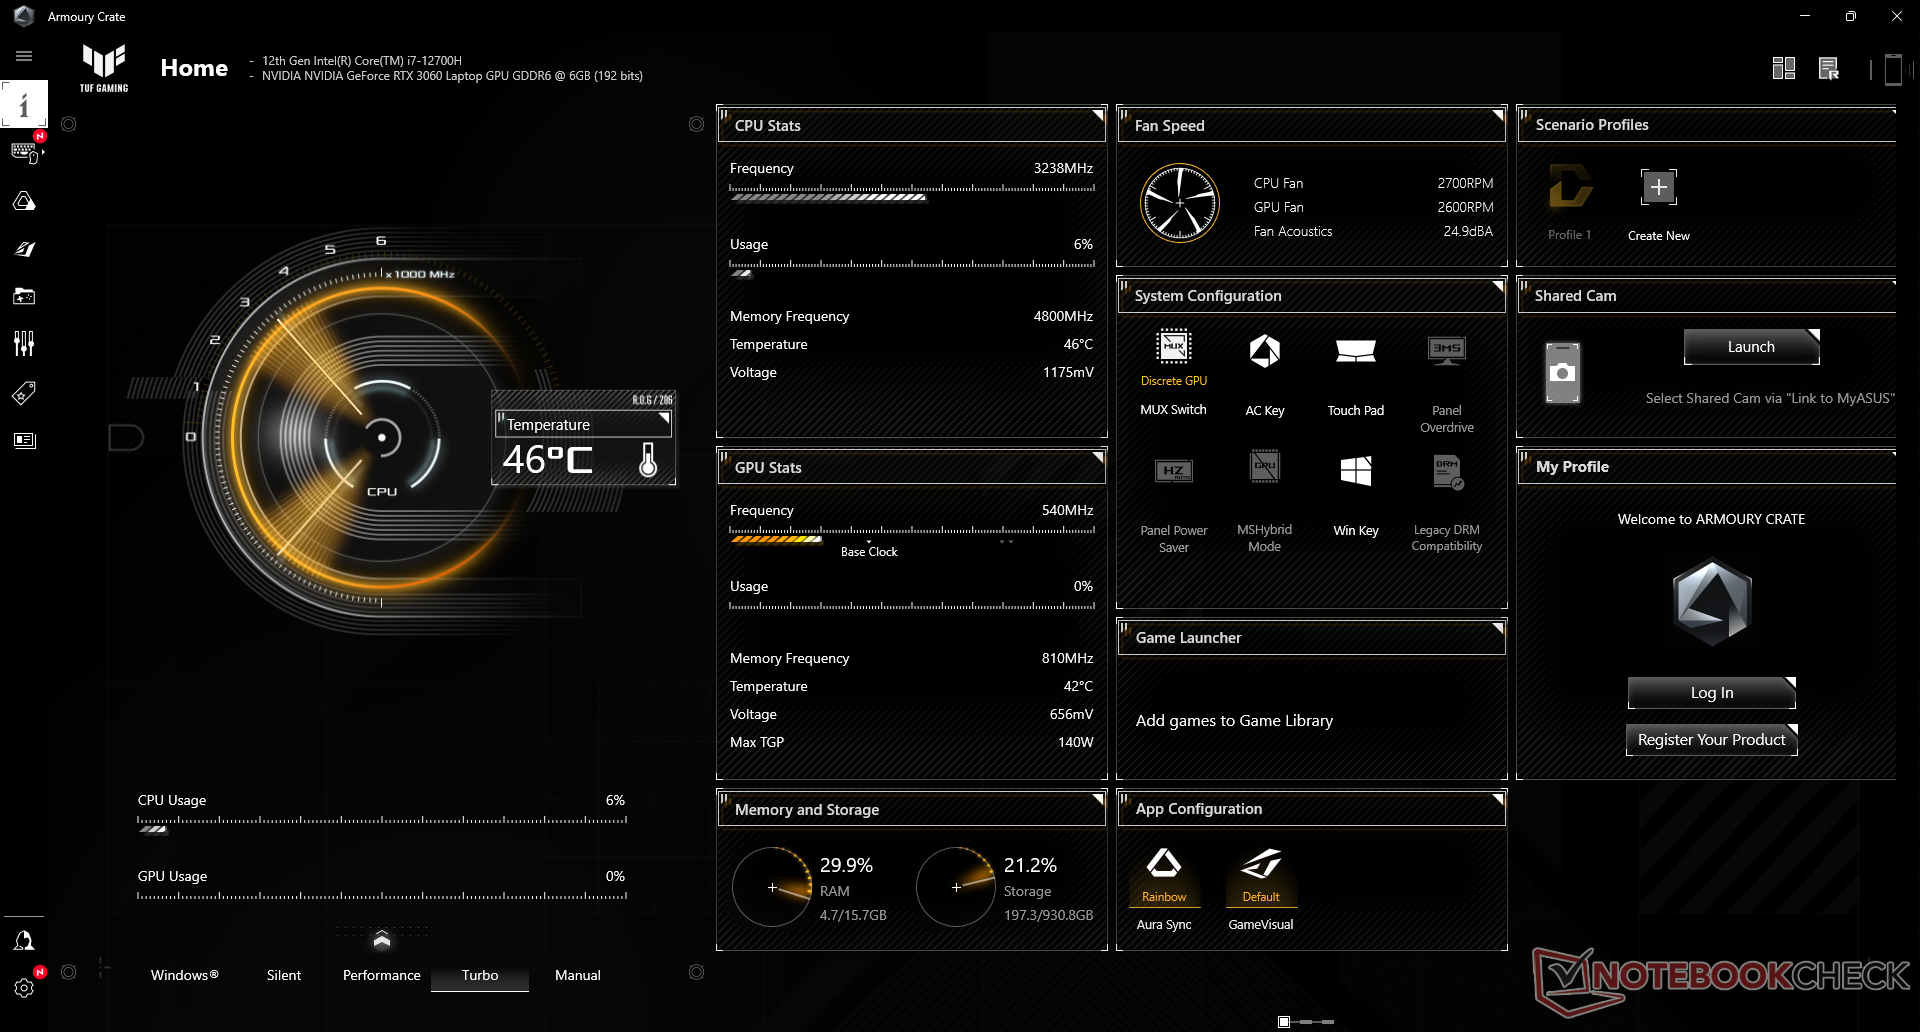
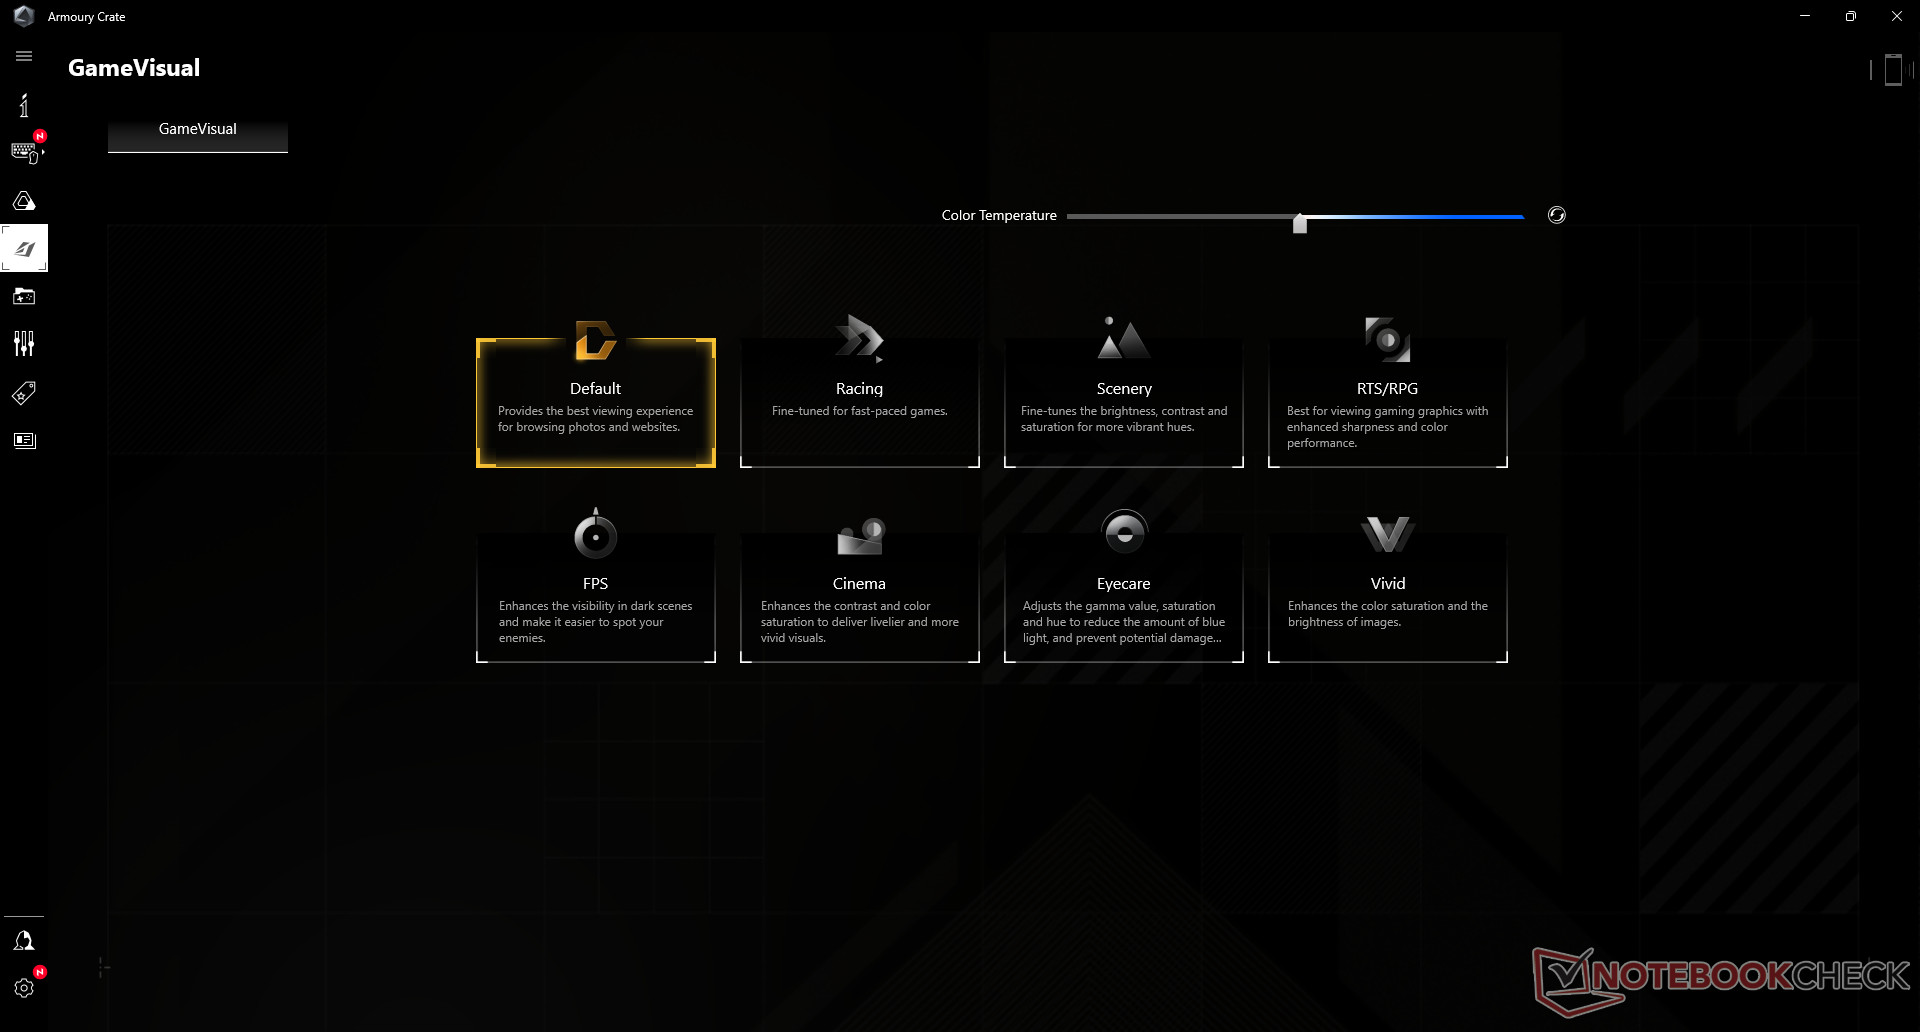
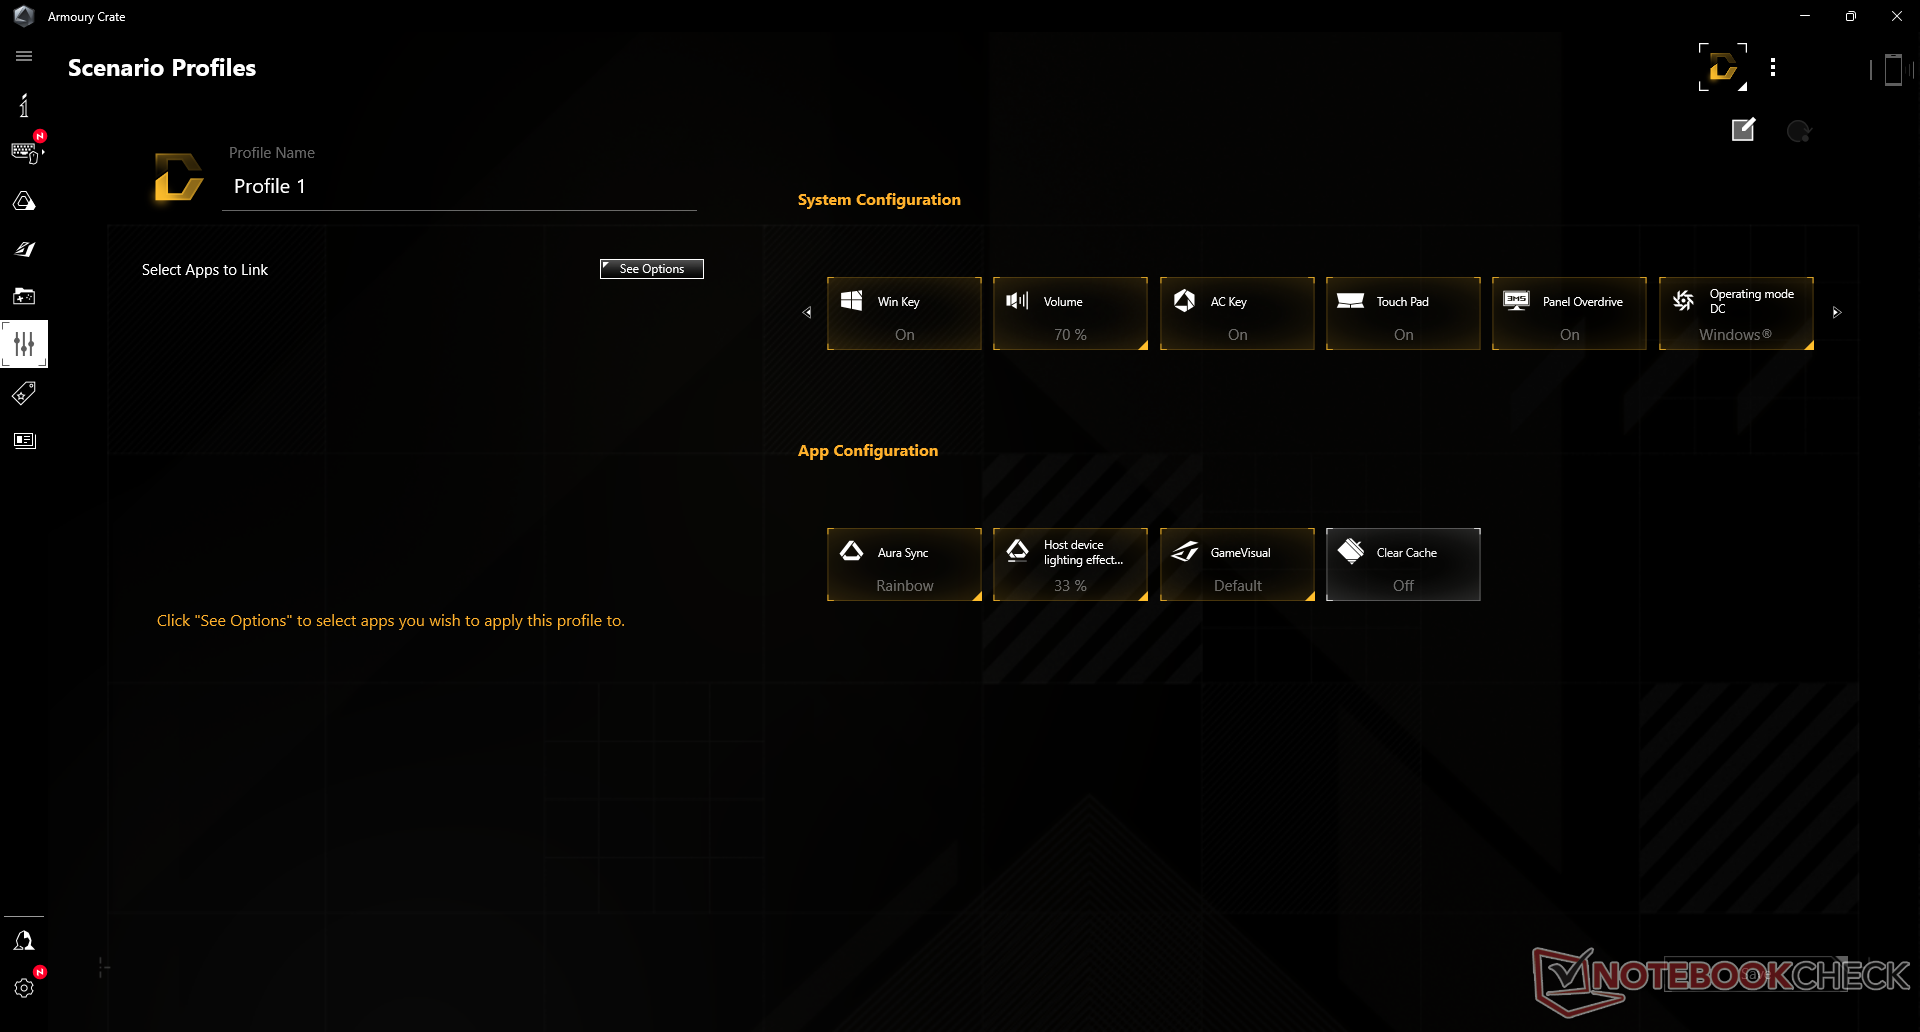
Birimimiz, aşağıdaki performans karşılaştırmalarını çalıştırmadan önce önceden yüklenmiş Armory Crate profili aracılığıyla Turbo moduna ve ayrı ekran kartı moduna ayarlandı. Performansı izlemek, yardımcı özellikleri değiştirmek ve performans profilleri arasında geçiş yapmak için bir merkez görevi gördüğünden, sahiplerinin bu yazılıma aşina olmaları önerilir. En önemlisi, kullanıcılar doğrudan yazılım aracılığıyla MSHybrid veya MUX grafik modları arasında geçiş yapabilir. Önceki FX506 modelinde MUX anahtarı yoktu.
Advanced Optimus desteklenmez, yani ayrık veya Optimus grafikleri arasında geçiş yaparken yumuşak bir yeniden başlatma gerekir. Adaptive Sync'in dahili ekranda çalışması için, harici ekran kartı MUX modu Adaptive Sync'i desteklemediğinden, kullanıcıların MSHybrid modunda çalışması gerekir. G-Sync ve FreeSync, HDMI yerine USB-C DisplayPort üzerinden bağlı olduğu sürece ekran kartı modundan bağımsız olarak desteklenen bir harici monitörde etkinleştirilebilir.
İşlemci TDP ve ekran kartı TGP hedefleri, aşağıdaki tabloda detaylandırıldığı gibi Armory Crate güç profiline bağlı olarak değişecektir. Bu nedenle, sahipleri FX507'den en fazla gücü elde etmek için sistemi Turbo veya Manuel modlarda çalıştırmalıdır.
| Güç Profili | Sessiz | Verim | Turbo | Manuel |
| Hedef İşlemci PL1 | 45 W | 70 W | 90 W | 100 W |
| Hedef İşlemci PL2 | 60 W | 105 W | 115 W | 135 W |
| Hedef Ekran Kartı TGP | <115 W (WhisperMode 2.0 açık) | 100 W + 15 W | 115 W + 25 W | 115 W + 25 W |
| Hedef Maks TDP+TGP | 25 W + <100 W (WhisperMode 2.0 açık) | 35 W + 100 W | 45 W + 115 W | 45 W + 115 W |
| Hedef dB(A) (Üretici Tarafından Sağlanır) | <35 dB(A) | 40 dB(A) | 48 dB(A) | 52 dB(A) |
İşlemci
İşlemci performansı mükemmel ve tam olarak aynı işlemciye sahip diğer dizüstü bilgisayarlara göre olmasını beklediğimiz yerde. Geçen yılki FX506'daki Core i7-11800H ile karşılaştırıldığında, Core i7-12700H sırasıyla yüzde 17 ve yüzde 30 daha hızlı tek iş parçacığı ve çoklu iş parçacığı performansı sunabilir. Genel performans , Razer Blade 15'te bulunan Core i7-12800H'nin önündeyken , daha pahalı Core i9-12900H ile esasen eşitti.
CineBench R15 xT'yi bir döngüde çalıştırırken 2735 puanlık ilk puanımız yalnızca birkaç yüzde puanı düşeceğinden, Turbo Boost sürdürülebilirliği iyidir.
Cinebench R15 Multi Loop
Cinebench R23: Multi Core | Single Core
Cinebench R15: CPU Multi 64Bit | CPU Single 64Bit
Blender: v2.79 BMW27 CPU
7-Zip 18.03: 7z b 4 | 7z b 4 -mmt1
Geekbench 5.5: Multi-Core | Single-Core
HWBOT x265 Benchmark v2.2: 4k Preset
LibreOffice : 20 Documents To PDF
R Benchmark 2.5: Overall mean
| Cinebench R20 / CPU (Multi Core) | |
| Corsair One i300 | |
| Asus TUF Gaming F15 FX507ZM | |
| MSI Vector GP66 12UGS | |
| Ortalama Intel Core i7-12700H (1576 - 7407, n=64) | |
| Razer Blade 15 2022 | |
| Asus TUF Gaming F15 FX506HM | |
| Schenker XMG Apex 15 NH57E PS | |
| MSI Delta 15 A5EFK | |
| Alienware m15 R4 RTX 3080 | |
| Asus VivoBook 15 Pro M3500QC-L1062 | |
| Acer Predator Helios 300 PH315-53-786B | |
| Schenker XMG Pro 15 | |
| Cinebench R20 / CPU (Single Core) | |
| Corsair One i300 | |
| MSI Vector GP66 12UGS | |
| Razer Blade 15 2022 | |
| Asus TUF Gaming F15 FX507ZM | |
| Ortalama Intel Core i7-12700H (300 - 704, n=64) | |
| Asus TUF Gaming F15 FX506HM | |
| MSI Delta 15 A5EFK | |
| Schenker XMG Apex 15 NH57E PS | |
| Asus VivoBook 15 Pro M3500QC-L1062 | |
| Alienware m15 R4 RTX 3080 | |
| Acer Predator Helios 300 PH315-53-786B | |
| Schenker XMG Pro 15 | |
| Cinebench R23 / Multi Core | |
| Corsair One i300 | |
| Asus TUF Gaming F15 FX507ZM | |
| MSI Vector GP66 12UGS | |
| Ortalama Intel Core i7-12700H (4032 - 19330, n=64) | |
| Razer Blade 15 2022 | |
| Asus TUF Gaming F15 FX506HM | |
| Schenker XMG Apex 15 NH57E PS | |
| MSI Delta 15 A5EFK | |
| Alienware m15 R4 RTX 3080 | |
| Asus VivoBook 15 Pro M3500QC-L1062 | |
| Acer Predator Helios 300 PH315-53-786B | |
| Cinebench R23 / Single Core | |
| Corsair One i300 | |
| MSI Vector GP66 12UGS | |
| Razer Blade 15 2022 | |
| Asus TUF Gaming F15 FX507ZM | |
| Ortalama Intel Core i7-12700H (778 - 1826, n=63) | |
| Asus TUF Gaming F15 FX506HM | |
| MSI Delta 15 A5EFK | |
| Schenker XMG Apex 15 NH57E PS | |
| Asus VivoBook 15 Pro M3500QC-L1062 | |
| Alienware m15 R4 RTX 3080 | |
| Acer Predator Helios 300 PH315-53-786B | |
| Cinebench R15 / CPU Multi 64Bit | |
| Corsair One i300 | |
| Asus TUF Gaming F15 FX507ZM | |
| Ortalama Intel Core i7-12700H (1379 - 2916, n=70) | |
| MSI Vector GP66 12UGS | |
| Razer Blade 15 2022 | |
| Asus TUF Gaming F15 FX506HM | |
| MSI Delta 15 A5EFK | |
| Schenker XMG Apex 15 NH57E PS | |
| Alienware m15 R4 RTX 3080 | |
| Asus VivoBook 15 Pro M3500QC-L1062 | |
| Asus VivoBook 15 Pro M3500QC-L1062 | |
| Asus VivoBook 15 Pro M3500QC-L1062 | |
| Acer Predator Helios 300 PH315-53-786B | |
| Schenker XMG Pro 15 | |
| Cinebench R15 / CPU Single 64Bit | |
| Corsair One i300 | |
| MSI Vector GP66 12UGS | |
| Razer Blade 15 2022 | |
| Asus TUF Gaming F15 FX507ZM | |
| Ortalama Intel Core i7-12700H (113 - 263, n=65) | |
| MSI Delta 15 A5EFK | |
| Schenker XMG Apex 15 NH57E PS | |
| Asus TUF Gaming F15 FX506HM | |
| Asus VivoBook 15 Pro M3500QC-L1062 | |
| Alienware m15 R4 RTX 3080 | |
| Acer Predator Helios 300 PH315-53-786B | |
| Schenker XMG Pro 15 | |
| Blender / v2.79 BMW27 CPU | |
| Schenker XMG Pro 15 | |
| Acer Predator Helios 300 PH315-53-786B | |
| Asus VivoBook 15 Pro M3500QC-L1062 | |
| Alienware m15 R4 RTX 3080 | |
| Schenker XMG Apex 15 NH57E PS | |
| MSI Delta 15 A5EFK | |
| Asus TUF Gaming F15 FX506HM | |
| Razer Blade 15 2022 | |
| Ortalama Intel Core i7-12700H (168 - 732, n=63) | |
| MSI Vector GP66 12UGS | |
| Asus TUF Gaming F15 FX507ZM | |
| Corsair One i300 | |
| 7-Zip 18.03 / 7z b 4 | |
| Corsair One i300 | |
| Asus TUF Gaming F15 FX507ZM | |
| MSI Vector GP66 12UGS | |
| Razer Blade 15 2022 | |
| Ortalama Intel Core i7-12700H (22844 - 73067, n=63) | |
| MSI Delta 15 A5EFK | |
| Schenker XMG Apex 15 NH57E PS | |
| Asus TUF Gaming F15 FX506HM | |
| Alienware m15 R4 RTX 3080 | |
| Asus VivoBook 15 Pro M3500QC-L1062 | |
| Acer Predator Helios 300 PH315-53-786B | |
| Schenker XMG Pro 15 | |
| 7-Zip 18.03 / 7z b 4 -mmt1 | |
| Corsair One i300 | |
| MSI Vector GP66 12UGS | |
| MSI Delta 15 A5EFK | |
| Razer Blade 15 2022 | |
| Asus TUF Gaming F15 FX506HM | |
| Ortalama Intel Core i7-12700H (2743 - 5972, n=63) | |
| Schenker XMG Apex 15 NH57E PS | |
| Asus VivoBook 15 Pro M3500QC-L1062 | |
| Asus TUF Gaming F15 FX507ZM | |
| Alienware m15 R4 RTX 3080 | |
| Acer Predator Helios 300 PH315-53-786B | |
| Schenker XMG Pro 15 | |
| Geekbench 5.5 / Multi-Core | |
| Corsair One i300 | |
| Razer Blade 15 2022 | |
| MSI Vector GP66 12UGS | |
| Asus TUF Gaming F15 FX507ZM | |
| Ortalama Intel Core i7-12700H (5144 - 13745, n=64) | |
| MSI Delta 15 A5EFK | |
| Schenker XMG Apex 15 NH57E PS | |
| Alienware m15 R4 RTX 3080 | |
| Asus VivoBook 15 Pro M3500QC-L1062 | |
| Acer Predator Helios 300 PH315-53-786B | |
| Schenker XMG Pro 15 | |
| Geekbench 5.5 / Single-Core | |
| Corsair One i300 | |
| MSI Vector GP66 12UGS | |
| Razer Blade 15 2022 | |
| Asus TUF Gaming F15 FX507ZM | |
| Ortalama Intel Core i7-12700H (803 - 1851, n=64) | |
| MSI Delta 15 A5EFK | |
| Schenker XMG Apex 15 NH57E PS | |
| Asus VivoBook 15 Pro M3500QC-L1062 | |
| Alienware m15 R4 RTX 3080 | |
| Acer Predator Helios 300 PH315-53-786B | |
| Schenker XMG Pro 15 | |
| HWBOT x265 Benchmark v2.2 / 4k Preset | |
| Corsair One i300 | |
| Asus TUF Gaming F15 FX507ZM | |
| MSI Vector GP66 12UGS | |
| Razer Blade 15 2022 | |
| Ortalama Intel Core i7-12700H (4.67 - 21.8, n=64) | |
| Asus TUF Gaming F15 FX506HM | |
| MSI Delta 15 A5EFK | |
| Schenker XMG Apex 15 NH57E PS | |
| Alienware m15 R4 RTX 3080 | |
| Asus VivoBook 15 Pro M3500QC-L1062 | |
| Acer Predator Helios 300 PH315-53-786B | |
| Schenker XMG Pro 15 | |
| LibreOffice / 20 Documents To PDF | |
| Alienware m15 R4 RTX 3080 | |
| Asus VivoBook 15 Pro M3500QC-L1062 | |
| Schenker XMG Apex 15 NH57E PS | |
| MSI Delta 15 A5EFK | |
| Razer Blade 15 2022 | |
| Asus TUF Gaming F15 FX507ZM | |
| Ortalama Intel Core i7-12700H (34.2 - 95.3, n=63) | |
| Acer Predator Helios 300 PH315-53-786B | |
| Asus TUF Gaming F15 FX506HM | |
| MSI Vector GP66 12UGS | |
| Corsair One i300 | |
| R Benchmark 2.5 / Overall mean | |
| Schenker XMG Pro 15 | |
| Acer Predator Helios 300 PH315-53-786B | |
| Alienware m15 R4 RTX 3080 | |
| Asus TUF Gaming F15 FX506HM | |
| Asus VivoBook 15 Pro M3500QC-L1062 | |
| Schenker XMG Apex 15 NH57E PS | |
| MSI Delta 15 A5EFK | |
| Ortalama Intel Core i7-12700H (0.4441 - 1.052, n=63) | |
| Razer Blade 15 2022 | |
| Asus TUF Gaming F15 FX507ZM | |
| MSI Vector GP66 12UGS | |
| Corsair One i300 | |
* ... daha küçük daha iyidir
AIDA64: FP32 Ray-Trace | FPU Julia | CPU SHA3 | CPU Queen | FPU SinJulia | FPU Mandel | CPU AES | CPU ZLib | FP64 Ray-Trace | CPU PhotoWorxx
| Performance rating | |
| Asus ROG Strix Scar 15 G533QS | |
| Ortalama Intel Core i7-12700H | |
| Asus Zephyrus S15 GX502L | |
| Asus TUF Gaming F15 FX507ZM | |
| Asus ZenBook Pro Duo UX582 LR-1BH2 | |
| Asus TUF Dash F15 FX516PR | |
| Asus TUF Gaming F15 FX506HM -9! | |
| AIDA64 / FP32 Ray-Trace | |
| Asus ROG Strix Scar 15 G533QS | |
| Asus Zephyrus S15 GX502L | |
| Asus ZenBook Pro Duo UX582 LR-1BH2 | |
| Ortalama Intel Core i7-12700H (2585 - 17957, n=64) | |
| Asus TUF Gaming F15 FX507ZM | |
| Asus TUF Dash F15 FX516PR | |
| AIDA64 / FPU Julia | |
| Asus ROG Strix Scar 15 G533QS | |
| Asus Zephyrus S15 GX502L | |
| Asus ZenBook Pro Duo UX582 LR-1BH2 | |
| Ortalama Intel Core i7-12700H (12439 - 90760, n=64) | |
| Asus TUF Gaming F15 FX507ZM | |
| Asus TUF Dash F15 FX516PR | |
| AIDA64 / CPU SHA3 | |
| Asus ROG Strix Scar 15 G533QS | |
| Asus TUF Gaming F15 FX507ZM | |
| Asus Zephyrus S15 GX502L | |
| Ortalama Intel Core i7-12700H (833 - 4242, n=64) | |
| Asus ZenBook Pro Duo UX582 LR-1BH2 | |
| Asus TUF Dash F15 FX516PR | |
| AIDA64 / CPU Queen | |
| Asus ROG Strix Scar 15 G533QS | |
| Asus TUF Gaming F15 FX507ZM | |
| Ortalama Intel Core i7-12700H (57923 - 103202, n=63) | |
| Asus Zephyrus S15 GX502L | |
| Asus ZenBook Pro Duo UX582 LR-1BH2 | |
| Asus TUF Dash F15 FX516PR | |
| AIDA64 / FPU SinJulia | |
| Asus ROG Strix Scar 15 G533QS | |
| Asus Zephyrus S15 GX502L | |
| Asus TUF Gaming F15 FX507ZM | |
| Asus ZenBook Pro Duo UX582 LR-1BH2 | |
| Ortalama Intel Core i7-12700H (3249 - 9939, n=64) | |
| Asus TUF Dash F15 FX516PR | |
| AIDA64 / FPU Mandel | |
| Asus ROG Strix Scar 15 G533QS | |
| Asus Zephyrus S15 GX502L | |
| Asus ZenBook Pro Duo UX582 LR-1BH2 | |
| Ortalama Intel Core i7-12700H (7135 - 44760, n=64) | |
| Asus TUF Gaming F15 FX507ZM | |
| Asus TUF Dash F15 FX516PR | |
| AIDA64 / CPU AES | |
| Asus ROG Strix Scar 15 G533QS | |
| Ortalama Intel Core i7-12700H (31839 - 144360, n=64) | |
| Asus TUF Dash F15 FX516PR | |
| Asus TUF Gaming F15 FX507ZM | |
| Asus Zephyrus S15 GX502L | |
| Asus ZenBook Pro Duo UX582 LR-1BH2 | |
| AIDA64 / CPU ZLib | |
| Asus TUF Gaming F15 FX507ZM | |
| Ortalama Intel Core i7-12700H (305 - 1171, n=64) | |
| Asus ROG Strix Scar 15 G533QS | |
| Asus Zephyrus S15 GX502L | |
| Asus ZenBook Pro Duo UX582 LR-1BH2 | |
| Asus TUF Dash F15 FX516PR | |
| Asus TUF Gaming F15 FX506HM | |
| AIDA64 / FP64 Ray-Trace | |
| Asus ROG Strix Scar 15 G533QS | |
| Asus Zephyrus S15 GX502L | |
| Asus ZenBook Pro Duo UX582 LR-1BH2 | |
| Ortalama Intel Core i7-12700H (1437 - 9692, n=64) | |
| Asus TUF Gaming F15 FX507ZM | |
| Asus TUF Dash F15 FX516PR | |
| AIDA64 / CPU PhotoWorxx | |
| Asus TUF Gaming F15 FX507ZM | |
| Ortalama Intel Core i7-12700H (12863 - 52207, n=64) | |
| Asus ROG Strix Scar 15 G533QS | |
| Asus Zephyrus S15 GX502L | |
| Asus TUF Dash F15 FX516PR | |
| Asus ZenBook Pro Duo UX582 LR-1BH2 | |
Sistem performansı
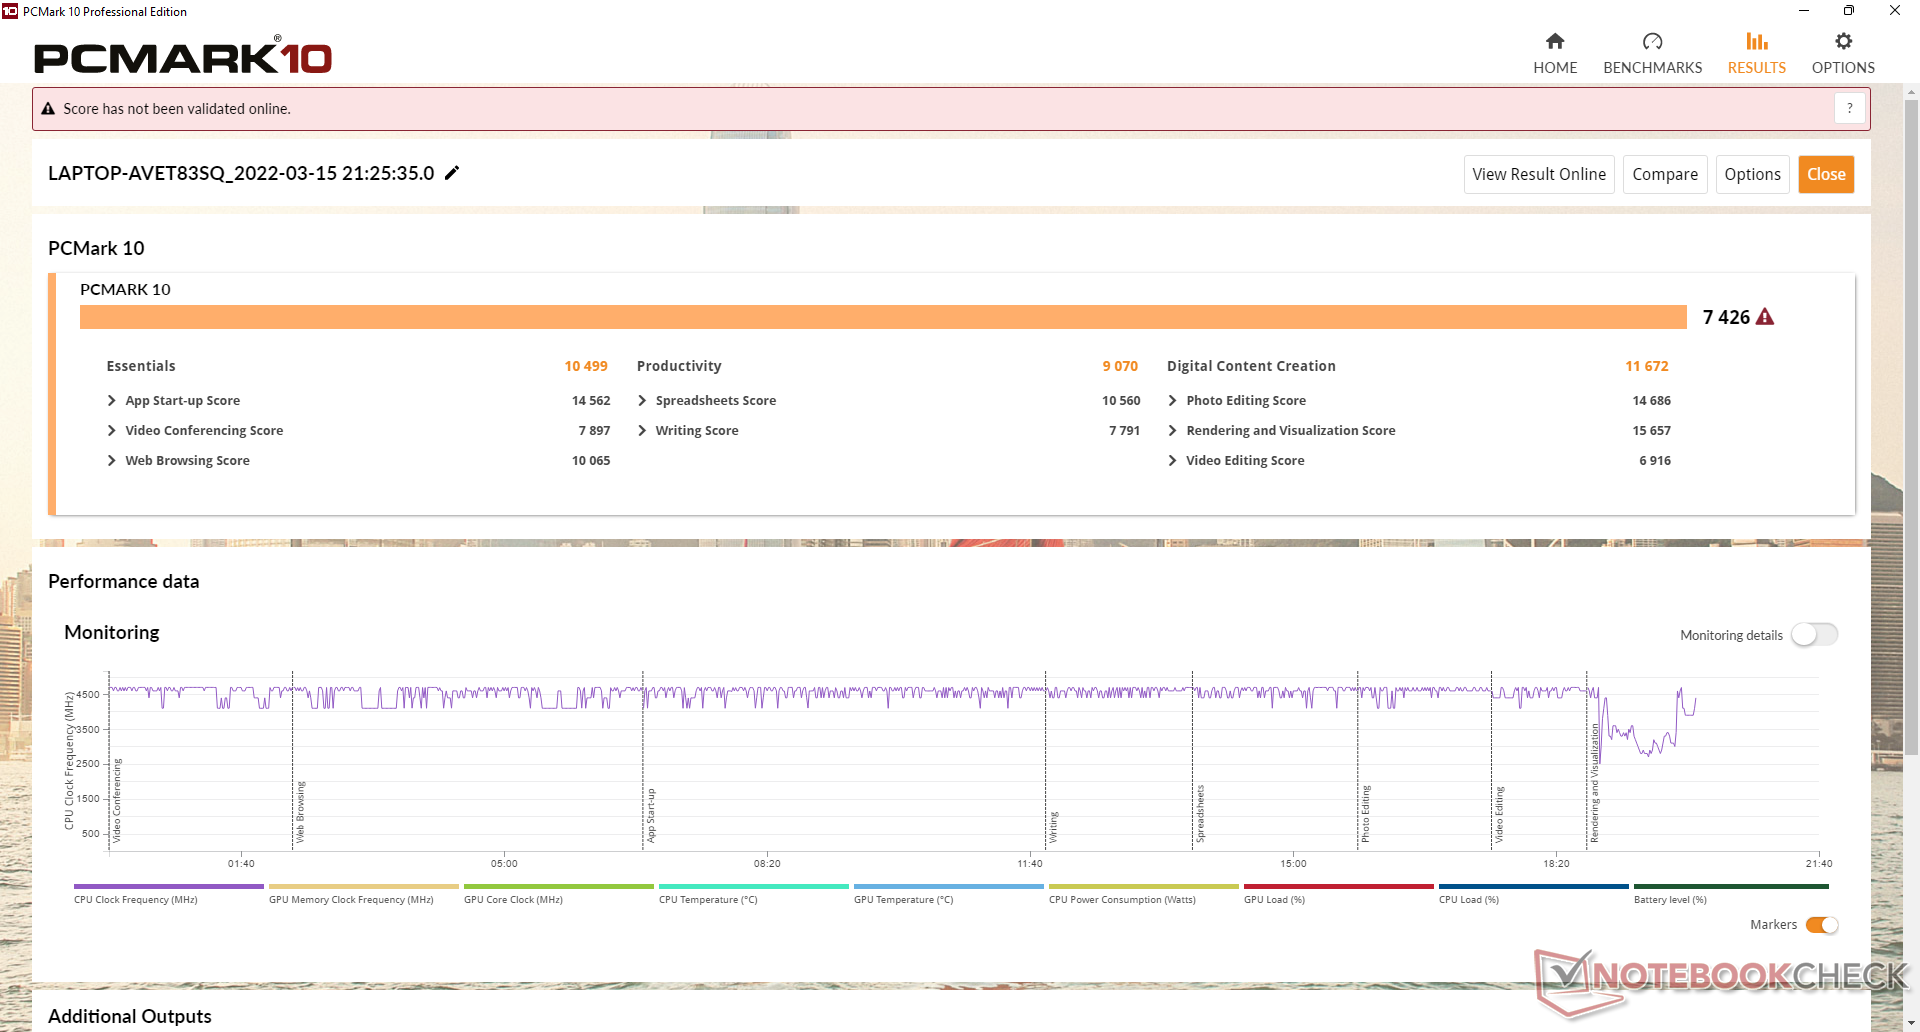
PCMark 10 sonuçları esasen FX506 ile aynıdır, yani işlemci ve ekran kartı yükseltmelerine rağmen günlük aktivitelerin daha hızlı hissetmeyeceği anlamına gelir. Dijital İçerik Oluşturma alt testi, büyük olasılıkla eski RTX 3060'a göre daha hızlı ekran kartı saat hızları nedeniyle belirgin şekilde daha yüksektir.
| PCMark 10 / Score | |
| Asus TUF Gaming F15 FX507ZM | |
| Ortalama Intel Core i7-12700H, NVIDIA GeForce RTX 3060 Laptop GPU (5986 - 8156, n=12) | |
| Asus ROG Strix Scar 15 G533QS | |
| Asus TUF Gaming F15 FX506HM | |
| Asus TUF Dash F15 FX516PR | |
| Asus ZenBook Pro Duo UX582 LR-1BH2 | |
| Asus Zephyrus S15 GX502L | |
| PCMark 10 / Essentials | |
| Ortalama Intel Core i7-12700H, NVIDIA GeForce RTX 3060 Laptop GPU (9289 - 12144, n=12) | |
| Asus TUF Gaming F15 FX506HM | |
| Asus TUF Gaming F15 FX507ZM | |
| Asus ROG Strix Scar 15 G533QS | |
| Asus Zephyrus S15 GX502L | |
| Asus TUF Dash F15 FX516PR | |
| Asus ZenBook Pro Duo UX582 LR-1BH2 | |
| PCMark 10 / Productivity | |
| Asus ROG Strix Scar 15 G533QS | |
| Asus TUF Dash F15 FX516PR | |
| Ortalama Intel Core i7-12700H, NVIDIA GeForce RTX 3060 Laptop GPU (6161 - 10362, n=12) | |
| Asus TUF Gaming F15 FX507ZM | |
| Asus TUF Gaming F15 FX506HM | |
| Asus Zephyrus S15 GX502L | |
| Asus ZenBook Pro Duo UX582 LR-1BH2 | |
| PCMark 10 / Digital Content Creation | |
| Asus TUF Gaming F15 FX507ZM | |
| Ortalama Intel Core i7-12700H, NVIDIA GeForce RTX 3060 Laptop GPU (8950 - 12554, n=12) | |
| Asus ROG Strix Scar 15 G533QS | |
| Asus TUF Gaming F15 FX506HM | |
| Asus ZenBook Pro Duo UX582 LR-1BH2 | |
| Asus TUF Dash F15 FX516PR | |
| Asus Zephyrus S15 GX502L | |
| PCMark 10 Score | 7426 puan | |
Yardım | ||
| AIDA64 / Memory Copy | |
| Ortalama Intel Core i7-12700H (25615 - 80511, n=64) | |
| Asus TUF Gaming F15 FX507ZM | |
| Asus ROG Strix Scar 15 G533QS | |
| Asus Zephyrus S15 GX502L | |
| Asus ZenBook Pro Duo UX582 LR-1BH2 | |
| Asus TUF Dash F15 FX516PR | |
| AIDA64 / Memory Read | |
| Asus TUF Gaming F15 FX507ZM | |
| Ortalama Intel Core i7-12700H (25586 - 79442, n=64) | |
| Asus ROG Strix Scar 15 G533QS | |
| Asus Zephyrus S15 GX502L | |
| Asus ZenBook Pro Duo UX582 LR-1BH2 | |
| Asus TUF Dash F15 FX516PR | |
| AIDA64 / Memory Write | |
| Asus TUF Gaming F15 FX507ZM | |
| Ortalama Intel Core i7-12700H (23679 - 88660, n=64) | |
| Asus ROG Strix Scar 15 G533QS | |
| Asus Zephyrus S15 GX502L | |
| Asus ZenBook Pro Duo UX582 LR-1BH2 | |
| Asus TUF Dash F15 FX516PR | |
| AIDA64 / Memory Latency | |
| Asus TUF Dash F15 FX516PR | |
| Asus ROG Strix Scar 15 G533QS | |
| Ortalama Intel Core i7-12700H (76.2 - 133.9, n=62) | |
| Asus Zephyrus S15 GX502L | |
| Asus ZenBook Pro Duo UX582 LR-1BH2 | |
| Asus TUF Gaming F15 FX506HM | |
| Asus TUF Gaming F15 FX507ZM | |
* ... daha küçük daha iyidir
DPC Gecikmesi
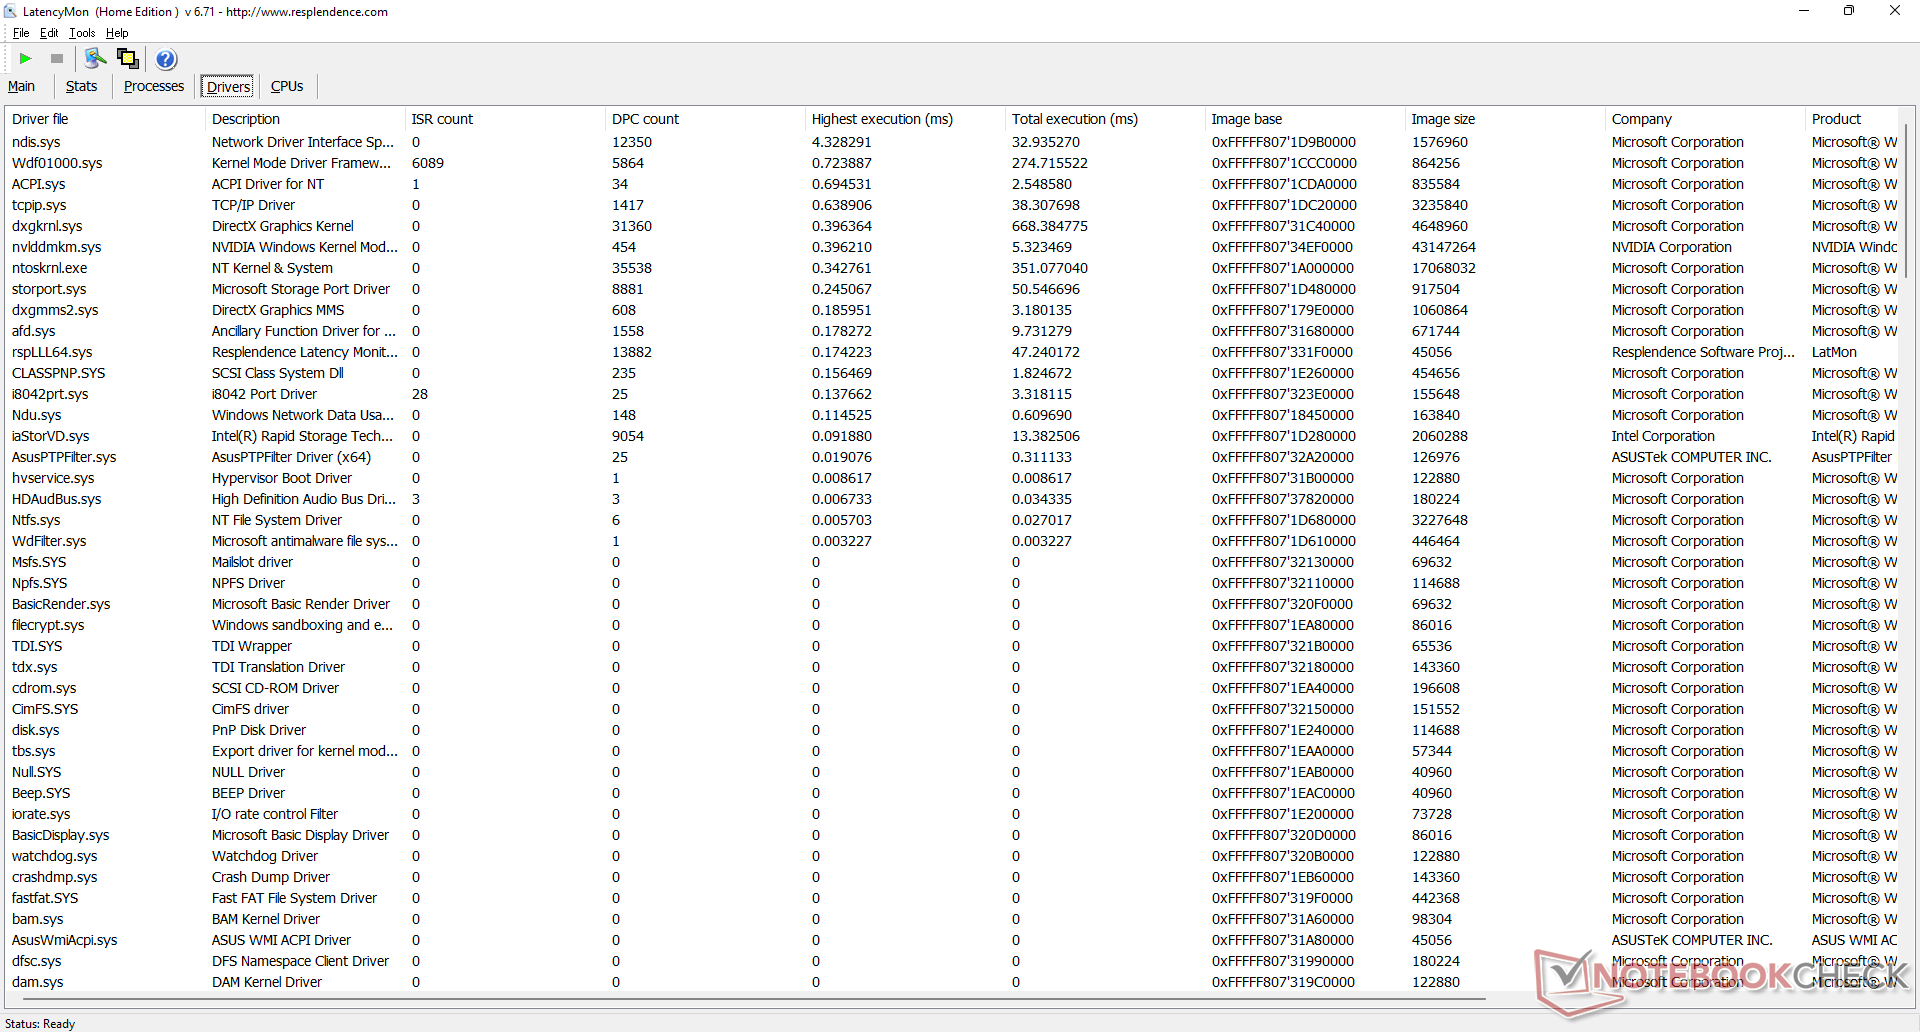
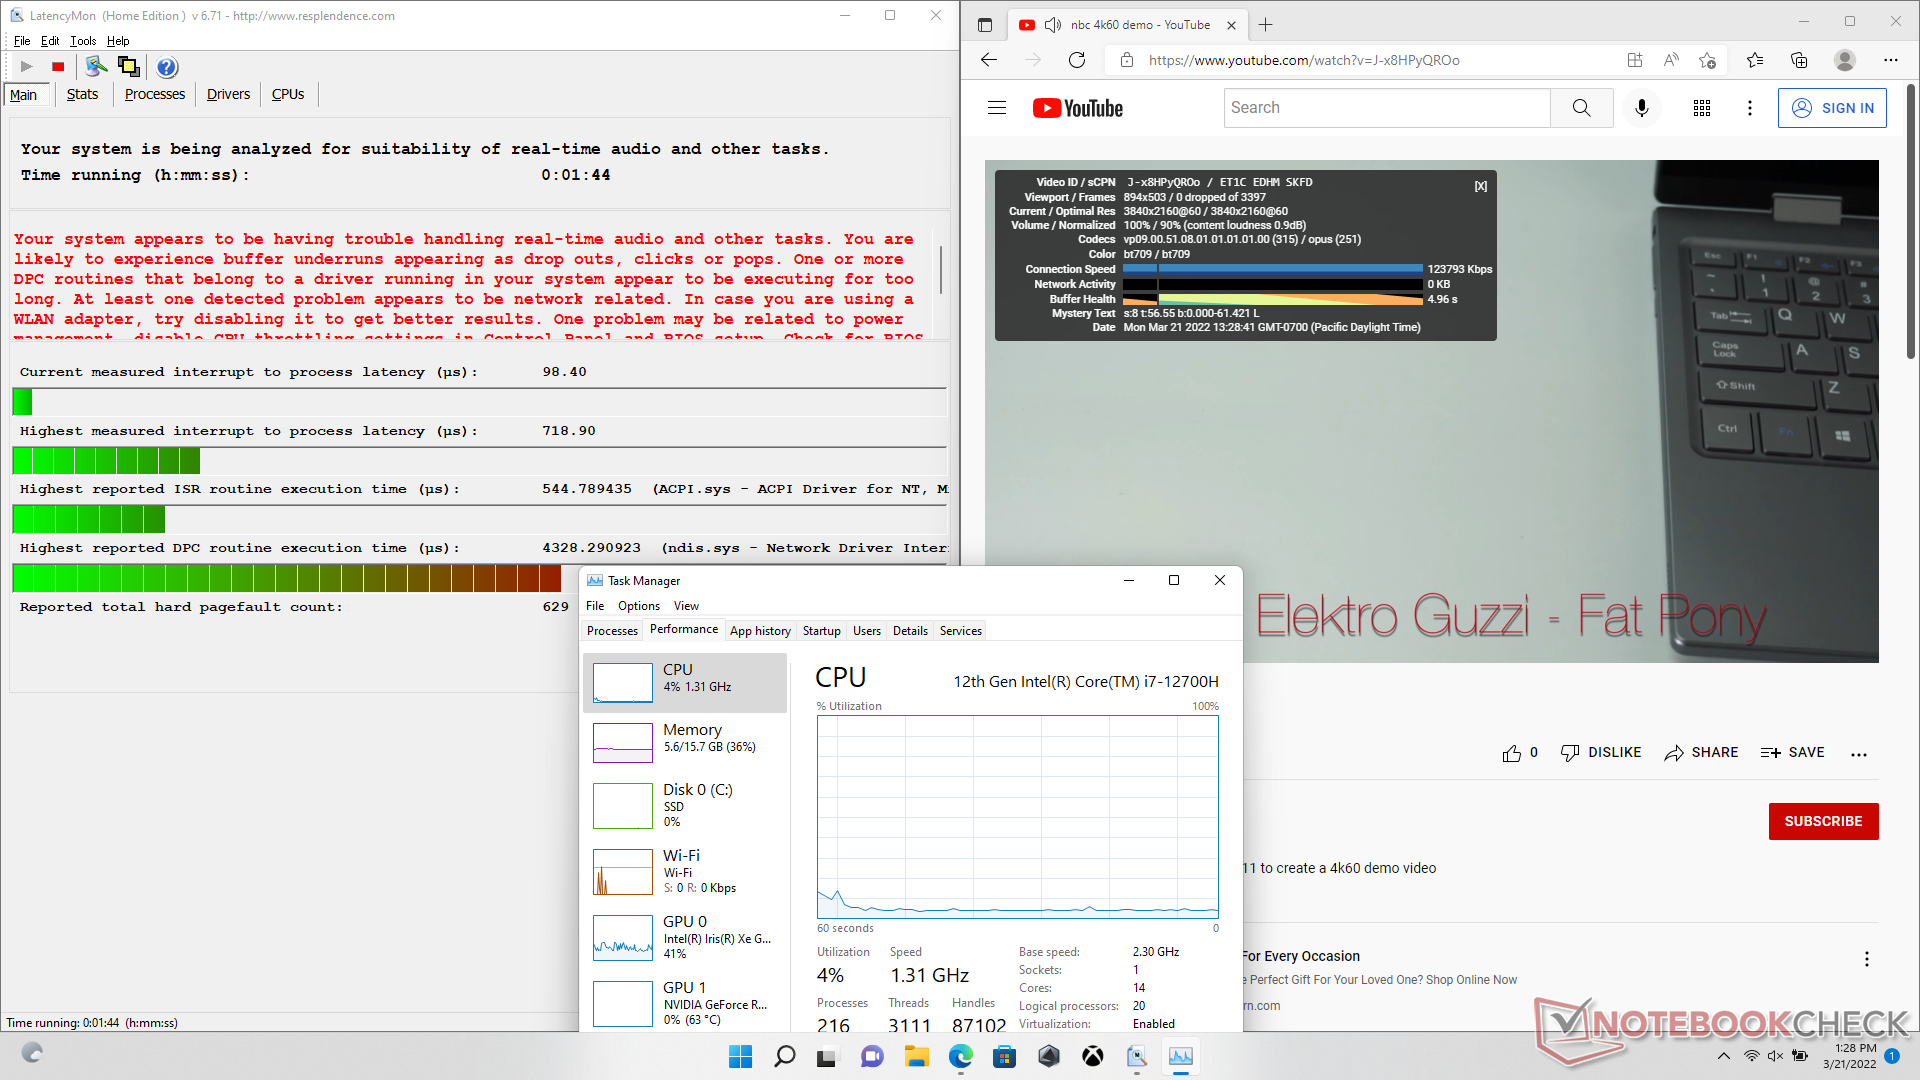
LatencyMon, ana sayfamızın birden çok tarayıcı sekmesini açarken DPC sorunlarını ortaya çıkarır. 60 FPS'de 4K video oynatımı, aksi takdirde sorunsuz ve kare atlama olmadan.
| DPC Latencies / LatencyMon - interrupt to process latency (max), Web, Youtube, Prime95 | |
| Asus Zephyrus S15 GX502L | |
| Asus TUF Gaming F15 FX506HM | |
| Asus ROG Strix Scar 15 G533QS | |
| Asus TUF Dash F15 FX516PR | |
| Asus ZenBook Pro Duo UX582 LR-1BH2 | |
| Asus TUF Gaming F15 FX507ZM | |
* ... daha küçük daha iyidir
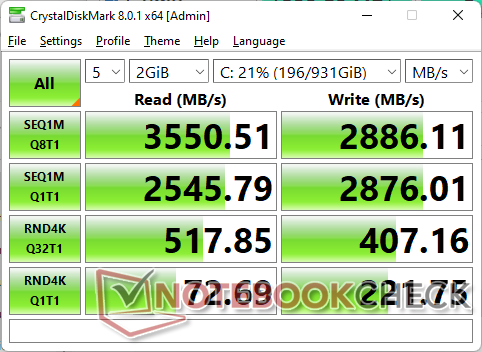
Depolama Aygıtları — En Fazla İki M.2 PCIe4 x4 Sürücü
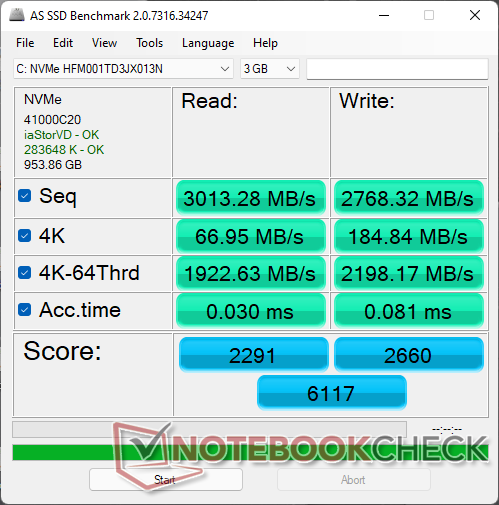
Ünitemiz, geçen yılki modelle aynı SK Hynix HFM001TD3JX013N PCIe3 x4 NVMe SSD ile birlikte gönderilir. Ancak, FX507'nin PCIe4 x4 SSD'leri desteklediğini, yani son kullanıcıların istenirse daha da hızlı sürücüler kurabileceğini unutmayın. İki M.2 yuvasının üzerinde ısı dağıtıcı olmadığından performans sürdürülebilirliği sınırlı olabilir.

* ... daha küçük daha iyidir
Sürekli yük okuması: DiskSpd Okuma Döngüsü, Sıra uzunluğu 8
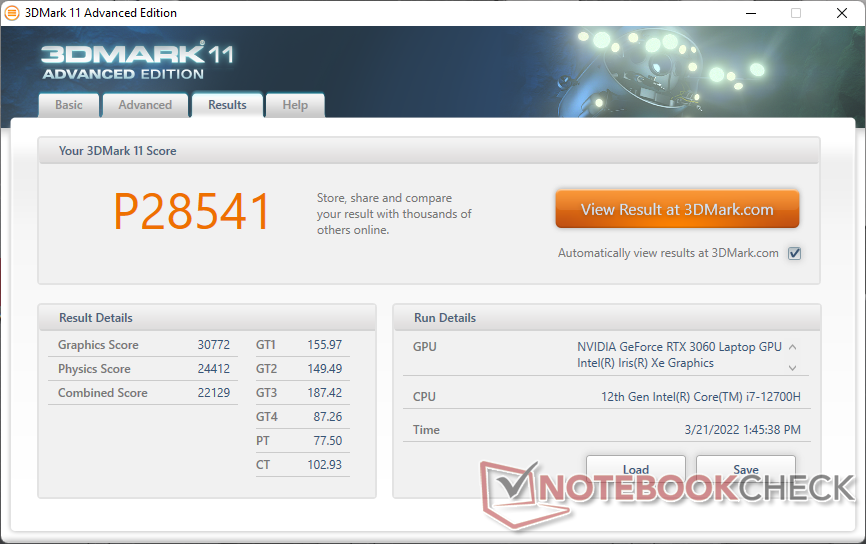
Ekran Kartı Performansı — 140 W TGP Grafikler
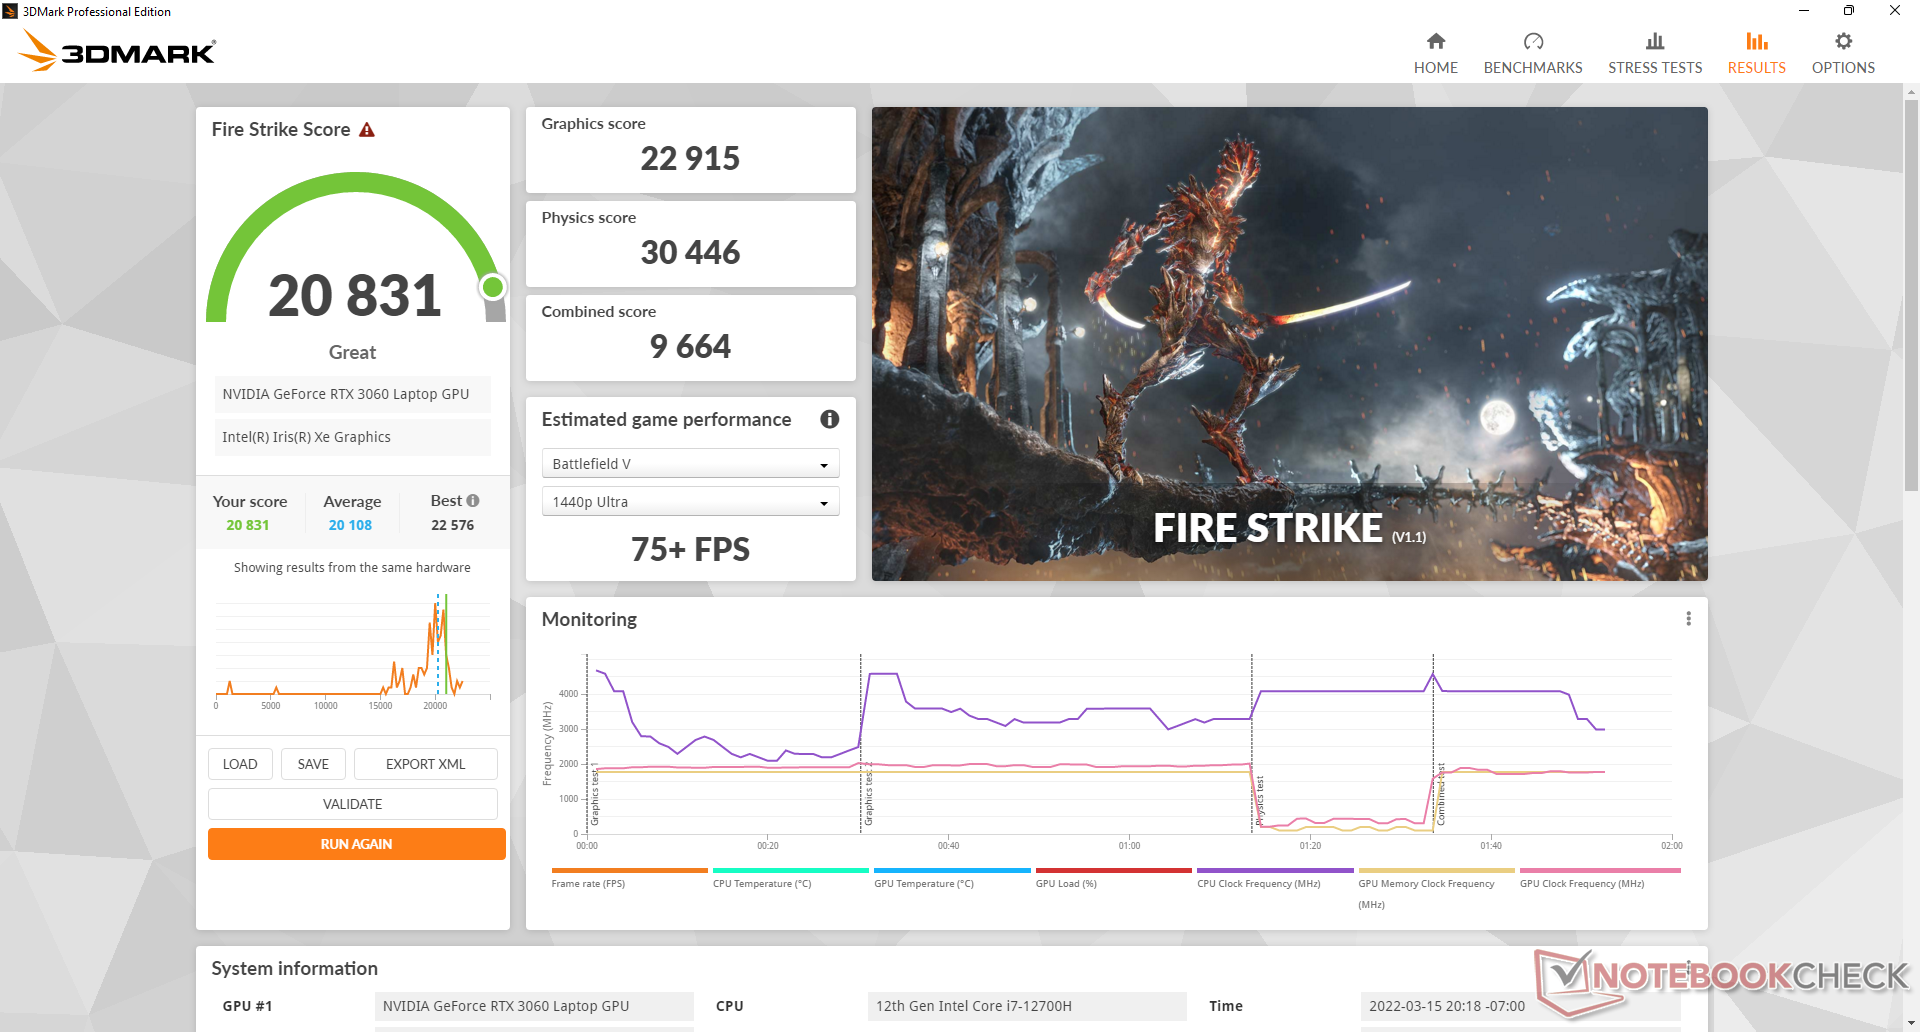
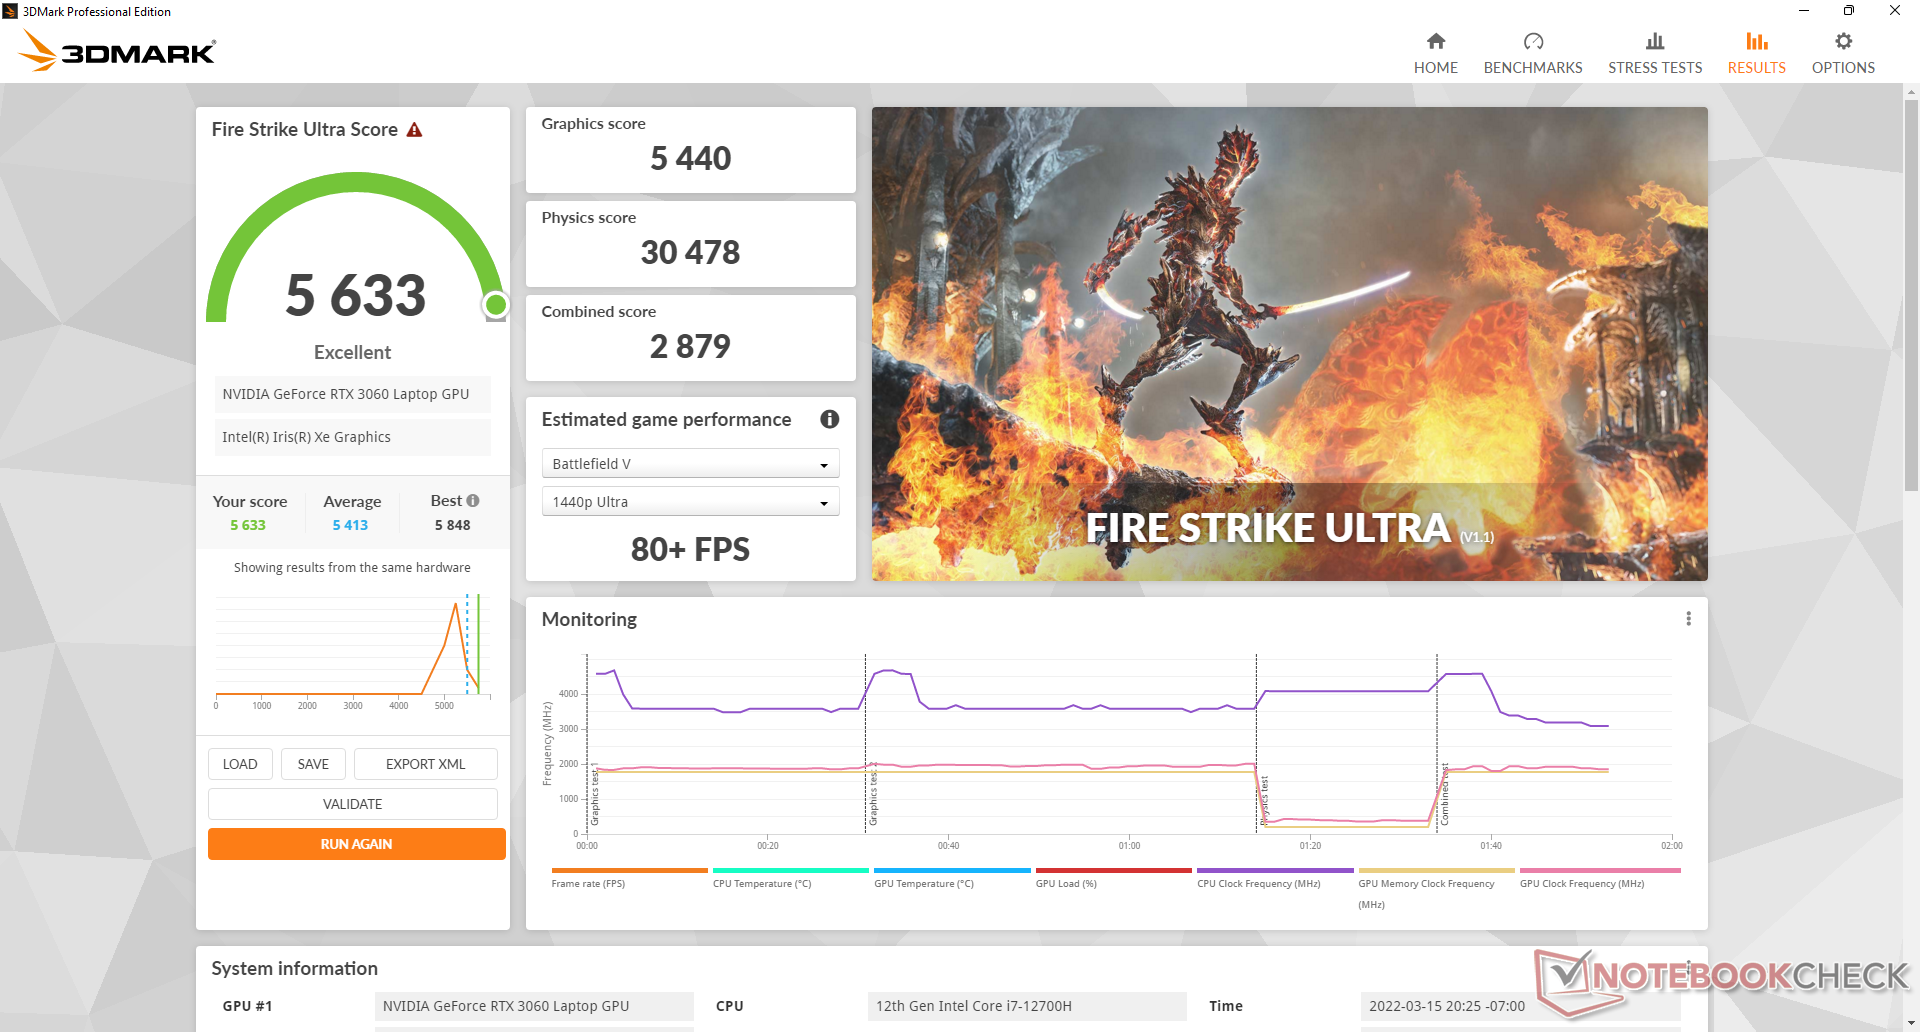
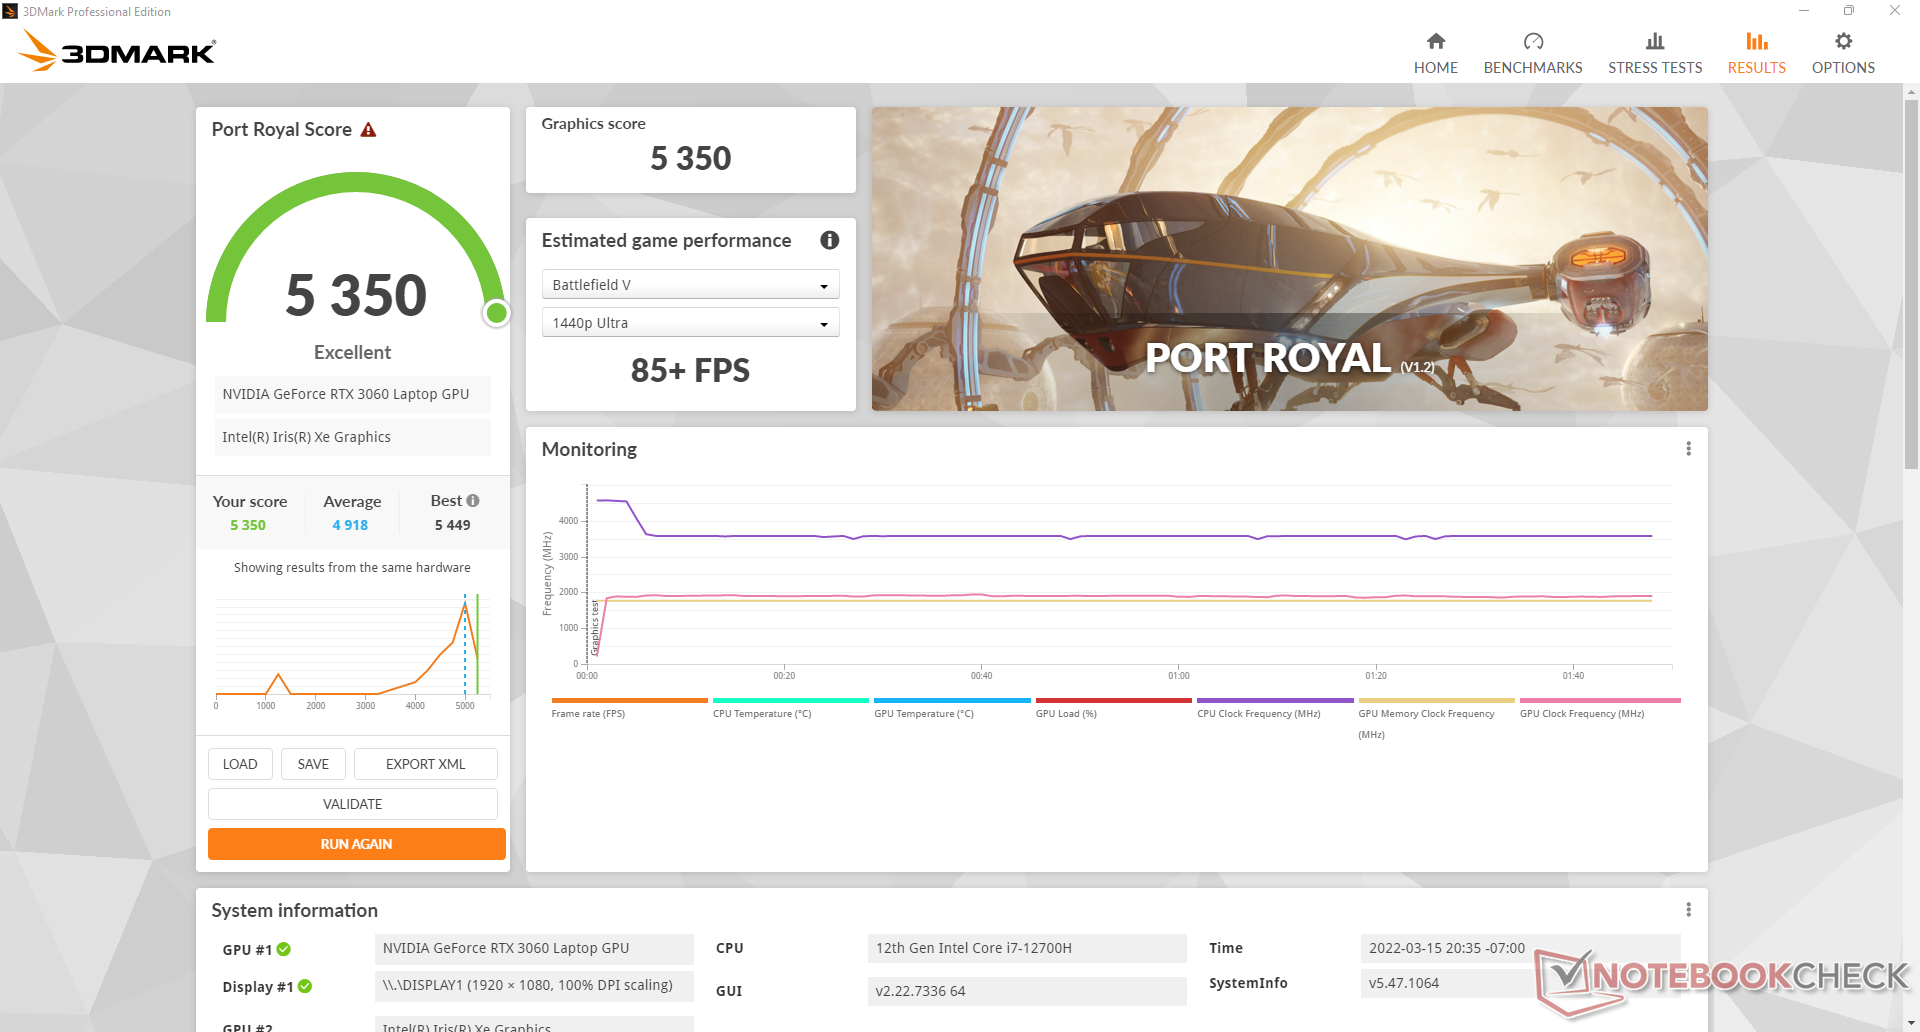
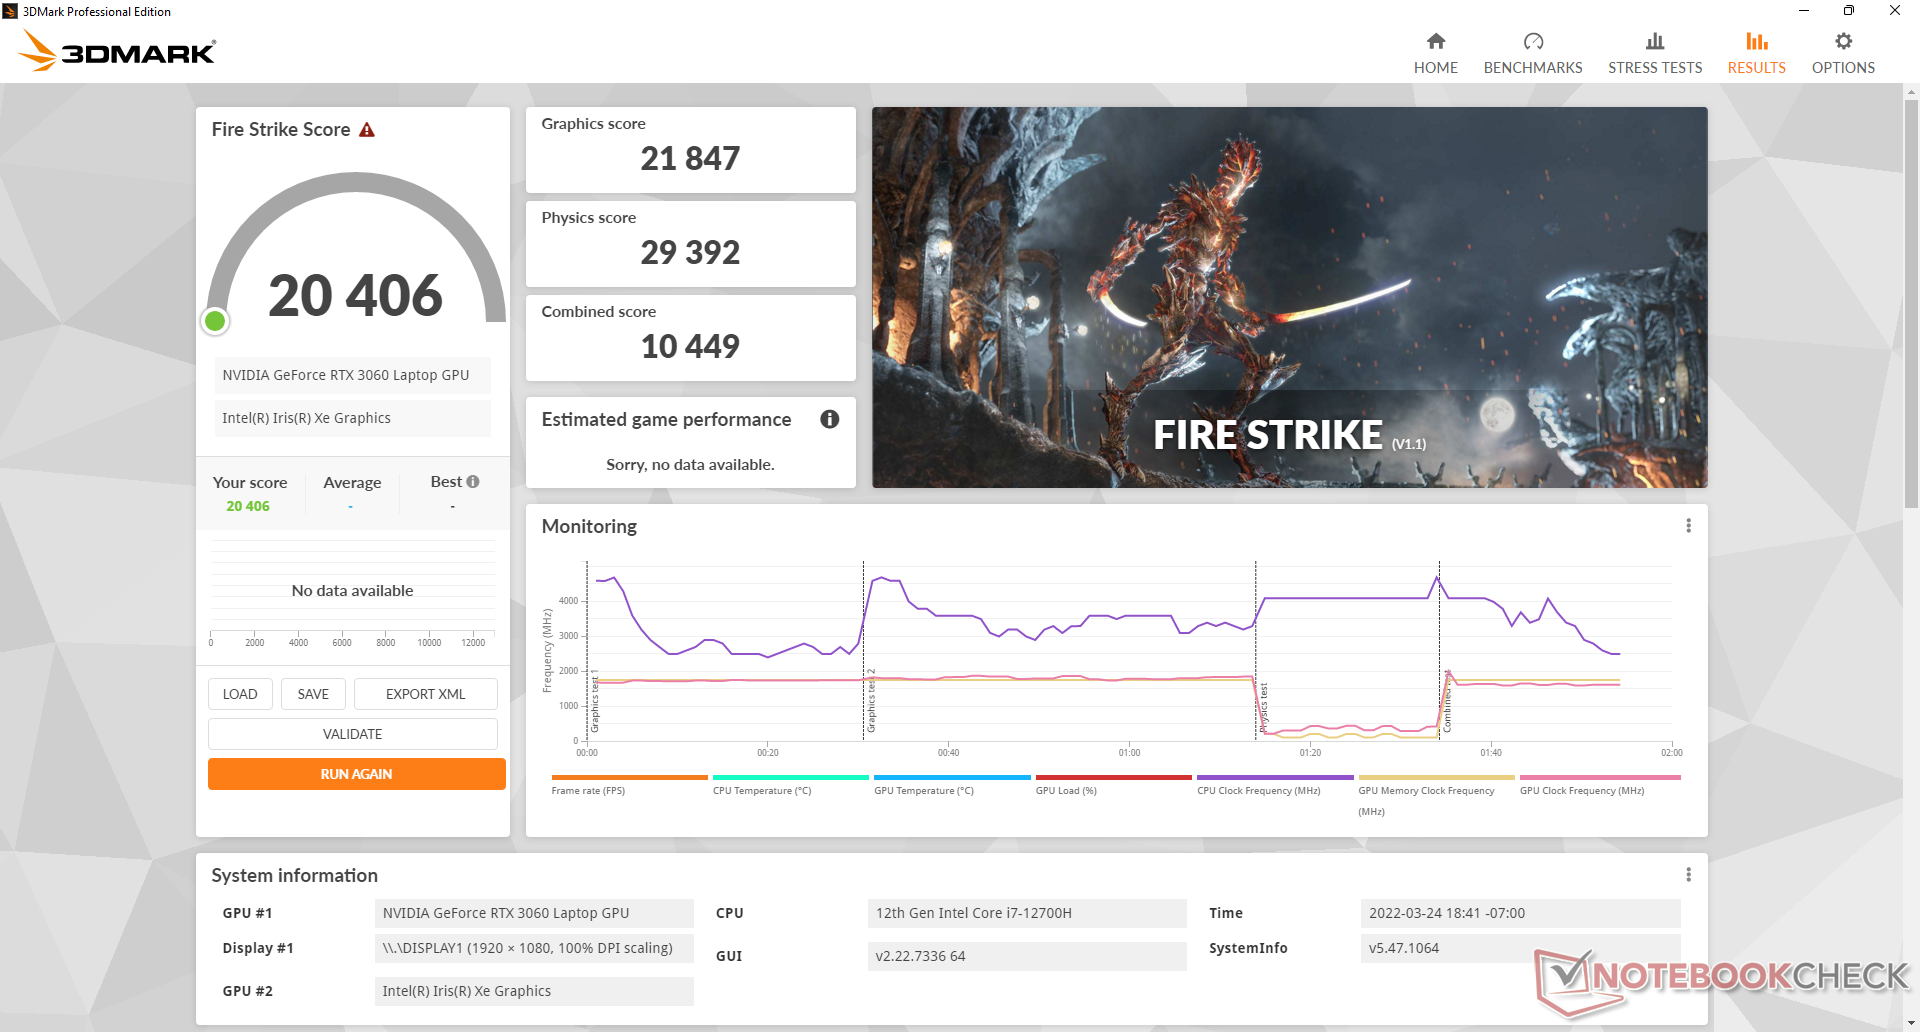
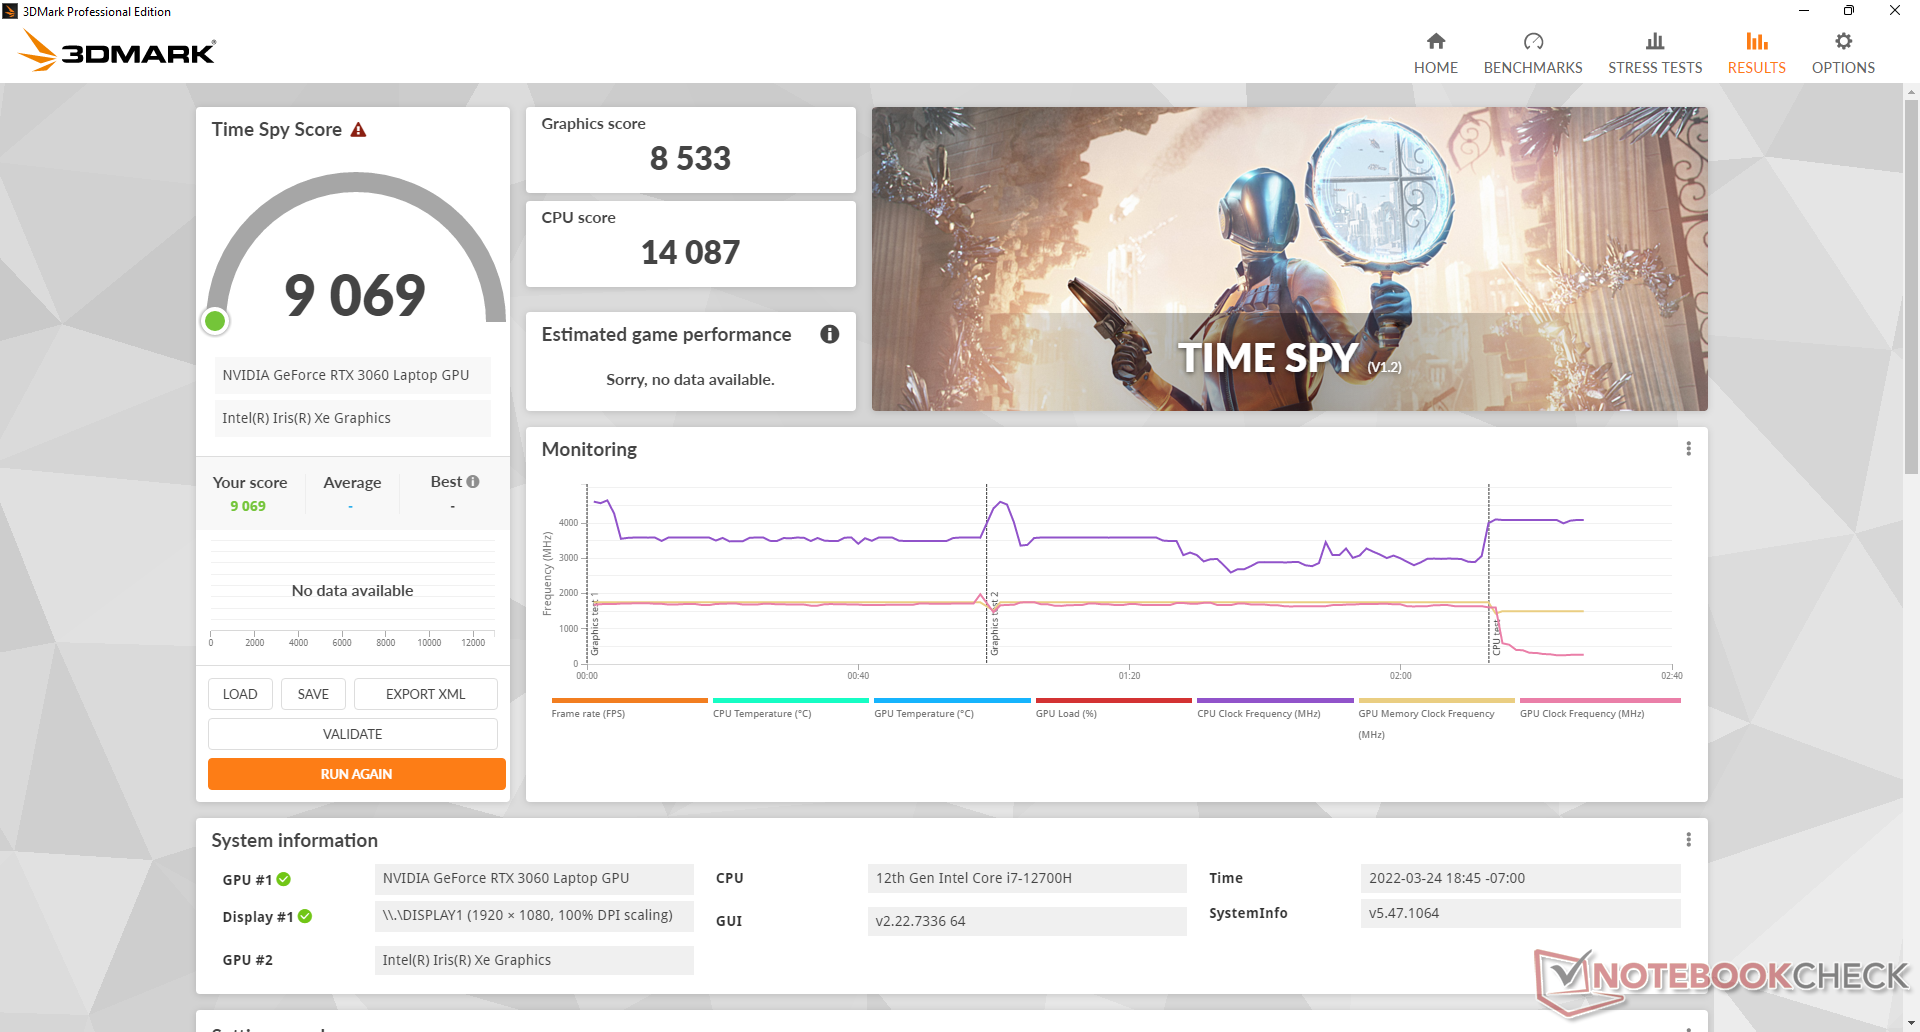
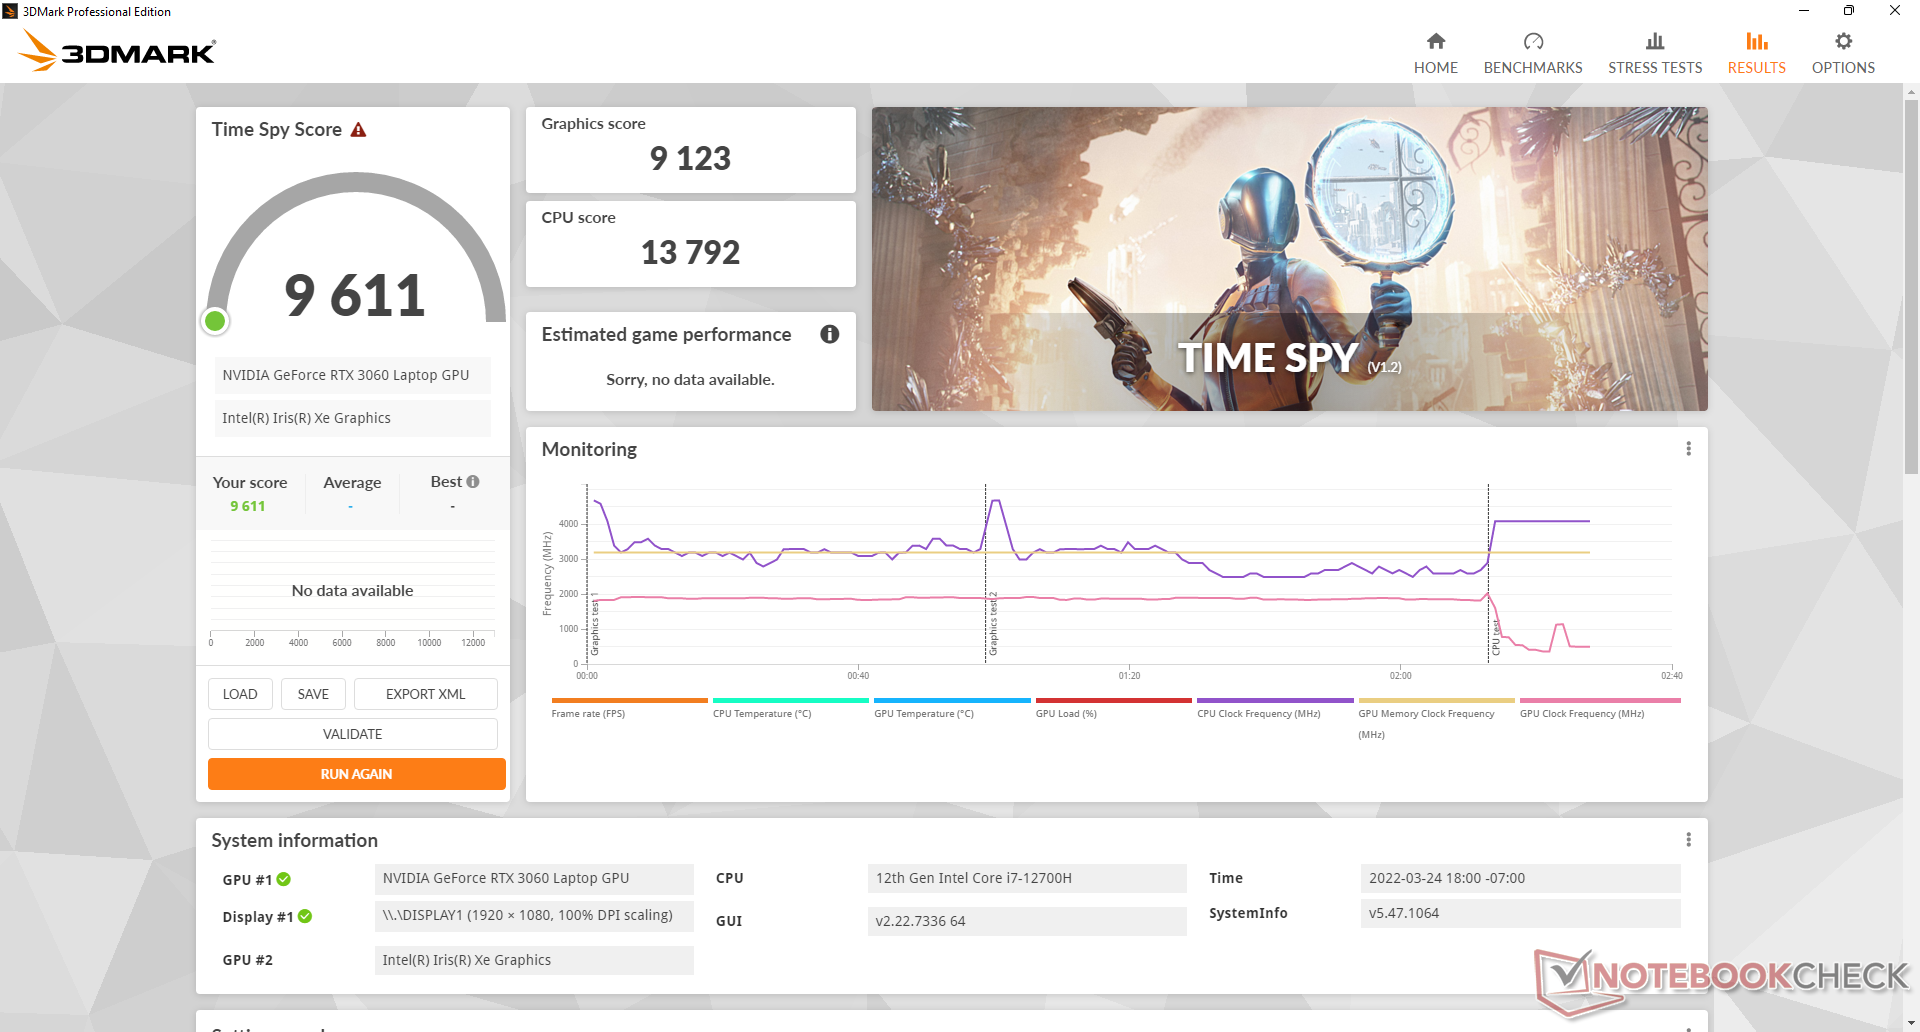
Geçen yılki modele kıyasla (140 W'a karşı 95 W) daha yüksek GeForce RTX 3060 TGP hedefi, doğal olarak daha yüksek grafik performansına yol açtı. Kullanıcılar, aynı RTX 3060 ekran kartı ile donatılmış FX506'ya göre yüzde 10 ila 20 performans artışı bekleyebilirler. Aslında FX507, aynı ekran kartına sahip ortalama dizüstü bilgisayardan yaklaşık yüzde 15 daha yüksek sonuçlarla şu anda satın alabileceğiniz en hızlı GeForce RTX 3060 dizüstü bilgisayarlardan biridir.
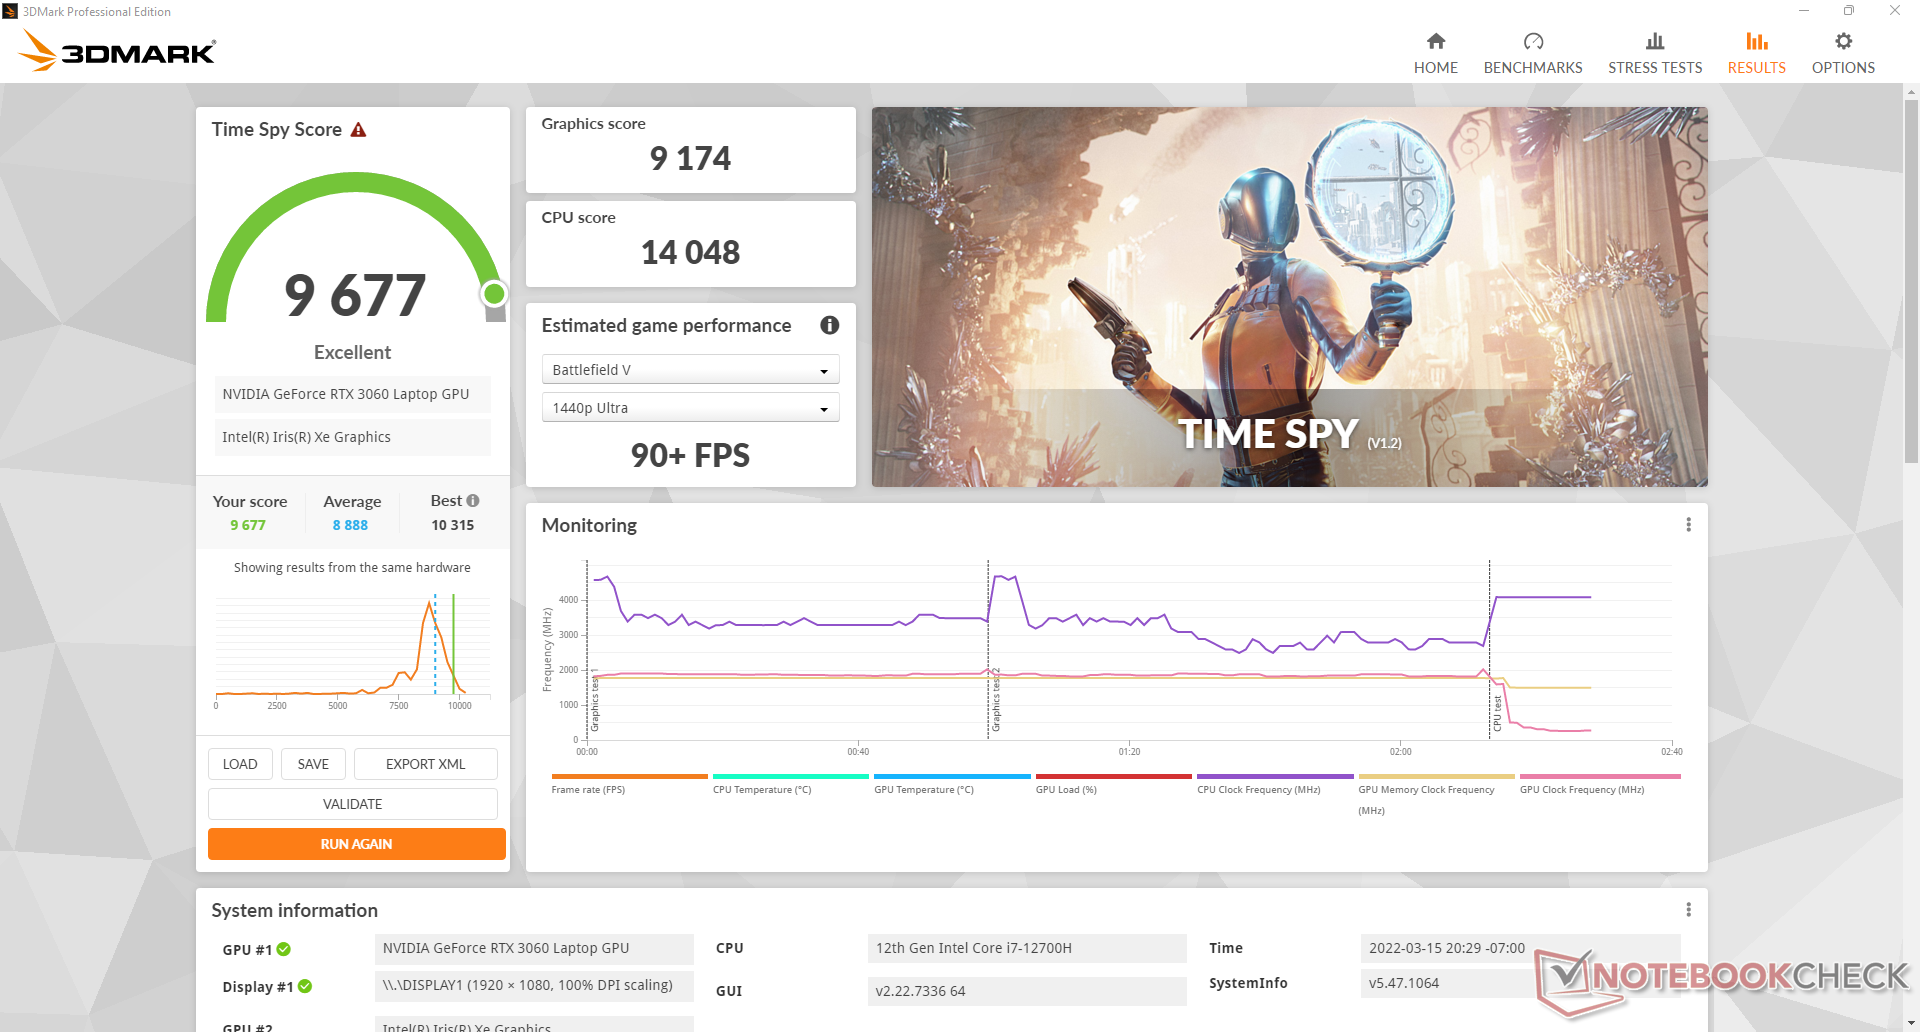
Harici Ekran Kartı modu yerine MSHybrid modunda çalıştırmak, yalnızca çok küçük performans açıklarına veya neredeyse hiç eksiğe neden olmaz. 3DMark sonuçları iki mod arasında neredeyse aynı olurken, oyun oynarken kare hızları testlerimizde sadece birkaç yüzde puanı daha yavaş olacaktı.
Harici Ekran Kartı Turbo modu yerine Harici Ekran Kartı Performans modunda çalıştırmak, yüzde 5 ila 10 ekran kartı performans açığına neden olur.

| 3DMark | |
| 1920x1080 Fire Strike Graphics | |
| Schenker XMG Neo 15 Tiger Lake | |
| MSI Vector GP66 12UGS | |
| Razer Blade 15 2022 | |
| MSI Delta 15 A5EFK | |
| Eurocom RX315 NH57AF1 | |
| Asus TUF Gaming F15 FX507ZM | |
| Inno3D GeForce RTX 3060 Twin X2 | |
| Asus TUF Gaming F15 FX506HM | |
| Ortalama NVIDIA GeForce RTX 3060 Laptop GPU (16354 - 23109, n=49) | |
| Asus ROG Zephyrus M15 GU502LU-BI7N4 | |
| Dell G3 15 3500-G4DG2 | |
| 2560x1440 Time Spy Graphics | |
| Schenker XMG Neo 15 Tiger Lake | |
| MSI Vector GP66 12UGS | |
| Razer Blade 15 2022 | |
| Eurocom RX315 NH57AF1 | |
| MSI Delta 15 A5EFK | |
| Asus TUF Gaming F15 FX507ZM | |
| Inno3D GeForce RTX 3060 Twin X2 | |
| Ortalama NVIDIA GeForce RTX 3060 Laptop GPU (6285 - 9235, n=49) | |
| Asus TUF Gaming F15 FX506HM | |
| Asus ROG Zephyrus M15 GU502LU-BI7N4 | |
| 2560x1440 Time Spy Score | |
| MSI Vector GP66 12UGS | |
| Schenker XMG Neo 15 Tiger Lake | |
| Razer Blade 15 2022 | |
| Asus TUF Gaming F15 FX507ZM | |
| Eurocom RX315 NH57AF1 | |
| MSI Delta 15 A5EFK | |
| Inno3D GeForce RTX 3060 Twin X2 | |
| Ortalama NVIDIA GeForce RTX 3060 Laptop GPU (6473 - 9677, n=50) | |
| Asus TUF Gaming F15 FX506HM | |
| Asus ROG Zephyrus M15 GU502LU-BI7N4 | |
| 3DMark 11 - 1280x720 Performance GPU | |
| Schenker XMG Neo 15 Tiger Lake | |
| MSI Vector GP66 12UGS | |
| Razer Blade 15 2022 | |
| Eurocom RX315 NH57AF1 | |
| MSI Delta 15 A5EFK | |
| Asus TUF Gaming F15 FX507ZM | |
| Inno3D GeForce RTX 3060 Twin X2 | |
| Asus TUF Gaming F15 FX506HM | |
| Ortalama NVIDIA GeForce RTX 3060 Laptop GPU (13799 - 30772, n=43) | |
| Asus ROG Zephyrus M15 GU502LU-BI7N4 | |
| Dell G3 15 3500-G4DG2 | |
| 3DMark 11 Performance | 28541 puan | |
| 3DMark Cloud Gate Standard Score | 58475 puan | |
| 3DMark Fire Strike Score | 20831 puan | |
| 3DMark Time Spy Score | 9677 puan | |
Yardım | ||
| Final Fantasy XV Benchmark | |
| 1280x720 Lite Quality | |
| Inno3D GeForce RTX 3060 Twin X2 | |
| MSI Vector GP66 12UGS | |
| Schenker XMG Neo 15 Tiger Lake | |
| Razer Blade 15 2022 | |
| Eurocom RX315 NH57AF1 | |
| Asus TUF Gaming F15 FX507ZM | |
| Ortalama NVIDIA GeForce RTX 3060 Laptop GPU (122.5 - 214, n=33) | |
| Asus TUF Gaming F15 FX506HM | |
| Asus ROG Zephyrus M15 GU502LU-BI7N4 | |
| 1920x1080 Standard Quality | |
| MSI Vector GP66 12UGS | |
| Razer Blade 15 2022 | |
| Schenker XMG Neo 15 Tiger Lake | |
| Asus TUF Gaming F15 FX507ZM | |
| Inno3D GeForce RTX 3060 Twin X2 | |
| Eurocom RX315 NH57AF1 | |
| MSI Delta 15 A5EFK | |
| Ortalama NVIDIA GeForce RTX 3060 Laptop GPU (70.4 - 133.5, n=37) | |
| Asus TUF Gaming F15 FX506HM | |
| Asus ROG Zephyrus M15 GU502LU-BI7N4 | |
| 1920x1080 High Quality | |
| MSI Vector GP66 12UGS | |
| Razer Blade 15 2022 | |
| Schenker XMG Neo 15 Tiger Lake | |
| Asus TUF Gaming F15 FX507ZM | |
| Eurocom RX315 NH57AF1 | |
| Inno3D GeForce RTX 3060 Twin X2 | |
| MSI Delta 15 A5EFK | |
| Ortalama NVIDIA GeForce RTX 3060 Laptop GPU (55 - 100.9, n=42) | |
| Asus TUF Gaming F15 FX506HM | |
| Asus ROG Zephyrus M15 GU502LU-BI7N4 | |
| X-Plane 11.11 | |
| 1280x720 low (fps_test=1) | |
| MSI Vector GP66 12UGS | |
| Inno3D GeForce RTX 3060 Twin X2 | |
| Razer Blade 15 2022 | |
| Asus TUF Gaming F15 FX507ZM | |
| Eurocom RX315 NH57AF1 | |
| Asus TUF Gaming F15 FX506HM | |
| Schenker XMG Neo 15 Tiger Lake | |
| Ortalama NVIDIA GeForce RTX 3060 Laptop GPU (83.6 - 157.1, n=48) | |
| Dell G3 15 3500-G4DG2 | |
| Asus ROG Zephyrus M15 GU502LU-BI7N4 | |
| 1920x1080 med (fps_test=2) | |
| MSI Vector GP66 12UGS | |
| Inno3D GeForce RTX 3060 Twin X2 | |
| Razer Blade 15 2022 | |
| Asus TUF Gaming F15 FX507ZM | |
| Schenker XMG Neo 15 Tiger Lake | |
| Eurocom RX315 NH57AF1 | |
| Asus TUF Gaming F15 FX506HM | |
| Ortalama NVIDIA GeForce RTX 3060 Laptop GPU (73 - 138.3, n=48) | |
| Asus ROG Zephyrus M15 GU502LU-BI7N4 | |
| Dell G3 15 3500-G4DG2 | |
| 1920x1080 high (fps_test=3) | |
| Inno3D GeForce RTX 3060 Twin X2 | |
| MSI Vector GP66 12UGS | |
| Razer Blade 15 2022 | |
| Asus TUF Gaming F15 FX507ZM | |
| Asus TUF Gaming F15 FX506HM | |
| Eurocom RX315 NH57AF1 | |
| Schenker XMG Neo 15 Tiger Lake | |
| Ortalama NVIDIA GeForce RTX 3060 Laptop GPU (61.9 - 109.3, n=48) | |
| Asus ROG Zephyrus M15 GU502LU-BI7N4 | |
| Dell G3 15 3500-G4DG2 | |
Witcher 3 FPS Chart
| düşük | orta | yüksek | ultra | |
|---|---|---|---|---|
| GTA V (2015) | 186 | 182 | 162 | 97.9 |
| The Witcher 3 (2015) | 395.4 | 291.8 | 186.8 | 91.5 |
| Dota 2 Reborn (2015) | 172 | 161 | 154 | 148 |
| Final Fantasy XV Benchmark (2018) | 161 | 122 | 91.9 | |
| X-Plane 11.11 (2018) | 153 | 136 | 107 | |
| Far Cry 5 (2018) | 156 | 123 | 114 | 114 |
| Strange Brigade (2018) | 345 | 232 | 185 | 160 |
Emisyonlar
Sistem Gürültüsü
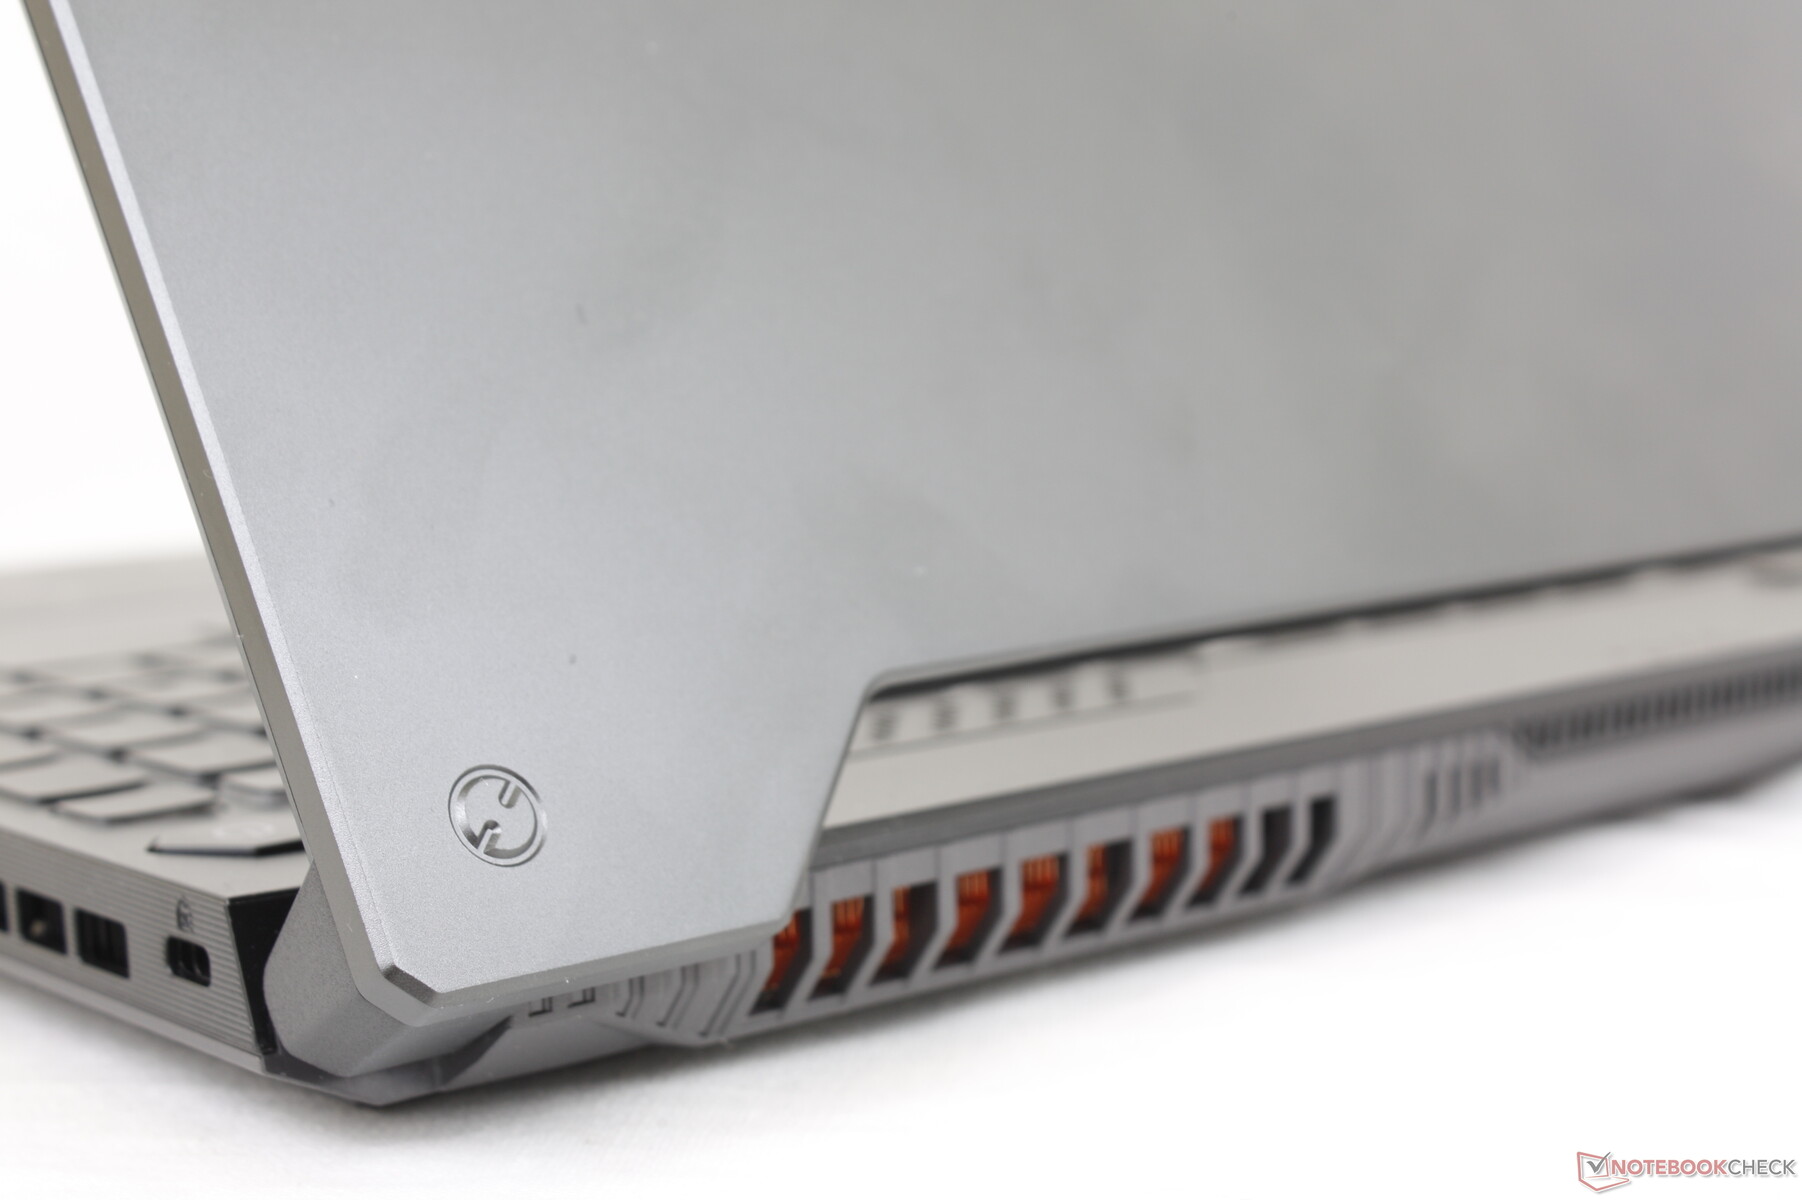
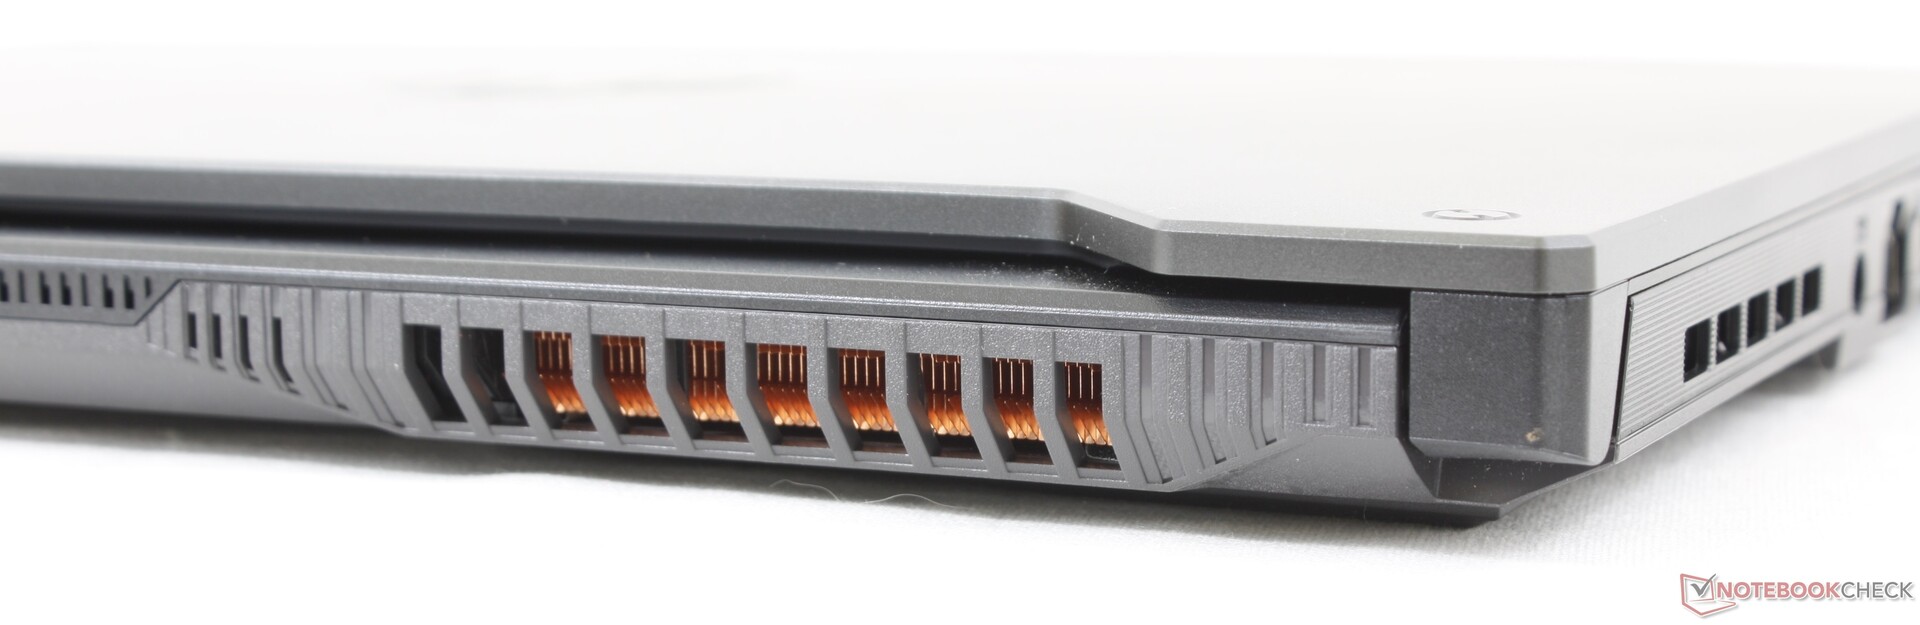
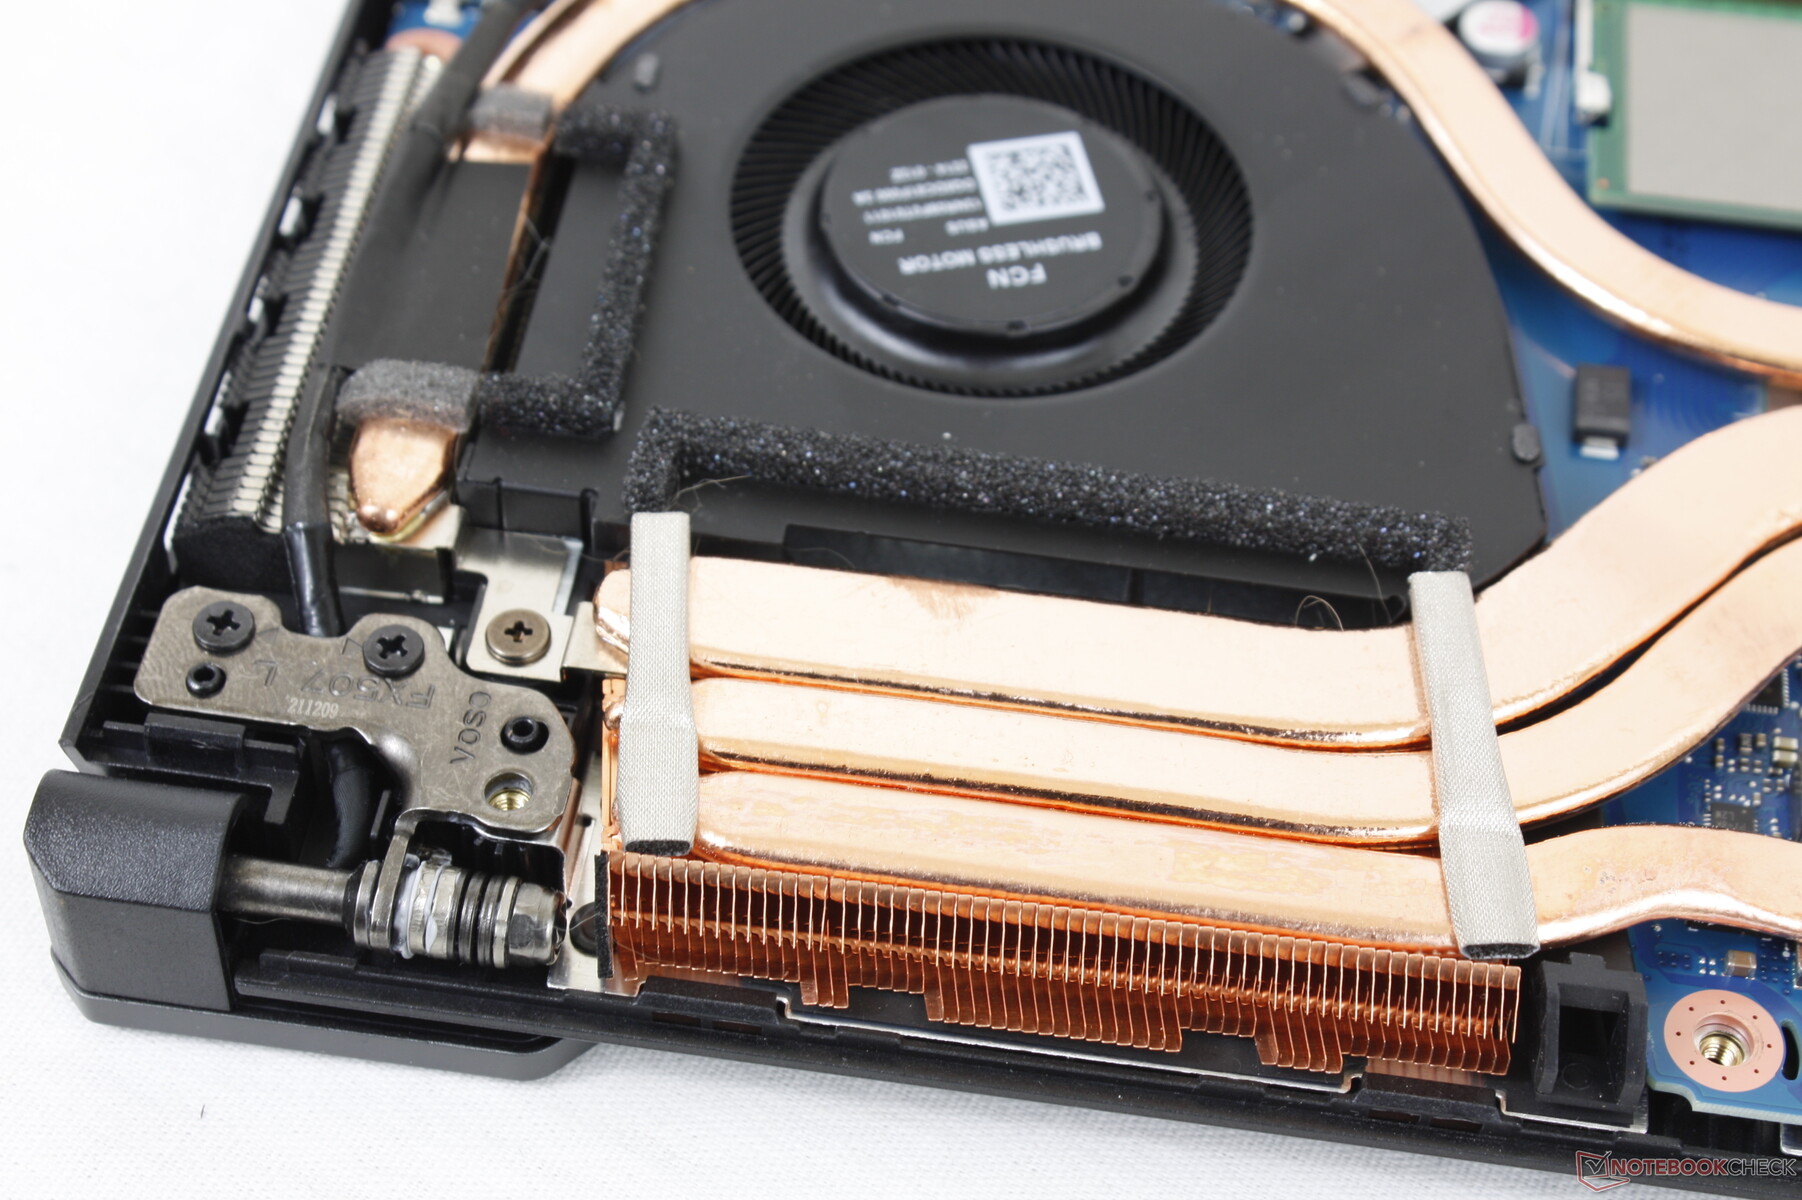
Asus, FX506'ya kıyasla daha hafif toplam ağırlığına rağmen FX507 için soğutma çözümünü yükseltti. Armory Crate aracılığıyla beş fan modu mevcuttur: Windows, Silent, Performance, Turbo ve Manual. Fanların titreşmesini önlemek için tarama veya sözcük işleme sırasında Windows veya Sessiz önerilir.
Witcher 3'ü Performans modunda ve Turbo modunda çalıştırmak, sırasıyla 45,8 dB(A) ve 54,1 dB(A) fan gürültüsüne neden olur. Performans modundaki daha düşük fan gürültüsü, Turbo moduna kıyasla grafik performansındaki yüzde 5 ila 10'luk küçük düşüşe göre önemli. Bu nedenle, fan gürültüsü bir sorunsa, kullanıcılar Performans modunda oyun oynamayı düşünmek isteyebilirler.
Ses yüksekliği
| Boşta |
| 23.6 / 23.6 / 25.4 dB |
| Çalışırken |
| 38 / 57.2 dB |
 | ||
30 dB sessiz 40 dB(A) duyulabilirlik 50 dB(A) gürültülü |
||
min: | ||
| Asus TUF Gaming F15 FX507ZM GeForce RTX 3060 Laptop GPU, i7-12700H, SK Hynix HFM001TD3JX013N | Asus TUF Gaming F15 FX506HM GeForce RTX 3060 Laptop GPU, i7-11800H, SK Hynix HFM001TD3JX013N | Asus TUF Dash F15 FX516PR GeForce RTX 3070 Laptop GPU, i7-11370H, SK Hynix HFM001TD3JX013N | Asus ROG Strix Scar 15 G533QS GeForce RTX 3080 Laptop GPU, R9 5900HX, ADATA Swordfish 2 TB | Asus Zephyrus S15 GX502L GeForce RTX 2070 Super Mobile, i7-10875H, WDC PC SN730 SDBPNTY-1T00 | Asus ZenBook Pro Duo UX582 LR-1BH2 GeForce RTX 3070 Laptop GPU, i7-10870H, Samsung PM981a MZVLB1T0HBLR | |
|---|---|---|---|---|---|---|
| Noise | 6% | -14% | -8% | -21% | -1% | |
| kapalı / ortam * (dB) | 23.2 | 24.8 -7% | 24 -3% | 25.5 -10% | 25 -8% | 24.6 -6% |
| Idle Minimum * (dB) | 23.6 | 24.6 -4% | 25 -6% | 25.5 -8% | 28 -19% | 24.6 -4% |
| Idle Average * (dB) | 23.6 | 24.9 -6% | 30 -27% | 25.5 -8% | 31 -31% | 24.6 -4% |
| Idle Maximum * (dB) | 25.4 | 24.9 2% | 35 -38% | 37.1 -46% | 36 -42% | 25.9 -2% |
| Load Average * (dB) | 38 | 27.1 29% | 53 -39% | 39.2 -3% | 56 -47% | 39.6 -4% |
| Witcher 3 ultra * (dB) | 54.1 | 46.4 14% | 48 11% | 50.5 7% | 55 -2% | 49.8 8% |
| Load Maximum * (dB) | 57.2 | 49 14% | 54 6% | 51.8 9% | 57 -0% | 54.2 5% |
* ... daha küçük daha iyidir
Sıcaklıklar
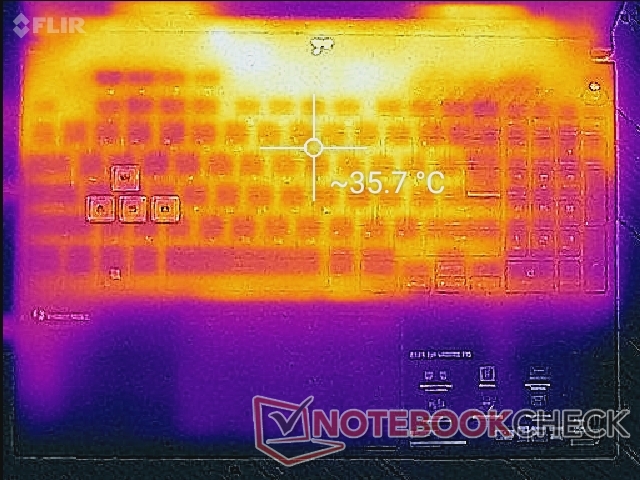
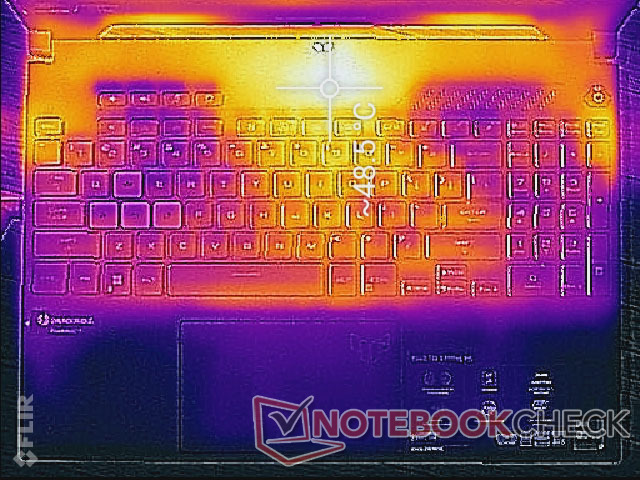
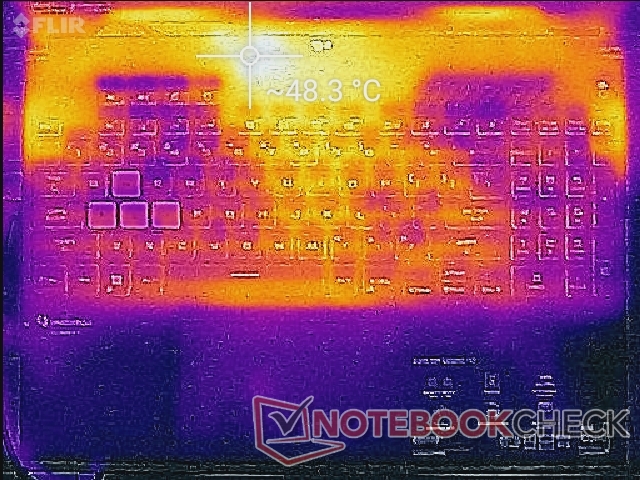
Yüzey sıcaklığındaki sıcak noktalar, geçen yılki modelde kaydettiğimizden daha sıcak. Örneğin, Witcher 3 çalıştırıldığında , FX507'deki en yüksek sıcak nokta, FX506'daki yalnızca 37 C'ye kıyasla 49 C kadar sıcak olabilir. Bununla birlikte, FX507'nin geliştirilmiş soğutma çözümü, ekran yükü ne olursa olsun avuç içi ve parmakları serin tutmak için etkin noktayı klavye tuşlarından uzaklaştırdı.
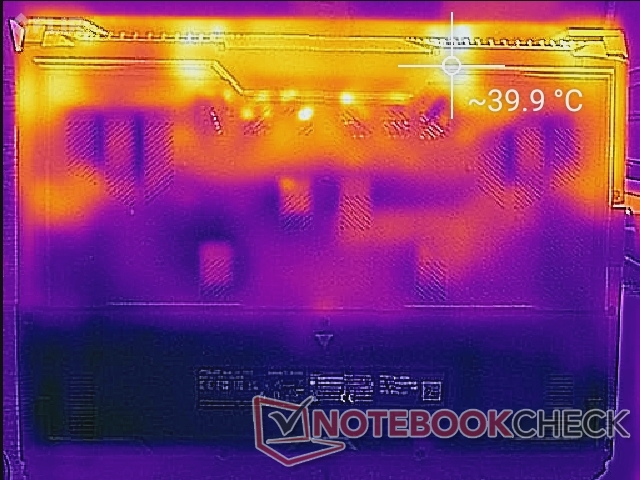
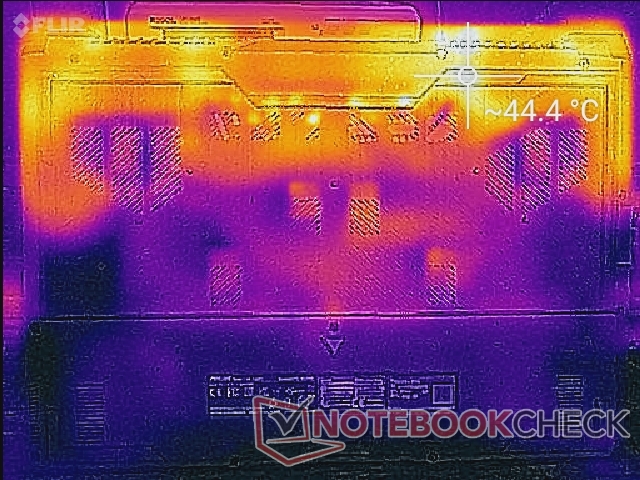
Yüzey sıcaklıkları, masaüstünde rölantideyken bile beklenenden daha sıcak, ancak bunun nedeni, etkinlik düşükken fanların boşta kalması veya çok düşük hızlarda çalışmasıdır. Bunu özellikle sınıflarda veya video veya müzik çalarken kabul edilebilir bir takas olarak görüyoruz.
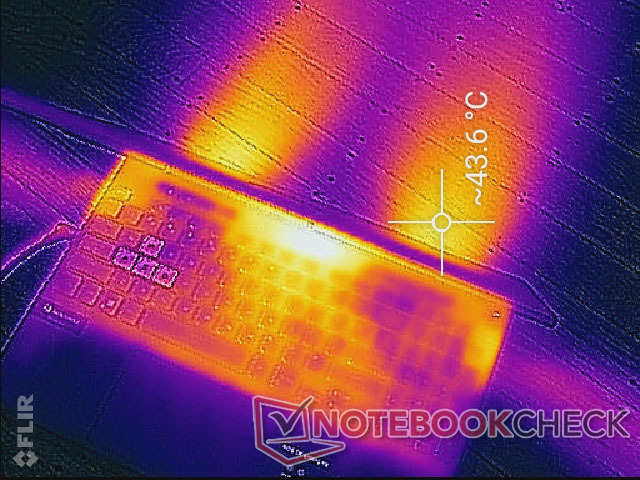
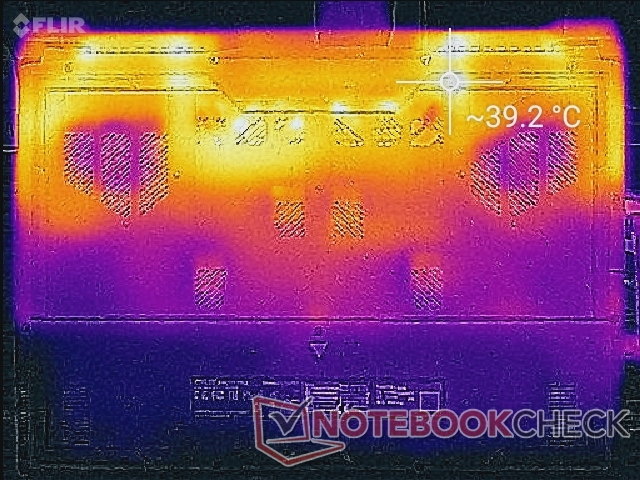
(±) Üst taraftaki maksimum sıcaklık, 40.4 °C / 105 F ortalamasına kıyasla 44.4 °C / 112 F'dir. , Gaming sınıfı için 21.2 ile 68.8 °C arasında değişir.
(-) Alt kısım, 43.2 °C / 110 F ortalamasına kıyasla maksimum 48.8 °C / 120 F'ye kadar ısınır
(+) Boşta kullanımda, üst tarafın ortalama sıcaklığı 30.2 °C / 86 F olup, cihazın 33.9 °C / 93 F.
(+) The Witcher 3 oynarken, üst tarafın ortalama sıcaklığı 31.4 °C / 89 F olup, cihazın 33.9 °C / 93 F.
(+) Avuç içi dayanakları ve dokunmatik yüzey, maksimum 28 °C / 82.4 F ile cilt sıcaklığından daha soğuktur ve bu nedenle dokunulduğunda soğuktur.
(±) Benzer cihazların avuç içi dayanağı alanının ortalama sıcaklığı 28.8 °C / 83.8 F (+0.8 °C / 1.4 F) idi.
| Asus TUF Gaming F15 FX507ZM Intel Core i7-12700H, NVIDIA GeForce RTX 3060 Laptop GPU | Asus TUF Gaming F15 FX506HM Intel Core i7-11800H, NVIDIA GeForce RTX 3060 Laptop GPU | Asus TUF Dash F15 FX516PR Intel Core i7-11370H, NVIDIA GeForce RTX 3070 Laptop GPU | Asus ROG Strix Scar 15 G533QS AMD Ryzen 9 5900HX, NVIDIA GeForce RTX 3080 Laptop GPU | Asus Zephyrus S15 GX502L Intel Core i7-10875H, NVIDIA GeForce RTX 2070 Super Mobile | Asus ZenBook Pro Duo UX582 LR-1BH2 Intel Core i7-10870H, NVIDIA GeForce RTX 3070 Laptop GPU | |
|---|---|---|---|---|---|---|
| Heat | 16% | 1% | 4% | 11% | 14% | |
| Maximum Upper Side * (°C) | 44.4 | 46.4 -5% | 55 -24% | 43.4 2% | 51 -15% | 47.7 -7% |
| Maximum Bottom * (°C) | 48.8 | 45.4 7% | 56 -15% | 48.2 1% | 44 10% | 53.8 -10% |
| Idle Upper Side * (°C) | 37.8 | 26 31% | 29 23% | 35.2 7% | 29 23% | 24.4 35% |
| Idle Bottom * (°C) | 39.6 | 27.4 31% | 32 19% | 37 7% | 30 24% | 24.7 38% |
* ... daha küçük daha iyidir
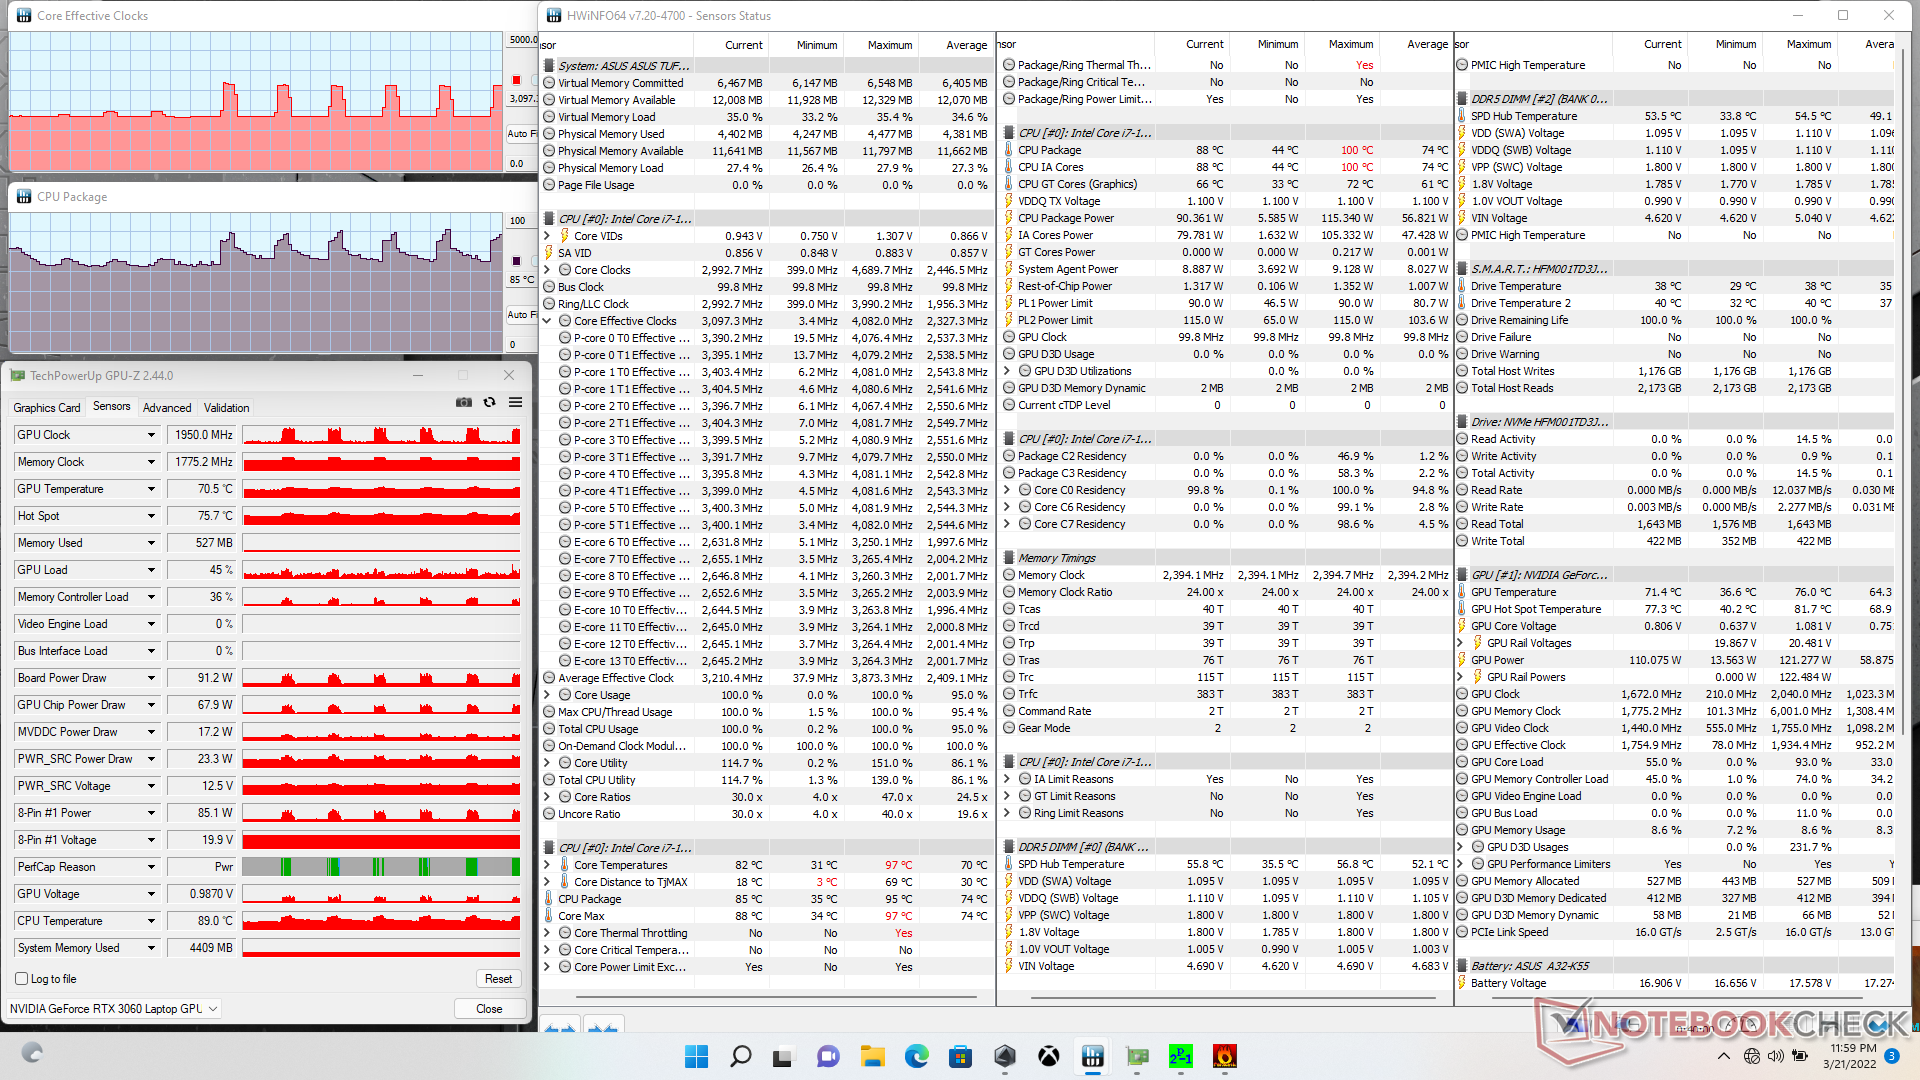
Stres testi
Prime95'i çalıştırırken, işlemci ilk 100 saniye ya da öylesine ve 95 C çekirdek sıcaklığında 3,8 GHz'e yükselir. Saat hızları ve sıcaklık sonunda düşer ve sırasıyla 3,1 GHz ve 83 C'de sabitlenir. HWiNFO'ya göre bu süre zarfında paket gücü de 115 W'tan 90 W'a düşecekti.
Tipik oyun stresini temsil etmek için Witcher 3 çalıştırıldığında , işlemci ve ekran kartı sıcaklıkları sırasıyla 69 C ve 77 C'de sabitlenir, ekran kartı 1927 MHz'de ve kart güç çekişi 133.4 W'dir. Aynı testi FX506'da çalıştırmak daha sıcak görünür. Sırasıyla 75 C ve 81 C işlemci ve ekran kartı sıcaklıkları, ancak 1717 MHz'lik daha yavaş bir ekran kartı saat hızı ve 90.4 W daha düşük kart güç çekişi.
Pil gücüyle çalışmak performansı sınırlar. Piller üzerinde bir Fire Strike testi, şebekedeyken 30446 ve 22915 puanlara kıyasla sırasıyla 21169 ve 15715 Fizik ve Grafik puanları döndürecektir.
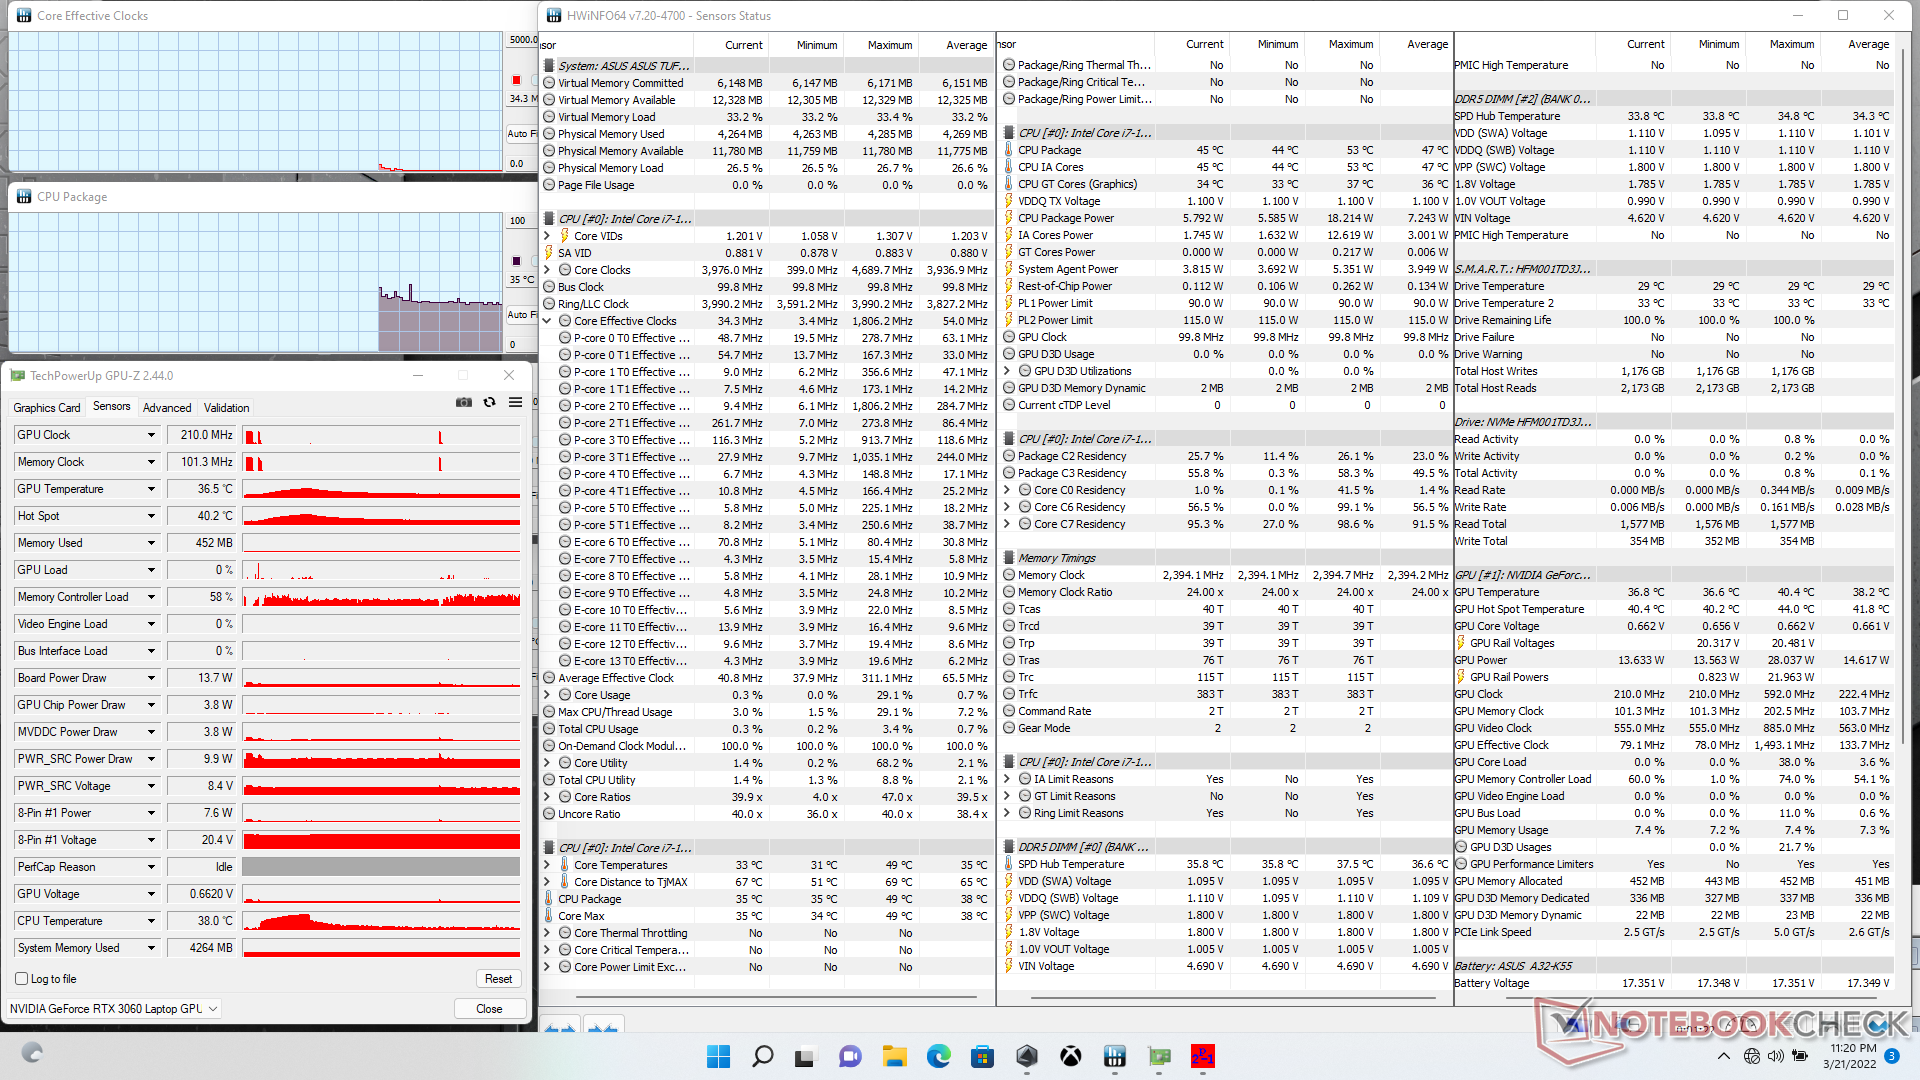
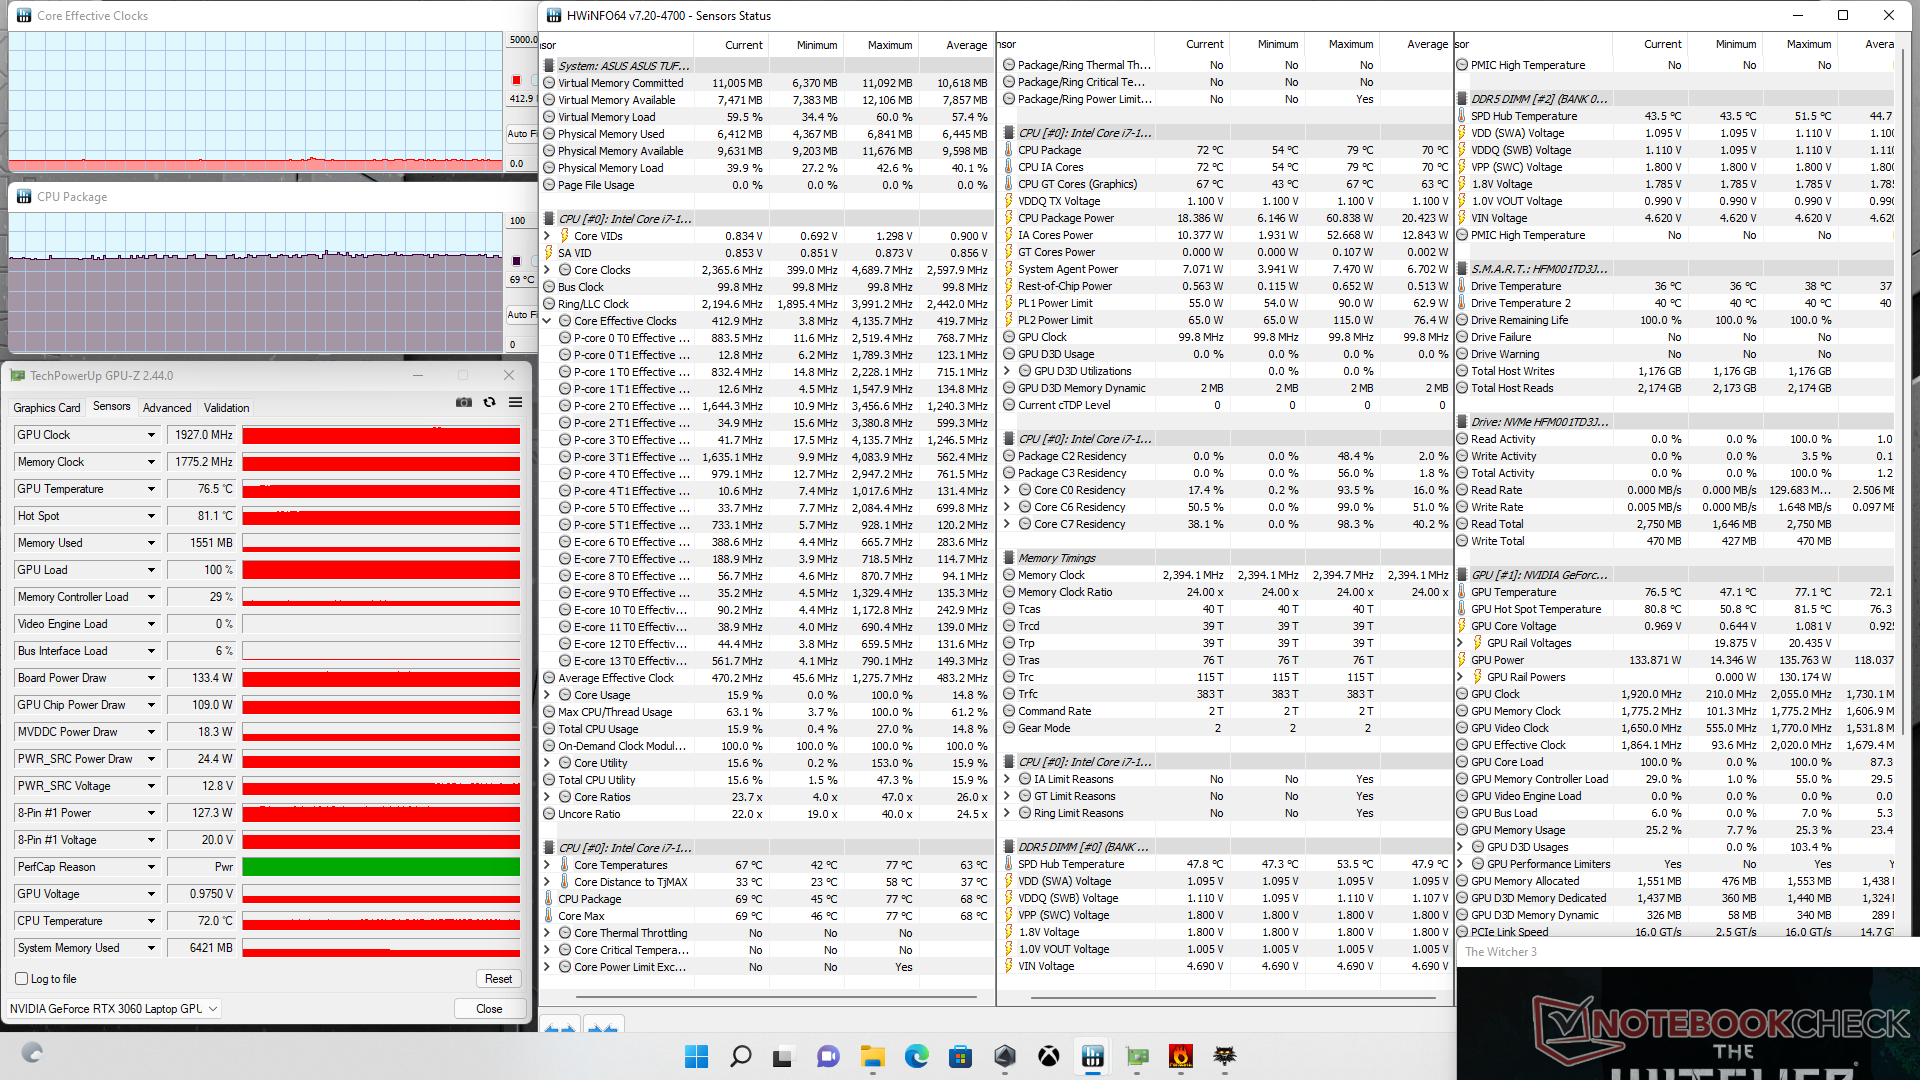
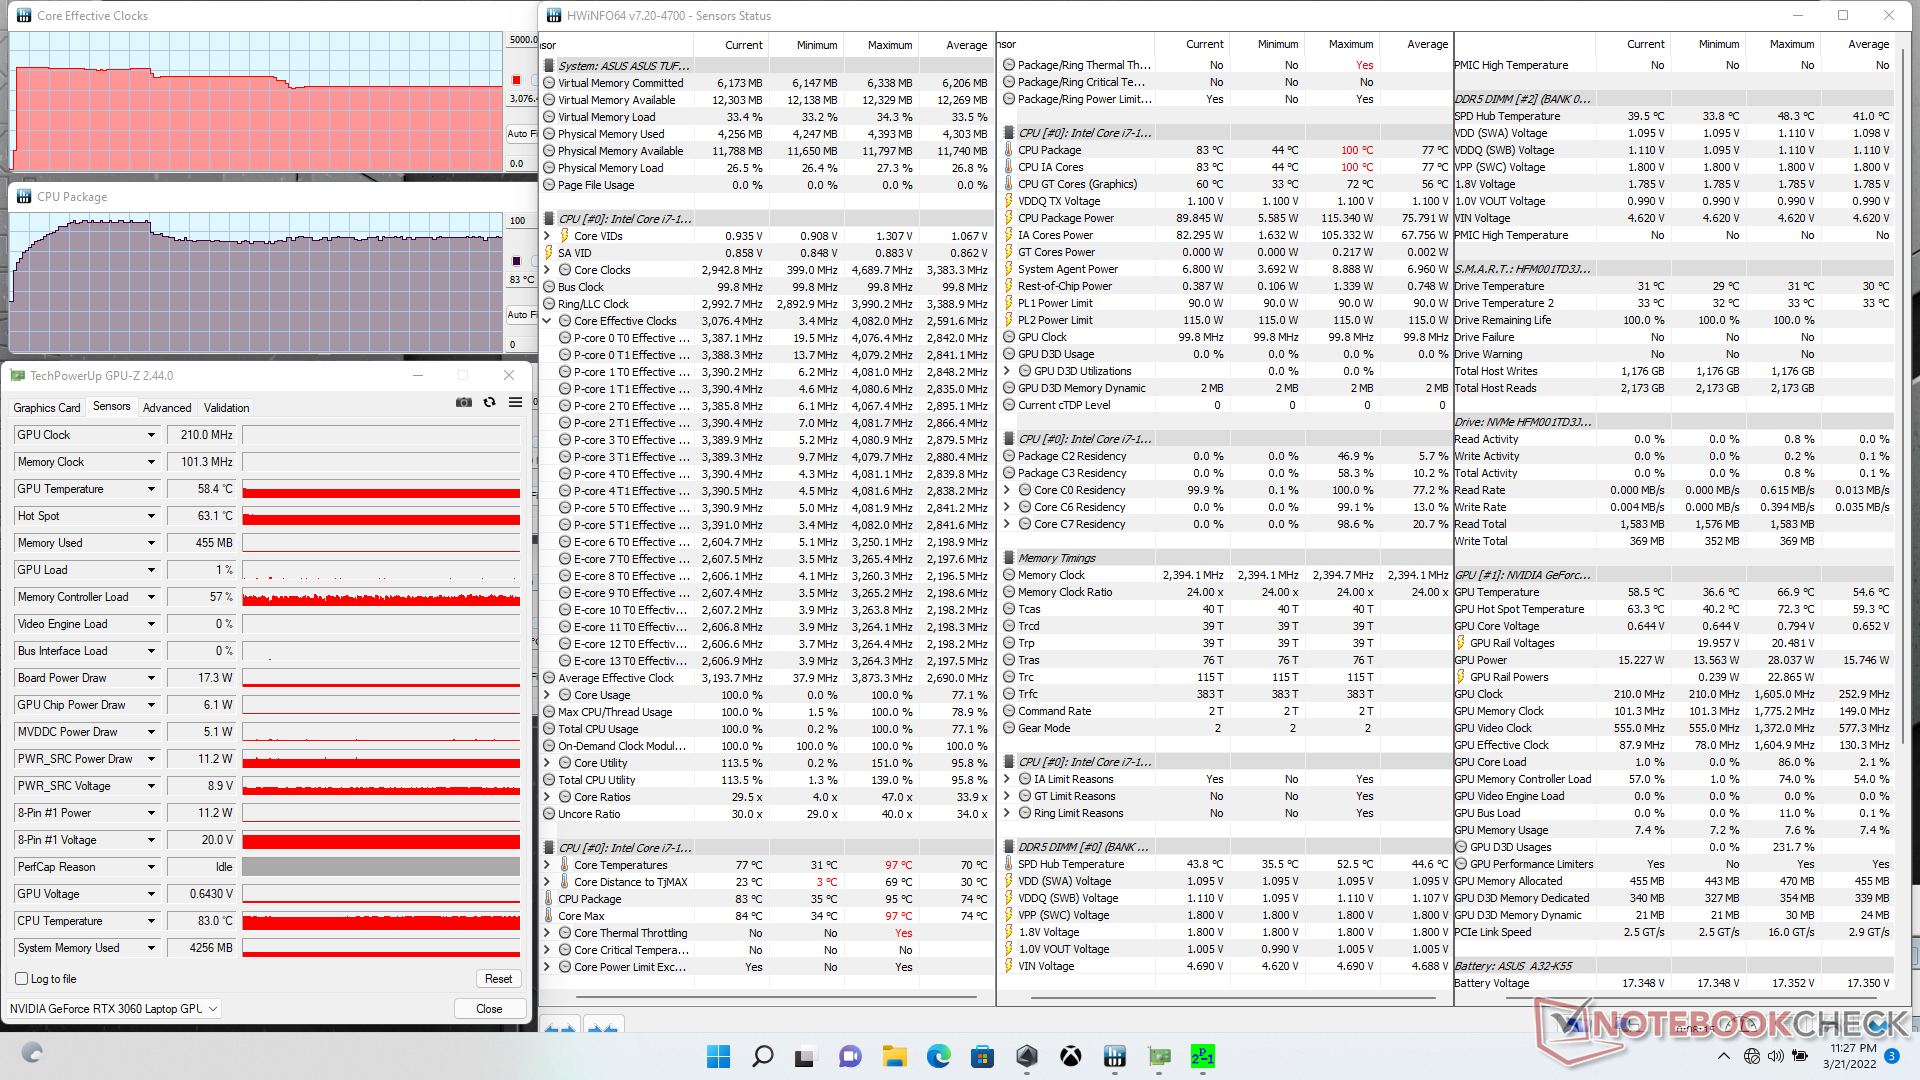
| İşlemci Saati (GHz) | Ekran Kartı Saati (MHz) | Ortalama İşlemci Sıcaklığı (°C) | Ortalama Ekran Kartı Sıcaklığı (°C) | |
| Sistem Boşta | -- | -- | 35 | 37 |
| Prime95 Stres | 3.1 | -- | 83 | 58 |
| Prime95 + FurMark Stres | 2.0 - 3.0 | 450 - 2000 | 66 - 89 | 58 - 72 |
| Witcher 3 Stres | 0.412 | 1927 | 69 | 77 |
Hoparlörler
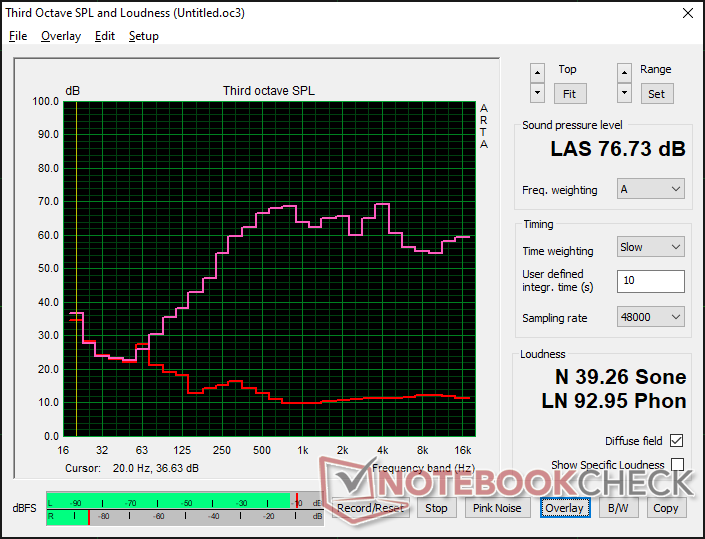
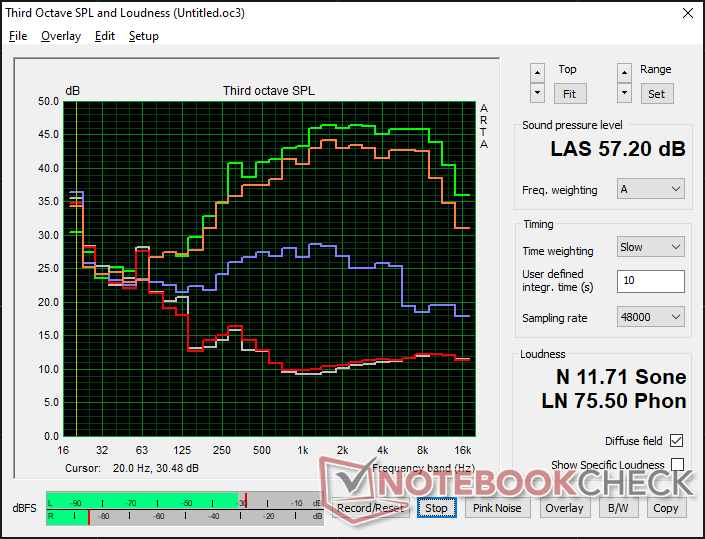
Asus TUF Gaming F15 FX507ZM ses analizi
(±) | hoparlör ses yüksekliği ortalama ama iyi (76.7 dB)
Bas 100 - 315Hz
(±) | azaltılmış bas - ortalama olarak medyandan 13.7% daha düşük
(±) | Bas doğrusallığı ortalamadır (10.1% delta - önceki frekans)
Ortalar 400 - 2000 Hz
(±) | daha yüksek ortalar - ortalama olarak medyandan 5.2% daha yüksek
(+) | orta frekanslar doğrusaldır (4.9% deltadan önceki frekansa)
Yüksekler 2 - 16 kHz
(+) | dengeli yüksekler - medyandan yalnızca 4.1% uzakta
(±) | Yükseklerin doğrusallığı ortalamadır (8.6% delta - önceki frekans)
Toplam 100 - 16.000 Hz
(±) | Genel sesin doğrusallığı ortalamadır (15.9% ortancaya göre fark)
Aynı sınıfla karşılaştırıldığında
» Bu sınıftaki tüm test edilen cihazların %38%'si daha iyi, 7% benzer, 56% daha kötüydü
» En iyisinin deltası 6% idi, ortalama 18% idi, en kötüsü 132% idi
Test edilen tüm cihazlarla karşılaştırıldığında
» Test edilen tüm cihazların %25'si daha iyi, 5 benzer, % 70 daha kötüydü
» En iyisinin deltası 4% idi, ortalama 24% idi, en kötüsü 134% idi
Apple MacBook Pro 16 2021 M1 Pro ses analizi
(+) | hoparlörler nispeten yüksek sesle çalabilir (84.7 dB)
Bas 100 - 315Hz
(+) | iyi bas - medyandan yalnızca 3.8% uzakta
(+) | bas doğrusaldır (5.2% delta ile önceki frekans)
Ortalar 400 - 2000 Hz
(+) | dengeli ortalar - medyandan yalnızca 1.3% uzakta
(+) | orta frekanslar doğrusaldır (2.1% deltadan önceki frekansa)
Yüksekler 2 - 16 kHz
(+) | dengeli yüksekler - medyandan yalnızca 1.9% uzakta
(+) | yüksekler doğrusaldır (2.7% deltadan önceki frekansa)
Toplam 100 - 16.000 Hz
(+) | genel ses doğrusaldır (4.6% ortancaya göre fark)
Aynı sınıfla karşılaştırıldığında
» Bu sınıftaki tüm test edilen cihazların %0%'si daha iyi, 0% benzer, 100% daha kötüydü
» En iyisinin deltası 5% idi, ortalama 17% idi, en kötüsü 45% idi
Test edilen tüm cihazlarla karşılaştırıldığında
» Test edilen tüm cihazların %0'si daha iyi, 0 benzer, % 100 daha kötüydü
» En iyisinin deltası 4% idi, ortalama 24% idi, en kötüsü 134% idi
Enerji Yönetimi — Anakartın Üzerinde Daha Fazla Güce Aç Donanım
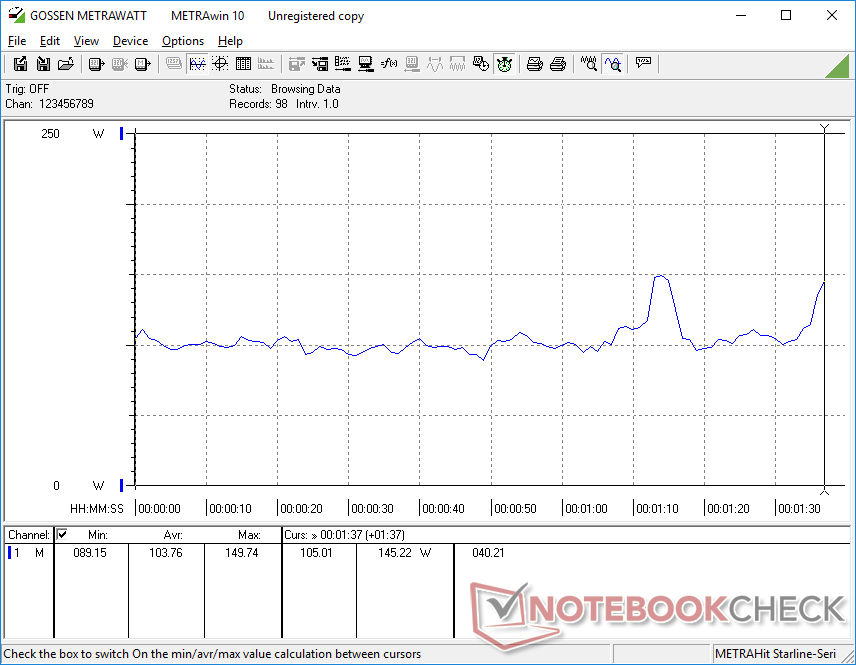
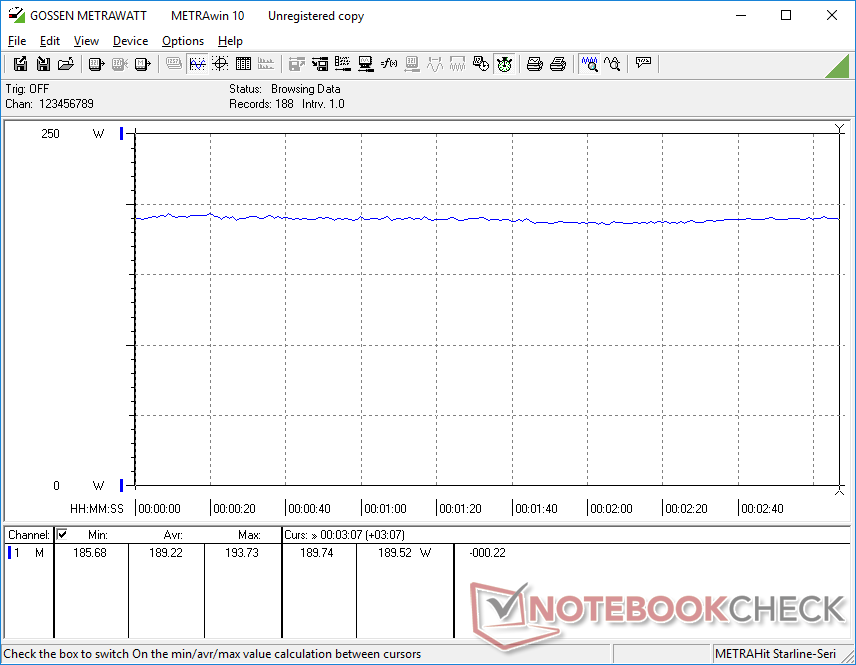
Güç tüketimi
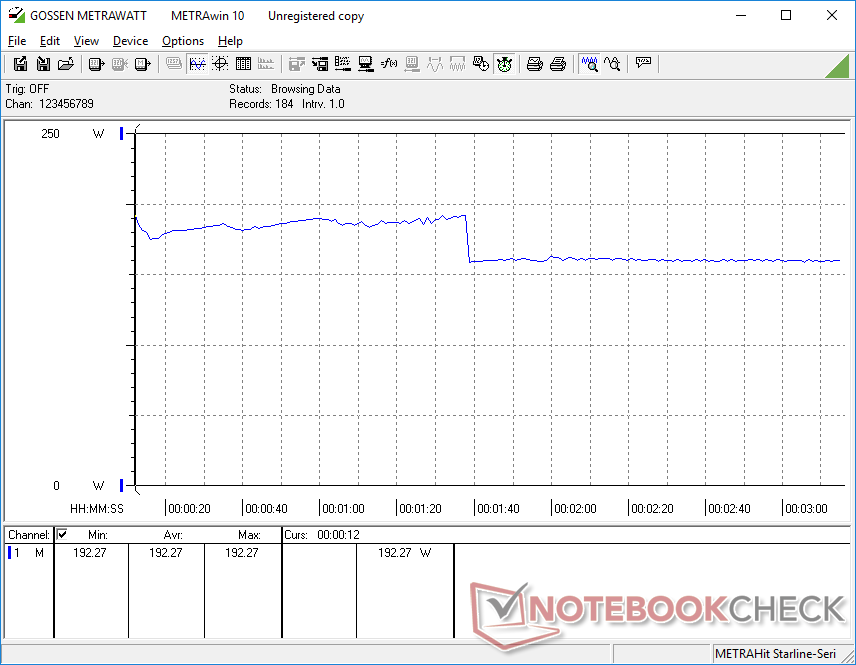
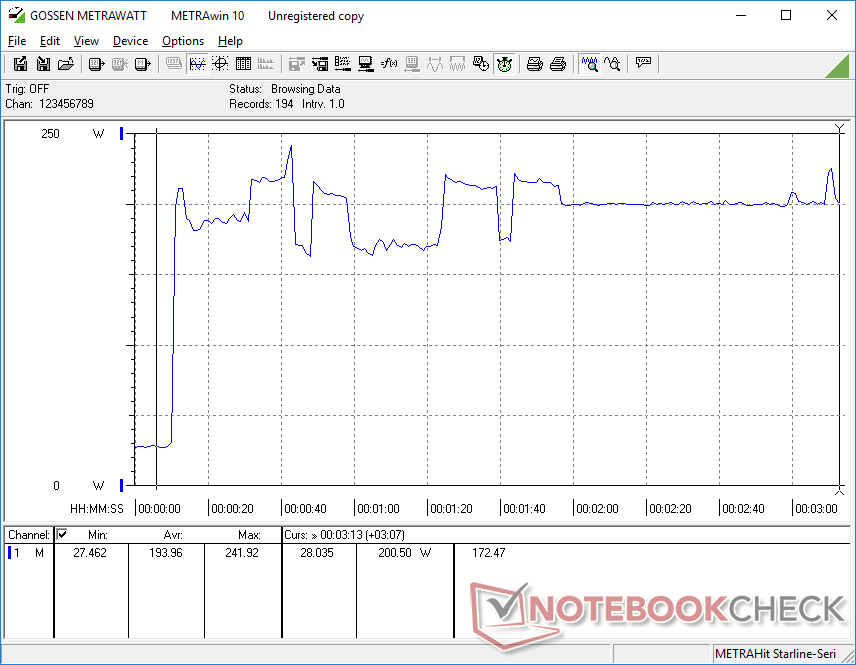
Genel tüketim, önceki yılın modelinde kaydedilenden daha yüksek. Bu, Intel'in yeni 12. nesil işlemcisinin daha yüksek güç talepleri, daha yüksek RTX 3060 TGP ve FX507'nin daha büyük dahili soğutma çözümü nedeniyle beklenebilir. Çalışan Witcher 3 , 2021 Asus FX506'ya kıyasla grafik performansında yüzde 10 ila 20'lik bir artış için yıldan yıla yaklaşık yüzde 20 daha fazla güç tüketiyor.
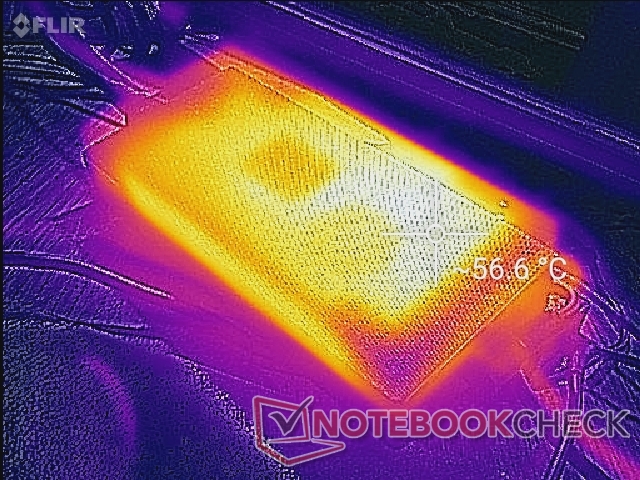
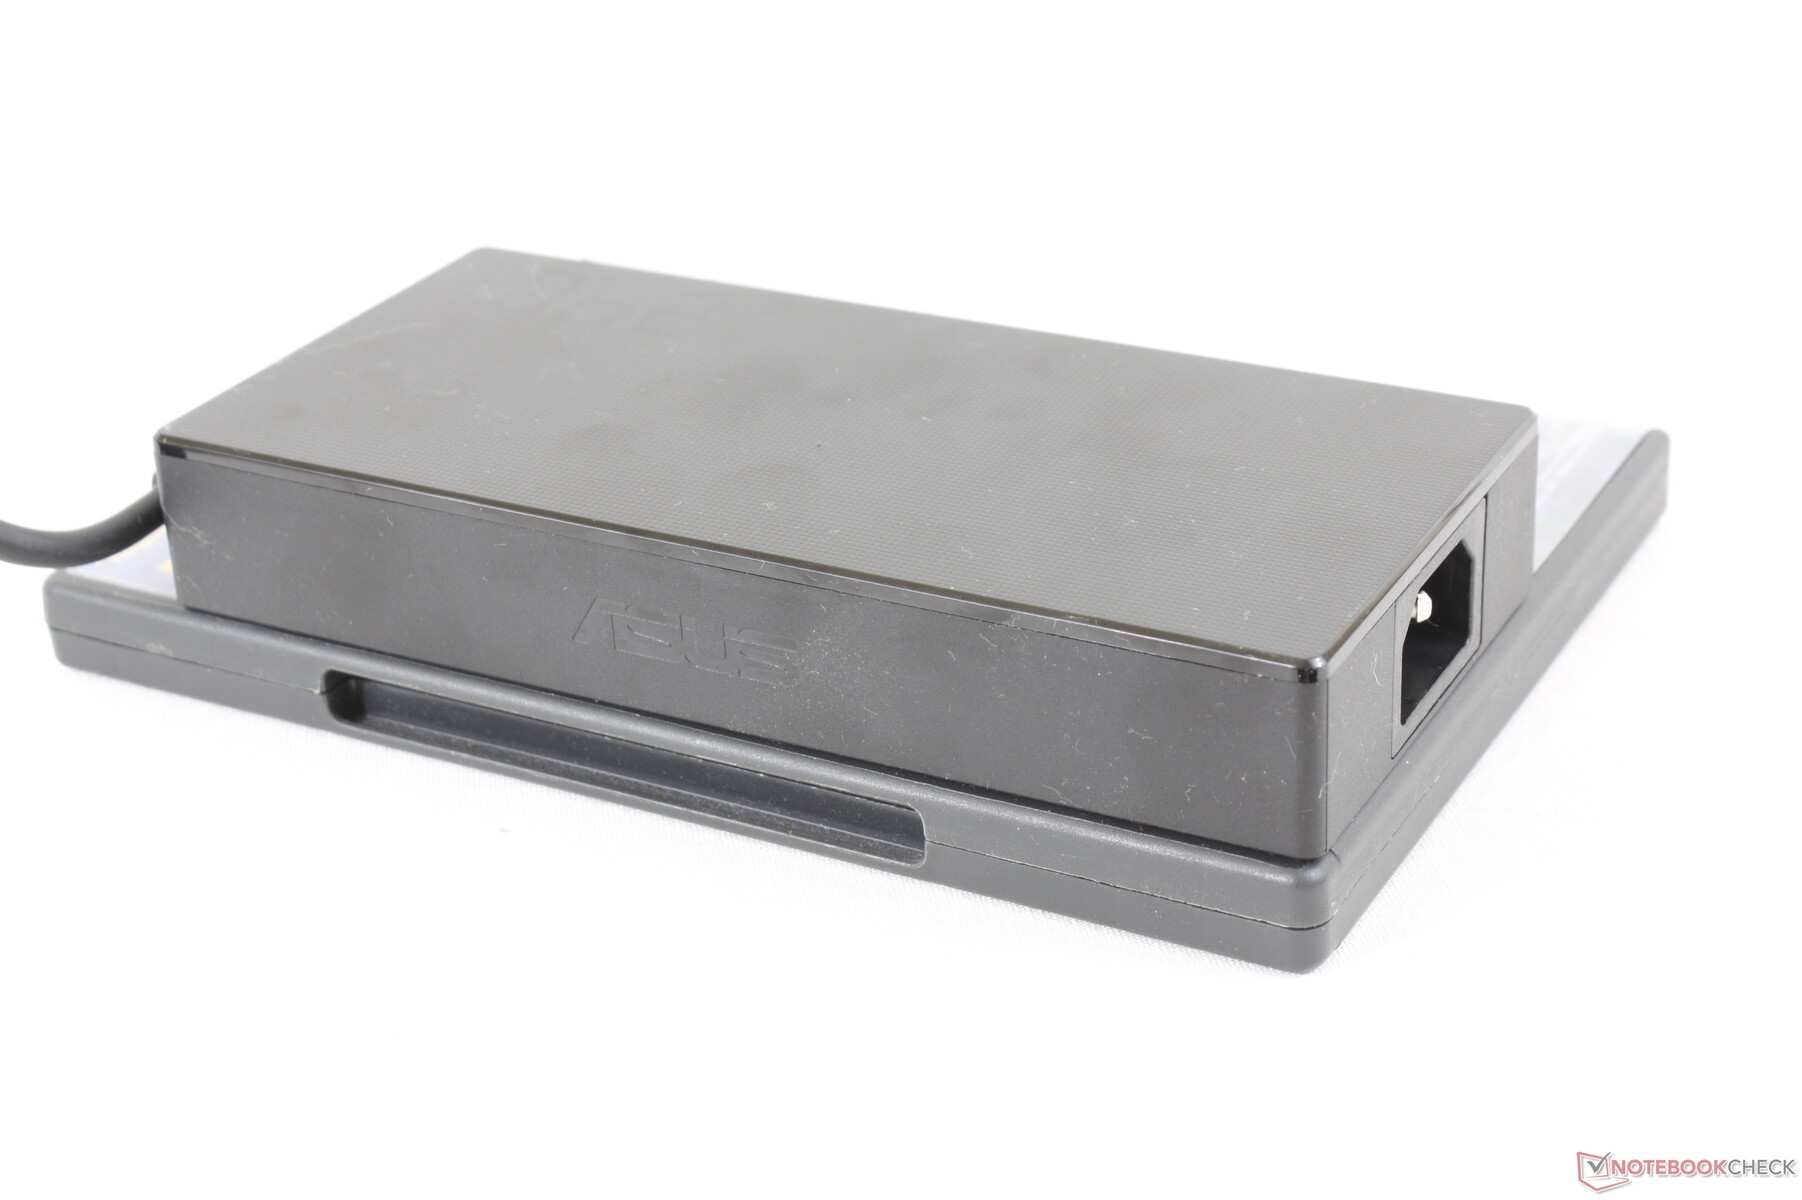
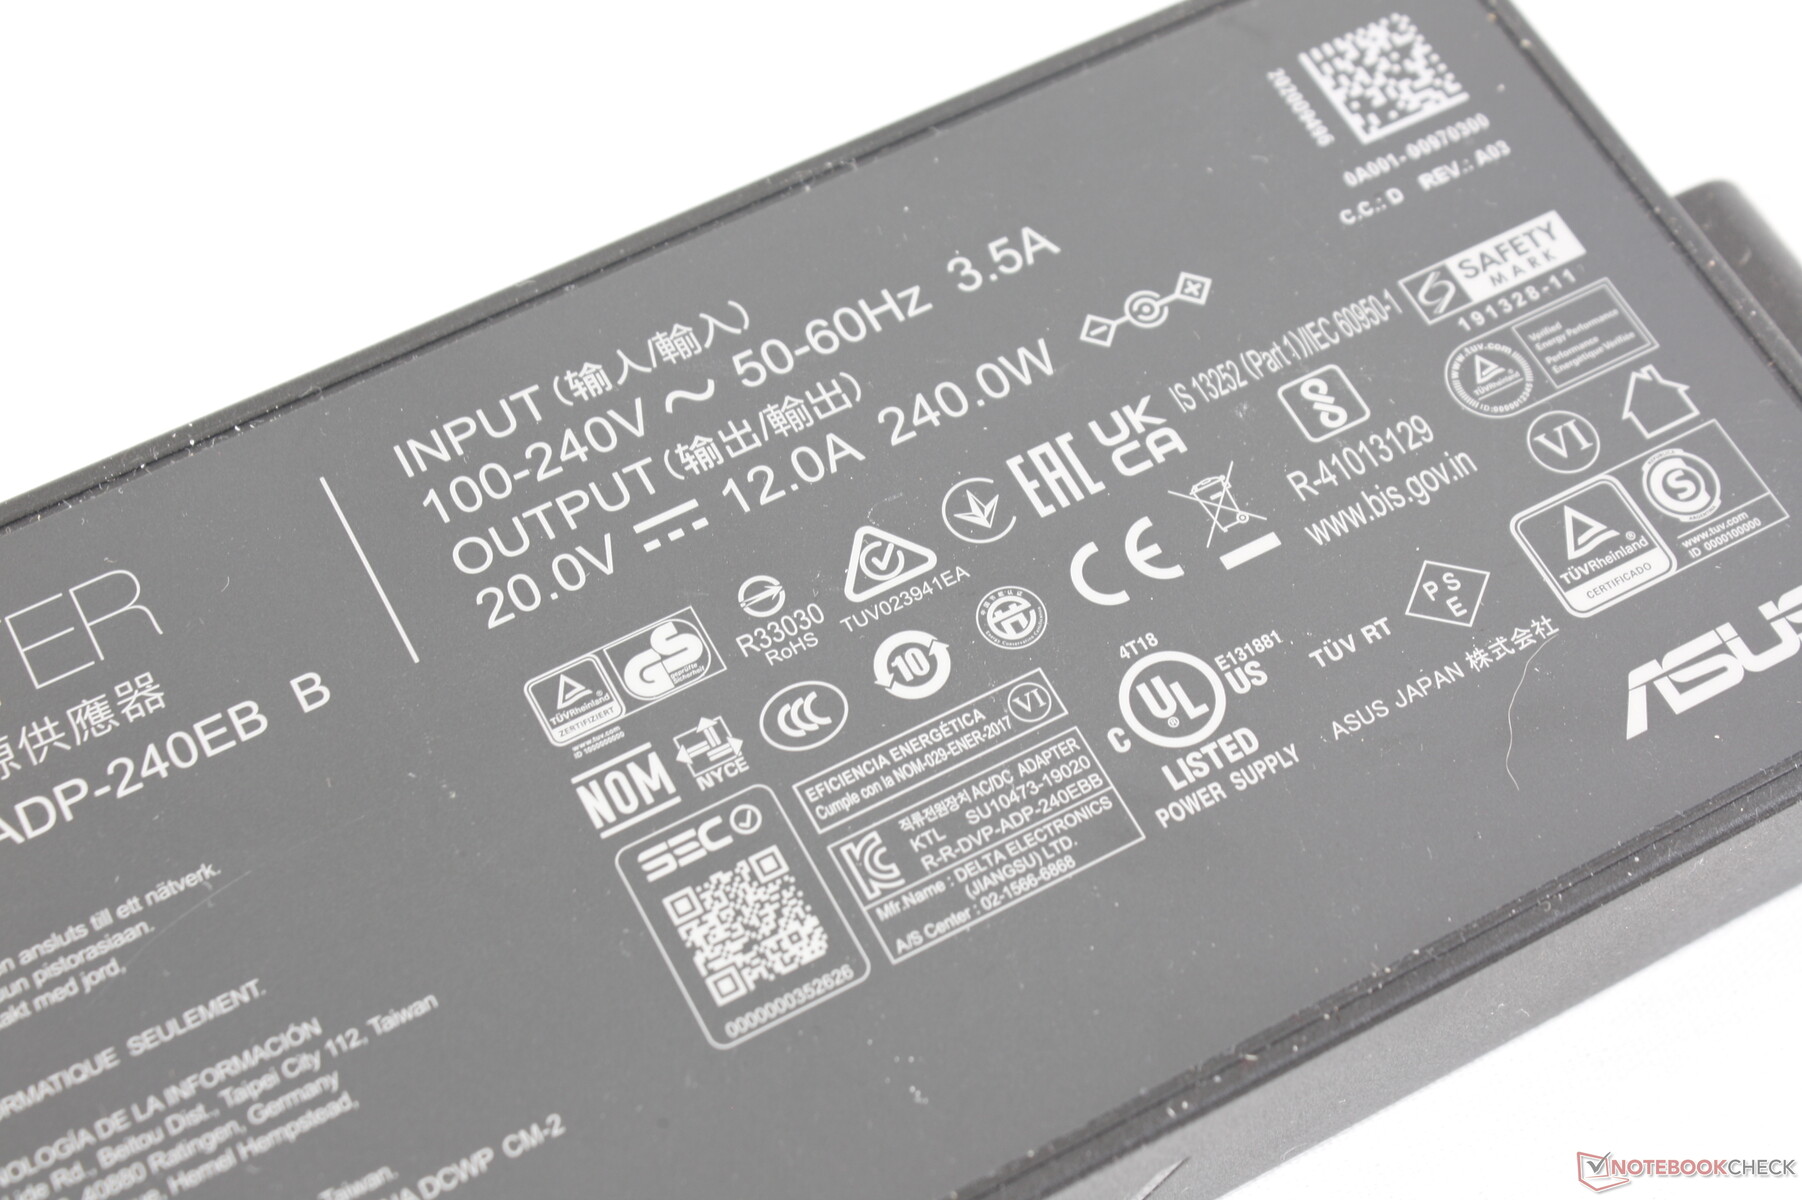
FX507, güce daha fazla aç olan dahili parçaları daha iyi barındırmak için FX506 ile birlikte verilen 200 W AC adaptöre kıyasla daha yüksek güçlü bir 240 W AC adaptörle birlikte gönderilir. Yeni adaptör daha sonra eski adaptörden daha büyüktür (~16,5 x 7,6 x 2,6 cm vs. ~15,1 x 7,2 x 2,3 cm).
| Kapalı / Bekleme modu | |
| Boşta | |
| Çalışırken |
|
Key:
min: | |
| Asus TUF Gaming F15 FX507ZM i7-12700H, GeForce RTX 3060 Laptop GPU, SK Hynix HFM001TD3JX013N, IPS, 1920x1080, 15.6" | Asus TUF Gaming F15 FX506HM i7-11800H, GeForce RTX 3060 Laptop GPU, SK Hynix HFM001TD3JX013N, IPS, 1920x1080, 15.6" | Asus TUF Dash F15 FX516PR i7-11370H, GeForce RTX 3070 Laptop GPU, SK Hynix HFM001TD3JX013N, IPS, 1920x1080, 15.6" | Asus ROG Strix Scar 15 G533QS R9 5900HX, GeForce RTX 3080 Laptop GPU, ADATA Swordfish 2 TB, IPS, 2560x1440, 15.6" | Asus Zephyrus S15 GX502L i7-10875H, GeForce RTX 2070 Super Mobile, WDC PC SN730 SDBPNTY-1T00, IPS, 1920x1080, 15.6" | Asus ZenBook Pro Duo UX582 LR-1BH2 i7-10870H, GeForce RTX 3070 Laptop GPU, Samsung PM981a MZVLB1T0HBLR, OLED + IPS, 3840x2160, 15.6" | |
|---|---|---|---|---|---|---|
| Power Consumption | -2% | 9% | -24% | -12% | -4% | |
| Idle Minimum * (Watt) | 6.3 | 9.5 -51% | 9 -43% | 11.2 -78% | 7 -11% | 9 -43% |
| Idle Average * (Watt) | 9.8 | 12.1 -23% | 11 -12% | 16.4 -67% | 13 -33% | 14 -43% |
| Idle Maximum * (Watt) | 26.5 | 22.5 15% | 16 40% | 29.4 -11% | 25 6% | 15 43% |
| Load Average * (Watt) | 103.8 | 99.5 4% | 107 -3% | 106.2 -2% | 148 -43% | 107.2 -3% |
| Witcher 3 ultra * (Watt) | 189 | 157 17% | 121 36% | 189 -0% | 175 7% | 156 17% |
| Load Maximum * (Watt) | 241.9 | 173.5 28% | 162 33% | 213.6 12% | 232 4% | 235 3% |
* ... daha küçük daha iyidir
Witcher 3 enerji tüketimi / Stresstest
Harici bir monitörle enerji tüketimi
Batarya Ömrü — Son Nesil Modelden Daha Kısa
WLAN çalışma süreleri, aralarında aynı 90 Wh kapasiteli pili taşımasına rağmen, geçen yılki modelde kaydettiğimizden birkaç saat daha kısa. Bunu, MSHybrid etkinken Dengeli güç profilinde iki kez test ettik ve aynı sonuçları elde ettik. Yıldan yıla daha kısa olan WLAN çalışma süreleri, 2021 Razer Blade 15 ile 2022 Razer Blade 15 arasında gözlemlediğimiz ile tutarlı .
Birlikte verilen AC adaptörüyle boştan tam kapasiteye şarj etmek yaklaşık 90 dakika sürer. Ne yazık ki bu model, Razer Blade serisi veya MSI GS serisinin aksine USB-C şarjını desteklemiyor.
| Asus TUF Gaming F15 FX507ZM i7-12700H, GeForce RTX 3060 Laptop GPU, 90 Wh | Asus TUF Gaming F15 FX506HM i7-11800H, GeForce RTX 3060 Laptop GPU, 90 Wh | Asus TUF Dash F15 FX516PR i7-11370H, GeForce RTX 3070 Laptop GPU, 76 Wh | Asus ROG Strix Scar 15 G533QS R9 5900HX, GeForce RTX 3080 Laptop GPU, 90 Wh | Asus Zephyrus S15 GX502L i7-10875H, GeForce RTX 2070 Super Mobile, 76 Wh | Asus ZenBook Pro Duo UX582 LR-1BH2 i7-10870H, GeForce RTX 3070 Laptop GPU, 92 Wh | |
|---|---|---|---|---|---|---|
| Pil Çalışma Süresi | 39% | 46% | 16% | -15% | 36% | |
| Reader / Idle (h) | 15.8 | 11 -30% | 16 1% | 11.1 -30% | 8.7 -45% | |
| WiFi v1.3 (h) | 4.8 | 7.9 65% | 9.1 90% | 7.3 52% | 3 -37% | 7.4 54% |
| Load (h) | 1.1 | 2 82% | 1.4 27% | 1.5 36% | 1.3 18% | |
| H.264 (h) | 8.2 |
Artılar
Eksiler
Son Görüş — 140 W GeForce RTX 3060 Ekran Kartı
Tüm kasa güncellemelerinin yanı sıra, FX507 en çok FX506'daki sadece 95 W'a kıyasla 140 W'lık çok daha yüksek TGP hedefiyle dikkat çekiyor . Nvidia, mobil RTX 3000 serisinin halefini henüz piyasaya sürmediğinden, her yerdeki PC üreticileri bu yıl aynı GeForce ekran kartları kullanıyor. Bu nedenle, aynı ekran kartından daha iyi grafik performansı sunmak için FX507'nin FX506'dan daha fazla güç tüketmesi gerekir. Sonuç, bir GeForce RTX 3060 dizüstü bilgisayarın şu anda aynı ekran kartı ile donatılmış diğer dizüstü bilgisayarların çoğundan daha hızlı olmasıdır.
Daha fazla güce aç bir sistemin bazı sonuçlarını hafifletmek için Asus, sıcaklıkları ve fan gürültüsünü kontrol altında tutmak için soğutma çözümünü yükseltti. FX507, genel olarak daha hafif olmasına rağmen önceki modelden önemli ölçüde daha sıcak veya daha yüksek değil.
FX507'nin daha zorlu işlemcileri, pil ömrünü ve AC adaptörünün boyutunu doğrudan etkiledi. Çoğu koşulda çalışma sürelerinin FX506'dan daha uzun olmasını beklemeyin ve eskisinden daha da büyük bir AC adaptörünü yanınızda taşımaya hazır olun. Sistemin üçüncü taraf USB-C adaptörleriyle şarj edilememesi talihsiz bir durumdur.
Klavye ve tıklama panelindeki değişiklikler, koyu gri yazı tipinin koyu tuş başlıklarıyla zayıf bir şekilde kontrast oluşturduğu düşünüldüğünde, karışık bir çantadır. Özel fare düğmeleri nedeniyle son nesil modelde sürükle ve bırak işlemleri daha kolaydır.
Fiyat ve Stok Durumu
Asus TUF Gaming F15 FX507ZM, şu anda Amazon'da 1750 USD karşılığında satın alınabiliyor.
Asus TUF Gaming F15 FX507ZM
- 03/26/2022 v7 (old)
Allen Ngo
Price comparison

