Captiva Advanced Gaming I74-121 (Clevo V150RND) incelemesi: Güçlü RTX 4060'a sahip ucuz bir dizüstü oyun bilgisayarı
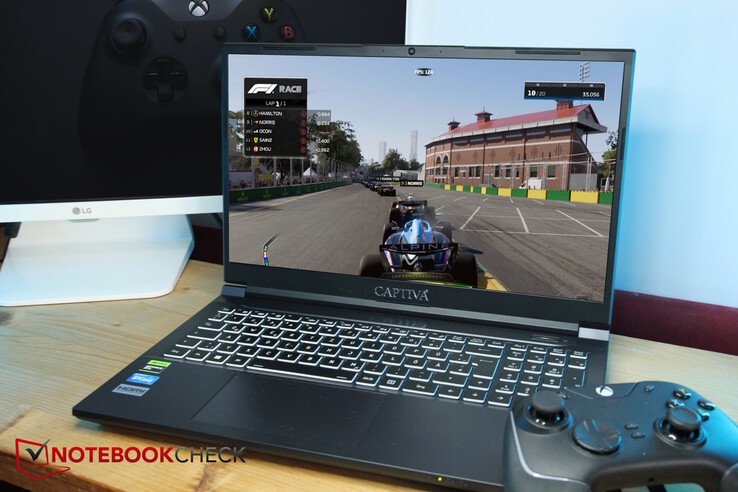
Seçkin birkaç çevrimiçi mağazada Captiva'nın (oyun) dizüstü bilgisayarlarını görmeye başlayabilirsiniz, ancak bu üretici kimdir? Captiva, Dachau merkezli bir Alman BT toptancısı olan Ecom Trading GmbH'nin bir yan kuruluşudur. Görünüşe bakılırsa, dizüstü bilgisayarlarının çoğu Çin'de üretiliyor. Captiva'nın dizüstü bilgisayarlarını daha önce hiç test etmediğimiz için, bunu yapmanın tam zamanı!
Captiva dizüstü bilgisayarın 17 inç ve 15 inç versiyonlarını bulabilirsiniz, bunlar temel olarak donanım kurulumunda farklılık gösterir. Sadece 17 inçlik olanlar isteğe bağlı olarak biri9-13900HX- 15 inçlik cihazlar yalnızca biri5-13500Hmonte edilmiştir. Buna ek olarak, test örneğimiz birRTX 4060. Alternatif olarak, dizüstü bilgisayarı birRTX 4070ve 17 inçlik versiyon da birRTX 4080.
Konfigürasyonumuz yaklaşık 1.800 ABD dolarına satılmaktadır. Rakipler arasında aşağıdaki gibi diğer tanıtım amaçlı oyun dizüstü bilgisayarları bulunmaktadırMSI Cyborg 15, Dell G15 5530, Lenovo Legion Slim 5 16APH8, Lenovo LOQ 15ve Schenker XMG Core 15 M22.
Karşılaştırmalı olarak olası rakipler
Derecelendirme | Tarih | Modeli | Ağırlık | Yükseklik | Boyut | Çözünürlük | Fiyat |
|---|---|---|---|---|---|---|---|
| 85.7 % v7 (old) | 09/2023 | Captiva Advanced Gaming I74-121 i5-13500H, GeForce RTX 4060 Laptop GPU | 2.3 kg | 29 mm | 15.60" | 1920x1080 | |
| 82.4 % v7 (old) | 06/2023 | MSI Cyborg 15 A12VF i7-12650H, GeForce RTX 4060 Laptop GPU | 2 kg | 22.9 mm | 15.60" | 1920x1080 | |
| 84.2 % v7 (old) | 07/2023 | Dell G15 5530 i7-13650HX, GeForce RTX 4060 Laptop GPU | 3 kg | 26.95 mm | 15.60" | 1920x1080 | |
| 87.7 % v7 (old) | 09/2023 | Lenovo Legion Slim 5 16APH8 R7 7840HS, GeForce RTX 4060 Laptop GPU | 2.4 kg | 25.2 mm | 16.00" | 2560x1600 | |
| 85.7 % v7 (old) | 09/2023 | Lenovo LOQ 15APH8 R7 7840HS, GeForce RTX 4050 Laptop GPU | 2.5 kg | 25.2 mm | 15.60" | 1920x1080 | |
| 87.9 % v7 (old) | Schenker XMG Core 15 (M22) R7 6800H, GeForce RTX 3060 Laptop GPU | 2.1 kg | 23 mm | 15.60" | 2560x1440 |
Vaka - Captiva barebone bir sırdır (Clevo)
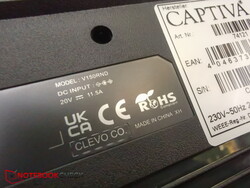
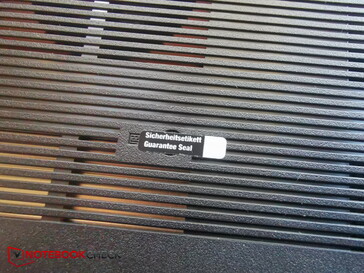
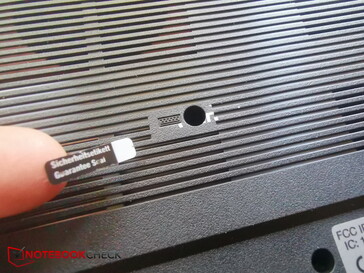
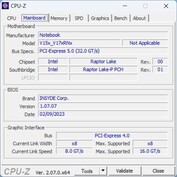
Sorulduğunda Captiva bize hangi barebone'un kullanıldığını söylemeyi reddetti - görünüşe göre bunlar "özellikle Captiva için" yapılmış. Ancak, alt kısımdaki bir etiket bize üretici Clevo'nun işin içinde olduğunu gösteriyor. Captiva'nın bu bilgiyi neden sakladığı bizim için belirsiz. Clevo barebone'un Clevo V150RND olduğunu tespit ettik.
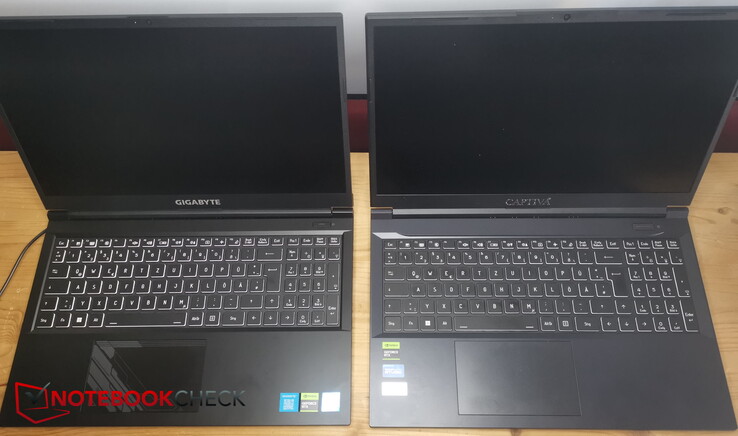
Dizüstü bilgisayarın iç kasası katlanıp açıldığında Gigabyte G5'i andırıyor. Klavyesi hafifçe girintilidir ve düzeni de benzerdir - ancak tam olarak aynı gibi görünmemektedir.
Top 10
» Top 10 Multimedia Notebook listesi
» Top 10 oyun notebooku
» Top 10 bütçeye uygun Ofis/İş Notebook Listesi
» Top 10 Premium Ofis/İş notebookları
» Top 10 Çalışma istasyonu laptopları
» Top 10 Subnotebook listesi
» Top 10 Ultrabooklar
» En iyi 10 dönüştürülebilir modeli
» Seçimi en iyi 10 tablet
» Notebookcheck Top 10 Windows Tabletleri
» Top 10 Subnotebook listesi
» NotebookCheck tarafından incelenen en iyi Notebook ekranları
» Notebookcheck'in 500 Euro altındaki en iyi 10 Notebook listesi
» NotebookCheck tarafından seçilen 300 Euro altındaki en iyi 10 Notebook
» Notebookcheck'in 500 Euro altındaki en iyi 10 Notebook listesi
» Notebookcheck'in Top 10 akıllı telefon listesi
» Notebookcheck'in Top 10 hafif oyun notebookları
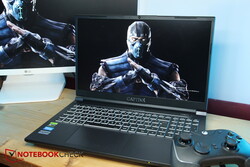
Dışarıdan bakıldığında, ayak izleri benzer olsa bile her iki model de oldukça farklı görünüyor. Captiva dizüstü bilgisayar G5'ten biraz daha kalın. Üst kısımda, mat siyah yüzeye yerleştirilmiş mavi, eğimli LED şeritler var - bir köşede gümüş "Captiva" yazısı parlıyor. Ayrıca, I74-121'in üst kısmı tamamen düz değil - bunun yerine hafif bir kıvrımı veya kavisi var.
Kullanılan tek malzeme plastik, ancak tabanı hala yeterince sert ve bükmeye çalıştığınızda herhangi bir çatlama sesi duymuyorsunuz. Olağandışı bir boşluk fark etmedik ve yapısı genel olarak oldukça iyi.
Geniş menteşe iyi ama mükemmel değil - sadece 135 ila 140 derecelik maksimum açılma açısına izin veriyor.
Minimalist tasarımının bir sonucu olarak Captiva dizüstü bilgisayar, özellikle derinlik söz konusu olduğunda, karşılaştırma alanındaki en küçük cihazlardan biridir. Buna karşılık, aynı zamanda bu karşılaştırmadaki en kalın dizüstü bilgisayarlardan biridir. Üretici 28 mm'lik bir kalınlık belirtmiş ancak biz cihazın arkasındaki orta kenar boyunca en az 29 mm ölçtük.
Ortalama bir ağırlığa sahip - Schenker ve MSI cihazları biraz daha hafif ve diğerleri, özellikle Dell G15 daha ağır.
Bağlanabilirlik - Biraz eski
İlk bakışta dizüstü bilgisayarın en önemli bağlantı seçeneklerine sahip olduğu görülüyor. İkinci bakışta durumun böyle olmadığı ya da en azından modasının geçtiği anlaşılıyor.
USB-A bağlantı noktalarından biri hala tip 2.0, Thunderbolt eksik ve ayrıca bir SD kart okuyucusu da yok. En azından MiniDP bağlantısı sayesinde dizüstü bilgisayar VR'a hazır. İki USB-A 3.2 bağlantı noktasından biri Gen2 hızına sahipken diğeri sadece Gen1. Hangisinin daha hızlı bağlantı olduğu dışarıdan anlaşılamıyor.
Sol taraftaki her iki USB-A bağlantı noktası birbirine çok yakın yerleştirilmiş, bu da kalın USB belleklerin yan yana bağlanamayacağı anlamına geliyor. Diğer tüm portlar arasında yeterli boşluk var. Bununla birlikte, ağ bağlantısı sağ tarafta - sağ elinizle bir fare kullanıyorsanız biraz can sıkıcı.
İletişim
Captiva dizüstü bilgisayarın Intel AX211 modülü WiFi 6E'yi destekler, yani 2,4 GHz, 6 GHz ve 6GHz frekanslarını kullanarak alabilir ve çıkış yapabilir. 6 GHz kullanıldığında aktarım hızları iyidir, ancak 5 GHz kullanıldığında dizüstü bilgisayar karşılaştırma alanındaki en zayıf olanıdır.
| Networking | |
| iperf3 transmit AXE11000 | |
| MSI Cyborg 15 A12VF | |
| Dell G15 5530 | |
| Lenovo Legion Slim 5 16APH8 | |
| Ortalama Intel Wi-Fi 6E AX211 (64 - 1921, n=270) | |
| Sınıf ortalaması Gaming (469 - 1862, n=119, son 2 yıl) | |
| Schenker XMG Core 15 (M22) | |
| Lenovo LOQ 15APH8 | |
| Captiva Advanced Gaming I74-121 | |
| iperf3 receive AXE11000 | |
| MSI Cyborg 15 A12VF | |
| Dell G15 5530 | |
| Lenovo Legion Slim 5 16APH8 | |
| Sınıf ortalaması Gaming (680 - 1745, n=119, son 2 yıl) | |
| Ortalama Intel Wi-Fi 6E AX211 (582 - 1890, n=270) | |
| Schenker XMG Core 15 (M22) | |
| Captiva Advanced Gaming I74-121 | |
| Lenovo LOQ 15APH8 | |
| iperf3 transmit AXE11000 6GHz | |
| Lenovo Legion Slim 5 16APH8 | |
| Captiva Advanced Gaming I74-121 | |
| Sınıf ortalaması Gaming (648 - 2355, n=47, son 2 yıl) | |
| Ortalama Intel Wi-Fi 6E AX211 (385 - 1851, n=224) | |
| Schenker XMG Core 15 (M22) | |
| iperf3 receive AXE11000 6GHz | |
| Captiva Advanced Gaming I74-121 | |
| Sınıf ortalaması Gaming (975 - 1788, n=46, son 2 yıl) | |
| Ortalama Intel Wi-Fi 6E AX211 (700 - 1857, n=224) | |
| Lenovo Legion Slim 5 16APH8 | |
| Schenker XMG Core 15 (M22) | |
Web kamerası
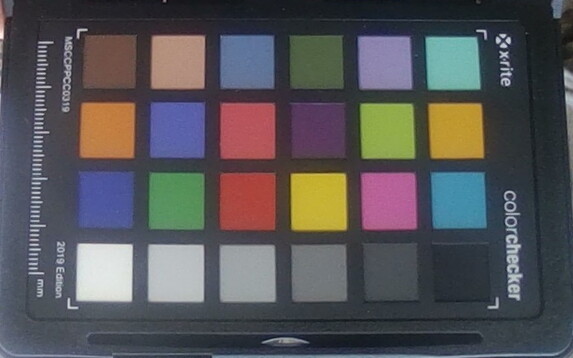
Web kamerası da tamamen güncel değil. Dizüstü bilgisayar modern bir Full HD web kamerası yerine 720p çözünürlüğe sahip eski bir HD web kamerası kullanıyor.
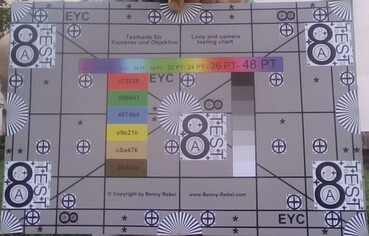
Renk sapması güzel ve düşük ancak iyi aydınlatma koşullarında bile görüntü oldukça grenli ve fazla ayrıntı göstermiyor.
Güvenlik
Intel yongası sayesinde TPM yerleşiktir ve cihaz bir Kensington kilidine sahiptir - ancak birçok oyun dizüstü bilgisayarında olduğu gibi Captiva cihazında da parmak izi tarayıcısı yoktur.
Teslimat ve garanti kapsamı
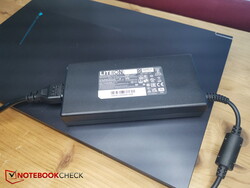
Dizüstü bilgisayarın kendisi ve tescilli güç kaynağının yanı sıra, teslimat kapsamında tüm olağan evraklar, 2 küçük vida ve bir sürücü CD'si yer alıyor. Dizüstü bilgisayarın bir CD sürücüsü olmadığı için sonuncusu biraz işe yaramaz - Schenker'in içerdiği gibi bir sürücü USB çubuğu çok daha mantıklı olurdu.
Bakım
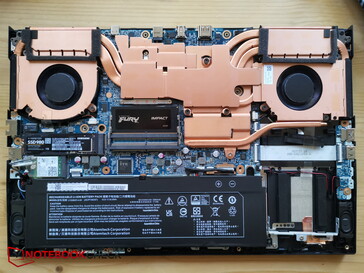
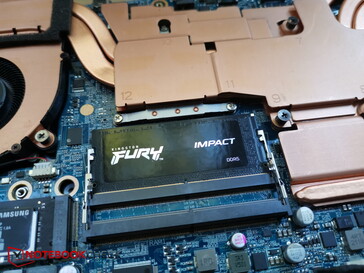
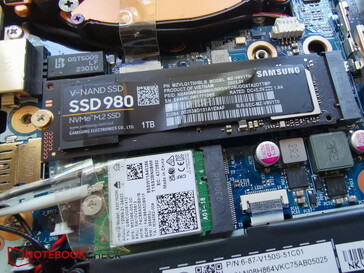
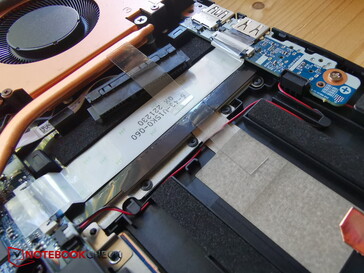
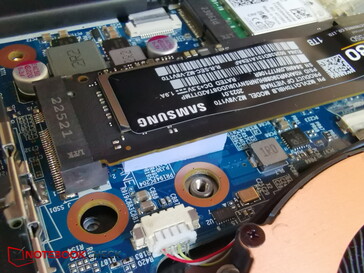
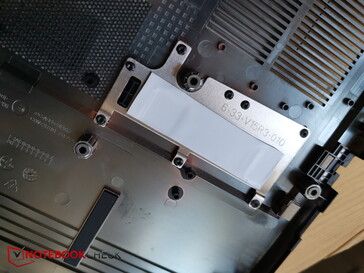
Vidaları söktükten sonra, herhangi bir alete ihtiyaç duymadan alt plakayı çıkarmak çok kolay. Altta, iki fan ve aralarında çok sayıda bakırdan oluşan soğutma sistemini, biri boş olan iki RAM bankasını, değiştirilebilir SSD'yi ve değiştirilebilir WiFi modülünü görebilirsiniz.
İkinci bir NVMe yuvası yerine, 2,5 inç sürücüleri barındırabilen bir SATA yuvası vardır. Garanti mührü dışında, bu dizüstü bilgisayarda bakım çalışması yapmak çok kolaydır.
Giriş cihazları - Sağlam ve günlük kullanıma uygun
Klavye
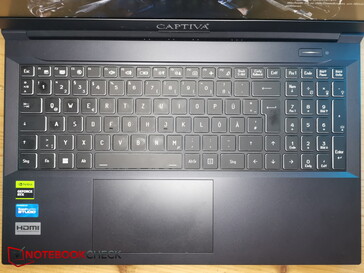
Klavye düzeni işlevsel ve sorunsuzdur. Ok tuşları normal boyutta (yaklaşık 15 x 15 mm), sayısal tuş takımı daha küçük tuşlara sahip (15 x 12,6 mm) ve sağ tarafa sorunsuz bir şekilde bağlanıyor. Sağ üstte, güç için ekstra bir düğme var.
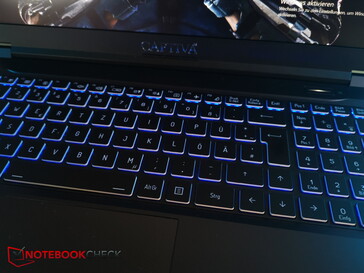
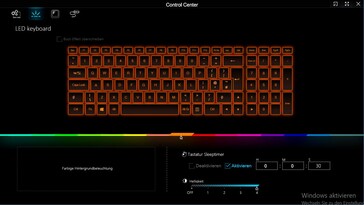
Tuşlar rahat, çok kısa olmayan bir kaldırışa ve iyi bir geri bildirime sahip. Yazarken çıkan sesler çok ılımlı. Ayrıca, tuş etiketleri çok okunaklı ve tek bölgeli çok renkli arka aydınlatması sayesinde karanlık ışık koşullarında da destekleniyor.
Dokunmatik yüzey
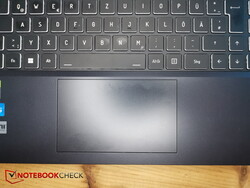
Sayısal tuş takımının bir sonucu olarak dokunmatik yüzey (12 x 7,2 cm) hafifçe sola yerleştirilmiş ve bu da doğru bir his veriyor. Yavaş hareketler sırasında veya elleriniz terlediğinde biraz yapışabiliyor ancak normal durumlarda parmaklarınız yüzey üzerinde sorunsuzca kayıyor.
Entegre tuşlar da iyi seviyede geri bildirime sahip - tıklama sesi biraz daha yüksek ama rahatsız edici değil.
Ekran - Gelişmiş Oyun yalnızca Full HD'ye sahiptir
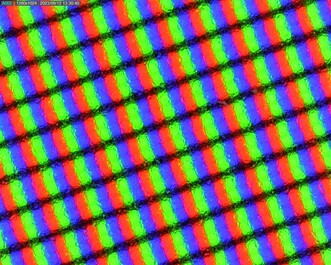
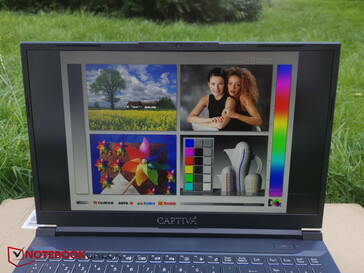
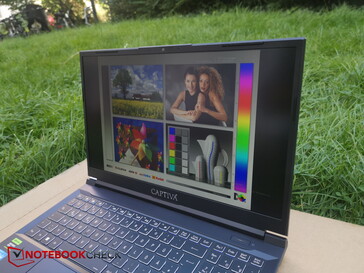
Captiva, dizüstü bilgisayara BOE'nin 144 Hz Full HD panelini yerleştirmiş. Aynı paneli Gigabyte A5 K1 içinde test ettik. Burada ekran biraz daha parlak (324'e karşı 281 nit) ancak buna karşılık siyah değeri ve kontrastı biraz daha zayıf. Yüzde 90'lık aydınlatması bile yeterli.
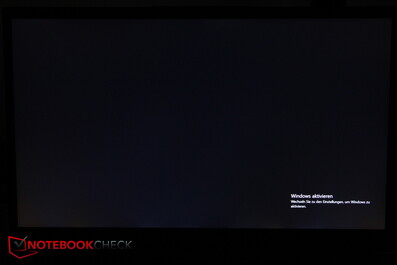
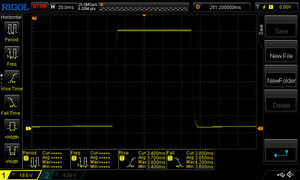
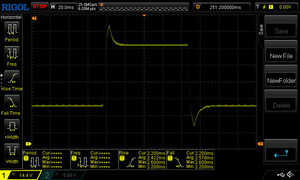
Panelin tepki hızları iyi, herhangi bir PWM titremesi fark etmedik ve sadece zar zor fark edilebilen az miktarda arka ışık akması var.
| |||||||||||||||||||||||||
Aydınlatma: 90 %
Batarya modunda parlaklık: 346 cd/m²
Kontrast: 989:1 (Siyah: 0.35 cd/m²)
ΔE ColorChecker Calman: 4.12 | ∀{0.5-29.43 Ø4.77}
calibrated: 1.22
ΔE Greyscale Calman: 4.81 | ∀{0.09-98 Ø5}
66% AdobeRGB 1998 (Argyll 3D)
93.2% sRGB (Argyll 3D)
64% Display P3 (Argyll 3D)
Gamma: 2.31
CCT: 7633 K
| Captiva Advanced Gaming I74-121 BOE08B3, IPS, 1920x1080, 15.6" | MSI Cyborg 15 A12VF AU Optronics B156HAN15.1, IPS, 1920x1080, 15.6" | Dell G15 5530 AUO B156HAN, IPS, 1920x1080, 15.6" | Lenovo Legion Slim 5 16APH8 BOE NJ NE160QDM-NYC, IPS, 2560x1600, 16" | Lenovo LOQ 15APH8 BOE NJ NE156FHM-NX3, IPS, 1920x1080, 15.6" | Schenker XMG Core 15 (M22) CSOT MNF601CA1-1, IPS, 2560x1440, 15.6" | |
|---|---|---|---|---|---|---|
| Display | -34% | 11% | 7% | -36% | 7% | |
| Display P3 Coverage (%) | 64 | 42.3 -34% | 73.1 14% | 69.3 8% | 40.2 -37% | 68.8 8% |
| sRGB Coverage (%) | 93.2 | 62.6 -33% | 98.4 6% | 100 7% | 60.2 -35% | 99.3 7% |
| AdobeRGB 1998 Coverage (%) | 66 | 43.7 -34% | 74.4 13% | 70 6% | 41.5 -37% | 69.9 6% |
| Response Times | -213% | 31% | -59% | -490% | -111% | |
| Response Time Grey 50% / Grey 80% * (ms) | 5 ? | 22 ? -340% | 3.39 ? 32% | 10.7 ? -114% | 42.7 ? -754% | 16 ? -220% |
| Response Time Black / White * (ms) | 7.55 ? | 14 ? -85% | 5.35 ? 29% | 7.8 ? -3% | 24.5 ? -225% | 7.6 ? -1% |
| PWM Frequency (Hz) | 21620 ? | |||||
| Screen | -19% | -0% | 27% | -14% | -0% | |
| Brightness middle (cd/m²) | 346 | 247 -29% | 320 -8% | 371.6 7% | 346.2 0% | 378 9% |
| Brightness (cd/m²) | 324 | 234 -28% | 316 -2% | 343 6% | 329 2% | 371 15% |
| Brightness Distribution (%) | 90 | 89 -1% | 94 4% | 84 -7% | 81 -10% | 93 3% |
| Black Level * (cd/m²) | 0.35 | 0.25 29% | 0.21 40% | 0.44 -26% | 0.31 11% | 0.33 6% |
| Contrast (:1) | 989 | 988 0% | 1524 54% | 845 -15% | 1117 13% | 1145 16% |
| Colorchecker dE 2000 * | 4.12 | 3.78 8% | 4.55 -10% | 1.52 63% | 4.19 -2% | 2.84 31% |
| Colorchecker dE 2000 max. * | 7.78 | 6.42 17% | 9.83 -26% | 2.68 66% | 19.19 -147% | 5.51 29% |
| Colorchecker dE 2000 calibrated * | 1.22 | 3.94 -223% | 1.51 -24% | 0.33 73% | 1.66 -36% | 2.75 -125% |
| Greyscale dE 2000 * | 4.81 | 2.16 55% | 6.2 -29% | 1.2 75% | 2.6 46% | 4.08 15% |
| Gamma | 2.31 95% | 2.33 94% | 2.07 106% | 2.1 105% | 2.19 100% | 2.4 92% |
| CCT | 7633 85% | 6906 94% | 6479 100% | 6503 100% | 6749 96% | 5841 111% |
| Toplam Ortalama (Program / Ayarlar) | -89% /
-50% | 14% /
7% | -8% /
10% | -180% /
-87% | -35% /
-14% |
* ... daha küçük daha iyidir
Eski çalışmalarda, panel optimumun altında kalibre edilmiştir ve renk sapmaları oldukça yüksektir. Bir XRite renk ölçüm cihazı ve Calman yazılımı yardımıyla yapılan kalibrasyon, renk ve gri tonlama DeltaE değerlerini önemli ölçüde düşürdü. Öncesinde sapmalar 4'ün üzerindeyken sonrasında 1 civarında ölçülmüştür.
Kalibre edilmiş icc profilimizi biraz daha yukarı kaydırırsanız ücretsiz olarak indirebilirsiniz.
Yanıt Sürelerini Görüntüle
| ↔ Tepki Süresi Siyahtan Beyaza | ||
|---|---|---|
| 7.55 ms ... yükseliş ↗ ve sonbahar↘ birleşimi | ↗ 3.7 ms yükseliş | |
| ↘ 3.85 ms sonbahar | ||
| Ekran, testlerimizde çok hızlı yanıt oranları gösteriyor ve hızlı oyun oynamaya çok uygun olmalı. Karşılaştırıldığında, test edilen tüm cihazlar 0.1 (minimum) ile 240 (maksimum) ms arasında değişir. » Tüm cihazların 21 %'si daha iyi. Bu, ölçülen yanıt süresinin test edilen tüm cihazların ortalamasından (20.2 ms) daha iyi olduğu anlamına gelir. | ||
| ↔ Tepki Süresi %50 Griden %80 Griye | ||
| 5 ms ... yükseliş ↗ ve sonbahar↘ birleşimi | ↗ 2.422 ms yükseliş | |
| ↘ 2.578 ms sonbahar | ||
| Ekran, testlerimizde çok hızlı yanıt oranları gösteriyor ve hızlı oyun oynamaya çok uygun olmalı. Karşılaştırıldığında, test edilen tüm cihazlar 0.165 (minimum) ile 636 (maksimum) ms arasında değişir. » Tüm cihazların 16 %'si daha iyi. Bu, ölçülen yanıt süresinin test edilen tüm cihazların ortalamasından (31.5 ms) daha iyi olduğu anlamına gelir. | ||
Ekran Titremesi / PWM (Darbe Genişliği Modülasyonu)
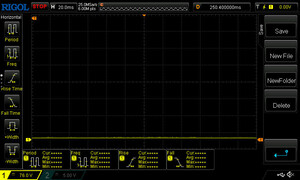
| Ekran titriyor / PWM algılanmadı | |||
Karşılaştırıldığında: Test edilen tüm cihazların %53 %'si ekranı karartmak için PWM kullanmıyor. PWM tespit edilirse, ortalama 8070 (minimum: 5 - maksimum: 343500) Hz ölçüldü. | |||
Performans - RTX 4060 (140 W) ile i5-13500H
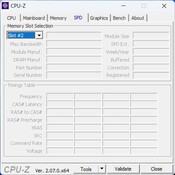
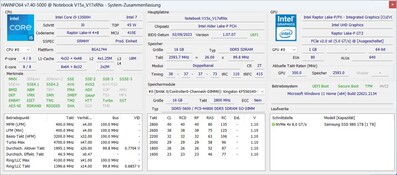
15 inçlik modelimiz şu özelliklerle donatılmıştırCore i5-13500H, birRTX 406016 GB RAM ve 1 TB SSD ile giriş seviyesinden orta seviyeye kadar bir oyun dizüstü bilgisayarıdır. 16:9 Full HD ekranı ve nispeten düşük fiyatı, daha çok ekonomik bir cihaz olarak sınıflandırılabileceğini gösteriyor.
Alternatif olarak, dizüstü bilgisayarı birRTX 4070rTX 4060 yerine - ancak yalnızca 17 inç modeller size bir RTX 4060 seçme seçeneği sunar.RTX 4080yanı sıra önemli ölçüde daha hızlı Intel HX işlemciler.
Test koşulları
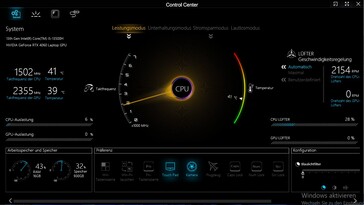
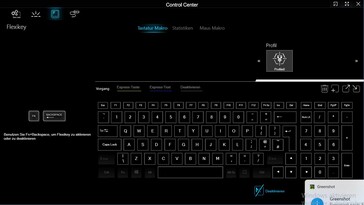
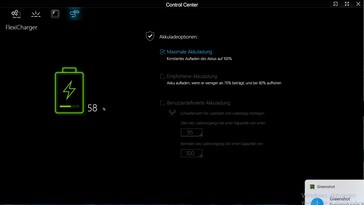
Kontrol Merkezi Captiva'ya yüklenmiştir. Performans, klavye, web kamerası ve benzerlerini kontrol etmek için olağan ayarlar vardır. Dört performans modu arasından seçim yapılabilir: performans modu, eğlence modu, güç tasarrufu modu ve sessiz mod.
En iyi benchmark sonuçlarını elde etmek için performans modunu seçtik, ancak testlerimiz sırasında diğer modlar hakkında da biraz daha fazla konuşacağız.
İşlemci
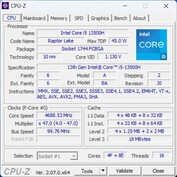
Intel Core i5-13500H, Ocak 2023'te piyasaya sürülen Raptor Lake H serisinden orta sınıf bir CPU'dur. CPU, dört performans çekirdeği ve sekiz verimlilik çekirdeğine sahiptir. Yalnızca P-çekirdekleri hiper iş parçacığını desteklediğinden bu, 16 iş parçacığına ulaşır - 2,6 ila 4,7 GHz'de çalışırlar (tek çekirdekli artırma, çok çekirdekli artırma maksimum 4,6 GHz'e izin verir). E-çekirdekleri 1,9 ila 3,5 GHz hızındadır.
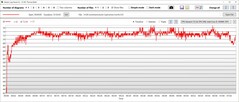
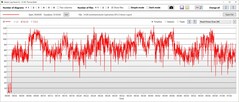
Cinebench R15 döngümüzde, performansı çok istikrarlı kaldı ve ilk çalıştırmalardan sonra performansta herhangi bir düşüş gözlemlemedik.
Tüm CPU testleri boyunca, Captiva'daki i5-13500H, veritabanımızdaki aynı CPU'ya sahip diğer tüm dizüstü bilgisayarlara kıyasla ortalamanın biraz üzerinde sonuçlar elde etti. HX CPU'lu Dell G15 hala biraz daha hızlı ancak mevcut AMD CPU'lara sahip Lenovo cihazları hız konusunda sadece küçük bir avantaja sahipti.
Pil modunda, TGP yaklaşık 20 watt'a düşüyor ve CPU'nun performansı yaklaşık yüzde 50 düşüyor.
Cinebench R15 Multi continuous test
Cinebench R23: Multi Core | Single Core
Cinebench R20: CPU (Multi Core) | CPU (Single Core)
Cinebench R15: CPU Multi 64Bit | CPU Single 64Bit
Blender: v2.79 BMW27 CPU
7-Zip 18.03: 7z b 4 | 7z b 4 -mmt1
Geekbench 5.5: Multi-Core | Single-Core
HWBOT x265 Benchmark v2.2: 4k Preset
LibreOffice : 20 Documents To PDF
R Benchmark 2.5: Overall mean
| CPU Performance rating | |
| Sınıf ortalaması Gaming | |
| Dell G15 5530 | |
| Lenovo Legion Slim 5 16APH8 | |
| Lenovo LOQ 15APH8 | |
| Captiva Advanced Gaming I74-121 | |
| MSI Cyborg 15 A12VF | |
| Ortalama Intel Core i5-13500H | |
| Schenker XMG Core 15 (M22) | |
| Cinebench R23 / Multi Core | |
| Sınıf ortalaması Gaming (5668 - 40970, n=145, son 2 yıl) | |
| Dell G15 5530 | |
| Lenovo Legion Slim 5 16APH8 | |
| Lenovo LOQ 15APH8 | |
| Captiva Advanced Gaming I74-121 | |
| Ortalama Intel Core i5-13500H (13542 - 16335, n=5) | |
| Schenker XMG Core 15 (M22) | |
| MSI Cyborg 15 A12VF | |
| Cinebench R23 / Single Core | |
| Sınıf ortalaması Gaming (1136 - 2267, n=145, son 2 yıl) | |
| Dell G15 5530 | |
| Lenovo Legion Slim 5 16APH8 | |
| Lenovo LOQ 15APH8 | |
| Captiva Advanced Gaming I74-121 | |
| MSI Cyborg 15 A12VF | |
| Ortalama Intel Core i5-13500H (1704 - 1799, n=5) | |
| Schenker XMG Core 15 (M22) | |
| Cinebench R20 / CPU (Multi Core) | |
| Sınıf ortalaması Gaming (2179 - 16108, n=144, son 2 yıl) | |
| Dell G15 5530 | |
| Lenovo Legion Slim 5 16APH8 | |
| Lenovo LOQ 15APH8 | |
| Captiva Advanced Gaming I74-121 | |
| Schenker XMG Core 15 (M22) | |
| MSI Cyborg 15 A12VF | |
| Ortalama Intel Core i5-13500H (5108 - 6212, n=5) | |
| Cinebench R20 / CPU (Single Core) | |
| Sınıf ortalaması Gaming (439 - 870, n=144, son 2 yıl) | |
| Dell G15 5530 | |
| Lenovo Legion Slim 5 16APH8 | |
| Lenovo LOQ 15APH8 | |
| Captiva Advanced Gaming I74-121 | |
| MSI Cyborg 15 A12VF | |
| Ortalama Intel Core i5-13500H (655 - 687, n=5) | |
| Schenker XMG Core 15 (M22) | |
| Cinebench R15 / CPU Multi 64Bit | |
| Sınıf ortalaması Gaming (1537 - 6271, n=144, son 2 yıl) | |
| Dell G15 5530 | |
| Lenovo LOQ 15APH8 | |
| Lenovo Legion Slim 5 16APH8 | |
| Captiva Advanced Gaming I74-121 | |
| Schenker XMG Core 15 (M22) | |
| Ortalama Intel Core i5-13500H (2234 - 2475, n=5) | |
| MSI Cyborg 15 A12VF | |
| Cinebench R15 / CPU Single 64Bit | |
| Sınıf ortalaması Gaming (188.8 - 343, n=143, son 2 yıl) | |
| Lenovo Legion Slim 5 16APH8 | |
| Lenovo LOQ 15APH8 | |
| Dell G15 5530 | |
| Captiva Advanced Gaming I74-121 | |
| Ortalama Intel Core i5-13500H (243 - 261, n=5) | |
| Schenker XMG Core 15 (M22) | |
| MSI Cyborg 15 A12VF | |
| Blender / v2.79 BMW27 CPU | |
| MSI Cyborg 15 A12VF | |
| Ortalama Intel Core i5-13500H (205 - 263, n=6) | |
| Schenker XMG Core 15 (M22) | |
| Captiva Advanced Gaming I74-121 | |
| Lenovo LOQ 15APH8 | |
| Lenovo Legion Slim 5 16APH8 | |
| Dell G15 5530 | |
| Sınıf ortalaması Gaming (80 - 517, n=140, son 2 yıl) | |
| 7-Zip 18.03 / 7z b 4 | |
| Sınıf ortalaması Gaming (23795 - 148086, n=142, son 2 yıl) | |
| Dell G15 5530 | |
| Lenovo Legion Slim 5 16APH8 | |
| Schenker XMG Core 15 (M22) | |
| Lenovo LOQ 15APH8 | |
| Captiva Advanced Gaming I74-121 | |
| MSI Cyborg 15 A12VF | |
| Ortalama Intel Core i5-13500H (50846 - 58567, n=6) | |
| 7-Zip 18.03 / 7z b 4 -mmt1 | |
| Lenovo Legion Slim 5 16APH8 | |
| Sınıf ortalaması Gaming (4199 - 7508, n=142, son 2 yıl) | |
| Lenovo LOQ 15APH8 | |
| Captiva Advanced Gaming I74-121 | |
| Dell G15 5530 | |
| Schenker XMG Core 15 (M22) | |
| MSI Cyborg 15 A12VF | |
| Ortalama Intel Core i5-13500H (5500 - 5885, n=6) | |
| Geekbench 5.5 / Multi-Core | |
| Sınıf ortalaması Gaming (4557 - 27010, n=141, son 2 yıl) | |
| Dell G15 5530 | |
| Lenovo Legion Slim 5 16APH8 | |
| MSI Cyborg 15 A12VF | |
| Ortalama Intel Core i5-13500H (9312 - 11465, n=5) | |
| Captiva Advanced Gaming I74-121 | |
| Schenker XMG Core 15 (M22) | |
| Lenovo LOQ 15APH8 | |
| Geekbench 5.5 / Single-Core | |
| Sınıf ortalaması Gaming (986 - 2474, n=141, son 2 yıl) | |
| Lenovo Legion Slim 5 16APH8 | |
| Dell G15 5530 | |
| Lenovo LOQ 15APH8 | |
| MSI Cyborg 15 A12VF | |
| Captiva Advanced Gaming I74-121 | |
| Ortalama Intel Core i5-13500H (1674 - 1762, n=5) | |
| Schenker XMG Core 15 (M22) | |
| HWBOT x265 Benchmark v2.2 / 4k Preset | |
| Sınıf ortalaması Gaming (7.7 - 44.3, n=142, son 2 yıl) | |
| Dell G15 5530 | |
| Lenovo Legion Slim 5 16APH8 | |
| Schenker XMG Core 15 (M22) | |
| Captiva Advanced Gaming I74-121 | |
| Lenovo LOQ 15APH8 | |
| MSI Cyborg 15 A12VF | |
| MSI Cyborg 15 A12VF | |
| Ortalama Intel Core i5-13500H (14.4 - 17.9, n=6) | |
| LibreOffice / 20 Documents To PDF | |
| Schenker XMG Core 15 (M22) | |
| Captiva Advanced Gaming I74-121 | |
| Ortalama Intel Core i5-13500H (44 - 65.5, n=5) | |
| Sınıf ortalaması Gaming (19 - 88.8, n=141, son 2 yıl) | |
| Dell G15 5530 | |
| Lenovo LOQ 15APH8 | |
| MSI Cyborg 15 A12VF | |
| Lenovo Legion Slim 5 16APH8 | |
| R Benchmark 2.5 / Overall mean | |
| Ortalama Intel Core i5-13500H (0.471 - 0.51, n=6) | |
| Captiva Advanced Gaming I74-121 | |
| Schenker XMG Core 15 (M22) | |
| MSI Cyborg 15 A12VF | |
| Lenovo LOQ 15APH8 | |
| Lenovo Legion Slim 5 16APH8 | |
| Sınıf ortalaması Gaming (0.3439 - 0.759, n=142, son 2 yıl) | |
| Dell G15 5530 | |
* ... daha küçük daha iyidir
AIDA64: FP32 Ray-Trace | FPU Julia | CPU SHA3 | CPU Queen | FPU SinJulia | FPU Mandel | CPU AES | CPU ZLib | FP64 Ray-Trace | CPU PhotoWorxx
| Performance rating | |
| Sınıf ortalaması Gaming | |
| Lenovo Legion Slim 5 16APH8 | |
| Lenovo LOQ 15APH8 | |
| Dell G15 5530 | |
| Schenker XMG Core 15 (M22) | |
| Captiva Advanced Gaming I74-121 | |
| Ortalama Intel Core i5-13500H | |
| MSI Cyborg 15 A12VF | |
| AIDA64 / FP32 Ray-Trace | |
| Lenovo LOQ 15APH8 | |
| Sınıf ortalaması Gaming (7192 - 85542, n=141, son 2 yıl) | |
| Lenovo Legion Slim 5 16APH8 | |
| Dell G15 5530 | |
| Schenker XMG Core 15 (M22) | |
| Captiva Advanced Gaming I74-121 | |
| Ortalama Intel Core i5-13500H (11081 - 15390, n=6) | |
| MSI Cyborg 15 A12VF | |
| AIDA64 / FPU Julia | |
| Sınıf ortalaması Gaming (35040 - 238426, n=141, son 2 yıl) | |
| Lenovo LOQ 15APH8 | |
| Lenovo Legion Slim 5 16APH8 | |
| Schenker XMG Core 15 (M22) | |
| Dell G15 5530 | |
| Captiva Advanced Gaming I74-121 | |
| MSI Cyborg 15 A12VF | |
| Ortalama Intel Core i5-13500H (56813 - 74251, n=6) | |
| AIDA64 / CPU SHA3 | |
| Sınıf ortalaması Gaming (1728 - 9817, n=141, son 2 yıl) | |
| Lenovo LOQ 15APH8 | |
| Lenovo Legion Slim 5 16APH8 | |
| Dell G15 5530 | |
| Captiva Advanced Gaming I74-121 | |
| Schenker XMG Core 15 (M22) | |
| Ortalama Intel Core i5-13500H (2621 - 3623, n=6) | |
| MSI Cyborg 15 A12VF | |
| AIDA64 / CPU Queen | |
| Lenovo Legion Slim 5 16APH8 | |
| Lenovo LOQ 15APH8 | |
| Sınıf ortalaması Gaming (49785 - 173351, n=141, son 2 yıl) | |
| Dell G15 5530 | |
| Schenker XMG Core 15 (M22) | |
| Captiva Advanced Gaming I74-121 | |
| MSI Cyborg 15 A12VF | |
| Ortalama Intel Core i5-13500H (77835 - 85727, n=6) | |
| AIDA64 / FPU SinJulia | |
| Lenovo Legion Slim 5 16APH8 | |
| Lenovo LOQ 15APH8 | |
| Sınıf ortalaması Gaming (4424 - 33636, n=141, son 2 yıl) | |
| Schenker XMG Core 15 (M22) | |
| Dell G15 5530 | |
| MSI Cyborg 15 A12VF | |
| Captiva Advanced Gaming I74-121 | |
| Ortalama Intel Core i5-13500H (7249 - 8086, n=6) | |
| AIDA64 / FPU Mandel | |
| Sınıf ortalaması Gaming (17585 - 128721, n=141, son 2 yıl) | |
| Lenovo LOQ 15APH8 | |
| Lenovo Legion Slim 5 16APH8 | |
| Schenker XMG Core 15 (M22) | |
| Dell G15 5530 | |
| Captiva Advanced Gaming I74-121 | |
| Ortalama Intel Core i5-13500H (27820 - 38336, n=6) | |
| MSI Cyborg 15 A12VF | |
| AIDA64 / CPU AES | |
| Captiva Advanced Gaming I74-121 | |
| Sınıf ortalaması Gaming (19065 - 247074, n=141, son 2 yıl) | |
| Ortalama Intel Core i5-13500H (62657 - 120493, n=6) | |
| Dell G15 5530 | |
| Lenovo LOQ 15APH8 | |
| Lenovo Legion Slim 5 16APH8 | |
| Schenker XMG Core 15 (M22) | |
| MSI Cyborg 15 A12VF | |
| AIDA64 / CPU ZLib | |
| Sınıf ortalaması Gaming (373 - 2531, n=141, son 2 yıl) | |
| Dell G15 5530 | |
| Lenovo LOQ 15APH8 | |
| Lenovo Legion Slim 5 16APH8 | |
| Captiva Advanced Gaming I74-121 | |
| Ortalama Intel Core i5-13500H (782 - 992, n=6) | |
| Schenker XMG Core 15 (M22) | |
| MSI Cyborg 15 A12VF | |
| AIDA64 / FP64 Ray-Trace | |
| Lenovo LOQ 15APH8 | |
| Lenovo Legion Slim 5 16APH8 | |
| Sınıf ortalaması Gaming (3856 - 45446, n=141, son 2 yıl) | |
| Dell G15 5530 | |
| Schenker XMG Core 15 (M22) | |
| Captiva Advanced Gaming I74-121 | |
| Ortalama Intel Core i5-13500H (5955 - 8495, n=6) | |
| MSI Cyborg 15 A12VF | |
| AIDA64 / CPU PhotoWorxx | |
| Sınıf ortalaması Gaming (10805 - 62916, n=141, son 2 yıl) | |
| Dell G15 5530 | |
| MSI Cyborg 15 A12VF | |
| Lenovo Legion Slim 5 16APH8 | |
| Ortalama Intel Core i5-13500H (20212 - 37618, n=6) | |
| Schenker XMG Core 15 (M22) | |
| Captiva Advanced Gaming I74-121 | |
| Lenovo LOQ 15APH8 | |
Sistem Performansı
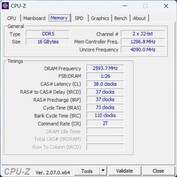
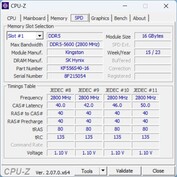
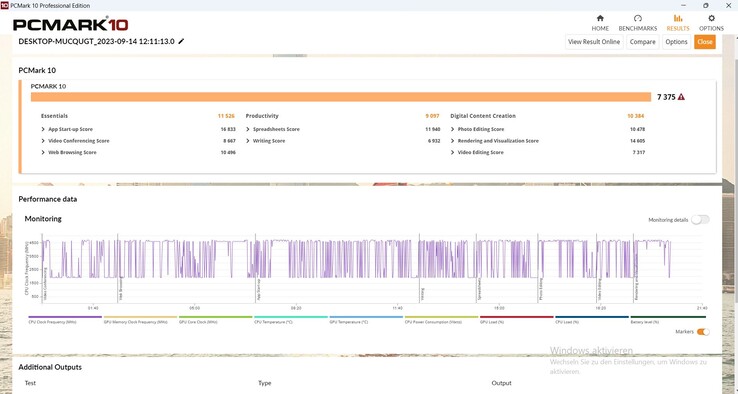
Captiva dizüstü bilgisayarın PCMark skoru beklendiği gibiydi. Essentials alt testinde zirveye bile çıktı. Buna karşılık, dizüstü bilgisayar üretkenlikte zayıfladı, bu da AIDA tarafından gösterildiği gibi muhtemelen biraz daha yavaş RAM'den kaynaklanıyor. Sonuç olarak, cihaz bir oyun dizüstü bilgisayarı için üst ortalama sonuçlar elde etti.
CrossMark: Overall | Productivity | Creativity | Responsiveness
| PCMark 10 / Score | |
| Sınıf ortalaması Gaming (5776 - 10060, n=119, son 2 yıl) | |
| Lenovo Legion Slim 5 16APH8 | |
| Lenovo LOQ 15APH8 | |
| Captiva Advanced Gaming I74-121 | |
| Ortalama Intel Core i5-13500H, NVIDIA GeForce RTX 4060 Laptop GPU (n=1) | |
| Schenker XMG Core 15 (M22) | |
| MSI Cyborg 15 A12VF | |
| Dell G15 5530 | |
| PCMark 10 / Essentials | |
| Captiva Advanced Gaming I74-121 | |
| Ortalama Intel Core i5-13500H, NVIDIA GeForce RTX 4060 Laptop GPU (n=1) | |
| Lenovo Legion Slim 5 16APH8 | |
| Dell G15 5530 | |
| Schenker XMG Core 15 (M22) | |
| Sınıf ortalaması Gaming (8810 - 12600, n=123, son 2 yıl) | |
| MSI Cyborg 15 A12VF | |
| Lenovo LOQ 15APH8 | |
| PCMark 10 / Productivity | |
| Lenovo Legion Slim 5 16APH8 | |
| Sınıf ortalaması Gaming (6662 - 16716, n=121, son 2 yıl) | |
| Dell G15 5530 | |
| Lenovo LOQ 15APH8 | |
| MSI Cyborg 15 A12VF | |
| Schenker XMG Core 15 (M22) | |
| Captiva Advanced Gaming I74-121 | |
| Ortalama Intel Core i5-13500H, NVIDIA GeForce RTX 4060 Laptop GPU (n=1) | |
| PCMark 10 / Digital Content Creation | |
| Sınıf ortalaması Gaming (7440 - 19351, n=121, son 2 yıl) | |
| Lenovo Legion Slim 5 16APH8 | |
| Lenovo LOQ 15APH8 | |
| Captiva Advanced Gaming I74-121 | |
| Ortalama Intel Core i5-13500H, NVIDIA GeForce RTX 4060 Laptop GPU (n=1) | |
| Schenker XMG Core 15 (M22) | |
| MSI Cyborg 15 A12VF | |
| Dell G15 5530 | |
| CrossMark / Overall | |
| Sınıf ortalaması Gaming (1247 - 2344, n=117, son 2 yıl) | |
| Dell G15 5530 | |
| Lenovo Legion Slim 5 16APH8 | |
| MSI Cyborg 15 A12VF | |
| Captiva Advanced Gaming I74-121 | |
| Ortalama Intel Core i5-13500H, NVIDIA GeForce RTX 4060 Laptop GPU (n=1) | |
| Lenovo LOQ 15APH8 | |
| Schenker XMG Core 15 (M22) | |
| CrossMark / Productivity | |
| Sınıf ortalaması Gaming (1299 - 2211, n=117, son 2 yıl) | |
| Lenovo Legion Slim 5 16APH8 | |
| Dell G15 5530 | |
| MSI Cyborg 15 A12VF | |
| Captiva Advanced Gaming I74-121 | |
| Ortalama Intel Core i5-13500H, NVIDIA GeForce RTX 4060 Laptop GPU (n=1) | |
| Lenovo LOQ 15APH8 | |
| Schenker XMG Core 15 (M22) | |
| CrossMark / Creativity | |
| Sınıf ortalaması Gaming (1275 - 2729, n=117, son 2 yıl) | |
| Dell G15 5530 | |
| Lenovo Legion Slim 5 16APH8 | |
| MSI Cyborg 15 A12VF | |
| Schenker XMG Core 15 (M22) | |
| Captiva Advanced Gaming I74-121 | |
| Ortalama Intel Core i5-13500H, NVIDIA GeForce RTX 4060 Laptop GPU (n=1) | |
| Lenovo LOQ 15APH8 | |
| CrossMark / Responsiveness | |
| Sınıf ortalaması Gaming (1030 - 2330, n=117, son 2 yıl) | |
| MSI Cyborg 15 A12VF | |
| Captiva Advanced Gaming I74-121 | |
| Ortalama Intel Core i5-13500H, NVIDIA GeForce RTX 4060 Laptop GPU (n=1) | |
| Dell G15 5530 | |
| Lenovo Legion Slim 5 16APH8 | |
| Lenovo LOQ 15APH8 | |
| Schenker XMG Core 15 (M22) | |
| PCMark 10 Score | 7375 puan | |
Yardım | ||
| AIDA64 / Memory Copy | |
| Sınıf ortalaması Gaming (21750 - 108104, n=141, son 2 yıl) | |
| Lenovo Legion Slim 5 16APH8 | |
| Dell G15 5530 | |
| MSI Cyborg 15 A12VF | |
| Schenker XMG Core 15 (M22) | |
| Ortalama Intel Core i5-13500H (36916 - 57830, n=6) | |
| Captiva Advanced Gaming I74-121 | |
| Lenovo LOQ 15APH8 | |
| AIDA64 / Memory Read | |
| Sınıf ortalaması Gaming (22956 - 104349, n=141, son 2 yıl) | |
| Dell G15 5530 | |
| MSI Cyborg 15 A12VF | |
| Lenovo Legion Slim 5 16APH8 | |
| Ortalama Intel Core i5-13500H (41676 - 65633, n=6) | |
| Schenker XMG Core 15 (M22) | |
| Captiva Advanced Gaming I74-121 | |
| Lenovo LOQ 15APH8 | |
| AIDA64 / Memory Write | |
| Lenovo Legion Slim 5 16APH8 | |
| Sınıf ortalaması Gaming (22297 - 133486, n=141, son 2 yıl) | |
| Dell G15 5530 | |
| MSI Cyborg 15 A12VF | |
| Schenker XMG Core 15 (M22) | |
| Ortalama Intel Core i5-13500H (36826 - 60523, n=6) | |
| Captiva Advanced Gaming I74-121 | |
| Lenovo LOQ 15APH8 | |
| AIDA64 / Memory Latency | |
| Sınıf ortalaması Gaming (59.5 - 259, n=141, son 2 yıl) | |
| Lenovo LOQ 15APH8 | |
| Lenovo Legion Slim 5 16APH8 | |
| Ortalama Intel Core i5-13500H (86.2 - 96.1, n=6) | |
| MSI Cyborg 15 A12VF | |
| Dell G15 5530 | |
| Captiva Advanced Gaming I74-121 | |
| Schenker XMG Core 15 (M22) | |
* ... daha küçük daha iyidir
DPC gecikme süresi
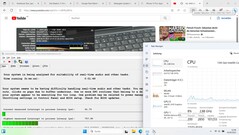
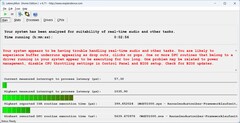
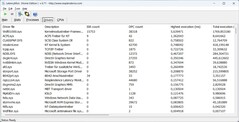
Birden fazla tarayıcı sekmesi veya web sitemizi açarken, Captiva birden fazla sekme olsa bile hiçbir sorun göstermedi. İlk küçük sorunlar 4K/60 fps YouTube videomuzu açarken görüldü. Gecikmeler nispeten düşüktü - düşen bir kare dışında video sorunsuz bir şekilde oynatıldı.
| DPC Latencies / LatencyMon - interrupt to process latency (max), Web, Youtube, Prime95 | |
| Dell G15 5530 | |
| Schenker XMG Core 15 (M22) | |
| Lenovo LOQ 15APH8 | |
| MSI Cyborg 15 A12VF | |
| Captiva Advanced Gaming I74-121 | |
| Lenovo Legion Slim 5 16APH8 | |
* ... daha küçük daha iyidir
Depolama cihazları
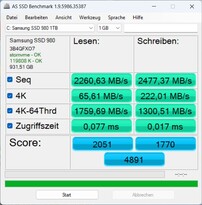
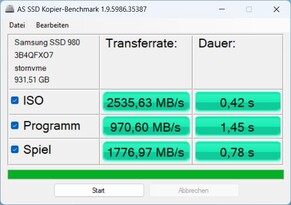
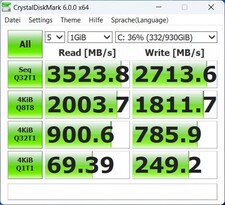
Captiva yığın depolama söz konusu olduğunda herhangi bir zayıflık göstermiyor. Test modelimizde, 1 TB depolama alanına sahip çok iyi bilinen bir Samsung SSD 980 takılı. Hala PCIe 3.0 neslinden olabilir, ancak en iyi modellerinden biridir. Şimdiye kadar daha hızlı SSD'ler de vardı (karşılaştırmamızın gösterdiği gibi), ancak bu depolama cihazı yine de üst ortalama sonuçlar elde etti.
Captiva'nın içinde SSD, veri tabanımızdaki ortalama modelden (Samsung 980 1 TB) yaklaşık yüzde 10 daha hızlı performans gösterdi ve ayrıca performansı daha uzun bir süre boyunca sabit kaldı ve termal daralma hiçbir zaman sorun olmadı.
| Drive Performance rating - Percent | |
| Sınıf ortalaması Gaming | |
| Lenovo Legion Slim 5 16APH8 | |
| MSI Cyborg 15 A12VF | |
| Schenker XMG Core 15 (M22) | |
| Captiva Advanced Gaming I74-121 | |
| Ortalama Samsung SSD 980 1TB MZ-V8V1T0BW | |
| Dell G15 5530 | |
| Lenovo LOQ 15APH8 | |
* ... daha küçük daha iyidir
Reading continuous performance: DiskSpd Read Loop, Queue Depth 8
Grafik kartı
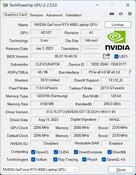
Captiva'nın temelleriNvidia Geforce RTX 4060grafik kartı olarak ve Dynamic Boost dahil 140 watt'a kadar erişime sahip.
İşlemcinin performansı ortalamanın altında olsa da, dizüstü bilgisayarın 3DMark benchmark sonuçları zirveye çıkmasını sağladı - sadeceDell G15ayak uydurabildi. VeLOQ 15veCyborg 15aynı GPU ile açıkça yenildi.
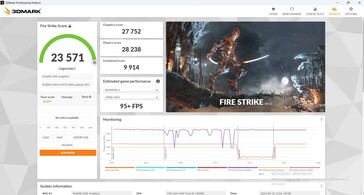
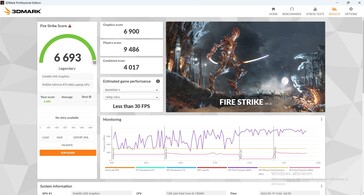
Prizden uzakta 3D performansı önemli ölçüde düşüyor. Başlangıçta Fire Strike testi sırasında elde edilen 23.571 puandan şimdi yalnızca 6.693 puan elde etti. Bu yüzde 72'lik bir düşüş demek!
| 3DMark Performance rating - Percent | |
| Sınıf ortalaması Gaming | |
| Captiva Advanced Gaming I74-121 | |
| Dell G15 5530 | |
| Ortalama NVIDIA GeForce RTX 4060 Laptop GPU | |
| Lenovo LOQ 15APH8 -1! | |
| Lenovo Legion Slim 5 16APH8 -1! | |
| MSI Cyborg 15 A12VF | |
| Schenker XMG Core 15 (M22) | |
| 3DMark 11 - 1280x720 Performance GPU | |
| Sınıf ortalaması Gaming (13523 - 80022, n=138, son 2 yıl) | |
| Dell G15 5530 | |
| Captiva Advanced Gaming I74-121 | |
| Ortalama NVIDIA GeForce RTX 4060 Laptop GPU (28136 - 38912, n=57) | |
| Lenovo LOQ 15APH8 | |
| Lenovo Legion Slim 5 16APH8 | |
| Schenker XMG Core 15 (M22) | |
| MSI Cyborg 15 A12VF | |
| 3DMark | |
| 1280x720 Cloud Gate Standard Graphics | |
| Captiva Advanced Gaming I74-121 | |
| Dell G15 5530 | |
| Ortalama NVIDIA GeForce RTX 4060 Laptop GPU (81407 - 180228, n=29) | |
| Sınıf ortalaması Gaming (84648 - 223650, n=65, son 2 yıl) | |
| MSI Cyborg 15 A12VF | |
| Schenker XMG Core 15 (M22) | |
| 1920x1080 Fire Strike Graphics | |
| Sınıf ortalaması Gaming (6487 - 62849, n=151, son 2 yıl) | |
| Captiva Advanced Gaming I74-121 | |
| Dell G15 5530 | |
| Ortalama NVIDIA GeForce RTX 4060 Laptop GPU (20533 - 29656, n=54) | |
| Lenovo Legion Slim 5 16APH8 | |
| Lenovo LOQ 15APH8 | |
| Schenker XMG Core 15 (M22) | |
| MSI Cyborg 15 A12VF | |
| 2560x1440 Time Spy Graphics | |
| Sınıf ortalaması Gaming (2295 - 25984, n=148, son 2 yıl) | |
| Dell G15 5530 | |
| Captiva Advanced Gaming I74-121 | |
| Ortalama NVIDIA GeForce RTX 4060 Laptop GPU (7484 - 11451, n=56) | |
| Lenovo LOQ 15APH8 | |
| Lenovo Legion Slim 5 16APH8 | |
| Schenker XMG Core 15 (M22) | |
| MSI Cyborg 15 A12VF | |
| 3DMark 11 Performance | 30608 puan | |
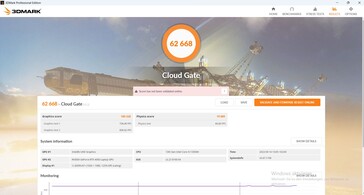
| 3DMark Cloud Gate Standard Score | 62668 puan | |
| 3DMark Fire Strike Score | 23571 puan | |
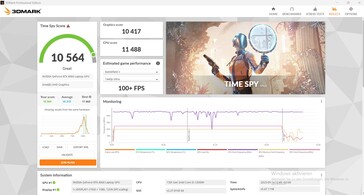
| 3DMark Time Spy Score | 10564 puan | |
Yardım | ||
| Blender | |
| v3.3 Classroom HIP/AMD | |
| Schenker XMG Core 15 (M22) | |
| Sınıf ortalaması Gaming (63 - 129, n=2, son 2 yıl) | |
| v3.3 Classroom OPTIX/RTX | |
| Schenker XMG Core 15 (M22) | |
| MSI Cyborg 15 A12VF | |
| Lenovo LOQ 15APH8 | |
| Captiva Advanced Gaming I74-121 | |
| Ortalama NVIDIA GeForce RTX 4060 Laptop GPU (19 - 28, n=53) | |
| Lenovo Legion Slim 5 16APH8 | |
| Dell G15 5530 | |
| Sınıf ortalaması Gaming (9 - 95, n=138, son 2 yıl) | |
| v3.3 Classroom CUDA | |
| Schenker XMG Core 15 (M22) | |
| MSI Cyborg 15 A12VF | |
| Lenovo LOQ 15APH8 | |
| Lenovo Legion Slim 5 16APH8 | |
| Ortalama NVIDIA GeForce RTX 4060 Laptop GPU (39 - 53, n=53) | |
| Captiva Advanced Gaming I74-121 | |
| Dell G15 5530 | |
| Sınıf ortalaması Gaming (15 - 228, n=142, son 2 yıl) | |
| v3.3 Classroom CPU | |
| MSI Cyborg 15 A12VF | |
| Schenker XMG Core 15 (M22) | |
| Captiva Advanced Gaming I74-121 | |
| Ortalama NVIDIA GeForce RTX 4060 Laptop GPU (189 - 452, n=53) | |
| Lenovo LOQ 15APH8 | |
| Lenovo Legion Slim 5 16APH8 | |
| Dell G15 5530 | |
| Sınıf ortalaması Gaming (122 - 962, n=139, son 2 yıl) | |
* ... daha küçük daha iyidir
Oyun Performansı
Captiva ile yakın bir düello içindeydi.Dell G15oyunlarda da - ikincisi sadece zirveye çıkmayı başarıyor. Bunun nedeni muhtemelen ilgili odağa sahip oyunlarda daha iyi CPU performansı göstermesidir.
Toplamda, Captiva neredeyse tüm güncel oyunları çok yüksek çözünürlüklerde sorunsuz bir şekilde çalıştırabiliyor ve veritabanımızda sakladığımız aynı GPU'ya sahip tüm dizüstü bilgisayarların ortalamasının biraz üzerinde çıktı.
| Performance rating - Percent | |
| Sınıf ortalaması Gaming | |
| Dell G15 5530 | |
| Captiva Advanced Gaming I74-121 | |
| Lenovo Legion Slim 5 16APH8 | |
| MSI Cyborg 15 A12VF | |
| Schenker XMG Core 15 (M22) | |
| Lenovo LOQ 15APH8 | |
| The Witcher 3 - 1920x1080 Ultra Graphics & Postprocessing (HBAO+) | |
| Sınıf ortalaması Gaming (18.4 - 240, n=48, son 2 yıl) | |
| Dell G15 5530 | |
| Captiva Advanced Gaming I74-121 | |
| Lenovo Legion Slim 5 16APH8 | |
| Lenovo LOQ 15APH8 | |
| Schenker XMG Core 15 (M22) | |
| MSI Cyborg 15 A12VF | |
| GTA V - 1920x1080 Highest AA:4xMSAA + FX AF:16x | |
| Sınıf ortalaması Gaming (12.1 - 186.9, n=128, son 2 yıl) | |
| Captiva Advanced Gaming I74-121 | |
| Dell G15 5530 | |
| Lenovo Legion Slim 5 16APH8 | |
| Schenker XMG Core 15 (M22) | |
| MSI Cyborg 15 A12VF | |
| Lenovo LOQ 15APH8 | |
| Final Fantasy XV Benchmark - 1920x1080 High Quality | |
| Sınıf ortalaması Gaming (19.2 - 215, n=137, son 2 yıl) | |
| Captiva Advanced Gaming I74-121 | |
| Dell G15 5530 | |
| Lenovo Legion Slim 5 16APH8 | |
| Schenker XMG Core 15 (M22) | |
| Lenovo LOQ 15APH8 | |
| MSI Cyborg 15 A12VF | |
| Strange Brigade - 1920x1080 ultra AA:ultra AF:16 | |
| Sınıf ortalaması Gaming (38.9 - 456, n=126, son 2 yıl) | |
| Dell G15 5530 | |
| Captiva Advanced Gaming I74-121 | |
| Lenovo Legion Slim 5 16APH8 | |
| Lenovo LOQ 15APH8 | |
| Schenker XMG Core 15 (M22) | |
| MSI Cyborg 15 A12VF | |
| Dota 2 Reborn - 1920x1080 ultra (3/3) best looking | |
| Sınıf ortalaması Gaming (65.1 - 248, n=143, son 2 yıl) | |
| Dell G15 5530 | |
| Captiva Advanced Gaming I74-121 | |
| Lenovo Legion Slim 5 16APH8 | |
| MSI Cyborg 15 A12VF | |
| Lenovo LOQ 15APH8 | |
| Schenker XMG Core 15 (M22) | |
| X-Plane 11.11 - 1920x1080 high (fps_test=3) | |
| Dell G15 5530 | |
| Sınıf ortalaması Gaming (33.4 - 150.2, n=146, son 2 yıl) | |
| Captiva Advanced Gaming I74-121 | |
| MSI Cyborg 15 A12VF | |
| Lenovo Legion Slim 5 16APH8 | |
| Lenovo LOQ 15APH8 | |
| Schenker XMG Core 15 (M22) | |
| The Witcher 3 | |
| 1920x1080 High Graphics & Postprocessing (Nvidia HairWorks Off) | |
| Sınıf ortalaması Gaming (138 - 424, n=30, son 2 yıl) | |
| Dell G15 5530 | |
| Captiva Advanced Gaming I74-121 | |
| Ortalama NVIDIA GeForce RTX 4060 Laptop GPU (110 - 229, n=36) | |
| Lenovo Legion Slim 5 16APH8 | |
| Lenovo LOQ 15APH8 | |
| Schenker XMG Core 15 (M22) | |
| MSI Cyborg 15 A12VF | |
| 1920x1080 Ultra Graphics & Postprocessing (HBAO+) | |
| Sınıf ortalaması Gaming (18.4 - 240, n=48, son 2 yıl) | |
| Dell G15 5530 | |
| Captiva Advanced Gaming I74-121 | |
| Ortalama NVIDIA GeForce RTX 4060 Laptop GPU (77 - 159.7, n=42) | |
| Lenovo Legion Slim 5 16APH8 | |
| Lenovo LOQ 15APH8 | |
| Schenker XMG Core 15 (M22) | |
| MSI Cyborg 15 A12VF | |
| Far Cry 5 | |
| 1920x1080 High Preset AA:T | |
| Captiva Advanced Gaming I74-121 | |
| Dell G15 5530 | |
| Sınıf ortalaması Gaming (82 - 186, n=37, son 2 yıl) | |
| Ortalama NVIDIA GeForce RTX 4060 Laptop GPU (104 - 158, n=33) | |
| Schenker XMG Core 15 (M22) | |
| MSI Cyborg 15 A12VF | |
| 1920x1080 Ultra Preset AA:T | |
| Dell G15 5530 | |
| Captiva Advanced Gaming I74-121 | |
| Sınıf ortalaması Gaming (70 - 174, n=37, son 2 yıl) | |
| Ortalama NVIDIA GeForce RTX 4060 Laptop GPU (95 - 148, n=34) | |
| Schenker XMG Core 15 (M22) | |
| MSI Cyborg 15 A12VF | |
| F1 23 | |
| 1920x1080 Ultra High Preset AA:T AF:16x | |
| Sınıf ortalaması Gaming (27 - 149.2, n=14, son 2 yıl) | |
| Ortalama NVIDIA GeForce RTX 4060 Laptop GPU (43.8 - 119.9, n=13) | |
| Captiva Advanced Gaming I74-121 | |
| 1920x1080 High Preset AA:T AF:16x | |
| Captiva Advanced Gaming I74-121 | |
| Sınıf ortalaması Gaming (45.5 - 321, n=13, son 2 yıl) | |
| Ortalama NVIDIA GeForce RTX 4060 Laptop GPU (143.7 - 207, n=13) | |
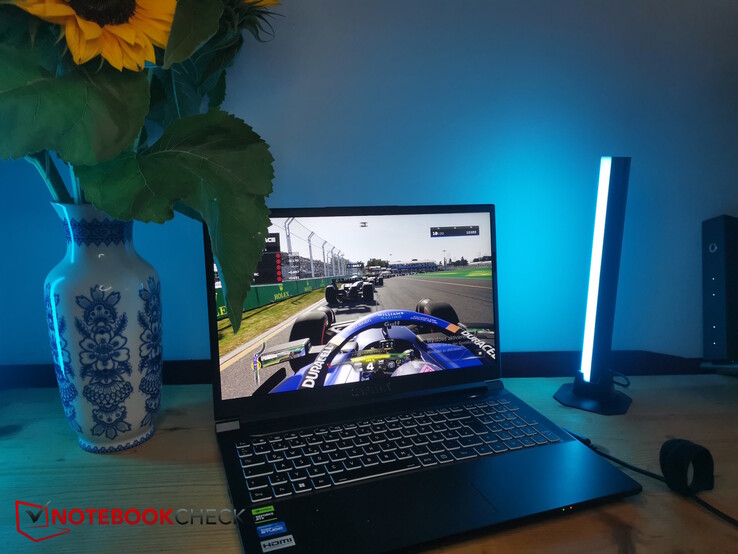
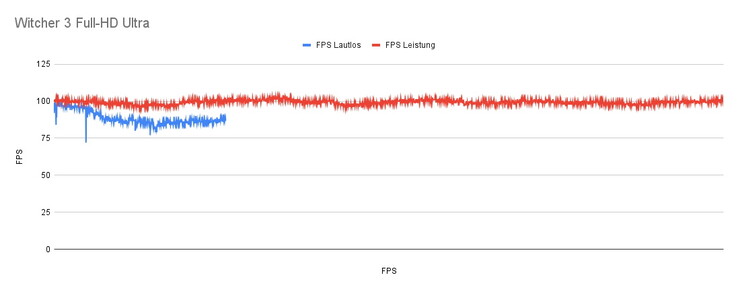
Olağan gündüz ve gece ritmi dışında, The Witcher 3 'daki kare hızı çok sabit kaldı. SadeceDell G15 biraz daha hızlıydı.
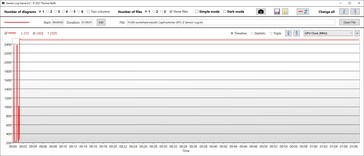
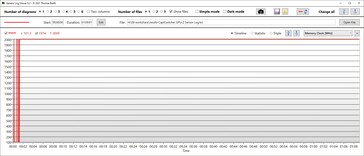
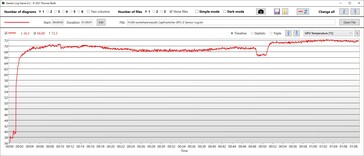
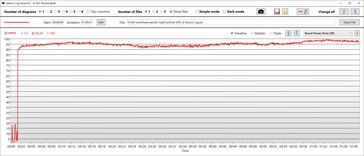
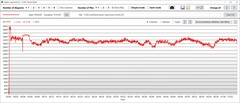
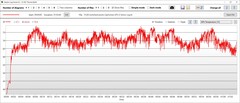
GPU, The Witcher 3 çalıştıran bir saatlik kıyaslama süresi boyunca sürekli olarak 2.400 MHz'in üzerinde bir hızda çalıştı ve bellek saati 2.000 MHz'de sabit kaldı. Bu süre zarfında GPU 72 °C'ye kadar ısındı ve güç tüketimi yaklaşık 95 watt oldu.
CPU aynı süre zarfında TDP'sini yaklaşık 30 watt'a düşürdü ve yaklaşık 77 °C'ye kadar ısındı.
Witcher 3 FPS diagram
Eğlence modu hemen hemen aynı değerlerle sonuçlandı ve çok daha sessiz bile değildi.
Sessiz modda bilgisayar biraz daha sessiz çalışıyor (31,43 dB). Fanların daha az aktif olması GPU'nun sıcaklığının çok daha hızlı yükselmesine neden oluyor. Yaklaşık 3,5 dakika sonra sıcaklık 87 °C'ye ulaştı ve bu da GPU saatinin ve güç tüketiminin biraz düşmesine neden oldu. Daha sonra sıcaklık 89 °C'de sabit kaldı. TGP 100 watt'tan 80 watt'a düştü. Aynı zamanda, kare hızı 100 fps'den sadece yaklaşık 85 fps'ye düştü.
| düşük | orta | yüksek | ultra | QHD | |
|---|---|---|---|---|---|
| GTA V (2015) | 186.5 | 182.4 | 177.2 | 117 | |
| The Witcher 3 (2015) | 367 | 296 | 199 | 101 | |
| Dota 2 Reborn (2015) | 181 | 168.1 | 147.2 | 140.5 | |
| Final Fantasy XV Benchmark (2018) | 185.6 | 148 | 102.2 | 75.6 | |
| X-Plane 11.11 (2018) | 142.7 | 128.1 | 99.4 | ||
| Far Cry 5 (2018) | 175 | 153 | 147 | 138 | |
| Strange Brigade (2018) | 470 | 276 | 219 | 187.9 | |
| F1 23 (2023) | 221 | 225 | 184 | 59 |
Emisyonlar - Serin ama sessiz değil
Gürültü emisyonları
Captiva Advanced Gaming'in her iki fanı da "sessiz mod" olarak adlandırılan modda bile hemen hemen her zaman aktiftir. Buna rağmen fanlar rölanti modunda çok sessiz çalışıyor. Oyun oynarken, dizüstü bilgisayar oldukça gürültülü hale geliyor ve maksimum yük altında olduğu gibi aynı gürültü emisyonlarına ulaşıyor. Ne yazık ki, herhangi bir fark gözlemleyemedik, örneğinLenovo LOQ.
En azından, maksimum gürültü emisyonları sıra dışı değil - diğer oyun dizüstü bilgisayarlarıyla hemen hemen aynı. Dell G15 aynı 3D performansına sahip olmasına rağmen daha sessiz.
Eğlence modu testimizde daha sessiz sonuçlara yol açmadı. Sessiz modu kullanırken, oyun gürültüsü seviyeleri önemli ölçüde düştü ve boşta modunda fanlar hala aktif kaldı.
Witcher 3 Full HD Ultra
| Mod/değer | dB cinsinden gürültü emisyonları | FPS |
|---|---|---|
| Performans | 55 | 101 |
| Eğlence | 55 | 101 |
| Sessiz | 31,43 | 85 (100 fps'den yavaş düşüş) |
Ses yüksekliği
| Boşta |
| 23 / 25.67 / 25.67 dB |
| Çalışırken |
| 38.52 / 54.17 dB |
 | ||
30 dB sessiz 40 dB(A) duyulabilirlik 50 dB(A) gürültülü |
||
min: | ||
| Captiva Advanced Gaming I74-121 GeForce RTX 4060 Laptop GPU, i5-13500H, Samsung SSD 980 1TB MZ-V8V1T0BW | MSI Cyborg 15 A12VF GeForce RTX 4060 Laptop GPU, i7-12650H, Samsung PM9B1 1024GB MZVL41T0HBLB | Dell G15 5530 GeForce RTX 4060 Laptop GPU, i7-13650HX, SSTC CL4-3D512-Q11 | Lenovo Legion Slim 5 16APH8 GeForce RTX 4060 Laptop GPU, R7 7840HS, SK hynix PC801 HFS512GEJ9X115N | Lenovo LOQ 15APH8 GeForce RTX 4050 Laptop GPU, R7 7840HS, Micron 2450 512GB MTFDKCD512TFK | Schenker XMG Core 15 (M22) GeForce RTX 3060 Laptop GPU, R7 6800H, Samsung SSD 980 Pro 1TB MZ-V8P1T0BW | |
|---|---|---|---|---|---|---|
| Noise | -30% | 5% | 2% | 2% | 1% | |
| kapalı / ortam * (dB) | 23 | 27 -17% | 20.41 11% | 22.9 -0% | 23.1 -0% | 23 -0% |
| Idle Minimum * (dB) | 23 | 27 -17% | 26.85 -17% | 23.1 -0% | 23.1 -0% | 23 -0% |
| Idle Average * (dB) | 25.67 | 37.5 -46% | 26.85 -5% | 23.1 10% | 23.1 10% | 23 10% |
| Idle Maximum * (dB) | 25.67 | 38 -48% | 26.85 -5% | 27.7 -8% | 25.2 2% | 23 10% |
| Load Average * (dB) | 38.52 | 56.3 -46% | 27.65 28% | 33.3 14% | 44.3 -15% | 42.41 -10% |
| Witcher 3 ultra * (dB) | 54.17 | 47.9 12% | 54 -0% | 45.8 15% | 54.71 -1% | |
| Load Maximum * (dB) | 54.17 | 56.3 -4% | 47.86 12% | 54 -0% | 52 4% | 55.05 -2% |
* ... daha küçük daha iyidir
Sıcaklık
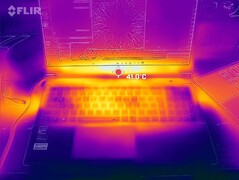
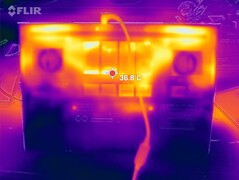
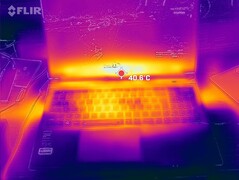
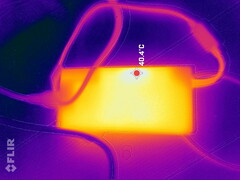
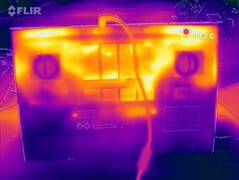
Dizüstü bilgisayarın cömert bakır kullanımı ve fanları sayesinde oyun cihazı nispeten serin kalıyor. Bir saat sonra tam yük altında bile yalnızca maksimum 42 °C ölçtük. İşte buradaDell G15gerçekten de daha sessiz fanların ne kadar maliyetli olduğunu gösteriyor - 60 °C'nin üzerinde sıcaklıklara ulaşıyor!
(±) Üst taraftaki maksimum sıcaklık, 40.4 °C / 105 F ortalamasına kıyasla 41 °C / 106 F'dir. , Gaming sınıfı için 21.2 ile 68.8 °C arasında değişir.
(±) Alt kısım, 43.3 °C / 110 F ortalamasına kıyasla maksimum 42 °C / 108 F'ye kadar ısınır
(+) Boşta kullanımda, üst tarafın ortalama sıcaklığı 28.3 °C / 83 F olup, cihazın 33.9 °C / 93 F.
(±) The Witcher 3 oynarken, üst tarafın ortalama sıcaklığı 32.9 °C / 91 F olup, cihazın 33.9 °C / 93 F.
(+) Avuç içi dayanakları ve dokunmatik yüzey, maksimum 30 °C / 86 F ile cilt sıcaklığından daha soğuktur ve bu nedenle dokunulduğunda soğuktur.
(±) Benzer cihazların avuç içi dayanağı alanının ortalama sıcaklığı 28.8 °C / 83.8 F (-1.2 °C / -2.2 F) idi.
| Captiva Advanced Gaming I74-121 Intel Core i5-13500H, NVIDIA GeForce RTX 4060 Laptop GPU | MSI Cyborg 15 A12VF Intel Core i7-12650H, NVIDIA GeForce RTX 4060 Laptop GPU | Dell G15 5530 Intel Core i7-13650HX, NVIDIA GeForce RTX 4060 Laptop GPU | Lenovo Legion Slim 5 16APH8 AMD Ryzen 7 7840HS, NVIDIA GeForce RTX 4060 Laptop GPU | Lenovo LOQ 15APH8 AMD Ryzen 7 7840HS, NVIDIA GeForce RTX 4050 Laptop GPU | Schenker XMG Core 15 (M22) AMD Ryzen 7 6800H, NVIDIA GeForce RTX 3060 Laptop GPU | |
|---|---|---|---|---|---|---|
| Heat | 7% | -20% | 10% | -1% | -5% | |
| Maximum Upper Side * (°C) | 41 | 47.5 -16% | 54 -32% | 40.6 1% | 44.4 -8% | 48 -17% |
| Maximum Bottom * (°C) | 42 | 35.5 15% | 62.2 -48% | 42 -0% | 52 -24% | 51 -21% |
| Idle Upper Side * (°C) | 32 | 27.7 13% | 33.4 -4% | 27.8 13% | 28 12% | 28 12% |
| Idle Bottom * (°C) | 35 | 29.5 16% | 33.4 5% | 26.6 24% | 29.6 15% | 33 6% |
* ... daha küçük daha iyidir
Stres testi
CPU saat hızı, bir saatlik stres testimiz boyunca şaşırtıcı bir şekilde sabit kaldı. Ortalama olarak yaklaşık 3,1 GHz'e ulaşıldı. CPU yaklaşık 72 °C'ye kadar ısındı ve 45 watt'lık sabit bir TDP'ye sahipti.
GPU da benzer şekilde tutarlı davrandı: Saati 2.460 MHz, bellek saati 2.000 MHz ve sıcaklık ortalama 69 °C idi.
| CPU Saati (GHz) | GPU Saati (MHz) | Ortalama CPU Sıcaklığı (°C) | Ortalama GPU Sıcaklığı (°C) | |
| Prime95 + FurMark Stres | 3.1 | 2,460 | 72 | 69 |
| Witcher 3 Stres | 0,8 | 2.400 | 77 | 72 |
Konuşmacılar
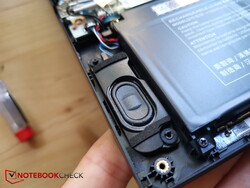
Captiva ön köşelerdeki alana stereo hoparlörler yerleştirmiş. Aşağıya doğru yayılıyorlar, biraz daha yüksek olabilirlerdi, neredeyse hiç basları yok ve bunun dışında oldukça vasatlar.
Dijital bağlantı noktalarına ek olarak, diğer ses cihazlarını bağlamak için iki jak mevcut - biri kulaklıklar ve kulaklıklar için, diğeri mikrofonlar için.
Captiva Advanced Gaming I74-121 ses analizi
(±) | hoparlör ses yüksekliği ortalama ama iyi (79.02 dB)
Bas 100 - 315Hz
(-) | neredeyse hiç bas yok - ortalama olarak medyandan 27.2% daha düşük
(±) | Bas doğrusallığı ortalamadır (12.7% delta - önceki frekans)
Ortalar 400 - 2000 Hz
(±) | daha yüksek ortalar - ortalama olarak medyandan 10% daha yüksek
(±) | Ortaların doğrusallığı ortalamadır (14.2% delta - önceki frekans)
Yüksekler 2 - 16 kHz
(+) | dengeli yüksekler - medyandan yalnızca 4.3% uzakta
(±) | Yükseklerin doğrusallığı ortalamadır (9.9% delta - önceki frekans)
Toplam 100 - 16.000 Hz
(-) | genel ses doğrusal değildir (30.3% ortancaya göre fark)
Aynı sınıfla karşılaştırıldığında
» Bu sınıftaki tüm test edilen cihazların %96%'si daha iyi, 2% benzer, 3% daha kötüydü
» En iyisinin deltası 6% idi, ortalama 18% idi, en kötüsü 132% idi
Test edilen tüm cihazlarla karşılaştırıldığında
» Test edilen tüm cihazların %88'si daha iyi, 3 benzer, % 9 daha kötüydü
» En iyisinin deltası 4% idi, ortalama 24% idi, en kötüsü 134% idi
Apple MacBook Pro 16 2021 M1 Pro ses analizi
(+) | hoparlörler nispeten yüksek sesle çalabilir (84.7 dB)
Bas 100 - 315Hz
(+) | iyi bas - medyandan yalnızca 3.8% uzakta
(+) | bas doğrusaldır (5.2% delta ile önceki frekans)
Ortalar 400 - 2000 Hz
(+) | dengeli ortalar - medyandan yalnızca 1.3% uzakta
(+) | orta frekanslar doğrusaldır (2.1% deltadan önceki frekansa)
Yüksekler 2 - 16 kHz
(+) | dengeli yüksekler - medyandan yalnızca 1.9% uzakta
(+) | yüksekler doğrusaldır (2.7% deltadan önceki frekansa)
Toplam 100 - 16.000 Hz
(+) | genel ses doğrusaldır (4.6% ortancaya göre fark)
Aynı sınıfla karşılaştırıldığında
» Bu sınıftaki tüm test edilen cihazların %0%'si daha iyi, 0% benzer, 100% daha kötüydü
» En iyisinin deltası 5% idi, ortalama 17% idi, en kötüsü 45% idi
Test edilen tüm cihazlarla karşılaştırıldığında
» Test edilen tüm cihazların %0'si daha iyi, 0 benzer, % 100 daha kötüydü
» En iyisinin deltası 4% idi, ortalama 24% idi, en kötüsü 134% idi
Güç yönetimi - Captiva'nın küçük bir pili vardır
Güç tüketimi
Captiva dizüstü bilgisayar boş modda biraz daha tutumlu olabilir, ancak performansı göz önüne alındığında tüketim oranları makuldür. Oyun söz konusu olduğunda en az onun kadar güçlü olan Dell G15, daha güçlü HX işlemcisi nedeniyle çok daha fazla tüketiyor.
Daha zayıf olan diğer rakipler kısılmış ve sonuç olarak yük altında çok daha tutumlular.
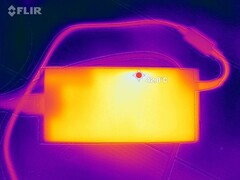
Kısa bir süre için maksimum 219 watt'lık bir yük ölçtük ve 230 watt'lık güç kaynağı bunun üstesinden gelebildi.
| Kapalı / Bekleme modu | |
| Boşta | |
| Çalışırken |
|
Key:
min: | |
| Captiva Advanced Gaming I74-121 i5-13500H, GeForce RTX 4060 Laptop GPU, Samsung SSD 980 1TB MZ-V8V1T0BW, IPS, 1920x1080, 15.6" | MSI Cyborg 15 A12VF i7-12650H, GeForce RTX 4060 Laptop GPU, Samsung PM9B1 1024GB MZVL41T0HBLB, IPS, 1920x1080, 15.6" | Dell G15 5530 i7-13650HX, GeForce RTX 4060 Laptop GPU, SSTC CL4-3D512-Q11, IPS, 1920x1080, 15.6" | Lenovo Legion Slim 5 16APH8 R7 7840HS, GeForce RTX 4060 Laptop GPU, SK hynix PC801 HFS512GEJ9X115N, IPS, 2560x1600, 16" | Lenovo LOQ 15APH8 R7 7840HS, GeForce RTX 4050 Laptop GPU, Micron 2450 512GB MTFDKCD512TFK, IPS, 1920x1080, 15.6" | Schenker XMG Core 15 (M22) R7 6800H, GeForce RTX 3060 Laptop GPU, Samsung SSD 980 Pro 1TB MZ-V8P1T0BW, IPS, 2560x1440, 15.6" | Ortalama NVIDIA GeForce RTX 4060 Laptop GPU | Sınıf ortalaması Gaming | |
|---|---|---|---|---|---|---|---|---|
| Power Consumption | 44% | 9% | 17% | 12% | 9% | 11% | -9% | |
| Idle Minimum * (Watt) | 18.4 | 6 67% | 8.4 54% | 9.4 49% | 15 18% | 11.8 36% | 11.5 ? 37% | 13.6 ? 26% |
| Idle Average * (Watt) | 20 | 8.8 56% | 14.98 25% | 15.5 22% | 17.7 11% | 14.7 26% | 16 ? 20% | 19.3 ? 3% |
| Idle Maximum * (Watt) | 20.7 | 11.9 43% | 15.56 25% | 24.4 -18% | 21.5 -4% | 15 28% | 20.3 ? 2% | 25.7 ? -24% |
| Load Average * (Watt) | 85 | 89 -5% | 96.8 -14% | 74.1 13% | 73.5 14% | 100 -18% | 92.9 ? -9% | 110.1 ? -30% |
| Witcher 3 ultra * (Watt) | 164 | 90.3 45% | 186 -13% | 112.9 31% | 138.6 15% | 184 -12% | ||
| Load Maximum * (Watt) | 219 | 99 55% | 271.42 -24% | 206.5 6% | 176.5 19% | 237 -8% | 210 ? 4% | 258 ? -18% |
* ... daha küçük daha iyidir
Power consumption Witcher 3 / Stress test
Power consumption with external monitor
Çalışma Zamanları
53 Wh batarya ile donatılmış olan düşük fiyatlı Captiva en iyisi değil; Dell G15 86 Wh bataryaya sahip, Schenker ve Lenovo 60 Wh kullanıyor ve sadece MSI Cyborg 53 Wh kullanıyor.
Sonuç olarak Captiva, kendi güç tasarrufu modunu kullanırken WLAN ve video testimizde 5 saatin biraz altında dayandı.
| Captiva Advanced Gaming I74-121 i5-13500H, GeForce RTX 4060 Laptop GPU, 53 Wh | MSI Cyborg 15 A12VF i7-12650H, GeForce RTX 4060 Laptop GPU, 53.5 Wh | Dell G15 5530 i7-13650HX, GeForce RTX 4060 Laptop GPU, 86 Wh | Lenovo Legion Slim 5 16APH8 R7 7840HS, GeForce RTX 4060 Laptop GPU, 80 Wh | Lenovo LOQ 15APH8 R7 7840HS, GeForce RTX 4050 Laptop GPU, 60 Wh | Schenker XMG Core 15 (M22) R7 6800H, GeForce RTX 3060 Laptop GPU, 62 Wh | Sınıf ortalaması Gaming | |
|---|---|---|---|---|---|---|---|
| Pil Çalışma Süresi | 50% | 4% | 5% | 5% | 8% | 28% | |
| H.264 (h) | 4.9 | 8 63% | 6.8 39% | 8.13 ? 66% | |||
| WiFi v1.3 (h) | 5.3 | 7.5 42% | 6.5 23% | 7.1 34% | 7.4 40% | 7.8 47% | 6.75 ? 27% |
| Load (h) | 1.6 | 2.3 44% | 0.8 -50% | 1.2 -25% | 1.1 -31% | 1.1 -31% | 1.45 ? -9% |
| Reader / Idle (h) | 13.6 | 11.7 | 9.8 | 9.17 ? | |||
| Witcher 3 ultra (h) | 0.8 | 0.958 ? |
Artılar
Eksiler
Karar - Bir oyun dizüstü bilgisayarının temel özelliklerine odaklanıyor
Captiva Advanced Gaming en hızlı işlemciyi kullanmayabilir, ancak yine de ortalamanın biraz üzerindeki RTX 4060 3D performansı hakkında hiçbir şüphe bırakmıyor. Daha sonra, üretici temel konulara odaklanıyor: oyun performansı.
Nispeten düşük olan 1.800 ABD doları fiyat için birkaç ödün vermeniz de gerekiyor. Bunlar arasında Thunderbolt ve SD kart okuyucu eksikliğinin yanı sıra eski USB 2.0 bağlantı noktası da yer alıyor.
Captiva Advanced Gaming I74-121, nispeten düşük bir fiyata oldukça yüksek 3D performansı sunuyor. Bağlantı seçenekleri söz konusu olduğunda taviz verilmesi gerekiyor.
Fiyatı cazip derecede düşük olmasına rağmen bazı uygun alternatifler var. Birçok karşılaştırmadaDell G15en sert rakiplerinden biri olarak sayılıyor. Daha iyi CPU performansı ve daha büyük bir pil sunuyor ancak buna karşılık çok daha fazla ısınıyor ve daha yüksek bir tüketime sahip.
Fiyat ve bulunabilirlik
Test modelimiz yaklaşık 1.800 ABD dolarına satılmaktadır. Şu anda herhangi bir ABD çevrimiçi perakendecisinden satın alınamıyor.
Dell G15 gibi benzer cihazlara Amazon'dan göz atabilirsiniz.
Captiva Advanced Gaming I74-121
- 09/22/2023 v7 (old)
Christian Hintze
Şeffaflık
İncelenecek cihazların seçimi editör ekibimiz tarafından yapılır. Test örneği, bu incelemenin amacı doğrultusunda üretici veya perakendeci tarafından yazara ödünç olarak sağlanmıştır. Borç verenin bu inceleme üzerinde herhangi bir etkisi olmadığı gibi, üretici de yayınlanmadan önce bu incelemenin bir kopyasını almamıştır. Bu incelemeyi yayınlama zorunluluğu yoktu. Bağımsız bir medya şirketi olarak Notebookcheck, üreticilerin, perakendecilerin veya yayıncıların otoritesine tabi değildir.
Notebookcheck bu şekilde test yapıyor
Notebookcheck, tüm sonuçların karşılaştırılabilir olmasını sağlamak için her yıl yüzlerce dizüstü bilgisayarı ve akıllı telefonu standart prosedürler kullanarak bağımsız olarak inceliyor. Yaklaşık 20 yıldır test yöntemlerimizi sürekli olarak geliştirdik ve bu süreçte endüstri standartlarını belirledik. Test laboratuvarlarımızda deneyimli teknisyenler ve editörler tarafından yüksek kaliteli ölçüm ekipmanları kullanılmaktadır. Bu testler çok aşamalı bir doğrulama sürecini içerir. Karmaşık derecelendirme sistemimiz, nesnelliği koruyan yüzlerce sağlam temellere dayanan ölçüm ve kıyaslamaya dayanmaktadır.

